The Pennsylvania State University The Graduate School The Huck Institute for Life Sciences CHROMATIN AND DNA FUNCTION: RECURRING QUESTIONS AND EVOLVING ANSWERS A Thesis in Integrative Biosciences by Xi Wang 2003 Xi Wang Submitted in Partial Fulfillment of the Requirements for the Degree of Doctor of Philosophy August 2003

Welcome message from author
This document is posted to help you gain knowledge. Please leave a comment to let me know what you think about it! Share it to your friends and learn new things together.
Transcript
The Pennsylvania State University
The Graduate School
The Huck Institute for Life Sciences
CHROMATIN AND DNA FUNCTION: RECURRING QUESTIONS AND EVOLVING ANSWERS
A Thesis in
Integrative Biosciences
by
Xi Wang
2003 Xi Wang
Submitted in Partial Fulfillment
of the Requirements
for the Degree of
Doctor of Philosophy
August 2003
The thesis of Xi Wang has been reviewed and approved* by the following:
Robert T. Simpson Professor and Holder of the Verne M. Willaman Chair in Biochemistry Thesis Adviser and Chair of Committee
Jerry L. Workman Paul Berg Professor of Biochemistry and Molecular Biology
Song Tan Assistant Professor in Biochemistry & Molecular Biology
Andrew Henderson Associate Professor of Veterinary Science
Hong Ma Professor of Biology Richard Frisque Professor of Molecular Virology Co-Director of the Huck Institute for Life Sciences
*Signatures are on file in the Graduate School.
iii
Abstract
In this thesis, in vivo analyses are presented to better understand the specific
parameters by which gene transcription is regulated in the context of
chromatin.
A novel DNase I probing assay is established and employed to detect
both histone-DNA and non-histone-DNA interactions in living cells. By
introducing a bovine pancreatic DNase I gene into yeast under control of a
galactose responsive promoter, we mapped chromatin structure at nucleotide
resolution in whole cells without isolation of nuclei. The validity and efficacy of
the strategy are demonstrated by footprinting a labile repressor bound to its
operator. Investigation of the inter-nucleosome linker regions in several types
of repressed domains has revealed different degrees of protection in cells,
relative to isolated nuclei. These different structural signatures likely reflect
the in vivo chromatin architectures that result in different biological behaviors
of these domains. Moreover, this strategy has been applied to map active
promoters and suggested that TBP, and possible other transcription factors,
are persisting at some, if not most, active promoters through multiple
transcription cycles in vivo. This conclusion was supported by chromatin
immunoprecipitation (ChIP) assays.
Unique chromatin structure characterizes cell type gene regions, including
the a cell-specific gene domains in yeast. In this study, the componential and
structural information of chromatin along the MFA1 gene, one of the a cell-
specific genes, was investigated comprehensively by employing multiple
approaches. Employing minichromosome affinity purification (MAP) and
electron microscopy (EM) techniques, we observed this domain as a highly
compact higher order chromatin structure. By doing Western blot, ChIP, and
knock-out assays, we detected the presence of Tup1p and Hho1p in this
domain, and their possible roles have also been discussed.
iv
TABLE OF CONTENTS
LIST OF FIGURES........................................................................................vii
LIST OF TABLES ........................................................................................viii
LIST OF ABBREVIATIONS ...........................................................................ix
ACKNOWLEDGEMENTS ...............................................................................x
CHAPTER I INTRODUCTION.........................................................................1
1.1 Chromatin structure and transcription..................................................................................... 3 1.1.1 Chromatin structure .............................................................................................................. 3 1.1.2 Chromatin structure and transcription.................................................................................... 5 1.1.3 Regulation of mating type specific genes in Saccharomyces cerevisiae .................................. 6 1.1.4 Ssn6-Tup1 mediated gene repression................................................................................... 10
1.2 Methods for in vivo analysis of chromatin structure ............................................................... 20 1.2.1 Nuclease digestion of isolated nuclei................................................................................... 20 1.2.2 Mapping chromatin structure by expressing enzymes in living cells..................................... 22 1.2.3 Chromatin Immuno-precipitation (CHIP) ............................................................................ 25 1.2.4 Electron microscopy (EM) and chromatin ........................................................................... 27 1.2.5 Minichromosome affinity purification (MAP) ..................................................................... 30 1.2.6 Other methods .................................................................................................................... 32 1.2.7 Conclusion ......................................................................................................................... 33
CHAPTER II CHROMATIN STRUCTURE MAPPING IN SACCHAROMYCES CEREVISIAE IN VIVO WITH DNASE I .........................................................34
Abstract.......................................................................................................................................... 35
2.1 Introduction ............................................................................................................................. 36
2.2 Materials and methods............................................................................................................. 39 2.2.1 Plasmid construction........................................................................................................... 39 2.2.2 Cell growth......................................................................................................................... 39 2.2.3 Nuclear and DNA preparation and analysis ......................................................................... 40 2.2.4 Southern blots..................................................................................................................... 41
2.3 Results ...................................................................................................................................... 43 2.3.1 DNase I expression in vivo.................................................................................................. 43 2.3.2 DNase I footprinting a labile repressor in vivo ..................................................................... 46 2.3.3 Different nucleosome linker accessibilities in repressed domains in vivo.............................. 48
v
2.4 Discussion....................................................................................................................................... 52
Acknowledgements.............................................................................................................................. 70
CHAPTER III TATA BOX BINDING PROTEIN PERSISTS AT ACTIVE YEAST PROMOTERS THROUGH MULTIPLE TRANSCRIPTION CYCLES IN VIVO .........................................................................................................71
3.1 Introduction ................................................................................................................................... 73
3.2 Materials and methods.................................................................................................................. 78 3.2.1 Yeast Strains and medium ....................................................................................................... 78 3.2.2 Nuclei and DNA preparation and analysis............................................................................... 78 3.2.3 Chromatin immunoprecipitation (ChIP).................................................................................. 80 3.2.4 Quantitative PCR..................................................................................................................... 81 3.2.5 Nuclei ChIP ............................................................................................................................. 81
3.3 Results ............................................................................................................................................ 83 3.3.1 Promoters of active genes are accessible and “nucleosome-free” ........................................... 83 3.3.2 TBP binds to promoters of different genes with the same occupancy level ............................ 85 3.3.3 Differential TBP binding patterns between living cells and isolated nuclei ............................ 89 3.3.4 TBP binds to a group of promoters with same occupancy level.............................................. 90
3.4 Discussion....................................................................................................................................... 94 3.4.1 TBP plays a different role in initiation and reinitiation ........................................................... 94 3.4.2 A comparison between TBP binding patterns in living cells and isolated nuclei .................... 98
Acknowledgements............................................................................................................................ 120
CHAPTER IV THE ROLE OF HIGHER ORDER CHROMATIN STRUCTURE IN REPRESSION OF THE MFA1 GENE IN Α CELLS................................121
4.1 Introduction ................................................................................................................................. 123
4.2 Materials and methods................................................................................................................ 127 4.2.1 Yeast strains and the minichromosome ................................................................................. 127 4.2.2 Minichromosome affinity purification................................................................................... 127 4.2.3 Western blot........................................................................................................................... 129 4.2.4 Electron microscopy (EM) .................................................................................................... 130 4.2.5 Nuclei and DNA preparation and analysis............................................................................. 130 4.2.6 Chromatin immunoprecipitation (ChIP)................................................................................ 131 4.2.7 Quantitative PCR................................................................................................................... 132
4.3 Results .......................................................................................................................................... 133 4.3.1 Nucleosomes are positioned over the regions required for MFA1 expression in cells ....... 133 4.3.2 The MFA1-ALT minichromosome ....................................................................................... 134 4.3.3 EM images of the MFA1-ALT minichromosome isolated from cells................................ 136 4.3.4 Multiple copies of Tup1p associate with the repressed MFA1 locus in vivo ......................... 137 4.3.5 Chromatin structure of the MFA1 locus in a tup1 mutant strain............................................ 139 4.3.6 Tup1p spreads over the entire MFA1 chromatin domain....................................................... 140 4.3.7 Hho1p binds to the repressed MFA1 locus in cells ............................................................ 141
4.4 Discussion..................................................................................................................................... 143
vi
Acknowledgements............................................................................................................................ 166
CHAPTER V SPECULATION ON FUTURE STUDIES AND AIMS ............167
5.1 Improvement of in vivo DNase I mapping................................................................................. 168
5.2 Further applications of MAP in exploring mechanisms of gene repression........................... 170 5.2.1 Is the compact chromatin structure specific for a cell-specific genes? .................................. 170 5.2.3 The distribution of Ssn6p-Tup1p complex along repressed domains .................................... 171 5.2.4 Deeper investigations of Hho1p function .............................................................................. 172
SUMMARY..................................................................................................178
REFERENCES............................................................................................184
APPENDIX ..................................................................................................200
vii
LIST OF FIGURES
Figure 2.1: Cytotoxicity of DNase I. .......................................................................... 57 Figure 2.2: DNase I expressed in vivo introduces nicks in and degrades plasmid DNA.
............................................................................................................................. 58 Figure 2.3: Time course of DNase I degradation of DNA in vivo. ............................. 60 Figure 2.4: DNase I footprinting of the genomic Mat2p/Mcm1p complex binding
site in intact cells and isolated nuclei.................................................................. 62 Figure 2.5: Chromatin structure of the recombination enhancer in vivo. ................... 64 Figure 2.6: Chromatin structure of the STE6 promoter in vivo................................... 66 Figure 2.7: Chromatin structure of a nucleosome adjacent to the E silencer at HMRa
in vivo.................................................................................................................. 68 Figure 3.1: Indirect end labeling mapping of chromatin structure of the promoter of
several genes. .................................................................................................... 102 Figure 3.2: Primer extension mapping of DNase I cutting sites around the promoter
and coding region of the PGK1 gene. ............................................................... 104 Figure 3.3: Primer extension mapping of DNase I cutting sites around the promoter
and coding region of the YCL056C gene. ......................................................... 106 Figure 3.4: Chromatin immunoprecipitation for transcription factor binding.......... 108 Figure 3.5: TBP occupancy of the STE6 promoter and open reading frame (ORF)
regions in living cells and isolated nuclei. ........................................................ 110 Figure 3.6: TBP binds to the promoter of a cell-specific genes only in a cells........ 112 Figure 3.7: RNA polymerase II and TFIIH occupancy at selected promoters. ........ 114 Figure 3.8: Summary of the ChIP data. .................................................................... 116 Figure 3.9: TBP and RNA polymerase II occupancy at promoters of selected histone
genes. ................................................................................................................ 118 Figure 4.1: Chromatin structure of MFA1 locus in cells. ...................................... 148 Figure 4.2: Minichromosome construct.................................................................... 150 Figure 4.3: Primer extension mapping of the chromatin structure of the MFA1-ALT
minichromosome............................................................................................... 152 Figure 4.4: Electron micrographs of MFA1-ALT minichromosomes isolated from
cells, negatively stained with uranyl acetate..................................................... 154 Figure 4.5: Western blot analysis of the affinity-purified MFA1-ALT
minichromosome probed with anti-Tup1p antibodies. ..................................... 156 Figure 4.6: Nucleosome mapping of MFA1 in a tup1 mutant strain. ....................... 158 Figure 4.7: Chromatin immunoprecipitation assay for Tup1p binding. ................... 160 Figure 4.8: Hho1p binds to MFA1 region in cells. ................................................ 162 Figure 4.9: Model for repression of MFA1 gene in cells. ..................................... 164 Figure 5.1: The schematic of the experiment to determine the ratio between Mcm1p
and Tup1p associated with the MFA1-ALT minichromosome. ....................... 176
viii
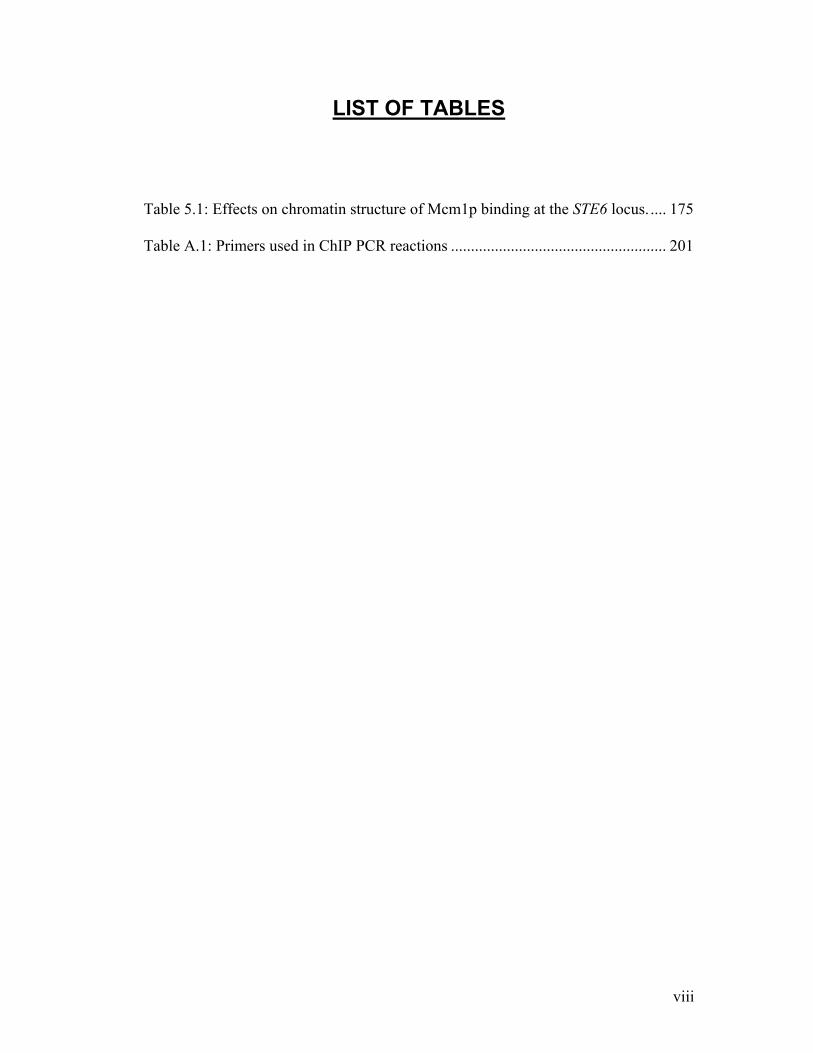
LIST OF TABLES
Table 5.1: Effects on chromatin structure of Mcm1p binding at the STE6 locus. .... 175 Table A.1: Primers used in ChIP PCR reactions ...................................................... 201
ix
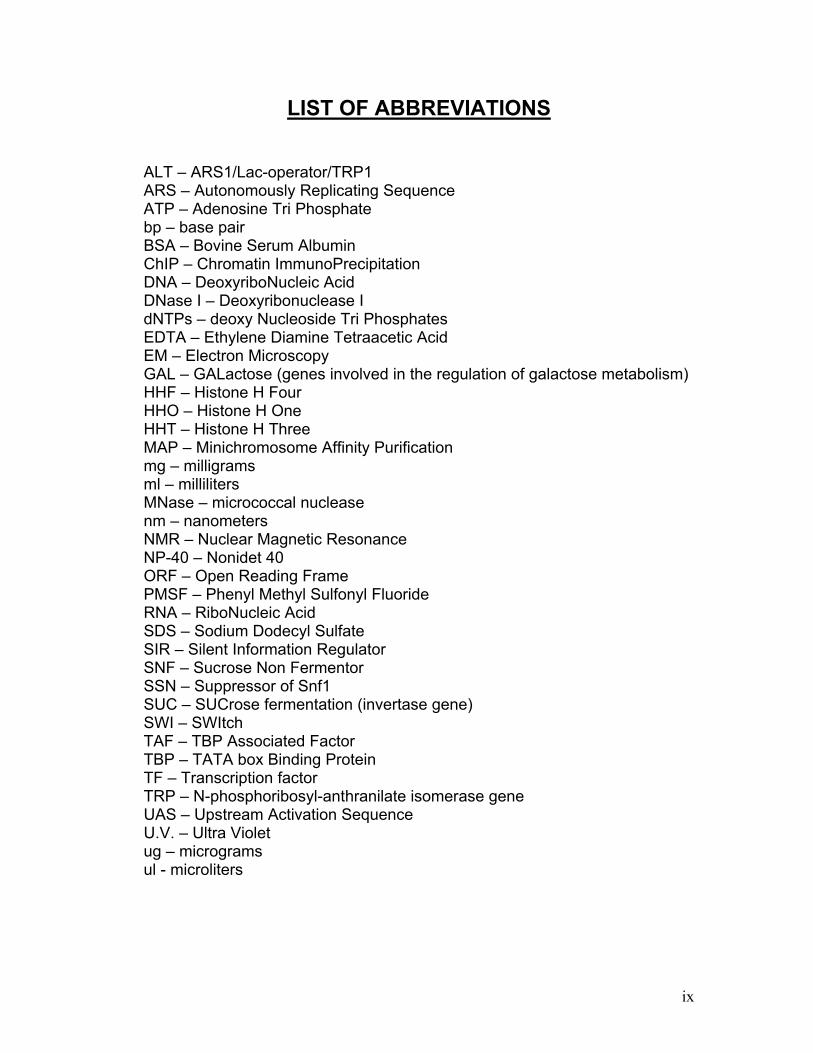
LIST OF ABBREVIATIONS
ALT – ARS1/Lac-operator/TRP1 ARS – Autonomously Replicating Sequence ATP – Adenosine Tri Phosphate bp – base pair BSA – Bovine Serum Albumin ChIP – Chromatin ImmunoPrecipitation DNA – DeoxyriboNucleic Acid DNase I – Deoxyribonuclease I dNTPs – deoxy Nucleoside Tri Phosphates EDTA – Ethylene Diamine Tetraacetic Acid EM – Electron Microscopy GAL – GALactose (genes involved in the regulation of galactose metabolism) HHF – Histone H Four HHO – Histone H One HHT – Histone H Three MAP – Minichromosome Affinity Purification mg – milligrams ml – milliliters MNase – micrococcal nuclease nm – nanometers NMR – Nuclear Magnetic Resonance NP-40 – Nonidet 40 ORF – Open Reading Frame PMSF – Phenyl Methyl Sulfonyl Fluoride RNA – RiboNucleic Acid SDS – Sodium Dodecyl Sulfate SIR – Silent Information Regulator SNF – Sucrose Non Fermentor SSN – Suppressor of Snf1 SUC – SUCrose fermentation (invertase gene) SWI – SWItch TAF – TBP Associated Factor TBP – TATA box Binding Protein TF – Transcription factor TRP – N-phosphoribosyl-anthranilate isomerase gene UAS – Upstream Activation Sequence U.V. – Ultra Violet ug – micrograms ul - microliters

x
ACKNOWLEDGEMENTS
Sincere thanks to my family, friends, professors, and colleagues who have
so greatly contributed to my accomplishments during these years. Enough
can never be said to recognize the importance of their help and friendship.
I am particularly grateful to Bob Simpson for his extraordinary scientific
guidance and personal friendship. As an advisor, he provides an excellent
role model and gives me opportunities to develop critical thought and skills
through practice. As a friend, he is generous, warm and caring. I can not
imagine how I could have prospered through these hard times without his
help.
Thanks to my labmates and friends at Penn State: Mai Xu, Bing Li, Bob
Boor, John Diller, Yingbao Zhu, Chun Ruan, Sevinc Ercan, Alexandra Surcel,
Sangita Chakraborty, Christopher Graham, Chris Vakoc, Tom Denkenberger,
Cissy Young, Hugh Patterton, Chuck Ducker, Kerstin Weiss, Sam John,
Zhengjian Zhang, Decha Sermwittayawong and Mitra Vishva. Their technical
information, scientific discussions, and enjoyable friendship are unforgettable.
Thanks to Drs. Jerry Workman, Joe Reese, David Gilmore, Frank Pugh,
Song Tan, Andy Henderson, Hong Ma and Nina Fedoroff for their efforts and
patience in teaching me the basics.
Thanks to my professors and friends in BMU for eight unforgettable years.
The medical knowledge I have gained gives me the ability to survive during

xi
hard times. Particularly, I want to say thanks to Professor Wang Kui, Zhang
Jingxia and Ji Chengye, whose earnest teaching has meant a lot to me.
Special thanks to Christopher, who brings me a great family. Thanks to
Chuck, Gail, Christopher, Gina, Andrew, and Thomas. For us (my wife and I),
every time we think of you, we are reminded of love, faith, support, elegance,
kindness, honesty, wisdom, and giving.
Thanks to my parents and sisters, whose sacrifice and love has been
worth more than words can say.
My last, but not least, thanks are due to my wife, Lijie. She brings
sweetness and light to my life. Without her love and companionship, every
success is meaningless.
Let your acquaintances be many,
But your advisors one in a thousand.
A faithful friend is a sure shelter,
Whoever finds one has found a rare treasure.
---Ecclesiasticus

Chapter I
Introduction
2
The importance of chromatin had been appreciated for many years before
the information regarding components and the structure of chromatin was
known. For example, in 1944 (about one year before the acceptance of DNA
as genetic material, nine years before the elucidation of double helix structure
of DNA, and thirty years before the discovery of nucleosome), Erwin
Schrödinger mentioned in his lecture What is Life? (Schrödinger, 1944): “the
chromosome structures are at the same time instrumental in bringing about
the development they foreshadow. They are law-code and executive power –
or, to use another simile, they are architect’s plan and builder’s craft – in one.”
Decades of intensive efforts have provided plenty of evidence for this
statement and revealed that in eukaryotic cells, DNA transcription, replication,
recombination and repair all take place in the context of chromatin (Jenuwein
and Allis, 2001; Kornberg and Lorch, 1999; Workman and Kingston, 1998a).
Therefore, exploration of structural and componential information of chromatin
is crucial to the understanding of these DNA functions.
In the first section of this chapter, I will describe the current knowledge of
chromatin structure and its role in transcription regulation. In addition, I will
use the regulation of a cell-specific genes in yeast and the Ssn6-Tup1
complex mediated gene repression as examples. In the second section, I will
briefly review the application, advantages, and disadvantages of several
chromatin analyzing methods.
3
1.1 Chromatin structure and transcription
1.1.1 Chromatin structure
Now it is clear that chromatin is a dynamic complex of the nucleic acid
with histones and other proteins. Nucleosome, the basic repeating unit of
chromatin, contains nucleosome core particle and linker DNA that connects
one core particle to the next in chromatin. A nucleosome core can be defined
as a histone octamer, made up of two each of H2A, H2B, H3 and H4, with
~146 bp of DNA wound on the outside. The (H3)2(H4)2 tetramer lies at the
center, and H2A-H2B dimmers stay at the ends of the DNA path. Each
histone is organized into two domains: a central fold (histone fold) which
constrains the DNA super-helix and contributes to the compact core of the
nucleosome, and an unstructured amino-terminal tail which extends outside
the core and provides a basis for interaction among nucleosomes and
regulation (Luger et al., 1997).
In higher eukaryotic organisms, linker DNA between nucleosomes is
associated with a histone termed linker histone (histone H1 or H5) (Vignali
and Workman, 1998; Widom, 1998). In Saccharomyces cerevisiae, HHO1
encodes a putative linker histone with very significant homology to histone H1
(Landsman, 1996; Ushinsky et al., 1997). While Hho1p has not been shown to
affect global chromatin structure, nor has its deletion shown any detectable
phenotype, it can form a stable ternary complex with a reconstituted core
dinucleosome at a molar ratio of one in vitro. After micrococcal nuclease
4
digestion of chromatin the reconstituted nucleosomes showed a kinetic pause
at ~168 bp, as do nucleosomes associated with histone H1 (Patterton et al.,
1998; Ushinsky et al., 1997). It is reported HHO1 and those genes encoding
the core histones are highly transcribed during S phase in yeast, indicating
that Hho1p possibly functions in a coordinated fashion with the core histones
(Spellman et al., 1998). Recently, Freidkin et al (2001) presented that HHO1
is both transcribed and translated in living yeast cells, the protein co-purifies
with the core histones and that HHO1 disruption does have a transcription
effect on a subset of genes and that it is preferentially concentrated at the
repeated sequences that encode rRNA. They also measured its relative
stoichiometry to the core histones in the cell, finding that hho1p is in far fewer
copies in the cell than core nucleosomes. All those evidence is consistent with
Hho1p being a bona fide linker histone protein and performing its functions
locally in yeast cells. However, much work is still needed to define the details
of Hho1p’s functions.
While people have observed that a chain of nucleosomes could be further
packaged into 30-nm fibers with six nucleosomes per turn in a spiral or
solenoid arrangement, it remains unclear how nucleosomal arrays twist and
fold this chromatin fiber into such a defined higher order structure (Van Holde,
1989). Reversely, the 30-nm fiber could unfold to generate a template for
transcription, in the form of an 11-nm fiber or beads on a string, by an
unknown mechanism. Therefore, future studies would focus on elucidating
5
the higher-order conformation and conformational changes of chromatin
under different physiological circumstances.
1.1.2 Chromatin structure and transcription
Chromatin plays an important role in the process of gene regulation in
eukaryotic cells (Kornberg and Lorch, 1999). Even 60 years ago, it was found
that a gene could be on or off without changing the sequence. After the
concept of nucleosome has been given, in vitro competition experiments with
histones and basal transcription (Knezetic et al., 1988; Knezetic and Luse,
1988; Lorch et al., 1987; Matsui, 1987; Workman et al., 1988; Workman and
Kingston, 1992b; Workman and Roeder, 1987b) have shown that packaging
promoters in nucleosomes prevents the initiation of transcription by bacterial
and eukaryotic RNA polymerases. Later investigators found that the
nucleosome can inhibit several processes that must occur for a eukaryotic
gene to be appropriately regulated. These processes include: binding of
activators to both enhancer and promoter regions; transcription initiation,
elongation and termination (Clark and Felsenfeld, 1992; Felsenfeld, 1992;
Felsenfeld et al., 1996; Studitsky et al., 1994; Workman and Kingston,
1998b).
These in vitro experiments were quickly followed by experiments, which
demonstrated that nucleosome positioning and remodeling of chromatin
structure in vivo also affect the transcription (Almer et al., 1986; Han et al.,
1987; Han and Grunstein, 1988; Han et al., 1988; Kim et al., 1988; Morse et
6
al., 1987; Simpson et al., 1993). For example, after turning off histone
synthesis by genetic means in yeast, and consequent nucleosome loss,
transcription of all previous inactive genes tested can be turned on (Han and
Grunstein, 1988). Recently, investigations on acetylation, methylation,
ubiquitation and phosphorylation of histone tails lead to the “histone code”
hypothesis, which predicts that such modifications will result in distinct “read
out” of the genetic information, such as gene activation versus gene silencing
(Jenuwein and Allis, 2001). Moreover, explorations on functions of ATP-
dependent chromatin remodeling complexes suggest that disruption of
nucleosomes is required for binding of RNA polymerase, transcription factors
and activators (Hassan et al., 2001; Vignali et al., 2000).
Currently, it is well accepted that chromatin can affect transcription at
different levels. These include the modifications of histones; the binding of
nonhistone proteins such as activators, transcription factors, and repressors;
positioning and remodeling of nucleosomes; higher order chromatin
structures (interactions among nucleosomes); and the localization within the
nucleus. Many detailed mechanisms still remain unclear. Among these are
the mechanisms by which the constitutively active transcription of the house
keeping genes is maintained, and the conformation and the conformational
changes of local chromatin under different functional states.
1.1.3 Regulation of mating type specific genes in Saccharomyces
cerevisiae
7
In eukaryotic organisms, the number of genes is in significant excess of
the required gene products for any given cell under a particular set of
circumstances. Therefore, some genes are turned on only in certain cell
(tissue) types, at certain developmental stages, or in response to certain
signals (e.g. nutrient, temperature, or hormone). Moreover, inappropriate
expression of some of these genes will lead to diseases in human beings
such as cancer and auto-immuno diseases. Among these are the mating type
specific genes in Saccharomyces cerevisiae.
The yeast Saccharomyces cerevisiae is an ideal experimental organism. It
is a microorganism that has a fast rate of growth, with a generation time of
only ninety minutes under optimal conditions. Genetic methods have been
developed that allow straightforward and generally easy manipulation of its
genome. Any desired mutation can be incorporated into the Saccharomyces
cerevisiae genome, allowing powerful genetic analyses to be performed.
Saccharomyces cerevisiae shares many fundamental properties with other
eukaryotes, including humans. Therefore, what is learned from studies of
Saccharomyces cerevisiae is often directly relevant to issues in human
biology.
Saccharomyces cerevisiae exists in three cell types: a and α and diploid
a/α (Dolan and Fields, 1991; Herskowitz, 1989). The a or α type of a haploid
cell is determined by the expression of master regulatory protein genes from
the active mating type locus (MAT). In MATα cells the MATα1 and MATα2
genes are expressed coding for the Matα1p and Matα2p proteins
8
respectively. Matα1p activates transcription of α cell specific genes and
Matα2p represses transcription of a cell specific genes. In a/α diploids, where
both an active MATa and MATα locus are present, haploid specific genes are
repressed by a hetero-dimer of Matα2p and a MATa product, Mata1p. In
MATa cells, neither Matα1p nor Matα2p is present, so a cell specific genes
can be expressed and no α cell specific genes are activated (Andrews and
Herskowitz, 1990).
In MATα cells the a cell specific genes are thought to be repressed by the
formation of a complex of proteins at the α2 operator, a nearly symmetric 31
bp sequence present approximately ~200 bp upstream of the seven a cell
specific genes (Johnson and Herskowitz, 1985; Zhong et al., 1999). A homo-
dimer of the Matα2p repressor binds to this operator in a cooperative manner
with a homo-dimer of another protein, Mcm1p, a non-cell type specific MADS
box protein (Acton et al., 1997; Mead et al., 2002). Mcm1p binds to the center
of the operator while Matα2p binds to operator sequences flanking the
Mcm1p binding site. Binding of Matα2p/Mcm1p to the α2 operator establishes
a repressive chromatin structure adjacent to the operator, in which
nucleosomes are precisely positioned over essential promoter elements of
the a cell specific genes and extend into the coding region of the genes
(Ducker and Simpson, 2000; Patterton and Simpson, 1994; Roth et al., 1992;
Shimizu et al., 1991; Simpson et al., 1993). Chromatin was implicated in the
repression of the a cell specific genes in α cells by virtue of the absence of a
nucleosomal array on the a cell specific genes in a cells. It was also shown
9
that nucleosomes are positioned less well defined on STE6, one of the a cell
specific gene, in α cells expressing histone H4 with amino-tail mutations.
Under these conditions, partial derepression of the a cell specific genes was
also reported (Roth et al., 1992). It was initially proposed from these data that
repression is established by Matα2p directly interacting with the tails of
histone H4 positioning nucleosomes on essential promoter elements, and
masking these elements from DNA binding trans-acting activator proteins
and/or basal transcription factors. However, it was reported that at least two
other proteins, Ssn6p (Schultz and Carlson, 1987) and Tup1p (Lemontt,
1980; Smith and Johnson, 2000), are also necessary for full repression of the
a cell specific genes. Keleher et al (1992) have demonstrated that in ssn6
knockout strains, the a cell specific genes are derepressed, even though the
Matα2p/Mcm1p complex is bound at the α2 operator. They also showed that
the targeting of Ssn6p to a heterologous promoter via fusion to a LexA DNA
binding domain, acts to repress transcription from the heterologous promoter
in a Tup1 dependent fashion. Neither Tup1p nor Ssn6p show any DNA
binding ability, instead the two proteins are thought to be recruited to the a
cell specific genes promoter by Matα2p and bind to histone tails (Davie et al.,
2002; Ducker and Simpson, 2000; Komachi et al., 1994; Smith and Johnson,
2000; Tzamarias and Struhl, 1994; Watson et al., 2000). Recently, our lab
has shown that the Tup1p specifically associates with the repressed
chromatin at a ratio of about two molecules per nucleosome along the
promoter region and entire genomic coding region of STE6 and MFA1, two of
10
the a cell specific genes, in α cells (this study and Ducker, 2001; Ducker and
Simpson, 2000). Also, collaborating with Dr. Woodcock, we observed a highly
organized secondary chromatin structure in these same repressive domains
under EM (this study and Ducker, 2001). These studies clearly showed that
there exists a special higher order chromatin structure along these repressed
domains.
Future studies regarding regulation of these a cell-specific genes should
focus on understanding in details the forces that hold these chromatin
structures together. Many questions need to be answered. What is the
methylation, acetylation, phosphorylation, and ubiquitation status of the
nucleosomes within these domains, both in active and repressed states?
What proteins other than Ssn6-Tup1 participate in the repression of these
genes? Are these genes localized to certain places inside the nucleus when
they are active or repressed? And, most interestingly, can we reassemble
these structures from defined components in vitro and show that they have
properties similar to those inferred from these above in vivo biochemical,
biophysical, and/or genetic studies? Certainly, fully understanding the
mechanisms by which the a cell-specific genes are activated or repressed will
provide insights into the regulation of tissue specific genes or developmental
stage specific genes in higher organisms and will also expand the
understanding of several human diseases.
1.1.4 Ssn6-Tup1 mediated gene repression
11
In addition to activation, gene specific repression of transcription also
plays a central role in gene regulation. A gene can be repressed through two
pathways. First, a gene present in a cell type can be repressed because of
the lack of necessary activators to activate this gene. The second pathway is
termed “active repression”, which means a gene (or a set of genes) can be
repressed even when the necessary activators are present in the cells.
Various protein complexes, called repressors, are involved in the process of
active repression. Repressors can repress selected genes through different
ways: modifying histones, organizing specialized chromatin structures,
interfering with activators, and/or the transcription machinery (Smith and
Johnson, 2000).
Ssn6-Tup1 complex is a well documented repression complex. This
repressor is composed of the Ssn6p (also called Cyc8p) and Tup1p proteins.
Repression by Ssn6-Tup1 has several distinguishing features. First, this
complex has an exceedingly efficient repression capacity. For example, the
repression ratio (the ratio of the transcription level under active conditions to
the transcription level under repression) can be as high as 1,000 times (Redd
et al., 1996). Second, Ssn6-Tup1 complex can repress as many as 3% of the
Saccharomyces cerevisiae genes (DeRisi et al., 1997). Third, the Ssn6-Tup1
repressor can cause strong repression when it is attracted to DNA at a variety
of positions along the upstream control region of its target genes (Herschbach
and Johnson, 1993; Keleher et al., 1988; Tzamarias and Struhl, 1995).
Moreover, this complex can prevail against many kinds of activators and can
12
repress genes that are activated by several different activators working
together. Finally, Ssn6p and Tup1p both belong to protein families that are
evolutionarily conserved (Smith and Johnson, 2000 and references there in).
Although the analyses are not yet complete, the available results reveal that
many species contain repressors that resemble Ssn6p and Tup1p not only in
sequence but also in function. Those species are yeasts (including
Saccharomyces cerevisiae, Candida albicans, and Schizosaccharomyces
pombe), worms, flies, and mammals (including mouse and human).
1.1.4.1 Biochemistry of Ssn6p and Tup1p
Tup1p is a 78kD protein with three functional domains (Ducker, 2001;
Williams and Trumbly, 1990). The N-terminal domain mediates
tetramerization of Tup1p and is necessary for the formation of a stable 4:1
complex between Tup1p and Ssn6p (Jabet et al., 2000; Tzamarias and
Struhl, 1994; Tzamarias and Struhl, 1995; Varanasi et al., 1996; Williams and
Trumbly, 1990). The C-terminal domain of Tup1p contains seven copies of
the WD40 repeat motif (Zhang et al., 2002b). The WD40 repeat is a
degenerate sequence ~40 amino acids in length and is present in many
proteins with diverse functions (Komachi et al., 1994; Schultz and Carlson,
1987; Williams and Trumbly, 1990). For example, at least 77 Saccharomyces
cerevisiae proteins, including Ste4p, Cdc4p, Cdc20p, and Mak11p contain
WD40 repeats (Komachi et al., 1994; Schultz and Carlson, 1987; Williams
and Trumbly, 1990). Moreover, a number of significant Drosophila proteins,
including extra sex combs and groucho, contain the WD40 motif (Gutjahr et
13
al., 1995). In vitro studies have revealed that the WD40 repeat domain is
involved in mediating protein-protein interactions, and that each of the seven
repeats of Tup1p is necessary for the repression of different set of genes
(Carrico and Zitomer, 1998; Zhang et al., 2002a). For example, the C-terminal
WD40 repeats 1 and 2 of Tup1p have been shown to interact directly with
Mat2p (Komachi and Johnson, 1997; Komachi et al., 1994). The central
domain of Tup1p contains a defined repression domain (Tzamarias and
Struhl, 1994) that interacts with the tails of histones H3 and H4, suggesting
that there may be a connection between these two functions (Edmondson et
al., 1996).
Ssn6p belongs to an evolutionarily conserved family of proteins, which is
characterized by the 34 amino acid repeat sequence termed the
tetratricopeptide motif (TPR) (Goebl and Yanagida, 1991). Forty two proteins
in Saccharomyces cerevisiae contain the TPR repeat (Rhee et al., 1989).
Ssn6p contains 10 tandomly repeated TPRs at its N-terminus that are
required for full function of the protein (Schultz and Carlson, 1987; Schultz et
al., 1990). Tzamarias and Struhl (1995) have demonstrated that the TPR
repeats do not function as a single unit. Instead, different sets of the TPRs
are necessary for repression of different genes by interacting with a number
of different DNA-binding proteins (Tzamarias and Struhl, 1995). For example,
the first three TPR repeats are sufficient for binding to Tup1p and to Mat2p
and hence, for repression of mating type genes (Smith et al., 1995;
Tzamarias and Struhl, 1994); Repeats 1 through 7 are necessary for
14
repression of hypoxia-induced genes (Tzamarias and Struhl, 1994); and all of
the TPR repeats are required for repression of DNA damage-regulated genes
(Tzamarias and Struhl, 1994). Notably, Schultz et al. (1990) have shown that
the C-terminal region of Ssn6p has a high content of PEST residues (8%
proline, 18% glutamate, and 25% serine and threonine), a characteristic
feature of proteins with short metabolic half-lives (Rechsteiner and Rogers,
1996; Rogers et al., 1986).
Interestingly, both Tup1p and Ssn6p have been shown to be
phosphorylated in vivo (Redd et al., 1997; Schultz et al., 1990). This post-
translational modification has been suggested to be involved in the function of
these proteins, although there is no direct evidence to support this
hypothesis.
1.1.4.2 Genes controlled by Tup1p and/or Ssn6p
The deletion of either Tup1p or Ssn6p is not lethal to the yeast cells.
However, compared to wild type cells, the Tup1p and/or Ssn6p mutants do
exhibit a number of distinct phenotypes (Keleher et al., 1992; Wahi et al.,
1998). These include flocculation, a loss of mating in -cells, slow growth,
poor sporulation, the ability to take up thymidine from the media (which is
where Tup1p gets its name – Thymidine Up-take Positive), and the loss of
some aspects of the glucose-dependent regulatory circuit (from which Ssn6p
gets its name – Suppressor of Sucrose Non-fermentor). A recent microarray
analysis (DeRisi et al., 1997) suggested that these phenotypes were caused
by the inappropriate expression of more than 150 yeast genes. Some of these
15
genes have been shown to be repressed by Tup1p and/or Ssn6p (Smith and
Johnson, 2000; Wahi et al., 1998). These genes can be divided into different
families. Each family of genes functions in a specific cellular process and has
a common sequence specific DNA-binding protein that is responsible for the
recruitment of Tup1p/Ssn6p, as neither Tup1p nor Ssn6p has the ability to
interact with DNA on their own. These proteins are Crt1p (for the DNA
damage-inducible genes) (Huang et al., 1998), Mig1p (for the glucose-
repressible genes) (Treitel and Carlson, 1995), Rox1p (for the hypoxia-
induced genes) (Balasubramanian et al., 1993), and Mat2p (for the a cell-
specific genes) (Herschbach et al., 1994; Komachi and Johnson, 1997;
Komachi et al., 1994; Smith et al., 1995). Notably, researchers have not found
any similarity between any two of the proteins responsible for recruiting
Tup1p and/or Ssn6p to specific genes (Smith and Johnson, 2000; Wahi et al.,
1998). Those proteins are different from each other either in their DNA-
binding motif or in any amino acid residues responsible for the interaction with
the Tup1p/Ssn6p complex.
As described above, Tup1p contains seven copies of WD motif, and
Ssn6p contains ten tandem arrays of TPR repeats (Smith and Johnson, 2000;
Tzamarias and Struhl, 1995). In addition, the Ssn6-Tup1 complex is
composed of four Tup1p molecules and one Ssn6p molecule (Varanasi et al.,
1996) and adopts an elongated conformation (Redd et al., 1997; Varanasi et
al., 1996). These features provide the Ssn6-Tup1 complex the flexibility to
interact with diverse sets of DNA-binding proteins with different conformations
16
and under different conditions. For example, the WD40 motif of Tup1p and
the TPR repeats mediate the interaction with Mat2p, whereas Mig1p and
Rox1p seem to interact with Ssn6p but not directly with Tup1p (Tzamarias
and Struhl, 1995). Furthermore, Mat2p can interact with any one of the TPR
repeats in Ssn6p and any one of the four Tup1p in the same complex. Thus,
the Ssn6-Tup1 complex can be oriented in many different ways when
interacting with Mat2p, allowing significant flexibility in the way that it can
bridge distances along DNA and interact with other proteins (Smith and
Johnson, 2000).
1.1.4.3 Mechanism of the Ssn6-Tup1 mediated repression
Although studies have firmly established the importance of the Ssn6-Tup1
repressor in the repression of many genes, many questions regarding the
precise mechanism by which the Ssn6-Tup1 repressor functions remain
unanswered. Two general models, which are not mutually exclusive, have
been advanced to explain how the Ssn6-Tup1 repressor might repress gene
transcription once the repressor has been brought to the DNA. These models
must be able to account for the general features of Ssn6-Tup1 repression
mentioned above and it is proposed that the Ssn6-Tup1 complex can utilize
multiple mechanisms to repress the transcription of any given gene.
(1) Direct interference with activators and/or the transcription
machinery. Several studies support this model. First, the Ssn6-Tup1 complex
could exert tight transcriptional repression while still allowing occupancy of a
UAS by activators (Gavin et al., 2000; Keleher et al., 1992; Redd et al., 1997).
17
For example, Gavin et al. (2000) have suggested that one of the mechanisms
of Tup1p mediated repression of the a-cell specific genes is the stabilization
of the Mat2p/Mcm1p complex. Therefore, the Ssn6-Tup1 repressor can
block the Mcm1p mediated activation and the chromatin remodeling activity.
It is also possible that Tup1p could interact with an activator directly once
Tup1p is recruited to DNA and compromise the activator’s ability to activate
transcription. As yet, this hypothesis has not been proved directly. Second,
Herschbach et al. (1994) and others (Redd et al., 1997) observed that
recombinant Mat2p and yeast extracts prepared from strains over-
expressing Ssn6p and Tup1p could repress transcription of a naked DNA
reporter construct in vitro. However, the repression level was modest as
compared to the repression in vivo. Finally, several genetic screens have
identified genes whose products could affect repression by the Ssn6-Tup1
complex. These gene products include some components of the
mediator/holoenzyme complex such as Srb7p, Ssn5p, Ssn2p, Ssn3p, Ssn8p,
Gal11p, Rgr1p, Sin4p, and Rox3p (Carlson, 1997). Although the precise
functions of these proteins are not clear, these proteins have been
biochemically linked to the RNA polymerase II transcription machinery. In
addition, genetic evidence suggests that the mediator/holoenzyme complex
plays a role not only in transcriptional activation but also in repression
(Carlson, 1997). However, there is no direct evidence for this argument so
far.
18
(2) Establishment of the local chromatin environment. This model is
supported by several lines of evidence. First, Ssn6-Tup1 complex repressed
genes are associated with the establishment of chromatin domains in which
nucleosomes are precisely positioned over essential promoter elements and
transcription initiation sites (Cooper et al., 1994; Gavin and Simpson, 1997; Li
and Reese, 2001; Roth, 1995). Deletion of TUP1 resulted in derepression of
the gene and disruption of the positioned nucleosomes (Cooper et al., 1994;
Gavin and Simpson, 1997; Li and Reese, 2001). Second, Tup1p interacts
with N-terminal tails of histones H3 and H4 in vitro. In vivo, deletion or
mutation of these tails has been observed to partially relieve Ssn6-Tup1
complex mediated repression (Edmondson et al., 1996; Edmondson et al.,
1998). Third, several HDACs can interact with Ssn6-Tup1 complex and affect
the repression (Watson et al., 2000). Fourth, by employing multiple
techniques, studies performed in our lab showed that the Ssn6-Tup1 complex
spreads along the promoter region and the entire coding sequence of two a
cell-specific genes, STE6 and MFA1, in repressed status (this study and
(Ducker, 2001; Ducker and Simpson, 2000).
In summary, all these evidence suggest that the Ssn6-Tup1 complex may
employ multiple mechanisms to repress a diversity of genes, and it is possible
that the Ssn6-Tup1 complex may employ different mechanisms to repress
different genes (Davie et al., 2002).
1.1.4.4 Relieve of the Ssn6-Tup1 mediated repression
19
Most, if not all, the genes repressed by Ssn6-Tup1 complex must be
derepressed under specific but distinct conditions. For example, the GAL
genes and the SUC2 gene are expressed in mediums using galactose as
carbon source (Smith and Johnson, 2000); when the cells are challenged with
moderate salt concentrations (400 mM NaCl), the osmotic stress response
genes must be activated for cells to survive (Proft et al., 2001). Obviously,
these genes can not be derepressed through inactivating the Ssn6-Tup1
complex, which will lead to expression of all the genes it controls. In stead,
the relief of repression results from the disassociation (Crt1p), degradation
(Mat2p), or exiting from nucleus (Mig1), of the sequence specific binding
proteins that recruit Ssn6-Tup1 complex to certain DNA regions. Therefore,
the Ssn6-Tup1 complex is released (Smith and Johnson, 2000). However,
this view has been challenged by several recent investigations showing that
in at least some cases, the Ssn6-Tup1 complex remains bound even though
the target genes are derepressed (Papamichos-Chronakis et al., 2002; Proft
and Struhl, 2002).
1.1.4.5 Future directions
Future studies will focus on (1) using MAP technique to confirm
distribution of Ssn6-Tup1 complex along repressed a cell-specific genes ( and
other Ssn6-Tup1 repressed genes) by employing immuno-EM technique, and
other new techniques; (2) the role of phosphorylation of Ssn6p and Tup1p,
since they are both phosphorylated proteins; and (3) the interaction between
the Ssn6-Tup1 complex and other histone modifiers such as methylases.
20
1.2 Methods for in vivo analysis of chromatin structure
1.2.1 Nuclease digestion of isolated nuclei
Most agents used to assess chromatin structure do not permeate cells.
Therefore, historically, the typical source of chromatin is within isolated nuclei.
Typically, nuclei are isolated from living cells and subjected to digestions of
nucleases. After the purification of DNA, the digestion sites can be analyzed
by indirect end labeling or primer extension (for details, see Simpson, 1998).
Both specific restriction endonucleases and non-specific nucleases, including
DNase I, DNase II and MNase, have been used (Simpson, 1998). The use of
restriction endonucleases to infer the presence of a nucleosome is relatively
simpler and quantification of the cutting can be done. However, it is also less
informative in that it cannot provide information about either the translational
or the rotational position of a nucleosome. Moreover, convincing results can
be obtained only when the restriction site is in or very close to the dyad of a
tightly positioned nucleosome. Therefore, DNase (I and II) and MNase are
more widely used for chromatin mapping. Two major classes of information,
the positioning of nucleosomes and hypersensitive sites, have been obtained
by digesting isolated nuclei with these nucleases.
A positioned nucleosome is located in a precise site relative to DNA
sequence in all cells of a given population (Simpson, 1991). Nucleosome
positioning can be detected by MNase (detecting the translational positions)
and DNase I (detecting the rotational positions) in isolated nuclei.
21
Nucleosome positioning is determined by several mechanisms and has
significant functional consequences (Simpson, 1991). For example, when an
autonomously replicating sequence of a minichromosome was covered by a
positioned nucleosome, the copy number of the minichromosome decreased
dramatically (Simpson, 1990).
In chromatin, nucleosome-free regions known as nuclease hypersensitive
sites represent the “open windows” that enhanced access of crucial trans-
factors. These regions are typically two orders of magnitude more sensitive to
DNase (I or II) and MNase than other regions in bulk chromatin (Elgin, 1988;
Gross and Garrard, 1988). These regions are always associated with very
important cis-acting DNA sequences such as enhancers, promoters,
replication origins or other sites which are important features of DNA
activities. Moreover, these hypersensitive sites can be used to predict the
discovery of new classes of cis-acting DNA sequences, perhaps involved in
the functional punctuation of chromatin domains (the boundary elements),
chromosome condensation and decondensation, meiotic chromosome
pairing, and other processes that remain to be discovered. However, the
mechanisms leading to the formation, maintenance, and propagation of
hypersensitive sites are poorly understood and represent challenging
questions (Elgin, 1988; Gross and Garrard, 1988).
Clearly there are numerous parameters to consider before concluding that
chromatin in an isolated nucleus represents native chromatin in a cell. For
example, TBP binding has been reported to change drastically upon isolation
22
of nuclei (this study and Pfeifer and Riggs, 1991); it was reported that
nucleoplasmin was readily lost upon isolation (Krohne and Franke, 1980); and
histone H1, was also degraded very soon in isolated nuclei(Krohne and
Franke, 1980). Even for nucleosome positioning, it has been reported that
care should be taken to analyze the data (Lohr and Lopez, 1995). Finally, the
swelling of chromatin in the low ionic strength digestion buffer makes it
impossible to obtain information about higher order chromatin structure.
1.2.2 Mapping chromatin structure by expressing enzymes in living cells
This strategy bypasses the need to isolate nuclei. So far, several classes
of enzymes have been expressed in living cells to probe chromatin structures.
These are DNA methylases (Kladde et al., 1999b), DNase I (Wang and
Simpson, 2001), and certain restriction endonucleases (Iyer and Struhl, 1995;
Mai et al., 2000).
Several studies suggested that DNA methylases (MTase) can be
expressed in vivo and test chromatin structure (Kladde et al., 1999b and
references therein). More than 20 years ago, Pratt and Hattman suggested
that MTase could be used to analyze protein-DNA interaction based on their
observation that MTase modified linker DNA preferentially to DNA associated
with histones in nucleosomes (Hattman et al., 1978; Pratt and Hattman,
1981). Gottschling (1992) and Singh and Klar (1992) also supported the use
of MTase accessibility as a probe for chromatin structure from their
independent studies on genes when repressed or expressed by using
23
expression of E. coli dam MTase in Saccharomyces cerevisiae cells. The
original DAM MTase, which was used for the assay, recognizes sequences of
4 bp, GATC, which occur randomly every several hundred base pairs. Efforts
made mainly in our lab have increased the number of potential target
sequences greatly by extending this method of analysis to more promiscuous
MTases, such as the SssI enzyme, recognizing CG, and the MCviPI enzyme,
recognizing GC, (Kladde et al., 1999b). To map chromatin structure with this
strategy, MTase is usually integrated into the genome under control of an
inducible promoter and is expressed in living cells and modifies its target sites
in chromatin under physiological conditions, and the accessibility of the
enzyme to its cognate site reflects the local chromatin structure (Kladde et al.,
1999b). Compared to other methods, this method has many advantages: the
method eliminates the need for isolation of nuclei (they can be expressed in
vivo) and does not impair cell viability when the modification level is low; it
does not damage DNA; and it can detect both histone-DNA and nonhistone-
DNA interactions. But this method also has disadvantages. For one, its
resolution is not high enough. For example, the most widely used enzyme,
M.SssI, modifies cytosine in the sequence CG. CG is underrepresented in
many genomes, including Saccharomyces cerevisiae, where it is present
once every ~35 bp. Another disadvantage is that there is endogenous MTase
in many organisms; this greatly limits the application of this method (Kladde et
al., 1999b).
24
DNase I was the first enzyme used to define the general nuclease
sensitivity that distinguish active from inactive genes by Weintraub and
Groudine (1976). Later on, Wu and Gilbert used this same nuclease for
description of nuclease hypersensitive sites that signaled a regulated
promoter in the active state (Wu and Gilbert, 1981). Most importantly,
extension of the general rule that DNase I hypersensitivity marks the sites
where the action is in chromatin has made hypersensitive sites synonymous
with enhancers, promoters, replication origins, or other features of DNA
activity (Elgin, 1988; Gross and Garrard, 1988). In an indirect-end label study
of DNase I digestion of ~50 kilobase pairs of the left arm of yeast
chromosome III, we have confirmed the correlation between these DNA
elements and hypersensitivity to the nuclease (S. Ercan and R.T.S.,
unpublished observation). Moreover, digestion of core particle DNA with a
periodicity of ~10 nucleotides leads to a distinctive pattern for rotationally
positioned nucleosomes (Wolffe, 1998). Differential sensitivity of linker DNA
allows DNase I mapping of nucleosome locations, although not with the
precise resolution of micrococcal nuclease which cuts linker DNA almost
exclusively (Simpson, 1998; Simpson, 1999). For these reasons, we elected
to attempt to establish DNase I as an in vivo chromatin probe (Wang and
Simpson, 2001). The advantages of this strategy include: (1) it can detect
interactions between non-histone proteins and DNA very efficiently (chapter II
and III); (2) as a non-specific endonuclease, DNase I can, in principle, detect
protein binding on any DNA sequences; (3) there is no need to isolate nuclei.
25
However, there are also some inherent disadvantages: (1) since it detects
chromatin structure in living cells, it is hard to distinguish whether the cutting
is from direct or indirect effects (for example, the cutting of DNA may induce
DNA damage reactions and DNA repair); (2) it is hard to distinguish whether
the protection comes from real binding of proteins or just from the steric
hindrance in the space due to the large size of DNase I; (3) it can provide only
a hint about protein binding, but not definitive information as to what proteins
are binding.
Several studies have also expressed specific restriction enzymes in living
cells (Iyer and Struhl, 1995; Mai et al., 2000). This strategy can yield
quantitative analysis and specific information. However, the sequence
specificity and the strong cutting properties (which lead to rapid cell death)
simultaneously limit its applications.
DNA repair enzymes, specifically photolyase, have been shown to be
responsive to chromatin organization and are therefore suggested for in vivo
tests of chromatin structure (Suter et al., 1999). However, as repair requires
an initial insult to the DNA by UV light to create lesions, the utility of these
enzymes for the study of normal cellular architecture is limited.
1.2.3 Chromatin Immuno-precipitation (CHIP)
ChIP is a valuable approach for analyzing the association of specific
proteins with certain DNA regions in the context of chromatin. This approach
uses formaldehyde fixation of cells, fragmentation of the nucleoprotein
26
complex by sonication or MNase digestion, and isolation of regions of DNA
that are connected to a particular protein by immunoprecipitation using
antibodies to that protein. After reversal of the crosslinking, the presence of
certain DNA fragments in the pellet can be tested by slot blot or quantitative
PCR (Hecht and Grunstein, 1999; Orlando, 2000).
Several advantages rapidly made this a popular approach (Hecht and
Grunstein, 1999; Orlando, 2000; Orlando et al., 1997; Simpson, 1999). First,
in principle, ChIP offers the ability to detect whether any given protein is
associated “in time and space” with specific genomic regions. In particular,
this method can analyze proteins that are not bound to DNA directly or that
depend on other proteins for binding activity in vivo. Second, the
macromolecular chromosomal structures in living material, such as tissue
culture cells or embryos, can be fixed very efficiently and the chromatin is
used as a substrate for immunoprecipitation. Third, antibodies directed
against the protein of interest allow immuno selection of all genomic binding
sites. Fourth, the crosslinking can be fully reversed and the DNA can be
analyzed. Fifth, the DNA can be analyzed by quantitative PCR, which is rapid
and sensitive, and which allows fine mapping of chromosomal proteins in
regions as small as 300 bp. Sixth, by employing antibodies which specifically
recognize histones with certain modifications ( for examples, see Deckert and
Struhl, 2001; Litt et al., 2001a; Litt et al., 2001b; Lo et al., 2001), several
studies have checked the status of histones in active versus inactive regions
and have thus made great contributions to the “histone code” model
27
(Jenuwein and Allis, 2001; Strahl and Allis, 2000). Finally, the use of this
approach along with DNA microarray (genome chip) technology (ChIP-chip)
can principally identify all the in vivo DNA targets of any protein of interest
(Ren et al., 2000; Simon et al., 2001; Wyrick et al., 1999). The availability
(currently or in the near future) of complete sequence information of several
genomes, including yeast, Drosophila, mouse, and human, will markedly
increase the potential power of this type of analysis.
However, this approach also has several obvious limitations. First, in the
ChIP assay, the immunoprecipitation step requires highly stringent conditions.
Therefore, many factors may affect the final results by influencing the
accessibility of the first and/or the secondary antibody. For example, too
much crosslinking has been observed to mask histones. In addition, in some
cases, the buffer conditions may not be compatible with certain antibodies.
Moreover, certain antigen epitopes are more sensitive to formaldehyde. In
this regard, polyclonal antibodies are better than monoclonal antibodies for
ChIP assay. Second, this approach can not be used to detect unknown
proteins binding on DNA regions of interest. Third, this approach may lead to
overinterpretation in some cases in which the given protein binds to DNA
transiently or is located very close to DNA.
1.2.4 Electron microscopy (EM) and chromatin
Obviously, the most direct way to explore a region of chromatin is to look
and see. In this regard, EM is one of the few techniques available to obtain
28
information about the spatial relationships among arrays of nucleosomes and
about other conformational issues that can not be approached directly by
other techniques. Successful examples of the use of EM include the
spectacular images of transcribing genes (Miller and Beatty, 1969), the
ubiquitous “beads-on-string” nucleosomal arrangement of chromatin (Olins
and Olins, 1974), the demonstration of the salt-dependent changes in the
folding of nucleosomal chains (Thoma et al., 1979), and the determination of
the sites and structures associated with RNA synthesis and processing
(Raska et al., 1990; Spector, 1993). All these results were obtained by
transmission EM, examining samples either in situ (fixed whole cell or
nucleus) or in vitro (isolated components) samples (Woodcock and Horowitz,
1997; Woodcock and Horowitz, 1998). However, certain problems arise in the
conventional EM method and introduce uncertainties concerning the degree
to which the final images actually correspond to the original structures
(Woodcock and Horowitz, 1997; Woodcock and Horowitz, 1998). First,
transmission electron microscopy requires the specimens to withstand a high
vacuum, to provide sufficient electron contrast, and to be thin enough to allow
penetration of the electron beam (Woodcock and Horowitz, 1997). To fulfill
these requirements, samples (cells, nuclei or isolated nuclear components)
were fixed, hydrated, embedded in plastic media, cut to be thin enough to
allow electron beam transmission, and stained with metals or metal salts. All
these preparatory treatments are highly disruptive to biological materials.
Second, the chromatin must usually be affixed to flat substrates, and this
29
inevitably affects the 3D conformation of the chromatin. Finally, the resolution
of nucleosomes and linker DNA is too low for the EM to provide an
unequivocal answer to the important question of how chains of nucleosomes
compact in solution. Based on these considerations, many approaches to the
imaging of isolated chromatin have been developed, designed to avoid these
drawbacks (Bednar and Woodcock, 1999; Engel and Colliex, 1993; Muller
and Engel, 2001). Among them is the cryo-EM (Bednar and Woodcock, 1999;
Woodcock and Horowitz, 1997).
Cryo-EM is based on two principles (Woodcock and Horowitz, 1997). First,
if cooled rapidly enough, water assumes a vitreous (glassy) state, instead of
crystallizing into ice. Second, when temperatures are sufficiently low, samples
can be placed in the high vacuum of the electron microscope without
significant water loss or vacuum degradation, thanks to the low vapor
pressure of vitreous water (Dubochet et al., 1988). Unfixed samples, which
are small enough to be embedded in a thin aqueous film over a hole that can
be rapidly frozen, can be imaged directly in this way, without staining with
heavy metal. Thus, the native conformation can be retained (Dubochet et al.,
1988). Further, this new technique can be used to examine changes
occurring over time as small as milliseconds (Bednar and Woodcock, 1999;
Berriman and Unwin, 1994). Therefore, the applications of cryo-EM include
(1) imaging the 3D conformation of small particles of interest, such as viruses
(Dubochet et al., 1988), (2) defining the complete 3D conformation of a
unique individual polynucleosome by determining the orientation of
30
nucleosomes (Bednar et al., 1995) and the path of the linker DNA segments
(Dubochet et al., 1992; Dustin et al., 1991). The samples can be in vitro
reconstituted chromatin (Bednar and Woodcock, 1999; Woodcock and
Horowitz, 1997); or MAP isolated in vivo packed chromatin (but it needs large
amount of samples; see below) under different physiological states; (3)
testing the effects of histone modifications or some non-histone proteins
(such as H1, HMG proteins) on 3D conformation of chromatin, by using
“random sequence” chromatin (Bednar and Woodcock, 1999; Woodcock and
Horowitz, 1997); (4) monitoring specific short lived intermediate
conformations or conformational changes of chromatin during processes such
as transcription (Bednar and Woodcock, 1999).
The major problems of cryo-EM include: (1) the extreme sensitivity of the
unfixed, unstained specimen to the electron beam, which makes low-dose
imaging mandatory and leads to a very low contrast; (2) the quality of the
specimen and preparation cannot be judged before taking images, which
places a premium on the skills of the operator; (3) large of amount of samples
are needed to get images. However, despite these considerations, cryo-EM is
the technique of choice for obtaining 3D information about macromolecular
assemblies and for examining rapid (~msec) conformational changes of such
assemblies in solution. In addition, further technical developments now in
progress will make cryo-EM less challenging.
1.2.5 Minichromosome affinity purification (MAP)
31
MAP is an approach to learning the composition, structure, and function of
unique genes packaged as chromatin in different functional states. This
approach is based on several principles. First, in yeast, there exist
minichromosomes, the small extrachromosomal plasmids that can be stably
maintained and packaged as chromatin in living yeast cells (Roth and
Simpson, 1991). Second, after being integrated into a commonly used
minichromosome, the ALT(Ducker and Simpson, 2000), a genomic domain
behaves in the same way as its genome copy (this study; Cooper et al., 1994;
Ducker and Simpson, 2000; Patterton and Simpson, 1994; Roth et al., 1990;
Roth et al., 1992; Roth and Simpson, 1991; Shimizu et al., 1991). Third, the
minichromosome can be isolated based on a protein-DNA affinity approach
(for details see chapter IV and (Ducker, 2001; Ducker and Simpson, 2000).
The application of the MAP methodology to chromatin is still in its infancy,
and there are numerous methodological questions to be answered and
improvements to be made (Ducker and Simpson, 2000; Simpson et al.,
2003). However, it is already providing useful new information concerning the
histone modifications, the non-histone components and the 3-D conformation
of chromatin of specific domains and promises to become a valuable
complement to biophysical and molecular techniques (Ducker and Simpson,
2000; Simpson et al., 2003). The applications of MAP include (1) determining
stoichiometry of proteins associated with particular gene sequences (Ducker
and Simpson, 2000); (2) identifying proteins that leave no footprint on DNA
and/or proteins whose absence is lethal; (3) identifying new proteins
32
associated with particular gene sequences (Ruan C. and Simpson RT.
unpublished data); (4) by combining with EM, observing the higher order
chromatin structure under different functional states (chapter IV and (Ducker,
2001).
1.2.6 Other methods
In addition to the methods mentioned above, there are several other
methods used to analyze chromatin structure, each having advantages and
disadvantages (Simpson, 1999; Zaret, 1999). These methods include the
application of small chemical modifying agents of DNA that can pass through
cell wall and membrane; the use of fluorescent proteins to determine the
localization of chromosome segments in living cells; and in situ mapping, in
which nonionic detergents or some antibiotics are used to permeabilize the
cell membrane and/or cell wall sufficiently to allow the entry of enzymatic
probes of chromatin such as DNase I and micrococcal nuclease.
It becomes more and more interesting to know whether the localization of
a specific chromosome segment is related to its functions. Recently, a
method has been developed to “track” the localization of certain chromosome
segment of interest in living cells (Robinett et al., 1996). Two hundred and fifty
six tandem repeats of the Escherichia coli lac operator sequence (~5 kb total)
was inserted into a specific location of the yeast, plant or CHO-cell genomic
sequence (Belmont and Straight, 1998; Kato and Lam, 2001; Kato and Lam,
2003; Robinett et al., 1996; Straight et al., 1996). A lac I repressor protein
33
fused to GFP can be expressed in the same cell, bind to the operator repeats,
and indicate the localization of the tagged chromosome region in the living
cell under fluorescent light-microscope. Resolution of this strategy can be
increased by employing immuno-EM. Up to today, this strategy has been
used in several studies to investigate the localization of important
chromosome segments (Belmont and Straight, 1998; Kato and Lam, 2001;
Kato and Lam, 2003; Kato et al., 2002; Robinett et al., 1996; Straight et al.,
1996). One example is that telomeres occupy a perinuclear location in yeast
cell nuclei (Gotta et al., 1996). However, the significance and the detailed
mechanisms of such localizations remain unexplored.
1.2.7 Conclusion
In this section, I have briefly reviewed several commonly used and newly
emerged methodologies for investigating chromatin structure in vivo. Each
method has its inherent advantages and disadvantages, and in many cases,
each provides complementary information regarding the components,
structure and function of chromatin.
In this study, we focused mainly on the establishment and/or application of
two of these methods: the in vivo DNase I mapping strategy (chapter II and
III), and MAP (chapter IV).

Chapter II
Chromatin structure mapping in Saccharomyces cerevisiae in vivo with DNase I
35
Abstract
Most methods for assessment of chromatin structure involve chemical or
nuclease damage to DNA followed by analysis of distribution and
susceptibility of cutting sites. The agents used generally do not permeate
cells, making nuclear isolation mandatory. In vivo mapping strategies might
allow detection of labile constituents and/or structures that are lost when
chromatin is swollen in isolated nuclei at low ionic strengths. DNase I has
been the most widely used enzyme to detect chromatin sites where DNA is
active in transcription, replication or recombination. We have introduced the
bovine DNase I gene into yeast under control of a galactose-responsive
promoter. Expression of the nuclease leads to DNA degradation and cell
death. Shorter exposure to the active enzyme allows mapping of chromatin
structure in whole cells without isolation of nuclei. The validity and efficacy of
the strategy are demonstrated by footprinting a labile repressor bound to its
operator. Investigation of the inter-nucleosome linker regions in several types
of repressed domains has revealed different degrees of protection in cells,
relative to isolated nuclei.
36
2.1 Introduction
Eukaryotic DNA transcription, replication, recombination and repair all
take place in the context of chromatin, the complex of the nucleic acid with
histones and other proteins. Increasingly, the relevance of structural features
of chromatin to these functions of DNA is being appreciated (reviewed in
(Kornberg and Lorch, 1999; Workman and Kingston, 1998a). Analysis of
chromatin structure is done mainly by determination of features of DNA
structure using nucleases or chemicals that modify the nucleic acid. Patterns
of modification are revealed by primer extension or indirect end-label methods
and interpreted in the context of known chromatin structures, such as
nucleosomes, or by comparison with in vitro complexes of DNA with particular
proteins (Simpson, 1998; Simpson, 1999). Most chemical methods (ultraviolet
light and psoralens are exceptions) and all nucleases require isolation of
nuclei for their utilization. This requires time, creating the possibility that short
half-life proteins may be absent in the analysis; this possibility is reality in
usual analyses of the yeast cell type-specific repressor Mat2p (Murphy et al.,
1993). In addition, the buffers often employed for nuclease digestion are low
in ionic strength, leading to swelling of the chromatin. This raises the
possibility that nucleoprotein structures normally present in the nucleus of a
living cell may be distorted or disrupted at the time of analysis by nucleases.
To counter these potential problems, we have attempted to develop
methods that assess chromatin structure in living yeast cells. Two different
methyltransferases, recognizing cytosine in CG or GC sequences,
37
respectively, have been utilized (Kladde et al., 1999a; Kladde et al., 1999b;
Xu et al., 1998). Both serve well, allowing survival of cells when expressed at
low levels (one modification per ~500–2500 bp) while mapping both regulatory
protein and histone interactions with DNA. Both suffer from the relative
infrequency of their modification site in native yeast DNA and the long times
necessary for achieving levels of modification suitable for mapping
experiments. In search of a more general reagent for mapping chromatin, we
have turned to the first reagent used for this purpose with isolated nuclei,
bovine pancreatic DNase I.
DNase I was used in the first definition of the general nuclease sensitivity
that distinguishes active from inactive genes by Weintraub and Groudine
(Weintraub and Groudine, 1976). Wu and Gilbert used this same nuclease for
description of nuclease hypersensitive sites that signaled a regulated
promoter in the active state (Wu and Gilbert, 1981). Digestion of core particle
DNA with a periodicity of ~10 nt leads to a distinctive pattern for rotationally
positioned nucleosomes. Differential sensitivity of linker DNA allows DNase I
mapping of nucleosome locations, although not with the precise resolution of
micrococcal nuclease which cuts linker DNA almost exclusively (Simpson,
1998; Simpson, 1999). Most importantly, extension of the general rule that
DNase I hypersensitivity marks the sites where the action is in chromatin has
made hypersensitive sites synonymous with enhancers, promoters, replication
origins or other features of DNA activity (Clark et al., 1993; Elgin, 1988; Gross
and Garrard, 1988). In an indirect end-label study of DNase I digestion of ~50
38
kb of the left arm of yeast chromosome III, we have confirmed the correlation
between these DNA elements and hypersensitivity to the nuclease (S.Ercan
and R.T.Simpson, unpublished observation). For these reasons, we elected to
attempt to establish DNase I as an in vivo chromatin probe.
Worrall and co-workers (Doherty et al., 1993; Worrall and Connolly, 1990)
synthesized and expressed a number of variants of the predicted DNA
sequence for the DNase I protein. The different proteins encoded by these
DNAs varied in specific enzymatic activity. We have cloned the DNA
sequence corresponding to the native protein plus a nuclear localization signal
(NLS) into a shuttle expression vector. Fortuitous expression in bacteria
required modification of the vector to eliminate this toxic activity. Expression in
yeast under control of the GAL1 promoter was sufficiently controlled by
dextrose repression to allow growth of transformed strains without differences
from similar strains lacking the nuclease gene. When these strains were
cultured in galactose, expression of the DNase I gene was lethal for long-term
growth. Prior to cell death, chromatin mapping in vivo is possible using the
nuclease to explore the DNase I susceptibility of the genome without
perturbation of the normal nuclear environment of chromatin. In this report, in
addition to documenting the methodology for use of DNase I as an in vivo
probe for chromatin structure, we present evidence that suggests an
unexpected higher order structure for some silenced or strongly repressed
parts of the yeast chromosome.
39
2.2 Materials and methods
2.2.1 Plasmid construction
A synthetic DNA designed to code for the native form of bovine pancreatic
DNase I and cloned in M13 was kindly provided by Dr A.F. Worrall (Worrall
and Connolly, 1990). The SV40 NLS (ATG CCA AAG AAG AGA AAG GTT),
flanked by an EcoRI site, was attached to the N-terminus using the
polymerase chain reaction. In the same reaction, an Escherichia coli lac-UV5
constitutive promoter in antisense orientation and an XbaI site were added to
the C-terminus of the coding sequence. The fragment was cloned into the
polylinker of pYES2 (Invitrogen) (Sikorski and Hieter, 1989). This vector is a
high copy number shuttle expression vector containing a polylinker between
the GAL1 promoter and the CYC1 terminator, a URA3 selection marker and
2µ origin of replication, as well as the ampicillin resistance gene and colE1
replication origin for selection/growth in E.coli. After growth in bacteria and
confirmation of the construction by restriction endonuclease mapping and
limited sequencing, the plasmid, pSUN-1, was transferred by electroporation
to Saccharomyces cerevisiae YPH500 (MAT, ade2-101, his3-∆200, leu2-1,
lys2-801, trp1-∆63, ura3-52) (Sikorski and Hieter, 1989). As a control, the
parental plasmid, pYES2, was transformed into the same strain in parallel.
2.2.2 Cell growth
Standard yeast media, both rich (YPD) and synthetic medium lacking
uracil [CSM-Ura (Bio 101), 0.67% yeast nitrogen base without amino acids
40
(Difco), and an appropriate carbon source (2% dextrose, 4% lactic acid or 2%
galactose)] were used. Cells containing pSUN-1 or pYES2 were grown at
30°C to OD600 1.0 in CSM-Ura dextrose medium. Similar densities of cells
were spread on CSM-Ura dextrose or CSM-Ura galactose plates to observe
any effect of DNase I on cell viability. For chromatin structure studies in cells
expressing DNase I, yeast cells transformed with pSUN-1 were grown at 30°C
to OD600 0.8 in 10 ml CSM-Ura dextrose medium, changed to 10 ml CSM-Ura
lactic acid medium and grown to OD600 1.0, and then switched to CSM-Ura
galactose medium for periods of up to 12 h.
2.2.3 Nuclear and DNA preparation and analysis
Yeast nuclei were prepared as described from cells grown at 30°C to
OD600 of 1.0 in YPD (Roth et al., 1992). DNase I digestion, isolation of nuclear
DNA and determination of the locations of DNase I cleavage sites by primer
extension were all performed exactly as previously described (Weiss and
Simpson, 1997). For isolation and analysis of DNA cut by DNase I in vivo,
cells were harvested by centrifugation, broken by homogenization with glass
beads in 100 mM Tris–HCl pH 8.0, 50 mM EDTA, 2% sodium dodecyl sulfate,
and the DNA was extracted (Rose et al., 1990). Purification of DNA involved
treatment with 100 ng/ml RNase A at 37°C for 1 h and then 100 ng/ml
proteinase K in 2% Sarkosyl, 200 mM NaClO4 at 50°C for 2 h. DNA was
further purified by extractions with equal volumes of
phenol/chloroform/isoamyl alcohol (25:24:1) and chloroform/isoamyl alcohol
(24:1), followed by ethanol precipitation. The DNA was dissolved in 20 µl 0.1x
41
TE and passed through a 1 ml Sephadex G-50 spin column prior to analysis.
Primer extension was carried out as previously described using the following
primers: recombination enhancer (RE) region, B297 (Weiss and Simpson,
1997); HMRa region, p14 (Ravindra et al., 1999); and STE6 region, –373 to –
352 (relative to transcription start site) 5'-CGTACCATTCCATTGGCTTTTC-3'
(Shimizu et al., 1991). In Figures 2.5, 26, and 2.7, the schematic diagrams of
nucleosome locations are based on previously published micrococcal
nuclease primer extension maps (Ravindra et al., 1999; Shimizu et al., 1991;
Weiss and Simpson, 1997) using the same primers and identical molecular
weight standards to those employed in the present work. Analysis of cutting of
the GAL control region of pSUN-1 from 0–12 h of induction of DNase I
expression revealed similar cutting site patterns at all time points. Intensities
of bands increased with time and shorter fragments became more prominent,
as expected.
2.2.4 Southern blots
Yeast cells transformed with either pSUN-1 or pYES2 were grown
sequentially in CSM-Ura with dextrose, lactic acid and galactose, as detailed
above. At 0, 1 and 6 h after exposure to galactose, cells were harvested and
DNA was recovered by the glass bead method (Rose et al., 1990). DNA from
equal cell numbers (based on A600nm) was subjected to electrophoretic
separation on a 1.2% agarose gel, transferred to Hybond-NX membrane
42
(Amersham), crosslinked with UV light and hybridized as previously described
(Ducker and Simpson, 2000). The pYES2 plasmid was random primer labeled
with [-32P] dATP for use as probe. Blots were exposed to film or a
PhosphorImager screen and analyzed using Image Quant v.5.0 software
(Molecular Dynamics).
43
2.3 Results
2.3.1 DNase I expression in vivo
Others have successfully cloned and expressed native DNase I in
bacterial systems (Doherty et al., 1993; Worrall and Connolly, 1990). Our
attempts to clone DNase I with a NLS into yeast shuttle expression vectors
led to deletions or mutation of the active site histidyl residue (data not shown).
Further analysis showed that these mutations occurred during bacterial
manipulations. Apparently, expression from a surrogate promoter led to
nuclease toxicity and selection for inactive mutants. To block DNase I
expression in bacteria, we inserted a constitutively active E.coli promoter, lac-
UV5, downstream of the DNase I gene in the opposite transcriptional
orientation. Inhibition of nuclease expression may involve antisense RNA,
physical interference with polymerase movement, or another unknown
mechanism. In any case, this approach allowed cloning of the intact DNase I
gene in bacteria.
Yeast containing the DNase I plasmid, pSUN-1, grew on dextrose-
containing medium identically to controls bearing an empty vector (Figure
2.1). Plating the two strains on galactose led to striking differences in growth
patterns. While the control strain, lacking DNase I, grew more slowly than it
did on dextrose, colony numbers were similar. However, the strain containing
the DNase I gene under GAL1 control failed to form any colonies when
expression of the gene was induced (Figure 2.1). Similarly, in suspension
44
cultures the strain carrying pSUN-1 did not grow in 12 h after a medium
change from CSM-Ura dextrose to CSM-Ura galactose medium (data not
shown). It is likely that DNase I killed cells in which it was expressed by
degradation of genomic DNA.
Since DNase I preferentially cuts one strand of duplex DNA, a highly
sensitive assay for its activity in living cells is to measure conversion of a
plasmid from closed circular form to a nicked, relaxed form; a single DNase I
cut per plasmid molecule is measured by this assay. We examined the
topological state of the pSUN-1 plasmid in yeast at various times after
transferring cells to galactose. At the time of medium change, 10% of the
isolated plasmid DNA was nicked, probably due to damage during
preparation. Within 1 h of growth in galactose, ~35% of plasmid DNA was in
the nicked form and this fraction increased to ~45% after 6 h exposure (Figure
2.2A and B). There is a decrease in total plasmid DNA during expression of
DNase I; this is likely due to cutting of the nuclease sensitive replication origin
in the minichromosome. Control cells, either containing the DNase I plasmid
and grown in dextrose or containing the plasmid backbone without the
nuclease gene and grown in galactose, had a constant content of episomal
DNA with ~10% nicked plasmid circles (data not shown). Examination of
genomic DNA on native agarose gel electrophoresis revealed mostly high
molecular weight material with some smearing to smaller fragment sizes,
most >1500 bp. The amount of digestion was insufficient to generate a
45
nucleosomal ladder. Attempts to use samples digested in vivo for indirect end
label mapping experiments failed due to the low levels of DNase I digestion.
The time course of DNase I cutting of plasmid DNA was examined over a
12 h period (Figure 2.3). Undigested or zero time samples were all high
molecular weight. Patterns of cutting at 3 and 6 h were similar with a large
amount of DNA of relatively high molecular weight and similar cutting sites.
More material was present for cutting sites closer to the primer in the 6 h
sample than the 3 h, as expected. After 12 h of DNase I expression, most of
the plasmid DNA had been degraded to sizes <500 nt and some changes in
cutting site patterns appeared. Clearly, the 3 and 6 h samples were in the
range of single hit kinetics for fragments <1 kb in length, making these times
appropriate for analysis of DNase I susceptibility. The 6 h sample gave a
higher yield of fragments in the mapping size range; this expression time was
therefore used for all the experiments presented below.
Primer extension analysis of the GAL control region DNA in the pSUN-1
plasmid showed that most of the nuclease cutting sites were similar to those
cut in naked DNA by pure DNase I in vitro (data not shown). This finding,
together with data presented below (Figure 2.7), demonstrates that chromatin
mapping in vivo reflects expression of the bovine DNase I gene and not
artefactually induced, unknown yeast nucleases. The three observations,
nicking of the plasmid, plasmid DNA degradation, and the similarity of cutting
sites on the plasmid to naked DNA, confirm DNase I expression under GAL
46
control and its activity in yeast cells. They validate use of DNase I expressed
in cells as a tool for in vivo analysis of chromatin structure.
2.3.2 DNase I footprinting a labile repressor in vivo
In -cells, Mat2p binds as a homodimer together with a homodimer of
Mcm1p to a 31 bp operator DNA sequence to repress expression of a-cell-
specific genes (Johnson and Herskowitz, 1985; Keleher et al., 1988; Sauer et
al., 1988). The repressor is one of the shortest-lived proteins in yeast, with a
half-life of <5 min. Consequently, it is absent from its cognate binding sites in
isolated nuclear preparations. It is likely that the protein is gone well before
spheroplasting, a mandatory prerequisite for nuclear isolation, is finished
(Hochstrasser et al., 1991). We previously mapped features of interactions of
Mat2p with DNA by using a very rapid method for isolation of crude nuclei in
a yeast strain that overproduced the protein and lacked several ubiquitination
enzymes (Murphy et al., 1993). It was also possible to demonstrate Mat2p
binding to its operator sequence in living cells using the SssI
methyltransferase; a single CpG site was blocked by interactions of one
monomer with DNA (Kladde et al., 1996). The structure of the DNA binding
domains of Mat2p and Mcm1p in a ternary complex with 2 operator DNA is
known at 2.25 Å resolution from X-ray crystal studies (Tan and Richmond,
1998). Taken together, the in vitro structural information and the in vivo
difficulties in studying binding of Mat2p and Mcm1p to the operator made
this system a good test of the possibility of mapping chromatin structures of
regulatory protein complexes with DNA using DNase I expressed in living
47
cells. There are nine functional Mat2p/Mcm1p binding sites in the yeast
genome (Johnson and Herskowitz, 1985; Zhong et al., 1999). Seven of these
reside upstream of a-cell-specific genes and repress their expression when
occupied by the protein complex in -cells. The other two are located in the
recombination enhancer and help to control directionality of mating type
interconversion (Haber, 1998b; Szeto and Broach, 1997; Wu and Haber,
1995). We have mapped chromatin structure of four of these Mat2p/Mcm1p
binding sites in vivo using DNase I.
Figure 2.4 shows the DNase I cutting patterns at the recombination
enhancer 2#1 operator, located 29194–29224 bp from the left end of
chromosome III. Naked DNA from this region was susceptible to DNase I at a
number of sites throughout the 2/MCM1 operator and its flanking sequences.
DNase I cutting was severely restricted in both isolated nuclei and in vivo
digested chromatin samples, relative to the protein-free DNA pattern. In
isolated nuclei, where Mat2p is expected to be absent, four prominent
nuclease-susceptible sites were present. Two sites flanked the operator and
two were located within the operator. Mcm1p is known to bind to the 11 bp
central region of the operator, while Mat2p binds to the 10 bp on either side
of the central segment. The two susceptible sites in the operator in isolated
nuclei likely resulted from Mcm1p-induced bending of the DNA with
consequent widening of the minor groove (Tan and Richmond, 1998). DNase
I is known to approach and cut DNA in the minor groove and the slightly bent,
partially open minor groove resembles the geometry of DNA in complex with
48
the enzyme (Weston et al., 1992). These two sites were inaccessible when
the analysis was performed with DNase I expressed in vivo. A large region
between the two operator-flanking hypersensitive sites was blocked from
digestion by the nuclease (Figure 2.4). Footprints for the 2 operator in nuclei
and in vivo for the recombination enhancer 2#2 site and for the
transcriptional repressor 2 operators upstream of the STE2 and STE6 genes
in -cells were essentially identical to those shown in Figure 2.4 (data not
shown). In a-cells, which lack Mat2p, in vivo and nuclear footprints were
indistinguishable and closely resembled the pattern observed for -cell nuclei.
We presume that binding of Mat2p precludes nuclease access to operator
DNA in -cells in vivo.
2.3.3 Different nucleosome linker accessibilities in repressed domains
in vivo
In yeast chromatin, a striking example of DNase I susceptibility of a
precisely positioned nucleosome was found near the 2#1 operator in the
recombination enhancer at 29403–29560 map units (m.u.) (Weiss and
Simpson, 1997). In isolated nuclei, digestion was highest in linkers and at the
ends of the core particle and diminished symmetrically to a low point at the
center of the nucleosome. While these accessible linkers may characterize
some yeast chromatin (see below), use of DNase I expressed in whole cells
has revealed nucleosomes with protected linker chromatin in some repressed
domains in vivo. One of these is the RE nucleosome at 29403–29560 m.u.
49
We confirmed the DNase I digestion pattern for this nucleosome in
isolated nuclei. The linker and edges of the core particle were accessible to
DNase I digestion. The lowest levels of cutting were in the center of the core
particle (Figure 2.5). In contrast, for the sample cut by DNase I in vivo, the
cutting site susceptibilities were almost reversed. Sites near the center of the
nucleosome core particle were cut in vivo more frequently than sites near the
ends of the nucleosomes and the intervening short linkers. This observation
was confirmed for DNase I cuts in the other strand through this same region.
Furthermore, the short linkers between several other pairs of positioned
nucleosomes in the RE in -cells also were differentially digested by DNase I
between isolated nuclei and in vivo samples (data not shown).
Another type of repressed domain with organized chromatin in -cells
encompasses the a-cell-specific genes, specifically STE6 (Roth et al., 1990;
Shimizu et al., 1991). A characteristic feature of these chromatin domains is
the presence of closely packed dinucleosomes with a short (<10 bp) linker.
Longer linkers, in the range of 40–45 bp, connect these dinucleosomes to one
another (Simpson et al., 1993). Both linkers of the first nucleosome, adjacent
to the 2 operator, were protected in vivo (Figure 2.6 and data not shown).
Cutting in nuclei was observed at a single site in the short linker between the
first and second nucleosomes. Within the second nucleosome, cutting in
nuclei was concentrated towards the ends of the core particle while cutting in
vivo was relatively greater towards the center of the nucleosome. Significant
differences were observed between nuclear and in vivo nuclease sites in the
50
long linker following the second nucleosome (Figure 2.6). The strong nuclear
site that marks the edge of the second nucleosome at the long linker was
absent in vivo while the site at the other end of the linker was present in both
samples. Three DNase I cutting sites were present for the long linker in the in
vivo sample. In nuclei, one of these was also DNase I sensitive, the other two
were weakly cut and two different sites were strongly cut. It is apparent that
significant features of this linker region, in terms of proteins bound or
packaging, are altered during the preparation of nuclei.
The silent mating type loci, HML and HMRa, are perhaps the best-
characterized repressed domains in the yeast genome (Ravindra et al., 1999;
Weiss and Simpson, 1998). The chromatin structure of the regions between
the E and I silencers has been determined by mapping with micrococcal
nuclease. HMRa is the smaller and simpler of the two loci, having 12 precisely
positioned nucleosomes between the silencer elements. These are arranged
as six pairs of closely packed dinucleosomes with ~20 bp linker between the
pairs (Ravindra et al., 1999). Figure 2.7 shows the results of mapping DNase I
cutting sites in nuclei and in vivo for the nucleosome that is closest to the E
silencer. The linkers flanking the nucleosome were significantly more
susceptible to DNase I than the central region of the core particle, both in vivo
and in isolated nuclei. For both samples, cutting sites within the core particle
were spaced at ~10 nt intervals. However, several strong cutting sites were
present in nuclei at the E end of the nucleosome and in the silencer, but
absent in whole cells. This observation suggests that certain proteins, e.g.

51
silent information regulator proteins (SIRs), involved in establishing or
stabilizing the repressive domain, might protect this region in living cells.
52
2.4 Discussion
Aspects of chromatin structure can be inferred because of a distinctive
component, DNA, which can be assayed by enzymes and chemicals that
specifically probe its structure. Based on known features of the reagent and
permutations of the nucleoprotein environment of the chromatin segment
under study, we can infer features of chromatin structure such as presence or
absence of nucleosomes, their organization and possible positioning, binding
of regulatory proteins, unusual DNA geometries, etc. Almost all such studies
are carried out in the context of isolated nuclei, since reagent access to the
nuclear contents is blocked in most cases by the plasma membrane and/or
cell wall. Here we have surmounted this limitation by controlled intracellular
expression of a nuclease and targeting the enzyme to the nucleus, where it
can map chromatin organization without disruption of cell structures.
The nuclease of choice is DNase I. Micrococcal nuclease, the other
relatively non-specific enzyme used widely for chromatin structure studies,
cuts linker regions preferentially and is therefore used for mapping
nucleosome locations. It has been less useful in revealing features of
interactions of regulatory proteins with DNA (Simpson, 1998). Of greater
concern, however, is the fact that micrococcal nuclease is a general nuclease,
with a strong preference for degrading single-stranded nucleic acids. Thus, it
will likely be cytotoxic by extensive degradation of RNA. Such activity might
53
well kill cells before the desired levels of DNA cutting for a mapping
experiment were achieved.
DNase I, on the other hand, has no ribonuclease activity, is active with
micromolar concentrations of calcium or magnesium and makes single strand
nicks in double-stranded DNA as its preferential mechanism of action. A
crystal structure of the enzyme as a complex with a DNA substrate is
available (Weston et al., 1992). This structure shows both the N- and C-
termini of the enzyme to be on the opposite side of the protein from the active
site; with this knowledge, we could modify the N-terminus of the enzyme with
the NLS, confident that it would not alter DNase I enzymatic activity or
specificity. DNase I is a good probe for chromatin structure, cutting within the
nucleosome at ~10 nt intervals as well as cutting linker DNA. Additionally,
DNase I has been the benchmark enzyme for defining sites of DNA function in
chromatin, marking interactions of regulatory proteins with DNA, for over two
decades (Elgin, 1988; Simpson, 1998; Weintraub and Groudine, 1976;
Wolffe, 1998; Wu and Gilbert, 1981).
The nuclease was outfitted with an NLS and placed in yeast under GAL
control. Culture of cells in galactose induced expression of DNase I leading to
nicking and degradation of plasmid DNA. Cytotoxic effects of DNase I
expression led to cell death, presumably due to damage to genomic DNA in
excess of the capacity of repair systems. Nuclease activity footprinted binding
of regulatory proteins and in a critical test detected the interactions of a labile
repressor with its cognate binding site, interactions which are absent in
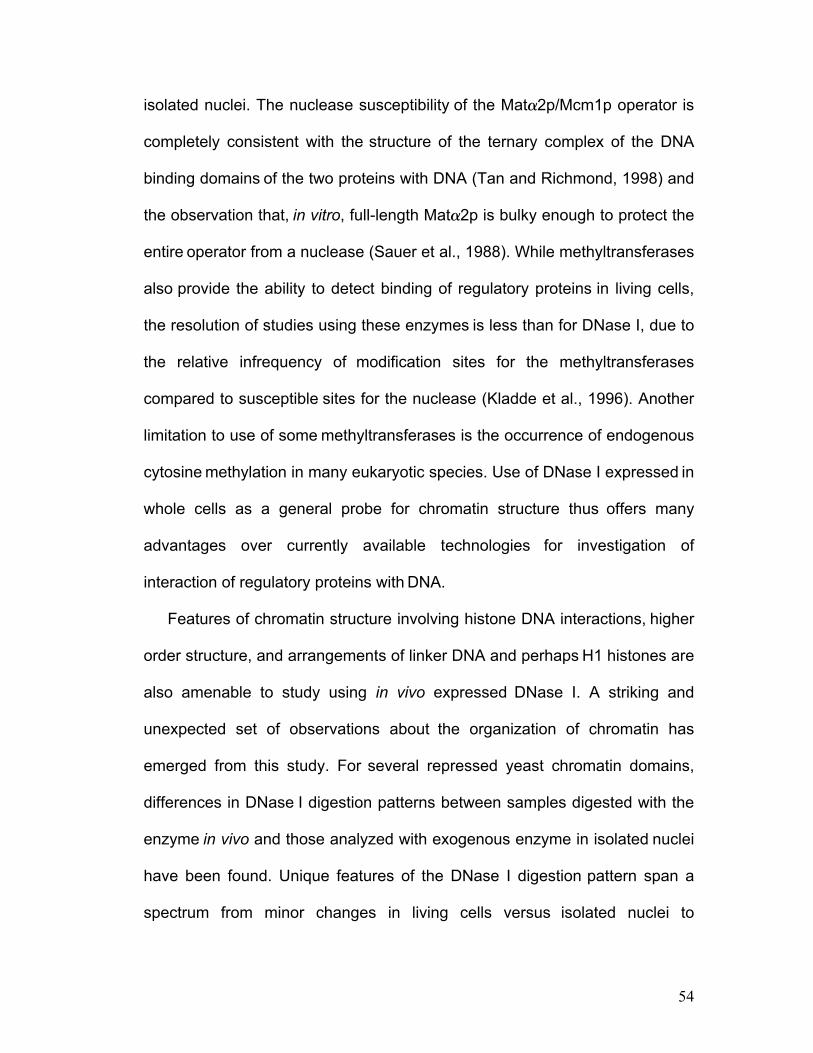
54
isolated nuclei. The nuclease susceptibility of the Mat2p/Mcm1p operator is
completely consistent with the structure of the ternary complex of the DNA
binding domains of the two proteins with DNA (Tan and Richmond, 1998) and
the observation that, in vitro, full-length Mat2p is bulky enough to protect the
entire operator from a nuclease (Sauer et al., 1988). While methyltransferases
also provide the ability to detect binding of regulatory proteins in living cells,
the resolution of studies using these enzymes is less than for DNase I, due to
the relative infrequency of modification sites for the methyltransferases
compared to susceptible sites for the nuclease (Kladde et al., 1996). Another
limitation to use of some methyltransferases is the occurrence of endogenous
cytosine methylation in many eukaryotic species. Use of DNase I expressed in
whole cells as a general probe for chromatin structure thus offers many
advantages over currently available technologies for investigation of
interaction of regulatory proteins with DNA.
Features of chromatin structure involving histone DNA interactions, higher
order structure, and arrangements of linker DNA and perhaps H1 histones are
also amenable to study using in vivo expressed DNase I. A striking and
unexpected set of observations about the organization of chromatin has
emerged from this study. For several repressed yeast chromatin domains,
differences in DNase I digestion patterns between samples digested with the
enzyme in vivo and those analyzed with exogenous enzyme in isolated nuclei
have been found. Unique features of the DNase I digestion pattern span a
spectrum from minor changes in living cells versus isolated nuclei to
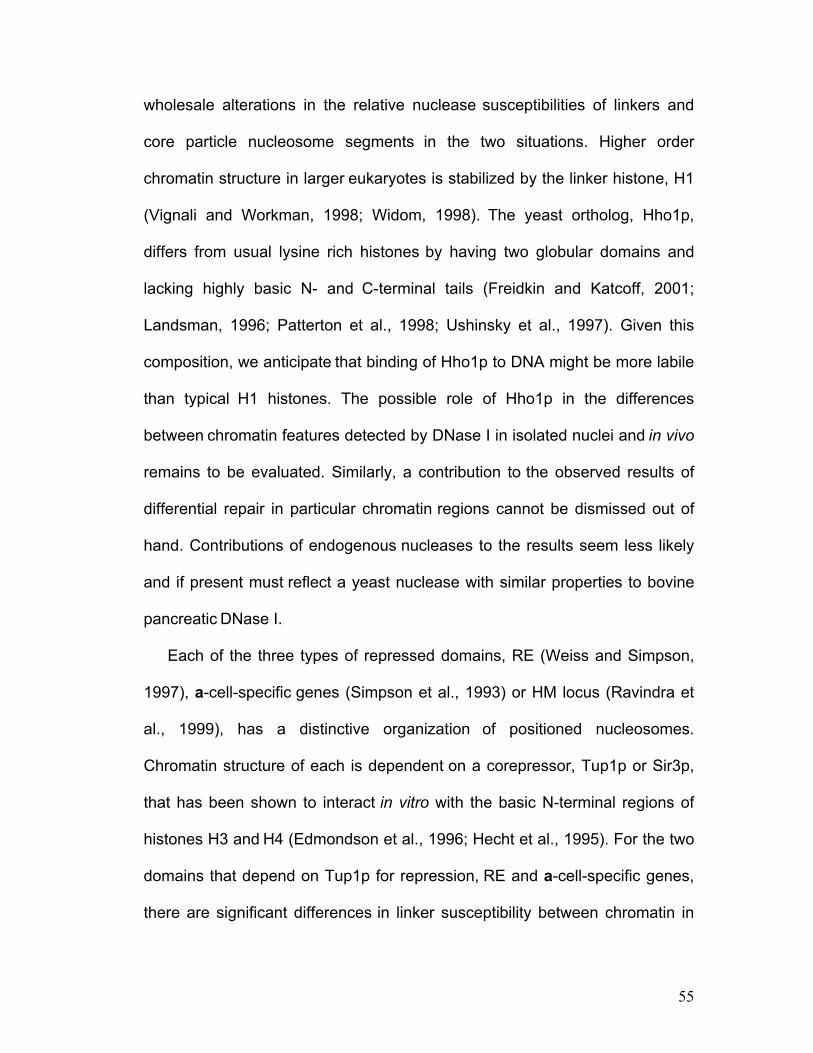
55
wholesale alterations in the relative nuclease susceptibilities of linkers and
core particle nucleosome segments in the two situations. Higher order
chromatin structure in larger eukaryotes is stabilized by the linker histone, H1
(Vignali and Workman, 1998; Widom, 1998). The yeast ortholog, Hho1p,
differs from usual lysine rich histones by having two globular domains and
lacking highly basic N- and C-terminal tails (Freidkin and Katcoff, 2001;
Landsman, 1996; Patterton et al., 1998; Ushinsky et al., 1997). Given this
composition, we anticipate that binding of Hho1p to DNA might be more labile
than typical H1 histones. The possible role of Hho1p in the differences
between chromatin features detected by DNase I in isolated nuclei and in vivo
remains to be evaluated. Similarly, a contribution to the observed results of
differential repair in particular chromatin regions cannot be dismissed out of
hand. Contributions of endogenous nucleases to the results seem less likely
and if present must reflect a yeast nuclease with similar properties to bovine
pancreatic DNase I.
Each of the three types of repressed domains, RE (Weiss and Simpson,
1997), a-cell-specific genes (Simpson et al., 1993) or HM locus (Ravindra et
al., 1999), has a distinctive organization of positioned nucleosomes.
Chromatin structure of each is dependent on a corepressor, Tup1p or Sir3p,
that has been shown to interact in vitro with the basic N-terminal regions of
histones H3 and H4 (Edmondson et al., 1996; Hecht et al., 1995). For the two
domains that depend on Tup1p for repression, RE and a-cell-specific genes,
there are significant differences in linker susceptibility between chromatin in
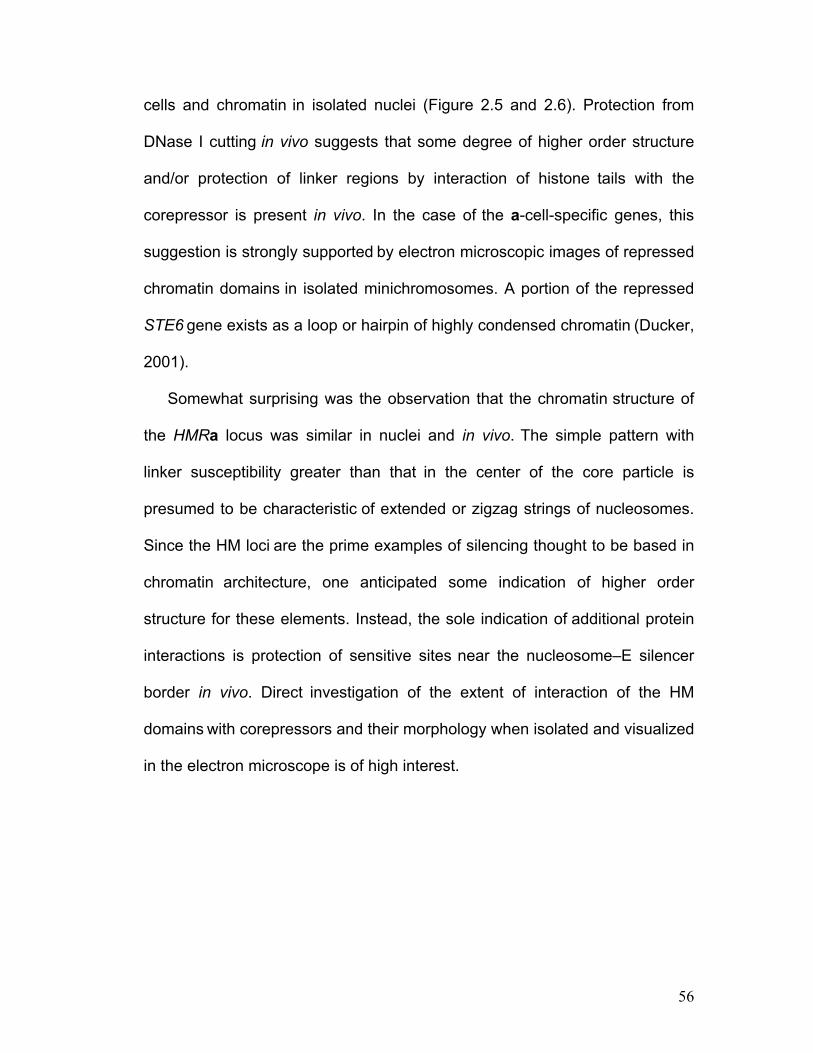
56
cells and chromatin in isolated nuclei (Figure 2.5 and 2.6). Protection from
DNase I cutting in vivo suggests that some degree of higher order structure
and/or protection of linker regions by interaction of histone tails with the
corepressor is present in vivo. In the case of the a-cell-specific genes, this
suggestion is strongly supported by electron microscopic images of repressed
chromatin domains in isolated minichromosomes. A portion of the repressed
STE6 gene exists as a loop or hairpin of highly condensed chromatin (Ducker,
2001).
Somewhat surprising was the observation that the chromatin structure of
the HMRa locus was similar in nuclei and in vivo. The simple pattern with
linker susceptibility greater than that in the center of the core particle is
presumed to be characteristic of extended or zigzag strings of nucleosomes.
Since the HM loci are the prime examples of silencing thought to be based in
chromatin architecture, one anticipated some indication of higher order
structure for these elements. Instead, the sole indication of additional protein
interactions is protection of sensitive sites near the nucleosome–E silencer
border in vivo. Direct investigation of the extent of interaction of the HM
domains with corepressors and their morphology when isolated and visualized
in the electron microscope is of high interest.
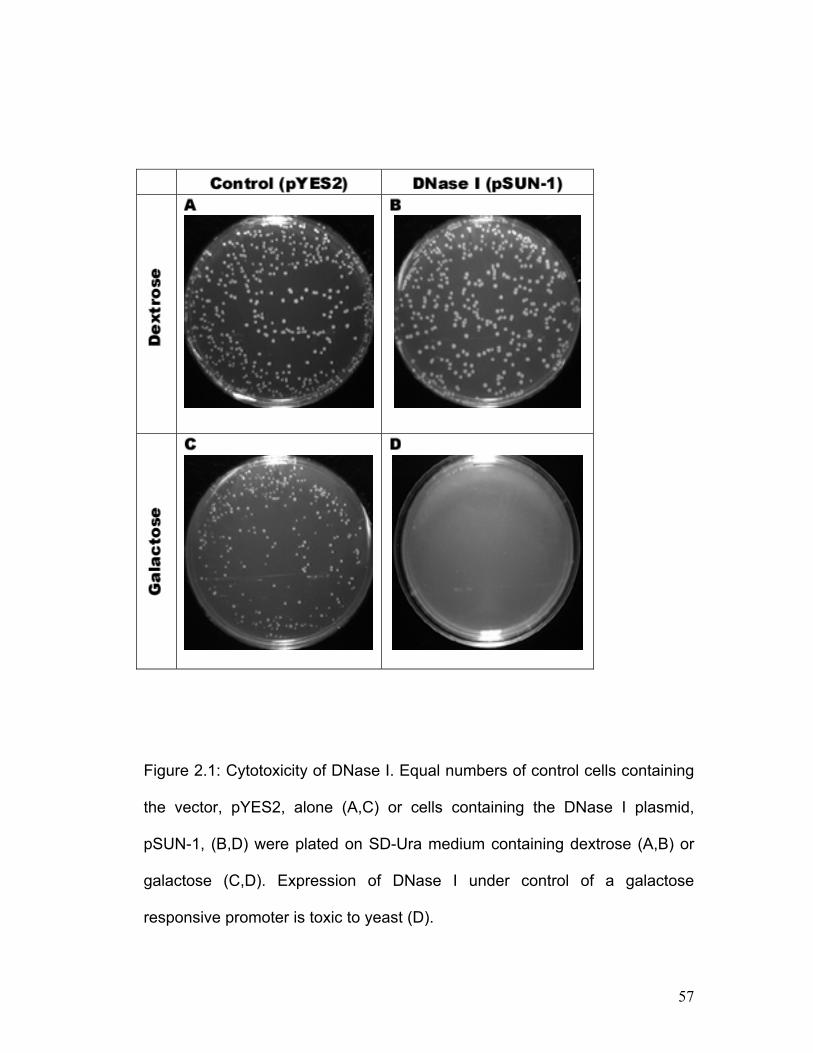
57
Figure 2.1: Cytotoxicity of DNase I. Equal numbers of control cells containing
the vector, pYES2, alone (A,C) or cells containing the DNase I plasmid,
pSUN-1, (B,D) were plated on SD-Ura medium containing dextrose (A,B) or
galactose (C,D). Expression of DNase I under control of a galactose
responsive promoter is toxic to yeast (D).
58
Figure 2.2: DNase I expressed in vivo introduces nicks in and degrades
plasmid DNA. Southern blot (A) and PhosphorImager quantification (B) of
pSUN-1 plasmid DNA during 6 hours of growth in galactose. Results are
shown for duplicate independent transformants in (A) and averaged in (B).
Samples from cells expressing DNase I under control of a galactose
responsive promoter were removed for analysis after 0, 1 and 6 hours of
incubation, as indicated. Migration positions of supercoiled (S) and nicked (N)
plasmid DNA are indicated. Standards in (A) are plasmid DNA cut with PvuII
(P) – no sites; EcoRI (E) or XbaI (X) – one site. The major species changes
from supercoiled to nicked plasmid DNA and the total plasmid DNA present
decreases during the incubation.
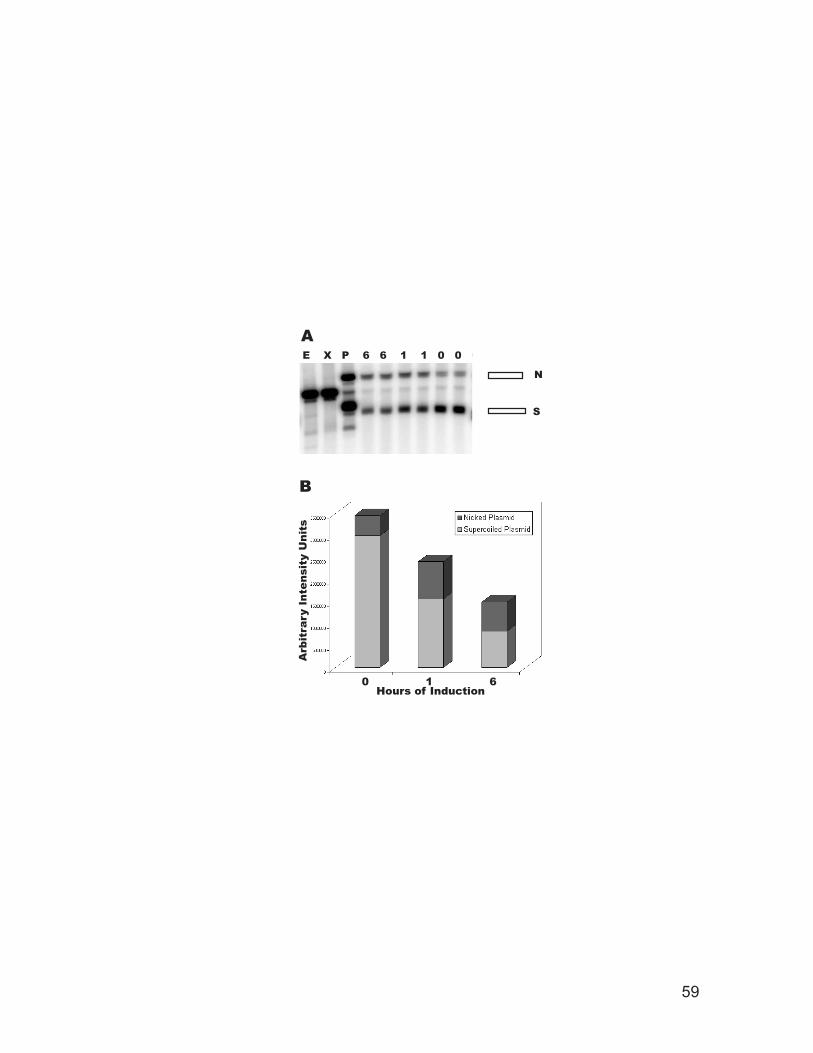
A
B
Hours of Induction
Arb
itra
ry I
nten
sity
Uni
ts
0 1 6
E X P 6 6 1 1 0 0 C0
N
S
59
60
Figure 2.3: Time course of DNase I degradation of DNA in vivo. Primer
extension mapping of cutting sites in the pSUN-1 plasmid after induction of
expression of DNase I for 0, 3, 6 and 12 h, as indicated. Patterns are
compared with those from digestion of protein-free DNA with DNase I in vitro,
as indicated. The primer was located 222 bp upstream of the GAL1 promoter
TATA box and the region mapped extended to the beginning of the
transcriptionally active DNase I gene. Numbers to the left of the gel are
coordinates relative to the start of the DNase I coding sequence. The
rectangular box denotes the position of the TATA box.
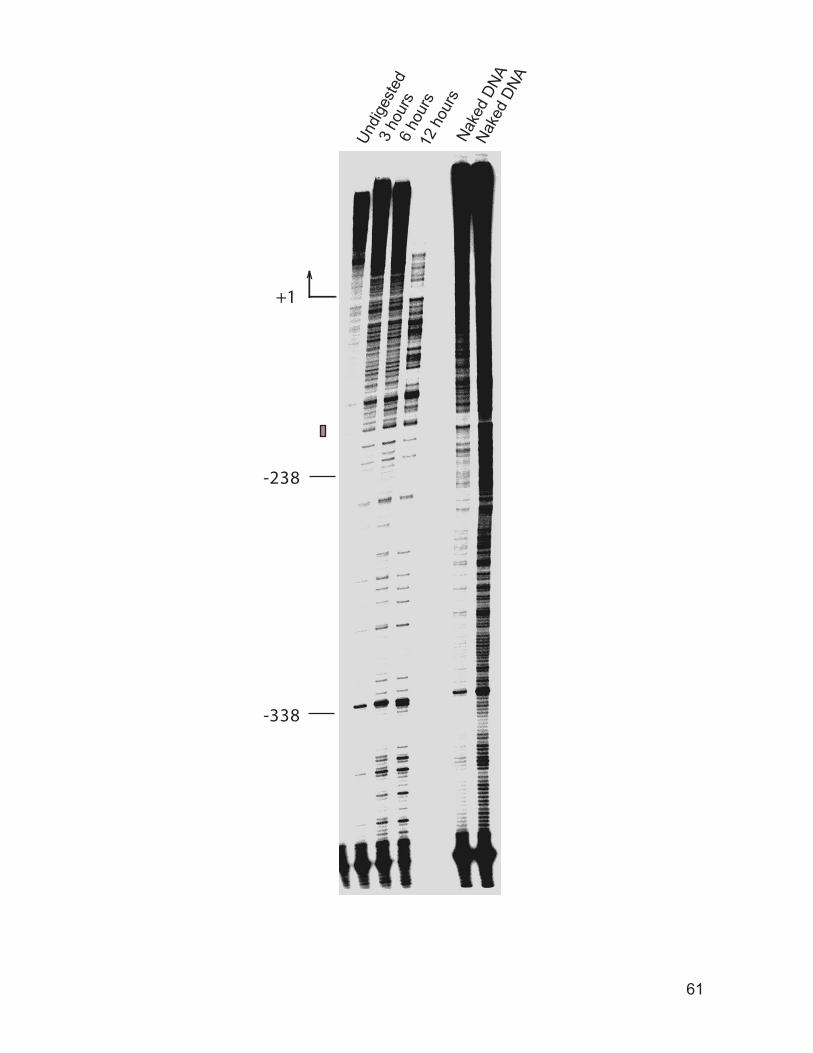
+1
-238
-338
Undi
gest
ed
3 ho
urs
6 ho
urs
12 h
ours
Nake
d DN
ANa
ked
DNA
61
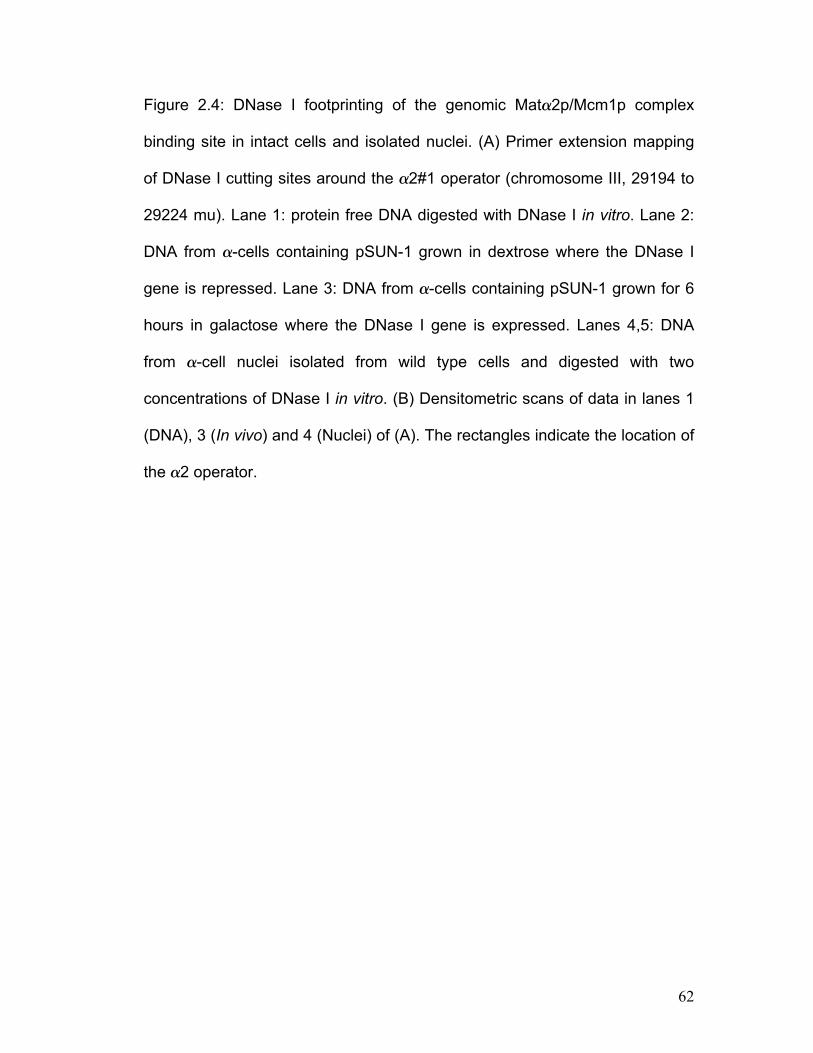
62
Figure 2.4: DNase I footprinting of the genomic Mat2p/Mcm1p complex
binding site in intact cells and isolated nuclei. (A) Primer extension mapping
of DNase I cutting sites around the 2#1 operator (chromosome III, 29194 to
29224 mu). Lane 1: protein free DNA digested with DNase I in vitro. Lane 2:
DNA from -cells containing pSUN-1 grown in dextrose where the DNase I
gene is repressed. Lane 3: DNA from -cells containing pSUN-1 grown for 6
hours in galactose where the DNase I gene is expressed. Lanes 4,5: DNA
from -cell nuclei isolated from wild type cells and digested with two
concentrations of DNase I in vitro. (B) Densitometric scans of data in lanes 1
(DNA), 3 (In vivo) and 4 (Nuclei) of (A). The rectangles indicate the location of
the 2 operator.
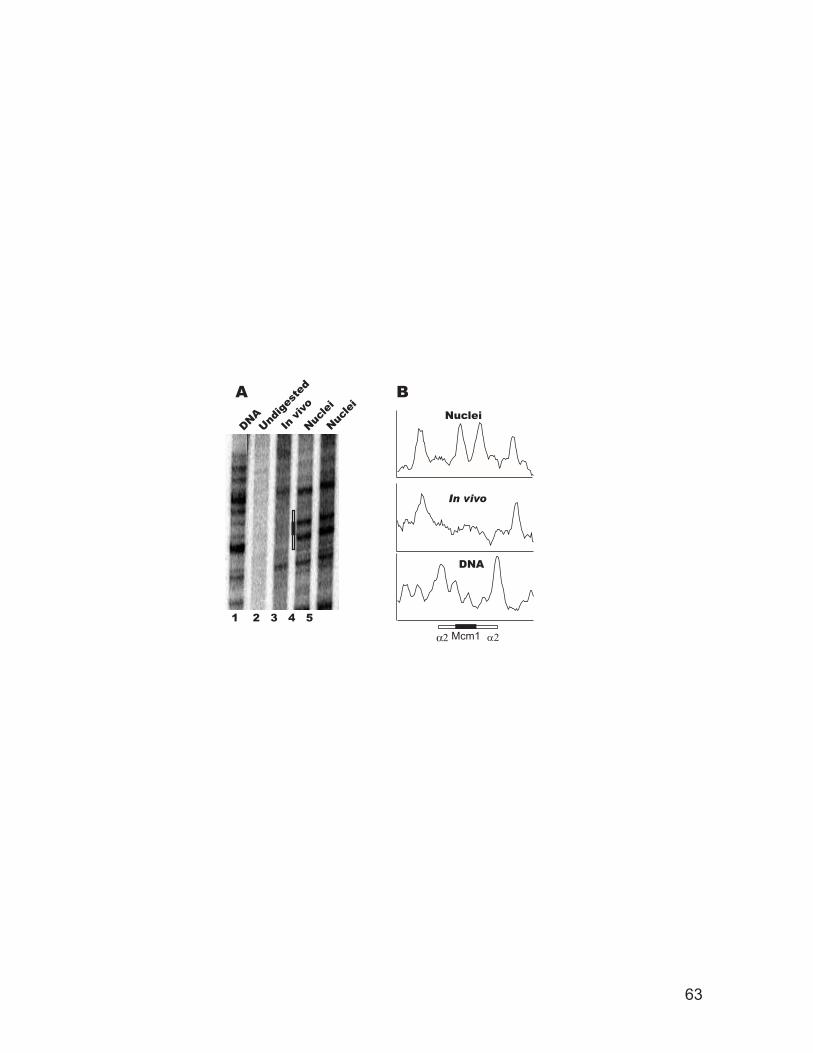
1 2 3 4 5
ANuclei
In vivo
DNA
B
DNAUnd
iges
ted
In vi
vo
Nucle
i
Nucle
i
Mcm1α2 α2
63
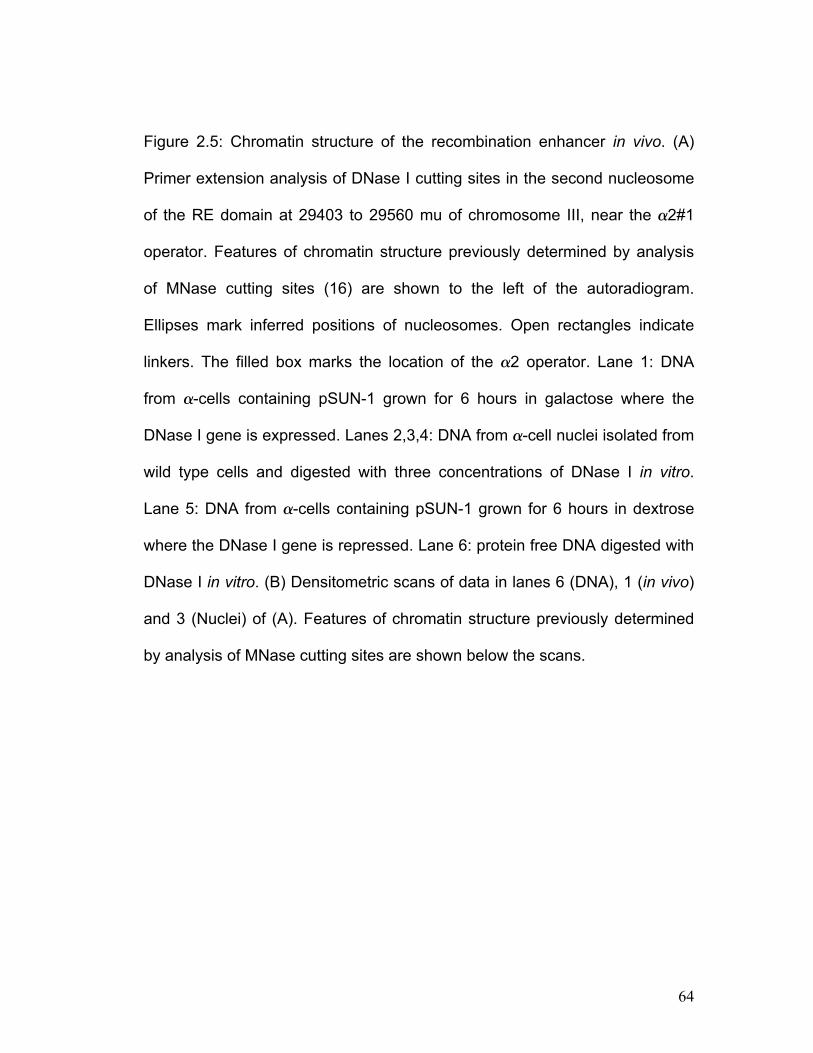
64
Figure 2.5: Chromatin structure of the recombination enhancer in vivo. (A)
Primer extension analysis of DNase I cutting sites in the second nucleosome
of the RE domain at 29403 to 29560 mu of chromosome III, near the 2#1
operator. Features of chromatin structure previously determined by analysis
of MNase cutting sites (16) are shown to the left of the autoradiogram.
Ellipses mark inferred positions of nucleosomes. Open rectangles indicate
linkers. The filled box marks the location of the 2 operator. Lane 1: DNA
from -cells containing pSUN-1 grown for 6 hours in galactose where the
DNase I gene is expressed. Lanes 2,3,4: DNA from -cell nuclei isolated from
wild type cells and digested with three concentrations of DNase I in vitro.
Lane 5: DNA from -cells containing pSUN-1 grown for 6 hours in dextrose
where the DNase I gene is repressed. Lane 6: protein free DNA digested with
DNase I in vitro. (B) Densitometric scans of data in lanes 6 (DNA), 1 (in vivo)
and 3 (Nuclei) of (A). Features of chromatin structure previously determined
by analysis of MNase cutting sites are shown below the scans.
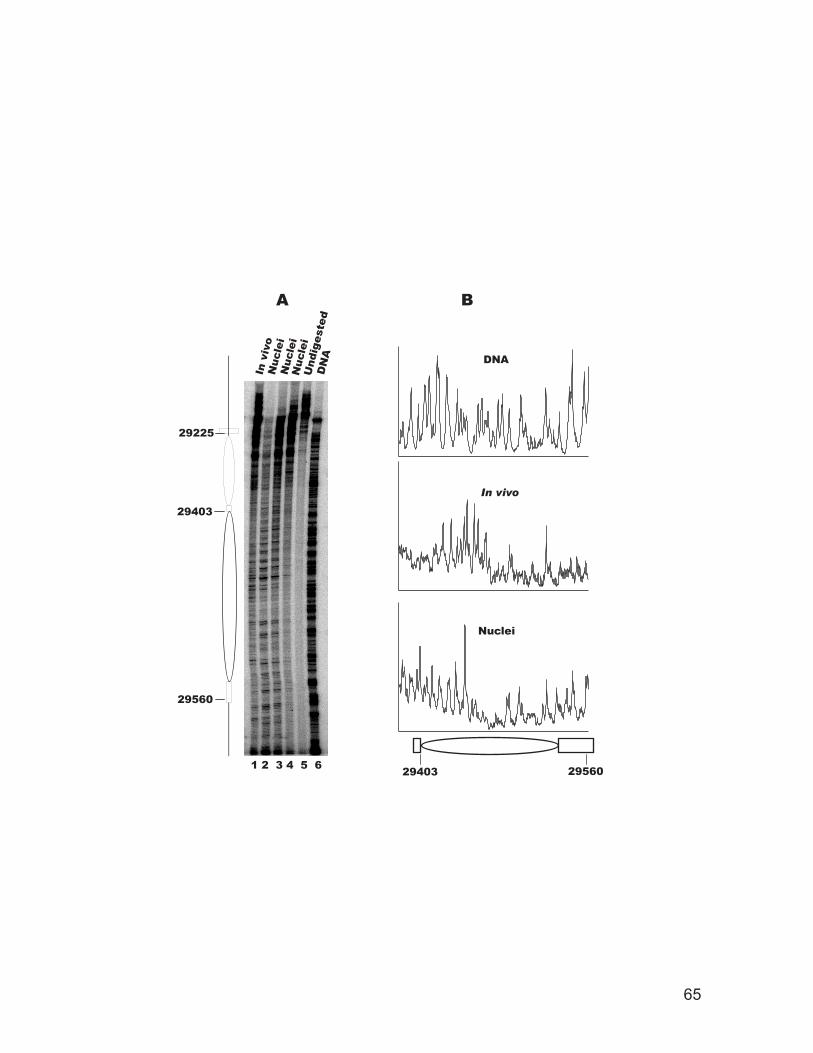
1 2 3 4 5 6
DNA
Nuclei
In vivo
29403
29560
29225
A B
29403 29560
DN
AU
ndig
este
d
In v
ivo
Nuc
lei
Nuc
lei
Nuc
lei
65
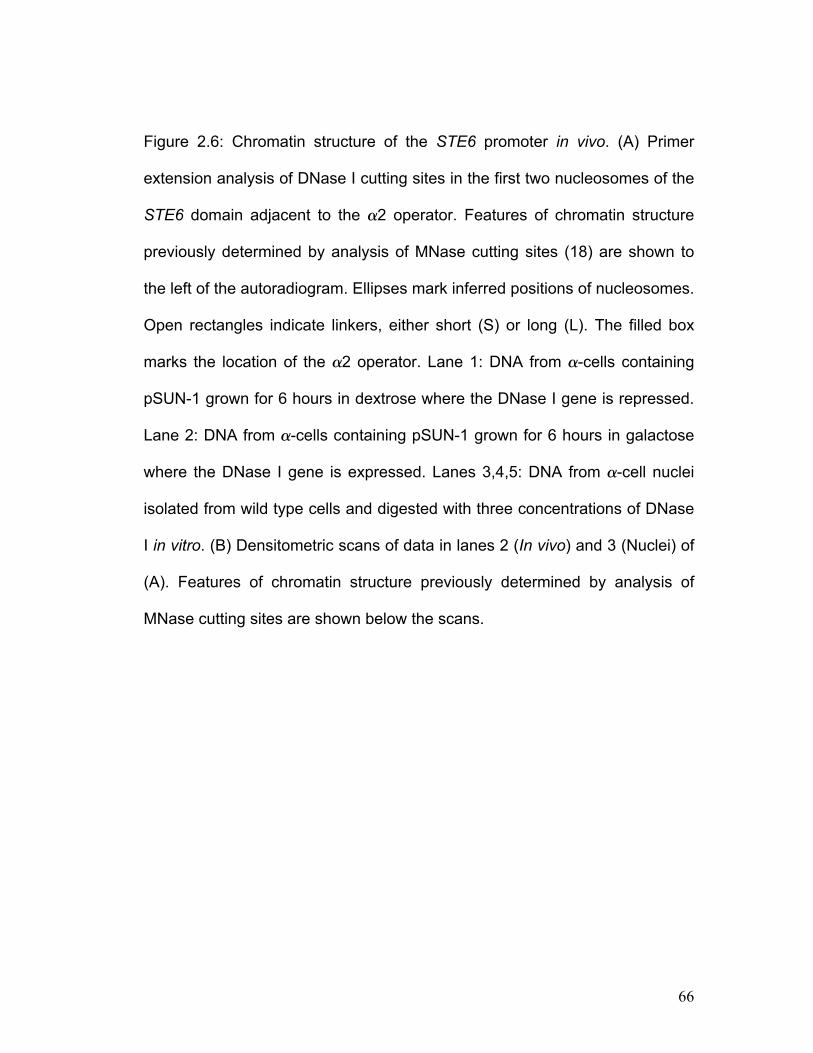
66
Figure 2.6: Chromatin structure of the STE6 promoter in vivo. (A) Primer
extension analysis of DNase I cutting sites in the first two nucleosomes of the
STE6 domain adjacent to the 2 operator. Features of chromatin structure
previously determined by analysis of MNase cutting sites (18) are shown to
the left of the autoradiogram. Ellipses mark inferred positions of nucleosomes.
Open rectangles indicate linkers, either short (S) or long (L). The filled box
marks the location of the 2 operator. Lane 1: DNA from -cells containing
pSUN-1 grown for 6 hours in dextrose where the DNase I gene is repressed.
Lane 2: DNA from -cells containing pSUN-1 grown for 6 hours in galactose
where the DNase I gene is expressed. Lanes 3,4,5: DNA from -cell nuclei
isolated from wild type cells and digested with three concentrations of DNase
I in vitro. (B) Densitometric scans of data in lanes 2 (In vivo) and 3 (Nuclei) of
(A). Features of chromatin structure previously determined by analysis of
MNase cutting sites are shown below the scans.
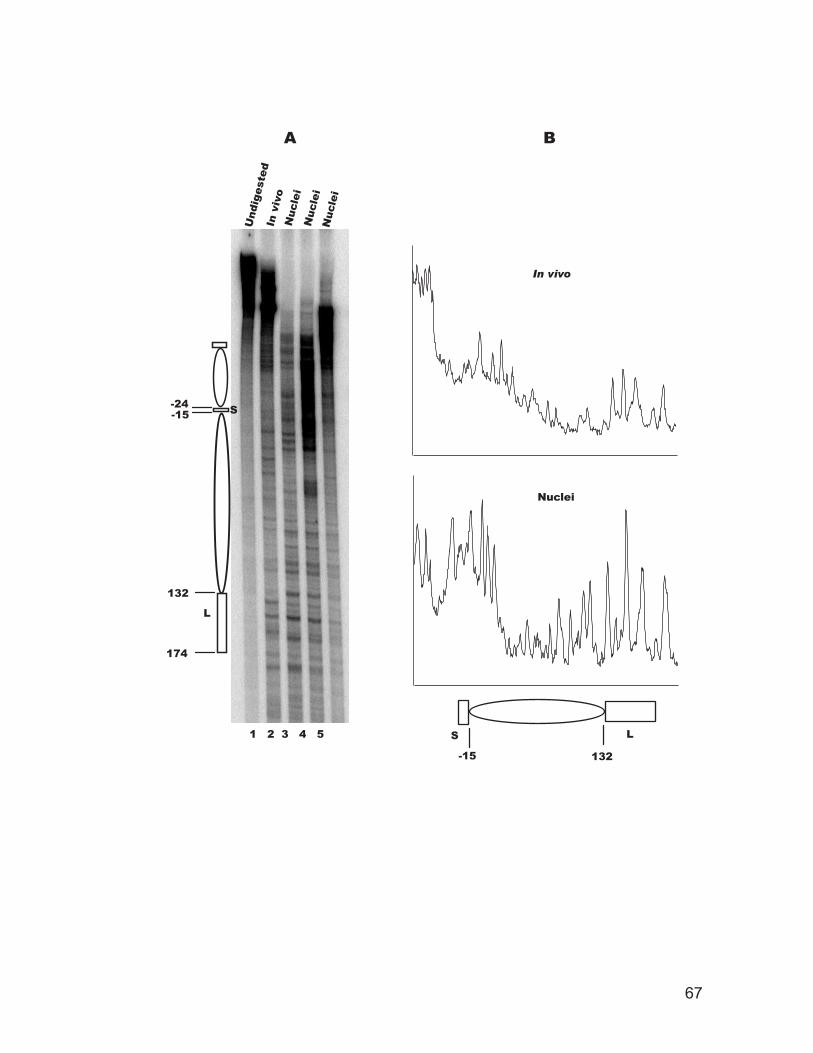
L
1 2 3 4 5
Nuclei
In vivo
S L
A B
-24-15
132
174
-15 132
S
Und
iges
ted
In v
ivo
Nuc
lei
Nuc
lei
Nuc
lei
67
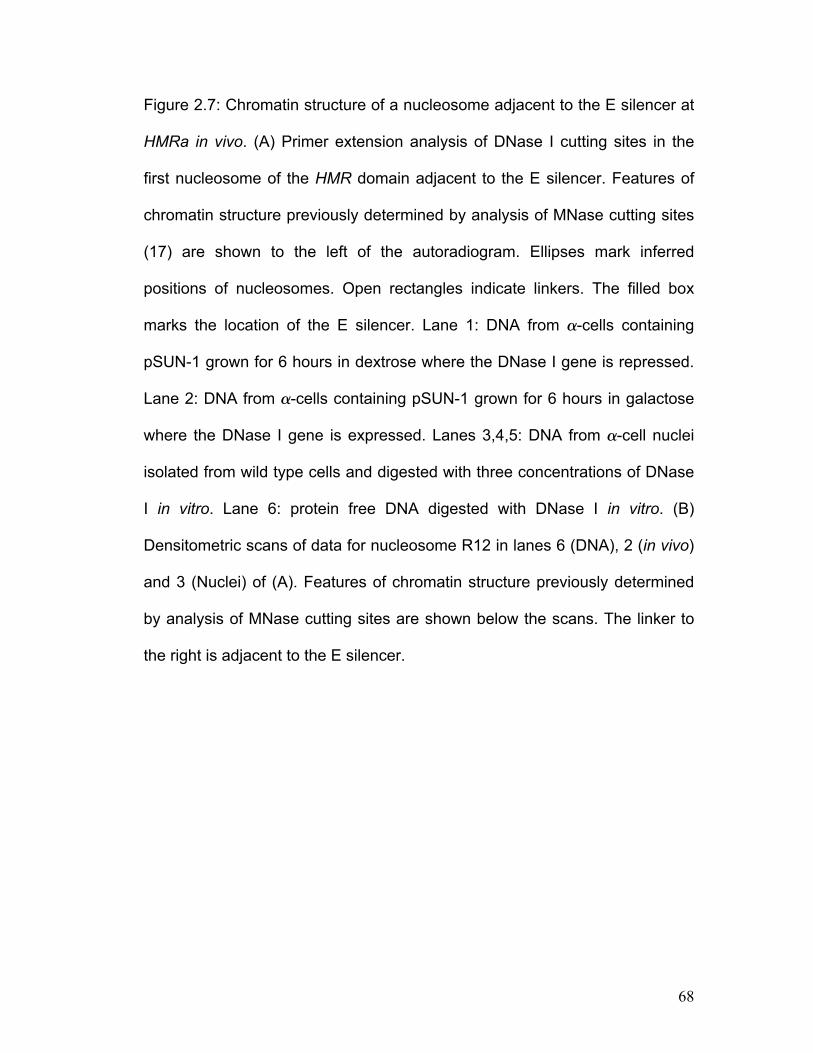
68
Figure 2.7: Chromatin structure of a nucleosome adjacent to the E silencer at
HMRa in vivo. (A) Primer extension analysis of DNase I cutting sites in the
first nucleosome of the HMR domain adjacent to the E silencer. Features of
chromatin structure previously determined by analysis of MNase cutting sites
(17) are shown to the left of the autoradiogram. Ellipses mark inferred
positions of nucleosomes. Open rectangles indicate linkers. The filled box
marks the location of the E silencer. Lane 1: DNA from -cells containing
pSUN-1 grown for 6 hours in dextrose where the DNase I gene is repressed.
Lane 2: DNA from -cells containing pSUN-1 grown for 6 hours in galactose
where the DNase I gene is expressed. Lanes 3,4,5: DNA from -cell nuclei
isolated from wild type cells and digested with three concentrations of DNase
I in vitro. Lane 6: protein free DNA digested with DNase I in vitro. (B)
Densitometric scans of data for nucleosome R12 in lanes 6 (DNA), 2 (in vivo)
and 3 (Nuclei) of (A). Features of chromatin structure previously determined
by analysis of MNase cutting sites are shown below the scans. The linker to
the right is adjacent to the E silencer.
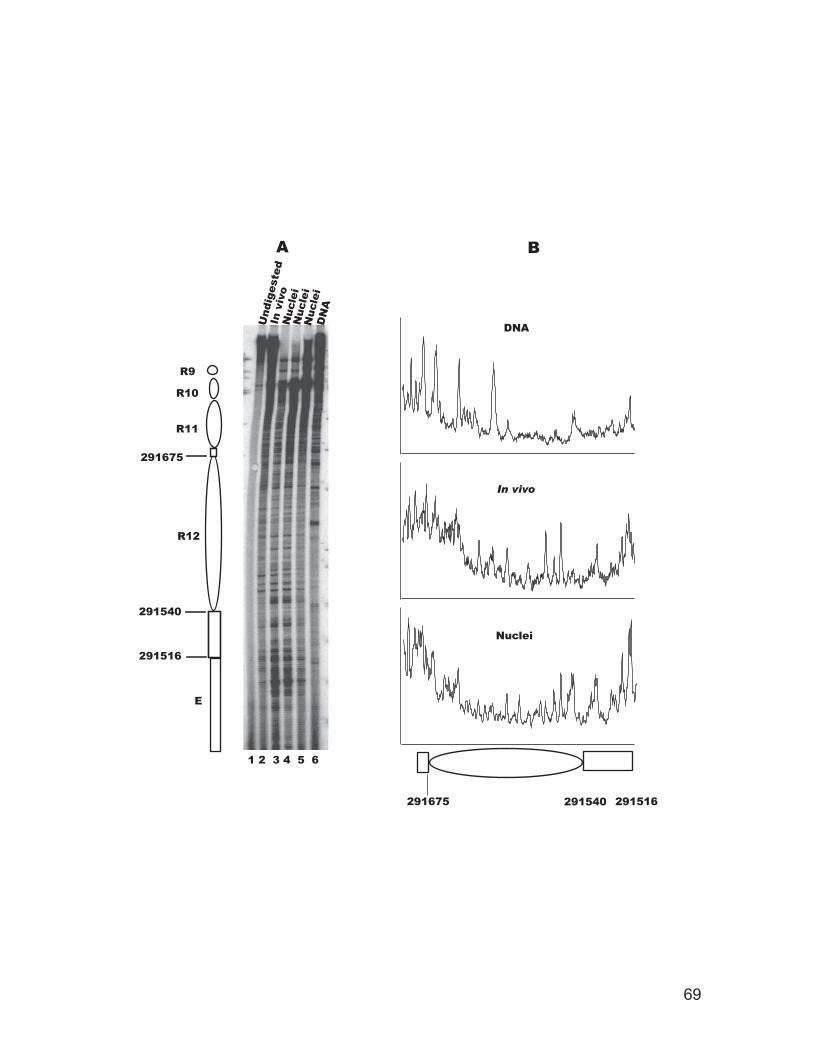
In vivo
Nuclei
DNA
291675 291540 291516
A B
1 2 3 4 5 6
E
R12
R11
R10
R9
291675
291540
291516
DN
A
Und
iges
ted
In v
ivo
Nuc
lei
Nuc
lei
Nuc
lei
69
70
Acknowledgements
Portions of this chapter are taken from (Wang and Simpson, 2001)
We are indebted to members of the Simpson and Workman laboratories
for criticism and support. We particularly thank Dr. John Diller for comments
on the manuscript. These studies were supported by grant R01 GM-52908
from the National Institute of General Medical Sciences.
Chapter III
TATA box binding protein persists at active yeast promoters through multiple transcription cycles in vivo
72
Abstract
TATA box binding protein (TBP) plays a pivotal role in the initiation of RNA
polymerase II mediated transcription. However, it is unclear whether TBP
remains bound to the TATA box after the initiation, during subsequent
transcription cycles. We have used a controlled, DNase I gene to investigate
chromatin and promoter structure in living yeast cells. We find that a region
around the TATA box in the promoter of both high and low rate genes is
protected against DNase I. Moreover, chromatin immunoprecipitation assays
reveal that two sets of coordinately regulated genes have approximately
equal amounts of TBP associated with their promoters, irrespective of their
transcription level. In contrast, occupancy by RNA polymerase II correlates
with transcription frequency. Our results, in addition to the observations that
the promoters of active genes are nucleosome free, suggest that TBP may
occupy the promoter region of active genes through multiple rounds of
transcription, and that binding of TBP to DNA is not a rate limiting step in the
activation of transcription reinitiation in vivo.
73
3.1 Introduction
In eukaryotic cells, most of the protein-encoding genes must be
repetitively transcribed by RNA polymerase II to perform housekeeping
functions and to respond to sustained inductive signals. The transcription
level of those genes is affected by the rate of two critical steps: initiation
during induction, and reinitiation in subsequent transcription cycles (Hahn,
1998; Szentirmay et al., 1998). Initiation and reinitiation both require various
transcription factors plus RNA polymerase II itself to form a complex called, in
jargon, “polymerase machinery” on the promoter (Hahn, 1998). However, a
number of observations suggest that initiation and reinitiation might occur
through different pathways (Hahn, 1998; Hawley and Roeder, 1987). First,
initiation and reinitiation are regulated by different activators (Hahn, 1998;
Szentirmay et al., 1998). For example, GAL4-AH mainly speeds up initiation,
HSF only affects the reinitiation step, and Gal4-VP16 can work on both steps
(Sandaltzopoulos and Becker, 1998; Yudkovsky et al., 2000). Second,
sarkosyl at certain concentrations can block reinitiation but not initiation
(Hawley and Roeder, 1987). Finally, several in vitro studies have shown that
rates of reinitiation at some promoters are several fold higher than those of
initiation (Jiang and Gralla, 1993; Yean and Gralla, 1997). Thus, controls of
initiation and reinitiation must be considered separately in assessing
regulation of promoter activity.
74
TBP, one of the essential general transcription factors, plays a pivotal role
in the initiation step both in vitro and in vivo (Chatterjee and Struhl, 1995;
Klages and Strubin, 1995; Lee and Young, 2000; Pugh, 2000; Xiao et al.,
1995; Yean and Gralla, 1997). Either associated with TAFs as TFIID or in
isolation (Kuras et al., 2000; Li et al., 2000), TBP is one of the first
components of the polymerase machinery to be recruited to the promoter
(Lee and Young, 1998; Pugh, 2000; Zawel et al., 1995). Once TBP has
become bound to a promoter, the rest of the polymerase machinery
assembles quite rapidly (Lee and Young, 2000; Pugh, 2000; Stargell and
Struhl, 1996; Zawel et al., 1995). In vivo, recruitment has also been inferred
from the results of “activator bypass” experiments in which fusion of TBP to a
sequence-specific DNA binding domain generates high levels of activator-
independent gene expression (Chatterjee and Struhl, 1995; Klages and
Strubin, 1995; Xiao et al., 1995). In living yeast cells, moreover, chromatin
immunoprecipitation (ChIP) experiments revealed that TBP is physically
associated with promoters of several genes under activated, but not
repressed, conditions (Kuras and Struhl, 1999; Li et al., 1999). Thus, in vitro
and in vivo evidence imply that recruitment of TBP to the TATA element is an
important step in initiation.
Although in vitro studies firmly establish the importance of TBP in
reinitiation (Hahn, 1998; Yudkovsky et al., 2000), many issues regarding the
precise mechanism by which TBP functions in this step remain unexplored.
One key question is whether TBP remains bound to the promoter through
75
multiple rounds of transcription or whether it needs to be recruited anew for
every cycle of transcription. Several in vitro studies have been performed to
address this issue, but the conclusions of these studies are inconsistent.
Employing Drosophila extracts, Kadonaga suggested that TBP was
dissociated completely from the promoter following each round of RNA
polymerase II transcription (Kadonaga, 1990). However, several other studies
favored an alternative conclusion, that TBP remained associated with the
promoter through multiple rounds of transcription. For example, Zawel et al.
(1995) showed that once bound, TBP can remain promoter bound through
multiple transcription cycles. The multiple techniques they used include a
defined reconstituted transcription system, transcription of templates attached
to solid supports coupled to western blotting, and template competition
assays. These results are consistent with several previous studies that
utilized fractionated HeLa extracts (Hawley and Roeder, 1987; Van Dyke et
al., 1988; Van Dyke et al., 1989; Van Dyke and Sawadogo, 1990). More
recently, a report using an immobilized-template assay and yeast extracts
suggested that, following each transcription cycle, TBP and some other
transcription factors were left at the promoter in a complex so-called “scaffold”
complex (Yudkovsky et al., 2000). The scaffold is competent to support
reinitiation of the next transcription cycles. In addition, Hoopes et al. (1998)
observed that equivalent occupancy of two TATA boxes by TBP resulted in
different levels of transcription. This lends additional support to the hypothesis
76
that TBP persists at the promoter through multiple cycles of transcription.
However, this in vitro based hypothesis has not been tested in living cells.
While it is difficult to provide in vivo evidence for the proposal that TBP
persists at the promoter during reinitiation transcription cycles, if this
hypothesis is believable, one expectation would be that equal amounts of
TBP would be present on the promoters of genes with different transcription
rates. In this study, for the sake of brevity only, we arbitrarily defined the
genes with a transcription rate higher than 80 mRNA per hour
(http://web.wi.mit.edu/young/expression/) as “high rate genes”, and the genes
with a transcription rate lower than 15 mRNA per hour
(http://web.wi.mit.edu/young/expression/) as “low rate genes”, respectively
(Holstege et al., 1998). We have investigated this expectation, employing
several techniques. We examined chromatin structure upstream of a number
of different genes using DNase I expressed in living Saccharomyces
cerevisiae, and found that for all the genes we tested, there was a protected
region around the TATA box. Roughly similar levels and extents of protection
were present for genes that were transcribed at widely different rates. We
also analyzed TBP binding to the promoters of two sets of genes by a
modified ChIP assay. These sets of genes were coordinately regulated but
had different expression levels. We found that the promoter regions around
the TATA box of these genes in each group are associated with TBP in
approximately equal amounts, irrespective of the transcriptional level. In
contrast, the amount of RNA polymerase II associated with the promoter was
77
roughly proportional to the transcriptional level. Taken together, we conclude
that many, if not all, transcriptionally competent genes have a complex of
transcription factors bound at their promoter, unrelated to their actual level of
transcription. In contrast, polymerase binding at the promoter correlates with
the frequency of transcription. Therefore, a rate-limiting step in transcriptional
control must lie between these two facets of the process.
78
3.2 Materials and methods
3.2.1 Yeast Strains and medium
The wild type yeast strains used in all experiments are YPH499 (MATa
ade2-101 ura3-52 his3-200 leu2-1 trp1-63 lys2-1) and YPH500 (MAT ade2-
101 ura3-52 his3-200 leu2-1 trp1-63 lys2-1), which are isogenic except at the
MAT locus. Standard yeast media, both rich (YPD) and synthetic medium
lacking uracil [CSM-Ura (Bio 101), 0.67% yeast nitrogen base without amino
acids (Difco), and an appropriate carbon source (2% dextrose, 4% lactic acid
or 2% galactose)] were used.
3.2.2 Nuclei and DNA preparation and analysis
Nuclei preparation was carried out essentially as described (Weiss and
Simpson, 1997). Briefly, yeast from a 1-liter culture grown to an optical density
of about 1.0 at 600nm was harvested and digested with Zymolyase 100T
(Seikagaku). Nuclei were purified by differential centrifugation and
resuspended in digestion buffer (10mM HEPES, pH 7.5, 0.5mM MgCl2,
0.05mM CaCl2) and incubated with 0, 2, and 4 units/ml MNase (Worthington)
or 0, 0.05, and 0.1 units/ml DNase I (Worthington) for 10 minutes at 37 °C.
The digestions were terminated by the addition of EDTA, and the DNA was
purified by RNase A and proteinase K digestion and phenol/chloroform
extraction. The DNA pellet was resuspended in 0.1×TE buffer.
79
In vivo DNase I digestion was performed as described previously (Wang
and Simpson, 2001) with a minor modification. Briefly, the expression of
DNase I was induced by switching the carbon source to galactose for 6 hours.
The cells were harvested by centrifugation, broken by homogenization with
glass beads in 100 mM Tris–HCl pH 8.0, 50 mM EDTA, 2% sodium dodecyl
sulfate, and the DNA was extracted. NH4OAc was added and precipitation
was allowed to proceed on ice for 2 hours. Purification of DNA involved
treatment with 100 ng/ml RNase A at 37°C for 1 hour and then 100 ng/ml
proteinase K in 2% Sarkosyl, and 200 mM NaClO4 at 50°C for 2 hours. DNA
was further purified by extractions with equal volumes of
phenol/chloroform/isoamyl alcohol (25:24:1) and chloroform/isoamyl alcohol
(24:1), followed by ethanol precipitation. The DNA was dissolved in 0.1x TE
(pH 8.0) prior to analysis.
For low-resolution mapping of nucleosomes by indirect end labeling, the
purified DNA was subjected to a secondary digestion by EcoR I, then
electrophoresed in 1.4% agarose gels in 1×TAE buffer, and transferred to
Hybond-NX membrane (Amersham) and crosslinked with UV light. The
specific DNA sequences were detected by hybridization with a random-primer
labeled probe directed toward the end of the EcoR I site. For high-resolution
mapping, multiple rounds of Taq DNA polymerase-based primer extension
was carried out from a 32P-end-labeled primer, and the products were then
resolved on a 6% polyacrylamide (19:1), 50% urea gel. Images were captured
80
on a PhosphorImager screen. The image was then scanned and analyzed
with Image Quant v.5.0 software (Molecular Dynamics).
3.2.3 Chromatin immunoprecipitation (ChIP)
Chromatin-containing extracts were prepared as previously described
(Hecht and Grunstein, 1999) with minor modifications. Extracts were prepared
from 200-ml cultures at a density of about 1.0 at 600nm. Cells were fixed in
3% formaldehyde and were disrupted with glass beads and transferred to a
15 ml centrifuge tube (the final volume was adjusted to 2 ml). The chromatin-
containing extract was sonicated to yield an average DNA size of 300 bp (the
majority of the fragments were approximately 300 bp long, but a very small
fraction of the fragments were as small as 50 bp or as large as 500 bp).
Sonication conditions were 40% output, 90% duty cycle, fifteen 12-second
cycles with a Branson Sonifier 450. The chromatin size was confirmed for
each input sample by running 10% of the DNA on a 2% agarose gel. The
sonicated extract was subsequently clarified by centrifugation.
The antibodies used in the immunoprecipitation step are: polyclonal
antibody against TBP (provided by J. Reese), polyclonal antibody against
Kin28 subunit of TFIIH (Covance), monoclonal antibody (8WG16) against
Rpb1 subunit of RNA polymerase II (Covance), polyclonal antibody against
TFIIB (provided by S. Hahn), and polyclonal antibody against TFG2 subunit of
TFIIF (provided by S. Hahn).
81
3.2.4 Quantitative PCR
All primers were designed to be 19- to 25-mers, with a Tm of approximately
60°C. Primer sequences are shown in Appendix. The PCR conditions were
94°C for 30 seconds, 55°C for 30 seconds, and 72°C for 1 minute for 28
cycles. A 5-minute 94°C step prior to the cycles and a 5-minute 72°C
extension following completion of the cycles were added. Several dilutions of
each sample were used for PCR. For the input DNA, the initial dilution series
was from 1/4,000 to 1/100; for the immunoprecipitated DNA, the initial dilution
series was from 1/20 to 1/5. Only one titration of input and
immunoprecipitated DNA was shown in the figures, except Figure 3.6B, to
conserve space. The PCR products were detected by UV illumination of an
ethidium bromide stained 2% agarose gel and analyzed with Image Quant
v.5.0 software (Molecular Dynamics).
3.2.5 Nuclei ChIP
Nuclei were isolated as above, and the quality of the chromatin structure
was checked by digestion of a portion of the isolated nuclei with micrococcal
nuclease and gel electrophoresis of the resulting DNA fragments (data not
shown). The remaining nuclei were subjected to ChIP analysis. The isolated
nuclei were crosslinked with varying concentrations of formaldehyde.
Sonicated, soluble chromatin of an average size of 0.3 kb was
immunoprecipitated with the TBP antibodies or TFIIH (kin28) antibodies as
82
above. The amount of STE6 promoter and ORF DNA present in the pellet
was determined by quantitative PCR as described above.
83
3.3 Results
3.3.1 Promoters of active genes are accessible and “nucleosome-free”
Transcription of genes occurs in the context of chromatin, thought to pose
an obstacle to recruitment of TBP and other trans-acting factors to DNA
(Workman and Kingston, 1998a). Many in vitro studies have shown that a
“kinetic competition” takes place between TBP and histones: packaging
promoter DNA in nucleosomes impedes accessibility of TBP to template
DNA, whereas prior binding of TBP or other factors to the promoter blocks
nucleosome assembly on important cis-acting DNA elements (Abmayr et al.,
1988; Adams and Workman, 1993; Almouzni et al., 1990; Imbalzano et al.,
1994; Svaren and Horz, 1997; Workman and Kingston, 1992a; Workman and
Roeder, 1987a; Workman et al., 1991). Therefore, the promoter regions of
most, if not all, active genes are nucleosome-free. We expect that if TBP
persists at the promoter through multiple transcription cycles, such an “active”
chromatin structure will be observed on promoters of not only high rate genes
but also low rate genes.
One of the most important experimental features of active promoter
chromatin structure is that these nucleosome-free regions, in isolated
chromatin or nuclei, were more sensitive to nucleases (such as MNase and
DNase I) than bulk chromatin (Elgin, 1988; Gross and Garrard, 1988).
Previous studies demonstrated that gene-specific increases in nuclease
susceptibility for those sensitive regions were associated with activated
84
transcription (Gavin and Simpson, 1997; Simpson et al., 1993; Svaren and
Horz, 1997). However, these studies focused on a small number of inducible
genes controlled by specific transcriptional regulators. As a more general
evaluation of the relationship between hypersensitivity to nucleases and
transcription, we have now analyzed sensitivity to nucleases at several
constitutively active promoters.
For all the promoters tested, we found a strong correlation between
sensitivity to nucleases and transcription, regardless of whether the
transcription frequency was high or low. In contrast, repressed promoters are
blocked from nuclease digestion. As shown in Figure 3.1, for example, the
promoter of MFA1 is occluded by a positioned nucleosome and therefore is
resistant to micrococcal nuclease (MNase) in cells where the gene is
repressed, whereas the promoter is sensitive to MNase in a cells where the
gene is active. The same change has been previously observed for other a
cell-specific genes (Simpson et al., 1993; Teng et al., 2001). Additionally,
promoter regions of other inducible genes have been reported to become
sensitive to MNase upon activation (Almer et al., 1986; Fedor and Kornberg,
1989).
Next, we checked the sensitivity to nucleases of more unrelated
promoters. Sensitivity was observed not only for the promoters of high
transcriptional rate genes such as MFA1 and PGK1, but also for low rate
genes such as STP1, MRPL28 (Figure 3.1 and data not shown). Notably, a
separate study (Ercan and Simpson, in revision) revealed a DNase I
85
hypersensitive site upstream of most of the 28 ORFs in a ~50 kb region of
yeast chromosome III in isolated nuclei, further supporting the correlation
between transcription competence and the lack of a nucleosome over the
promoter region.
Although we favor the idea that the nucleosome-free characteristic of
promoters in isolated chromatin derives from TBP binding during initiation and
is maintained by continuous presence of TBP and possibly other transcription
factors (see Discussion), we did not see the footprint of TBP or other
transcription factors on promoters when we did high resolution (single base
pair level) mapping of isolated swollen nuclei (Figure 3.2, 3.3 and data not
shown). Actually, in isolated nuclei, such a footprint has been observed in
only a very few cases (Chen et al., 1994). We suggest that this may be due to
possible dissociation of TBP and other transcription factors during isolation of
nuclei (see Discussion). Therefore, we used methodology previously
developed by us to analyze chromatin structure of multiple genomic loci by
inducing expression of DNase I in living yeast cells (Wang and Simpson,
2001).
3.3.2 TBP binds to promoters of different genes with the same
occupancy level
To better understand the interaction between trans-acting factors and
DNA in the native chromatin environment inside living cells, we have
expressed the gene for bovine DNase I under GAL control in Saccharomyces
86
cerevisiae (Wang and Simpson, 2001). While yeast cells eventually die when
the nuclease is active, they survive for hours, long enough to let us get
snapshots of the chromatin structure of particular loci.
DNase I has been the gold standard for chromatin structure studies since
the seminal studies of Carl Wu (Wu, 1980). We have mapped the DNase I
cutting pattern of the 31 bp 2 operator in different situations. The central 11
bp is bound by a homo-dimer of Mcm1 protein in a and cells while the
flanking 10 bp on each side is bound by Mat2 protein in cells (Keleher et
al., 1989). Previously we have shown that the 31 bp region is protected in
cells, whereas in nuclei isolated from cells, only the central 11 bp is
protected from DNase I digestion (Wang and Simpson, 2001). The cutting
pattern for this region is identical in wild type a cells and a cell nuclei (Wang
and Simpson, 2001). These observations agree well with earlier studies
suggesting that only Mcm1p remains bound at the operator in isolated nuclei
(Murphy et al., 1993).
These data demonstrated the efficacy of the in vivo chromatin mapping
strategy and prompted us to study the binding of TBP and other transcription
factors in living cells. Using primer extension, we mapped DNase I cutting
sites around the promoter region and the beginning of the coding region of
several genes that are transcribed by RNA polymerase II. These genes
represent mechanistically distinct classes of genes and the transcription rate
(mRNA per hour) of these genes spans a more than a 1300 fold range
(http://web.wi.mit.edu/young/expression/). Surprisingly, for every gene
87
analyzed, there is a protected region surrounding the TATA box in living cells
but not in isolated nuclei or protein free DNA samples (Figure 3.2, 3.3, and
data not shown). Two examples are shown in Figures 3.2 and 3.3.
Figure 3.2 shows the DNase I cutting patterns at the promoter and coding
regions of PGK1, a highly active gene with a transcription rate of 110
transcripts per hour. Naked DNA from this region was susceptible to DNase I
at a number of sites throughout the promoter and coding region. Cutting in
isolated nuclei (lanes 4, 5, and 6) has a similar, but not identical, digestion
pattern to that of naked DNA (lanes 7 and 8). This is in agreement with other
studies showing that the promoter and coding regions of active genes are
hypersensitive to nuclease in isolated nuclei (Elgin, 1988; Gross and Garrard,
1988). In contrast, in a region surrounding the TATA box (from ~10 bp
upstream to ~60 bp downstream), DNase I cutting was severely restricted in
the in vivo digested chromatin samples (lanes 2 and 3), relative to the
digestion pattern in both naked DNA and isolated nuclei. Beyond this region,
including the coding region, a similar cutting pattern was observed for all
three samples. Notably, a site ~ 10 bp upstream of the TATA box is
hypersensitive to DNase I in vivo; this site may mark the edge of the binding
site of the transcription complex. The protection at the promoter seems to
arise from binding of TBP and other transcription factors.
Figure 3.3 shows the DNase I cutting patterns at the promoter and coding
regions of the YCL056C gene, with a transcription rate of only 3.5 transcripts
per hour. Again, cleavage of isolated nuclei (lanes 3 and 4) and naked DNA
88
(lanes 5 and 6) yielded complex patterns of cutting through the region.
Interestingly, sequences in the promoter region and the beginning of the
coding region of this gene were also protected from DNase I in living cells
(lane 2). Again, a hypersensitive site which is ~ 10 bp upstream of the TATA
box was observed in the in vivo digestion sample. These results are in
agreement with the in vitro result (Yudkovsky et al., 2000) suggesting that
TBP and other factors form a scaffold complex and remain bound to
promoters through multiple cycles of transcription. These experiments also
imply that elements or structures present on promoters in living cells may be
lost during nuclear isolation or chromatin preparation, as suggested by
previous investigations (Pfeifer and Riggs, 1991; Zaret, 1999).
To investigate what proteins might be associated with promoters, we used
chromatin immunoprecipitation assays. Formaldehyde fixed chromatin was
sonicated to reduce DNA length to <500 bp (Figure 3.6A) and
immunoprecipitated with specific antisera. After reversing the crosslinking,
DNA was purified, and the presence of a particular DNA sequence was
detected by polymerase chain reaction amplification. TBP, TFIIB, TFIIF,
TFIIH, and RNA polymerase II were found to be associated with the promoter
of both of the genes mapped above (Figure 3.4). As a negative control, none
of the above factors was found to bind to the upstream activation site (UAS)
of the STE3 gene, which lacks a TATA element. These results suggest that
the protection seen in vivo reflects binding of these factors.
89
3.3.3 Differential TBP binding patterns between living cells and isolated
nuclei
Our data showed that in isolated nuclei the TATA box is hypersensitive to
DNase I, and, in contrast, this region is protected in living cells. An appealing
notion, therefore, is that some structures are disrupted during nuclei
purification. In support of this idea is evidence that in vitro, TBP can protect its
cognate sites from nucleases, either by itself or in association with TFIIA or
TFIIB. However, these results are not sufficient to prove directly that these
DNA footprinting differences are due to the differential binding conditions of
TBP in living intact cells versus isolated nuclei.
To further determine whether or not TBP binds to DNA in isolated nuclei in
the same way as in living cells, ChIP was carried out to monitor binding of
TBP and RNA polymerase II to the STE6 promoter and to a region in the
STE6 ORF. The region of the STE6 ORF is located more than 1.5 kilobases
(kb) from the promoter (Figure 3.5A).
First, we examined the STE6 promoter and ORF occupancy by TBP and
RNA polymerase II in whole cells. Figure 3.5B shows that nearly ten times
more of the STE6 promoter was present relative to the STE6 ORF DNA in
TBP immunoprecipitates. In contrast, RNA polymerase II was found
associated with both promoter and ORF DNA at similar levels. This
observation is consistent with previous studies (Kuras and Struhl, 1999; Li et
al., 1999; Pokholok et al., 2002).
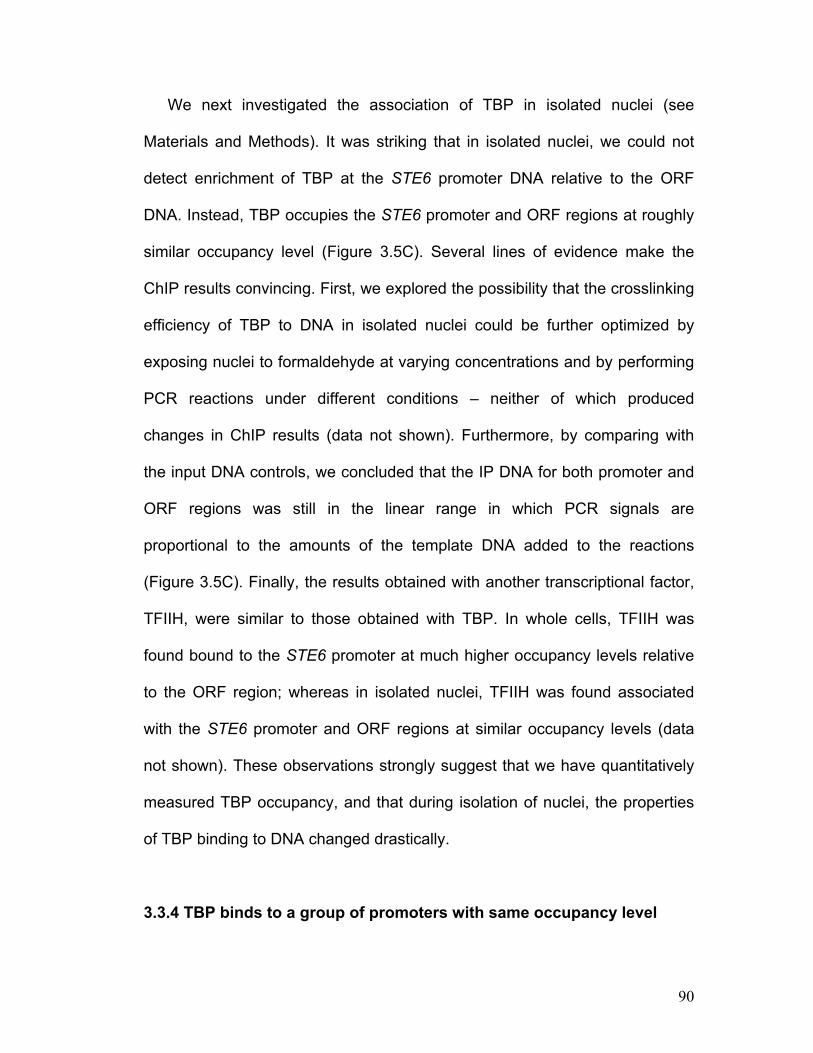
90
We next investigated the association of TBP in isolated nuclei (see
Materials and Methods). It was striking that in isolated nuclei, we could not
detect enrichment of TBP at the STE6 promoter DNA relative to the ORF
DNA. Instead, TBP occupies the STE6 promoter and ORF regions at roughly
similar occupancy level (Figure 3.5C). Several lines of evidence make the
ChIP results convincing. First, we explored the possibility that the crosslinking
efficiency of TBP to DNA in isolated nuclei could be further optimized by
exposing nuclei to formaldehyde at varying concentrations and by performing
PCR reactions under different conditions – neither of which produced
changes in ChIP results (data not shown). Furthermore, by comparing with
the input DNA controls, we concluded that the IP DNA for both promoter and
ORF regions was still in the linear range in which PCR signals are
proportional to the amounts of the template DNA added to the reactions
(Figure 3.5C). Finally, the results obtained with another transcriptional factor,
TFIIH, were similar to those obtained with TBP. In whole cells, TFIIH was
found bound to the STE6 promoter at much higher occupancy levels relative
to the ORF region; whereas in isolated nuclei, TFIIH was found associated
with the STE6 promoter and ORF regions at similar occupancy levels (data
not shown). These observations strongly suggest that we have quantitatively
measured TBP occupancy, and that during isolation of nuclei, the properties
of TBP binding to DNA changed drastically.
3.3.4 TBP binds to a group of promoters with same occupancy level
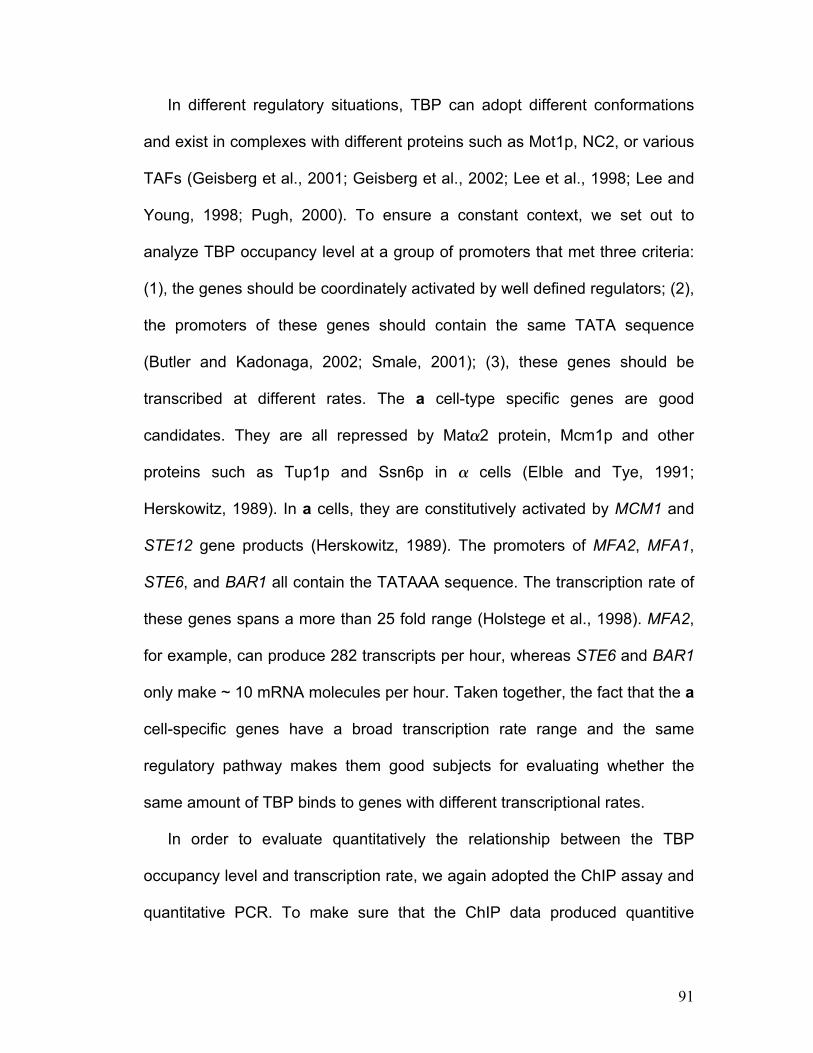
91
In different regulatory situations, TBP can adopt different conformations
and exist in complexes with different proteins such as Mot1p, NC2, or various
TAFs (Geisberg et al., 2001; Geisberg et al., 2002; Lee et al., 1998; Lee and
Young, 1998; Pugh, 2000). To ensure a constant context, we set out to
analyze TBP occupancy level at a group of promoters that met three criteria:
(1), the genes should be coordinately activated by well defined regulators; (2),
the promoters of these genes should contain the same TATA sequence
(Butler and Kadonaga, 2002; Smale, 2001); (3), these genes should be
transcribed at different rates. The a cell-type specific genes are good
candidates. They are all repressed by Mat2 protein, Mcm1p and other
proteins such as Tup1p and Ssn6p in cells (Elble and Tye, 1991;
Herskowitz, 1989). In a cells, they are constitutively activated by MCM1 and
STE12 gene products (Herskowitz, 1989). The promoters of MFA2, MFA1,
STE6, and BAR1 all contain the TATAAA sequence. The transcription rate of
these genes spans a more than 25 fold range (Holstege et al., 1998). MFA2,
for example, can produce 282 transcripts per hour, whereas STE6 and BAR1
only make ~ 10 mRNA molecules per hour. Taken together, the fact that the a
cell-specific genes have a broad transcription rate range and the same
regulatory pathway makes them good subjects for evaluating whether the
same amount of TBP binds to genes with different transcriptional rates.
In order to evaluate quantitatively the relationship between the TBP
occupancy level and transcription rate, we again adopted the ChIP assay and
quantitative PCR. To make sure that the ChIP data produced quantitive
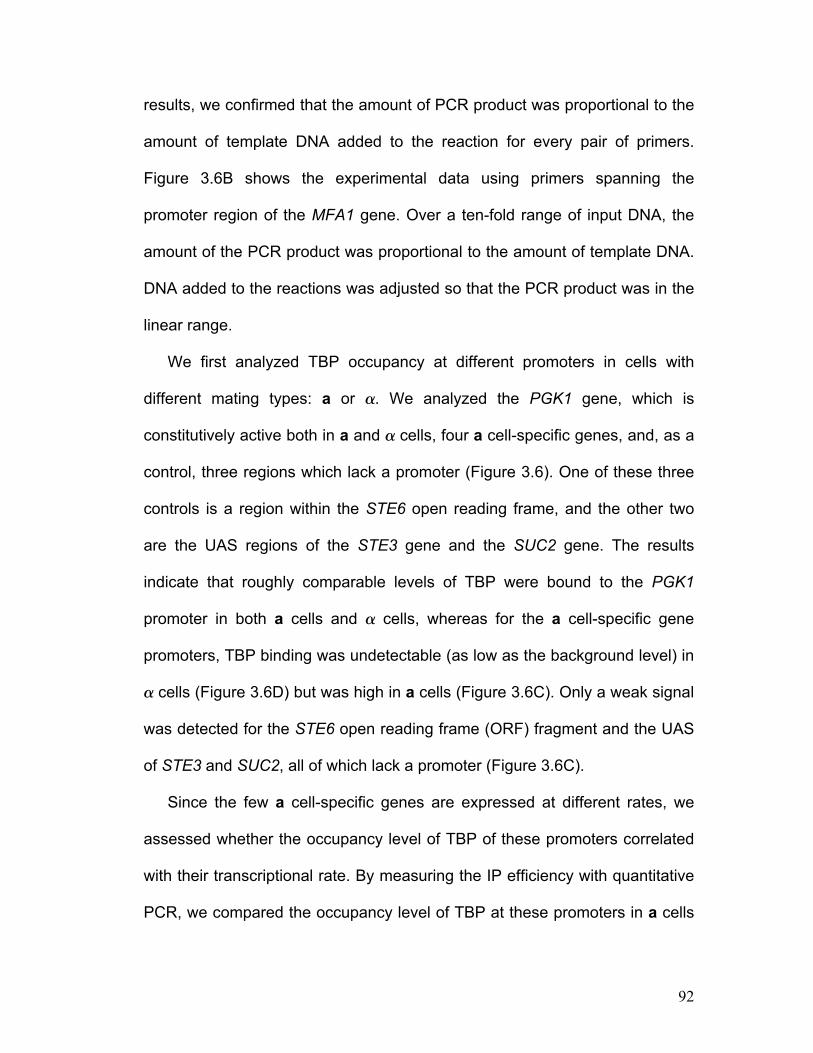
92
results, we confirmed that the amount of PCR product was proportional to the
amount of template DNA added to the reaction for every pair of primers.
Figure 3.6B shows the experimental data using primers spanning the
promoter region of the MFA1 gene. Over a ten-fold range of input DNA, the
amount of the PCR product was proportional to the amount of template DNA.
DNA added to the reactions was adjusted so that the PCR product was in the
linear range.
We first analyzed TBP occupancy at different promoters in cells with
different mating types: a or . We analyzed the PGK1 gene, which is
constitutively active both in a and cells, four a cell-specific genes, and, as a
control, three regions which lack a promoter (Figure 3.6). One of these three
controls is a region within the STE6 open reading frame, and the other two
are the UAS regions of the STE3 gene and the SUC2 gene. The results
indicate that roughly comparable levels of TBP were bound to the PGK1
promoter in both a cells and cells, whereas for the a cell-specific gene
promoters, TBP binding was undetectable (as low as the background level) in
cells (Figure 3.6D) but was high in a cells (Figure 3.6C). Only a weak signal
was detected for the STE6 open reading frame (ORF) fragment and the UAS
of STE3 and SUC2, all of which lack a promoter (Figure 3.6C).
Since the few a cell-specific genes are expressed at different rates, we
assessed whether the occupancy level of TBP of these promoters correlated
with their transcriptional rate. By measuring the IP efficiency with quantitative
PCR, we compared the occupancy level of TBP at these promoters in a cells
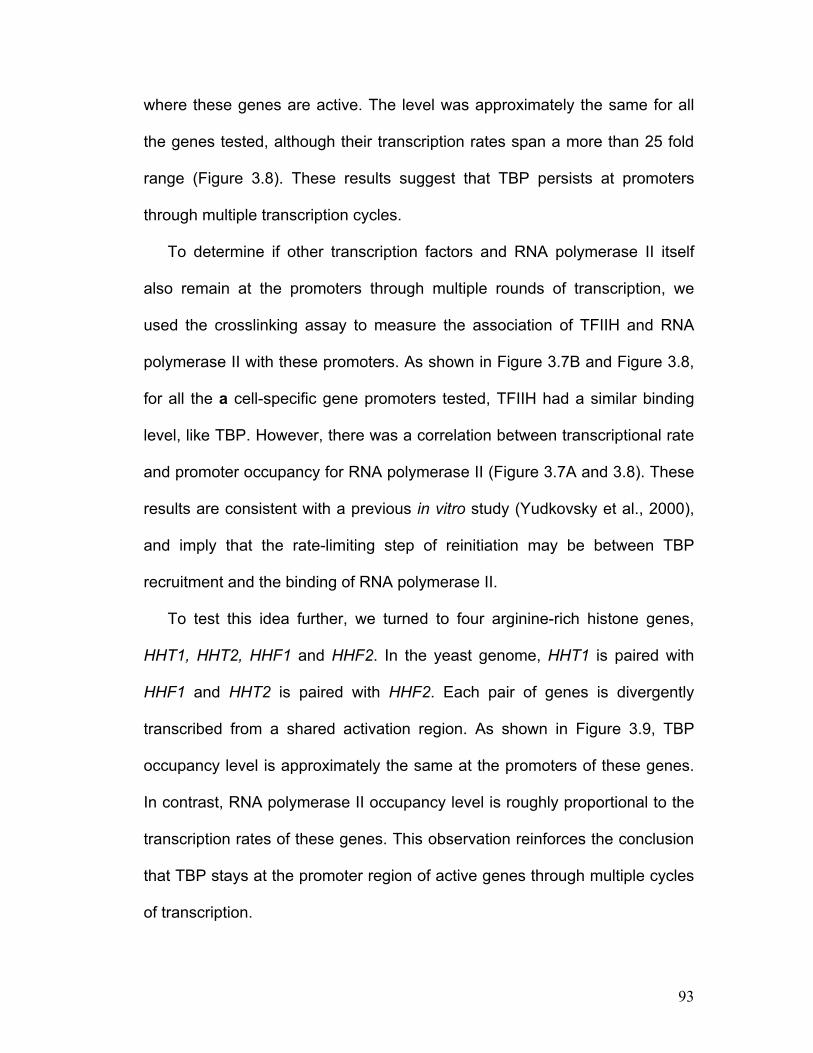
93
where these genes are active. The level was approximately the same for all
the genes tested, although their transcription rates span a more than 25 fold
range (Figure 3.8). These results suggest that TBP persists at promoters
through multiple transcription cycles.
To determine if other transcription factors and RNA polymerase II itself
also remain at the promoters through multiple rounds of transcription, we
used the crosslinking assay to measure the association of TFIIH and RNA
polymerase II with these promoters. As shown in Figure 3.7B and Figure 3.8,
for all the a cell-specific gene promoters tested, TFIIH had a similar binding
level, like TBP. However, there was a correlation between transcriptional rate
and promoter occupancy for RNA polymerase II (Figure 3.7A and 3.8). These
results are consistent with a previous in vitro study (Yudkovsky et al., 2000),
and imply that the rate-limiting step of reinitiation may be between TBP
recruitment and the binding of RNA polymerase II.
To test this idea further, we turned to four arginine-rich histone genes,
HHT1, HHT2, HHF1 and HHF2. In the yeast genome, HHT1 is paired with
HHF1 and HHT2 is paired with HHF2. Each pair of genes is divergently
transcribed from a shared activation region. As shown in Figure 3.9, TBP
occupancy level is approximately the same at the promoters of these genes.
In contrast, RNA polymerase II occupancy level is roughly proportional to the
transcription rates of these genes. This observation reinforces the conclusion
that TBP stays at the promoter region of active genes through multiple cycles
of transcription.
94
3.4 Discussion
We have analyzed the in vivo TBP occupancy at promoters of active
genes with different transcription frequency. The hypothesis is that
persistence of TBP at competent promoters should make protection against
DNase I digestion and occupancy level the same for high and low
transcriptional rate genes. We find that the promoter regions of both groups of
genes are nucleosome free and a region around the TATA box in the
promoter of both high and low rate genes is protected against DNase I in vivo.
The occupancy level of TBP was same for the promoters of two groups of
similarly regulated genes, despite the fact that the transcription frequency of
the genes in either group is different from each other. In contrast, the
occupancy level of RNA polymerase II correlated well with the transcription
frequency. These findings support a model that after initiation of the first cycle
of transcription, TBP persists at the promoters of active genes through
multiple cycles of transcription.
3.4.1 TBP plays a different role in initiation and reinitiation
Initiation and reinitiation are two important steps in the process of
transcription. Initiation controls the on or off status of a gene. Once a gene is
activated, most of the subsequent RNA synthesis probably results from
reinitiation rather than de novo initiation events because the rate of reinitiation
is much faster than the rate of initiation (Yean and Gralla, 1997; Yudkovsky et
95
al., 2000). In living eukaryotic cells, genes are transcribed at tremendously
different levels. However, little is known about the mechanisms that control
the frequency of reinitiation at different promoters (Hahn, 1998). In fact, in
contrast to the numerous investigations regarding initiation (Kuras and Struhl,
1999; Li et al., 1999; Pugh, 2000), only few in vitro investigations (Kadonaga,
1990; Van Dyke et al., 1988; Van Dyke et al., 1989; Yudkovsky et al., 2000;
Zawel et al., 1995), and no in vivo studies, have been performed to date to
test whether the same mechanism is applied to initiation and reinitiation.
Here, we provide in vivo evidence that TBP plays different roles in initiation
and reinitiation.
Previous studies have established that activation of genes is accompanied
by the recruitment of TBP to the promoters (Kuras and Struhl, 1999; Li et al.,
1999). Our data support this idea by showing that the promoter regions of a
cell-specific genes are occluded by positioned nucleosomes in cells. In a
cells, where these genes are transcribed, these nucleosomes are disrupted
and TBP occupancy can be easily detected (Figure 3.1 and 3.6).
We investigated the role TBP plays in regulating reinitiation in vivo. In vitro
studies have demonstrated that TBP can bind stably to its DNA target and
remain bound at the promoter through multiple transcription cycles (Van Dyke
et al., 1988; Van Dyke et al., 1989; Yudkovsky et al., 2000; Zawel et al.,
1995). All of these suggest the model that TBP persists at the promoter of
active genes, and that the binding of TBP is not the rate limiting step of
reinitiation. Therefore, we might expect to find similar levels of TBP
96
occupancy at the promoters of high rate genes and low rate genes. Indeed,
our results are consistent with this hypothesis.
Our results (Figure 3.1, 3.2, 3.3; and Ercan and Simpson, in revision),
together with a large body of earlier work (Adams and Workman, 1993;
Workman and Kingston, 1998a; Workman and Roeder, 1987a), indicated that
the promoter regions of active genes, both high and low rate genes, are
nucleosome-free. It is well accepted that transcription occurs in the context of
chromatin and in most, if not all, cases, active transcription requires that the
promoter region is nucleosome-free (Adams and Workman, 1993; Simpson et
al., 1993; Svaren and Horz, 1997; Workman and Kingston, 1998a; Workman
and Roeder, 1987a). If TBP binds to the promoters of active genes through
multiple cycles of transcription, then the promoters of these genes may be
free of nucleosomes. Indeed, a number of studies have suggested that the
normal nucleosomal array is disrupted in the promoter regions of active genes
(Adams and Workman, 1993; Workman and Kingston, 1998a; Workman and
Roeder, 1987a). First, as mentioned above, active promoters are
hypersensitive to nucleases in isolated nuclei (Elgin, 1988; Gross and
Garrard, 1988). Second, neither the tails nor the histone fold domains of the
core histones can be cross-linked to the heat shock gene promoters, which
are bound by TBP (Nacheva et al., 1989; Tsukiyama et al., 1994). Finally,
while inducible genes can be derepressed upon nucleosome loss even under
non-inducing conditions (Han and Grunstein, 1988), a genome wide analysis
revealed that expression of 75% of already induced genes in yeast did not
97
change when nucleosome content was reduced by deleting histone H4
(Wyrick et al., 1999).
Although it has been well accepted that for inducible genes, recruitment of
TBP to the promoter is mediated by activators and/or chromatin remodeling
complexes (Becker and Horz, 2002; Jenuwein and Allis, 2001), the
mechanism of TBP recruitment remains unknown for constitutively active
genes. The most likely and simplest model is that during DNA replication,
TBP binds to the promoter and prevents the assembly of nucleosomes
around this region, as is the case for some other transcription factors (Fedor
and Kornberg, 1989). In vitro studies showed that prebinding of TBP to
promoters prior to nucleosome assembly can prevent nucleosome-mediated
repression of transcription (Abmayr et al., 1988; Almouzni et al., 1990;
Workman and Roeder, 1987a; Workman et al., 1991).
Using in vivo DNase I digestion, we observed roughly similar extents and
levels of protection at the promoters of both high and low transcriptional rate
genes. Notably, the primer extension experiments to map these two classes
of promoters were performed using the same DNA samples. That is, those
promoter regions were all mapped from the same in vivo DNase I digested
DNA sample, and the similarity we observed among promoters was
reproducible in multiple experiments. This indicates that some proteins bind
to the promoter region at all times. We conclude that TBP, and possibly other
factors, remain bound at the promoters after each cycle of transcription.
98
Using a ChIP assay, we quantitatively measured TBP occupancy level at
the promoters of four a cell-specific genes. These genes are thought to be
regulated by the same mechanism and the TATA sequences are the same for
their promoters, so accessibility of the antibody to TBP should not be affected
by conformation or different factors associating with TBP. Although the
transcription rate of these genes spans more than a 25 fold range, the TBP
occupancy level is same for their promoters. Similarly, equivalent TBP
occupancy is observed among promoters of four histone genes. This strongly
supports the conclusion that TBP remains on promoters through multiple
cycles of transcription.
We suggest that TBP, possibly together with other transcription factors,
binds to the promoter of active genes upon induction by activators or during
replication. Then, unless receiving dissociating signals, TBP, perhaps
together with some other factors, will form a postinitiation complex on the
promoter to facilitate further cycles of transcription.
3.4.2 A comparison between TBP binding patterns in living cells and
isolated nuclei
Nuclease digestion of isolated nuclei has been used for many decades to
map chromatin structure (Simpson, 1998). Using this method, nucleosomes
have been shown to be positioned on certain DNA sequences and such
positioning has important functional consequences (Simpson, 1991; Simpson,
1998). For example, when an autonomously replicating sequence of a
99
minichromosome was covered by a positioned nucleosome, the copy number
of the minichromosome decreased dramatically (Simpson, 1990). However,
for non-histone binding studies, it has been a concern that artifacts may be
produced during the process of nuclei preparation, these artifacts are caused
either by the dissociation or degradation of proteins, by buffer conditions
different from physiological conditions, or by disruption of some nuclear
structure (Kornberg et al., 1989; Zaret, 1999). One example is the binding of
Mat2p, a short half-life protein (Murphy et al., 1993). The footprint of this
protein is lost in isolated nuclei (Murphy et al., 1993); however, Mat2p can
protect binding sites in situ or in living cells against UV light, methylase and
DNase I (Gavin et al., 2000; Kladde et al., 1996; Murphy et al., 1993; Wang
and Simpson, 2001; Wu et al., 1998). A striking depletion of TBP bound to the
Xa promoter within nuclei isolated from human cells compared to that within
permeabilized cells has also been reported (Pfeifer and Riggs, 1991). It has
been shown in several cases that the TATA box is protected from
modification by UV light in living cells; however, in isolated nuclei, these sites
are hypersensitive to nucleases (Elgin, 1988; Gross and Garrard, 1988).
While these results imply that TBP dissociates from its target sites in isolated
nuclei, interpretation is complicated by the differing DNA sequence
specificities and other characteristics of these modifiers and nucleases (Van
Dyke and Dervan, 1983; Zaret, 1999).
In this study, we compared the DNase I digestion pattern at several active
promoters in samples from isolated nuclei and also from in vivo samples.
100
Strikingly, for the promoters of all the genes we tested, differences in DNase I
digestion patterns between samples digested with the enzyme in vivo and
those analyzed with an exogenous enzyme in isolated nuclei have been
observed. In vivo, the TATA box and a region surrounding the TATA box
within each gene are protected from DNase I; in isolated nuclei, however,
such regions are hypersensitive to nucleases compared to the bulk chromatin
(Figure 3.1, 3.2, 3.3, and data not shown). Considering that in vitro binding
assays showed that TBP, either in purified form or associated with TFIIA
and/or TFIIB, can protect the binding site from DNase I (Sawadogo and
Roeder, 1985; Van Dyke et al., 1989), we suggest that TBP and other factors
were dissociated from their cognate sites upon isolation of chromatin. This
idea is further supported by the ChIP assay showing that redistribution of TBP
and other general transcriptional factors occurs upon nuclei isolation (Figure
3.5 and data not shown). As such, our results favor (although they do not
prove) the idea that TBP and other general transcriptional factors bind to
active promoters specifically in living cells; in isolated nuclei, however, TBP
and other general transcriptional factors bind to DNA elements
nonspecifically, transiently and weakly.
Possible explanations for these observed differences between in vivo and
isolated chromatin samples are as follows. First, it could be proposed that
TBP, like Mat2p, has been degraded during the process of nuclei
preparation. This idea is contradicted by the observation that, in many cases,
TBP can be easily detected in nuclear extracts (Yudkovsky et al., 2000). A
101
second explanation might be that TBP dissociates from the promoter due to
the hypotonic buffer used in the nuclei preparation process. Although it is
difficult to exclude this second possibility, it is clearly inconsistent with the fact
that TBP can bind to its target DNA in various conditions, and that the affinity
of TBP for the TATA box is very high (KD ~ 1nM) (Pugh, 2000).
We favor a third possibility. This explanation assumes that TBP is binding
to the promoter in the context of some nuclear structure. Existence of a
filamentous structure in the nucleus of many cell types has been supported by
numerous experimental approaches (Nickerson et al., 1997; Wan et al.,
1999). Some observations have implied that active genes are attached to
these filamentous structures so that mRNA transcription occurs in hundreds
to thousands of discrete foci in the nucleus (Cockell and Gasser, 1999;
Szentirmay and Sawadogo, 2000). TBP, the competent promoters, and
perhaps other transcription factors, might associate in the context of nuclear
compartments. Upon nuclear isolation, disruption of these nuclear
compartments might lead to loss of TBP footprinting and the binding
specificity. Such disruption may be caused by the loss of cytoskeletal
architecture, the diffusion of nucleoplasm from the nuclei, or the altered ionic
environment (Kornberg et al., 1989; Zaret, 1999).
Therefore, our results strongly suggest that care should be taken in
concluding that chromatin in the isolated nucleus represents native chromatin
in the living cell. In addition, perhaps the term “isolated chromatin” should be
used when referring to isolated nuclei.
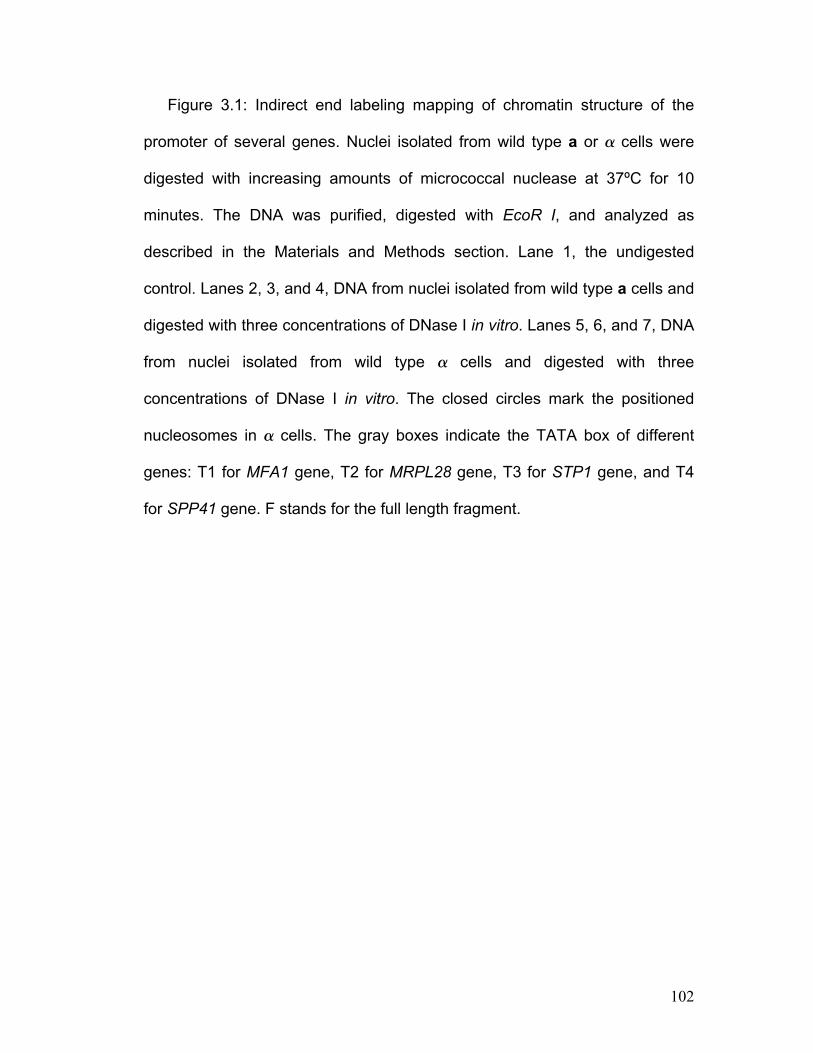
102
Figure 3.1: Indirect end labeling mapping of chromatin structure of the
promoter of several genes. Nuclei isolated from wild type a or cells were
digested with increasing amounts of micrococcal nuclease at 37ºC for 10
minutes. The DNA was purified, digested with EcoR I, and analyzed as
described in the Materials and Methods section. Lane 1, the undigested
control. Lanes 2, 3, and 4, DNA from nuclei isolated from wild type a cells and
digested with three concentrations of DNase I in vitro. Lanes 5, 6, and 7, DNA
from nuclei isolated from wild type cells and digested with three
concentrations of DNase I in vitro. The closed circles mark the positioned
nucleosomes in cells. The gray boxes indicate the TATA box of different
genes: T1 for MFA1 gene, T2 for MRPL28 gene, T3 for STP1 gene, and T4
for SPP41 gene. F stands for the full length fragment.
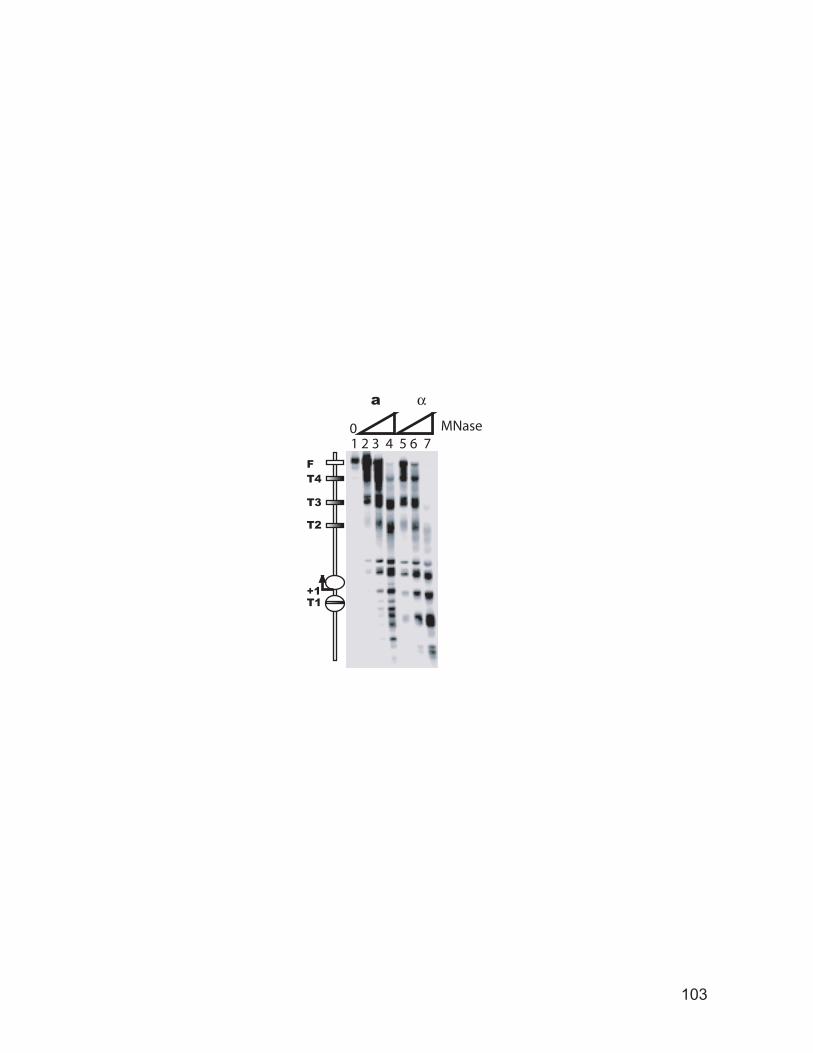
T1
T2
T3
T4
+1
αa
MNase01 2 3 4 5 6 7
F
103
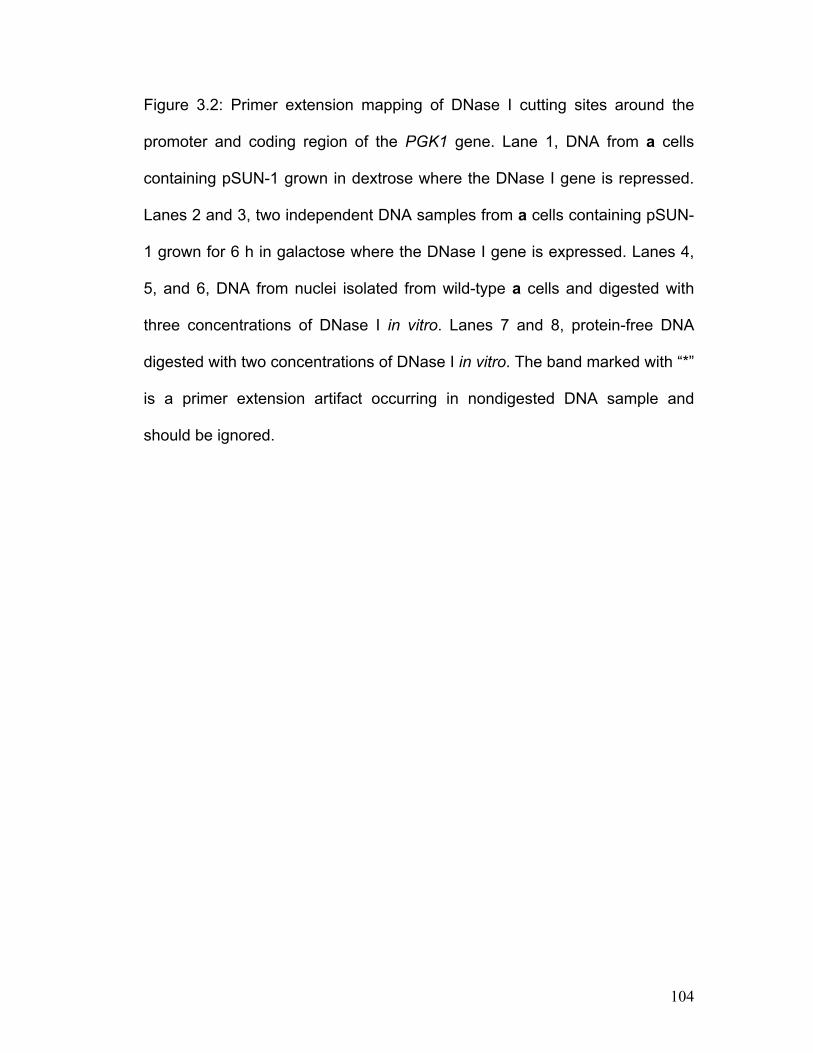
104
Figure 3.2: Primer extension mapping of DNase I cutting sites around the
promoter and coding region of the PGK1 gene. Lane 1, DNA from a cells
containing pSUN-1 grown in dextrose where the DNase I gene is repressed.
Lanes 2 and 3, two independent DNA samples from a cells containing pSUN-
1 grown for 6 h in galactose where the DNase I gene is expressed. Lanes 4,
5, and 6, DNA from nuclei isolated from wild-type a cells and digested with
three concentrations of DNase I in vitro. Lanes 7 and 8, protein-free DNA
digested with two concentrations of DNase I in vitro. The band marked with “*”
is a primer extension artifact occurring in nondigested DNA sample and
should be ignored.
1 2 3 4 5 6 7 8
+1
TATA
*
Und
iget
ed c
ontro
lIn
viv
o di
gest
ion
Nuc
lear
dig
estio
nN
aked
DN
A
Nuc
lear
dig
estio
nN
aked
DN
A
Nuc
lear
dig
estio
n
In v
ivo
dige
stio
n
105
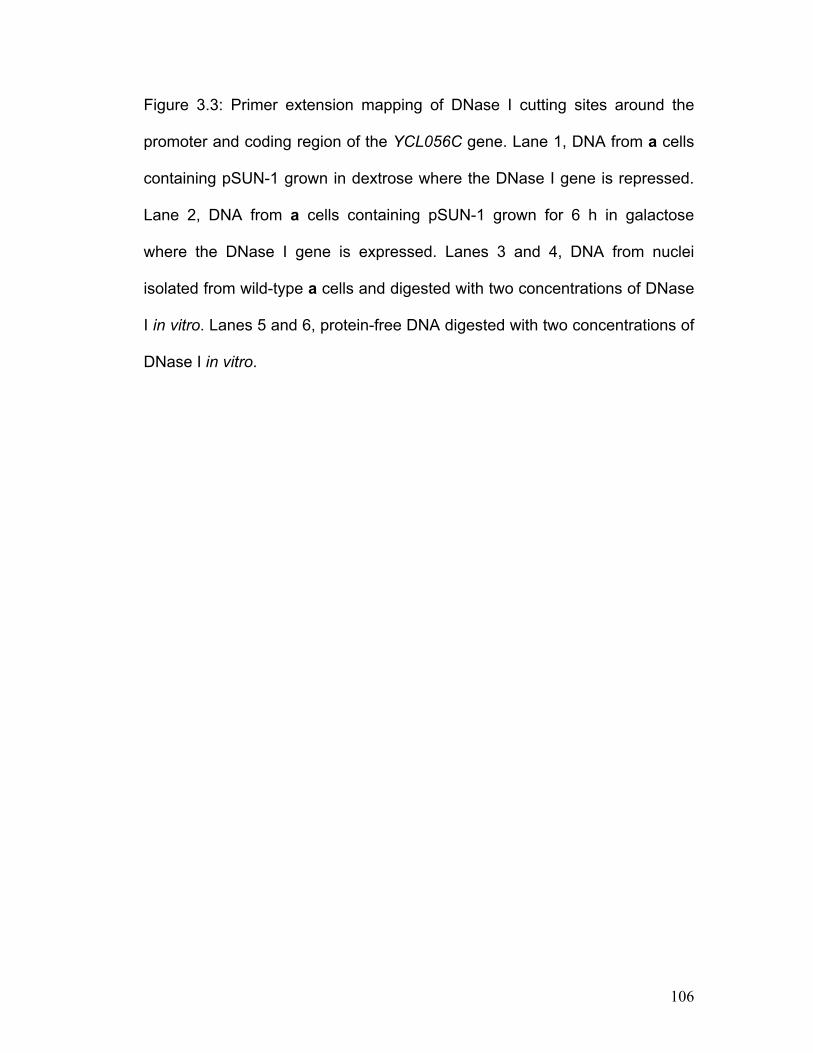
106
Figure 3.3: Primer extension mapping of DNase I cutting sites around the
promoter and coding region of the YCL056C gene. Lane 1, DNA from a cells
containing pSUN-1 grown in dextrose where the DNase I gene is repressed.
Lane 2, DNA from a cells containing pSUN-1 grown for 6 h in galactose
where the DNase I gene is expressed. Lanes 3 and 4, DNA from nuclei
isolated from wild-type a cells and digested with two concentrations of DNase
I in vitro. Lanes 5 and 6, protein-free DNA digested with two concentrations of
DNase I in vitro.
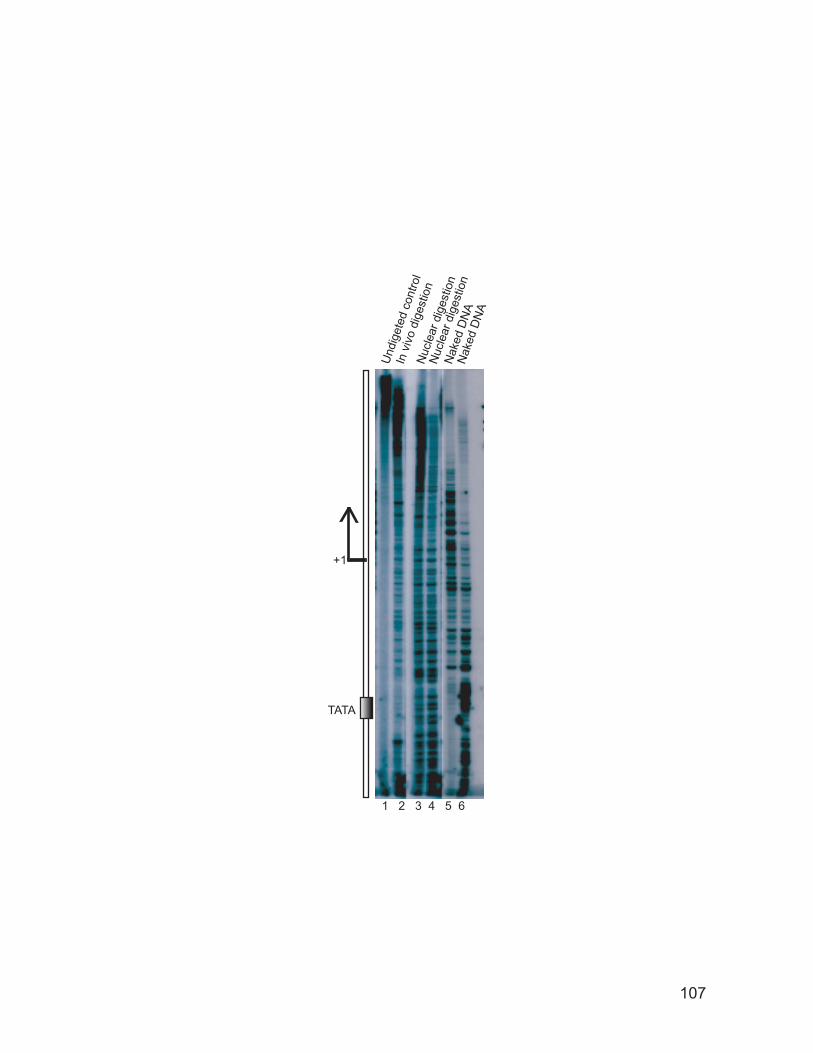
+1
TATA
1 2 3 4 5 6
Und
iget
ed c
ontro
lIn
viv
o di
gest
ion
Nak
ed D
NA
Nuc
lear
dig
estio
nN
aked
DN
A
Nuc
lear
dig
estio
n
107
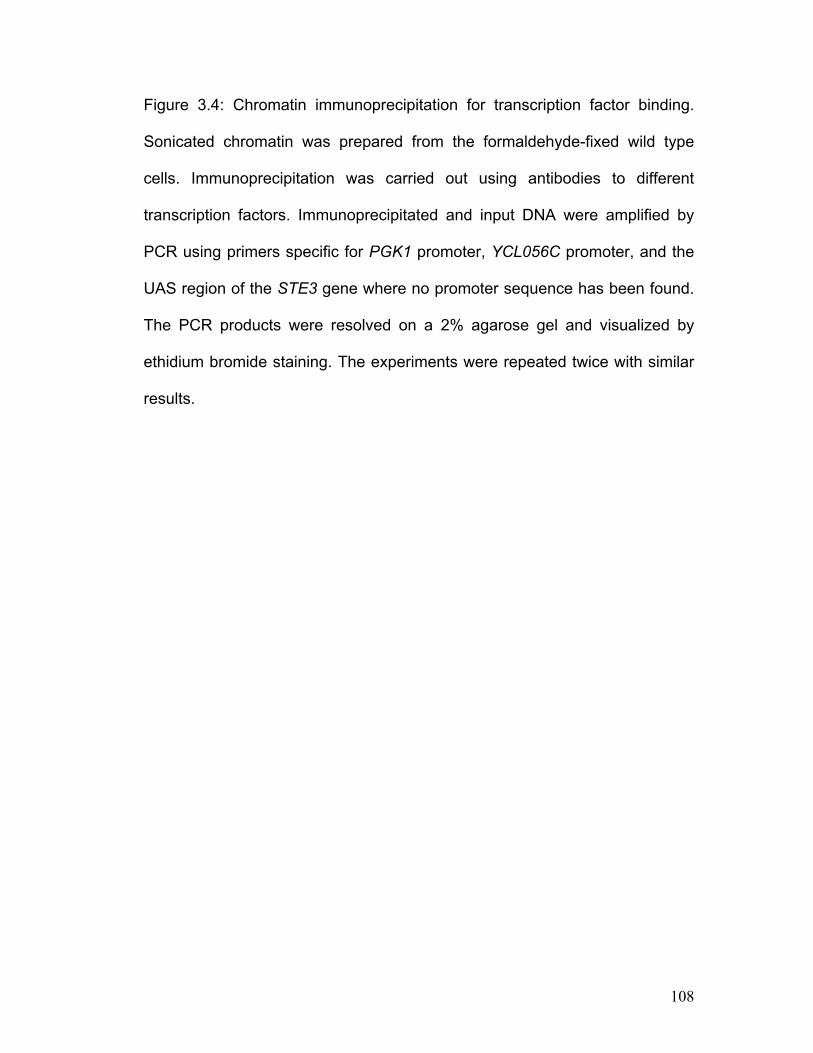
108
Figure 3.4: Chromatin immunoprecipitation for transcription factor binding.
Sonicated chromatin was prepared from the formaldehyde-fixed wild type
cells. Immunoprecipitation was carried out using antibodies to different
transcription factors. Immunoprecipitated and input DNA were amplified by
PCR using primers specific for PGK1 promoter, YCL056C promoter, and the
UAS region of the STE3 gene where no promoter sequence has been found.
The PCR products were resolved on a 2% agarose gel and visualized by
ethidium bromide staining. The experiments were repeated twice with similar
results.
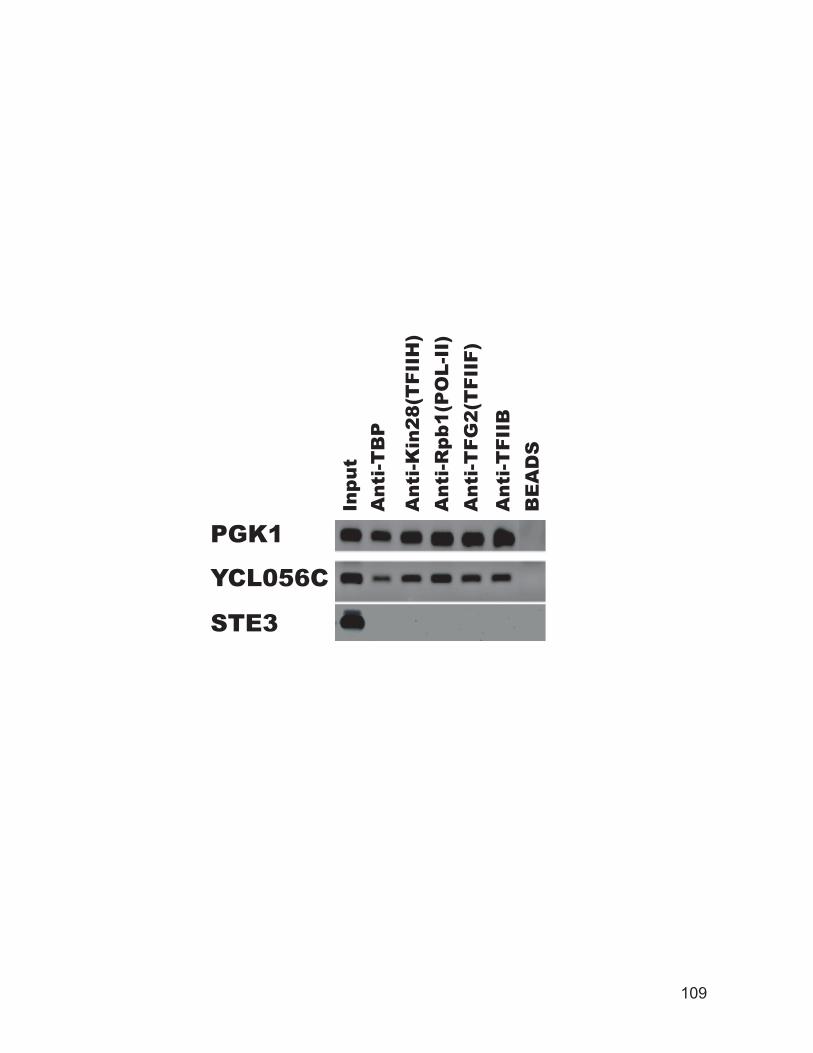
PGK1
YCL056C
STE3
Inpu
tA
nti-T
BP
Ant
i-Kin
28(T
FIIH
)A
nti-R
pb1(
PO
L-II
)A
nti-T
FG2(
TFI
IF)
Ant
i-TFI
IBB
EA
DS
109
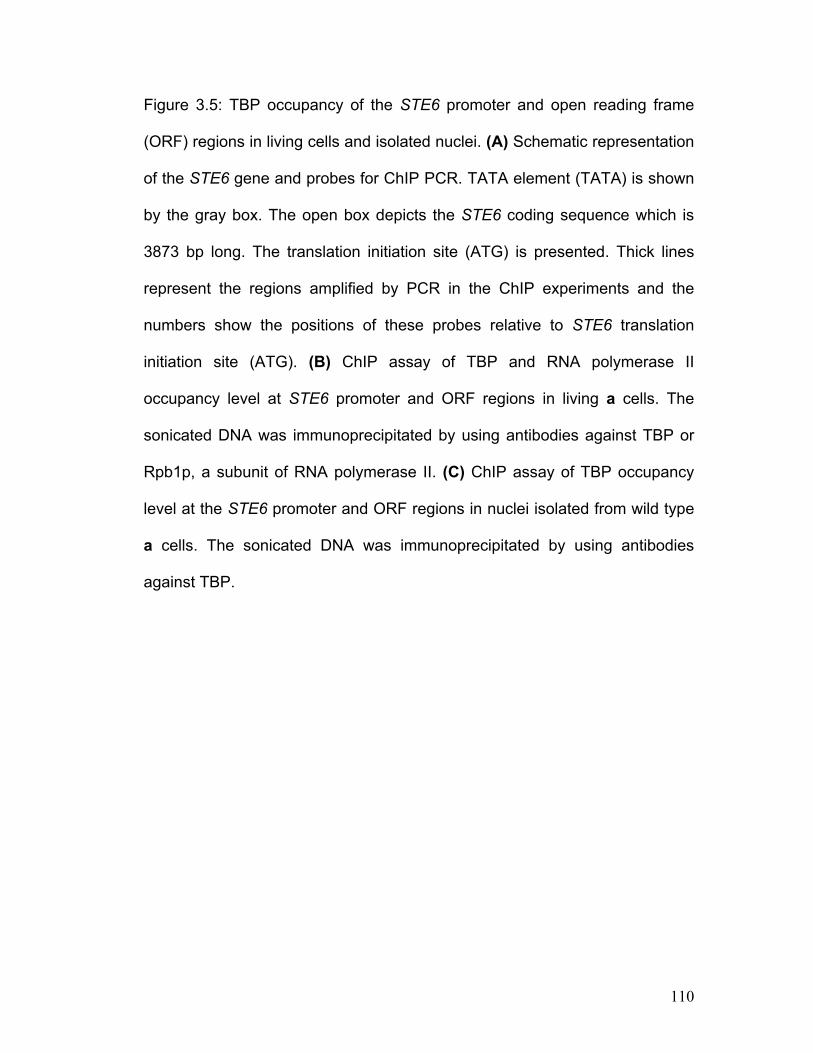
110
Figure 3.5: TBP occupancy of the STE6 promoter and open reading frame
(ORF) regions in living cells and isolated nuclei. (A) Schematic representation
of the STE6 gene and probes for ChIP PCR. TATA element (TATA) is shown
by the gray box. The open box depicts the STE6 coding sequence which is
3873 bp long. The translation initiation site (ATG) is presented. Thick lines
represent the regions amplified by PCR in the ChIP experiments and the
numbers show the positions of these probes relative to STE6 translation
initiation site (ATG). (B) ChIP assay of TBP and RNA polymerase II
occupancy level at STE6 promoter and ORF regions in living a cells. The
sonicated DNA was immunoprecipitated by using antibodies against TBP or
Rpb1p, a subunit of RNA polymerase II. (C) ChIP assay of TBP occupancy
level at the STE6 promoter and ORF regions in nuclei isolated from wild type
a cells. The sonicated DNA was immunoprecipitated by using antibodies
against TBP.
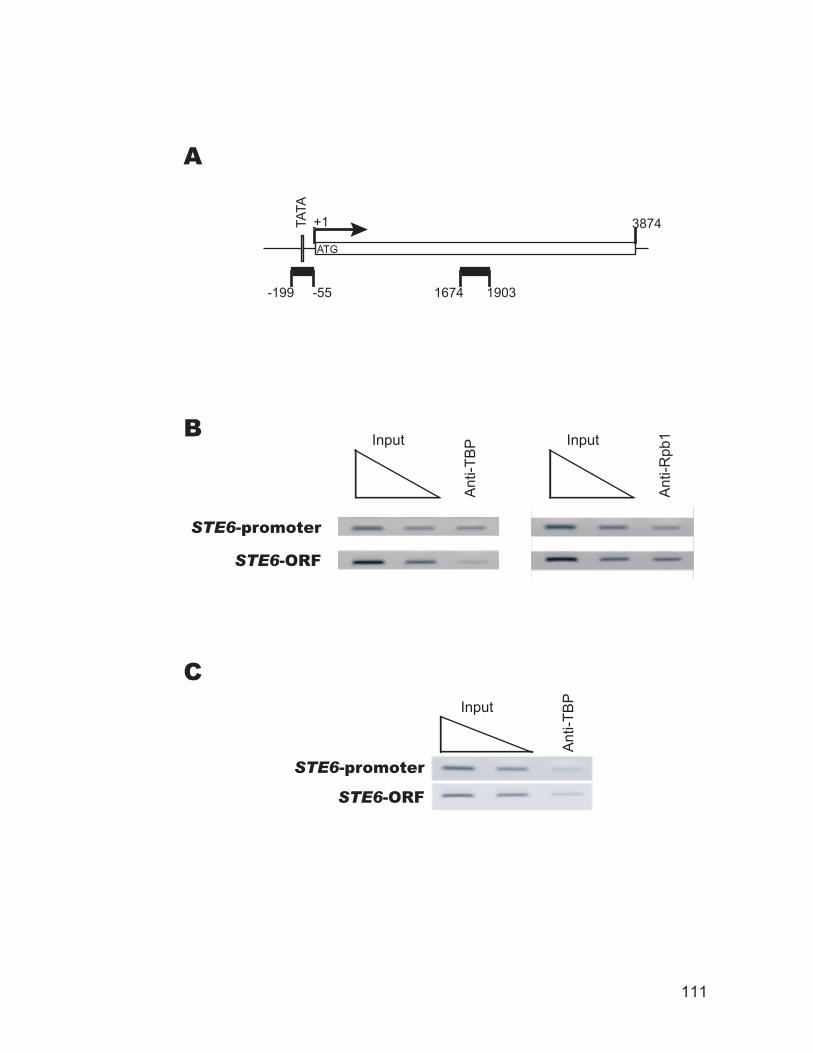
B
A
C
Input
Ant
i-TB
P
STE6-promoter
STE6-ORF
Input
Ant
i-Rpb
1
+1TATA
3874
ATG
1674 1903-199 -55
STE6-promoter
STE6-ORF
Input
Ant
i-TB
P
111
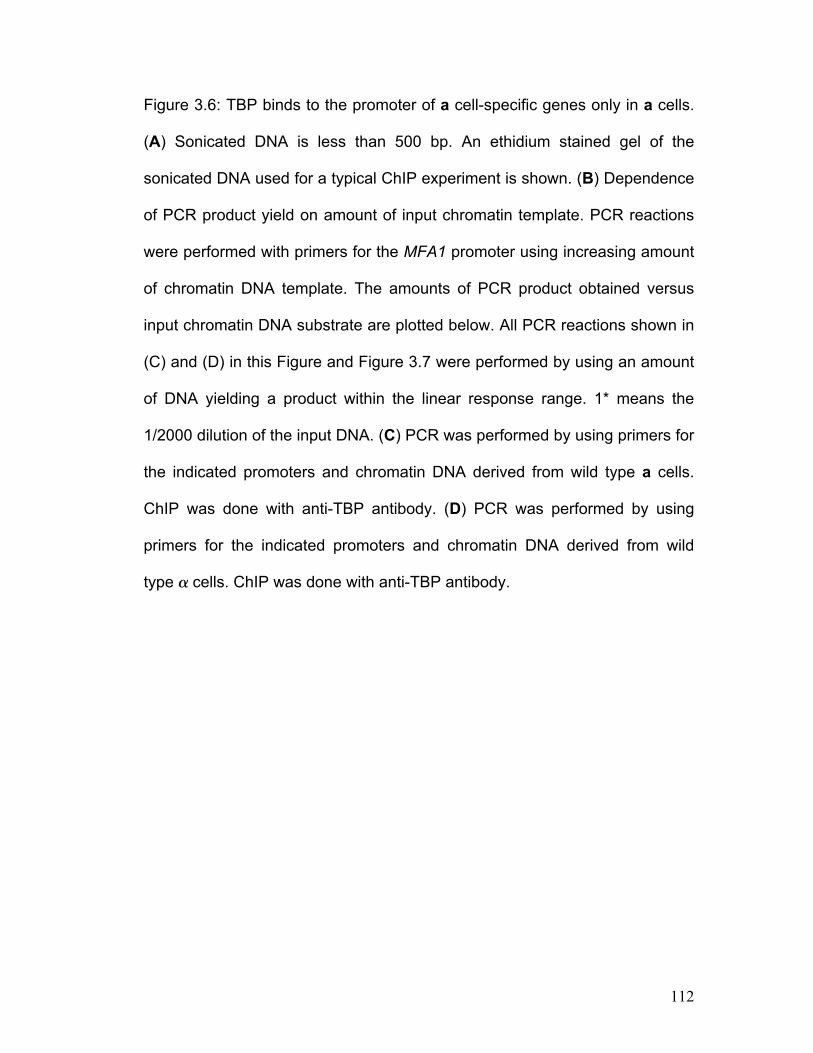
112
Figure 3.6: TBP binds to the promoter of a cell-specific genes only in a cells.
(A) Sonicated DNA is less than 500 bp. An ethidium stained gel of the
sonicated DNA used for a typical ChIP experiment is shown. (B) Dependence
of PCR product yield on amount of input chromatin template. PCR reactions
were performed with primers for the MFA1 promoter using increasing amount
of chromatin DNA template. The amounts of PCR product obtained versus
input chromatin DNA substrate are plotted below. All PCR reactions shown in
(C) and (D) in this Figure and Figure 3.7 were performed by using an amount
of DNA yielding a product within the linear response range. 1* means the
1/2000 dilution of the input DNA. (C) PCR was performed by using primers for
the indicated promoters and chromatin DNA derived from wild type a cells.
ChIP was done with anti-TBP antibody. (D) PCR was performed by using
primers for the indicated promoters and chromatin DNA derived from wild
type cells. ChIP was done with anti-TBP antibody.
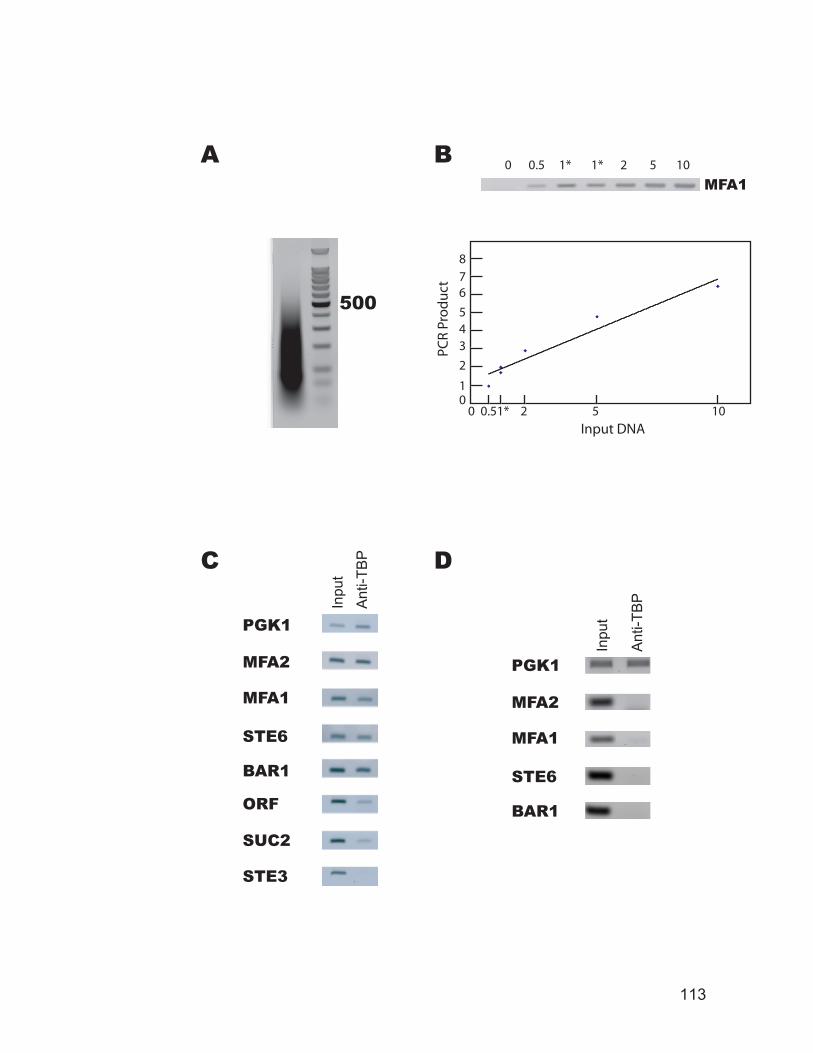
A B
C D
Input DNAPC
R Pr
od
uct
0 0.51* 2 5 10
876
543
2
10
0 0.5 1* 1* 2 5 10
MFA1
Inpu
t
Ant
i-TB
P
MFA2
MFA1
STE6
BAR1
PGK1MFA2
MFA1
STE6
BAR1
PGK1
ORF
SUC2
STE3
Inpu
t
Ant
i-TB
P
113
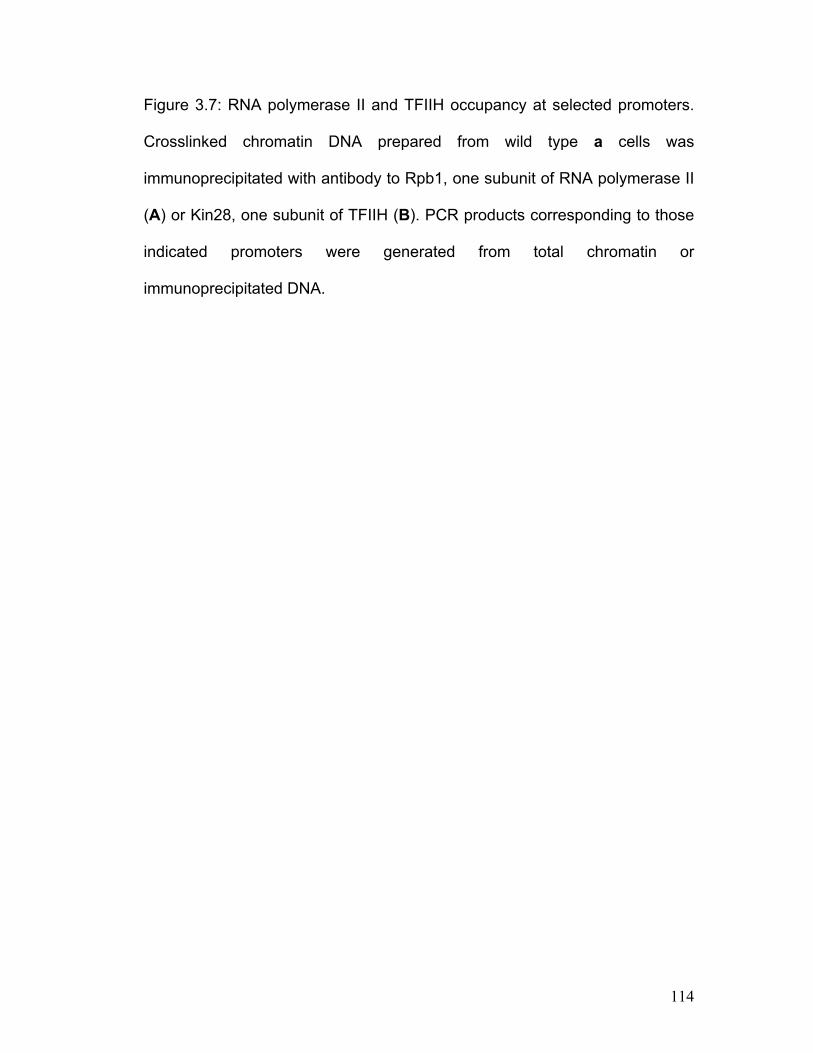
114
Figure 3.7: RNA polymerase II and TFIIH occupancy at selected promoters.
Crosslinked chromatin DNA prepared from wild type a cells was
immunoprecipitated with antibody to Rpb1, one subunit of RNA polymerase II
(A) or Kin28, one subunit of TFIIH (B). PCR products corresponding to those
indicated promoters were generated from total chromatin or
immunoprecipitated DNA.
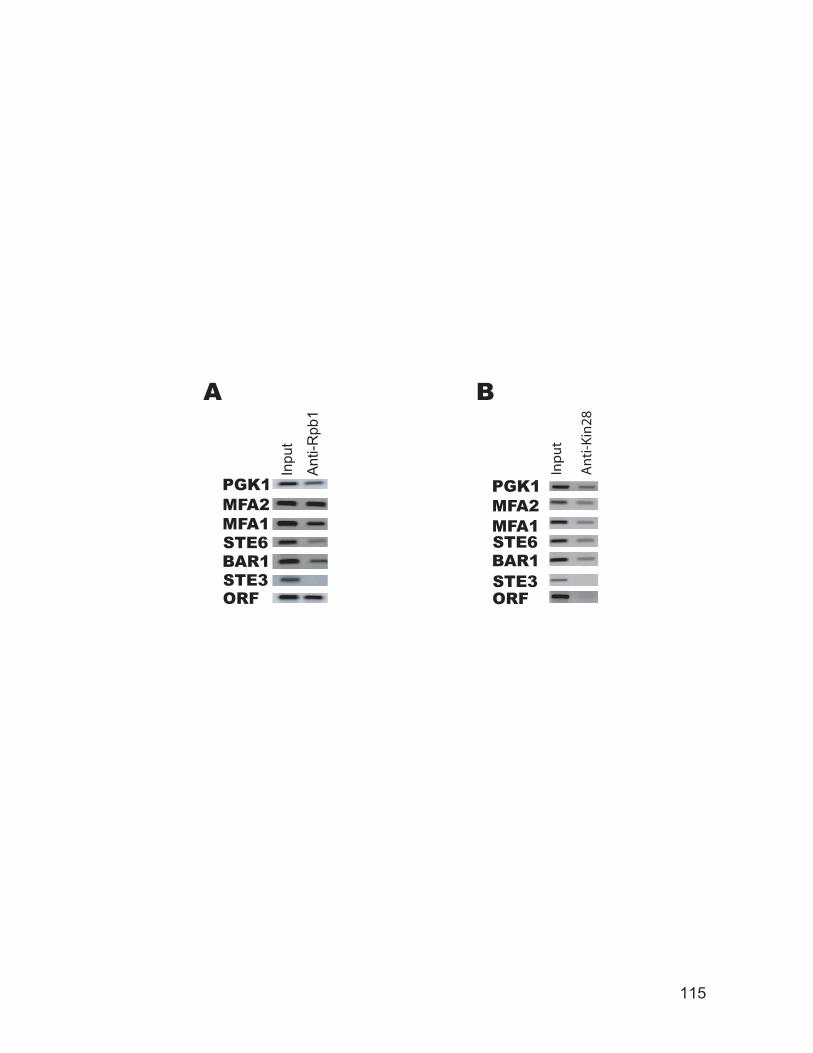
Inp
ut
An
ti-K
in28
BA
Inpu
t
Ant
i-Rpb
1
115
116
Figure 3.8: Summary of the ChIP data. All the numbers are averaged from at
least two independent assays. The transcriptional frequency numbers are
from Young’s database (http://web.wi.mit.edu/young/expression/). *, for each
promoter, the relative occupancy level is indicated in terms of the percent of
the observed occupancy level at the STE6 promoter, which is arbitrarily
defined as 100. ^, for each promoter, the relative occupancy level is indicated
in terms of the percent of the observed occupancy level at the MFA2
promoter, which is arbitrarily defined as 100.
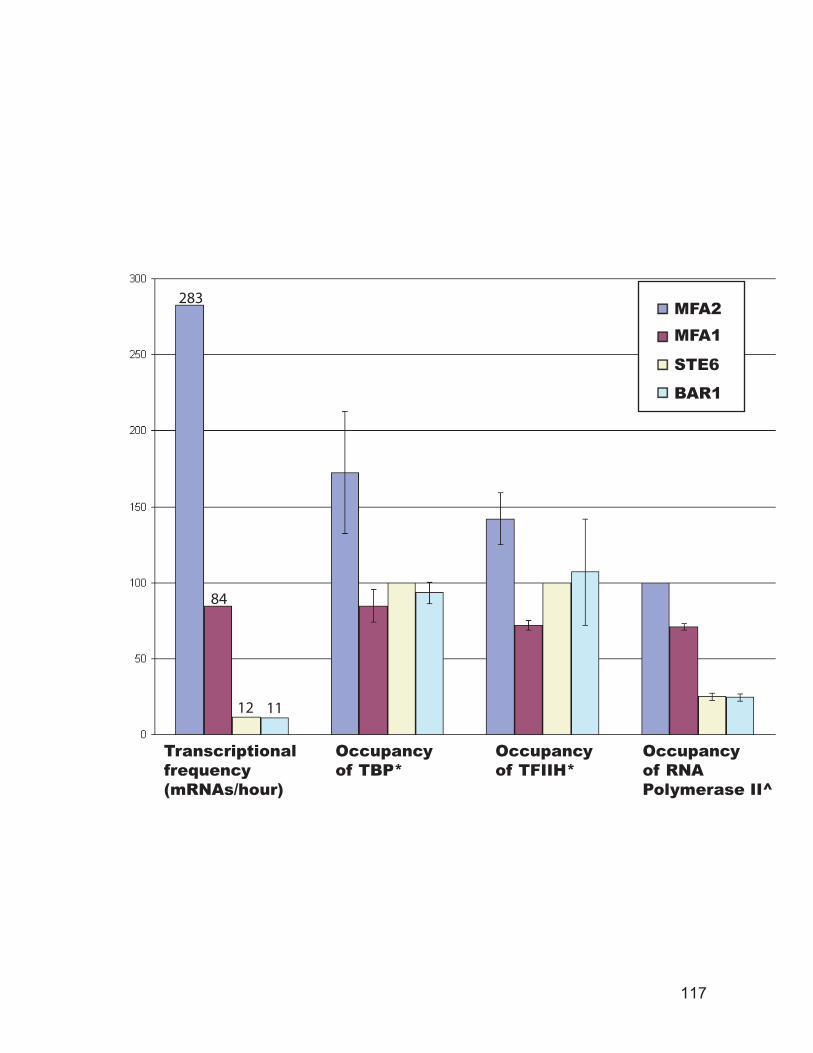
Transcriptionalfrequency(mRNAs/hour)
Occupancyof TBP*
Occupancyof TFIIH*
Occupancyof RNA Polymerase II^
MFA2MFA1
STE6
BAR1
283
84
12 11
117
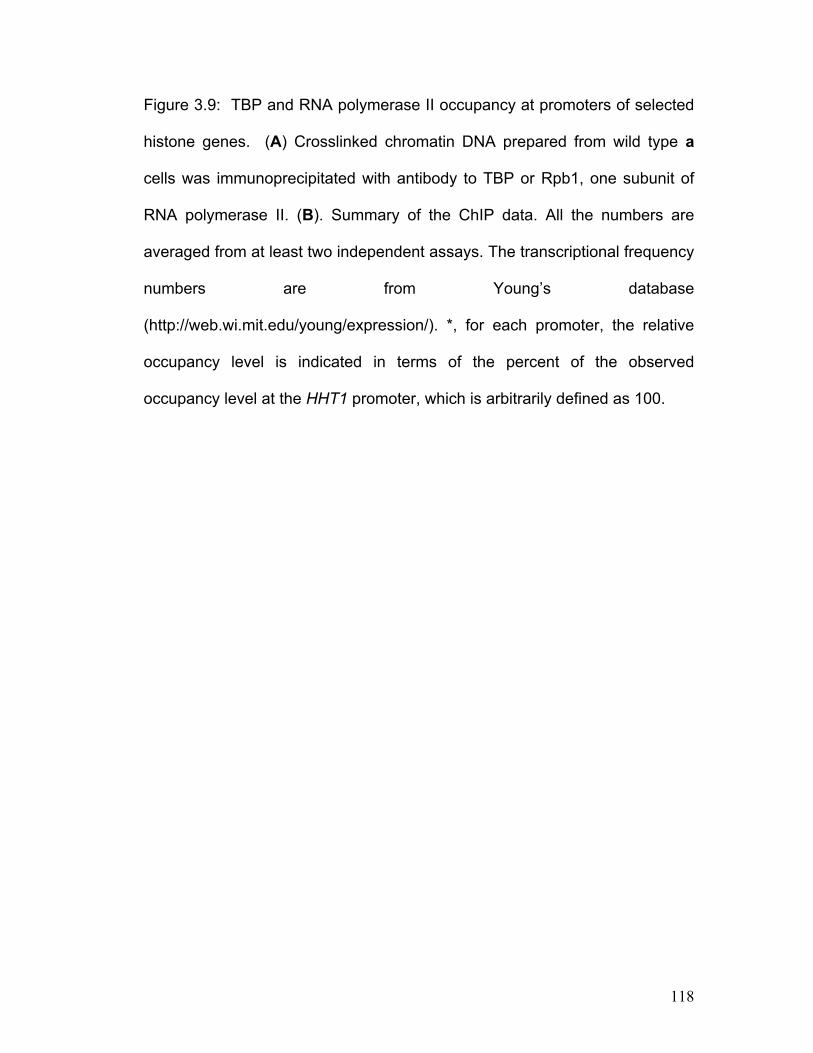
118
Figure 3.9: TBP and RNA polymerase II occupancy at promoters of selected
histone genes. (A) Crosslinked chromatin DNA prepared from wild type a
cells was immunoprecipitated with antibody to TBP or Rpb1, one subunit of
RNA polymerase II. (B). Summary of the ChIP data. All the numbers are
averaged from at least two independent assays. The transcriptional frequency
numbers are from Young’s database
(http://web.wi.mit.edu/young/expression/). *, for each promoter, the relative
occupancy level is indicated in terms of the percent of the observed
occupancy level at the HHT1 promoter, which is arbitrarily defined as 100.
HHT2HHT1
HHF2
HHF1
Transcriptionalfrequency(mRNAs/hour)
Occupancyof TBP*
Occupancyof RNA Polymerase II*
HHT2
HHT1
HHF1
HHF2
Ant
i-TB
P
Ant
i-Rpb
1
Inpu
t
Inpu
t
112
103
65
38
B
A
119
120
Acknowledgements
We thank Drs. S. Hahn and J. Reese for antibodies indicated in Materials
and Methods, C. Graham, J. Diller, F. Pugh, and D. Gilmour for review of the
manuscript, members of the Simpson, Workman and Reese groups for their
criticism and technical advice. This study was supported by grant GM052908
from NIH to R.T.S.
Chapter IV
The role of higher order chromatin structure in repression of the MFA1 gene in cells
122
Abstract
It is generally accepted that packaging DNA into chromatin plays a crucial
role in the constitutive repression of gene transcription in eukaryotic cells. In
Saccharomyces cerevisiae, the repression of the a cell-specific genes is
associated with the organization of a chromatin domain in which an array of
nucleosomes is precisely positioned over the essential promoter elements
and the entire coding region of these genes. In a previous study (Ducker,
2001), the minichromosome affinity purification (MAP) technique has been
improved to allow the isolation of a unique genomic locus as in vivo packaged
chromatin and facilitate the observation of higher-order structure of this locus
under EM. By using this strategy, the images of higher-order chromatin
structure of the STE6 gene have been obtained. These images clearly
showed that when the gene was repressed, the nucleosomes associated with
the gene adopted a highly ordered, compact “hairpin” conformation. Here, we
checked the higher order chromatin structure of the MFA1 gene using the
same strategy. A tightly compact conformation has been observed. Using
western blot and chromatin immunoprecipitation assays, we confirmed that
Tup1p is associated with this repressed region and spreads along the entire
repressed MFA1 locus. Interestingly, we found that Hho1p also binds to this
region, indicating that Hho1p plays a structural role in this region and may
facilitate the bending of the linker DNA between these two positioned
nucleosomes.
123
4.1 Introduction
It has been widely accepted that modulation of chromatin structure has a
pivotal influence on the regulation of gene expression in eukaryotes. The
functional consequence of chromatin packaging, in general, is to restrict
access of DNA to a variety of DNA-binding proteins that regulate gene
activity. Thus, transcription activation is often accompanied by the alteration
of chromatin so that its DNA sequences become more transparent to the
transcriptional apparatus. These local changes of the chromatin structure are
often mediated by ATP-dependent nucleosome-remodeling complexes and
histone tail modifiers, both of which can be brought to DNA by the activators.
On the other hand, different proteins, named repressors, make chromatin
structure less transparent and help repress transcription (Kornberg and Lorch,
1999; Workman and Kingston, 1998a).
Chromatin is composed of repeating units termed nucleosomes (see
Chapter 1). Many in vitro biochemistry studies have shown that the packaging
of promoter DNA into nucleosomes impedes accessibility of general
transcription factors and/or activators to template DNA, whereas prior binding
of these factors to the promoter blocks nucleosome assembly on important
cis-acting DNA elements (Abmayr et al., 1988; Adams and Workman, 1993;
Almouzni et al., 1990; Imbalzano et al., 1994; Svaren and Horz, 1997;
Workman and Kingston, 1992a; Workman and Roeder, 1987a; Workman et
al., 1991). In vivo, nucleosomes exert a similar inhibitory effect upon
124
transcription. For example, in yeast, activation of several previously—
repressed genes was accompanied by nucleosome loss, as a result of turning
off histone synthesis by genetic means (Han and Grunstein, 1988; Han et al.,
1988; Kim et al., 1988). These and other observations have led to the
conclusion that nucleosomes serve as general repressors for transcription,
and that a “kinetic competition” takes place between transcription activators
and general transcription factors and core nucleosomes.
In evaluating repression of gene expression, accumulating observations
suggest a mechanism beyond single nucleosome—based promoter
extinction. For example, numerous studies have found that many silencing
regions do appear to have a highly regular nucleosome array and decreased
acetylation of histone tails (Kornberg and Lorch, 1999; Ravindra et al., 1999;
Weiss and Simpson, 1998). Conversely, many active genes in vertebrates
can reside in large chromosomal domains, characterized by elevated
accessibility to DNase I and increased acetylation of histone tails (Bulger et
al., 2002; Hebbes et al., 1994). Furthermore, recent investigations have
revealed a correlation between transcription activity and phosphorylation of
histone tails, which has been long correlated with chromosome condensation
(Wei et al., 1998). Finally, gene silencing by heterochromatin seems likely to
depend on its higher order chromatin structure (Kornberg and Lorch, 1999).
However, the pattern of coiling a chain of nucleosomes in a thicker fiber
remains uncertain, and, thus, information about the higher order chromatin
125
structure beyond the nucleosome is crucial for understanding chromatin
function.
The current methodology for assaying the chromatin structure relies
mainly on the accessibility of the DNA in chromatin to nucleases or modifying
enzymes in isolated nuclei or in living cells (Simpson, 1998; Simpson, 1999).
However, instead of giving direct information, these techniques provide only a
hint of the three-dimensional (3D) chromatin structures in the nucleus. Among
the few techniques available to investigate the 3D conformation of the nuclear
chromatin architecture, electron microscopy (EM) can produce images which
provide information of not only the spatial relationships among arrays of
nucleosomes but also on the effect of associated proteins on these arrays
(Woodcock and Dimitrov, 2001; Woodcock and Horowitz, 1997; Woodcock
and Horowitz, 1998). Furthermore, in conjunction with biochemical and
biophysical data, EM can provide a way to establish the significance of the 3D
structure of chromatin in the regulation of DNA transcription, repair,
recombination, and replication (Woodcock, 1989). However, in most cases,
EM has only focused on examining overall chromatin structure in situ,
because of the difficulty identifying a particular region of the genome (Van
Holde, 1989).
The MAP methodology (see chapter 1) is the first technique available to
isolate a specific gene, the STE6 gene, as chromatin (Ducker, 2001).
Combining this technology with negative staining, a highly ordered hairpin
conformation has been observed to be associated with the repressed STE6
126
gene (Ducker, 2001). However, it is still uncertain whether such a structure is
unique to the STE6 gene, or whether it can also be observed for other gene
loci.
Here we describe a comprehensive analysis of the chromatin structure of
the MFA1 region in a repressed state. A combination of high-resolution and
low-resolution micrococcal nuclease (MNase) sensitivity mapping studies
clearly demonstrates that in cells, an array of positioned nucleosomes
covers the promoter and extends into the coding sequence. Using MAP and
EM technology, we found that this nucleosome array can form a special
higher order structure in living cells. The possibility of the participation of the
Ssn6-Tup1 complex and Hho1p is also discussed.
127
4.2 Materials and methods
4.2.1 Yeast strains and the minichromosome
The yeast strains YPH499 (MATa ade2-101 ura3-52 his3-200 leu2-1 trp1-
63 lys2-1), YPH500 (MAT ade2-101 ura3-52 his3-200 leu2-1 trp1-63 lys2-1),
and YPH500 ∆TUP1 (MAT ade2-101 ura3-52 his3-200 leu2-1 trp1-63 lys2-1
tup1::ura3) were used in this study.
As shown in figure 4.2, the MFA1-ALT minichromosome was created by
inserting a 914 bp fragment containing the MFA1 coding sequence from -401
to +513 (the start site of the ORF is set as +1) into the ALT minichromosome,
as described previously (Ducker and Simpson, 2000).
4.2.2 Minichromosome affinity purification
The minichromosomes were isolated as described previously (Ducker and
Simpson, 2000). Briefly, yeast cells carrying the minichromosomes were
harvested by centrifugation at an OD600 of 1.0 - 1.5. The cells were treated
with Zymolyase 100T (Seikagaku) and spheroplast formation was determined
microscopically. Washed spheroplasts were gently resuspended in 10 ml of
minichromosome binding buffer (MBB) [20 mM HEPES, pH 8.0; 150 mM
NaCl; 1 mM EDTA; 0.1% Tween20] plus protease inhibitors [1 mM PMSF, 10
ug/ml A-protinin, 2 ug/ml Leupeptin, 2 ug/ml Pepstatin A] and chilled on ice for
15 minutes. The chilled spheroplasts were lysed in a Thomas® glass
homogenizer and Teflon motor driven pestle with approximately 8 strokes.
128
The resulting lysates were held on ice for 2 - 4 hours with occasional agitation
to allow the minichromosomes to be released from the nuclei. The lysates
were then clarified by centrifugation in a Sorvall SS-34 rotor at 40,000 g for 20
minutes, at 4° C. The supernatants were subjected to the lac I-Z affinity
chromatography column prepared as described previously (Ducker and
Simpson, 2000).
Prior to starting the affinity chromatography, 10 ml of MBB was run over
the column at full gravity speed (the bed volume of the chitin beads is 1 ml
and the dimension of the column s 1 cm, so that the flow speed is around 1
ml/minute) to ensure proper buffer equilibration. The yeast supernatants
containing the minichromosomes were mixed in batch with the chitin-lacI-Z
matrix in MBB for 1 hour at 4° C. The columns were then packed by running
the slurry into the columns at full gravity speed. Each column was washed
three times with 10 ml MBB at full gravity speed, and then the
minichromosomes were eluted from the columns in 5 ml of MBB containing
300 mM NaCl and 1 mM IPTG, at full gravity speed. After concentrating, the
minichromosome samples were divided into small aliquots and saved in -
80°C.
For DNA analysis, nucleic acid was purified from samples taken
throughout the isolation by treatment with 100 ug/ml RNase A at 37° C for 2
hour, followed by 50 ug/ml proteinase K at 50° C for 30 minutes. The DNA
samples were phenol:chloroform extracted two times and ethanol
precipitated.
129
For protein analysis, portions of the denatured minichromosome samples
were directly loaded onto SDS-PAGE gel.
For electron microscopy analysis, the isolated minichromosomes were
centrifuged in a 15-40% sucrose gradient containing 10 mM HEPES, pH 8.0;
50 mM NaCl; 0.2 mM EDTA at 4° C for 14 hours at 30,000 RPM in an
SW41Ti rotor. Peak fractions from the gradient were dialyzed into the same
buffer (without the sucrose) and imaged.
4.2.3 Western blot
Protein samples were electrophoresed on 10% SDS-polyacrylamide gels
followed by electrotransfer to Hybond ECL membranes (Amersham Life
Sciences, Inc.). The membranes were incubated in phosphate buffered
saline plus 0.1% Tween20 (PBST) containing 5% powdered milk (w/v) on a
shaking platform at room temperature for 1 hour. The membranes were
washed 3 times in PBST for 10 minutes each at room temperature.
Membranes were then incubated with anti-Tup1p antibodies (provided by J.
Reese) or anti-hho1p antibodies (provided by H. Patterton) in PBST on a
shaking platform for 1 to 2 hours at room temperature. The membranes were
washed 3 times in PBST for 10 minutes each at room temperature. Anti-
rabbit antibodies conjugated to horseradish peroxidase (Amersham Life
Sciences, Inc.) were then incubated with the membranes in PBST on a
shaking platform for 1 hour at room temperature. The blots were washed 3
times in PBST for 10 minutes each at room temperature. Blots were
130
developed with PICO super signal western development reagents (Pierce
Biotechnology Inc.) and exposed to Fuji XAR film.
4.2.4 Electron microscopy (EM)
Methods for sample preparation including fixing, grid adhesion and
staining can be found in Woodcock and Horowitz (1998).
4.2.5 Nuclei and DNA preparation and analysis
Nuclei preparation was carried out essentially as described by Weiss and
Simpson (Weiss and Simpson, 1997). Briefly, yeast from a 1-liter culture
grown to an optical density of about 1.0 at 600nm was harvested and digested
with Zymolyase 100T (Seikagaku). Nuclei were purified by differential
centrifugation and resuspended in digestion buffer (10mM HEPES, pH 7.5;
0.5mM MgCl2; 0.05mM CaCl2) and incubated with 0, 2, and 4 units/ml MNase
(Worthington) for 10 minutes at 37 °C. The digestions were terminated by the
addition of EDTA, and the DNA was purified by RNase A and proteinase K
digestion and phenol/chloroform extraction. The DNA pellet was resuspended
in 0.1XTE buffer.
For low-resolution mapping of nucleosomes by indirect end labeling, the
purified DNA was subjected to a secondary digestion by EcoR I. DNA was
then electrophoresed in 1.4% agarose gels in 1×TAE buffer, and transferred
to Hybond-NX membrane (Amersham) and crosslinked with UV light. The
specific DNA sequences were detected by hybridizing with a random-primer
131
labeled probe directed toward the end of the EcoR I site. For high-resolution
mapping, multiple rounds of Taq DNA polymerase-based primer extension
was carried out from a 32P-end-labeled primer, and the products were then
resolved on a 6% polyacrylamide (19:1), 50% urea gel. Images were captured
on a PhosphorImager screen. The image was then scanned and analyzed
with Image Quant v.5.0 software (Molecular Dynamics).
4.2.6 Chromatin immunoprecipitation (ChIP)
Chromatin-containing extracts were prepared as previously described
(Hecht and Grunstein, 1999) with minor modifications. Extracts were prepared
from 200-ml cultures at a density of about 1.0 at 600nm. Cells were fixed in
3% formaldehyde and were disrupted with glass beads and transferred to a
15 ml centrifuge tube (the final volume was adjusted to 2 ml). The chromatin-
containing extract was sonicated to yield an average DNA size of 300 bp (the
majority of the fragments were approximately 300 bp long, but a small
percentage of the fragments were as small as 50 bp or as large as 500 bp).
Sonication conditions were 40% output, 90% duty cycle, fifteen 12-second
cycles with a Branson Sonifier 450. The chromatin size was confirmed for
each input sample by running 10% of the DNA on a 2% agarose gel. The
sonicated extract was subsequently clarified by centrifugation.
The antibodies used in the immunoprecipitation step were: polyclonal
antibody against Tup1p (provided by J. Reese), and polyclonal antibody
against Hho1p (provided by H. Patterton) (Patterton et al., 1998).
132
4.2.7 Quantitative PCR
All primers were designed to be 19- to 25-mers, with a Tm of approximately
60°C. Primer sequences are shown in Appendix. The PCR conditions were as
follows: 94°C for 30 seconds, 55°C for 30 seconds, and 72°C for 1 minute for
28 cycles. A 5-minute 94°C step prior to the cycles and a 5-minute 72°C
extension following completion of the cycles were added. Several dilutions of
each sample were used for PCR. For the input DNA, the initial dilution series
was from 1/4,000 to 1/100; for the immunoprecipitated DNA, the initial dilution
series was from 1/20 to 1/5. Only one titration of input and
immunoprecipitated DNA was shown in the figures to conserve space. The
PCR products were detected by UV illumination of an ethidium bromide
stained 2% agarose gel and analyzed with Image Quant v.5.0 software
(Molecular Dynamics).
133
4.3 Results
4.3.1 Nucleosomes are positioned over the regions required for MFA1
expression in cells
Yeast exists in two haploid cell types, a and (Herskowitz, 1989). Seven
genes, termed a cell-specific genes, are specifically expressed only in the a
mating type yeast cells (Zhong et al., 1999). In cells, MAT2p cooperates
with Mcm1p to repress these a cell type-specific genes through binding to the
2 operator, a 32 base-pairs (bp) long DNA sequence, which is located about
200 bp upstream from the start site of the open reading frame (ORF) of these
genes. The binding of MAT2p and Mcm1p to the 2 operator establishes an
organized chromatin domain with a well-defined nucleosomal array. This
chromatin domain begins ~15 bp downstream of the 2 operator, extends
through the coding region, and ends abruptly 30 to 70 bp downstream of the
termination codon of the genes, thus forming a discrete domain (Ganter et
al., 1993; Roth et al., 1992; Simpson et al., 1993; Teng et al., 2001).
However, the mechanism of its termination remains uncertain.
In contrast, this highly organized chromatin appears to be disrupted in a
cells, suggesting that it is required for, or a result of, repression of these
genes in cells. This idea was further supported by the observation that in
cells, mutations of the N-terminal tail of histone H4 resulted in both the
disruption of chromatin and derepression of the a cell-specific genes (Roth et
al., 1992).
134
The MFA1 gene, one of the a cell-specific genes, encodes one of the a
mating factors in a cells and is repressed in cells. The open reading frame
of this gene is only 111 bp long. In cells, both low resolution and high
resolution mapping of micrococcal nuclease cutting sites showed two 140-150
bp protected regions. Both regions are protected from micrococcal nuclease
digestion and are flanked by nuclease-hypersensitive sites (Figure 3.1 and
Figure 4.1). These results indicate that there are two precisely positioned
nucleosomes abutting the 2 operator (Figure 3.1, 4.1, and Y.Tsukagoshi and
R.T.Simpson, unpublished data). One is positioned over the promoter region,
with the TATA box lying at the center of this nucleosome; the other extends
into the coding sequence and ends ~35 bp downstream of the termination
codon of the MFA1 gene. The length of the linker DNA between these two
nucleosomes is ~40 bp long (Figure 4.1). In a cells, these two nucleosomes
are imprecisely located, as expected (Figure 3.1 and Y.Tsukagoshi and
R.T.Simpson, unpublished data).
4.3.2 The MFA1-ALT minichromosome
To observe the higher order chromatin structure of the repressed MFA1
locus and to analyze non-histone proteins associating with MFA1, we created
a minichromosome, termed MFA1-ALT minichromosome. The
minichromosome is composed of the ALT backbone (Ducker and Simpson,
2000) and a 914 bp fragment containing the MFA1 coding sequence and
flanking DNA inserted into HSR B (Figure 4.2). In order to ensure the
135
inclusion of all regulatory elements, the "MFA1 insert" in the MFA1-ALT
minichromosome is comprised of extensive sequences both upstream (401
bp) and downstream (402 bp) of the coding region of the gene.
Quantitive analyses revealed that 40-60% of the 2371 bp MFA1-ALT
minichromosome was released from the nuclei. Of the material loaded onto
the Lac I-Z affinity column, more than 90% was retained and more than 90%
of the minichromosomes were recovered in the eluate fraction (data not
shown).
Functional and structural characterization of the MFA1-ALT
minichromosome revealed that the MFA1 gene fragment in the MFA1-ALT
minichromosome contains all of the necessary regulatory sequences for the
proper repression of this gene and for the organization of the characteristic
chromatin structure observed in the genomic copy of this gene. First,
northern analysis of mRNA isolated from strains carrying the MFA1-ALT
minichromosome showed that the construct was transcribed in a cells and
greatly repressed in cells (data not shown). Therefore, MFA1 on the
minichromosome seems to behave in the same way as the genomic copy of
the gene does. Second, primer extension mapping of micrococcal nuclease
digests of MFA1-ALT minichromosome in nuclei isolated from -cells showed
two precisely-positioned nucleosomes abutting the 2 operator (Figure 4.3),
identical to the genomic locus (Figure 4.1). Finally, the copy number of this
minichromosome is determined to be 25 copies per cell (data not shown).
These results indicate (1) the minichromosome copy of the MFA1 gene
136
accurately reflected the features of the genomic copy of this gene; and (2) the
proteins necessary for repression and organization of the chromatin structure,
such as Mat2p, Mcm1p, Tup1p, and Ssn6p, are not limiting, under these
conditions (Ducker and Simpson, 2000).
4.3.3 EM images of the MFA1-ALT minichromosome isolated from
cells
There exists considerable evidence suggesting that repression of the a-
cell specific genes in Saccharomyces cerevisiae is associated with the
organization of a chromatin domain in which nucleosomes are precisely
positioned over essential promoter elements and over the entire coding
region of the gene (Cooper et al., 1994; Ducker and Simpson, 2000; Ganter
et al., 1993; Patterton and Simpson, 1994; Roth et al., 1992; Shimizu et al.,
1991; Simpson et al., 1993). However, it remains unclear whether (and how)
these nucleosomes interact with each other and form higher order structure.
In a recent seminal work (Ducker, 2001), affinity-purified minichromosomes
were employed to investigate the 3D chromatin architecture of STE6 gene in
both transcriptionally active and repressed states. The results of this work
showed that the minichromosomes isolated from a cells appeared as a
“beads on a string” motif of evenly spaced nucleosomes. In contrast,
minichromosomes isolated from cells had a region in which the 10 nm fiber
is interrupted by a more compact conformation of nucleosomes. In many
cases, this compact region of the minichromosome adopted a doubled-over
137
or hairpin structure. Based on these observations, we concluded that these
positioned nucleosomes form special hairpin-like higher-order chromatin
structures in the repressed STE6 locus.
To provide further insight into this issue, by collaborating with Dr. Chris
Woodcock, we isolated the MFA1-ALT minichromosome from cells and
observed its chromatin structure under EM. By doing positive staining, a
higher density region which is different from the backbone of the
minichromosome was observed for many of the isolated MFA1-ALT
minichromosomes (data not shown). Under negative staining conditions, a
compact structure was again observed, which appeared to contain two tightly
associated nucleosomes (Figure 4.4). When considered together with the
SALT10 images we obtained previously (Ducker, 2001), we concluded that
the structure is a “tip of the hairpin without a stem.”
4.3.4 Multiple copies of Tup1p associate with the repressed MFA1 locus
in vivo
Another advantage of the MAP methodology is that it facilitates the
characterization of non-histone proteins associated with certain gene loci. The
best example of such application is the investigation of the role of Tup1p in
the repression of the STE6 gene, in the aforementioned work (Ducker, 2001;
Ducker and Simpson, 2000).
As one of the best investigated co-repressors so far, Tup1p can form a
tetramer by itself or by forming a complex with Ssn6p (see chapter 1 for
138
review). It can repress genes by three mechanisms which are not mutually
exclusive(Smith and Johnson, 2000): (1) by blocking the activator; (2) by
interfering with the general transcription factors; and (3) by forming a
repressive chromatin structure by interacting with histone tails. The third
hypothesis was supported by several observations. First, the repression
domain of Tup1p has been demonstrated to interact directly with the N-
terminal tails of histone H3 and H4 (Edmondson et al., 1996). Second, Tup1p
is essential for the maintaining the deacetylation status of histone tails, which
plays an important role in repression (Ducker, 2001; Edmondson et al., 1998;
Watson et al., 2000). Third, TUP1 deletion induces a disorganization of the
chromatin of several repressed loci (Cooper et al., 1994; Gavin et al., 2000;
Gavin and Simpson, 1997; Weiss and Simpson, 1997).
As mentioned above, an investigation performed in our lab has shown that
MAP can provide a powerful tool to investigate how Tup1p plays a role in
gene repression. In this work, several yeast minichromosomes containing
varying lengths of the STE6 gene including flanking control regions were
constructed. Tup1p was found to bind to these minichromosomes in cells
(Ducker and Simpson, 2000). Furthermore, these observations revealed that
Tup1p associated with the repressed STE6 gene at a level stoichiometric with
nucleosomes, or, more quantitively, at a ratio of 2-2.4 molecules of Tup1p per
nucleosome. Further, this work showed that Tup1p did not bind to the
minichromosome backbone (the ALT), or to the minichromosome containing
STE6 in a cells (Ducker and Simpson, 2000).
139
Here, we used the same strategy to conduct a Tup1p stoichiometry
analysis along the repressed MFA1 locus. Figure 4.5A shows that Tup1p
does bind to the MFA1-ALT minichromosome isolated from cells (lane 5).
Notably, the Tup1p antibody used in this study detects the Tup1p signal from
a crude whole cell extract from wild type yeast cells (lane 1), but not from the
tup1 deletion cells (lane 2). Furthermore, the western signal for the
recombinant Tup1p expressed from E. coli is proportional to the amount of
the proteins loaded onto the gel (Figure5A, lanes 3 and 4; Figure 4.5B, lanes
2 to 6).
As shown in Figure 4.5B, a representative isolated MFA1-ALT
minichromosome sample and a graded set of standards generated with
recombinant Tup1p expressed in E. coli were loaded on 10% SDS-PAGE gel,
transferred to an ECL membrane, and subjected to western blot analysis.
Densitometry of the blot (Figure 4.5C) shows a ratio of ~7.7 Tup1p molecules
per MFA1-ALT minichromosome isolated from cells. Statistical analysis of
two replicates of this experiment shows 7.71.3 copies of Tup1p per MFA1-
ALT minichromosome. These results strongly support the hypothesis that
there are two Tup1p tetramers associating with the repressed MFA1 locus in
vivo.
4.3.5 Chromatin structure of the MFA1 locus in a tup1 mutant strain
Next, we analyzed the requirement for Tup1p in the establishment of the
chromatin structure of the repressed MFA1 locus. The chromatin structure of
140
the MFA1 locus in a tup1 mutant stain (Weiss and Simpson, 1997) was
mapped using MNase. In the absence of Tup1p, the highly organized
chromatin structure of the MFA1 locus, with an array of two nucleosomes, in
wild type cells disappeared (Figure. 4.6A). Notably, the MNase digestion
patterns outside the MFA1 locus are identical between wild type and mutant
strains (Figure 4.6A).
Furthermore, we showed that deletion of the TUP1 gene resulted in
derepression of the MFA1 gene (Figure 4.6B). Thus, like other a cell-specific
genes (Cooper et al., 1994; Roth et al., 1992; Simpson et al., 1993),
repression of MFA1 requires Tup1p. This is also true for a and strains
(Figure 3.1).
4.3.6 Tup1p spreads over the entire MFA1 chromatin domain
To further test if Tup1p associates with the regulatory region and the
coding region of the genomic copy of the MFA1 gene, chromatin
immunoprecipitation (ChIP) was performed (see chapter 3 for the details of
this approach). Tup1p antibodies were used to immunoprecipitate
formaldehyde-cross-linked, sonicated chromatin from wild type a and cells.
After reversal of the crosslinks, the precipitated DNA was visualized by
quantitive PCR (Figure 4.7). Each PCR-amplified fragment is around 200 bp
long and was identified based on the position of the center of each fragment
relative to the start site of the ORF of the MFA1 gene. Figure 4.7C shows the
MFA1 fragments amplified from a cell immunoprecipitated material.
Comparing this signal to the input for this cell type shows uniform background
141
amplification from the immunoprecipitated material. Figure 4.7A shows the
MFA1 fragments amplified from the cell immunoprecipitated material. By
comparing the signal from a cells to cells, it is clear that all the fragments
between the 2 operator and the 3' end of the MFA1 gene are preferitially
precipitated from cells, indicating that Tup1p spreads along the entire
chromatin domain of the gene. No PCR product is obtained from the IP DNA
when primers outside the MFA1 gene (-0.50, and +0.55) are used. These
results show that Tup1p spreads unidirectionally from the 2 operator to the
3' end of the gene, corresponding exactly to the direction and scope of
positioned nucleosomes in the MFA1 chromatin domain (Figure 4.1 and
Y.Tsukagoshi and R.T.Simpson, unpublished data).
A control for amplification from both cell types is also shown in Figure 4.7.
The SUC2 gene, a sucrose catabolism gene, is repressed by Tup1p in the
presence of glucose (Gavin and Simpson, 1997). It should be repressed in
both cell types in this experiment, and therefore should be associated with
Tup1p in both cell types. As expected, the ChIP data shows roughly equal
amplification from the SUC2 locus immunoprecipitated with Tup1p antibodies
from both a and cells.
4.3.7 Hho1p binds to the repressed MFA1 locus in cells
Another possible candidate protein to hold the compact chromatin
structure together is Hho1p, the putative linker histone in yeast (Freidkin and
Katcoff, 2001; Landsman, 1996; Patterton et al., 1998; Ushinsky et al., 1997;
142
Zlatanova, 1997). Like the linker histones in other species, Hho1p may be
primarily a structural protein and contribute to folding of the nucleosome
filament into the next higher level of structure in special loci.
To test this idea, we first did a Western blot to check if Hho1p binds to the
MFA1-ALT minichromosome. As shown in Figure 8A, Hho1p was detected in
the MAP-isolated MFA1-ALT minichromosome sample, but not in the ALT
minichromosome sample. This indicates that Hho1p binds to the MFA1 locus
specifically.
Next we confirmed this conclusion by doing a ChIP assay. In cells,
Hho1p was found to bind to the MFA1 locus, But not to the PGK1 locus
(Figure 8B). In contrast, no Hho1p signal was detected on the MFA1 locus in
a cells (Figure 8C). As a control, Hho1p was found to bind to the rDNA
repeating sequences, which is consistent with a previous report (Freidkin and
Katcoff, 2001).
As shown in Figure 8D and 8E, Hho1p formed crosslinks in cell, with
highest efficiency to the region (-300 bp to +200) where the nucleosomes are
positioned. No crosslink was observed at sequences upstream of the 2
operator, or downstream the termination site of the MFA1 codon. These
results indicate that Hho1p binds to the repressed MFA1 region and may play
a role in the establishment of the highly organized chromatin structure.
143
4.4 Discussion
In Saccharomyces cerevisiae, transcriptionally inert regions of DNA form
silenced domains. Mapping studies showed that arrays of precisely-
positioned nucleosomes are associated with these domains (Ravindra et al.,
1999; Simpson et al., 1993; Weiss and Simpson, 1997; Weiss and Simpson,
1998).
The size of these silenced domains varies. A silenced domain can be very
large and may contain many genes. Some examples include telomeres and
silenced mating type loci (Ravindra et al., 1999; Simpson et al., 1993; Weiss
and Simpson, 1997; Weiss and Simpson, 1998). On the other hand, a
silenced domain can be formed at the single-gene level. For example, a
repressed domain can be formed along one of the a cell-specific gene loci in
cells (Cooper et al., 1994; Ducker and Simpson, 2000; Ganter et al., 1993;
Patterton and Simpson, 1994; Roth et al., 1992; Shimizu et al., 1991;
Simpson et al., 1993). These domains contain a well-organized nucleosomal
array, which begins at the promoter, extends into the coding sequence, and
ends just 30-70 bp downstream of the termination codon, without affecting
either upstream or downstream regions (Simpson et al., 1993). However,
whether and how these nucleosomes interact with each other remains
unclear.
To address the correlation between higher order chromatin structure and
gene repression, the MAP method has been developed to isolate a unique
144
gene locus as in vivo packed chromatin (Ducker and Simpson, 2000). By
looking at the higher-order chromatin structure of MAP-isolated
minichromosomes, a previous study (Ducker, 2001) in our lab found that the
repressed STE6 gene has a compact, “hairpin” like conformation. This
structure contains two stacks of nucleosomes side by side. In this study, we
reported the higher-order chromatin structure of the repressed MFA1 locus
under EM. Measurements of the structure in Figure 4.9 show that it is 10 nm
wide and 20 nm long (Figure. 4.9). There is enough room to fit two
nucleosomes side by side. These studies clearly show that in cells, the
nucleosomes associated with these a cell-specific genes adopt a highly
ordered conformation, which is different from surrounding regions.
What forces then, would hold this structure together so tightly? We prefer
the view that the Ssn6p/Tup1p complex bridges, or strengthens, the
interactions among Mat2p, histones, and possibly, other proteins, based on
the following characteristics. First, Tup1p and Ssn6p have been shown to
bind directly to Mat2p (Smith and Johnson, 2000), the N-terminal tails of
histone H3 and H4 (Edmondson et al., 1996; Huang et al., 1997), and histone
deacetylases (HDACs) (Davie et al., 2002; Edmondson et al., 1998; Watson
et al., 2000), in vitro and/or in vivo. Second, Tup1p can form a repressive
chromatin structure by being artificially recruited (Tzamarias and Struhl,
1994). Third, a TUP1 deletion leads to derepression of a cell-specific genes
and disruption of the well organized chromatin structure (this study;(Cooper et
al., 1994; Gavin et al., 2000). Fourth, by itself or in association with Ssn6p,
145
Tup1p can form a tetramer (Smith and Johnson, 2000; Varanasi et al., 1996),
providing the advantage of being a connecter. Fifth, the number of Tup1p
molecules interacting with repressed a cell-specific gene regions is
approximately proportional to the positioned nucleosomes (this study and
(Ducker, 2001), indicating that Tup1p is spreading along the entire chromatin
domains. Finally, Tup1p was observed under EM to be present in the cavity of
the “hairpin” structure of the STE6 domain (Ducker, 2001).
In this study, we also assessed the stoichiometry of Tup1p with the
nucleosomes of the repressed MFA1 gene. The results showed that Tup1p is
associated with the MFA1 nucleosomes in a ration of (2N+4):N, where N is
the number of nucleosomes along this region. This is consistent with our
previous STE6 data. The extra Tup1p tetramer may contact the Mat2p dimer
and bridge the interaction between Mat2p and histones (Figure 4.9).
Interestingly, our data strongly indicate that Hho1p plays a structural role
in the MFA1 locus. The structural role of linker histone has been described in
other species (Shen et al., 1995; Widom, 1998). Whether or not Hho1p is the
linker histone in yeast has been an elusive problem for many years
(Landsman, 1996; Patterton et al., 1998; Ushinsky et al., 1997). Linker
histones in other species have a central globular region and long N- and C-
terminal basic tails. However, Hho1p has two globular domains, connected by
a 42 amino acid long, lysine-rich domain. Hho1p also has N- and C-terminal
basic tails, but the tails are shorter (Landsman, 1996). Here we confirmed by
doing a western blot that Hho1p binds to the repressed MFA1 (Figure 4.8A).
146
Moreover, ChIP assays show that Hho1p distribution is limited to the
repressed chromatin region (Figure 4.8D and 4.8E). The binding of Hho1p
would help to decide the sequence whereby the repressed a cell-specific
gene domains are bent in half. Notably, all the a cell-specific genes have an
even number of positioned nucleosomes associated with them when they are
repressed. Also, the linker DNA between the two nucleosomes where the
bend occurs has a unique micrococcal nuclease cutting pattern that differs
from other linkers in the rest of the repressed domain (Figure 4.1 and
Y.Tsukagoshi and R.T.Simpson, unpublished data). This strongly implies that
there are some proteins binding on the linker regions of these domains.
These two globular regions might be just what are needed to bind two
nucleosomes at the “bend” site or the end of the hairpin, with the linker
between them being determined by steric considerations and the length of
peptide available between the two globular domains. In this regard, the
globular region of mammalian H1 is thought to bind DNA at the entry/exit
points from its path around the histone octamer in the nucleosomal core
particle. Future studies will focus on the presence of Hho1p on these regions
and the details of its structural role (see chapter V).
In summary, we have presented a model for the chromatin structure of the
repressed MFA1 locus as follows (Figure 4.9). The Mat2p/Mcm1p hetero-
tetramer initiates the binding of Ssn6-Tup1 complex to this region. The Ssn6-
Tup1 complex further recruits HDACs and positions the nucleosomes by
interacting with the hypo-acetylated N-terminal tails of histone H3 and H4
147
(Bone and Roth, 2001; Watson et al., 2000). The recruitment of HDACs also
ensures a more folded status of the chromatin (Annunziato and Hansen,
2000). Moreover, the binding of Hho1p ensures the proper bending of the
linker DNA region and makes the compact chromatin structure more stable. It
is possible that Hho1p does stabilize the end of the compact chromatin
structure but Tup1p crosslinking of the terminal nucleosomes positions
relative to each other suffices for the overall organization of the repressed
domain.
This model provides a plausible explanation of how the a cell-specific
genes can be repressed efficiently in cells. Because of the extremely rapid
dynamics of histone acetylation and deacetylation, in which a reversal of
targeted acetylation occurs within 1.5 min (Katan-Khaykovich and Struhl,
2002), as well as the high average histone acetylation level in yeast
(Waterborg, 2000), constant maintenance of histone deacetylation in
chromatin is likely to be a critical requirement for transcription repression. The
sequestration of the tails and recruitment of HDACs by Ssn6-Tup1 complex,
in addition to the compact conformation, would prevent any modification of
these tails that could lead to derepression of the gene. Furthermore, these
results provide insight into the mechanism of how tissue-specific genes are
regulated in higher organisms.
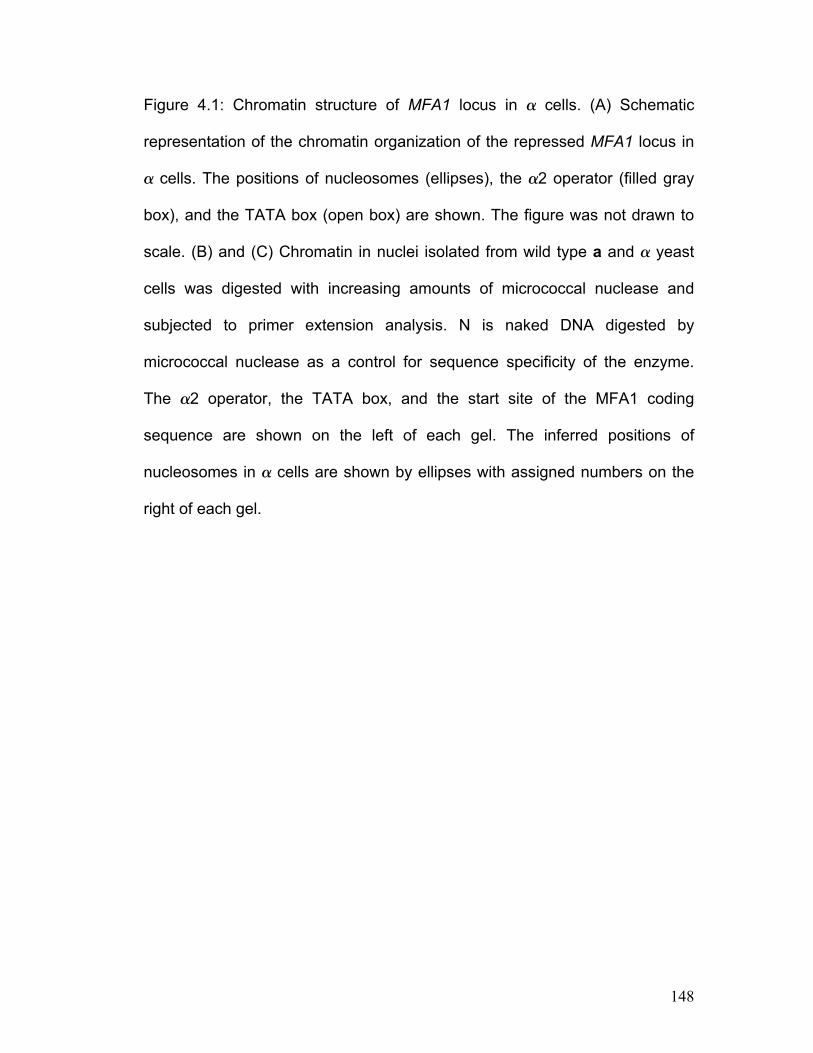
148
Figure 4.1: Chromatin structure of MFA1 locus in cells. (A) Schematic
representation of the chromatin organization of the repressed MFA1 locus in
cells. The positions of nucleosomes (ellipses), the 2 operator (filled gray
box), and the TATA box (open box) are shown. The figure was not drawn to
scale. (B) and (C) Chromatin in nuclei isolated from wild type a and yeast
cells was digested with increasing amounts of micrococcal nuclease and
subjected to primer extension analysis. N is naked DNA digested by
micrococcal nuclease as a control for sequence specificity of the enzyme.
The 2 operator, the TATA box, and the start site of the MFA1 coding
sequence are shown on the left of each gel. The inferred positions of
nucleosomes in cells are shown by ellipses with assigned numbers on the
right of each gel.
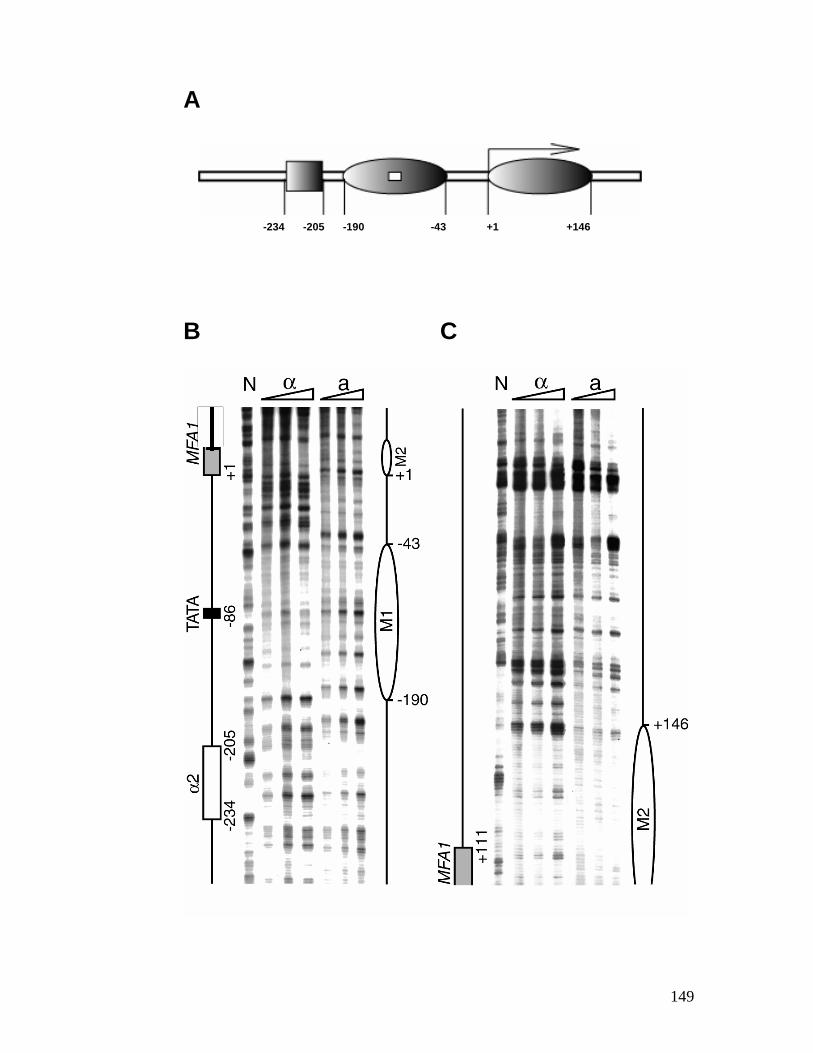
-43 +1 +146-234 -205 -190
A
B C
149
150
Figure 4.2: Minichromosome construct. In the center is the unaltered
TRP1/ARS1 minichromosome, showing the positions of the nucleosomes and
nuclease-hypersensitive sites. The arrow represents the direction of
transcription of the TRP1 gene. In the expanded box at the bottom is a blow-
up of the ARS region of the minichromosome showing the placement of the
lac operator. Bases in bold are those shared between the B2 element and the
lac operator. Expanded at the top is the MFA1 insert for the minichromosome
used in this study. The fragment was cloned into HSR B at the EcoRI site.
Indicated are the 2 operator and the translation start site of MFA1 gene.
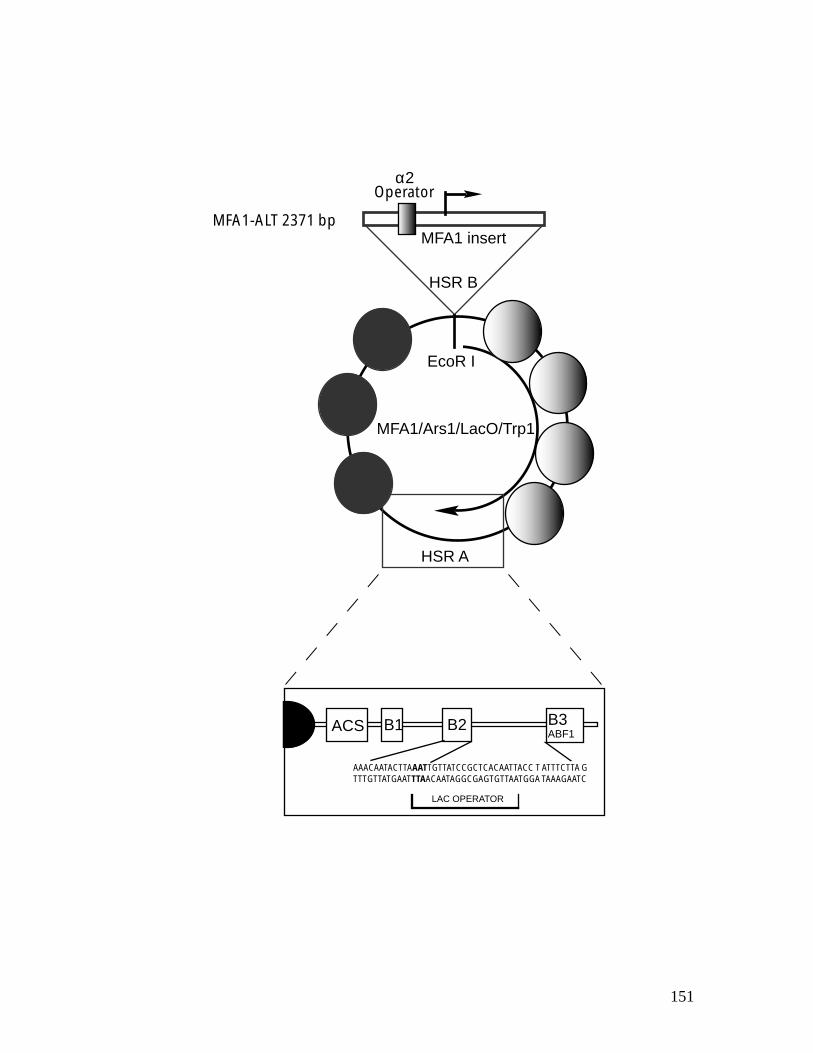
151
AAACAATACTTAAATTGTTATCCGCTCACAATTACC T ATTTCTTA GTTTGTTATGAATTTAACAATAGGCGAGTGTTAATGGA TAAAGAATC
LAC OPERATOR
MFA1-ALT 2371 bp
Operatorα2
MFA1 insert
HSR B
EcoR I
MFA1/Ars1/LacO/Trp1
HSR A
ACS B1 B2 B3ABF1
152
Figure 4.3: Primer extension mapping of the chromatin structure of the MFA1-
ALT minichromosome. The cleavage patterns were obtained by MNase
digestion of MFA1-ALT minichromosome chromatin, MAP isolated from a and
cells. Lanes 1, 2, and 3 are DNA from nuclei isolated from cells carrying
the MFA1-ALT minichromosome and digested with three concentrations of
MNase. Lanes 4, 5, and 6 are DNA from nuclei isolated from a cells carrying
the MFA1-ALT minichromosome and digested with three concentrations of
MNase. Lane 7 (0) is the undigested control. Lane 8 (D) exhibits the protein-
free DNA digested with MNase in vitro. M is the marker DNA fragments
corresponding to 726, 713, 553, 500, 427, 413, 311, 249, 200, 151, and 140
nucleotides from HinfI digest of X174 RF DNA. The 2 operator consensus
sequence is shown by a filled gray box, and the ellipses correspond to
inferred positions of nucleosomes in cells. Numbers on the left side
correspond to their distance from the A residue of the initiation codon for the
MFA1 gene.
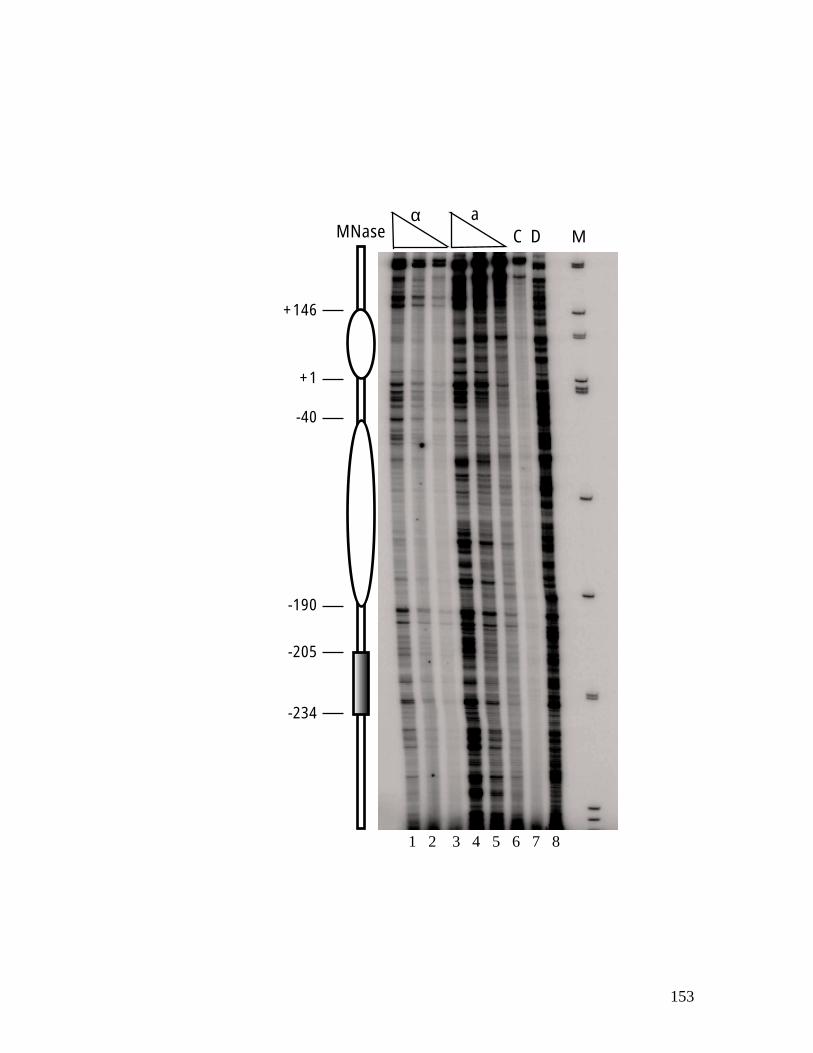
153
C D MMNaseaα
+146
+1
-40
-190
-205
-234
1 2 3 4 5 6 7 8
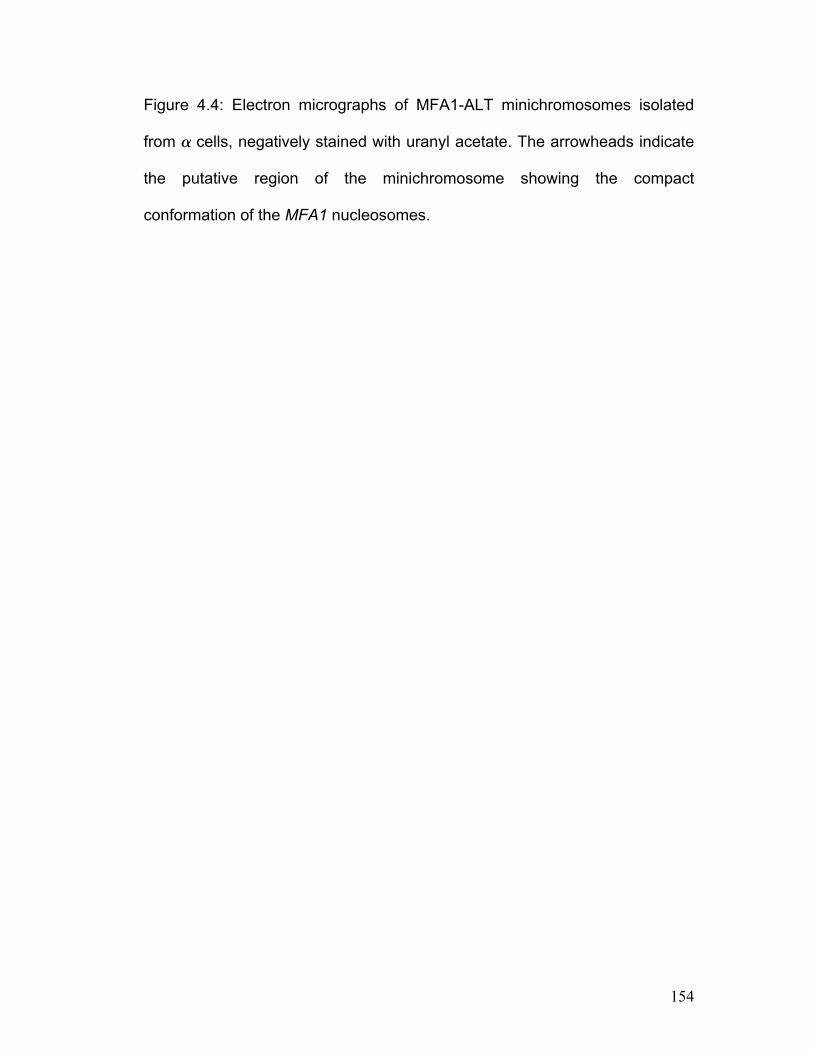
154
Figure 4.4: Electron micrographs of MFA1-ALT minichromosomes isolated
from cells, negatively stained with uranyl acetate. The arrowheads indicate
the putative region of the minichromosome showing the compact
conformation of the MFA1 nucleosomes.
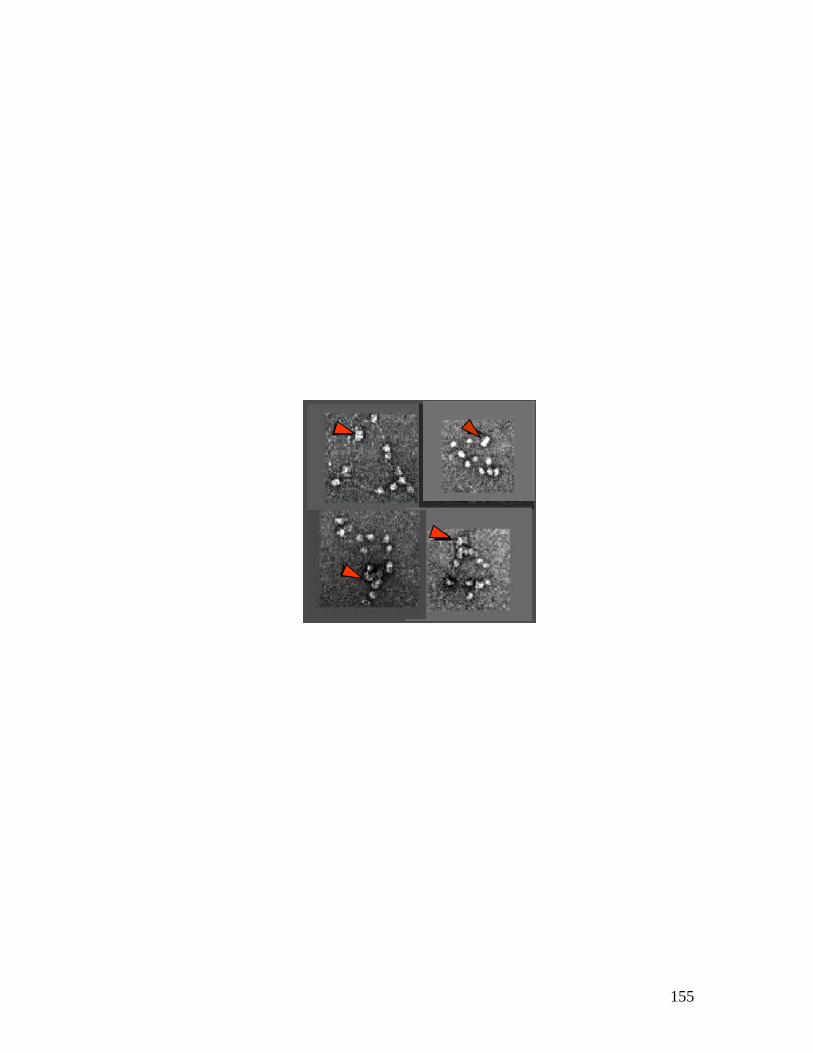
155
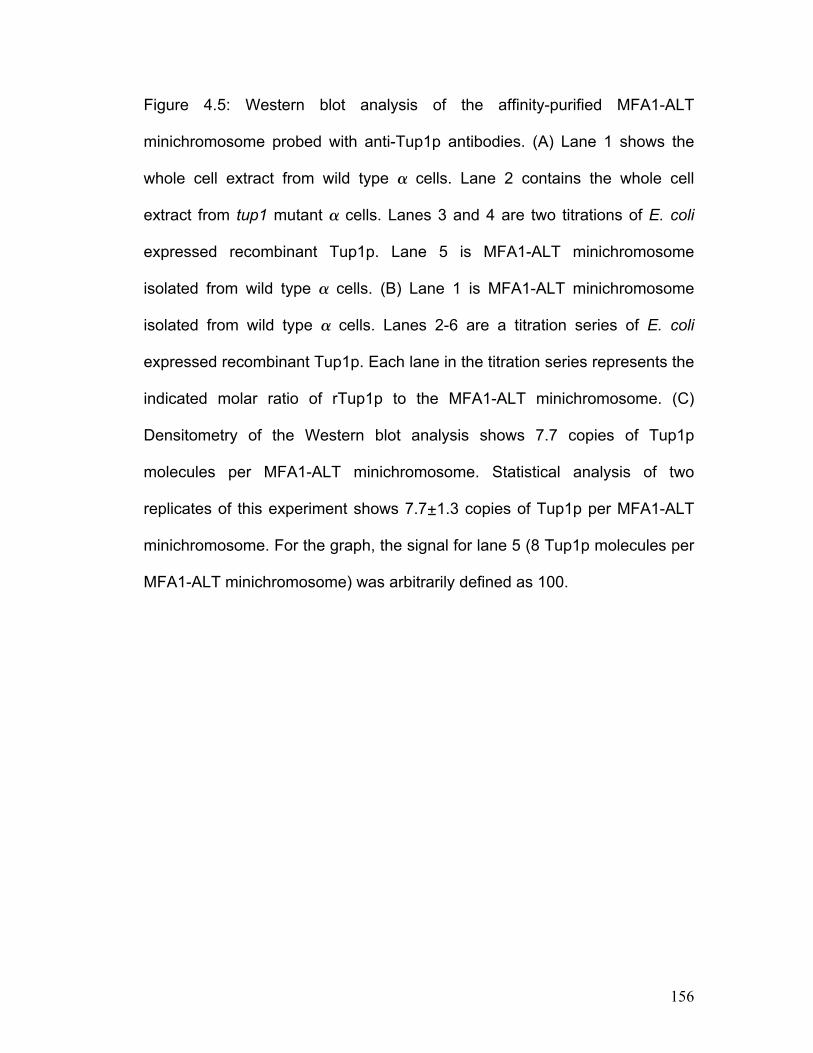
156
Figure 4.5: Western blot analysis of the affinity-purified MFA1-ALT
minichromosome probed with anti-Tup1p antibodies. (A) Lane 1 shows the
whole cell extract from wild type cells. Lane 2 contains the whole cell
extract from tup1 mutant cells. Lanes 3 and 4 are two titrations of E. coli
expressed recombinant Tup1p. Lane 5 is MFA1-ALT minichromosome
isolated from wild type cells. (B) Lane 1 is MFA1-ALT minichromosome
isolated from wild type cells. Lanes 2-6 are a titration series of E. coli
expressed recombinant Tup1p. Each lane in the titration series represents the
indicated molar ratio of rTup1p to the MFA1-ALT minichromosome. (C)
Densitometry of the Western blot analysis shows 7.7 copies of Tup1p
molecules per MFA1-ALT minichromosome. Statistical analysis of two
replicates of this experiment shows 7.71.3 copies of Tup1p per MFA1-ALT
minichromosome. For the graph, the signal for lane 5 (8 Tup1p molecules per
MFA1-ALT minichromosome) was arbitrarily defined as 100.
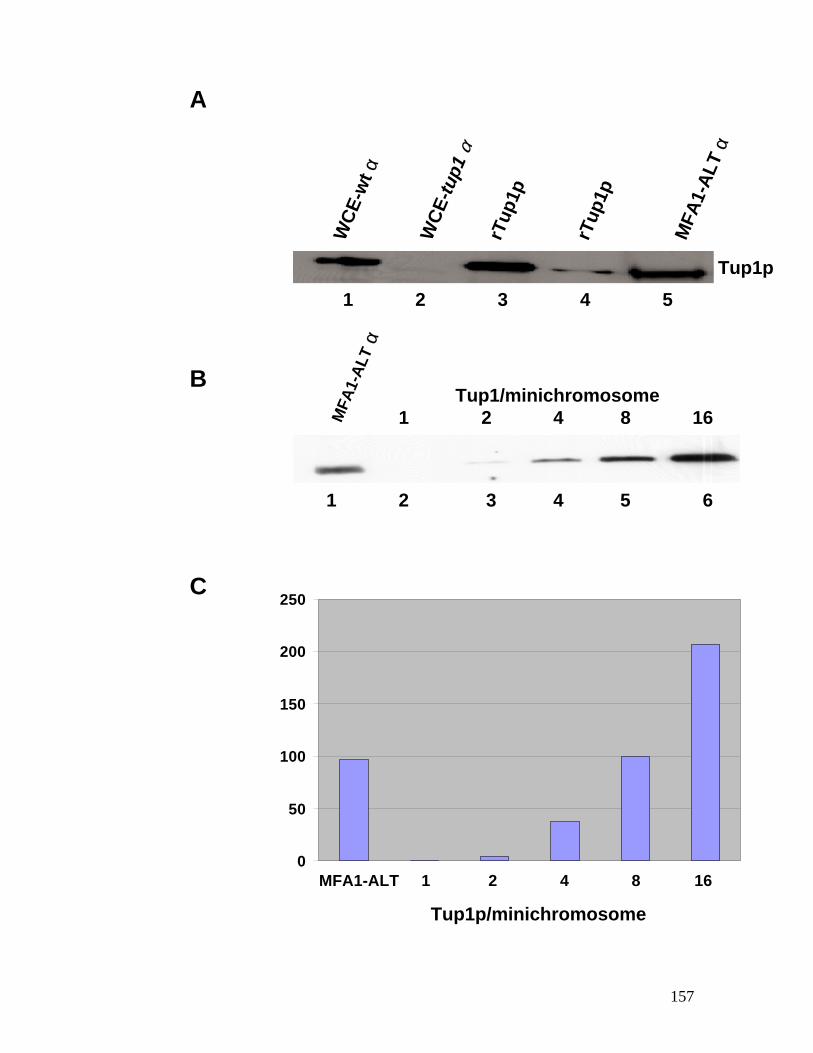
157
1 2 3 4 5 6
Tup1/minichromosome1 2 4 8 16
MFA1-ALT 1 2 4 8 16
Tup1p/minichromosome
WCE
-wt α
WCE
-tup1
α
rTup
1p
MFA
1-AL
T α
rTup
1p
Tup1p
A
B
C
1 2 3 4 5
0
50
100
150
200
250
MFA
1-AL
Tα
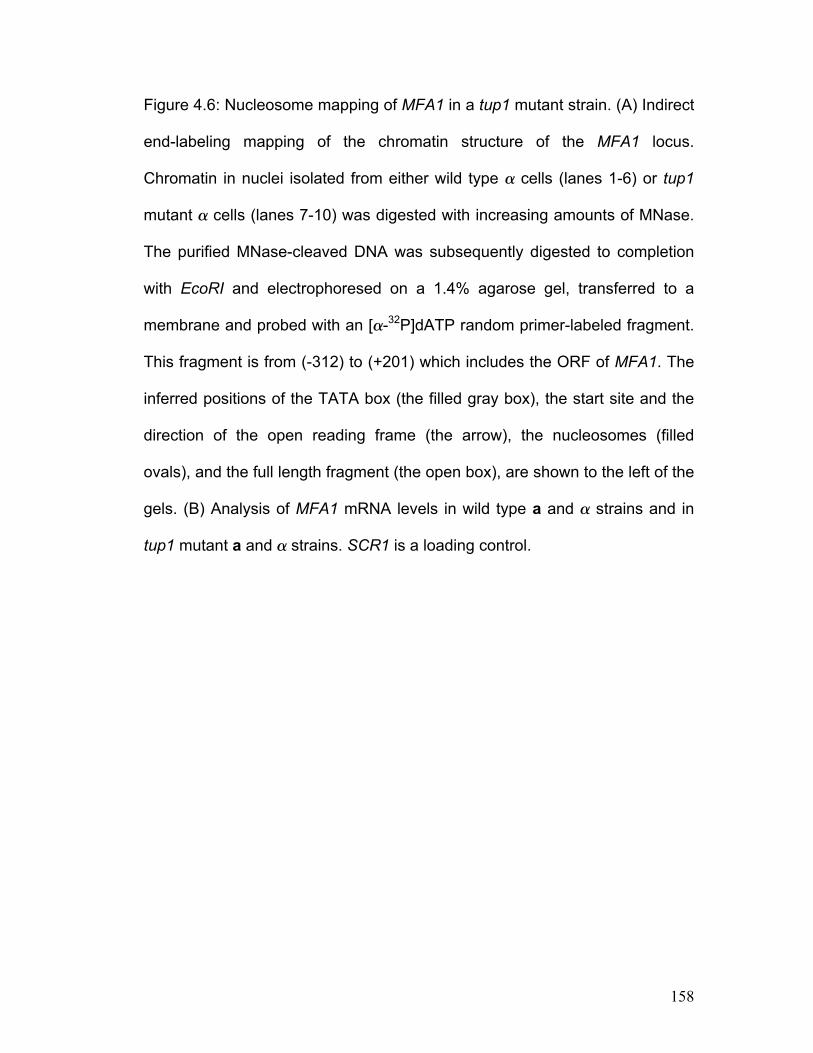
158
Figure 4.6: Nucleosome mapping of MFA1 in a tup1 mutant strain. (A) Indirect
end-labeling mapping of the chromatin structure of the MFA1 locus.
Chromatin in nuclei isolated from either wild type cells (lanes 1-6) or tup1
mutant cells (lanes 7-10) was digested with increasing amounts of MNase.
The purified MNase-cleaved DNA was subsequently digested to completion
with EcoRI and electrophoresed on a 1.4% agarose gel, transferred to a
membrane and probed with an [-32P]dATP random primer-labeled fragment.
This fragment is from (-312) to (+201) which includes the ORF of MFA1. The
inferred positions of the TATA box (the filled gray box), the start site and the
direction of the open reading frame (the arrow), the nucleosomes (filled
ovals), and the full length fragment (the open box), are shown to the left of the
gels. (B) Analysis of MFA1 mRNA levels in wild type a and strains and in
tup1 mutant a and strains. SCR1 is a loading control.
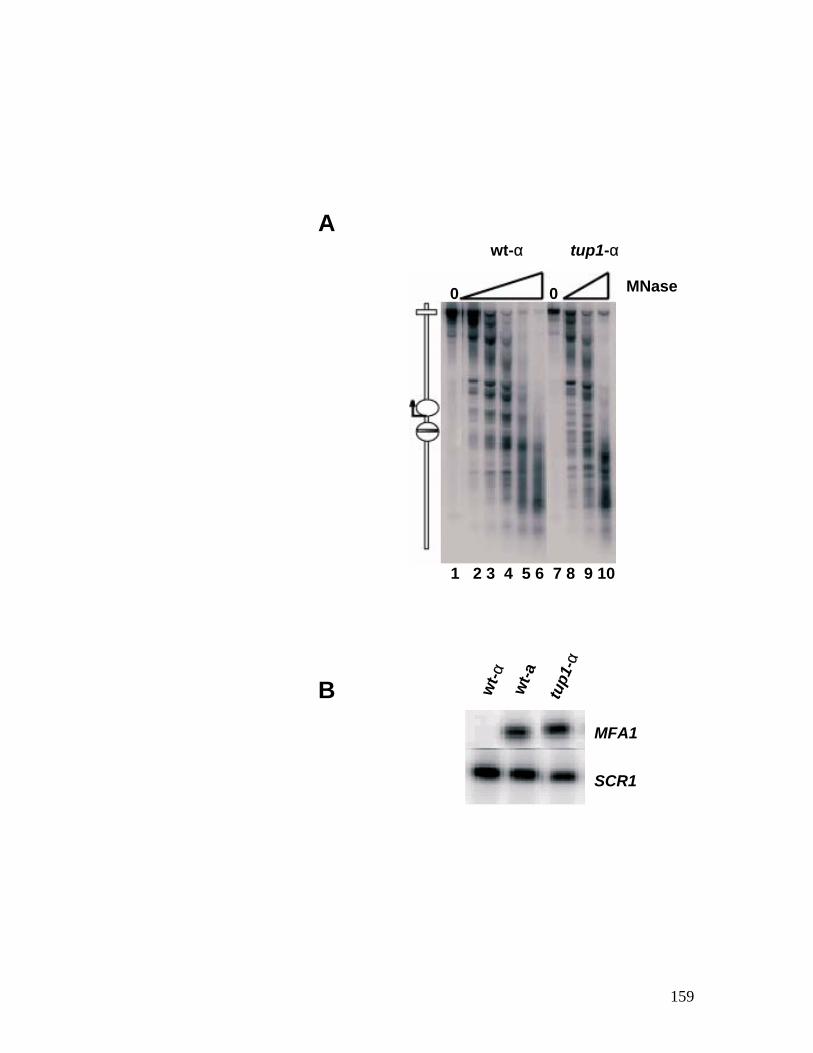
159
wt-α tup1-α
0 0 MNase
1 2 3 4 5 6 7 8 9 10
wt-α wt-a
tup1
-α
MFA1
SCR1
A
B
160
Figure 4.7: Chromatin immunoprecipitation assay for Tup1p binding.
Sonicated chromatin was prepared from formaldehyde-fixed wild type (A)
and a (C) cells. Immunoprecipitations were carried out using polyclonal
antibodies to Tup1p. The location of the PCR primer sets is given in kilobases
with the starting ATG as a reference (0.0 kb). As a control, a fragment of the
UAS of the SUC2 gene was also amplified. All PCR primer sets were
designed to generate ~200 bp products. The 2 operator spans positions
from -234 to -205. The bar graphs of the densitometry represent the signals
from cells (B) and a cells (D). For the graph, four independent experiments
were averaged and the error bars are shown. Quantitative PCR products from
one representative experiment are shown in (A) for cells and (C) for a cells.
The Tup1p occupancy for the -0.20 kb fragment from cells was arbitrarily
defined as 100. The signals of cells and a cells are normalized based on
the signals of the SUC2 fragment from these two cell types.
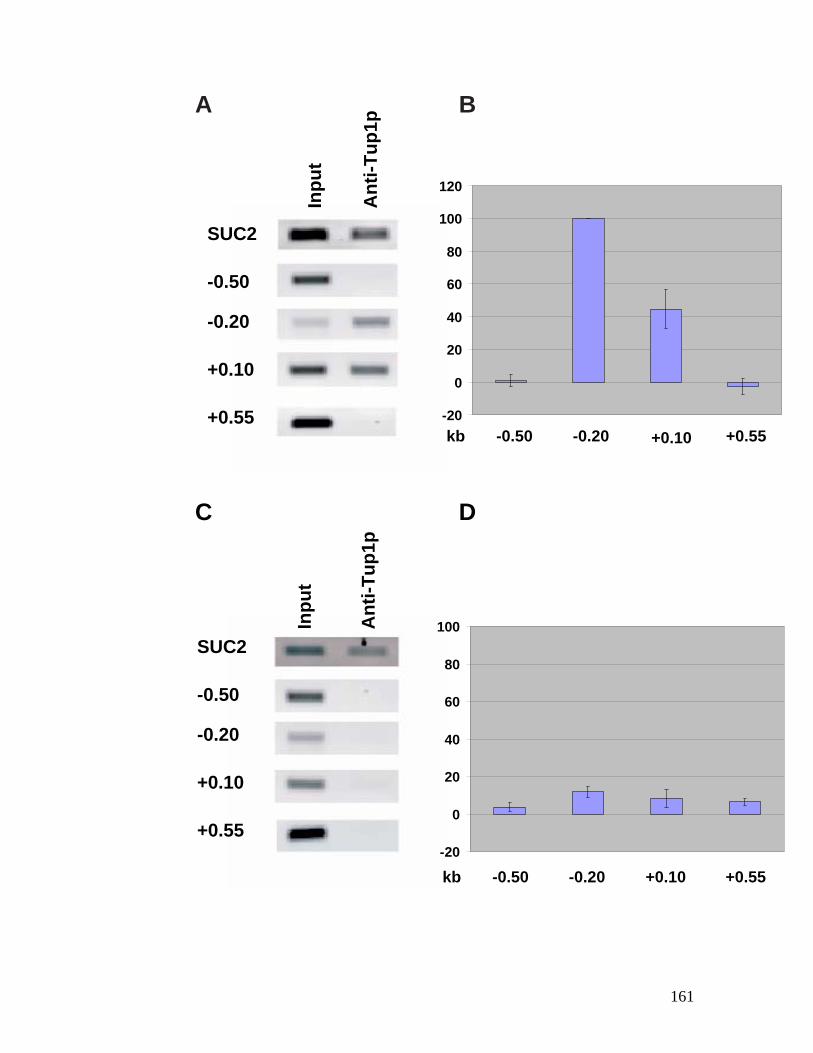
161
SUC2
-0.50
-0.20
+0.10
+0.55
Inpu
t
Ant
i-Tup
1p
SUC2
-0.50
-0.20
+0.10
+0.55
Inpu
t
Ant
i-Tup
1p
C D
-20
0
20
40
60
80
100
kb -0.50 -0.20 +0.10 +0.55
kb -0.50 -0.20 +0.10 +0.55-20
0
20
40
60
80
100
120
A B
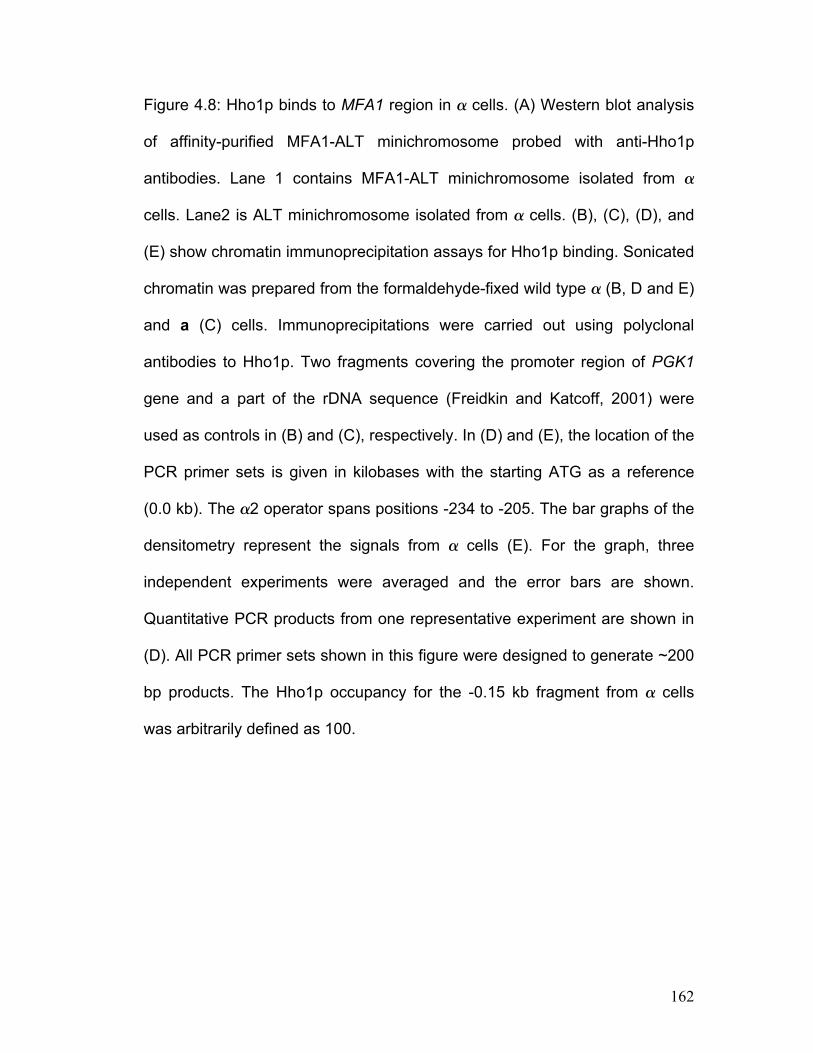
162
Figure 4.8: Hho1p binds to MFA1 region in cells. (A) Western blot analysis
of affinity-purified MFA1-ALT minichromosome probed with anti-Hho1p
antibodies. Lane 1 contains MFA1-ALT minichromosome isolated from
cells. Lane2 is ALT minichromosome isolated from cells. (B), (C), (D), and
(E) show chromatin immunoprecipitation assays for Hho1p binding. Sonicated
chromatin was prepared from the formaldehyde-fixed wild type (B, D and E)
and a (C) cells. Immunoprecipitations were carried out using polyclonal
antibodies to Hho1p. Two fragments covering the promoter region of PGK1
gene and a part of the rDNA sequence (Freidkin and Katcoff, 2001) were
used as controls in (B) and (C), respectively. In (D) and (E), the location of the
PCR primer sets is given in kilobases with the starting ATG as a reference
(0.0 kb). The 2 operator spans positions -234 to -205. The bar graphs of the
densitometry represent the signals from cells (E). For the graph, three
independent experiments were averaged and the error bars are shown.
Quantitative PCR products from one representative experiment are shown in
(D). All PCR primer sets shown in this figure were designed to generate ~200
bp products. The Hho1p occupancy for the -0.15 kb fragment from cells
was arbitrarily defined as 100.
163
Inpu
t
Ant
i-hho
1p
PGK1MFA1
B
-0.50
Inpu
t
Ant
i-hho
1p
-0.15
+0.10
+0.55
DIn
put
Ant
i-hho
1p
rDNAMFA1
C
0
20
40
60
80
100
120
140
160
kb: -0.50 -0.15 +0.10 +0.55
E
MFA
1-A
LT
ALT
Hho1p
A
1 2
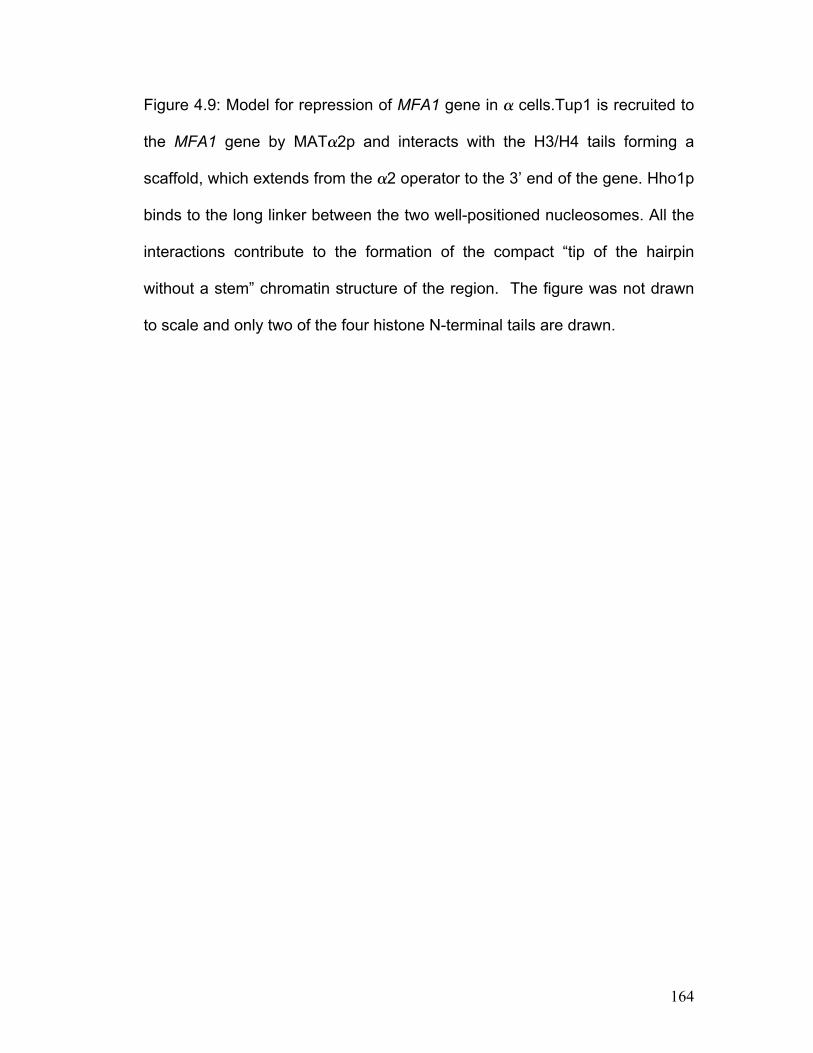
164
Figure 4.9: Model for repression of MFA1 gene in cells.Tup1 is recruited to
the MFA1 gene by MAT2p and interacts with the H3/H4 tails forming a
scaffold, which extends from the 2 operator to the 3’ end of the gene. Hho1p
binds to the long linker between the two well-positioned nucleosomes. All the
interactions contribute to the formation of the compact “tip of the hairpin
without a stem” chromatin structure of the region. The figure was not drawn
to scale and only two of the four histone N-terminal tails are drawn.
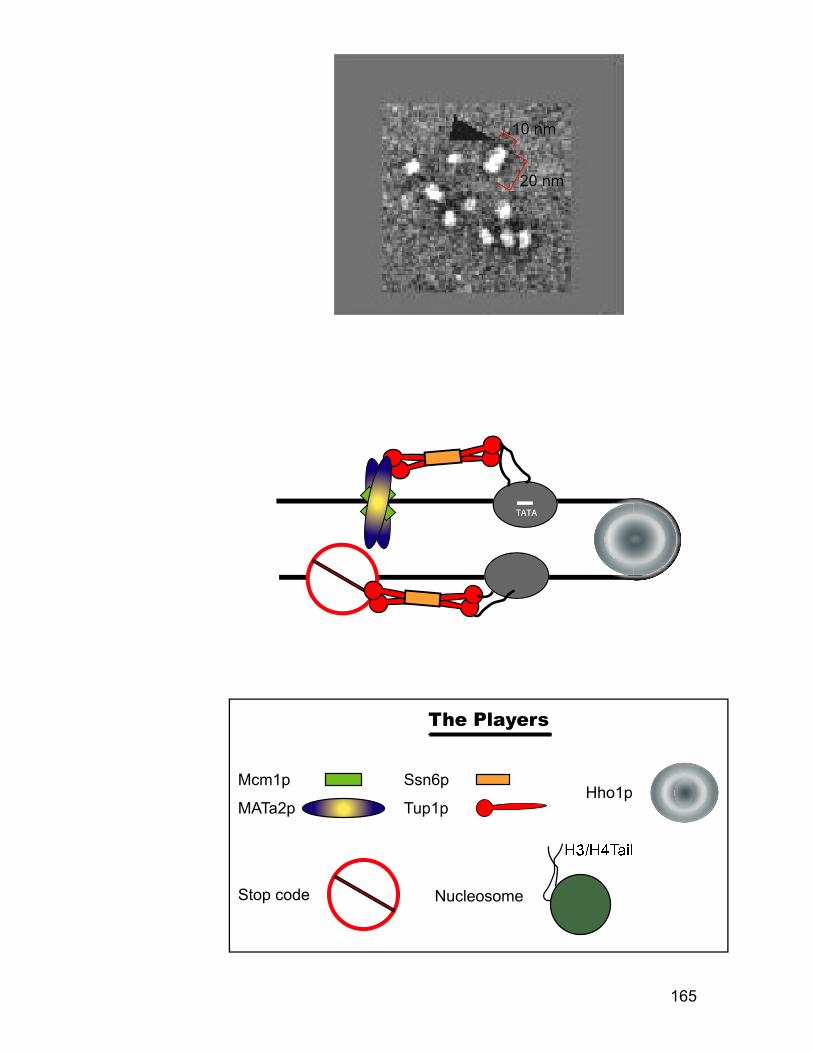
166
Acknowledgements
Yuko Tsukagoshi performed the primer extension mapping experiments
shown in figure 4.1. We thank Dr. Chris Woodcock for EM work, Joe Reese
and Hugh Patterton for antibodies, Christopher J. Graham for reading the
manuscript, Charles E. Ducker and John D. Diller for technique help. We
thank members of the labs of Drs. Robert Simpson, Jerry Workman, Joe
Reese, and Song Tan for many valuable discussions. This work is supported
by a grant from NIGMS to RTS.

Chapter V
Speculation on future studies and aims
168
5.1 Improvement of in vivo DNase I mapping
We have shown that in vivo DNase I mapping is a promising tool to
investigate chromatin structure (chapter II) and the interaction between DNA
and non-histone proteins (chapter II and III) in living yeast cells. However,
some technical problems still exist. First, the digestion level is too low for
indirect end labeling to check cutting patterns. Thus, the primer extension is
obligatory. Current protocol requires induction time of at least 4-6 hours.
Second, prior to galactose induction of nuclease expression, yeast cells need
to grow in medium containing lactic acid as a carbon source, to relieve the
repression from dextrose. In this medium, yeast cells grow very slowly (the
double time is ~ 31 hours!).
To address these problems and increase the sensitivity of this strategy,
we and our collaborator (Dr. Mike Kladde, Texas A&M University) will employ
the following strategies. It was realized that the extremely low quantities of the
Gal4p protein is rate-limiting for maximal induction of expression of genes
driven by GAL promoters (Mylin et al., 1990; Schultz et al., 1987), especially
when the desired GAL-promoter-gene fusion construct is carried on a high
copy number plasmid (Mylin et al., 1990; Schultz et al., 1987), e.g. in the case
of this study. Hence, increasing Gal4p amount would increase expression of
target genes (Mylin et al., 1990; Mylin and Hopper, 1997; Sil et al., 2000). Our
attempts using a vector bearing GAL10-promoter-Gal4p (Sil et al., 2000)
failed (data not shown) for unknown reasons. However, it is still worthwhile to
169
express DNase I in a cell strain bearing the GAL10-promoter-Gal4p cassette
in the genome (Mylin and Hopper, 1997).
Since DNase I is a foreign protein in yeast cells, it may be degraded
rapidly by proteases, so expressing DNase I in protease deficient strains
(Emr, 1990; Jones, 1991) may benefit our studies, and hence increase the
sensitivity of this strategy.
In addition, an alternative strategy other than the galactose inducible
system can be employed to clone and express DNase I. A more tractable
system is based on regulatory elements of the xenobiotic E. coli Tn-10-
specified tetracycline-resistance operon, through which the tetracycline
repressor (tetR) negatively regulates transcription of several resistance-
mediating genes (Hillen et al., 1983; Hillen et al., 1984; Klock et al., 1985).
Presence of tetracycline related compounds releases tetR from its binding
sites (tetR operators) located within the promoter region of the operon and
derepresses transcription of target genes (Hillen et al., 1983; Hillen et al.,
1984; Klock et al., 1985). This system has been applied in yeast
(Dingermann et al., 1992), plant (Gatz et al., 1991; Gatz and Quail, 1988;
Weinmann et al., 1994) and mammalian cells (Gossen and Bujard, 1992;
Gossen and Bujard, 2002; Shockett et al., 1995). Superiority of this system is
based on these observations: (1) specificity of tetR for its operator sequence
(Hillen et al., 1983; Hillen et al., 1984; Klock et al., 1985); (2) high affinity of
tetracycline for tetR (Takahashi et al., 1986); (3) well-studied chemical and
170
physiological properties of tetracycline; and (4) the absence of requirements
for switching medium or temperature.
5.2 Further applications of MAP in exploring mechanisms of
gene repression
MAP has been proved to be the technique of choice for exploring structure
and composition of chromatin packaged in vivo under different functional
states. Future studies will focus on the following areas.
5.2.1 Is the compact chromatin structure specific for a cell-specific
genes?
We observed that for two of the repressed a cell-specific gene domains,
the STE6 domain (Ducker, 2001) and the MFA1 domain (this study), there is
a highly ordered, compact, “hairpin” like chromatin structure. We propose that
Ssn6p-Tup1p bridges the nucleosomes and that Hho1p also plays a role in
stabilizing this structure. It would be informative to employ the same strategy
in looking at the higher chromatin structure of the following constructs.
• a cell-specific genes with a mutation of the Mcm1p binding site
(GG:CC). This is a mutant which shows many interesting
characteristics (table 5.1). This construct may provide information
about the role of (1) Ssn6p-Tup1p; (2) Mat2p- Mcm1p; (3) histone
acetylation; and (4) transcription, in the formation and/or
171
maintenance of the compact chromatin structures of the repressed a
cell-specific gene domains.
• Other Ssn6p-Tup1p controlled genes, such as RNR2 and SUC2. It
has been shown that different activators and/or repressors can
induce different acetylation states (Davie et al., 2002; Deckert and
Struhl, 2001). Furthermore, the distribution of Tup1p is different
between the a cell-specific genes and DNA damage response genes
(Davie et al., 2002). Finally, the damage response genes have basal
level of transcription, in contrast to the a cell-specific genes in cells.
Therefore, these constructs would tell us about (1) whether Ssn6p-
Tup1p associates with these genes in the same way as with a cell-
specific genes; (2) whether different repressors initiate different
chromatin structure in the sense of higher order conformation; and
(3) what the effect of basal transcription may be on the formation and
maintenance of certain higher order chromatin structure; and (4)
different roles of Ssn6p and Tup1p in different context.
• Other repressed genes not controlled by Ssn6p-Tup1p, such as
PHO5. These constructs may further elucidate the relationships
between Ssn6p-Tup1p and special higher order chromatin structure.
5.2.3 The distribution of Ssn6p-Tup1p complex along repressed
domains
172
We proposed that the Ssn6p-Tup1p complex spreads along the entire
repressed a cell-specific gene domains (Ducker, 2001). To confirm this
conclusion, we plan to perform following experiments. The first strategy,
explained in Figure 5.1, is a revised quantification method, which bypasses
the requirement for quantifying the amount of minichromosome DNA. We
have obtained purified recombinant Mcm1p from Dr. Song Tan and an
antibody to the protein is commercially available. The only potential problem
with this strategy is the possibility that Mcm1p may also bind to regions on the
MFA1-ALT other than the 2 operator. This possibility can be tested by using
ALT as a control.
Another technique of choice is immuno-gold EM, which employs
antibodies coupled to electron-dense material (about the technique, see
(Woodcock, 1989). This technique will show directly the distribution of the
Ssn6p-Tup1p complex along the isolated minichromosomes.
5.2.4 Deeper investigations of Hho1p function
Interestingly, we have observed that Hho1p is associated with the
repressed MFA1 locus in cells. Hho1p is very unusual for an H1 histone.
Instead of having a central globular region and long N- and C-terminal basic
tails, the yeast protein has two globular domains, connected by a 42 amino
acid long, lysine rich domain, and has shorter basic amino- and carboxyl-
terminal tails. The globular region of mammalian H1 is thought to bind DNA at
the entry/exit points from its path around the histone octamer in the chromatin
173
core particle (Vignali and Workman, 1998). Two globular regions might be just
what is needed to bind two nucleosomes at the end of a hairpin, with the
linker between them being determined by steric considerations and the length
of peptide available between the globular domains. To further elucidate the
functions of Hho1p, much work on this subject lies ahead.
• The hho1 deletion and its effects;
We will perform detailed analysis of micrococcal nuclease cutting of
the long linker in the MFA1 gene chromatin in wild type and hho1
deletion strains of yeast. Since it is possible that like many elements
in yeast structure determinants are redundant, we will also assess
the structure of the long linker in a tup1 deletion strain and a double
mutant, hho1/tup1, or: in a GG:CC mfa1 mutant strain and a double
mutant, hho1/GG:CC. We anticipate that the distinctive cutting
pattern in the MFA1 linker will be lost in the absence of Hho1p. We
attribute inactivity of the gene in the mutant to redundancy of
organization of repressive chromatin structure.
• Immuno-EM staining;
This will be done as described (Frado et al., 1983).
• Where else does Hho1p bind?
There are around 2,000 molecules of Hho1p in each yeast cell.
Therefore, Hho1p must bind to regions other than the MFA1 domain.
First, we will do western blots to check whether Hho1p associates
with minichromosomes containing other a cell-specific genes and
174
repressed genes mentioned above. The presence of Hho1p in the
genomic copy of these loci will be confirmed by ChIP. Finally, to
determine more regions where Hho1p functions, we would carry out
genome-wide location analysis for Hho1p using a method that
combines the micro-array technique and ChIP together (ChIP-chip).
This method has been used successfully to identify genomic binding
sites for many other DNA associated factors (Ren et al., 2000; Simon
et al., 2001; Wyrick et al., 1999). The facility for gene and interenic
microarray is available at our university.
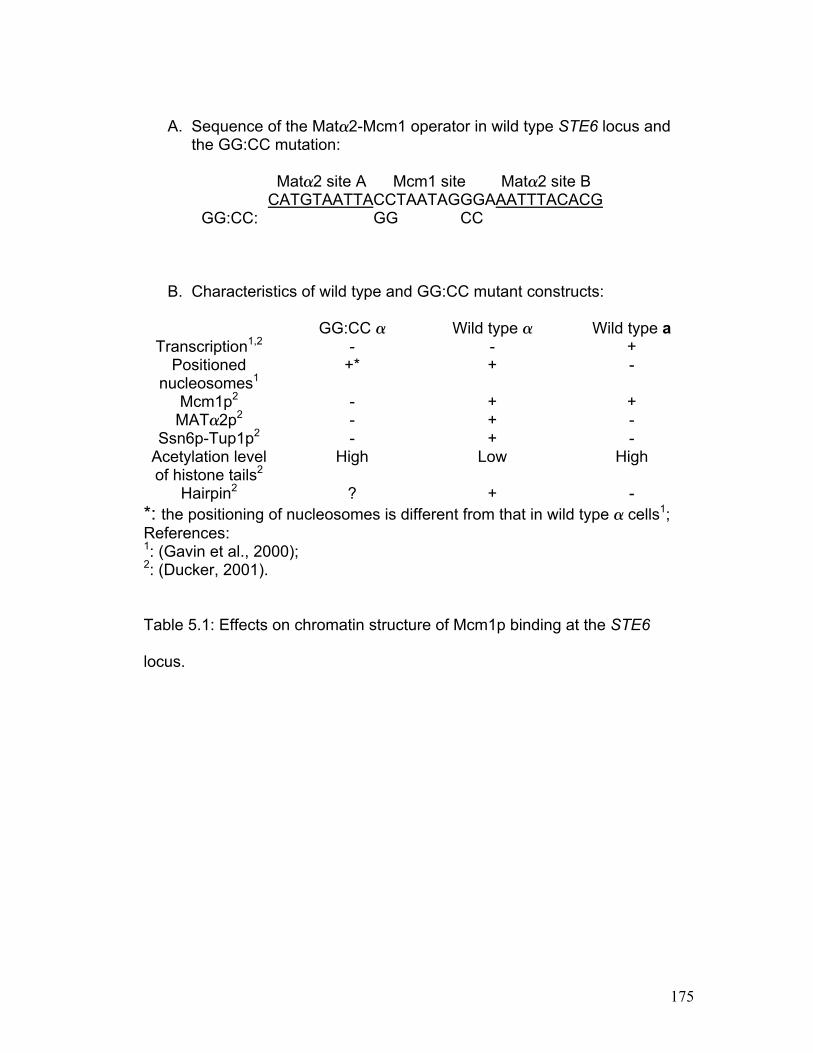
175
A. Sequence of the Mat2-Mcm1 operator in wild type STE6 locus and
the GG:CC mutation: Mat2 site A Mcm1 site Mat2 site B CATGTAATTACCTAATAGGGAAATTTACACG GG:CC: GG CC
B. Characteristics of wild type and GG:CC mutant constructs:
GG:CC Wild type Wild type a Transcription1,2 - - +
Positioned nucleosomes1
+* + -
Mcm1p2 - + + MAT2p2 - + -
Ssn6p-Tup1p2 - + - Acetylation level of histone tails2
High Low High
Hairpin2 ? + - *: the positioning of nucleosomes is different from that in wild type cells1; References: 1: (Gavin et al., 2000); 2: (Ducker, 2001). Table 5.1: Effects on chromatin structure of Mcm1p binding at the STE6
locus.
176
Figure 5.1: The schematic of the experiment to determine the ratio between
Mcm1p and Tup1p associated with the MFA1-ALT minichromosome. This
experiment is based on the fact that two molecules of Mcm1p bind to one
copy of the MFA1 region in the MFA1-ALT minichromosome.
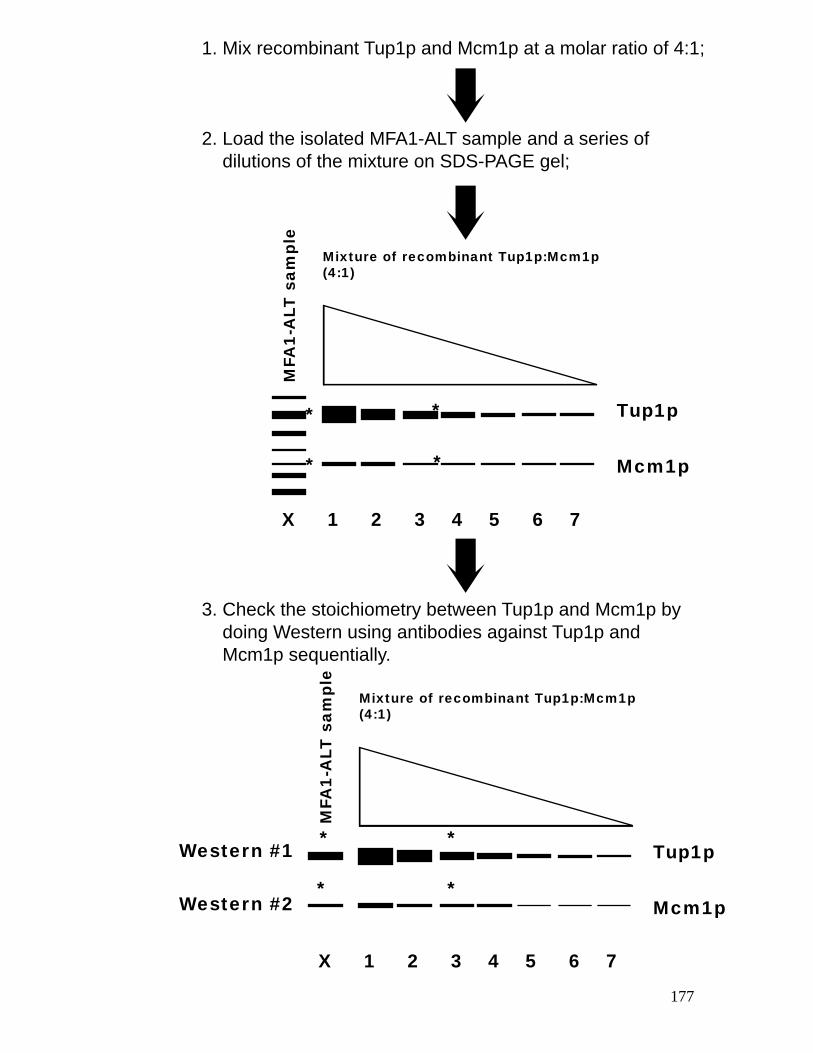
177
1. Mix recombinant Tup1p and Mcm1p at a molar ratio of 4:1;
2. Load the isolated MFA1-ALT sample and a series of dilutions of the mixture on SDS-PAGE gel;
MFA
1-A
LT s
ampl
e
Mixture of recombinant Tup1p:Mcm1p (4:1)
X 1 2 3 4 5 6 7
Tup1p
Mcm1p
*
**
*
MFA
1-A
LT s
ampl
e
Mixture of recombinant Tup1p:Mcm1p (4:1)
X 1 2 3 4 5 6 7
Tup1p
Mcm1p
Western #1
Western #2
**
**
3. Check the stoichiometry between Tup1p and Mcm1p by doing Western using antibodies against Tup1p and Mcm1p sequentially.

Summary
179
In eukaryotic cells, transcription, replication, recombination, and other
functions of DNA all take place in the context of chromatin, the complex of the
nucleic acid with histones and other proteins. Increasingly, the relevance of
structural features of chromatin to these functions of DNA is appreciated.
However, detailed knowledge and experimental criteria for chromatin
organization beyond the nucleosome are still needed to fully understand the
regulation of these DNA processes. To address these issues, the work
described in this thesis was focused on several newly developed methods of
analyzing active or repressed chromatin structures involving non-histone
proteins and higher-order nucleosomal interactions in vivo.
In the first part (chapter II and III), we described the establishment and
application of a new in vivo chromatin structure mapping strategy. Previously,
we developed the methylase probing assay (Kladde et al., 1999b), a new
methodology for the analysis of chromatin structure. This method allows
detecting both histone-DNA and non histone-DNA interactions in living yeast
cells. However, this method has two disadvantages that greatly affect its
application. One is the sequence specificity of these methylases, which limits
it resolution. The other one is the fact that many species have endogenous
methylases. Here, we extend this strategy to DNase I, a nonspecific
nuclease. DNase I has been the most widely used enzyme to detect
180
chromatin sites where DNA is active in transcription, replication or
recombination. The cloning and expression of bovine pancreatic DNase I in
yeast cells provides a powerful tool in chromatin structure mapping. Utilizing
this sensitive and high-resolution assay, we detected a labile repressor
binding to its cognate sites in vivo. These data demonstrated the validity and
efficacy of this strategy. Investigation of the inter-nucleosome linker regions in
several types of repressed domains has revealed different degrees of
protection in cells, relative to isolated nuclei. Our data clearly showed that the
HMR locus is less compact than repressed a cell-specific genes and the
recombination enhancer. This observation correlates well with our EM images
of these loci. Furthermore, the relatively less compact chromatin structure of
HMR may be necessary for karyoskeleton interaction and this would explain
the seeming paradox of a chromatin structure that precludes transcription yet
is perfectly appropriate for recombination or transposon integration (Haber,
1998a; Haber, 1998b; Zou et al., 1996; Zou and Voytas, 1997; Zou et al.,
1995).
Using this strategy, we further investigated the working mechanisms by
which TBP regulates transcription in vivo. In contrast to the results obtained
from previous studies, which suggested that promoters of active genes are
hypersensitive to nucleases in isolated chromatin, we found that in living cells,
these sites are protected from DNase I relative to surrounding regions. ChIP
assays confirmed this conclusion. Then, we used ChIP and quantitive PCR to
181
investigate two sets of genes that are coordinately regulated: four a cell-
specific genes (MFA2, MFA1, STE6 and BAR1), and four arginine-rich
histone genes (HHT1, HHT2, HHF1 and HHF2). We found that approximately
equal amounts of TBP are associated with the promoters of these genes in
each group, irrespective of the transcription level. In contrast, the amount of
RNA polymerase II associated with gene promoters is roughly proportional to
the transcription level. Our results, in addition to the suggestions that the
promoters of active genes are nucleosome free, suggest that TBP may
occupy the promoter region of active genes through multiple rounds of
transcription, and that binding of TBP to DNA is not a rate limiting step in the
activation of transcription reinitiation in living cells.
In the second part (chapter IV), we described a comprehensive
investigation of the repressed MFA1 domain in vivo using multiple methods,
including the newly developed MAP technique. The MAP protocol provides an
opportunity to directly investigate the formation of higher order chromatin
structure at any unique gene. Through EM imaging using negative staining for
the MAP isolated MFA1-ALT minichromosome, we have observed a unique
higher order chromatin structure associated with the repressed MFA1 locus.
This structure explains the fact that this gene is never depressed throughout
the life of the MAT cells. Western blot and ChIP assays also suggest that
this structure appears to involve both histones and non-histone proteins that
would hold the structure together. We confirmed that the Ssn6-Tup1 complex
182
plays an important role in the repression of MFA1 gene. Interestingly, we also
found for the first time that Hho1p is binding to a repressed locus in vivo.
In the third part (chapter V), we outlined the future studies and aims that
are suggested by our preliminary data. We will improve the DNase I in vivo
mapping strategy by increasing sensitivity. And obtaining EM images of more
regions will clearly show the involvement of higher order chromatin structure
in the repression of genes.
In summary, the research described in this thesis extends the previous
studies by disclosing the unique features of the transcription regulation in
living yeast cells. Our data provide evidence that in living cells where the
situation is far more complicated than in simple, purified biochemical systems,
the chromatin may function and be targeted in a different mode. While we
have not yet determined the exact nature of the relationship between the
chromatin function and structure, direction for future studies can be proposed
based on our results. In regard to technology development, application of in
vivo DNase I mapping and the MAP technique to the analysis of chromatin
structure in living cells makes them very powerful strategies for the study of
multiple fields. This approach should not be limited only to the study of
transcription. For example, the idea of expressing DNase I in living cells is
intriguing not only because of the application of mapping protein-DNA
interaction. It also can be used to induce DNA damage and far reaching cell
183
death. It is noteworthy that the expression of DNase I will eventually induce
cell death without disrupting the cell membrane and/or cell wall (data not
shown). This may provide a new pathway to induce apoptosis. Finally, both
the in vivo DNase I mapping strategy and the MAP methodology can be
applied to investigate similar projects in higher organisms.
184
References
Abmayr, S.M., Workman, J.L. and Roeder, R.G. (1988) The pseudorabies immediate early protein stimulates in vitro transcription by facilitating TFIID: promoter interactions. Genes Dev., 2, 542-553.
Acton, T.B., Zhong, H. and Vershon, A.K. (1997) DNA-binding specificity of Mcm1: operator mutations that alter DNA-bending and transcriptional activities by a MADS box protein. Mol Cell Biol, 17, 1881-1889.
Adams, C.C. and Workman, J.L. (1993) Nucleosome displacement in transcription. Cell, 72, 305-308.
Almer, A., Rudolph, H., Hinnen, A. and Horz, W. (1986) Removal of positioned nucleosomes from the yeast PHO5 promoter upon PHO5 induction releases additional upstream activating DNA elements. EMBO J., 5, 2689-2696.
Almouzni, G., Mechali, M. and Wolffe, A.P. (1990) Competition between transcription complex assembly and chromatin assembly on replicating DNA. EMBO J., 9, 573-582.
Andrews, B.J. and Herskowitz, I. (1990) Regulation of cell cycle-dependent gene expression in yeast. J Biol Chem, 265, 14057-14060.
Annunziato, A.T. and Hansen, J.C. (2000) Role of histone acetylation in the assembly and modulation of chromatin structures. Gene Expr, 9, 37-61.
Balasubramanian, B., Lowry, C.V. and Zitomer, R.S. (1993) The Rox1 repressor of the Saccharomyces cerevisiae hypoxic genes is a specific DNA-binding protein with a high-mobility-group motif. Mol. Cell. Biol., 13, 6071-6078.
Becker, P.B. and Horz, W. (2002) ATP-dependent nucleosome remodeling. Annu. Rev. Biochem., 71, 247-273.
Bednar, J., Horowitz, R.A., Dubochet, J. and Woodcock, C.L. (1995) Chromatin conformation and salt-induced compaction: three-dimensional structural information from cryoelectron microscopy. J Cell Biol, 131, 1365-1376.
Bednar, J. and Woodcock, C.L. (1999) Cryoelectron microscopic analysis of nucleosomes and chromatin. Methods Enzymol, 304, 191-213.
Belmont, A.S. and Straight, A.F. (1998) In vivo visualization of chromosomes using lac operator-repressor binding. Trends Cell Biol, 8, 121-124.
Berriman, J. and Unwin, N. (1994) Analysis of transient structures by cryo-microscopy combined with rapid mixing of spray droplets. Ultramicroscopy, 56, 241-252.
Bone, J.R. and Roth, S.Y. (2001) Recruitment of the yeast Tup1p-Ssn6p repressor is associated with localized decreases in histone acetylation. J. Biol. Chem., 276, 1808-1813.
Bulger, M., Sawado, T., Schubeler, D. and Groudine, M. (2002) ChIPs of the beta-globin locus: unraveling gene regulation within an active domain. Curr Opin Genet Dev, 12, 170-177.
Butler, J.E. and Kadonaga, J.T. (2002) The RNA polymerase II core promoter: a key component in the regulation of gene expression. Genes Dev., 16, 2583-2592.
Carlson, M. (1997) Genetics of transcriptional regulation in yeast: connections to the RNA polymerase II CTD. Annu Rev Cell Dev Biol, 13, 1-23.
185
Carrico, P.M. and Zitomer, R.S. (1998) Mutational analysis of the Tup1 general repressor of yeast. Genetics, 148, 637-644.
Chatterjee, S. and Struhl, K. (1995) Connecting a promoter-bound protein to TBP bypasses the need for a transcriptional activation domain. Nature, 374, 820-822.
Chen, J., Ding, M. and Pederson, D.S. (1994) Binding of TFIID to the CYC1 TATA boxes in yeast occurs independently of upstream activating sequences. Proc. Natl. Acad. Sci. USA, 91, 11909-11913.
Clark, D., Reitman, M., Studitsky, V., Chung, J., Westphal, H., Lee, E. and Felsenfeld, G. (1993) Chromatin structure of transcriptionally active genes. Cold Spring Harb.Symp.Quant.Biol., 581-6, 6.
Clark, D.J. and Felsenfeld, G. (1992) A Nucleosome Core Is Transferred Out of the Path of a Transcribing Polymerase. Cell., 71, 11-22.
Cockell, M. and Gasser, S.M. (1999) Nuclear compartments and gene regulation. Curr. Opin. Genet. Dev., 9, 199-205.
Cooper, J.P., Roth, S.Y. and Simpson, R.T. (1994) The global transcriptional regulators, SSN6 and TUP1, play distinct roles in the establishment of a repressive chromatin structure. Genes Dev., 8, 1400-1410.
Davie, J.K., Trumbly, R.J. and Dent, S.Y. (2002) Histone-dependent association of Tup1-Ssn6 with repressed genes in vivo. Mol. Cell. Biol., 22, 693-703.
Deckert, J. and Struhl, K. (2001) Histone acetylation at promoters is differentially affected by specific activators and repressors. Mol Cell Biol, 21, 2726-2735.
DeRisi, J.L., Iyer, V.R. and Brown, P.O. (1997) Exploring the metabolic and genetic control of gene expression on a genomic scale. Science, 278, 680-686.
Dingermann, T., Frank-Stoll, U., Werner, H., Wissmann, A., Hillen, W., Jacquet, M. and Marschalek, R. (1992) RNA polymerase III catalysed transcription can be regulated in Saccharomyces cerevisiae by the bacterial tetracycline repressor-operator system. Embo J, 11, 1487-1492.
Doherty, A.J., Connolly, B.A. and Worrall, A.F. (1993) Overproduction of the toxic protein, bovine pancreatic DNase I, in Escherichia coli using a tightly controlled T7-promoter-based vector. Gene, 136, 337-340.
Dolan, J. and Fields, S. (1991) Cell-type-specific transcription in yeast. Biochim. Biophys. Acta, 1088, 155-169.
Dubochet, J., Adrian, M., Chang, J.J., Homo, J.C., Lepault, J., McDowall, A.W. and Schultz, P. (1988) Cryo-electron microscopy of vitrified specimens. Q Rev Biophys, 21, 129-228.
Dubochet, J., Adrian, M., Dustin, I., Furrer, P. and Stasiak, A. (1992) Cryoelectron microscopy of DNA molecules in solution. Methods Enzymol, 211, 507-518.
Ducker, C.E. (2001) Physical studies of STE6 repression using affinity purified minichromosome. Ph.D. Thesis. The Pennsylvania State University.
Ducker, C.E. and Simpson, R.T. (2000) The organized chromatin domain of the repressed yeast a cell-specific gene STE6 contains two molecules of the corepressor Tup1p per nucleosome. EMBO J., 19, 400-409.
Dustin, I., Furrer, P., Stasiak, A., Dubochet, J., Langowski, J. and Egelman, E. (1991) Spatial visualization of DNA in solution. J Struct Biol, 107, 15-21.
186
Edmondson, D.G., Smith, M.M. and Roth, S.Y. (1996) Repression domain of the yeast global repressor Tup1 interacts directly with histones H3 and H4. Genes Dev., 10, 1247-1259.
Edmondson, D.G., Zhang, W., Watson, A., Xu, W., Bone, J.R., Yu, Y., Stillman, D. and Roth, S.Y. (1998) In vivo functions of histone acetylation/deacetylation in Tup1p repression and Gcn5p activation. Cold Spring Harb. Symp. Quant. Biol., 63, 459-468.
Elble, R. and Tye, B.K. (1991) Both activation and repression of a-mating-type-specific genes in yeast require transcription factor Mcm1. Proc Natl. Acad. Sci. USA, 88, 10966-10970.
Elgin, S.C. (1988) The formation and function of DNase I hypersensitive sites in the process of gene activation. J. Biol. Chem., 263, 19259-19262.
Emr, S.D. (1990) Heterologous gene expression in yeast. Methods Enzymol, 185, 231-233.
Engel, A. and Colliex, C. (1993) Application of scanning transmission electron microscopy to the study of biological structure. Curr Opin Biotechnol, 4, 403-411.
Fedor, M.J. and Kornberg, R.D. (1989) Upstream activation sequence-dependent alteration of chromatin structure and transcription activation of the yeast GAL1-GAL10 genes. Mol. Cell. Biol., 9, 1721-1732.
Felsenfeld, G. (1992) Chromatin as an essential part of the transcriptional mechanism. Nature, 355, 219-224.
Felsenfeld, G., Boyes, J., Chung, J., Clark, D. and Studitsky, V. (1996) Chromatin structure and gene expression. Proc.Natl.Acad.Sci.USA, 93, 9384-9388.
Frado, L.L., Mura, C.V., Stollar, B.D. and Woodcock, C.L. (1983) Mapping of histone H5 sites on nucleosomes using immunoelectron microscopy. J Biol Chem, 258, 11984-11990.
Freidkin, I. and Katcoff, D.J. (2001) Specific distribution of the Saccharomyces cerevisiae linker histone homolog HHO1p in the chromatin. Nucleic Acids Res., 29, 4043-4051.
Ganter, B., Tan, S. and Richmond, T.J. (1993) Genomic footprinting of the promoter regions of STE2 and STE3 genes in the yeast Saccharomyces cerevisiae. J Mol Biol, 234, 975-987.
Gatz, C., Kaiser, A. and Wendenburg, R. (1991) Regulation of a modified CaMV 35S promoter by the Tn10-encoded Tet repressor in transgenic tobacco. Mol Gen Genet, 227, 229-237.
Gatz, C. and Quail, P.H. (1988) Tn10-encoded tet repressor can regulate an operator-containing plant promoter. Proc Natl Acad Sci U S A, 85, 1394-1397.
Gavin, I.M., Kladde, M.P. and Simpson, R.T. (2000) Tup1p represses Mcm1p transcriptional activation and chromatin remodeling of an a-cell-specific gene. EMBO J., 19, 5875-5883.
Gavin, I.M. and Simpson, R.T. (1997) Interplay of yeast global transcriptional regulators Ssn6p-Tup1p and Swi-Snf and their effect on chromatin structure. EMBO J., 16, 6263-6271.
187
Geisberg, J.V., Holstege, F.C., Young, R.A. and Struhl, K. (2001) Yeast NC2 associates with the RNA polymerase II preinitiation complex and selectively affects transcription in vivo. Mol. Cell. Biol., 21, 2736-2742.
Geisberg, J.V., Moqtaderi, Z., Kuras, L. and Struhl, K. (2002) Mot1 associates with transcriptionally active promoters and inhibits association of NC2 in Saccharomyces cerevisiae. Mol. Cell. Biol., 22, 8122-8134.
Goebl, M. and Yanagida, M. (1991) The TPR snap helix: a novel protein repeat motif from mitosis to transcription. Trends Biochem Sci, 16, 173-177.
Gossen, M. and Bujard, H. (1992) Tight control of gene expression in mammalian cells by tetracycline-responsive promoters. Proc Natl Acad Sci U S A, 89, 5547-5551.
Gossen, M. and Bujard, H. (2002) Studying gene function in eukaryotes by conditional gene inactivation. Annu Rev Genet, 36, 153-173.
Gotta, M., Laroche, T., Formenton, A., Maillet, L., Scherthan, H. and Gasser, S. (1996) The clustering of telomeres and colocalization with Rap1, Sir3, and Sir4 proteins in wild-type Saccharomyces cerevisiae. J. Cell. Biol., 134, 1349-1363.
Gottschling, D.E. (1992) Telomere-proximal DNA in Saccharomyces cerevisiae is refractory to methyltransferase activity in vivo. Proc Natl Acad Sci U S A, 89, 4062-4065.
Gross, D.S. and Garrard, W.T. (1988) Nuclease hypersensitive sites in chromatin. Annu. Rev. Biochem., 57, 159-197.
Gutjahr, T., Frei, E., Spicer, C., Baumgartner, S., White, R.A. and Noll, M. (1995) The Polycomb-group gene, extra sex combs, encodes a nuclear member of the WD-40 repeat family. Embo J, 14, 4296-4306.
Haber, J.E. (1998a) A locus control region regulates yeast recombination. Trends Genet, 14, 317-321.
Haber, J.E. (1998b) Mating-type gene switching in Saccharomyces cerevisiae. Annu.Rev.Genet., 32, 561-599.
Hahn, S. (1998) Activation and the role of reinitiation in the control of transcription by RNA polymerase II. Cold Spring Harb. Symp. Quant. Biol., 63, 181-188.
Han, M., Chang, M., Kim, U.J. and Grunstein, M. (1987) Histone H2B repression causes cell-cycle-specific arrest in yeast: effects on chromosomal segregation, replication, and transcription. Cell, 48, 589-597.
Han, M. and Grunstein, M. (1988) Nucleosome loss activates yeast downstream promoters in vivo. Cell, 55, 1137-1145.
Han, M., Kim, U.J., Kayne, P. and Grunstein, M. (1988) Depletion of histone H4 and nucleosomes activates the PHO5 gene in Saccharomyces cerevisiae. EMBO J., 7, 2221-2228.
Hassan, A.H., Neely, K.E., Vignali, M., Reese, J.C. and Workman, J.L. (2001) Promoter targeting of chromatin-modifying complexes. Front Biosci, 6, D1054-1064.
Hattman, S., Kenny, C., Berger, L. and Pratt, K. (1978) Comparative study of DNA methylation in three unicellular eucaryotes. J Bacteriol, 135, 1156-1157.
188
Hawley, D. and Roeder, R. (1987) Functional steps in transcription initiation and reinitiation from the major late promoter in a HeLa nuclear extract. J. Biol. Chem., 262, 3452-3461.
Hebbes, T.R., Clayton, A.L., Thorne, A.W. and Crane-Robinson, C. (1994) Core histone hyperacetylation comaps with generalized DNase I sensitivity in chicken beta globin chromosomal domain. EMBO J., 13, 1823-1830.
Hecht, A. and Grunstein, M. (1999) Mapping DNA interaction sites of chromosomal proteins using immunoprecipitation and polymerase chain reaction. Methods Enzymol., 304, 399-414.
Hecht, A., Laroche, T., Strahlbolsinger, S., Gasser, S.M. and Grunstein, M. (1995) Histone H3 and H4 N-termini interact with SIR3 and SIR4 proteins: A molecular model for the formation of heterochromatin in yeast. Cell, 80, 583-592.
Herschbach, B.M., Arnaud, M.B. and Johnson, A.D. (1994) Transcriptional repression directed by the yeast alpha 2 protein in vitro. Nature, 370, 309-311.
Herschbach, B.M. and Johnson, A.D. (1993) The yeast alpha 2 protein can repress transcription by RNA polymerases I and II but not III. Mol Cell Biol, 13, 4029-4038.
Herskowitz, I. (1989) A regulatory hierarchy for cell specialization in yeast. Nature, 342, 749-757.
Hillen, W., Gatz, C., Altschmied, L., Schollmeier, K. and Meier, I. (1983) Control of expression of the Tn10-encoded tetracycline resistance genes. Equilibrium and kinetic investigation of the regulatory reactions. J Mol Biol, 169, 707-721.
Hillen, W., Schollmeier, K. and Gatz, C. (1984) Control of expression of the Tn10-encoded tetracycline resistance operon. II. Interaction of RNA polymerase and TET repressor with the tet operon regulatory region. J Mol Biol, 172, 185-201.
Hochstrasser, M., Ellison, M.J., Chau, V. and Varshavsky, A. (1991) The short-lived MAT alpha2 transcriptional regulator is ubiquitinated in vivo. Proc.Natl.Acad.Sci.USA, 88, 4606-4610.
Holstege, F.C., Jennings, E.G., Wyrick, J.J., Lee, T.I., Hengartner, C.J., Green, M.R., Golub, T.R., Lander, E.S. and Young, R.A. (1998) Dissecting the regulatory circuitry of a eukaryotic genome. Cell, 95, 717-728.
Huang, L., Zhang, W. and Roth, S.Y. (1997) Amino termini of histones H3 and H4 are required for a1-alpha2 repression in yeast. Mol. Cell. Biol., 17, 6555-6562.
Huang, M., Zhou, Z. and Elledge, S.J. (1998) The DNA replication and damage checkpoint pathways induce transcription by inhibition of the Crt1 repressor. Cell, 94, 595-605.
Imbalzano, A.N., Kwon, H., Green, M.R. and Kingston, R.E. (1994) Facilitated binding of TATA-binding protein to nucleosomal DNA. Nature, 370, 481-485.
Iyer, V. and Struhl, K. (1995) Poly(dA:dT), a ubiquitous promoter element that stimulates transcription via its intrinsic DNA structure. Embo J, 14, 2570-2579.
Jabet, C., Sprague, E.R., VanDemark, A.P. and Wolberger, C. (2000) Characterization of the N-terminal domain of the yeast transcriptional
189
repressor Tup1. Proposal for an association model of the repressor complex Tup1 x Ssn6. J. Biol. Chem., 275, 9011-9018.
Jenuwein, T. and Allis, C.D. (2001) Translating the histone code. Science, 293, 1074-1080.
Jiang, Y. and Gralla, J. (1993) Uncoupling of initiation and reinitiation rates during HeLa RNA polymerase II transcription in vitro. Mol. Cell. Biol., 13, 4572-4577.
Johnson, A.D. and Herskowitz, I. (1985) A repressor (MAT alpha 2 Product) and its operator control expression of a set of cell type specific genes in yeast. Cell, 42, 237-247.
Jones, E.W. (1991) Tackling the protease problem in Saccharomyces cerevisiae. Methods Enzymol, 194, 428-453.
Kadonaga, J. (1990) Assembly and disassembly of the Drosophila RNA polymerase II complex during transcription. J. Biol. Chem., 265, 2624-2631.
Katan-Khaykovich, Y. and Struhl, K. (2002) Dynamics of global histone acetylation and deacetylation in vivo: rapid restoration of normal histone acetylation status upon removal of activators and repressors. Genes Dev, 16, 743-752.
Kato, N. and Lam, E. (2001) Detection of chromosomes tagged with green fluorescent protein in live Arabidopsis thaliana plants. Genome Biol, 2, RESEARCH0045.
Kato, N. and Lam, E. (2003) Chromatin of endoreduplicated pavement cells has greater range of movement than that of diploid guard cells in Arabidopsis thaliana. J Cell Sci, 116, 2195-2201.
Kato, N., Pontier, D. and Lam, E. (2002) Spectral profiling for the simultaneous observation of four distinct fluorescent proteins and detection of protein-protein interaction via fluorescence resonance energy transfer in tobacco leaf nuclei. Plant Physiol, 129, 931-942.
Keleher, C.A., Goutte, C. and Johnson, A.D. (1988) The yeast cell-type-specific repressor alpha 2 acts cooperatively with a non-cell-type-specific protein. Cell, 53, 927-936.
Keleher, C.A., Passmore, S. and Johnson, A.D. (1989) Yeast repressor alpha 2 binds to its operator cooperatively with yeast protein Mcm1. Mol. Cell. Biol., 9, 5228-5230.
Keleher, C.A., Redd, M.J., Schultz, J., Carlson, M. and Johnson, A.D. (1992) Ssn6-Tup1 is a general repressor of transcription in yeast. Cell, 68, 709-719.
Kim, U.J., Han, M., Kayne, P. and Grunstein, M. (1988) Effects of histone H4 depletion on the cell cycle and transcription of Saccharomyces cerevisiae. EMBO J., 7, 2211-2219.
Kladde, M.P., Xu, M. and Simpson, R.T. (1996) Direct study of DNA-protein interactions in repressed and active chromatin in living cells. EMBO J., 15, 6290-6300.
Kladde, M.P., Xu, M. and Simpson, R.T. (1999a) DNA methyltransferases as probes for chromatin structure in yeast. Methods Mol. Biol., 119, 395-416.
Kladde, M.P., Xu, M. and Simpson, R.T. (1999b) DNA methyltransferases as probes of chromatin structure in vivo. Methods Enzymol., 304, 431-447.
190
Klages, N. and Strubin, M. (1995) Stimulation of RNA polymerase II transcription initiation by recruitment of TBP in vivo. Nature, 374, 822-823.
Klock, G., Unger, B., Gatz, C., Hillen, W., Altenbuchner, J., Schmid, K. and Schmitt, R. (1985) Heterologous repressor-operator recognition among four classes of tetracycline resistance determinants. J Bacteriol, 161, 326-332.
Knezetic, J.A., Jacob, G.A. and Luse, D.S. (1988) Assembly of RNA polymerase II preinitiation complexes before assembly of nucleosomes allows efficient initiation of transcription on nucleosomal templates. Mol.Cell.Biol., 8, 3114-3121.
Knezetic, J.A. and Luse, D.S. (1988) The presence of nucleosomes on a DNA template prevents initiation by RNA polymerase II in vitro. Cell., 45, 95-104.
Komachi, K. and Johnson, A.D. (1997) Residues in the WD repeats of Tup1 required for interaction with alpha2. Mol. Cell. Biol., 17, 6023-6028.
Komachi, K., Redd, M.J. and Johnson, A.D. (1994) The WD repeats of Tup1 interact with the homeo domain protein alpha 2. Genes Dev., 8, 2857-2867.
Kornberg, R. and Lorch, Y. (1999) Twenty-five years of the nucleosome, fundamental particle of the eukaryote chromosome. Cell, 98, 285-294.
Kornberg, R.D., LaPointe, J.W. and Lorch, Y. (1989) Preparation of nucleosomes and chromatin. Methods Enzymol, 170, 3-14.
Krohne, G. and Franke, W.W. (1980) A major soluble acidic protein located in nuclei of diverse vertebrate species. Exp Cell Res, 129, 167-189.
Kuras, L., Kosa, P., Mencia, M. and Struhl, K. (2000) TAF-Containing and TAF-independent forms of transcriptionally active TBP in vivo. Science, 288, 1244-1248.
Kuras, L. and Struhl, K. (1999) Binding of TBP to promoters in vivo is stimulated by activators and requires Pol II holoenzyme. Nature, 399, 609-613.
Landsman, D. (1996) Histone H1 in Saccharomyces cerevisiae: a double mystery solved? Trends Biochem. Sci., 21, 287-288.
Lee, T.I., Wyrick, J.J., Koh, S.S., Jennings, E.G., Gadbois, E.L. and Young, R.A. (1998) Interplay of positive and negative regulators in transcription initiation by RNA polymerase II holoenzyme. Mol. Cell. Biol., 18, 4455-4462.
Lee, T.I. and Young, R.A. (1998) Regulation of gene expression by TBP-associated proteins. Genes Dev., 12, 1398-1408.
Lee, T.I. and Young, R.A. (2000) Transcription of eukaryotic protein-coding genes. Annu. Rev. Genet., 34, 77-137.
Lemontt, J.F. (1980) Genetic and physiological factors affecting repair and mutagenesis in yeast. Basic Life Sci, 15, 85-120.
Li, B. and Reese, J.C. (2001) Ssn6-Tup1 regulates RNR3 by positioning nucleosomes and affecting the chromatin structure at the upstream repression sequence. J. Biol. Chem., 276, 33788-33797.
Li, X.Y., Bhaumik, S.R. and Green, M.R. (2000) Distinct classes of yeast promoters revealed by differential TAF recruitment. Science, 288, 1242-1244.
Li, X.Y., Virbasius, A., Zhu, X. and Green, M.R. (1999) Enhancement of TBP binding by activators and general transcription factors. Nature, 399, 605-609.
191
Litt, M.D., Simpson, M., Gaszner, M., Allis, C.D. and Felsenfeld, G. (2001a) Correlation between histone lysine methylation and developmental changes at the chicken beta-globin locus. Science, 293, 2453-2455.
Litt, M.D., Simpson, M., Recillas-Targa, F., Prioleau, M.N. and Felsenfeld, G. (2001b) Transitions in histone acetylation reveal boundaries of three separately regulated neighboring loci. Embo J, 20, 2224-2235.
Lo, W.S., Duggan, L., Tolga, N.C., Emre, Belotserkovskya, R., Lane, W.S., Shiekhattar, R. and Berger, S.L. (2001) Snf1--a histone kinase that works in concert with the histone acetyltransferase Gcn5 to regulate transcription. Science, 293, 1142-1146.
Lohr, D. and Lopez, J. (1995) GAL4/GAL80-dependent nucleosome disruption/deposition on the upstream regions of the yeast GAL1-10 and GAL80 genes. J Biol Chem, 270, 27671-27678.
Lorch, Y., LaPointe, J.W. and Kornberg, R. (1987) Nucleosomes inhibit the initiation of transcription but allow chain elongation with the displacement of histones. Cell., 49, 203-210.
Luger, K., Mader, A.W., Richmond, R.K., Sargent, D.F. and Richmond, T.J. (1997) Crystal structure of the nucleosome core particle at 2.8 angstrom resolution. Nature, 389, 251-260.
Mai, X., Chou, S. and Struhl, K. (2000) Preferential accessibility of the yeast his3 promoter is determined by a general property of the DNA sequence, not by specific elements. Mol Cell Biol, 20, 6668-6676.
Matsui, T. (1987) Transcription of Adenovirus 2 major late and peptide IX genes under conditions of in vitro nucleosome assembly. Mol.Cell.Biol., 7, 1401-1408.
Mead, J., Bruning, A.R., Gill, M.K., Steiner, A.M., Acton, T.B. and Vershon, A.K. (2002) Interactions of the Mcm1 MADS box protein with cofactors that regulate mating in yeast. Mol Cell Biol, 22, 4607-4621.
Miller, O.L., Jr. and Beatty, B.R. (1969) Visualization of nucleolar genes. Science, 164, 955-957.
Morse, R.H., Pederson, D.S., Dean, A. and Simpson, R.T. (1987) Yeast nucleosomes allow thermal untwisting of DNA. Nucleic Acids Res., 15, 10311-10330.
Muller, S.A. and Engel, A. (2001) Structure and mass analysis by scanning transmission electron microscopy. Micron, 32, 21-31.
Murphy, M.R., Shimizu, M., Roth, S.Y., Dranginis, A.M. and Simpson, R.T. (1993) DNA-protein interactions at the S.cerevisiae alpha 2 operator in vivo. Nucleic Acids Res., 21, 3295-3300.
Mylin, L.M., Hofmann, K.J., Schultz, L.D. and Hopper, J.E. (1990) Regulated GAL4 expression cassette providing controllable and high-level output from high-copy galactose promoters in yeast. Methods Enzymol, 185, 297-308.
Mylin, L.M. and Hopper, J.E. (1997) Inducible expression cassettes in yeast: GAL4. Methods Mol Biol, 62, 131-148.
Nacheva, G., Guschin, D., Preobrazhenskaya, O., Karpov, V., Ebralidse, K. and Mirzabekov, A. (1989) Change in the pattern of histone binding to DNA upon transcriptional activation. Cell, 58, 27-36.
192
Nickerson, J.A., Krockmalnic, G., Wan, K.M. and Penman, S. (1997) The nuclear matrix revealed by eluting chromatin from a cross-linked nucleus. Proc. Natl. Acad. Sci. USA, 94, 4446-4450.
Olins, A.L. and Olins, D.E. (1974) Spheroid chromatin units (v bodies). Science, 183, 330-332.
Orlando, V. (2000) Mapping chromosomal proteins in vivo by formaldehyde-crosslinked-chromatin immunoprecipitation. Trends Biochem Sci, 25, 99-104.
Orlando, V., Strutt, H. and Paro, R. (1997) Analysis of chromatin structure by in vivo formaldehyde cross-linking. Methods, 11, 205-214.
Papamichos-Chronakis, M., Petrakis, T., Ktistaki, E., Topalidou, I. and Tzamarias, D. (2002) Cti6, a PHD domain protein, bridges the Cyc8-Tup1 corepressor and the SAGA coactivator to overcome repression at GAL1. Mol. Cell, 9, 1297-1305.
Patterton, H.G., Landel, C.C., Landsman, D., Peterson, C.L. and Simpson, R.T. (1998) The biochemical and phenotypic characterization of Hho1p, the putative linker histone H1 of Saccharomyces cerevisiae. J. Biol. Chem., 273, 7268-7276.
Patterton, H.G. and Simpson, R.T. (1994) Nucleosomal location of the STE6 TATA box and Mat alpha 2p-mediated repression. Mol. Cell. Biol., 14, 4002-4010.
Pfeifer, G. and Riggs, A. (1991) Chromatin differences between active and inactive X chromosomes revealed by genomic footprinting of permeabilized cells using DNase I and ligation-mediated PCR. Genes Dev., 5, 1102-1113.
Pokholok, D., Hannett, N. and Young, R. (2002) Exchange of RNA polymerase II initiation and elongation factors during gene expression in vivo. Mol. Cell, 9, 799-809.
Pratt, K. and Hattman, S. (1981) Deoxyribonucleic acid methylation and chromatin organization in Tetrahymena thermophila. Mol Cell Biol, 1, 600-608.
Proft, M., Pascual-Ahuir, A., de Nadal, E., Arino, J., Serrano, R. and Posas, F. (2001) Regulation of the Sko1 transcriptional repressor by the Hog1 MAP kinase in response to osmotic stress. EMBO J., 20, 1123-1133.
Proft, M. and Struhl, K. (2002) Hog1 kinase converts the Sko1-Cyc8-Tup1 repressor complex into an activator that recruits SAGA and SWI/SNF in response to osmotic stress. Mol. Cell, 9, 1307-1317.
Pugh, B. (2000) Control of gene expression through regulation of the TATA-binding protein. Gene, 255, 1-14.
Raska, I., Ochs, R.L. and Salamin-Michel, L. (1990) Immunocytochemistry of the cell nucleus. Electron Microsc Rev, 3, 301-353.
Ravindra, A., Weiss, K. and Simpson, R.T. (1999) High-resolution structural analysis of chromatin at specific loci: Saccharomyces cerevisiae silent mating-type locus HMRa. Mol. Cell. Biol., 19, 7944-7950.
Rechsteiner, M. and Rogers, S.W. (1996) PEST sequences and regulation by proteolysis. Trends Biochem Sci, 21, 267-271.
Redd, M.J., Arnaud, M.B. and Johnson, A.D. (1997) A complex composed of tup1 and ssn6 represses transcription in vitro. J. Biol. Chem., 272, 11193-11197.
Redd, M.J., Stark, M.R. and Johnson, A.D. (1996) Accessibility of alpha 2-repressed promoters to the activator Gal4. Mol Cell Biol, 16, 2865-2869.
193
Ren, B., Robert, F., Wyrick, J.J., Aparicio, O., Jennings, E.G., Simon, I., Zeitlinger, J., Schreiber, J., Hannett, N., Kanin, E., Volkert, T.L., Wilson, C.J., Bell, S.P. and Young, R.A. (2000) Genome-wide location and function of DNA binding proteins. Science, 290, 2306-2309.
Rhee, S.K., Icho, T. and Wickner, R.B. (1989) Structure and nuclear localization signal of the SKI3 antiviral protein of Saccharomyces cerevisiae. Yeast, 5, 149-158.
Robinett, C.C., Straight, A., Li, G., Willhelm, C., Sudlow, G., Murray, A. and Belmont, A.S. (1996) In vivo localization of DNA sequences and visualization of large-scale chromatin organization using lac operator/repressor recognition. J Cell Biol, 135, 1685-1700.
Rogers, S., Wells, R. and Rechsteiner, M. (1986) Amino acid sequences common to rapidly degraded proteins: the PEST hypothesis. Science, 234, 364-368.
Rose, M.D., Winston, F. and Hieter, P. (1990) In Methods in yeast genetics: A laboratory course manual. Cold Spring Harbor Lab. Press, Plainview, NY, p. 130.
Roth, S.Y. (1995) Chromatin-mediated transcriptional repression in yeast. Curr. Opin. Genet. Dev., 5, 168-173.
Roth, S.Y., Dean, A. and Simpson, R.T. (1990) Yeast alpha 2 repressor positions nucleosomes in TRP1/ARS1 chromatin. Mol. Cell. Biol., 10, 2247-2260.
Roth, S.Y., Shimizu, M., Johnson, L., Grunstein, M. and Simpson, R.T. (1992) Stable nucleosome positioning and complete repression by the yeast alpha 2 repressor are disrupted by amino-terminal mutations in histone H4. Genes Dev., 6, 411-425.
Roth, S.Y. and Simpson, R.T. (1991) Yeast minichromosomes. Methods Cell. Biol., 35, 289-314.
Sandaltzopoulos, R. and Becker, P. (1998) Heat shock factor increases the reinitiation rate from potentiated chromatin templates. Mol. Cell. Biol., 18, 361-367.
Sauer, R.T., Smith, D.L. and Johnson, A.D. (1988) Flexibility of the yeast alpha 2 repressor enables it to occupy the ends of its operator, leaving the center free. Genes Dev., 2, 807-816.
Sawadogo, M. and Roeder, R.G. (1985) Interaction of a gene-specific transcription factor with the adenovirus major late promoter upstream of the TATA box region. Cell, 43, 165-175.
Schrödinger, E. (1944) WHAT IS LIFE? University Press, Cambridge, UK. Schultz, J. and Carlson, M. (1987) Molecular analysis of SSN6, a gene functionally
related to the SNF1 protein kinase of Saccharomyces cerevisiae. Mol. Cell. Biol., 7, 3637-3645.
Schultz, J., Marshall-Carlson, L. and Carlson, M. (1990) The N-terminal TPR region is the functional domain of SSN6, a nuclear phosphoprotein of Saccharomyces cerevisiae. Mol. Cell. Biol., 10, 4744-4756.
Schultz, L.D., Hofmann, K.J., Mylin, L.M., Montgomery, D.L., Ellis, R.W. and Hopper, J.E. (1987) Regulated overproduction of the GAL4 gene product greatly increases expression from galactose-inducible promoters on multi-copy expression vectors in yeast. Gene, 61, 123-133.
194
Shen, X., Yu, L., Weir, J.W. and Gorovsky, M.A. (1995) Linker histones are not essential and affect chromatin condensation in vivo. Cell, 82, 47-56.
Shimizu, M., Roth, S.Y., Szent-Gyorgyi, C. and Simpson, R.T. (1991) Nucleosomes are positioned with base pair precision adjacent to the alpha 2 operator in Saccharomyces cerevisiae. EMBO J., 10, 3033-3041.
Shockett, P., Difilippantonio, M., Hellman, N. and Schatz, D.G. (1995) A modified tetracycline-regulated system provides autoregulatory, inducible gene expression in cultured cells and transgenic mice. Proc Natl Acad Sci U S A, 92, 6522-6526.
Sikorski, R.S. and Hieter, P. (1989) A system of shuttle vectors and yeast host strains designed for efficient manipulation of DNA in Saccharomyces cerevisiae. Genetics., 122, 19-27.
Sil, A.K., Xin, P. and Hopper, J.E. (2000) Vectors allowing amplified expression of the Saccharomyces cerevisiae Gal3p-Gal80p-Gal4p transcription switch: applications to galactose-regulated high-level production of proteins. Protein Expr Purif, 18, 202-212.
Simon, I., Barnett, J., Hannett, N., Harbison, C.T., Rinaldi, N.J., Volkert, T.L., Wyrick, J.J., Zeitlinger, J., Gifford, D.K., Jaakkola, T.S. and Young, R.A. (2001) Serial regulation of transcriptional regulators in the yeast cell cycle. Cell, 106, 697-708.
Simpson, R., T, Ducker, C., Diller, J. and Ruan, C. (2003) In preparation. Simpson, R.T. (1990) Nucleosome positioning can affect the function of a cis-acting
DNA element in vivo. Nature, 343, 387-389. Simpson, R.T. (1991) Nucleosome positioning: occurrence, mechanisms, and
functional consequences. Prog. Nucleic Acid Res. Mol. Biol., 40, 143-184. Simpson, R.T. (1998) Chromatin structure and analysis of mechanisms of activators
and repressors. Methods, 15, 283-294. Simpson, R.T. (1999) In vivo methods to analyze chromatin structure. Curr. Opin.
Genet. Dev., 9, 225-229. Simpson, R.T., Roth, S.Y., Morse, R.H., Patterton, H.G., Cooper, J.P., Murphy, M.,
Kladde, M.P. and Shimizu, M. (1993) Nucleosome positioning and transcription. Cold Spring Harb. Symp. Quant. Biol., 58, 237-245.
Singh, J. and Klar, A.J. (1992) Active genes in budding yeast display enhanced in vivo accessibility to foreign DNA methylases: a novel in vivo probe for chromatin structure of yeast. Genes Dev, 6, 186-196.
Smale, S.T. (2001) Core promoters: active contributors to combinatorial gene regulation. Genes Dev., 15, 2503-2508.
Smith, R.L. and Johnson, A.D. (2000) Turning genes off by Ssn6-Tup1: a conserved system of transcriptional repression in eukaryotes. Trends Biochem. Sci., 25, 325-330.
Smith, R.L., Redd, M.J. and Johnson, A.D. (1995) The tetratricopeptide repeats of Ssn6 interact with the homeo domain of alpha 2. Genes Dev., 9, 2903-2910.
Spector, D.L. (1993) Macromolecular domains within the cell nucleus. Annu Rev Cell Biol, 9, 265-315.
Spellman, P.T., Sherlock, G., Zhang, M.Q., Iyer, V.R., Anders, K., Eisen, M.B., Brown, P.O., Botstein, D. and Futcher, B. (1998) Comprehensive
195
identification of cell cycle-regulated genes of the yeast Saccharomyces cerevisiae by microarray hybridization. Mol.Biol.Cell, 9, 3273-3297.
Stargell, L.A. and Struhl, K. (1996) A new class of activation-defective TATA-binding protein mutants: evidence for two steps of transcriptional activation in vivo. Mol. Cell. Biol., 16, 4456-4464.
Strahl, B.D. and Allis, C.D. (2000) The language of covalent histone modifications. Nature, 403, 41-45.
Straight, A.F., Belmont, A.S., Robinett, C.C. and Murray, A.W. (1996) GFP tagging of budding yeast chromosomes reveals that protein-protein interactions can mediate sister chromatid cohesion. Curr Biol, 6, 1599-1608.
Studitsky, V.M., Clark, D.J. and Felsenfeld, G. (1994) A Histone Octamer Can Step Around a Transcribing Polymerase Without Leaving the Template. Cell, 76, 371-382.
Suter, B., Livingstone-Zatchej, M. and Thoma, F. (1999) Mapping cyclobutane-pyrimidine dimers in DNA and using DNA-repair by photolyase for chromatin analysis in yeast. Methods Enzymol, 304, 447-461.
Svaren, J. and Horz, W. (1997) Transcription factors vs nucleosomes: regulation of the PHO5 promoter in yeast. Trends Biochem. Sci., 22, 93-97.
Szentirmay, M.N., Musso, M., Van Dyke, M.W. and Sawadogo, M. (1998) Multiple rounds of transcription by RNA polymerase II at covalently cross-linked templates. Nucleic Acids Res., 26, 2754-2760.
Szentirmay, M.N. and Sawadogo, M. (2000) Spatial organization of RNA polymerase II transcription in the nucleus. Nucleic Acids Res., 28, 2019-2025.
Szeto, L. and Broach, J.R. (1997) Role of α2 protein in donor locus selection during mating type interconversion. Mol.Cell.Biol., 17, 751-759.
Takahashi, M., Altschmied, L. and Hillen, W. (1986) Kinetic and equilibrium characterization of the Tet repressor-tetracycline complex by fluorescence measurements. Evidence for divalent metal ion requirement and energy transfer. J Mol Biol, 187, 341-348.
Tan, S. and Richmond, T.J. (1998) Crystal structure of the yeast MATalpha2/MCM1/DNA ternary complex. Nature, 391, 660-666.
Teng, Y., Yu, S. and Waters, R. (2001) The mapping of nucleosomes and regulatory protein binding sites at the Saccharomyces cerevisiae MFA2 gene: a high resolution approach. Nucleic Acids Res., 29, E64-64.
Thoma, F., Koller, T. and Klug, A. (1979) Involvement of histone H1 in the organization of the nucleosome and of the salt-dependent superstructures of chromatin. J Cell Biol, 83, 403-427.
Treitel, M.A. and Carlson, M. (1995) Repression by SSN6-TUP1 is directed by MIG1, a repressor/activator protein. Proc. Natl. Acad. Sci. USA, 92, 3132-3136.
Tsukiyama, T., Becker, P. and Wu, C. (1994) ATP-dependent nucleosome disruption at a heat-shock promoter mediated by binding of GAGA transcription factor. Nature, 367, 525-532.
Tzamarias, D. and Struhl, K. (1994) Functional dissection of the yeast Cyc8-Tup1 transcriptional co-repressor complex. Nature, 369, 758-761.
196
Tzamarias, D. and Struhl, K. (1995) Distinct TPR motifs of Cyc8 are involved in recruiting the Cyc8-Tup1 corepressor complex to differentially regulated promoters. Genes Dev., 9, 821-831.
Ushinsky, S.C., Bussey, H., Ahmed, A.A., Wang, Y., Friesen, J., Williams, B.A. and Storms, R.K. (1997) Histone H1 in Saccharomyces cerevisiae. Yeast, 13, 151-161.
Van Dyke, M., Roeder, R. and Sawadogo, M. (1988) Physical analysis of transcription preinitiation complex assembly on a class II gene promoter. Science, 241, 1335-1338.
Van Dyke, M., Sawadogo, M. and Roeder, R. (1989) Stability of transcription complexes on class II genes. Mol. Cell. Biol., 9, 342-344.
Van Dyke, M.W. and Dervan, P.B. (1983) Methidiumpropyl-EDTA.Fe(II) and DNase I footprinting report different small molecule binding site sizes on DNA. Nucleic Acids Res., 11, 5555-5567.
Van Dyke, M.W. and Sawadogo, M. (1990) DNA-binding and transcriptional properties of human transcription factor TFIID after mild proteolysis. Mol. Cell. Biol., 10, 3415-3420.
Van Holde, K.E. (1989) Chromatin. Springer-Verlag, New York. Varanasi, U.S., Klis, M., Mikesell, P.B. and Trumbly, R.J. (1996) The Cyc8 (Ssn6)-
Tup1 corepressor complex is composed of one Cyc8 and four Tup1 subunits. Mol. Cell. Biol., 16, 6707-6714.
Vignali, M., Hassan, A.H., Neely, K.E. and Workman, J.L. (2000) ATP-dependent chromatin-remodeling complexes. Mol Cell Biol, 20, 1899-1910.
Vignali, M. and Workman, J.L. (1998) Location and function of linker histones. Nat Struct Biol, 5, 1025-1028.
Wahi, M., Komachi, K. and Johnson, A.D. (1998) Gene regulation by the yeast Ssn6-Tup1 corepressor. Cold Spring Harb. Symp. Quant. Biol., 63, 447-457.
Wan, K.M., Nickerson, J.A., Krockmalnic, G. and Penman, S. (1999) The nuclear matrix prepared by amine modification. Proc. Natl. Acad. Sci. USA, 96, 933-938.
Wang, X. and Simpson, R.T. (2001) Chromatin structure mapping in Saccharomyces cerevisiae in vivo with DNase I. Nucleic Acids Res., 29, 1943-1950.
Waterborg, J.H. (2000) Steady-state levels of histone acetylation in Saccharomyces cerevisiae. J Biol Chem, 275, 13007-13011.
Watson, A.D., Edmondson, D.G., Bone, J.R., Mukai, Y., Yu, Y., Du, W., Stillman, D.J. and Roth, S.Y. (2000) Ssn6-Tup1 interacts with class I histone deacetylases required for repression. Genes Dev., 14, 2737-2744.
Wei, Y., Mizzen, C.A., Cook, R.G., Gorovsky, M.A. and Allis, C.D. (1998) Phosphorylation of histone H3 at serine 10 is correlated with chromosome condensation during mitosis and meiosis in Tetrahymena. Proc Natl Acad Sci U S A, 95, 7480-7484.
Weinmann, P., Gossen, M., Hillen, W., Bujard, H. and Gatz, C. (1994) A chimeric transactivator allows tetracycline-responsive gene expression in whole plants. Plant J, 5, 559-569.
Weintraub, H. and Groudine, M. (1976) Chromosomal subunits in active genes have an altered conformation. Science, 193, 848-856.
197
Weiss, K. and Simpson, R.T. (1997) Cell type-specific chromatin organization of the region that governs directionality of yeast mating type switching. EMBO J., 16, 4352-4360.
Weiss, K. and Simpson, R.T. (1998) High-resolution structural analysis of chromatin at specific loci: Saccharomyces cerevisiae silent mating type locus HMLalpha. Mol. Cell. Biol., 18, 5392-5403.
Weston, S.A., Lahm, A. and Suck, D. (1992) X-ray structure of the DNaseI-d(GGTATACC)2 complex at 2.3A resolution. J.Mol.Biol., 226, 1237-1256.
Widom, J. (1998) Chromatin structure: linking structure to function with histone H1. Curr Biol, 8, R788-791.
Williams, F.E. and Trumbly, R.J. (1990) Characterization of TUP1, a mediator of glucose repression in Saccharomyces cerevisiae. Mol. Cell. Biol., 10, 6500-6511.
Wolffe, A. (1998) Chromatin : structure and function. Academic Press, London. Woodcock, C.L. (1989) Immunoelectron microscopy of nucleosomes. Methods
Enzymol, 170, 180-192. Woodcock, C.L. and Dimitrov, S. (2001) Higher-order structure of chromatin and
chromosomes. Curr Opin Genet Dev, 11, 130-135. Woodcock, C.L. and Horowitz, R.A. (1997) Electron microscopy of chromatin.
Methods, 12, 84-95. Woodcock, C.L. and Horowitz, R.A. (1998) Electron microscopic imaging of
chromatin with nucleosome resolution. Methods Cell Biol, 53, 167-186. Workman, J. and Kingston, R. (1992a) Nucleosome core displacement in vitro via a
metastable transcription factor-nucleosome complex. Science, 258, 1780-1784.
Workman, J. and Kingston, R. (1998a) Alteration of nucleosome structure as a mechanism of transcriptional regulation. Annu. Rev. Biochem., 67, 545-579.
Workman, J. and Roeder, R. (1987a) Binding of transcription factor TFIID to the major late promoter during in vitro nucleosome assembly potentiates subsequent initiation by RNA polymerase II. Cell, 51, 613-622.
Workman, J., Taylor, I., Kingston, R. and Roeder, R. (1991) Control of class II gene transcription during in vitro nucleosome assembly. Methods Cell Biol., 35, 419-447.
Workman, J.L., Abmayr, S.M., Cromlish, W.A. and Roeder, R.G. (1988) Transcriptional regulation by the immediate early protein of pseudorabies virus during in vitro nucleosome assembly. Cell., 55, 211-219.
Workman, J.L. and Kingston, R.E. (1992b) Nucleosome core displacement in vitro via a metastable transcription factor nucleosome complex. Science., 258, 1780-1784.
Workman, J.L. and Kingston, R.E. (1998b) Alteration of nucleosome structure as a mechanism of transcriptional regulation. Annu.Rev.Biochem., 67, 545-579.
Workman, J.L. and Roeder, R.G. (1987b) Binding of transcription factor TFIID to the major late promoter during in vitro nucleosome assembly potentiates subsequent initiation by RNA polymerase II. Cell., 1, 613-622.
198
Worrall, A.F. and Connolly, B.A. (1990) The chemical synthesis of a gene coding for bovine pancreatic DNase I and its cloning and expression in E. coli. J.Biol.Chem., 265, 21889-21995.
Wu, C. (1980) The 5' ends of Drosophila heat shock genes in chromatin are hypersensitive to DNase I. Nature, 286, 854-860.
Wu, C. and Gilbert, W. (1981) Tissue-specific exposure of chromatin structure at the 5' terminus of the rat preproinsulin II gene. Proc Natl Acad Sci U S A, 78, 1577-1580.
Wu, C., Weiss, K., Yang, C., Harris, M.A., Tye, B.K., Newlon, C.S., Simpson, R.T. and Haber, J.E. (1998) Mcm1 regulates donor preference controlled by the recombination enhancer in Saccharomyces mating-type switching. Genes Dev., 12, 1726-1737.
Wu, X.H. and Haber, J.E. (1995) MATa donor preference in yeast mating-type switching: Activation of a large chromosomal region for recombination. Gene Develop., 9, 1922-1932.
Wyrick, J., Holstege, F., Jennings, E., Causton, H., Shore, D., Grunstein, M., Lander, E. and Young, R. (1999) Chromosomal landscape of nucleosome-dependent gene expression and silencing in yeast. Nature, 402, 418-421.
Xiao, H., Friesen, J. and Lis, J. (1995) Recruiting TATA-binding protein to a promoter: transcriptional activation without an upstream activator. Mol. Biol. Cell, 15, 5757-5761.
Xu, M., Kladde, M.P., Van Etten, J.L. and Simpson, R.T. (1998) Cloning, characterization and expression of the gene coding for a cytosine-5-DNA methyltransferase recognizing GpC. Nucleic Acids Res., 26, 3961-3966.
Yean, D. and Gralla, J. (1997) Transcription reinitiation rate: a special role for the TATA box. Mol. Cell. Biol., 17, 3809-3816.
Yudkovsky, N., Ranish, J. and Hahn, S. (2000) A transcription reinitiation intermediate that is stabilized by activator. Nature, 408, 225-229.
Zaret, K.S. (1999) In vivo analysis of chromatin structure. Methods Enzymol., 304, 612-626.
Zawel, L., Kumar, K. and Reinberg, D. (1995) Recycling of the general transcription factors during RNA polymerase II transcription. Genes Dev., 9, 1479-1490.
Zhang, Z., Varanasi, U., Carrico, P. and Trumbly, R.J. (2002a) Mutations of the WD repeats that compromise Tup1 repression function maintain structural integrity of the WD domain trypsin-resistant core. Arch Biochem. Biophys., 406, 47-54.
Zhang, Z., Varanasi, U. and Trumbly, R.J. (2002b) Functional dissection of the global repressor Tup1 in yeast: dominant role of the C-terminal repression domain. Genetics, 161, 957-969.
Zhong, H., McCord, R. and Vershon, A. (1999) Identification of target sites of the alpha2-Mcm1 repressor complex in the yeast genome. Genome Res., 9, 1040-1047.
Zlatanova, J. (1997) H1 histone in yeast. Trends Biochem. Sci., 22, 49. Zou, S., Ke, N., Kim, J.M. and Voytas, D.F. (1996) The Saccharomyces
retrotransposon Ty5 integrates preferentially into regions of silent chromatin at the telomeres and mating loci. Gene Develop., 10, 634-645.
199
Zou, S. and Voytas, D.F. (1997) Silent chromatin determines target preference of the Saccharomyces retrotransposon Ty5. Proc.Natl.Acad.Sci.USA, 94, 7412-7416.
Zou, S., Wright, D.A. and Voytas, D.F. (1995) The Saccharomyces Ty5 retrotransposon family is associated with origins of DNA replication at the telomeres and the silent mating locus HMR. Proc.Natl.Acad.Sci.USA, 92, 920-924.

Appendix
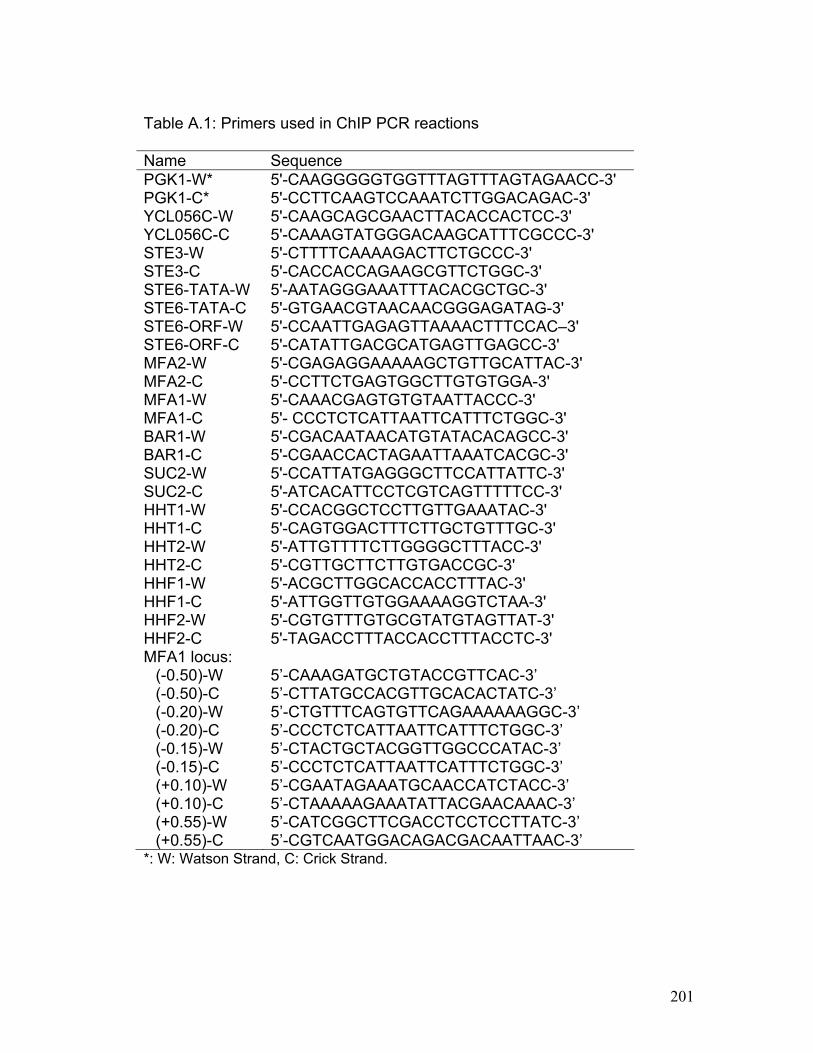
201
Table A.1: Primers used in ChIP PCR reactions
Name Sequence PGK1-W* PGK1-C* YCL056C-W YCL056C-C STE3-W STE3-C STE6-TATA-W STE6-TATA-C STE6-ORF-W STE6-ORF-C MFA2-W MFA2-C MFA1-W MFA1-C BAR1-W BAR1-C SUC2-W SUC2-C HHT1-W HHT1-C HHT2-W HHT2-C HHF1-W HHF1-C HHF2-W HHF2-C MFA1 locus:
(-0.50)-W (-0.50)-C (-0.20)-W (-0.20)-C (-0.15)-W (-0.15)-C (+0.10)-W (+0.10)-C (+0.55)-W (+0.55)-C
5'-CAAGGGGGTGGTTTAGTTTAGTAGAACC-3' 5'-CCTTCAAGTCCAAATCTTGGACAGAC-3' 5'-CAAGCAGCGAACTTACACCACTCC-3' 5'-CAAAGTATGGGACAAGCATTTCGCCC-3' 5'-CTTTTCAAAAGACTTCTGCCC-3' 5'-CACCACCAGAAGCGTTCTGGC-3' 5'-AATAGGGAAATTTACACGCTGC-3' 5'-GTGAACGTAACAACGGGAGATAG-3' 5'-CCAATTGAGAGTTAAAACTTTCCAC–3' 5'-CATATTGACGCATGAGTTGAGCC-3' 5'-CGAGAGGAAAAAGCTGTTGCATTAC-3' 5'-CCTTCTGAGTGGCTTGTGTGGA-3' 5'-CAAACGAGTGTGTAATTACCC-3' 5'- CCCTCTCATTAATTCATTTCTGGC-3' 5'-CGACAATAACATGTATACACAGCC-3' 5'-CGAACCACTAGAATTAAATCACGC-3' 5'-CCATTATGAGGGCTTCCATTATTC-3' 5'-ATCACATTCCTCGTCAGTTTTTCC-3' 5'-CCACGGCTCCTTGTTGAAATAC-3' 5'-CAGTGGACTTTCTTGCTGTTTGC-3' 5'-ATTGTTTTCTTGGGGCTTTACC-3' 5'-CGTTGCTTCTTGTGACCGC-3' 5'-ACGCTTGGCACCACCTTTAC-3' 5'-ATTGGTTGTGGAAAAGGTCTAA-3' 5'-CGTGTTTGTGCGTATGTAGTTAT-3' 5'-TAGACCTTTACCACCTTTACCTC-3' 5’-CAAAGATGCTGTACCGTTCAC-3’ 5’-CTTATGCCACGTTGCACACTATC-3’ 5’-CTGTTTCAGTGTTCAGAAAAAAGGC-3’ 5’-CCCTCTCATTAATTCATTTCTGGC-3’ 5’-CTACTGCTACGGTTGGCCCATAC-3’ 5’-CCCTCTCATTAATTCATTTCTGGC-3’ 5’-CGAATAGAAATGCAACCATCTACC-3’ 5’-CTAAAAAGAAATATTACGAACAAAC-3’ 5’-CATCGGCTTCGACCTCCTCCTTATC-3’ 5’-CGTCAATGGACAGACGACAATTAAC-3’
*: W: Watson Strand, C: Crick Strand.
VITA
Xi Wang Education:
1994-1997 M.S. In Biophysics, Peking University, P. R. China.
1989-1994 B.M. In Medicine, Beijing Medical University (Medical School of
Peking University), P. R. China.
Publications:
Wang, X., and Simpson, R. T. (2003) Involvement of higher order chromatin
structure in repression of MFA1 gene in yeast cells. (In preparation)
Wang, X., and Simpson, R. T. (2003) TATA box binding protein persists at active
promoters in vivo. (Submitted)
Wang, X., and Simpson, R. T. (2001) Chromatin structure mapping in
Saccharomyces cerevisiae in vivo with DNase I. Nucleic Acids Res.
29:1943-1950.
Presentations:
2002 International Yeast Genetics and Molecular Biology Meeting. Title: In
vivo analysis of TFIID binding to DNA. (Poster)
2001 Mid-Atlantic Yeast Genetic Meeting. Title: Chromatin structure mapping
in Saccharomyces cerevisiae in vivo with DNase I. (Poster)
Related Documents