aggreko 1 INTERIM RESULTS FOR THE SIX MONTHS ENDED 30 JUNE 2017 2 AUGUST 2017 Business priorities delivering; full year guidance unchanged Chris Weston, Chief Executive Officer, commented: “I am confident that the changes we have made in the last two years are delivering results, with our first half performance supporting our view that, Argentina aside, we will grow this year. In particular, we have made good progress enhancing our product offering, improving our customer experience and reducing our cost base, all of which makes us more competitive. As we look forward, energy markets and technologies are evolving and we continue to invest and grow our capabilities to take advantage of the opportunities this presents.” Financial Highlights • Group revenue of £792 million in line with prior year excluding impact of currency and pass- through fuel o Excluding legacy contracts in Argentina, revenue was up 6% • Half year profit before tax and exceptional items of £63 million (2016: £71 million) in line with market expectations • Full year guidance unchanged • Interim dividend maintained at 9.38 pence • Strong operating cash inflow of £184 million (2016: £100 million) as working capital initiative begins to deliver results o Improvement on payables, further work required on receivables Business Unit Highlights • Power Solutions Utility order intake of 430 MW year to date (2016: 875 MW); off-hire rate of 15% (2016: 20%) • Power Solutions Industrial revenue grew 20%, Eurasia year to date order intake of 179 MW (2016: 165 MW) • Rental Solutions revenues grew 2%; excluding oil and gas, revenue grew 7% Business Priorities Highlights • Expect the initiatives outlined in 2015 to be delivered by the end of 2018 • New CRM and website live across much of the business significantly improving customer experience, with full roll-out complete in 2018 • On track to deliver cash savings of more than £100 million • Product portfolio continues to develop, with market leading diesel, gas and HFO solutions and the recent addition of solar and storage, to further reduce cost of energy for our customers

Welcome message from author
This document is posted to help you gain knowledge. Please leave a comment to let me know what you think about it! Share it to your friends and learn new things together.
Transcript

aggreko 1
I NTER IM RESULTS FOR THE S I X MONTHS
ENDED 30 JUNE 2017
2 AUGUST 2017
Business priorities delivering; full year guidance unchanged
Chris Weston, Chief Executive Officer, commented:
“I am confident that the changes we have made in the last two years are delivering
results, with our first half performance supporting our view that, Argentina aside, we
will grow this year. In particular, we have made good progress enhancing our product
offering, improving our customer experience and reducing our cost base, all of which
makes us more competitive. As we look forward, energy markets and technologies are
evolving and we continue to invest and grow our capabilities to take advantage of the
opportunities this presents.”
Financial Highlights
• Group revenue of £792 million in line with prior year excluding impact of currency and pass-
through fuel
o Excluding legacy contracts in Argentina, revenue was up 6%
• Half year profit before tax and exceptional items of £63 million (2016: £71 million) in line with
market expectations
• Full year guidance unchanged
• Interim dividend maintained at 9.38 pence
• Strong operating cash inflow of £184 million (2016: £100 million) as working capital initiative
begins to deliver results
o Improvement on payables, further work required on receivables
Business Unit Highlights
• Power Solutions Utility order intake of 430 MW year to date (2016: 875 MW); off-hire rate of
15% (2016: 20%)
• Power Solutions Industrial revenue grew 20%, Eurasia year to date order intake of 179 MW
(2016: 165 MW)
• Rental Solutions revenues grew 2%; excluding oil and gas, revenue grew 7%
Business Priorities Highlights
• Expect the initiatives outlined in 2015 to be delivered by the end of 2018
• New CRM and website live across much of the business significantly improving customer
experience, with full roll-out complete in 2018
• On track to deliver cash savings of more than £100 million
• Product portfolio continues to develop, with market leading diesel, gas and HFO solutions
and the recent addition of solar and storage, to further reduce cost of energy for our
customers
aggreko 2
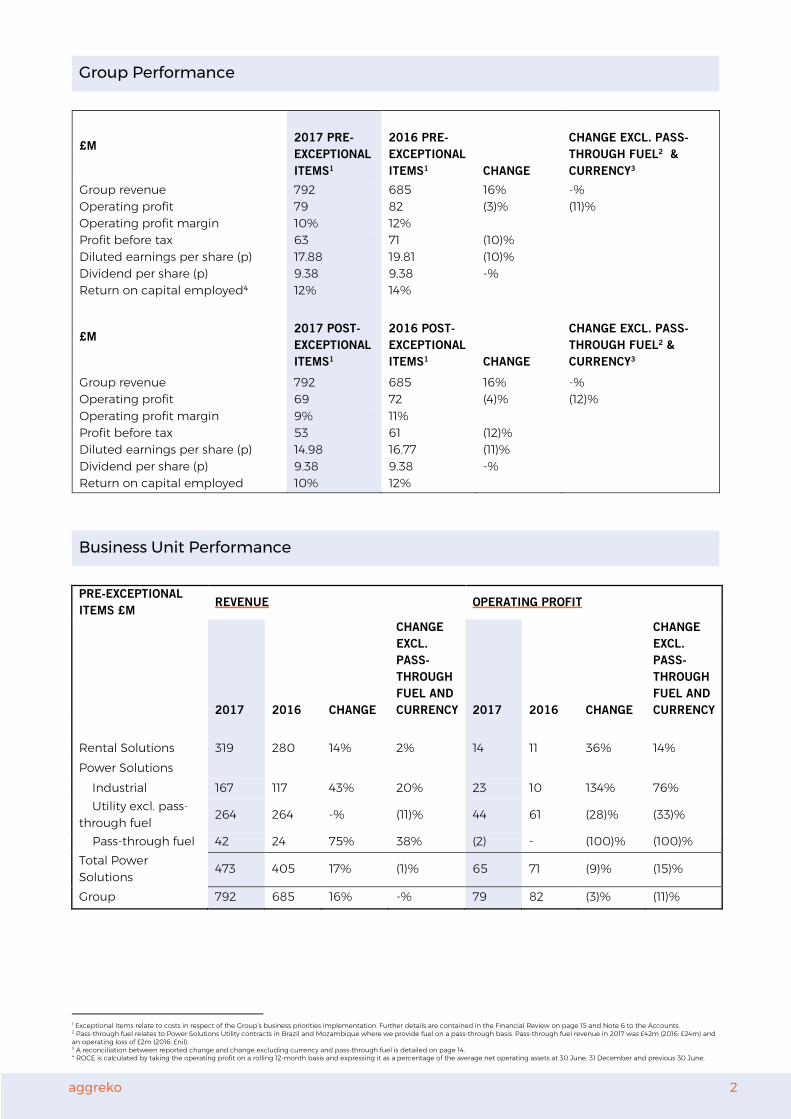
Group Performance
£M
2017 PRE-
EXCEPTIONAL
ITEMS1
2016 PRE-
EXCEPTIONAL
ITEMS1
CHANGE
CHANGE EXCL. PASS-
THROUGH FUEL2 &
CURRENCY3
Group revenue 792 685 16% -%
Operating profit 79 82 (3)% (11)%
Operating profit margin 10% 12%
Profit before tax 63 71 (10)%
Diluted earnings per share (p) 17.88 19.81 (10)%
Dividend per share (p) 9.38 9.38 -%
Return on capital employed4 12% 14%
£M
2017 POST-
EXCEPTIONAL
ITEMS1
2016 POST-
EXCEPTIONAL
ITEMS1
CHANGE
CHANGE EXCL. PASS-
THROUGH FUEL2 &
CURRENCY3
Group revenue 792 685 16% -%
Operating profit 69 72 (4)% (12)%
Operating profit margin 9% 11%
Profit before tax 53 61 (12)%
Diluted earnings per share (p) 14.98 16.77 (11)%
Dividend per share (p) 9.38 9.38 -%
Return on capital employed 10% 12%
Business Unit Performance
PRE-EXCEPTIONAL
ITEMS £M REVENUE OPERATING PROFIT
2017 2016 CHANGE
CHANGE
EXCL.
PASS-
THROUGH
FUEL AND
CURRENCY 2017 2016 CHANGE
CHANGE
EXCL.
PASS-
THROUGH
FUEL AND
CURRENCY
Rental Solutions 319 280 14% 2% 14 11 36% 14%
Power Solutions
Industrial 167 117 43% 20% 23 10 134% 76%
Utility excl. pass-
through fuel 264 264 -% (11)% 44 61 (28)% (33)%
Pass-through fuel 42 24 75% 38% (2) - (100)% (100)%
Total Power
Solutions 473 405 17% (1)% 65 71 (9)% (15)%
Group 792 685 16% -% 79 82 (3)% (11)%
1 Exceptional items relate to costs in respect of the Group’s business priorities implementation. Further details are contained in the Financial Review on page 15 and Note 6 to the Accounts. 2 Pass-through fuel relates to Power Solutions Utility contracts in Brazil and Mozambique where we provide fuel on a pass-through basis. Pass-through fuel revenue in 2017 was £42m (2016: £24m) and an operating loss of £2m (2016: £nil). 3 A reconciliation between reported change and change excluding currency and pass-through fuel is detailed on page 14. 4 ROCE is calculated by taking the operating profit on a rolling 12-month basis and expressing it as a percentage of the average net operating assets at 30 June, 31 December and previous 30 June.

aggreko 3
POST-EXCEPTIONAL
ITEMS £M REVENUE OPERATING PROFIT
2017 2016 CHANGE
CHANGE
EXCL.
PASS-
THROUGH
FUEL AND
CURRENCY 2017 2016 CHANGE
CHANGE
EXCL.
PASS-
THROUGH
FUEL AND
CURRENCY
Rental Solutions 319 280 14% 2% 11 5 123% 68%
Power Solutions
Industrial 167 117 43% 20% 18 8 113% 56%
Utility excl. pass-
through fuel 264 264 -% (11)% 42 59 (29)% (34)%
Pass-through fuel 42 24 75% 38% (2) - (100)% (100)%
Total Power
Solutions 473 405 17% (1)% 58 67 (14)% (20)%
Group 792 685 16% -% 69 72 (4)% (12)%
Future Reporting
11th October 2017 Customer Business Priority teach-in
November 2017 Q3 2017 trading update
Enquiries
Investors & Analysts
Louise Bryant, Aggreko plc
Tom Hull, Aggreko plc
+44 7876 478 272
+44 7342 056 727
Media
John Sunnucks / Liz Morley, Bell Pottinger +44 20 3772 2500
Analyst Presentation
A presentation will be held for analysts and investors today at 9am (BST) at the London Stock
Exchange, 10 Paternoster Square, EC4M 7LS. A live web-cast and a copy of the slides will be
available on our website at www.plc.aggreko.com/investors.
Watch Chris Weston discuss the highlights on our website: www.plc.aggreko.com/investors/investor-
centre.

aggreko 4
I NTRODUCT ION FROM CHRIS WESTON , CEO
“Two years ago, in response to changing market conditions, we announced our Business Priorities;
we acknowledged that the world had changed, economic growth had slowed and competition
had increased and that we needed to better understand the needs of our customers. In response,
we implemented an extensive change programme focused on three areas, Customer, Technology
and Efficiency. I am pleased that we are now beginning to see the results of these initiatives,
allowing us to effectively respond to the changing needs of our customers. There is still work to do,
and energy markets are evolving, with decarbonisation, decentralisation and digitisation becoming
increasingly apparent, and we continue to position Aggreko to take advantage of these
opportunities.”
RESULTS FOR THE S I X MONTHS TO 30 JUNE 2017
Group Trading Performance
Unless otherwise stated, the figures quoted below are pre-exceptional items and exclude the
impact of currency and pass-through fuel. We believe reporting our financial results on this basis
provides a better understanding of the performance of the business over the period under review.
It is also worth noting that in our Power Solutions Utility business, there has been significant
repricing and some off-hires of contracts we have held in Argentina since 2008. As a result, on
occasion we will refer to performance excluding the impact of these contracts.
Group revenue was in line with the prior year. Rental Solutions revenue was up 2% with solid
growth in Europe partially offset by a small decrease in Australia Pacific, with the comparator
including an emergency contract in Tasmania. North American revenue was up 1% on prior year
with growth in most sectors helping to offset the year on year decrease in oil and gas revenue;
excluding the impact of oil and gas, revenue was up 8%. Power Solutions Industrial revenue
increased 20% with strong growth from Eurasia, the Middle East and Africa. Power Solutions Utility
revenue was down 11% due to repricing and off-hires in Argentina. Excluding the impact of
Argentina, Power Solutions Utility revenue grew 1% and Group revenue grew 6%.
The Group operating margin was 10% (2016: 12%). The Rental Solutions margin was up one
percentage point on the same period last year, at 5%. The Power Solutions Industrial margin was
up six percentage points at 14%, due to the growth in Middle East and Eurasia and restructuring of
our businesses in Latin America. The Power Solutions Utility margin was down six percentage points
at 17%, driven by the volume and price reduction in Argentina and also one-off benefits in the prior
year comparators, most notably in indirect tax and service material costs. The lower Group margin
impacted the Group return on capital employed (ROCE), which was 12% (2016: 14%).
The Group delivered profit before tax of £63 million (2016: £71 million). Diluted earnings per share
(DEPS) was 17.88 pence (2016: 19.81 pence).
Reported Financial Measures
Reported revenue and operating profit include the translational impact of currency as Aggreko’s
revenues and profits are earned in a number of different currencies (most notably the US Dollar),
which are then translated and reported in sterling. The movement in exchange rates in the period
had the translational impact of increasing revenue by £93 million and operating profit by £9 million.
In addition, the Group separately reports fuel revenue from contracts in our Power Solutions Utility
business in Brazil and Mozambique, where we manage fuel on a pass-through basis on behalf of
our customers. The reason for the separate reporting is that fuel revenue on these contracts is

aggreko 5
entirely dependent on fuel prices and volumes of fuel consumed, and these can be volatile and
may distort the view of the performance of the underlying business. In 2017, fuel revenue from
these contracts was £42 million (2016: £24 million).
Reported Group revenue was up 16% on prior year with Rental Solutions up 14% and Power
Solutions Industrial and Utility up 43% and 6% respectively.
During the period the Group incurred exceptional costs relating to the implementation of our
Business Priorities of £10 million (2016: £10 million) which are split: Rental Solutions £3 million (2016:
£6 million), Power Solutions Utility £2 million (2016: £2 million) and Power Solutions Industrial £5
million (2016: £2 million). These are explained on page 15.
Group operating margin post exceptional items was 9% (2016: 11%). The Rental Solutions margin
was up two percentage points on a post-exceptional basis at 4%. The Power Solutions Industrial
margin was up four percentage points, post exceptional items due to the growth in Middle East
and Eurasia. The Power Solutions Utility margin, excluding pass-through fuel on post-exceptional
item basis, was down six percentage points driven by the volume and price reduction in Argentina
and also one-off benefits in the prior year comparatives, most notably in indirect tax and service
material costs.
Group ROCE post exceptional items was 10% (2016: 12%). Profit before tax and post exceptional
items was £53 million (2016: £61 million) and diluted earnings per share post-exceptional items was
14.98p (2016: 16.77p).
Dividends
The Group is proposing to maintain the interim dividend at 9.38 pence per share (2016: 9.38 per
share), this equates to dividend cover pre-exceptional items of 1.9 times (2016: 2.1 times). Dividend
cover post-exceptional items is 1.6 times (2016: 1.8 times). Dividend cover is calculated as basic
earnings per share for the period divided by dividend per share.
Cashflow and Balance Sheet
During the first six months, we generated an operating cash inflow of £184 million (2016: £100
million). The increase in operating cash flow is mainly driven by lower working capital outflows year
on year with an outflow of £38 million in 2017 compared to £101 million outflow in 2016. This year’s
outflow is the net of a £65 million inflow from trade and other payables, as our now established
procurement function has worked to improve supplier terms and leverage our scale and spend.
However, trade and other receivables has more than offset this improvement, increasing £103
million, explained as follows.
The increase in trade and other receivables is analysed by business unit as a: £5 million decrease in
Rental Solutions; a £34 million increase in Power Solutions Industrial and a £74 million increase in
the Power Solutions Utility business. The increase in Power Solutions Industrial is driven by the 20%
increase in revenue. In Power Solutions Utility, £36 million of the increase in the debtor book relates
to new contracts in Brazil which have recently been commissioned and include fuel, therefore the
revenue per megawatt generated is much greater; the balance outstanding is in line with
commercial terms and there is no issue with the recoverability. The remaining increase is driven by
a few customers in Africa who are taking longer to pay given restrictions on liquidity and access to
US Dollars. None of these customers dispute the debt, amounts have been received from each in
the year to date and payment plans are being agreed to clear the overdue amounts. Recognising
the increase in overdue debt, the Power Solutions Utility debtor provision has increased to $73
million, $10 million higher than December 2016.

aggreko 6
At the start of this year we initiated a project to reduce our working capital. In the first six months,
we have focused on our largest businesses and have dedicated work streams for payables,
receivables and inventory. We have made good progress on payables and are starting to make
progress with inventory. As we anticipated, the biggest challenge is the Power Solutions Utility
debtor book which is an area of particular focus. The project is ongoing and we will provide a
further update at the year end.
Fleet capital expenditure was £115 million (2016: £91 million) which was 0.8 times fleet depreciation.
Of this, £41 million was invested to continue to develop our medium speed HFO fleet and £21
million in continuing to refurbish our diesel fleet to the more fuel efficient, higher output G3+
engine; this now makes up around 30% of the Power Solutions Utility diesel fleet.
Net debt was £683 million at 30 June 2017, £49 million higher than the prior year. There are a
number of movements driving the increase, including £10 million in currency, notably the
weakening of sterling against the US Dollar, and the acquisitions noted on page 11. This resulted in
net debt to EBITDA on a rolling 12-month basis of 1.3 times compared to 1.2 times at June 2016.
Outlook
Our full year guidance remains unchanged. The changes we have made in the last two years are delivering results, with performance in the first half supporting our view that, Argentina aside, we will grow this year.
We have made three acquisitions so far this year, which strengthen our position in two key markets and bring capability in the integration of energy systems based on battery storage, which we believe will present opportunities as energy markets and technologies continue to evolve. We continue to expect fleet capital expenditure for the full year to be £300 million.

aggreko 7
BUS INESS UNI T PERFORMANCE REV I EW
RENTAL SOLUT IONS
REVENUE OPERATING PROFIT
2017 2016 CHANGE
CHANGE
EXCLUDING
CURRENCY 2017 2016 CHANGE
CHANGE
EXCLUDING
CURRENCY
Pre-exceptional
items £m 319 280 14% 2% 14 11 36% 14%
Operating Margin 5% 4%
pre-exceptional
items
Post-exceptional
items £m 319 280 14% 2% 11 5 123% 68%
Operating Margin 4% 2%
post-exceptional
items
Headlines
• Revenue and operating profit up 2% and 14% respectively, excluding currency and
exceptional items
• Revenue on the same basis and excluding oil and gas, grew 7%
• 24 MW next generation gas contracts won
• Strong growth in temperature control, up 13% excluding currency
Commentary
Our Rental Solutions business had a solid performance in the first six months with revenue
excluding the impact of currency up 2% on the prior year and operating profit (excluding
exceptional items) up 14%. The increase in operating profit relative to the increase in revenue is
driven by cost reduction in our North American business and lower mobilisation and service costs in
Australia Pacific, with the comparator including costs relating to the 108 MW emergency response
contract in Tasmania last year.
North American revenue, excluding currency, was up 1% on the prior year. Oil and gas sector
revenues in North America, although 28% lower when compared to the first half of 2016, were up
on the fourth quarter of 2016. Most of the other sectors in North America grew, with revenue
excluding oil and gas increasing 8%, with a particularly strong performance in temperature control,
up 17%.
In our Australia Pacific business, revenue excluding currency decreased 2%, a good performance
given the large Tasmania contract in the comparatives. We saw good growth in the mining and
construction sectors, however this was offset by a decline in oil and gas and utilities.
Our Continental European business saw revenue excluding currency increase 3% aided by good
growth in Germany and Eastern Europe, partially offset by a decrease in the Netherlands. The
Northern European business delivered good growth with revenue excluding currency increasing
11%, driven by the utility and construction sectors.

aggreko 8
POWER SOLUT IONS
PRE-EXCEPTIONAL
ITEMS £M REVENUE OPERATING PROFIT
2017 2016 CHANGE
CHANGE
EXCL.
PASS-
THROUGH
FUEL AND
CURRENCY 2017 2016 CHANGE
CHANGE
EXCL.
PASS-
THROUGH
FUEL AND
CURRENCY
Industrial 167 117 43% 20% 23 10 134% 76%
Utility excl. pass-
through fuel 264 264 -% (11)% 44 61 (28)% (33)%
Pass-through fuel 42 24 75% 38% (2) - (100)% (100)%
Total Power Solutions 473 405 17% (1)% 65 71 (9)% (15)%
Operating Margin
Industrial 14% 8%
Utility excl. pass-through fuel 17% 23%
Total Power Solutions excl. pass-through fuel 16% 19%
POST-EXCEPTIONAL
ITEMS £M REVENUE OPERATING PROFIT
2017 2016 CHANGE
CHANGE
EXCL.
PASS-
THROUGH
FUEL AND
CURRENCY 2017 2016 CHANGE
CHANGE
EXCL.
PASS-
THROUGH
FUEL AND
CURRENCY
Industrial 167 117 43% 20% 18 8 113% 56%
Utility excl. pass-
through fuel 264 264 -% (11)% 42 59 (29)% (34)%
Pass-through fuel 42 24 75% 38% (2) - (100)% (100)%
Total Power Solutions 473 405 17% (1)% 58 67 (14)% (20)%
Operating Margin
Industrial 11% 7%
Utility excl. pass-through fuel 16% 22%
Total Power Solutions excl. pass-through fuel 14% 18%

aggreko 9
Headlines
• Power Solutions Industrial revenue and operating profit excluding currency increased 20%
and 76% respectively driven by growth in our Eurasia, Middle East and Africa businesses and
cost savings from restructuring in Latin America
• Power Solutions Utility revenue and operating profit reflect impact of offhires and repricing
of legacy contracts in Argentina
o Reduction in price and volume in Argentina had a £34 million impact on revenue
excluding currency
• Power Solutions Utility order intake year to date of 430 MW plus 200 MW from KBT
acquisition in Indonesia (2016: 875 MW)
• Secured 28 MW of next generation gas contracts and initial HFO and solar-diesel contracts
• Power Solutions Utility debtor provision increased by $10 million due to slower payments in
Africa
Commentary
Overall, our Power Solutions business saw revenue excluding pass-through fuel and currency
decline by 1% and on the same basis operating profit pre-exceptional items decrease by 15%
(operating profit post-exceptional items decreased by 20%).
In our Power Solutions Industrial business revenue excluding the impact of currency increased 20%.
In Eurasia revenue grew 71%, with order intake of 179 MW (2016: 165 MW) in the first six months. In
the Middle East and Africa we also delivered double-digit growth with particular strength in Qatar,
Dubai, Nigeria and Angola, although weaker in Saudi Arabia given the impact of the lower oil price.
In Asia, revenues were up 1% with a decrease in South Korea offset by an increase in Indonesia. The
restructuring work in Latin America has progressed well, with operating profit pre-exceptional items
up by £5 million.
Our Power Solutions Utility business saw revenue excluding currency and pass-through fuel
decrease by 11% due to repricing and off-hires in Argentina, an impact of £34 million on prior year.
Excluding the impact of Argentina revenue grew 1%. Operating margin pre-exceptional items
decreased to 17% (2016: 23%) driven by the reduction in Argentina and also one-off benefits in the
prior year comparatives, most notably in indirect tax and service material costs. Excluding the
impact of Argentina, the operating margin increased. Operating margin post-exceptional items was
16% (2016: 22%). In Argentina we are contracted to provide 174 MW of fixed site capacity and 30
MW of standby capacity until the end of 2017. In addition, we are still running a further 65 MW on a
day-to-day basis.
We continued to see delays in payments in Power Solutions Utility, in particular from customers in
Africa. As a result our bad debt provision increased by $10 million to $73 million. While the situation
is clearly challenging and many customers are struggling with liquidity, none dispute the debt,
payments have been made by each customer and we are working closely with them to agree
payment plans to clear the overdue amounts. The situation also continues to be very challenging in
Venezuela where we are operating at a considerably reduced number of megawatts. The overdue
debt is well provided given the political instability.
Order intake year to date is 430 MW (2016: 875 MW) with a higher conversion rate than in Q1. New
business included 95 MW in Bangladesh, 60 MW in Yemen, 60 MW in Sri Lanka and 20 MW in
Sierra Leone. We are pleased to have won 28 MW of next generation gas and initial contracts for
HFO (28 MW, Madagascar) and solar-diesel (7 MW). The sales pipeline for HFO and NGG contains a
number of opportunities which we expect to convert during the second half of the year; this is
supported by the build plan which will deliver a fleet in line with market demand.
aggreko 10
At the end of the period, our order book was over 72,000 MW months, the equivalent of 25 months’
revenue at the current run-rate (30 June 2016: 25 months). The off-hire rate in the first half was 15%
(2016: 20%). In addition we completed the acquisition of KBT in Indonesia in the first half which
adds growth of a further 200 MW to our Power Solutions Utility order book.
BUS INESS PR IORI T IES
Two years ago, we launched our business priorities focussing on our customer, our technology and
our efficiency, all of which were designed to improve our customer proposition, make us more
competitive and drive growth.
Rental Solutions
In Rental Solutions, we have focused on improving the customer journey, making it easier to do
business with us, primarily through implementing a number of systems and creating a digital
platform. Our new website, which was launched in May, is designed to be easier to navigate and
more user friendly; since its launch we have seen a marked increase in activity and people are
staying longer on the site. We have made good progress with the roll-out of our Customer
Relationship Management system (CRM) and it is now live in the UK and North America;
implementation in Continental Europe and Australia Pacific is planned for later this year. We will
also be launching Field Service Management, an operations system which will provide real-time
visibility of assets and technicians. We expect the full suite of systems / applications to improve
customer satisfaction, whilst improving utilisation and productivity.
Power Solutions
In Power Solutions, we have focused on understanding the needs of our customers and enhancing
our sales capability. We have increased our sales presence in key markets, particularly in the Power
Solutions Utility business, and we have overhauled our training programme. This ensures that our
sales people better understand the energy markets they operate in, our product offering and how
to tailor it for each customer in that market. The new CRM system has been deployed in the Power
Solutions Utility business and is providing better visibility of the sales pipeline; it will be
implemented in the Power Solutions Industrial business early next year.
We have developed our product offering, with the introduction of HFO and solar/diesel hybrid
products, the first contracts for which have been signed and we are now in the process of
mobilising. In addition, we have introduced a new generation of gas products which provides
significantly improved fuel efficiency and we have continued to develop our market leading diesel
product. The product road maps are multi-generational with upgrades at refurbishment, allowing
us to improve capital and fuel efficiency with less risk of stranded capital.
Efficiency
In addition to the business specific initiatives, across the Group we have been focused on reducing
our cost base. We initially committed to making annualised cash savings of around £80 million,
delivered by removing duplication and improving our procurement practices. In March we
committed to a further £25 million of annualised cash savings achieved by further work right-sizing
our Power Solutions businesses in Latin America, Asia and Africa. This latter piece of work removed
over 200 roles from these businesses, with the majority of these in Latin America. We have closed
seven facilities across Brazil, Chile and Peru while transferring over 450 generators to other regions
where demand is stronger. We remain on track to deliver these savings by the end of 2017. The use
of these savings will be balanced between reinvestment to drive growth and supporting margins
and returns.

aggreko 11
Our procurement function is now well embedded across the Group and a number of their key
activities such as improved supplier terms, more competitive tendering practices and new sourcing
tools, are now used throughout the business. In addition, we now have framework agreements in
place with our key OEM suppliers, focussed on building sustainable partnerships and reducing the
costs associated with ongoing maintenance of our equipment. In Power Solutions Utility, we are
currently reviewing our hub and logistics model to ensure this is optimally aligned to our markets.
We have made considerable progress across these initiatives, with a number completed and the
balance to be concluded during 2018. To ensure that the initiatives continue to deliver we are
developing KPIs with which to monitor the business and we will continue to identify other areas for
improvement on an ongoing basis.
A CQUIS IT IONS
As previously disclosed, we are continuously assessing the market landscape and typically have a
small pipeline of potential acquisitions. We invest for both scale and capability, including
adjacencies, and acquisitions are subject to our disciplined capital allocation process and have to
meet appropriate hurdle rates of return. In 2016 we acquired DRYCO, a specialist in moisture
control, drying, heating and cooling applications in key sectors in North America, and have made
three small acquisitions so far in 2017.
Younicos
Last month we announced the acquisition of Younicos for £40 million5, a pioneer and global market
leader in the development and deployment of integrated energy systems. This supports our
strategy of investing in technology that provides a lower cost of energy and broadens the range of
products available to our customers.
Younicos’ proprietary software and control systems, and its knowledge of batteries, together enable
the seamless integration of multiple energy sources, both thermal and renewable, providing a
reliable source of power and an optimised energy management system. We can leverage Younicos’
expertise and combine this with our generating technology, deployment capability and global scale
to provide customers with a reliable, cheaper and cleaner source of energy.
We see the initial opportunities from Younicos within Aggreko in Rental Solutions and Power
Solutions Industrial. In particular there are compelling opportunities in supporting off grid
applications in a number of sectors, such as mining and events; and grid connected opportunities,
such as spinning reserve displacement, where storage is used to provide extra capacity in case of
excess demand; and in supporting distributed generation, where the combination of a number of
generation sources (renewable, thermal) are required to provide a low cost, reliable solution. As
energy markets evolve, particularly in developed markets, with higher renewable penetration and
more distributed generation we expect such opportunities to become more prevalent and the
capabilities Younicos brings, coupled with Aggreko’s mobile, modular and more efficient products,
to become more important.
Younicos is an investment in the future of Aggreko. In 2016 it made a loss of £15 million, but it is
expected that performance will improve across 2017 and become profitable during the latter part
of 2018.
5 In addition, on completion there will be a net debt / cash adjustment of circa £7 million.

aggreko 12
Kerta Bumni Tekindo (KBT)
In June 2017 Aggreko purchased KBT for £25 million. KBT are an Indonesian Utility business with
over 200 MW of work on hire. As an archipelago of over 17,000 islands, Indonesia is a good market
for Aggreko’s solutions and this acquisition strengthens our business in this important power
market.
TuCo
Aggreko also completed the purchase of TuCo Industrial Products Inc., for £3 million. TuCo are a US
based temporary heat and air conditioning business based in Washington State with a focus on key
sectors, including events.
MED IUM TERM RETURN OBJECT I VES
Aggreko has return targets of around 20%, to be achieved in the medium term. The plans and
actions undertaken as a result of the business priorities and the acquisitions made, are all designed
to support the achievement of these objectives.

aggreko 13
FINANCIAL REVIEW
A summarised Income Statement for 2017 as well as related ratios are set out below. The first table
excludes exceptional items and the second table includes exceptional items.
PRE-EXCEPTIONAL ITEMS
£M
2017 2016
CHANGE
CHANGE EXCL. PASS-
THROUGH FUEL AND
CURRENCY
Revenues 792 685 16% -%
Operating profit 79 82 (3)% (11)%
Net interest expense (16) (11) (41)%
Profit before tax 63 71 (10)%
Taxation (18) (20) 10%
Profit after tax 45 51 (10)%
Diluted earnings per share (pence) 17.88 19.81 (10)%
Operating margin 10% 12% (2)pp
ROCE 12% 14% (2)pp
POST-EXCEPTIONAL ITEMS
£M
2017 2016
CHANGE
CHANGE EXCL. PASS-
THROUGH FUEL AND
CURRENCY
Revenues 792 685 16% -%
Operating profit 69 72 (4)% (12)%
Net interest expense (16) (11) (41)%
Profit before tax 53 61 (12)%
Taxation (15) (18) 14%
Profit after tax 38 43 (12)%
Diluted earnings per share (pence) 14.98 16.77 (11)%
Operating margin 9% 11% (2)pp
ROCE 10% 12% (2)pp

aggreko 14
Currency Translation
The movement in exchange rates in the period had the translational impact of increasing revenue
by £93 million and operating profit by £9 million. This was driven by the strength, against Sterling, of
all the principal currencies impacting the Group, most notably the US Dollar. Currency translation
also gave rise to a £54 million decrease in the value of net assets from December 2016 to June 2017.
Set out in the table below are the principal exchange rates which affected the Group’s profits and
net assets.
PRINCIPAL EXCHANGE RATES JUNE 2017 JUNE 2016 DEC 2016
(PER £ STERLING)
AVERAGE PERIOD AVERAGE PERIOD AVERAGE PERIOD
END END END
United States Dollar 1.26 1.30 1.43 1.33 1.36 1.23
Euro 1.16 1.14 1.28 1.19 1.22 1.17
UAE Dirhams 4.63 4.76 5.26 4.88 4.98 4.53
Australian Dollar 1.67 1.69 1.95 1.78 1.83 1.71
Brazilian Reals 4.01 4.28 5.29 4.27 4.74 4.01
Argentinian Peso 19.80 21.40 20.50 19.99 20.00 19.61
Russian Rouble 73.04 76.69 100.26 85.21 91.04 75.23
(Source: Bloomberg)
Reconciliation of Adjusted Movement to Reported Movement
The tables below reconcile the reported and adjusted revenue and operating profit movements:
Revenue
RS PSI PSU GROUP
2017 2016 CHANGE 2017 2016 CHANGE 2017 2016 CHANGE 2017 2016 CHANGE
£M £M % £M £M % £M £M % £M £M %
As reported 319 280 14% 167 117 43% 306 288 6% 792 685 16%
Pass-through
fuel - - - - (42) (24) (42) (24)
Currency
impact - 33 - 22 - 38 - 93
Adjusted 319 313 2% 167 139 20% 264 302 (11)% 750 754 -%
Operating profit RS PSI PSU GROUP
2017 2016 CHANGE 2017 2016 CHANGE 2017 2016 CHANGE 2017 2016 CHANGE
£M £M % £M £M % £M £M % £M £M %
As reported 11 5 123% 18 8 113% 40 59 (33)% 69 72 (4)%
Pass-through
fuel - - - - 2 - 2 -
Currency
impact - 2 - 3 - 4 - 9
Exceptional
items 3 6 5 2 2 2 10 10
Adjusted 14 13 14% 23 13 76% 44 65 (33)% 81 91 (11)% Note (i): RS – Rental Solutions; PSI – Power Solutions Industrial; PSU – Power Solutions Utility
Note (ii): the currency impact is calculated by taking 2016 numbers in local currency and retranslating them at 2017 average rates.

aggreko 15
Exceptional Items An exceptional charge of £10 million before tax was recorded in the six months to 30 June 2017 in
respect of the Group’s business priorities implementation. These costs include employment costs,
professional fees, severance costs and facility closure costs directly related to the implementation.
Interest
The net interest charge of £16 million was £5 million higher than last year reflecting higher average
net debt year on year and an increase in the effective interest rate. Interest cover, measured against
rolling 12-month EBITDA (Earnings before Interest, Taxes, Depreciation and Amortisation) remained
strong at 17 times (2016: 25 times) relative to the financial covenant attached to our borrowing
facilities that EBITDA should be no less than 4 times interest.
Effective Tax Rate
The current forecast of the effective tax rate for the full year, which has been used in the interim
accounts, is 28% which is the same as the first half last year.
Dividends
The Board has decided to pay an interim dividend of 9.38 pence per ordinary share which is
maintained in line with last year; dividend cover is 1.9 times (30 June 2016: 2.1 times). This interim
dividend will be paid on 6 October 2017 to shareholders on the register at 8 September 2017, with
an ex-dividend date of 7 September 2017. Dividend cover is calculated as basic earnings per share
for the period divided by dividend per share.
Cashflow
The net cash inflow from operations during the period totalled £184 million (2016: £100 million). The
increase in cash inflow from operations was mainly driven by reduction in the working capital
outflow of £63 million. This funded capital expenditure of £128 million (2016: £98 million). Of the
£128 million, £115 million (2016: £91 million) was spent on fleet.
Net debt was £683 million at 30 June 2017, £49 million higher than the prior year. There are a
number of movements driving the increase, including £10 million in currency, notably the
weakening of sterling against the US dollar, and the acquisitions noted above. This resulted in net
debt to EBITDA on a rolling 12-month basis of 1.3 times compared to 1.2 times at June 2016.
The increase in operating cash inflow is mainly driven by lower working capital outflows year on
year with an outflow of £38 million in 2017 compared to £101 million outflow in 2016. This year’s
outflow is the net of a £65 million inflow from trade and other payables, as our now established
procurement function has worked to improve supplier terms and leverage our scale and spend.
However trade and other receivables has more than offset this improvement increasing £103
million which is explained as follows.
The increase in trade and other receivables is broken down by business unit as a: £5 million
decrease in Rental Solutions; a £34 million increase in Power Solutions Industrial and a £74 million
increase in the Power Solutions Utility business. The increase in Power Solutions Industrial is driven
by the 20% increase in revenue. In Power Solutions Utility, £36 million of the increase in the debtor
book relates to new contracts in Brazil which have recently been commissioned and include fuel,
therefore the revenue per megawatt generated is much greater; the balance outstanding is in line
with commercial terms and there is no issue with the recoverability. The remaining increase is
driven by a few customers in Africa who are taking longer to pay given restrictions on liquidity and

aggreko 16
access to US Dollars. None of these customers dispute the debt, amounts have been received from
each in the year to date and payment plans are being agreed to clear the overdue amounts.
Recognising the increase in overdue debt, the Power Solutions Utility debtor provision has
increased to $73 million, $10 million higher than December 2016.
At the start of this year we initiated a project to reduce our working capital. In the first six months,
we have focused on our largest businesses and have dedicated work streams for payables,
receivables and inventory. We have made good progress on payables and are starting to make
progress with inventory. As we anticipated, the biggest challenge is the Power Solutions Utility
debtor book which is an area of particular focus. The project is ongoing and we will provide a
further update at the year end.
Financial Resources
The Group maintains sufficient facilities to meet its normal funding requirements over the medium
term. At 30 June 2017, these facilities totalled £1,295 million in the form of committed bank
facilities arranged on a bilateral basis with a number of international banks and private placement
notes. The financial covenants attached to these facilities are that EBITDA should be no less than 4
times interest and net debt should be no more than 3 times EBITDA; at 30 June 2017, these stood
at a comfortable 17 times and 1.3 times respectively. The maturity profile of the borrowings is
detailed in Note 11 in the Accounts.
Net debt amounted to £683 million at 30 June 2017 and, at that date, un-drawn committed
facilities were £625 million.
Net Operating Assets
The net operating assets of the Group (including goodwill) at 30 June 2017 totalled £2,070 million,
£79 million higher than the same period in 2016. Excluding the impact of currency net operating
assets are £34 million higher. The main components of net operating assets are detailed in the
table below.
£ MILLION 2017 2016 MOVEMENT MOVEMENT EXCLUDING THE IMPACT
OF CURRENCY
Rental Fleet 1,157 1,131 2% -%
Property & Plant 106 99 7% 6%
Inventory 238 233 2% -%
Net Trade Debtors 480 376 27% 25%
A key measure of Aggreko’s performance is the return (expressed as adjusted operating profit)
generated from average net operating assets (ROCE). For each half year reporting period, we
calculate ROCE by taking the operating profit on a rolling 12-month basis and expressing it as a
percentage of the average net operating assets at 30 June, 31 December and the previous 30 June.
In the first half of 2017 the ROCE decreased to 12% compared with 14% for the same period in 2016
driven by the decrease in the Group operating margin.

aggreko 17
Acquisitions
The Group completed two acquisitions in the six months to 30 June 2017. On 14 June 2017, the
Group acquired Kerta Bumni Tekindo (KBT), an Indonesia-based power rental company for a total
consideration of £25 million ($33 million). On 27 January 2017, the Group acquired TuCo Industrial
Products Inc., a temporary heat and air conditioning company for a total consideration of £3 million.
Details of these acquisitions is contained in Note 15 to the Accounts. In addition on 3 July we
announced an agreement to acquire Younicos, a global market leader in the development and
deployment of integrated energy systems, based on battery storage. The cost of the acquisition was
£40 million and in addition there will be a net debt/cash adjustment of circa £7 million payable.
Shareholders’ Equity Shareholders’ equity decreased by £56 million to £1,312 million in the six months ended 30 June
2017, represented by the net assets of the Group of £1,995 million before net debt of £683 million.
The movements in shareholders’ equity are analysed in the table below:
MOVEMENTS IN SHAREHOLDERS’ EQUITY
£ MILLION £ MILLION
AS AT 1 JANUARY 2017 1,368
Profit for the period post exceptional items 38
Dividend6 (45)
Retained earnings
Employee share awards
(7)
4
Re-measurement of retirement benefits (1)
Currency translation (54)
Movement in hedging reserve 2
AS AT 30 JUNE 2017 1,312
Principal Risks and Uncertainties
In the day to day operations of the Group, we face risks and uncertainties. We aim to mitigate and
manage these risks and to aid this the Board has a risk management process which is described on
pages 52 to 53 of the 2016 Annual Report and Accounts. Also set out on pages 52 to 60 of that
report are the principal risks and uncertainties which we believe could potentially impact the
Group, and these are summarised below:
• Market dynamics – Rental Solutions;
• Market dynamics – Power Solutions;
• Change management relating to our business priorities;
• Talent management;
• Technology – market introduction;
• Cyber security;
• Security;
• Health and safety;
• Environment;
• Failure to conduct business dealings with integrity and honesty;
• Taxation;
• Failure to collect payments or to recover assets.
6 Reflects the final dividend for 2016 of 17.74 pence per share (2015: 17.74 pence) that was paid during the period.

aggreko 18
In the main we do not believe that the principal risks and uncertainties facing the business have
changed materially since the publication of the Annual Report and we believe these will continue
to be the same in the second half of the year.
Shareholder information Our website can be accessed at www.plc.aggreko.com. This contains a large amount of information
about our business, including a range of charts and data, which can be downloaded for easy
analysis. The website also carries copies of recent investor presentations, as well as Stock Exchange
announcements.
Chris Weston
Carole Cran
Chief Executive Officer Chief Financial Officer
2 August 2017

aggreko 19
GROUP INCOME STATEMENT
FOR THE SIX MONTHS ENDED 30 JUNE 2017 (UNAUDITED)
6 MONTHS ENDED 30 JUNE 2017 6 MONTHS ENDED 30 JUNE 2016
TOTAL BEFORE EXCEPTIONAL TOTAL BEFORE
EXCEPTIONAL ITEMS EXCEPTIONAL EXCEPTIONAL
ITEMS (NOTE 6) ITEMS ITEMS
2017 2017 2017 2016 2016 2016
NOTES £ MILLION £ MILLION £ MILLION £ MILLION £ MILLION £ MILLION
Revenue 4 792 - 792 685 - 685
Cost of sales (375) (1) (376) (309) - (309)
Gross profit 417 (1) 416 376 - 376
Distribution costs (232) (3) (235) (214) - (214)
Administrative expenses (108) (6) (114) (85) (10) (95)
Other income 2 - 2 5 - 5
Operating profit 4 79 (10) 69 82 (10) 72
Net finance costs
- Finance cost (17) - (17) (12) - (12)
- Finance income 1 - 1 1 - 1
Profit before taxation 63 (10) 53 71 (10) 61
Taxation 8 (18) 3 (15) (20) 2 (18)
Profit for the period 45 (7) 38 51 (8) 43
All profit for the period is attributable to the owners of the Company.
Basic earnings per share (pence) 7 17.89 (2.91) 14.98 19.83 (3.04) 16.79
Diluted earnings per share (pence) 7 17.88 (2.90) 14.98 19.81 (3.04) 16.77
GROUP STATEMENT OF COMPREHENS IVE INCOME
FOR THE SIX MONTHS ENDED 30 JUNE 2017 (UNAUDITED)
6 MONTHS
ENDED
30 JUNE 2017
6 MONTHS
ENDED
30 JUNE 2016
£ MILLION £ MILLION
Profit for the period 38 43
Other comprehensive (loss)/income
Items that will not be reclassified to profit or loss
Remeasurement of retirement benefits
(1)
(9)
Items that may be reclassified subsequently to profit or loss
Cash flow hedges
2
1
Net exchange (losses)/gains offset in reserves (54) 150
Other comprehensive (loss)/income for the period (53) 142
Total comprehensive (loss)/income for the period (15) 185

aggreko 20
GROUP INCOME STATEMENT
FOR THE YEAR ENDED 31 DECEMBER 2016
TOTAL BEFORE
EXCEPTIONAL EXCEPTIONAL
ITEMS ITEMS
2016 2016 2016
NOTES £ MILLION £ MILLION £ MILLION
Revenue 4 1,515 - 1,515
Cost of sales (664) (30) (694)
Gross profit 851 (30) 821
Distribution costs (430) - (430)
Administrative expenses (182) (19) (201)
Other income 9 - 9
Operating profit 4 248 (49) 199
Net finance costs
- Finance cost (29) - (29)
- Finance income 2 - 2
Profit before taxation 221 (49) 172
Taxation 8 (63) 16 (47)
Profit for the year 158 (33) 125
All profit for the period is attributable to the owners of the Company.
Basic earnings per share (pence) 7 61.98 (13.10) 48.88
Diluted earnings per share (pence) 7 61.95 (13.09) 48.86
GROUP STATEMENT OF COMPREHENS IVE INCOME
FOR THE YEAR ENDED 31 DECEMBER 2016
2016
£ MILLION
Profit for the period 125
Other comprehensive income/(loss)
Items that will not be reclassified to profit or loss
Remeasurement of retirement benefits
Taxation on remeasurement of retirement benefits
(29)
5
Items that may be reclassified subsequently to profit or loss
Cashflow hedges
Taxation on cashflow hedges
1
-
Net exchange gains offset in reserves 220
Other comprehensive income for the period (net of tax) 197
Total comprehensive income for the period 322

aggreko 21
GROUP BALANCE SHEET
AS AT 30 JUNE 2017 (UNAUDITED)
30 JUNE 30 JUNE 31 DEC
2017 2016 2016
NOTES £ MILLION £ MILLION £ MILLION
Non-current assets
Goodwill 153 144 159
Other intangible assets 23 17 24
Property, plant and equipment 9 1,263 1,230 1,309
Deferred tax asset 52 32 51
1,491 1,423 1,543
Current assets
Inventories 238 233 247
Trade and other receivables 10 736 611 656
Cash 51 51 44
Derivative financial instruments 1 3 1
Current tax assets 25 29 20
1,051 927 968
Total assets 2,542 2,350 2,511
Current liabilities
Borrowings 11 (137) (65) (60)
Derivative financial instruments (1) (2) (2)
Trade and other payables (358) (277) (299)
Current tax liabilities (44) (57) (58)
Provisions (1) (2) (1)
(541) (403) (420)
Non-current liabilities
Borrowings 11 (597) (620) (633)
Derivative financial instruments (4) (7) (5)
Deferred tax liabilities (55) (58) (55)
Retirement benefit obligation
Contingent consideration
15
(30)
(3)
(11)
-
(30)
-
(689) (696) (723)
Total liabilities (1,230) (1,099) (1,143)
Net assets 1,312 1,251 1,368
Shareholders’ equity
Share capital 42 42 42
Share premium 20 20 20
Treasury shares (8) (15) (14)
Capital redemption reserve 13 13 13
Hedging reserve (net of deferred tax) (1) (3) (3)
Foreign exchange reserve 17 1 71
Retained earnings 1,229 1,193 1,239
Total shareholders’ equity 1,312 1,251 1,368

aggreko 22
GROUP CASH FLOW STATEMENT
FOR THE SIX MONTHS ENDED 30 JUNE 2017 (UNAUDITED)
6 MONTHS
ENDED
6 MONTHS
ENDED
YEAR
ENDED
30 JUNE 30 JUNE 31 DEC
2017 2016 2016
NOTES £ MILLION £ MILLION £ MILLION
Operating activities
Profit for the period 38 43 125
Adjustments for:
Exceptional items 10 10 19
Exceptional – impairment charge - - 30
Tax 15 18 47
Depreciation 149 135 281
Amortisation of intangibles 2 2 4
Finance income (1) (1) (2)
Finance cost 17 12 29
Profit on sale of PPE (2) (5) (9)
Share based payments 4 2 6
Changes in working capital (excluding the effects of
exchange differences on consolidation):
Increase in inventories - (22) (21)
Increase in trade and other receivables (103) (73) (81)
Increase/(decrease) in trade and other payables 65 (6) (17)
Cash flows relating to exceptional items (10) (15) (23)
Cash generated from operations 184 100 388
Tax paid (33) (22) (64)
Interest received 1 1 2
Interest paid (18) (12) (28)
Net cash generated from operating activities 134 67 298
Cash flows from investing activities
Acquisitions (net of cash acquired)
Acquisitions: repayment of loans and financing
15
15
(10)
(18)
-
-
(22)
-
Purchases of property, plant and equipment (PPE)
Purchase of other intangible assets
(128)
(2)
(98)
-
(263)
(5)
Proceeds from sale of PPE 6 14 23
Net cash used in investing activities (152) (84) (267)
Cash flows from financing activities
Increase in long-term loans 615 204 393
Repayment of long-term loans (551) (159) (373)
Net movement in short-term loans (10) 22 18
Dividends paid to shareholders (45) (45) (69)
Purchase of treasury shares - (8) (8)
Net cash from/(used in) financing activities 9 14 (39)
Net decrease in cash and cash equivalents (9) (3) (8)
Cash and cash equivalents at beginning of the period 25 32 32
Exchange gain on cash and cash equivalents - 2 1
Cash and cash equivalents at end of the period 16 31 25

aggreko 23
RECONC I L I AT ION OF NET CASH FLOW TO MOVEMENT IN NET DEBT
FOR THE SIX MONTHS ENDED 30 JUNE 2017 (UNAUDITED)
6 MONTHS
ENDED
6 MONTHS
ENDED
YEAR
ENDED
30 JUNE 30 JUNE 31 DEC
2017 2016 2016
NOTES £ MILLION £ MILLION £ MILLION
Decrease in cash and cash equivalents (9) (3) (8)
Cash inflow from movement in debt (54) (67) (38)
Changes in net debt arising from cash flows (63) (70) (46)
Exchange gain/(loss) 29 (75) (114)
Movement in net debt in period (34) (145) (160)
Net debt at beginning of period (649) (489) (489)
Net debt at end of period 11 (683) (634) (649)

aggreko 24
GROUP STATEMENT OF CHANGES IN EQU I TY
FOR THE SIX MONTHS ENDED 30 JUNE 2017 (UNAUDITED)
AS AT
30 JUNE 2017 ATTRIBUTABLE TO EQUITY HOLDERS OF THE COMPANY
ORDINARY
SHARE
CAPITAL
£ MILLLION
SHARE
PREMIUM
ACCOUNT
£ MILLLION
TREASURY
SHARES
£ MILLLION
CAPITAL
REDEMPTION
RESERVE
£ MILLLION
HEDGING
RESERVE
£ MILLLION
FOREIGN
EXCHANGE
RESERVE
(TRANSLATION)
£ MILLLION
RETAINED
EARNINGS
£ MILLLION
TOTAL
EQUITY
£ MILLLION
Balance at 1
January 2017 42 20 (14) 13 (3) 71 1,239 1,368
Profit for the
period - - - - - - 38 38
Other comprehensive
(loss)/income:
Fair value gains
on interest rate
swaps
-
-
-
- 2
-
- 2
Currency
translation
differences
(Note (i)) - - - - - (54) - (54)
Re-
measurement
of retirement
benefits (net of
tax)
-
-
-
- -
- (1) (1)
Total
comprehensive
income for the
period ended
30 June 2017
-
-
-
- 2 (54) 37 (15)
Transactions
with owners:
Employee share
awards - - - - - - 4 4
Issue of ordinary
shares to
employees
under share
option schemes
(Note (ii))
-
-
6
-
-
- (6) -
Dividends paid
during the
period - - - - - - (45) (45)
- - 6 - - - (47) (41)
Balance at 30
June 2017 42 20 (8) 13 (1) 17 1,229 1,312
(i) The currency translation difference is explained in the Financial Review on page 14.
(ii) During the period 435,760 Ordinary shares have been transferred from the Employee Benefit Trust to satisfy
the Restricted Stock Schemes. In addition 1,698 shares were transferred from the Employee Benefit Trust to participants in the Long Term Incentive Plan.

aggreko 25
GROUP STATEMENT OF CHANGES IN EQU I TY
FOR THE SIX MONTHS ENDED 30 JUNE 2017 (UNAUDITED)
AS AT
30 JUNE 2016 ATTRIBUTABLE TO EQUITY HOLDERS OF THE COMPANY
ORDINARY
SHARE
CAPITAL
£ MILLLION
SHARE
PREMIUM
ACCOUNT
£ MILLLION
TREASURY
SHARES
£ MILLLION
CAPITAL
REDEMPTION
RESERVE
£ MILLLION
HEDGING
RESERVE
£ MILLLION
FOREIGN
EXCHANGE
RESERVE
(TRANSLATION)
£ MILLLION
RETAINED
EARNINGS
£ MILLLION
TOTAL
EQUITY
£ MILLLION
Balance at 1
January 2016 42 20 (9) 13 (4) (149) 1,202 1,115
Profit for the
period - - - - - - 43 43
Other comprehensive
(loss)/income:
Fair value gains
on foreign
currency cash
flow hedge
-
-
-
- 2
-
- 2
Transfers from
hedging reserve
to revenue - - - - (1) - - (1)
Currency
translation
differences
-
-
-
- -
150 - 150
Re-
measurement
of retirement
benefits (net of
tax) - - - - - - (9) (9)
Total
comprehensive
income for the
period ended
30 June 2016
-
-
-
- 1 150 34 185
Transactions
with owners: - - - - - - - -
Purchase of
treasury shares
- - (8) - - - - (8)
Employee share
awards - - - - - - 4 4
Issue of ordinary
shares to
employees
under share
option schemes
(Note (i)) - - 2 - - - (2) -
Dividends paid
during the
period - - - - - - (45) (45)
- - (6) - - - (43) (49)
Balance at 30
June 2016 42 20 (15) 13 (3) 1 1,193 1,251
(i) During the period 109,434 Ordinary shares have been transferred from the Employee Benefit Trust to satisfy the
Restricted Stock Schemes. In addition 19,638 shares were transferred from the Employee Benefit Trust to
participants in the Long Term Incentive Plan.

aggreko 26
NOTES TO THE INTER IM ACCOUNTS
For the six months ended 30 June 2017 (unaudited)
1 . GENERAL INFORMAT ION
The Company is a public limited company which is listed on the London Stock Exchange and is
incorporated and domiciled in the UK. The address of the registered office is 120 Bothwell Street,
Glasgow, G2 7JS, UK.
This condensed interim financial information was approved for issue on 2 August 2017.
This condensed consolidated interim financial information does not comprise Statutory Accounts
within the meaning of Section 434 of the Companies Act 2006. Statutory Accounts for the year
ended 31 December 2016 were approved by the Board on 7 March 2017 and delivered to the
Registrar of Companies. The report of the auditors on those Accounts was unqualified, did not
contain an emphasis of matter paragraph and did not contain any statement under Section 498 of
the Companies Act 2006.
The condensed consolidated interim financial information is unaudited but has been reviewed by
the Group’s auditors, whose report is on page 38.
2 . BAS I S OF PREPARAT ION
This condensed consolidated interim financial information for the six months ended 30 June 2017
has been prepared in accordance with the Disclosure and Transparency Rules (DTR) of the Financial
Conduct Authority (previously the Financial Services Authority) and IAS 34 ‘Interim financial
reporting’ as adopted by the European Union. The condensed consolidated interim financial
information should be read in conjunction with the annual financial statements for the year ended
31 December 2016, which have been prepared in accordance with IFRSs as adopted by the
European Union.
Going concern basis
The Group’s banking facilities are primarily in the form of committed bank facilities arranged on a
bilateral basis with a number of international banks and private placement notes; facilities
totalled £1,295 million at 30 June 2017. The financial covenants attached to these facilities are that
EBITDA should be no less than 4 times interest (30 June 2017: 17 times excluding exceptional items)
and net debt should be no more than 3 times EBITDA (30 June 2017: 1.3 times excluding
exceptional items). The Group does not consider that these covenants are restrictive to its
operations. The maturity profile of the borrowings is detailed in Note 11 to the Accounts. Having
reassessed the principal risks and the Group's forecasts and projections, the directors considered it
appropriate to adopt the going concern basis of accounting in preparing the interim financial
information.
3 . ACCOUNTING POL I C IES
Except as described below, the accounting policies are consistent with those of the annual financial
statements for the year ended 31 December 2016, as described in those annual financial
statements.
Taxes on income in the interim periods are accrued using the tax rate that would be applicable to
expected total annual earnings.

aggreko 27
3 . ACCOUNTING POL I C IES CONT INUED
New and amended standards adopted by the Group There are no new IFRSs or IFRICs that are effective for the first time this year that have a material
impact on the Group.
New standards, amendments and interpretations issued but not effective for the financial year
beginning 1 January 2017 and not early adopted
IFRS 15, ‘Revenue from contracts with customers’ deals with revenue recognition and establishes
principles for reporting useful information to users of financial statements about the nature,
amount, timing and uncertainty of revenue and cash flows arising from an entity’s contracts with
customers. Revenue is recognised when a customer obtains control of a good or service and thus
has the ability to direct the use and obtain benefits from the good or service. The standard replaces
IAS 18 ‘Revenue’ and IAS 11 ‘Construction contracts’ and related interpretations. The standard is
effective for annual periods beginning on or after 1 January 2018. The Group has substantially
completed its assessment of the impact of this standard and the main changes we expect from
adopting IFRS 15 are:
• Mobilisation costs will be amortised over the contact period instead of being recognised as
incurred as equipment is mobilised before power is produced. Demobilisation costs, if they
can be measured reliably, will also be amortised over the contract period instead of being
recognised as incurred at the end of the contract. There is a difference in the definition of
contract period for mobilisation costs and demobilisation costs. In the former the contract
period is re-assessed for agreed extensions. In the latter the contract period is re-assessed if
there is a high probability of an extension however it doesn’t need to be agreed with the
customer.
• Mobilisation and demobilisation income (where timing is specifically stipulated in the
contract in order to match the timing of associated costs) will be recognised during the
period of provision of power.
• Judgement will be required around whether there is any restriction in recognising variable
revenue due to penalty clauses in the contracts however the probability of this is small.
• On some contracts there may be more than one performance obligation however we
expect the impact of this to be small.
We expect to be able to give an indication as to the likely effect on the annual results of
implementing IFRS 15 in the 2017 Annual Report.
IFRS 9, ‘Financial instruments’ addresses the classification, measurement and recognition of
financial assets and liabilities. The standard is effective for accounting periods beginning on
or after 1 January 2018. An impact assessment will be carried out during half two 2017 but we do
not expect this standard to have a material impact on the Group.
IFRIS 16, ‘Leases’ applies to annual periods beginning on or after 1 January 2019. IFRIS 16 requires
lessees to recognise a lease liability reflecting future lease payments and a ‘right-of-use asset’ for
virtually all lease contracts. The Group will assess the impact of IFRS 16 closer to the
implementation date however the main impact is expected to be the recognition of £92 million of
operating leases as right of use assets with a corresponding liability based on the information as at
31 December 2016. This will be updated during half two 2017.
There are no other IFRSs or IFRIC interpretations that are not yet effective that would be expected
to have a material impact on the Group.

aggreko 28
4 . SEGMENTAL REPORT ING
(a) Revenue by segment
EXTERNAL REVENUE
6 MONTHS 6 MONTHS YEAR
ENDED ENDED ENDED
30 JUNE 30 JUNE 31 DEC
2017 2016 2016
£ MILLION £ MILLION £ MILLION
Power Solutions
Industrial 167 117 262
Utility 306 288 624
473 405 886
Rental Solutions 319 280 629
Group 792 685 1,515
(i) Inter-segment transfers or transactions are entered into under the normal commercial terms and conditions that would also be available to unrelated third parties. All inter-segment revenue was less than £1 million.
(b) Profit by segment
OPERATING PROFIT
6 MONTHS 6 MONTHS YEAR
ENDED ENDED ENDED
30 JUNE 30 JUNE 31 DEC
2017 2016 2016
£ MILLION £ MILLION £ MILLION
Power Solutions
Industrial 23 10 32
Utility 42 61 164
65 71 196
Rental Solutions 14 11 52
Operating profit pre-exceptional items 79 82 248
Exceptional items (Note 6) (10) (10) (49)
Operating profit post-exceptional items 69 72 199
Finance costs - net (16) (11) (27)
Profit before taxation 53 61 172
Taxation (15) (18) (47)
Profit for the period/year 38 43 125

aggreko 29
4 . SEGMENTAL REPORT ING CONT INUED
(c) Depreciation and amortisation by segment
YEAR ENDED 31 DECEMBER 2016
6 MONTHS 6 MONTHS BEFORE
ENDED ENDED EXCEPTIONAL IMPAIRMENT
30 JUNE 30 JUNE CHARGES CHARGES TOTAL
2017 2016 2016 2016 2016
£ MILLION £ MILLION £ MILLION £ MILLION £ MILLION
Power Solutions
Industrial 36 30 63 - 63
Utility 67 61 127 - 127
103 91 190 - 190
Rental Solutions 48 46 95 30 125
Group 151 137 285 30 315
(d) Capital expenditure on property, plant & equipment and intangible assets by segment
6 MONTHS 6 MONTHS YEAR
ENDED ENDED ENDED
30 JUNE 30 JUNE 31 DEC
2017 2016 2016
£ MILLION £ MILLION £ MILLION
Power Solutions
Industrial 14 24 43
Utility 108 34 144
122 58 187
Rental Solutions 32 40 94
Group 154 98 281
(i) The net book value of total Group disposals of PPE during the period were £4 million. (30 June
2016: £9 million, 31 Dec 2016: £14 million). (ii) Capital expenditure comprises additions of property, plant and equipment (PPE) of £128 million
(30 June 2016: £98 million, 31 December 2016: £263 million), additions of intangible assets of £2 million (30 June 2016: £nil, 31 December 2016: £5 million), acquisitions of PPE of £24 million (30 June 2016: £nil, 31 December 2016: £10 million), and acquisitions of intangible assets of £nil (30 June 2016: £nil, 31 December 2016: £3 million).
aggreko 30
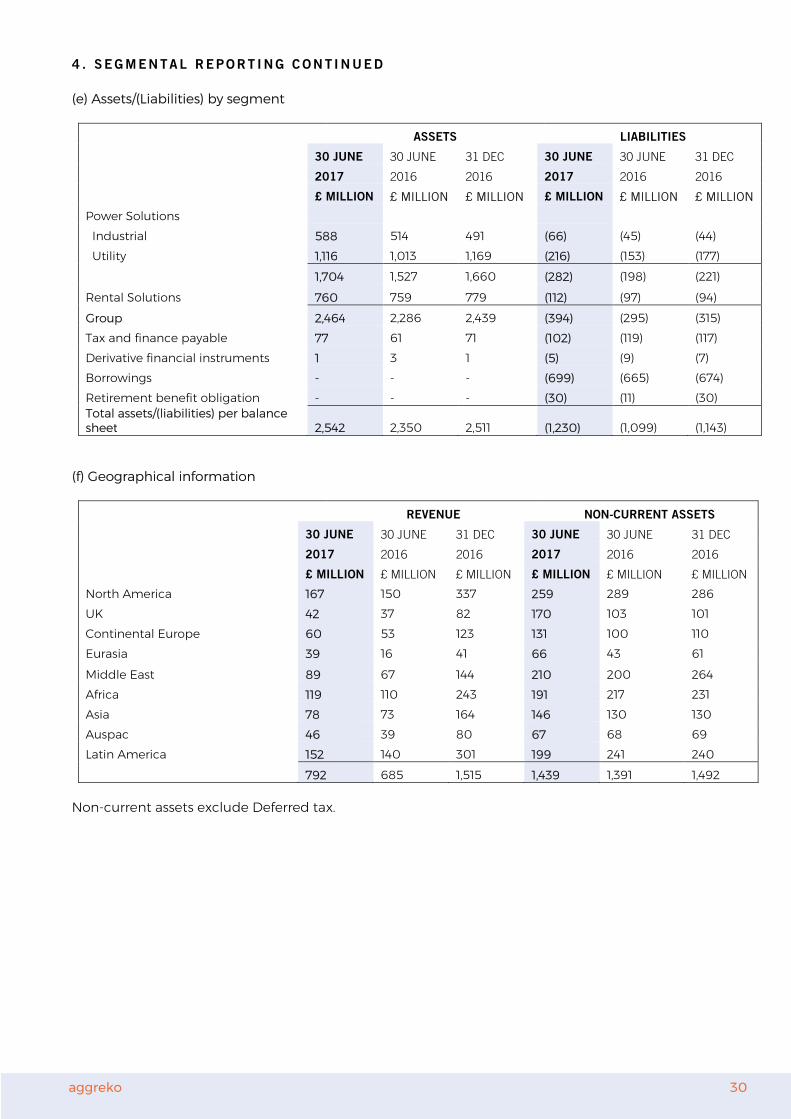
4 . SEGMENTAL REPORT ING CONT INUED
(e) Assets/(Liabilities) by segment
ASSETS LIABILITIES
30 JUNE 30 JUNE 31 DEC 30 JUNE 30 JUNE 31 DEC
2017 2016 2016 2017 2016 2016
£ MILLION £ MILLION £ MILLION £ MILLION £ MILLION £ MILLION
Power Solutions
Industrial 588 514 491 (66) (45) (44)
Utility 1,116 1,013 1,169 (216) (153) (177)
1,704 1,527 1,660 (282) (198) (221)
Rental Solutions 760 759 779 (112) (97) (94)
Group 2,464 2,286 2,439 (394) (295) (315)
Tax and finance payable 77 61 71 (102) (119) (117)
Derivative financial instruments 1 3 1 (5) (9) (7)
Borrowings - - - (699) (665) (674)
Retirement benefit obligation - - - (30) (11) (30)
Total assets/(liabilities) per balance sheet 2,542 2,350 2,511 (1,230) (1,099) (1,143)
(f) Geographical information
REVENUE NON-CURRENT ASSETS
30 JUNE 30 JUNE 31 DEC 30 JUNE 30 JUNE 31 DEC
2017 2016 2016 2017 2016 2016
£ MILLION £ MILLION £ MILLION £ MILLION £ MILLION £ MILLION
North America 167 150 337 259 289 286
UK 42 37 82 170 103 101
Continental Europe 60 53 123 131 100 110
Eurasia 39 16 41 66 43 61
Middle East 89 67 144 210 200 264
Africa 119 110 243 191 217 231
Asia 78 73 164 146 130 130
Auspac 46 39 80 67 68 69
Latin America 152 140 301 199 241 240
792 685 1,515 1,439 1,391 1,492
Non-current assets exclude Deferred tax.

aggreko 31
5 . D I V IDENDS
The dividends paid in the period were:
6 MONTHS 6 MONTHS YEAR
ENDED ENDED ENDED
30 JUNE 30 JUNE 31 DEC
2017 2016 2016
Total dividend (£ million) 45 45 69
Dividend per share (pence) 17.74 17.74 27.12
The interim dividend for the period was 9.38 pence (2016: 9.38 pence), amounting to a total
dividend of £24 million (2016: £24 million). This interim dividend will be paid on 6 October 2017 to
shareholders on the register on 8 September 2017, with an ex-dividend date of 7 September 2017.
6 . E XCEPT IONAL I TEMS
An exceptional charge of £10 million before taxation was recorded in the period in respect of the
Group’s business priorities implementation. The costs comprise £7 million of employee costs, £2
million of professional fees and £1 million of property related costs. The employee costs relate to
severance costs as well as the costs of employees who are working full time on the business
priorities implementation. This exceptional charge can be split into Rental Solutions £3 million,
Power Solutions – Industrial £5 million and Power Solutions – Utility £2 million.
7 . EARNINGS PER SHARE
Basic earnings per share have been calculated by dividing the earnings attributable to ordinary
shareholders by the weighted average number of shares in issue during the period, excluding shares
held by the Employee Share Ownership Trusts which are treated as cancelled.
30 JUNE 30 JUNE 31 DEC
2017 2016 2016
Profit for the period (£ million) 38 43 125
Weighted average number of ordinary shares in issue (million) 254 256 255
Basic earnings per share (pence) 14.98 16.79 48.88
For diluted earnings per share, the weighted average number of ordinary shares in issue is adjusted
to assume conversion of all potentially dilutive ordinary shares. These represent share options
granted to employees where the exercise price is less than the average market price of the
Company’s ordinary shares during the period. The number of shares calculated as above is
compared with the number of shares that would have been issued assuming the exercise of the
share options.

aggreko 32
7 . EARNINGS PER SHARE CONT INUED
30 JUNE 30 JUNE 31 DEC
2017 2016 2016
Profit for the period (£ million) 38 43 125
Weighted average number of ordinary shares in issue (million) 254 256 255
Adjustment for share options - - -
Diluted weighted average number of ordinary shares in issue (million) 254 256 255
Diluted earnings per share (pence) 14.98 16.77 48.86
Aggreko plc assesses the performance of the Group by adjusting earnings per share, calculated in accordance with IAS 33, to exclude items it considers to be material and non-recurring and believes that the exclusion of such items provides a better comparison of business performance. The calculation of earnings per ordinary share on a basis which excludes exceptional items is based on the following adjusted earnings:
30 JUNE 30 JUNE 31 DEC
2017 2016 2016
£ MILLION £ MILLION £ MILLION
Profit for the period 38 43 125
Exclude exceptional items (net of tax) 7 8 33
Adjusted earnings 45 51 158
An adjusted earnings per share figure is presented below.
Basic earnings per share pre-exceptional items (pence) 17.89 19.83 61.98
Diluted earnings per share pre-exceptional items (pence) 17.88 19.81 61.95
8 . TAXAT ION
The taxation charge for the period is based on an estimate of the Group’s expected annual effective
rate of tax for 2017 based on prevailing tax legislation at 30 June 2017. This is currently estimated to
be 28% on profits before exceptional items and 25% for exceptional items (June 2016: 28%;
December 2016: 28% on profits before exceptional items and June 2016: 19%; December 2016: 32%
on exceptional items).

aggreko 33
9 . PROPERTY , P LANT AND EQUIPMENT
SIX MONTHS ENDED 30 JUNE 2017
FREEHOLD
SHORT
LEASEHOLD
VEHICLES,
PLANT &
PROPERTIES PROPERTIES FLEET EQUIPMENT TOTAL
£ MILLION £ MILLION £ MILLION £ MILLION £ MILLION
Cost
At 1 January 2017 91 22 3,475 136 3,724
Exchange adjustments (2) - (135) (3) (140)
Additions - - 115 13 128
Acquisitions (Note 15) - - 24 - 24
Disposals - (1) (34) (1) (36)
At 30 June 2017 89 21 3,445 145 3,700
Accumulated depreciation
At 1 January 2017 36 16 2,272 91 2,415
Exchange adjustments (1) - (92) (2) (95)
Charge for the period 2 1 138 8 149
Disposals - (1) (30) (1) (32)
At 30 June 2017 37 16 2,288 96 2,437
Net book values
At 30 June 2017 52 5 1,157 49 1,263
At 31 December 2016 55 6 1,203 45 1,309
10 . TRADE AND OTHER RECE I VABLES
30 JUNE
2017
30 JUNE
2016
31 DEC
2016
£ MILLION £ MILLION £ MILLION
Trade receivables 553 458 521
Less: provision for impairment of receivables (73) (82) (67)
Trade receivables – net 480 376 454
Prepayments 45 63 38
Accrued income 140 125 109
Other receivables (Note (i)) 71 47 55
Total receivables 736 611 656
Provision for impairment of receivables
30 JUNE 30 JUNE 31 DEC
2017 2016 2016
£ MILLION £ MILLION £ MILLION
Power Solutions
Industrial 7 8 7
Utility 56 67 52
63 75 59
Rental Solutions 10 7 8
Group 73 82 67
(i) Other receivables include £8 million (30 June 2016: £nil, 31 December 2016: £8 million) of
private placement notes with one customer in Venezuela (PDVSA). The financial
instrument was booked at fair value which reflects our estimation of the recoverability of
these notes.
aggreko 34
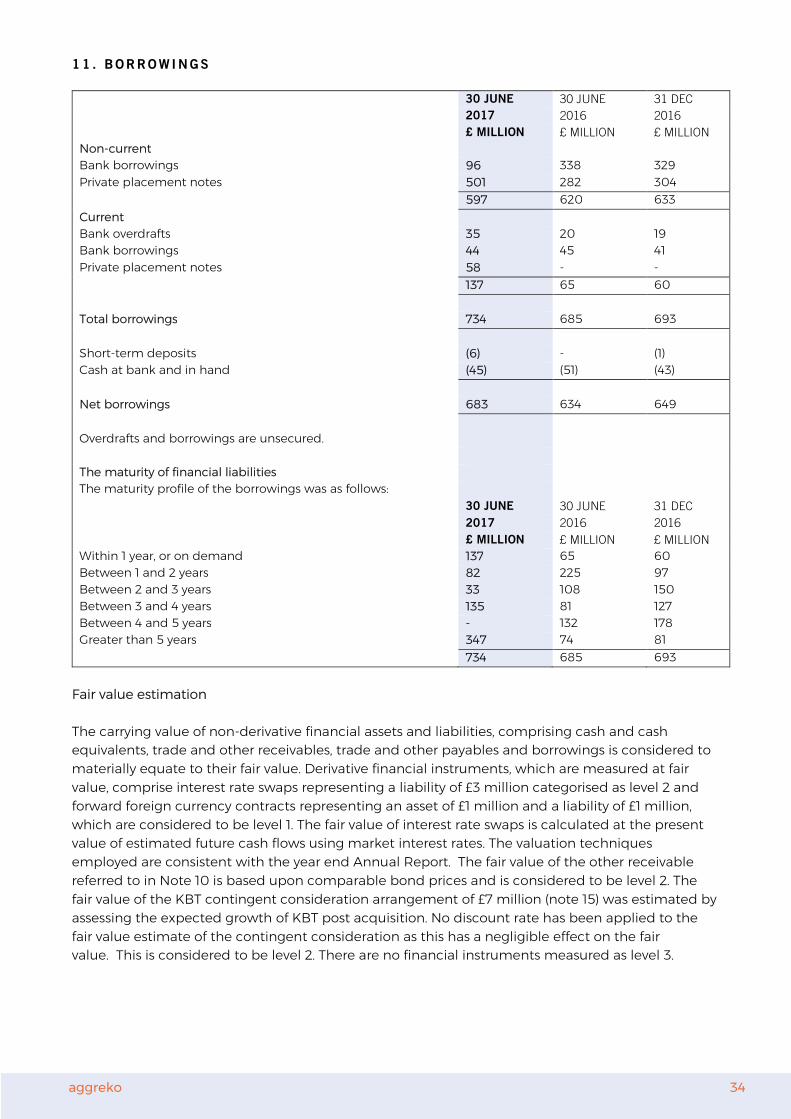
11 . BORROWINGS
30 JUNE 30 JUNE 31 DEC
2017 2016 2016
£ MILLION £ MILLION £ MILLION
Non-current
Bank borrowings 96 338 329
Private placement notes 501 282 304
597 620 633
Current
Bank overdrafts 35 20 19
Bank borrowings 44 45 41
Private placement notes 58 - -
137 65 60
Total borrowings 734 685 693
Short-term deposits (6) - (1)
Cash at bank and in hand (45) (51) (43)
Net borrowings 683 634 649
Overdrafts and borrowings are unsecured.
The maturity of financial liabilities
The maturity profile of the borrowings was as follows:
30 JUNE 30 JUNE 31 DEC
2017 2016 2016
£ MILLION £ MILLION £ MILLION
Within 1 year, or on demand 137 65 60
Between 1 and 2 years 82 225 97
Between 2 and 3 years 33 108 150
Between 3 and 4 years 135 81 127
Between 4 and 5 years - 132 178
Greater than 5 years 347 74 81
734 685 693
Fair value estimation
The carrying value of non-derivative financial assets and liabilities, comprising cash and cash
equivalents, trade and other receivables, trade and other payables and borrowings is considered to
materially equate to their fair value. Derivative financial instruments, which are measured at fair
value, comprise interest rate swaps representing a liability of £3 million categorised as level 2 and
forward foreign currency contracts representing an asset of £1 million and a liability of £1 million,
which are considered to be level 1. The fair value of interest rate swaps is calculated at the present
value of estimated future cash flows using market interest rates. The valuation techniques
employed are consistent with the year end Annual Report. The fair value of the other receivable
referred to in Note 10 is based upon comparable bond prices and is considered to be level 2. The
fair value of the KBT contingent consideration arrangement of £7 million (note 15) was estimated by
assessing the expected growth of KBT post acquisition. No discount rate has been applied to the
fair value estimate of the contingent consideration as this has a negligible effect on the fair
value. This is considered to be level 2. There are no financial instruments measured as level 3.

aggreko 35
12 . CAP I TAL COMMITMENTS
30 JUNE 30 JUNE 31 DEC
2017 2016 2016
£ MILLION £ MILLION £ MILLION
Contracted but not provided for (property, plant and equipment) 55 27 22
13 . RELATED PARTY TRANSACT IONS
Transactions between the Company and its subsidiaries, which are related parties, have been
eliminated on consolidation and are not disclosed in this note. There were no other related party
transactions in the period.
14 . SEASONAL ITY
The Group is subject to seasonality with the third quarter of the year being our peak demand
period, accordingly revenue and profits have historically been higher in the second half of the year.
15 . ACQU IS I T IONS
KBT (Kerta Bumni Tekindo) On 14 June 2017 the Group acquired 95% of the share capital of KBT, an Indonesia-based power rental company for a maximum consideration of £25 million. Included within this maximum consideration is £7 million which was deposited into an escrow account as contingent consideration. The total potential undiscounted amount of all future payments that the seller could be entitled to under the acquisition agreement is between £nil and £7 million payable after year 1 and year 3.
£ MILLION Current contingent consideration 4 Non-current contingent consideration 3
Total contingent consideration 7
These amounts are dependent upon a number of conditions relating to the contracts in place at the acquisition date. Deductions will be made for the following:
• Any contracts that: - are off-hired - are expired or have been terminated or - have extended at terms lower than those currently in place
• Any claims against the contract including overdue trade receivables, tax or misrepresentations,
The revenue and operating profit included in the consolidated income statement from 14 June 2017 to 30 June 2017 contributed by KBT was negligible. Had KBT been consolidated from 1 January 2017, the consolidated income statement for the period ended 30 June 2017 would show revenue and operating profit of £799 million and £69 million respectively. The acquisition method of accounting has been adopted and the goodwill arising on the purchase will be capitalised. Acquisition related costs of £0.4 million have been expensed in the period and are included within administrative expenses in the income statement.

aggreko 36
15 . ACQU IS I T IONS CONT INUED
KBT (Kerta Bumni Tekindo) Continued The details of the transaction and fair value of assets acquired are shown below:
FAIR VALUE
£ MILLION Property, plant & equipment 23 Trade and other receivables 3 Trade and other payables (1) Loans and financing (18) Net assets acquired 7 Goodwill - Contingent consideration 7 Add loans and financing settled 18 Net cash outflow 25
The fair values are provisional and will be finalised during half two 2017.
TuCo Industrial Products Inc On 27 January 2017 the Group completed the acquisition of the business and assets of TuCo Industrial Products Inc (TuCo). TuCo specialises in providing temporary heat and air conditioning equipment to the construction, industrial, commercial and special events industries. The purchase consideration paid in cash was £3 million. The revenue and operating profit included in the consolidated income statement from 27 January 2017 to 30 June 2017 contributed by TuCo was £1.4 million and £0.5 million respectively. Had TuCo been consolidated from 1 January 2017, the consolidated income statement for the period ended 30 June 2017 would show revenue and operating profit of £793 million and £69 million respectively. The acquisition method of accounting has been adopted and the goodwill arising on the purchase has been capitalised. Acquisition related costs of £0.2 million have been expensed in the period and are included within administrative expenses in the income statement. The details of the transaction and fair value of assets acquired are shown below:
FAIR VALUE
£ MILLION Property, plant & equipment 1 Inventory 1
Net assets acquired 2 Goodwill 1
Consideration per cash flow statement 3
Goodwill represents the value of synergies arising from the integration of the acquired business. Synergies include direct cost savings and the reduction of overheads as well as the ability to leverage Aggreko systems and access to assets.
16 . POST BALANCE SHEET EVENTS
On 3 July 2017 the Group announced the acquisition of Younicos, a global market leader in the development and deployment of integrated energy systems based on battery storage. The cost of the acquisition was £40 million and in addition there will be a net debt/cash adjustment of circa £7 million payable. For the year ended 31 December 2016 Younicos had revenues of £7 million and made an operating loss of £15 million.

aggreko 37
STATEMENT OF D IRECTORS ’ RESPONS IB I L I T IES
The Directors confirm that to the best of their knowledge, these condensed consolidated interim
financial statements have been prepared in accordance with IAS 34 as adopted by the European
Union, and that the interim management report includes a fair review of the information required
by DTR 4.2.7 and DTR 4.2.8, namely:
• An indication of important events that have occurred during the first six months and their
impact on the condensed set of financial statements, and a description of the principal risks
and uncertainties for the remaining six months of the financial year; and
• Material related party transactions in the first six months and any material changes in the
related-party transactions described in the last annual report.
The Directors of Aggreko plc are listed in the Aggreko plc Annual Report for 31 December 2016.
By order of the Board
Chris Weston Carole Cran
Chief Executive Officer Chief Financial Officer
2 August 2017

aggreko 38
I NDEPENDENT REV IEW REPORT TO AGGREKO PLC
Conclusion
We have been engaged by the company to review the condensed set of financial statements in the half-yearly financial report for the six months ended 30 June 2017 which comprises the Group Income Statement, Group Statement of Comprehensive Income, Group Balance Sheet, Group Cash Flow Statement, Group Statement of Changes in Equity, and the related explanatory notes.
Based on our review, nothing has come to our attention that causes us to believe that the condensed set of financial statements in the half-yearly financial report for the six months ended 30 June 2017 is not prepared, in all material respects, in accordance with IAS 34 Interim Financial
Reporting as adopted by the EU and the Disclosure Guidance and Transparency Rules (“the DTR”) of the UK’s Financial Conduct Authority (“the UK FCA”).
Scope of review
We conducted our review in accordance with International Standard on Review Engagements (UK and Ireland) 2410 Review of Interim Financial Information Performed by the Independent Auditor
of the Entity issued by the Auditing Practices Board for use in the UK. A review of interim financial information consists of making enquiries, primarily of persons responsible for financial and accounting matters, and applying analytical and other review procedures. We read the other information contained in the half-yearly financial report and consider whether it contains any apparent misstatements or material inconsistencies with the information in the condensed set of financial statements.
A review is substantially less in scope than an audit conducted in accordance with International Standards on Auditing (UK) and consequently does not enable us to obtain assurance that we would become aware of all significant matters that might be identified in an audit. Accordingly, we do not express an audit opinion.
Directors’ responsibilities
The half-yearly financial report is the responsibility of, and has been approved by, the directors. The directors are responsible for preparing the half-yearly financial report in accordance with the DTR of the UK FCA.
As disclosed in note 2, the annual financial statements of the group are prepared in accordance with International Financial Reporting Standards as adopted by the EU. The directors are responsible for preparing the condensed set of financial statements included in the half-yearly financial report in accordance with IAS 34 as adopted by the EU.
Our responsibility
Our responsibility is to express to the company a conclusion on the condensed set of financial statements in the half-yearly financial report based on our review.
The purpose of our review work and to whom we owe our responsibilities
This report is made solely to the company in accordance with the terms of our engagement to assist the company in meeting the requirements of the DTR of the UK FCA. Our review has been undertaken so that we might state to the company those matters we are required to state to it in this report and for no other purpose. To the fullest extent permitted by law, we do not accept or assume responsibility to anyone other than the company for our review work, for this report, or for the conclusions we have reached.
John Luke for and on behalf of KPMG LLP Chartered Accountants 319 St Vincent Street Glasgow G2 5AS 2 August 2017
Related Documents