1 Chpater-4: Solutions to Problems P4-1. Depreciation LG 1; Basic Depreciation Schedule Year Cost(1) Percentages from Table 4.2 (2) Depreciation [(1) (2)] (3) Asset A 1 $17,000 33% $ 5,610 2 $17,000 45 7,650 3 $17,000 15 2,550 4 $17,000 7 1,190 Asset B 1 $45,000 20% $ 9,000 2 $45,000 32 14,400 3 $45,000 19 8,550 4 $45,000 12 5,400 5 $45,000 12 5,400 6 $45,000 5 2,250 P4-2. Depreciation LG 1; Basic Depreciation Schedule Cork stopper machine Year Cost (1) Percentages from Table 4.2 (2) Depreciation [(1) (2)] (3) 1 $10,000 33% $ 3,300 2 $10,000 45 4,500 3 $10,000 15 1,500 4 $10,000 7 7000 P4-3. MACRS depreciation expense, taxes, and cash flow LG 1, 2; Challenge a. Depreciation expense $80,000 0.20 $16,000 (MACRS depreciation percentages found on Table 4.2 in the text.) b. New taxable income $430,000 $16,000 $414,000 Tax liability $113,900 [($414,000 $335,000) 0.34] $113,900 $26,860 $140,760 Original tax liability before depreciation expense: Tax liability $113,900 [($430,000 $335,000) 0.34] $113,900 $32,300 $146,200

Welcome message from author
This document is posted to help you gain knowledge. Please leave a comment to let me know what you think about it! Share it to your friends and learn new things together.
Transcript

1
Chpater-4: Solutions to Problems
P4-1. Depreciation
LG 1; Basic
Depreciation Schedule
Year
Cost(1)
Percentages from Table 4.2 (2)
Depreciation [(1) (2)] (3)
Asset A
1 $17,000 33% $ 5,610
2 $17,000 45 7,650
3 $17,000 15 2,550
4 $17,000 7 1,190
Asset B
1 $45,000 20% $ 9,000
2 $45,000 32 14,400
3 $45,000 19 8,550
4 $45,000 12 5,400
5 $45,000 12 5,400
6 $45,000 5 2,250
P4-2. Depreciation
LG 1; Basic
Depreciation Schedule
Cork stopper machine
Year
Cost (1)
Percentages from Table 4.2
(2)
Depreciation [(1) (2)]
(3)
1 $10,000 33% $ 3,300
2 $10,000 45 4,500
3 $10,000 15 1,500
4 $10,000 7 7000
P4-3. MACRS depreciation expense, taxes, and cash flow
LG 1, 2; Challenge
a. Depreciation expense $80,000 0.20 $16,000 (MACRS depreciation percentages found
on Table 4.2 in the text.)
b. New taxable income $430,000 $16,000 $414,000
Tax liability $113,900 [($414,000 $335,000) 0.34] $113,900 $26,860
$140,760
Original tax liability before depreciation expense:
Tax liability $113,900 [($430,000 $335,000) 0.34] $113,900 $32,300
$146,200
2
Tax savings $146,200 $140,760 $5,440
P4-4. Depreciation and accounting cash flow
LG 1, 2; Intermediate
a. Operating cash flow
Sales revenue $400,000
Less: Total costs before depreciation,
interest, and taxes 290,000
Depreciation expense 34,200 (= 0.19 x $180,000)
Earnings before interest and taxes $ 75,800
Less: Taxes at 40% 30,320
Net profit after taxes $ 45,480
Plus: Depreciation 34,200
Cash flow from operations $ 79,680
b. Depreciation and other noncash charges serve as a tax shield against income, increasing
annual cash flow.
P4-5. Classifying inflows and outflows of cash
LG 2; Basic
Item
Change ($)
I/O
Item
Change ($)
I/O
Cash 100 O Accounts receivable 700 I
Accounts payable
1,000 O Net profits 600 I
Notes payable 500 I Depreciation 100 I
Long-term debt 2,000 O Repurchase of stock 600 O
Inventory 200 O Cash dividends 800 O
Fixed assets 400 O Sale of stock 1,000 I
Note 1: Think of cash in terms of money in a checking account.
Note 2: As a non-cash charge depreciation is not really an I/O at all, but it will be reported as a
positive amount on the statement of cash flows.
P4-6. PROBLEM SET-1 ASSIGNMENT QUESTION
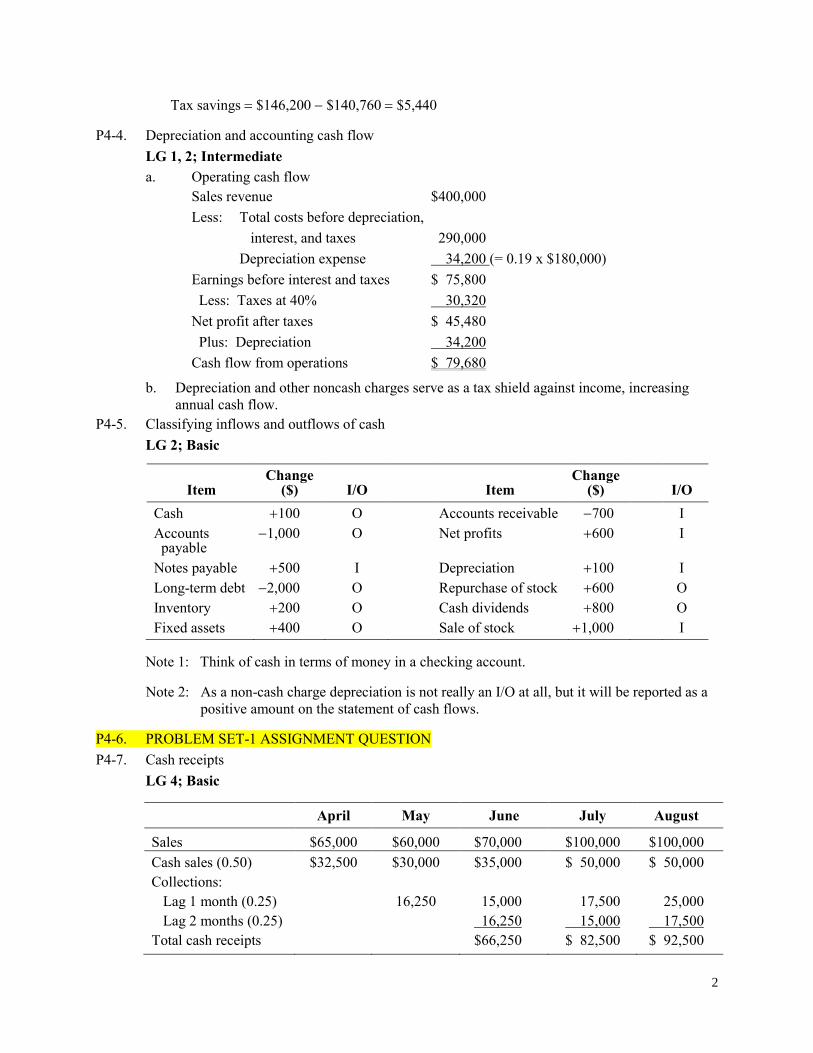
P4-7. Cash receipts
LG 4; Basic
April May June July August
Sales $65,000 $60,000 $70,000 $100,000 $100,000
Cash sales (0.50) $32,500 $30,000 $35,000 $ 50,000 $ 50,000
Collections:
Lag 1 month (0.25) 16,250 15,000 17,500 25,000
Lag 2 months (0.25) 16,250 15,000 17,500
Total cash receipts $66,250 $ 82,500 $ 92,500
3
P4-8. Cash disbursement schedule
LG 4; Basic
February March April May June July
Sales
Disbursements $500,000 $500,000 $560,000 $610,000 $650,000 $650,000
Purchases (0.60) $300,000 $336,000 $366,000 $390,000 $390,000
Cash 36,600 39,000 39,000
1-month delay (0.50)
168,000 183,000 195,000
2-month delay (0.40)
120,000 134,400 146,400
Rent 8,000 8,000 8,000
Wages & salary
Fixed 6,000 6,000 6,000
Variable 39,200 42,700 45,500
Taxes 54,500
Fixed assets 75,000
Interest 30,000
Cash dividends 12,500
Total Disbursements
$465,300
$413,100
$524,400
P4-9. Cash budget—basic
LG 4; Intermediate
March April May June July
Sales $50,000 $60,000 $70,000 $80,000 $100,000
Cash sales (0.20) $10,000 $12,000 $14,000 $16,000 $ 20,000
Lag 1 month (0.60) 36,000 42,000 48,000
Lag 2 months (0.20) 10,000 12,000 14,000
Other income 2,000 2,000 2,000
Total cash receipts $62,000 $72,000 $ 84,000
Disbursements
Purchases $50,000 $70,000 $ 80,000
Rent 3,000 3,000 3,000
Wages & salaries 6,000 7,000 8,000
Dividends 3,000
Principal & interest 4,000
Purchase of new equipment 6,000
Taxes due 6,000
Total cash disbursements $59,000 $93,000 $97,000

4
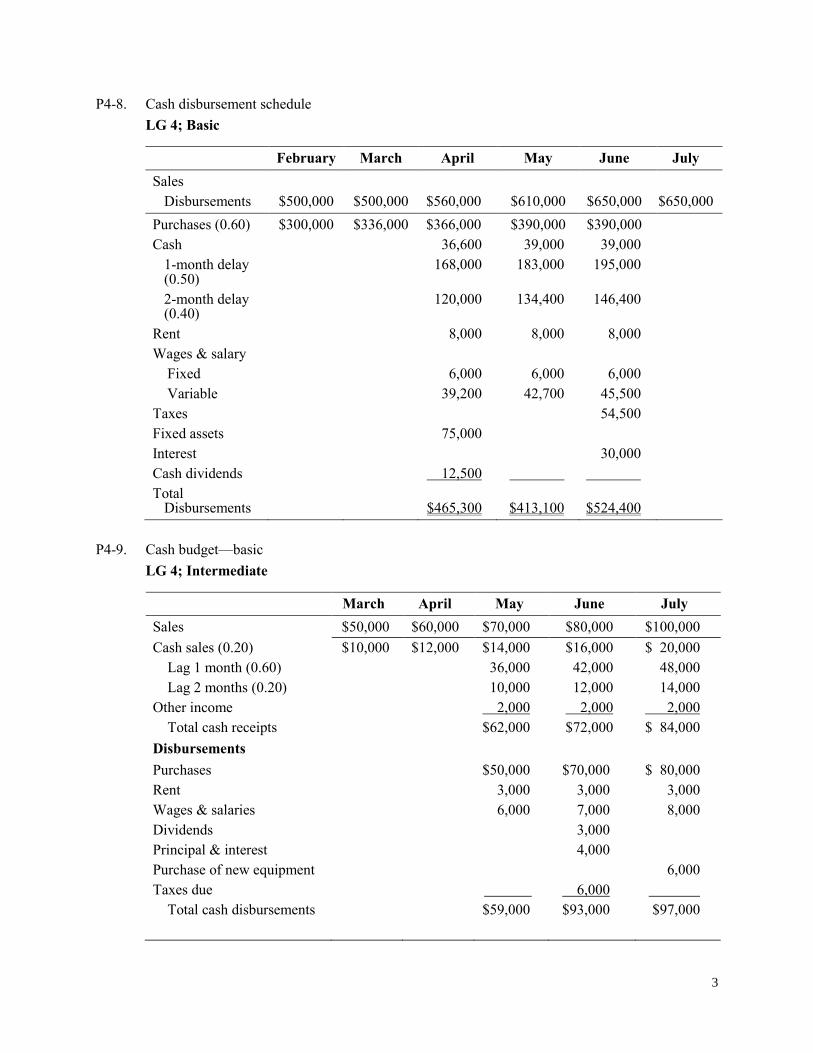
Total cash receipts $62,000 $72,000 $84,000
Total cash disbursements 59,000 93,000 97,000
Net cash flow $ 3,000 ($21,000) ($13,000)
Add: Beginning cash 5,000 8,000 (13,000)
Ending cash $ 8,000 ($13,000) ($26,000)
Minimum cash 5,000 5,000 5,000
Required total financing (notes payable)
$18,000
$31,000
Excess cash balance
(marketable securities) $ 3,000 0 0
The firm should establish a credit line of at least $31,000, but may need to secure three to four
times this amount based on scenario analysis.
5
P4-10. Personal finance: Preparation of cash budget
LG 4; Basic
Sam and Suzy Sizeman
Personal Budget
for the Period October—December 2013
October November December
Income
Take-home pay $4,900 $4,900 $4,900
Expenses Percent
Housing 30.0% $1,470 $1,470 $1,470
Utilities 5.0% 245 245 245
Food 10.0% 490 490 490
Transportation 7.0% 343 343 343
Medical/Dental 0.5% 25 25 25
Clothing 3.0% 147 147 440
Property taxes 11.5% 564
Appliances 1.0% 49 49 49
Personal care 2.0% 98 98 98
Entertainment 6.0% 294 294 1,500
Savings 7.5% 368 368 368
Other 5.0% 245 245 245
Excess cash 4.5% 221 221 221
Total expenses $3,995 $4,559 $5,494
Cash surplus or (deficit) $ 905 $ 341 $ (594)
Cumulative cash surplus or (deficit) $ 905 $1,246 $ 652
6
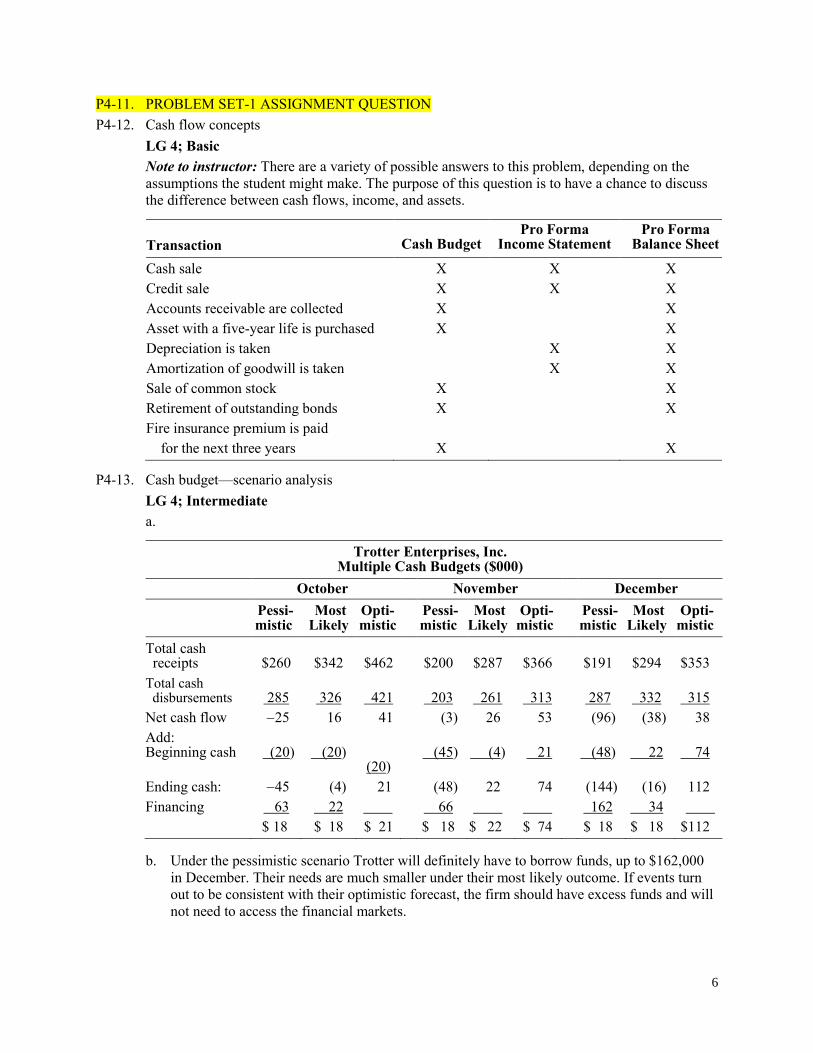
P4-11. PROBLEM SET-1 ASSIGNMENT QUESTION
P4-12. Cash flow concepts
LG 4; Basic
Note to instructor: There are a variety of possible answers to this problem, depending on the
assumptions the student might make. The purpose of this question is to have a chance to discuss
the difference between cash flows, income, and assets.
Transaction
Cash Budget
Pro Forma Income Statement
Pro Forma Balance Sheet
Cash sale X X X
Credit sale X X X
Accounts receivable are collected X X
Asset with a five-year life is purchased X X
Depreciation is taken X X
Amortization of goodwill is taken X X
Sale of common stock X X
Retirement of outstanding bonds X X
Fire insurance premium is paid
for the next three years X X
P4-13. Cash budget—scenario analysis
LG 4; Intermediate
a.
Trotter Enterprises, Inc. Multiple Cash Budgets ($000)
October November December
Pessi- mistic
Most Likely
Opti-mistic
Pessi-mistic
Most Likely
Opti- mistic
Pessi-mistic
Most Likely
Opti-mistic
Total cash receipts
$260
$342
$462
$200
$287
$366
$191
$294
$353
Total cash disbursements
285
326
421
203
261
313
287
332
315
Net cash flow 25 16 41 (3) 26 53 (96) (38) 38
Add: Beginning cash
(20)
(20)
(20)
(45)
(4)
21
(48)
22
74
Ending cash: 45 (4) 21 (48) 22 74 (144) (16) 112
Financing 63 22 66 162 34
$ 18 $ 18 $ 21 $ 18 $ 22 $ 74 $ 18 $ 18 $112
b. Under the pessimistic scenario Trotter will definitely have to borrow funds, up to $162,000
in December. Their needs are much smaller under their most likely outcome. If events turn
out to be consistent with their optimistic forecast, the firm should have excess funds and will
not need to access the financial markets.
7
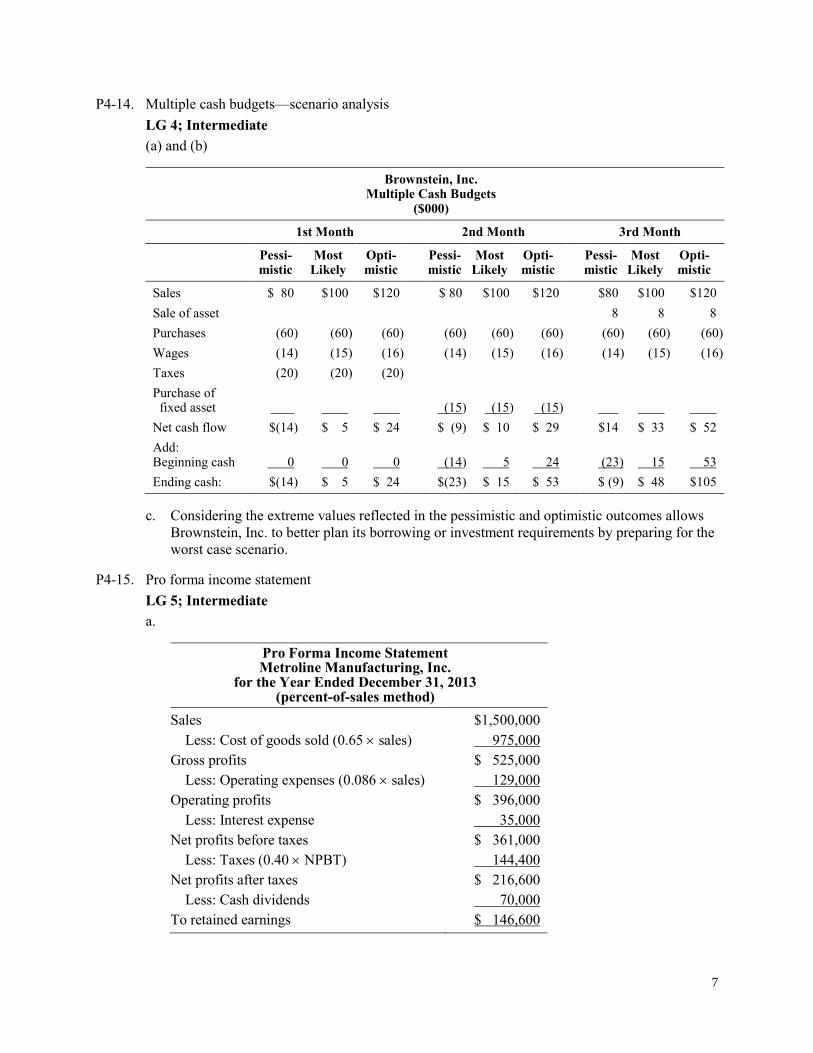
P4-14. Multiple cash budgets—scenario analysis
LG 4; Intermediate
(a) and (b)
Brownstein, Inc. Multiple Cash Budgets
($000)
1st Month 2nd Month 3rd Month
Pessi-mistic
Most Likely
Opti- mistic
Pessi-mistic
Most Likely
Opti- mistic
Pessi-mistic
Most Likely
Opti- mistic
Sales $ 80 $100 $120 $ 80 $100 $120 $80 $100 $120
Sale of asset 8 8 8
Purchases (60) (60) (60) (60) (60) (60) (60) (60) (60)
Wages (14) (15) (16) (14) (15) (16) (14) (15) (16)
Taxes (20) (20) (20)
Purchase of fixed asset
(15)
(15)
(15)
Net cash flow $(14) $ 5 $ 24 $ (9) $ 10 $ 29 $14 $ 33 $ 52
Add: Beginning cash
0
0
0
(14)
5
24
(23)
15
53
Ending cash: $(14) $ 5 $ 24 $(23) $ 15 $ 53 $ (9) $ 48 $105
c. Considering the extreme values reflected in the pessimistic and optimistic outcomes allows
Brownstein, Inc. to better plan its borrowing or investment requirements by preparing for the
worst case scenario.
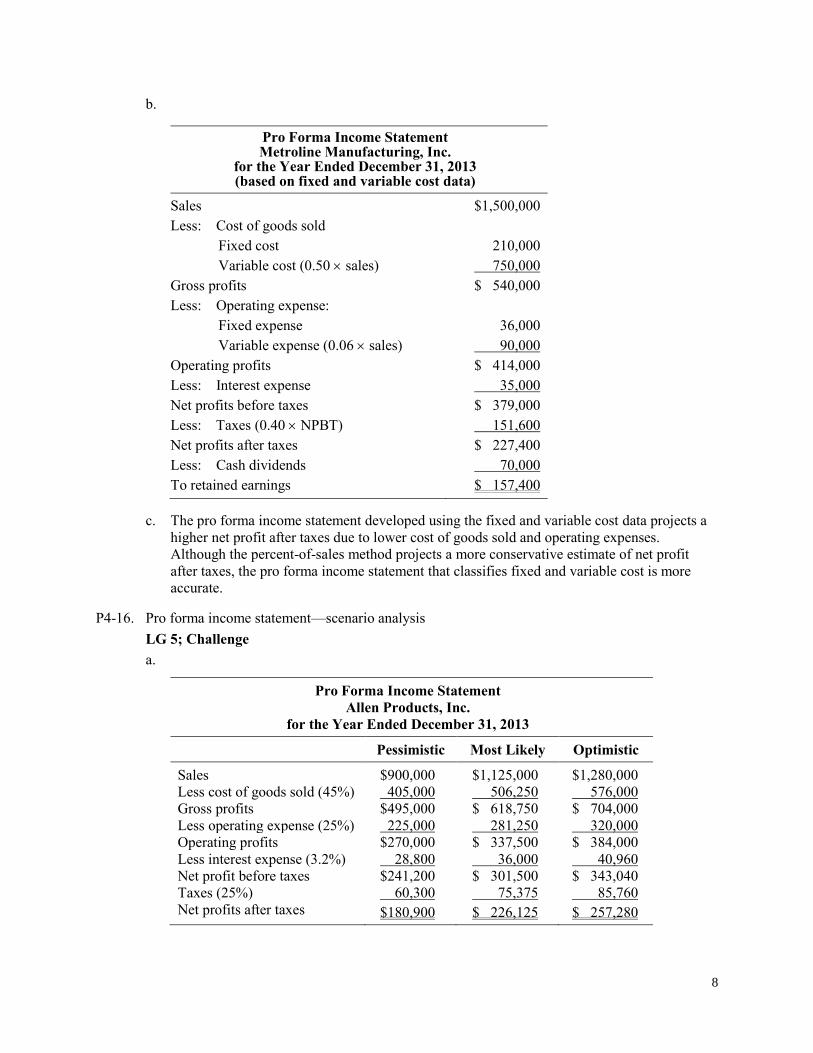
P4-15. Pro forma income statement
LG 5; Intermediate
a.
Pro Forma Income Statement Metroline Manufacturing, Inc.
for the Year Ended December 31, 2013 (percent-of-sales method)
Sales $1,500,000
Less: Cost of goods sold (0.65 sales) 975,000
Gross profits $ 525,000
Less: Operating expenses (0.086 sales) 129,000
Operating profits $ 396,000
Less: Interest expense 35,000
Net profits before taxes $ 361,000
Less: Taxes (0.40 NPBT) 144,400
Net profits after taxes $ 216,600
Less: Cash dividends 70,000
To retained earnings $ 146,600
8
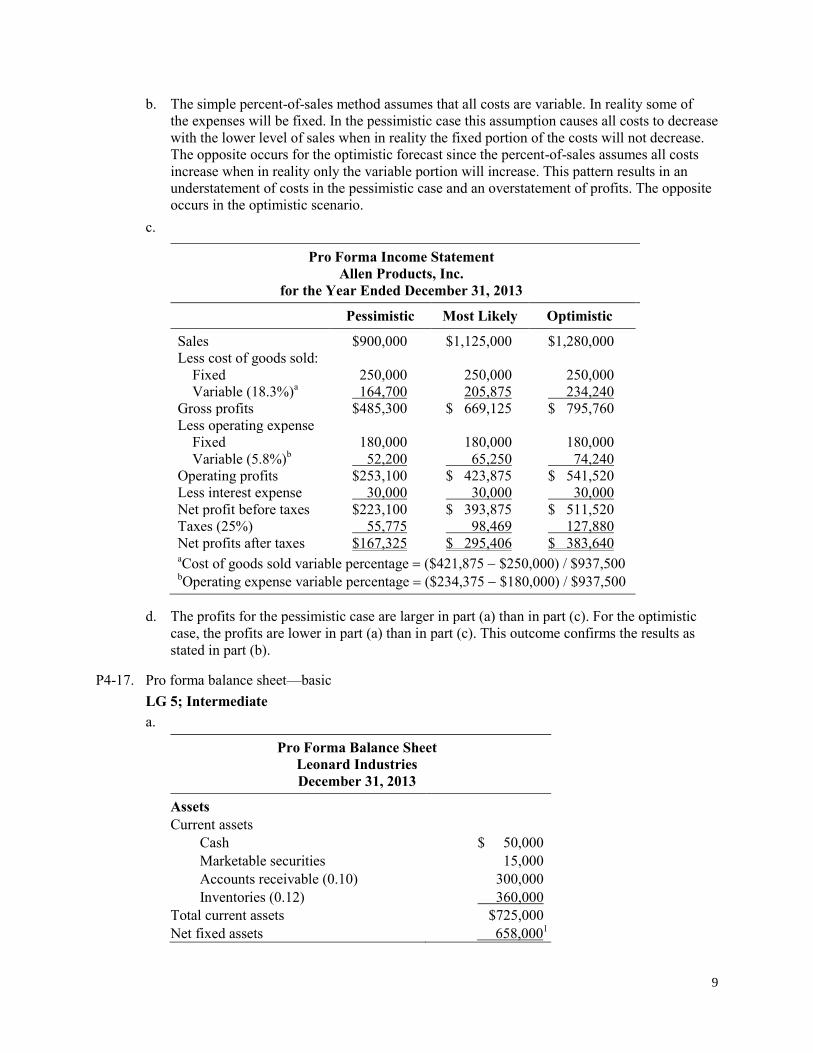
b.
Pro Forma Income Statement Metroline Manufacturing, Inc.
for the Year Ended December 31, 2013 (based on fixed and variable cost data)
Sales $1,500,000
Less: Cost of goods sold
Fixed cost 210,000
Variable cost (0.50 sales) 750,000
Gross profits $ 540,000
Less: Operating expense:
Fixed expense 36,000
Variable expense (0.06 sales) 90,000
Operating profits $ 414,000
Less: Interest expense 35,000
Net profits before taxes $ 379,000
Less: Taxes (0.40 NPBT) 151,600
Net profits after taxes $ 227,400
Less: Cash dividends 70,000
To retained earnings $ 157,400
c. The pro forma income statement developed using the fixed and variable cost data projects a
higher net profit after taxes due to lower cost of goods sold and operating expenses.
Although the percent-of-sales method projects a more conservative estimate of net profit
after taxes, the pro forma income statement that classifies fixed and variable cost is more
accurate.
P4-16. Pro forma income statement—scenario analysis
LG 5; Challenge
a.
Pro Forma Income Statement
Allen Products, Inc.
for the Year Ended December 31, 2013
Pessimistic Most Likely Optimistic
Sales $900,000 $1,125,000 $1,280,000
Less cost of goods sold (45%) 405,000 506,250 576,000
Gross profits $495,000 $ 618,750 $ 704,000
Less operating expense (25%) 225,000 281,250 320,000
Operating profits $270,000 $ 337,500 $ 384,000
Less interest expense (3.2%) 28,800 36,000 40,960
Net profit before taxes $241,200 $ 301,500 $ 343,040
Taxes (25%) 60,300 75,375 85,760
Net profits after taxes $180,900 $ 226,125 $ 257,280
9
b. The simple percent-of-sales method assumes that all costs are variable. In reality some of
the expenses will be fixed. In the pessimistic case this assumption causes all costs to decrease
with the lower level of sales when in reality the fixed portion of the costs will not decrease.
The opposite occurs for the optimistic forecast since the percent-of-sales assumes all costs
increase when in reality only the variable portion will increase. This pattern results in an
understatement of costs in the pessimistic case and an overstatement of profits. The opposite
occurs in the optimistic scenario.
c.
Pro Forma Income Statement
Allen Products, Inc.
for the Year Ended December 31, 2013
Pessimistic Most Likely Optimistic
Sales $900,000 $1,125,000 $1,280,000
Less cost of goods sold:
Fixed 250,000 250,000 250,000
Variable (18.3%)a 164,700 205,875 234,240
Gross profits $485,300 $ 669,125 $ 795,760
Less operating expense
Fixed 180,000 180,000 180,000
Variable (5.8%)b 52,200 65,250 74,240
Operating profits $253,100 $ 423,875 $ 541,520
Less interest expense 30,000 30,000 30,000
Net profit before taxes $223,100 $ 393,875 $ 511,520
Taxes (25%) 55,775 98,469 127,880
Net profits after taxes $167,325 $ 295,406 $ 383,640 aCost of goods sold variable percentage ($421,875 $250,000) / $937,500
bOperating expense variable percentage ($234,375 $180,000) / $937,500
d. The profits for the pessimistic case are larger in part (a) than in part (c). For the optimistic
case, the profits are lower in part (a) than in part (c). This outcome confirms the results as
stated in part (b).
P4-17. Pro forma balance sheet—basic
LG 5; Intermediate
a.
Pro Forma Balance Sheet
Leonard Industries
December 31, 2013
Assets
Current assets
Cash $ 50,000
Marketable securities 15,000
Accounts receivable (0.10) 300,000
Inventories (0.12) 360,000
Total current assets $725,000
Net fixed assets 658,0001
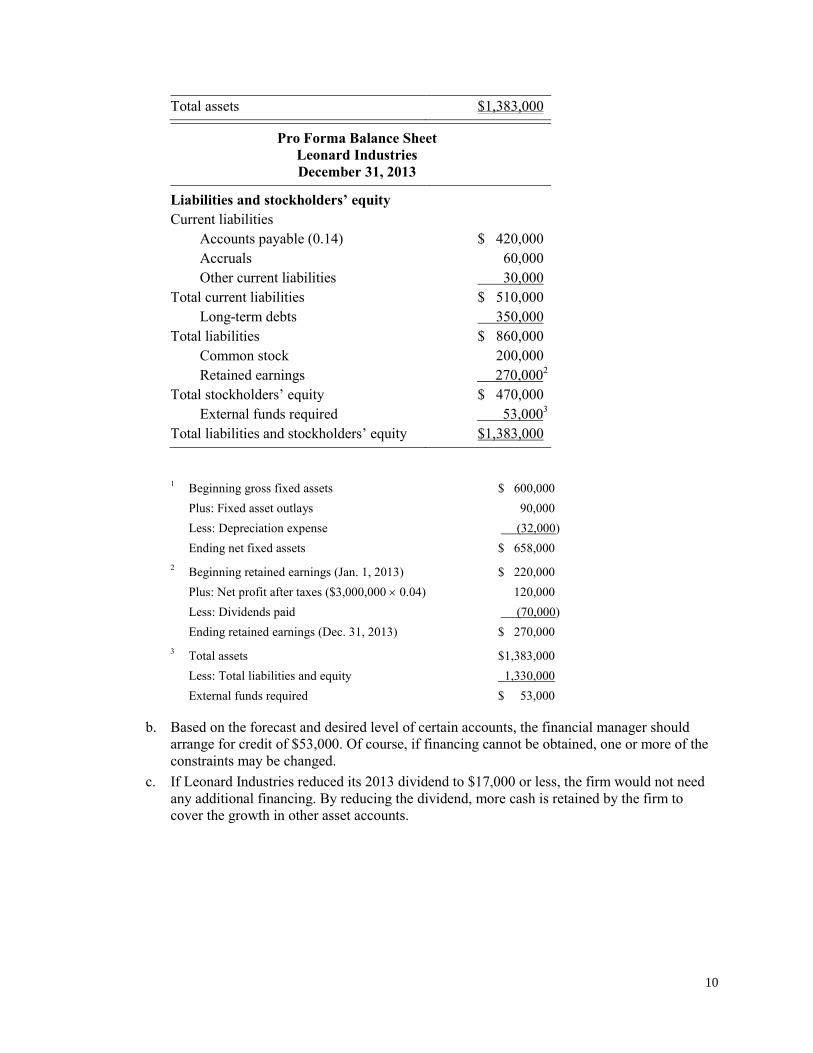
10
Total assets $1,383,000
Pro Forma Balance Sheet
Leonard Industries
December 31, 2013
Liabilities and stockholders’ equity
Current liabilities
Accounts payable (0.14) $ 420,000
Accruals 60,000
Other current liabilities 30,000
Total current liabilities $ 510,000
Long-term debts 350,000
Total liabilities $ 860,000
Common stock 200,000
Retained earnings 270,0002
Total stockholders’ equity $ 470,000
External funds required 53,0003
Total liabilities and stockholders’ equity $1,383,000
1 Beginning gross fixed assets $ 600,000
Plus: Fixed asset outlays 90,000
Less: Depreciation expense (32,000)
Ending net fixed assets $ 658,000
2 Beginning retained earnings (Jan. 1, 2013) $ 220,000
Plus: Net profit after taxes ($3,000,000 0.04) 120,000
Less: Dividends paid (70,000)
Ending retained earnings (Dec. 31, 2013) $ 270,000
3 Total assets $1,383,000
Less: Total liabilities and equity 1,330,000
External funds required $ 53,000
b. Based on the forecast and desired level of certain accounts, the financial manager should
arrange for credit of $53,000. Of course, if financing cannot be obtained, one or more of the
constraints may be changed.
c. If Leonard Industries reduced its 2013 dividend to $17,000 or less, the firm would not need
any additional financing. By reducing the dividend, more cash is retained by the firm to
cover the growth in other asset accounts.
11
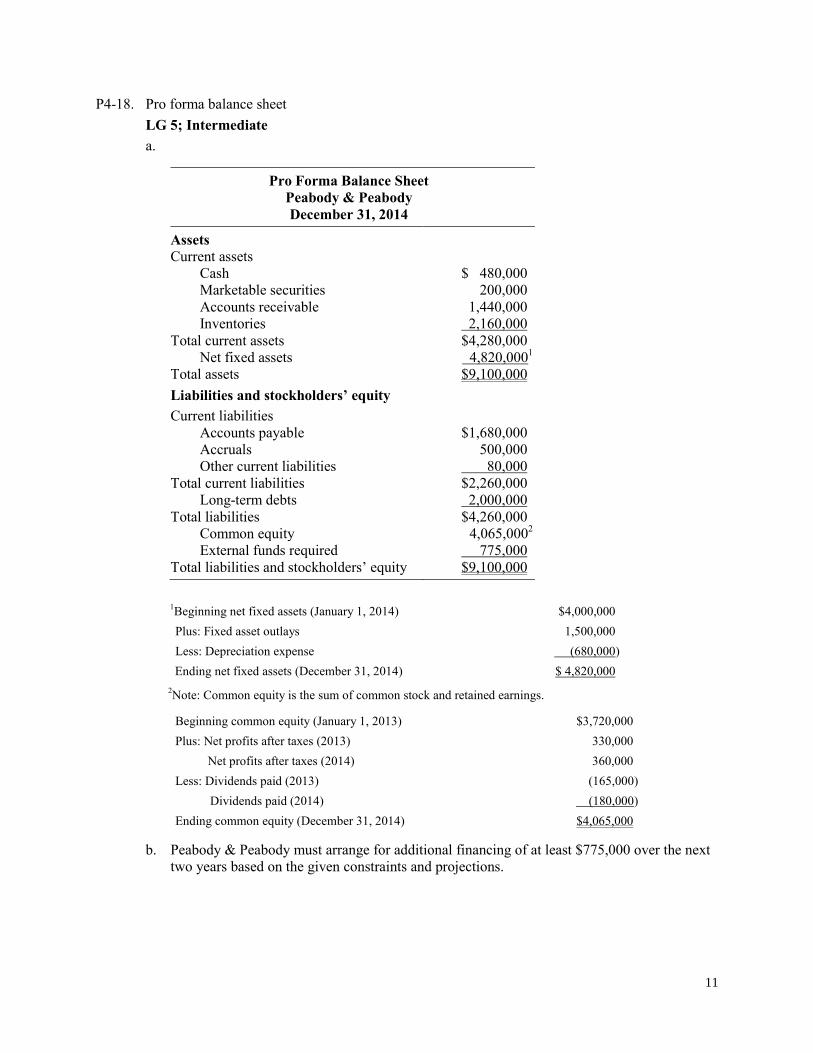
P4-18. Pro forma balance sheet
LG 5; Intermediate
a.
Pro Forma Balance Sheet
Peabody & Peabody
December 31, 2014
Assets
Current assets
Cash $ 480,000
Marketable securities 200,000
Accounts receivable 1,440,000
Inventories 2,160,000
Total current assets $4,280,000
Net fixed assets 4,820,0001
Total assets $9,100,000
Liabilities and stockholders’ equity
Current liabilities
Accounts payable $1,680,000
Accruals 500,000
Other current liabilities 80,000
Total current liabilities $2,260,000
Long-term debts 2,000,000
Total liabilities $4,260,000
Common equity 4,065,0002
External funds required 775,000
Total liabilities and stockholders’ equity $9,100,000
1Beginning net fixed assets (January 1, 2014) $4,000,000
Plus: Fixed asset outlays 1,500,000
Less: Depreciation expense (680,000)
Ending net fixed assets (December 31, 2014) $ 4,820,000
2Note: Common equity is the sum of common stock and retained earnings.
Beginning common equity (January 1, 2013) $3,720,000
Plus: Net profits after taxes (2013) 330,000
Net profits after taxes (2014) 360,000
Less: Dividends paid (2013) (165,000)
Dividends paid (2014) (180,000)
Ending common equity (December 31, 2014) $4,065,000
b. Peabody & Peabody must arrange for additional financing of at least $775,000 over the next
two years based on the given constraints and projections.
12
P4-19. PROBLEM SET-1 ASSIGNMENT QUESTION
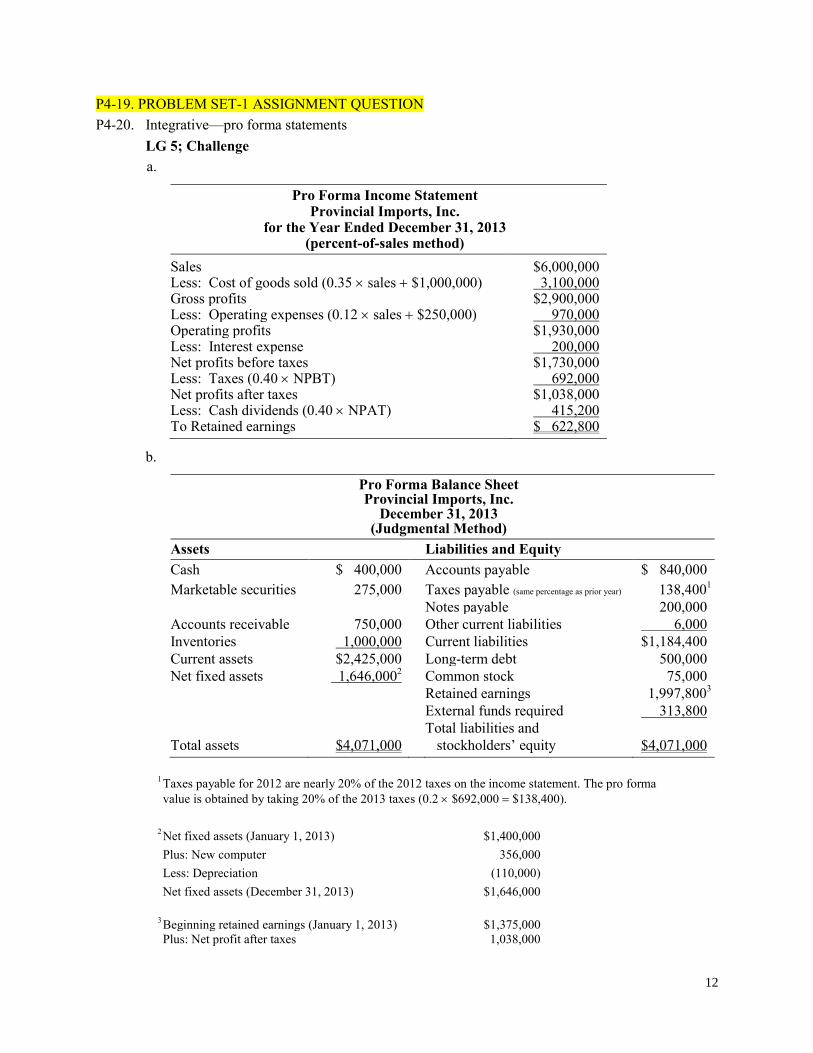
P4-20. Integrative—pro forma statements
LG 5; Challenge
a.
Pro Forma Income Statement Provincial Imports, Inc.
for the Year Ended December 31, 2013 (percent-of-sales method)
Sales $6,000,000 Less: Cost of goods sold (0.35 sales $1,000,000) 3,100,000 Gross profits $2,900,000 Less: Operating expenses (0.12 sales $250,000) 970,000 Operating profits $1,930,000 Less: Interest expense 200,000 Net profits before taxes $1,730,000 Less: Taxes (0.40 NPBT) 692,000 Net profits after taxes $1,038,000 Less: Cash dividends (0.40 NPAT) 415,200 To Retained earnings $ 622,800
b.
Pro Forma Balance Sheet Provincial Imports, Inc.
December 31, 2013 (Judgmental Method)
Assets Liabilities and Equity
Cash $ 400,000 Accounts payable $ 840,000
Marketable securities 275,000 Taxes payable (same percentage as prior year) 138,4001
Notes payable 200,000
Accounts receivable 750,000 Other current liabilities 6,000
Inventories 1,000,000 Current liabilities $1,184,400
Current assets $2,425,000 Long-term debt 500,000
Net fixed assets 1,646,0002 Common stock 75,000
Retained earnings 1,997,8003
External funds required 313,800
Total liabilities and
Total assets $4,071,000 stockholders’ equity $4,071,000
1 Taxes payable for 2012 are nearly 20% of the 2012 taxes on the income statement. The pro forma
value is obtained by taking 20% of the 2013 taxes (0.2 $692,000 $138,400).
2 Net fixed assets (January 1, 2013) $1,400,000 Plus: New computer 356,000 Less: Depreciation (110,000) Net fixed assets (December 31, 2013) $1,646,000
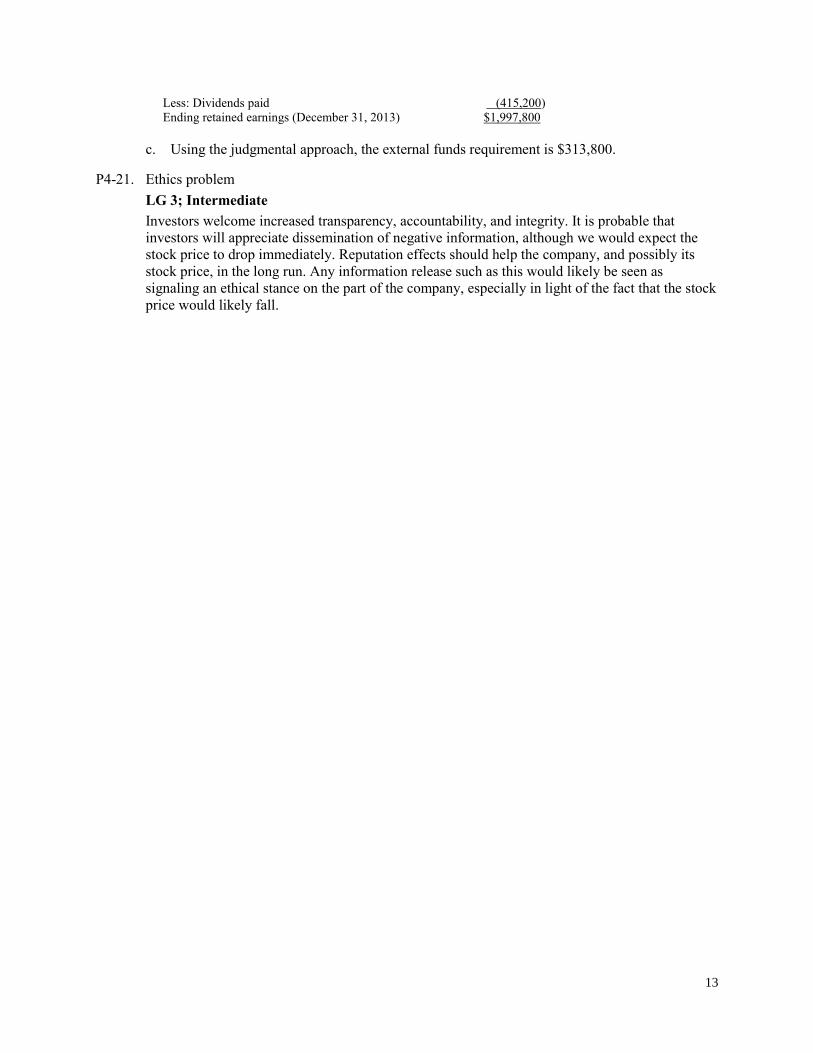
3 Beginning retained earnings (January 1, 2013) $1,375,000
Plus: Net profit after taxes 1,038,000
13
Less: Dividends paid (415,200)
Ending retained earnings (December 31, 2013) $1,997,800
c. Using the judgmental approach, the external funds requirement is $313,800.
P4-21. Ethics problem
LG 3; Intermediate
Investors welcome increased transparency, accountability, and integrity. It is probable that
investors will appreciate dissemination of negative information, although we would expect the
stock price to drop immediately. Reputation effects should help the company, and possibly its
stock price, in the long run. Any information release such as this would likely be seen as
signaling an ethical stance on the part of the company, especially in light of the fact that the stock
price would likely fall.
Related Documents


