1 Chapter 1 : Introduction and Literature Review 1.1. Introduction Vehicle bombing attacks against buildings have been a weapon of choice used by many terrorist organizations. The use of vehicle bombs to attack a structure has been a common type of terrorist attack. Terror attacks against buildings have been of great concern among the structure analysts since September 11, 2001. Accordingly it is important to protect critical buildings against blast loads and to consider how blast loads may affect the building. Due to the threat from vehicle bomb attacks, structural engineers have developed methods of structural design and analysis against blast loads. The analysis and design of structures subjected to blast loads requires a detailed understanding of the air blast phenomena and the dynamic response of structure. The analysis of structures against blast loads is very difficult because the uniform highly transient loads produced by the nearby detonation of a conventional weapon, combined with the localized structural response, results in an extremely complex structural analysis problem. The assumptions necessary in developing a simplified analysis procedure usually lead to overly conservative design because they fail to accurately account for the localized nature of the structural response, the large variation of pressure over a relatively small area, and the fact that the pressure does not arrive at every point on the structure at the same time as shown in Figure 1.1. Engineers in the military or their contractors developed empirical methods to predict peak pressure and time duration of blast loads. Army TM5-855-1 and Army TM5-1300 are representative criteria of structural design and analysis against blast loads.

Welcome message from author
This document is posted to help you gain knowledge. Please leave a comment to let me know what you think about it! Share it to your friends and learn new things together.
Transcript
1
Chapter 1 : Introduction and Literature Review
1.1. Introduction
Vehicle bombing attacks against buildings have been a weapon of choice used by many terrorist
organizations. The use of vehicle bombs to attack a structure has been a common type of
terrorist attack. Terror attacks against buildings have been of great concern among the structure
analysts since September 11, 2001. Accordingly it is important to protect critical buildings
against blast loads and to consider how blast loads may affect the building.
Due to the threat from vehicle bomb attacks, structural engineers have developed methods of
structural design and analysis against blast loads. The analysis and design of structures
subjected to blast loads requires a detailed understanding of the air blast phenomena and the
dynamic response of structure. The analysis of structures against blast loads is very difficult
because the uniform highly transient loads produced by the nearby detonation of a conventional
weapon, combined with the localized structural response, results in an extremely complex
structural analysis problem. The assumptions necessary in developing a simplified analysis
procedure usually lead to overly conservative design because they fail to accurately account for
the localized nature of the structural response, the large variation of pressure over a relatively
small area, and the fact that the pressure does not arrive at every point on the structure at the
same time as shown in Figure 1.1.
Engineers in the military or their contractors developed empirical methods to predict peak
pressure and time duration of blast loads. Army TM5-855-1 and Army TM5-1300 are
representative criteria of structural design and analysis against blast loads.
2
Figure 1.1 : Blast Loads on Structure
The purpose of this research is to examine linear and nonlinear structural responses of two
buildings due to the stand-off distance and charge size. In this study, blast loads were applied 3
story and 10 story buildings with welded steel moment frames that are representative of
earthquake resistant design in California.
To investigate structural behavior in different conditions, explosive weights of 100 lb, 500 lb,
1,000 lb, and 2,000 lb are applied to a steel frame at stand-off distance 20 ft. Using a explosive
weight of 1,000 lb, the effect of stand-off distance is evaluated for distances of 15 ft, 30 ft, 50 ft,
and 100 ft. This study also considers the size of the blast crater along with the different
structural responses that include story displacements, demand/capacity ratio of columns and
floor diaphragm, drifts and plastic rotation demands. These parameters are then compared with
limit values suggested by seismic guidelines.
3
1.2. Literature Review
1.2.1. Blast Wave Scaling Law
Sachs blast wave scaling was proposed in 1944 as a more general one that was consisted of
parameters having a function of scaled distance (Baker, 1973).
13
013
R Rp
E
−
=
Where, R is the range, P0 is the ambient pressure and E is the energy of charge. Sachs Law
assumes that air behaves as perfect gas and gravity and viscosity are negligible.
Hopkins-Cranz blast wave scaling was described as cube-root scaling referenced by Baker
(1973). The blast wave scaling law defined by Hopkins (1915) states two different weights of
the same explosive have same blast characteristics at some scaled distances in similar
atmospheric conditions. The Hopkins scaling distance is
13
RZW
=
Where, R is the range from the blast center to the point of structure and W is the weight of
charge
4
1.2.2. Blast Wave Parameters
Incident Pressure
The release of energy from a detonation leads to a sudden pressure increase and then the
increase is from the ambient pressure to a peak incident or shock front pressure (ps). The
incident pressure is the pressure on a surface parallel to the direction of the blast wave. Brode
(1955) estimated not only incident pressure due to spherical blast based on the Hopkins scaling
distance but also expressed in terms of near field and far field.
3
6.7 1 ( 10 )s sp bar p barz
= + ⟩
2 3
0.975 1.455 5.85 0.019 (0.1 10 )s sp bar bar p barz z z
= + + − ⟨ ⟨
Newmark and Hansen (1961) introduced blast overpressure in terms of range and explosive
weight at the ground surface.
12
3 36784 93sW WpR R
⎛ ⎞= + ⎜ ⎟⎝ ⎠
Another expression of blast overpressure in KPa was introduced by Mills (1987) in terms of
equivalent charge weight and scaled distance.
3 2
1772 114 108sp
z z z= − +
5
Reflected Pressure
As the blast wave propagates through the air, the air behind shock front has lower velocity. The
velocity depends on incident pressure and is associated with dynamic pressure. If such a blast
wave encounters an obstacle perpendicular to the direction of wave direction, the reflection
changes the pressure to reflected pressure (pr). Rankin and Hugoniot (1870) suggested the
velocity of blast wave and dynamic pressure in terms of incident pressure.
00
0
6 77
ss
p pU ap+
= ⋅
2
0
52( 7 )
ss
s
pqp p
=+
Where, Us is the velocity of wavefront, ps is the overpressure, p0 is the ambient of air pressure,
a0 is the speed of sound in air and qs is the dynamic pressure.
Rankine and Hugoniot also derived the equation for reflected overpressure pr.
0
0
7 427
sr s
s
p pp pp p
⎡ ⎤+= ⎢ ⎥+⎣ ⎦
6
Figure 1.2 : Peak Incident Pressure vs. Peak Dynamic Pressure, Particle Velocity & Density of Air (SOURCE : Army TM5-1300, Navy NAVFAC)
Blast Wave pressure Profiles
The pressure-time history of a blast wave was modeled using exponential functions such as the
Friendlander equation. Thus, a conservative estimation used a linear decay and neglected
negative phase.
( ) 1 expss s
t btp t pT T
⎡ ⎤ ⎧ ⎫= − −⎨ ⎬⎢ ⎥
⎣ ⎦ ⎩ ⎭
Where ps is the peak overpressure, Ts is the positive phase duration and b is the decay constant.

7
Figure 1.3 : Exponential Decay of Pressure-Time History
Typical blast pressure profile is in shown as Figure 1.3. At the arrival time following the
explosion, pressure at the position suddenly increases to a peak overpressure, Pso, over ambient
pressure, Po, and pressure decays to ambient pressure at time tA+to, then decays further to an
under pressure, pso-, before returning to ambient level. Most design case ignore negative phase
because of little effect on structure.
1.2.3. Blast Wave External Loading on Structure
To obtain the pressure on a structure, a charge placed on or very near the ground surface, such as
a vehicle bomb attack, is considered to be a surface burst. The initial wave of the explosion is
reflected and reinforced by the ground surface to produce a reflected wave. The Figure 1.4 is
shown that how the reflected wave propagates through the atmosphere (TM 5-855-1).
8
Figure 1.4 : Surface Burst Blast Environmental
TM5-1300 provided reflected pressure, incident pressure, arrival time, time duration, wave
length, and the impulse of incident and reflected pressure in terms of scaled distance. Figure 1.5
is shown that various data was given by TM5-1300. In addition, Figure 1.6 is shown that the
variation of the pressure and impulse patterns on a reflecting surface is a function of the angle
and magnitude of the incident pressure ps.
For the calculation of reflected pressure, incident pressure is interpolated in Figure 1.6 and then
a coefficient ,Cr , is determined for the angle of incident. This coefficient is used to obtain the
reflected pressure for applied to the structure.

9
Figure 1.5 : Wave Parameters of Hemispherical TNT Explosions
Figure 1.6 : Reflected Pressure Coefficient vs. Angle of Incidence (SOURCE : Army TM5-1300, Navy NAVFAC)

10
Chapter 2 : Finite Element Model of Steel Structures
The welded steel moment frame (WSMF) buildings are designed to resist earthquake ground
shaking, based on the assumption that they are capable of extensive yielding and inelastic
deformation. This building system was based on the 1994 Uniform Building Code (UBC).
However, the design of the frame didn’t provide any deliberate resistance against a vehicle
bomb attack. This chapter describes the building details as well as shows a model of building
using SAP2000 FEM Software [21].
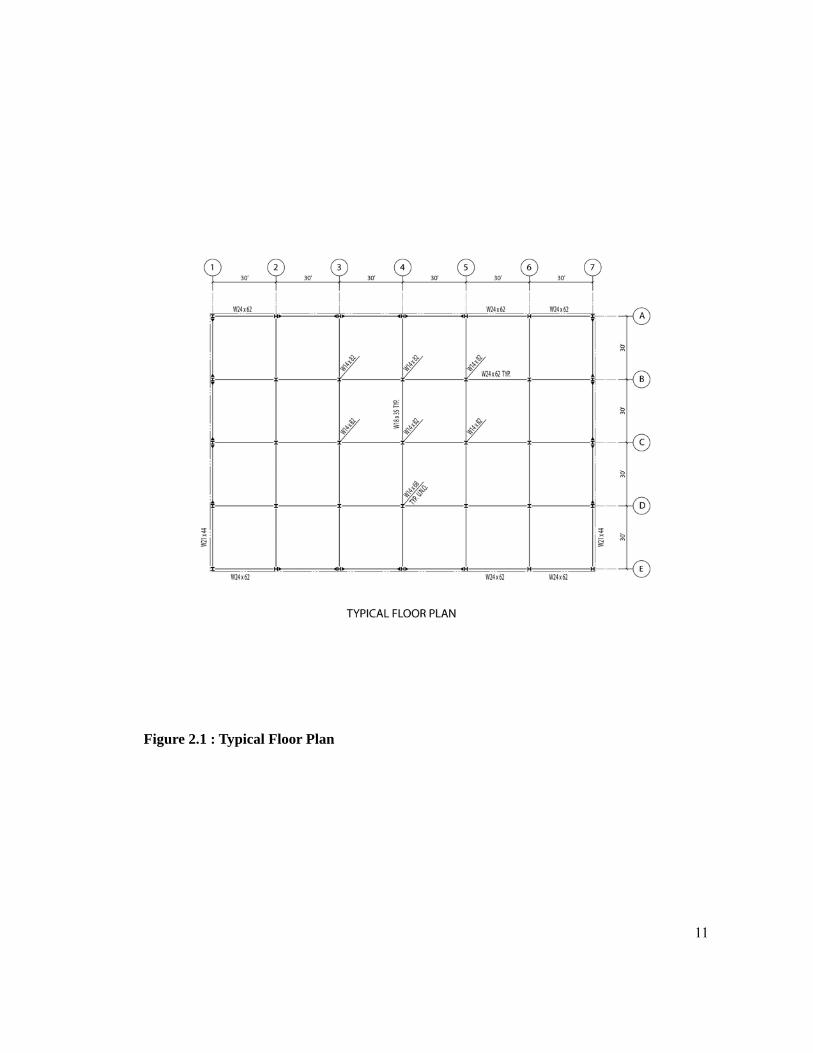
2.1. Description of 3 Story Building
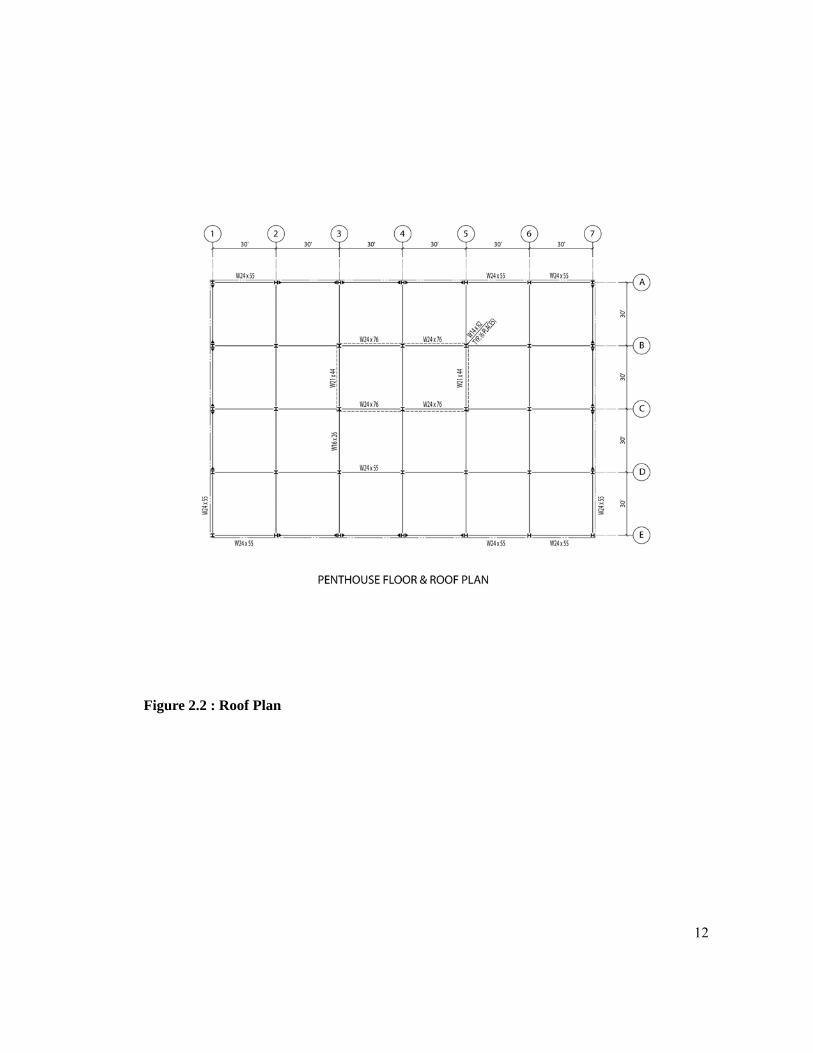
Figure 2.1 shows the 3 story building with a typical floor to floor height of 13’-0” is rectangular
in shape and main roof with same dimension of typical floor in Figure 2.2. The floor was
consisted of concrete over metal deck diaphragm. The building plane is 180’*120’and divided
into 30-feet bays in each direction, six in the longitudinal direction and four in the transverse
direction. The lateral force resisting systems in each direction consist of 3-bay WSMF frames
on each side of the building perimeter. The remainder of the steel framing is provided for
gravity loads. The base of the frame columns are assumed to be fixed. Concrete grade beams at
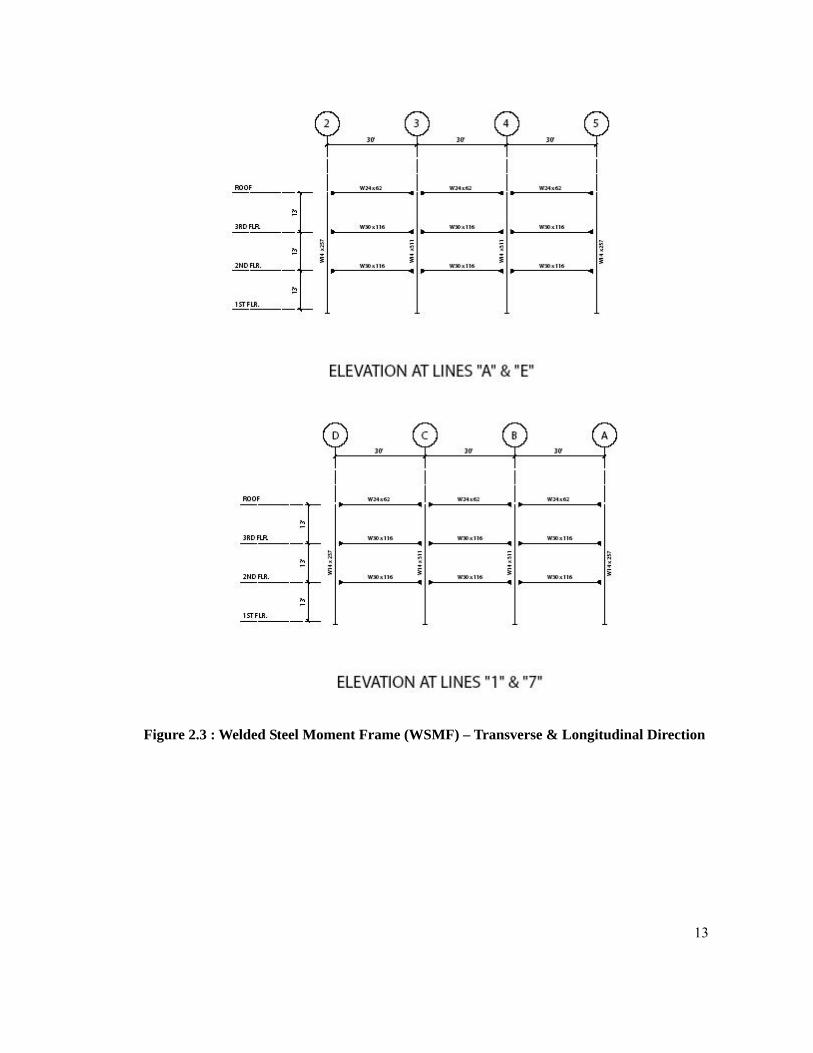
the foundation level are utilized to resist the moments at the base of the columns. Figure 2.3
shows details of WSMF frames. The gravity beams and columns conform to ASTM A36 and
ASTM A572 Gr.50, as specified. The Welded Frame girders conform to ASTM A36 and the
Welded Frame columns conform to ASTM A572 Gr.50.
11
Figure 2.1 : Typical Floor Plan
12
Figure 2.2 : Roof Plan
13
Figure 2.3 : Welded Steel Moment Frame (WSMF) – Transverse & Longitudinal Direction
14
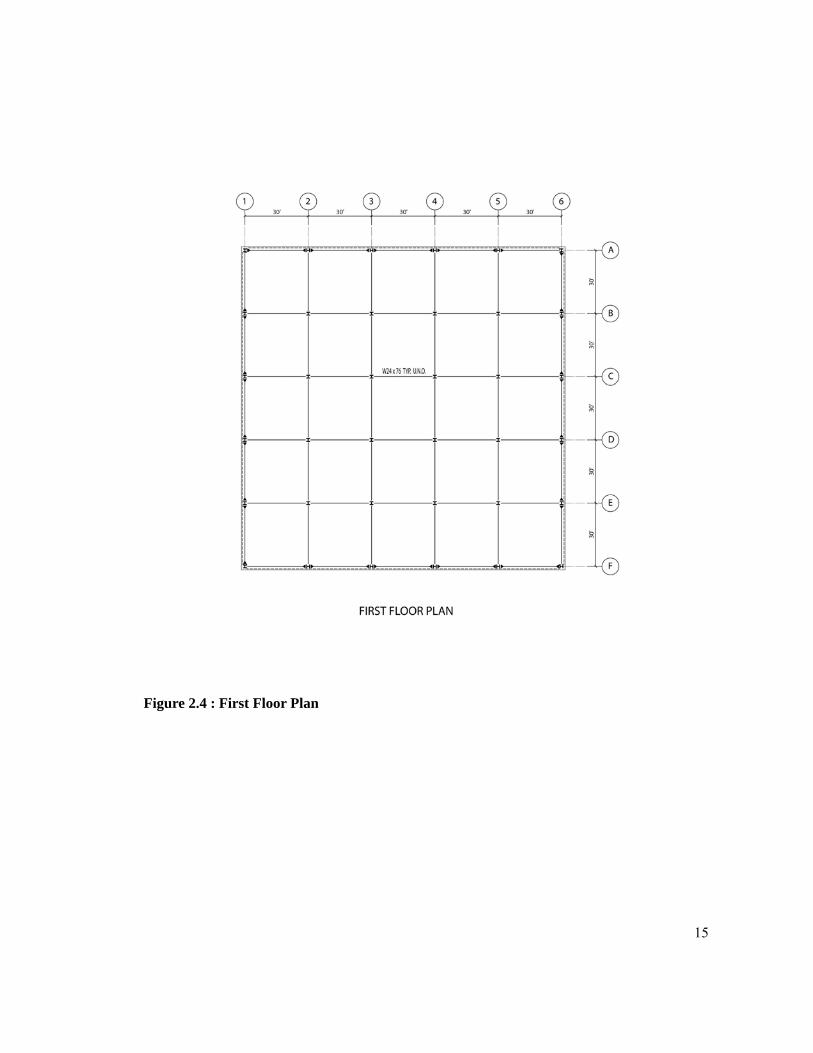
2.2. Description of 10 Story Building
Figure 2.4, Figure 2.5 and Figure 2.7 show the 10 story building with a typical floor to floor
height of 13’-0” with exception of 12’ for the 1st floor and 18’ for the 2nd floor. The plane is
square in shape with the main roof and the same dimension of typical roof in Figure 2.6. The
floor was also consisted of concrete over metal deck diaphragm. The building plane is
150’*150’and divided into 30-feet bays in each direction, five in the longitudinal direction and
five in the transverse direction. The lateral force resisting systems in each direction consist of 5-
bay WSMF frames on each side of the building perimeter. The remainder of the steel framing is
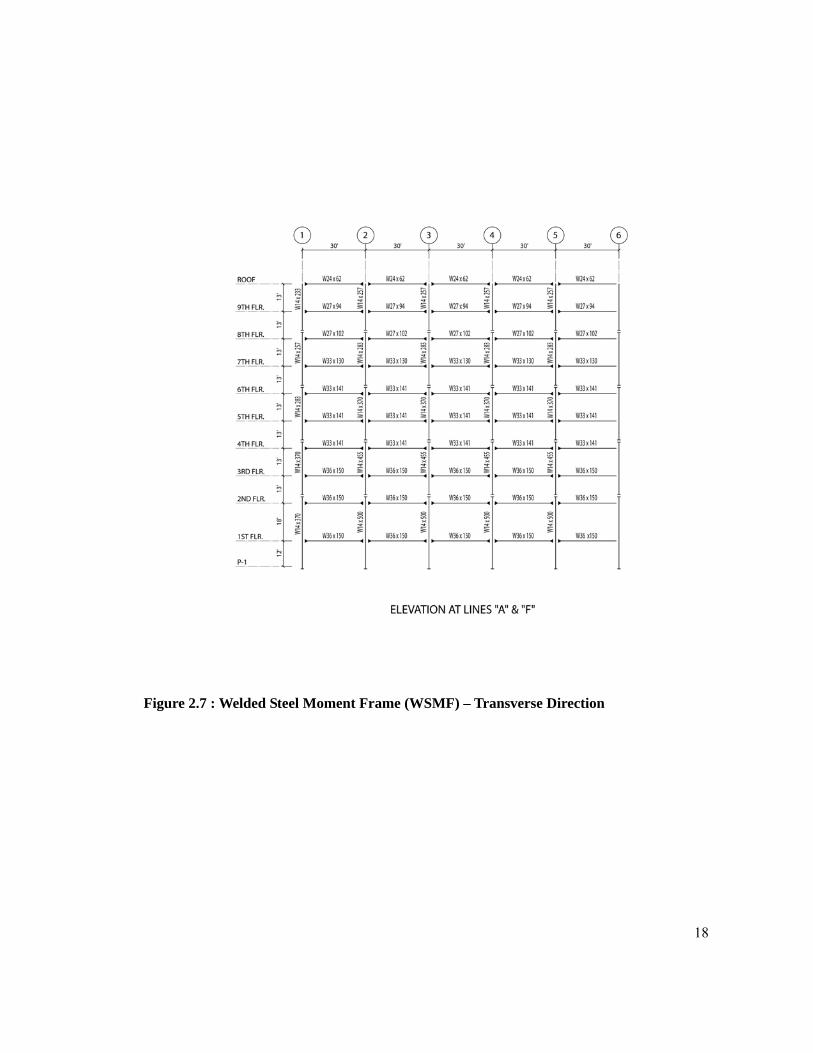
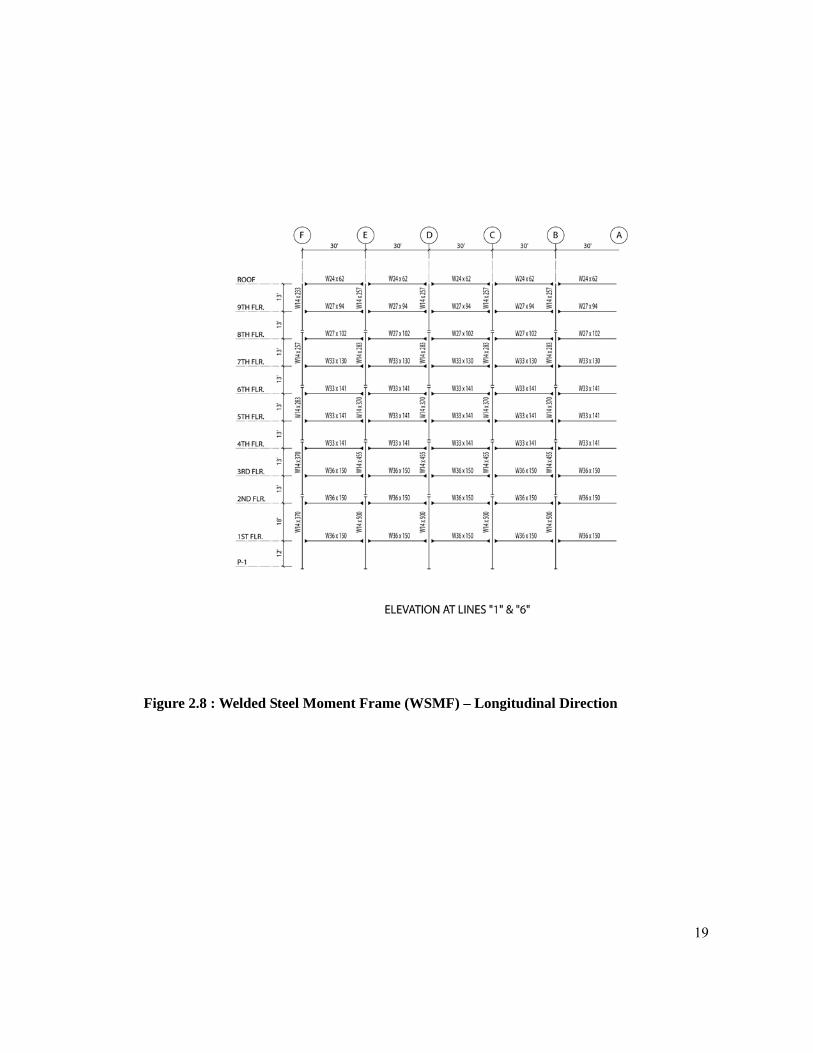
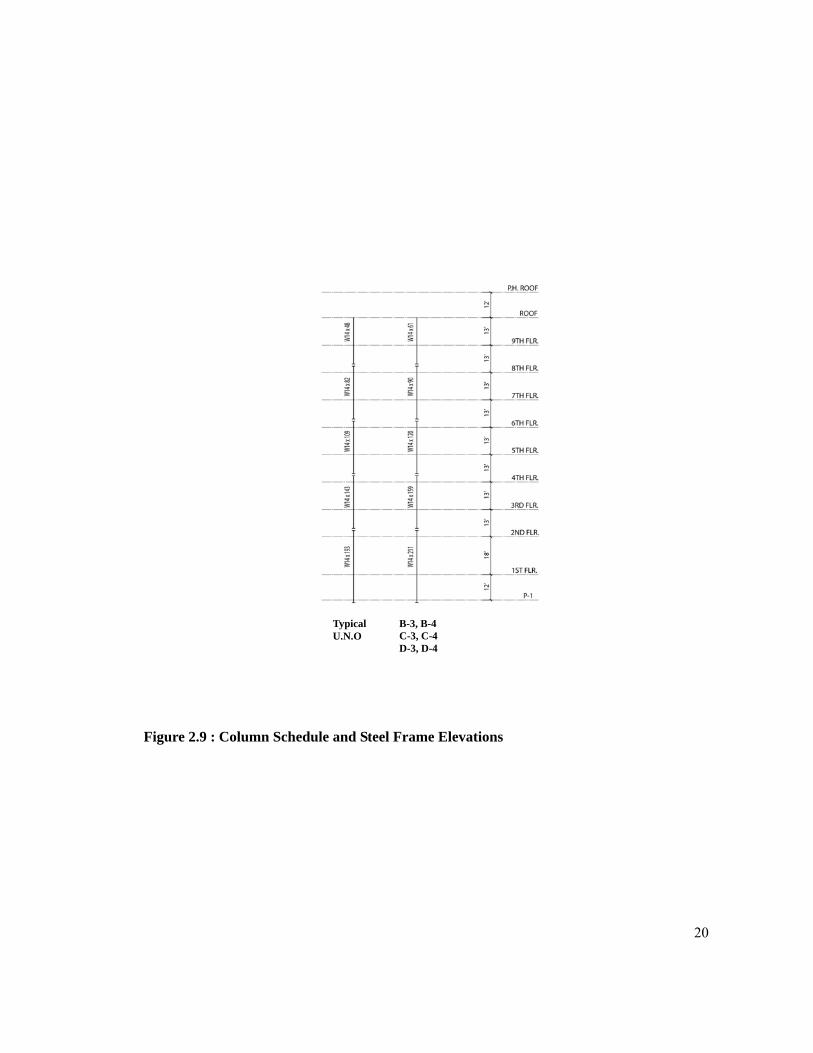
provided for gravity loads. The base of the frame columns are designed fixed. Figure 2.7 and
Figure 2.8 show details of WSMF frames as well as Figure 2.9 also shows frame elevation of
steel column. The gravity beams and columns conform to ASTM A36 and ASTM A572 Gr.50,
as specified. The Welded Frame girders and the Welded Frame columns conform to ASTM A36
and ASTM A572 Gr.50.
15
Figure 2.4 : First Floor Plan

16
Figure 2.5 : Typical Floor Plan

17
Figure 2.6 : Roof Plan
18
Figure 2.7 : Welded Steel Moment Frame (WSMF) – Transverse Direction
19
Figure 2.8 : Welded Steel Moment Frame (WSMF) – Longitudinal Direction
20
Figure 2.9 : Column Schedule and Steel Frame Elevations
TypicalU.N.O
B-3, B-4 C-3, C-4 D-3, D-4
21
2.3. Description of Building Model
Figure 2.10 and Figure 2.11 show 3D views of the computer model of 3 story building and 10
story building. The floor is assumed to be rigid in its plane due to be consisted of a concrete
metal deck diaphragm. The infill beams are not specifically included in the computer model
using SAP2000 FEM Software. The base restraint was assumed to be the fixed condition and
the concrete over metal deck floor was assumed to be a rigid diaphragm in initial model.
Figure 2.10 : Description of 3 Story Building Model Using SAP2000 FEM Software
22
Figure 2.11 : Description of 10 Story Building Model Using SAP 2000 FEM Software

23
Chapter 3 : Blast Loads and Crater
To confirm the values of incident pressure in Figure 3.1, the CONWEP [26] and ATBLAST [3]
program will be used. For example, a vehicle bomb explosion of 2,000 lb TNT weight at 970 ft
results in an incident overpressure is 0.5 psi as shown in Figure 3.1. The incident pressure of
ATBLAST is 0.5 psi shown in Figure 3.2 and the reflected pressure obtained by ATBLAST is
1.0 psi shown in Figure 3.2 and the reflected pressure obtained by CONWEP is 1.0 psi shown in
Figure 3.3. Thus, these programs are able to provide reliable results. In Table 3.1, the incident
and reflected pressure have good agreements of four cases at 2,000 lb TNT.
Figure 3.1 : Incident Overpressure Measured in Pounds per Square in, As a Function of Stand-off Distance and Net Explosive Weight (Pounds – TNT)
24
(a) Incident Pressure from ATBLAST (b) Reflected Pressure from ATBLAST
Figure 3.2 : Incident Pressure and Reflected Pressure from ATBLAST Program
Figure 3.3 : Reflected Pressure from CONWEP Program
25
Table 3.1 : Comparison of ATBLAST and CONWEP
ATBLAST ATBLAST CONWEP
Case Range (ft) Incident Pressure (psi)
Reflected Pressure(psi)
Reflected Pressure(psi)
1 970 0.5 1.02 1.03 2 575 1 2.05 2.04 3 335 2 4.24 4.19 4 123 10.02 25.35 25.05
But incident pressure is not parallel to the direction of the wave’s travel, it is reflected and
reinforced, producing what is known as reflected pressure. The reflected pressure is always
greater than the incident pressure at the same distance from the explosion. When the shock
wave impinges on a surface that is perpendicular to the direction it is traveling, the point of
impact will experience the maximum reflected pressure [10]. Therefore, reflected pressure is
used in the analysis. The incident pressure and reflected pressure through different stand-off
distance are shown in Appendix A.1.
26
3.1. Blast Loads
To define the blast loads, the CONWEP program based on TM 5-855-1 [26] was used for loads
on the structure. This program defines peak reflected pressure (Pr) and time duration (td) at a
given distance. Prior to obtaining peak pressure and time duration, the type of blast, weapon,
direction of target and stand-off distance were selected as given conditions. The input
procedures of CONWEP program is shown in Appendix A.2. Table 3.2 shows input data and
Table 3.3 shows peak reflected pressure (Pr), time duration (td) and time of arrival (tA) at node
points on the transverse face of the structure. These input data were assumed under vehicle
bomb attack with 1,000 lb TNT weight at 15 ft. Also, time history functions were defined to
input data for SAP2000 FEM software [21] using these results. Figure 3.4 – Figure 3.7 show
generation of blast loads on 3 story building using SAP2000.
Table 3.2 : Input Data in CONWEP Program
Type of Blast Air Blast Type of Air Blast Loads on Structure Select of Weapon and Weight TNT, 1,000 lb Direction of Target Hemispherical Surface Burst Stand-off Distance 15 ft
27
Table 3.3 : Output of CONWEP Program
No of Joint Time of Arrival (msec)
Time of Duration (msec)
Force (kips)
2 19.75 16.8 1178.38 3 22.01 17.65 976.48 4 25.66 18.73 405.23
30 6.92 14.07 26295.09 31 9.44 16.24 8527.47 32 13.53 16.48 1844.86 58 2.35 12.41 49547.16 59 4.95 16.33 14635.30 60 9.17 16.08 2727.27
Figure 3.4 : Front Frame (Transverse Direction)
28
Figure 3.5 : Applied Blast Loads on Joint 2, 3, 4
Figure 3.6 : Applied Blast Loads on Joint 30, 31, 32
29
Figure 3.7 : Applied Blast Loads on Joint 58, 59, 60
3.2. Crater
For bursts near the ground surface, the yield and quantity of explosive detonation inferred the
dimension of the crater formed as well as distance of window breakage. To verify crater
dimension in this study, the crater dimension of Murrah Building [14] was compared with
methods used for the analysis of conventional weapons effects on structure (CONWEP). In
Murrah Building, the detonation of TNT weight was estimated to be approximately 4,000 lb at
4.5 ft above 18 in thick pavement on soil which resulted in a crater whose dimensions are 28 ft
diameter and 6.8 ft in depth.
Table 3.4 shows the dimension of crater measured and the dimension of crater analyzed by
CONWEP. As shown in Table 3.4, the prediction of crater dimension using CONWEP provides
confidence due to its close approximation to the measured dimension. Therefore, this study was

30
used methods of CONWEP to calculate the dimension of the expected crater for all cases. The
results of CONWEP are shown in Figure 3.8. It can be seen that in these cases the apparent
crater is almost exactly equal to the true crater.
Table 3.4 : Comparison with Estimates of Crater Dimensions
Condition Depth (ft)
Diameter (ft)
Distance of Window Breakage (ft)
Measured at Murrah Bldg 6.8 28 N.A. By F, Mlakar Sr(1998) 7.2 27 N.A. This Report 7.4 28.64 1937
Figure 3.8 : Dimension of 4,000 lb TNT Weight assumed Dry Sand Clay Soil
Related Documents