I am thankful to Prof. Rajasekhar, Prof. R.S. Deshpande, Prof. K.V. Raju, Prof. Kadekodi, Dr. Vijayendra Rao, Dr. Anirudh Krishna, Dr. Priya for their support. Dr. Ajit menon has been a great source of support from the very early stages of this work. Dr. Sivakami spent quite a bit of her time in helping me code the data. Dr. Madeshwaran and Dr. Venkatachalam provided crucial support during a critical stage of the work. Venugopal facilitated my initiation into qualitative response models. Balraja and Srinivas were of great support during data collection, while Sushma and Manjula provided computational assistance. Last, but not the least the farmers who choose to spend their time in talking to me. The usual disclaimer applies. 16 Choosing ‘not’ to Participate—Evidence from Drought Prone Area Programme (DPAP) in Chitradurga, Karnataka G. ANANDA VADIVELU It is pointless to expect development agencies to ‘correct’ their mistakes in any meaningful sense. Rather, we should expect ‘failing’ projects to receive renewed funding precisely because they are succeeding in a broader sense, in depoliticising such key issues as the distribution of land or the extension of bureaucratic power in contested zones of governance. What seems like failure is success by another name. (Kumar and Corbridge, 2002:94) Introduction The main purpose of the Drought Prone Areas Programme (DPAP), which comprises a core component of projects implemented as per the GoI (1994) guidelines, is to restore ecological ‘balance’ through soil and moisture conservation on a watershed basis. However, the Technical Committee (GoI, 1994) has noted that watershed projects were “implemented in a fragmented manner by different departments through rigid guidelines without any well-designed plans prepared on watershed basis by involving the inhabitants” (GoI, 1994:1). Therefore, the result has been that the programmes initiated were

Welcome message from author
This document is posted to help you gain knowledge. Please leave a comment to let me know what you think about it! Share it to your friends and learn new things together.
Transcript

383Choosing ‘not’ to Participate—Evidence from Drought Prone... • G. ANANDA VADIVELU
I am thankful to Prof. Rajasekhar, Prof. R.S. Deshpande, Prof. K.V. Raju,Prof. Kadekodi, Dr. Vijayendra Rao, Dr. Anirudh Krishna, Dr. Priya for their support.Dr. Ajit menon has been a great source of support from the very early stages of thiswork. Dr. Sivakami spent quite a bit of her time in helping me code the data.Dr. Madeshwaran and Dr. Venkatachalam provided crucial support during a criticalstage of the work. Venugopal facilitated my initiation into qualitative responsemodels. Balraja and Srinivas were of great support during data collection, whileSushma and Manjula provided computational assistance. Last, but not the least thefarmers who choose to spend their time in talking to me. The usual disclaimerapplies.
16Choosing ‘not’ to Participate—Evidence from
Drought Prone Area Programme (DPAP)in Chitradurga, Karnataka
G. ANANDA VADIVELU
It is pointless to expect development agencies to ‘correct’ their
mistakes in any meaningful sense. Rather, we should expect ‘failing’
projects to receive renewed funding precisely because they are
succeeding in a broader sense, in depoliticising such key issues as the
distribution of land or the extension of bureaucratic power in
contested zones of governance. What seems like failure is success by
another name. (Kumar and Corbridge, 2002:94)
Introduction
The main purpose of the Drought Prone Areas Programme (DPAP),
which comprises a core component of projects implemented as per the
GoI (1994) guidelines, is to restore ecological ‘balance’ through soil
and moisture conservation on a watershed basis. However, the
Technical Committee (GoI, 1994) has noted that watershed projects
were “implemented in a fragmented manner by different departments
through rigid guidelines without any well-designed plans prepared on
watershed basis by involving the inhabitants” (GoI, 1994:1).
Therefore, the result has been that the programmes initiated were

384 Development in Karnataka: Challenges of Governance, Equity and Empowerment
unable to arrest the overall process of ecological degradation. The
Technical committee has noted that based on ‘successes’1 achieved
that this has been possible due to—“planning on watershed basis
through the participation of people at all stages, active involvement of
the voluntary organisations and coordinated effort by the
administration” (GoI, 1994: 1).
The lacunae in the implementation of the programme in terms of
the nature of participation are clearly noted—“Except in rare cases, the
participation of the people was conspicuous by its absence either in
the preparation of plans or in their implementation. The people were
found to be passive at best and skeptical and even hostile at worst
(emphasis mine). In quite a few cases, the structures created by the
departments were demolished by the farmers, as, for example, in
certain areas as many as 25 per cent of the bunds laid on the fields
were demolished” (GoI, 1994:13).
The attempt of the State to transform the governance structure of
the watershed programmes implemented by the Ministry of Rural
Development through the Common Guidelines (GoI, 1994) has
therefore been characterised as being revolutionary in nature by Shah
and Memon (1999) for three reasons, pertaining to the design of the
institutional mechanism: (a) devolution of decision-making and
financial allocation directly to the district and then to the village level,
(b) creation of a partnership between the Government, Non-
Governmental Organisations (NGOs) and communities and
(c) evolution of flexible mechanisms regarding the technical and
financial norms. The changes that are occurring in terms of
Government bureaucracies trying to reform are part of wider changes
wherein there is move towards ‘depoliticisation’ of development
through the crafting of single purpose user committees (water user
committees, watershed development committees, health committees,
forest protection committees, etc.).2 In this paper, we have a limited
1. The cases of success cited in the report are from Ralegaon Sidhi and Adgaon inMaharasthra, certain Tribal areas of Pancahaml in Gujarat, Mittemari in Karnataka andJhabua in Madhya Pradesh.
2. These attempts to ‘depoliticise’ development is rightly argued to be based on theunrealistic and flawed assumption that these groups are apolitical in nature, a critiqueof this ‘second wave’ of decentralisation is beginning to emerge (Manor, 2004).
385Choosing ‘not’ to Participate—Evidence from Drought Prone... • G. ANANDA VADIVELU
purpose and we only examine the constraints that farmers face in
participating in the programme of somebody else—‘the government’.
The paper is organised as follows: In section one, we discuss the
framework adopted for the study and state our normative position and
locate the enquiry in the participatory development discourse. In
section two, we briefly discuss the ‘failure’ of the Drought Prone Areas
Programme (DPAP), which provides a backdrop to understand the
historical baggage under which current programme constraints are
encountered. In section three, we introduce the study area and specify
the methodology adopted for the field enquiry. In section four, we
present the evidence and in the last section, we conclude by raising
certain policy issues in the context of our findings.
Framework to Examine Participation
The typology of Cohen and Uphoff (1980) provides a useful
framework for discussing participation. The three dimensions of
participation outlined are: what kind of participation is under
consideration, who is participating in it and how is participation
occurring?. With respect, to What, they are: (a) Participation in
decision-making; (b) Participation in implementation; (c) Participation
in benefits; and (d) Participation in evaluation. To answer the, what
question, we have to examine as to what are the levels in which
participation can occur. The three types of decisions are—initial
decisions, ongoing decisions and operational decisions. An important
issue relates to Resource contribution (cash, labour and raw materials)
—“It is particularly important to know as to who is contributing and
how their contributions are made, whether they are voluntary,
remunerated or coerced, the degree to which they are provided on an
individual basis and whether they occur on an intermittent or
continual basis” (Cohen and Uphoff, 1980: 220). The next question
that has to be answered is–Who participates? The study analyses the
differential levels of participation of farmers (small, medium and
large) located across the upper and lower reaches of the watershed,
regarding certain key variables relating to the planning and
implementation of the intervention.

386 Development in Karnataka: Challenges of Governance, Equity and Empowerment
Participation in the watershed context is usually defined as
‘communities’ being involved in the analysis of the soil and water
conservation problems and ‘jointly’ arriving at strategies to alleviate
them. The aspects critical for such processes it is argued are the ability
of members to participate ‘as community’ or to have ‘collective’ voice
(Kolavalli and Kerr, 2002). We argue that the problematisation of
participation by seeing it in terms of the all-inclusive notional concept
of ‘community ’ is too simplistic for the following reason. The
‘community ’ consists of heterogeneous individuals and their
perceptions and incentives to be involved in processes of planning,
implementation and cost sharing differ based on various factors. The
interaction of the ‘individual’—the farmer with a variety of
stakeholders ultimately results in some collective decision-making. The
‘participation’ of the individual farmer, therefore, needs to be
understood in a disaggregated manner, which would enable us to
understand the differential roles that various stakeholders play and
viewpoints that emerge before collective decisions are taken.
Constraints in Participating—Choice between ‘Voice’
vis-à-vis ‘Exit’ Options
Appadurai explains, “poor people have a deeply ambivalent
relationship to the dominant norms of the societies in which they live.
Even when they are not obviously hostile to these norms, they often
show forms of irony, distance, and cynicism about these norms…and
what they often seek strategically (even without a theory to dress it
up) is to optimise the terms of trade between recognition and
redistribution in their immediate, local lives” (emphasis mine, Rao
and Walton, 2004: 65). Breaking this status-quo is not a easy
proposition and in contrast, it is observed, that the rich have a more
fully developed capacity to aspire “because they have a bigger stock of
available experiences of the relationship of aspirations and outcomes,
because they are in a better position to explore and harvest diverse
experiences of exploration and trail, because of their many
opportunities to link material goods and immediate opportunities to
more generic possibilities and options” (Rao and Walton, 2004:68).
Development projects, typically have the mandate of breaking such
a status-quo situation; however, this is not an easy proposition

387Choosing ‘not’ to Participate—Evidence from Drought Prone... • G. ANANDA VADIVELU
because of the constraints involved including the incentives structures
of the ‘street’ level bureaucrats whose mandate is to break such
status-quo scenarios. Appadurai explains certain way of changing such
scenarios:
“any development project or initiative, however grand or modest in
scope, should develop a set of tools for identifying the cultural map
of aspirations that surround the specific intervention that is
contemplated. This requires a method of placing specific technologies
or material inputs in their aspirational contexts for the people most
affected by them. This will require careful and thoughtful surveys,
which can move from specific goods and technologies to the
narratives within which they are understood and thence to the norms
which guide these narratives” (Rao and Walton, 2004:83).
The challenges that development projects face is to change the
mentality and status-quo situation wherein people often choose the
‘exit’ option rather than the ‘voice’ option in their engagement with
development interventions that are facilitated by Governmental
Organisations or NGOs.
Normative Position
The normative stand that we hold is, participation in itself is
important, only to the extent that it facilitates the realisation of
‘desirable’ outcomes. These outcomes are increase in crop production
and productivity, groundwater recharge, reduced rates of migration,
etc.
We believe that the intrinsic value of participation as an
empowering’ exercise is a ‘second-best’ solution and the logical
outcome of ‘better’ participation would be realisation of desirable
outcomes. If this does not happen, the ‘value’ of participation is
‘limited’ in nature.
Locating the Study in the Participatory
Development Discourse
The central importance of community based development is based
on the principle that a more inclusive process of planning and
implementation can lead to better outcomes in terms of the efficiency
of the intervention in achieving its desired goals. This facilitates a

388 Development in Karnataka: Challenges of Governance, Equity and Empowerment
greater possibility that the communities sustain the intervention since
they have played an integral part in planning and implementing the
programme. Better “participation is expected to lead to better
designed projects, better targeted benefits, more cost effective and
timely delivery of project inputs, and more equitably distributed
projects with less corruption and other rent seeking activity” (Mansuri
and Rao, 2004: 6).
The empirical constraints involved in achieving such idealised
objectives are the following based on the review of Mansuri and Rao
(2004):
First, the basic constraint is that individuals have opportunity costs
in exercising ‘voice’ as there are implications in terms of the time lost
or the financial loss incurred due to such participation. Second,
mainstreaming participation is used simply as a means of cost-effective
delivery or low-cost maintenance rather than as a vehicle for social
transformation. Third, it is argued that it would be naïve to expect
participatory exercises to transform the attitudes and implementation
style of authoritarian bureaucracies.3
Some of the insightful studies, which have examined participatory
projects, are Mosse (2003), Kumar and Corbridge (2002) and Baviskar
(2004), (see Mansuri and Rao (2004) for an over-arching review of the
empirical literature). Based on an investigation of the various ‘doubts’
that have begun to be asked about the participatory development
‘project’, certain keen observers have asked and attempted to answer the
following question - whether participation is the ‘new tyranny’? (Cooke
and Kothari, 2001). The various authors in the above volume argue that
participatory processes undertaken ‘ritualistically’ have turned out to be
‘manipulative’ in nature and has ‘harmed’ those it was supposed to
empower. The questions examined are—(a) Do participatory facilitators
override existing legitimate decision-making processes? (b) Do group
dynamics lead to participatory decisions that reinforce the interests of
the already powerful; and (c) The third question relates to the nature
of the participatory method itself. Our study is an effort in examining
the above questions, in particular question-(c).
3. This is based however, on the qualifier that concerted efforts do lead to the requiredresults but more strategic attempts have to be made (See Thomson, 1995).

389Choosing ‘not’ to Participate—Evidence from Drought Prone... • G. ANANDA VADIVELU
Historical ‘Failure’ of Drought Prone Areas Programme
(DPAP) 1973-74 to 2002): A Brief Picture of State Inertia
The DPAP was initiated in 1973 covering 947 blocks of 155 districts
in 13 states. The programme is a centrally sponsored scheme with the
expenditure being shared equally by the Centre and the States. By April
1995, a total area of 74.6 million hectares had been treated under the
programme. The financial implication of this intervention was Rs. 2,195
crores. The results however have not been satisfactory and the Report
of the Comptroller and Auditor General4 states that the “drought
conditions and ecological conditions had shown no perceptible
improvement” and the “drought prone areas had increased from 55.3
million hectares in 1973-1976 to 74.6 million hectares in April 1995”.
However in defense, the Ministry of Rural Areas and Employment stated
in January 1999 that this increase was due to a refinement in the criteria
adopted for identifying a drought prone area and as a reason the
programme was extended to 74.6 million hectares. It was also stated that
the meager allocation meant that efforts to drought proofing was
restricted to only a few confined pockets and there was a need for
enhanced allocation to ensure effectiveness of the programme. However,
the CAG report found that this explanation by the ministry untenable
as “the impact of the DPAP was not monitored and the Ministry had no
information on the magnitude of the drought proofed area after a
quarter of century of the implementation of the programme” while
recognising that insufficient fund allocation was a contributory factor for
the poor results. The Mid Term Appraisal by the Planning Commission
for the 1997-2002 period states in very clear terms the contributory
factor for the poor performance which include issues related to poor
participation, incentive of the staff, insecurity about funding, lack of
impact assessment, etc. (See GoI, 2002: 250-51).
We now proceed to examine the evidence emerging from our study
sites.
4. www.cagindia.org/reports/civil/1999-book3 accessed on 7th March, 2005. The report ofthe Comptroller and Auditor General (GoI, 1998) includes a review of theprogrammes of the Ministry of Rural Areas and Employment including the DPAP andis a severe indictment of the programme. The Audit was conducted in 60 districts of14 states, including Karnataka from April 1998 to June 1998.

390 Development in Karnataka: Challenges of Governance, Equity and Empowerment
Study Area and Methodology
Chitradurga district falls under the Central Dry Agro climatic zone,
which comprises 17 taluks of the districts of Chitradurga and Tumkur.
The total geographical area is 19,98,509 ha and the Gross cropped area
is 10,9169 acres. The major crops grown in the district are: Ragi, Rice,
Jowar, Pulses and Oil seeds. The district falls under the Krishna basin
and two major rivers Vedavathi and Tunghabhadra drain the district.
The mean annual rainfall for the 1901 to 1990 period was 565.mm.
The projects in the II phase were selected as they were the earliest
available to examine projects implemented as per GoI (1994). The
taluk has faced consecutive crop ‘failures’ from 2000 to 2003 period,
especially during the Kharif (rainy season crop) period. There had been
lack of interest in agriculture due to the uncertainties prevailing and
the more urgent need of the small and medium farmers was for wage-
labour. Under such a backdrop the DPAP intervention was undertaken
in the taluk. Certain basic information on the study villages has been
provided in Table 16.1, while Table 16.2 provides a snapshot picture
of the village’s response to the intervention.
Table 16.1
Profile of the II Phase Villages—DPAP (1999-2003)
Sl. Name of Number Total Watershed Dry Irrigated CW5 NAC6
No. the Village of area Area land (ha) (Ha) (Ha)Households (ha) (ha) (ha)
1 Bommadevarahalli 210 1,029.94 307.00 568.03 4.86 92.46 34.92
2 Rajapura 180 1,059.07 360.47 762.75 28.32 70.91 34.56
3 Devasamudra 428 1,476.43 526.52 408.61 177.83 356.21 77.15
4 Vithalapura 51 379.98 375.34 54.33 25.97 25.97 2.94
5 Venkatapura 301 374.38 370.01 219.28 88.04 40.18 26.88
6 Oorthalu 81 563.03 501.28 342.24 301.04 27.95 43.32
7 Muthugarahalli 208 1,543.49 496.64 426.58 30.0 26.49 153.23
Source: DPAP project documents (Number of Households and Watershed area) and therest from GoI (1991).
5. Culturable Waste.
6. Area not available for cultivation.

391Choosing ‘not’ to Participate—Evidence from Drought Prone... • G. ANANDA VADIVELU
Table 16.2
Locating the Differential Village Level ‘Responses’ to the WatershedIntervention
Name of the Village Characterisation of the Village
Devasamudra Local power structures are centralised in the village;(‘Head-end’ village). attempt have been made to appropriate the maximum
resources within the village; in ‘tail’ end villages,resources get spent—‘adjusted’ based on some sort of‘patron-client relationship’. Conflict between thePanchayat (controlled by the Congress) and theWatershed Development Committee (controlled by theJanata Dal); The current Panchayat President’spredecessor was his father who had been the PanchayatChairman for 36 years continuously. Decision on(a) whether the land has to be treated, (b) what sort oftreatment to be done, to a large extent, is influenced bywhether a farmer has alliance is to the Congress or theJanata Dal. The effective ‘control’ of the programme wasexercised by the Z.P. member ’s husband. TheAgricultural assistant before he proceeded to the plotsto plan and implement the treatment used to visit theZ.P. member’s house and based on his ‘instruction/authorisation’ the work proceeded.
Venkatapura and Lobby to ensure that there is only one WDC and notVithalapura WDCs in each village so that resource ‘appropriation’ by(‘Tail’ end villages) Devasamudra can be minimised. WDC members
representing the tail end villages lobby (with the MLAat the hobli7 and Agricultural assistant) to ensure thatthe power exercised by the influence of DevasamudraWDC members is minimised.
Bommadevarahalli Strong indigenous ‘corporate ‘organisation of the Temple(passive village) Committee, which is involved in various activities.
Although there is this strong indigenous set up,government is in the realm of the ‘other ’ and thedesignated person ‘Sarkarada Manusha’ represents largelyany ‘interaction’ that needs to be undertaken with the‘Sarkara’ (Government)
Muthugarahalli Decisions taken by the Agricultural assistant, the WDC(passive village) chairman is a ‘rubber stamp’ to the Agricultural
assistant, certain amount of ‘elite capture’ takes place(ex: Boulder removal being done in Lingayat (a forwardcaste) plots while not in others, which is not anauthorised activity under the DPAP programme)
7. Unit of administration below the Taluk level.

392 Development in Karnataka: Challenges of Governance, Equity and Empowerment
Sampling Procedure
The study involved data collection from five DPAP villages from the
following strata of households after the list of the treated plots were
prepared during the transact undertaken from the upper to the lower
reach of the watershed.
(a) Upper Small.
(b) Upper Medium.
(c) Upper Large.
(d) Lower Small.
(e) Lower Medium.
(f) Lower Large.
Small is defined as those farm households, having less than 5 acres.
Medium is defined as households owning between 5 to 10 acres and
large are those households having more than 10 acres. One acre of
irrigated land is considered to be equivalent to 2 acres of dry land.
Totally, 150 households were interviewed from the above six strata.
We now examine the processes in the study villages.
Preparation of “Master Plan and Action Plan” Document
The basic flaw in the planning process has been that the activities
relating to SHG formation were made only after the action plans were
prepared and submitted. The Participatory Rural Appraisal (PRA)
exercise as envisaged by the architects of the Common Guidelines in
terms of a ‘learning sharing and contestation’ exercise did not take
place. If anything which had a semblance of a PRA exercise, the
following took place—The Agricultural assistant undertook the
transact with the assistance of the ‘key person’ in the village. The
person could be a NGO staff (who had been shortlisted to get a
contract for the ‘software’ part of the work) or a farmer who
potentially became an ‘assistant’ to the Agricultural assistant in the
village. The transact lead to the identification of treatment plans for
the entire designated watershed area and the preparation of year-wise
action plan. The Agricultural assistant solely made this exercise based
on his one-two days visit to the village and one-week of number

393Choosing ‘not’ to Participate—Evidence from Drought Prone... • G. ANANDA VADIVELU
crunching in his calculator, in between his trips to the line
departments for data collation. Having done so, the Master plan was
finalised and submitted to the Zilla Parishad in Chitradurga.
Self Help Groups (SHGs)
The process of being a part of the SHGs is a ‘learning’ and in some
sense, empowering exercise for the members. By collectively managing
the credit activities, this provides some sort of a ‘ground’ wherein
higher-level objectives in terms of building up other village level
organisations could be embarked upon (Fernandez, 1994). The basic
flaw in the intervention process has been that the process of building
rapport and the initiation of SHGs is considered as the ‘software’ part
of the intervention and “NGOs were supposed to have comparative
advantage to do this.”8 This work was ‘contracted out’ to them. This
was contradictory to what the Guidelines envisages. These processes
initiated by the government staff, which was supposed to be a
‘learning experience’ (initiation of SHGs, conduct of PRA exercises).
But all these had not happened, the effort was in terms of getting the
‘real thing done’—fulfillment of work targets prepared in the action
plans.
Even the ‘second–best’ option of contracting the work to NGOs
which was exercised, was plagued with problems, as there was no
commitment on the part of the district level authorities to ensure that
these efforts were supported adequately. The NGOs were basically
one-two men teams. Effort was put by the organisation SAHANA in
the four villages of Devasamudra, Venkatapaura, Vithalapura and
Bommadevarahalli in terms of initiating SHGs. However, no proper
follow up was undertaken, as the NGOs were not paid regularly for
their efforts. This meant that some of the SHGs had become defunct
(one of the reasons was that these groups which are formed with the
expectation of getting ‘loans’ lost interest when they realised that their
chances of getting the loans were low). In at least two of the above
four villages, efforts were put in terms of ‘creating’ ‘area groups’
which basically consisted of households following a particular
8. Interview with the Taluk Agriculture Officer (Team leader of the WatershedDevelopment Team), on 3rd March, 2004.

394 Development in Karnataka: Challenges of Governance, Equity and Empowerment
occupation—pottery, for example. However these area groups remains
only on “paper” (in the NGO records) as further efforts were not put
in terms of training, facilitating the evolving of income enhancement
strategies, etc.9
Only 8.5 per cent of the respondents belonged to those SHGs
initiated by the NGOs which were providing support to the
programme, with the majority (91.5) being member of other initiatives
independent of the watershed intervention (see Table 16.3). Although
it is clearly evident that the effort put in organising these groups was
‘limited’ in nature, the more serious issue pertains to the lack of effort
of the Government staff to ‘engage’ with already existing
organisational capital to create some sort of ‘interest’ in the
programme (Table 16.4). Lack of effort has implications in terms of
poor processes, which are evident in the later stages of the project
cycle.
Table 16.3
Membership of Self-Help Group
(in Percentages)
Strata Not a Member Member of Some SHG
Upper Small 46.2 53.8
Upper Medium 65.4 34.6
Upper Large 50.0 50.0
Lower Small 47.1 52.9
Lower Medium 59.1 40.9
Lower Large 50.0 50.0
Average 52.7 47.3
Attendance of the First Meeting in the Village before the
Initiation of the Watershed Development Committee (WDC)
The initial meeting was held in only three of the five villages. The
meeting was not held in Venkatapura and Vithalapura villages as all
the meetings were centralised in Devasamudra. Only 23 per cent of
the farmers stated that they had attended the meeting. In terms of
9. Interview with the Team leader of SAHANA on 1st June, 2004 who admitted that lackof financial support prevented him from taking any further initiative.

395Choosing ‘not’ to Participate—Evidence from Drought Prone... • G. ANANDA VADIVELU
reach, their distribution was almost equal, while upper reach farmers
represented 53 per cent, lower reach was 47 per cent. The distribution
of farmers who attended the meeting was skewed, a significant
proportion of the farmers belonging to the politically ‘vibrant’
environment of Devasamudra (41 per cent), followed by the tail-end
village of Venkatupura (22.72).
Table 16.5
Attendance at the First Meeting in the Village
(in Percentages)
Strata Not Aware Aware, but did not Aware, but did not Attendedof the Meeting Attend. As Busy in Attend for
Agricultural Work Other Reasons
Upper Small 53.8 11.5 15.4 19.2
Upper Medium 69.2 3.8 7.7 19.2
Upper Large 40.0 30.0 5.0 25.0
Lower Small 61.8 8.8 5.9 23.5
Lower Medium 54.5 13.6 9.1 22.7
Lower Large 36.4 27.3 4.5 32.1
Average 54.0 14.7 8.0 23.3
10. These SHGs were started by the Department of Women and Child Development (StreeShakthi), through the World Bank support (Swashakathi) and other NGOs, whichwere operating, independent of the watershed intervention.
Table 16.4
Membership- Type of Group
(in Percentages)
Strata NGO Providing ‘Software’ Support Others10
to the Watershed Programme
Upper Small 7.1 92.9
Upper Medium 0.0 100.0
Upper Large 10.0 90.0
Lower Small 11.1 88.9
Lower Medium 11.1 88.9
Lower Large 9.1 90.9
Average 8.5 91.5
396 Development in Karnataka: Challenges of Governance, Equity and Empowerment
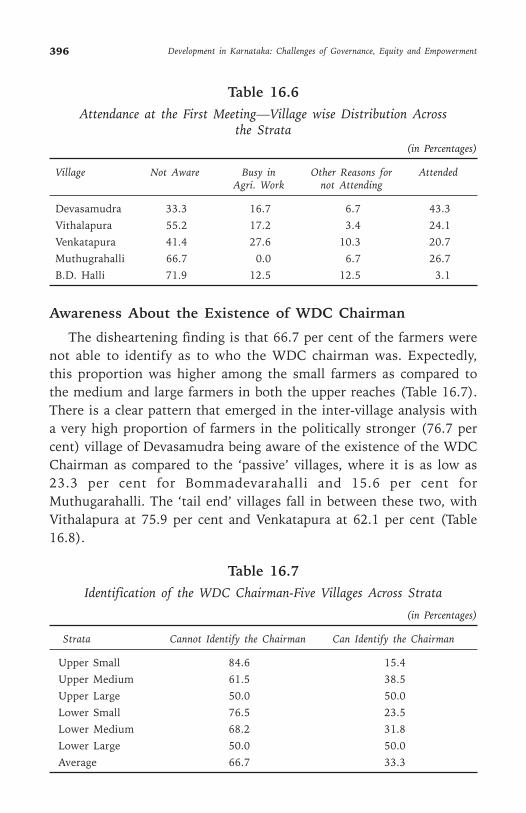
Table 16.6
Attendance at the First Meeting—Village wise Distribution Acrossthe Strata
(in Percentages)
Village Not Aware Busy in Other Reasons for AttendedAgri. Work not Attending
Devasamudra 33.3 16.7 6.7 43.3
Vithalapura 55.2 17.2 3.4 24.1
Venkatapura 41.4 27.6 10.3 20.7
Muthugrahalli 66.7 0.0 6.7 26.7
B.D. Halli 71.9 12.5 12.5 3.1
Awareness About the Existence of WDC Chairman
The disheartening finding is that 66.7 per cent of the farmers were
not able to identify as to who the WDC chairman was. Expectedly,
this proportion was higher among the small farmers as compared to
the medium and large farmers in both the upper reaches (Table 16.7).
There is a clear pattern that emerged in the inter-village analysis with
a very high proportion of farmers in the politically stronger (76.7 per
cent) village of Devasamudra being aware of the existence of the WDC
Chairman as compared to the ‘passive’ villages, where it is as low as
23.3 per cent for Bommadevarahalli and 15.6 per cent for
Muthugarahalli. The ‘tail end’ villages fall in between these two, with
Vithalapura at 75.9 per cent and Venkatapura at 62.1 per cent (Table
16.8).
Table 16.7
Identification of the WDC Chairman-Five Villages Across Strata
(in Percentages)
Strata Cannot Identify the Chairman Can Identify the Chairman
Upper Small 84.6 15.4
Upper Medium 61.5 38.5
Upper Large 50.0 50.0
Lower Small 76.5 23.5
Lower Medium 68.2 31.8
Lower Large 50.0 50.0
Average 66.7 33.3
397Choosing ‘not’ to Participate—Evidence from Drought Prone... • G. ANANDA VADIVELU
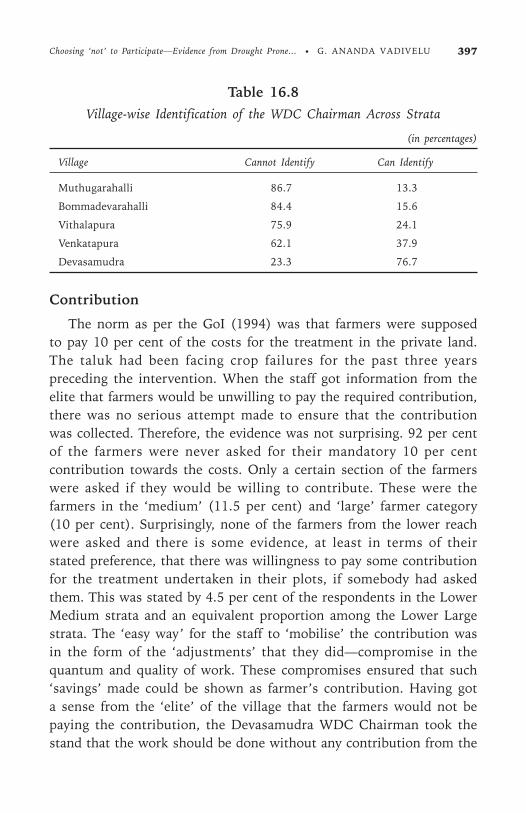
Table 16.8
Village-wise Identification of the WDC Chairman Across Strata
(in percentages)
Village Cannot Identify Can Identify
Muthugarahalli 86.7 13.3
Bommadevarahalli 84.4 15.6
Vithalapura 75.9 24.1
Venkatapura 62.1 37.9
Devasamudra 23.3 76.7
Contribution
The norm as per the GoI (1994) was that farmers were supposed
to pay 10 per cent of the costs for the treatment in the private land.
The taluk had been facing crop failures for the past three years
preceding the intervention. When the staff got information from the
elite that farmers would be unwilling to pay the required contribution,
there was no serious attempt made to ensure that the contribution
was collected. Therefore, the evidence was not surprising. 92 per cent
of the farmers were never asked for their mandatory 10 per cent
contribution towards the costs. Only a certain section of the farmers
were asked if they would be willing to contribute. These were the
farmers in the ‘medium’ (11.5 per cent) and ‘large’ farmer category
(10 per cent). Surprisingly, none of the farmers from the lower reach
were asked and there is some evidence, at least in terms of their
stated preference, that there was willingness to pay some contribution
for the treatment undertaken in their plots, if somebody had asked
them. This was stated by 4.5 per cent of the respondents in the Lower
Medium strata and an equivalent proportion among the Lower Large
strata. The ‘easy way’ for the staff to ‘mobilise’ the contribution was
in the form of the ‘adjustments’ that they did—compromise in the
quantum and quality of work. These compromises ensured that such
‘savings’ made could be shown as farmer’s contribution. Having got
a sense from the ‘elite’ of the village that the farmers would not be
paying the contribution, the Devasamudra WDC Chairman took the
stand that the work should be done without any contribution from the
398 Development in Karnataka: Challenges of Governance, Equity and Empowerment
farmers.11 (See Chootray, 2004 and Kolavalli and Kerr, 2002, p. 235 for
evidence from elsewhere in the country).
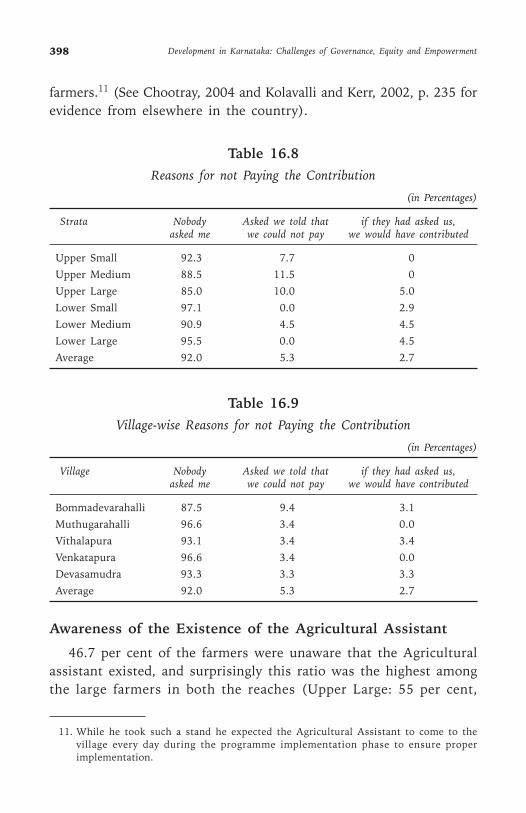
Table 16.8
Reasons for not Paying the Contribution
(in Percentages)
Strata Nobody Asked we told that if they had asked us,asked me we could not pay we would have contributed
Upper Small 92.3 7.7 0
Upper Medium 88.5 11.5 0
Upper Large 85.0 10.0 5.0
Lower Small 97.1 0.0 2.9
Lower Medium 90.9 4.5 4.5
Lower Large 95.5 0.0 4.5
Average 92.0 5.3 2.7
Table 16.9
Village-wise Reasons for not Paying the Contribution
(in Percentages)
Village Nobody Asked we told that if they had asked us,asked me we could not pay we would have contributed
Bommadevarahalli 87.5 9.4 3.1
Muthugarahalli 96.6 3.4 0.0
Vithalapura 93.1 3.4 3.4
Venkatapura 96.6 3.4 0.0
Devasamudra 93.3 3.3 3.3
Average 92.0 5.3 2.7
Awareness of the Existence of the Agricultural Assistant
46.7 per cent of the farmers were unaware that the Agricultural
assistant existed, and surprisingly this ratio was the highest among
the large farmers in both the reaches (Upper Large: 55 per cent,
11. While he took such a stand he expected the Agricultural Assistant to come to thevillage every day during the programme implementation phase to ensure properimplementation.

399Choosing ‘not’ to Participate—Evidence from Drought Prone... • G. ANANDA VADIVELU
Lower Large:54.5 per cent), while it was the least among the upper
medium strata (34.6 per cent) (Table 16.10). The village-wise evidence
was on expected lines, with the proportion of farmers unaware about
the Agricultural assistant being highest in the passive villages—
Bommadevarahlli (65.6 per cent) and Muthugarahalli (60 per cent)
with the least in the ‘head end’ village of Devasamudra (30 per cent).
The proportion of the farmers being unaware of the Agricultural
assistant was quite high in the tail-end village of Vithalapura (62.1 per
cent) which reflects that the village had a few farmers who actively
lobbied, this coexisted with a majority who were unaware of the
existence of the agricultural assistant. Similarly in Venkatapura, close
to half the farmers (48.3 per cent) were unaware of the existence of
the Agricultural assistant (Table 16.11)
Table 16.10
Awareness of Existence of Agricultural Assistant
(in Percentages)
Strata Yes No
Upper Small 57.7 42.3
Upper Medium 65.4 34.6
Upper Large 45.0 55.0
Lower Small 52.9 47.1
Lower Medium 50.0 50.0
Lower Large 45.5 54.5
Average 53.3 46.7
Table 16.11
Village-wise Awareness of the Existence of the Agricultural Assistant
(in Percentages)
Village No Yes
Bommadevarahalli 65.6 34.4
Muthugarahalli 60.0 40.0
Vithalapura 62.1 37.9
Venkatapura 48.3 51.7
Devasamudra 30.0 70.0

400 Development in Karnataka: Challenges of Governance, Equity and Empowerment
A majority of the farmers were unaware that an Agricultural
assistant existed (52.7 per cent) with this proportion being the highest
among the ‘small’ farmers—upper reach (57.7 per cent) and lower
reach (52.9 per cent). Although the visibility of ‘adjustments’ was low,
only 8.7 per cent of the respondents have stated that the quality of the
work is poor and the staff are corrupt (Table 16.12), the data on the
quality of the treatment reveals ‘problems’ due to the compromise on
the quantum and quality of the treatment undertaken.12 The
proportion of farmers stating that ‘good’ work was done was
expectedly higher in Devasamudra (40 per cent), where most of the
resources got ‘appropriated’ and spent. In the same village, 30 per cent
of the farmers stated that they were not aware of the Agricultural
assistant, indicating the differential processes that were underway in
the same village.
Table 16.12
Perception by the Farmers on the Agricultural Assistant
(in Percentages)
Reach Do not Corrupt Did not do Fought with Met me GoodKnow & as I wanted- him to and took Work
Quality Did as per get the consent Doneis Poor Estimates Work Done
Upper small 57.7 11.5 1.0 1.0 0.0 23.1
Upper Medium 65.4 7.7 0.0 3.8 0.0 23.1
Upper Large 40.0 5.0 10.0 5.0 5.0 35.0
Lower Small 52.9 11.8 8.8 0.0 23.5 2.9
Lower Medium 50.1 9.1 9.1 0.0 0.0 31.8
Lower Large 45.5 9.1 9.1 4.5 0.0 31.8
Average 52.7 8.7 6.7 2.7 1.3 28.0
Decision-making on the Treatment in the Plot
The findings for the five villages on the aggregate are that 30 per
cent of the farmers were never consulted, while 24 per cent of them
were consulted and consent was taken. In 36 per cent of the cases, the
farmer made a request, while active lobbying was done by 10 of per
12. A detailed discussion on this is beyond the scope of this paper.

401Choosing ‘not’ to Participate—Evidence from Drought Prone... • G. ANANDA VADIVELU
cent of the farmers. The disaggregated strata-wise inference (Table
16.13) clearly shows that the proportion of households, which were
not consulted, was higher among the small farmers in both the upper
and lower reaches (38.5 and 35.3 per cent respectively), while the
proportion was the least among larger farmers (20 and 18 per cent
respectively for the farmers in the upper and lower strata). This
proportion was lower in the case of ‘large’ farmers because they
themselves were actively involved in lobbying to get the desired
treatments.
This was more so the case of lower reach farmers (18.1 per cent)
than the upper reach (10 per cent). These farmers largely took the
initiative to meet the Agricultural assistant and request the required
treatment. For, the Agricultural assistant too, such farmers were more
‘easily’ accessible whenever he decided to visit the village, while it was
more difficult to meet the ‘small’ farmers whose livelihoods depended
not only on the crops that they cultivate, but also on wage
employment for which they frequently had to go to the neighbouring
villages.
Table 16.13
Decision making on Treatment in the Plot
(in Percentages)
Strata Treatment Farmer’s Farmer Stating Farmerdone without Consent Taken his Request UndertakingConsultation ‘Proactive’ Action
Upper Small 38.5 15.4 46.1 0
Upper Medium 34.6 23.1 26.9 15.4
Upper Large 20.0 35.0 35.0 10.0
Lower Small 35.3 20.6 32.3 11.8
Lower Medium 27.3 36.4 31.8 4.5
Lower Large 18.2 18.2 45.5 18.1
Average 30.0 24.0 36.0 10.0
The disaggregated village-wise analysis is on predictable lines, with
the proportion of ‘no consent’ treatments highest among the ‘passive’
villages of Bommadevarhalli, which had the highest proportion of
households falling under this category (53.1 per cent), followed by

402 Development in Karnataka: Challenges of Governance, Equity and Empowerment
Muthugarahalli (43.3 per cent), while the politically ‘dominant’
Devasamudra had the least proportion of households (10 per cent).
The proportion in the tail-end villages fell between the two extremes
with Venkatapura having 17.2 per cent of households, while
Vithalapura is 24.1 per cent (Table 16.14).
Table 16.14
Decision-making in the Plot Across the Villages
(in Percentages)
Village Treatment Farmer’s Farmer Stating Farmerdone without Consent his Request UndertakingConsultation Taken ‘Proactive’ Action
Bommadevarahalli 53.1 21.9 21.9 3.1
Muthugarahalli 43.3 40.0 16.6 0.0
Vithalapura 24.1 24.1 31.0 20.7
Venkatapura 17.2 10.3 55.2 17.2
Devasamudra 10.0 23.3 56.7 10.0
Average 30.0 24.0 36.0 10.0
Econometric Analysis
The objective of the econometric analysis is to examine the
causative factors for the ‘differential’ decision making process
regarding the treatment undertaken in the farmer’s plot. The farmer
is either aware or unaware of the ‘processes’ underway (formation of
SHGs, Watershed Development Committee, preparation of an action
plan for the treatment) before reaching a stage wherein a decision has
to be taken on the nature of treatment that has to be undertaken in
the farmer’s plot. If the farmer is unaware, then the decision is made
(a) Without taking the farmer’s consent or
(b) By taking his consent13
If aware, he either
(c) Requests or
(d) Lobbies
13. This initiative of the Agricultural Assistant in meeting the farmer is the ‘first’ andprobably only indication to the farmer that the DPAP programme is underway in hisvillage.

403Choosing ‘not’ to Participate—Evidence from Drought Prone... • G. ANANDA VADIVELU
Since, the dependant variable has four sets of responses,
multinomial logit is an appropriate model to analyse the data. The
Model is based on unordered choices. Each of the responses are not
close substitutes and the choice made by the farmer is a conscious one
and each of the events is a mutually exclusive event. Therefore
Hausmann test is not required to test the IIA property.14 In the
Multinomial Logit Model (MNLM), we specify each nominal outcome
as a nonlinear function of the independent variables x ‘s. Once the
model is identified we express this nonlinear probability model as
linear of the log of odds.
The general form of the decision-making on the treatment model
equation is
(1)
The dependant variable for our analysis represents the choice made
by an household in either ‘passively’ giving consent or in making more
active attempts in terms of either requesting or lobbying for
treatment. The most undesired process of decision-making is
undertaking of the treatment by the Agricultural assistant on his own
without taking the consent of the farmer. This forms our base category
as it represents the reference point as compared to other forms of
decision-making. Hence the objective of the model is to know the
probabilities of households under each of the set of the responses. The
set of explanatory variables have been presented in Table 16.15 and
their expected signs in Table 16.16.
Regression Estimates
Multinomial logit models have been estimated for the equation (1)
based on the survey data using the STATA software package.
++ ASSISTANTLTURALAWARAGRICUADUMALAG 65 ββ
+++++==−
=YEARSCHOIRRIEXETOTALLANREACH
YP
YPIn
i
i43210)1(1
)1( βββββ
iAWAWDCC ∈+7β
14. The multinomial logit specification imposes the restriction that the odds (ratio of theprobabilities) of choosing the jth alternative over the ith depend only on thecharacteristics of the two alternatives. In other words, the choice of any otheralternatives in the choice set has no influence on the odds between the ith and jthalternatives. This feature is called the independence from irrelevant alternatives (IIA)property.

404 Development in Karnataka: Challenges of Governance, Equity and Empowerment
Table 16.15
Description of the Variables
Variable Description Mean
Dependant Variable
Decision made 1 if no consent was taken, 27.3%without consent 0 otherwise
Consent taken 1 if consent was taken, 25.3%0 otherwise
Farmer requested 1 if farmer requested, 37.3%0 otherwise
Farmer lobbied 1 if farmer lobbied, 10%0 otherwise
Explanatory Variables
a. Endowment Variables
Reach 1 is lower reach while 0 is 53%upper reach
Totallan Total land holding of the farmer 9.92(in acres)
Irriexe Proportion of land that is irrigated 5.8(per cent)
Yearscho Years of schooling for the head 4.45of the household
Adumalag Number of adult males involved 1.53in agricultural labour assecondary occupation
b. Mode Level Variables
Awaraa 1 if aware of the existence of the 47%Agricultural assistant, 0 otherwise
Awawdcc 1 if aware of the existence of the 34%Watershed Development committee,0 otherwise

405Choosing ‘not’ to Participate—Evidence from Drought Prone... • G. ANANDA VADIVELU
Maximum likelihood estimation has been used to estimate the
coefficients, which have been reported in Table 16.17. The likelihood
test rejects (at less than 1 per cent significance level) the hypothesis
that all the coefficients of the explanatory variables (except the
constant) are zero. The coefficient of each of the variables reflects the
effect of change in each of the variables on the probability that a
certain mode of decision making took place relative to the decision
made without consent of the farmer. The Pseuedo R2 is 0.150.15
Table 16.16
Explanatory Variables and Expected Signs
Expected Signs
Variable Description Agricultural Farmer Farmerassistant decides requested lobbied
and Consent of thefarmer is taken
REACH Location of the plot, upper + + +or lower reach (binary) - - -
TOTALLAN Farm size in acres + + +(continuous)
IRRIEXE per cent of total land + + +holding that is irrigated(continuous)
ADUMALAG Number of adult males in - - -the household involved inagricultural labour(continuous)
YEARSCHO Years of schooling for the - + +head of the household
AWAWDCC If the farmer is aware of the - + +existence of the WatershedDevelopment Committee ornot (binary)
AWARAA Whether the farmer is aware + + +of the existence of theAgricultural assistant ornot (binary)
15. Following Maddala who states that “the low R2 values one usually obtains whencalculating correlations between a binary dependant variable and the predictedprobabilities need not imply that the model is not good”, we conclude that the modelcan be interpreted even if the Psuedo R2 value is low (1983:38).

406 Development in Karnataka: Challenges of Governance, Equity and Empowerment
Table 16.17
Multinomial Logit Regression Estimates for the Decision Making onTreatment Model
Farmer’s Consent Taken Farmer Requesting Farmer Lobbying
Variable Coeff Odds Coeff Odds Coeff Odds(S.error) ratio16 (S.error) ratio (S.error) ratio
Constant -.201 -.798 -3.74(.501) (0.672) (1.04)
Reach -.009 0.81 -.474 0.62 0.264 1.02(.0323) (.493) (.697)
Totallan .010 0.99 .0156 1.01 .0293 1.02(.0195) (.0295) (.0316)
Irriexe .110 1.01 -.000 0.99 .005 1.00(.060) (.0199) (.022)
Yearscho -.258*** 1.11 .136** 1.14 .166*** 1.18(.266) (.0650) (.087)
Adumalag 1.248 0.77 -.228 0.79 .362 1.43(.541) (0.260) (.329)
Awaraa 2.544** 3.48 1.264** 3.54 1.800** 6.07(.806) (.532) (.969)
Awawdcc -.611** 5.23 2.544* 12.73 1.800*** 6.05(0.683) (.806) (0.969)
N = 150 Likelihood ratio test = 58.80 Pseuedo R2 = 0.150
Notes: *** Significant at 10 per cent level
** Significant at 5 per cent level
* Significant at 1 per cent level
The coefficients of three of the seven explanatory variables included
in the model have been found to be significant. The coefficient of
years of schooling (YEARSCHO) was estimated to be positively signed
and as expected has been found significant at either 10 per cent or 5
per cent level. The Odds Ratio of 1.11 for the farmer consent taken
group indicates that a farmer with an additional one year of schooling
would lead to a 11 per cent higher probability that the Agricultural
assistant would consult the farmer before deciding on the treatment
16. The odds ratio in multinomial logistic models is referred to as Relative Risk Ratio(RRR). Like the odds ratio, a relative risk equal to 1 implies that the event is equallyprobable in both groups. A relative risk greater than 1 implies that the event is morelikely in the first group. A relative risk less than 1 implies that the event is less likelyin the first group.

407Choosing ‘not’ to Participate—Evidence from Drought Prone... • G. ANANDA VADIVELU
on his land. Similarly, the Odds Ratio of 1.14 for the farmer
requesting group indicates that an additional year of schooling of the
farmer increases the the probability of the farmer taking the initiative
and making a request to the Agricultural assistant on the desired
treatment required for his land by 14 per cent. The Odds Ratio of 1.18
for the farmer lobbying group indicates that an additional one-year of
schooling would increase the probability by 18 per cent of the farmer
making proactive attempts to lobby.17
The coefficient of Awareness of Agricultural assistant (AWARAA)
was estimated to be positively signed and as expected was found to
be significant at the 5 per cent level. The Odds Ratio of 3.48 for the
farmer consent taken group indicated that an ‘effort’ by the farmer to
‘recognise’ that the Agricultural assistant existed meant that the
probability that the staff would consult the farmer increased by more
than 3 times. The Odds Ratio of 3.54 for the farmer requesting group
similarly increased the probability by 3 times of the ‘effort’ the farmer
would put in making a request to the Agricultural assistant. For the
farmer lobbying category, the Odds Ratio of 6.05 indicated that an
awareness of the existence of the Agricultural assistant increased the
probability by six times that the farmer would lobby to influence him
(either directly or indirectly).
Contrary to the expected positive sign, the coefficient for the
consent taken group showed a negative sign (-.61) for the Awareness
of the existence of the Watershed Development Committee variable
(AWAWDCC). (in comparison the expected positive sign is met for
the other two groups). This finding clearly indicates that the consent
taken was largely based on a one-to-one interaction between the
Agricultural assistant and the individual farmer and the awareness or
unawareness of the existence of the WDC did not play a role in the
decision making process involved between the individual farmer and
the staff. This ‘arrangement’ was unproblematic for both the farmer
(his consent was taken) and the staff (consultation was done although
not through the mandated route of the WDC playing a role in that
consultation process).
17. This can be either the Agricultural Assistant being influenced one-to-one by thefarmer or through the MLA or the ZP member’s husband. This pertains to the headend village of Devasamudra and tail end villages of Venkatapura and Vithalapura.

408 Development in Karnataka: Challenges of Governance, Equity and Empowerment
The Odds Ratio of 12.73 for the farmer making a request category
indicates that the awareness of the existence of the Watershed
Development Committee (WDC) increased by more than 12 times the
probability that the farmer would take the ‘effort’ to request the
desired treatment, while the Odds Ratio of 6.07 indicated that such
an awareness would increase by more than 6 times the probability that
the farmer would put in the required ‘effort’ to lobby to garner the
required benefits.
The causative factors for certain independent variables being not
statistically significant were the following. Regarding, the REACH
variable, we hypothesised that that the farmers in the lower reach
would have a better interest to participate in the programme (due to
their better initial endowment- higher quality soil, higher proportion
of irrigated land) because of their more optimistic assumptions about
the benefits that could be derived from the various soil and water
conservation treatments, the project offered. However, this was not
found to be true, as the lower reach farmers similar to the upper reach
farmers were pessimistic about the programme. This was because the
failure of the rains in the past three years predominantly dominated
their thinking about the utility of the programme whose benefits were
contingent on good rainfall. The occurrence of a large number of
borewell failures was another reason for them to loose faith in the
possibilities that agriculture offered. Therefore, the variable regarding
irrigation (IRRIEXE) also was insignificant.
For the variable, land holding (TOTALLAN), the qualitative
inference clearly showed that differential modes of decision making
occur based on the extent of the land owned. The econometric result
has not substantiated the qualitative finding due to the nature of the
econometric exercise wherein due to the effect of various other
variables, land holding is not significant, while this has not been the
case in the qualitative inference as we establish a one-to-one
relationship between the variables. The same argument holds true for
the variable-Adult Males involved in agricultural labour
(ADUMALAG).

409Choosing ‘not’ to Participate—Evidence from Drought Prone... • G. ANANDA VADIVELU
Central Argument of the Paper
The farmer’s option to choose the ‘exit’ option (passiveness and
deliberate choice to ‘exclude’ themselves from the processes) was due
to a combination of various factors. First, when the taluk was facing
three consecutive crop failures, the mode of operation of the DPAP
programme did not factor in the major concern which a majority of
the farmers (small and medium) had: need for wage labour creation.
Instead of meeting this concern, the programme was largely
implemented using machinery. Such a programme did not prove of
interest to the farmer, as their expectation of the outcome of the
programme (in terms of higher output and yield) was not positive.
Therefore, a programme of wage labour generation, through a Food for
Work Programme (FFW) would have been of interest to them as at
least in terms of meeting their ‘immediate’ concern.
Second, a ‘mode’ level factor is the lack of conditionalites or “no
negotiables” not being there. When farmers could get their land
treated without attending meetings, without making a contribution,
without knowing who the WDC Chairman or Agricultural assistant
was, why would they take the ‘trouble’ of going though all this
processes, which the architects of the national guidelines expect them
to do? (GoI, 1994). The staff also found this as non-problematic as
they had alternative mechanisms—‘adjustments’ to meet the
requirements of the national guidelines. Since the auditor did not
undertake a verification exercise, to see what is happening in terms of
the guidelines, the targets were met, the projects get completed and
the staff gets busy with the ‘new’ project- the SUJALA Watershed
Project18 funded by the World Bank or various other projects,
underway.
To conclude, the ‘exit’ option exercised by the farmer and the
behaviour of the bureaucrat to be ‘inefficient’ (not follow the norms
prescribed by the guidelines (GoI, 1994) proved to be a win-win
situation for both the farmers and the staff as they could finally
achieve something which was desired by both. For the farmers, they
18. The supervision norms apparently were quite ‘strict’ in this project and was a greatersource of ‘pressure’ as better processes had to be initiated in the ‘ground’ to ensureupward accountability.

410 Development in Karnataka: Challenges of Governance, Equity and Empowerment
could get their land treated, without having to ‘waste’ their time in
‘unnecessary’ processes, while the bureaucrats could mange to get
their projects completed without having to undertake various tasks
involved in putting the processes in place.
Policy Implications in the Context of the Policy Discourse
The policy initiative in terms of the funding envisaged for the
Watershed programmes in the country involves a total outlay of
Rs. 76,000 crores to be spent over a 25 year period which would lead
to a treatment of 63 million ha. This is as per the Perspective Plan
prepared by the Planning Commission. The Government intends to do
this by merging various employment guarantee schemes in the dry
land and by shifting a part of the allocation from irrigation and water
resource. However, the evidence in the context of an important
programme—the Drought Prone Areas Programme (DPAP) has been
extremely unsatisfactory. This is based on two important policy
documents—(a) Report of the Comptroller and Auditor General
(CAG) on the programmes of the Ministry of Rural Areas and
Employment, and (b) Mid term appraisal for the 1997-2002 period of
the Planning Commission. The evidence from our field sites
substantiates the findings of the above policy documents and
documents, the lacunae in the programme and provides certain
causative factors for such a situation to exist.
Since the Planning Commission is well aware of the lacunae in the
programme the question that needs to be answered is: How does one
proceed further in terms of design of the programme? Joy and Parajape
(2004: 120-126) have suggested mechanisms to restructure the
programme, which needs to be seriously considered by the policy
makers. It is pointed out that the current time span of projects of five
years is not sufficient and there is need for increasing the project
duration to a range of seven to ten years. It is envisaged that the
programme would proceed from one phase to another based on the
condition that funding for each phase would be tied to the
performance of the previous phase. An assessment would be carried
out after the end of the period and that would decide as to how much
proportion of the assistance would have to be treated as a loan vis-à-
411Choosing ‘not’ to Participate—Evidence from Drought Prone... • G. ANANDA VADIVELU
vis how much as a grant based on the performance criteria (that needs
to be evolved). It is beyond the scope of this paper to discuss the
nitty-gritty’s of the components of each of the phases. However based
on our findings, our concern relates to the need to build in strong
conditionalites on the various components of participation for each of
the phases. In this context, an important contribution to the debate
is the contribution of Shah (2005) who has worked out certain
modalities under which the existing subsidy regime in the watershed
context needs to be reworked.
Considering that droughts are going to persist in the near future
too, the current modes of implementation are quite ‘naïve’ and
‘insensitive’ to the concerns that farmers have. If such, sensitivity does
occur, Food For Work (FFW) programme would emerge as a major
‘mode’ of implementation strategy (particularly in such distress
situations) to address the concerns raised in this paper. If serious
thought on these issues is not given, we would end up replicating and
scaling up ‘failures’ and not ‘successes’. The implications of this is not
only the ‘loss’ of Rs. 76,000 crores to be spent over the next twenty
five years but also of the lost opportunities for us to demonstrate that
dry land development programmes do deliver.
References
Appadurai, Arjun (2004). “The Capacity to Aspire: Culture and the Terms of Recognition”,in Vijayendra Rao, and Michael Walton (eds.), Culture and Public Action, PermanentBlack, New Delhi.
Baviskar, Amitha (2004). “Between Micro-politics and Administrative Imperatives:Decentralisation and the Watershed Mission in Madhya Pradesh, India”, European
Journal of Development Research, Vol. No. 16(1):26-40.
Cohen, John M. and Norman Uphoff (1980). “Participation’s Place in Rural Development:Seeking Clarity though Specificity”, World Development, Vol. No. 8:213-235.
Cooke, Bill and Uma Kothari (2001). Participation: The New Tyranny. London: Zed Books.
Chhotray, Vasuda (2004). “The Negation of Politics in Participatory Development Projects,Kurnool Andhra Pradesh”, Development and Change, Vol. No. 35(2):327-352.
Fernandez, A.P. (1994). The Myrada Experience: The Interventions of a Voluntary Agency in theEmergence and Growth of People’s Institutions for Sustained and Equitable Management of
Watersheds, Bangalore, MYRADA.
Government of India (1991). “Census of India 1991”, Series 11-Karnataka, District CensusHandbook, Chitradurga District, Part XII-A, Town and Village Directory, Bangalore, Directorof Census Operations, Karnataka.
———. (1994). Guidelines for Watershed Development. New Delhi: Government of India.

412 Development in Karnataka: Challenges of Governance, Equity and Empowerment
———. (2002). Mid-Term Appraisal–Final Document (1997-2002). New Delhi: PlanningCommission.
Joy, K.J. and Suhas Paranjape with A.K. Kiran Kumar, Rohini Lele and Raju Adagale (2004).Watershed Development Review: Issues and Prospects, Technical Report. Bangalore: Centre forInterdisciplinary Studies in Environment and Development.
Maddala, G.S. (1983). Limited Dependant and Qualitative Variables in Econometrics. Cambridge:Cambridge University Press.
Kolavalli, L., Shashi and John Kerr (2002). “Mainstreaming Participatory WatershedDevelopment”, Economic and Political Weekly, Vol. No. XXXVII (3):225-242, January 19.
Kumar, Sanjay and Stuart Corbridge (2002). “Programmed to Fail? Development Projectsand the Politics of Participation”, The Journal of Development Studies, Vol. No. 39 (2):73-103.
Manor, James (2004). “User Committees: A Potentially Damaging Second Wave ofDecentralisation”, The European Journal of Development Research, Vol. No. 16 (1):192-213.
Mansuri, Ghazala and Vijayendra Rao (2004). “On Community-Driven Development”,The World Bank Research Observer, Vol. No. 19(1):1-39.
Mosse, David (2003). “Good Policy is Unimplementable? Reflections on the Ethnographyof Aid Policy and Practice”, Paper presented at the EIDOS Workshop on Order and
Disjuncture: the Organization of Aid and Development, 26-28th September, SOAS, London.
Rao, Vijayendra (2002). “Experiments in ‘Participatory Econometrics’ Improving theConnections between Economic Analysis and the Real World”, May 18, Economic and
Political Weekly, Vol. No. XXXVII (20):1887-1891.
Thomson, John (1995). “Participatory Approaches in Government Bureaucracies: Facilitatingthe Process of Institutional Change”, World Development, Vol. No. 23, (9):1521-54.
Shah, Amitha (2005). “Economic Rationale, Subsidy and Cost Sharing for WatershedProjects: Imperatives for Institutions and Market Development”, Paper Presented at the2005 IWMI-TATA Water Policy Program Partners Meet.
Shah, Amitha and Gani Memom (1999). Watershed Development Project in Gujarat—A Quick
Review. Vadodara: Gujarat Ecology Commission.
Related Documents