Electronic copy available at: http://ssrn.com/abstract=2015071 RTI Press Choosing a Mattress: Using Actigraphy and Diary Reports to Identify a Mattress at Provides Best Sleep Andrew D. Krystal, Jack D. Edinger, Gayle S. Bieler, Scott W. Mladsi, and Sean O. Hogan Febuary 2011 RESEARCH REPORT

Welcome message from author
This document is posted to help you gain knowledge. Please leave a comment to let me know what you think about it! Share it to your friends and learn new things together.
Transcript
Electronic copy available at: http://ssrn.com/abstract=2015071
RTI Press
Choosing a Mattress: Using Actigraphy and Diary Reports to Identify a Mattress That Provides Best SleepAndrew D. Krystal, Jack D. Edinger, Gayle S. Bieler, Scott W. Mladsi, and Sean O. Hogan
Febuary 2011
ReseaRch RepoRt
Electronic copy available at: http://ssrn.com/abstract=2015071
This publication is part of the RTI Press Research Report series.
RTI International 3040 Cornwallis Road PO Box 12194 Research Triangle Park, NC 27709-2194 USA
Tel: +1.919.541.6000 Fax: +1.919.541.5985 E-mail: [email protected] Web site: www.rti.org
RTI Press publication RR-0015-1102
This PDF document was made available from www.rti.org as a public service of RTI International. More information about RTI Press can be found at http://www.rti.org/rtipress.
RTI International is an independent, nonprofit research organization dedicated to improving the human condition by turning knowledge into practice. The RTI Press mission is to disseminate information about RTI research, analytic tools, and technical expertise to a national and international audience. RTI Press publications are peer-reviewed by at least two independent substantive experts and one or more Press editors.
Suggested CitationKrystal, A. D., Edinger, J. D., Bieler, G. S., Mladsi, S. W., and Hogan, S. O. (2011). Choosing a Mattress: Using Actigraphy and Diary Reports to Identify a Mattress That Provides Best Sleep. RTI Press publication No. RR-0015-1102. Research Triangle Park, NC: RTI Press. Retrieved [date] from http://www.rti.org/rtipress.
©2011 Research Triangle Institute. RTI International is a trade name of Research Triangle Institute.
All rights reserved. Please note that this document is copyrighted and credit must be provided to the authors and source of the document when you quote from it. You must not sell the document or make a profit from reproducing it.
doi:10.3768/rtipress.2010.rr.0015.1102
www.rti.org/rtipress
About the AuthorsAndrew D. Krystal, MD, is Director, Quantitative EEG Laboratory at Duke University Medical Center, and assistant professor in Duke’s Department of Psychiatry and Behavioral Sciences.
Jack D. Edinger, PhD, is a senior psychologist at the Veterans Affairs Medical Center, Durham, North Carolina.
Gayle S. Bieler, MS, is senior statistician at RTI International.
Scott W. Mladsi, MS, is a mechanical engineer, formerly of RTI International.
Sean O. Hogan, PhD, is a survey director at RTI International.
Choosing a Mattress: Using Actigraphy and Diary Reports to Identify a Mattress That Provides Best SleepAndrew D. Krystal, Jack D. Edinger, Gayle S. Bieler, Scott W. Mladsi, and Sean O. Hogan
AbstractWe systematically assessed the effects of mattress firmness on sleep, pain, and daytime functioning, finding that mattress firmness has statistically significant effects on both sleep and daytime functioning and that individuals varied widely in the mattress that optimized their sleep. A convenience sample of 128 healthy adults living in the Raleigh-Durham, North Carolina, area was recruited to assess the effects of mattress firmness on pain, duration of sleep, sleep quality, and next-day function in healthy sleepers. Our study used a Latin-square randomization design, and subjects slept in their homes on seven test mattresses for approximately 4 weeks per mattress. The firmness of these inner-spring mattresses is typical of mattresses sold in the US marketplace. Mattress firmness was found to significantly affect 9 out of 11 key actigraphic and diary-derived measures of sleep. Though pain was generally minimal for subjects, beds could be distinguished by different levels of morning pain. The “best” and “worst” mattresses were distributed relatively evenly across all mattresses studied.
ContentsIntroduction 2
Methods 2
Design 2
statistical Methods 4
analysis of Mattress Firmness 4
“Best” Mattress analysis 4
Results 5
effect of Mattress Firmness on pain 5
effect of Mattress Firmness on actigraphic Measures 6
effect of Mattress Firmness on sleep Diary Measures 7
effect of Mattress Firmness on Daytime Functioning 7
analysis of pain and Motion 7
Discussion 11
References 13
Acknowledgments Inside back cover
2 Krystal et al., 2011 RTI Press
IntroductionWe spend approximately one-third of our lives in bed. Yet hardly any research has been conducted on the effects of mattress characteristics on health, quality of life, and ability to function. Possible relationships between sleep surface, pain, and sleep quality have been postulated in the published literature.1–4 Among the few published research studies, two1,2 provide preliminary evidence that mattress firmness affects pain. The effects of sleep surface on sleep have been virtually ignored despite the fact that adverse effects of chronic sleep loss on health and function are well established.5–10 Further, the meager set of existing studies is hampered by methodological shortcomings in terms of small numbers of subjects and evaluation of few sleep surfaces.
In this regard, Jacobson et al. tested 22 subjects on two different mattresses to conclude that a prescribed bedding system alleviates chronic lower back or shoulder pain.1 With a larger sample of 300 people using tests involving two mattresses, Kovacs et al. concluded that a medium-firm mattress reduces back pain more than harder or softer surfaces.2 Likewise, Bader and Engdal evaluated the sleep experience of a sample of nine subjects.4 Despite their limitations, these studies collectively suggest that mattress type might influence next-day pain and quality of sleep.
In our study, we sought to more thoroughly evaluate the relationship between mattress surface and pain, as well as to study the effects of mattress firmness on sleep parameters and daytime functioning. Specifically, we evaluated the effects of varying levels of mattress firmness on nocturnal movement, sleep time, and efficiency measured by a device called an actigraph, which monitors motion. Actigraphic measurement is used regularly in sleep research performed outside laboratory settings.11,12 It is regarded by the American Academy of Sleep Medicine as a valid means of identifying periods of wakefulness and sleep.13 Further, we used self-reported measures of sleep quality, sleep time, feelings of restedness upon awakening, number of overnight awakenings, and daytime functioning.
Our approach is unique in that we (1) enrolled a large sample (n = 128), (2) studied healthy subjects devoid of clinically significant pain complaints, (3) employed
accepted actigraphic and diary measures of sleep, and (4) exposed each of our subjects to multiple mattresses for extended periods of time. No other study has the benefit of this combination of a wide variety of mattresses and a large sample size not affected by preexisting sleep abnormalities or chronic pain. Our primary objective was to answer the question, “Does the mattress matter?” or, more precisely, “Does mattress firmness matter?” We hypothesized that mattresses with differing firmness and support will produce statistically significant differences in pain, sleep, and function effects. We also tested whether the optimal mattress might vary from person to person. We found support for these hypotheses using both actigraphic evidence and diary reports, thereby providing robust findings.
Methods
Design Subjects slept in their own homes, recording sleep with an actigraph and a diary each night. The actigraph is a motion-sensitive device worn on the subject’s arm. The diary used in this study is based on the Epworth Sleepiness Scale and the National Sleep Foundation’s sleep diary. Subjects slept in their own homes without the research design imposing any restrictions. Thus, the only treatment is the change in bed, rather than any change in lifestyle or sleeping arrangements.
We recruited a convenience sample of 165 healthy adults from the Raleigh-Durham area of North Carolina. Subjects completed a 56-question screening survey that a physician (AK) used to eliminate subjects who (1) were pregnant or planning to become pregnant in the next year, (2) cared for or planned to adopt an infant under the age of 2 during the study, (3) had a medical or psychiatric condition that might affect sleep, (4) had a pacemaker, (5) worked evening or overnight shifts, (6) used sleep-altering medications, (7) had a sleep disorder, or (8) were frequently away from home at night.
Of the 165 participants enrolled in the study, 128 provided complete data. Participants not providing complete data across all beds typically experienced equipment failures. The mean age was 40.4 years,
Choosing a Mattress 3
and the average body mass index (BMI) was 25.9. Sixty-one percent of the final sample was female, and the ethnic composition was 80.5 percent Caucasians, 13.3 percent African Americans, 5.5 percent Asians, and 0.8 percent Native Americans. Our protocol was approved by the Institutional Review Board at RTI International. Participants provided informed consent and, as an incentive, received either $700 or a mattress at the conclusion of the study. Participants who did not complete the study received an amount prorated to the proportion of the study completed.
MattressesWe studied sleep experiences on seven innerspring mattress and box spring sets (“mattress”) ranging in firmness from 1 (least firm) to 7 (most firm) and representing the range of innerspring mattresses commercially available in the United States. We refer to relative firmness of the beds accordingly. Beds 1 through 7 are in order of firmness; however, the degree of change in firmness from bed to bed is not uniform. All of the mattresses were produced by a single manufacturer to control for materials and manufacturing processes.
Latin-Square DesignSubjects were assigned to mattresses in an order determined by a Latin-square design so that each subject slept on each of the study mattresses for only one period of 3 to 4 weeks. We assigned individuals randomly to one of 14 mattress rotation sequences so that particular types of people were not systematically assigned to a particular rotation.
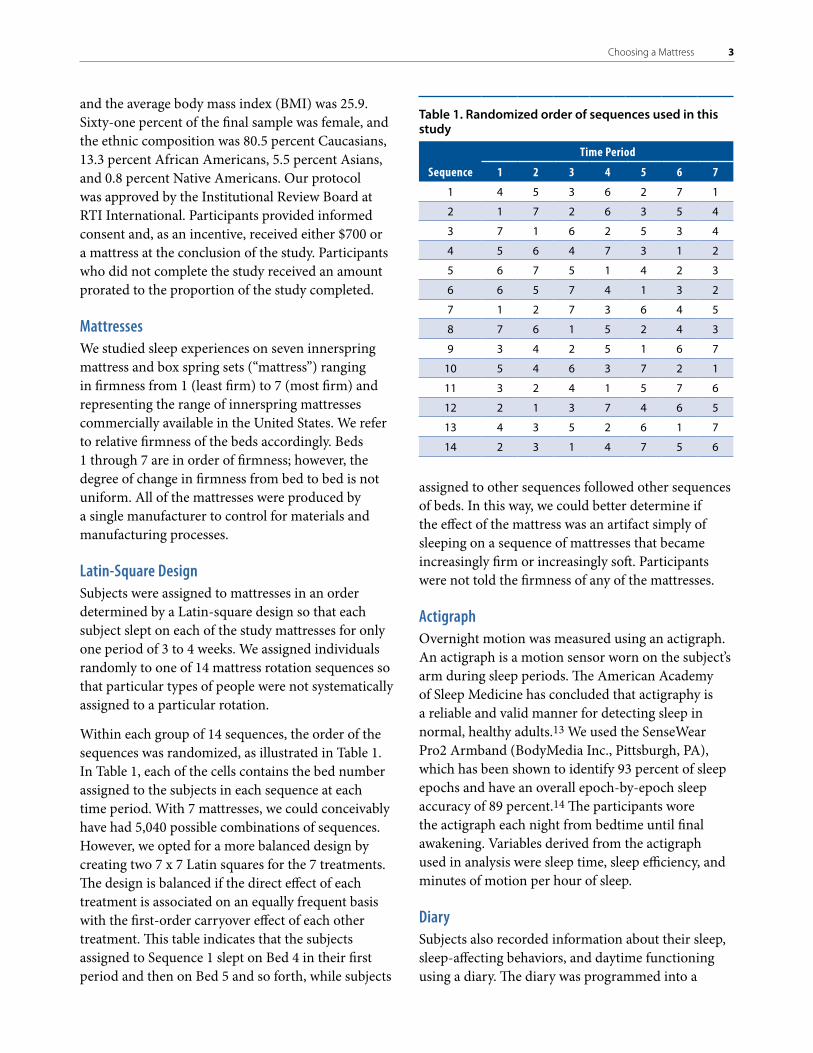
Within each group of 14 sequences, the order of the sequences was randomized, as illustrated in Table 1. In Table 1, each of the cells contains the bed number assigned to the subjects in each sequence at each time period. With 7 mattresses, we could conceivably have had 5,040 possible combinations of sequences. However, we opted for a more balanced design by creating two 7 x 7 Latin squares for the 7 treatments. The design is balanced if the direct effect of each treatment is associated on an equally frequent basis with the first-order carryover effect of each other treatment. This table indicates that the subjects assigned to Sequence 1 slept on Bed 4 in their first period and then on Bed 5 and so forth, while subjects
assigned to other sequences followed other sequences of beds. In this way, we could better determine if the effect of the mattress was an artifact simply of sleeping on a sequence of mattresses that became increasingly firm or increasingly soft. Participants were not told the firmness of any of the mattresses.
ActigraphOvernight motion was measured using an actigraph. An actigraph is a motion sensor worn on the subject’s arm during sleep periods. The American Academy of Sleep Medicine has concluded that actigraphy is a reliable and valid manner for detecting sleep in normal, healthy adults.13 We used the SenseWear Pro2 Armband (BodyMedia Inc., Pittsburgh, PA), which has been shown to identify 93 percent of sleep epochs and have an overall epoch-by-epoch sleep accuracy of 89 percent.14 The participants wore the actigraph each night from bedtime until final awakening. Variables derived from the actigraph used in analysis were sleep time, sleep efficiency, and minutes of motion per hour of sleep.
DiarySubjects also recorded information about their sleep, sleep-affecting behaviors, and daytime functioning using a diary. The diary was programmed into a
Table 1. Randomized order of sequences used in this study
Time Period
Sequence 1 2 3 4 5 6 7
1 4 5 3 6 2 7 1
2 1 7 2 6 3 5 4
3 7 1 6 2 5 3 4
4 5 6 4 7 3 1 2
5 6 7 5 1 4 2 3
6 6 5 7 4 1 3 2
7 1 2 7 3 6 4 5
8 7 6 1 5 2 4 3
9 3 4 2 5 1 6 7
10 5 4 6 3 7 2 1
11 3 2 4 1 5 7 6
12 2 1 3 7 4 6 5
13 4 3 5 2 6 1 7
14 2 3 1 4 7 5 6
4 Krystal et al., 2011 RTI Press
handheld computer, and subjects completed this diary twice each day: once upon awakening and again at bedtime. Subjects recorded information about their consumption of alcohol and caffeine, difficulty falling asleep, time asleep, number of overnight awakenings, overall sleep quality, pain severity upon going to bed and at awakening, feelings of restedness at the start of the day, and feelings of energy and drowsiness during the day. Measures of pain, sleep quality, difficulty falling asleep, and daytime functioning were recorded using 7-point Likert-type scales. Measures of time awake, number of awakenings, and alcohol or caffeine use were measured using frequency counts.
Statistical MethodsThe analyses focused on 128 participants and their 16,366 “compliant nights” of data. A compliant night was defined by (1) valid actigraphic data—actigraph worn at least 4 hours, at least 30 minutes of recorded sleep, and recorded sleep efficiency at least 20 percent; (2) valid morning diary; and (3) valid evening diary. The number of compliant nights within each of the 128 × 7 = 896 participant-by-mattress combinations ranged from 1 to 50, with 18 nights being the most frequent.* There was at least one compliant night for 895 out of 896 mattress combinations.
Because our approach modeled aggregated data over the nights on each bed, we examined the outliers in our range to determine whether they distorted our mean scores and found that they did not. If we eliminate any cases of fewer than 5 and more than 40, we lose a total of 6 observations and still have a mean of 18.
Statistical significance in our analysis refers to p < 0.05, and all p-values are two-sided based on significance testing.
Analysis of Mattress FirmnessWe used linear regression modeling to evaluate the effect of mattress firmness, with firmness as the main effect. We controlled for participants’ demographic characteristics, the amount of time devoted to sleep, and acclimation to each mattress. We evaluated the overall mattress effect and performed pairwise comparisons among mattresses. We applied Tukey’s multiple comparisons adjustment to perform all possible pairwise comparisons among the seven beds for a given outcome variable (actigraph and diary). In other words, we adjusted the pairwise p-values separately for each outcome. We did not adjust for analysis of multiple outcomes. Given that we used mixed models to do the regression on each outcome, alternatives to Tukey’s adjustment (such as the Bonferroni adjustment) would be overly conservative for such a small number of outcomes and greatly increases the risk of suppressing statistically significant results.15,16
Longitudinal data were analyzed simultaneously in a general linear mixed model.17 The PROC MIXED procedure in SAS Version 9.1.3 was used to account for the correlation of mattresses and nights within participants.18 The following covariates were included in each regression model: study period (reflecting the order in which subjects slept on each bed), time (number of nights on a bed), age, gender, BMI, and actigraphic time in bed (time devoted to sleep) on a given night. The mattress effects reported reflect adjustment for these covariates.
“Best” Mattress AnalysisWe carried out two analyses in which we ranked the beds for each participant from best to worst. In one analysis, we ranked the beds according to the average morning pain rating from best (lowest pain = 1) to worst (highest pain = 7). In the other analysis, we ranked the beds according to the average amount of overnight actigraphic motion per hour of sleep from best (least motion = 1) to worst (most motion = 7). We used linear regression to determine the degree to which pain and motion were lower on the “best bed” vs. other beds. We used linear regression to evaluate the relationship between pain and actigraphic motion bed rank on the diary outcomes. For each sleep
* The first three nights on each bed served as an acclimation period, so data for those nights were not included in the analysis. In addition, in 12 out of 896 participant-by-mattress combinations (1.3%), fewer than 5 compliant weeknights were available. We used the available (fewer than 5) compliant weeknights after Day 3. Noting the range of nights any person was observed on a bed (1 to 50) may have affected our observations, so we tested to determine whether this was the case. We found that sleep experience scores stabilized after the third night and there was no significant change in experience owing to number of nights observed after the acclimation.
Choosing a Mattress 5
variable, we evaluated the overall effect of pain and motion bed rank, trend across bed rank, and results of specific pairwise comparisons among bed ranks (best bed vs. second-best bed, best bed vs. average of all others). Covariates were included to control for demographic characteristics, time devoted to sleep, and number of prior days sleeping on each mattress. Pain and motion bed rank effects reflect adjustment for these covariates. Longitudinal data from all compliant nights on all mattresses from each participant were analyzed simultaneously in a general linear mixed model.19 The MIXED procedure was used to account for the correlation of mattresses and nights within participants.18
Results
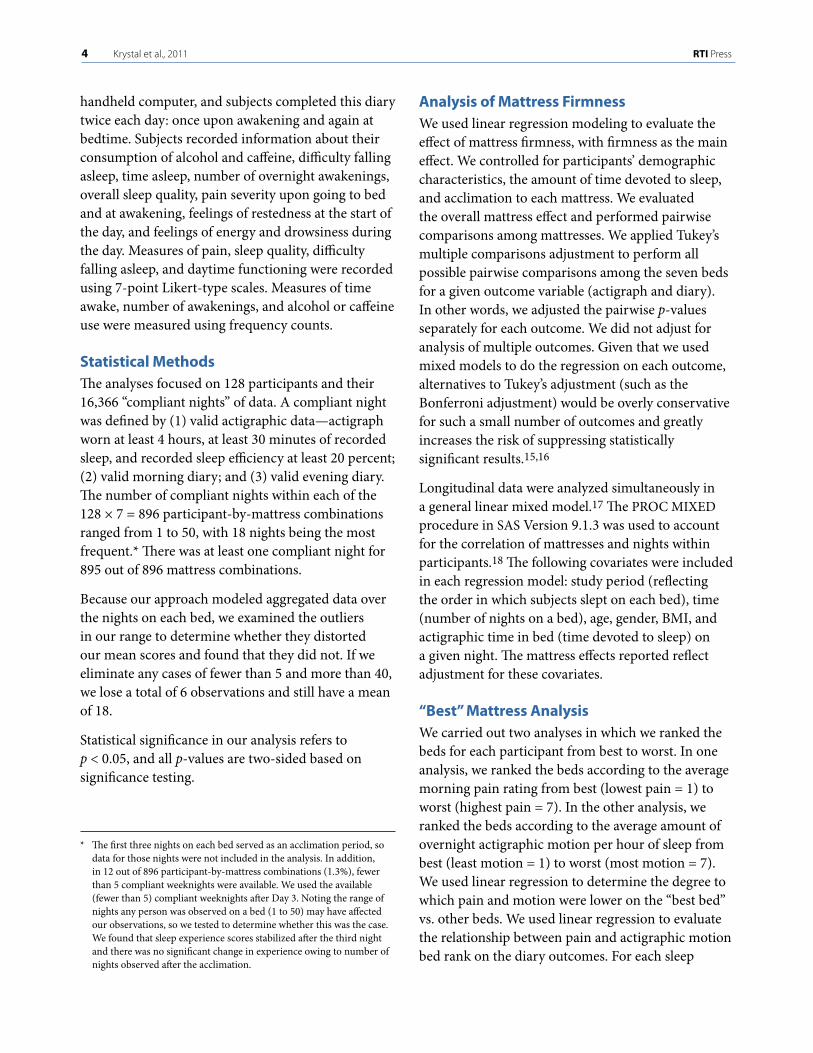
Effect of Mattress Firmness on PainTable 2 presents adjusted means and standard errors for three actigraph outcomes (sleep time, sleep efficiency, and motion) and eight diary outcomes (sleep time, number of awakenings, etc.; see left column of the table) for each level of mattress firmness. Morning pain was greatest on beds with a firmness of 1 or 7 (Beds firmness-1 and firmness-7). Participants reported statistically significantly higher levels of morning pain (average = 1.70) on Bed firmness-7 compared on a pairwise basis with all other beds and on Bed firmness-1 (average = 1.60) compared with a subset of beds in the middle
Table 2. Effects of mattress firmness on sleep
Outcome
Model-Adjusted1 Mean (SE)Overall Mattress
p-value
SignificantPairwise Comparisons*Bed 12 Bed 2 Bed 3 Bed 4 Bed 5 Bed 6 Bed 7
Actigraph
Sleep time (minutes per 8 hours)
355.56 2.96
359.96 2.96
360.32 2.95
359.59 2.95
360.06 2.95
358.62 2.96
357.84 2.97
0.0045 Bed 1 < 2–5
Sleep efficiency (%) 79.38 0.67
80.35 0.67
80.43 0.66
80.26 0.66
80.39 0.66
80.08 0.67
79.91 0.67
0.0081 Bed 1 < 2, 3, 5
Motion (minutes per 8 hours)
62.25 1.64
62.24 1.64
62.72 1.64
62.61 1.64
62.89 1.64
61.66 1.64
61.98 1.64
NS—
Diary
Sleep time (minutes per 8 hours)
433.58 2.33
433.75 2.33
433.66 2.32
434.42 2.32
433.66 2.32
432.05 2.33
433.75 2.34
NS—
Number of awakenings
1.05 0.07
0.97 0.07
0.95 0.07
0.92 0.07
0.93 0.07
0.92 0.07
1.03 0.07
0.0001 Bed 1 > 2–6 Bed 7 > 4, 5, 6
Minutes awake 1.86 0.05
1.80 0.05
1.77 0.05
1.78 0.05
1.76 0.05
1.74 0.05
1.81 0.05
0.0005 Bed 1 > 3–6
Sleep quality 4.85 0.07
5.12 0.07
5.17 0.07
5.150.07
5.160.07
5.130.07
4.88 0.07
0.0001 Bed 1 < 2–6 Bed 7 < 2–6
Well-restedness 4.69 0.07
4.90 0.07
4.94 0.07
4.91 0.07
4.950.07
4.95 0.07
4.73 0.07
0.0001 Bed 1 < 2–6 Bed 7 < 2–6
Morning pain 1.60 0.06
1.51 0.06
1.45 0.06
1.57 0.06
1.53 0.06
1.50 0.06
1.70 0.06
0.0001 Bed 7 > 1–6 Bed 1 > 2, 3, 6 Bed 4 > 3 Bed 5 > 3
Daytime sleepiness 2.92 0.08
2.81 0.08
2.79 0.08
2.78 0.08
2.81 0.08
2.75 0.08
2.83 0.08
0.0001 Bed 1 > 2–6
Daytime energy 4.79 0.08
4.89 0.08
4.86 0.08
4.90 0.08
4.90 0.08
4.91 0.08
4.86 0.08
0.0001 Bed 1 < 2, 4, 5, 6
* p < 0.05 via Tukey adjustment for multiple comparisons.
SE = standard error; NS = not significant (p > 0.05).1 Adjusted for time in bed, age, gender, day on bed, body mass index, and study period. 2 Bed 1 is least firm; Bed 7 is most firm.
6 Krystal et al., 2011 RTI Press
firmness range (see last column of Table 2). In addition, a statistically significant increase in morning pain was detected on Beds firmness-4 and firmness-5 compared with Bed firmness-3. Although these scores indicate that pain was generally minimal for the study population, beds could be distinguished by statistically significant different levels of morning pain Among the covariates studied, greater time in bed devoted to sleep and fewer days on the same bed were associated with greater pain.
Table 3. Covariate effects for sleep outcomes
OutcomeSignificant* Model Covariate(s) Effect p-value1 Slope (SE) Relationship
Actigraph
Sleep time (minutes per 8 hours)
Time in bed 0.0001 0.7492 (0.0048) TIB ↑ Sleep time ↑
Sleep efficiency Time in bed 0.0011 −0.0036 (0.0011) TIB ↑ Sleep efficiency ↓
Motion (minutes per 8 hours)
Time in bed 0.0001 0.0452 (0.0017) TIB ↑ Motion ↑
Gender (F vs. M) 0.0129 −8.14 (3.23) F < M
Study period 0.0001 — —
Diary
Morning pain Time in bed 0.0001 0.0008 (0.0001) TIB ↑ Pain ↑
Day on bed 0.0001 −0.0057 (0.0009) Day ↑ Pain ↓
Sleep time (minutes per 8 hours)
Time in bed 0.0001 0.5870 (0.0050) TIB ↑ Sleep time ↑
BMI 0.0383 −0.8770 (0.4189) BMI ↑ Sleep time ↓
Number of awakenings Time in bed 0.0001 0.0014 (0.0001) TIB ↑ Awakening ↑
BMI 0.0087 −0.0352 (0.0132) BMI ↑ Awakening ↓
Day on bed 0.0001 −0.0049 (0.0009) Day ↑ Awakening ↓
Study period 0.0100 — —
Minutes awake Time in bed 0.0001 0.0014 (0.0001) TIB ↑ Minutes awake ↑
Age 0.0002 0.0164 (0.0043) Age ↑ Minutes awake ↑
BMI 0.0046 −0.0263 (0.0091) BMI ↑ Minutes awake ↓
Study period 0.0031 — —
Sleep quality Time in bed 0.0001 0.0008 (0.0001) TIB ↑ Sleep quality ↑
Age 0.0095 0.0167 (0.0064) Age ↑ Sleep quality ↑
BMI 0.0357 −0.0283 (0.0133) BMI ↑ Sleep quality ↓
Day on bed 0.0081 0.0024 (0.0009) Day ↑ Sleep quality ↑
Study period 0.0001 — —
Well-restedness Time in bed 0.0001 0.0018 (0.0001) TIB ↑ Restedness ↑
Age 0.0032 0.0193 (0.0064) Age ↑ Restedness ↑
Study period 0.0001 — —
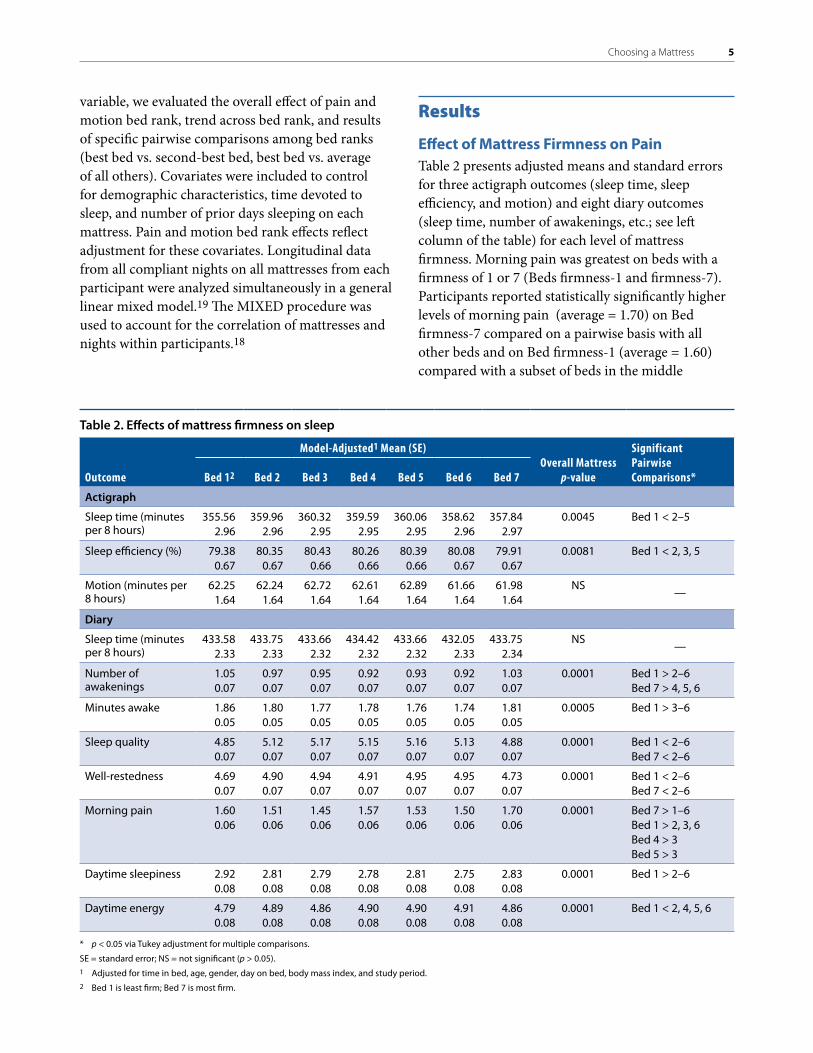
Effect of Mattress Firmness on Actigraphic Measures A statistically significant reduction in both actigraphic sleep time and sleep efficiency (percentage of time asleep during the period devoted to sleep) was detected on Bed firmness-1 compared with a subset of beds in the middle range (see Table 2). Sleep time ranged from an average of 355.6 minutes on Bed firmness-1 to a maximum of 360.3 minutes on beds in the middle range. Sleep efficiency ranged from an average of 79.4 percent on Bed firmness-1 to 80.4 percent on beds in the middle range. Time in bed devoted to sleep was a statistically significant covariate such that greater time in bed was associated with longer sleep time and lower sleep efficiency (see Table 3).
Choosing a Mattress 7
Table 3. Covariate effects for sleep outcomes
OutcomeSignificant* Model Covariate(s) Effect p-value1 Slope (SE) Relationship
Diary (continued)
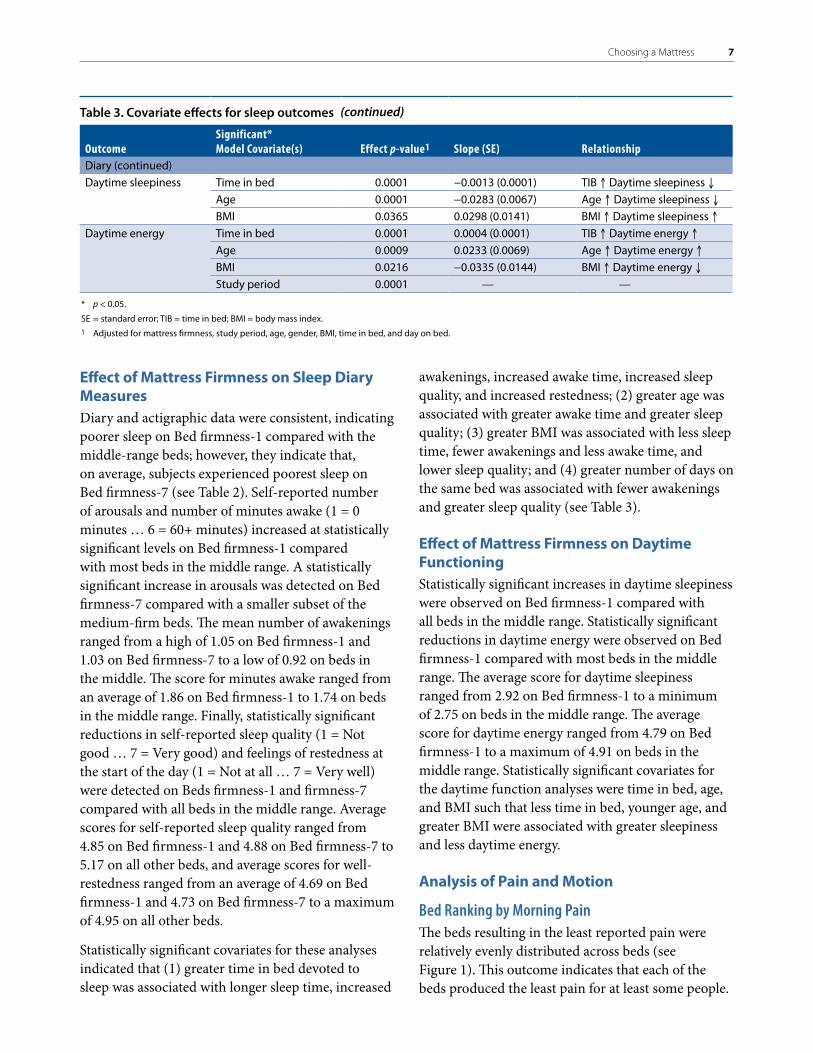
Daytime sleepiness Time in bed 0.0001 −0.0013 (0.0001) TIB ↑ Daytime sleepiness ↓
Age 0.0001 −0.0283 (0.0067) Age ↑ Daytime sleepiness ↓
BMI 0.0365 0.0298 (0.0141) BMI ↑ Daytime sleepiness ↑
Daytime energy Time in bed 0.0001 0.0004 (0.0001) TIB ↑ Daytime energy ↑
Age 0.0009 0.0233 (0.0069) Age ↑ Daytime energy ↑
BMI 0.0216 −0.0335 (0.0144) BMI ↑ Daytime energy ↓
Study period 0.0001 — —
* p < 0.05.
SE = standard error; TIB = time in bed; BMI = body mass index.1 Adjusted for mattress firmness, study period, age, gender, BMI, time in bed, and day on bed.
(continued)
Effect of Mattress Firmness on Sleep Diary MeasuresDiary and actigraphic data were consistent, indicating poorer sleep on Bed firmness-1 compared with the middle-range beds; however, they indicate that, on average, subjects experienced poorest sleep on Bed firmness-7 (see Table 2). Self-reported number of arousals and number of minutes awake (1 = 0 minutes … 6 = 60+ minutes) increased at statistically significant levels on Bed firmness-1 compared with most beds in the middle range. A statistically significant increase in arousals was detected on Bed firmness-7 compared with a smaller subset of the medium-firm beds. The mean number of awakenings ranged from a high of 1.05 on Bed firmness-1 and 1.03 on Bed firmness-7 to a low of 0.92 on beds in the middle. The score for minutes awake ranged from an average of 1.86 on Bed firmness-1 to 1.74 on beds in the middle range. Finally, statistically significant reductions in self-reported sleep quality (1 = Not good … 7 = Very good) and feelings of restedness at the start of the day (1 = Not at all … 7 = Very well) were detected on Beds firmness-1 and firmness-7 compared with all beds in the middle range. Average scores for self-reported sleep quality ranged from 4.85 on Bed firmness-1 and 4.88 on Bed firmness-7 to 5.17 on all other beds, and average scores for well-restedness ranged from an average of 4.69 on Bed firmness-1 and 4.73 on Bed firmness-7 to a maximum of 4.95 on all other beds.
Statistically significant covariates for these analyses indicated that (1) greater time in bed devoted to sleep was associated with longer sleep time, increased
awakenings, increased awake time, increased sleep quality, and increased restedness; (2) greater age was associated with greater awake time and greater sleep quality; (3) greater BMI was associated with less sleep time, fewer awakenings and less awake time, and lower sleep quality; and (4) greater number of days on the same bed was associated with fewer awakenings and greater sleep quality (see Table 3).
Effect of Mattress Firmness on Daytime FunctioningStatistically significant increases in daytime sleepiness were observed on Bed firmness-1 compared with all beds in the middle range. Statistically significant reductions in daytime energy were observed on Bed firmness-1 compared with most beds in the middle range. The average score for daytime sleepiness ranged from 2.92 on Bed firmness-1 to a minimum of 2.75 on beds in the middle range. The average score for daytime energy ranged from 4.79 on Bed firmness-1 to a maximum of 4.91 on beds in the middle range. Statistically significant covariates for the daytime function analyses were time in bed, age, and BMI such that less time in bed, younger age, and greater BMI were associated with greater sleepiness and less daytime energy.
Analysis of Pain and Motion
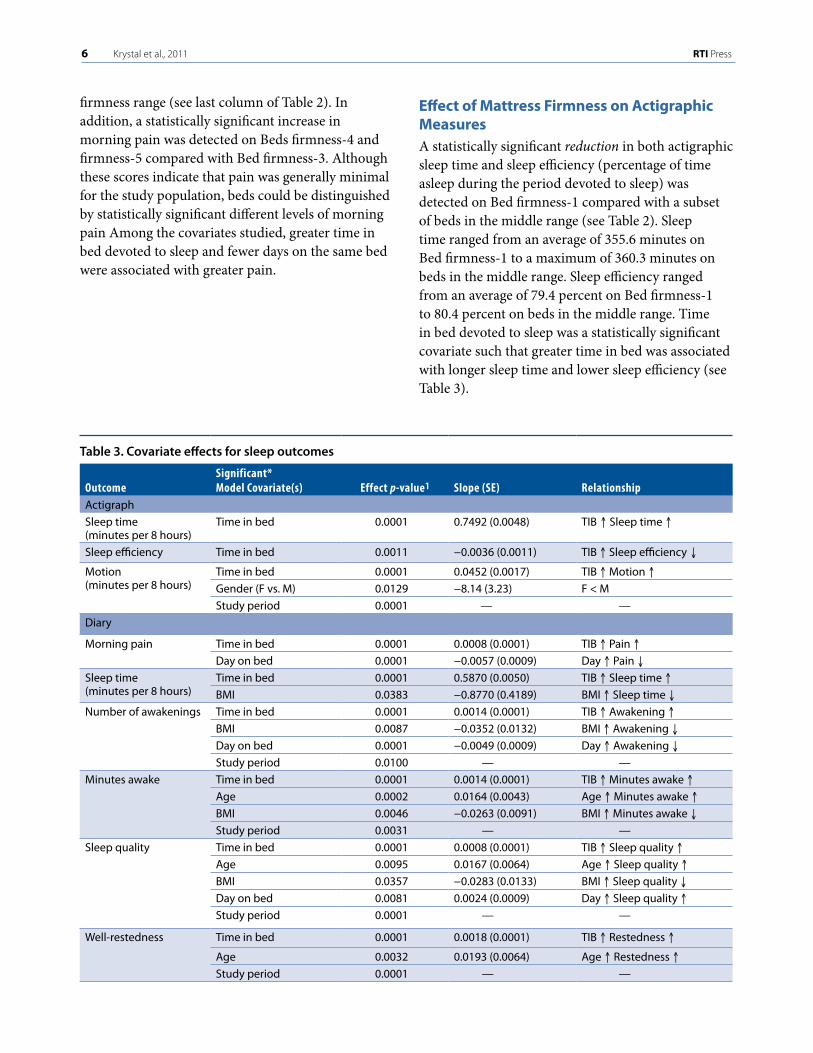
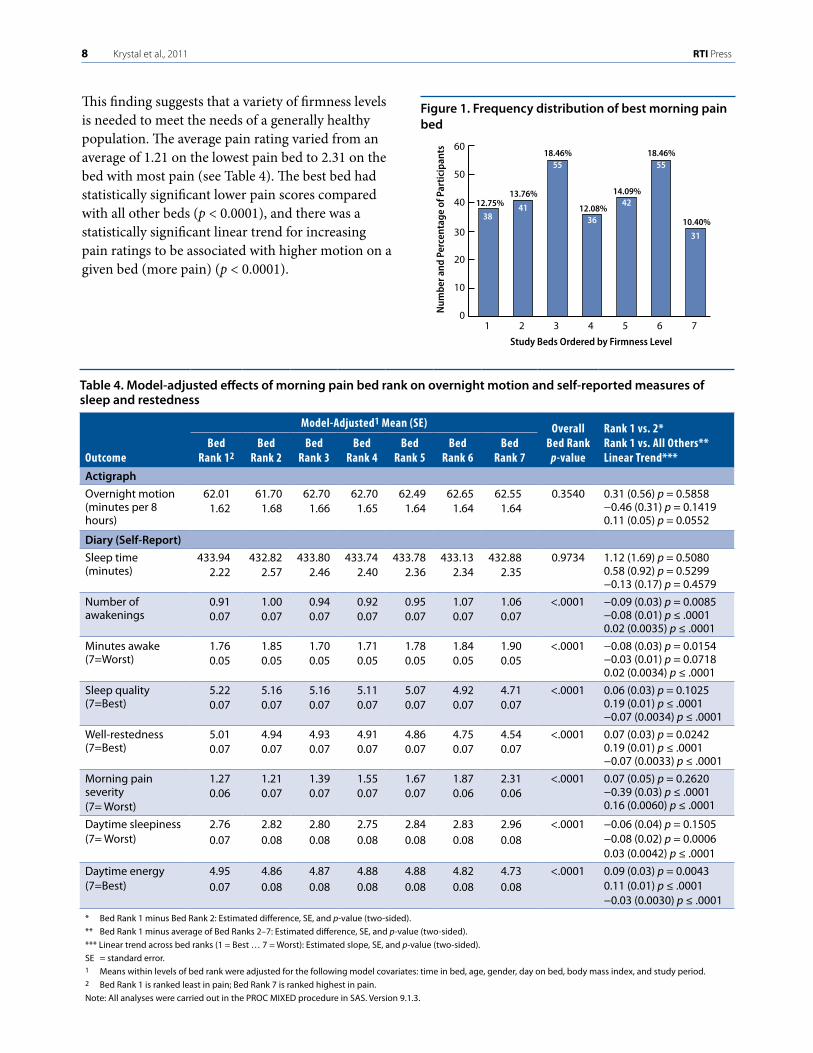
Bed Ranking by Morning Pain The beds resulting in the least reported pain were relatively evenly distributed across beds (see Figure 1). This outcome indicates that each of the beds produced the least pain for at least some people.
8 Krystal et al., 2011 RTI Press
This finding suggests that a variety of firmness levels is needed to meet the needs of a generally healthy population. The average pain rating varied from an average of 1.21 on the lowest pain bed to 2.31 on the bed with most pain (see Table 4). The best bed had statistically significant lower pain scores compared with all other beds (p < 0.0001), and there was a statistically significant linear trend for increasing pain ratings to be associated with higher motion on a given bed (more pain) (p < 0.0001).
Table 4. Model-adjusted effects of morning pain bed rank on overnight motion and self-reported measures of sleep and restedness
Outcome
Model-Adjusted1 Mean (SE) Overall Bed Rank p-value
Rank 1 vs. 2*Rank 1 vs. All Others**Linear Trend***
Bed Rank 12
Bed Rank 2
Bed Rank 3
Bed Rank 4
Bed Rank 5
Bed Rank 6
Bed Rank 7
Actigraph
Overnight motion (minutes per 8 hours)
62.01 1.62
61.70 1.68
62.70 1.66
62.70 1.65
62.49 1.64
62.65 1.64
62.55 1.64
0.3540 0.31 (0.56) p = 0.5858 −0.46 (0.31) p = 0.1419 0.11 (0.05) p = 0.0552
Diary (Self-Report)
Sleep time (minutes)
433.94 2.22
432.82 2.57
433.80 2.46
433.74 2.40
433.78 2.36
433.13 2.34
432.882.35
0.9734 1.12 (1.69) p = 0.5080 0.58 (0.92) p = 0.5299 −0.13 (0.17) p = 0.4579
Number of awakenings
0.91 0.07
1.00 0.07
0.94 0.07
0.92 0.07
0.95 0.07
1.07 0.07
1.06 0.07
<.0001 −0.09 (0.03) p = 0.0085 −0.08 (0.01) p ≤ .0001 0.02 (0.0035) p ≤ .0001
Minutes awake (7=Worst)
1.76 0.05
1.85 0.05
1.70 0.05
1.710.05
1.78 0.05
1.84 0.05
1.90 0.05
<.0001 −0.08 (0.03) p = 0.0154 −0.03 (0.01) p = 0.0718 0.02 (0.0034) p ≤ .0001
Sleep quality (7=Best)
5.22 0.07
5.16 0.07
5.16 0.07
5.11 0.07
5.07 0.07
4.92 0.07
4.71 0.07
<.0001 0.06 (0.03) p = 0.1025 0.19 (0.01) p ≤ .0001 −0.07 (0.0034) p ≤ .0001
Well-restedness (7=Best)
5.01 0.07
4.94 0.07
4.93 0.07
4.91 0.07
4.86 0.07
4.75 0.07
4.54 0.07
<.0001 0.07 (0.03) p = 0.0242 0.19 (0.01) p ≤ .0001 −0.07 (0.0033) p ≤ .0001
Morning pain severity(7= Worst)
1.27 0.06
1.21 0.07
1.39 0.07
1.55 0.07
1.67 0.07
1.87 0.06
2.31 0.06
<.0001 0.07 (0.05) p = 0.2620 −0.39 (0.03) p ≤ .0001 0.16 (0.0060) p ≤ .0001
Daytime sleepiness (7= Worst)
2.76 0.07
2.82 0.08
2.80 0.08
2.75 0.08
2.84 0.08
2.83 0.08
2.96 0.08
<.0001 −0.06 (0.04) p = 0.1505 −0.08 (0.02) p = 0.0006 0.03 (0.0042) p ≤ .0001
Daytime energy (7=Best)
4.95 0.07
4.86 0.08
4.87 0.08
4.88 0.08
4.88 0.08
4.82 0.08
4.73 0.08
<.0001 0.09 (0.03) p = 0.0043 0.11 (0.01) p ≤ .0001 −0.03 (0.0030) p ≤ .0001
* Bed Rank 1 minus Bed Rank 2: Estimated difference, SE, and p-value (two-sided).
** Bed Rank 1 minus average of Bed Ranks 2–7: Estimated difference, SE, and p-value (two-sided).
*** Linear trend across bed ranks (1 = Best … 7 = Worst): Estimated slope, SE, and p-value (two-sided).
SE = standard error.1 Means within levels of bed rank were adjusted for the following model covariates: time in bed, age, gender, day on bed, body mass index, and study period. 2 Bed Rank 1 is ranked least in pain; Bed Rank 7 is ranked highest in pain.
Note: All analyses were carried out in the PROC MIXED procedure in SAS. Version 9.1.3.
3841
55
36
42
55
31
12.75%13.76%
18.46%
12.08%
14.09%
18.46%
10.40%
0
10
20
30
40
50
60
7654321
Study Beds Ordered by Firmness Level
Num
ber a
nd P
erce
ntag
e of
Par
tici
pant
s
Figure 1. Frequency distribution of best morning pain bed
Choosing a Mattress 9
Relationship Between Pain Rank and Actigraphic Motion The average actigraphic motion during the night did not produce statistically significant differences for the bed associated with the least pain compared with all other beds or the second-best bed. We found no statistically significant linear trend for actigraphic motion minutes to increase with reported pain levels.
Pain and Diary Sleep Measures The beds associated with the least pain were associated with statistically significant improvements in sleep and daytime function in six out of eight diary variables (see Table 4).
Self-reported sleep time was not associated with statistically significant differences on the bed with least pain compared with the bed with the next lowest pain score or the average of all other beds. We did not detect a linear trend relating pain experienced on a mattress with self-reported sleep time on a given mattress.
Self-reported overnight awakenings was associated with statistically significant lower scores on the bed with reduced pain when compared with the second lowest-pain bed (p < 0.0085) and to the average of all other beds (p < 0.0001). In addition, the number of self-reported awakenings yielded statistically significant increases in reported pain (p < 0.0001).
Self-reported awake time (1 = 0 min … 6 = 60+ min) was associated with statistically significant lower values on the bed with the lowest pain compared with the next-best bed (p < 0.0154) but not compared with the average of all other beds. In addition, awake time increased linearly and at statistically significant levels with pain reported on a given mattress (p < 0.0001).
Sleep quality scores (1 = Not good … 7 = Very good) were greater on the best bed compared with the average of all other beds (p < 0.0001). In addition, statistically significant linear decreases in sleep quality were associated with increasing motion (p < 0.0001). Average scores for sleep quality ranged from 5.22 on the best bed to 4.71 on the worst bed.
Restedness at the start of the day (1 = Not at all … 7 = Very well) was statistically significantly greater on the best bed ranked by morning pain compared with
Num
ber a
nd P
erce
ntag
e of
Par
tici
pant
s
18
2019
15
2120
11.7%
14.1%15.6% 14.8%
11.7%
16.4%15.6%
0
5
10
15
20
25
30
7654321Study Beds Ordered by Firmness Level
15
Figure 2. Best beds by actigraphic motion
the second-best bed (p < 0.0242) and the average of all other beds (p < 0.0001), and restedness decreased linearly and at statistically significant levels with increasing bed rank (p < 0.0001). Average scores for restedness ranged from 5.01 to 4.54 on the worst pain bed.
Relationship Between Pain and Daytime FunctionDaytime sleepiness (1 = Not at all … 7 = Very) was reduced at statistically significant levels on the bed associated with the least pain compared with the other beds (p < 0.0006). We found a statistically significant linear trend for daytime sleepiness ratings to increase with increasing pain reported on a mattress (worse pain) (p < 0.0001).
Daytime energy (1 = Not at all … 7 = Very) was reduced at statistically significant levels on the best bed for morning pain compared with the second-best pain bed (p < 0.0043) and compared with all other beds (p < 0.0001). We found a statistically significant linear trend for daytime energy ratings to decrease with increasing pain bed rank (worse pain) (p < 0.0001).
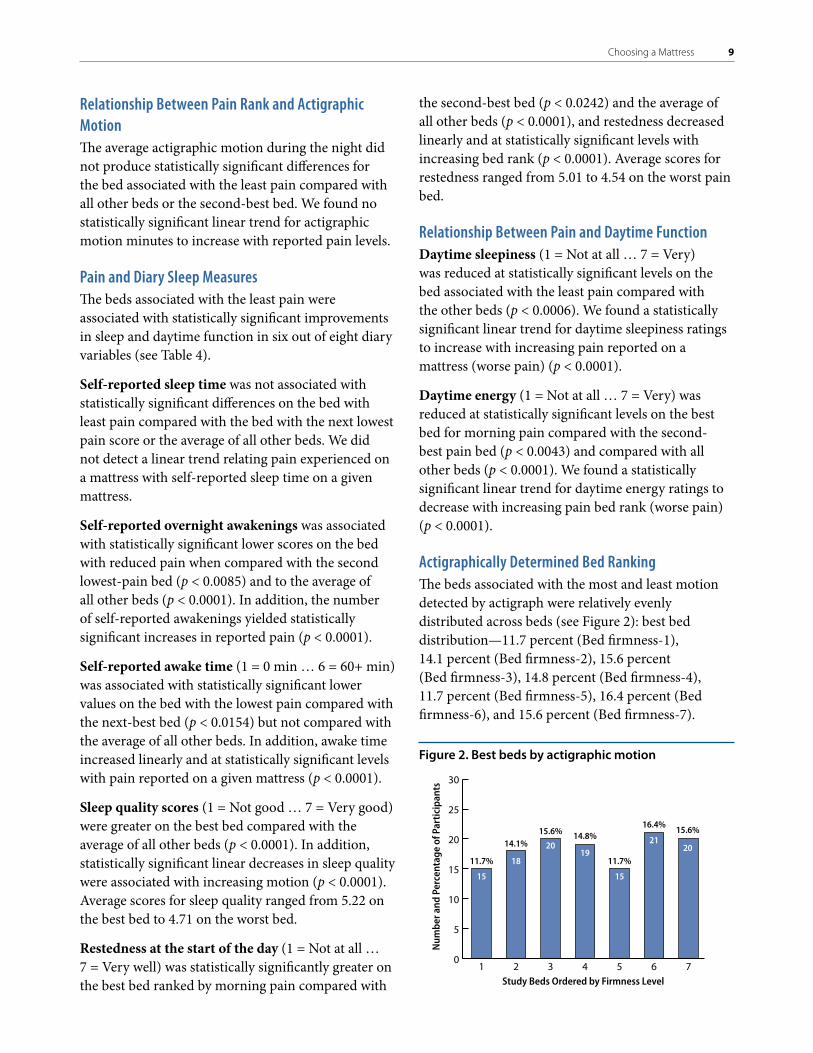
Actigraphically Determined Bed RankingThe beds associated with the most and least motion detected by actigraph were relatively evenly distributed across beds (see Figure 2): best bed distribution—11.7 percent (Bed firmness-1), 14.1 percent (Bed firmness-2), 15.6 percent (Bed firmness-3), 14.8 percent (Bed firmness-4), 11.7 percent (Bed firmness-5), 16.4 percent (Bed firmness-6), and 15.6 percent (Bed firmness-7).
10 Krystal et al., 2011 RTI Press
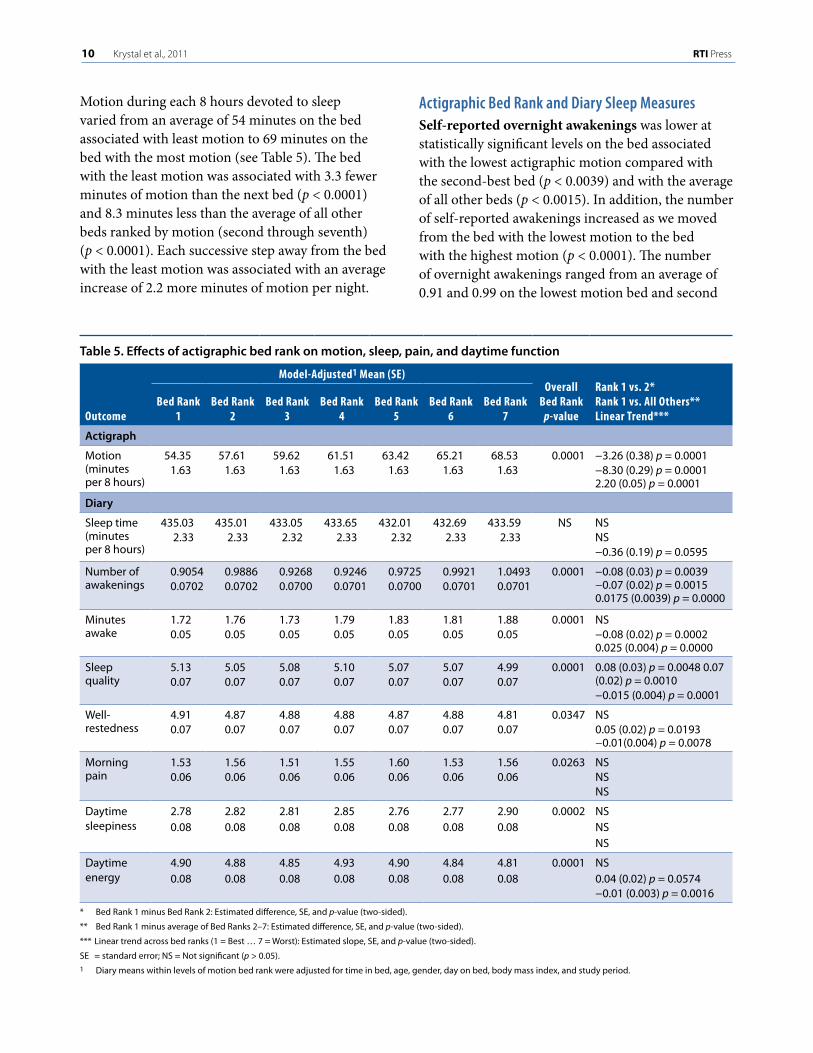
Motion during each 8 hours devoted to sleep varied from an average of 54 minutes on the bed associated with least motion to 69 minutes on the bed with the most motion (see Table 5). The bed with the least motion was associated with 3.3 fewer minutes of motion than the next bed (p < 0.0001) and 8.3 minutes less than the average of all other beds ranked by motion (second through seventh) (p < 0.0001). Each successive step away from the bed with the least motion was associated with an average increase of 2.2 more minutes of motion per night.
Actigraphic Bed Rank and Diary Sleep Measures Self-reported overnight awakenings was lower at statistically significant levels on the bed associated with the lowest actigraphic motion compared with the second-best bed (p < 0.0039) and with the average of all other beds (p < 0.0015). In addition, the number of self-reported awakenings increased as we moved from the bed with the lowest motion to the bed with the highest motion (p < 0.0001). The number of overnight awakenings ranged from an average of 0.91 and 0.99 on the lowest motion bed and second
Table 5. Effects of actigraphic bed rank on motion, sleep, pain, and daytime function
Outcome
Model-Adjusted1 Mean (SE)Overall
Bed Rank p-value
Rank 1 vs. 2* Rank 1 vs. All Others** Linear Trend***
Bed Rank 1
Bed Rank 2
Bed Rank 3
Bed Rank 4
Bed Rank 5
Bed Rank 6
Bed Rank 7
Actigraph
Motion (minutes per 8 hours)
54.351.63
57.611.63
59.621.63
61.511.63
63.421.63
65.21 1.63
68.53 1.63
0.0001 −3.26 (0.38) p = 0.0001 −8.30 (0.29) p = 0.0001 2.20 (0.05) p = 0.0001
Diary
Sleep time (minutes per 8 hours)
435.032.33
435.012.33
433.052.32
433.652.33
432.012.32
432.692.33
433.59 2.33
NS NS NS −0.36 (0.19) p = 0.0595
Number of awakenings
0.9054 0.0702
0.9886 0.0702
0.9268 0.0700
0.9246 0.0701
0.9725 0.0700
0.9921 0.0701
1.0493 0.0701
0.0001 −0.08 (0.03) p = 0.0039 −0.07 (0.02) p = 0.0015 0.0175 (0.0039) p = 0.0000
Minutes awake
1.72 0.05
1.76 0.05
1.73 0.05
1.79 0.05
1.83 0.05
1.81 0.05
1.88 0.05
0.0001 NS −0.08 (0.02) p = 0.0002 0.025 (0.004) p = 0.0000
Sleep quality
5.13 0.07
5.05 0.07
5.08 0.07
5.10 0.07
5.07 0.07
5.07 0.07
4.99 0.07
0.0001 0.08 (0.03) p = 0.0048 0.07 (0.02) p = 0.0010 −0.015 (0.004) p = 0.0001
Well-restedness
4.91 0.07
4.87 0.07
4.88 0.07
4.880.07
4.87 0.07
4.88 0.07
4.81 0.07
0.0347 NS 0.05 (0.02) p = 0.0193 −0.01(0.004) p = 0.0078
Morning pain
1.53 0.06
1.56 0.06
1.51 0.06
1.550.06
1.60 0.06
1.53 0.06
1.56 0.06
0.0263 NS NS NS
Daytime sleepiness
2.78 0.08
2.82 0.08
2.81 0.08
2.85 0.08
2.76 0.08
2.77 0.08
2.90 0.08
0.0002 NS NS NS
Daytime energy
4.90 0.08
4.88 0.08
4.85 0.08
4.93 0.08
4.90 0.08
4.84 0.08
4.810.08
0.0001 NS 0.04 (0.02) p = 0.0574 −0.01 (0.003) p = 0.0016
* Bed Rank 1 minus Bed Rank 2: Estimated difference, SE, and p-value (two-sided).
** Bed Rank 1 minus average of Bed Ranks 2–7: Estimated difference, SE, and p-value (two-sided).
*** Linear trend across bed ranks (1 = Best … 7 = Worst): Estimated slope, SE, and p-value (two-sided).
SE = standard error; NS = Not significant (p > 0.05).1 Diary means within levels of motion bed rank were adjusted for time in bed, age, gender, day on bed, body mass index, and study period.
Choosing a Mattress 11
lowest-motion bed, respectively, to 1.05 on the highest-motion bed (see Table 3).
Self-reported awake time (1 = 0 min … 6 = 60+ min) was lower, by statistically significant levels, on the bed with the overall lowest motion compared with the average of all other beds when ordered by motion (p < 0.0002). Awake time increased linearly at statisti-cally significant levels, as we moved away from the bed with the lowest motion. The average number of minutes of awake time ranged from 1.72 on the best bed and 1.76 on the second-best bed to 1.88 on the worst bed.
Sleep quality (1 = Not good … 7 = Very good) was greater, at statistically significant levels, on the bed associated with the lowest motion compared with the bed with the second lowest motion (p < 0.0048) and to the average of all other beds (p < 0.0010). In addition, sleep quality decreased linearly with increasing motion (p < 0.0001). Average sleep quality ranged from 5.13 on the bed with the lowest motion and 5.05 on the bed with the next lowest motion to 4.99 on the bed associated with the greatest motion.
Restedness at the start of the day (1 = Not at all … 7 = Very well) was greater, at statistically significant levels, on the bed with the lowest motion compared with the average of all other beds (p < 0.0193), and restedness decreased linearly on the beds associated with more motion (p = 0.0078). Average scores for restedness ranged from 4.91 and 4.87 on the least-motion and second-best beds to 4.81 on the bed with the greatest motion (see Table 5).
Relationship Between Bed Rank and Morning PainMorning pain (1 = None … 7 = Worst) was not lower, at levels of statistical significance, on the bed with the lowest motion compared with the other beds. The average score for morning pain ranged from 1.53 and 1.56 on the best and second-best beds to 1.60 on the bed with the most pain.
Effect of Motion on Daytime FunctioningDaytime sleepiness (1 = Not at all … 7 = Very) was not reduced, at statistically significant levels, on the best bed compared with the other beds (see Table 5). The average score for daytime sleepiness ranged
from 2.78 and 2.82 on the best and second-best beds, respectively, to 2.90 on the worst bed.
Daytime energy (1 = Not at all … 7 = Very) increased with beds with lower motion (p < 0.0016). The average score for daytime energy ranged from 4.90 and 4.88 on the best and second-best beds to 4.81 on the worst bed.
DiscussionWith a large sample of healthy sleepers, a wide range of mattresses of varying firmness much larger than most studies, and two means of measuring the sleep experience, we provide rigorous evidence that mattress firmness affects pain, sleep, and daytime experience. The findings are consistent across pain ratings, actigraphic and self-reported sleep variables, and self-assessments of daytime function. The least firm mattress was consistently associated with greater pain, poorer sleep, and diminished daytime function compared with most of the other mattresses. However, the mattress with the greatest firmness was associated with greater pain and worse self-reported sleep than most of the other mattresses, but it did not differ from the other mattresses on actigraphic sleep indices or reported daytime sleepiness or energy level. Little difference was observed among mattresses with medium firmness.
Based on this analysis alone, one might conclude that although mattress firmness affects pain and sleep, a range of mattresses may be associated with similar trends of pain and sleep quality in normal sleepers, whereas the softest and firmest of mattresses are, on average, not optimal for the majority of the sample. However, it is important to note that this finding derives from average results in the total study sample. The analyses in which the beds were ranked on the basis of pain and actigraphic motion do not indicate that Beds firmness-2 through firmness-6 were indistinguishable or that the softest and firmest beds were unsuitable. In fact, the analysis of beds ranked by motion was notable in indicating that the “best” and “worst” mattresses were distributed evenly among all of the mattresses, including Beds firmness-1 and firmness-7 with the exception that Beds firmness-1 and firmness-7 were more likely to be the “worst”
12 Krystal et al., 2011 RTI Press
bed in terms of pain than the other mattresses. The “best” mattress for motion not only optimized pain and actigraphic indices of sleep but also was “best” in terms of several self-reported measures of sleep and daytime energy.
Taken together, the mattress firmness and motion analyses suggest that normal sleepers vary widely in the mattress firmness that optimizes their pain and sleep, but, on average, the softest mattresses and firmest mattress are associated with worsened levels of pain and sleep quality.
An exception to the lack of difference among Beds firmness-2 through firmness-6 occurred with the reported level of pain. Bed firmness-4 and firmness-5 were associated with greater pain than Bed firmness-3. This finding suggests that among normal sleepers without reported chronic pain problems, pain may be more sensitive to differences in mattress firmness than sleep or daytime sleepiness and energy. Our findings also suggest that mattresses may affect pain independently of sleep. One implication of this idea is that researchers cannot assume that effects of mattress firmness on sleep were necessarily present in prior studies1,2 that noted an effect of mattress type on pain. Another implication is that including both pain and sleep-specific assessments will be important in future work so that the covariation in these two phenomena can be better understood.
A critical consideration when drawing conclusions from this study is the size of the differences in sleep observed as a function of mattress firmness. As Table 2 shows, differences in sleep time occurring among the mattresses in this study were approximately 5 minutes, and sleep efficiency differences were approximately 1 percent. Although these differences were statistically significant, it could be questioned whether they are clinically significant. Our analysis suggests that although the differences are small, they are important. The differences were consistent across multiple measures and across domains, including both self-report and actigraphic variables, as well as indices of pain and reported daytime function. Another consideration is the fact that actigraphy may be a relatively insensitive measure for detecting differences among mattresses
and/or which mattress optimizes sleep. However, the fact that the best mattress determined by actigraphy was also better, at conventional levels of statistical significance, than the other mattresses on several self-reported measures of sleep and daytime energy provides some validation for using actigraphy as a means of identifying the best mattress for an individual. Probably the most important factor related to the relatively small numerical differences in sleep measures among the mattresses in this study is that we included only pain-free, normal sleepers in our study.
The fact that our subjects were normal sleepers seems likely to have limited the potential size of mattress effects. In a sense, the study was not capable of demonstrating that an optimal mattress could improve pain and sleep so much as it could demonstrate that suboptimal mattresses can increase pain and disrupt the sleep of those who are without pain and characteristically sleep quite well. This would explain why the overall group analysis of mattress firmness identified effects only related to the extreme mattresses. The fact that statistically significant effects were found in this study of normal sleepers, however small, opens the door to future research on mattress firmness and sets the stage for studies involving sleepers with pain and/or sleep complaints. For such populations, we hypothesize that an optimally suited mattress might improve pain, sleep, and function, and we anticipate that effect sizes are likely to be substantially larger. In addition to studying populations with sleep and/or pain complaints, it will also be important for future mattress firmness research to employ polysomnography and actigraphy to determine the extent to which the use of actigraphy may have been a limitation in our study.
The fact that we relied on the mattresses of a single manufacturer may be criticized as a limiting factor. The objective was to control for the extent to which materials such as fabrics and cushioning, manufacturing processes, stitching, or the like might affect sleep. It remains to be seen whether variances in bedding materials and manufacturing processes might affect sleep quality. The beds we used were tested to ensure they were within a range of firmness
Choosing a Mattress 13
in the commercial marketplace. The extent to which one may observe the change in sleep based on a different increment of firmness may be a fruitful area of future exploration. Such information would inform manufacturers about optimal incremental changes in firmness.
In summary, this study indicates that mattress matters in terms of pain, sleep, and reported daytime function. This research is novel not only in terms of the findings of statistically significant differences across mattresses in objective and subjective sleep measures, but also for demonstrating effects on measures of pain and reported daytime function. It is the first study to carry out an analysis of the degree of “fit” of mattress firmness. Our analysis showed that individuals vary substantially in the degree of mattress firmness/support that optimizes their sleep and reduces their pain. Furthermore, this study is by far the largest that has been conducted on the effects of mattress firmness on pain and sleep, and it is
1. Jacobson BH, Gemmell HA, Hayes BM, Altena TS. Effectiveness of a selected bedding system on quality of sleep, low back pain, shoulder pain and spine stiffness. J Manipulative Physiol Ther. 2002;2:88-92.
2. Kovacs FM, Abraira V, Peña A, Martín-Rodríguez JG, Sánchez-Vera M, Ferrer E, et al. Effect of firmness of mattress on chronic non-specific low-back pain: randomized, double-blind, controlled, multi-centre trial. Lancet. 2003;362:1599-604.
3. Suckling EE, Koenig EH, Hoffman BF, Brooks CM. The physiological effects of sleeping on hard or soft beds. Hum Biol. 1957;274-88.
4. Bader GG, Engdal S. The influence of bed firmness on sleep quality. Appl Ergon. 2000;31:487-97.
5. Alapin I, Fichten CS, Libman E, Creti L, Bailes S, Wright J. How is good and poor sleep in older adults and college students related to daytime sleepiness, fatigue and ability to concentrate? J Psychosom Res. 2000;49:381-90.
notable because all subjects slept for a series of nights on each of seven mattresses.
These findings have several implications for medical practice. First, it must be considered whether sleep lab mattress firmness must be taken into account when carrying out polysomnography for clinical or research purposes. Furthermore, when a substantive difference in firmness exists between a subject’s home mattress and the laboratory mattress, the sleep assessed in the laboratory may deviate significantly from what occurs at home. Furthermore, for individuals with sleep complaints, prescribing a change in mattress firmness could become a therapeutic intervention. Finally, a poorly fitted mattress may cause pain and/or impose sleep disruptions on an otherwise healthy individual. Additional work is needed to determine the merit of such considerations. Although little research has been carried out in this area, our study opens the door to more systematic research on the effects of mattress firmness on pain, sleep, and daytime function.
References
6. Elmenhorst ME, Elmenhorst D, Luks N, Maass H, Vejvoda M, Samel A. Partial sleep deprivation: impact on the architecture and quality of sleep. Sleep Med. 2008;9:840-50.
7. Hamilton NA, Gallagher MW, Preacher KJ, Stevens N, Nelson CA, Karlson C, et al. Insomnia and well-being. J Consult Clin Psychol. 2007;75:939-46.
8. Hänel SE, Dartman T, Shishoo R. Measuring methods for comfort rating of seats and beds. Int J Ind Ergon. 1996;20:163-72.
9. National Institutes of Health, National Institute of Neurological Disorders and Stroke. Brain basics: understanding sleep. Bethesda, MD: National Institutes of Health; 2003.
10. Roberts RE, Roberts, CR, Duong HT. Chronic insomnia and its negative consequences for health and functioning of adolescents: a 12-month prospective study. J Adolesc Health. 2008;42:294-302.
14 Krystal et al., 2011 RTI Press
11. Morgenthaler T, Alessi C, Friedman L, Owens J, Kapur V, Boehlecke B, et al. Practice parameters for the use of actigraphy in the assessment of sleep and sleep disorders: an update for 2007. Sleep. 2007;30:519-29.
12. Ancoli-Israel S, Cole R, Alessi C, Chambers M, Moorcroft W, Pollak, CP. The role of actigraphy in the study of sleep and circadian rhythms. Sleep. 2003;3:342-92.
13. Littner M, Kushida CA, Anderson WM, Bailey D, Berry RB, Davila DG, et al. Practice parameters for the role of actigraphy in the study of sleep and circadian rhythms: an update for 2002. Sleep. 2003;26(3),337-341.
14. Germain A, Buysse DJ, Kupfer DJ. Preliminary validation of a new device for studying sleep. Sleep. 2006;29:A1028.
15. Cohen J. Things I have learned (so far). Am Psychol. 1990;45:1304-12.
16. Perneger TV. What’s wrong with Bonferroni adjustments? Brit Med J. 1998;316:1236-8.
17. Lindsay J. Models for repeated measurements. Oxford: Oxford University Press; 1993.
18. Diggle PJ, Liang KY, Zeger SL. Analysis of longitudinal data. Oxford: Oxford University Press; 1994.
19. Laird NM, Ware JH. Random effects models for longitudinal data. Biometrics. 1982;38:963-74.

AcknowledgmentsThe authors acknowledge that this research was sponsored by Sleep to Live, a Kingsdown Inc. company.
RTI International is an independent, nonprofit research organization dedicated to improving the human condition by turning knowledge into practice. RTI offers innovative research and technical solutions to governments and businesses worldwide in the areas of health and pharmaceuticals, education and training, surveys and statistics, advanced technology, international development, economic and social policy, energy and the environment, and laboratory and chemistry services.
The RTI Press complements traditional publication outlets by providing another way for RTI researchers to disseminate the knowledge they generate. This PDF document is offered as a public service of RTI International. More information about RTI Press can be found at www.rti.org/rtipress.
www.rti.org/rtipress RTI Press publication RR-0015-1102
Related Documents