This article appeared in a journal published by Elsevier. The attached copy is furnished to the author for internal non-commercial research and education use, including for instruction at the authors institution and sharing with colleagues. Other uses, including reproduction and distribution, or selling or licensing copies, or posting to personal, institutional or third party websites are prohibited. In most cases authors are permitted to post their version of the article (e.g. in Word or Tex form) to their personal website or institutional repository. Authors requiring further information regarding Elsevier’s archiving and manuscript policies are encouraged to visit: http://www.elsevier.com/copyright

Welcome message from author
This document is posted to help you gain knowledge. Please leave a comment to let me know what you think about it! Share it to your friends and learn new things together.
Transcript

This article appeared in a journal published by Elsevier. The attachedcopy is furnished to the author for internal non-commercial researchand education use, including for instruction at the authors institution
and sharing with colleagues.
Other uses, including reproduction and distribution, or selling orlicensing copies, or posting to personal, institutional or third party
websites are prohibited.
In most cases authors are permitted to post their version of thearticle (e.g. in Word or Tex form) to their personal website orinstitutional repository. Authors requiring further information
regarding Elsevier’s archiving and manuscript policies areencouraged to visit:
http://www.elsevier.com/copyright
Author's personal copy
Mutation Research 703 (2010) 200–208
Contents lists available at ScienceDirect
Mutation Research/Genetic Toxicology andEnvironmental Mutagenesis
journa l homepage: www.e lsev ier .com/ locate /gentoxCommuni ty address : www.e lsev ier .com/ locate /mutres
Chlorination treatment of aqueous samples reduces, but does not eliminate,the mutagenic effect of the azo dyes Disperse Red 1, Disperse Red 13 andDisperse Orange 1
G.A.R. Oliveiraa,∗,1, E.R.A. Ferraza,1, F.M.D. Chequera, M.D. Grandoa, J.P.F. Angelib, M.S. Tsuboyb,J.C. Marcarinib, M.S. Mantovanib, M.E. Osugic, T.M. Lizierc, M.V.B. Zanonic, D.P. Oliveiraa
a USP, Departamento de Análises Clínicas, Toxicológicas e Bromatológicas, Faculdade de Ciências Farmacêuticas de Ribeirão Preto,Universidade de São Paulo, Av. do Café, s/n, 14040-903, Ribeirão Preto, SP, Brazilb UEL, Departamento de Biologia Geral, Centro de Ciências Biológicas, Universidade Estadual de Londrina, Campus Universitário, Londrina, 86061-990, PR, Brazilc UNESP, Universidade Estadual Paulista Júlio de Mesquita Filho, Instituto de Química de Araraquara,Departamento de Química Analítica, Rua Francisco Degni, s/n, Bairro Quitandinha, 14800-900, Araraquara, SP, Brazil
a r t i c l e i n f o
Article history:Received 14 June 2010Received in revised form 27 August 2010Accepted 1 September 2010Available online 20 September 2010
Keywords:Azo dyeChlorinationComet assayMicronucleus assaySalmonella assay
a b s t r a c t
The treatment of textile effluents by the conventional method based on activated sludge followed by achlorination step is not usually an effective method to remove azo dyes, and can generate products moremutagenic than the untreated dyes. The present work evaluated the efficiency of conventional chlori-nation to remove the genotoxicity/mutagenicity of the azo dyes Disperse Red 1, Disperse Orange 1, andDisperse Red 13 from aqueous solutions. The comet and micronucleus assays with HepG2 cells and theSalmonella mutagenicity assay were used. The degradation of the dye molecules after the same treat-ment was also evaluated, using ultraviolet and visible absorption spectrum measurements (UV–vis), highperformance liquid chromatography coupled to a diode-array detector (HPLC-DAD), and total organic car-bon removal (TOC) analysis. The comet assay showed that the three dyes studied induced damage in theDNA of the HepG2 cells in a dose-dependent manner. After chlorination, these dyes remained genotoxic,although with a lower damage index (DI). The micronucleus test showed that the mutagenic activity of thedyes investigated was completely removed by chlorination, under the conditions tested. The Salmonellaassay showed that chlorination reduced the mutagenicity of all three dyes in strain YG1041, but increasedthe mutagenicity of Disperse Red 1 and Disperse Orange 1 in strain TA98. With respect to chemical anal-ysis, all the solutions showed rapid discoloration and a reduction in the absorbance bands characteristicof the chromophore group of each dye. However, the TOC was not completely removed, showing thatchlorination of these dyes is not efficient in mineralizing them. It was concluded that conventional chlo-rination should be used with caution for the treatment of aqueous samples contaminated with azo dyes.
© 2010 Elsevier B.V. All rights reserved.
1. Introduction
Dyes and pigments are used the world over for coloring or tointensify the color of many products, such as textiles, paper, rub-ber, food, drink, leather products, enamels, and printing inks, andin the pharmaceutical and cosmetics industries [1–4]. Among theclasses of dye used for this purpose, azo dyes (R N N R′ groups)are of great concern due to their potential to form toxic aromaticproducts (carcinogenic and mutagenic properties) and because ofthe low removal rate of these dyes during primary and secondary
∗ Corresponding author. Tel.: +55 16 3602 0663; fax: +55 16 3602 4725.E-mail addresses: [email protected], [email protected] (G.A.R. Oliveira).
1 The first two authors participated equally in this research.
treatments [5,6]. Azo dyes represent about half of worldwide dyeproduction, and correspond to an important source of contamina-tion, considering that a significant part of synthetic textile dyes islost in waste waters during manufacturing or processing opera-tions. The discharge of these compounds into the environment isundesirable not only for aesthetic reasons but also because manyazo dyes and their breakdown products are toxic to aquatic lifeand mutagenic to humans [7–12]. It is therefore important to useeffective methods to test the mutagenicity/genotoxicity of thesecompounds and their derivatives [3,9,13,14].
Chlorine has been used extensively as a complementary treat-ment to remove or reduce the color of industrial effluentscontaining dyes [15,16] and also for disinfection purposes in drink-ing water treatment plants (DWTP). The discoloration process,using sodium hypochlorite (NaOCl) or chlorine gas, is based on
1383-5718/$ – see front matter © 2010 Elsevier B.V. All rights reserved.doi:10.1016/j.mrgentox.2010.09.001
Author's personal copy
G.A.R. Oliveira et al. / Mutation Research 703 (2010) 200–208 201
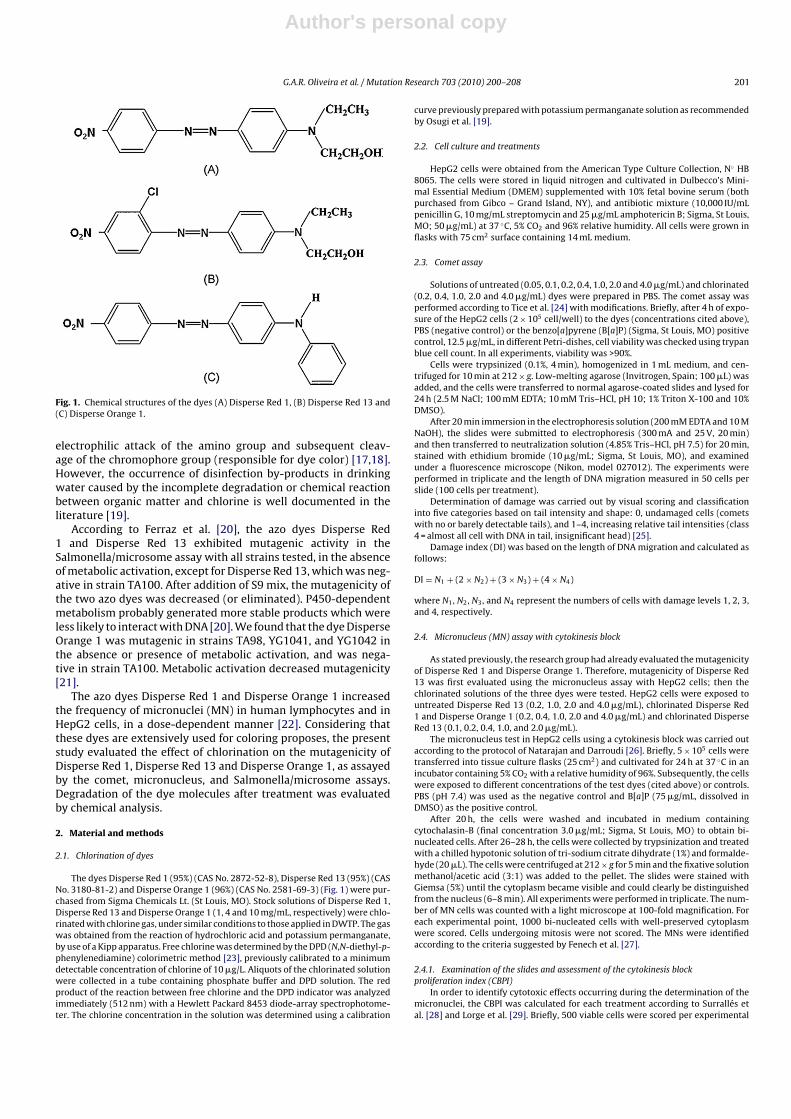
Fig. 1. Chemical structures of the dyes (A) Disperse Red 1, (B) Disperse Red 13 and(C) Disperse Orange 1.
electrophilic attack of the amino group and subsequent cleav-age of the chromophore group (responsible for dye color) [17,18].However, the occurrence of disinfection by-products in drinkingwater caused by the incomplete degradation or chemical reactionbetween organic matter and chlorine is well documented in theliterature [19].
According to Ferraz et al. [20], the azo dyes Disperse Red1 and Disperse Red 13 exhibited mutagenic activity in theSalmonella/microsome assay with all strains tested, in the absenceof metabolic activation, except for Disperse Red 13, which was neg-ative in strain TA100. After addition of S9 mix, the mutagenicity ofthe two azo dyes was decreased (or eliminated). P450-dependentmetabolism probably generated more stable products which wereless likely to interact with DNA [20]. We found that the dye DisperseOrange 1 was mutagenic in strains TA98, YG1041, and YG1042 inthe absence or presence of metabolic activation, and was nega-tive in strain TA100. Metabolic activation decreased mutagenicity[21].
The azo dyes Disperse Red 1 and Disperse Orange 1 increasedthe frequency of micronuclei (MN) in human lymphocytes and inHepG2 cells, in a dose-dependent manner [22]. Considering thatthese dyes are extensively used for coloring proposes, the presentstudy evaluated the effect of chlorination on the mutagenicity ofDisperse Red 1, Disperse Red 13 and Disperse Orange 1, as assayedby the comet, micronucleus, and Salmonella/microsome assays.Degradation of the dye molecules after treatment was evaluatedby chemical analysis.
2. Material and methods
2.1. Chlorination of dyes
The dyes Disperse Red 1 (95%) (CAS No. 2872-52-8), Disperse Red 13 (95%) (CASNo. 3180-81-2) and Disperse Orange 1 (96%) (CAS No. 2581-69-3) (Fig. 1) were pur-chased from Sigma Chemicals Lt. (St Louis, MO). Stock solutions of Disperse Red 1,Disperse Red 13 and Disperse Orange 1 (1, 4 and 10 mg/mL, respectively) were chlo-rinated with chlorine gas, under similar conditions to those applied in DWTP. The gaswas obtained from the reaction of hydrochloric acid and potassium permanganate,by use of a Kipp apparatus. Free chlorine was determined by the DPD (N,N-diethyl-p-phenylenediamine) colorimetric method [23], previously calibrated to a minimumdetectable concentration of chlorine of 10 �g/L. Aliquots of the chlorinated solutionwere collected in a tube containing phosphate buffer and DPD solution. The redproduct of the reaction between free chlorine and the DPD indicator was analyzedimmediately (512 nm) with a Hewlett Packard 8453 diode-array spectrophotome-ter. The chlorine concentration in the solution was determined using a calibration
curve previously prepared with potassium permanganate solution as recommendedby Osugi et al. [19].
2.2. Cell culture and treatments
HepG2 cells were obtained from the American Type Culture Collection, N◦ HB8065. The cells were stored in liquid nitrogen and cultivated in Dulbecco’s Mini-mal Essential Medium (DMEM) supplemented with 10% fetal bovine serum (bothpurchased from Gibco – Grand Island, NY), and antibiotic mixture (10,000 IU/mLpenicillin G, 10 mg/mL streptomycin and 25 �g/mL amphotericin B; Sigma, St Louis,MO; 50 �g/mL) at 37 ◦C, 5% CO2 and 96% relative humidity. All cells were grown inflasks with 75 cm2 surface containing 14 mL medium.
2.3. Comet assay
Solutions of untreated (0.05, 0.1, 0.2, 0.4, 1.0, 2.0 and 4.0 �g/mL) and chlorinated(0.2, 0.4, 1.0, 2.0 and 4.0 �g/mL) dyes were prepared in PBS. The comet assay wasperformed according to Tice et al. [24] with modifications. Briefly, after 4 h of expo-sure of the HepG2 cells (2 × 10⁵ cell/well) to the dyes (concentrations cited above),PBS (negative control) or the benzo[a]pyrene (B[a]P) (Sigma, St Louis, MO) positivecontrol, 12.5 �g/mL, in different Petri-dishes, cell viability was checked using trypanblue cell count. In all experiments, viability was >90%.
Cells were trypsinized (0.1%, 4 min), homogenized in 1 mL medium, and cen-trifuged for 10 min at 212 × g. Low-melting agarose (Invitrogen, Spain; 100 �L) wasadded, and the cells were transferred to normal agarose-coated slides and lysed for24 h (2.5 M NaCl; 100 mM EDTA; 10 mM Tris–HCl, pH 10; 1% Triton X-100 and 10%DMSO).
After 20 min immersion in the electrophoresis solution (200 mM EDTA and 10 MNaOH), the slides were submitted to electrophoresis (300 mA and 25 V, 20 min)and then transferred to neutralization solution (4.85% Tris–HCl, pH 7.5) for 20 min,stained with ethidium bromide (10 �g/mL; Sigma, St Louis, MO), and examinedunder a fluorescence microscope (Nikon, model 027012). The experiments wereperformed in triplicate and the length of DNA migration measured in 50 cells perslide (100 cells per treatment).
Determination of damage was carried out by visual scoring and classificationinto five categories based on tail intensity and shape: 0, undamaged cells (cometswith no or barely detectable tails), and 1–4, increasing relative tail intensities (class4 = almost all cell with DNA in tail, insignificant head) [25].
Damage index (DI) was based on the length of DNA migration and calculated asfollows:
DI = N1 + (2 × N2) + (3 × N3) + (4 × N4)
where N1, N2, N3, and N4 represent the numbers of cells with damage levels 1, 2, 3,and 4, respectively.
2.4. Micronucleus (MN) assay with cytokinesis block
As stated previously, the research group had already evaluated the mutagenicityof Disperse Red 1 and Disperse Orange 1. Therefore, mutagenicity of Disperse Red13 was first evaluated using the micronucleus assay with HepG2 cells; then thechlorinated solutions of the three dyes were tested. HepG2 cells were exposed tountreated Disperse Red 13 (0.2, 1.0, 2.0 and 4.0 �g/mL), chlorinated Disperse Red1 and Disperse Orange 1 (0.2, 0.4, 1.0, 2.0 and 4.0 �g/mL) and chlorinated DisperseRed 13 (0.1, 0.2, 0.4, 1.0, and 2.0 �g/mL).
The micronucleus test in HepG2 cells using a cytokinesis block was carried outaccording to the protocol of Natarajan and Darroudi [26]. Briefly, 5 × 10⁵ cells weretransferred into tissue culture flasks (25 cm2) and cultivated for 24 h at 37 ◦C in anincubator containing 5% CO2 with a relative humidity of 96%. Subsequently, the cellswere exposed to different concentrations of the test dyes (cited above) or controls.PBS (pH 7.4) was used as the negative control and B[a]P (75 �g/mL, dissolved inDMSO) as the positive control.
After 20 h, the cells were washed and incubated in medium containingcytochalasin-B (final concentration 3.0 �g/mL; Sigma, St Louis, MO) to obtain bi-nucleated cells. After 26–28 h, the cells were collected by trypsinization and treatedwith a chilled hypotonic solution of tri-sodium citrate dihydrate (1%) and formalde-hyde (20 �L). The cells were centrifuged at 212 × g for 5 min and the fixative solutionmethanol/acetic acid (3:1) was added to the pellet. The slides were stained withGiemsa (5%) until the cytoplasm became visible and could clearly be distinguishedfrom the nucleus (6–8 min). All experiments were performed in triplicate. The num-ber of MN cells was counted with a light microscope at 100-fold magnification. Foreach experimental point, 1000 bi-nucleated cells with well-preserved cytoplasmwere scored. Cells undergoing mitosis were not scored. The MNs were identifiedaccording to the criteria suggested by Fenech et al. [27].
2.4.1. Examination of the slides and assessment of the cytokinesis blockproliferation index (CBPI)
In order to identify cytotoxic effects occurring during the determination of themicronuclei, the CBPI was calculated for each treatment according to Surrallés etal. [28] and Lorge et al. [29]. Briefly, 500 viable cells were scored per experimental
Author's personal copy
202 G.A.R. Oliveira et al. / Mutation Research 703 (2010) 200–208
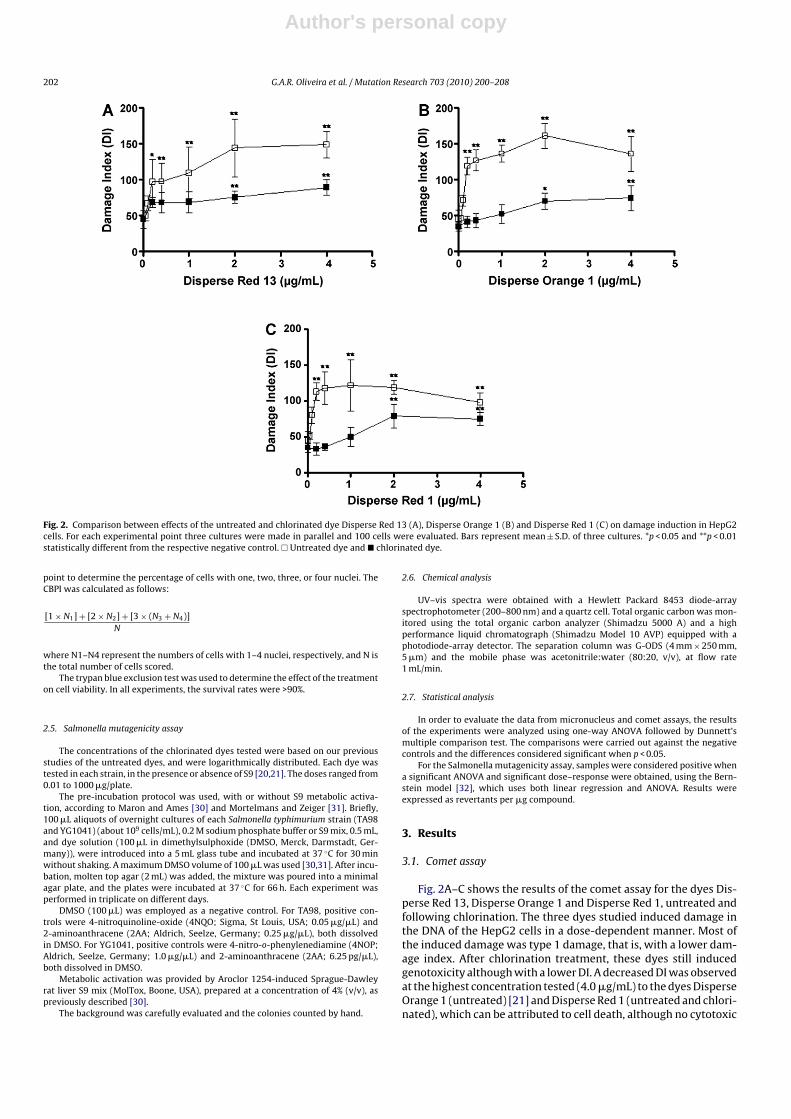
Fig. 2. Comparison between effects of the untreated and chlorinated dye Disperse Red 13 (A), Disperse Orange 1 (B) and Disperse Red 1 (C) on damage induction in HepG2cells. For each experimental point three cultures were made in parallel and 100 cells were evaluated. Bars represent mean ± S.D. of three cultures. *p < 0.05 and **p < 0.01statistically different from the respective negative control. � Untreated dye and � chlorinated dye.
point to determine the percentage of cells with one, two, three, or four nuclei. TheCBPI was calculated as follows:
[1 × N1] + [2 × N2] + [3 × (N3 + N4)]N
where N1–N4 represent the numbers of cells with 1–4 nuclei, respectively, and N isthe total number of cells scored.
The trypan blue exclusion test was used to determine the effect of the treatmenton cell viability. In all experiments, the survival rates were >90%.
2.5. Salmonella mutagenicity assay
The concentrations of the chlorinated dyes tested were based on our previousstudies of the untreated dyes, and were logarithmically distributed. Each dye wastested in each strain, in the presence or absence of S9 [20,21]. The doses ranged from0.01 to 1000 �g/plate.
The pre-incubation protocol was used, with or without S9 metabolic activa-tion, according to Maron and Ames [30] and Mortelmans and Zeiger [31]. Briefly,100 �L aliquots of overnight cultures of each Salmonella typhimurium strain (TA98and YG1041) (about 109 cells/mL), 0.2 M sodium phosphate buffer or S9 mix, 0.5 mL,and dye solution (100 �L in dimethylsulphoxide (DMSO, Merck, Darmstadt, Ger-many)), were introduced into a 5 mL glass tube and incubated at 37 ◦C for 30 minwithout shaking. A maximum DMSO volume of 100 �L was used [30,31]. After incu-bation, molten top agar (2 mL) was added, the mixture was poured into a minimalagar plate, and the plates were incubated at 37 ◦C for 66 h. Each experiment wasperformed in triplicate on different days.
DMSO (100 �L) was employed as a negative control. For TA98, positive con-trols were 4-nitroquinoline-oxide (4NQO; Sigma, St Louis, USA; 0.05 �g/�L) and2-aminoanthracene (2AA; Aldrich, Seelze, Germany; 0.25 �g/�L), both dissolvedin DMSO. For YG1041, positive controls were 4-nitro-o-phenylenediamine (4NOP;Aldrich, Seelze, Germany; 1.0 �g/�L) and 2-aminoanthracene (2AA; 6.25 pg/�L),both dissolved in DMSO.
Metabolic activation was provided by Aroclor 1254-induced Sprague-Dawleyrat liver S9 mix (MolTox, Boone, USA), prepared at a concentration of 4% (v/v), aspreviously described [30].
The background was carefully evaluated and the colonies counted by hand.
2.6. Chemical analysis
UV–vis spectra were obtained with a Hewlett Packard 8453 diode-arrayspectrophotometer (200–800 nm) and a quartz cell. Total organic carbon was mon-itored using the total organic carbon analyzer (Shimadzu 5000 A) and a highperformance liquid chromatograph (Shimadzu Model 10 AVP) equipped with aphotodiode-array detector. The separation column was G-ODS (4 mm × 250 mm,5 �m) and the mobile phase was acetonitrile:water (80:20, v/v), at flow rate1 mL/min.
2.7. Statistical analysis
In order to evaluate the data from micronucleus and comet assays, the resultsof the experiments were analyzed using one-way ANOVA followed by Dunnett’smultiple comparison test. The comparisons were carried out against the negativecontrols and the differences considered significant when p < 0.05.
For the Salmonella mutagenicity assay, samples were considered positive whena significant ANOVA and significant dose–response were obtained, using the Bern-stein model [32], which uses both linear regression and ANOVA. Results wereexpressed as revertants per �g compound.
3. Results
3.1. Comet assay
Fig. 2A–C shows the results of the comet assay for the dyes Dis-perse Red 13, Disperse Orange 1 and Disperse Red 1, untreated andfollowing chlorination. The three dyes studied induced damage inthe DNA of the HepG2 cells in a dose-dependent manner. Most ofthe induced damage was type 1 damage, that is, with a lower dam-age index. After chlorination treatment, these dyes still inducedgenotoxicity although with a lower DI. A decreased DI was observedat the highest concentration tested (4.0 �g/mL) to the dyes DisperseOrange 1 (untreated) [21] and Disperse Red 1 (untreated and chlori-nated), which can be attributed to cell death, although no cytotoxic
Author's personal copy
G.A.R. Oliveira et al. / Mutation Research 703 (2010) 200–208 203
Table 1Number of micronucleus (MN), percent of bi-nucleated cells (BN) and the cytokinesis block proliferation index (CBPI) in cultures of HepG2 cells treated with differentconcentrations of the original and chlorinated dye Disperse Red 13 and chlorinated dyes Disperse Red 1 and Disperse Orange 1. Results are given as median ± S.D. of threereplicate experiments.
Treatment (�g/ml) MNa (median ± S.D.) % BN (median ± S.D.) CBPI (median ± S.D.)
Negative control 14.0 ± 1.53 43.9 ± 4.12 1.542 ± 0.06Untreated Red 13
0.2 17 ± 2.52 53.2 ± 2.27 1.639 ± 0.021.0 28 ± 2.64** 54.9 ± 3.00 1.652 ± 0.022.0 26 ± 1.00** 52.1 ± 5.56 1.605 ± 0.0S4.0 20 ± 2.00 51.2 ± 3.64 1.607 ± 0.07
Negative control 12.0 ± 2.64 43.9 ± 4.12 1.542 ± 0.06B[a]P 75 41.0 ± 19.08** 44.3 ± 4.05 1.499 ± 0.06Chlorinated Red 13
0.1 16.0 ± 3.00 39.9 ± 2.32 1.489 ± 0.050.2 20.0 ± 2.00 42.0 ± 5.33 1.544 ± 0.050.4 19.7 ± 7.51 42.3 ± 4.1 0 1.527 ± 0.031.0 15.0 ± 3.61 41.1 ± 4.65 1.526 ± 0.042.0 9.00 ± 5.29 41.9 ± 0.92 1.51 7 ± 0.01
Chlorinated Orange 10.2 13.3 ± 4.51 43.9 ± 1.70 1.575 ± 0.040.4 11.3 ± 4.16 46.8 ± 5.48 1.586 ± 0.101.0 17.7 ± 4.04 48.7 ± 4.84 1.623 ± 0.092.0 17.3 ± 6.51 45.8 ± 3.99 1.611 ± 0.104.0 14.3 ± 4.93 53.5 ± 3.06 1.597 ± 0.04
Chlorinated Red 10.2 13.3 ± 5.51 48.0 ± 7.67 1.625 ± 0.120.4 19.7 ± 8.62 51.7 ± 3.42 1.631 ± 0.091.0 17.7 ± 3.21 50.9 ± 2.40 1.596 ± 0.032.0 9.7 ± 5.51 48.8 ± 4.54 1.589 ± 0.084.0 8.0 ± 3.46 54.1 ± 8.26 1.609 ± 0.06
a 1000 BN were analyzed per culture; S.D.: standard deviation; B[a]P: benzo[a]pyrene.** p < 0.01 significant difference with respect to the negative control.
effect was observed by trypan blue, as it was observed on the workof Chequer et al. [22].
Although the genotoxic effect was still present after chlorinationfor all the dyes tested, this effect was only observed at the higherconcentrations.
3.2. Micronucleus assay
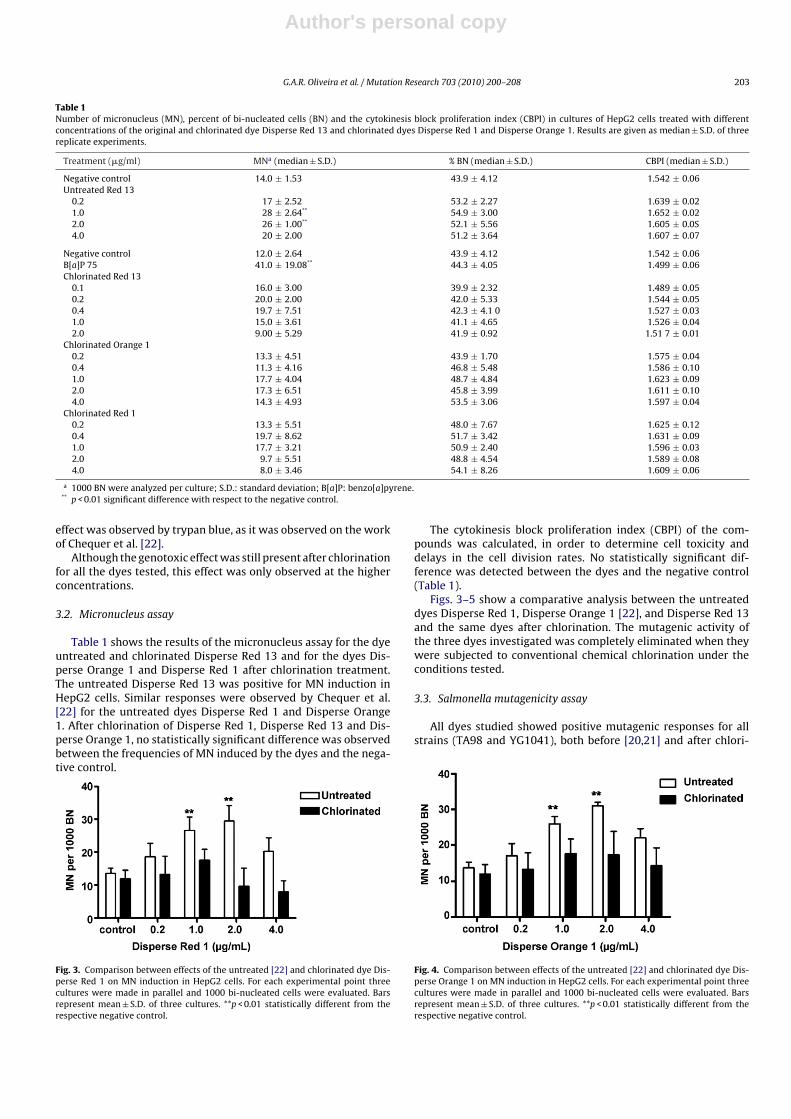
Table 1 shows the results of the micronucleus assay for the dyeuntreated and chlorinated Disperse Red 13 and for the dyes Dis-perse Orange 1 and Disperse Red 1 after chlorination treatment.The untreated Disperse Red 13 was positive for MN induction inHepG2 cells. Similar responses were observed by Chequer et al.[22] for the untreated dyes Disperse Red 1 and Disperse Orange1. After chlorination of Disperse Red 1, Disperse Red 13 and Dis-perse Orange 1, no statistically significant difference was observedbetween the frequencies of MN induced by the dyes and the nega-tive control.
Fig. 3. Comparison between effects of the untreated [22] and chlorinated dye Dis-perse Red 1 on MN induction in HepG2 cells. For each experimental point threecultures were made in parallel and 1000 bi-nucleated cells were evaluated. Barsrepresent mean ± S.D. of three cultures. **p < 0.01 statistically different from therespective negative control.
The cytokinesis block proliferation index (CBPI) of the com-pounds was calculated, in order to determine cell toxicity anddelays in the cell division rates. No statistically significant dif-ference was detected between the dyes and the negative control(Table 1).
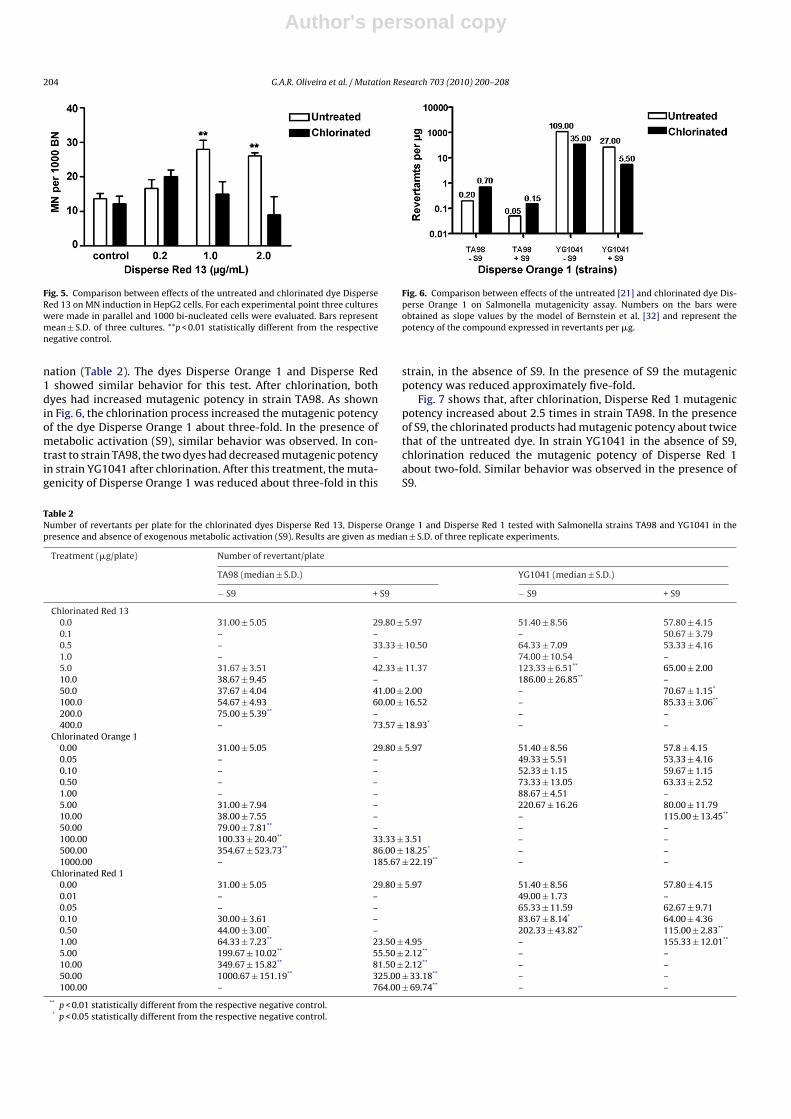
Figs. 3–5 show a comparative analysis between the untreateddyes Disperse Red 1, Disperse Orange 1 [22], and Disperse Red 13and the same dyes after chlorination. The mutagenic activity ofthe three dyes investigated was completely eliminated when theywere subjected to conventional chemical chlorination under theconditions tested.
3.3. Salmonella mutagenicity assay
All dyes studied showed positive mutagenic responses for allstrains (TA98 and YG1041), both before [20,21] and after chlori-
Fig. 4. Comparison between effects of the untreated [22] and chlorinated dye Dis-perse Orange 1 on MN induction in HepG2 cells. For each experimental point threecultures were made in parallel and 1000 bi-nucleated cells were evaluated. Barsrepresent mean ± S.D. of three cultures. **p < 0.01 statistically different from therespective negative control.
Author's personal copy
204 G.A.R. Oliveira et al. / Mutation Research 703 (2010) 200–208
Fig. 5. Comparison between effects of the untreated and chlorinated dye DisperseRed 13 on MN induction in HepG2 cells. For each experimental point three cultureswere made in parallel and 1000 bi-nucleated cells were evaluated. Bars representmean ± S.D. of three cultures. **p < 0.01 statistically different from the respectivenegative control.
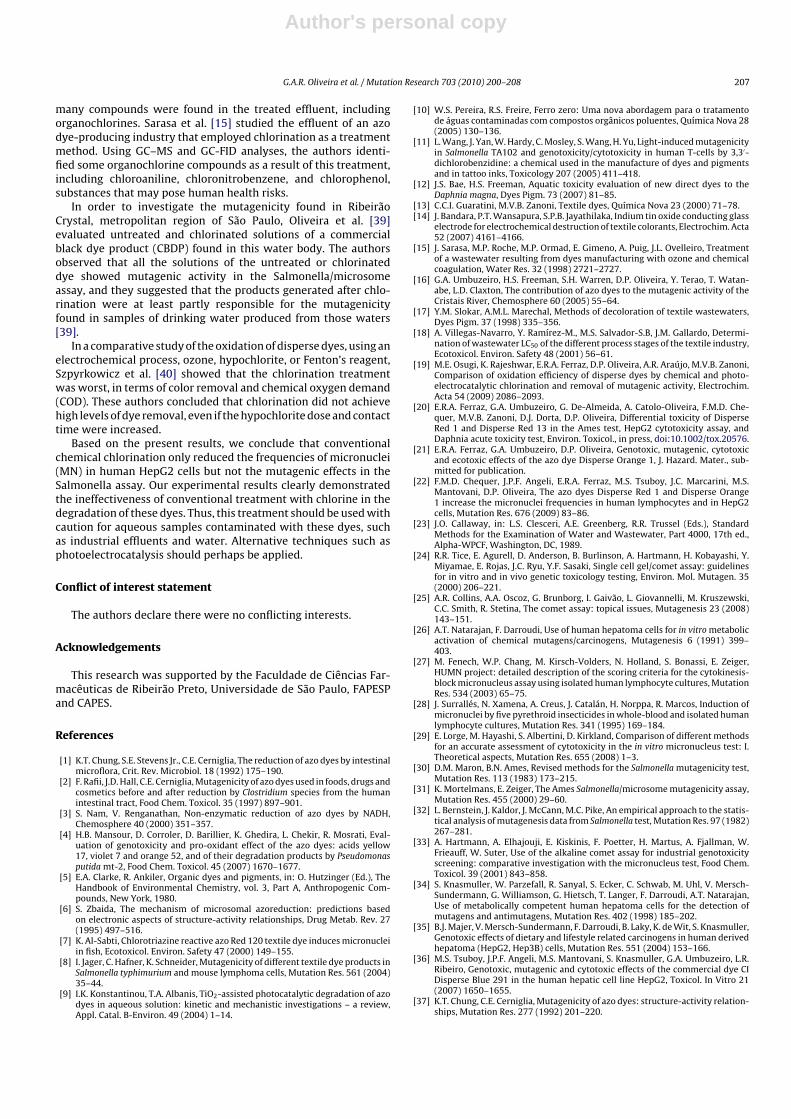
nation (Table 2). The dyes Disperse Orange 1 and Disperse Red1 showed similar behavior for this test. After chlorination, bothdyes had increased mutagenic potency in strain TA98. As shownin Fig. 6, the chlorination process increased the mutagenic potencyof the dye Disperse Orange 1 about three-fold. In the presence ofmetabolic activation (S9), similar behavior was observed. In con-trast to strain TA98, the two dyes had decreased mutagenic potencyin strain YG1041 after chlorination. After this treatment, the muta-genicity of Disperse Orange 1 was reduced about three-fold in this
Fig. 6. Comparison between effects of the untreated [21] and chlorinated dye Dis-perse Orange 1 on Salmonella mutagenicity assay. Numbers on the bars wereobtained as slope values by the model of Bernstein et al. [32] and represent thepotency of the compound expressed in revertants per �g.
strain, in the absence of S9. In the presence of S9 the mutagenicpotency was reduced approximately five-fold.
Fig. 7 shows that, after chlorination, Disperse Red 1 mutagenicpotency increased about 2.5 times in strain TA98. In the presenceof S9, the chlorinated products had mutagenic potency about twicethat of the untreated dye. In strain YG1041 in the absence of S9,chlorination reduced the mutagenic potency of Disperse Red 1about two-fold. Similar behavior was observed in the presence ofS9.
Table 2Number of revertants per plate for the chlorinated dyes Disperse Red 13, Disperse Orange 1 and Disperse Red 1 tested with Salmonella strains TA98 and YG1041 in thepresence and absence of exogenous metabolic activation (S9). Results are given as median ± S.D. of three replicate experiments.
Treatment (�g/plate) Number of revertant/plate
TA98 (median ± S.D.) YG1041 (median ± S.D.)
− S9 + S9 − S9 + S9
Chlorinated Red 130.0 31.00 ± 5.05 29.80 ± 5.97 51.40 ± 8.56 57.80 ± 4.150.1 – – – 50.67 ± 3.790.5 – 33.33 ± 10.50 64.33 ± 7.09 53.33 ± 4.161.0 – – 74.00 ± 10.54 –5.0 31.67 ± 3.51 42.33 ± 11.37 123.33 ± 6.51** 65.00 ± 2.0010.0 38.67 ± 9.45 – 186.00 ± 26.85** –50.0 37.67 ± 4.04 41.00 ± 2.00 – 70.67 ± 1.15*
100.0 54.67 ± 4.93 60.00 ± 16.52 – 85.33 ± 3.06**
200.0 75.00 ± 5.39** – – –400.0 – 73.57 ± 18.93* – –
Chlorinated Orange 10.00 31.00 ± 5.05 29.80 ± 5.97 51.40 ± 8.56 57.8 ± 4.150.05 – – 49.33 ± 5.51 53.33 ± 4.160.10 – – 52.33 ± 1.15 59.67 ± 1.150.50 – – 73.33 ± 13.05 63.33 ± 2.521.00 – – 88.67 ± 4.51 –5.00 31.00 ± 7.94 – 220.67 ± 16.26 80.00 ± 11.7910.00 38.00 ± 7.55 – – 115.00 ± 13.45**
50.00 79.00 ± 7.81** – – –100.00 100.33 ± 20.40** 33.33 ± 3.51 – –500.00 354.67 ± 523.73** 86.00 ± 18.25* – –1000.00 – 185.67 ± 22.19** – –
Chlorinated Red 10.00 31.00 ± 5.05 29.80 ± 5.97 51.40 ± 8.56 57.80 ± 4.150.01 – – 49.00 ± 1.73 –0.05 – – 65.33 ± 11.59 62.67 ± 9.710.10 30.00 ± 3.61 – 83.67 ± 8.14* 64.00 ± 4.360.50 44.00 ± 3.00* – 202.33 ± 43.82** 115.00 ± 2.83**
1.00 64.33 ± 7.23** 23.50 ± 4.95 – 155.33 ± 12.01**
5.00 199.67 ± 10.02** 55.50 ± 2.12** – –10.00 349.67 ± 15.82** 81.50 ± 2.12** – –50.00 1000.67 ± 151.19** 325.00 ± 33.18** – –100.00 – 764.00 ± 69.74** – –
** p < 0.01 statistically different from the respective negative control.* p < 0.05 statistically different from the respective negative control.

Author's personal copy
G.A.R. Oliveira et al. / Mutation Research 703 (2010) 200–208 205
Fig. 7. Comparison between effects of the untreated [20] and chlorinated dye Dis-perse Red 1 on Salmonella mutagenicity assay. Numbers on the bars were obtainedas slope values by the model of Bernstein et al. [32] and represent the potency ofthe compound expressed in revertants per �g.
Unlike the previous two dyes, Disperse Red 13 (Fig. 8) muta-genicity in strain TA98 in the absence of S9 was reduced by abouthalf after chlorination. This treatment led to a product that wasmutagenic in the presence of S9; in the untreated dye, metabolicactivation reduced mutagenicity. As with the previous two dyes, instrain YG1041, chlorination reduced the mutagenicity of DisperseRed 13, either with or without S9 activation.
3.4. Chemical analysis of the dyes and their chlorinated products
The degradation of the disperse dyes following treatment withchlorine gas was investigated by ultraviolet-visible absorption(UV–vis), high performance liquid chromatography coupled todiode-array detection (HPLC-DAD), and total organic carbon analy-
Fig. 8. Comparison between effects of the untreated [20] and chlorinated dye Dis-perse Red 13 on Salmonella mutagenicity assay. Numbers on the bars were obtainedas slope values by the model of Bernstein et al. [32] and represent the potency ofthe compound expressed in revertants per �g.
sis (TOC). Fig. 9 shows the UV–vis spectra obtained before and after5 min of chlorination of 0.5 mM solutions of Disperse Red 1 (CurveI), Disperse Orange 1 (Curve II), and Disperse Red 13 (Curve III). Allthe spectra showed rapid discoloration of the solution and com-plete disappearance of the bands around 498 nm (Disperse Red 1),480 nm (Disperse Orange 1), and 524 nm (Disperse Red 13), indi-cating complete degradation of the azo group chromophores.
This interpretation was confirmed by the results of the HPLC-DAD chromatograms. Disperse Red 1, Disperse Orange 1, andDisperse Red 13 showed typical chromatograms characterizedby an intense peak at a retention time of tr = 4.48 min (DisperseRed 1), 7.28 min (Disperse Orange 1) and 5.44 min (Disperse Red13) (Fig. 10A). After chlorination, complete disappearance of themain peaks attributed to each dye was observed. Chlorinated sam-
Fig. 9. UV–vis spectra obtained for treatment of 0.5 mM of (I) Disperse Red 1, (II) Disperse Orange 1 and (III) Disperse Red 13 before (—) and after 5 min of chemical chlorination(– –).

Author's personal copy
206 G.A.R. Oliveira et al. / Mutation Research 703 (2010) 200–208
Fig. 10. HPLC-DAD chromatograms obtained for treatment of 0.5 mM of (a) DisperseRed 1, (b) Disperse Orange 1 and (c) Disperse Red 13 before (A) and after 5 min ofchemical chlorination (B).
ples showed many poorly defined product peaks, tr = 2.2–4.0 min(Fig. 10B). TOC removal for chlorine-treated dyes was 1% (DisperseRed 1), 9% (Disperse Orange 1), and 6% (Disperse Red 13).
4. Discussion
The comet and micronuclei assays are routinely used for thedetection of genotoxic compounds [33]. The human HepG2 cell linehas been used in genotoxicity tests because it expressed severalenzymes involved in the activation/detoxication of DNA-reactivecarcinogens [34,35].
Considering the comet assay results, the present work demon-strated that the three dyes induced genotoxicity in the HepG2 cellsboth before and after chlorination. However, after chlorination, thedamage index (DI) decreased. Untreated Disperse Orange 1 [21]and Disperse Red 1 dyes and chlorinated Disperse Red 1 dye (Fig. 2)showed a decreased damage index at higher concentrations. Atthese higher concentrations, although a decrease in cell viabilitywas not observed in the Trypan Blue assay, destroyed cells wereclearly observable on the slides. A similar effect was observed byChequer et al. [22]. These authors evaluated the same dyes in HepG2cells and human lymphocytes, using the micronucleus assay, and, inboth cell lines, the number of micronuclei decreased, although thecytokinesis block proliferation index (CBPI), which assesses cyto-toxicity, did not change. However, the authors reported difficulty incounting the cells during analysis of the slides treated with higherconcentrations.
Disperse Red 1, Disperse Orange 1, and Disperse Red 13 pre-sented no statistically significant differences in MN frequenciesin HepG2 cells after chlorination, when compared to the negativecontrol. As can be seen in Figs. 3–5, the mutagenic activity of the
untreated dyes was completely eliminated when they were sub-mitted to treatment by conventional chemical chlorination. Theformation of MN can occur either due to breakage of the chromo-some or dysfunction of the mitotic spindle, and the comet assayonly detects single- and double-stranded breaks and alkali-labilesites [23,36].
Considering the test results for mutagenicity in Salmonellastrains TA98 and YG1041, we observed that, for all dyes stud-ied, both untreated [20,21] and chlorinated (Figs. 6–8), mutagenicpotency is higher with strain YG1041 than with TA98. This isdue to the action of the nitroreductase and O-acetyltransferaseenzymes, which are expressed at high levels in strain YG1041, andwhich appear to play important roles in the mutagenicity of thesecompounds. The S9 metabolizing system decreased the mutagenicpotency of all the untreated and chlorinated dyes. Possibly, prod-ucts generated after cytochrome P450-catalyzed metabolism haveless DNA-damaging potential.
We observed for both Disperse Orange 1 and Disperse Red 1 thatchlorination increased mutagenicity in strain TA98, in the presenceor absence of S9 (Figs. 6 and 7). In strain YG1041, we observedthe opposite behavior. This difference may be explained based onthe enzymes that are overproduced by strain YG1041. Apparently,the O-acetyltransferase and nitroreductase enzymes acting on thechlorinated dyes generate products that are less mutagenic thanthose derived from the action of these enzymes on the untreateddyes.
Disperse Red 13 showed different behavior. Chlorinationreduced the mutagenicity of the untreated dye in both strainsTA98 and YG1041 (Fig. 8). Untreated Disperse Red 13 did notshow mutagenicity in strain TA98 in the presence of S9. How-ever, after chlorination (Fig. 8), the dye has mutagenic activityin strain TA98 in the presence of S9, with mutagenic potency0.10 rev/�g. Probably, chlorination of this dye generated prod-ucts that require cytochrome P450-mediated metabolism to exertmutagenicity. This may be explained by presence of a chlorine atomin the structure of this dye. According to Chung and Cerniglia [37],insertion of a chlorine atom in an aromatic ring para to anotherchlorine atom tends to increase the mutagenicity of the compound.Possibly, chlorination of Disperse Red 13 leads to insertion of a chlo-rine atom in this position. For train YG1041, chlorination reducedmutagenic potency in the absence or presence of S9. As stated pre-viously, this strain produces high amounts of nitroreductase andO-acetyltransferase. These enzymes may act on the chlorinated dye,generating products that are less mutagenic than those generatedfrom the metabolism of the untreated dye.
For Disperse Orange 1 and Disperse Red 1, the comet assay didnot show the same pattern of response as in Salmonella strainTA98 (increasing genetic damage after chlorination). This may beexplained on the basis of the type of damage caused by these com-pounds. As stated previously, these compounds act on DNA, causingframe-shift mutations. This shift can occur by addition or deletionof nitrogenous bases. Possibly, the deletion of a small number ofbases cannot be detected by the comet assay. It can be inferredthat these dyes, following chlorination, do not cause chromosomebreaks. Thus, chlorination of Disperse Red 1, Disperse Red 13, andDisperse Orange 1 generated compounds that caused mainly DNAbreaks and/or point mutations.
Considering the chemical analysis, the results of the presentwork showed that, although chlorination promoted rupture ofthe azo bond, no mineralization of other aromatic centers in themolecule (generating H2O and inorganic carbon) occurred.
Several studies have shown the inefficiency of chlorination indegrading dyes. Pizzolato et al. [38] studied the effectiveness oftreating a textile effluent by oxidation with sodium hypochlo-rite (NaClO). The authors observed that the color was removed ina few minutes, but the dyes were not completely oxidized and
Author's personal copy
G.A.R. Oliveira et al. / Mutation Research 703 (2010) 200–208 207
many compounds were found in the treated effluent, includingorganochlorines. Sarasa et al. [15] studied the effluent of an azodye-producing industry that employed chlorination as a treatmentmethod. Using GC–MS and GC-FID analyses, the authors identi-fied some organochlorine compounds as a result of this treatment,including chloroaniline, chloronitrobenzene, and chlorophenol,substances that may pose human health risks.
In order to investigate the mutagenicity found in RibeirãoCrystal, metropolitan region of São Paulo, Oliveira et al. [39]evaluated untreated and chlorinated solutions of a commercialblack dye product (CBDP) found in this water body. The authorsobserved that all the solutions of the untreated or chlorinateddye showed mutagenic activity in the Salmonella/microsomeassay, and they suggested that the products generated after chlo-rination were at least partly responsible for the mutagenicityfound in samples of drinking water produced from those waters[39].
In a comparative study of the oxidation of disperse dyes, using anelectrochemical process, ozone, hypochlorite, or Fenton’s reagent,Szpyrkowicz et al. [40] showed that the chlorination treatmentwas worst, in terms of color removal and chemical oxygen demand(COD). These authors concluded that chlorination did not achievehigh levels of dye removal, even if the hypochlorite dose and contacttime were increased.
Based on the present results, we conclude that conventionalchemical chlorination only reduced the frequencies of micronuclei(MN) in human HepG2 cells but not the mutagenic effects in theSalmonella assay. Our experimental results clearly demonstratedthe ineffectiveness of conventional treatment with chlorine in thedegradation of these dyes. Thus, this treatment should be used withcaution for aqueous samples contaminated with these dyes, suchas industrial effluents and water. Alternative techniques such asphotoelectrocatalysis should perhaps be applied.
Conflict of interest statement
The authors declare there were no conflicting interests.
Acknowledgements
This research was supported by the Faculdade de Ciências Far-macêuticas de Ribeirão Preto, Universidade de São Paulo, FAPESPand CAPES.
References
[1] K.T. Chung, S.E. Stevens Jr., C.E. Cerniglia, The reduction of azo dyes by intestinalmicroflora, Crit. Rev. Microbiol. 18 (1992) 175–190.
[2] F. Rafii, J.D. Hall, C.E. Cerniglia, Mutagenicity of azo dyes used in foods, drugs andcosmetics before and after reduction by Clostridium species from the humanintestinal tract, Food Chem. Toxicol. 35 (1997) 897–901.
[3] S. Nam, V. Renganathan, Non-enzymatic reduction of azo dyes by NADH,Chemosphere 40 (2000) 351–357.
[4] H.B. Mansour, D. Corroler, D. Barillier, K. Ghedira, L. Chekir, R. Mosrati, Eval-uation of genotoxicity and pro-oxidant effect of the azo dyes: acids yellow17, violet 7 and orange 52, and of their degradation products by Pseudomonasputida mt-2, Food Chem. Toxicol. 45 (2007) 1670–1677.
[5] E.A. Clarke, R. Ankiler, Organic dyes and pigments, in: O. Hutzinger (Ed.), TheHandbook of Environmental Chemistry, vol. 3, Part A, Anthropogenic Com-pounds, New York, 1980.
[6] S. Zbaida, The mechanism of microsomal azoreduction: predictions basedon electronic aspects of structure-activity relationships, Drug Metab. Rev. 27(1995) 497–516.
[7] K. Al-Sabti, Chlorotriazine reactive azo Red 120 textile dye induces micronucleiin fish, Ecotoxicol. Environ. Safety 47 (2000) 149–155.
[8] I. Jager, C. Hafner, K. Schneider, Mutagenicity of different textile dye products inSalmonella typhimurium and mouse lymphoma cells, Mutation Res. 561 (2004)35–44.
[9] I.K. Konstantinou, T.A. Albanis, TiO2-assisted photocatalytic degradation of azodyes in aqueous solution: kinetic and mechanistic investigations – a review,Appl. Catal. B-Environ. 49 (2004) 1–14.
[10] W.S. Pereira, R.S. Freire, Ferro zero: Uma nova abordagem para o tratamentode águas contaminadas com compostos orgânicos poluentes, Química Nova 28(2005) 130–136.
[11] L. Wang, J. Yan, W. Hardy, C. Mosley, S. Wang, H. Yu, Light-induced mutagenicityin Salmonella TA102 and genotoxicity/cytotoxicity in human T-cells by 3,3′-dichlorobenzidine: a chemical used in the manufacture of dyes and pigmentsand in tattoo inks, Toxicology 207 (2005) 411–418.
[12] J.S. Bae, H.S. Freeman, Aquatic toxicity evaluation of new direct dyes to theDaphnia magna, Dyes Pigm. 73 (2007) 81–85.
[13] C.C.I. Guaratini, M.V.B. Zanoni, Textile dyes, Química Nova 23 (2000) 71–78.[14] J. Bandara, P.T. Wansapura, S.P.B. Jayathilaka, Indium tin oxide conducting glass
electrode for electrochemical destruction of textile colorants, Electrochim. Acta52 (2007) 4161–4166.
[15] J. Sarasa, M.P. Roche, M.P. Ormad, E. Gimeno, A. Puig, J.L. Ovelleiro, Treatmentof a wastewater resulting from dyes manufacturing with ozone and chemicalcoagulation, Water Res. 32 (1998) 2721–2727.
[16] G.A. Umbuzeiro, H.S. Freeman, S.H. Warren, D.P. Oliveira, Y. Terao, T. Watan-abe, L.D. Claxton, The contribution of azo dyes to the mutagenic activity of theCristais River, Chemosphere 60 (2005) 55–64.
[17] Y.M. Slokar, A.M.L. Marechal, Methods of decoloration of textile wastewaters,Dyes Pigm. 37 (1998) 335–356.
[18] A. Villegas-Navarro, Y. Ramírez-M., M.S. Salvador-S.B, J.M. Gallardo, Determi-nation of wastewater LC50 of the different process stages of the textile industry,Ecotoxicol. Environ. Safety 48 (2001) 56–61.
[19] M.E. Osugi, K. Rajeshwar, E.R.A. Ferraz, D.P. Oliveira, A.R. Araújo, M.V.B. Zanoni,Comparison of oxidation efficiency of disperse dyes by chemical and photo-electrocatalytic chlorination and removal of mutagenic activity, Electrochim.Acta 54 (2009) 2086–2093.
[20] E.R.A. Ferraz, G.A. Umbuzeiro, G. De-Almeida, A. Catolo-Oliveira, F.M.D. Che-quer, M.V.B. Zanoni, D.J. Dorta, D.P. Oliveira, Differential toxicity of DisperseRed 1 and Disperse Red 13 in the Ames test, HepG2 cytotoxicity assay, andDaphnia acute toxicity test, Environ. Toxicol., in press, doi:10.1002/tox.20576.
[21] E.R.A. Ferraz, G.A. Umbuzeiro, D.P. Oliveira, Genotoxic, mutagenic, cytotoxicand ecotoxic effects of the azo dye Disperse Orange 1, J. Hazard. Mater., sub-mitted for publication.
[22] F.M.D. Chequer, J.P.F. Angeli, E.R.A. Ferraz, M.S. Tsuboy, J.C. Marcarini, M.S.Mantovani, D.P. Oliveira, The azo dyes Disperse Red 1 and Disperse Orange1 increase the micronuclei frequencies in human lymphocytes and in HepG2cells, Mutation Res. 676 (2009) 83–86.
[23] J.O. Callaway, in: L.S. Clesceri, A.E. Greenberg, R.R. Trussel (Eds.), StandardMethods for the Examination of Water and Wastewater, Part 4000, 17th ed.,Alpha-WPCF, Washington, DC, 1989.
[24] R.R. Tice, E. Agurell, D. Anderson, B. Burlinson, A. Hartmann, H. Kobayashi, Y.Miyamae, E. Rojas, J.C. Ryu, Y.F. Sasaki, Single cell gel/comet assay: guidelinesfor in vitro and in vivo genetic toxicology testing, Environ. Mol. Mutagen. 35(2000) 206–221.
[25] A.R. Collins, A.A. Oscoz, G. Brunborg, I. Gaivão, L. Giovannelli, M. Kruszewski,C.C. Smith, R. Stetina, The comet assay: topical issues, Mutagenesis 23 (2008)143–151.
[26] A.T. Natarajan, F. Darroudi, Use of human hepatoma cells for in vitro metabolicactivation of chemical mutagens/carcinogens, Mutagenesis 6 (1991) 399–403.
[27] M. Fenech, W.P. Chang, M. Kirsch-Volders, N. Holland, S. Bonassi, E. Zeiger,HUMN project: detailed description of the scoring criteria for the cytokinesis-block micronucleus assay using isolated human lymphocyte cultures, MutationRes. 534 (2003) 65–75.
[28] J. Surrallés, N. Xamena, A. Creus, J. Catalán, H. Norppa, R. Marcos, Induction ofmicronuclei by five pyrethroid insecticides in whole-blood and isolated humanlymphocyte cultures, Mutation Res. 341 (1995) 169–184.
[29] E. Lorge, M. Hayashi, S. Albertini, D. Kirkland, Comparison of different methodsfor an accurate assessment of cytotoxicity in the in vitro micronucleus test: I.Theoretical aspects, Mutation Res. 655 (2008) 1–3.
[30] D.M. Maron, B.N. Ames, Revised methods for the Salmonella mutagenicity test,Mutation Res. 113 (1983) 173–215.
[31] K. Mortelmans, E. Zeiger, The Ames Salmonella/microsome mutagenicity assay,Mutation Res. 455 (2000) 29–60.
[32] L. Bernstein, J. Kaldor, J. McCann, M.C. Pike, An empirical approach to the statis-tical analysis of mutagenesis data from Salmonella test, Mutation Res. 97 (1982)267–281.
[33] A. Hartmann, A. Elhajouji, E. Kiskinis, F. Poetter, H. Martus, A. Fjallman, W.Frieauff, W. Suter, Use of the alkaline comet assay for industrial genotoxicityscreening: comparative investigation with the micronucleus test, Food Chem.Toxicol. 39 (2001) 843–858.
[34] S. Knasmuller, W. Parzefall, R. Sanyal, S. Ecker, C. Schwab, M. Uhl, V. Mersch-Sundermann, G. Williamson, G. Hietsch, T. Langer, F. Darroudi, A.T. Natarajan,Use of metabolically competent human hepatoma cells for the detection ofmutagens and antimutagens, Mutation Res. 402 (1998) 185–202.
[35] B.J. Majer, V. Mersch-Sundermann, F. Darroudi, B. Laky, K. de Wit, S. Knasmuller,Genotoxic effects of dietary and lifestyle related carcinogens in human derivedhepatoma (HepG2, Hep3B) cells, Mutation Res. 551 (2004) 153–166.
[36] M.S. Tsuboy, J.P.F. Angeli, M.S. Mantovani, S. Knasmuller, G.A. Umbuzeiro, L.R.Ribeiro, Genotoxic, mutagenic and cytotoxic effects of the commercial dye CIDisperse Blue 291 in the human hepatic cell line HepG2, Toxicol. In Vitro 21(2007) 1650–1655.
[37] K.T. Chung, C.E. Cerniglia, Mutagenicity of azo dyes: structure-activity relation-ships, Mutation Res. 277 (1992) 201–220.

Author's personal copy
208 G.A.R. Oliveira et al. / Mutation Research 703 (2010) 200–208
[38] T.M. Pizzolato, E. Carissimi, E.L. Machado, I.A.H. Schneider, Colour removal withNaClO of dye wastewater from an agate-processing plant in Rio Grande do Sul,Brazil, Int. J. Miner. Process. 65 (2002) 203–211.
[39] D.P. Oliveira, P.A. Carneiro, C.M. Rech, M.V.B. Zanoni, L.D. Claxton, G.A.Umbuzeiro, Mutagenic compounds generated from the chlorination of disperse
azo-dyes and their presence in drinking water, Environ. Sci. Technol. 40 (2006)6682–6689.
[40] L. Szpyrkowicz, C. Juzzolino, S.N. Kaul, A comparative study on oxidation of dis-perse dyes by electrochemical process, ozone, hypochlorite and Fenton reagent,Water Res. 35 (2001) 2129–2136.
Related Documents