Chlamydia 2000 Estimating Reinfection Intervals for Chlamydia trachomatis based on Routine Data Collection Florian W. Burckhardt Dissertation for the MSc in Epidemiology Department of Public Health Sciences University of Edinburgh September 2000

Welcome message from author
This document is posted to help you gain knowledge. Please leave a comment to let me know what you think about it! Share it to your friends and learn new things together.
Transcript
Chlamydia 2000
Estimating Reinfection Intervals for
Chlamydia trachomatis
based on Routine Data Collection
Florian W. Burckhardt
Dissertation for the MSc in Epidemiology
Department of Public Health Sciences
University of Edinburgh
September 2000

Declaration
I, Florian Burckhardt, declare the following dissertation to be my own work and entirely
composed by myself.

Acknowledgements
I would like to thank the following people for their cooperation and help in writing this
dissertation:
My tutor Pamela Warner, for her guidance, advice and time spent on discussions. Her
patience would do a Zen-Master proud.
Sheena Sutherland for allowing me to use her data and for her helpful suggestions.
Gordon Murray and Robin Prescott for their advice on survival methods.
Bruce Harris for extracting the data and helping with data related problems.
John Young and Gordon Scott for helpful information on study related issues.
Moral support: Coco for sending Comics&Chocolate, Markus in General, Kaffe Politik
for their carrot cake, Sid Meier for his Game Alpha Centauri & Friends
I dedicate this dissertation to my granddad Rudolf Külbel.

Abstract
Chlamydia trachomatis is the most common bacterial sexually transmitted disease in Scotland and the
rest of the UK. Its sequelae include pelvic inflammatory disease, ectopic pregnancy, infertility and
arthritis and these are more likely if reinfection occurs.
The costs to the healthcare system are estimated at £50 million a year and increased resources have been
directed towards piloting a national screening program in the UK. Due to the nature of the disease,
reinfection is common and knowledge of the time between subsequent infections is important for retest
intervals in screening programs. Despite numerous studies on reinfection with Chlamydia, the actual
reinfection interval for a British GUM clinic population is not known.
This study analyses routine data on Chlamydia tests collected retrospectively from January 1992 until
May 2000 by the Medical Microbiology Laboratory of the Royal Infirmary Edinburgh GUM clinic. A
total of 47.587 tests made on 34.754 patients were analysed with survival methods to estimate risk-group
specific reinfection intervals and to identify the importance of factors available for analysis that may be
determinants of reinfection. Variables were examined to ensure the assumptions underlying the analyses
were met.
The process of data cleaning, analysis and the rationale behind it are described in detail because of their
importance in studies using routinely collected data and to enable similar studies on routine data of other
GUM clinics. Results are discussed and areas for future research identified.

Table of Contents
I. INTRODUCTION....................................................................................................................................1
OUTLINE ....................................................................................................................................................2
II. REVIEW OF THE LITERATURE......................................................................................................3
OVERVIEW.................................................................................................................................................3
MICROBIOLOGICAL BACKGROUND............................................................................................................4
DIAGNOSIS OF CHLAMYDIA ........................................................................................................................5
TREATMENT...............................................................................................................................................5
PREVALENCE AND RISK FACTORS .............................................................................................................6
CONTROL STRATEGIES ............................................................................................................................10
MODELLING.............................................................................................................................................11
III. STUDY DESIGN.................................................................................................................................13
INTRODUCTION ........................................................................................................................................13
STUDY POPULATION ................................................................................................................................13
ROUTINE TESTING AND TREATMENT PROCEDURE...................................................................................14
REINFECTION DEFINITION .......................................................................................................................14
COVARIATES IN A STUDY ........................................................................................................................15
IV. METHODS ..........................................................................................................................................17
ESTIMATION OF REINFECTION INTERVALS ..............................................................................................17
POPULATION AND COVARIATES INCLUDED IN COX'S REGRESSION .........................................................19
COMPARISON OF PATIENTS WITH ONE VS. MULTIPLE CLINIC VISITS.........................................................20
COMPARISON OF MULTIPLE REINFECTION EPISODES ..............................................................................21
IMPACT OF INCREASED TEST SENSITIVITY................................................................................................21
STATISTICAL ANALYSIS ..........................................................................................................................22
V. DATA MANAGEMENT......................................................................................................................23
DATA CLEANING .....................................................................................................................................23
DATA STORAGE SYSTEM ..........................................................................................................................23
DATA EXTRACTION AND CLEANING.........................................................................................................24
VI. RESULTS ............................................................................................................................................26
DESCRIPTIVE ANALYSIS ..........................................................................................................................26
HYPOTHESIS TESTING..............................................................................................................................30
SURVIVAL ANALYSIS...............................................................................................................................30
PATIENTS WITH ONE VS. MULTIPLE CLINIC VISITS ...................................................................................40
MULTIPLE REINFECTION EPISODES .........................................................................................................40
INCREASED TEST SENSITIVITY .................................................................................................................41
VII. DISCUSSION.....................................................................................................................................42
AIM OF THE DISSERTATION .....................................................................................................................42
DESIGN OF THE STUDY ............................................................................................................................43
SOURCES OF BIAS ....................................................................................................................................43
ANALYSIS AND INTERPRETATION OF FINDINGS .......................................................................................45
LIMITATIONS OF THIS STUDY...................................................................................................................50
OUTLOOK AND FURTHER RESEARCH STRATEGY .....................................................................................52
VIII. REFERENCES.................................................................................................................................54
IX. APPENDIX
Table of Tables
Table 1.1: Studies on risk factors for Chlamydia infection. ............................................................................................ 8
Table 1.2: Studies on risk factors for reinfection with Chlamydia. ................................................................................. 9
Table 2: Covariates used in Cox’s regression................................................................................................................ 20
Table 3: Variables in the study-database .............................................................................................................appendix
Table 4: Pivot table of diagnoses.........................................................................................................................appendix
Table 5: Reinfection status after one, two, three and four or more years per sex and agegroup................................... 29
Table 6: Results of testing the age distribution for men and women in the survival-study population compared to the
general population............................................................................................................................................... 30
Table 7: Logrank tests to test equality of survival distributions between man and women. ......................................... 34
Table 8: Covariates used in Cox’s regression................................................................................................................ 35
Table 9.1: Cox’s regression with covariates sex, agecat, firstneg, prost.. .................................................... 37
Table 9.2: Cox’s regression for men only with covariates agecat, firstneg, prost.......................................... 38
Table 9.3: Cox’s regression for women only with covariates agecat, firstneg, prost..................................... 38
Table 10: Results of testing the age-distribution of men and women with one visit compared to those with two or
more visits. .......................................................................................................................................................... 40

Table 11: Results of testing the durations of first and second reinfection intervals...................................................... 40
Table 12: Results of testing the proportion of positive diagnoses in cervical swabs between LCx, culture................. 41
Table of Figures
Figure 1: Reinfection cycle of Chlamydia. ..........................................................................................................appendix
Figure 2: Illustration of reinfection interval .................................................................................................................. 15
Figure 3: Breakdown of study population.. .........................................................................................................appendix
Figure 4.1: Tests request sheet.............................................................................................................................appendix
Figure 4.2: Tests request sheet, specimen section. ..............................................................................................appendix
Figure 5: Tests with conflicting date of births per year and quarter....................................................................appendix
Figure 6.1: Number of total Chlamydia tests for men (blue) and women (red) for each age category. ........................ 26
Figure 6.2: Comparison of relative age distribution between the RIEGUM clinic population and the general Lothian
population............................................................................................................................................................ 27
Figure 7: Tests per ageband and sex.. ............................................................................................................................ 28
Figure 9: Proportion of men and women tested positive plotted against age. ............................................................... 30
Figure 10.1: Kaplan-Meier plot of cumulative survival for men and women of all ages.............................................. 31
Figure 10.2: Kaplan-Meier plot of cumulative survival for men and women between 15 and 19 years....................... 32
Figure 10.3: Kaplan-Meier plot of cumulative survival for men and women between 20 and 24 years....................... 32
Figure 10.4: Kaplan-Meier plot of cumulative survival for men and women between 25 and 34 years....................... 33
Figure 10.5: Kaplan-Meier plot of cumulative survival for men and women 35 years and older................................. 33
Figure 11.1: Log-minus-Log plots to check proportional hazards assumption for covariate sex................................ 35
Figure 11.2: Log-minus-Log plots to check proportional hazards assumption for covariate firstneg.................... 36
Figure 11.3: Log-minus-Log plots to check proportional hazards assumption for covariate prost........................... 36
Figure 11.4: Log-minus-Log plots to check proportional hazards assumption for covariate agecat. ....................... 37

Estimating Reinfection Intervals for Chlamydia trachomatis
I. Introduction
Epidemiology can be seen as the study of the pattern of disease through time, place and population. It
seeks to uncover the hidden links and causations of ill-health on a population rather than a physiological,
individual level. Epidemiological studies look at the associations between risk factors (exposures) and
disease outcomes. They can try to infer causations from data in order to create hypotheses of why people
get a disease. Alternatively, if the aetiology of a disease is already known in detail, knowledge of who is
more likely to get the disease is essential for cost efficient medical and educational support. This is even
more important for risk factors that lie beyond an individual's control such as age or ethnicity. It is an
ethical obligation to be as efficient in delivering health care as possible, since resources wasted
unnecessarily are not available to others.
Sexually transmitted diseases (STDs) are a major burden of disease worldwide and bring great suffering.
They can lead to severe medical consequences such as infertility for both, men and women, adverse
pregnancy outcomes or even death and cause a high social and economic burden. STDs share overlapping
epidemiologies with similar modes of transmissions and symptoms. Any insight into the underlying
disease patterns of one STD could possibly be transferrable to others. STDs are more controlled by
behaviour than by physiological constitution. Precise knowledge of risk groups allows targeted prevention
strategies such as specialised health education or better access to screening programs.
Chlamydia trachomatis is causing the majority of sexually transmitted bacterial infections throughout the
world. With efficient diagnostic tests and treatment for the disease at disposal, Chlamydia infections
challenge the non-medical aspects of Public Health, such as identifying and targeting risk groups or
providing education and access to healthcare.
Despite lots of dedicated research, one of the important open questions regarding Chlamydia is that of the
reinfection interval. Ideally, one would like to be able to define an interval based on selected personal
characteristics of an individual. Multivariate statistical methods can help to find the "right" set of
characteristics in a study population. However, it has to be checked carefully whether findings can be
generalised to other settings. For an adequate Public Health response to Chlamydia, one would have to
consider not only reinfection intervals, but also qualitative information of group specific seriousness of
sequelae and access to healthcare infrastructure. Health economic and resource management implications
would have to be considered, too.

Estimating Reinfection Intervals for Chlamydia trachomatis
With the widespread use of modern data processing in a lot of health care settings, routinely collected
data can be accessed quickly without time consuming compilation of written records. Multicentre
databases are making an increasing contribution to medical understanding as they allow one to tap into a
rich seam of epidemiological data for retrospective studies.
This study analyses routine data on Chlamydia tests collected retrospectively from January 1992 until
May 2000 by the Medical Microbiology Laboratory of the Royal Infirmary Edinburgh GUM clinic. A
total of 47.587 tests made on 34.754 patients are analysed with survival methods to estimate risk-group
specific reinfection intervals and to identify determinants of reinfection. The large time interval makes the
study sample one of the largest ever on Chlamydia in the UK and one of the largest worldwide involving
both, men and women.
The process of data cleaning, analysis and the rationale behind it are described in detail because of their
importance in studies using routinely collected data and to enable similar studies on routine data of other
GUM clinics.
Outline
Chapter II will cover epidemiological issues by reviewing the current literature on Chlamydia. It will also
give a brief microbiological background.
Chapter III will describe the study design and give details on the routine data collection process.
Chapter IV will introduce the statistical methods used and describe the analyses made.
Chapter V will provide more detailed information on data storage and retrieval, which would otherwise
have obstructed the reading flow.
Chapter VI will report the results in tables and figures.
Chapter VII will discuss the results of this study, reflect on its implications and make recommendations.
The appendix contains a list of abbreviations used in this dissertation.
Estimating Reinfection Intervals for Chlamydia trachomatis
II. Review of the Literature
Overview
Chlamydia trachomatis is the most common bacterial sexually transmitted disease (STD) in Scotland
(ISD, 2000) and the rest of the UK (Stephenson, 1998). The infection is asymptomatic in 50% of men and
70% of women (CMO, 1997) and can thus be passed on quite readily before any preventative or curative
measures are taken.
Chlamydial infections have major medical, social and economic consequences. Pelvic inflammatory
disease (PID), ectopic pregnancy, tubal factor infertility and epididymitis, proctitis and arthritis
(Paavonen et al, 1996) are all extremely costly sequelae to the healthcare system with conservative
calculations being estimated at £50 million per year (Stephenson, 1998). Women are particularly affected
with further adverse outcomes including chronic pelvic pain, premature rupture of membranes during
pregnancy, low birth weight of infants, still birth and early pregnancy loss. In neonates of infected
mothers, Chlamydial conjunctivitis, trachoma (hence the name) and pneumonitis may develop (Genc et
al, 1996). It is also estimated that 6 million people lost their eyesight because of Chlamydial infections
(Kayser et al, 1992). In the tropics, C. trachomatis is responsible for lymphogranuloma venerum.
Chlamydial infections are also linked to an increased susceptibility to HIV, probably due to the
inflammatory response that leads to a higher concentration of HIV-host cells (Royce et al, 1997). In what
follows, only sexually transmitted Chlamydial infections are considered.
In addition to any economic cost, the psychological burden for an individual suffering from infertility,
chronic PID or having survived an ectopic pregnancy will be severe. As a result of C. trachomatis
infection, in the UK alone each year about 74.000 women will suffer from PID, 30.000 couples will seek
fertility treatment and 3.000 ectopic pregnancies will occur, 120 of which will lead to death of the mother
(Taylor-Robinson, 1994). There is clearly a strong public health interest in reducing infection and
reinfection with Chlamydia, which has led to the launching of a national screening study pilot in the UK
(Bower, 1998, Department of Health, 2000)
One of the key issues for future research pointed out by the Chief Medical Officers' (CMO) expert
advisory group on Chlamydia concerns optimum screening intervals (CMO, 1997). Even the most recent
report on a national screening pilot study (Tobin et al, 2000) identifies this as a crucial question, that
remains to be answered. Screening intervals will depend on reinfection probabilities and intervals, access

Estimating Reinfection Intervals for Chlamydia trachomatis
to risk groups, severity of sequelae, existing health infrastructure and resources avilable. Methods for
estimation of reinfection intervals and reporting them is the focus for this dissertation.
Microbiological Background
Chlamydia trachomatis belongs to the Chlamydiaceae, a group of obligate intracellular bacterial parasites
(Kayser et al, 1992). For the remainder of the text, “Chlamydia” (genus) will refer to Chlamydia
trachomatis (species) unless stated otherwise. Chlamydiaceae differ from other bacteria by going through
a special reproductive cycle with two distinct morphological stages, the infectious elementary bodies
(EB) and the reproductive reticulate bodies (RB).
An elementary body is about 300 nm wide, dense, spherical and with a rigid cell wall especially adapted
to survive outside a host cell. It also contains the necessary receptors to dock onto the outside of mucosal
host cells and to trigger its own phagocytosis, thus conveying infectivity. Once inside the cellular
compartments of a mucosal cell, EBs change to become the larger (1000 nm), less dense and non-
infectious RBs that grow through cellular division inside their host cell and drain its resources.
Subsequently, some RBs change back to become EBs. Upon lysis of the host cell, both RBs and EBs get
released and the EBs continue the infectious cycle. One cycle from docking on the host to lysis of the host
takes about 48h (Kayser et al, 1992; appendix, fig. 1).
C. trachomatis, like all Chlamydiaceae, exists in a wide range of different serotypes, which are
responsible for different sequelae. Host acquired immunity against one serotype is partial since it does not
protect against a different serotype, thus making subsequent infections possible.
A host's immune system has, simply put, two main strategies, humoral (non-cellular) and cellular defence.
Humoral defence consists mainly of different types of antibodies dissolved in blood plasma, ready to
attack and immobilise any pathogen they encounter and able to call in “help” from lymphocytes. Cellular
defence consists of specialized lymphocytes such as natural killer cells that can recognise and kill
“invaded” body cells. Being an intracellular parasite, Chlamydia basically evades humoral immune
defence and cellular defence only can be effective. There is growing evidence now for reinfections being
associated with chronic inflammation and increasing the risk for ectopic pregnancy through an excessive
inflammatory response with a subsequent scarring of tissue, which causes tubal blockage (Hillis et al,
1997, Rasmussen et al, 1997, Patton et al, 1989).
Further issues surrounding reinfection will be discussed in greater detail later.

Estimating Reinfection Intervals for Chlamydia trachomatis
Diagnosis of Chlamydia
A lot of veneral infections share overlapping symptoms and can also be present simultaneously
(Fortenberry et al, 1999), so diagnosis of infection is a key step. For Chlamydia, proof of live culture used
to be the method of choice because of its high specificity. With the discovery of monoclonal antibodies,
immunofluorescent methods (direct fluorescent antibodies, enzyme immunoassays) were also used in
detecting Chlamydia (CEG, 1999). The antibodies targeted an outer membrane protein of EBs that is
shared by all serotypes. However, this still required invasive sampling and RBs could escape detection.
The advent of DNA-amplification made it possible to amplify specific Chlamydia-only sequences, even
with very diluted specimen such as a patient's urine. Studies have shown that the new tests have a higher
sensitivity and specificity than previous tests (Quinn et al, 1996, Young et al, 1998).
It is obvious that a test should have a high sensitivity to pick up positives, but it also should be specific,
otherwise false positive results would cause unnecessary worries for the individuals concerned (CMO,
1997). This is more likely to happen where the prevalence of the condition in a population is low.
Sensitivity is about 75% – 100%, specificity >99% when used on non-invasive samples like first void
urine (FVU) (CEG, 1999). The test can also detect C. trachomatis infection when organisms are in very
low numbers, which is important for early diagnosis. Testing is also less dependent on sampling and
transportation techniques (Stary, 1997), so even home sampling of FVU might be an option.
Men especially benefit from the new non-invasive sampling, as the previous method involved rather
painful urethral swabs. Indeed, since introduction of the new testing method the total number of men and
also the relative proportion of men testing positive has increased, because more partners of positive
women agreed to get tested (Dr. Sheena Sutherland, affil.).
A particular diagnostic problem is inherently connected with the high sensitivity of amplification assays.
Based on DNA amplification and able to detect minute amounts of it, undegraded DNA from dead or non
viable bacteria could give a false positive result if tested within 3 weeks of initial treatment. Therefore, a
test of cure (TOC) has to be made 3 weeks after treatment (CEG, 1999).
Treatment
As a bacterium, Chlamydia is vulnerable to antibiotics. Antibiotics of choice are tetracyclines and
macrolides. The infection is easily treated with either Doxycycline (100mg) or Erythromycin (500mg) for
7 days or Acithromycin (1000mg) given in a single dose (Martin et al, 1992, CEG 1999). Acithromycin
guarantees compliance, as doctors can observe patients taking the treatment, but it is almost 4 times more

Estimating Reinfection Intervals for Chlamydia trachomatis
expensive (Stephenson, 1998). Unlike a lot of other antibiotics, Acithromycin is still under patent (Pfizer
Pharmaceuticals), soits holder can dictate the price. This raises issues of patient compliancy with
treatment vs. cost of treatment, which have to be balanced carefully for different public health settings.
CEG (1999) recommends Acithromycin for patients with erratic healthcare seeking behaviour. There is
evidence for Acithromycin having overall cost advantages, however, mainly because of its 100%
compliancy rate (Black et al, 2000).
Chlamydia is an intracellular parasite with an unusual life cycle, therefore genetic exchange of resistance
plasmids with other bacteria will be extremely limited and no antibiotic resistance is known (Young et al,
1998). This is important for practical management, since concerns regarding non-compliancy are limited
to issues of cure of patient and reduction of infection pool. There is no danger of antibiotic resistance
developing due to non-compliancy.
Prevalence and Risk Factors
The majority of studies on Chlamydia were conducted on women only (table 1.1-2). The main reasons
might be availability of routine data, accessibility of study population and severity of sequelae. Men are
less likely than women to attend healthcare settings where screening would be feasible and their sequelae
are less severe (Tobin et al, 2000). There is also a far more extensive reproductive health infrastructure
available for women than for men, e.g. routine cervical cancer screening. It is now recommended practice
to include testing for Chlamydia in all these health settings (SIGN, 2000).
In addition, the moral pressure on women regarding STDs is certainly higher than that on men. However,
one must not ignore the contribution of men in spreading STDs and more research in that area would help
to get a better overall picture on the pattern of disease (Pierpoint et al, 2000).
The exact prevalence of C. trachomatis is not known but numbers for women range from 3% to 11%
(James, 1999, Oakeshott et al, 1995, Paavonen, 1997, SCIEH, 1999, Santer et al, 2000). However, it is
very clear from routine data on sexually transmitted diseases (ISD, 2000, Simms et al, 1997) and from
other studies (Stokes, 1997, Grun et al, 1997) that risk of infection is highly age dependent, with highest
prevalence in teenage women and peak levels for men aged 25-34.
Within Scotland, Lothian accounts for almost a quarter of all cases (ISD, 2000). The number of positives
in Scotland has increased by 20% annually since 1996 (ISD, 2000). Part of the increase can be attributed
to the higher sensitivity of the new LCx test, since an increasing number of laboratories were shifting to
the new amplification assays during the last years (SCIEH, 1999). In case of the Royal Infirmary data,

Estimating Reinfection Intervals for Chlamydia trachomatis
test methods changed from culture and immunofluorescence to LCx in summer 1998, leading to an
immediate 1.5 increase in positive diagnoses.
Effects at population level are determined by the behaviours of individuals. In theory, sexual transmission
can be prevented almost completely by using condoms. In real life on the other hand, behavioural risk
factors and socioeconomic proxy measures are used to explain the observed differences in infection rates
within a population: young age, ethnic group, low school leaving age, single status, not using barrier
contraceptives, multiple sexual partners or a new partner in recent months are considered to be risk
factors (table 1.1-2). However, some studies contradict the findings of others. In a study by Burstein et al
(1998), common predictors such as prior STD-history, multiple or new partners and inconsistent condom
use were, however, not able to identify a high-risk subset among adolescent females. Regarding hormonal
contraception, one study reported a protective effect (Richey et al, 1999) and another found the opposite
(CMO, 1997). This might be explained by different kinds of sexual relationships of women taking
hormonal contraception: active family planning in a secure relationship combined with a low risk attitude
vs. casual relationships with convenient pregnancy prevention.
Cultural differences between study settings will lead to different conclusions and recommendations. For
example, ethnicity is used as a covariate in most of the studies (tab. 1.1-2). In most US studies, however,
the ethnicity variable only accounts for “white”, “black” and “other” (Blythe et al, 1992, Hillis et al,
1994, Fortenberry et al, 1999, Richey et al.1999), in UK studies it additionally differentiates “black
Caribbean”, “black African”, “Asian” (Hughes et al, 2000, Shahmanesh et al, 2000). It is unclear to what
extent findings for a racial subgroup as risk factor can be generalised to other settings.
Summing up, for women, young age seems to be the most robust predictor for increased risk of
Chlamydial infection. With regard to men, there has been too little data to establish robust predictors of
increased risk.

Estimating Reinfection Intervals for Chlamydia trachomatis
Table 1.1: Studies on risk factors for Chlamydia infection.
Author study type Sex Age Country L(P)CR Risk Factors, other findings
CMO ExpertAdvisory Group,1997
summary both all UK various young age, ethnic group, single status, oralcontraceptives, new sexual partners within last 3months, no previous births, low school leaving age
Hughes, 2000 crosssectional
both all UK various black ethnic minority, teenagers, multiple partners
Mosure, 1996 retrosp. women 15-19 US no cervicitis, friable cervix, multiple/ new/ symptomaticsex partners; study population: more than one visit tofamily planning clinic
Pierpoint, 2000 crosssectional
menonly
18-35 UK yes low response rate (51%), prevalence 1.9%, highest inmen >30, screening women and contact tracing malepartners may be efficient for Chlamydia control
Shahmanesh,2000
crosssectional
both all UK (no) * within large urban centres, Chlamydia infectionsoccur in core areas
Simms, 1997 retrosp. both all UK no 16-19 year old, particularly women; high levels ofasymptomatics
Winter, 2000 retrosp. both 15-64 UK no men: ethnic group, women: young age, interactionsbetween ethnic group and age for both sexes andethnic group and level of deprivation for men;ecological study
Studies on risk factors for reinfection are inconclusive (table 1.2). Young age, multiple/ new partners,
presence of other STDs and ethnic group increase the risk of reinfection in studies with women only
(Fortenberry et al, 1999, Hillis et al, 1998, Hillis et al, 1994) but not in others which also include men
(Miller et al, 1998, Richey et al, 1999). Reinfection rate ranged between 17% and 54% and reinfection
intervals, where given, between 6 months and 1 year (Kjaer et al, 2000, Blythe et al, 1992, Fortenberry et
al, 1999).
Although Chlamydia is the most widespread STD in the western world, one still needs either a high-risk
group or a very large sample to detect reinfection events. Most studies therefore take either large datasets
from GUM clinics, family planning clinics or other health care setting (Hillis et al, 1994, Miller et al,
1998, Richey et al, 1999) or enroll adolescent women, a high risk group, for a prospective cohort study
(Blythe et al, 1992, Fortenberry et al, 1999). Pimenta et al (2000) have analysed reinfection rates in
England and found far lower rates (3.6%-9.4%) than those reported from the US studies.
Treatment success of initial infections is high (95%) and within rates of pharmacological treatment failure
(Hillis et al, 1998). Therefore, a reinfection event will most likely come from a new or an untreated
partner (Blythe et al, 1992). This points out the importance of consequent contact tracing and partner
treatment, which will be discuused below.

Estimating Reinfection Intervals for Chlamydia trachomatis
Table 1.2: Studies on risk factors for reinfection with Chlamydia.
Author study type Sex Age Country L(P)CR Risk Factors, other findings
Burstein, 1998 prospective women 12-19 US yes included risk factors (prior disease, multiple/newpartners, inconsistent condom use) failed to identify ahigh risk subset, reinfection interval: 6.3 months
Blythe, 1992 prospective women adole-scent
US no 38.4% reinfection, majority within 9 months,reinfections with same serovar frequent, suggestingrelapse or reinfection from untreated partner
Fortenberry,1999
prospective women 15-19 US no ethnic group, gonorrhea as initial infection, multiplesex partners in previous 3 months, inconsistentcondom use, 40% recurrence with at least one STDwithin one year
Hillis, 1998 prospective women all yes 2-3 fold increased risk for: <24 and white, multiple/new partners, untreated partner
Hillis, 1997 retrosp. women all US no <25 years, black, place of residence
Hillis, 1994 retrosp. women <15 - 44 US no young age, ethnic group, area of residence,coinfection with gonorrhea, STD history; receivingcare in a family-planning clinic protective; 54%(<15) and 30% (15-19) reinfection within 5 years
Kissinger, 1998 prospective women 14-39 US no annual recurrence rate lower for patient deliveredpartner medication (11.5%) compared to partnerreferral group (25.5%)
Kjær, 2000 prospective both >18 DK yes presence of other STDs associated with higher risk ofreinfection, cumulated incidence of recurrence within24 weeks: 29%; home sampling promising methodfor retesting
Miller, 1998 retrosp. women all US no young age, pregnancy, infection with other STDs notpredictive for reinfection with Chlamydia, 17%reinfection
Pimenta, 2000 retrosp. women ? UK ? 3.6% overall reinfection rate per year, blackCarribeans, multiple partners, previous STD
Richey, 1999 retrosp. both(fewmales)
all US no reinfection risk independent of age, multiple/ newpartners or other STDs; reduced risk of reinfectionassociated with tubal litigation, hormonal/ barriercontraception; number of visits to clinic protective
* inconsistently reported

Estimating Reinfection Intervals for Chlamydia trachomatis
Control Strategies
Screening and contact tracing are the key strategies discussed for STD control (Tobin et al, 2000). An
infective agent with a large pool of asymptomatic carriers unaware of their condition can spread
extensively into the population before preventative measures are taken. One strategy of detecting
asymptomatics is opportunistic screening during routine health visits such as cervical smear tests or
during special treatments like termination of pregnancy (SIGN, 2000, Santer et al, 2000). A pilot study
for nationwide Chlamydia screening has been set up in Portsmouth and the Wirral and offers
opportunistic screening for women aged 16-25 who attend GPs, family planning, termination of
pregnancy, genitourinary medicine (GUM), colposcopy, gynacology, or antenatal clinics (Department of
Health, 2000).
On the other hand, infections can only occur in sex partners of an infected index case. Therefore, another
strategy for detecting infection in asymptomatics is by following up sex partners of a positive index case.
This is termed contact tracing, a vital part in STD management because, as the name implies, these
infections are transmitted by having sex. The proportion of asymptomatic infections in sexual partners
was about 60% in a Danish study (Kjaer et al, 2000). The best test and treatment efforts are foiled if the
partner of an index case is not tested and treated as well, because a ping-pong-like effect would then lead
to reciprocal infections between partners (Blythe et al, 1992). With high rates of contact tracing, however,
it possible to lower prevalence close to eradication. Kretzschmar et al (1996) have modelled different
strategies for STD management: mass screening, focal screening and contact tracing. In their simulations,
they found that Chlamydia needed much higher rates of contact tracing than other STDs in order to
achieve eradication.
Sweden has very high contact tracing rates and even has legislation in place that allows for police
enforced testing of named partners (Tyden et al, 2000). In the Royal Infirmary health care setting, less
than 30% of partners of women tested positive came forward for testing (Dr. Sheena Sutherland, affil,).
The previously mentioned Danish study that detected a high rate of asymptomatics, offered home
sampling of first void urine. This approach takes into account the social reality of STDs in that it provides
anonymity and thus avoids stigmatisation. In addition, home sampling is very convenient. Sacrificing a
small amount of sensitivity for a two to threefold increase in partner participation rate warrants careful
consideration as a future option for contact tracing. The RIEGUM clinic has already secured funding for
home sampling and plans to offer this option in the second half of 2001 (Dr. Gordon Scott, personal
communication).

Estimating Reinfection Intervals for Chlamydia trachomatis
Modelling
Risk factor studies, both retrospective and prospective, are empirical and inductive. They try to infer from
data the traits and characteristics that make an individual member of the study population more likely to
get the disease in question. Provided the study population is representative, the findings can then be
extrapolated to a larger population and help in making the appropriate healthcare management decisions
to lower morbidity.
A different epistemiological approach to gain insight into disease patterns is mathematical model
building. During this rather deductive process, a model for the spread of disease within a population
through time is formulated after conceptual reflection and theoretical inquiry. One advantage is that any
assumption is made explicit and can be scrutinised carefully. The model is usually translated into a
computer simulation program and fed with starting values from empirical observations.
Mathematical modelling of STDs is fairly new (Anderson et al, 1991, Diekmann et al, 2000) and draws
on a variety of different disciplines, including the social sciences (Wasserman et al, 1994). A model can
be deterministic (Renshaw, 1991) or stochastic (Kretzschmar et al, 1996) and have virtually any degree of
complexity. The difficulty lies in reducing the complexity as much as possible while keeping it as close to
reality as possible. A model must not require estimation of more parameters than can sensibly be derived
from data (Garnett et al, 1996).
“Classic” deterministic models are often an extension of the old Lotka-Volterra predator-prey differential
equations (Lotka, 1925, Volterra, 1926) to accommodate host-parasites relationships (Renshaw, 1991).
Basically, infected and non-infected are seen as different compartments which are connected with each
other and have different influx and efflux rates.
Stochastic models also have different compartments for infected and non infected, but a transition matrix
of probabilities replaces fixed (“deterministic”) exchange rates (Kretzschmar et al, 1996).
Models can be expanded to account for the complexity of social networks within a population by splitting
the population into a high prevalence group, e.g. young, and a low prevalence group, e.g. old people
(Kretzschmar et al, 1996, Aral et al, 1999). Including social networks would account for the fact that
population dynamics does not merely consist of the sum of its individuals but includes the interactions
between them as well. As Koopman et al (1999) argues, this would take into account the “network” plane
of epidemiological data, i.e. the arrangement of and exchange between individuals, which is lost by
merely looking at the “individual” plane of “classic” epidemiological studies with exposure and outcome
variables per individual only.

Estimating Reinfection Intervals for Chlamydia trachomatis
One advantage of this “reality-in-a-test-tube” approach is that different intervention strategies can be
tested beforehand at low cost with different model parameters for e.g. disease prevalence or contact
tracing rate. Kretzschmar et al (1996) compared the effectiveness of different prevention and intervention
scenarios for gonorrhea and Chlamydia, including contact tracing, mass screening, screening of
subgroups and condom use.
In their simulations, they found that treatment of symptomatically infected and yearly screening of 20%
of women in age class 15-24 was most effective in reducing Chlamydia prevalence. Treatment of at least
50% of partners was necessary to reduce Chlamydia prevalence to a low level with good probability of
extinction (Kretzschmar et al, 1996). This shows how important contact tracing is for a long-term
extermination program.
It should not be ignored, however, that a lot of the data involved in building models, choosing parameters
and estimating starting values for simulations comes from different studies which are only related to each
other via ecological correlation. Nevertheless, epidemiological models can help to highlight limitations in
available information and to focus attention on what needs to be measured to better understand the
complexity of infectious diseases (Garnett et al, 1996).
Literature was reviewed using Medline (2000) and Web of Science (2000) up to July 2000 and hand
searching the journal Sexually Transmitted Infections up to September 2000. In addition, references were
given by Pamela Warner, Dr. Sheena Sutherland and Dr. John Young. Further references were then taken
from each article read. Keywords for online search were as follows:
Chlamydia specific:
Chlamydia trachomatis, Chlamydia, recurrence, recurrent infections, infection, reinfection.
Modelling:
stochastic/ deterministic/ theoretical model, sexually transmitted disease, simulation, Monte Carlo,
computer, network, Markov Chain, modelling.

Estimating Reinfection Intervals for Chlamydia trachomatis
III. Study Design
Introduction
This dissertation seeks to answer important issues surrounding Chlamydia reinfections in-patients of
GUM clinics. More specifically, based on descriptive analysis and regression methods, the probability of
reinfection within a time interval is estimated based on personal characteristics and testing history. This
predicted reinfection interval would help clinicians to make the right recommendations for their patients
and would also assist economists in making cost-benefit calculations for health service expenditures.
Study Population
The study cohort consists of all patients attending the Lothian GUM clinic between 1992 and May 2000.
The Lothian Health Board is responsible for the health care needs of about 773.800 people living in the
areas of East Lothian (89.600), Midlothian (80.900), West Lothian (153.100) and City of Edinburgh
(450.200) (GROSa, 2000). They make up about 15% of the total Scottish population of 5.120.000 people
(GROSa, 2000).
Data for this dissertation were derived from a review of Chlamdyia test records between January 1992
and May 2000 for all patients attending the Royal Infirmary of Edinburgh GUM clinic (RIEGUM), the
only one in Lothian. The clinic sees 9500 patients a year as of 1999-2000 (Dr. Gordon Scott, personal
communication). The test records are stored in the Medical Microbiology Laboratory (MML) database,
which is kept separate from the patients’ records database held at RIEGUM to ensure patients' anonymity.
Both databases can be record-linked. Data for this dissertation come from the MML database only, not
the RIEGUM database.
The Royal Infirmary also serves as an outreach clinic for prostitutes (HEBS, 1999). In addition, its
laboratories provide STD testing services for general practitioners (GPs) and family planning clinics. The
ratio of number of tests done between GUM and non-GUM settings was 7376:4588 between 1.5.1999 and
1.4.2000. Non-GUM patients were almost exclusively women (Dr. Sheena Sutherland, affil.). Among the
7376 GUM patients, 3528 (48%) were women. However, this dissertation's data exclude any tests from
GPs or other non GUM-settings.
Analysis of reinfection is further restricted to the subgroup of patients whose first positive test (=index
test) was between January 1992 and December 1997 to ensure that everyone had at least 2.5 years time
during which reinfections could be ascertained.

Estimating Reinfection Intervals for Chlamydia trachomatis
Routine Testing and Treatment Procedure
Patients coming to the RIEGUM clinic are given a unique patient identifier (UPI) at their first visit with
the intention that this will be used for all future visits. The RIEGUM database stores information on
name, date of birth (DOB), diagnosis, sex, ethnic group, postcode, reason for referral, occupational class,
marital status, contraceptive method used and number of regular/irregular partners. Completeness of this
data depends on a patient's cooperation and the comprehensiveness of a GP's referral. Unfortunately, the
RIEGUM data was not available for this study.
Usually, patients are offered tests for Chlamydia and gonorrhea, even if they came for testing a different
STD such as HIV. However, more Chlamydia than gonorrhea tests are made because of the convenience
of giving a urine sample for Chlamydia compared to invasive probing for gonorrhea (Dr. Gordon Scott,
personal communication). Specimens are then sent to the nearby MML where they get tested, usually on
the same day. Each laboratory test gets a unique laboratory identifier (ULI). Test results are crosschecked
by a senior scientific officer before being reported back to RIEGUM (Bruce Harris, personal
communication). The MML uses the same patient identifier as RIEGUM, which enables record-linkage
between both databases. Between January 1992 and August 1998 the large majority (98%) of Chlamydia
tests was done by growth of culture and was superceeded from September 1998 onwards by ligase chain
reaction (LCx) from Abbot Pharmaceuticals.
Patients are asked to come back after three days for the test results. In case of a positive test, they are
additionally contacted by phone and asked to come back for treatment. If treated, they are further invited
to return for a test of cure (TOC). The TOC should be made no sooner than four weeks after treatment.
The reasons for this are twofold. First, antibiotics need enough time to kill pathogens and an early TOC
could detect a bacterial population on the verge of eradication. Second, the new LCx tests are based on
detecting DNA and minute amounts of undegraded DNA from dead bacteria could give a false positive
result. This is likely to happen during the 2-3 weeks immediately after treatment.
Treatment follows the National Guideline for Chlamydia management (CEG, 1999) and consists of either
100mg Doxycycline twice a day for 7 days or a single 1000 mg dose of Acithromycine.
Reinfection Definition
“Reinfection” and “recurrence” are commonly used in literature to describe a repeated infection with the
same organism (Blythe et al, 1992, Fortenberry et al, 1999, Hillis et al, 1998, Hillis et al, 1994, Kjær et
al, 2000, Miller, 1998, Richey et al, 1999). “Recurrence” originally implied a repeated infection with the

Estimating Reinfection Intervals for Chlamydia trachomatis
same serovar, which could have been the result of either an incomplete cure (relapse) or an untreated
partner.
Here, reinfection is defined as the second positive test of a patient and “reinfection interval” describes the
time between the first and second positive test (fig. 2). An arbitrary number of negative tests may lie in
between. The reinfection interval cannot be estimated exactly, because the first and second infection are
likely to have occurred sometime before the tests by which each was detected.
In order to increase the probability of detecting new rather than uncleared previous (unresolved)
infections, the time between two successive positive tests had to be equal or greater than 30 days. In case
a patient tested positive within this 30-day interval, treatment failure was assumed and the next
subsequent positive test, if done, was chosen.
+index test
treatment
1st infection time
(test of cure)
-(negative test)
+
2nd infection=reinfection
2nd positive test (event)
time of infection
time of detection
reinfection interval, t ≥ 30 days
+-
Figure 2: Illustration of reinfection interval
Unresolved rather than true reinfections would be detected by a TOC about 2 months after treatment.
However, this largely depends on a healthy patient's cooperation and of all 7.766 patients with two or
more tests (total number of tests: 20.600), only 2106 tests were carried out within 2 months. In order to
make analysis easier, the stringent reinfection requirement of TOC used in prospective studies (Blythe et
al, 1992, Fortenberry et al, 1999, Kjaer et al, 2000) was relaxed and both, patients' compliance and
successful antibiotic treatment of first infection was assumed. 26 out of 34.754 patients had more than
one reinfection episode, i.e. 3 or more positive tests. Multiple reinfection events will be discussed later.
Covariates in a Study
Covariates are used in regression modelling as independent factors to explain variations in outcome. The
number of covariates that can be used in a regression calculation depends on the number of cases

Estimating Reinfection Intervals for Chlamydia trachomatis
available and a range of other factors. The event per variable (EPV) ratio should be higher if there are
small expected effects and dose-response gradients or if intercorrelations between variables or
appreciable measurement errors exist.
Intraclass correlations, effect modification and heterogeneity of effects can further complicate modelling
and may increase sample size needed (Camus, 2000). Unfortunately, a lot of these factors are not known
until after data collection. If the EPV ratio is too small, the algebraic model that is used in proportional
hazards regression might be unreliable and lead to spurious results (Concato et al, 1997), so inclusion of
too many covariates should be avoided.
One difficulty for this study lies in the nature of laboratory data: it hardly contains any behavioural
information on the patients other than GUM clinic visit patterns and the only physiological information
stored are sex and age. Although information on ethnic group, postcode, occupational class, marital
status, contraception used, number of regular and irregular partners is stored in the separate RIEGUM
database, that information was not available at the time of this study.
Here, covariates based on visit pattern and test outcome were extracted and are used in addition to sex,
age- and risk group. If too many variables are derived by indirect observations, they are likely to be
strongly correlated with each other. This poses a methodological problem for any regression and choice
of indirect covariates has to be carefully balanced. Details of covariates used are given in the next chapter.
The original study design consisted of an initial retrospective cohort study, with the intention of following
it with a modelling simulation. The cohort study seeks to estimate the median reinfection interval for
patients of GUM clinics and to assess the contribution of sex, age, risk group membership and GUM
clinic visit history to reinfection risk. In addition, primary reinfection intervals will be compared with
subsequent ones to see if they are different. Further, a comparison of diagnostic test performances tries to
find out whether the new LCx test method has an influence on the likelihood of a positive test outcome.
New DNA-amplification based tests are expected to pick up cases of infections that would have (false)
negatives under the older methods (Young et al, 1998). This has not been proven yet on a large
population level.
Finally, the modelling simulation would have to be built on the descriptive information of the data and
would evaluate the performance of different contact tracing strategies. Modelling the efficiency of contact
tracing strategies would have been done with Markov Chain Monte Carlo (MCMC) methods as
simulation algorithms using WinBugs (Gilks, et al, 1996, BUC/DEPICL, 2000). A fundamental
assumption is that the probability of an event is independent of event history (Markov property), i.e. the
probability for an individual testing positive for Chlamydia does not depend on the outcomes of previous
Chlamydia tests. In the event the cohort study only was available in the timeframe for the dissertation, the
simulations will be conducted at a later date.

Estimating Reinfection Intervals for Chlamydia trachomatis
IV. Methods
Estimation of Reinfection Intervals
Survival methods are used to estimate the time to reinfection and factors contributing to risk of
reinfection. They allow for incomplete observations and different starting points for observations through
time and record the time interval between start of observation and the event happening. In this context,
the statistical term “event” represents reinfection with Chlamydia and the term “survival” corresponds to
the time to event, not a patient’s actual survival.
“Censoring“ of observation happens in patients who either withdrew from study without having had the
event or who have had no event during the whole study period. Right censoring relates to withdrawal
from study, left censoring occurs when the starting point of a person's time-to-event is not precisely
known (Kleinbaum, 1995). This is the case for most survival studies involving infections: the exact time
of infection is never known, only the time of the first positive test.
Survival methods assume that entering or being withdrawn from follow-up in a study is unrelated to the
current hazard of the event happening (non-informative censoring), otherwise systematic inclusion or
withdrawal of high- or low-risk patients would bias the results (Bull et al 1997). However, if the event
occurred in a high-risk patient at the beginning of the study in 1992-93 and that person then had all
subsequent tests at a GP instead of the GUM clinic, the withdrawal was related to the reinfection hazard.
This situation cannot be controlled for with GUM clinic data only. Systematic withdrawal is termed
“informative right censoring”. “Informative left censoring” can happen if late arrivals into the study are
not at equal risk to those already under surveillance (non-informative late entry) (Bull et al 1997).
Because this study is based on routine data, there is no reason to believe otherwise.
Kaplan-Meier (KM) curves (survival curves) plot against time the probability that a study subject
survives, i.e. is event-free past a specified time (Kleinbaum, 1995). They are graphical representations of
life tables, which record the time between events and the proportion of event-free patients. The median
time-to-event, here median reinfection time, can be obtained graphically by looking at which time the
survival-probability equals 0.5, i.e. passes through y=0.5. This estimation is only reliable if the survival
curves falls rather steeply through y=0.5. KM curves can be plotted for different levels of a factor, e.g.
sex, and equality of survival distributions for the different levels can be tested with the logrank test (Bull
et al, 1997). It requires constant odds ratios of risk through time, i.e. constant slopes of survival curves. In
this study, the distributions between men and women, stratified for age, is compared.
Estimating Reinfection Intervals for Chlamydia trachomatis
To test the influence of more than one covariate on time-to-event, more complex methods have to be
chosen. Cox's proportional hazards regression model will be used to evaluate risk factors for reinfection.
A regression model looks at adjusted influences of specific factors on outcome and tries to predict (within
limits) the outcome for an individual with a certain set of characteristics. Cox’s proportional hazards
regression model is a technique that provides simultaneous estimates of hazard ratios in the presence of
multiple explanatory factors (Bull et al 1997). It is a semiparametric model and expresses the
instantaneous risk of an event occurring (=hazard) as a parametric function of the factors of interest
(covariates) multiplied with an underlying non-parametric baseline hazard function for the event. Time to
event models that permit analysis of multiple events per subjects (multistate hazard models), i.e. patients
with more than one reinfection, are currently topics of discussion in statistical research (Clayton, 1994,
Gordon Murray, personal communication) and will not be used here. In addition, standard statistical
software packages such as SPSS do not support them, yet. Therefore, only the first reinfection-event will
be used for survival analysis.
Cox’s regression model assumes that covariates (e.g. sex or age) have a multiplicative effect on the
hazard function and that the ratio of hazard functions for any two individuals will be constant through
time, i.e. the covariates included in the model are independent of time (proportional hazards). Cox’s
model does not make any assumptions about the underlying hazard functions other than being
proportional. To test the assumption of proportional hazards, one could build a more complex model with
a time dependent covariate and look whether the time dependent factor is significant or not. One could
also divide the time into different epochs, make a Cox’s regression for each single epoch and then check
whether the covariates’ coefficients differ markedly.
Fortunately, one can check the assumption of proportional hazards graphically with a “log(-log of
survival function)”-plot (LML-plot) against time for a number of subgroups defined by different
combination of covariates, which is the method of choice in this dissertation. If the assumption holds, the
plots should produce a number of parallel lines. First, a univariate LML plot has to be made for different
values of each single covariate involved in the selection process. This is followed by LML plots for all
different combinations of significant covariates. In case a covariate violates the assumption of
proportional hazards, the analysis can be split up into subanalyses, stratified for this covariate. It is also
informative at what period in time the assumption was violated.
Cox’s model also allows assessing the impact on time to an event of a particular covariate, adjusted for
the other covariates. For example, the influence of a patient's sex on reinfection risk can be assessed
independent of age.
Estimating Reinfection Intervals for Chlamydia trachomatis
Population and Covariates included in Cox's Regression
To enter the study, patients had to have a positive test between 1992 and 1997 and a subsequent negative
or positive test (n=1610). For reinfecteds, time to event (=reinfection) was calculated as: (“date of second
positive test” – “date of index test”), non-reinfected patients had their time to censoring calculated as:
(“date of last negative test” – “date of index test”). The subsequent positive test had to be more than one
month apart, which was not the case for 21 patients. 3 of these 21 patients had no more tests done and
were excluded. Another 3 of the 21 cases had a third positive test one or more months after the index test,
which was then taken to calculate the reinfection time. The remaining 15 patients were treated as having
had one positive and one or more negative tests, i.e. as not reinfected. This made a total of n=1607 cases
which corresponds to group D2 in figure 3 (appendix). The age distribution per sex of the 1607 patients
will be compared by a WRS-test with the remaining study population to see whether they are similar and
results can be extrapolated.
Agegroup and sex are extracted directly from the data. Agegroups are defined according to the agebands
used by ISD (ISD, 2000). Agegroup is used as a nominal instead of age as a continuous variable because
it is known that for men, Chlamydia incidence first rises with age and then decreases. This clearly violates
the assumption of linear effects on on hazard for a continuous variable. However, one must realize that
using several nominal variables instead of one continuous reduces the statistical power of a regression, so
their number should be minimized. The following agegroups are chosen: 15-19, 20-24, 25-34, ≥35. The
first three correspond to those chosen by ISD (2000), the fourth summarises the last two ISD-agebands.
Patients from the outreach clinic in Leith are prostitutes and have a certain letter in their UPI. As they
comprise a defined risk group, a binary variable called prost will be included in the analysis and set to
one if the patient is a prostitute. It is not clear, however, whether they are more at risk of acquiring a
STD since they can counteract this “occupational” risk by insisting on condom-use.
Trends of reinfection through time could be measured by including year of index case as a covariate. If
taken as a continuous variable, one assumes a linear effect on reinfection risk. It seems more likely,
however, that risk behaviour changed abruptly because of HIV and Safe Sex campaigns. Unfortunately,
there were no major campaigns in Lothian during the study period (Dr. Gordon Scott, personal
communication). Accounting for year of test without making invalid assumptions would require 6
additional nominal variables (1992-1997), at considerable cost to the statistical power of the study. It is
therefore not included. Year of test still is an important covariate in a study, especially if a shift in tests
towards amplification assays occurred during the study period.
Estimating Reinfection Intervals for Chlamydia trachomatis
One could also take year of first visit at the clinic as a behavioural covariate. It is not used here either for
the same reasons given for year of test.
People who come to a GUM clinic for the first time come for a reason, usually they had risked exposure
or have symptoms. In case of a symptomatic patient, the person will likely test positive on the first visit
and might be more careful in the future, thus increasing the interval to reinfection. On the other hand,
someone who tests negative on the first visit might get a complacent attitude towards sexual risk
behaviour and have a shorter reinfection interval. To test this, a binary variable will be included in the
regression (ta. 2). It is set to 1 if a reinfected patient had one or more negative tests prior to the index test.
Total number of clinic visits is not included as a covariate because in 66% of the cases with 3 or more
visits the additional visit(s) took place after the index case and would thus not be known beforehand,
which makes “number of visits” less suitable as a prognostic factor. It would also be strongly correlated
with a variable measuring prior negative tests, as the number of total visits rises with the likelihood of a
previous negative visit.
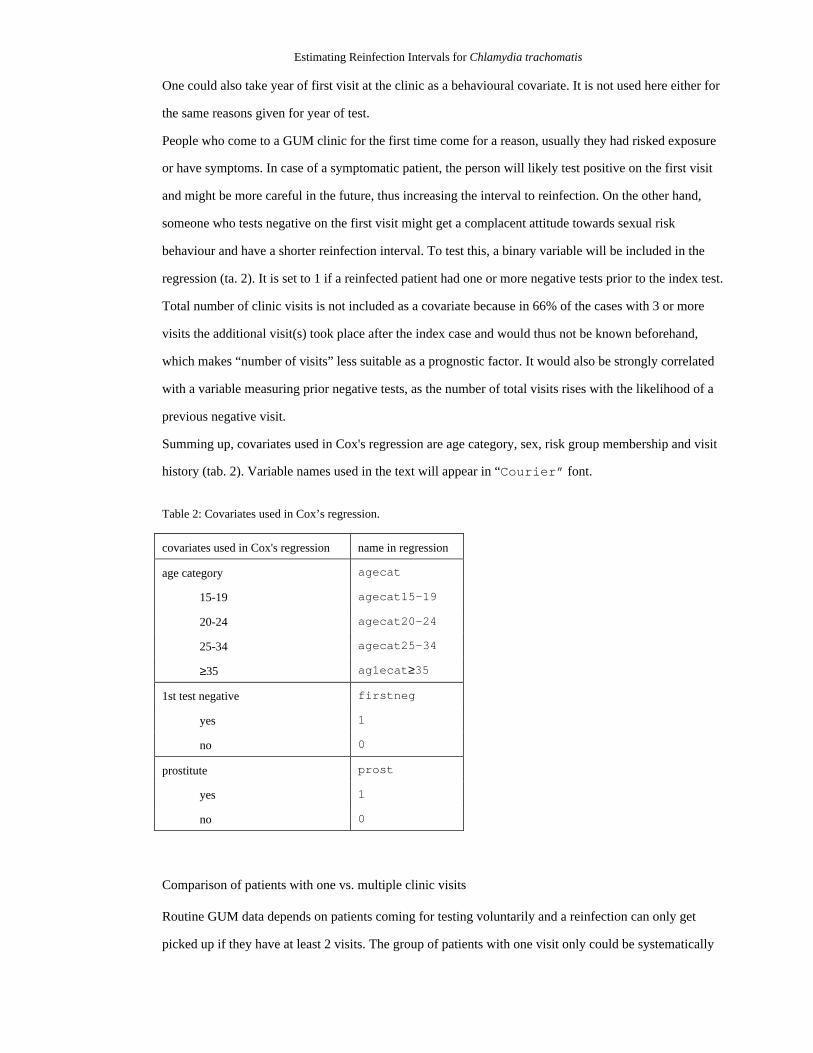
Summing up, covariates used in Cox's regression are age category, sex, risk group membership and visit
history (tab. 2). Variable names used in the text will appear in “Courier” font.
Table 2: Covariates used in Cox’s regression.
covariates used in Cox's regression name in regression
age category agecat
15-19 agecat15-19
20-24 agecat20-24
25-34 agecat25-34
≥35 ag1ecat≥35
1st test negative firstneg
yes 1
no 0
prostitute prost
yes 1
no 0
Comparison of patients with one vs. multiple clinic visits
Routine GUM data depends on patients coming for testing voluntarily and a reinfection can only get
picked up if they have at least 2 visits. The group of patients with one visit only could be systematically

Estimating Reinfection Intervals for Chlamydia trachomatis
different from the group with two or more visits, which would bias any results regarding reinfection
intervals.
To detect differences, the age at first visit of both sub-populations will be compared for each sex with a
Wilcoxon Rank Sum (WRS)-test, the null-hypothesis being that of no difference between the groups. The
non-parametric WRS test is chosen since the distribution of age per sex and patient group is not known.
Only patients who presented before 1998 will be chosen to allow everyone at least 2.5 years time to return
to the clinic.
Comparison of Multiple Reinfection Episodes
Cox's regression model described above was developed for non-repetitive events such as death. Multiple
events such as successive reinfections can not be included in basic Cox's regression analysis. In order not
to discard potentially useful information on reinfection, the length of subsequent reinfection intervals will
be compared with that of primary reinfection intervals.
A person with a Chlamydia reinfection might have become more responsible in his or her sexual risk
behaviour and have longer subsequent reinfection intervals. Alternatively, since Chlamydia is easily
cured with antibiotics, a person's perception of STDs might be that of a minor nuisance, conquered by
modern technology and intervals would shorten. Insight into these patterns could help targeting education
and screening efforts. Patients will be older at the second interval by definition, and should age be
associated with a decreased risk of reinfection, any secondary reinfection interval would thus tend to be
longer. Comparing the intervals of patients with multiple reinfections could pick up differences in length
of intervals between first and subsequent reinfections. Due to the low numbers of patients with more than
one reinfection episode (26 out of 34.754 patients), only first and second reinfection intervals will be
compared. Distribution of reinfection intervals is unknown, so a Wilcoxon signed rank test for paired
samples will be used. The nullhypothesis is that intervals of secondary reinfections do not differ from
those of the first. The age distribution per sex of the multiple-reinfection subgroup then has to be
compared by a WRS-test with the general study population to check generalisability.
Impact of increased test sensitivity
Given a constant risk of infection, incidence rates would go up automatically if a more sensitive test is
used and by only looking at the rates one would assume an increase of risk. With regard to the MML
Chlamydia data from 1992 to 2000, on September 1998 a switch in testing methods from culture to LCx
occurred. DNA amplification assays have a higher sensitivity compared to culture methods (Young et al,

Estimating Reinfection Intervals for Chlamydia trachomatis
1999) and thus incidence and reinfection rate would be expected to rise after September 1998 because of
the new test only. To check this on a large population scale, proportion of positive diagnoses for women
undergoing cervical smear tests will be compared by Chi-square-test one year before (group 1) and after
(group 2) the change in tests. The nullhypothesis is that both proportions are equal. Again, age will be
compared between both groups by a WRS-test to test their homogeneity.
Statistical Analysis
The estimation of reinfection intervals, the tests for comparison of patients with one vs. multiple clinic
visits, comparison of multiple reinfection episodes and increased test sensitivity will be made as described
above. They will be preceded by a descriptive analysis of the MML data.
First, general population characteristics of the test-based MML data will be given with respect to sex and
age of patients and compared to the composition of the general population in Lothian. Then, a pivot table
will describe the number of Chlamydia tests and their outcomes for each year, stratified by sex and
ageband. It is followed by graphs of the number of positive and negative tests per ageband, stratified by
sex and year of test. The graphs do not contain additional information, however, they help to better
visualise Chlamydia incidence per sex and ageband through time.
The sub population used in the survival analyses will then be described in more detail by giving the
proportion of patients reinfected within one, two and three years, stratified for sex and ageband. Finally, a
plot of the proportion of positives against age at testing for men and women will illustrate age trends in
infection between the sexes.
Estimating Reinfection Intervals for Chlamydia trachomatis
V. Data management
Data Cleaning
Data cleaning is an essential and often overlooked issue of epidemiological research. It describes the
techniques necessary to resolve inconsistencies within the dataset. In the case of retrospective studies
such as this one, data often come from routinely collected information over many years and one has
usually little control over the collection process. It cannot automatically be assumed that the dataset is
free of errors and inconsistencies. Systematic differences during the data collection may lead to recording
bias. Further, any loss of quality of the data weakens the statistical inferences drawn and might mask true
associations or create spurious ones between the variables of interest. Diagnostic errors are exceptionally
difficult to detect afterwards and only strict laboratory quality control can prevent them from happening
in the first place. Errors made during electronic data entry, e.g. regarding sex or DOB can show up as
inconsistencies if the false information on one record can later be matched through a database with that
from a correct one. Some errors happen because of poor design of report sheets or user interfaces. With
the growing number of retrospective studies based on electronic archives of patients' records and multi-
centre databases, data cleaning techniques will become more and more important.
Data storage system
From 1992 on, test results on all STD tests were kept electronically in a database. These records contain
the UPI, DOB, sex, location of specimen, date of sampling, date of testing, ULI, setting (RIEGUM, GP)
and comments with test results. Information on STDs other than Chlamydia and reason for visit for some
patients (e.g. termination of pregnancy, cervical cancer screening) were stored in the MML database but
were not extracted for this analysis.
Information regarding a patient's place of residence, ethnic group, occupational class, number of
regular/irregular sex partners, contraception used and marital status is not stored but could be retrieved by
record linkage from the RIEGUM database.
Multiple MML records can be crosslinked via UPIs to create summary reports, e.g. on all Chlamydial and
gonococcal tests an individual has had (Bruce Harris, personal communication).
Estimating Reinfection Intervals for Chlamydia trachomatis
Data extraction and cleaning
MML test records are stored in two different databases, one for tests done before summer 1998 (40716
records) and one for tests done thereafter (8175 records). Data for this study have been extracted from
both systems into two Microsoft Access files. The database system used in this dissertation was
FilemakerPro 4.0 for Macintosh. Both files were transferred from Access to FilemakerPro via DBF 4.0
format, which is supported by both programs. Data transfer consistency has been checked by comparing
total tests done, total number of females and total number of males.
Minor adjustments had to be made to the original data. The old MML database system allowed for
multiple comments per entry and each extra line of comment created an additional record if exported to
Access. This led to several entries (1.273 of 40.716) with the same laboratory identifier, violating its
uniqueness. After manual elimination of records with duplicate ULIs, both data files were concatenated
and resulted in 47.618 entries (40.716+8.175-1.273). Result and type of test were extracted from the
comment field into new variables. Age at test was calculated by subtracting DOB from date of test. For a
table of variables in the database, refer to table 3 (appendix).In summer 1998, MML switched to a new
database system
One problem were records with the same patient identifier, but different DOB (351) and/or sex (53), i.e.
tests seeming to be of the same patient, but discordant as to DOB or sex (400 of 47.618/ 0.8%). Some
DOB-differences (124) were of typographical nature, where e.g. a “3” in one record became an “8” in
another or a “1” became a “7”. Only one digit in either day, month or year was discordant. Other records
(227) had completely different DOBs with different day, month and year. Here, either DOB was correct
and the UPI was incorrectly read from the request form (appendix, fig. 4.1), so a genuinely different
person was tested. Alternatively, a flaw in the user interface could have lead to the same person getting a
wrong DOB: usually, UPI, DOB and sex have to be entered by a lab technician. If only UPI is entered,
DOB and sex of the previously entered patient remains on the screen and is, erroneously, used. A higher
proportion of these non-typographical errors occurred after the database switch in summer 1998
(appendix, fig. 5), maybe because records prior to the switch were not accessible from the new database
and thus proofreading was not possible. Errors also doubled from the third quarter 1997 onwards, maybe
due to a change in data entry staff. However, the more tests per UPI are made and the larger a database is,
the more likely these errors can arise.
Typographical DOB conflicts were resolved “democratically“ with the DOB of the majority of records
with the same UPI overruling the discordant record. If there were only two records with the same UPI
Estimating Reinfection Intervals for Chlamydia trachomatis
(95), DOB of that patient was looked up at the original MML database, which included patient entries
other than that for Chlamydia. If there were no further entries, the later test was not used.
For records with same UPIs but completely different DOBs, those in the minority were excluded. In case
of a draw, the later presentation was excluded. A total of 227 tests have been excluded from analysis this
way. This might have introduced bias and will be discussed later.
Records with conflicting sex (53 of 400) were treated differently. The request sheet that accompanies
each specimen when it arrives at the lab has two fields for sex, male and female which lie close together
and by circling the field hastily or carelessly, the wrong field can easily be indicated. Fortunately, UPIs
consist of a letter and a four-digit number. 9 of 11 letters code for either male or female, so all except 12
sex-conflicts could be resolved with the UPI-keys (Bruce Harris, personal communication).
Some records had internal inconsistencies such as men with cervical swabs. However, the location-field
on the request form had the boxes for “urethra” and “endocervix” next to each other (appendix, fig 4.2),
so a hastily filled out form might have resulted in the wrong box indicated. These inconsistencies were
ignored, because “location of specimen” was not used in the analysis. Records with Chlamydia tests for
eyes (n=29) were excluded from analysis, since they were unlikely to be transmitted sexually. Altogether,
256 out of 47618 records (0.5%) were excluded.
It is important to remember that each record comprised one test, so the original per-test database had to be
converted into a per-patient database for further analysis. In the latter, each record corresponds to one
patient (UPI) with additional information such as total number of tests, test outcomes, number of positive
and negative results or interval between first positive test and second positive test. Extracts from the total
dataset were made for the individual statistical analysis.

Estimating Reinfection Intervals for Chlamydia trachomatis
VI. Results
Descriptive Analysis
The age distribution of patients visiting the RIEGUM clinic differs for men and women (fig. 6.1). In both
sexes, there were very few patients under 15 years of age, but apart from this, female patients were much
more likely to be under 25 years (53% of women patients compared to 32% of men). Men dominated the
25+ agebands.
Age distribution for men and women
0
2000
4000
6000
8000
10000
12000
ageband
menwomen
men 23 1331 6610 10734 4093 1699
women 132 3812 7681 7472 2100 626
0-14 15-19 20-24 25-34 35-44 45-100
Figure 6.1: Number of total Chlamydia tests for men (blue) and women (red) for each age category.
Figure 6.2 compares the relative proportion of men and women in different agebands between the
RIEGUM clinic population and the general Lothian population (GROSa, 2000). People between 15-29
dominate the sexually active population in Lothian, they are about three times more abundant in the
RIEGUM data set than in the general population.

Estimating Reinfection Intervals for Chlamydia trachomatis
Proportion of men and women per ageband compared between Lothian and RIEGUM population
0,0%
10,0%
20,0%
30,0%
40,0%
50,0%
60,0%
70,0%
80,0%
0-14 15-29 30-44 45-59 60-74 75 &over
ageband
men (Lothian)men (RIEGUM)women (Lothian)women (RIEGUM)
Figure 6.2: Comparison of relative age distribution between the RIEGUM clinic population and the general Lothian
population.
The pivot table lists the number of men testing positive or negative and the number of women testing
positive or negative for each year between January 1992 and May 2000 (appendix, tab. 4). The numbers
are further given separately for the different age-categories. The categories were set according to those
used in ISD publications, however with categories 45-64 and ≥65 put together (ISD, 2000). A total of
47589 Chlamydia tests were done in that period. Only 47305 records are given in the pivot table because
few tests had no sex (12) and/or no DOB (51) or were marked having unreliable results in the MML
database (223).
In order to get a better overview, the “outcome per ageband“ information is summarised for the years
1992 - 1999 in figure 7 on a semi-log scale, where the average number of positive and negative test
outcomes in men and women including standard deviation is given for each ageband. Note that number of
tests is plotted on a log-scale so that agebands with low numbers (0-14) and high numbers (25-34) can be
displayed on the same graph.
Standard deviation is chosen as dispersion measure because the sample comprises the entire study
population. It can be seen that negative tests always outweigh positive tests in both sexes and all
agebands. The number of positive cases for women is greater than that in men in the 15-19 ageband,
about the same in the 20-24 ageband and consistently lower in the upper agebands.

Estimating Reinfection Intervals for Chlamydia trachomatis
men+
men-
women+
women-
0-14 15-19 20-24 25-34 35-44 45-1000,1
1
10
100
1000
2000
ageband
Figure 7: Tests per ageband and sex. Summary of the information of table 4 (pivot table). The 8 years 1992-1999
were combined to give the average number of positive and negative Chlamydia tests for men (dark and light blue)
and women (dark and light red) per ageband. Graph includes standard deviation (black error bars). Number of tests is
given on a logarithmic scale.
Figures 8.1-8.4 (appendix) contain the same information given in the pivot table, but in a different
arrangement. Here, the number of men and women testing positive or negative are displayed per ageband
on a timescale from 1992 to 1999 to look at trends in infections during that period. Although it is a bit
difficult to compare graphs on a semi-log scale, it can be seen clearly that women have consistently more
positive cases than men in the 15-19 ageband and less in the 25-34 and 35-44 ageband. With regard to test
outcomes in the 20-24 ageband, men and women are virtually indistinguishable. It can further be seen in
the graphs that the number of men and women testing positive increased from 1997 onwards, but so did
the number of men and women testing negative.
Table 5 describes the population used in the survival analysis (group D2 in appendix, fig. 3) with regard
to reinfection within one, two, three and four or more years. The total number and proportion of
reinfected men and women is given four age-categories. The categories used here differ slightly from the
six used above, in that the first (0-14) is omitted and the last two (35-44, ≥45) are combined.

Estimating Reinfection Intervals for Chlamydia trachomatis
Group men:15-19 and group women:≥35 contain less than 30 cases, so their results have to be treated
with caution. In the other agegroups, proportion of reinfected within one year is between 2.0% and 4.8%
for men and 3.2% and 8.8% for women. The women:15-19 group has the highest proportion (8.8%) of
reinfected within one year. Within three years, 7.7% of men between the age of 20-24 and 12.5% of
women between 15-19 become reinfected with Chlamydia.
Table 5: Reinfection status after one, two, three and four or more years per sex and agegroup for the population used
in the survival analyses.
Reinfected within
sex, age patients one year two years three years four or more years
Men
15-19 27 1 (3,7%) 1 (3,7%) 2 (7,4%) 3 (11,1%)
20-24 309 15 (4,8%) 20 (6,4%) 24 (7,7%) 30 (9,7%)
25-34 445 18 (4,0%) 24 (5,3%) 26 (5,8%) 37 (8,3%)
35-100 97 2 (2,0%) 4 (4,1%) 4 (4,1%) 5 (5,1%)
total 878 36 (4,1%) 49 (5,6%) 56 (6,4%) 75 (8,5%)
Women
15-19 136 12 (8,8%) 15 (11,0%) 17 (12,5%) 19 (14,0%)
20-24 358 14 (3,9%) 15 (4,1%) 15 (4,2%) 18 (5,0%)
25-34 214 7 (3,2%) 8 (3,7%) 9 (4,2%) 11 (5,1%)
35-100 21 1 (4,7%) 1 (4,7%) 1 (4,7%) 1 (4,8%)
total 729 34 (4,6%) 39 (5,3%) 42 (5,8%) 49 (6,7%)
In figure 9, the proportion of women and men testing positive is plotted against age at infection to look at
trends between the sexes. Proportion of positives under 16 years is unreliable because of the low total
number of test done. For both sexes, there is an overall decrease from 15% down to 0-3%. 17-year-old
women (14.7%) have four percent points more positive tests than men (10.6%) of that age. Both sexes are
roughly equal with 18, and from 22 years on men have consistently 2-4 percent points more positive tests
than women.

Estimating Reinfection Intervals for Chlamydia trachomatis
Proportion of positive test outcomes per sex and age
0,0%
5,0%
10,0%
15,0%
20,0%
10 20 30 40 50 60
age
MenWomen
Figure 9: Proportion of men and women tested positive plotted against age.
Hypothesis Testing
Survival Analysis
The age distribution of men and women in the sub-population used for the survival analyses was
significantly different from that of the general GUM population (p<0.0001 for men and women). Median
age of men was 25.3 compared to 28.2 in the general population, 21.6 years compared to 24.8 for women
(tab. 6).
Table 6: Results of testing the nullhypothesis that the age distribution is the same for men and women in the survival-
study population compared to the general population.
survival-studypop.
remainingpopulation
Z value of 2 tailedWRS-test
2-tailedsignificance
number of men 878 10956 -11.6 <0.0001
median age 25.3 28.2
number of women 729 9866 -14.3 <0.0001
median age 21.6 24.8
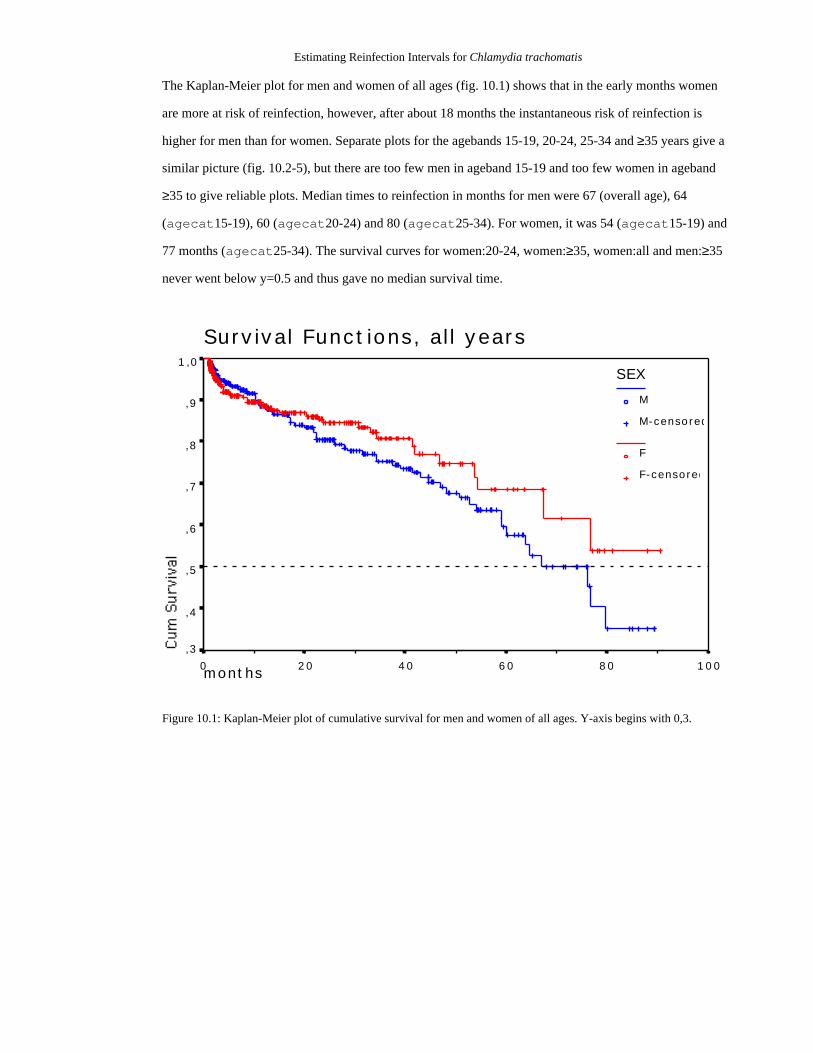
Estimating Reinfection Intervals for Chlamydia trachomatis
The Kaplan-Meier plot for men and women of all ages (fig. 10.1) shows that in the early months women
are more at risk of reinfection, however, after about 18 months the instantaneous risk of reinfection is
higher for men than for women. Separate plots for the agebands 15-19, 20-24, 25-34 and ≥35 years give a
similar picture (fig. 10.2-5), but there are too few men in ageband 15-19 and too few women in ageband
≥35 to give reliable plots. Median times to reinfection in months for men were 67 (overall age), 64
(agecat15-19), 60 (agecat20-24) and 80 (agecat25-34). For women, it was 54 (agecat15-19) and
77 months (agecat25-34). The survival curves for women:20-24, women:≥35, women:all and men:≥35
never went below y=0.5 and thus gave no median survival time.
Survival Functions, all years
months 100806040200
1,0
,9
,8
,7
,6
,5
,4
,3
SEX
M
M-censored
F
F-censored
Figure 10.1: Kaplan-Meier plot of cumulative survival for men and women of all ages. Y-axis begins with 0,3.

Estimating Reinfection Intervals for Chlamydia trachomatis
months
Survival Functions, 15-19 years
100806040200
1,0
,8
,6
,4
,2
0,0
SEX
M
M-censored
F
F-censored
Figure 10.2: Kaplan-Meier plot of cumulative survival for men and women between 15 and 19 years.
months
Survival Functions, 20-24 years
100806040200
1,0
,8
,6
,4
,2
0,0
SEX
M
M-censored
F
F-censored
Figure 10.3: Kaplan-Meier plot of cumulative survival for men and women between 20 and 24 years.

Estimating Reinfection Intervals for Chlamydia trachomatis
months
Survival Functions, 25-34 years
100806040200
1,0
,8
,6
,4
,2
SEX
M
M-censored
F
F-censored
Figure 10.4: Kaplan-Meier plot of cumulative survival for men and women between 25 and 34 years, y-axis begins
with 0,2.
months
Survival Functions, ≥35 years
100806040200
1,0
,9
,8
,7
,6
,5
,4
SEX
M
M-censored
F
F-censored
Figure 10.5: Kaplan-Meier plot of cumulative survival for men and women 35 years and older, y-axis begins with
0,4.

Estimating Reinfection Intervals for Chlamydia trachomatis
The logrank test was used to check equality of survival distribution between men and women in the
different agebands (tab. 7). Only in the 20-24 ageband a significant difference was detected.
Table 7: Logrank tests to test equality of survival distributions between man and women. Tests are made for all ages
and each individual age-category.
agecategory
sex median time toreinfection (months)
number ofreinfections
numbercensored
Log Rank significance
15-19 men 64 3 24
women 54 19 117
0,32 0,5720
20-24 men 60 30 279
women # 18 340
4,66 0,0309
25-34 men 80 37 408
women 77 11 203
1,09 0,2974
35-100 men # 5 92
women # 1 20
0,00 0,9867
all men 67 75 803
women # 49 680
1,07 0,3002
# survival curve (survival probability) did not fall below 0,5
Frequencies for covariates used in the Cox's regression are given in table 8. 10% of all study subjects are
between 15 and 19 years old, 41% between 20-24 and 25-34, 8% are ≥35. 12% had a negative test before
the index test and 0.7% are prostitutes.

Estimating Reinfection Intervals for Chlamydia trachomatis
Table 8: Covariates used in Cox’s regression.
covariates used in Cox's regression name in regression
age category Women Men total agecat
15-19 136 27 163 agecat15-19
20-24 358 309 667 agecat20-24
25-34 214 445 659 agecat25-34
≥35 21 97 118 agecat≥35
1st test negative firstneg
yes 89 108 197 1
no 640 770 1410 0
prostitute prost
yes 10 1 11 1
no 719 877 1596 0
The LML plots for sex (fig. 11.1) and firstneg (fig. 11.2) have non-parallel curves, the plot for
prost has one curve only (fig 11.3). The LML plot for agebands has parallel lines except for
agecat≥35 (fig. 11.4).
LML Function at mean of covariates
100806040200
1
0
-1
-2
-3
-4
-5
-6
SEX
M
F
Figure 11.1: Log-minus-Log plots to check proportional hazards assumption for covariate sex.

Estimating Reinfection Intervals for Chlamydia trachomatis
LML Function at mean of covariates
100806040200
1
0
-1
-2
-3
-4
-5
-6
FIRSTNEG
1
0
Figure 11.2: Log-minus-Log plots to check proportional hazards assumption for covariate firstneg.
LML Function at mean of covariates
100806040200
0
-1
-2
-3
-4
-5
Figure 11.3: Log-minus-Log plots to check proportional hazards assumption for covariate prost.
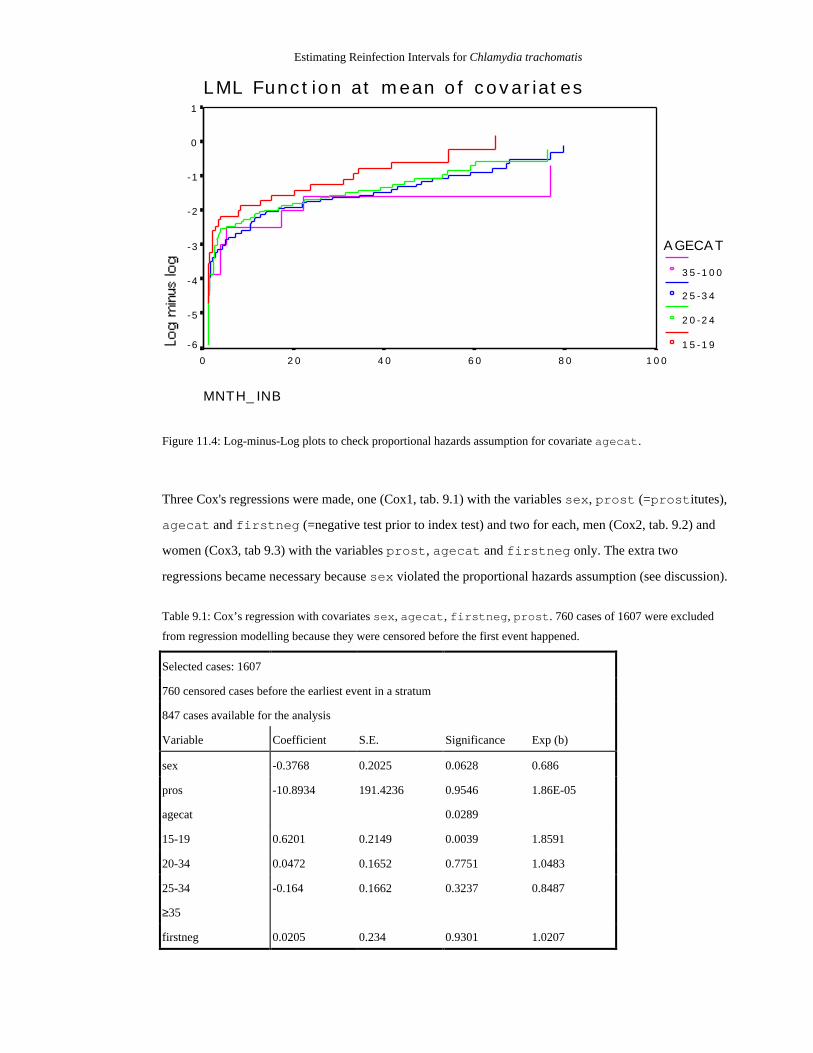
Estimating Reinfection Intervals for Chlamydia trachomatis
AGECAT
35-100
25-34
20-24
15-19
LML Function at mean of covariates
MNTH_INB
100806040200
1
0
-1
-2
-3
-4
-5
-6
Figure 11.4: Log-minus-Log plots to check proportional hazards assumption for covariate agecat.
Three Cox's regressions were made, one (Cox1, tab. 9.1) with the variables sex, prost (=prostitutes),
agecat and firstneg (=negative test prior to index test) and two for each, men (Cox2, tab. 9.2) and
women (Cox3, tab 9.3) with the variables prost, agecat and firstneg only. The extra two
regressions became necessary because sex violated the proportional hazards assumption (see discussion).
Table 9.1: Cox’s regression with covariates sex, agecat, firstneg, prost. 760 cases of 1607 were excluded
from regression modelling because they were censored before the first event happened.
Selected cases: 1607
760 censored cases before the earliest event in a stratum
847 cases available for the analysis
Variable Coefficient S.E. Significance Exp (b)
sex -0.3768 0.2025 0.0628 0.686
pros -10.8934 191.4236 0.9546 1.86E-05
agecat 0.0289
15-19 0.6201 0.2149 0.0039 1.8591
20-34 0.0472 0.1652 0.7751 1.0483
25-34 -0.164 0.1662 0.3237 0.8487
≥35
firstneg 0.0205 0.234 0.9301 1.0207
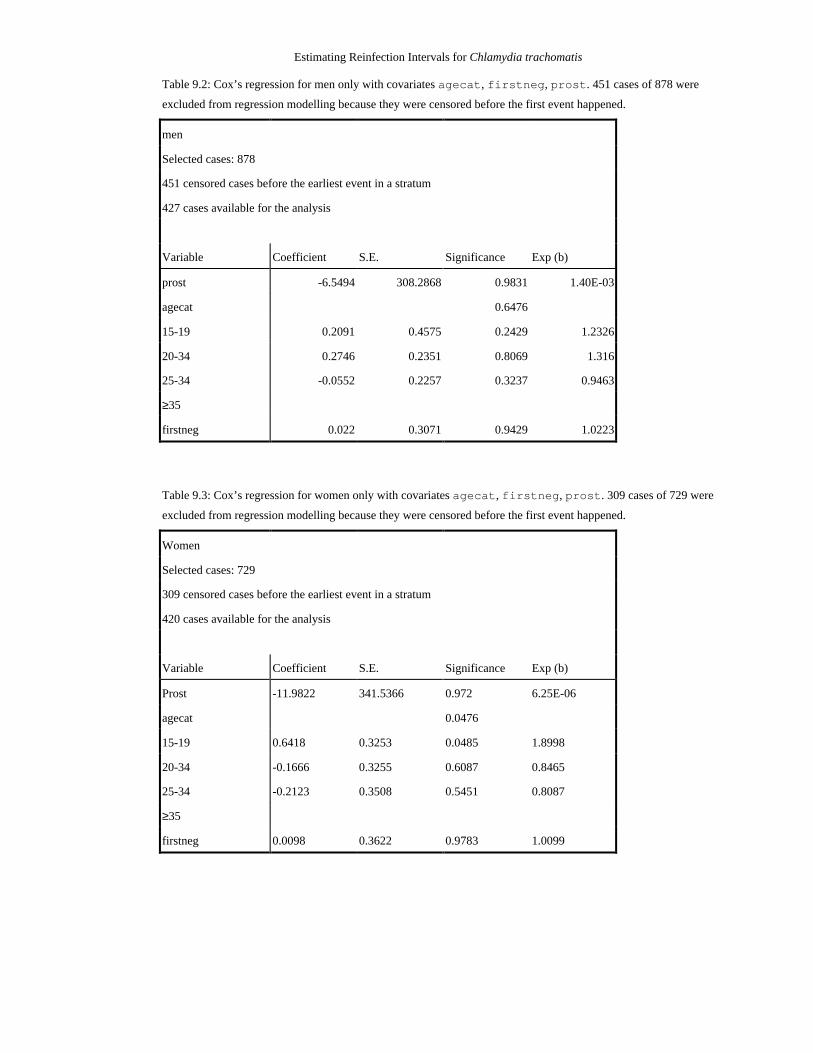
Estimating Reinfection Intervals for Chlamydia trachomatis
Table 9.2: Cox’s regression for men only with covariates agecat, firstneg, prost. 451 cases of 878 were
excluded from regression modelling because they were censored before the first event happened.
men
Selected cases: 878
451 censored cases before the earliest event in a stratum
427 cases available for the analysis
Variable Coefficient S.E. Significance Exp (b)
prost -6.5494 308.2868 0.9831 1.40E-03
agecat 0.6476
15-19 0.2091 0.4575 0.2429 1.2326
20-34 0.2746 0.2351 0.8069 1.316
25-34 -0.0552 0.2257 0.3237 0.9463
≥35
firstneg 0.022 0.3071 0.9429 1.0223
Table 9.3: Cox’s regression for women only with covariates agecat, firstneg, prost. 309 cases of 729 were
excluded from regression modelling because they were censored before the first event happened.
Women
Selected cases: 729
309 censored cases before the earliest event in a stratum
420 cases available for the analysis
Variable Coefficient S.E. Significance Exp (b)
Prost -11.9822 341.5366 0.972 6.25E-06
agecat 0.0476
15-19 0.6418 0.3253 0.0485 1.8998
20-34 -0.1666 0.3255 0.6087 0.8465
25-34 -0.2123 0.3508 0.5451 0.8087
≥35
firstneg 0.0098 0.3622 0.9783 1.0099
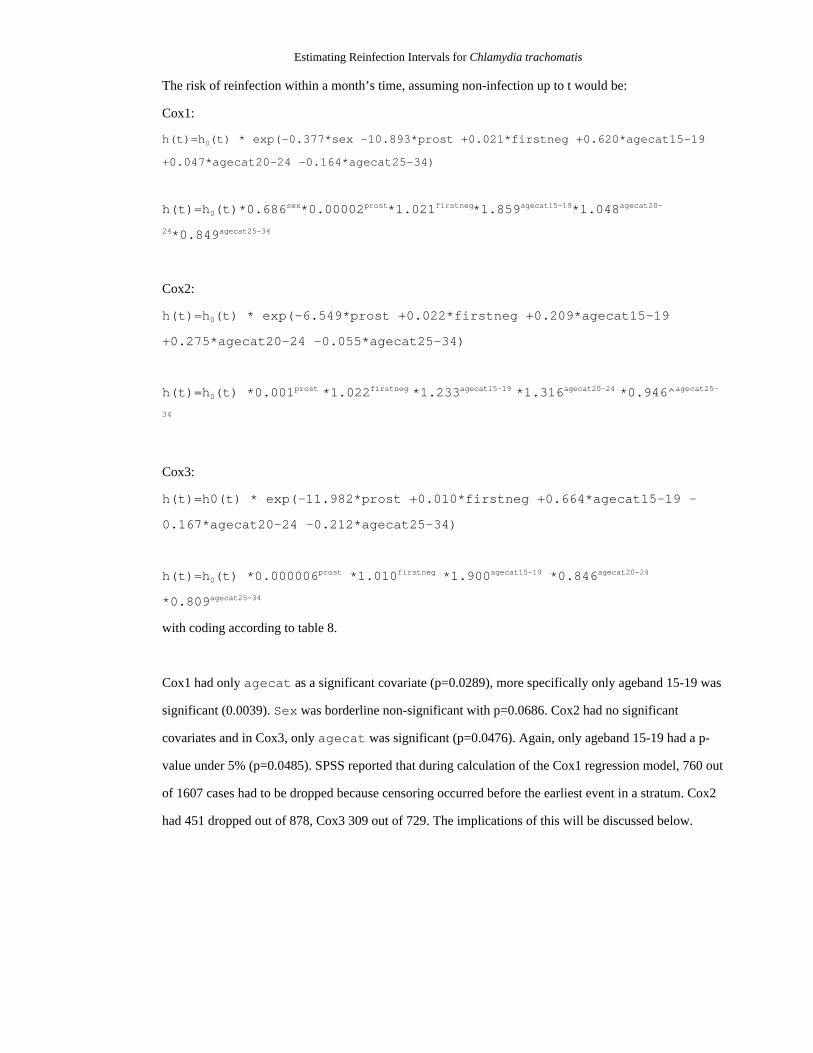
Estimating Reinfection Intervals for Chlamydia trachomatis
The risk of reinfection within a month’s time, assuming non-infection up to t would be:
Cox1:
h(t)=h0(t) * exp(-0.377*sex -10.893*prost +0.021*firstneg +0.620*agecat15-19
+0.047*agecat20-24 -0.164*agecat25-34)
h(t)=h0(t)*0.686sex*0.00002prost*1.021firstneg*1.859agecat15-19*1.048agecat20-
24*0.849agecat25-34
Cox2:
h(t)=h0(t) * exp(-6.549*prost +0.022*firstneg +0.209*agecat15-19
+0.275*agecat20-24 -0.055*agecat25-34)
h(t)=h0(t) *0.001prost *1.022firstneg *1.233agecat15-19 *1.316agecat20-24 *0.946^agecat25-
34
Cox3:
h(t)=h0(t) * exp(-11.982*prost +0.010*firstneg +0.664*agecat15-19 -
0.167*agecat20-24 -0.212*agecat25-34)
h(t)=h0(t) *0.000006prost *1.010firstneg *1.900agecat15-19 *0.846agecat20-24
*0.809agecat25-34
with coding according to table 8.
Cox1 had only agecat as a significant covariate (p=0.0289), more specifically only ageband 15-19 was
significant (0.0039). Sex was borderline non-significant with p=0.0686. Cox2 had no significant
covariates and in Cox3, only agecat was significant (p=0.0476). Again, only ageband 15-19 had a p-
value under 5% (p=0.0485). SPSS reported that during calculation of the Cox1 regression model, 760 out
of 1607 cases had to be dropped because censoring occurred before the earliest event in a stratum. Cox2
had 451 dropped out of 878, Cox3 309 out of 729. The implications of this will be discussed below.

Estimating Reinfection Intervals for Chlamydia trachomatis
Patients with one vs. multiple clinic visits
Men and women going to the clinic once differ statistically significant in age from those going twice or
more (tab. 10).
Table 10: Results of testing the nullhypothesis that men and women with one visit have the same age-distribution asthose with two or more visits.
patients with 1visit only
patients with 2+visits
Z value of 2 tailedWRS-test
2-tailedsignificance
Number of men 8666 3168 -4.58 <0.0001
Median age 28.1 27.4
Number of women 7687 2908 -12.8 <0.0001
Median age 25.0 23.4
Multiple Reinfection Episodes
The data shown in table 11 are consistent with the nullhypothesis of no difference between first and
second reinfection interval (p=0.919, WRS). However, the age distribution between the general GUM
population and patients with multiple reinfection intervals is significantly different. Men and women with
multiple reinfections tend to be younger than the general GUM population (tab. 4).
Table 11: Results of testing the nullhypothesis that the durations of first and second reinfection intervals are the same.Also given is the result of testing whether the age distribution of men and women in the preceding test is differentfrom that of the other GUM clinic patients.
Wilcoxon matched-pairs Signed Rank Test of first and second reinfection interval (n=21)
1st longer than 2nd 12
2nd longer than 1st 9
Z-score -0.42
2 tailed sign. 0.9199
age comparison with general study population
multiple reinf.pop.
remainingpopulation
Z value of 2 tailedWRS-test
2-tailedsignificance
number of men 15 11819 -3.34 0.0008
median age 22.7 27.9
number of women 4 10591 -2.1 0.0375
median age 18.5 24.5

Estimating Reinfection Intervals for Chlamydia trachomatis
Increased test sensitivity
The data are incompatible with the nullhypothesis that type of test used makes no difference in proportion
of positives detected for cervical swab specimens. Cervical swab specimens of women are more likely to
test positive for Chlamydia if an LCx test (proportion positive: 0.124) is used instead of a culture test
(proportion positives: 0.061), with the ratio between proportions being 1.91 (95% CI: 1.85-1.96, tab. 12).
Table 12: Comparing LCx tests with culture tests. Results of testing the nullhypothesis that proportion of positivediagnoses in cervical swab testing is the same regardless of test used (LCx, culture). Also given are the odds ratio andits confidence interval and the result for testing the nullhypothesis of equal age distribution between both test groups.
negative results positive results total proportion ofpositives
Culture 2175 134 2309 6.10%
LCx 1462 182 1644 12.40%
Total 3637 316 3953
Chi-square: 35.5
Significance (df1): <0.00001
Odds ratio ofproportionsLCx:culture (95% CI)
1.91 (1.54-2.36)
age comparison patients withculture test
patients with LCxtest
Z value of 2 tailedWRS-test
2-tailedsignificance
Number of women 2309 1644 -1.1 0.2635
median age 24.7 24.7
Estimating Reinfection Intervals for Chlamydia trachomatis
VII. Discussion
Aim of the Dissertation
Chlamydia trachomatis infections are a serious burden of disease in the UK (Paavonen et al 1996, CMO,
1997) and recently considerable resources have been directed towards a national screening pilot program
(Department of Health, 2000). With a sensitive and specific diagnostic test and a efficient treatment at
hand, the disease is controllable from an individual-centred medical perspective, patients “just” have to
get treated. However, from a population based public health perspective, the disease has escaped control,
as Chlamydia incidence is rising (ISD, 2000).
Some of the more serious sequelae such as ectopic pregnancy, chronic inflammation and infertility have
been associated with reinfection (Hillis, 1997). Reinfection with Chlamydia is a sign of inadequate
control measures at both the individual level, because of high-risk behaviour and inadquate health
education, and at a population level, because of inefficient screening and contact tracing strategies.
Despite many studies on reinfection risk and intervals (table 1.2), some results are contradictory and
others only apply to women. In addition, only one (Pimenta et al, 2000) out of 11 reinfection studies took
place in the UK (table 1.2), yet even the most recent report on the national screening pilot study (Tobin et
a., 2000) leaves the question of reinfection intervals unanswered.
The availability of large hospital and laboratory based datasets covering several years allow researchers to
relate clinical outcomes to risk factors and time. The primary objective of the dissertation was to give an
estimation of Chlamydia reinfection intervals for GUM clinic patients, based on routine laboratory test
results. Reinfection intervals help clinicians to decide when a patient should come back for testing and
assist health economics in allocating appropriate funding for health care. Being the only GUM clinic in
Lothian, the Royal Infirmary serves a population of 773.800 people (GROSa, 2000) and routine
laboratory data from January 1992 to May 2000 were available for this task.
Secondary objectives were the analysis of multiple reinfections and the impact of a change in test
methods on routine data. Finally, another aim of this study was to identify suitable methods applicable to
routine data in order to maximise the benefit of legacy data of other health boards. If the same kind of
information from other health boards were to be evaluated in a similar way, comparisons between health
boards across Scotland would be possible. Any systematic differences found could suggest factors that
may be implicated in infection and reinfection.

Estimating Reinfection Intervals for Chlamydia trachomatis
Design of the Study
Reinfection is characterised by multiple events through time, so a cohort study design had to be chosen.
Cross-sectional studies only give point estimates of prevalences and associations of exposure with
disease, but lack any insights into temporal associations between exposure and disease (Hennekens et al
1987). Cohort studies are observational, exposure to risk factors are recorded through time and are
compared with disease-status at the end of the study. Prospective cohorts are expensive to set up and take
the whole study period to complete. However, they provide strong causal evidence for links between
disease and exposure, as most factors involved can be controlled for right from the beginning, and the
study is “tailor-made” to answer the topic under investigation. Retrospective cohorts on the other hand are
much cheaper and faster to complete, since they utilise data that had been collected already. However,
many such studies rely on information that has been gathered on a routine basis, and not to answer a
particular research question. Factors important to the current research project might not have been
collected and the relevant data are irrecoverable since any event took place in the past and not
concurrently. The people who collected the data and those who analyse them are usually different, so
great care has to be taken that all important information regarding collection is communicated to those
involved in analysis.
Here, the cohort consisted of the patients visiting the RIEGUM clinic between January 1992 and May
2000, exposure variables recorded were sex, age, risk group, date of test and testing history, disease
(event of interest) was defined as “reinfection with Chlamydia”.
Sources of Bias
A major source of bias for retrospective cohort studies is selection bias, since entry into the study
population can neither be randomized nor controlled for retrospectively and baseline characteristics of the
study population might no longer be available. Considering the nature of the disease, primarily
symptomatic patients will come forward for testing, and they might be physiologically different from the
rest of the population. Ideally, everyone would go to the clinic, but given the stigma of a sexually
acquired disease, this is not the case and a GUM patient population might differ from the normal
population, e.g. in socioeconomic status, as well as in subtle characteristics of sexual attitude and
behaviour. For this study, apart from sex and age, no personal characteristics were available.
38% of the Chlamydia tests done by the MML (estimation based on interval 1.5.1999 - 1.4.2000) were for
GPs and not the RIEGUM clinic, so the GUM clinic study population excludes the group of patients who
rather go to their GP for STD-testing. However, in Lothian, most patients testing positive for Chlamydia
Estimating Reinfection Intervals for Chlamydia trachomatis
are referred to the RIEGUM clinic by their GPs for treatment and contact tracing (Louise Shaw, personal
communication). Contacts who are traced will be seen at the GUM clinic, however, GPs may give
patients they treat a second dose of antibiotics to give to their partner, i.e. a proportion of cases might be
cured without ever being tested (Dr. Sheena Sutherland, affil.). It is still important to point out that any
results reported here are only applicable to GUM clinic patients.
Also, by design, only reinfection episodes within a maximum interval of 8 years could have been
detected.
Another selection bias could have been introduced by excluding 227 patients because of their conflicting
DOB. If these errors occurred in high-risk outreach clinic patients only, they would be underrepresented.
An alternative decision-rule for excluding records with same UPI, but non-typographically different
DOBs would have been to exclude those who presented during an error prone period (see below). Still
another option would be the complete exclusion of these “offending” records.
Instrument bias could have been introduced by ignoring type of test for the reinfection event. By
definition, all index tests had to be done before 1.1.1998 and were thus made without LCx, but 28 out of
124 reinfected patients (22.5%) had their second positive test (reinfection event) done with LCx.
Depending on whom which test was done, systematic differences could have been introduced. Also,
reinfection intervals would seem to be shorter because more positive cases are getting picked up
(ascertainment bias).
Observer bias is unlikely to have occurred for the specimen testing, as for the actual testing, only a
patient's UPI is known, neither sex nor age.
Recording bias is a problem for retrospective studies and might be introduced by a change in staff during
the 8 years of study time, for example when a less experienced or new staff member is making more
errors during data entry and management. There was a higher rate of conflicting DOBs within the dataset
after the third quarter of 1997 (appendix, fig. 5).
Censoring bias (informative censoring) and reporting bias would have been present if a subgroup of the
study population with different reinfection risk or differing personal characteristics tended to have any
subsequent tests done at their GPs after their last visit at the RIEGUM clinic. Any reinfection event
diagnosed by a GP would have been lost, as well as the additional time until censoring in case of a
negative test.

Estimating Reinfection Intervals for Chlamydia trachomatis
Analysis and Interpretation of Findings
Descriptives
Descriptive analyses of the study population do not make any assumptions and do not test hypotheses, but
give a general overview and serve as a valuable starting point for further “explorations” into the data.
There was an almost equal number of tests done on men and women, however the age pattern varied
considerably as more young women between 15 and 24 and more older men between 25-44 were tested
(fig. 6.1). This might be explained with an earlier exposure of women to sexual contacts without adequate
health education and persistently increased risk behaviour in a subgroup of older men. But more tests on
young women and older men do not necessarily mean that these groups are more likely to test positive.
However, the proportion of positives (fig. 9) is constantly higher for men older than 22. Whereas the
proportion of women testing positive is falling rather steeply and reaches levels below 5% for women at
age 28, men lag about 7 years behind before they reach an equally low proportion of positives (fig 9).
This could indicate age-dependent differences in risk behaviour between the sexes with older men and
younger women having an elevated risk of infection. However, the possibility remains that young
symptomatic men and older symptomatic women refrain visiting a GUM clinic and thus escape detection.
The behavioural and biological explanations for the observed differences require specific research to
proof them.
Rates of reinfection within a year are between 2.0-4.8% for men and 3.2-8.8% for women. These results
are in the same range as those of Pimenta et al (2000), who looked at urban STD-clinic data in England.
The UK rates are considerably lower than those reported in US studies (Blythe et al, 1992, Fortenberry et
al, 1999, Hillis et al, 1994), perhaps because of differences in study populations. US studies tend to
include a higher proportion of young women deemed to be at high risk. It is therefore important to ensure
comparability of the cultural setting of a study before any generalisations are made. Nevertheless, women
aged 15-19 have the highest risk of Chlamydia reinfection within a year, which is concordant with other
findings in the literature (tab. 1.1-2). This is of particular concern, since young people tend to have a
reduced perception of risk and are also just beginning to explore their sexuality, yet they have more to
lose in terms of sequelae.
Analysis
Any inference drawn from data can only be made at the expense of certain assumptions. These
assumptions therefore require critical reflection, so that inferences are either strengthened or treated with
caution.

Estimating Reinfection Intervals for Chlamydia trachomatis
Survival Analysis
The sub-population of the survival study is about 3 years (median age) significantly younger than the
general GUM clinic population. This was to be expected, since a patient with a reinfection attended at
least twice, but his or her age at first presentation was chosen, which is, by definition, the younger one.
With at least 1,607 cases in each group of a Wilcoxon Rank Sum test, even small differences in median
age are likely to test significant. Therefore, the test might have been inadequate to begin with.
Kaplan Meier Curves
KM estimates for median reinfection time were between 60 and 80 months for men and 54 and 77 months
for women. The KM-curves did not fall steeply through y=0.5, so that the point estimates given are likely
to be unreliable. In addition, the statistical measure of median survival time might be of little clinical
relevance. It is hardly in the interest of public health to wait with retesting until everyone has a 50%
chance of reinfection. However, a lower threshold can be chosen analogous to the graphical estimation of
the median survival time. Further issues will be discussed in the outlook section of this section.
Logrank Test
Apart from the first 5 months, survival curves for men and women had a constant slope for age categories
≥15 (all), 15-19 and 20-24. For age category 25-34, the slopes were constant until t=68, for category ≥35
they were not constant at all, probably due to the low number of events for men (4) and women (1).
Logrank tests were therefore reliable for age categories: all, 15-19, 20-24 and 25-34. The survival
distribution between men and women was significantly different only in the 20-24 ageband. This has
important consequences as it could point to different risk behaviours or exposures between the sexes who
in turn would need individual intervention strategies.
Cox's Regression
Sex
In Cox1, women were at 31% lower risk of reinfection. However, not only was sex borderline non-
significant (p=0.0628), the LML plots for sex intersected each other at t=16 and the assumption of
proportional hazards is thus clearly violated. Great care has to be taken in interpreting model Cox1.
Therefore, separate Cox's regressions for men (Cox2) and women (Cox3) became necessary. However, it
could be informative to know when the hazards were not proportional any more (here: between 15 and 18
months), as this would indicate a time dependend difference in reinfection risk between men and women,
which would need to be investigated further.

Estimating Reinfection Intervals for Chlamydia trachomatis
Prostitutes
In Cox2 and Cox3, the multiplicative hazard of 0.00002prost is rather meaningless, because being a
prostitutes (prost=1) results in a coefficient near zero, which would nullify any influence the other
covariates have and leave only the non-parametric baseline hazard function. Not being a prostitute
(prost=0) would set the coefficient to one, i.e. no influence on hazard.
Covariates should capture variation in data in order to be of any predictive value. Although prostitutes
comprise a defined risk group and the total dataset contained 721 prostitutes, only 11 fulfilled the
requirements of the survival study. The imbalance in numbers between prostitutes and non-
prostitutes (11:1596) reduced the statistical power considerably and made inclusion of the prost
variable in regression modelling rather superfluous. This is reflected in the high p values and standard
errors of the covariate (tab. 9.1-3). LML plots for prost had only one graph because all prostitutes
were censored before the first reinfection event and hazard proportionality could not be tested. Including
prost as an explanatory variable was certainly not a good choice.
Prior Negative Test
Having prior Chlamydia tests was included as a proxy measure for overall STD testing history, which was
shown to be associated with infection risk in some studies (Hillis et al, 1994, Fortenberry et al, 1999).
197 of 1607 (12%) patients had a negative test prior to their index test and systematic differences in risk
of reinfection caused by this could have been picked up. However, the p-value of the firstneg-
covariate was over 0.93 for all regressions (tab. 9.1-3), which is equivalent with the statement that having
negative tests prior to the index test makes no contribution beyond chance to explain variations in
reinfection risks. This is also reflected in the modest increase of instantaneous reinfection risk of 1-3% in
Cox1-3 (table 9.1-3). Either the true effect on reinfection risk was too small to be detected or it did not
exist in the first place. Also, negative tests before 1992 were not accounted for. The LML plots show
nearly parallel graphs with the lines intersecting at t=58, which could point at a violation of the
proportional hazards assumption. However, at the intersection point, only 11 out of 197 patients were left
which makes the plot rather unreliable at this point.
Speaking from the point of regression analysis only, previous negative tests had no predictive value for
reinfection risk. From a modelling point of view, however, this is an important prerequisite for using
Markov chain simulation algorithms, because testing history (past events) must not influence infection
probability. More precisely, previous negative tests had no influence on repeated infection risk and for
additional proof of Markov property it remains to be shown that previous positive tests had no influence
either.

Estimating Reinfection Intervals for Chlamydia trachomatis
Age Categories
Including a categorical covariate requires a reference group for dummy-coding (tab. 8). That group
should be sufficiently big in order to have enough power to detect differences. Since the regression
coefficients will be estimated in relation to the reference category, its suspected effect on risk should be
on either end of the scale to make interpretations easier. Here, the group with the lowest suspected risk,
agecat≥35 was chosen as reference category.
Only in Cox1 and Cox3, agecat had a significant influence on reinfection risk and then only the first
category, agecat15-29 was significant. Instantaneous risk of reinfection for both sexes (Cox1) increases
by 86% (15-19), 5% (20-24) and decreases by 16% for those aged 25-34. In women (Cox3), risk
increases by 90% for 15-19 old and decreases by 16% and 20% for 20-24 and 25-34 old. In Cox2 (men),
agecat20-24 had a 32% higher risk of reinfection compared with a 23% increase for 15-19 year old.
Men aged 25-34 had a 5% lower chance of reinfection. However, the risk profile for men has to be
interpreted with caution, as agecat was not significant (p=0.6476).
The regression results reflect the observations made in descriptive analysis, namely that young women
between 15-19 and men between 20-24 have an elevated risk of contracting Chlamydia, even if controlled
for other covariates. LML plots for age showed parallel lines for agecat15-19, 20-24 and 25-34. The
line for agecat≥35 intersected others several times, but with only 5 reinfected patients out of a total of
86 in that age category, any event would have caused a rather steep step in the graph, thereby intersecting
other graphs. The LML plot for agecat≥35 is therefore unreliable.
With no more than one significant covariate in the model, a combined LML-plot for all significant
covariates as described in the methods section became unnecessary.
Multiple Visits vs. one Visit
If people think they may have contracted an STD, a visit to the GUM clinic is likely. However, different
people have different visit patterns and it is important to look at systematic differences between those
who come more often than others in order to be able to focus health education. Looking at the variables
sex and age at first visit, men and women visiting the clinic once only are significantly older (men:28.1,
Women:25.0) than those with two or more visits (men:27.4, women:23.4). It is difficult to decide whether
this has clinical relevance, since the groups compared in the WRS-test had at least 2900 cases each, and
small differences in age are therefore likely to be statistically significant. For men, an age difference of 8
months seems hardly relevant. The difference for women is 19 months and could point at a systematic
difference between women who come more than once and women who do not.

Estimating Reinfection Intervals for Chlamydia trachomatis
Multiple Reinfections
It does not seem to take longer for a second reinfection than it took for the first which supports the view
that risk behaviour of individuals stays constant, otherwise intervals would shorten or become prolonged.
Patients with multiple reinfections were significantly younger than those with only one (tab. 11). This was
expected because any patient with recurrent episodes needed to be in the study for a longer time and was
hence younger at his or her first visit. Looking at age to check for differences between groups does not
seem to be a good diagnostic test. Also, comparing multiple reinfection episodes within 8 years
automatically selects those patients with short intervals. If they were systematically different, it would
have introduced bias.
Diagnostic Test Performance
Cervical swabs of women visiting the clinic between Septmenber 1997 and August 1999 were almost
twice as likely to test positive if diagnosed with LCx instead of culture media (tab. ###). This means that
prior to LCx testing, a proportion of people with Chlamydia were told they were not infected, did not get
treated and had most likely spread the infection. Future studies on Chlamydia risk factors have to consider
type of diagnostic test as a confounder and thus should include it as a covariate. Also, higher incidence
rates might merely reflect the improved sensitivity of laboratory tests. Therefore, nationwide statistics on
Chlamydia incidence such as those published by ISD (ISD, 2000) should include the proportion of
laboratories using DNA-amplification tests. A conversion factor between old (pre-LCx) and new (LCx)
rates would be:
incidenceadjusted = incidence(new)*(1-proportion of LCx tests/1.91)
odds ratio for proportion of positives LCx:culture = 1.91
As of 1999, 6% of GUM clinics in the UK were using DNA amplification assays (David, 1999).
Ideally, both tests, LCx and culture would have been carried out here on the same individuals and
compared against each other with McNemar's chi-square test, adressing the number of discordant pairs.
Here, an ordinary chi-square test was performed and the age of both sub-populations (LCx and culture)
was compared with a WRS test. Median age was 24.7 for both groups and the data supported the
nullhypothesis of no difference in age (p=0.2635, WRS). Yet, an unknown confounder could have lead to
a low risk group of women visiting the clinic between September 1997 and August 1998. Alternatively, a
high-risk group of women could have begun visiting the clinic from the first of September 1998. The
latter two scenarios seem rather unlikely, however, and homogeneity of both groups, “LCx-women” and
“culture-women” is assumed.

Estimating Reinfection Intervals for Chlamydia trachomatis
The above example on test sensitivity illustrates the differences between prospective and retrospective
cohorts. A proper prospective cohort study would have conducted both tests on the same individuals or,
for a certain time, would have selected individuals at random and test them with either the old or the new
test. In a laboratory with a high volume of tests such as the MML, this extra burden would have required
additional personnel and material, which in turn would have increased the total budget of the study.
Retrospective studies, on the other hand, have to find ways to minimize the impact of confounders. Here,
tests were stratified for sex and specimen and only test results of cervical swabs within a certain time
were compared. This reduced temporal effects and removed selection bias based on sex, since
asymptomatic men are more likely to get tested with LCx than with culture. Further, age comparison
between women of both groups demonstrated a certain degree of homogeneity in the retrospective cohort.
Limitations of this Study
The value of any conclusions in an observational study depends on the comprehensiveness of potentially
relevant factors considered (Bull et al, 1997). The individual reasons to visit a GUM clinic are manifold,
among them recent exposure to infection, presence of symptoms or general anxiousness and health
concerns. This study for reinfection intervals makes two major assumptions about the comprehensiveness
of the data: first, anyone with a Chlamydia infection in Lothian gets tested and second, if they do, they
come to the RIEGUM clinic as a monopolist provider for all their tests. The first assumption is very
optimistic, because some people are too afraid to see a doctor for STDs and never go to a clinic. Also,
Chlamydia infection is asymptomatic in 50% of men and 70% of women (CMO, 1997) and these people
will not feel ill so will not attend for tests unless identified as a contact and then they may be very
reluctant to come for testing. A certain amount of these asymptomatics can be picked up through contact
tracing or, if they are female through routine health visits such as cervical smear testing. However,
cervical screening is instigated only if over 25 or over 20 if sexually active, so the major pool of
infectious women under 20 would not get screened. There will still be a large amount of asymptomatic
carriers in the general population, which remain undetected by looking at routine data only.
The second assumption of a monopolist provider is implicitly made during estimation of reinfection
intervals, which is based on GUM clinic visit history. Chlamydia tests done outside the GUM clinic are
not accounted for in the study and will lower the accuracy of estimating reinfection intervals. This is
particularly worrying if one considers that e.g. between 1.5.1999 and 1.4.2000, 3528 women were tested
at the GUM-clinic, compared to almost 4588 that were tested outside the GUM-clinic. Therefore,
including and linking GP data would greatly enhance any future study.
Estimating Reinfection Intervals for Chlamydia trachomatis
Another limitation of this study is that despite using data from 8.4 years, year of index case was not
included as a covariate. It would have required six additional nominal variables, which in turn would have
reduced the power of the analysis considerably. However, no major STD prevention campaign took place
in Lothian during the study period (Gordon Scott, personal communication), which could have influenced
risk behaviour. The only known time-dependent confounder was the change in testing methods in
September 1998. By definition, no index test was after 31.12.1997. However, 22.5% of reinfected patients
had their second positive test (reinfection event) done with LCx and the influence of year of event
(reinfection) happening could have been tested by including “test type of event” as a time dependent
covariate. Also, if variation within a group is not accounted for by a covariate and if that variation is
relatively large compared to between group variation, the estimation of risk will become more imprecise.
The large time interval could have also lead to substantial differences in the composition of the study
populations between 1992 and 1999/2000. However, Scotland has low immigration and emmigration
rates between 1-2% (Grosb, 2000), so this seems to be minor issue.
Age categories were chosen according to those used by ISD (2000). They might have been to coarse, so
that important age effects were “diluted“ during the analysis.
KM curves only account for one factor, whereas Cox's regression analysis allows adjustment for multiple
explanatory factors. However, in this study the covariates available for analysis were rather unsatisfactory
and the models had severe limitations. One covariate, sex, violated the assumption of proportional
hazards and the regression had to be made for each sex separately, reducing the overall power. Of the
remaining three covariates firstneg, prost and agecat, only in women, one (agecat) was
significant and even then, only one category (15-19) had a p-value below 5%. With so many non-
significant covariates the value of using Cox's regression analysis is questionable. Therefore, a purely
descriptive Kaplan Meier analysis for men and women with age as factor would have been sufficient.
Even then, the gradient of the KM survival curves was so small, that any point estimate given for median
time to reinfection is rather vague and has to be interpreted with great care. This is unsatisfactory, since a
major goal of the study was to estimate this very interval. It can be seen qualitatively, however, that
young women aged 15-19 have the shortest median reinfection interval and men aged 25-34 have the
longest. A previous study by Hillis et al (1994) showed that within 5 years, 54% of women under 14 (at
index case) got reinfected with Chlamydia. The median reinfection interval, i.e. the time by which 50% of
the sample had become reinfected, for 15-19 year old women was 4.5 years, which compares to the result
of Hillis et al (1994).

Estimating Reinfection Intervals for Chlamydia trachomatis
A general limitation of the Cox's regressions presented here was that 760 out of 1607 cases were not part
of the “risk set” at the time of event anymore. In other words, they were censored before the first event
happened and were therefore excluded during model building, which in turn reduced the power of the
parameter estimation in regression modelling.
Outlook and further Research Strategy
Arguably, the greatest weakness of this retrospective cohort study was the lack of important observational
variables such as socioeconomic status, occupational class, ethnicity, personal risk behaviour and STD
infections other than Chlamydia. Given extra time, additional information on postcode, occupational
class, ethnicity, number of regular/irregular sex partners, contraception used and non-Chlamydial STDs
could have been obtained from the RIEGUM clinic and the MML if more time were available. Including
both, ethnicity and socioeconomic status would help to disentangle their effects on each other.
Discussions are under way to link some of this data to the reinfection database so far constructed.
Also, any covariate used in the regression should capture enough variation and have sufficient events to
be of analytical value. Age categories in particular were very unevenly distributed (tab. 8). An alternative
strategy for setting age categories could be to look at data from one year only, take cut-off points that
capture differences in proportion of positives and then exclude this year in the analyses to avoid biased
significance tests.
Subsequent reinfections could have been analysed analogously to first reinfections. Of all patients with a
reinfection (124), those with at least 3 tests would be included in the study (117). The second positive test
(reinfection event of first survival study) would mark the starting point of observation and the third
positive test would be the “(multiple) reinfection event“ (21 patients). However, a better way of
evaluating multiple reinfections would be time-to-event models that allow for multiple events (Clayton,
1994).
Coefficients of significant covariates that have a strong effect on risk in Cox's regressions could be used
to create a prognostic index. The index could be subdivided into low, medium and high-risk categories. A
KM plot stratified for these categories could then serve as a descriptive, graphical decision support, since
retest intervals could be chosen flexibly depending on the tolerated reinfection probability.
New approaches for screening such as home sampling and reinforced contact tracing efforts have be
considered to increase “catchment” of asymptomatic carriers and, ultimetely, lower the prevalence of
Chlamydia and other STDs.

Estimating Reinfection Intervals for Chlamydia trachomatis
There was not enough time to go into detailed reinfection modelling. However, results from the
descriptive analysis would have been combined with information from published cross sectional studies
as follows:
- conceptions, abortions and teenage pregnancies (ONS, 1999, Scottish Executive, 1999a)
- attitudes towards sexual relations (NSR, 1998, Scottish Executive, 1999b)
- number of sexual partners (ONSHEA, 1998)
- income distribution (DSS, 1998)
- sexual behaviour of young people (Scottish Executive, 1999a)
- attendance at family clinics (Scottish Executive, 1999a)
- sex education (Scottish Executive, 1999b)
- STD incidence (ISD, 2000)
- social deprivation (Scottish Executive, 1999a)
The model would have followed the approach of Kretzschmar et al (1996) who studied the spread of
STDs within a population, taking into account the structure of sexual contact patterns and different
prevention strategies such as screening of subgroups, contact tracing and condom use as a crucial aspect
of sexual risk behaviour. Modelling would have been done with Markov Chain Monte Carlo (MCMC)
methods using WinBugs for simulations (Gilks, et al, 1996, BUC/DEPICL, 2000).
On a more philosophical note, access to cleaned, anonymised raw epidemiological data such as that
extracted for this study could be transferred to an internet based “Open-Source“ epidemiological
community. Ownership of the datasets would remain with their originating institutions, but everyone
would have free access to them and any changes or novel evaluation methods would have to be made
electronically accessible for free as well, including custom software or computer macros for SPSS, SAS,
S or other statistical packages. Patient identifiable information would have to be treated with greatest care
according to the guidelines set forth by the Caldicott Committee (NHS Executive, 1999, 2000, tab. 13,
appendix). The “Open-Source“ idea will be discussed with the owners of this dataset.
In computer software engineering, the “Open-Source“ idea has led to a proliferation of free, highest
quality software, some of which is responsible for 60% of all internet services worldwide. Free flow of
high quality epidemiological data would lead to a substantial increase of interdisciplinary cooperations
across the globe between experts of different fields such as mathematical modelling or disease
surveillance.
Knowledge would increase exponentially and lead to novel approaches that help to remove the “spirit of
sickness“ before it takes shape.

Estimating Reinfection Intervals for Chlamydia trachomatis
VIII. References
Anderson, R. M., May, R. M. (1991). 'Infectious diseases of humans: dynamics and control'. Oxford:
Oxford University Press
Aral, S. O., Hughes, J. P., Stoner, B., Whittington, W., Handsfield, H. H., Anderson, R. M. et al. (1999).
'Sexual Mixing Patterns in the Spread of Gonococcal and Chlamydial Infections'. American Journal of
Public Health, 89, pp825-833
Black, C. M., Byrne, G., Carlin, E., Gruber, F., Johnson, F. N., Mardh, P. A. et al. (2000). 'Chlamydia
trachomatis genital infections and single-dose azithromycin therapy'. Reviews In Contemporary
Pharmacotherapy , 11, pp139-256
Blythe, M. J., Katz B. P., Batteiger, B. E., Ganser, J. A., Jones, R. B. (1992). 'Recurrent Genitourinary
Chlamydial Infections in Sexually Active Female Adolescents'. Journal of Pediatrics , 121, pp487-493
Bower, H. (1998). 'Britain launches pilot screening programme for chlamydia'. BRITISH MEDICAL
JOURNAL, 316, pp1479
Bull, K., Spiegelhalter, D., J. (1997). 'Tutorial in Biostatistics Survival Analysis in observational studies'.
Statistics in Medicine, 16, pp1041
Burstein, G. R., Gaydos, C. A., Diener-West, M., Howell, M. R., Zenilman, J. M., Quinn, T. C. (1998).
'Incident Chlamydia trachomatis Infections Among Inner-city Adolescent Females'. JAMA, 280, pp521-
526
Camus, M. 'Case to variable ratio in logistic regression'. [email protected], (1.9.2000)
Clayton, D. G. (1994). 'Some approaches to the analysis of recurrent event data'. Statistical Methods on
Medical Research, 3, 244-262
Estimating Reinfection Intervals for Chlamydia trachomatis
Clinical Effectiveness Group (CEG) (1999). 'National guideline for the management of Chlamydia
trachomatis genital tract infection'. Sexually Transmitted Infections, 75 (Suppl), S4-S8
CMO Expert Advisory Group (1997). 'Chlamydia trachomatis: Summary and Conclusions of CMO’s
Expert Advisory Group'. London: Health Promotion Division,
Concato J., Feinstein A. R. (1997). 'Monte carlo methods in clinical research:
applications in multivariable analysis. '. J Investig Med , 45:394-400.
Department of Health (2000). 'Chlamydia trachomatis screening pilot project initiation document'.
London: Department of Health, March 2000
Department of Social Security (DSS) (1998). 'Households Below Average Income: Income distribution of
individuals, dataset: rt34803'. http://www.statistics.gov.uk/statbase/xsdataset.aspvlnk=1020, page last
updated: 14th January 2000, accessed 25.8.2000
Diekmann, O., Heesterbeek, J. A. P. (2000). 'Mathematical Epidemiology of Infectious Diseases'.
Chichester, John Wiley & Sons
Fortenberry, J. D., Brizendine, E. J., Katz, B. P., Wools, K. K., Blythe, M. J., Orr, D. P. (1999).
'Subsequent Sexually Transmitted Infections Among Adolescent Women with Genital Infection Due to
Chlamydia trachomatis, Neisseria gonorrhoeae, or Trichomonas vaginalis'. Sexually Transmitted
Diseases, 26, pp 26-32
Garnett, G. P., Anderson, R. M. (1996). 'Sexually Transmitted Diseases and Sexual Behavior: Insights
from Mathematical Models'. The Journal of Infectious Diseases, 172, pp150-161
Genç, M., Mårdh, P. A. (1996). 'A Cost-effectiveness Analysis of Screening and Treatment for
Chlamydia trachomatis Infection in Asymptomatic Women'. Annals of Internal Medicine, 125, pp1-7

Estimating Reinfection Intervals for Chlamydia trachomatis
General Register Office for Scotland (GROSa) (2000). '1998 Based Sub-National Population Projections,
Scotland'. http://www.gro-scotland.gov.uk/grosweb/grosweb.nsf/pages /file1/$file/98snp2.wk1 , page last
updated: 31st March 2000, accessed 25.8.2000
General Register Office for Scotland (GROSb) (2000). '1998 Based Sub-National Population Projections,
Scotland'. http://www.gro-scotland.gov.uk/grosweb/grosweb.nsf/pages/98snpp, page last updated: 31st
March 2000, accessed 25.8.2000
Gilks, W.R., Richardson, S., Spiegelhalter, D.J. (eds.) (1996). 'Markov Chain Monte Carlo in Practice'.
New York: Chapman & Hall
Grun, L., Tassano-Smith, J., Carder, C., Johnson, A. M., Robinson, A., Murray, E. et al. (1997).
'Comparison of two methods of screening for genital Chlamydia infection in women attending in general
practice: cross sectional survey'. British Medical Journal, 315, pp 226 – 230
Health Education Board for Scotland (HEBS) (1999). 'What do you know about GUM and STD services
in Scotland?'. http://www.hebs.scot.nhs.uk/cgi-
bin/dbtcgi.exe$TEXTBASE_PATH=f:%5Cwebdocs%5Cdatasets%5Cfulltextp&$TEXTBASE_NAME=f
ulltext&$BOOL0=OR&Title_code=41&$REPORT_FORM=sectionprinthtm&$DISPLAY_FORM=secti
onprinthtm&$NOREPORT=0&$NODISPLAY=0, 1999, accessed 25.8.2000
Hillis, S. D., Coles, F. B., Litchfield, B., Black, C. M., Mojica, B., Schmitt, K., St Louis, M. E. (1998).
'Doxycycline and azithromycin for prevention of chlamydial persistence or recurrence one month after
treatment in women - A use-effectiveness study in public health settings'. Sexually Transmitted Diseases ,
25, pp 5-11
Hillis, S. D., Nakashima, A., Marchbanks, P. A., Addiss, D. G., Davis, J. P. (1994). 'Risk Factors for
Recurrent Chlamydia trachomatis Infections in Women'. American Journal of Obstetrics and
Gynecology, 170, pp 801-806

Estimating Reinfection Intervals for Chlamydia trachomatis
Hillis, S. D., Owens, L. M., Marchbanks, P. A., Amsterdam, L. E., Mac Kenzie, W. R. (1997). 'Recurrent
chlamydial infections increase the risks of hospitalization for ectopic pregnancy and pelvic inflammatory
disease'. American Journal of Obstetrics and Gynecology, 176, pp 103-107
Hughes, G., Catchpole, M., Rogers, P.A., Brady, A.R., Kinghorn, G., Mercey, D., Thin, N. (2000).
'Comparison of risk factors for four Sexually Transmitted Infections: results from a study of attenders at
three Genitourinary Medicine clinics in England'. Sexually Transmitted Infections, 76, 262-267
Information & Statistics Division (ISD) (2000). 'Genitourinary Medicine Statistics Scotland Year Ending
31 March 1999'. Edinburgh, ISD Scotland Publications.
Isham, V., Medley, G. (1996). 'Models for Infectious human Diseases: Their Structure and Relation to
Data'. Cambridge, Publications of the Newton Institute, Press Syndicate of the University of Cambridge
James, N., Hughes, S., Ahmed-Jushuf, I., Slack, R. (1999). 'A collaborative approach to management of
chlamydial infection among teenagers seeking contraceptive care in a community setting'. Sexually
Transmitted Infections, 75, pp 156 – 161
Kayser, F. H., Bienz, K. A., Eckert, J., Lindenmann, J.. (1992). 'Medizinische Mikrobiologie'. Stuttgart,
Thieme Verlag
Kissinger, P., Brown, R., Reed, K., Salifou, J., Drake, A., Farley, T. A., Martin, D. H. (1998).
'Effectiveness of patient delivered partner medication for preventing recurrent Chlamydia trachomatis'.
Sexually Transmitted Infections, 74, pp 331-333
Kjær, H. O., Dimcevski, G., Hoff, G., Olesen, F., Østergaard, L. (2000). 'Recurrence of urogenital
Chlamydia trachomatis infection evaluated by mailed samples obtained at home: 24 weeks’ prospective
follow up study'. Sexually Transmitted Infections, 76, pp169-172
Kleinbaum, D. G. (1995). 'Survival Analysis'. New York, Springer-Verlag
Estimating Reinfection Intervals for Chlamydia trachomatis
Koopman, J. S., Lynch, J. W. (1999). 'Individual Causal Models and Population System Models in
Epidemiology'. American Journal of Public Health, 89, pp1170-1174
Kretzschmar, M., van Duynhoven, Y. T. H. P., Severijnen, A. J. (1996). 'Modeling Prevention Strategies
fo Gonorrhea and Chlamydia Using Stochastic Network Simulations'. American Journal of Epidemiology,
144, pp306-317
Lotka, A.J. (1925). 'Elements of Physical Biology'. Baltimore: Williams and Wilkins,
Miller, J. M. (1998). 'Recurrent Chlamydial Colonization During Pregnancy'. American Journal of
Perinatology, 15, pp307-309
Mosure, D. J., Berman, S., Kleinbaum, D., Halloran, M. E. (1996). 'Predictors of Chlamydia trachomatis
Infection among Female Adolescents: A Longitudinal Analysis'. American Journal of Epidemiology, 144,
pp 997-1003
MRC Biostatistics Unit Cambridge, Department of Epidemiology and Public Health of the Imperial
College London (BUC/DEPICL) (2000). 'The BUGS Project - WinBUGS'. http://www.mrc-
bsu.cam.ac.uk/bugs/winbugs/contents.shtml, accessed 19.9.2000
National Centre for Social Research (NSR) (1998). 'British Social Attitudes Survey: Attitudes towards
sexual relations, dataset: st30212'. http://www.statistics.gov.uk/statbase/xsdataset.aspvlnk=126, page last
updated: 3rd March 2000, accessed 25.8.2000
NHS Executive (1999). 'The Caldicott Committee: Report on the review of patient-identifiable
information - December 1997'. http://www.doh.gov.uk/confiden/crep.htm, page last updated: 24th April
1999, accessed 25.8.2000
NHS Executive (2000). 'Protecting And Using Patient Information: A Manual for Caldicott Guardians '.
http://www.doh.gov.uk/confiden/cgmcont.htm, page last updated: 4th April 2000, accessed 25.8.2000
Estimating Reinfection Intervals for Chlamydia trachomatis
Oakeshott, P., Hay, P. (1995). 'General practice update: Chlamydia infection in women'. British Journal
of General Practice, 45, pp 615 – 620
Office for National Statistics and Health Education Authority (ONSHEA) (1998). 'Health Education
Monitoring Survey: Number of sexual partners in the previous year: by gender and age, dataset: st30211'.
http://www.statistics.gov.uk/statbase/xsdataset.aspvlnk=125, page last updated: 3rd March 2000, accessed
25.8.2000
Office for National Statistics (ONS) (1999). 'Conceptions to women aged under 18 (numbers, rates and
percentage leading to abortion): area of usual residence 1993-95 and 1996-98 , dataset: pt99ct6'.
http://www.statistics.gov.uk/statbase/xsdataset.aspvlnk=1348, page last updated: 27h March 2000,
accessed 25.8.2000
Paavonen, J. (1997). 'Is screening for Chlamydia trachomatis infection cost effective?'. Genitourinary
Medicine, 73, pp 103 – 104
Paavonen, J., Puolakkainen, M., Pauku, M., Sintonen, H. (1996). 'Cost-benefit analysis of screening for
Chlamydia infection in low prevalence population'. Proceedings of the 3rd meeting of the European
Society for Chlamydia Research,
Patton, D.L., Kuo, C.C. (1989). 'Histopathology of Chlamydia trachomatis salpingitis after primary and
repeated infections in the monkey subcutaneous pocket model'. J Reprod Fertil, 85, 647-56
Pierpoint, T., Thomas, B., Judd, A., Brugha, R., Taylor-Robinson, D. (2000). 'Prevalence of Chlamydia
trachomatis in young men in north west London'. Sexually Transmitted Infections, 76, 273-276
Pimenta, J.M., Hughes, G., Rogers, P.A., Catchpole, M., Kinghorn, G. (2000). 'Re-infection rates for
genital Chlamydia trachomatis infection in an STD clinic in England: implications for national screening'.
Proceedings of the 4th Meeting of the European Society for Chlamydia Research, Helsinki, Finland,
20.8.2000

Estimating Reinfection Intervals for Chlamydia trachomatis
Quinn, T., Welsh, L., Lentz, A., Crotchfelt, K., Zenilman, J., Newhall, J. et al. (1996). 'Diagnosis of
Chlamydia trachomatis infection in urine samples by Amplicor polymerase chain reaction in women and
men attending sexually transmitted disease clinics'. Journal of Clinical Microbiology, 34, pp1401-1406
Rasmussen, S. J., Eckmann, L., Quayle, A. J., Shen, L., Zhang, Y. X., Anderson, D.J. et al. (1997).
'Secretion of proinflammatory cytokines by epithelial cells in response to Chlamydia infection suggests a
central role for epithelial cells in chlamydial pathogenesis.'. Journal of Clinical Investigation, 99, pp77-87
Renshaw, E. (1991). 'Modelling Biological Populations in Space and Time'. Cambridge, Press Syndicate
of the University of Cambridge
Richey, C. M., Macaluso, M., Hook, E. W. (1999). 'Determinants of Reinfection with Chlamydia
trachomatis'. Sexually Transmitted Diseases, 26, pp 4-11
Royce, R.A., Sena, A., Cates, W., Cohen, M.S. (1997). 'Sexual transmission of HIV'. N Engl J Med, 336,
pp 1072-1078
Santer, M., Warner, P., Wyke, S., Sutherland, S. (2000). 'Opportunistic screening for chlamydia infection
in general practice: can we reach young women?'. Journal of Medical Screening, in press
Scottish Centre for Infection and Environmental Health (SCIEH) (1999). 'Weekly Report Vol. 33 No
99/31'. Edinburgh, ISD Scotland Publications.
Scottish Executive (1999). 'Health in Scotland'. http://www.scotland.gov.uk/library3/health/his9-09.asp,
accessed 25.8.2000
Scottish Executive (1999). 'Report on the Working Group on Sex Education in Scottish Schools'.
http://www.scotland.gov.uk/library2/doc16/sess-03.asp, accessed 25.8.2000
Shahmanesh, M., Gayed, S., Ashcroft, M., Smith, R., Roopnarainsingh, R., Dunn, J., Ross, J. (2000).
'Geomapping of chlamydia and gonhorroea in Birmingham'. Sexually Transmitted Infections, 76, 268-272
Estimating Reinfection Intervals for Chlamydia trachomatis
SIGN (2000). 'Management of Genital Chlamydia trachomatis Infection'. Scottish Intercollegiate
Guidelines Network,
Simms, I. , Catchpole, M., Brugha, R., Rogers, P., Mallinson, H., Nicoll, A. (1997). 'Epidemiology of
genital Chlamydia trachomatis in England and Wales'. Genitourinary Medicine, 73, pp122-126
Stary, A. (1997). 'Chlamydia screening: which sample for which technique?'. Genitourinary Medicine, 73,
pp 99 – 102
Stephenson, J. (1998). 'Screening for genital chlamydial infection'. British Medical Bulletin, 54, pp 891 –
902
Stokes, T. (1997). 'Screening for chlamydia in general practice: a literatur review and summary of the
evidence'. Journal of Public Health Medicine, 19, pp22-232
Sun Tzu, translated by Cleary, T. (1988). 'The Art of War'. Boston, Shambhala Publications
Taylor-Robinson, D. (1994). 'Chlamydia trachomatis and sexually transmitted disease'. British Medical
Journal, 303, pp 150-151
Tobin, J.M., Harindra, V., Tucker, L.J. (2000). 'The future of chlamydia screening'. Sexually Transmitted
Infections, 76, 233-234
Tyden, T., Ramstedt, K. (2000). 'A survey of patients with Chlamydia trachomatis infection: sexual
behaviour and perceptions about contact tracing '. International Journal Of Std & Aids, 11, pp 92-95
Volterra, V. (1926). 'Fluctuations in the abundance of a species considered mathematically'. Nature, 118,
S.558-560
Wasserman, S., Faust, K. (1994). 'Social Network Analysis'. Cambridge, Press Syndicate of the University
of Cambridge

Estimating Reinfection Intervals for Chlamydia trachomatis
Winter, A. J., Sriskandabalan, P., Wade, A. A. H., Cummins, C., Barker, P. (2000). 'Sociodemography of
genital Chlamydia trachomatis in Coventry, UK, 1992-6'. Sexually Transmitted Infections, 76, pp103-109
Young, H., Moyes, A., Horn, K., Scott, G. R., Patrizion, C., Sutherland, S. (1998). 'PCR testing of genital
and urine specimens compared with culture for the diagnosis of chlamydial infection in men and women'.
International Journal of STD & AIDS, 9: 661-665

Estimating Reinfection Intervals for Chlamydia trachomatis
IX. Appendix
Related Documents