Chino Basin Recycled Water Groundwater Recharge Program 2017 Annual Report May 1, 2018

Welcome message from author
This document is posted to help you gain knowledge. Please leave a comment to let me know what you think about it! Share it to your friends and learn new things together.
Transcript
Chino Basin Recycled Water Groundwater Recharge Program
2017
Annual Report
May 1, 2018
6075 Kimball Avenue • Chino • CA • 91708 • Tel: 909.993.1600 • Fax: 909.993.9000
Randy Lee, P.E. Peter Kavounas, P.E. Manager of Planning & Environmental Resources General Manager
May 1, 2018
Regional Water Quality Control Board, Santa Ana Region Attention: Ms. Hope Smythe 3737 Main Street, Suite 500 Riverside, California 92501-3348 Subject: Transmittal of the Annual Report for 2017
Chino Basin Recycled Water Groundwater Recharge Program
Dear Ms. Smythe:
The Inland Empire Utilities Agency (IEUA) and the Chino Basin Watermaster (CBWM) hereby submit the 2017 Annual Report for the Recycled Water Groundwater Recharge Program. The recycled water groundwater recharge program is being implemented by IEUA and CBWM and its annual reporting is pursuant to requirements of the following orders:
California Regional Water Quality Control Board, Santa Ana Region. Order No. R8-2007-0039. Water Recycling Requirements for Inland Empire Utilities Agency and Chino Basin Watermaster. Chino Basin Recycled Water Groundwater Recharge Program: Phase I and Phase II Projects, San Bernardino County, June 29, 2007.
California Regional Water Quality Control Board, Santa Ana Region. Order No. R8-2009-0057 Amending Order No. R8-2007-0039 for Inland Empire Utilities Agency and Chino Basin Watermaster. Chino Basin Recycled Water Groundwater Recharge Program: Phase I and Phase II Projects, San Bernardino County, October 23, 2009.
ACTIVITIES, FINDINGS, AND CONCLUSIONS
The following bullets summarize the principal activities, findings, and conclusions of the Recycled Water Groundwater Recharge Program for 2017:
The 2017 calendar year include annual program recharge of 59,448 acre-feet (AF), which includes 7,570.9 AF of storm water and dry weather flows; 14,371.9 AF of recycled water; and 37,505 AF of imported water.
During 2017, recycled water quality monitoring was conducted in accordance with Monitoring and Reporting Program No. R8-2007-0039. No turbidity, coliform, and total organic carbon (TOC) compliance limits were exceeded during 2017. No primary or secondary regulated contaminants limits were exceeded during 2017, with the exception of the secondary MCL for odor.
No corrective actions were necessary for RP-1 and RP-4. No unit process changes occurred during 2017.
6075 Kimball Avenue • Chino • CA • 91708 • Tel: 909.993.1600 • Fax: 909.993.9000
In-aquifer blending of recycled water, diluent water, and native groundwater is evident at monitoring wells near 8th Street, Banana, Hickory, Brooks, Ely, Turner, Victoria, and RP3 Basins. For 8th Street, Banana, and Hickory Basins, blending was observed to be occurring both in the groundwater mound and downgradient. Evidence includes variations in water chemistry, variations in water levels, and recharge ratios of water sources.
At the end of 2017, the volume-based 120-month running average recycled water contributions (RWCs), inclusive of groundwater underflow, by basin were: 8th Street - 22%; Banana - 36%; Brooks - 18%; Declez 7%, Ely - 22%, Hickory - 22%, RP3 - 17%; San Sevaine 5 - 7%; Turner Basin Cells 1&2 - 22%; Turner Basin Cells 3&4 - 23%; and Victoria - 30%. These basins are all in compliance with their maximum RWC limits.
CBWM has verified in the Recycled Water Groundwater Recharge Quarterly Monitoring Reports that there was no reported pumping of groundwater in 2017 for domestic or municipal use from zones that extend 500 feet and 6-months underground travel time from the 8th Street, Banana, Brooks, Declez, Ely, Hickory, Turner, RP3, San Sevaine, and Victoria recharge sites.
Sufficient data exist to estimate approximate arrival times of recycled water at several monitoring wells based on observed trends in EC, TDS, and chloride concentration at the following monitoring wells 8TH-1/1 (22 months) for 8th Street Basin; BRK-1/1 (5 months) and BRK-1/2 (17 months) for Brooks Basin; Philadelphia Well (13 months) for Ely Basin, BH-1/2 (2 months) for Hickory Basin; California Speedway Infield Well (29 months) and Speedway 2 (83 months) for Banana Basin; TRN-1/2 (3.2 months) for Turner Cell 1; TRN-2/2 (13 months) and Ontario Well No. 25 (48 months) for Turner Cell 4; VCT-1/1 (7.5 months) for Victoria Basin and RP3-1 (3.3 months) for RP3 Basin Cell 1. Other monitoring wells have not yet shown definitive variations in EC, TDS, and chloride that would signal arrival of recycled water at these well sites.
Comparison of the pre-recharge groundwater elevation contour map (Fall 2003) with the most recent groundwater elevation contour map (Spring 2016) indicates that for areas near the recharge basins, there were minor regional changes in groundwater elevation, but the recharge program has not significantly changed groundwater flow directions. The 2016 groundwater elevations measured in the program monitoring wells have generally changed less than the contour interval (25 feet) used in the 2003, 2006, 2008, 2010, 2012, and 2014 groundwater elevation maps. The only significant differences in groundwater flow direction between the 2003 and 2016 maps is for the mound at 8th Street, which between 2012 and 2016 had a more westward direction as opposed to a south-southwest direction in 2013. This difference may indicate the 8th Street Basin downgradient monitoring well location (8TH-2) is not appropriately located to characterize downgradient recharge water quality. Other differences include a deeper and larger area pumping depression has developed in the vicinity of the Chino Desalter well field (area of hydraulic control) and a smaller pumping depression has developed in Pomona west of Brooks Basin. Some changes in the contouring style/methodology are evident between the 2003 and 2016 maps. For example, the groundwater contours in the area north of Victoria and San Sevaine basins were interpreted for the 2003 map, but were not interpreted for the 2016 map.

6075 Kimball Avenue • Chino • CA • 91708 • Tel: 909.993.1600 • Fax: 909.993.9000
DECLARATION
I certify under penalty of law that I have personally examined and am familiar with the information submitted in this document and all attachments thereto; and that, based on my inquiry of the individuals immediately responsible for obtaining the information, I believe that the information is true, accurate, and complete. I am aware that there are significant penalties for submitting false information, including the possibility of fines and imprisonment.
Executed on the 1st day of May 2018 in the Cities of Chino and Rancho Cucamonga.
Randy Lee, P.E. Peter Kavounas, P.E. Executive Manager of Operations/ Assistant General Manager
General Manager
bfan
Stamp
bfan
Stamp
6075 Kimball Avenue • Chino • CA • 91708 • Tel: 909.993.1600 • Fax: 909.993.9000
Chino Basin Recycled Water
Groundwater Recharge Program
2017
Annual Report Prepared by:
Inland Empire Utilities Agency
Andy Campbell
Groundwater Recharge Coordinator / Hydrogeologist
Bonita Fan
Sr. Environmental Resources Planner – Regulatory Compliance
Reviewed and Approved by:
Randy Lee, P.E.
Executive Manager of Operations / Assistant General Manager
May 1, 2018
bfan
Stamp
Chino Basin Recycled Water Annual Report: Groundwater Recharge Program January 1 through December 31, 2017 Order No. R8-2007-0039
i
TABLE OF CONTENTS
1 INTRODUCTION ............................................................................................................................. 1-1
1.1 Requirements of Order No. R8-2007-0039 ......................................................................... 1-1
1.2 Organization of the Annual Report ....................................................................................... 1-2
2 RECYCLED WATER QUALITY MONITORING ......................................................................... 2-1
2.1 Recycled Water Quality Specifications ................................................................................ 2-1
2.1.1 Detections and Compliance with Narrative Limits ...................................................... 2-1
2.1.2 Detections and Compliance with Regulated and Non-regulated Contaminants.... 2-1
2.2 Groundwater Quality Monitoring ........................................................................................... 2-2
2.3 Laboratory Certifications and Test Methods ....................................................................... 2-3
2.4 Calibration Summary .............................................................................................................. 2-3
2.5 Violations, Suspensions, and Corrective Actions ............................................................... 2-3
2.6 Unit Process Changes and Anticipated Impact on Water Quality ................................... 2-5
2.7 Summary of Chemical Usage ................................................................................................ 2-5
3 GROUNDWATER RECHARGE MONITORING ......................................................................... 3-1
3.1 Summary of Recharge Operations ....................................................................................... 3-1
3.2 In-Aquifer Blending of Recycled Water ................................................................................ 3-1
3.2.1 Evidence of Blending Based on Volume ..................................................................... 3-2
3.2.2 Evidence of Blending Based on Water Quality ........................................................... 3-3
3.3 RWC Management Plan ......................................................................................................... 3-9
3.4 Buffer Zone/Travel Time Compliance ................................................................................ 3-11
3.4.1 Recharge Water Arrival Times .................................................................................... 3-11
3.4.2 Leading Edge of Recycled Water in Aquifer ............................................................. 3-14
3.4.3 Tracer Test Results ....................................................................................................... 3-14
3.5 Groundwater Elevations ....................................................................................................... 3-14
3.5.1 Current Elevation vs. Modeled Elevation ................................................................... 3-15
3.5.2 Water Level Trends in Monitoring Wells .................................................................... 3-15
4 REFERENCES ................................................................................................................................ 4-1
Chino Basin Recycled Water Annual Report: Groundwater Recharge Program January 1 through December 31, 2017 Order No. R8-2007-0039
ii
LIST OF TABLES
2-1 Summary of Treatment Chemical Usage at RP-1 and RP-4
3-1 Evidence of Recycled Water Blending Based on Water Quality at Monitoring Wells in 2017 Based on EC and Chloride
3-2 Volume-Based RWC Actuals by Basin
LIST OF FIGURES
1-1 Basin Locations
2-1 Monitoring Well Network: Hickory and Banana Basins
2-2 Monitoring Well Network: Turner Basins
2-3 Monitoring Well Network: 7th & 8th Street Basins
2-4 Monitoring Well Network: Ely Basin
2-5 Monitoring Well Network: Brooks Basin
2-6 Monitoring Well Network: Declez & RP3 Basins
2-7 Monitoring Well Network: San Sevaine & Victoria Basins
Chino Basin Recycled Water Annual Report: Groundwater Recharge Program January 1 through December 31, 2017 Order No. R8-2007-0039
iii
LIST OF APPENDICES
A Monthly Groundwater Recharge Summaries
B RWC Management Plans
C Evidence for Blending: EC, TDS, & Chloride Time-Series Graphs
D Monitoring Well Hydrographs
E Groundwater Elevation Contour Maps

1-1
1 INTRODUCTION
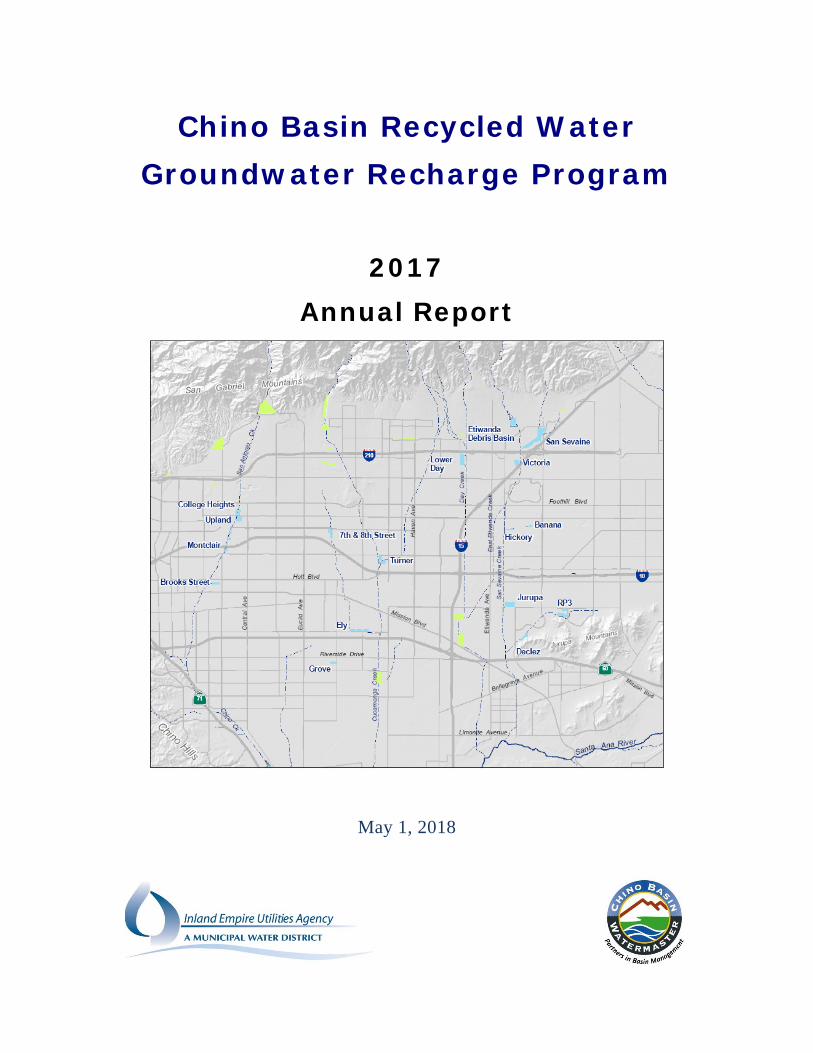
This is the 2017 Annual Report for the Chino Basin Recycled Water Groundwater Recharge Program. Inland Empire Utilities Agency (IEUA), Chino Basin Watermaster (CBWM), Chino Basin Water Conservation District, and San Bernardino County Flood Control District are partners in the implementation of the Chino Basin Recycled Water Groundwater Recharge Program. The recharge program is part of a comprehensive program to enhance water supply reliability and improve the groundwater quality in local drinking water wells throughout the Chino Groundwater Basin by increasing the recharge of storm water, imported water and recycled water. Figure 1-1 is a location map of the recharge basin locations used in the Recycled Water Groundwater Recharge Program. Recharge operations for 8th Street, Banana, Brooks, Ely, Hickory, RP3, Turner, San Sevaine, and Victoria Basins have previously been summarized in the four 2017 quarterly monitoring reports to the Regional Board Water Quality Control Board (Regional Board) for these basins where recharge of recycled water has been initiated. During the 2017 calendar year, 59,448 acre-feet (AF) of water were recharged in the Chino Basin, which included 7,570.9 AF of storm water and dry weather flows; 14,371.9 AF of recycled water; and 37,505 AF of imported water.
1.1 Requirements of Order No. R8-2007-0039
This Recycled Water Groundwater Recharge Program is subject to the requirements found in the following documents issued by the California Regional Water Quality Control Board Santa Ana Region:
Order No. R8-2007-0039 Water Recycling Requirements for Inland Empire Utilities Agency and Chino Basin Watermaster, Chino Basin Recycled Water Groundwater Recharge Program, Phase I and Phase II Projects, San Bernardino County, June 29, 2007;
Monitoring and Reporting Program No. R8-2007-0039 for Inland Empire Utilities Agency and Chino Basin Watermaster, Chino Basin Recycled Water Groundwater Recharge Program Phase I and Phase II Projects, San Bernardino County, June 29, 2007;
Order No. R8-2009-0057 Amending Order No. R8-2007-0039 for Inland Empire Utilities Agency and Chino Basin Watermaster, Chino Basin Recycled Water Groundwater Recharge Program: Phase I and Phase II Projects, San Bernardino County, October 23, 2009; and
Revised Monitoring and Reporting Program No. R8-2007-0039 for Inland Empire Utilities Agency and Chino Basin Watermaster. Chino Basin Recycled Water Groundwater Recharge Program: Phase I and Phase II Projects, San Bernardino County, October 27, 2010.
On June 18, 2014, the State Water Resources Control Board – Division of Drinking Water (DDW) adopted new regulations pertaining to Groundwater Replenishment Reuse Projects (GRRP), which can be found in Title 22 California Code of Regulations, Division 4, Chapter 3. Article 5.1
1-2
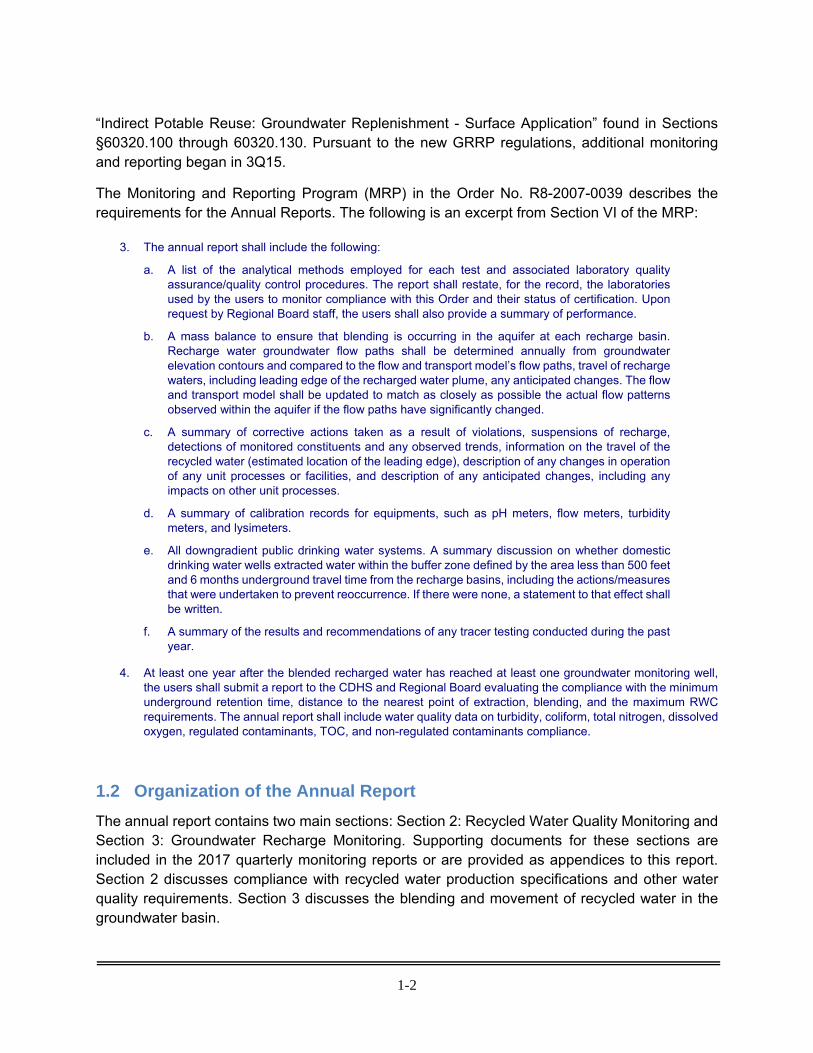
“Indirect Potable Reuse: Groundwater Replenishment - Surface Application” found in Sections §60320.100 through 60320.130. Pursuant to the new GRRP regulations, additional monitoring and reporting began in 3Q15.
The Monitoring and Reporting Program (MRP) in the Order No. R8-2007-0039 describes the requirements for the Annual Reports. The following is an excerpt from Section VI of the MRP:
3. The annual report shall include the following:
a. A list of the analytical methods employed for each test and associated laboratory quality assurance/quality control procedures. The report shall restate, for the record, the laboratories used by the users to monitor compliance with this Order and their status of certification. Upon request by Regional Board staff, the users shall also provide a summary of performance.
b. A mass balance to ensure that blending is occurring in the aquifer at each recharge basin. Recharge water groundwater flow paths shall be determined annually from groundwater elevation contours and compared to the flow and transport model’s flow paths, travel of recharge waters, including leading edge of the recharged water plume, any anticipated changes. The flow and transport model shall be updated to match as closely as possible the actual flow patterns observed within the aquifer if the flow paths have significantly changed.
c. A summary of corrective actions taken as a result of violations, suspensions of recharge, detections of monitored constituents and any observed trends, information on the travel of the recycled water (estimated location of the leading edge), description of any changes in operation of any unit processes or facilities, and description of any anticipated changes, including any impacts on other unit processes.
d. A summary of calibration records for equipments, such as pH meters, flow meters, turbidity meters, and lysimeters.
e. All downgradient public drinking water systems. A summary discussion on whether domestic drinking water wells extracted water within the buffer zone defined by the area less than 500 feet and 6 months underground travel time from the recharge basins, including the actions/measures that were undertaken to prevent reoccurrence. If there were none, a statement to that effect shall be written.
f. A summary of the results and recommendations of any tracer testing conducted during the past year.
4. At least one year after the blended recharged water has reached at least one groundwater monitoring well, the users shall submit a report to the CDHS and Regional Board evaluating the compliance with the minimum underground retention time, distance to the nearest point of extraction, blending, and the maximum RWC requirements. The annual report shall include water quality data on turbidity, coliform, total nitrogen, dissolved oxygen, regulated contaminants, TOC, and non-regulated contaminants compliance.
1.2 Organization of the Annual Report
The annual report contains two main sections: Section 2: Recycled Water Quality Monitoring and Section 3: Groundwater Recharge Monitoring. Supporting documents for these sections are included in the 2017 quarterly monitoring reports or are provided as appendices to this report. Section 2 discusses compliance with recycled water production specifications and other water quality requirements. Section 3 discusses the blending and movement of recycled water in the groundwater basin.
Chino Basin Recycled Water Annual Report: Groundwater Recharge Program January 1 through December 31, 2017 Order No. R8-2007-0039
2-1
2 RECYCLED WATER QUALITY MONITORING
2.1 Recycled Water Quality Specifications
During 2017, recycled water quality monitoring was conducted in accordance with the required frequency for all parameters as specified in MRP No. R8-2007-0039. All monitoring and compliance data for the year can be found in the quarterly monitoring reports submitted to the Regional Board (IEUA 2017a, 2017b, 2017c, 2018).
2.1.1 Detections and Compliance with Narrative Limits
Recycled Water Specifications A.5 though A.9 are narrative limits in the permit. The 2017 recycled water quality monitoring data and associated limits for specifications A.5 through A.9 are shown in Tables 2-1 and 2-2 of the quarterly monitoring reports.
The monitoring and compliance for the parameters in Table 2-1 of the quarterly monitoring reports is based on the analysis of the two separate recycled water sources, Regional Plant No. 1 (RP-1) and Regional Plant No. 4 (RP-4) sampled at the NPDES-permitted monitoring locations (M-001B/REC-001 and REC-002) at their respective facilities. In accordance with MRP No. R8-2007-0039, the required monitoring frequency for turbidity and pH is continuous; total coliform is daily; total inorganic nitrogen (TIN), total nitrogen (TN), and total organic carbon (TOC) is weekly; and total dissolved solids (TDS) is monthly. Compliance with the TN limit of 5 mg/L can also be met at the lysimeters (Table 2-5a of quarterly reports) or at locations specified in alternative monitoring plans (Table 2-5b of quarterly reports). None of the narrative limits for turbidity, coliform, TDS, TIN, pH, or TOC were exceeded during 2017.
Table 2-2 of the quarterly report presents IEUA’s Agency-wide 12-month running average for TDS and TIN as required by the NPDES permit. During 2017, there were no exceedances of the agency-wide 12-month running average for TDS and TIN.
2.1.2 Detections and Compliance with Regulated and Non-regulated Contaminants
Recycled Water Specifications A.1 through A.3 and A.15 of Order No. R8-2007-0039 are limits based primary maximum contaminant levels (MCLs), secondary MCLs, and Action Levels established by the Environmental Protection Agency (EPA). The monitoring for compliance of these parameters is based on the analysis of a sample collected at a recycled water sampling point along the distribution pipeline. The sample point is the turnout to NRG California South, LP (formerly known as Reliant Energy), as it represents a mixture of recycled water from both RP-1 and RP-4. The 2017 recycled water quality monitoring data and associated limits for Recycled Water Specifications A.1 through A.3 are shown in Table 2-3 of the quarterly monitoring reports. Compliance determination for these constituents is based on 4-quarter running averages. In accordance with MRP No. R8-2007-0039, the required monitoring frequency for constituents with primary MCLs is quarterly and constituents with secondary MCLs is annually. During 2017, the 4-quarter running average concentrations for constituents with constituents with primary MCLs,
Chino Basin Recycled Water Annual Report: Groundwater Recharge Program January 1 through December 31, 2017 Order No. R8-2007-0039
2-2
secondary MCLs, and action levels did not exceed compliance limits, with the exception of the secondary MCL for odor (see Section 2.5).
Non-regulated contaminants include the remaining priority pollutants, endocrine disrupting chemicals & pharmaceuticals, and unregulated chemicals. These constituents do not have associated limits; however, they require annual monitoring in accordance with MRP No. R8-2007-0039 (Table II. Recycled Water Monitoring). Several non-regulated contaminants are sampled and reported more frequently than the required annual frequency due to having the same analysis methods used to monitor compounds with primary MCLs. Additionally, in accordance with Title 22, Division 4, Chapter 3. Article 5.1 §60320.120(b) the monitoring frequency of recycled water for chemicals with State notification levels (NLs) increased from annually to quarterly. The non-regulated contaminants monitoring data for recycled water can be found in Table 2-4 of the quarterly monitoring report. In 2017, the annual sampling for the non-regulated contaminants in the recycled water took place during the third quarter of 2017.
The compliance sampling point for Total Trihalomethanes (TTHMs), Total Haloacetic Acids (HAA5), and 1,2,3-Trichloropropane (1,2,3-TCP was added in 3Q17 after it was adopted as a primary MCL in July 2017) are not at the NRG Turnout. Lysimeter compliance sampling for these parameters is performed at groundwater recharge basins actively receiving recycled water prior to sampling. Compliance for TTHMs and HAA5 were consistently met throughout 2017 and 1,2,3-TCP were consistently met starting 3Q17 at the selected lysimeters.
2.2 Groundwater Quality Monitoring
Groundwater quality data is collected at designated monitoring wells, and at the nearest down gradient potable water supply well near recharge basins utilizing recycled water. Location maps for wells monitored for the recharge program are presented on Figures 2-1 through 2-7 for Hickory & Banana, Turner, 7th & 8th Street, Ely, Brooks, Declez & RP3, and San Sevaine & Victoria Basins, respectively. Groundwater quality samples are collected and tested quarterly for all constituents listed in Table 1 of Section V in the MRP R8-2007-0039. At the monitoring wells specified in Condition No. 19 in the Phase I Findings of Fact (FOF) of Order No. R8-2005-0033 and Condition No. 25 in the Phase II FOF of Order No. R8-2007-0039, groundwater quality samples are collected and tested annually for constituents specified in Condition No. 27 of the Phase II FOF.
The 2014 GRRP regulations require two downgradient monitoring wells to be monitored quarterly for Priority Pollutants, and that the wells are located (A) no less than two weeks but no more than six months of travel through the unsaturated zone affected by the project, and (B) at least 30 days upgradient of the nearest drinking water well be monitored quarterly for Priority Toxic Pollutants.
All groundwater-quality data collected at the monitoring wells is reported in Table 2-9a and 2-9b of the quarterly monitoring reports. Annual monitoring data for 2017 can be found in Table 2-9c in the 3Q17 report.
Groundwater quality monitoring results can be used to assess background or baseline conditions, to estimate the time of arrival of recharge waters and the percentage of recycled water at a
Chino Basin Recycled Water Annual Report: Groundwater Recharge Program January 1 through December 31, 2017 Order No. R8-2007-0039
2-3
monitoring well, and to access the impacts of recharged water on down-gradient groundwater supplies. Section 3.2 and Section 3.4 of this report describe how the groundwater quality monitoring results are used for these purposes in more detail. Section 2.5 of this report describes any exceedances of a primary or secondary MCL, or the presence of total coliform in groundwater samples during 2017, and the notification to the DDW.
2.3 Laboratory Certifications and Test Methods
Water quality samples collected for the recycled water recharge program are analyzed by either the IEUA or Eurofins Eaton Analytical (EEA) laboratories. Both laboratories are DDW Environmental Laboratory Accreditation Program (ELAP) certified, pursuant to the California Environmental Laboratory Improvement Act. The IEUA laboratory certification is valid through October 2019 and the EEA laboratory certification is valid through January 2019.
To ensure the quality and reliability of test measurements and results, specific programs and procedures have been developed by both the IEUA and EEA. The 2017 Annual Laboratory QA/QC Data Summary Report was also submitted to the Regional Board as an attachment in IEUA’s 2017 Annual NPDES Report.
2.4 Calibration Summary
The field parameters of temperature, pH, conductivity, dissolved oxygen, oxidation/reduction potential were recorded during monitoring well sampling using a QED MP20 Multiparameter Meter. This instrument utilizes a flow-cell to allow water to flow through the meter chamber without exposure to the atmosphere. Field analytical instruments used throughout this project were maintained and calibrated each day of use. Calibration was conducted according to instructions provided by the instrument manufacturer.
2.5 Violations, Suspensions, and Corrective Actions
No operational problems or corrective actions at RP-1 or RP-4 were initiated based on regulatory monitoring at the NRG Turnout and at the recharge basins.
Odor has a secondary MCL of 3 Units in Recycled Water Specification A.3. During every quarter of 2017, the 4-quarter running average threshold odor value exceeded the secondary MCL. The odor has been identified by EEA as chlorine. Recycled water used for groundwater recharge must meet disinfected tertiary recycled water standards in accordance to Title 22. Sodium hypochlorite is used as the disinfection agent at the RP-1 and RP-4 water recycling facilities; hence, the smell of chlorine is prominent in recycled water and is therefore unavoidable. Order No. R8-2007-0039 allows compliance for secondary MCLs to be determined at the mound monitoring well. Based on the mound monitoring well data (Table 2-9a in the quarterly reports), threshold odor does not exceed 3 Units at any of the monitoring wells.
During 2017, there were exceedances of limits for constituents sampled at groundwater monitoring wells adjacent to recharge basins receiving recycled water. These exceedances were primarily for secondary MCLs, and some for primary MCLs, and total coliform presence. The DDW
Chino Basin Recycled Water Annual Report: Groundwater Recharge Program January 1 through December 31, 2017 Order No. R8-2007-0039
2-4
is notified within 48 hours of receiving the results for primary MCL exceedances or coliform presence at active municipal drinking water wells. Exceedances of primary MCLs and coliform presence at non-drinking water monitoring wells and all secondary MCL exceedances will only be reported in the quarterly reports.
As required in MRP R8-2007-0039 Section V.2 the DDW were notified when necessary. The following describes the exceedances that were detected during 2017 groundwater sampling, and any DDW notification:
Turbidity exceeding the secondary MCL of 5 NTU was observed at several wells, namely: 8TH-1/1, Bishop of San Bernardino Corporation (Ely), BRK-1/1, BRK-2/1, BRK-2/2, DCZ-1/1, Ely MW1, RP3-1/1, T-2/1, and VCT-1/1.
The secondary MCL of 15 units for color was exceeded at several wells, namely: 8TH-1/1, Bishop of San Bernardino Corporation (Ely), BRK-1/1, BRK-2/1, BRK-2/2, DCZ-1/1, and RP3-1/1.
The secondary MCL for pH within the range of 6.5 to 8.5 was exceeded at Ontario Well No. 38 and Reliant Energy – East Well.
The secondary MCL of 3 units for threshold odor was exceeded at Reliant Energy – East Well.
The secondary MCLs of 50 µg/L for manganese and 300 µg/L for iron were exceeded at Ely MW1.
TDS and electrical conductivity (EC) were higher than their secondary MCLs of 500 mg/L and 900 µmhos/cm, respectively, in the RP3 basin area wells (Alcoa MW3 and Southridge JHS) and Ely MW2 (Walnut). Bishop of San Bernardino Corporation and RP3-1/1 exceeded the TDS secondary MCL. The wells south of the Ely Basins and near the RP3 Basins are in areas where the TDS and EC concentrations in groundwater are historically elevated. The distribution of TDS concentrations observed at wells in the Chino Basin is summarized in Watermaster’s State of the Basin Reports.
Some monitoring wells, including potable supply wells, in the Banana-Hickory, RP3, Brooks, and Ely Basins monitoring networks have NO3-N concentrations above the primary MCL of 10 mg/L. These higher levels are characteristic of groundwater quality in the local area where historically the NO3-N concentrations range from 10-30 mg/L. The distribution of NO3-N concentrations observed at wells in the Chino Basin are summarized in Watermaster’s State of the Basin Reports. No notifications were made to the DDW as these high NO3-N concentrations are comparable to the ambient NO3-N concentration in groundwater for each monitoring well’s respective groundwater management zone within the Chino Basin.
Total coliform was detected at various wells during 2017. In accordance with the MRP, notification to the DDW of coliform presence in active municipal drinking water wells must be made within 48 hours of receiving the results. There were no notifications made to the
Chino Basin Recycled Water Annual Report: Groundwater Recharge Program January 1 through December 31, 2017 Order No. R8-2007-0039
2-5
DDW for coliform presence 2017, as none of wells that showed coliform presence were active municipal drinking water wells.
Unitex 91090 is an active private potable well that has shown coliform presence. No notification was made to the DDW or municipality due to the well not being a municipal well. Additionally, there has been no recycled water recharge upgradient of this well at San Sevaine 5 since 2Q14.
During the annual sampling event, the perchlorate concentration at BRK-1/2 was above the primary MCL of 6 µg/L. Perchlorate concentrations at BRK-1/2 have always been at levels slightly above the MCL since sampling at this well began in early 2007, prior to recycled water recharge. The perchlorate concentrations in BRK-1/2 are consistent with historical background groundwater concentration founds at nearby wells in the Pomona area. The perchlorate concentrations in these areas are reported in the Watermaster’s State of the Basin reports.
2.6 Unit Process Changes and Anticipated Impact on Water Quality
No unit process changes occurred during the 2017 calendar year, therefore there was no impact on water quality.
2.7 Summary of Chemical Usage
The summary of treatment chemicals used on a monthly basis at RP-1 and RP-4 during the 2017 calendar year is presented in Table 2-1.
Chino Basin Recycled Water Annual Report: Groundwater Recharge Program January 1 through December 31, 2017 Order No. R8-2007-0039
3-1
3 GROUNDWATER RECHARGE MONITORING
3.1 Summary of Recharge Operations
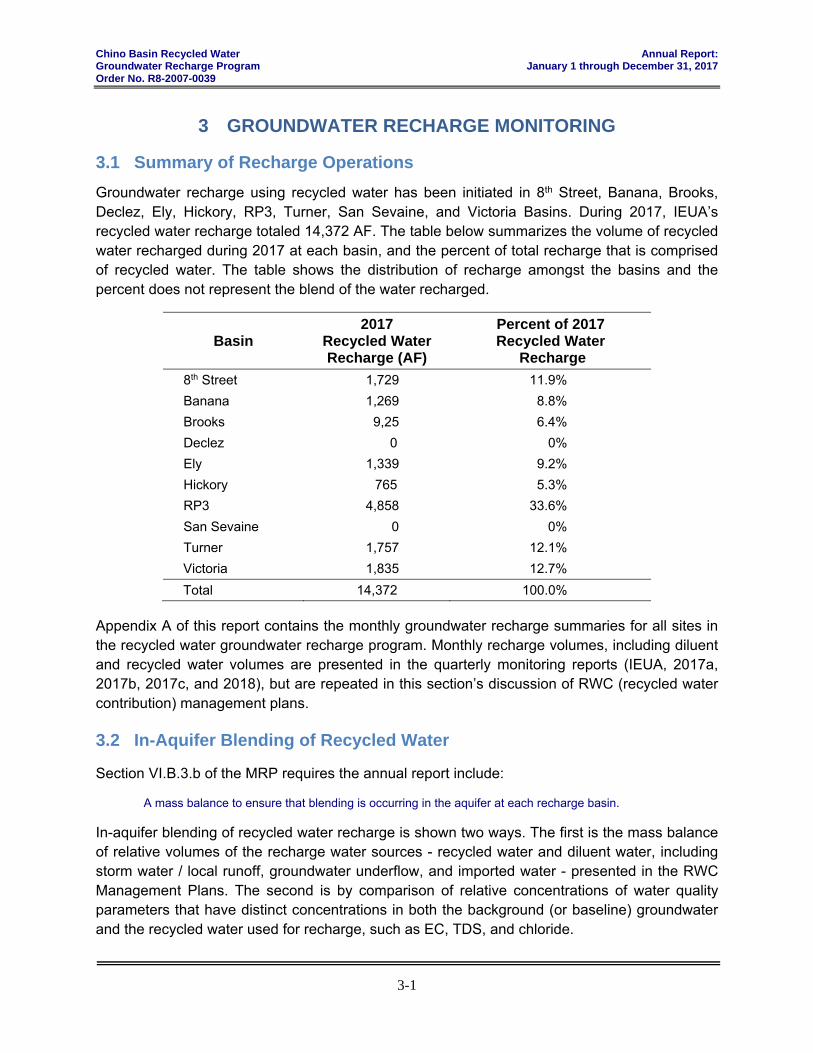
Groundwater recharge using recycled water has been initiated in 8th Street, Banana, Brooks, Declez, Ely, Hickory, RP3, Turner, San Sevaine, and Victoria Basins. During 2017, IEUA’s recycled water recharge totaled 14,372 AF. The table below summarizes the volume of recycled water recharged during 2017 at each basin, and the percent of total recharge that is comprised of recycled water. The table shows the distribution of recharge amongst the basins and the percent does not represent the blend of the water recharged.
Basin 2017
Recycled Water Recharge (AF)
Percent of 2017 Recycled Water
Recharge
8th Street 1,729 11.9%
Banana 1,269 8.8%
Brooks 9,25 6.4%
Declez 0 0%
Ely 1,339 9.2%
Hickory 765 5.3%
RP3 4,858 33.6%
San Sevaine 0 0%
Turner 1,757 12.1%
Victoria 1,835 12.7%
Total 14,372 100.0%
Appendix A of this report contains the monthly groundwater recharge summaries for all sites in the recycled water groundwater recharge program. Monthly recharge volumes, including diluent and recycled water volumes are presented in the quarterly monitoring reports (IEUA, 2017a, 2017b, 2017c, and 2018), but are repeated in this section’s discussion of RWC (recycled water contribution) management plans.
3.2 In-Aquifer Blending of Recycled Water
Section VI.B.3.b of the MRP requires the annual report include:
A mass balance to ensure that blending is occurring in the aquifer at each recharge basin.
In-aquifer blending of recycled water recharge is shown two ways. The first is the mass balance of relative volumes of the recharge water sources - recycled water and diluent water, including storm water / local runoff, groundwater underflow, and imported water - presented in the RWC Management Plans. The second is by comparison of relative concentrations of water quality parameters that have distinct concentrations in both the background (or baseline) groundwater and the recycled water used for recharge, such as EC, TDS, and chloride.
Chino Basin Recycled Water Annual Report: Groundwater Recharge Program January 1 through December 31, 2017 Order No. R8-2007-0039
3-2
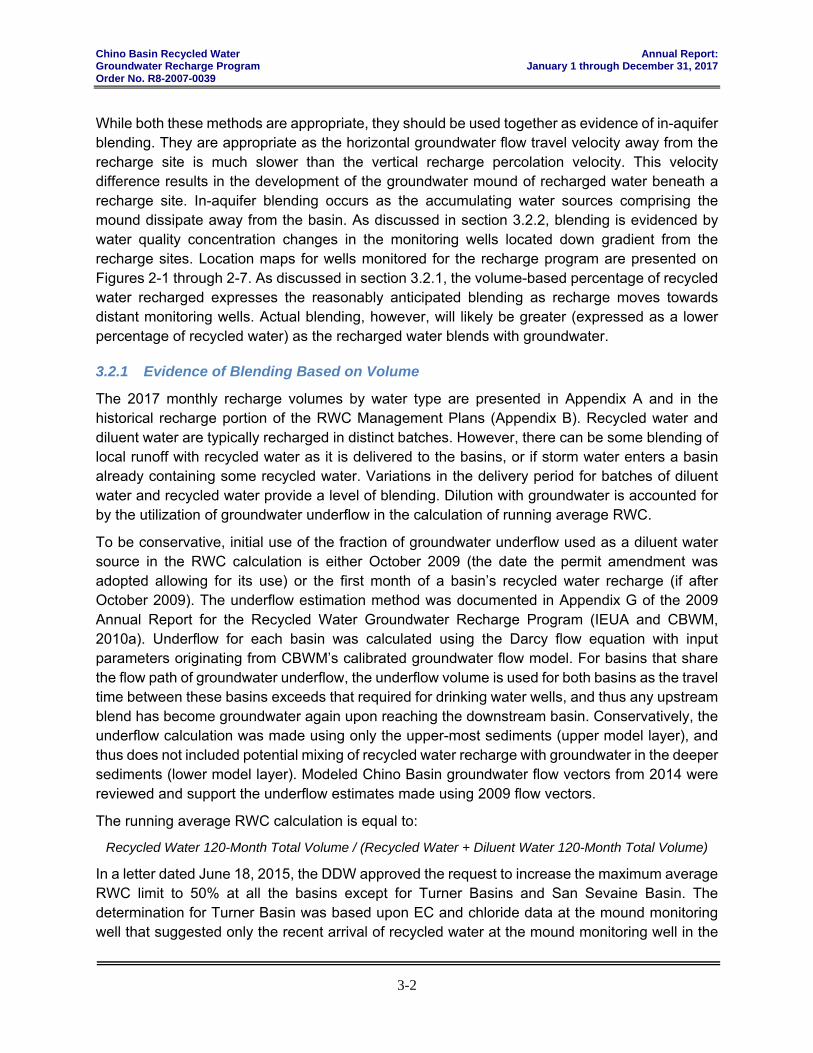
While both these methods are appropriate, they should be used together as evidence of in-aquifer blending. They are appropriate as the horizontal groundwater flow travel velocity away from the recharge site is much slower than the vertical recharge percolation velocity. This velocity difference results in the development of the groundwater mound of recharged water beneath a recharge site. In-aquifer blending occurs as the accumulating water sources comprising the mound dissipate away from the basin. As discussed in section 3.2.2, blending is evidenced by water quality concentration changes in the monitoring wells located down gradient from the recharge sites. Location maps for wells monitored for the recharge program are presented on Figures 2-1 through 2-7. As discussed in section 3.2.1, the volume-based percentage of recycled water recharged expresses the reasonably anticipated blending as recharge moves towards distant monitoring wells. Actual blending, however, will likely be greater (expressed as a lower percentage of recycled water) as the recharged water blends with groundwater.
3.2.1 Evidence of Blending Based on Volume
The 2017 monthly recharge volumes by water type are presented in Appendix A and in the historical recharge portion of the RWC Management Plans (Appendix B). Recycled water and diluent water are typically recharged in distinct batches. However, there can be some blending of local runoff with recycled water as it is delivered to the basins, or if storm water enters a basin already containing some recycled water. Variations in the delivery period for batches of diluent water and recycled water provide a level of blending. Dilution with groundwater is accounted for by the utilization of groundwater underflow in the calculation of running average RWC.
To be conservative, initial use of the fraction of groundwater underflow used as a diluent water source in the RWC calculation is either October 2009 (the date the permit amendment was adopted allowing for its use) or the first month of a basin’s recycled water recharge (if after October 2009). The underflow estimation method was documented in Appendix G of the 2009 Annual Report for the Recycled Water Groundwater Recharge Program (IEUA and CBWM, 2010a). Underflow for each basin was calculated using the Darcy flow equation with input parameters originating from CBWM’s calibrated groundwater flow model. For basins that share the flow path of groundwater underflow, the underflow volume is used for both basins as the travel time between these basins exceeds that required for drinking water wells, and thus any upstream blend has become groundwater again upon reaching the downstream basin. Conservatively, the underflow calculation was made using only the upper-most sediments (upper model layer), and thus does not included potential mixing of recycled water recharge with groundwater in the deeper sediments (lower model layer). Modeled Chino Basin groundwater flow vectors from 2014 were reviewed and support the underflow estimates made using 2009 flow vectors.
The running average RWC calculation is equal to:
Recycled Water 120-Month Total Volume / (Recycled Water + Diluent Water 120-Month Total Volume)
In a letter dated June 18, 2015, the DDW approved the request to increase the maximum average RWC limit to 50% at all the basins except for Turner Basins and San Sevaine Basin. The determination for Turner Basin was based upon EC and chloride data at the mound monitoring well that suggested only the recent arrival of recycled water at the mound monitoring well in the
Chino Basin Recycled Water Annual Report: Groundwater Recharge Program January 1 through December 31, 2017 Order No. R8-2007-0039
3-3
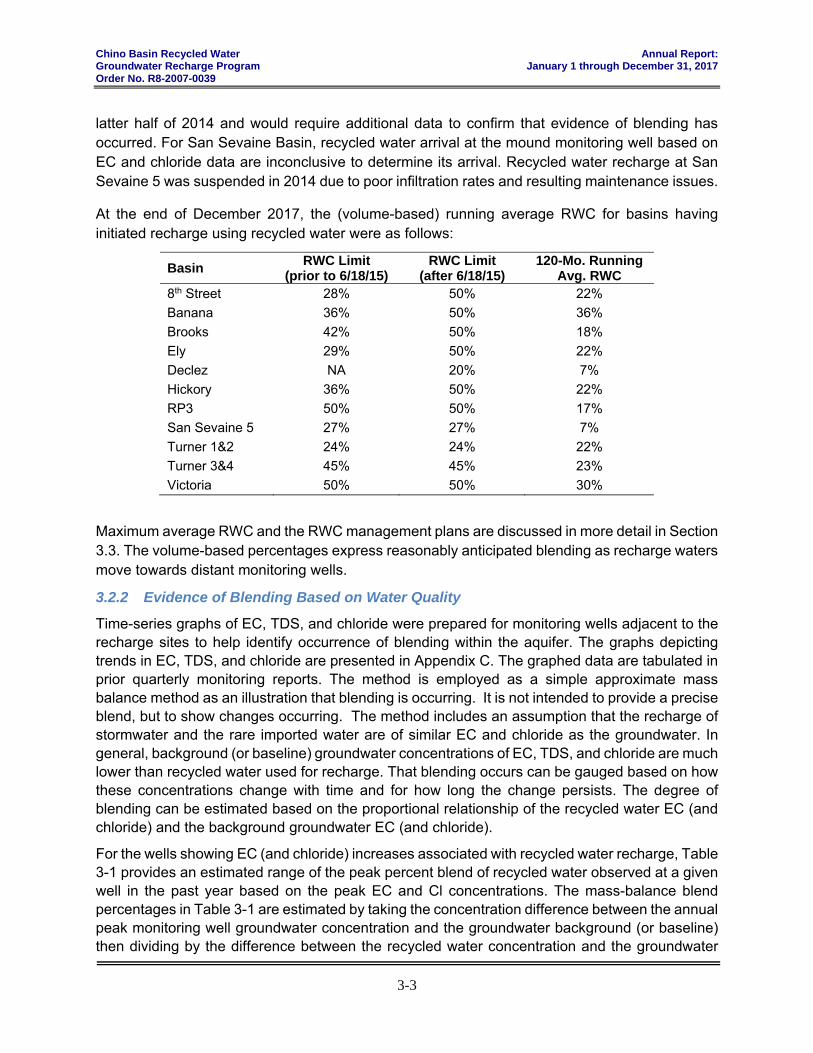
latter half of 2014 and would require additional data to confirm that evidence of blending has occurred. For San Sevaine Basin, recycled water arrival at the mound monitoring well based on EC and chloride data are inconclusive to determine its arrival. Recycled water recharge at San Sevaine 5 was suspended in 2014 due to poor infiltration rates and resulting maintenance issues.
At the end of December 2017, the (volume-based) running average RWC for basins having initiated recharge using recycled water were as follows:
Basin RWC Limit
(prior to 6/18/15) RWC Limit
(after 6/18/15) 120-Mo. Running
Avg. RWC 8th Street 28% 50% 22%
Banana 36% 50% 36%
Brooks 42% 50% 18%
Ely 29% 50% 22%
Declez NA 20% 7%
Hickory 36% 50% 22%
RP3 50% 50% 17%
San Sevaine 5 27% 27% 7%
Turner 1&2 24% 24% 22%
Turner 3&4 45% 45% 23%
Victoria 50% 50% 30%
Maximum average RWC and the RWC management plans are discussed in more detail in Section 3.3. The volume-based percentages express reasonably anticipated blending as recharge waters move towards distant monitoring wells.
3.2.2 Evidence of Blending Based on Water Quality
Time-series graphs of EC, TDS, and chloride were prepared for monitoring wells adjacent to the recharge sites to help identify occurrence of blending within the aquifer. The graphs depicting trends in EC, TDS, and chloride are presented in Appendix C. The graphed data are tabulated in prior quarterly monitoring reports. The method is employed as a simple approximate mass balance method as an illustration that blending is occurring. It is not intended to provide a precise blend, but to show changes occurring. The method includes an assumption that the recharge of stormwater and the rare imported water are of similar EC and chloride as the groundwater. In general, background (or baseline) groundwater concentrations of EC, TDS, and chloride are much lower than recycled water used for recharge. That blending occurs can be gauged based on how these concentrations change with time and for how long the change persists. The degree of blending can be estimated based on the proportional relationship of the recycled water EC (and chloride) and the background groundwater EC (and chloride).
For the wells showing EC (and chloride) increases associated with recycled water recharge, Table 3-1 provides an estimated range of the peak percent blend of recycled water observed at a given well in the past year based on the peak EC and Cl concentrations. The mass-balance blend percentages in Table 3-1 are estimated by taking the concentration difference between the annual peak monitoring well groundwater concentration and the groundwater background (or baseline) then dividing by the difference between the recycled water concentration and the groundwater
Chino Basin Recycled Water Annual Report: Groundwater Recharge Program January 1 through December 31, 2017 Order No. R8-2007-0039
3-4
background (or baseline). The background groundwater EC in Table 3-1 is the approximate well water concentration prior to recycled water recharge. The recycled water EC in Table 3-1 is the current calendar year average concentration of the blended RP-1 and RP-4 recycled water.
8th Street Basin Area
For the 8th Street Basin area, in the shallower monitoring well (8TH-1/1) there was a 2009-10 increase in chloride concentrations indicating the arrival of recycled water that was recharged in 2007 and 2008. This represents an approximate 21-month travel time for recharge in the north portion of 8th Street Basin to percolate to the water table and travel to 8TH-1/1. In 2015, the 8TH-1/1 monitoring well groundwater EC, TDS, and chloride concentrations were the highest since the initiation of recycled water recharge at the 8th Street Basin. EC concentrations showed an increasing trend in 2017, while chloride and TDS concentrations showed a decreasing trend. As presented in Table 3-1, the highest percent blend of recycled water in the groundwater mound at 8TH-1/1 during 2017 was approximately 60% to 64% based on chloride and EC concentrations. After the 2015 peak, recycled water blend at the well decreased through 2017.
In the deeper casing (8TH-1/2), there were slight increases in the EC, TDS, and chloride concentrations from mid-2011 to 2017 after trending downward since the well was constructed in 2007. These increases suggest recycled water recharge upon start up in 2007 and 2008 may have started to arrive in the deeper casing after a travel time of roughly 46 months. From 2011 through 2017, 8TH-1/2 groundwater EC, TDS, and chloride concentrations continued a gradual rise, suggesting that the movement of recycled water downward at this location may be blending with underflow at a nearly steady rate. As the TDS and EC data are within historical, pre-recycled water recharge values, continued monitoring of these two water quality parameters at the deeper casing is needed to identify with certainty the arrival and blending of recycled water at this depth. At 50 mg/L, the chloride concentration continues to be above background levels (approximately 20 mg/L) However, recycled water arrival would be confirmed should EC and TDS continue to rise significantly above the 2011 baseline concentrations (460 μmhos/cm and 300 mg/L, respectively) at this location and depth. As presented in Table 3-1, the highest percent blend of recycled water in the groundwater mound at 8TH-1/2 during 2017 may have reached approximately 35% based on chloride concentrations.
Between 2007 and 2017, the shallower casing of monitoring well 8TH-2 (8TH-2/1) shows cyclical seasonal variations and a trend of decreasing in EC, TDS, and chloride that make the arrival of recycled water somewhat difficult to evaluate. Arrival of recycled water at 8TH-2/1 would likely be observed as a longer-term increase in the cyclical annual peaks of EC, TDS, and chloride. In 2016 and 2017, EC and TDS peaks were greater than their historical peak (about 50 mg/L higher for TDS). This would suggest an 8.5 to 9-year travel time to this well casing. Chloride remained in the historical range. Water quality monitoring of the deeper well casing of 8TH-2 (located approximately 2,500 feet farther from 8TH-1) was suspended in the third quarter of 2015, and resumed in the second quarter of 2017. Since monitoring began in 2007, there is insufficient indication from 8TH-2/2 to identify a recycled water source in the groundwater in relation to the recharge operations at 8th Street Basin. In the deeper casing of monitoring well 8TH-2 (8TH-2/2), TDS and EC concentrations both showed an increase from 2007 through mid-2009 followed by a consistent decrease through early 2015 to below the initial 2007 concentrations. This increase and then decrease in concentration is sooner than would be excepted if it were caused by recycled

Chino Basin Recycled Water Annual Report: Groundwater Recharge Program January 1 through December 31, 2017 Order No. R8-2007-0039
3-5
water recharge based on the well distance from the recharge basin and is thus considered background variations. Between 2007 and early 2017, these data likely indicate varied concentrations of groundwater are moving past the well site. Of note, chloride concentrations appear to be trending slowly upwards in 2017 to a historical high (35 mg/l) and should watched for possible higher concentrations in 2018.
Banana & Hickory Basins Area
Beginning in early 2008 and plateauing in mid-2009, the deeper casing of monitoring well BH-1 (BH-1/2) located adjacent to Hickory Basin demonstrated significant changes in EC, TDS, and chloride (a 110-mg/L difference in TDS). These changes are attributed to the initiation and continued recharge of recycled water at Hickory and Banana Basins. In 2010 through 2014, generally consistent EC, TDS, and chloride concentrations of the groundwater at BH-1/2 are observed and suggest a stabilized RWC with historical operations at Hickory and Banana Basins. In mid-2014 through 2015, EC, TDS, and chloride data increased to historically high levels (another 130 mg/L increase in TDS). In 2016 and 2017, concentrations remained fairly stable. As presented in Table 3-1 in 2017, the highest percent blend of recycled water the groundwater mound at BH-1/2 based on EC and chloride variations reached approximately 90% to 100%.
Since initiation of recycled water recharge in 2005, the California Speedway Infield Well, south of Banana Basin, showed gradual increases in EC, TDS, and chloride concentrations through 2015 (150-mg/L TDS and 19 mg/L chloride differences). The gradual increase is to be expected with gradual blending as groundwater moves away from the basin (compare with the 150 to 200-mg/L TDS variation at the basin area mound). Travel time from Banana Basin to the California Speedway Infield Well based on these data is approximately 29 months. In 2016 and 2017, concentrations of EC, TDS, and chloride generally plateaued at peak historical levels. As presented in Table 3-1 based on EC and chloride variations, in 2017 the highest percent blend of recycled water in the groundwater at the California Speedway Infield Well reached approximately 28% to 68%.
For downgradient well California Speedway No. 2, EC, TDS, and chloride concentrations generally remained the same from 2005 through mid-2012. In April 2012, a slight increase in concentration trend began and continued through 2017. While small, the change supports a recycled water arrived at this well in April 2012, an approximately 6.5-year travel time. As presented in Table 3-1 based on EC and chloride variations, in 2017 the highest percent blend of recycled water in the groundwater at the California Speedway Well No. 2 reached approximately 10% to 25%.
For downgradient well Reliant East, the EC, TDS, and chloride data do not definitively suggest arrival of recycled water recharge, although slight increases in the monitored parameters were observed in 2015 and 2016. Continued observation of the Reliant well is needed to evaluate whether it is being impacted by recycled water recharge. Ontario Well No. 20 was taken out of service in 2015 and is no longer monitored. Fontana Water Company 37A (located 2,240 feet up gradient of Banana basin) was taken out of service in 2016 and will be replaced with Fontana Water Company 7A in 2018.
Chino Basin Recycled Water Annual Report: Groundwater Recharge Program January 1 through December 31, 2017 Order No. R8-2007-0039
3-6
Brooks Basin Area
For the Brooks Basin area, monitoring wells are located at the basin (BRK-1) and downgradient of the basin (BRK-2). Water quality monitoring of the deeper casing (BRK-1/2 and BRK-2/2) was suspended in the second quarter of 2015 and resumed in second quarter 2017. Monitoring was resumed at these deeper wells to track a peak change in the parameters being sampled.
Recycled water recharge began in September 2008. EC, TDS, and chloride concentrations at BRK-1/1 show seasonal increases and decreases through its history, likely related to recharge activity. From 2013 to 2017, concentration increases of 150 mg/L for TDS and 60 mg/L for chloride have been observed and attributed to the presence of recycled water at BRK-1/1. In 2015, 2016, and 2017, the EC and TDS concentrations have been relatively stable in BRK-1/1. However, chloride concentrations decreased from approximately 110 mg/L in 2015 to 90 mg/L in 2017. As presented in Table 3-1 based on EC and chloride variations, the highest percent blend of recycled water in the groundwater mound at the recharge basin during 2017 reached approximately 86 to 100% at BRK-1/1. The historical data shows that blending occurs in the aquifer beneath Brooks Basin. In the deeper casing (BRK-1/2), a smaller (than BRK-1/1) increases in EC, TDS, and chloride began in January 2010 and continued through 2017. Concentration increases of 100 mg/L for TDS and 10 mg/L for chloride have been observed and are attributed to the presence of recycled water at BRK-1/2. Based on the historical EC and chloride data, the percent blend of recycled water at BRK-1/2 has been approximately 10% to 59%.
The chloride concentrations at BRK-2/1 show a 35-mg/L stepped increase in 2011 that oddly coincides with a 100 μmhos/cm decrease in EC. Then in 2012 and continuing through 2014, chloride concentrations decreased to background levels while EC and TDS increase steadily. Beginning in mid-2014 through 2017, chloride concentrations in BRK-2/1 increased sharply (approximately 40 mg/L) to historical highs, similar to the increase observed from mid-2010 through mid-2011. While the chloride trends may indicate pulses of arrival of recycled water recharge in the shallower casing groundwater, continued observations at this well would be necessary to identify, with certainty, the presence of recycled water based on TDS and EC changes. The return to background concentrations through 2013 and 2014 could suggest a change in groundwater flow direction (of Brooks Basin recharge) around this well. Groundwater flow direction west of Brooks Basin is subject to the dynamics of a pumping depression in Pomona which has been observed to gradually shift location and magnitude over the years (see Appendix E). For downgradient well BRK-2/2, the EC, TDS, and chloride data are relatively stable and do not definitively suggest arrival of recycled water recharge. Continued observation of the BRK-2/2 is needed to evaluate whether it is being impacted by recycled water recharge.
Ely Basin Area
Groundwater in the area directly south of Ely Basin (south of the 60 Freeway) is on the northern perimeter of a portion of the Chino Groundwater Basin with high TDS and nitrate concentrations. Groundwater in this area has TDS concentrations between 500 and 1,000 mg/L, as is typical of the Chino Basin areas with a long irrigation history (CBWM & IEUA, 2003). Recycled water has been recharged at Ely Basin since 1999. Quarterly sampling of the Ely area monitoring wells began in 2007, when the site was incorporated in the program’s recharge permit.
For Ely Basin, monitoring wells are located at the basin (Philadelphia well) and downgradient (Walnut well and Riverside well). Historical recycled water recharge is estimated to have traveled
Chino Basin Recycled Water Annual Report: Groundwater Recharge Program January 1 through December 31, 2017 Order No. R8-2007-0039
3-7
to and beyond the three monitoring wells directly downgradient of Ely basin due to the basin’s recharge history and the wells proximity to the basin (0.0 miles, 0.5 mile and 1.0 mile for the Philadelphia, Walnut, and Riverside wells, respectively).
The late 2014 sample results at the Philadelphia well show EC and chloride at historical high levels nearly equal to that of recycled water. Due to drought conditions in 2014, recycled water was the predominant recharge source water. In 2015 2016, and 2017, the EC, TDS and chloride concentrations at the Philadelphia well have decreased slightly, but remain well above pre-2014 levels. As presented in Table 3-1 based on EC and chloride variations, the highest percent blend of recycled water in the groundwater at the Philadelphia well during 2017 reached approximately 67% to 85%.
At the downgradient Walnut and Riverside wells, the high background concentrations of EC, TDS, and chloride make it difficult to identify the arrival of lower concentration storm water and recycled water. The EC, TDS, and chloride concentrations at the Walnut well have historically been at 1.5 to 2 times the concentrations found in recycled water. It is thus difficult to attribute variations in concentration with recharge activity at Ely Basin. The lower TDS concentrations in 2009 to 2011 may be linked with more intense periods of storm water and recycled water recharge that would dilute the higher background TDS groundwater; however, these return to higher levels in from 2011 to 2017. Further down gradient of the Walnut well, the EC, TDS, and chloride of groundwater at the Riverside well are relatively stable but exhibited a gradual increase in concentration between 2007 and 2015 followed by a slight decrease in 2016 and 2017. These results do not indicate any direct seasonal changes from recycled water or diluent water recharge at Ely Basin. The volume-based percent recycled water recharged at Ely basin has been between 12% and 22% the past 5 years (including groundwater underflow).
Turner Basin Area
The Turner Basin area monitoring well TRN-1/2 (at Turner 1) has historical and temporal variations in EC, TDS, and chloride (100 to 200 mg/L for TDS) that can be attributed to cycles of recycled water recharge. For the 5 years after the Turner 1 recycled water start-up period (2006-2007), recycled water deliveries had been limited, and thus EC, TDS, and chloride concentrations decreased towards background levels. However, with the recent drought conditions, a larger volume of recycled water was delivered in late 2014, 2015, and early 2017 than prior years. The rapid fluctuations in TDS, EC, and chloride concentrations at TRN-1 indicate recharge water moves quickly away from the Turner 1 basin. As presented in Table 3-1 based on EC and chloride variations, the highest percent blend of recycled water in the groundwater mound at Turner 1 during 2017 was approximately 79% to 100% at TRN-1/2.
At monitoring well TRN-2/2 (adjacent to Turner 4), the EC, TDS, and chloride concentrations are delayed several months from past recharge activities. The slower and smaller relative concentration changes (compared to TRN-1/2) suggests that recharge from Turner 4 is more laterally distributed when it reaches the groundwater table. This is consistent with the slower recharge rates observed at Turner 4. In 2017, Turner 4 mound had a lower percent of recycled water than the prior two years. As presented in Table 3-1 based on EC and chloride variations, the highest percent blend of recycled water in the groundwater mound at the Turner 4 basin during 2017 was approximately 40% to 55%. The TRN-1/2 and TRN-2/2 data show recycled water blending is occurring with groundwater in the aquifer beneath the Turner Basins.
Chino Basin Recycled Water Annual Report: Groundwater Recharge Program January 1 through December 31, 2017 Order No. R8-2007-0039
3-8
Downgradient from the Turner Basins, Ontario Well No. 25 showed a slight increase in EC (75 μmhos/cm), TDS (40 mg/L), and chloride (10 mg/L) above background levels that suggest recycled water arrival in July 2010. Between mid 2010 through 2016, the EC, TDS and chloride concentrations in Ontario Well No. 25 have remained relatively constant. Declines towards background concentrations were observed by the end of 2017. Estimated travel time based on these water quality data is approximately 48 months. As presented in Table 3-1 based on EC and chloride variations, the highest percent blend of recycled water in the groundwater at Ontario Well No. 25 during 2017 was approximately 7% to 8%.
In January 2009 through 2010, downgradient Ontario Well No. 29 showed a slight stepped increase in TDS and chloride concentration similar in magnitude to the gradual rise at Ontario Well No. 25. However, the increases at Ontario Well No. 29 are within the range of background data. These changes are not definitive changes that would correlate with groundwater recharge using recycled water. Ontario Well No. 29 was not sampled from October 2010 to October 2012 because the well was out of commission. The 2013 and 2017 data are lower than the wells’ peak values in 2010 and are within background concentrations. Additional data from future monitoring are required to assess the arrival and blending of recycled water at Ontario Well No. 29.
RP3 Basin Area
For the RP3 Basins area, the initiation of recycled water recharge occurred in June 2009. Through 2012, variations in water quality concentrations from the RP3-1 monitoring wells were difficult to draw conclusions from regarding the percent recycled water. The variations were likely due to purging of higher TDS and chloride water from the soil and groundwater beneath the basin. By April 2012, EC, TDS, and chloride concentrations reached historical lows for this well site. From late 2012 through late 2017, EC, TDS, and chloride concentrations steadily increased. Use of the low values in 2012 as baseline conditions followed by a steady rise in EC, TDS, and chloride through 2017, has provided sufficient data to estimate a blend of recycled water beneath the basin. As presented in Table 3-1 based on EC and chloride variations, the percent blend of recycled water in the groundwater during 2017 at well RP3-1/1 was 97% to 100%. Due to their similarities in water quality, sampling of the deeper casing RP3-1/2 was discontinued in 2015.
Downgradient well ALCOA MW-1 shows seasonal (summer through early fall) spikes in EC, TDS, and chloride from 2011 through 2017. These spikes of high concentrations are greater in magnitude than their respective concentrations in recycled water, and thus are likely due to salt contamination moving past the well. The background concentrations at ALCOA MW-1 are similar to that of recycled water. More data is required to correlate the arrival of recycled water recharge at ALCOA MW-1.
Downgradient well ALCOA MW-3 has higher EC, TDS, and chloride concentrations than ALCOA MW-1. In 2017, ALCOA MW-3 groundwater continued to show fluctuating EC, TDS, and chloride concentrations, which suggests salt contamination moving past the well site. The EC has ranged from 785 to 1,163 μmhos/cm which is higher than the recycled water EC (about 750 μmhos/cm). More data is required to evaluate the arrival of recycled water at ALCOA MW-3.
The Southridge Junior High School (JHS) well water quality data show a slight but gradual decrease in EC, TDS, and chloride concentrations since quarterly sampling began in 2009 through 2013 and then relatively stable values through 2017. The background concentrations at the Southridge JHS well are higher than that of recycled water. As such, mixing of groundwater
Chino Basin Recycled Water Annual Report: Groundwater Recharge Program January 1 through December 31, 2017 Order No. R8-2007-0039
3-9
with recycled water at this location would appear as a slight downward trend. Alternatively, it could increase as higher salinity upgradient groundwater moves southward. The well data do not suggest that recycled water recharge has reached the downgradient Southridge JHS well from the RP3 recharge site. In 2013, the well pump’s electric motor failed and no samples were collected until its repair in 2014. In 2014, the well was rehabilitated and the pump was replaced. A well video was conducted and identified the well is screened at multiple depths. Louvered well screen intervals were observed below ground surface from 100 feet to 140 feet, 160 feet to 200 feet, 220 feet to 258 feet, 278 feet to 320 feet, and 340 feet to 360 feet.
Declez Basin Area
Recycled water recharge at Declez Basin began in December 2015 and was voluntarily suspended in September 2016 after its Start-Up Period. Recycled water recharge will resume in 2018 upon completion of an intermediate downgradient monitoring well. Background EC, TDS, and chloride have notable annual variation in concentration, which may make determination of percent recycled water difficult. In 2017 all parameters rose to slightly higher than prior background levels. Conditions at DCZ-1/1 appear to be similar to the fluctuations at the upstream ALCOA and Southridge monitoring wells. The two DCZ-1/1 EC data spikes during the start-up period are likely anomalous as they do not remain high as does the basin surface water and lysimeter waster (IEUA, draft Start-Up Protocol for Declez Basin) and these spikes are not seen in the TDS and chloride data. Additional long-term monitoring will be needed to determine the impact of recycled water recharge at this location.
San Sevaine & Victoria Basins Area
Monitoring of San Sevaine and Victoria Basins area wells began in late 2009. Initiation of recycled water recharge began in these two basins in mid-2010. Recycled water recharge at San Sevaine 5 was suspended voluntarily in 2014 to develop plans to mitigate poor infiltration rates and midgefly control. The solution was to build a pipeline to the San Sevaine 1, 2, and 3 basins and resume recycled water recharge there in mid 2018. For the San Sevaine area, the trends in EC, TDS, and chloride have yet to indicate a detectable arrival of recycled water at monitoring wells SS-1 and Unitex 91090. Both wells show slightly declining or stable concentrations.
Victoria Basin mound monitoring well VCT-1/1 shows a steady increase in EC, TDS, and chloride concentrations beginning in May 2011 that continued into early 2016. These values stabilize in mid to late 2016 at values typical of recycled water. Through 2017, these parameters began to decline slightly. Mound monitoring well VCT-1/1 water quality data support a travel time of approximately 7.5 months based on the initiation of recycled water recharge on September 2, 2010 and its arrival detection with the May 19, 2011 sample. As presented in Table 3-1 based on EC and chloride variations, the percent blend of recycled water in the groundwater mound at Victoria Basin during 2016 was 93% to 96% at VCT-1/1. Downgradient wells VCT-2 and CVWD No. 39 have not shown any EC, TDS, or chloride variations that would indicate arrival of recycled water.
3.3 RWC Management Plan
The RWC Management Plan is a necessary tool to demonstrate how IEUA and CBWM will meet the maximum RWC limits established during the start-up period of a recharge site. A basin’s volume-based RWC must be in compliance with its RWC limit. Volume-based RWC is a

Chino Basin Recycled Water Annual Report: Groundwater Recharge Program January 1 through December 31, 2017 Order No. R8-2007-0039
3-10
calculation of the percent recycled water infiltrated compared to all recharge and is based on a 120-month rolling average. Appendix B contains the RWC Management Plans for 8th Street, Banana, Brooks, Ely, Hickory, RP3, San Sevaine 5, Turner Basin 1&2, Turner Basin 3&4, Victoria, and Declez Basins. While the plans contain calculations for up to 120 months of historical data, the tabulated and graphed RWC Management Plans (Appendix B) show only the previous 5 years (60 months) of historical recharge and 10 years (120 months) of forecast (planned) data. Historical data not contained in the current report appendices are contained in prior annual reports.
The RWC Management Plans include two parts. Part 1 displays the historical operation of the basin for the previous 5 years. Part 2 is the planned optimal operation for the next 10 years (120 months). The historical portion of a basin’s RWC Management Plan shows actual diluent water (storm water and imported water) and actual recycled water recharge volumes. The planned section includes projections of average stormwater diluent water recharge and maximized recycled water recharge deliveries. Storm water projections are updated annually and represent a basin’s historical monthly stormwater recharge average. For a conservative approach to the RWC forecast, future recharge of imported water is not used in the RWC Plan.
In 2009, IEUA and CBWM received a permit amendment from the RWQCB Order No. R8-2009-0057 that allowed a change from a 60-month to a 120-month RWC averaging period and for the inclusion of a fraction of groundwater underflow as a diluent water source in the RWC calculation. The RWC Management Plans included underflow beginning in October 2009 for basins that had already receiving recycled water at the time the permit amendment was issued allowing accounting of underflow. For basins that started recycled water recharge after the 2009 permit amendment, the use of underflow in the RWC calculation begins upon the month of recycled water recharge initiation. IEUA reviewed 2014 groundwater flow data, similar to that reviewed in 2009 when the underflow estimates were made, and determined the underflow estimates are still valid. For basins that share the flow path of groundwater underflow, the underflow volume is used for both basins as the travel time between these basins exceeds that required for drinking water wells, and thus any upstream blend has become groundwater again upon reaching the downstream basin. Victoria and San Sevaine Basins share a common underflow as do RP3 and Declez Basins.
Forecasts for recycled water are made by determining a basins optimal monthly capacity and then subtracting the average monthly stormwater. Thus, the RWC Plan includes the maximum possible recharge and is thus a conservatively high estimate of future RWC. The conservative calculations do not include months of no recharge during future basin maintenance. Should the forecasted recycled water volume cause a basin RWC prediction to exceed its RWC limit, the basin capacity number is sequentially reduced until the RWC limit is no longer exceeded. Turner 1, Turner 4, Declez, Victoria, and San Sevaine are basins whose RWC Plans include a recycled water recharge capacity less than the basin’s maximum capacity. These basins each have an RWC limit of less than 50%, except for Victoria. No basins are forecasted to exceed their RWC limit with the forecasted estimates of average diluent water.
Chino Basin Recycled Water Annual Report: Groundwater Recharge Program January 1 through December 31, 2017 Order No. R8-2007-0039
3-11
Table 3-2 lists the volume-based RWC actual at the end of 2017 for each recharge site. The recharge sites are all in compliance with their maximum RWC limits. Based on future projections of diluent recharge, the RWC Management Plans show that recycled water deliveries for each basin can continue to be made and remain in compliance with their RWC limits.
3.4 Buffer Zone/Travel Time Compliance
Section VI.B.3.e of the M&RP requires the annual report to include the following:
A summary discussion on whether domestic drinking water wells extracted water within the buffer zone defined by the area less than 500 feet and 6 months underground travel time from the recharge basins, including the actions/measures that were undertaken to prevent reoccurrence. If there were none, a statement to that effect shall be written.
As stated in the cover letters of the 2017 quarterly monitoring reports, CBWM has certified that there was no reported pumping of groundwater in 2017 for domestic or municipal use from the zones that extend 500 feet and 6 months underground travel time from the 8th Street, Banana, Brooks, Ely, Hickory, RP3, San Sevaine, Turner, and Victoria Basins. In fact, there are no domestic or municipal production wells in the buffer zones of the aforementioned recharge sites.
3.4.1 Recharge Water Arrival Times
As documented in annual reports and basin start-up period reports, sufficient data exist to estimate arrival times of recycled water at monitoring wells: 8TH-1/1 and 8TH-1/2 for 8th Street Basin; BRK-1/1 and BRK-1/2 for Brooks Basin; BH-1/2 for Hickory Basin; California Speedway Infield Well for Banana Basin; TRN-1/2 and TRN-2/2 for Turner 1 and Turner 4 Basins, respectively; Ontario Well No. 25 for Turner 4 Basin; VCT-1/1 for Victoria Basin, and RP3-1/1 and RP3-1/2 for RP3 Basins. The evaluations of arrival time are based on the water chemistry data presented in Appendix C and basin operations data. Arrival times can be determined from notable increases in EC, TDS, and/or chloride concentrations above background, excluding natural seasonal variations.
8th Street Basin Area
Travel time from 8th Street Basin through the vadose zone and along groundwater flow paths to monitoring well 8TH-1/1 is estimated by steadily increasing concentrations of EC, TDS, and chloride beginning in July 2009 and continuing through 2016. Recharge of recycled water began at 8th Street Basin on September 7, 2007, thus the travel-time estimate for 8TH-1/1 is approximately 660 days (22 months). Downgradient monitoring well 8TH-2 does not yet show conclusive indication of recycled water arrival. Water quality sampling of the deeper casing of 8TH-2 (8TH-2/2 was suspended in mid 2015 but added back into the program until a long-term trend is identified for an influence from recharge activity.
Banana & Hickory Basins Area
Travel time from Hickory Basin through the vadose zone and along groundwater flow paths to monitoring well BH-1/2 was documented at approximately 59 days (IEUA and CBWM, 2009). The California Speedway Infield Well has demonstrated a small but gradual increase in EC, TDS, and chloride from September 2005 through the end of 2012. Travel time from Banana Basin to California Speedway Infield Well is estimated at 890 days (29 months) based on a stepped increase in EC, TDS, and chloride concentrations between data collected on October 9, 2007 and
Chino Basin Recycled Water Annual Report: Groundwater Recharge Program January 1 through December 31, 2017 Order No. R8-2007-0039
3-12
January 7, 2008 (IEUA and CBWM, 2009). The modeled travel time to the California Speedway Infield Well was 682 days (22 months) (CH2MHill, 2003).
Travel time from the Banana - Hickory Basin to California Speedway No. 2 is estimated at 83 months (6.9 years) based on a gradual increased trend in EC, TDS, and chloride concentrations that began in July 2012 and has continued through 2017. These parameters were relatively stable from 2006 to 2012. Speedway No. 2 is located about one half mile south of Hickory Basin. Due to the groundwater flow gradient direction, the travel time most likely is from travel from Banana Basin. A travel time estimate was not modeled for Speedway No. 2 in the Phase I Title 22 Engineering report (CH2MHill, 2003). The upgradient monitoring well FWC-37A (being replaced in 2018) showed a similarly gradual increasing trend in these parameters continually from 2006 through 2016, which should not be due to recharge activities at Banana and Hickory Basins. The trend at Speedway No. 2 is interpreted as a recycled water arrival due to its relatively stable concentrations from 2006 to 2012. The downgradient monitoring well, Reliant East, has not yet shown definitive variations in EC, TDS, and chloride that would signal arrival of recycled water.
Brooks Basin Area
Travel time from Brooks Basin through the vadose zone to the shallow casing of mound monitoring well BRK-1/1 located at the basin is approximately 150 days (5 months) based on trends in EC, TDS, and chloride data documented from 2009 data (IEUA and CBWM, 2010b) The chloride increased from background concentration to over 80 mg/L in January, February, and March 2009 are indicative of the arrival of recycled water. Evaluation of 2010 through 2015 EC, TDS, and chloride data indicate recycled water arrived at the deeper casing (BRK-1/2) in January 2010 for a travel time of approximately 526 days (17 months). At the downgradient monitoring well BRK-2, variations of EC, TDS, and chloride concentrations after recharge are similar to the background variations prior to recycled water recharge, which makes identification of travel time to this well difficult. EC and TDS data at BRK-2 (casings BRK-2/1 and BRK-2/2) continue to be within the range of the background concentration; an increase in chloride concentration at BRK-2/1 was observed through 2011 and 2012 and again in 2015 and 2017 which may suggest grief arrivals of recycled water. In 2013 and 2014, chloride concentration at BRK-2/1 returned to background levels. These brief elevated chloride concentrations may suggest a minimum potential arrival time of 29 months (2.4 years), but is not definitive without a corresponding increase in EC and TDS.
Ely Basin Area
Groundwater in the Ely Basin area has high background TDS and nitrate concentrations from a history of irrigation. Due to the seasonal variations of TDS, EC, and chloride concentrations at the Philadelphia, Walnut, and Riverside Wells, arrival times are difficult to determine. Recycled water recharge began in 1999 and thus it is estimated that recycled water has already arrived and traveled beyond these wells. For the Philadelphia Well, peak EC, TDS, and chloride
Chino Basin Recycled Water Annual Report: Groundwater Recharge Program January 1 through December 31, 2017 Order No. R8-2007-0039
3-13
concentrations observed in late 2014 correlate with peak recycled water deliveries to Ely basin 13 month prior and thus indicated a 13-month travel time to the Philadelphia well.
Turner Basin Area
Travel time from Turner Basins through the vadose zone to the groundwater is approximately 10 to 12 months for both Turner well sites. While the initial rise in EC, TDS, and chloride at TRN-1/2 suggested a 3-month travel time, the subsequent decline in EC, TDS, and chloride during summer and fall of 2008 suggested a longer travel time of approximately 10 months, after recycled water recharge stopped in the summer of 2007. At TRN-2/2, the EC, TDS, and chloride concentrations increased significantly from background concentrations in the summer of 2007 and indicated an (initial) 11-month travel time. Both monitoring wells have two casings, with the shallower being designated /1 and the deeper being designated /2. TRN-1/1 is not currently sampled as it was constructed above the water table for future mound sampling needs, TRN-2-1 sampling was suspended in 2015 due to sampling results very similar to TRN-2-2. Original modeling (CH2MHill, 2003) for the Turner recharge site predicted a 109-day (9-month) travel time to each of these wells. Decrease in EC, TDS, and chloride concentrations at TRN-1/2 indicate that recycled water recharged during the start-up period migrated away from this location after the high-volume recharge start-up period ended in 2007.
The travel time from Turner Basins to downgradient Ontario Well No. 25 suggest a travel time of 1,475 days (48 months) (IEUA and CBWM, 2011). Downgradient monitoring well, Ontario Well No. 29, has not yet shown variations in EC, TDS, and chloride that could signal arrival of recycled water at these well sites. Data collected in 2017 are consistent with the prior data interpretations for these two Ontario wells.
RP3 Basin Area
Travel time from RP3 Basin (cell 1) through the vadose zone to the shallower casing of mound monitoring well RP3-1/1 (located at on the west side of cell 1) was initially interpreted in the 2009 Annual Report (IEUA and CBWM, 2010a) to be approximately 14 days based on observation of EC changes. However, 2009 through 2010 data and RP3 Basin Start-Up Period Report (IEUA & CBWM, 2010d) findings indicate the earlier data did not represent the arrival of recycled water, but was instead evidence of vadose zone flushing (IEUA and CBWM, 2010c). The EC and water level trends support a travel time estimate of approximately 99 days. While the background EC prior to recycled water recharge was 1,000 to 1,100 µmhos/cm, initiation of storm water recharge operations at cell 1 in February 2009 appears to have pushed the higher EC water from the vadose zone raising the well water EC to 1,400 µmhos/cm. Recycled water recharge began on June 2, 2009 and a 400-µmhos/cm decrease in EC was observed in this mound monitoring well by August 25, 2009. The approximately 99-day travel time to the well is corroborated by the hydrograph of well casing RP3-1/1 (Appendix D), which shows an approximately +90-day delay between the mid-September 2010 recharge low and the mid-December 2010 water level low. Recycled water has also been observed as a chloride increase in both the shallow and the deep casing RP3-1/1 and RP3-1/2 in the summer of 2010, approximately 12 months after initiation of the basin with recycled water. The longer time to observe a chloride response is likely due to the purged of the vadose zone. The water quality data from downgradient monitor wells ALCOA MW-1 and MW-3 do not indicate the arrival of recycled water at these locations. Data collected in 2016 are consistent with the prior data interpretations for the RP3 region monitoring wells.
Chino Basin Recycled Water Annual Report: Groundwater Recharge Program January 1 through December 31, 2017 Order No. R8-2007-0039
3-14
San Sevaine & Victoria Basins Area
San Sevaine Basins lie directly upgradient of Victoria Basin and thus these two sites are considered together. Travel time from recharge at San Sevaine 5 to the water table is complicated by recharge activities at San Sevaine 1. For the 2017 Annual Report, the hydrograph of SS-1 is complimented with recharge of both basin 5 (storm water and recycled water) and the combined basins 1, 2, and 3 (stormwater and imported water). Both sets of basins appear to have different impacts timing on the well water levels (varying from 2 to 4 months). The timing of water level impacts from these recharge is complicated and warrants further data collection. There is currently insufficient data from the San Sevaine area monitoring wells to establish travel times of recharge from the mound to cross gradient well Unitex 91090.
For Victoria Basin, mound monitoring well VCT-1/1 water quality data (EC, TDS, and chloride) support a travel time of approximately 7.5 months based on the initiation of recycled water recharge on September 2, 2010 and the beginning of a steady rise in EC, TDS, and chloride (starting with the May 19, 2011 sample) through 2016. No indication of recycled water arrival has yet to be observed at wells VCT-2 and CVWD-39.
3.4.2 Leading Edge of Recycled Water in Aquifer
The leading edges of groundwater containing a component of recycled water were evaluated for the various recharge sites using monitoring well data. Such data include groundwater elevations changes and changes in EC, TDS, and/or chloride concentrations. Water quality data were discussed in Section 3.2 and Section 3.4. Appendix D contains basin-specific water level hydrographs, with discussion in Section 3.5.2 of water level mounding due to recycled water recharge. Location maps for wells monitored for the recharge program are presented in Figures 2-1 through 2-7. Evaluation of basin-specific water chemistry and water level data indicate recycled water recharge has passed the first monitoring wells located downgradient of 8th Street, Banana, Brooks, Ely, Hickory, Turner Basins, Victoria, and RP3 Basins. Several production wells used for monitoring near the basins show a water quality change from background concentrations that would be associated with recycled water recharge; specifically, California Speedway Infield Well and Speedway 2 for Banana & Hickory Basins and Ontario Well No. 25 for Turner 4. CBWM certifies on a quarterly basis that no pumping for drinking water purposes took place in the buffer zones extending 500 feet laterally and 6 months of underground travel time from each of the recharge sites using recycled water and further specifies there are no domestic or municipal production wells in the buffer zones of these recharge sites.
3.4.3 Tracer Test Results
No tracer tests were conducted in 2017, nor are any planned for the current program.
3.5 Groundwater Elevations
Section VI.B.3.b of the M&RP requires the annual report to include a discussion of groundwater elevations and flow paths:
Recharge water groundwater flow paths shall be determined annually from groundwater elevation contours and compared to the flow and transport model’s flow paths, travel of recharge waters, including leading edge of the recharged water plume, any anticipated changes. The flow and transport model shall be updated to match as closely as possible the actual flow patterns observed within the aquifer if the flow paths have significantly changed.
Chino Basin Recycled Water Annual Report: Groundwater Recharge Program January 1 through December 31, 2017 Order No. R8-2007-0039
3-15
3.5.1 Current Groundwater Elevations
Groundwater elevations from the recharge program monitoring wells and many other wells are used by CBWM to periodically prepare groundwater elevation contours of the Chino groundwater basin. Groundwater contour maps were prepared for 1997, 2000, 2003, 2006, 2008, 2010, 2012, 2014, and 2016. These groundwater elevation maps from the Chino Basin Watermaster’s Biennial State of the Basin Reports are presented in Appendix E. The Spring 2016 elevation contour map will be used for discussion in this report.
A comparison of the pre-recharge elevation contour map (Fall 2003) with the most recent post-program start-up groundwater contour map (Spring 2016) indicates several things. First, local changes in groundwater elevation near the recharge basins due to recharge activities are present, but (apart from Hickory and Ely basins) are not generally evident using the 25-foot contour interval of the maps, indicating that the recharge program has not significantly impacted regional groundwater flow directions. The only significant differences in groundwater flow direction between the 2003 and 2016 maps is for the mound at 8th Street, which between 2012 and 2016 had a more westward direction as opposed to a south-southwest direction in 2013. This difference may indicate the 8th Street Basin downgradient monitoring well location (8TH-2) is not appropriately located to characterize downgradient recharge water quality. Recharge mounds at basins are evident locally by the well hydrographs at the monitoring wells (Appendix D), but are generally within the contour interval (25 feet) of the maps. Also of note, since 2008 a deeper and larger area pumping depression has developed and stabilized around the Chino Desalter (hydraulic control) well field. Also during this time, the regional pumping depression in the Pomona area west of Brooks Basin has become smaller and narrower. There are some changes in the contouring style/methodology between the 2003 and 2016 maps. For example, the groundwater contours in the area north of Victoria and San Sevaine Basins were interpreted for the 2003 map, but were not interpreted for the 2010 through 2016 maps.
3.5.2 Water Level Trends in Monitoring Wells
Appendix D contains groundwater elevation hydrographs for wells constructed for the monitoring program. Location maps for wells monitored for the recharge program are presented on Figures 2-1 through 2-7. Plotted on each hydrograph is the daily volume of water captured at the nearest recharge site. These hydrographs can be used to identify local increases in groundwater elevations and their correlation with local recharge. Generally, the hydrographs are from mound monitoring wells at recharge basins or the closest monitoring well downgradient of the recharge basin.
8th Street Basin Area
The hydrographs of the 8th Street Basin mound monitoring well (8TH-1) show relatively stable long-term groundwater elevations from 2008 through 2017, that seasonally fluctuate between 640 to 680 feet above mean sea level (MSL). Since 2014, 8TH-1/1 has shown increase seasonal fluctuations in water levels likely due to well production changes in this area. There is an approximate 4-month delay, but a strong correlation between basin recharge and groundwater elevations in both 8TH-1/1 and 8TH-1/2, indicating relatively rapid recharge of surface water to the underlying aquifer. There are missing water level data for both casings at 8TH-1 due to the replacement of damaged pumps and/or pressure transducers at the well. Manual water levels supplemented the hydrographs during those times. The hydrograph for downgradient well 8TH-2
Chino Basin Recycled Water Annual Report: Groundwater Recharge Program January 1 through December 31, 2017 Order No. R8-2007-0039
3-16
shows about a 10-foot increasing water level trend between 2008 and 2013, which then stabilizes at approximately 635 feet MSL between 2014 through 2017. Short duration downward spikes in the 8TH-2 hydrograph are indicative of nearby groundwater pumping activities.
Brooks Basin Area
The hydrographs for the Brooks Basin mound monitoring well (BRK-1/1) show 2- to 10- foot seasonal fluctuations in water level and were relatively stable annually between mid-2009 and mid-2013. From mid-2013 through early 2016, water levels BRK-1/1 have steadily decreased approximately 15 feet, from 622 to 607 feet MSL. This decrease is perhaps due to drought and a decrease in stormwater recharge or other nearby groundwater stresses. Beginning in mid 2016, through 2017, BRK-1/1 water levels rose slightly, stabilizing at approximately 610 feet MSL.
At the deeper casing, BRK-1/2, groundwater elevations typically range between 584 and 614 feet MSL. The larger groundwater elevation fluctuations in the deeper casing (BRK-1/2) are due to a greater influence from nearby groundwater production at that depth. Recycled recharge began at Brooks Basin in August 2008 at the time when water levels were declining in this casing from their high of 612 feet MSL. Between 2009 and 2013, water levels in BRK-1/2 were generally stable fluctuating between 587 and 605 feet MSL. Like BRK-1/1, BRK-1/2 shows a decrease in water levels beginning 2013 and reaching historical lows in early 2016. Beginning in mid 2016, BRK-1/2 water levels began to rise a total of 5 feet, and through 2017 generally stabilized at approximately 590 feet MSL.
The hydrograph of the downgradient (intermediate) monitoring well BRK-2 shows a similarly stable trend as BRK-1/2 from 2009 to 2013, followed by decreases through 2015, small increases in 2016, then generally stable in 2017. BRK-2 casings have slightly larger seasonal fluctuations and pumping influences.
Banana & Hickory Basins Area
The hydrograph for the Banana and Hickory Basins mound monitoring well (BH-1) shows seasonal water level fluctuations between 680 and 690 feet MSL and generally stable through the 10 years of data shown. From 2008 through 2017, the BH-1/2 hydrograph shows relatively stable water levels with 5 to 10-foot season fluctuations. The peak and trough seasonal fluctuations appear delayed between 3 and 4 months from peak recharge activities. Impacts on water elevations due to recharge at Hickory and Banana Basins are muted and delayed due to the over 400-foot depth to the water table at this location.
Ely Basin Area
Ely Basin has received recycled water recharge since 1999, 6 years prior to the currently permitted regional recharge program. In 2011, IEUA installed a transducer in MW-1 (aka the Philadelphia well) and began recording water levels. Since 2011, the long-term water-level trend near Ely Basins in stable, but fluctuates +/-20 feet in response to recharge. In January 2015, the water level transducer malfunctioned and several months of water level data were lost. From the end of 2015 through 2016 water levels were relatively stable with approximately 5-foot seasonal
Chino Basin Recycled Water Annual Report: Groundwater Recharge Program January 1 through December 31, 2017 Order No. R8-2007-0039
3-17
fluctuations. In 2017, two months of intense recharge coincided with an approximately 15-foot seasonal increased water level.
Turner Basin Area
The hydrographs for the two Turner Basin monitoring wells, TRN-1/2 and TRN-2/2, show long term increased in water levels. For these two sites, between 2008 and 2017 the annual winter highs and summer lows show 10 to 20-foot differences, suggesting recharge at Turner Basins has a positive local impact on regional water levels. Since 2010, hydrographs have shown about a 2 to 3-foot per year increase in groundwater elevation. Peak water levels are delayed about 1 to 2 months from peaks in recharge.
RP3 Basin Area
The hydrographs of the RP3 Basin mound monitoring well, RP3-1, shows a good correlation with recharge activity at the basin. Prior to 2009, the water elevation varied by no more than 2 to 3 feet with recharge activity. However, after initiation in June 2009 of using Jurupa Basin for pumping water to RP3 cell 1 (both recycled water and winter stormwater), delivery/recharge volumes increased. For 2009 through 2011, water levels at RP3-1 rose approximately 20 feet. A similarly dramatic decrease in groundwater elevation occurred in late 2012 when the RP3 basin was off line for maintenance. In 2013, water levels rebounded 5 to 10 feet upwards with renewed recharge at the RP3 site. Water levels at RP3 fell about 12 feet through most of 2014 due in part to the low rainfall and stormwater recharge in that year. In mid 2015 IEUA completed the Wineville pipeline extension to RP3 and began delivering recycled water at an increased rate to all cells at the RP3 site. This resulted in water levels in both the shallow and deep RP3-1 casings increasing 10 to 20 feet to a high in 2017 of nearly 40 feet higher than pre-2009 elevations.
Declez Basin Area
The long-term water level trend at this site is has been stable between 2008 and 2017 fluctuating between 698 and 722 feet MSL. The data generally shows 10 to 15 feet seasonal variations, with the water level responding within days of stormwater recharge. Recycled water recharge occurred in Declez basin for its start-up period of December 2015 through September 2016 and appear to provide about a 5-foot increase in the season water level high. Recycled water delivery has stopped in September 2016 and will resume to Declez Basin upon completion of a downgradient monitoring well in spring 2018.
San Sevaine & Victoria Basins Area
Monitoring well SS-1 was installed in spring 2010 for monitoring recycled water recharge at San Sevaine 5. The recharge history of San Sevaine 5 alone does not correlate well with SS-1 water levels. However, imported water recharge in San Sevaine Basins 1and 2 during 2011 and 2017 does appear to correlate with SS-1 water level changes beneath San Sevaine 5. The hydrograph for San Sevaine 5 has been modified for the 2017 Annual Report to include recharge for both San Sevaine 5 and the combined San Sevaine 1, 2, and 3. Between 2010 and April 2011, the hydrograph for the San Sevaine 5 basin mound monitoring well (SS-1) shows a water level decrease of 5 feet, but began recovering steeply in July 2011 approximately 2 months after the initiation of imported water recharge in San Sevaine 1 and 2 in May 2011. The initial water level rise in May is likely related to the earlier San Sevaine 5 recharge in December 2011. Thus, it appears to be an approximately 2-month delay to the well for recharge at San Sevaine 1 and 2
Chino Basin Recycled Water Annual Report: Groundwater Recharge Program January 1 through December 31, 2017 Order No. R8-2007-0039
3-18
and an approximately 4-month delay for recharge at San Sevaine 5. Similarly, between 2013 and mid 2017, the SS-1 water levels showed a steady decline, due in part to the low rainfall and low stormwater recharge in the 2015 winter. A small upward change in water level began in June 2017 following imported water recharge in late 2016. A similar water level increase is predicted to continue through mid 2018 following the 2017 imported water charge in San Sevaine 1 and 2. Recycled water recharge at San Sevaine 5 has not occurred since May 2014 due to low basin infiltration rates and operating constraints. Recycled Water recharge will resume in 2018 following completion of a pipeline to San Sevaine 1, 2, and 3.
The hydrograph for the Victoria Basin mound monitoring well (VCT-1/1) shows seasonal and longer-term water level fluctuations within a 20-foot range. The mound area water levels rose 15 feet from 2010 to 2011, then fell and rose 5 feet in 2012. In 2013, the mound area water levels fell approximately 10 feet. There appears to be about an 11-month delay between recharge and water table changes beneath the Victoria Basin, yet more observations are needed to confirm this delay. In late 2014, water levels rose sharply approximately 15 feet due to relatively higher volume recharge of recycled water in early 2014, and remained relatively stable until the December 2015. In 2016, there was a 20-foot drop in water level most likely due to the basin being off line for maintenance. Water levels recovered 30 feet through the first half of 2017.
The hydrograph for the Victoria Basin downgradient (intermediate) monitoring well (VCT-2/2) shows 8-year record of relative stability within the elevations 750 to 765 feet MSL. Seasonally, the hydrograph shows 5- to 8-foot water level fluctuations in 2010 through 2018. This well was installed in spring 2010. The existing water level data set does not yet correlate definitively with recharge activities at the San Sevaine and Victoria Basins. While water level and recharge volumes rise and fall annually, comparison of a longer duration data set is required to determine their correlation with certainty. Water level data for 2014 and early 2015 were not available due to Caltrans construction activities at the well’s site which resulted in the ground and the well casing being lowered. Data collection was resumed in November 2015, and show water levels a few feet lower than the previous year. The transducer failed in mid 2016 and was replaced.
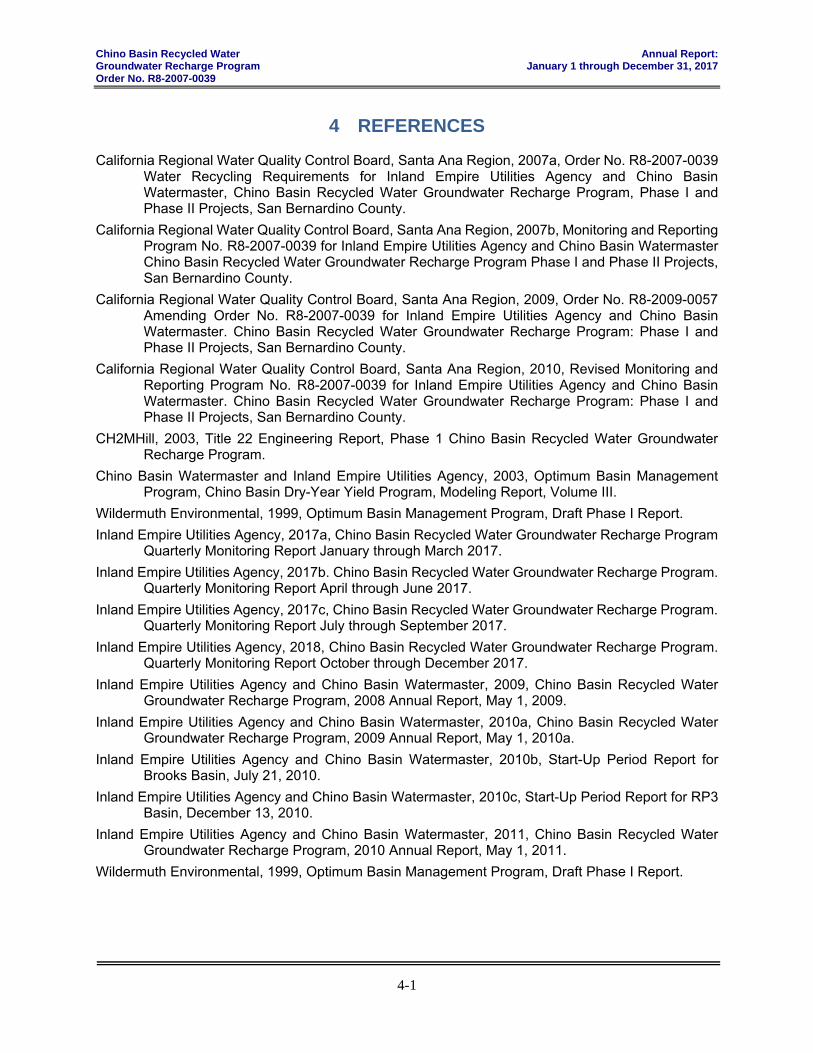
Chino Basin Recycled Water Annual Report: Groundwater Recharge Program January 1 through December 31, 2017 Order No. R8-2007-0039
4-1
4 REFERENCES
California Regional Water Quality Control Board, Santa Ana Region, 2007a, Order No. R8-2007-0039 Water Recycling Requirements for Inland Empire Utilities Agency and Chino Basin Watermaster, Chino Basin Recycled Water Groundwater Recharge Program, Phase I and Phase II Projects, San Bernardino County.
California Regional Water Quality Control Board, Santa Ana Region, 2007b, Monitoring and Reporting Program No. R8-2007-0039 for Inland Empire Utilities Agency and Chino Basin Watermaster Chino Basin Recycled Water Groundwater Recharge Program Phase I and Phase II Projects, San Bernardino County.
California Regional Water Quality Control Board, Santa Ana Region, 2009, Order No. R8-2009-0057 Amending Order No. R8-2007-0039 for Inland Empire Utilities Agency and Chino Basin Watermaster. Chino Basin Recycled Water Groundwater Recharge Program: Phase I and Phase II Projects, San Bernardino County.
California Regional Water Quality Control Board, Santa Ana Region, 2010, Revised Monitoring and Reporting Program No. R8-2007-0039 for Inland Empire Utilities Agency and Chino Basin Watermaster. Chino Basin Recycled Water Groundwater Recharge Program: Phase I and Phase II Projects, San Bernardino County.
CH2MHill, 2003, Title 22 Engineering Report, Phase 1 Chino Basin Recycled Water Groundwater Recharge Program.
Chino Basin Watermaster and Inland Empire Utilities Agency, 2003, Optimum Basin Management Program, Chino Basin Dry-Year Yield Program, Modeling Report, Volume III.
Wildermuth Environmental, 1999, Optimum Basin Management Program, Draft Phase I Report.
Inland Empire Utilities Agency, 2017a, Chino Basin Recycled Water Groundwater Recharge Program Quarterly Monitoring Report January through March 2017.
Inland Empire Utilities Agency, 2017b. Chino Basin Recycled Water Groundwater Recharge Program. Quarterly Monitoring Report April through June 2017.
Inland Empire Utilities Agency, 2017c, Chino Basin Recycled Water Groundwater Recharge Program. Quarterly Monitoring Report July through September 2017.
Inland Empire Utilities Agency, 2018, Chino Basin Recycled Water Groundwater Recharge Program. Quarterly Monitoring Report October through December 2017.
Inland Empire Utilities Agency and Chino Basin Watermaster, 2009, Chino Basin Recycled Water Groundwater Recharge Program, 2008 Annual Report, May 1, 2009.
Inland Empire Utilities Agency and Chino Basin Watermaster, 2010a, Chino Basin Recycled Water Groundwater Recharge Program, 2009 Annual Report, May 1, 2010a.
Inland Empire Utilities Agency and Chino Basin Watermaster, 2010b, Start-Up Period Report for Brooks Basin, July 21, 2010.
Inland Empire Utilities Agency and Chino Basin Watermaster, 2010c, Start-Up Period Report for RP3 Basin, December 13, 2010.
Inland Empire Utilities Agency and Chino Basin Watermaster, 2011, Chino Basin Recycled Water Groundwater Recharge Program, 2010 Annual Report, May 1, 2011.
Wildermuth Environmental, 1999, Optimum Basin Management Program, Draft Phase I Report.

TABLES
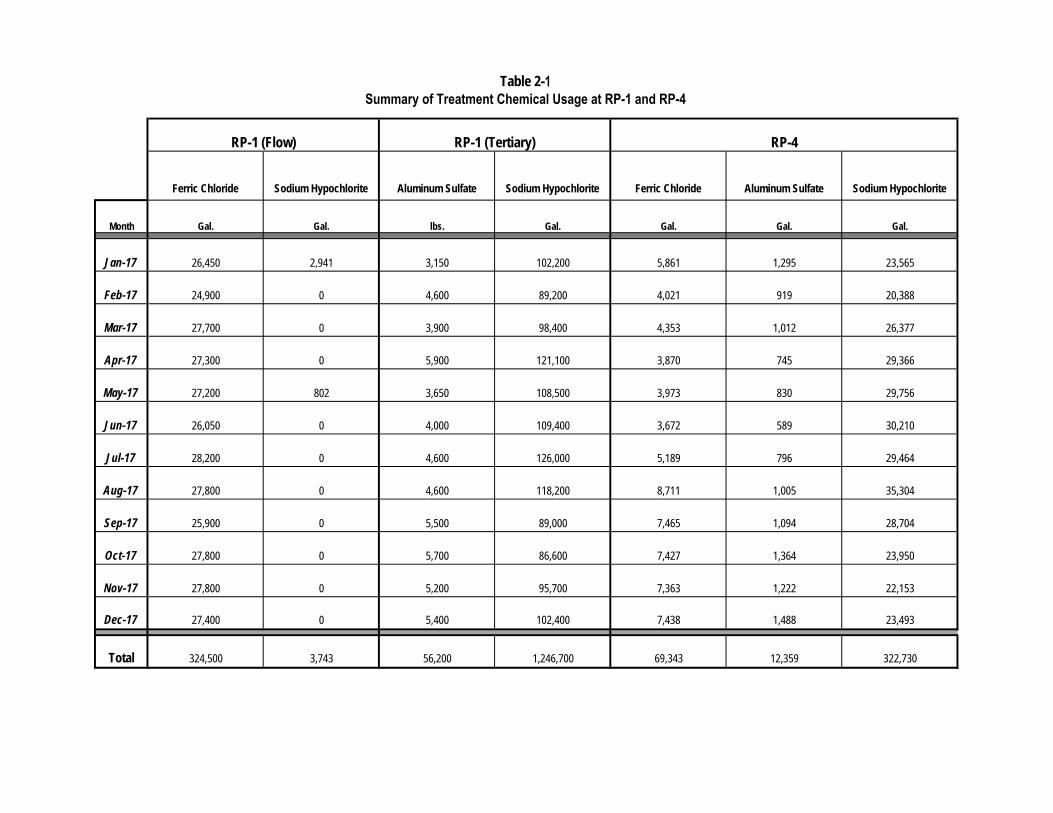
Ferric Chloride Sodium Hypochlorite Aluminum Sulfate Sodium Hypochlorite Ferric Chloride Aluminum Sulfate Sodium Hypochlorite
Month Gal. Gal. lbs. Gal. Gal. Gal. Gal.
Jan-17 26,450 2,941 3,150 102,200 5,861 1,295 23,565
Feb-17 24,900 0 4,600 89,200 4,021 919 20,388
Mar-17 27,700 0 3,900 98,400 4,353 1,012 26,377
Apr-17 27,300 0 5,900 121,100 3,870 745 29,366
May-17 27,200 802 3,650 108,500 3,973 830 29,756
Jun-17 26,050 0 4,000 109,400 3,672 589 30,210
Jul-17 28,200 0 4,600 126,000 5,189 796 29,464
Aug-17 27,800 0 4,600 118,200 8,711 1,005 35,304
Sep-17 25,900 0 5,500 89,000 7,465 1,094 28,704
Oct-17 27,800 0 5,700 86,600 7,427 1,364 23,950
Nov-17 27,800 0 5,200 95,700 7,363 1,222 22,153
Dec-17 27,400 0 5,400 102,400 7,438 1,488 23,493
Total 324,500 3,743 56,200 1,246,700 69,343 12,359 322,730
Table 2-1Summary of Treatment Chemical Usage at RP-1 and RP-4
RP-1 (Flow) RP-4RP-1 (Tertiary)
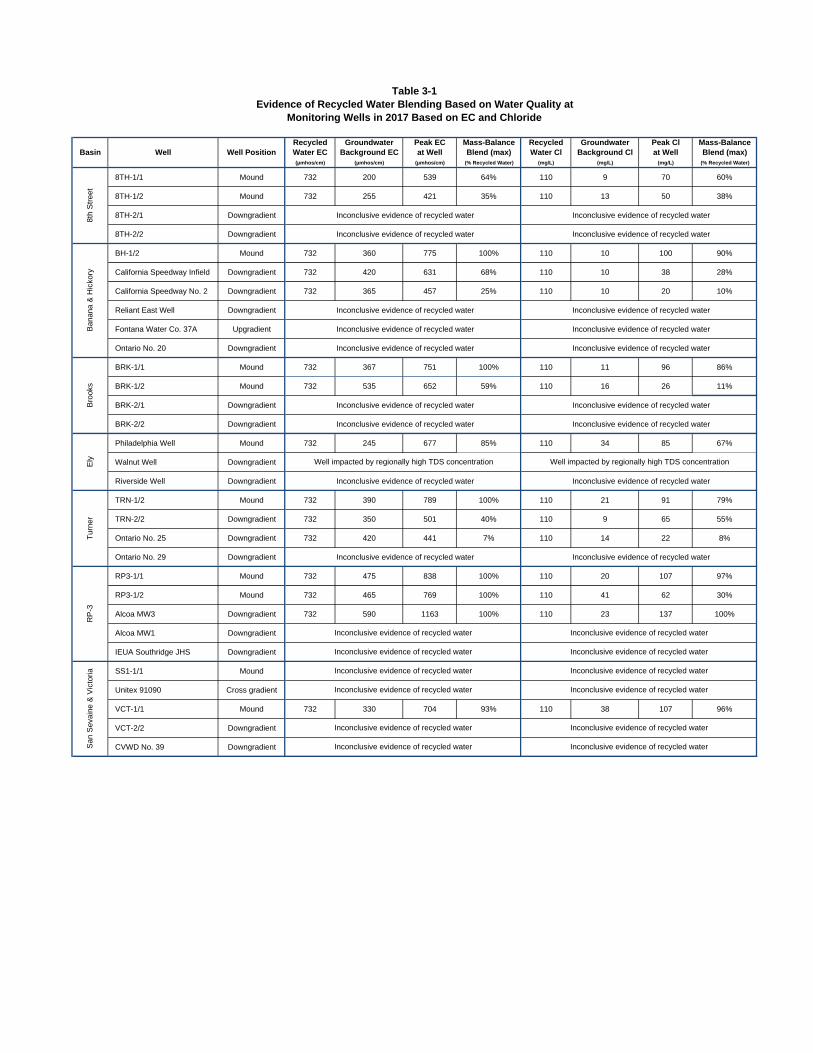
Recycled Groundwater Peak EC Mass-Balance Recycled Groundwater Peak Cl Mass-BalanceBasin Well Well Position Water EC Background EC at Well Blend (max) Water Cl Background Cl at Well Blend (max)
(µmhos/cm) (µmhos/cm) (µmhos/cm) (% Recycled Water) (mg/L) (mg/L) (mg/L) (% Recycled Water)
8TH-1/1 Mound 732 200 539 64% 110 9 70 60%
8TH-1/2 Mound 732 255 421 35% 110 13 50 38%
8TH-2/1 Downgradient Inconclusive evidence of recycled water Inconclusive evidence of recycled water
8TH-2/2 Downgradient Inconclusive evidence of recycled water Inconclusive evidence of recycled water
BH-1/2 Mound 732 360 775 100% 110 10 100 90%
California Speedway Infield Downgradient 732 420 631 68% 110 10 38 28%
California Speedway No. 2 Downgradient 732 365 457 25% 110 10 20 10%
Reliant East Well Downgradient Inconclusive evidence of recycled water Inconclusive evidence of recycled water
Fontana Water Co. 37A Upgradient Inconclusive evidence of recycled water Inconclusive evidence of recycled water
Ontario No. 20 Downgradient Inconclusive evidence of recycled water Inconclusive evidence of recycled water
BRK-1/1 Mound 732 367 751 100% 110 11 96 86%
BRK-1/2 Mound 732 535 652 59% 110 16 26 11%
BRK-2/1 Downgradient Inconclusive evidence of recycled water Inconclusive evidence of recycled water
BRK-2/2 Downgradient Inconclusive evidence of recycled water Inconclusive evidence of recycled water
Philadelphia Well Mound 732 245 677 85% 110 34 85 67%
Walnut Well Downgradient
Riverside Well Downgradient Inconclusive evidence of recycled water Inconclusive evidence of recycled water
TRN-1/2 Mound 732 390 789 100% 110 21 91 79%
TRN-2/2 Downgradient 732 350 501 40% 110 9 65 55%
Ontario No. 25 Downgradient 732 420 441 7% 110 14 22 8%
Ontario No. 29 Downgradient Inconclusive evidence of recycled water Inconclusive evidence of recycled water
RP3-1/1 Mound 732 475 838 100% 110 20 107 97%
RP3-1/2 Mound 732 465 769 100% 110 41 62 30%
Alcoa MW3 Downgradient 732 590 1163 100% 110 23 137 100%
Alcoa MW1 Downgradient
IEUA Southridge JHS Downgradient
SS1-1/1 Mound
Unitex 91090 Cross gradient
VCT-1/1 Mound 732 330 704 93% 110 38 107 96%
VCT-2/2 Downgradient
CVWD No. 39 Downgradient
Monitoring Wells in 2017 Based on EC and ChlorideEvidence of Recycled Water Blending Based on Water Quality at
Table 3-1
Inconclusive evidence of recycled water
Inconclusive evidence of recycled water Inconclusive evidence of recycled water
Inconclusive evidence of recycled water
Bro
oks
Inconclusive evidence of recycled water
Inconclusive evidence of recycled water
Inconclusive evidence of recycled water
Inconclusive evidence of recycled water
Well impacted by regionally high TDS concentration
8th
Str
eet
Ban
ana
& H
icko
ryS
an S
evai
ne &
Vic
toria
Inconclusive evidence of recycled water
Inconclusive evidence of recycled water
RP
-3E
lyT
urne
r
Well impacted by regionally high TDS concentration
Inconclusive evidence of recycled water
Inconclusive evidence of recycled water
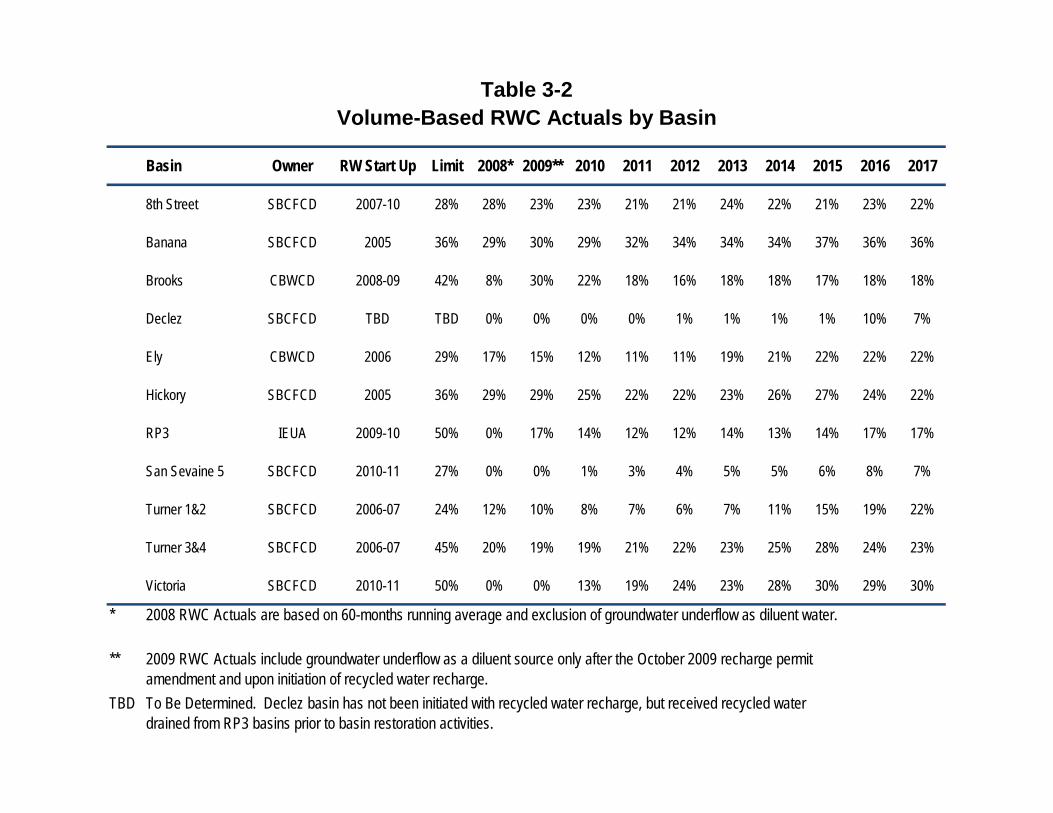
Basin Owner RW Start Up Limit 2008* 2009** 2010 2011 2012 2013 2014 2015 2016 2017
8th Street SBCFCD 2007-10 28% 28% 23% 23% 21% 21% 24% 22% 21% 23% 22%
Banana SBCFCD 2005 36% 29% 30% 29% 32% 34% 34% 34% 37% 36% 36%
Brooks CBWCD 2008-09 42% 8% 30% 22% 18% 16% 18% 18% 17% 18% 18%
Declez SBCFCD TBD TBD 0% 0% 0% 0% 1% 1% 1% 1% 10% 7%
Ely CBWCD 2006 29% 17% 15% 12% 11% 11% 19% 21% 22% 22% 22%
Hickory SBCFCD 2005 36% 29% 29% 25% 22% 22% 23% 26% 27% 24% 22%
RP3 IEUA 2009-10 50% 0% 17% 14% 12% 12% 14% 13% 14% 17% 17%
San Sevaine 5 SBCFCD 2010-11 27% 0% 0% 1% 3% 4% 5% 5% 6% 8% 7%
Turner 1&2 SBCFCD 2006-07 24% 12% 10% 8% 7% 6% 7% 11% 15% 19% 22%
Turner 3&4 SBCFCD 2006-07 45% 20% 19% 19% 21% 22% 23% 25% 28% 24% 23%
Victoria SBCFCD 2010-11 50% 0% 0% 13% 19% 24% 23% 28% 30% 29% 30%
*
**
TBD
2008 RWC Actuals are based on 60-months running average and exclusion of groundwater underflow as diluent water.
2009 RWC Actuals include groundwater underflow as a diluent source only after the October 2009 recharge permit amendment and upon initiation of recycled water recharge.To Be Determined. Declez basin has not been initiated with recycled water recharge, but received recycled water drained from RP3 basins prior to basin restoration activities.
Table 3-2Volume-Based RWC Actuals by Basin

FIGURES
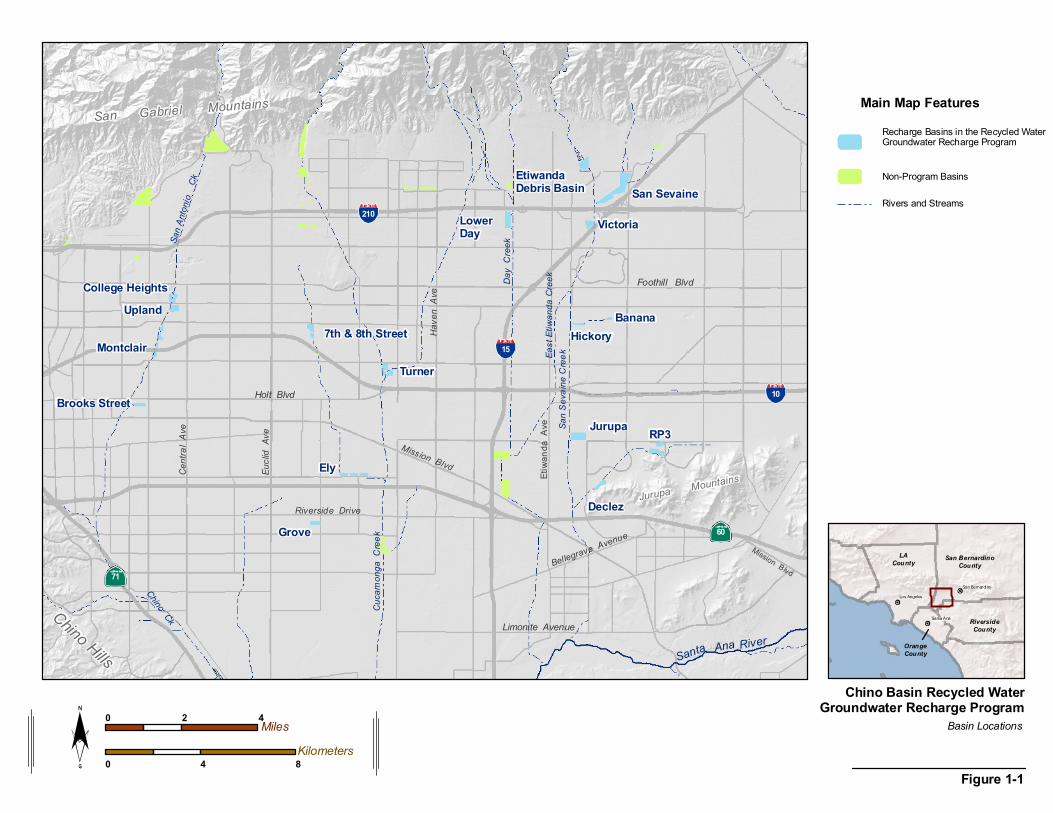
LACounty San Bernardino
County
RiversideCounty
OrangeCounty
Santa Ana
Los AngelesSan Bernardino
Chino Hills
Jurupa Mountains
San Gabriel Mountains
EtiwandaDebris Basin
San S
evain
e Cree
kEast
Etiwa
nda C
reek
60
10
15
210
71
Ely
Turner
Grove
River
Riverside Drive
Holt Blvd
Centr
al A
ve
Eucli
d Av
e
Mission Blvd
Bellegrave Avenue
Limonite Avenue
Etiwa
nda
Ave
Have
n Av
e Foothill Blvd
Mission Blvd
San A
ntonio
Ck
Chino Ck
Day
Cree
k
Santa Ana
Cuca
mong
a Cr
eek
Jurupa RP3
LowerDay
Declez
Victoria
Brooks Street
San Sevaine
HickoryUpland Banana
College Heights
7th & 8th StreetMontclair
Figure 1-1
Chino Basin Recycled WaterGroundwater Recharge Program
Main Map Features
Non-Program Basins
Rivers and Streams
0 2 4Miles
0 4 8Kilometers
Basin Locations
Recharge Basins in the Recycled WaterGroundwater Recharge Program
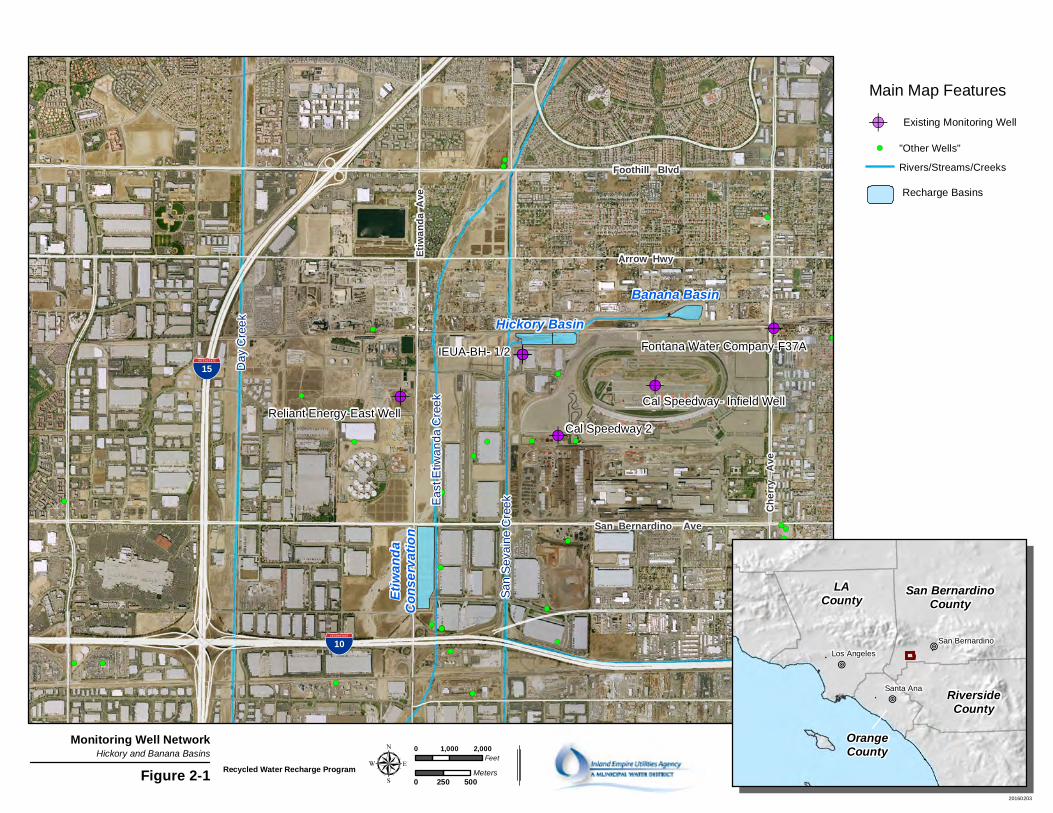
!(
!(
!(
!(
!(!(
!(
!(
!(
!(
!(
!(
!(
!(!(!(
!(
!(
!(
!(
!(
!(
!(!(
!(
!(
!(
!(
!(
!(
!(
!(
!(
!(
!(
!(!(
!(
!(
!(
!(
!(
!(
!(
!(
!(!(
!(
!(
!(!(
!(
!(
!(
!(
!(
!(
!(
!(
!(
!(
!(
!(
!(
!(
!(
!(
!(
!(
!(
!(
!(!(
!(
!(
!(
!(
!(
!(
!(
!(!(!(!(
!(
!(
!(!(
!(
!(
!(
!(
!(
!(
!(!(
!(
!(
!(
!(
!(
!(
!(
!(
!(
!( !(
!(
!(
!( !(
!(
!(!(!( !( !(
!(
!(
!(
!(!(
!(!(
!(
!(!(
!(!(
!(!(
!(
!(
!(!(
!(
!(!(
!(!(!(!(!(!(
!(
!(
!(
!(
!(
!(
!(
!(
!(
!(
!(
!(
!(
!(
!(
!(
!(
!(!(
!(
!(!(!(!(
!(!(!(!(!(
!(!(!(!(!(!(!(
!(!(!(
!(
!(!(!(!(!(!(!( !(!(!(!(!(
!(!(!(!(!(!(!(!(
!(!(!(!(!(
!(!(!(!(!(!(!(!(!(
!(!(
!(!(
!(
!(
!(!(!(
!(
!(
!(!(
!(
!(!(
!(!(
!A
!A
!A
!A!A!A
Cal Speedway 2
%&'(15
%&'(10
Reliant Energy-East WellCal Speedway- Infield Well
Fontana Water Company-F37AIEUA-BH- 1/2
Foothill Blvd
San Bernardino Ave
Foothill Blvd
Cher
ry A
ve
Arrow HwyEtiw
anda
Ave
Hickory Basin
Etiw
anda
Cons
erva
tion
Banana Basin
Day
Cre
ek
Sa
n S
eva
ine
Cre
ekEa
st E
tiwa
nd
a C
ree
k
Figure 2-1
Monitoring Well NetworkHickory and Banana Basins 0 1,000 2,000
Feet
0 250 500Meters
LACounty San Bernardino
County
RiversideCounty
OrangeCounty
Santa Ana
Los Angeles
San Bernardino
Recycled Water Recharge Program
!A Existing Monitoring Well
µ
!O
!O
!O
Main Map Features
20160203
!( "Other Wells"
Rivers/Streams/Creeks
Recharge Basins
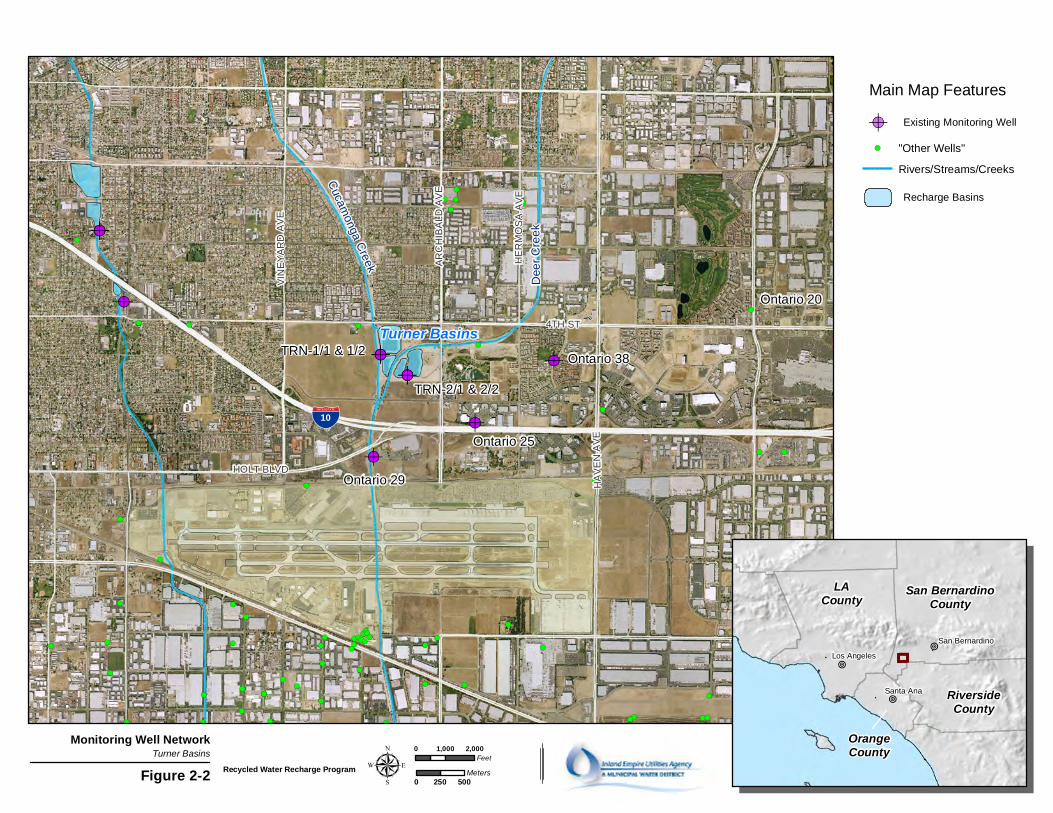
!(
!(
!(
!(
!(
!(
!(
!(
!(
!(
!(
!(
!(
!(!(
!(
!(
!(
!(
!(
!(
!(
!(
!(!( !(
!(
!(
!(
!(
!(!(
!(
!(
!(
!(
!(!(
!(
!(
!(!(!( !(
!(
!(
!(
!(
!(
!(
!(
!(
!(
!( !(
!(
!(
!(
!( !(!(
!(
!(
!(
!(
!(
!(
!(
!(
!(
!(
!(
!( !(
!(
!(
!(
!(
!(
!(
!(!(
!(
!(
!(
!(
!(
!(
!(
!(
!(
!(!( !(!(!(
!(
!(!(!( !(
!(
!(
!(
!(
!(
!(
!(
!(
!(
!(
!(
!(
!(!(!(!(
!(
!(
!(
!(
!(
!(
!(
!(
!(
!( !(
!(
!(
!(
!(
!(
!(
!(
!(
!(
!(
!(
!(!(
!(
!(
!(
!(
!(
!( !(
!(
!(
!(
!(
!(
!(!(!(
!(
!(
!(
!(
!(
!(
!(!(
!(
!(
!(
!(!(
!(
!(
!(
!(!(
!( !(
!(
!(
!(
!(
!(
!(
!( !(
!(
!(
!(
!(
!(
!( !(
!(
!(!( !(!(
!(!(
!(
!(
!( !(
!(!(!(
!(
!(
!(
!(
!(
!(
!(
!(
!(
!(
!(!(
!(
!(
!(
!(
!(
!(
!(
!(
!( !(
!(
!(
!(!(!(!(
!(
!(
!(!( !( !(
!(
!(
!(!(
!(
!( !(
!(
!(
!(
!(
!(
!(
!(
!(
!(
!(!(
!(!(
!(
!(
!(
!(
!(
!(!(
!(
!(
!(
!(!(
!(
!( !(
!(
!(
!(
!(!(!(
!(
!(!(!(!(
!(
!(!(!(!(
!(
!(
!(
!(!(
!(
!(
!(
!(
!(
!(
!(
!( !(
!( !(!(
!(
!(
!(
!(
!(!(
!(
!(
!(
!(
!(!(
!(
!(
!(!(
!(
!(!(
!(!(
!(
!(!( !(!(
!(
!(
!(!(!( !(
!(
!(
!(
!(
!(
!(
!(
!(
!(!(
!(
!( !(
!(
!(
!(!(
!(
!(
!(
!(
!(
!(!(
!(
!(
!(
!(
!(!(
!(
!(
!(
!(!( !( !(!(!(
!(
!(
!(!(!(
!( !(
!(
!(!(
!( !(
!(
!( !(
!(
!(
!(
!(!(
!(!(!(!(
!(
!(!(
!(
!(
!(
!(!(
!(
!(
!(
!( !(!( !( !(
!(!(
!(
!(
!(
!(
!(
!(!(!(
!(!(
!(!(
!(
!(
!(
!(
!(
!(
!(!(
!(
!(
!(
!(
!(
!(
!(
!(
!(
!(
!(!(!(
!(
!(!(
!(
!(!(!(
!(
!(!(
!(
!(
!(
!(!(
!(
!( !(
!(
!( !(
!(
!(
!(
!(
!(
!(
!(
!(
!(
!(
!(!(!(
!( !(
!(
!(
!(
!(
!(!(!(
!(
!(
!(!(
!(
!(
!(!(
!( !(!(
!(!(!( !(
!(
!(!(!(!(
!(
!(!(
!(!(
!(!(!(
!(!(
!(!(
!(
!( !(!(
!(!(!(!(!(!(
!(
!(
!(!(
!( !(!( !(!(!( !(!(
!(!(
!(
!(
!(
!(
!(
!(
!(
!(
!(
!(!(
!(!(
!(
!(!(
!(!(
!(!(
!(
!(
!(!(
!(
!(!(
!(!(!(!(!(!(
!(
!(
!(
!(
!(
!(
!(
!(
!(!(
!(
!(
!(
!(
!(
!(
!(
!(
!(
!(
!(
!(
!(
!(
!(
!(
!(
!(
!(
!(
!(
!(
!(
!( !(
!(
!(!(
!(
!(
!(
!(
!(!(
!(
!(
!(
!(
!(
!(
!(
!(
!( !(!(
!(
!(
!(
!(
!(
!(
!(
!(
!(
!(
!(!(!(
!(
!(
!(
!(!(
!(
!(
!(
!(
!(
!(
!(
!(
!(
!(
!(!(
!(!(!(!(!(!(!(
!(
!(!(!(!(
!(
!(!(
!(
!(
!A!A!A!A
!A
!A
!A
!A!A
!A
Turner Basins
HOLT BLVD
4TH ST
HA
VE
N A
VE
HE
RM
OS
A A
VE
AR
CH
IBA
LD
AV
E
VIN
EY
AR
D A
VE
%&'(10
Cucam
onga Creek
Dee
r C
ree
k
Figure 2-2
Monitoring Well NetworkTurner Basins 0 1,000 2,000
Feet
0 250 500Meters
LACounty San Bernardino
County
RiversideCounty
OrangeCounty
Santa Ana
Los Angeles
San Bernardino
Recharge Basins
Recycled Water Recharge Program
!A Existing Monitoring Well
TRN-1/1 & 1/2
Ontario 29
Ontario 25
µ
!( "Other Wells"
Rivers/Streams/Creeks
!O
!O
!O
Main Map Features
TRN-2/1 & 2/2
Ontario 38
Ontario 20
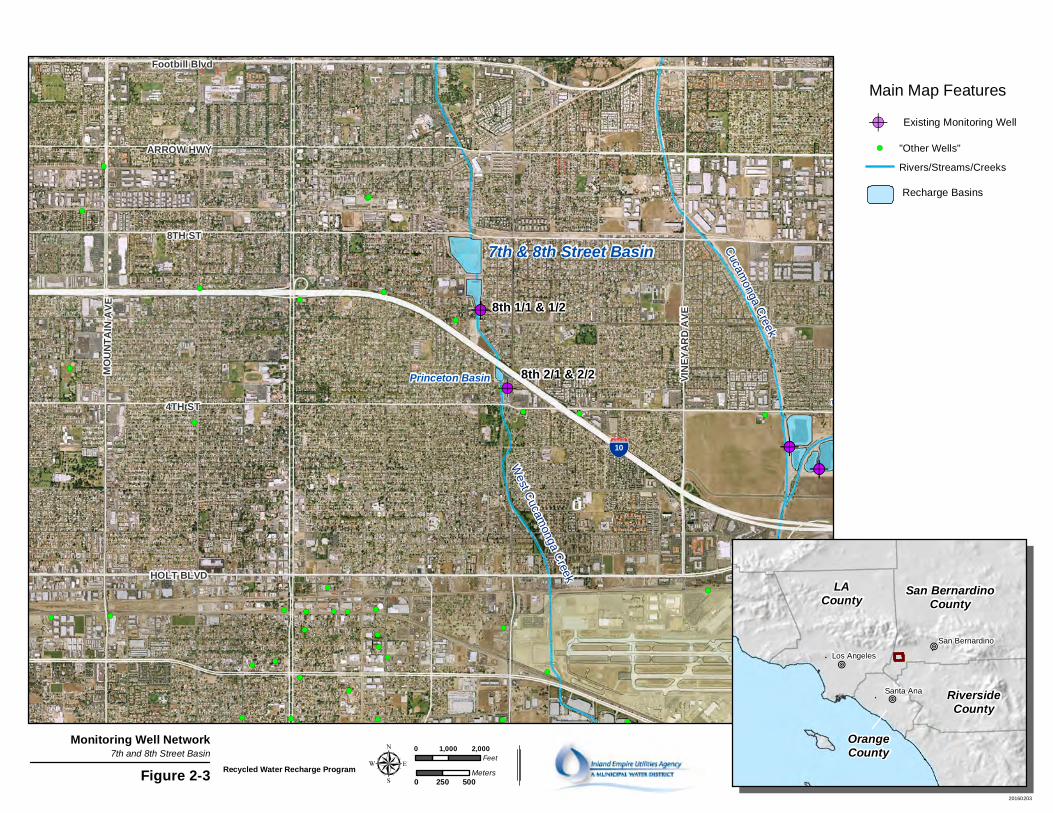
!(
!(
!(
!(
!(
!(!(
!(
!(
!(
!(
!(
!(
!(
!(
!(!( !(
!(
!(
!(
!(
!(!(
!(
!(
!(
!(
!(!(
!(
!(
!(!( !(
!(
!(
!(
!(
!(
!(
!(
!(!(
!(
!(
!(
!(
!(
!(!(
!(
!(
!(
!(
!(!(
!(
!(
!(
!(
!(
!(
!(
!(
!(
!(
!(
!(
!(
!(
!(
!(
!(
!(
!(
!(
!(
!(
!( !(
!(
!(
!(
!(
!(
!(
!(
!(
!(
!(
!(
!(
!(
!( !(
!(
!(
!(
!(
!(
!( !(
!(
!(!( !(!(
!(!(
!(
!(
!( !(
!(!(!(
!(
!(
!(
!(
!(
!(
!(
!(
!(!(
!(
!(
!(
!(
!(
!(
!(
!(
!( !(
!(
!(
!(!(!(!(
!(
!(
!(!( !(
!(
!(
!(!(
!(!(
!(
!(
!(
!(
!(
!(!(
!(
!(
!(
!( !(!(
!(
!(
!(
!(!(
!(
!(
!(
!(
!(
!(
!(!(
!(
!(
!(!(
!(
!(!(!( !(
!( !(
!(
!(
!(
!(
!(
!(
!(!(
!(!(
!(!(
!(!(
!(
!(
!(!(!(!(
!(!(
!(
!(
!(
!(
!(!(!(
!(
!(
!(
!(
!(
!(
!(
!(
!(
!(
!(
!( !(!(
!(
!(
!(
!(
!(
!(
!(
!(
!(
!(
!(!(!(
!(
!(
!(
!(!(
!(
!(
!(
!(
!(
!(
!(
!(
!(
!(
!(!(
!(!(!(
!(!(!(!(
!(
!(!(!(
!(
!(
!(!(
!(
!A!A
!A!A
!A
!A
!A!A
ARROW HWY
8TH ST
4TH ST
HOLT BLVD
VINEY
ARD
AVE
MOUN
TAIN
AVE
!"#$10
Footbill Blvd
Cucam
onga Creek
West C
ucamonga C
reek
Turner
Figure 2-3
Monitoring Well Network7th and 8th Street Basin 0 1,000 2,000
Feet
0 250 500Meters
LACounty San Bernardino
County
RiversideCounty
OrangeCounty
Santa Ana
Los Angeles
San Bernardino
Recycled Water Recharge Program
!A Existing Monitoring Well
µ
!O
!O
!O
Main Map Features
20160203
!( "Other Wells"
Rivers/Streams/Creeks
Recharge Basins
8th 1/1 & 1/2
8th 2/1 & 2/2
7th & 8th Street Basin
Princeton Basin
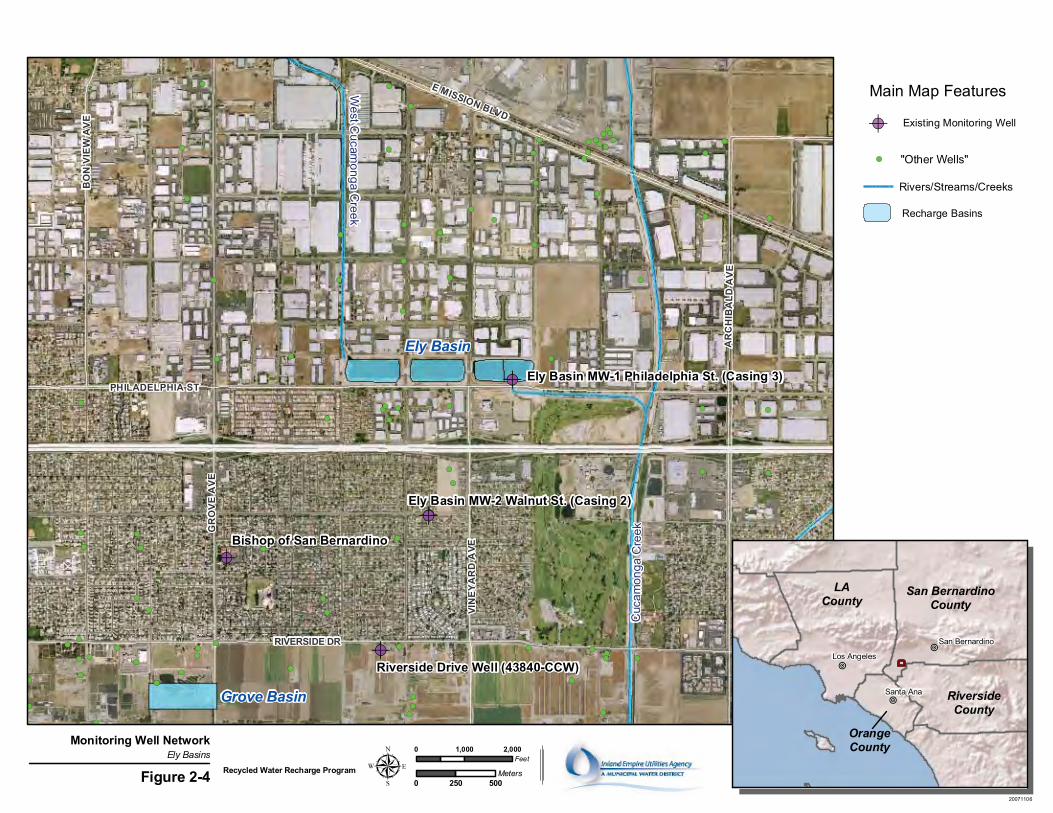
!A
!A
!A
!(
!(!( !(
!(
!(
!(
!(
!(
!(
!(!(
!(
!(
!(
!(
!(
!(
!(
!(
!(!(
!(!( !(!(
!(!(
!(
!(
!( !(
!(
!(
!(
!(
!(
!(
!(
!(
!(
!(
!(
!(
!(
!(
!(!(
!(!(
!(
!(!(
!(
!(!(
!(
!(
!(!(
!(
!(
!( !(
!(
!(!(
!(!(
!(!(
!(
!(
!(
!(
!(
!(
!(
!(
!(
!(
!(
!(
!(
!(
!(
!(!(
!(!(!(
!(!(!(!(
!(
!(!(!(
!(
!(
!A
!A
!A
!A
Ely Basin MW-1 Philadelphia St. (Casing 3)
Ely Basin MW-2 Walnut St. (Casing 2)
Riverside Drive Well (43840-CCW)
BO
N V
IEW
AV
E
PHILADELPHIA ST
GR
OV
E A
VE
VIN
EY
AR
D A
VE
AR
CH
IBA
LD A
VE
E MISSION BLVD
RIVERSIDE DR
West C
ucamonga C
reek
Cuc
amon
ga C
reek
Grove Basin
Ely Basin
Bishop of San Bernardino
Figure 2-4
Monitoring Well NetworkEly Basins 0 1,000 2,000
Feet
0 250 500Meters
LACounty
San BernardinoCounty
RiversideCounty
OrangeCounty
Santa Ana
Los Angeles
San Bernardino
Recycled Water Recharge Program
!A Existing Monitoring Well
μ
!O
!O
!O
Rivers/Streams/Creeks
Recharge Basins
Main Map Features
20071106
!( "Other Wells"
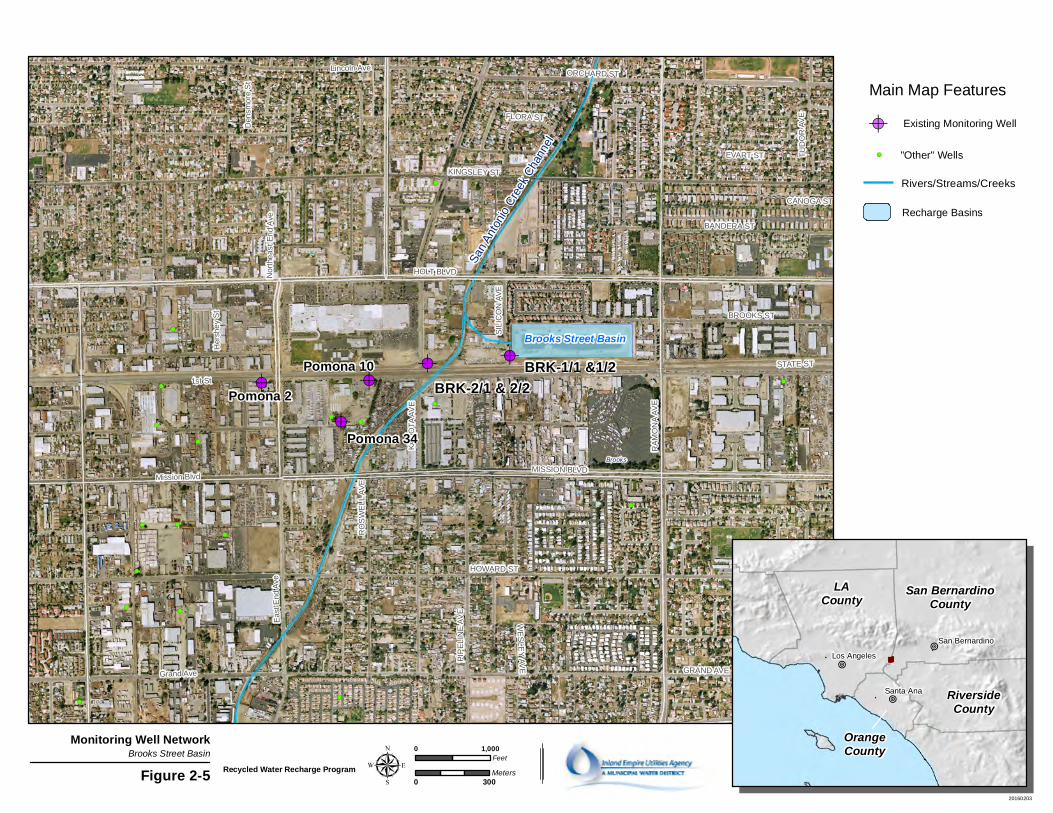
!(
!(
!(!(
!(
!(
!(
!(
!(
!(
!(
!(
!(!(!(
!(
!(
!(
!(!(
!(
!(
!(
!(
!(
!(
!(
!(
!(!(
!(
!(
!(
!(
!( !(
!(
!(!(
!(
!(
!(
!(
!(
!(
!(
!(
!(
!(
!(
!(
!(
!(
!(
!(
!(
!(
!(
!(
!(
!(
!(
!(
!(
!(
!(
!(
!(
!(
!(
!(
!(
!(
!(
!(
!(
!(
!(
!(
!(
!(
!(
!(
!(
!(
!(
!(
!(
!(
!(
!(
!(
!(
!(
!(
!(
!(
!(
!(
!(
!(
!(
!(
!A !A
!A!A
!A
Pomona 2Pomona 10
WE
SL
EY
AV
E
FLORA ST
SIL
ICO
N A
VE
CLAIR ST
EVART ST TU
DO
R A
VE
RO
SW
EL
L A
VE
CANOGA ST
BANDERA ST
PIP
EL
INE
AV
E
KA
DO
TA
AV
E
ORCHARD ST
BROOKS ST
KINGSLEY ST
HOWARD ST
MISSION BLVD
HOLT BLVD
GRAND AVE
RA
MO
NA
AV
E
STATE ST
Her
she
y S
t
Den
smo
re S
t
Nor
the
ast
En
d A
ve
Grand Ave
Mission Blvd
Ea
st E
nd
Ave
Lincoln Ave
1st St
Brooks Street Basin
BRK-1/1 &1/2BRK-2/1 & 2/2
San
Ant
onio
Cre
ek C
hann
el
Pomona 34Brooks
Figure 2-5
Monitoring Well NetworkBrooks Street Basin 0 1,000
Feet
0 300Meters
LACounty San Bernardino
County
RiversideCounty
OrangeCounty
Santa Ana
Los Angeles
San Bernardino
Recycled Water Recharge Program µ
!O
!O
!O
Recharge Basins
Main Map Features
20160203
!( "Other" Wells
Rivers/Streams/Creeks
!A Existing Monitoring Well
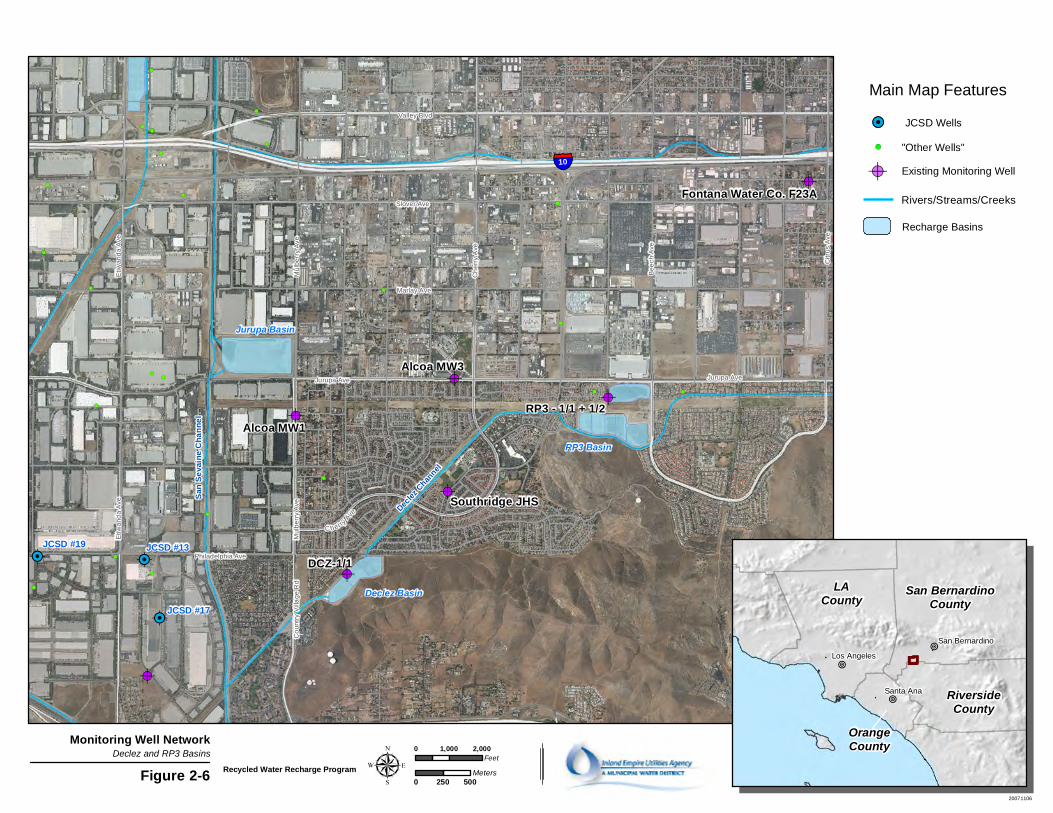
!(
!(
!(!(
!(!( !(
!(
!(
!(
!(
!(
!(
!(
!(
!(
!(
!(!(!(
!(
!(
!(
!(
!(
!(
!(!(
!(
!(
!(
!(
!(
!(
!(
!(
!(
!(
!(
!(
!(
!(
!(!(
!(
!(
!(
!(!(
!(!(
!(
!(
!(
!(
!(
!(
!(
!(
!(!(
!(
!(
!(
!(
!(
!(
!(
!(
!(
!(
!(
!(!(
!(
!(
!(
!(
!( !(!(
!(
!(
!(
!(
!(
!(
!(
!(
!(
!(
!(
!(
!(
!(!(
!(
!(
!(
!(
!(
!(
!(
!(!(!(!(
!(
!(
!(!(
!(
!(
!(
!(
!(!(
!(
!(
!(
!(
!(
!( !(
!(
!(
!(
!(
!(
!(
!( !(
!(
!(
!(
!(
!(!(
!(
!(
!(
!(
!(
!(
!(!(
!(
!(
!(
!(
!(
!(
!(
!(
!(!(
!(!(
!(
!(
!(
!( !(
!(
!(
!(
!(
!(
!(
!(
!(
!(
!(
!(
!(
!(
!(
!(
!(
!(
!(
!(
!(
!( !(!(
!(
!(!(!(!(
!(
!(
!(!(
!(
!(!(
!(
!(!(
!(!(
!(
!(
!(
!(!(
!(
!(
!(
!(
!(
!(
!(
!(
!(
!(
!(
!(
!(
!(
!(
!(!(
!(
!(
!(
!(
!(
!(
!(
!(!(
!(!(
!(
!(!(
!(
!(
!(
!(!(!(!(!(!(!(!(
!(!(
!(!(!(
!(!(!(
!( !(!(!( !(
!(
!(!(!( !(!(
!(
!(
!(!(!(
!(
!(!(!(
!(!(!(!(!(!(
!(
!(
!(
!(!(
!(!(
!(
!(
!( !(!(
!(!(
!(
!(!(
!(
!(
!(!(!(!(
!(!(!( !(!(!(!(!(
!(!(!(!(
!(
!(!(!(
!(!(!(!(!(
!(!(!(!(!(!(!(!(!(
!(
!(
!(
!(
!(
!(
!(
!(!(
!(
!(
!(
!(
!(
!(
!(
!(
!(
!(
!(
!(
!(
!(!(
!(
!(
!(
!(
!(
!(
!(
!(
!(
!(
!(
!(
!A
!A
!A
!A
!A
!A
!A
!A
!A
!A !H
!H
!H
Jurupa Basin
Declez Basin
RP3 Basin
San S
evain
e Cha
nnel
Declez
Channel
DCZ-1/1
Fontana Water Co. F23A
Southridge JHS
RP3 - 1/1 + 1/2Alcoa MW1
Alcoa MW3
Mu
lbe
rry
Ave
Jurupa Ave
Marlay Ave
Be
ech
Ave
Citr
us
Ave
Ch
err
y A
ve
Valley Blvd
Slover Ave
Cherry
Ave
Mu
lbe
rry
Ave
Co
un
try
Vill
ag
e R
d
Jurupa Ave
Philadelphia Ave
§̈¦10
JCSD #17
JCSD #19 JCSD #13
Etiw
an
da
Ave
Etiw
an
da
Ave
Figure 2-6
Monitoring Well NetworkDeclez and RP3 Basins 0 1,000 2,000
Feet
0 250 500Meters
LACounty San Bernardino
County
RiversideCounty
OrangeCounty
Santa Ana
Los Angeles
San Bernardino
Recycled Water Recharge Program µ
!O
!O
!O
Recharge Basins
Main Map Features
20071106
Rivers/Streams/Creeks
!A Existing Monitoring Well
!H JCSD Wells
!( "Other Wells"
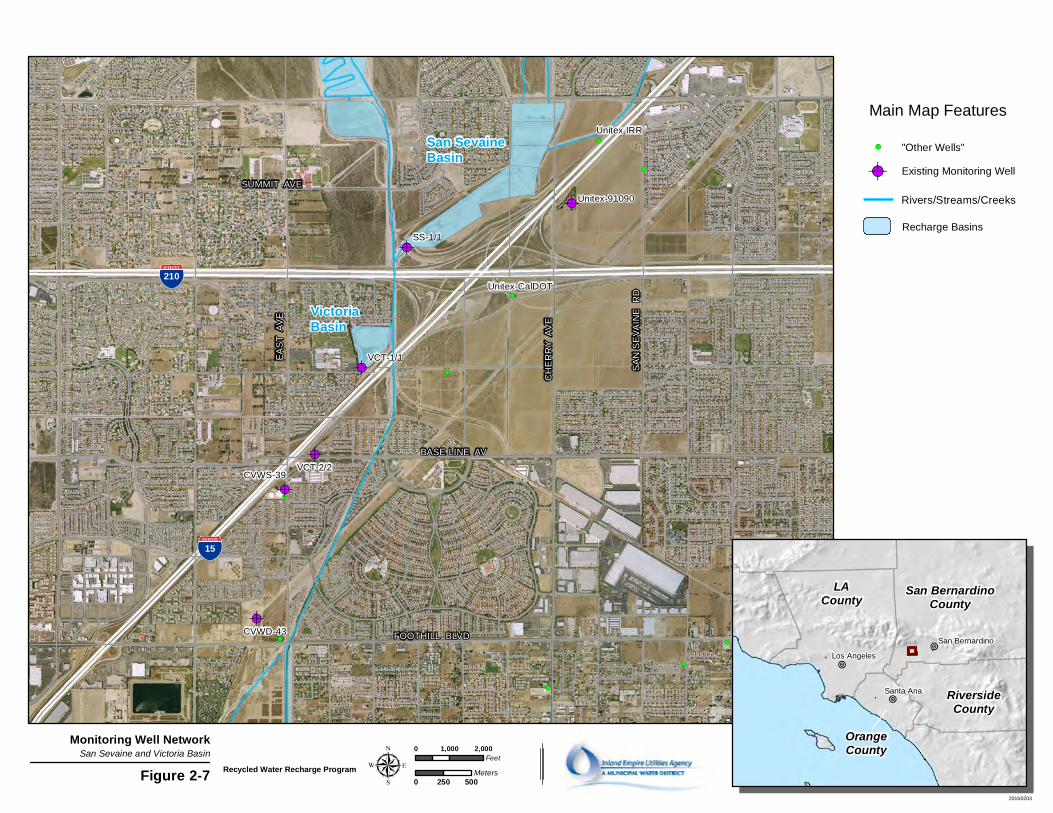
!(
!(
!(
!(
!(!(
!(!( !(
!(!(
!(
!(
!(
!(
!(
!(
!(
!(!(!(
!(
!(
!(
!(!(
!(
!(
!(
!(
!(
!(
!(
!(
!(
!(
!(
!(
!(
!(
!(
!(!(
!(
!(
!(
!(
!(
!(
!(
!(
!(!(!(
!(
!(
!.
!.
!.
!.
!.
!.
!.
!.
!.
!.
!A
!A
!A
!A
!A
!A
BASE LINE AV
FOOTHILL BLVD
CH
ER
RY
AV
E
SUMMIT AVE
EA
ST
AV
E
SA
N S
EV
AIN
E
RD
!"#$15
!"#$210
SS-1/1
CVWD-43
CVWS-39VCT-2/2
VCT-1/1
Unitex IRR
Unitex-91090
Unitex-CalDOT
Figure 2-7
Monitoring Well NetworkSan Sevaine and Victoria Basin 0 1,000 2,000
Feet
0 250 500Meters
LACounty San Bernardino
County
RiversideCounty
OrangeCounty
Santa Ana
Los Angeles
San Bernardino
Recycled Water Recharge Program µ
!O
!O
!O
Recharge Basins
Main Map Features
20160203
Rivers/Streams/Creeks
!A Existing Monitoring Well
San SevaineBasin
VictoriaBasin
!( "Other Wells"
APPENDIX A
MONTHLY GROUNDWATER RECHARGE SUMMARIES

SUMMARY OF CHINO BASIN GROUNDWATER RECHARGE OPERATIONSJanuary 2017
Drainage System Recharge Volume (AF)* ManagementBasin SW/LR IW RW Zone Subtotals
San Antonio Channel Drainage System College Heights 57 - N MZ-1Upland 373 - N 1,407Montclair 1, 2, 3 & 4 400 125.8 N AF**Brooks 254 - -
West Cucamonga Channel Drainage System 8th Street 203 - -7th Street 120 - -Ely 1, 2, & 3 317 - -
Minor DrainageGrove 121 N N
Cucamonga and Deer Creek Channel Drainage SystemsTurner 1 & 2 233 - -Turner 3 & 4 298 - - MZ-2
Day Creek Channel Drainage System 2,343Lower Day 268 - X
Etiwanda Channel Drainage System Etiwanda Debris 272 - XVictoria 327 - -
San Sevaine Channel Drainage System (MZ-2)San Sevaine 1, 2, 3, & 4 264 - -San Sevaine 5 224 - -
West Fontana Channel SystemHickory 19 - -Banana 50 - -
San Sevaine Channel Drainage System (MZ-3)Jurupa 157 - -
Declez Channel Drainage System MZ-3RP3 Cells 1, 3, & 4 431 - 431 1,393RP3 Cell 2 157 - - AF**Declez 167 - -
Non-Replenishment Recharge**MZ1: Montclair (SAWCo) - (125.8)
Month Total = 5,143 AF 4,712 0.0 431 January 2017Fiscal Year to Date Total Fiscal Year
Since July 1, 2016 = 21,067 AF 9,291 4,260.2 7,516 to DateCalendar Year to Date Total Calendar Year
Since Jan. 1, 2017 = 5,143 AF 4,712 0.0 431 to Date SW : Storm Water, LR : Local Runoff (and GE, MVWD), IW : Imported Water, RW : Recycled Water
- : No stormwater/local runoff, or basin not in use due to maintenance or testing.
X : Turnouts not available - to be installed during future projects.
N : No turnout planned for installation.
* : Data are preliminary based on the data available at the time of this report preparation.
** : Management Zone Subtotals have deducted from them any Non-Replenishment Recharge, which is
recharge originating from pumped to waste discharges and water recharged for storage agreements.Printed: May. 01, 17 v.3
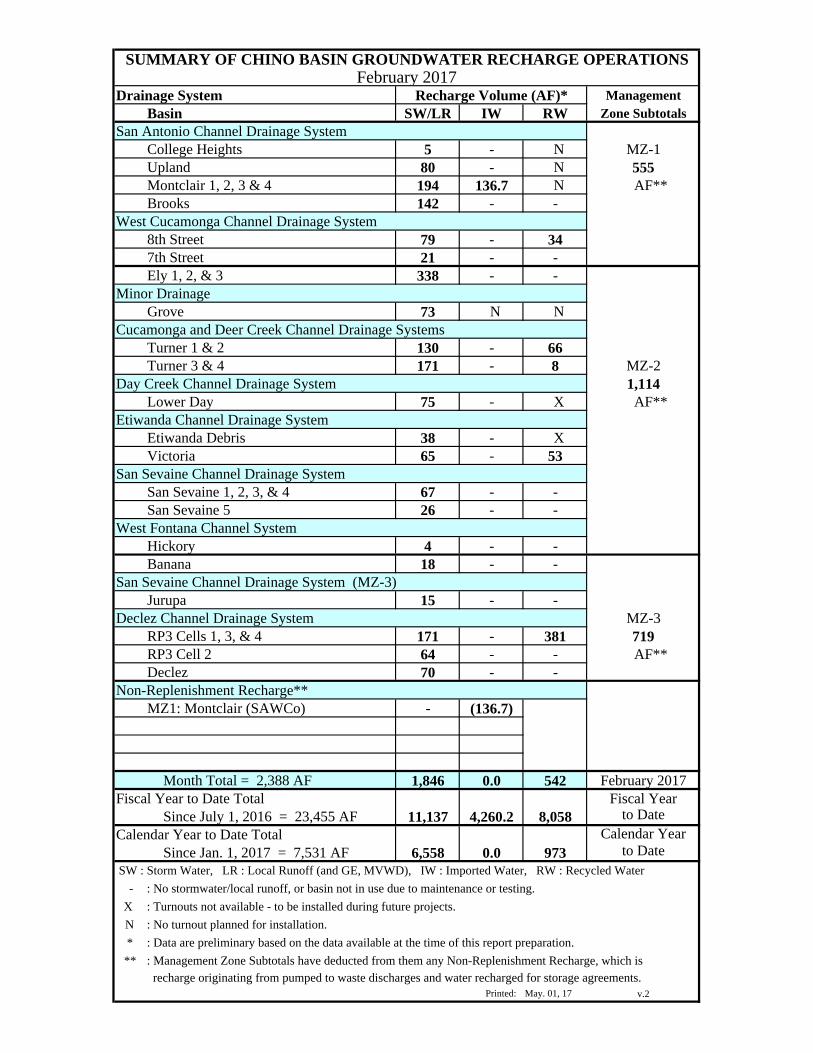
SUMMARY OF CHINO BASIN GROUNDWATER RECHARGE OPERATIONSFebruary 2017
Drainage System Recharge Volume (AF)* ManagementBasin SW/LR IW RW Zone Subtotals
San Antonio Channel Drainage System College Heights 5 - N MZ-1Upland 80 - N 555Montclair 1, 2, 3 & 4 194 136.7 N AF**Brooks 142 - -
West Cucamonga Channel Drainage System 8th Street 79 - 347th Street 21 - -Ely 1, 2, & 3 338 - -
Minor DrainageGrove 73 N N
Cucamonga and Deer Creek Channel Drainage SystemsTurner 1 & 2 130 - 66Turner 3 & 4 171 - 8 MZ-2
Day Creek Channel Drainage System 1,114Lower Day 75 - X AF**
Etiwanda Channel Drainage System Etiwanda Debris 38 - XVictoria 65 - 53
San Sevaine Channel Drainage System San Sevaine 1, 2, 3, & 4 67 - -San Sevaine 5 26 - -
West Fontana Channel SystemHickory 4 - -Banana 18 - -
San Sevaine Channel Drainage System (MZ-3)Jurupa 15 - -
Declez Channel Drainage System MZ-3RP3 Cells 1, 3, & 4 171 - 381 719RP3 Cell 2 64 - - AF**Declez 70 - -
Non-Replenishment Recharge**MZ1: Montclair (SAWCo) - (136.7)
Month Total = 2,388 AF 1,846 0.0 542 February 2017Fiscal Year to Date Total Fiscal Year
Since July 1, 2016 = 23,455 AF 11,137 4,260.2 8,058 to DateCalendar Year to Date Total Calendar Year
Since Jan. 1, 2017 = 7,531 AF 6,558 0.0 973 to Date SW : Storm Water, LR : Local Runoff (and GE, MVWD), IW : Imported Water, RW : Recycled Water
- : No stormwater/local runoff, or basin not in use due to maintenance or testing.
X : Turnouts not available - to be installed during future projects.
N : No turnout planned for installation.
* : Data are preliminary based on the data available at the time of this report preparation.
** : Management Zone Subtotals have deducted from them any Non-Replenishment Recharge, which is
recharge originating from pumped to waste discharges and water recharged for storage agreements.Printed: May. 01, 17 v.2
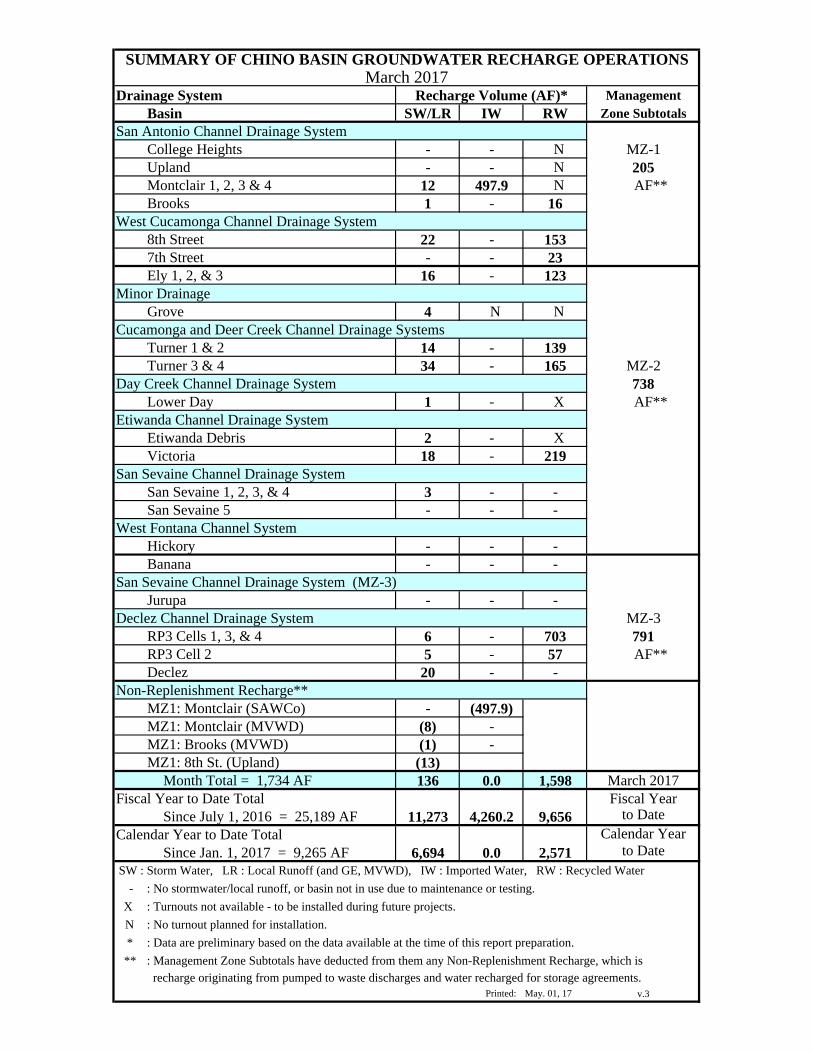
SUMMARY OF CHINO BASIN GROUNDWATER RECHARGE OPERATIONSMarch 2017
Drainage System Recharge Volume (AF)* ManagementBasin SW/LR IW RW Zone Subtotals
San Antonio Channel Drainage System College Heights - - N MZ-1Upland - - N 205Montclair 1, 2, 3 & 4 12 497.9 N AF**Brooks 1 - 16
West Cucamonga Channel Drainage System 8th Street 22 - 1537th Street - - 23Ely 1, 2, & 3 16 - 123
Minor DrainageGrove 4 N N
Cucamonga and Deer Creek Channel Drainage SystemsTurner 1 & 2 14 - 139Turner 3 & 4 34 - 165 MZ-2
Day Creek Channel Drainage System 738Lower Day 1 - X AF**
Etiwanda Channel Drainage System Etiwanda Debris 2 - XVictoria 18 - 219
San Sevaine Channel Drainage System San Sevaine 1, 2, 3, & 4 3 - -San Sevaine 5 - - -
West Fontana Channel SystemHickory - - -Banana - - -
San Sevaine Channel Drainage System (MZ-3)Jurupa - - -
Declez Channel Drainage System MZ-3RP3 Cells 1, 3, & 4 6 - 703 791RP3 Cell 2 5 - 57 AF**Declez 20 - -
Non-Replenishment Recharge**MZ1: Montclair (SAWCo) - (497.9)MZ1: Montclair (MVWD) (8) -MZ1: Brooks (MVWD) (1) -MZ1: 8th St. (Upland) (13)
Month Total = 1,734 AF 136 0.0 1,598 March 2017Fiscal Year to Date Total Fiscal Year
Since July 1, 2016 = 25,189 AF 11,273 4,260.2 9,656 to DateCalendar Year to Date Total Calendar Year
Since Jan. 1, 2017 = 9,265 AF 6,694 0.0 2,571 to Date SW : Storm Water, LR : Local Runoff (and GE, MVWD), IW : Imported Water, RW : Recycled Water
- : No stormwater/local runoff, or basin not in use due to maintenance or testing.
X : Turnouts not available - to be installed during future projects.
N : No turnout planned for installation.
* : Data are preliminary based on the data available at the time of this report preparation.
** : Management Zone Subtotals have deducted from them any Non-Replenishment Recharge, which is
recharge originating from pumped to waste discharges and water recharged for storage agreements.Printed: May. 01, 17 v.3
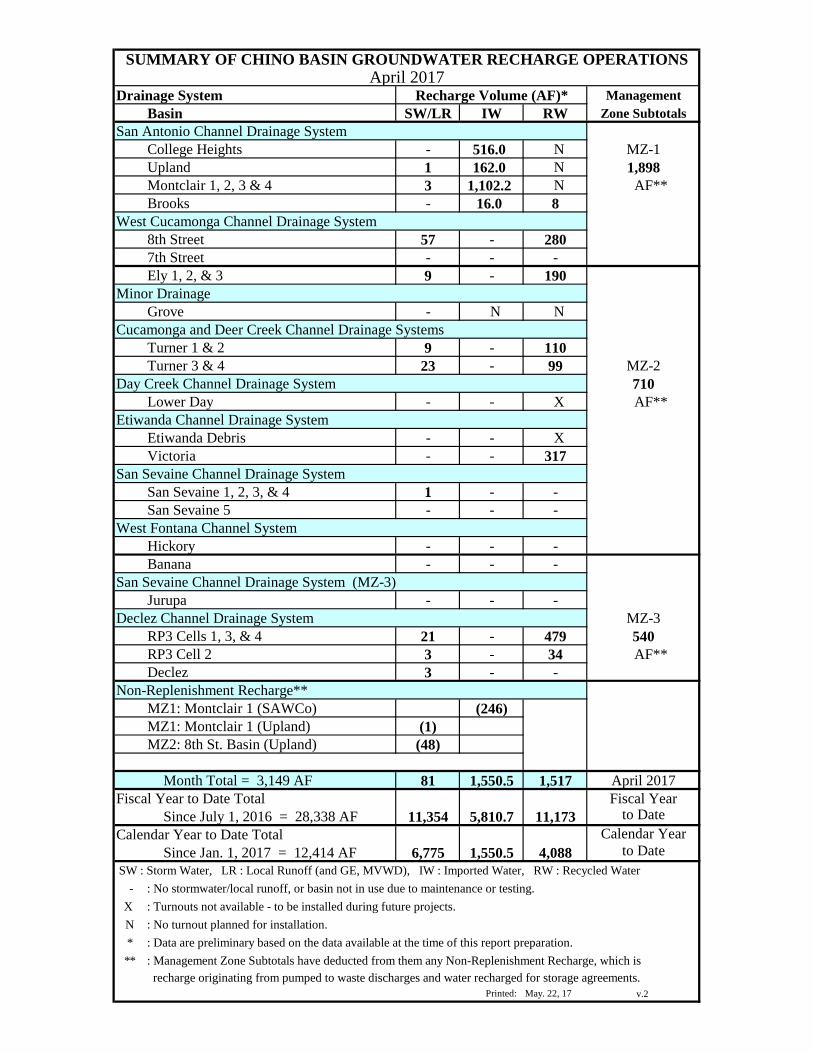
SUMMARY OF CHINO BASIN GROUNDWATER RECHARGE OPERATIONSApril 2017
Drainage System Recharge Volume (AF)* ManagementBasin SW/LR IW RW Zone Subtotals
San Antonio Channel Drainage System College Heights - 516.0 N MZ-1Upland 1 162.0 N 1,898Montclair 1, 2, 3 & 4 3 1,102.2 N AF**Brooks - 16.0 8
West Cucamonga Channel Drainage System 8th Street 57 - 2807th Street - - -Ely 1, 2, & 3 9 - 190
Minor DrainageGrove - N N
Cucamonga and Deer Creek Channel Drainage SystemsTurner 1 & 2 9 - 110Turner 3 & 4 23 - 99 MZ-2
Day Creek Channel Drainage System 710Lower Day - - X AF**
Etiwanda Channel Drainage System Etiwanda Debris - - XVictoria - - 317
San Sevaine Channel Drainage System San Sevaine 1, 2, 3, & 4 1 - -San Sevaine 5 - - -
West Fontana Channel SystemHickory - - -Banana - - -
San Sevaine Channel Drainage System (MZ-3)Jurupa - - -
Declez Channel Drainage System MZ-3RP3 Cells 1, 3, & 4 21 - 479 540RP3 Cell 2 3 - 34 AF**Declez 3 - -
Non-Replenishment Recharge**MZ1: Montclair 1 (SAWCo) (246)MZ1: Montclair 1 (Upland) (1)MZ2: 8th St. Basin (Upland) (48)
Month Total = 3,149 AF 81 1,550.5 1,517 April 2017Fiscal Year to Date Total Fiscal Year
Since July 1, 2016 = 28,338 AF 11,354 5,810.7 11,173 to DateCalendar Year to Date Total Calendar Year
Since Jan. 1, 2017 = 12,414 AF 6,775 1,550.5 4,088 to Date SW : Storm Water, LR : Local Runoff (and GE, MVWD), IW : Imported Water, RW : Recycled Water
- : No stormwater/local runoff, or basin not in use due to maintenance or testing.
X : Turnouts not available - to be installed during future projects.
N : No turnout planned for installation.
* : Data are preliminary based on the data available at the time of this report preparation.
** : Management Zone Subtotals have deducted from them any Non-Replenishment Recharge, which is
recharge originating from pumped to waste discharges and water recharged for storage agreements.Printed: May. 22, 17 v.2
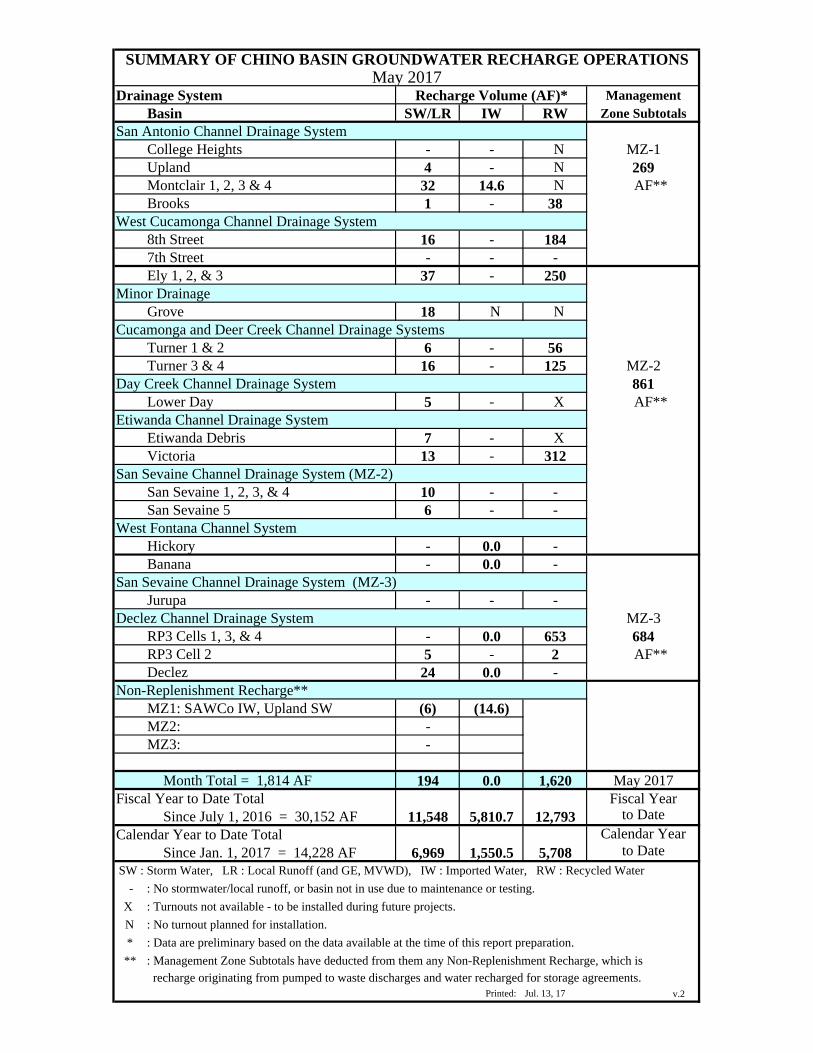
SUMMARY OF CHINO BASIN GROUNDWATER RECHARGE OPERATIONSMay 2017
Drainage System Recharge Volume (AF)* ManagementBasin SW/LR IW RW Zone Subtotals
San Antonio Channel Drainage System College Heights - - N MZ-1Upland 4 - N 269Montclair 1, 2, 3 & 4 32 14.6 N AF**Brooks 1 - 38
West Cucamonga Channel Drainage System 8th Street 16 - 1847th Street - - -Ely 1, 2, & 3 37 - 250
Minor DrainageGrove 18 N N
Cucamonga and Deer Creek Channel Drainage SystemsTurner 1 & 2 6 - 56Turner 3 & 4 16 - 125 MZ-2
Day Creek Channel Drainage System 861Lower Day 5 - X AF**
Etiwanda Channel Drainage System Etiwanda Debris 7 - XVictoria 13 - 312
San Sevaine Channel Drainage System (MZ-2)San Sevaine 1, 2, 3, & 4 10 - -San Sevaine 5 6 - -
West Fontana Channel SystemHickory - 0.0 -Banana - 0.0 -
San Sevaine Channel Drainage System (MZ-3)Jurupa - - -
Declez Channel Drainage System MZ-3RP3 Cells 1, 3, & 4 - 0.0 653 684RP3 Cell 2 5 - 2 AF**Declez 24 0.0 -
Non-Replenishment Recharge**MZ1: SAWCo IW, Upland SW (6) (14.6)MZ2: -MZ3: -
Month Total = 1,814 AF 194 0.0 1,620 May 2017Fiscal Year to Date Total Fiscal Year
Since July 1, 2016 = 30,152 AF 11,548 5,810.7 12,793 to DateCalendar Year to Date Total Calendar Year
Since Jan. 1, 2017 = 14,228 AF 6,969 1,550.5 5,708 to Date SW : Storm Water, LR : Local Runoff (and GE, MVWD), IW : Imported Water, RW : Recycled Water
- : No stormwater/local runoff, or basin not in use due to maintenance or testing.
X : Turnouts not available - to be installed during future projects.
N : No turnout planned for installation.
* : Data are preliminary based on the data available at the time of this report preparation.
** : Management Zone Subtotals have deducted from them any Non-Replenishment Recharge, which is
recharge originating from pumped to waste discharges and water recharged for storage agreements.Printed: Jul. 13, 17 v.2
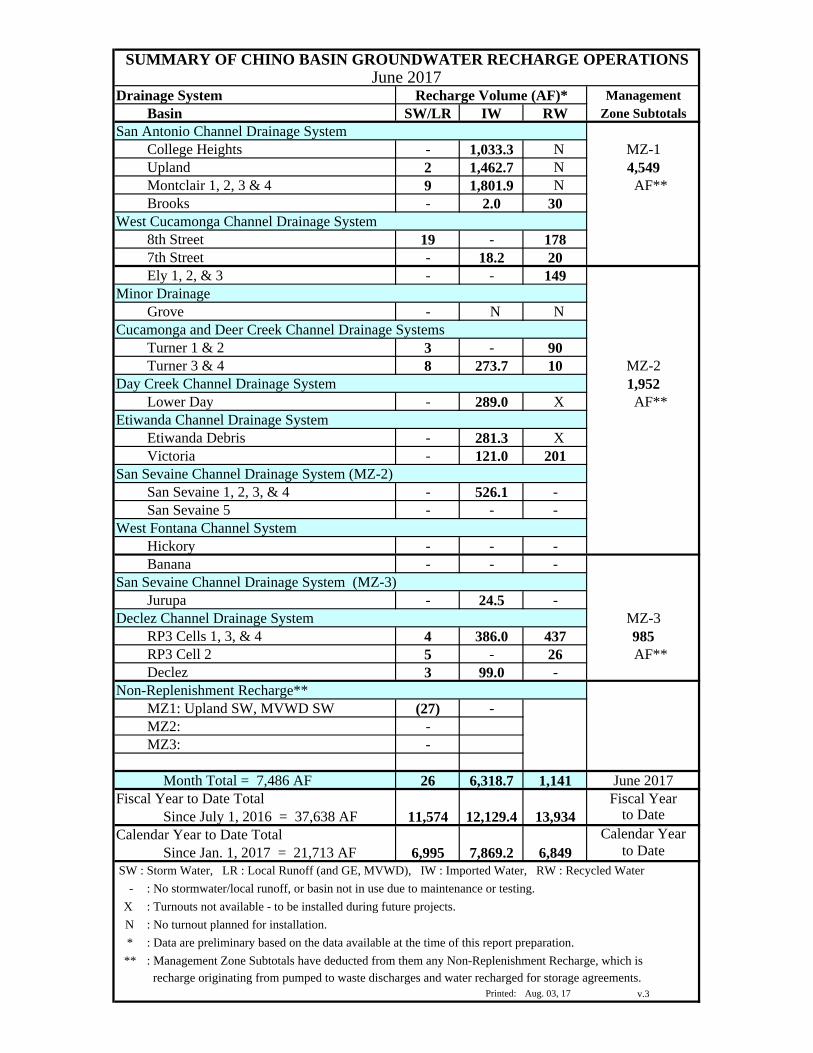
SUMMARY OF CHINO BASIN GROUNDWATER RECHARGE OPERATIONSJune 2017
Drainage System Recharge Volume (AF)* ManagementBasin SW/LR IW RW Zone Subtotals
San Antonio Channel Drainage System College Heights - 1,033.3 N MZ-1Upland 2 1,462.7 N 4,549Montclair 1, 2, 3 & 4 9 1,801.9 N AF**Brooks - 2.0 30
West Cucamonga Channel Drainage System 8th Street 19 - 1787th Street - 18.2 20Ely 1, 2, & 3 - - 149
Minor DrainageGrove - N N
Cucamonga and Deer Creek Channel Drainage SystemsTurner 1 & 2 3 - 90Turner 3 & 4 8 273.7 10 MZ-2
Day Creek Channel Drainage System 1,952Lower Day - 289.0 X AF**
Etiwanda Channel Drainage System Etiwanda Debris - 281.3 XVictoria - 121.0 201
San Sevaine Channel Drainage System (MZ-2)San Sevaine 1, 2, 3, & 4 - 526.1 -San Sevaine 5 - - -
West Fontana Channel SystemHickory - - -Banana - - -
San Sevaine Channel Drainage System (MZ-3)Jurupa - 24.5 -
Declez Channel Drainage System MZ-3RP3 Cells 1, 3, & 4 4 386.0 437 985RP3 Cell 2 5 - 26 AF**Declez 3 99.0 -
Non-Replenishment Recharge**MZ1: Upland SW, MVWD SW (27) -MZ2: -MZ3: -
Month Total = 7,486 AF 26 6,318.7 1,141 June 2017Fiscal Year to Date Total Fiscal Year
Since July 1, 2016 = 37,638 AF 11,574 12,129.4 13,934 to DateCalendar Year to Date Total Calendar Year
Since Jan. 1, 2017 = 21,713 AF 6,995 7,869.2 6,849 to Date SW : Storm Water, LR : Local Runoff (and GE, MVWD), IW : Imported Water, RW : Recycled Water
- : No stormwater/local runoff, or basin not in use due to maintenance or testing.
X : Turnouts not available - to be installed during future projects.
N : No turnout planned for installation.
* : Data are preliminary based on the data available at the time of this report preparation.
** : Management Zone Subtotals have deducted from them any Non-Replenishment Recharge, which is
recharge originating from pumped to waste discharges and water recharged for storage agreements.Printed: Aug. 03, 17 v.3
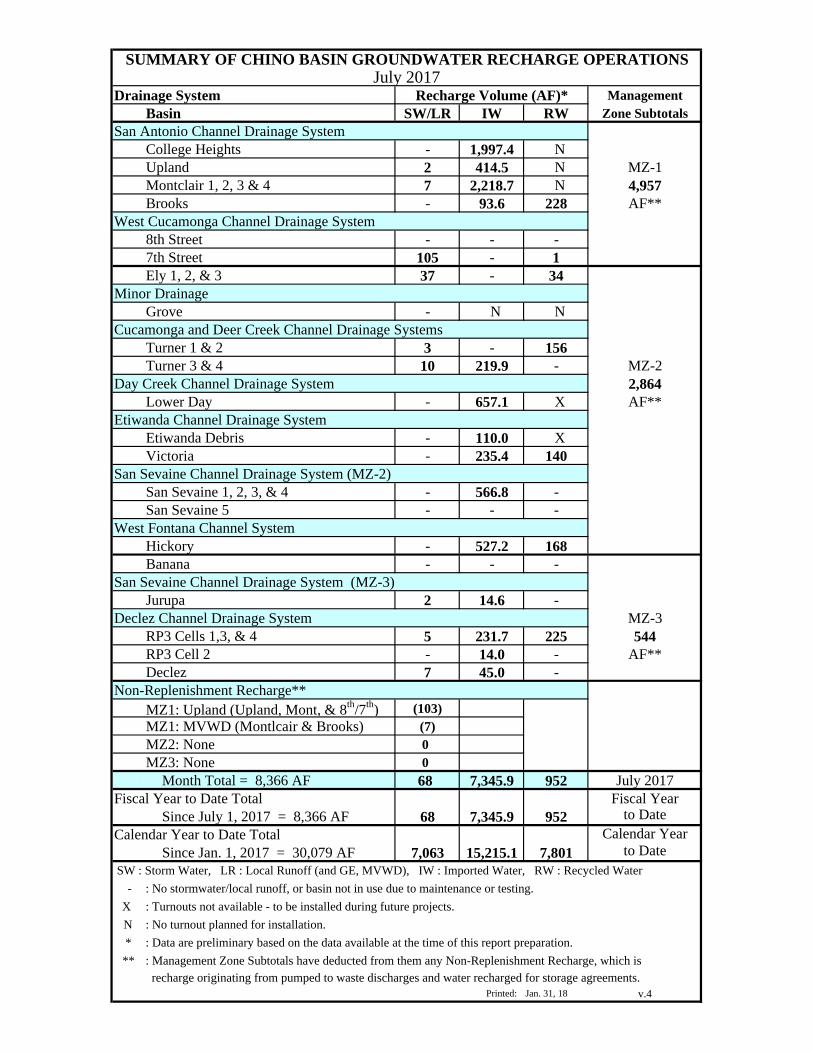
SUMMARY OF CHINO BASIN GROUNDWATER RECHARGE OPERATIONSJuly 2017
Drainage System Recharge Volume (AF)* ManagementBasin SW/LR IW RW Zone Subtotals
San Antonio Channel Drainage System College Heights - 1,997.4 NUpland 2 414.5 N MZ-1Montclair 1, 2, 3 & 4 7 2,218.7 N 4,957Brooks - 93.6 228 AF**
West Cucamonga Channel Drainage System 8th Street - - -7th Street 105 - 1Ely 1, 2, & 3 37 - 34
Minor DrainageGrove - N N
Cucamonga and Deer Creek Channel Drainage SystemsTurner 1 & 2 3 - 156Turner 3 & 4 10 219.9 - MZ-2
Day Creek Channel Drainage System 2,864Lower Day - 657.1 X AF**
Etiwanda Channel Drainage System Etiwanda Debris - 110.0 XVictoria - 235.4 140
San Sevaine Channel Drainage System (MZ-2)San Sevaine 1, 2, 3, & 4 - 566.8 -San Sevaine 5 - - -
West Fontana Channel SystemHickory - 527.2 168Banana - - -
San Sevaine Channel Drainage System (MZ-3)Jurupa 2 14.6 -
Declez Channel Drainage System MZ-3RP3 Cells 1,3, & 4 5 231.7 225 544RP3 Cell 2 - 14.0 - AF**Declez 7 45.0 -
Non-Replenishment Recharge**MZ1: Upland (Upland, Mont, & 8th/7th) (103)MZ1: MVWD (Montlcair & Brooks) (7)MZ2: None 0MZ3: None 0
Month Total = 8,366 AF 68 7,345.9 952 July 2017Fiscal Year to Date Total Fiscal Year
Since July 1, 2017 = 8,366 AF 68 7,345.9 952 to DateCalendar Year to Date Total Calendar Year
Since Jan. 1, 2017 = 30,079 AF 7,063 15,215.1 7,801 to Date SW : Storm Water, LR : Local Runoff (and GE, MVWD), IW : Imported Water, RW : Recycled Water
- : No stormwater/local runoff, or basin not in use due to maintenance or testing.
X : Turnouts not available - to be installed during future projects.
N : No turnout planned for installation.
* : Data are preliminary based on the data available at the time of this report preparation.
** : Management Zone Subtotals have deducted from them any Non-Replenishment Recharge, which is
recharge originating from pumped to waste discharges and water recharged for storage agreements.Printed: Jan. 31, 18 v.4
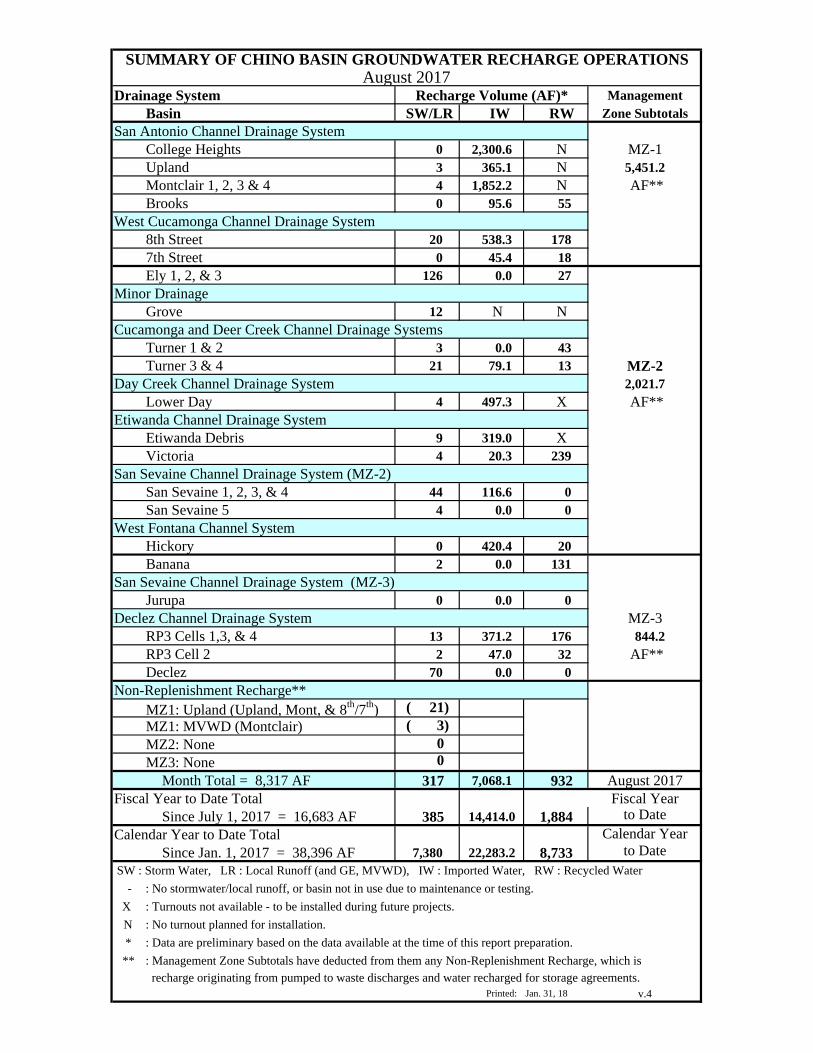
SUMMARY OF CHINO BASIN GROUNDWATER RECHARGE OPERATIONSAugust 2017
Drainage System Recharge Volume (AF)* ManagementBasin SW/LR IW RW Zone Subtotals
San Antonio Channel Drainage System College Heights 0 2,300.6 N MZ-1Upland 3 365.1 N 5,451.2Montclair 1, 2, 3 & 4 4 1,852.2 N AF**Brooks 0 95.6 55
West Cucamonga Channel Drainage System 8th Street 20 538.3 1787th Street 0 45.4 18Ely 1, 2, & 3 126 0.0 27
Minor DrainageGrove 12 N N
Cucamonga and Deer Creek Channel Drainage SystemsTurner 1 & 2 3 0.0 43Turner 3 & 4 21 79.1 13 MZ-2
Day Creek Channel Drainage System 2,021.7Lower Day 4 497.3 X AF**
Etiwanda Channel Drainage System Etiwanda Debris 9 319.0 X Victoria 4 20.3 239
San Sevaine Channel Drainage System (MZ-2)San Sevaine 1, 2, 3, & 4 44 116.6 0San Sevaine 5 4 0.0 0
West Fontana Channel SystemHickory 0 420.4 20Banana 2 0.0 131
San Sevaine Channel Drainage System (MZ-3)Jurupa 0 0.0 0
Declez Channel Drainage System MZ-3RP3 Cells 1,3, & 4 13 371.2 176 844.2RP3 Cell 2 2 47.0 32 AF**Declez 70 0.0 0
Non-Replenishment Recharge**MZ1: Upland (Upland, Mont, & 8th/7th) ( 21)MZ1: MVWD (Montclair) ( 3)MZ2: None 0MZ3: None 0
Month Total = 8,317 AF 317 7,068.1 932 August 2017Fiscal Year to Date Total Fiscal Year
Since July 1, 2017 = 16,683 AF 385 14,414.0 1,884 to DateCalendar Year to Date Total Calendar Year
Since Jan. 1, 2017 = 38,396 AF 7,380 22,283.2 8,733 to Date SW : Storm Water, LR : Local Runoff (and GE, MVWD), IW : Imported Water, RW : Recycled Water
- : No stormwater/local runoff, or basin not in use due to maintenance or testing.
X : Turnouts not available - to be installed during future projects.
N : No turnout planned for installation.
* : Data are preliminary based on the data available at the time of this report preparation.
** : Management Zone Subtotals have deducted from them any Non-Replenishment Recharge, which is
recharge originating from pumped to waste discharges and water recharged for storage agreements.Printed: Jan. 31, 18 v.4
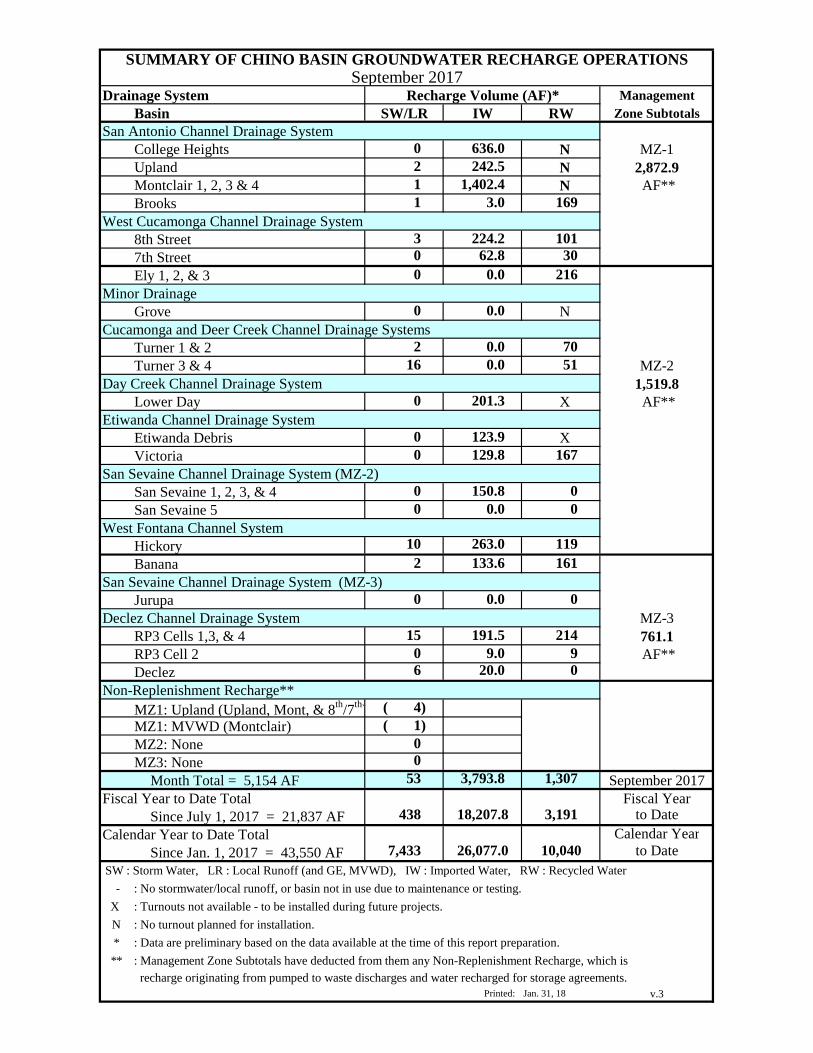
SUMMARY OF CHINO BASIN GROUNDWATER RECHARGE OPERATIONSSeptember 2017
Drainage System Recharge Volume (AF)* ManagementBasin SW/LR IW RW Zone Subtotals
San Antonio Channel Drainage System College Heights 0 636.0 N MZ-1Upland 2 242.5 N 2,872.9Montclair 1, 2, 3 & 4 1 1,402.4 N AF**Brooks 1 3.0 169
West Cucamonga Channel Drainage System 8th Street 3 224.2 1017th Street 0 62.8 30Ely 1, 2, & 3 0 0.0 216
Minor DrainageGrove 0 0.0 N
Cucamonga and Deer Creek Channel Drainage SystemsTurner 1 & 2 2 0.0 70Turner 3 & 4 16 0.0 51 MZ-2
Day Creek Channel Drainage System 1,519.8Lower Day 0 201.3 X AF**
Etiwanda Channel Drainage System Etiwanda Debris 0 123.9 XVictoria 0 129.8 167
San Sevaine Channel Drainage System (MZ-2)San Sevaine 1, 2, 3, & 4 0 150.8 0San Sevaine 5 0 0.0 0
West Fontana Channel SystemHickory 10 263.0 119Banana 2 133.6 161
San Sevaine Channel Drainage System (MZ-3)Jurupa 0 0.0 0
Declez Channel Drainage System MZ-3RP3 Cells 1,3, & 4 15 191.5 214 761.1RP3 Cell 2 0 9.0 9 AF**Declez 6 20.0 0
Non-Replenishment Recharge**MZ1: Upland (Upland, Mont, & 8th/7th) ( 4)MZ1: MVWD (Montclair) ( 1)MZ2: None 0MZ3: None 0
Month Total = 5,154 AF 53 3,793.8 1,307 September 2017Fiscal Year to Date Total Fiscal Year
Since July 1, 2017 = 21,837 AF 438 18,207.8 3,191 to DateCalendar Year to Date Total Calendar Year
Since Jan. 1, 2017 = 43,550 AF 7,433 26,077.0 10,040 to Date SW : Storm Water, LR : Local Runoff (and GE, MVWD), IW : Imported Water, RW : Recycled Water
- : No stormwater/local runoff, or basin not in use due to maintenance or testing.
X : Turnouts not available - to be installed during future projects.
N : No turnout planned for installation.
* : Data are preliminary based on the data available at the time of this report preparation.
** : Management Zone Subtotals have deducted from them any Non-Replenishment Recharge, which is
recharge originating from pumped to waste discharges and water recharged for storage agreements.Printed: Jan. 31, 18 v.3
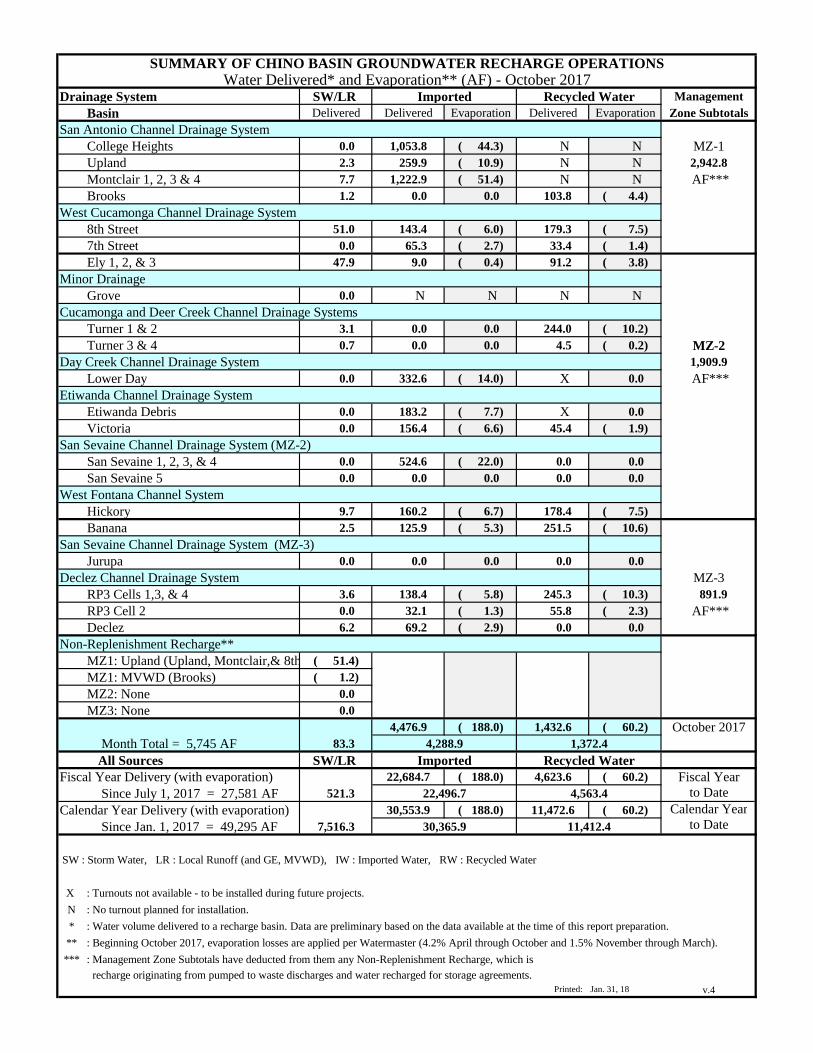
SUMMARY OF CHINO BASIN GROUNDWATER RECHARGE OPERATIONSWater Delivered* and Evaporation** (AF) - October 2017
Drainage System SW/LR Imported Recycled Water Management
Basin Delivered Delivered Evaporation Delivered Evaporation Zone SubtotalsSan Antonio Channel Drainage System
College Heights 0.0 1,053.8 ( 44.3) N N MZ-1Upland 2.3 259.9 ( 10.9) N N 2,942.8Montclair 1, 2, 3 & 4 7.7 1,222.9 ( 51.4) N N AF***Brooks 1.2 0.0 0.0 103.8 ( 4.4)
West Cucamonga Channel Drainage System 8th Street 51.0 143.4 ( 6.0) 179.3 ( 7.5)7th Street 0.0 65.3 ( 2.7) 33.4 ( 1.4)Ely 1, 2, & 3 47.9 9.0 ( 0.4) 91.2 ( 3.8)
Minor DrainageGrove 0.0 N N N N
Cucamonga and Deer Creek Channel Drainage SystemsTurner 1 & 2 3.1 0.0 0.0 244.0 ( 10.2)Turner 3 & 4 0.7 0.0 0.0 4.5 ( 0.2) MZ-2
Day Creek Channel Drainage System 1,909.9Lower Day 0.0 332.6 ( 14.0) X 0.0 AF***
Etiwanda Channel Drainage System Etiwanda Debris 0.0 183.2 ( 7.7) X 0.0Victoria 0.0 156.4 ( 6.6) 45.4 ( 1.9)
San Sevaine Channel Drainage System (MZ-2)San Sevaine 1, 2, 3, & 4 0.0 524.6 ( 22.0) 0.0 0.0San Sevaine 5 0.0 0.0 0.0 0.0 0.0
West Fontana Channel SystemHickory 9.7 160.2 ( 6.7) 178.4 ( 7.5)Banana 2.5 125.9 ( 5.3) 251.5 ( 10.6)
San Sevaine Channel Drainage System (MZ-3)Jurupa 0.0 0.0 0.0 0.0 0.0
Declez Channel Drainage System MZ-3RP3 Cells 1,3, & 4 3.6 138.4 ( 5.8) 245.3 ( 10.3) 891.9RP3 Cell 2 0.0 32.1 ( 1.3) 55.8 ( 2.3) AF***Declez 6.2 69.2 ( 2.9) 0.0 0.0
Non-Replenishment Recharge**MZ1: Upland (Upland, Montclair,& 8th ( 51.4)MZ1: MVWD (Brooks) ( 1.2)MZ2: None 0.0MZ3: None 0.0
4,476.9 ( 188.0) 1,432.6 ( 60.2) October 2017 Month Total = 5,745 AF 83.3 4,288.9 1,372.4
All Sources SW/LR Imported Recycled WaterFiscal Year Delivery (with evaporation) 22,684.7 ( 188.0) 4,623.6 ( 60.2) Fiscal Year
Since July 1, 2017 = 27,581 AF 521.3 22,496.7 4,563.4 to DateCalendar Year Delivery (with evaporation) 30,553.9 ( 188.0) 11,472.6 ( 60.2) Calendar Year
Since Jan. 1, 2017 = 49,295 AF 7,516.3 30,365.9 11,412.4 to Date
SW : Storm Water, LR : Local Runoff (and GE, MVWD), IW : Imported Water, RW : Recycled Water
X : Turnouts not available - to be installed during future projects.
N : No turnout planned for installation.
* : Water volume delivered to a recharge basin. Data are preliminary based on the data available at the time of this report preparation.
** : Beginning October 2017, evaporation losses are applied per Watermaster (4.2% April through October and 1.5% November through March).
*** : Management Zone Subtotals have deducted from them any Non-Replenishment Recharge, which is
recharge originating from pumped to waste discharges and water recharged for storage agreements.Printed: Jan. 31, 18 v.4
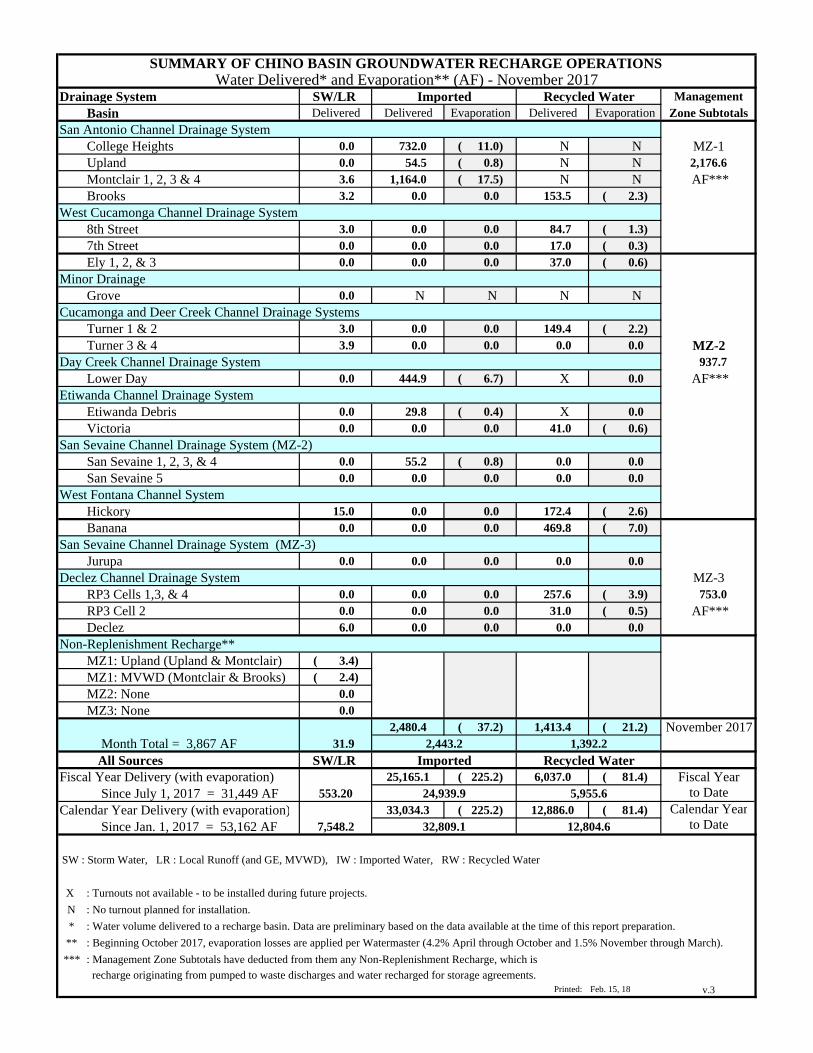
SUMMARY OF CHINO BASIN GROUNDWATER RECHARGE OPERATIONSWater Delivered* and Evaporation** (AF) - November 2017
Drainage System SW/LR Imported Recycled Water Management
Basin Delivered Delivered Evaporation Delivered Evaporation Zone SubtotalsSan Antonio Channel Drainage System
College Heights 0.0 732.0 ( 11.0) N N MZ-1Upland 0.0 54.5 ( 0.8) N N 2,176.6Montclair 1, 2, 3 & 4 3.6 1,164.0 ( 17.5) N N AF***Brooks 3.2 0.0 0.0 153.5 ( 2.3)
West Cucamonga Channel Drainage System 8th Street 3.0 0.0 0.0 84.7 ( 1.3)7th Street 0.0 0.0 0.0 17.0 ( 0.3)Ely 1, 2, & 3 0.0 0.0 0.0 37.0 ( 0.6)
Minor DrainageGrove 0.0 N N N N
Cucamonga and Deer Creek Channel Drainage SystemsTurner 1 & 2 3.0 0.0 0.0 149.4 ( 2.2)Turner 3 & 4 3.9 0.0 0.0 0.0 0.0 MZ-2
Day Creek Channel Drainage System 937.7Lower Day 0.0 444.9 ( 6.7) X 0.0 AF***
Etiwanda Channel Drainage System Etiwanda Debris 0.0 29.8 ( 0.4) X 0.0Victoria 0.0 0.0 0.0 41.0 ( 0.6)
San Sevaine Channel Drainage System (MZ-2)San Sevaine 1, 2, 3, & 4 0.0 55.2 ( 0.8) 0.0 0.0San Sevaine 5 0.0 0.0 0.0 0.0 0.0
West Fontana Channel SystemHickory 15.0 0.0 0.0 172.4 ( 2.6)Banana 0.0 0.0 0.0 469.8 ( 7.0)
San Sevaine Channel Drainage System (MZ-3)Jurupa 0.0 0.0 0.0 0.0 0.0
Declez Channel Drainage System MZ-3RP3 Cells 1,3, & 4 0.0 0.0 0.0 257.6 ( 3.9) 753.0RP3 Cell 2 0.0 0.0 0.0 31.0 ( 0.5) AF***Declez 6.0 0.0 0.0 0.0 0.0
Non-Replenishment Recharge**MZ1: Upland (Upland & Montclair) ( 3.4)MZ1: MVWD (Montclair & Brooks) ( 2.4)MZ2: None 0.0MZ3: None 0.0
2,480.4 ( 37.2) 1,413.4 ( 21.2) November 2017 Month Total = 3,867 AF 31.9 2,443.2 1,392.2
All Sources SW/LR Imported Recycled WaterFiscal Year Delivery (with evaporation) 25,165.1 ( 225.2) 6,037.0 ( 81.4) Fiscal Year
Since July 1, 2017 = 31,449 AF 553.20 24,939.9 5,955.6 to DateCalendar Year Delivery (with evaporation) 33,034.3 ( 225.2) 12,886.0 ( 81.4) Calendar Year
Since Jan. 1, 2017 = 53,162 AF 7,548.2 32,809.1 12,804.6 to Date
SW : Storm Water, LR : Local Runoff (and GE, MVWD), IW : Imported Water, RW : Recycled Water
X : Turnouts not available - to be installed during future projects.
N : No turnout planned for installation.
* : Water volume delivered to a recharge basin. Data are preliminary based on the data available at the time of this report preparation.
** : Beginning October 2017, evaporation losses are applied per Watermaster (4.2% April through October and 1.5% November through March).
*** : Management Zone Subtotals have deducted from them any Non-Replenishment Recharge, which is
recharge originating from pumped to waste discharges and water recharged for storage agreements.Printed: Feb. 15, 18 v.3
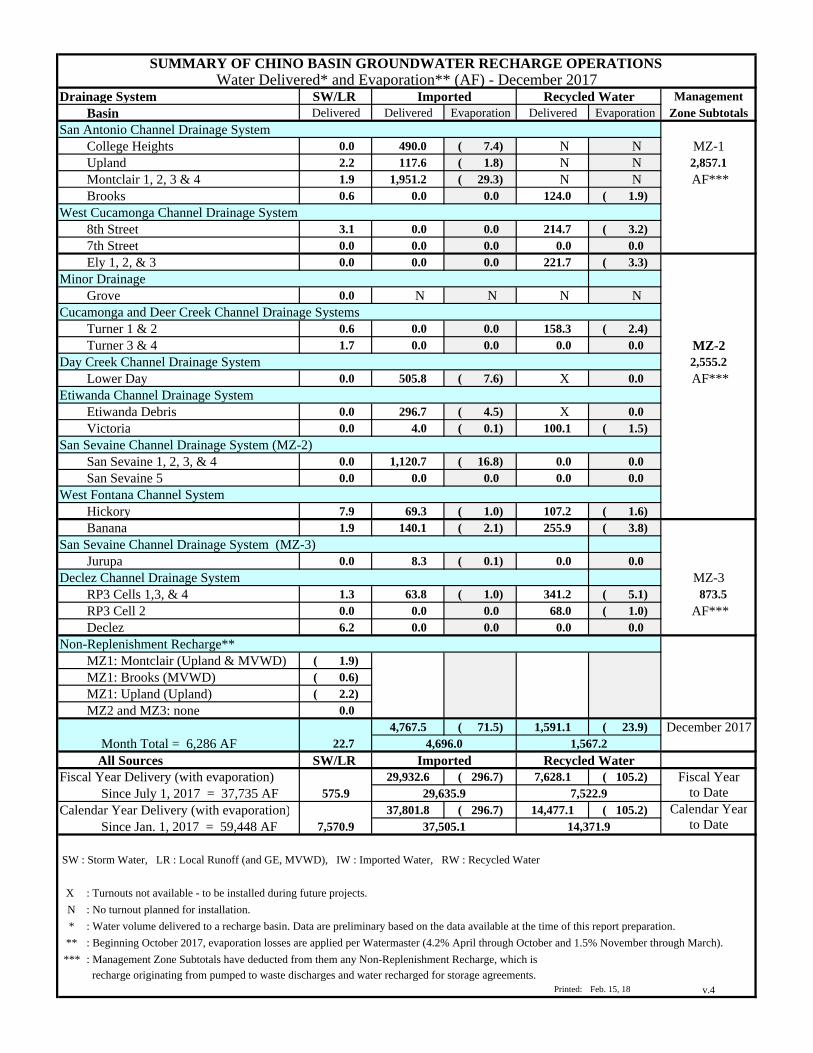
SUMMARY OF CHINO BASIN GROUNDWATER RECHARGE OPERATIONSWater Delivered* and Evaporation** (AF) - December 2017
Drainage System SW/LR Imported Recycled Water Management
Basin Delivered Delivered Evaporation Delivered Evaporation Zone SubtotalsSan Antonio Channel Drainage System
College Heights 0.0 490.0 ( 7.4) N N MZ-1Upland 2.2 117.6 ( 1.8) N N 2,857.1Montclair 1, 2, 3 & 4 1.9 1,951.2 ( 29.3) N N AF***Brooks 0.6 0.0 0.0 124.0 ( 1.9)
West Cucamonga Channel Drainage System 8th Street 3.1 0.0 0.0 214.7 ( 3.2)7th Street 0.0 0.0 0.0 0.0 0.0Ely 1, 2, & 3 0.0 0.0 0.0 221.7 ( 3.3)
Minor DrainageGrove 0.0 N N N N
Cucamonga and Deer Creek Channel Drainage SystemsTurner 1 & 2 0.6 0.0 0.0 158.3 ( 2.4)Turner 3 & 4 1.7 0.0 0.0 0.0 0.0 MZ-2
Day Creek Channel Drainage System 2,555.2Lower Day 0.0 505.8 ( 7.6) X 0.0 AF***
Etiwanda Channel Drainage System Etiwanda Debris 0.0 296.7 ( 4.5) X 0.0Victoria 0.0 4.0 ( 0.1) 100.1 ( 1.5)
San Sevaine Channel Drainage System (MZ-2)San Sevaine 1, 2, 3, & 4 0.0 1,120.7 ( 16.8) 0.0 0.0San Sevaine 5 0.0 0.0 0.0 0.0 0.0
West Fontana Channel SystemHickory 7.9 69.3 ( 1.0) 107.2 ( 1.6)Banana 1.9 140.1 ( 2.1) 255.9 ( 3.8)
San Sevaine Channel Drainage System (MZ-3)Jurupa 0.0 8.3 ( 0.1) 0.0 0.0
Declez Channel Drainage System MZ-3RP3 Cells 1,3, & 4 1.3 63.8 ( 1.0) 341.2 ( 5.1) 873.5RP3 Cell 2 0.0 0.0 0.0 68.0 ( 1.0) AF***Declez 6.2 0.0 0.0 0.0 0.0
Non-Replenishment Recharge**MZ1: Montclair (Upland & MVWD) ( 1.9)MZ1: Brooks (MVWD) ( 0.6)MZ1: Upland (Upland) ( 2.2)MZ2 and MZ3: none 0.0
4,767.5 ( 71.5) 1,591.1 ( 23.9) December 2017 Month Total = 6,286 AF 22.7 4,696.0 1,567.2
All Sources SW/LR Imported Recycled WaterFiscal Year Delivery (with evaporation) 29,932.6 ( 296.7) 7,628.1 ( 105.2) Fiscal Year
Since July 1, 2017 = 37,735 AF 575.9 29,635.9 7,522.9 to DateCalendar Year Delivery (with evaporation) 37,801.8 ( 296.7) 14,477.1 ( 105.2) Calendar Year
Since Jan. 1, 2017 = 59,448 AF 7,570.9 37,505.1 14,371.9 to Date
SW : Storm Water, LR : Local Runoff (and GE, MVWD), IW : Imported Water, RW : Recycled Water
X : Turnouts not available - to be installed during future projects.
N : No turnout planned for installation.
* : Water volume delivered to a recharge basin. Data are preliminary based on the data available at the time of this report preparation.
** : Beginning October 2017, evaporation losses are applied per Watermaster (4.2% April through October and 1.5% November through March).
*** : Management Zone Subtotals have deducted from them any Non-Replenishment Recharge, which is
recharge originating from pumped to waste discharges and water recharged for storage agreements.Printed: Feb. 15, 18 v.4

APPENDIX B
RWC MANAGEMENT PLANS
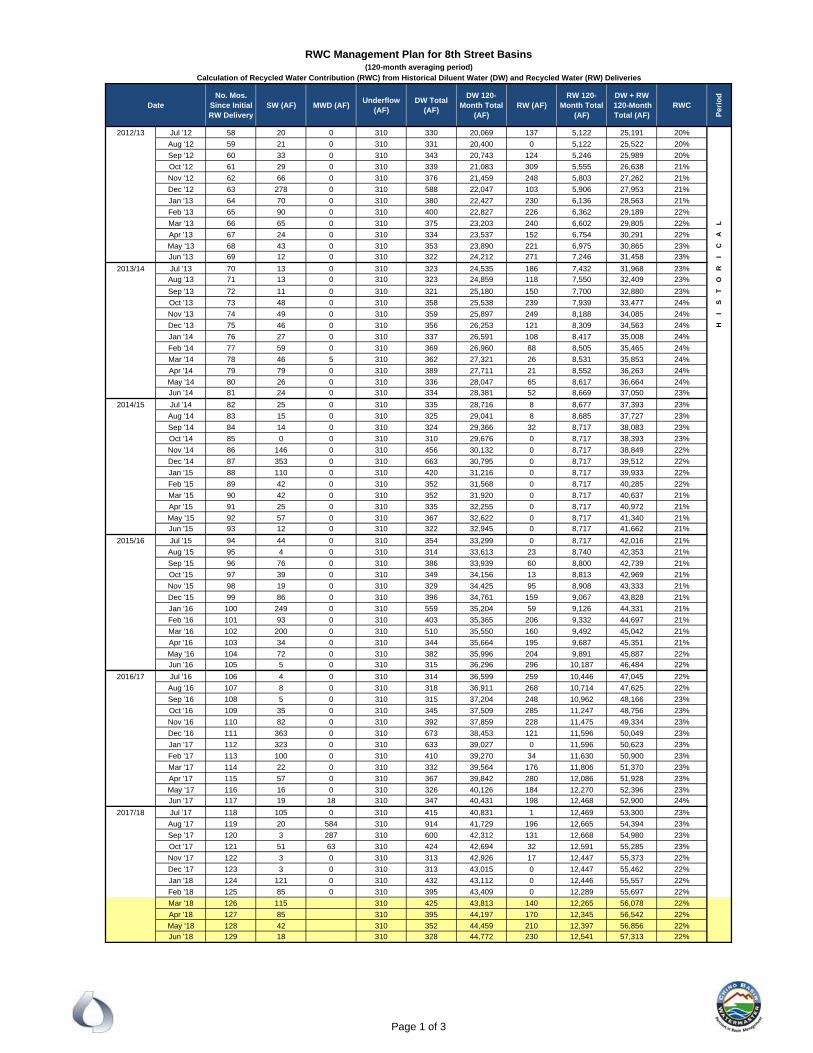
RWC Management Plan for 8th Street Basins(120-month averaging period)
Calculation of Recycled Water Contribution (RWC) from Historical Diluent Water (DW) and Recycled Water (RW) Deliveries
DateNo. Mos.
Since Initial RW Delivery
SW (AF) MWD (AF)Underflow
(AF)DW Total
(AF)
DW 120-Month Total
(AF)RW (AF)
RW 120-Month Total
(AF)
DW + RW 120-Month Total (AF)
RWC
Pe
rio
d
2012/13 Jul '12 58 20 0 310 330 20,069 137 5,122 25,191 20%
Aug '12 59 21 0 310 331 20,400 0 5,122 25,522 20%
Sep '12 60 33 0 310 343 20,743 124 5,246 25,989 20%
Oct '12 61 29 0 310 339 21,083 309 5,555 26,638 21%
Nov '12 62 66 0 310 376 21,459 248 5,803 27,262 21%
Dec '12 63 278 0 310 588 22,047 103 5,906 27,953 21%
Jan '13 64 70 0 310 380 22,427 230 6,136 28,563 21%
Feb '13 65 90 0 310 400 22,827 226 6,362 29,189 22%
Mar '13 66 65 0 310 375 23,203 240 6,602 29,805 22% L
Apr '13 67 24 0 310 334 23,537 152 6,754 30,291 22% A
May '13 68 43 0 310 353 23,890 221 6,975 30,865 23% C
Jun '13 69 12 0 310 322 24,212 271 7,246 31,458 23% I
2013/14 Jul '13 70 13 0 310 323 24,535 186 7,432 31,968 23% R
Aug '13 71 13 0 310 323 24,859 118 7,550 32,409 23% O
Sep '13 72 11 0 310 321 25,180 150 7,700 32,880 23% T
Oct '13 73 48 0 310 358 25,538 239 7,939 33,477 24% S
Nov '13 74 49 0 310 359 25,897 249 8,188 34,085 24% I
Dec '13 75 46 0 310 356 26,253 121 8,309 34,563 24% H
Jan '14 76 27 0 310 337 26,591 108 8,417 35,008 24%
Feb '14 77 59 0 310 369 26,960 88 8,505 35,465 24%
Mar '14 78 46 5 310 362 27,321 26 8,531 35,853 24%
Apr '14 79 79 0 310 389 27,711 21 8,552 36,263 24%
May '14 80 26 0 310 336 28,047 65 8,617 36,664 24%
Jun '14 81 24 0 310 334 28,381 52 8,669 37,050 23%
2014/15 Jul '14 82 25 0 310 335 28,716 8 8,677 37,393 23%
Aug '14 83 15 0 310 325 29,041 8 8,685 37,727 23%
Sep '14 84 14 0 310 324 29,366 32 8,717 38,083 23%
Oct '14 85 0 0 310 310 29,676 0 8,717 38,393 23%
Nov '14 86 146 0 310 456 30,132 0 8,717 38,849 22%
Dec '14 87 353 0 310 663 30,795 0 8,717 39,512 22%
Jan '15 88 110 0 310 420 31,216 0 8,717 39,933 22%
Feb '15 89 42 0 310 352 31,568 0 8,717 40,285 22%
Mar '15 90 42 0 310 352 31,920 0 8,717 40,637 21%
Apr '15 91 25 0 310 335 32,255 0 8,717 40,972 21%
May '15 92 57 0 310 367 32,622 0 8,717 41,340 21%
Jun '15 93 12 0 310 322 32,945 0 8,717 41,662 21%
2015/16 Jul '15 94 44 0 310 354 33,299 0 8,717 42,016 21%
Aug '15 95 4 0 310 314 33,613 23 8,740 42,353 21%
Sep '15 96 76 0 310 386 33,939 60 8,800 42,739 21%
Oct '15 97 39 0 310 349 34,156 13 8,813 42,969 21%
Nov '15 98 19 0 310 329 34,425 95 8,908 43,333 21%
Dec '15 99 86 0 310 396 34,761 159 9,067 43,828 21%
Jan '16 100 249 0 310 559 35,204 59 9,126 44,331 21%
Feb '16 101 93 0 310 403 35,365 206 9,332 44,697 21%
Mar '16 102 200 0 310 510 35,550 160 9,492 45,042 21%
Apr '16 103 34 0 310 344 35,664 195 9,687 45,351 21%
May '16 104 72 0 310 382 35,996 204 9,891 45,887 22%
Jun '16 105 5 0 310 315 36,296 296 10,187 46,484 22%
2016/17 Jul '16 106 4 0 310 314 36,599 259 10,446 47,045 22%
Aug '16 107 8 0 310 318 36,911 268 10,714 47,625 22%
Sep '16 108 5 0 310 315 37,204 248 10,962 48,166 23%
Oct '16 109 35 0 310 345 37,509 285 11,247 48,756 23%
Nov '16 110 82 0 310 392 37,859 228 11,475 49,334 23%
Dec '16 111 363 0 310 673 38,453 121 11,596 50,049 23%
Jan '17 112 323 0 310 633 39,027 0 11,596 50,623 23%
Feb '17 113 100 0 310 410 39,270 34 11,630 50,900 23%
Mar '17 114 22 0 310 332 39,564 176 11,806 51,370 23%
Apr '17 115 57 0 310 367 39,842 280 12,086 51,928 23%
May '17 116 16 0 310 326 40,126 184 12,270 52,396 23%
Jun '17 117 19 18 310 347 40,431 198 12,468 52,900 24%
2017/18 Jul '17 118 105 0 310 415 40,831 1 12,469 53,300 23%
Aug '17 119 20 584 310 914 41,729 196 12,665 54,394 23%
Sep '17 120 3 287 310 600 42,312 131 12,668 54,980 23%
Oct '17 121 51 63 310 424 42,694 32 12,591 55,285 23%
Nov '17 122 3 0 310 313 42,926 17 12,447 55,373 22%
Dec '17 123 3 0 310 313 43,015 0 12,447 55,462 22%
Jan '18 124 121 0 310 432 43,112 0 12,446 55,557 22%
Feb '18 125 85 0 310 395 43,409 0 12,289 55,697 22%
Mar '18 126 115 310 425 43,813 140 12,265 56,078 22%
Apr '18 127 85 310 395 44,197 170 12,345 56,542 22%
May '18 128 42 310 352 44,459 210 12,397 56,856 22%
Jun '18 129 18 310 328 44,772 230 12,541 57,313 22%
Page 1 of 3
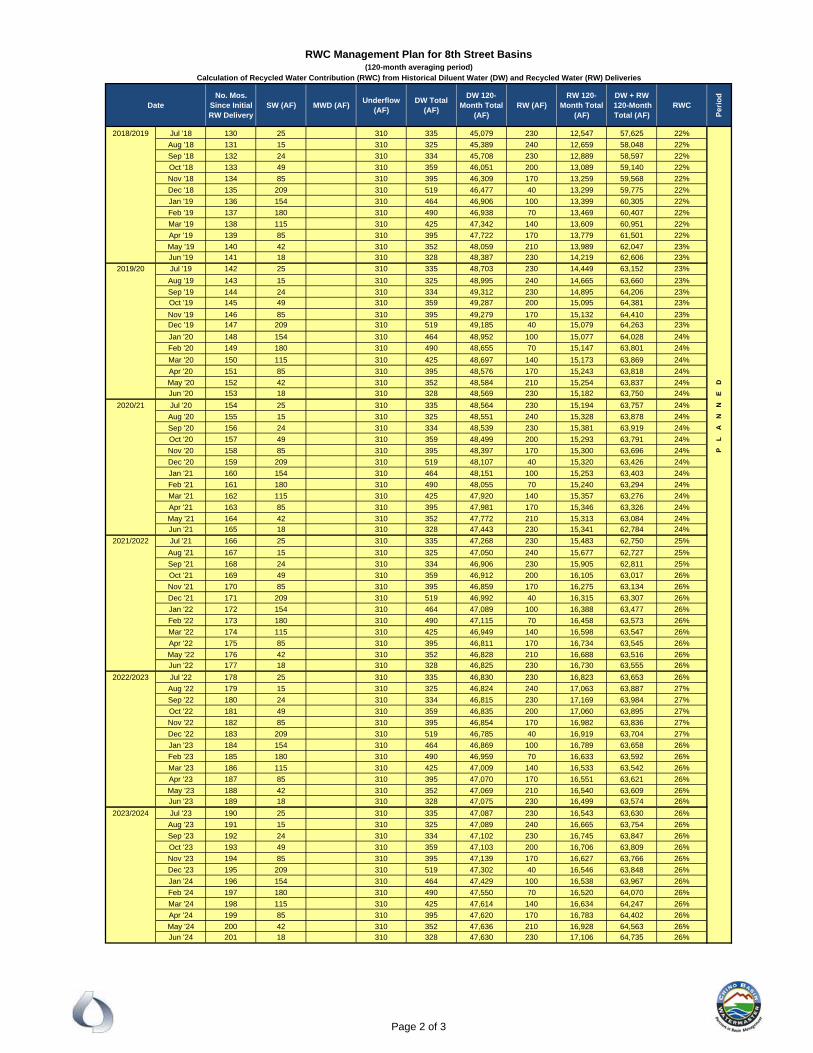
RWC Management Plan for 8th Street Basins(120-month averaging period)
Calculation of Recycled Water Contribution (RWC) from Historical Diluent Water (DW) and Recycled Water (RW) Deliveries
DateNo. Mos.
Since Initial RW Delivery
SW (AF) MWD (AF)Underflow
(AF)DW Total
(AF)
DW 120-Month Total
(AF)RW (AF)
RW 120-Month Total
(AF)
DW + RW 120-Month Total (AF)
RWC
Pe
rio
d
2018/2019 Jul '18 130 25 310 335 45,079 230 12,547 57,625 22%
Aug '18 131 15 310 325 45,389 240 12,659 58,048 22%
Sep '18 132 24 310 334 45,708 230 12,889 58,597 22%
Oct '18 133 49 310 359 46,051 200 13,089 59,140 22%
Nov '18 134 85 310 395 46,309 170 13,259 59,568 22%
Dec '18 135 209 310 519 46,477 40 13,299 59,775 22%
Jan '19 136 154 310 464 46,906 100 13,399 60,305 22%
Feb '19 137 180 310 490 46,938 70 13,469 60,407 22%
Mar '19 138 115 310 425 47,342 140 13,609 60,951 22%
Apr '19 139 85 310 395 47,722 170 13,779 61,501 22%
May '19 140 42 310 352 48,059 210 13,989 62,047 23%
Jun '19 141 18 310 328 48,387 230 14,219 62,606 23%
2019/20 Jul '19 142 25 310 335 48,703 230 14,449 63,152 23%
Aug '19 143 15 310 325 48,995 240 14,665 63,660 23%
Sep '19 144 24 310 334 49,312 230 14,895 64,206 23%
Oct '19 145 49 310 359 49,287 200 15,095 64,381 23%
Nov '19 146 85 310 395 49,279 170 15,132 64,410 23%Dec '19 147 209 310 519 49,185 40 15,079 64,263 23%
Jan '20 148 154 310 464 48,952 100 15,077 64,028 24%
Feb '20 149 180 310 490 48,655 70 15,147 63,801 24%
Mar '20 150 115 310 425 48,697 140 15,173 63,869 24%
Apr '20 151 85 310 395 48,576 170 15,243 63,818 24%
May '20 152 42 310 352 48,584 210 15,254 63,837 24% D
Jun '20 153 18 310 328 48,569 230 15,182 63,750 24% E
2020/21 Jul '20 154 25 310 335 48,564 230 15,194 63,757 24% N
Aug '20 155 15 310 325 48,551 240 15,328 63,878 24% N
Sep '20 156 24 310 334 48,539 230 15,381 63,919 24% A
Oct '20 157 49 310 359 48,499 200 15,293 63,791 24% L
Nov '20 158 85 310 395 48,397 170 15,300 63,696 24% P
Dec '20 159 209 310 519 48,107 40 15,320 63,426 24%
Jan '21 160 154 310 464 48,151 100 15,253 63,403 24%
Feb '21 161 180 310 490 48,055 70 15,240 63,294 24%
Mar '21 162 115 310 425 47,920 140 15,357 63,276 24%
Apr '21 163 85 310 395 47,981 170 15,346 63,326 24%
May '21 164 42 310 352 47,772 210 15,313 63,084 24%
Jun '21 165 18 310 328 47,443 230 15,341 62,784 24%
2021/2022 Jul '21 166 25 310 335 47,268 230 15,483 62,750 25%
Aug '21 167 15 310 325 47,050 240 15,677 62,727 25%
Sep '21 168 24 310 334 46,906 230 15,905 62,811 25%
Oct '21 169 49 310 359 46,912 200 16,105 63,017 26%
Nov '21 170 85 310 395 46,859 170 16,275 63,134 26%
Dec '21 171 209 310 519 46,992 40 16,315 63,307 26%
Jan '22 172 154 310 464 47,089 100 16,388 63,477 26%
Feb '22 173 180 310 490 47,115 70 16,458 63,573 26%
Mar '22 174 115 310 425 46,949 140 16,598 63,547 26%
Apr '22 175 85 310 395 46,811 170 16,734 63,545 26%
May '22 176 42 310 352 46,828 210 16,688 63,516 26%
Jun '22 177 18 310 328 46,825 230 16,730 63,555 26%
2022/2023 Jul '22 178 25 310 335 46,830 230 16,823 63,653 26%
Aug '22 179 15 310 325 46,824 240 17,063 63,887 27%
Sep '22 180 24 310 334 46,815 230 17,169 63,984 27%
Oct '22 181 49 310 359 46,835 200 17,060 63,895 27%
Nov '22 182 85 310 395 46,854 170 16,982 63,836 27%
Dec '22 183 209 310 519 46,785 40 16,919 63,704 27%
Jan '23 184 154 310 464 46,869 100 16,789 63,658 26%
Feb '23 185 180 310 490 46,959 70 16,633 63,592 26%
Mar '23 186 115 310 425 47,009 140 16,533 63,542 26%
Apr '23 187 85 310 395 47,070 170 16,551 63,621 26%
May '23 188 42 310 352 47,069 210 16,540 63,609 26%
Jun '23 189 18 310 328 47,075 230 16,499 63,574 26%
2023/2024 Jul '23 190 25 310 335 47,087 230 16,543 63,630 26%
Aug '23 191 15 310 325 47,089 240 16,665 63,754 26%
Sep '23 192 24 310 334 47,102 230 16,745 63,847 26%
Oct '23 193 49 310 359 47,103 200 16,706 63,809 26%
Nov '23 194 85 310 395 47,139 170 16,627 63,766 26%
Dec '23 195 209 310 519 47,302 40 16,546 63,848 26%
Jan '24 196 154 310 464 47,429 100 16,538 63,967 26%
Feb '24 197 180 310 490 47,550 70 16,520 64,070 26%
Mar '24 198 115 310 425 47,614 140 16,634 64,247 26%
Apr '24 199 85 310 395 47,620 170 16,783 64,402 26%
May '24 200 42 310 352 47,636 210 16,928 64,563 26%
Jun '24 201 18 310 328 47,630 230 17,106 64,735 26%
Page 2 of 3
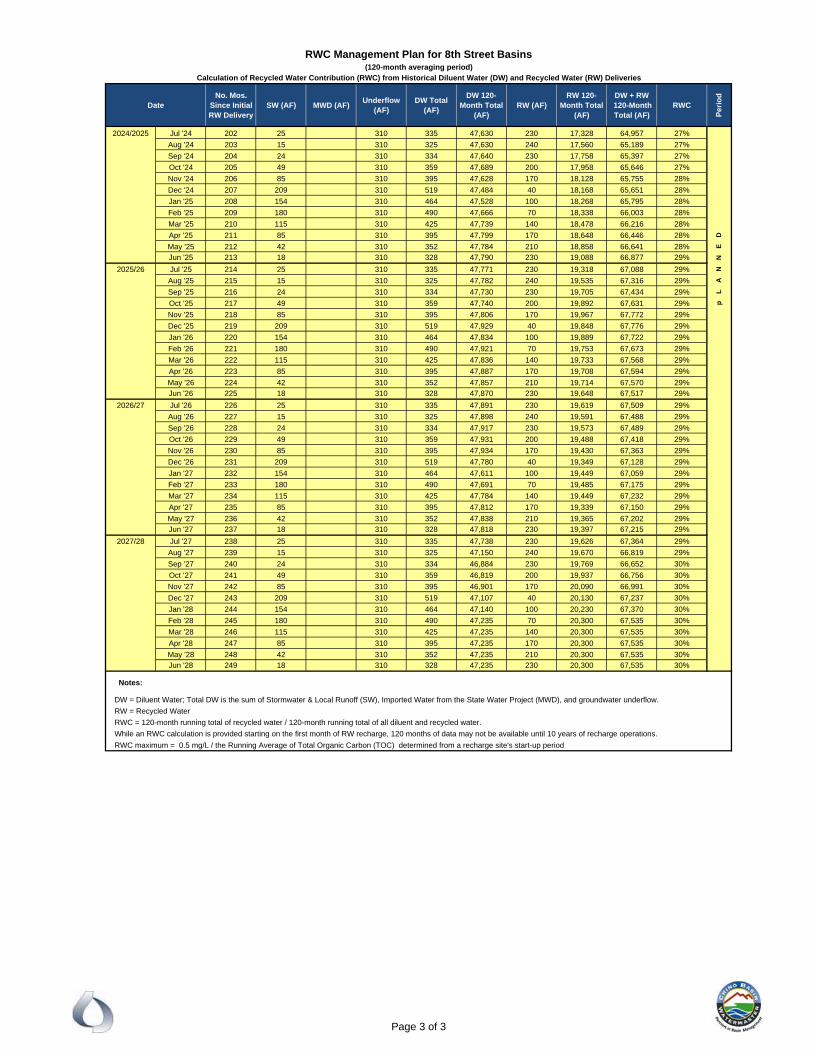
RWC Management Plan for 8th Street Basins(120-month averaging period)
Calculation of Recycled Water Contribution (RWC) from Historical Diluent Water (DW) and Recycled Water (RW) Deliveries
DateNo. Mos.
Since Initial RW Delivery
SW (AF) MWD (AF)Underflow
(AF)DW Total
(AF)
DW 120-Month Total
(AF)RW (AF)
RW 120-Month Total
(AF)
DW + RW 120-Month Total (AF)
RWC
Pe
rio
d
2024/2025 Jul '24 202 25 310 335 47,630 230 17,328 64,957 27%
Aug '24 203 15 310 325 47,630 240 17,560 65,189 27%
Sep '24 204 24 310 334 47,640 230 17,758 65,397 27%
Oct '24 205 49 310 359 47,689 200 17,958 65,646 27%
Nov '24 206 85 310 395 47,628 170 18,128 65,755 28%
Dec '24 207 209 310 519 47,484 40 18,168 65,651 28%
Jan '25 208 154 310 464 47,528 100 18,268 65,795 28%
Feb '25 209 180 310 490 47,666 70 18,338 66,003 28%
Mar '25 210 115 310 425 47,739 140 18,478 66,216 28%
Apr '25 211 85 310 395 47,799 170 18,648 66,446 28% D
May '25 212 42 310 352 47,784 210 18,858 66,641 28% E
Jun '25 213 18 310 328 47,790 230 19,088 66,877 29% N
2025/26 Jul '25 214 25 310 335 47,771 230 19,318 67,088 29% N
Aug '25 215 15 310 325 47,782 240 19,535 67,316 29% A
Sep '25 216 24 310 334 47,730 230 19,705 67,434 29% L
Oct '25 217 49 310 359 47,740 200 19,892 67,631 29% p
Nov '25 218 85 310 395 47,806 170 19,967 67,772 29%
Dec '25 219 209 310 519 47,929 40 19,848 67,776 29%
Jan '26 220 154 310 464 47,834 100 19,889 67,722 29%
Feb '26 221 180 310 490 47,921 70 19,753 67,673 29%
Mar '26 222 115 310 425 47,836 140 19,733 67,568 29%
Apr '26 223 85 310 395 47,887 170 19,708 67,594 29%
May '26 224 42 310 352 47,857 210 19,714 67,570 29%
Jun '26 225 18 310 328 47,870 230 19,648 67,517 29%
2026/27 Jul '26 226 25 310 335 47,891 230 19,619 67,509 29%
Aug '26 227 15 310 325 47,898 240 19,591 67,488 29%
Sep '26 228 24 310 334 47,917 230 19,573 67,489 29%
Oct '26 229 49 310 359 47,931 200 19,488 67,418 29%
Nov '26 230 85 310 395 47,934 170 19,430 67,363 29%
Dec '26 231 209 310 519 47,780 40 19,349 67,128 29%
Jan '27 232 154 310 464 47,611 100 19,449 67,059 29%
Feb '27 233 180 310 490 47,691 70 19,485 67,175 29%
Mar '27 234 115 310 425 47,784 140 19,449 67,232 29%
Apr '27 235 85 310 395 47,812 170 19,339 67,150 29%
May '27 236 42 310 352 47,838 210 19,365 67,202 29%
Jun '27 237 18 310 328 47,818 230 19,397 67,215 29%
2027/28 Jul '27 238 25 310 335 47,738 230 19,626 67,364 29%
Aug '27 239 15 310 325 47,150 240 19,670 66,819 29%
Sep '27 240 24 310 334 46,884 230 19,769 66,652 30%
Oct '27 241 49 310 359 46,819 200 19,937 66,756 30%
Nov '27 242 85 310 395 46,901 170 20,090 66,991 30%
Dec '27 243 209 310 519 47,107 40 20,130 67,237 30%
Jan '28 244 154 310 464 47,140 100 20,230 67,370 30%
Feb '28 245 180 310 490 47,235 70 20,300 67,535 30%
Mar '28 246 115 310 425 47,235 140 20,300 67,535 30%
Apr '28 247 85 310 395 47,235 170 20,300 67,535 30%
May '28 248 42 310 352 47,235 210 20,300 67,535 30%
Jun '28 249 18 310 328 47,235 230 20,300 67,535 30%
Notes:
DW = Diluent Water; Total DW is the sum of Stormwater & Local Runoff (SW), Imported Water from the State Water Project (MWD), and groundwater underflow.
RW = Recycled Water
RWC = 120-month running total of recycled water / 120-month running total of all diluent and recycled water.
While an RWC calculation is provided starting on the first month of RW recharge, 120 months of data may not be available until 10 years of recharge operations.
RWC maximum = 0.5 mg/L / the Running Average of Total Organic Carbon (TOC) determined from a recharge site's start-up period
Page 3 of 3
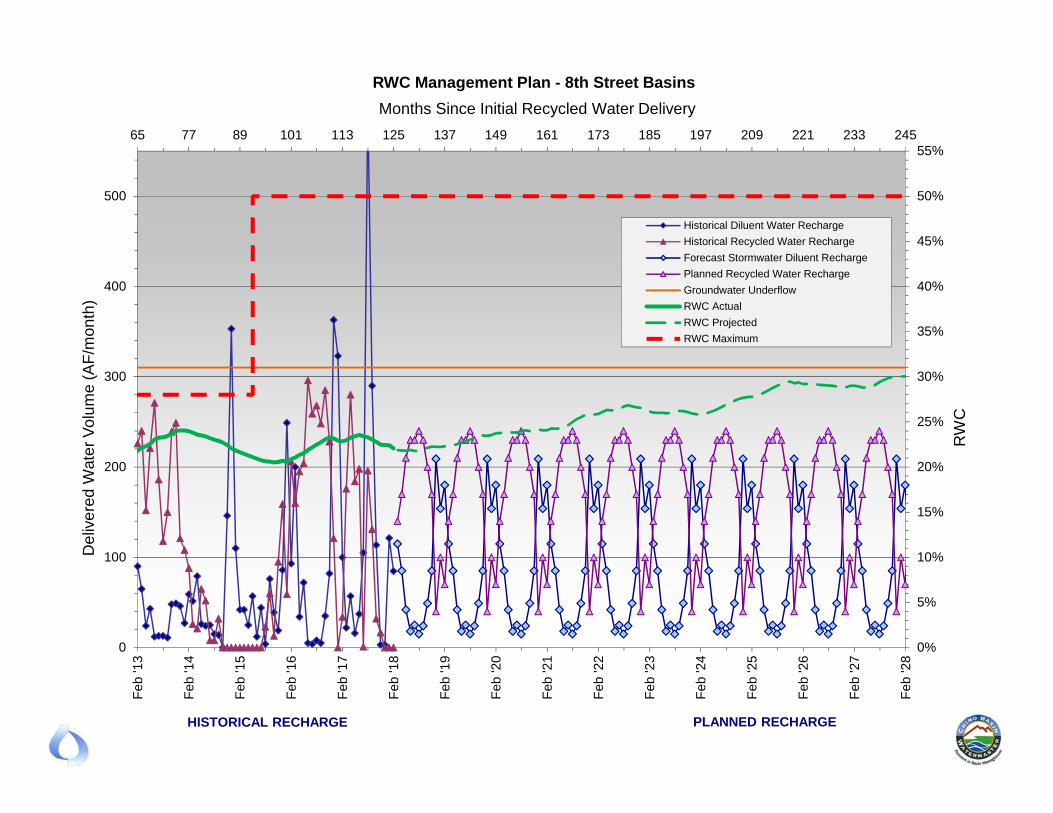
0%
5%
10%
15%
20%
25%
30%
35%
40%
45%
50%
55%65 77 89 101 113 125 137 149 161 173 185 197 209 221 233 245
0
100
200
300
400
500
Feb
'13
Feb
'14
Feb
'15
Feb
'16
Feb
'17
Feb
'18
Feb
'19
Feb
'20
Feb
'21
Feb
'22
Feb
'23
Feb
'24
Feb
'25
Feb
'26
Feb
'27
Feb
'28
RW
C
Months Since Initial Recycled Water DeliveryD
eliv
ere
d W
ate
r V
olu
me
(A
F/m
on
th)
RWC Management Plan - 8th Street Basins
Historical Diluent Water Recharge
Historical Recycled Water Recharge
Forecast Stormwater Diluent Recharge
Planned Recycled Water Recharge
Groundwater Underflow
RWC Actual
RWC Projected
RWC Maximum
HISTORICAL RECHARGE PLANNED RECHARGE
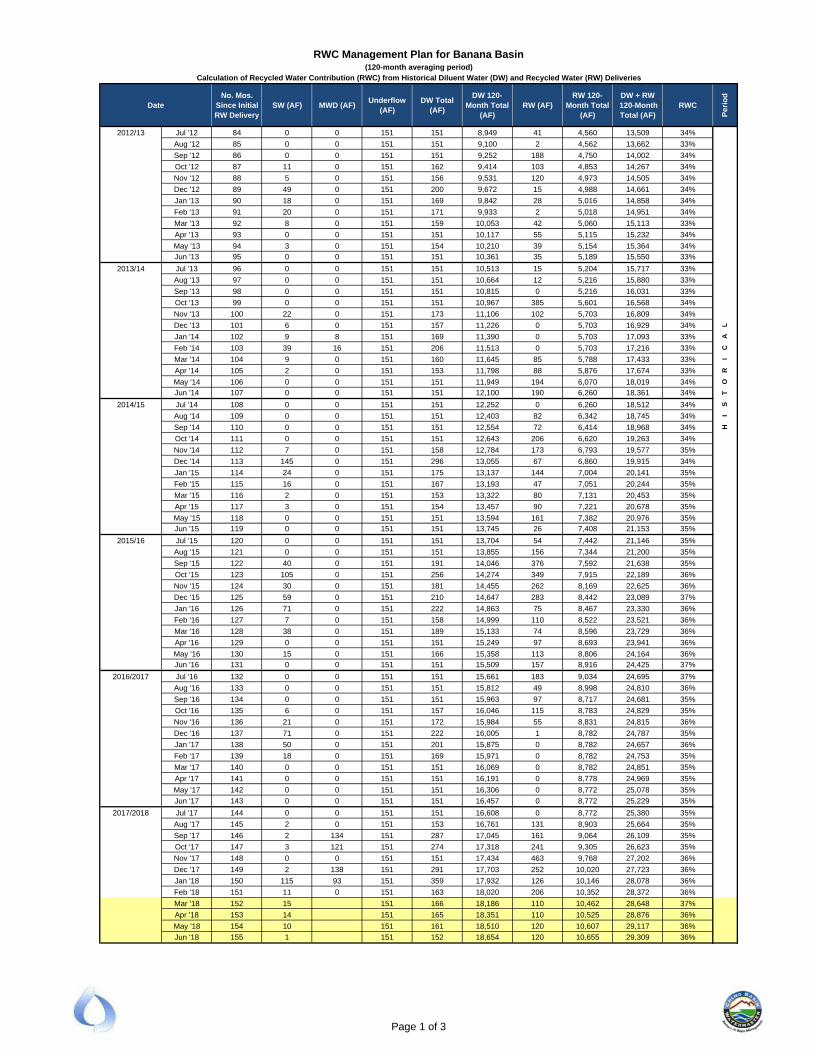
RWC Management Plan for Banana Basin(120-month averaging period)
Calculation of Recycled Water Contribution (RWC) from Historical Diluent Water (DW) and Recycled Water (RW) Deliveries
DateNo. Mos.
Since Initial RW Delivery
SW (AF) MWD (AF)Underflow
(AF)DW Total
(AF)
DW 120-Month Total
(AF)RW (AF)
RW 120-Month Total
(AF)
DW + RW 120-Month Total (AF)
RWC
Pe
rio
d
2012/13 Jul '12 84 0 0 151 151 8,949 41 4,560 13,509 34%
Aug '12 85 0 0 151 151 9,100 2 4,562 13,662 33%
Sep '12 86 0 0 151 151 9,252 188 4,750 14,002 34%
Oct '12 87 11 0 151 162 9,414 103 4,853 14,267 34%
Nov '12 88 5 0 151 156 9,531 120 4,973 14,505 34%
Dec '12 89 49 0 151 200 9,672 15 4,988 14,661 34%
Jan '13 90 18 0 151 169 9,842 28 5,016 14,858 34%
Feb '13 91 20 0 151 171 9,933 2 5,018 14,951 34%
Mar '13 92 8 0 151 159 10,053 42 5,060 15,113 33%
Apr '13 93 0 0 151 151 10,117 55 5,115 15,232 34%
May '13 94 3 0 151 154 10,210 39 5,154 15,364 34%
Jun '13 95 0 0 151 151 10,361 35 5,189 15,550 33%
2013/14 Jul '13 96 0 0 151 151 10,513 15 5,204 15,717 33%
Aug '13 97 0 0 151 151 10,664 12 5,216 15,880 33%
Sep '13 98 0 0 151 151 10,815 0 5,216 16,031 33%
Oct '13 99 0 0 151 151 10,967 385 5,601 16,568 34%
Nov '13 100 22 0 151 173 11,106 102 5,703 16,809 34%
Dec '13 101 6 0 151 157 11,226 0 5,703 16,929 34% L
Jan '14 102 9 8 151 169 11,390 0 5,703 17,093 33% A
Feb '14 103 39 16 151 206 11,513 0 5,703 17,216 33% C
Mar '14 104 9 0 151 160 11,645 85 5,788 17,433 33% I
Apr '14 105 2 0 151 153 11,798 88 5,876 17,674 33% R
May '14 106 0 0 151 151 11,949 194 6,070 18,019 34% O
Jun '14 107 0 0 151 151 12,100 190 6,260 18,361 34% T
2014/15 Jul '14 108 0 0 151 151 12,252 0 6,260 18,512 34% S
Aug '14 109 0 0 151 151 12,403 82 6,342 18,745 34% I
Sep '14 110 0 0 151 151 12,554 72 6,414 18,968 34% H
Oct '14 111 0 0 151 151 12,643 206 6,620 19,263 34%
Nov '14 112 7 0 151 158 12,784 173 6,793 19,577 35%
Dec '14 113 145 0 151 296 13,055 67 6,860 19,915 34%
Jan '15 114 24 0 151 175 13,137 144 7,004 20,141 35%
Feb '15 115 16 0 151 167 13,193 47 7,051 20,244 35%
Mar '15 116 2 0 151 153 13,322 80 7,131 20,453 35%
Apr '15 117 3 0 151 154 13,457 90 7,221 20,678 35%
May '15 118 0 0 151 151 13,594 161 7,382 20,976 35%
Jun '15 119 0 0 151 151 13,745 26 7,408 21,153 35%
2015/16 Jul '15 120 0 0 151 151 13,704 54 7,442 21,146 35%
Aug '15 121 0 0 151 151 13,855 156 7,344 21,200 35%
Sep '15 122 40 0 151 191 14,046 376 7,592 21,638 35%
Oct '15 123 105 0 151 256 14,274 349 7,915 22,189 36%
Nov '15 124 30 0 151 181 14,455 262 8,169 22,625 36%
Dec '15 125 59 0 151 210 14,647 283 8,442 23,089 37%
Jan '16 126 71 0 151 222 14,863 75 8,467 23,330 36%
Feb '16 127 7 0 151 158 14,999 110 8,522 23,521 36%
Mar '16 128 38 0 151 189 15,133 74 8,596 23,729 36%
Apr '16 129 0 0 151 151 15,249 97 8,693 23,941 36%
May '16 130 15 0 151 166 15,358 113 8,806 24,164 36%
Jun '16 131 0 0 151 151 15,509 157 8,916 24,425 37%
2016/2017 Jul '16 132 0 0 151 151 15,661 183 9,034 24,695 37%
Aug '16 133 0 0 151 151 15,812 49 8,998 24,810 36%
Sep '16 134 0 0 151 151 15,963 97 8,717 24,681 35%
Oct '16 135 6 0 151 157 16,046 115 8,783 24,829 35%
Nov '16 136 21 0 151 172 15,984 55 8,831 24,815 36%
Dec '16 137 71 0 151 222 16,005 1 8,782 24,787 35%
Jan '17 138 50 0 151 201 15,875 0 8,782 24,657 36%
Feb '17 139 18 0 151 169 15,971 0 8,782 24,753 35%
Mar '17 140 0 0 151 151 16,069 0 8,782 24,851 35%
Apr '17 141 0 0 151 151 16,191 0 8,778 24,969 35%
May '17 142 0 0 151 151 16,306 0 8,772 25,078 35%
Jun '17 143 0 0 151 151 16,457 0 8,772 25,229 35%
2017/2018 Jul '17 144 0 0 151 151 16,608 0 8,772 25,380 35%
Aug '17 145 2 0 151 153 16,761 131 8,903 25,664 35%
Sep '17 146 2 134 151 287 17,045 161 9,064 26,109 35%
Oct '17 147 3 121 151 274 17,318 241 9,305 26,623 35%
Nov '17 148 0 0 151 151 17,434 463 9,768 27,202 36%
Dec '17 149 2 138 151 291 17,703 252 10,020 27,723 36%
Jan '18 150 115 93 151 359 17,932 126 10,146 28,078 36%
Feb '18 151 11 0 151 163 18,020 206 10,352 28,372 36%
Mar '18 152 15 151 166 18,186 110 10,462 28,648 37%
Apr '18 153 14 151 165 18,351 110 10,525 28,876 36%
May '18 154 10 151 161 18,510 120 10,607 29,117 36%
Jun '18 155 1 151 152 18,654 120 10,655 29,309 36%
Page 1 of 3
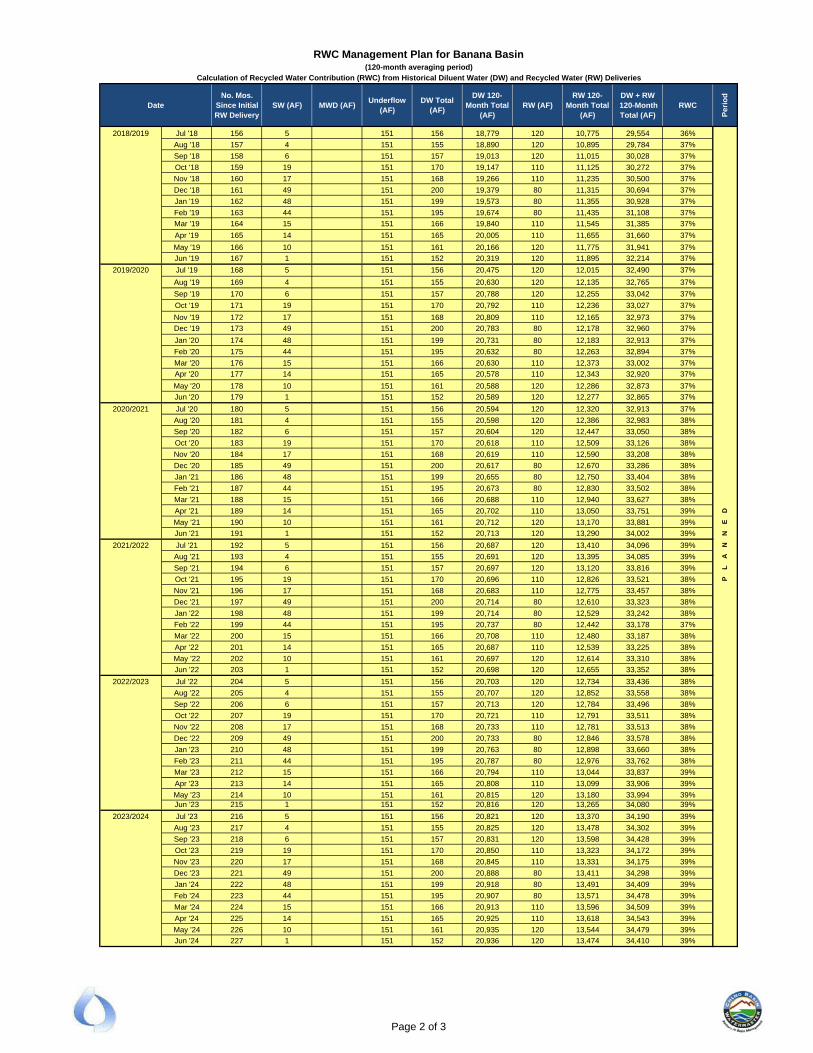
RWC Management Plan for Banana Basin(120-month averaging period)
Calculation of Recycled Water Contribution (RWC) from Historical Diluent Water (DW) and Recycled Water (RW) Deliveries
DateNo. Mos.
Since Initial RW Delivery
SW (AF) MWD (AF)Underflow
(AF)DW Total
(AF)
DW 120-Month Total
(AF)RW (AF)
RW 120-Month Total
(AF)
DW + RW 120-Month Total (AF)
RWC
Pe
rio
d
2018/2019 Jul '18 156 5 151 156 18,779 120 10,775 29,554 36%
Aug '18 157 4 151 155 18,890 120 10,895 29,784 37%
Sep '18 158 6 151 157 19,013 120 11,015 30,028 37%
Oct '18 159 19 151 170 19,147 110 11,125 30,272 37%
Nov '18 160 17 151 168 19,266 110 11,235 30,500 37%
Dec '18 161 49 151 200 19,379 80 11,315 30,694 37%
Jan '19 162 48 151 199 19,573 80 11,355 30,928 37%
Feb '19 163 44 151 195 19,674 80 11,435 31,108 37%
Mar '19 164 15 151 166 19,840 110 11,545 31,385 37%
Apr '19 165 14 151 165 20,005 110 11,655 31,660 37%
May '19 166 10 151 161 20,166 120 11,775 31,941 37%
Jun '19 167 1 151 152 20,319 120 11,895 32,214 37%
2019/2020 Jul '19 168 5 151 156 20,475 120 12,015 32,490 37%
Aug '19 169 4 151 155 20,630 120 12,135 32,765 37%
Sep '19 170 6 151 157 20,788 120 12,255 33,042 37%
Oct '19 171 19 151 170 20,792 110 12,236 33,027 37%
Nov '19 172 17 151 168 20,809 110 12,165 32,973 37%
Dec '19 173 49 151 200 20,783 80 12,178 32,960 37%
Jan '20 174 48 151 199 20,731 80 12,183 32,913 37%
Feb '20 175 44 151 195 20,632 80 12,263 32,894 37%
Mar '20 176 15 151 166 20,630 110 12,373 33,002 37%
Apr '20 177 14 151 165 20,578 110 12,343 32,920 37%
May '20 178 10 151 161 20,588 120 12,286 32,873 37%
Jun '20 179 1 151 152 20,589 120 12,277 32,865 37%
2020/2021 Jul '20 180 5 151 156 20,594 120 12,320 32,913 37%
Aug '20 181 4 151 155 20,598 120 12,386 32,983 38%
Sep '20 182 6 151 157 20,604 120 12,447 33,050 38%
Oct '20 183 19 151 170 20,618 110 12,509 33,126 38%
Nov '20 184 17 151 168 20,619 110 12,590 33,208 38%
Dec '20 185 49 151 200 20,617 80 12,670 33,286 38%
Jan '21 186 48 151 199 20,655 80 12,750 33,404 38%
Feb '21 187 44 151 195 20,673 80 12,830 33,502 38%
Mar '21 188 15 151 166 20,688 110 12,940 33,627 38%
Apr '21 189 14 151 165 20,702 110 13,050 33,751 39% D
May '21 190 10 151 161 20,712 120 13,170 33,881 39% E
Jun '21 191 1 151 152 20,713 120 13,290 34,002 39% N
2021/2022 Jul '21 192 5 151 156 20,687 120 13,410 34,096 39% N
Aug '21 193 4 151 155 20,691 120 13,395 34,085 39% A
Sep '21 194 6 151 157 20,697 120 13,120 33,816 39% L
Oct '21 195 19 151 170 20,696 110 12,826 33,521 38% P
Nov '21 196 17 151 168 20,683 110 12,775 33,457 38%
Dec '21 197 49 151 200 20,714 80 12,610 33,323 38%
Jan '22 198 48 151 199 20,714 80 12,529 33,242 38%
Feb '22 199 44 151 195 20,737 80 12,442 33,178 37%
Mar '22 200 15 151 166 20,708 110 12,480 33,187 38%
Apr '22 201 14 151 165 20,687 110 12,539 33,225 38%
May '22 202 10 151 161 20,697 120 12,614 33,310 38%
Jun '22 203 1 151 152 20,698 120 12,655 33,352 38%
2022/2023 Jul '22 204 5 151 156 20,703 120 12,734 33,436 38%
Aug '22 205 4 151 155 20,707 120 12,852 33,558 38%
Sep '22 206 6 151 157 20,713 120 12,784 33,496 38%
Oct '22 207 19 151 170 20,721 110 12,791 33,511 38%
Nov '22 208 17 151 168 20,733 110 12,781 33,513 38%
Dec '22 209 49 151 200 20,733 80 12,846 33,578 38%
Jan '23 210 48 151 199 20,763 80 12,898 33,660 38%
Feb '23 211 44 151 195 20,787 80 12,976 33,762 38%
Mar '23 212 15 151 166 20,794 110 13,044 33,837 39%
Apr '23 213 14 151 165 20,808 110 13,099 33,906 39%
May '23 214 10 151 161 20,815 120 13,180 33,994 39%Jun '23 215 1 151 152 20,816 120 13,265 34,080 39%
2023/2024 Jul '23 216 5 151 156 20,821 120 13,370 34,190 39%
Aug '23 217 4 151 155 20,825 120 13,478 34,302 39%
Sep '23 218 6 151 157 20,831 120 13,598 34,428 39%
Oct '23 219 19 151 170 20,850 110 13,323 34,172 39%
Nov '23 220 17 151 168 20,845 110 13,331 34,175 39%
Dec '23 221 49 151 200 20,888 80 13,411 34,298 39%
Jan '24 222 48 151 199 20,918 80 13,491 34,409 39%
Feb '24 223 44 151 195 20,907 80 13,571 34,478 39%
Mar '24 224 15 151 166 20,913 110 13,596 34,509 39%
Apr '24 225 14 151 165 20,925 110 13,618 34,543 39%
May '24 226 10 151 161 20,935 120 13,544 34,479 39%
Jun '24 227 1 151 152 20,936 120 13,474 34,410 39%
Page 2 of 3
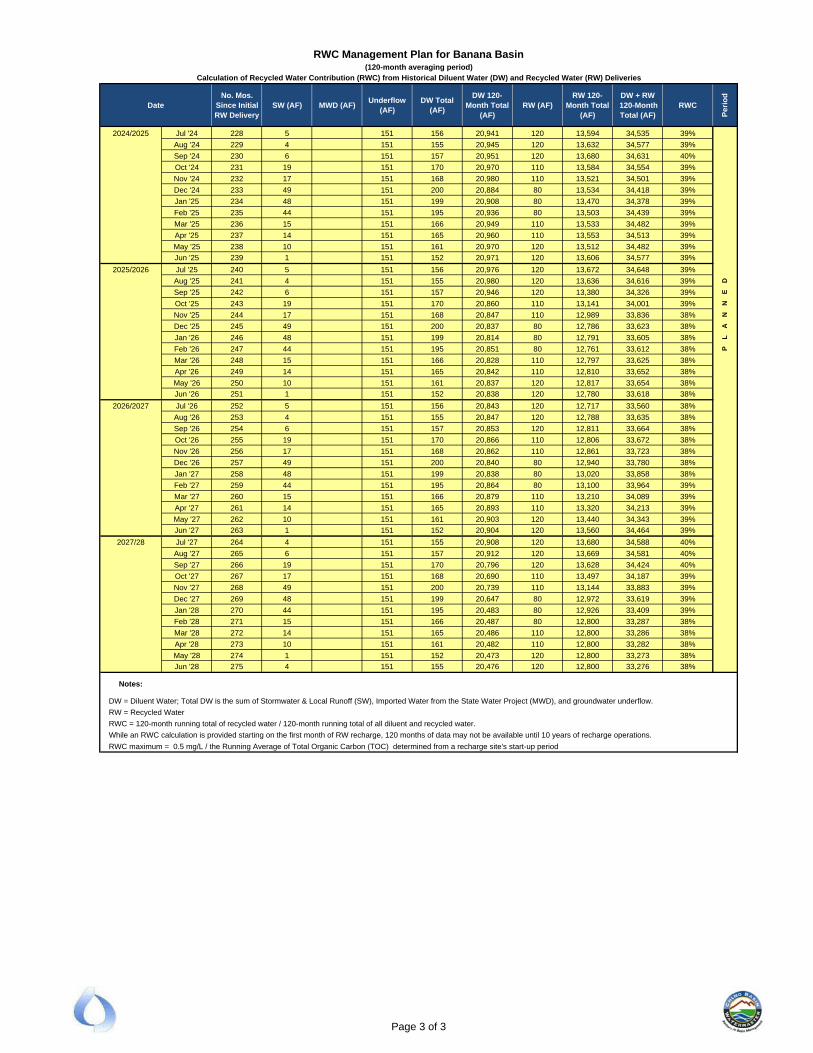
RWC Management Plan for Banana Basin(120-month averaging period)
Calculation of Recycled Water Contribution (RWC) from Historical Diluent Water (DW) and Recycled Water (RW) Deliveries
DateNo. Mos.
Since Initial RW Delivery
SW (AF) MWD (AF)Underflow
(AF)DW Total
(AF)
DW 120-Month Total
(AF)RW (AF)
RW 120-Month Total
(AF)
DW + RW 120-Month Total (AF)
RWC
Pe
rio
d
2024/2025 Jul '24 228 5 151 156 20,941 120 13,594 34,535 39%
Aug '24 229 4 151 155 20,945 120 13,632 34,577 39%
Sep '24 230 6 151 157 20,951 120 13,680 34,631 40%
Oct '24 231 19 151 170 20,970 110 13,584 34,554 39%
Nov '24 232 17 151 168 20,980 110 13,521 34,501 39%
Dec '24 233 49 151 200 20,884 80 13,534 34,418 39%
Jan '25 234 48 151 199 20,908 80 13,470 34,378 39%
Feb '25 235 44 151 195 20,936 80 13,503 34,439 39%
Mar '25 236 15 151 166 20,949 110 13,533 34,482 39%
Apr '25 237 14 151 165 20,960 110 13,553 34,513 39%
May '25 238 10 151 161 20,970 120 13,512 34,482 39%
Jun '25 239 1 151 152 20,971 120 13,606 34,577 39%
2025/2026 Jul '25 240 5 151 156 20,976 120 13,672 34,648 39%
Aug '25 241 4 151 155 20,980 120 13,636 34,616 39% D
Sep '25 242 6 151 157 20,946 120 13,380 34,326 39% E
Oct '25 243 19 151 170 20,860 110 13,141 34,001 39% N
Nov '25 244 17 151 168 20,847 110 12,989 33,836 38% N
Dec '25 245 49 151 200 20,837 80 12,786 33,623 38% A
Jan '26 246 48 151 199 20,814 80 12,791 33,605 38% L
Feb '26 247 44 151 195 20,851 80 12,761 33,612 38% P
Mar '26 248 15 151 166 20,828 110 12,797 33,625 38%
Apr '26 249 14 151 165 20,842 110 12,810 33,652 38%
May '26 250 10 151 161 20,837 120 12,817 33,654 38%
Jun '26 251 1 151 152 20,838 120 12,780 33,618 38%
2026/2027 Jul '26 252 5 151 156 20,843 120 12,717 33,560 38%
Aug '26 253 4 151 155 20,847 120 12,788 33,635 38%
Sep '26 254 6 151 157 20,853 120 12,811 33,664 38%
Oct '26 255 19 151 170 20,866 110 12,806 33,672 38%
Nov '26 256 17 151 168 20,862 110 12,861 33,723 38%
Dec '26 257 49 151 200 20,840 80 12,940 33,780 38%
Jan '27 258 48 151 199 20,838 80 13,020 33,858 38%
Feb '27 259 44 151 195 20,864 80 13,100 33,964 39%
Mar '27 260 15 151 166 20,879 110 13,210 34,089 39%
Apr '27 261 14 151 165 20,893 110 13,320 34,213 39%
May '27 262 10 151 161 20,903 120 13,440 34,343 39%
Jun '27 263 1 151 152 20,904 120 13,560 34,464 39%
2027/28 Jul '27 264 4 151 155 20,908 120 13,680 34,588 40%
Aug '27 265 6 151 157 20,912 120 13,669 34,581 40%
Sep '27 266 19 151 170 20,796 120 13,628 34,424 40%
Oct '27 267 17 151 168 20,690 110 13,497 34,187 39%
Nov '27 268 49 151 200 20,739 110 13,144 33,883 39%
Dec '27 269 48 151 199 20,647 80 12,972 33,619 39%
Jan '28 270 44 151 195 20,483 80 12,926 33,409 39%
Feb '28 271 15 151 166 20,487 80 12,800 33,287 38%
Mar '28 272 14 151 165 20,486 110 12,800 33,286 38%
Apr '28 273 10 151 161 20,482 110 12,800 33,282 38%
May '28 274 1 151 152 20,473 120 12,800 33,273 38%
Jun '28 275 4 151 155 20,476 120 12,800 33,276 38%
Notes:
DW = Diluent Water; Total DW is the sum of Stormwater & Local Runoff (SW), Imported Water from the State Water Project (MWD), and groundwater underflow.
RW = Recycled Water
RWC = 120-month running total of recycled water / 120-month running total of all diluent and recycled water.
While an RWC calculation is provided starting on the first month of RW recharge, 120 months of data may not be available until 10 years of recharge operations.
RWC maximum = 0.5 mg/L / the Running Average of Total Organic Carbon (TOC) determined from a recharge site's start-up period
Page 3 of 3
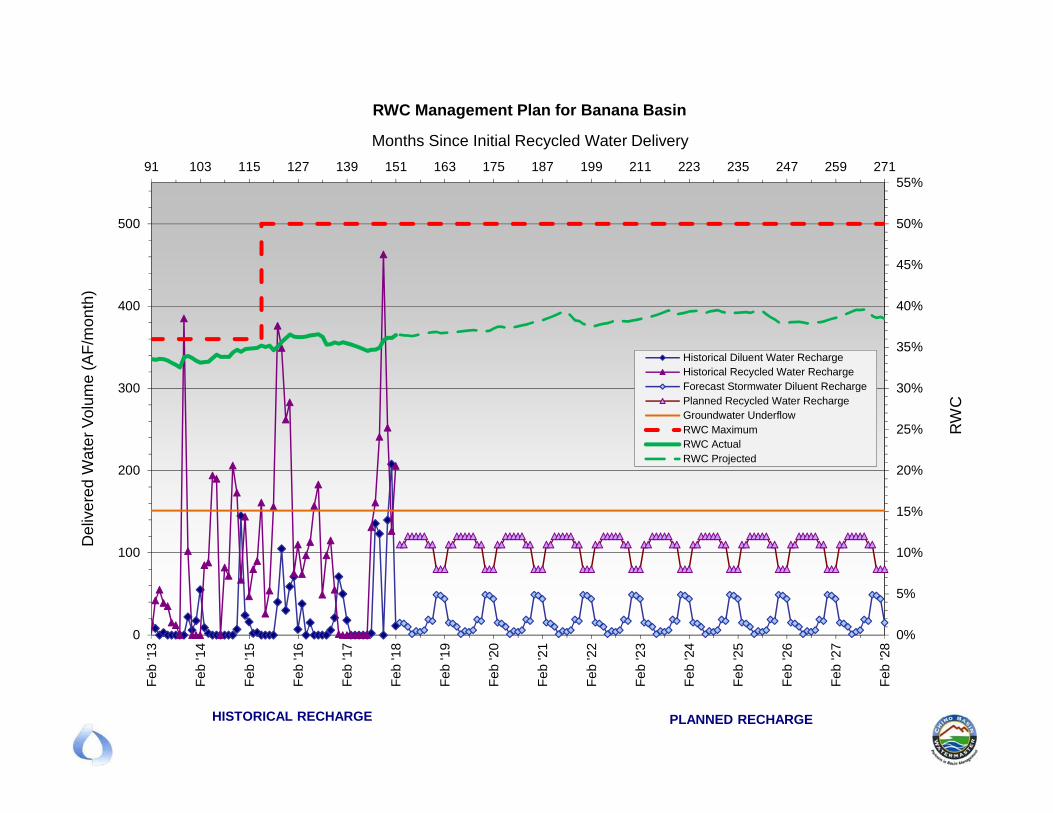
0%
5%
10%
15%
20%
25%
30%
35%
40%
45%
50%
55%91 103 115 127 139 151 163 175 187 199 211 223 235 247 259 271
0
100
200
300
400
500
Feb
'13
Feb
'14
Feb
'15
Feb
'16
Feb
'17
Feb
'18
Feb
'19
Feb
'20
Feb
'21
Feb
'22
Feb
'23
Feb
'24
Feb
'25
Feb
'26
Feb
'27
Feb
'28
RW
C
Months Since Initial Recycled Water Delivery
De
live
red
Wat
er
Vo
lum
e (
AF
/mo
nth
)
RWC Management Plan for Banana Basin
Historical Diluent Water RechargeHistorical Recycled Water RechargeForecast Stormwater Diluent RechargePlanned Recycled Water RechargeGroundwater UnderflowRWC MaximumRWC ActualRWC Projected
HISTORICAL RECHARGE PLANNED RECHARGE

RWC Management Plan for Brooks Street Basins(120-month averaging period)
Calculation of Recycled Water Contribution (RWC) from Historical Diluent Water (DW) and Recycled Water (RW) Deliveries
DateNo. Mos.
Since Initial RW Delivery
SW (AF) MWD (AF)Underflow
(AF)DW Total
(AF)
DW 120-Month Total
(AF)RW (AF)
RW 120-Month Total
(AF)
DW + RW 120-Month Total (AF)
RWC
Pe
rio
d
2012/13 Jul '12 47 1 0 509 510 26,187 33 5,542 31,729 17%
Aug '12 48 2 0 509 511 26,699 39 5,581 32,280 17%
Sep '12 49 2 0 509 511 27,210 51 5,632 32,842 17%
Oct '12 50 0 0 509 509 27,719 0 5,632 33,351 17%
Nov '12 51 0 0 509 509 28,228 0 5,632 33,860 17%
Dec '12 52 0 0 509 509 28,737 0 5,632 34,369 16%
Jan '13 53 35 0 509 544 29,282 342 5,974 35,256 17%
Feb '13 54 26 0 509 535 29,817 299 6,273 36,090 17%
Mar '13 55 32 0 509 541 30,358 238 6,511 36,869 18%
Apr '13 56 0 0 509 509 30,867 231 6,742 37,609 18%
May '13 57 17 0 509 526 31,394 152 6,894 38,288 18%
Jun '13 58 1 0 509 510 31,904 120 7,014 38,918 18%
2013/14 Jul '13 59 1 0 509 510 32,414 169 7,183 39,597 18%
Aug '13 60 1 0 509 510 32,924 197 7,380 40,304 18%
Sep '13 61 28 0 509 537 33,461 182 7,562 41,023 18%
Oct '13 62 23 0 509 532 33,994 108 7,670 41,664 18%
Nov '13 63 4 0 509 513 34,507 94 7,764 42,271 18%
Dec '13 64 8 0 509 517 35,024 104 7,868 42,892 18%
Jan '14 65 3 0 509 512 35,536 109 7,977 43,513 18%
Feb '14 66 47 0 509 556 36,093 102 8,079 44,172 18%
Mar '14 67 12 0 509 521 36,614 130 8,209 44,823 18%
Apr '14 68 14 0 509 523 37,137 65 8,274 45,411 18%
May '14 69 0 0 509 509 37,646 0 8,274 45,920 18%
Jun '14 70 19 0 509 528 38,174 48 8,322 46,496 18%
2014/15 Jul '14 71 7 0 509 516 38,691 72 8,394 47,085 18%
Aug '14 72 1 0 509 510 39,201 141 8,535 47,736 18%
Sep '14 73 1 0 509 510 39,711 157 8,692 48,403 18% L
Oct '14 74 6 0 509 515 40,226 56 8,748 48,974 18% A
Nov '14 75 28 0 509 537 40,764 37 8,785 49,549 18% C
Dec '14 76 95 0 509 604 41,368 0 8,785 50,153 18% I
Jan '15 77 19 0 509 528 41,896 10 8,795 50,691 17% R
Feb '15 78 27 0 509 536 42,432 92 8,887 51,319 17% O
Mar '15 79 13 0 509 522 42,955 69 8,956 51,911 17% T
Apr '15 80 10 0 509 519 43,474 101 9,057 52,531 17% S
May '15 81 21 0 509 530 44,004 120 9,177 53,181 17% I
Jun '15 82 0 0 509 509 44,513 156 9,333 53,846 17% H
2015/16 Jul '15 83 0 0 509 509 44,990 63 9,396 54,386 17%
Aug '15 84 0 0 509 509 45,324 0 9,396 54,720 17%
Sep '15 85 1 0 509 510 45,148 0 9,396 54,544 17%
Oct '15 86 0 0 509 509 45,530 0 9,396 54,926 17%
Nov '15 87 1 0 509 510 45,650 0 9,396 55,046 17%
Dec '15 88 0 0 509 509 45,796 101 9,497 55,293 17%
Jan '16 89 54 0 509 563 46,103 254 9,751 55,854 17%
Feb '16 90 91 0 509 600 46,310 116 9,867 56,177 18%
Mar '16 91 91 0 509 600 46,696 211 10,078 56,774 18%
Apr '16 92 13 0 509 522 46,956 192 10,270 57,226 18%
May '16 93 1 0 509 510 47,166 278 10,548 57,714 18%
Jun '16 94 0 0 509 509 47,304 0 10,548 57,852 18%
2016/17 Jul '16 95 0 0 509 509 47,607 0 10,548 58,155 18%
Aug '16 96 0 0 509 509 47,965 0 10,548 58,513 18%
Sep '16 97 31 0 509 540 48,163 145 10,693 58,856 18%
Oct '16 98 17 170 509 696 48,552 19 10,712 59,264 18%
Nov '16 99 39 0 509 548 48,813 116 10,828 59,641 18%
Dec '16 100 196 0 509 705 49,256 13 10,841 60,097 18%
Jan '17 101 254 0 509 763 49,907 0 10,841 60,748 18%
Feb '17 102 142 0 509 651 50,429 0 10,841 61,270 18%
Mar '17 103 1 0 509 510 50,936 16 10,857 61,793 18%
Apr '17 104 0 16 509 525 51,359 8 10,865 62,224 17%
May '17 105 1 0 509 510 51,865 38 10,903 62,768 17%
Jun '17 106 0 2 509 511 52,374 30 10,933 63,307 17%
2017/18 Jul '17 107 0 94 509 603 52,977 228 11,161 64,138 17%
Aug '17 108 0 96 509 605 53,582 55 11,216 64,798 17%
Sep '17 109 1 3 509 513 54,070 169 11,385 65,455 17%
Oct '17 110 1 0 509 510 54,546 99 11,484 66,030 17%
Nov '17 111 3 0 509 512 55,034 151 11,636 66,670 17%
Dec '17 112 1 0 509 510 55,502 122 11,758 67,260 17%
Jan '18 113 28 5 509 542 55,762 94 11,852 67,614 18%
Feb '18 114 9 0 509 518 56,230 106 11,958 68,188 18%
Mar '18 115 0 509 509 56,731 150 12,108 68,839 18%
Apr '18 116 0 509 509 57,236 150 12,258 69,494 18%
May '18 117 0 509 509 57,702 150 12,408 70,110 18%
Jun '18 118 0 509 509 58,208 150 12,558 70,766 18%
Page 1 of 3
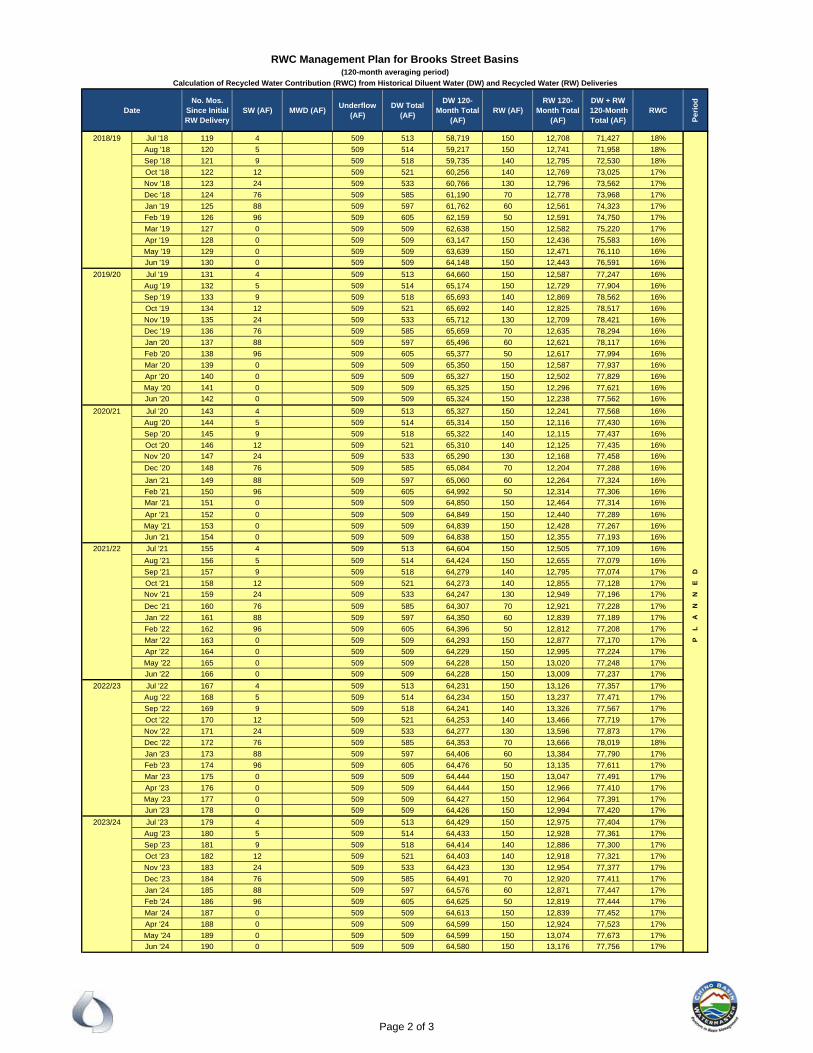
RWC Management Plan for Brooks Street Basins(120-month averaging period)
Calculation of Recycled Water Contribution (RWC) from Historical Diluent Water (DW) and Recycled Water (RW) Deliveries
DateNo. Mos.
Since Initial RW Delivery
SW (AF) MWD (AF)Underflow
(AF)DW Total
(AF)
DW 120-Month Total
(AF)RW (AF)
RW 120-Month Total
(AF)
DW + RW 120-Month Total (AF)
RWC
Pe
rio
d
2018/19 Jul '18 119 4 509 513 58,719 150 12,708 71,427 18%
Aug '18 120 5 509 514 59,217 150 12,741 71,958 18%
Sep '18 121 9 509 518 59,735 140 12,795 72,530 18%
Oct '18 122 12 509 521 60,256 140 12,769 73,025 17%
Nov '18 123 24 509 533 60,766 130 12,796 73,562 17%
Dec '18 124 76 509 585 61,190 70 12,778 73,968 17%
Jan '19 125 88 509 597 61,762 60 12,561 74,323 17%
Feb '19 126 96 509 605 62,159 50 12,591 74,750 17%
Mar '19 127 0 509 509 62,638 150 12,582 75,220 17%
Apr '19 128 0 509 509 63,147 150 12,436 75,583 16%
May '19 129 0 509 509 63,639 150 12,471 76,110 16%
Jun '19 130 0 509 509 64,148 150 12,443 76,591 16%
2019/20 Jul '19 131 4 509 513 64,660 150 12,587 77,247 16%
Aug '19 132 5 509 514 65,174 150 12,729 77,904 16%
Sep '19 133 9 509 518 65,693 140 12,869 78,562 16%
Oct '19 134 12 509 521 65,692 140 12,825 78,517 16%
Nov '19 135 24 509 533 65,712 130 12,709 78,421 16%
Dec '19 136 76 509 585 65,659 70 12,635 78,294 16%
Jan '20 137 88 509 597 65,496 60 12,621 78,117 16%
Feb '20 138 96 509 605 65,377 50 12,617 77,994 16%
Mar '20 139 0 509 509 65,350 150 12,587 77,937 16%
Apr '20 140 0 509 509 65,327 150 12,502 77,829 16%
May '20 141 0 509 509 65,325 150 12,296 77,621 16%
Jun '20 142 0 509 509 65,324 150 12,238 77,562 16%
2020/21 Jul '20 143 4 509 513 65,327 150 12,241 77,568 16%
Aug '20 144 5 509 514 65,314 150 12,116 77,430 16%
Sep '20 145 9 509 518 65,322 140 12,115 77,437 16%
Oct '20 146 12 509 521 65,310 140 12,125 77,435 16%
Nov '20 147 24 509 533 65,290 130 12,168 77,458 16%
Dec '20 148 76 509 585 65,084 70 12,204 77,288 16%
Jan '21 149 88 509 597 65,060 60 12,264 77,324 16%
Feb '21 150 96 509 605 64,992 50 12,314 77,306 16%
Mar '21 151 0 509 509 64,850 150 12,464 77,314 16%
Apr '21 152 0 509 509 64,849 150 12,440 77,289 16%
May '21 153 0 509 509 64,839 150 12,428 77,267 16%
Jun '21 154 0 509 509 64,838 150 12,355 77,193 16%
2021/22 Jul '21 155 4 509 513 64,604 150 12,505 77,109 16%
Aug '21 156 5 509 514 64,424 150 12,655 77,079 16%
Sep '21 157 9 509 518 64,279 140 12,795 77,074 17% D
Oct '21 158 12 509 521 64,273 140 12,855 77,128 17% E
Nov '21 159 24 509 533 64,247 130 12,949 77,196 17% N
Dec '21 160 76 509 585 64,307 70 12,921 77,228 17% N
Jan '22 161 88 509 597 64,350 60 12,839 77,189 17% A
Feb '22 162 96 509 605 64,396 50 12,812 77,208 17% L
Mar '22 163 0 509 509 64,293 150 12,877 77,170 17% P
Apr '22 164 0 509 509 64,229 150 12,995 77,224 17%
May '22 165 0 509 509 64,228 150 13,020 77,248 17%
Jun '22 166 0 509 509 64,228 150 13,009 77,237 17%
2022/23 Jul '22 167 4 509 513 64,231 150 13,126 77,357 17%
Aug '22 168 5 509 514 64,234 150 13,237 77,471 17%
Sep '22 169 9 509 518 64,241 140 13,326 77,567 17%
Oct '22 170 12 509 521 64,253 140 13,466 77,719 17%
Nov '22 171 24 509 533 64,277 130 13,596 77,873 17%
Dec '22 172 76 509 585 64,353 70 13,666 78,019 18%
Jan '23 173 88 509 597 64,406 60 13,384 77,790 17%
Feb '23 174 96 509 605 64,476 50 13,135 77,611 17%
Mar '23 175 0 509 509 64,444 150 13,047 77,491 17%
Apr '23 176 0 509 509 64,444 150 12,966 77,410 17%
May '23 177 0 509 509 64,427 150 12,964 77,391 17%
Jun '23 178 0 509 509 64,426 150 12,994 77,420 17%
2023/24 Jul '23 179 4 509 513 64,429 150 12,975 77,404 17%
Aug '23 180 5 509 514 64,433 150 12,928 77,361 17%
Sep '23 181 9 509 518 64,414 140 12,886 77,300 17%
Oct '23 182 12 509 521 64,403 140 12,918 77,321 17%
Nov '23 183 24 509 533 64,423 130 12,954 77,377 17%
Dec '23 184 76 509 585 64,491 70 12,920 77,411 17%
Jan '24 185 88 509 597 64,576 60 12,871 77,447 17%
Feb '24 186 96 509 605 64,625 50 12,819 77,444 17%
Mar '24 187 0 509 509 64,613 150 12,839 77,452 17%
Apr '24 188 0 509 509 64,599 150 12,924 77,523 17%
May '24 189 0 509 509 64,599 150 13,074 77,673 17%
Jun '24 190 0 509 509 64,580 150 13,176 77,756 17%
Page 2 of 3
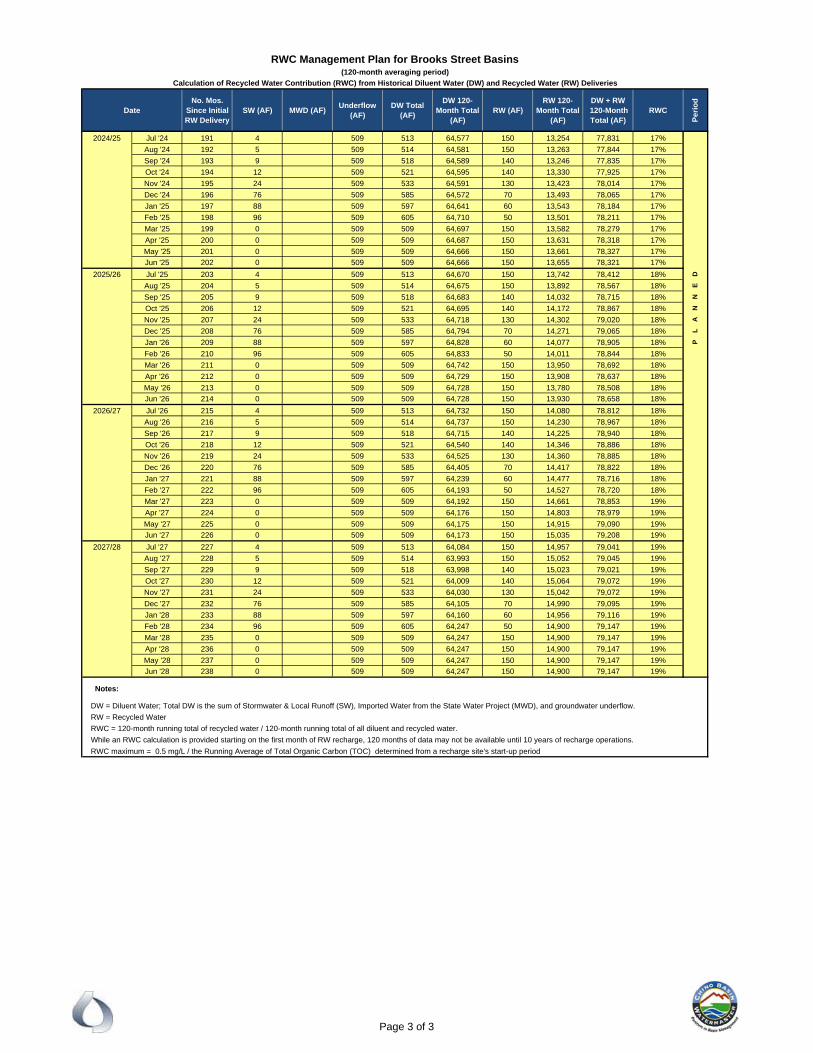
RWC Management Plan for Brooks Street Basins(120-month averaging period)
Calculation of Recycled Water Contribution (RWC) from Historical Diluent Water (DW) and Recycled Water (RW) Deliveries
DateNo. Mos.
Since Initial RW Delivery
SW (AF) MWD (AF)Underflow
(AF)DW Total
(AF)
DW 120-Month Total
(AF)RW (AF)
RW 120-Month Total
(AF)
DW + RW 120-Month Total (AF)
RWC
Pe
rio
d
2024/25 Jul '24 191 4 509 513 64,577 150 13,254 77,831 17%
Aug '24 192 5 509 514 64,581 150 13,263 77,844 17%
Sep '24 193 9 509 518 64,589 140 13,246 77,835 17%
Oct '24 194 12 509 521 64,595 140 13,330 77,925 17%
Nov '24 195 24 509 533 64,591 130 13,423 78,014 17%
Dec '24 196 76 509 585 64,572 70 13,493 78,065 17%
Jan '25 197 88 509 597 64,641 60 13,543 78,184 17%
Feb '25 198 96 509 605 64,710 50 13,501 78,211 17%
Mar '25 199 0 509 509 64,697 150 13,582 78,279 17%
Apr '25 200 0 509 509 64,687 150 13,631 78,318 17%
May '25 201 0 509 509 64,666 150 13,661 78,327 17%
Jun '25 202 0 509 509 64,666 150 13,655 78,321 17%
2025/26 Jul '25 203 4 509 513 64,670 150 13,742 78,412 18% D
Aug '25 204 5 509 514 64,675 150 13,892 78,567 18% E
Sep '25 205 9 509 518 64,683 140 14,032 78,715 18% N
Oct '25 206 12 509 521 64,695 140 14,172 78,867 18% N
Nov '25 207 24 509 533 64,718 130 14,302 79,020 18% A
Dec '25 208 76 509 585 64,794 70 14,271 79,065 18% L
Jan '26 209 88 509 597 64,828 60 14,077 78,905 18% P
Feb '26 210 96 509 605 64,833 50 14,011 78,844 18%
Mar '26 211 0 509 509 64,742 150 13,950 78,692 18%
Apr '26 212 0 509 509 64,729 150 13,908 78,637 18%
May '26 213 0 509 509 64,728 150 13,780 78,508 18%
Jun '26 214 0 509 509 64,728 150 13,930 78,658 18%
2026/27 Jul '26 215 4 509 513 64,732 150 14,080 78,812 18%
Aug '26 216 5 509 514 64,737 150 14,230 78,967 18%
Sep '26 217 9 509 518 64,715 140 14,225 78,940 18%
Oct '26 218 12 509 521 64,540 140 14,346 78,886 18%
Nov '26 219 24 509 533 64,525 130 14,360 78,885 18%
Dec '26 220 76 509 585 64,405 70 14,417 78,822 18%
Jan '27 221 88 509 597 64,239 60 14,477 78,716 18%
Feb '27 222 96 509 605 64,193 50 14,527 78,720 18%
Mar '27 223 0 509 509 64,192 150 14,661 78,853 19%
Apr '27 224 0 509 509 64,176 150 14,803 78,979 19%
May '27 225 0 509 509 64,175 150 14,915 79,090 19%
Jun '27 226 0 509 509 64,173 150 15,035 79,208 19%
2027/28 Jul '27 227 4 509 513 64,084 150 14,957 79,041 19%
Aug '27 228 5 509 514 63,993 150 15,052 79,045 19%
Sep '27 229 9 509 518 63,998 140 15,023 79,021 19%
Oct '27 230 12 509 521 64,009 140 15,064 79,072 19%
Nov '27 231 24 509 533 64,030 130 15,042 79,072 19%
Dec '27 232 76 509 585 64,105 70 14,990 79,095 19%
Jan '28 233 88 509 597 64,160 60 14,956 79,116 19%
Feb '28 234 96 509 605 64,247 50 14,900 79,147 19%
Mar '28 235 0 509 509 64,247 150 14,900 79,147 19%
Apr '28 236 0 509 509 64,247 150 14,900 79,147 19%
May '28 237 0 509 509 64,247 150 14,900 79,147 19%
Jun '28 238 0 509 509 64,247 150 14,900 79,147 19%
Notes:
DW = Diluent Water; Total DW is the sum of Stormwater & Local Runoff (SW), Imported Water from the State Water Project (MWD), and groundwater underflow.
RW = Recycled Water
RWC = 120-month running total of recycled water / 120-month running total of all diluent and recycled water.
While an RWC calculation is provided starting on the first month of RW recharge, 120 months of data may not be available until 10 years of recharge operations.
RWC maximum = 0.5 mg/L / the Running Average of Total Organic Carbon (TOC) determined from a recharge site's start-up period
Page 3 of 3
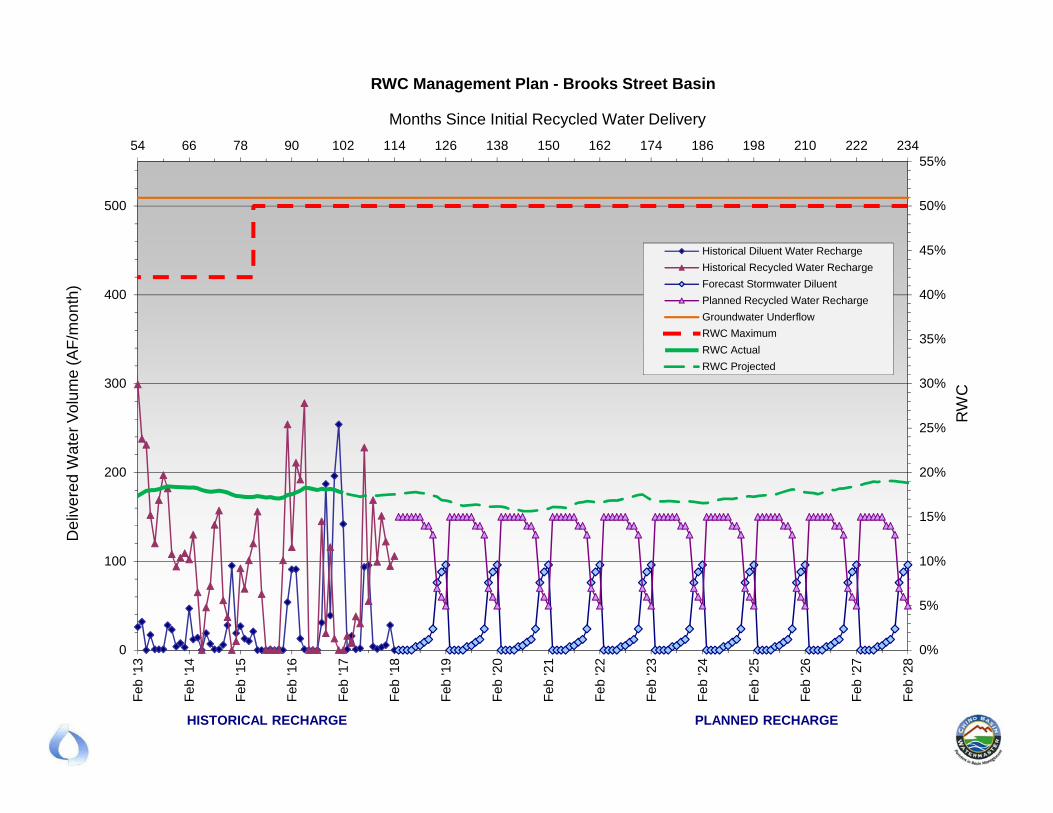
0%
5%
10%
15%
20%
25%
30%
35%
40%
45%
50%
55%54 66 78 90 102 114 126 138 150 162 174 186 198 210 222 234
0
100
200
300
400
500
Feb
'13
Feb
'14
Feb
'15
Feb
'16
Feb
'17
Feb
'18
Feb
'19
Feb
'20
Feb
'21
Feb
'22
Feb
'23
Feb
'24
Feb
'25
Feb
'26
Feb
'27
Feb
'28
RW
C
Months Since Initial Recycled Water Delivery
De
live
red
Wat
er
Vo
lum
e (
AF
/mo
nth
)
RWC Management Plan - Brooks Street Basin
Historical Diluent Water Recharge
Historical Recycled Water Recharge
Forecast Stormwater Diluent
Planned Recycled Water Recharge
Groundwater Underflow
RWC Maximum
RWC Actual
RWC Projected
HISTORICAL RECHARGE PLANNED RECHARGE
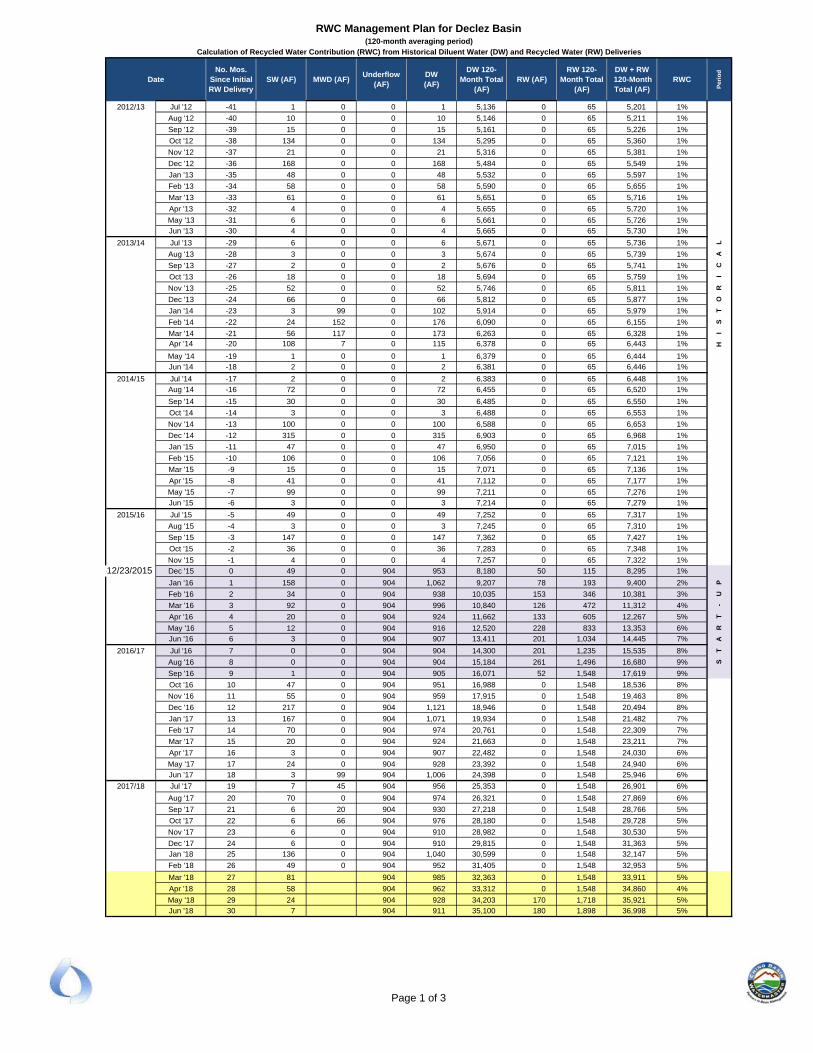
DateNo. Mos.
Since Initial RW Delivery
SW (AF) MWD (AF)Underflow
(AF)DW(AF)
DW 120-Month Total
(AF)RW (AF)
RW 120-Month Total
(AF)
DW + RW 120-Month Total (AF)
RWC
Per
iod
2012/13 Jul '12 -41 1 0 0 1 5,136 0 65 5,201 1%
Aug '12 -40 10 0 0 10 5,146 0 65 5,211 1%
Sep '12 -39 15 0 0 15 5,161 0 65 5,226 1%
Oct '12 -38 134 0 0 134 5,295 0 65 5,360 1%
Nov '12 -37 21 0 0 21 5,316 0 65 5,381 1%
Dec '12 -36 168 0 0 168 5,484 0 65 5,549 1%
Jan '13 -35 48 0 0 48 5,532 0 65 5,597 1%
Feb '13 -34 58 0 0 58 5,590 0 65 5,655 1%
Mar '13 -33 61 0 0 61 5,651 0 65 5,716 1%
Apr '13 -32 4 0 0 4 5,655 0 65 5,720 1%
May '13 -31 6 0 0 6 5,661 0 65 5,726 1%
Jun '13 -30 4 0 0 4 5,665 0 65 5,730 1%
2013/14 Jul '13 -29 6 0 0 6 5,671 0 65 5,736 1% L
Aug '13 -28 3 0 0 3 5,674 0 65 5,739 1% A
Sep '13 -27 2 0 0 2 5,676 0 65 5,741 1% C
Oct '13 -26 18 0 0 18 5,694 0 65 5,759 1% I
Nov '13 -25 52 0 0 52 5,746 0 65 5,811 1% R
Dec '13 -24 66 0 0 66 5,812 0 65 5,877 1% O
Jan '14 -23 3 99 0 102 5,914 0 65 5,979 1% T
Feb '14 -22 24 152 0 176 6,090 0 65 6,155 1% S
Mar '14 -21 56 117 0 173 6,263 0 65 6,328 1% I
Apr '14 -20 108 7 0 115 6,378 0 65 6,443 1% H
May '14 -19 1 0 0 1 6,379 0 65 6,444 1%
Jun '14 -18 2 0 0 2 6,381 0 65 6,446 1%
2014/15 Jul '14 -17 2 0 0 2 6,383 0 65 6,448 1%
Aug '14 -16 72 0 0 72 6,455 0 65 6,520 1%
Sep '14 -15 30 0 0 30 6,485 0 65 6,550 1%
Oct '14 -14 3 0 0 3 6,488 0 65 6,553 1%
Nov '14 -13 100 0 0 100 6,588 0 65 6,653 1%
Dec '14 -12 315 0 0 315 6,903 0 65 6,968 1%
Jan '15 -11 47 0 0 47 6,950 0 65 7,015 1%
Feb '15 -10 106 0 0 106 7,056 0 65 7,121 1%
Mar '15 -9 15 0 0 15 7,071 0 65 7,136 1%
Apr '15 -8 41 0 0 41 7,112 0 65 7,177 1%
May '15 -7 99 0 0 99 7,211 0 65 7,276 1%
Jun '15 -6 3 0 0 3 7,214 0 65 7,279 1%
2015/16 Jul '15 -5 49 0 0 49 7,252 0 65 7,317 1%
Aug '15 -4 3 0 0 3 7,245 0 65 7,310 1%
Sep '15 -3 147 0 0 147 7,362 0 65 7,427 1%
Oct '15 -2 36 0 0 36 7,283 0 65 7,348 1%
Nov '15 -1 4 0 0 4 7,257 0 65 7,322 1%
-12/23/2015 Dec '15 0 49 0 904 953 8,180 50 115 8,295 1%
Jan '16 1 158 0 904 1,062 9,207 78 193 9,400 2% P
Feb '16 2 34 0 904 938 10,035 153 346 10,381 3% U
Mar '16 3 92 0 904 996 10,840 126 472 11,312 4% -
Apr '16 4 20 0 904 924 11,662 133 605 12,267 5% T
May '16 5 12 0 904 916 12,520 228 833 13,353 6% R
Jun '16 6 3 0 904 907 13,411 201 1,034 14,445 7% A
2016/17 Jul '16 7 0 0 904 904 14,300 201 1,235 15,535 8% T
Aug '16 8 0 0 904 904 15,184 261 1,496 16,680 9% S
Sep '16 9 1 0 904 905 16,071 52 1,548 17,619 9%
Oct '16 10 47 0 904 951 16,988 0 1,548 18,536 8%
Nov '16 11 55 0 904 959 17,915 0 1,548 19,463 8%
Dec '16 12 217 0 904 1,121 18,946 0 1,548 20,494 8%
Jan '17 13 167 0 904 1,071 19,934 0 1,548 21,482 7%
Feb '17 14 70 0 904 974 20,761 0 1,548 22,309 7%
Mar '17 15 20 0 904 924 21,663 0 1,548 23,211 7%
Apr '17 16 3 0 904 907 22,482 0 1,548 24,030 6%
May '17 17 24 0 904 928 23,392 0 1,548 24,940 6%
Jun '17 18 3 99 904 1,006 24,398 0 1,548 25,946 6%
2017/18 Jul '17 19 7 45 904 956 25,353 0 1,548 26,901 6%
Aug '17 20 70 0 904 974 26,321 0 1,548 27,869 6%
Sep '17 21 6 20 904 930 27,218 0 1,548 28,766 5%
Oct '17 22 6 66 904 976 28,180 0 1,548 29,728 5%
Nov '17 23 6 0 904 910 28,982 0 1,548 30,530 5%
Dec '17 24 6 0 904 910 29,815 0 1,548 31,363 5%
Jan '18 25 136 0 904 1,040 30,599 0 1,548 32,147 5%
Feb '18 26 49 0 904 952 31,405 0 1,548 32,953 5%
Mar '18 27 81 904 985 32,363 0 1,548 33,911 5%
Apr '18 28 58 904 962 33,312 0 1,548 34,860 4%
May '18 29 24 904 928 34,203 170 1,718 35,921 5%
Jun '18 30 7 904 911 35,100 180 1,898 36,998 5%
Calculation of Recycled Water Contribution (RWC) from Historical Diluent Water (DW) and Recycled Water (RW) Deliveries
(120-month averaging period)
RWC Management Plan for Declez Basin
Page 1 of 3
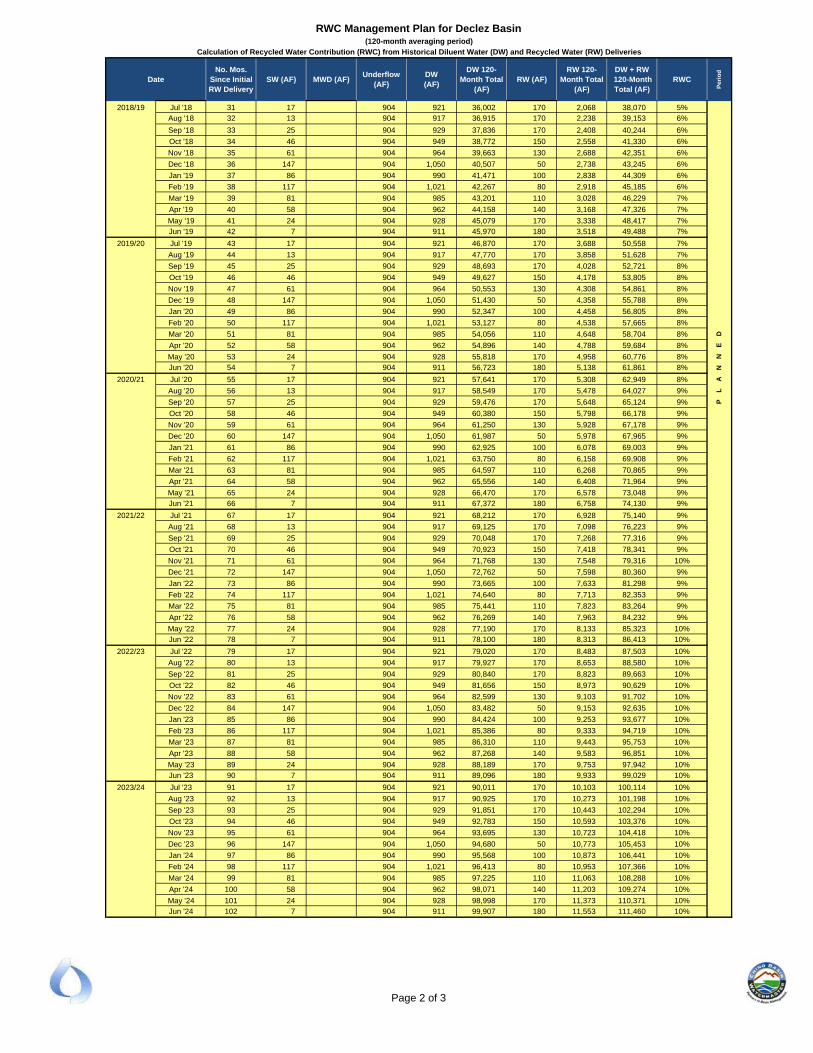
DateNo. Mos.
Since Initial RW Delivery
SW (AF) MWD (AF)Underflow
(AF)DW(AF)
DW 120-Month Total
(AF)RW (AF)
RW 120-Month Total
(AF)
DW + RW 120-Month Total (AF)
RWC
Per
iod
Calculation of Recycled Water Contribution (RWC) from Historical Diluent Water (DW) and Recycled Water (RW) Deliveries
(120-month averaging period)
RWC Management Plan for Declez Basin
2018/19 Jul '18 31 17 904 921 36,002 170 2,068 38,070 5%
Aug '18 32 13 904 917 36,915 170 2,238 39,153 6%
Sep '18 33 25 904 929 37,836 170 2,408 40,244 6%
Oct '18 34 46 904 949 38,772 150 2,558 41,330 6%
Nov '18 35 61 904 964 39,663 130 2,688 42,351 6%
Dec '18 36 147 904 1,050 40,507 50 2,738 43,245 6%
Jan '19 37 86 904 990 41,471 100 2,838 44,309 6%
Feb '19 38 117 904 1,021 42,267 80 2,918 45,185 6%
Mar '19 39 81 904 985 43,201 110 3,028 46,229 7%
Apr '19 40 58 904 962 44,158 140 3,168 47,326 7%
May '19 41 24 904 928 45,079 170 3,338 48,417 7%
Jun '19 42 7 904 911 45,970 180 3,518 49,488 7%
2019/20 Jul '19 43 17 904 921 46,870 170 3,688 50,558 7%
Aug '19 44 13 904 917 47,770 170 3,858 51,628 7%
Sep '19 45 25 904 929 48,693 170 4,028 52,721 8%
Oct '19 46 46 904 949 49,627 150 4,178 53,805 8%
Nov '19 47 61 904 964 50,553 130 4,308 54,861 8%
Dec '19 48 147 904 1,050 51,430 50 4,358 55,788 8%
Jan '20 49 86 904 990 52,347 100 4,458 56,805 8%
Feb '20 50 117 904 1,021 53,127 80 4,538 57,665 8%
Mar '20 51 81 904 985 54,056 110 4,648 58,704 8% D
Apr '20 52 58 904 962 54,896 140 4,788 59,684 8% E
May '20 53 24 904 928 55,818 170 4,958 60,776 8% N
Jun '20 54 7 904 911 56,723 180 5,138 61,861 8% N
2020/21 Jul '20 55 17 904 921 57,641 170 5,308 62,949 8% A
Aug '20 56 13 904 917 58,549 170 5,478 64,027 9% L
Sep '20 57 25 904 929 59,476 170 5,648 65,124 9% P
Oct '20 58 46 904 949 60,380 150 5,798 66,178 9%
Nov '20 59 61 904 964 61,250 130 5,928 67,178 9%
Dec '20 60 147 904 1,050 61,987 50 5,978 67,965 9%
Jan '21 61 86 904 990 62,925 100 6,078 69,003 9%
Feb '21 62 117 904 1,021 63,750 80 6,158 69,908 9%
Mar '21 63 81 904 985 64,597 110 6,268 70,865 9%
Apr '21 64 58 904 962 65,556 140 6,408 71,964 9%
May '21 65 24 904 928 66,470 170 6,578 73,048 9%
Jun '21 66 7 904 911 67,372 180 6,758 74,130 9%
2021/22 Jul '21 67 17 904 921 68,212 170 6,928 75,140 9%
Aug '21 68 13 904 917 69,125 170 7,098 76,223 9%
Sep '21 69 25 904 929 70,048 170 7,268 77,316 9%
Oct '21 70 46 904 949 70,923 150 7,418 78,341 9%
Nov '21 71 61 904 964 71,768 130 7,548 79,316 10%
Dec '21 72 147 904 1,050 72,762 50 7,598 80,360 9%
Jan '22 73 86 904 990 73,665 100 7,633 81,298 9%
Feb '22 74 117 904 1,021 74,640 80 7,713 82,353 9%
Mar '22 75 81 904 985 75,441 110 7,823 83,264 9%
Apr '22 76 58 904 962 76,269 140 7,963 84,232 9%
May '22 77 24 904 928 77,190 170 8,133 85,323 10%
Jun '22 78 7 904 911 78,100 180 8,313 86,413 10%
2022/23 Jul '22 79 17 904 921 79,020 170 8,483 87,503 10%
Aug '22 80 13 904 917 79,927 170 8,653 88,580 10%
Sep '22 81 25 904 929 80,840 170 8,823 89,663 10%
Oct '22 82 46 904 949 81,656 150 8,973 90,629 10%
Nov '22 83 61 904 964 82,599 130 9,103 91,702 10%
Dec '22 84 147 904 1,050 83,482 50 9,153 92,635 10%
Jan '23 85 86 904 990 84,424 100 9,253 93,677 10%
Feb '23 86 117 904 1,021 85,386 80 9,333 94,719 10%
Mar '23 87 81 904 985 86,310 110 9,443 95,753 10%
Apr '23 88 58 904 962 87,268 140 9,583 96,851 10%
May '23 89 24 904 928 88,189 170 9,753 97,942 10%
Jun '23 90 7 904 911 89,096 180 9,933 99,029 10%
2023/24 Jul '23 91 17 904 921 90,011 170 10,103 100,114 10%
Aug '23 92 13 904 917 90,925 170 10,273 101,198 10%
Sep '23 93 25 904 929 91,851 170 10,443 102,294 10%
Oct '23 94 46 904 949 92,783 150 10,593 103,376 10%
Nov '23 95 61 904 964 93,695 130 10,723 104,418 10%
Dec '23 96 147 904 1,050 94,680 50 10,773 105,453 10%
Jan '24 97 86 904 990 95,568 100 10,873 106,441 10%
Feb '24 98 117 904 1,021 96,413 80 10,953 107,366 10%
Mar '24 99 81 904 985 97,225 110 11,063 108,288 10%
Apr '24 100 58 904 962 98,071 140 11,203 109,274 10%
May '24 101 24 904 928 98,998 170 11,373 110,371 10%
Jun '24 102 7 904 911 99,907 180 11,553 111,460 10%
Page 2 of 3
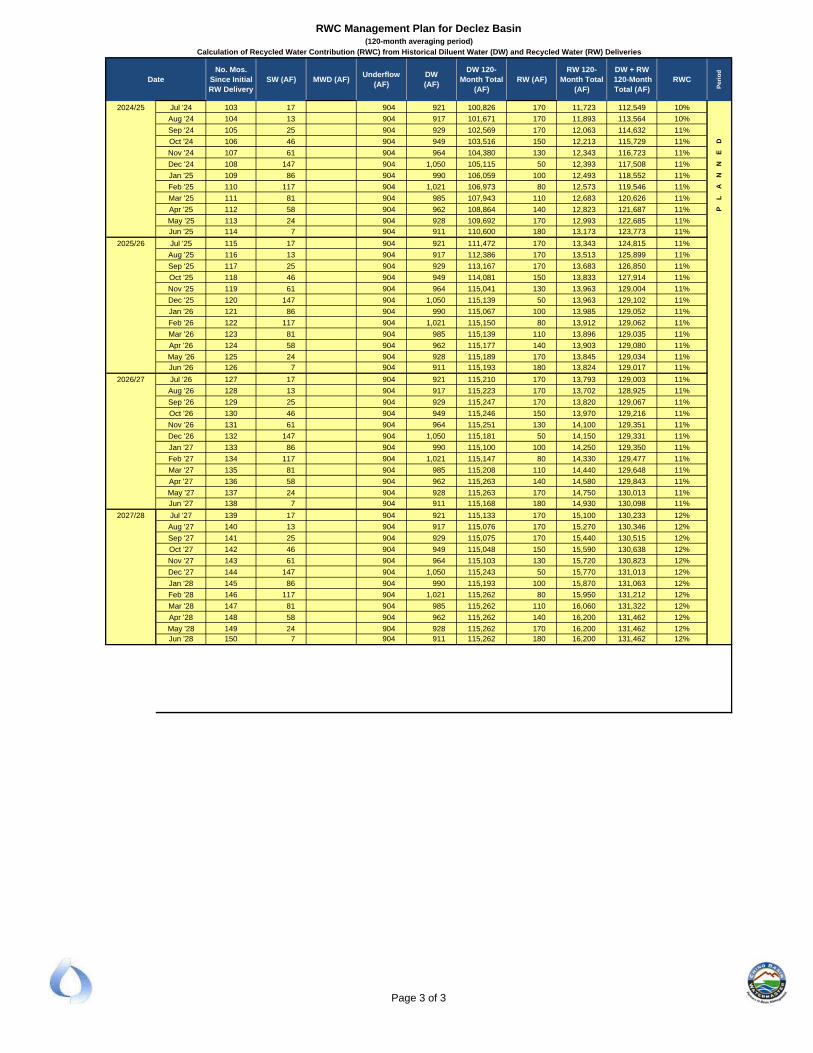
DateNo. Mos.
Since Initial RW Delivery
SW (AF) MWD (AF)Underflow
(AF)DW(AF)
DW 120-Month Total
(AF)RW (AF)
RW 120-Month Total
(AF)
DW + RW 120-Month Total (AF)
RWC
Per
iod
Calculation of Recycled Water Contribution (RWC) from Historical Diluent Water (DW) and Recycled Water (RW) Deliveries
(120-month averaging period)
RWC Management Plan for Declez Basin
2024/25 Jul '24 103 17 904 921 100,826 170 11,723 112,549 10%
Aug '24 104 13 904 917 101,671 170 11,893 113,564 10%
Sep '24 105 25 904 929 102,569 170 12,063 114,632 11%
Oct '24 106 46 904 949 103,516 150 12,213 115,729 11% D
Nov '24 107 61 904 964 104,380 130 12,343 116,723 11% E
Dec '24 108 147 904 1,050 105,115 50 12,393 117,508 11% N
Jan '25 109 86 904 990 106,059 100 12,493 118,552 11% N
Feb '25 110 117 904 1,021 106,973 80 12,573 119,546 11% A
Mar '25 111 81 904 985 107,943 110 12,683 120,626 11% L
Apr '25 112 58 904 962 108,864 140 12,823 121,687 11% P
May '25 113 24 904 928 109,692 170 12,993 122,685 11%
Jun '25 114 7 904 911 110,600 180 13,173 123,773 11%
2025/26 Jul '25 115 17 904 921 111,472 170 13,343 124,815 11%
Aug '25 116 13 904 917 112,386 170 13,513 125,899 11%
Sep '25 117 25 904 929 113,167 170 13,683 126,850 11%
Oct '25 118 46 904 949 114,081 150 13,833 127,914 11%
Nov '25 119 61 904 964 115,041 130 13,963 129,004 11%
Dec '25 120 147 904 1,050 115,139 50 13,963 129,102 11%
Jan '26 121 86 904 990 115,067 100 13,985 129,052 11%
Feb '26 122 117 904 1,021 115,150 80 13,912 129,062 11%
Mar '26 123 81 904 985 115,139 110 13,896 129,035 11%
Apr '26 124 58 904 962 115,177 140 13,903 129,080 11%
May '26 125 24 904 928 115,189 170 13,845 129,034 11%
Jun '26 126 7 904 911 115,193 180 13,824 129,017 11%
2026/27 Jul '26 127 17 904 921 115,210 170 13,793 129,003 11%
Aug '26 128 13 904 917 115,223 170 13,702 128,925 11%
Sep '26 129 25 904 929 115,247 170 13,820 129,067 11%
Oct '26 130 46 904 949 115,246 150 13,970 129,216 11%
Nov '26 131 61 904 964 115,251 130 14,100 129,351 11%
Dec '26 132 147 904 1,050 115,181 50 14,150 129,331 11%
Jan '27 133 86 904 990 115,100 100 14,250 129,350 11%
Feb '27 134 117 904 1,021 115,147 80 14,330 129,477 11%
Mar '27 135 81 904 985 115,208 110 14,440 129,648 11%
Apr '27 136 58 904 962 115,263 140 14,580 129,843 11%
May '27 137 24 904 928 115,263 170 14,750 130,013 11%
Jun '27 138 7 904 911 115,168 180 14,930 130,098 11%
2027/28 Jul '27 139 17 904 921 115,133 170 15,100 130,233 12%
Aug '27 140 13 904 917 115,076 170 15,270 130,346 12%
Sep '27 141 25 904 929 115,075 170 15,440 130,515 12%
Oct '27 142 46 904 949 115,048 150 15,590 130,638 12%
Nov '27 143 61 904 964 115,103 130 15,720 130,823 12%
Dec '27 144 147 904 1,050 115,243 50 15,770 131,013 12%
Jan '28 145 86 904 990 115,193 100 15,870 131,063 12%
Feb '28 146 117 904 1,021 115,262 80 15,950 131,212 12%
Mar '28 147 81 904 985 115,262 110 16,060 131,322 12%
Apr '28 148 58 904 962 115,262 140 16,200 131,462 12%
May '28 149 24 904 928 115,262 170 16,200 131,462 12%Jun '28 150 7 904 911 115,262 180 16,200 131,462 12%
Page 3 of 3

0%
5%
10%
15%
20%
25%
30%
35%
40%
45%
50%
55%-36 -24 -12 0 12 24 36 48 60 72 84 96 108 120 132 144
0
100
200
300
400
500
Feb
'13
Feb
'14
Feb
'15
Feb
'16
Feb
'17
Feb
'18
Feb
'19
Feb
'20
Feb
'21
Feb
'22
Feb
'23
Feb
'24
Feb
'25
Feb
'26
Feb
'27
Feb
'28
RW
C
Months Since Initial Recycled Water Delivery
De
live
red
Wat
er
Vo
lum
e (
AF
/mo
nth
)
RWC Management Plan - Declez Basin
Historical Diluent Water Recharge
Historical Recycled Water Recharge
Forecast Stormwater Diluent Recharge
Planned Recycled Water Recharge
Groundwater Underflow
RWC Actual
RWC Projected
RWC Maximum
HISTORICAL RECHARGE PLANNED RECHARGE
Declez Basin Groundwater Underflow is 903.8 AF per month
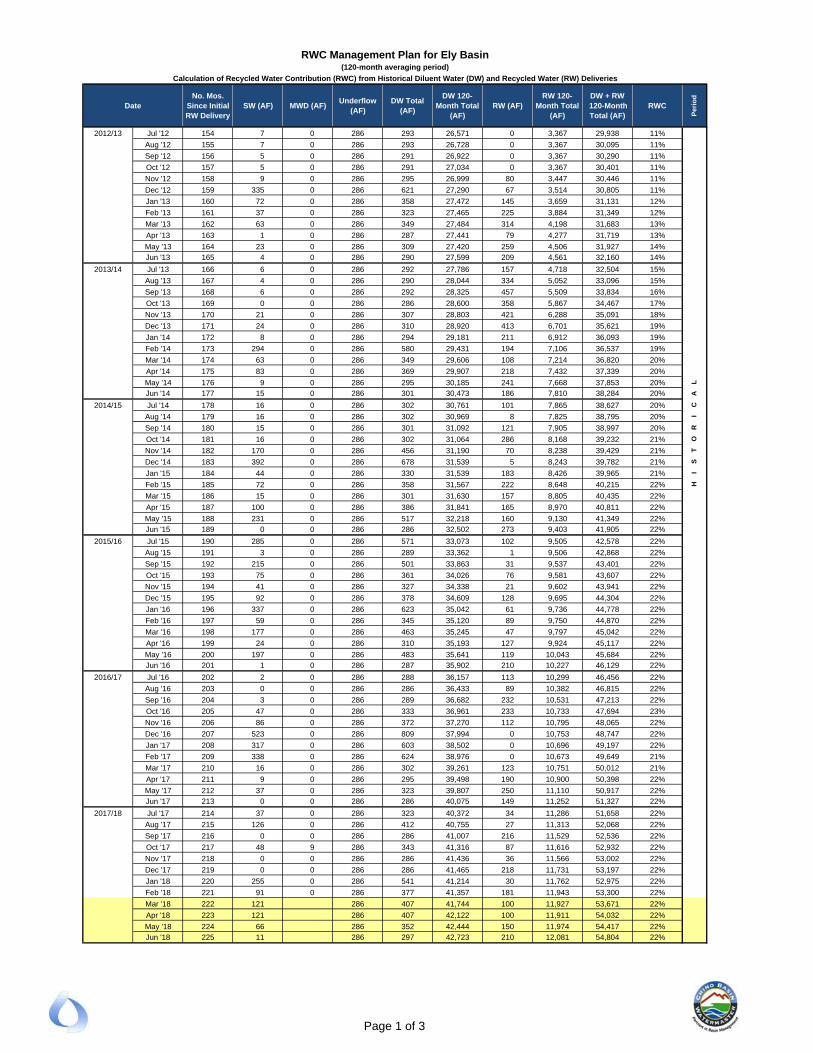
RWC Management Plan for Ely Basin(120-month averaging period)
Calculation of Recycled Water Contribution (RWC) from Historical Diluent Water (DW) and Recycled Water (RW) Deliveries
DateNo. Mos.
Since Initial RW Delivery
SW (AF) MWD (AF)Underflow
(AF)DW Total
(AF)
DW 120-Month Total
(AF)RW (AF)
RW 120-Month Total
(AF)
DW + RW 120-Month Total (AF)
RWC
Per
iod
2012/13 Jul '12 154 7 0 286 293 26,571 0 3,367 29,938 11%
Aug '12 155 7 0 286 293 26,728 0 3,367 30,095 11%
Sep '12 156 5 0 286 291 26,922 0 3,367 30,290 11%
Oct '12 157 5 0 286 291 27,034 0 3,367 30,401 11%
Nov '12 158 9 0 286 295 26,999 80 3,447 30,446 11%
Dec '12 159 335 0 286 621 27,290 67 3,514 30,805 11%
Jan '13 160 72 0 286 358 27,472 145 3,659 31,131 12%
Feb '13 161 37 0 286 323 27,465 225 3,884 31,349 12%
Mar '13 162 63 0 286 349 27,484 314 4,198 31,683 13%
Apr '13 163 1 0 286 287 27,441 79 4,277 31,719 13%
May '13 164 23 0 286 309 27,420 259 4,506 31,927 14%
Jun '13 165 4 0 286 290 27,599 209 4,561 32,160 14%
2013/14 Jul '13 166 6 0 286 292 27,786 157 4,718 32,504 15%
Aug '13 167 4 0 286 290 28,044 334 5,052 33,096 15%
Sep '13 168 6 0 286 292 28,325 457 5,509 33,834 16%
Oct '13 169 0 0 286 286 28,600 358 5,867 34,467 17%
Nov '13 170 21 0 286 307 28,803 421 6,288 35,091 18%
Dec '13 171 24 0 286 310 28,920 413 6,701 35,621 19%
Jan '14 172 8 0 286 294 29,181 211 6,912 36,093 19%
Feb '14 173 294 0 286 580 29,431 194 7,106 36,537 19%
Mar '14 174 63 0 286 349 29,606 108 7,214 36,820 20%
Apr '14 175 83 0 286 369 29,907 218 7,432 37,339 20%
May '14 176 9 0 286 295 30,185 241 7,668 37,853 20% L
Jun '14 177 15 0 286 301 30,473 186 7,810 38,284 20% A
2014/15 Jul '14 178 16 0 286 302 30,761 101 7,865 38,627 20% C
Aug '14 179 16 0 286 302 30,969 8 7,825 38,795 20% I
Sep '14 180 15 0 286 301 31,092 121 7,905 38,997 20% R
Oct '14 181 16 0 286 302 31,064 286 8,168 39,232 21% O
Nov '14 182 170 0 286 456 31,190 70 8,238 39,429 21% T
Dec '14 183 392 0 286 678 31,539 5 8,243 39,782 21% S
Jan '15 184 44 0 286 330 31,539 183 8,426 39,965 21% I
Feb '15 185 72 0 286 358 31,567 222 8,648 40,215 22% H
Mar '15 186 15 0 286 301 31,630 157 8,805 40,435 22%
Apr '15 187 100 0 286 386 31,841 165 8,970 40,811 22%
May '15 188 231 0 286 517 32,218 160 9,130 41,349 22%
Jun '15 189 0 0 286 286 32,502 273 9,403 41,905 22%
2015/16 Jul '15 190 285 0 286 571 33,073 102 9,505 42,578 22%
Aug '15 191 3 0 286 289 33,362 1 9,506 42,868 22%
Sep '15 192 215 0 286 501 33,863 31 9,537 43,401 22%
Oct '15 193 75 0 286 361 34,026 76 9,581 43,607 22%
Nov '15 194 41 0 286 327 34,338 21 9,602 43,941 22%
Dec '15 195 92 0 286 378 34,609 128 9,695 44,304 22%
Jan '16 196 337 0 286 623 35,042 61 9,736 44,778 22%
Feb '16 197 59 0 286 345 35,120 89 9,750 44,870 22%
Mar '16 198 177 0 286 463 35,245 47 9,797 45,042 22%
Apr '16 199 24 0 286 310 35,193 127 9,924 45,117 22%
May '16 200 197 0 286 483 35,641 119 10,043 45,684 22%
Jun '16 201 1 0 286 287 35,902 210 10,227 46,129 22%
2016/17 Jul '16 202 2 0 286 288 36,157 113 10,299 46,456 22%
Aug '16 203 0 0 286 286 36,433 89 10,382 46,815 22%
Sep '16 204 3 0 286 289 36,682 232 10,531 47,213 22%
Oct '16 205 47 0 286 333 36,961 233 10,733 47,694 23%
Nov '16 206 86 0 286 372 37,270 112 10,795 48,065 22%
Dec '16 207 523 0 286 809 37,994 0 10,753 48,747 22%
Jan '17 208 317 0 286 603 38,502 0 10,696 49,197 22%
Feb '17 209 338 0 286 624 38,976 0 10,673 49,649 21%
Mar '17 210 16 0 286 302 39,261 123 10,751 50,012 21%
Apr '17 211 9 0 286 295 39,498 190 10,900 50,398 22%
May '17 212 37 0 286 323 39,807 250 11,110 50,917 22%
Jun '17 213 0 0 286 286 40,075 149 11,252 51,327 22%
2017/18 Jul '17 214 37 0 286 323 40,372 34 11,286 51,658 22%
Aug '17 215 126 0 286 412 40,755 27 11,313 52,068 22%
Sep '17 216 0 0 286 286 41,007 216 11,529 52,536 22%
Oct '17 217 48 9 286 343 41,316 87 11,616 52,932 22%
Nov '17 218 0 0 286 286 41,436 36 11,566 53,002 22%
Dec '17 219 0 0 286 286 41,465 218 11,731 53,197 22%
Jan '18 220 255 0 286 541 41,214 30 11,762 52,975 22%
Feb '18 221 91 0 286 377 41,357 181 11,943 53,300 22%
Mar '18 222 121 286 407 41,744 100 11,927 53,671 22%
Apr '18 223 121 286 407 42,122 100 11,911 54,032 22%
May '18 224 66 286 352 42,444 150 11,974 54,417 22%
Jun '18 225 11 286 297 42,723 210 12,081 54,804 22%
Page 1 of 3
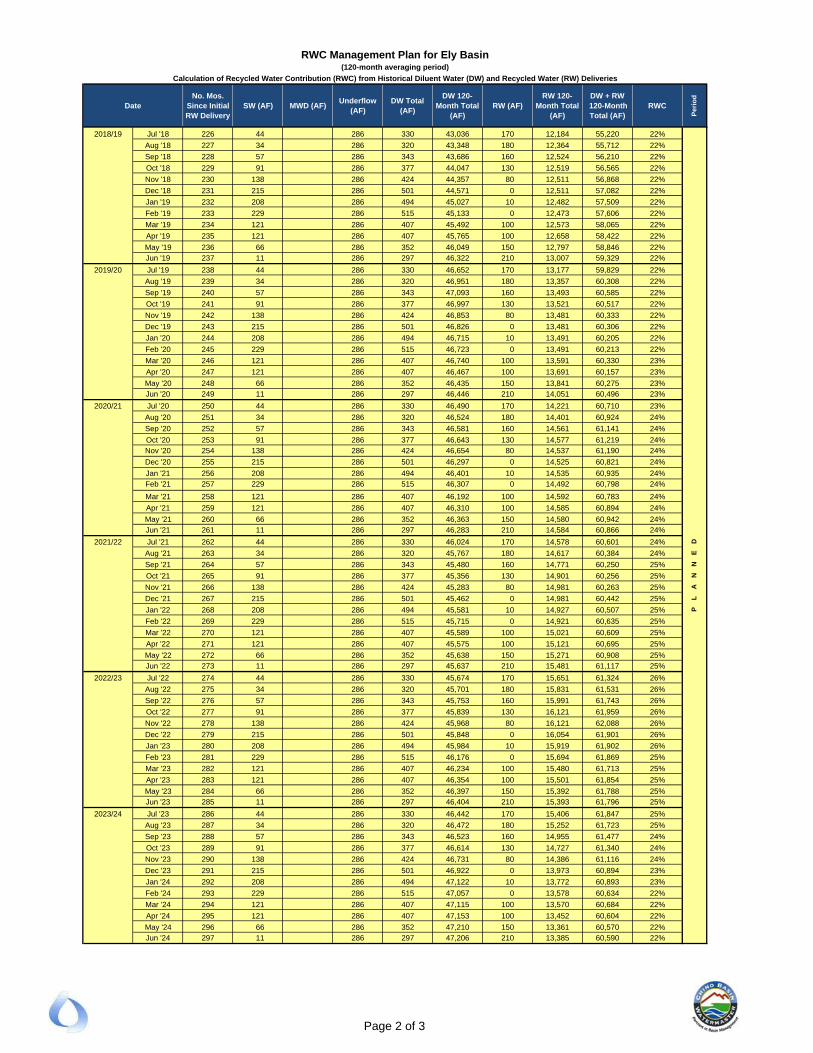
RWC Management Plan for Ely Basin(120-month averaging period)
Calculation of Recycled Water Contribution (RWC) from Historical Diluent Water (DW) and Recycled Water (RW) Deliveries
DateNo. Mos.
Since Initial RW Delivery
SW (AF) MWD (AF)Underflow
(AF)DW Total
(AF)
DW 120-Month Total
(AF)RW (AF)
RW 120-Month Total
(AF)
DW + RW 120-Month Total (AF)
RWC
Per
iod
2018/19 Jul '18 226 44 286 330 43,036 170 12,184 55,220 22%
Aug '18 227 34 286 320 43,348 180 12,364 55,712 22%
Sep '18 228 57 286 343 43,686 160 12,524 56,210 22%
Oct '18 229 91 286 377 44,047 130 12,519 56,565 22%
Nov '18 230 138 286 424 44,357 80 12,511 56,868 22%
Dec '18 231 215 286 501 44,571 0 12,511 57,082 22%
Jan '19 232 208 286 494 45,027 10 12,482 57,509 22%
Feb '19 233 229 286 515 45,133 0 12,473 57,606 22%
Mar '19 234 121 286 407 45,492 100 12,573 58,065 22%
Apr '19 235 121 286 407 45,765 100 12,658 58,422 22%
May '19 236 66 286 352 46,049 150 12,797 58,846 22%
Jun '19 237 11 286 297 46,322 210 13,007 59,329 22%
2019/20 Jul '19 238 44 286 330 46,652 170 13,177 59,829 22%
Aug '19 239 34 286 320 46,951 180 13,357 60,308 22%
Sep '19 240 57 286 343 47,093 160 13,493 60,585 22%
Oct '19 241 91 286 377 46,997 130 13,521 60,517 22%
Nov '19 242 138 286 424 46,853 80 13,481 60,333 22%
Dec '19 243 215 286 501 46,826 0 13,481 60,306 22%
Jan '20 244 208 286 494 46,715 10 13,491 60,205 22%
Feb '20 245 229 286 515 46,723 0 13,491 60,213 22%
Mar '20 246 121 286 407 46,740 100 13,591 60,330 23%
Apr '20 247 121 286 407 46,467 100 13,691 60,157 23%
May '20 248 66 286 352 46,435 150 13,841 60,275 23%
Jun '20 249 11 286 297 46,446 210 14,051 60,496 23%
2020/21 Jul '20 250 44 286 330 46,490 170 14,221 60,710 23%
Aug '20 251 34 286 320 46,524 180 14,401 60,924 24%
Sep '20 252 57 286 343 46,581 160 14,561 61,141 24%
Oct '20 253 91 286 377 46,643 130 14,577 61,219 24%
Nov '20 254 138 286 424 46,654 80 14,537 61,190 24%
Dec '20 255 215 286 501 46,297 0 14,525 60,821 24%
Jan '21 256 208 286 494 46,401 10 14,535 60,935 24%
Feb '21 257 229 286 515 46,307 0 14,492 60,798 24%
Mar '21 258 121 286 407 46,192 100 14,592 60,783 24%
Apr '21 259 121 286 407 46,310 100 14,585 60,894 24%
May '21 260 66 286 352 46,363 150 14,580 60,942 24%
Jun '21 261 11 286 297 46,283 210 14,584 60,866 24%
2021/22 Jul '21 262 44 286 330 46,024 170 14,578 60,601 24% D
Aug '21 263 34 286 320 45,767 180 14,617 60,384 24% E
Sep '21 264 57 286 343 45,480 160 14,771 60,250 25% N
Oct '21 265 91 286 377 45,356 130 14,901 60,256 25% N
Nov '21 266 138 286 424 45,283 80 14,981 60,263 25% A
Dec '21 267 215 286 501 45,462 0 14,981 60,442 25% L
Jan '22 268 208 286 494 45,581 10 14,927 60,507 25% P
Feb '22 269 229 286 515 45,715 0 14,921 60,635 25%
Mar '22 270 121 286 407 45,589 100 15,021 60,609 25%
Apr '22 271 121 286 407 45,575 100 15,121 60,695 25%
May '22 272 66 286 352 45,638 150 15,271 60,908 25%
Jun '22 273 11 286 297 45,637 210 15,481 61,117 25%
2022/23 Jul '22 274 44 286 330 45,674 170 15,651 61,324 26%
Aug '22 275 34 286 320 45,701 180 15,831 61,531 26%
Sep '22 276 57 286 343 45,753 160 15,991 61,743 26%
Oct '22 277 91 286 377 45,839 130 16,121 61,959 26%
Nov '22 278 138 286 424 45,968 80 16,121 62,088 26%
Dec '22 279 215 286 501 45,848 0 16,054 61,901 26%
Jan '23 280 208 286 494 45,984 10 15,919 61,902 26%
Feb '23 281 229 286 515 46,176 0 15,694 61,869 25%
Mar '23 282 121 286 407 46,234 100 15,480 61,713 25%
Apr '23 283 121 286 407 46,354 100 15,501 61,854 25%
May '23 284 66 286 352 46,397 150 15,392 61,788 25%
Jun '23 285 11 286 297 46,404 210 15,393 61,796 25%
2023/24 Jul '23 286 44 286 330 46,442 170 15,406 61,847 25%
Aug '23 287 34 286 320 46,472 180 15,252 61,723 25%
Sep '23 288 57 286 343 46,523 160 14,955 61,477 24%
Oct '23 289 91 286 377 46,614 130 14,727 61,340 24%
Nov '23 290 138 286 424 46,731 80 14,386 61,116 24%
Dec '23 291 215 286 501 46,922 0 13,973 60,894 23%
Jan '24 292 208 286 494 47,122 10 13,772 60,893 23%
Feb '24 293 229 286 515 47,057 0 13,578 60,634 22%
Mar '24 294 121 286 407 47,115 100 13,570 60,684 22%
Apr '24 295 121 286 407 47,153 100 13,452 60,604 22%
May '24 296 66 286 352 47,210 150 13,361 60,570 22%
Jun '24 297 11 286 297 47,206 210 13,385 60,590 22%
Page 2 of 3
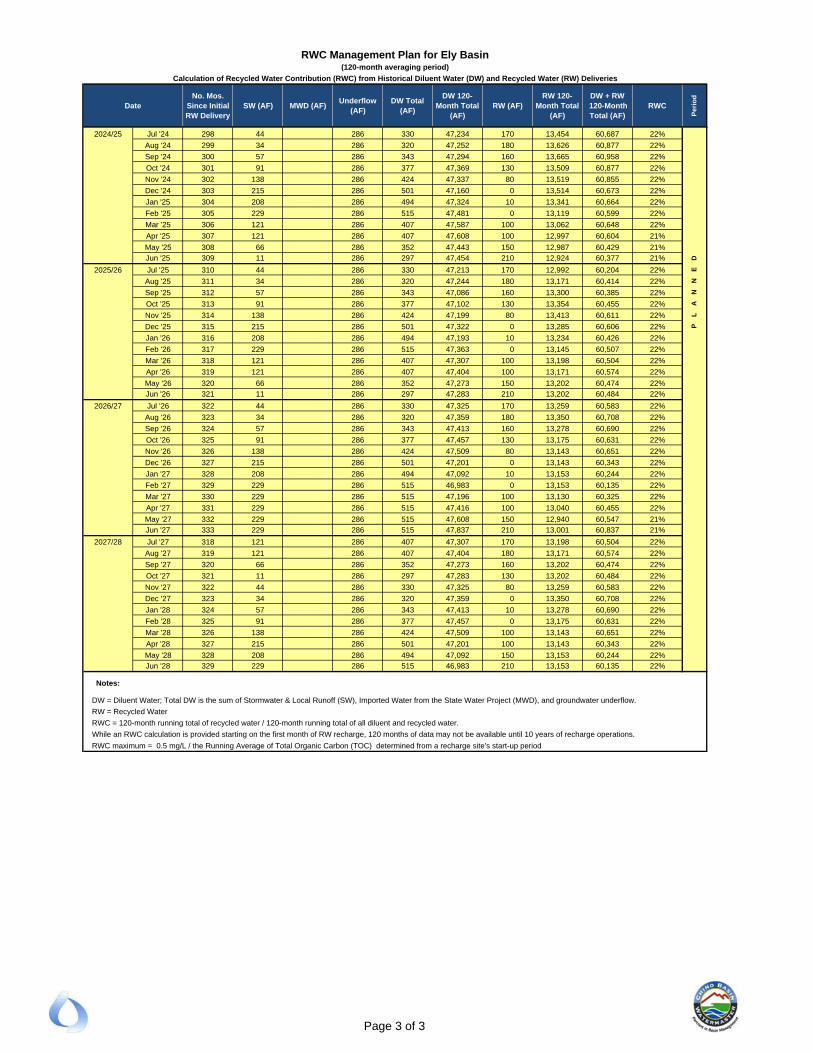
RWC Management Plan for Ely Basin(120-month averaging period)
Calculation of Recycled Water Contribution (RWC) from Historical Diluent Water (DW) and Recycled Water (RW) Deliveries
DateNo. Mos.
Since Initial RW Delivery
SW (AF) MWD (AF)Underflow
(AF)DW Total
(AF)
DW 120-Month Total
(AF)RW (AF)
RW 120-Month Total
(AF)
DW + RW 120-Month Total (AF)
RWC
Per
iod
2024/25 Jul '24 298 44 286 330 47,234 170 13,454 60,687 22%
Aug '24 299 34 286 320 47,252 180 13,626 60,877 22%
Sep '24 300 57 286 343 47,294 160 13,665 60,958 22%
Oct '24 301 91 286 377 47,369 130 13,509 60,877 22%
Nov '24 302 138 286 424 47,337 80 13,519 60,855 22%
Dec '24 303 215 286 501 47,160 0 13,514 60,673 22%
Jan '25 304 208 286 494 47,324 10 13,341 60,664 22%
Feb '25 305 229 286 515 47,481 0 13,119 60,599 22%
Mar '25 306 121 286 407 47,587 100 13,062 60,648 22%
Apr '25 307 121 286 407 47,608 100 12,997 60,604 21%
May '25 308 66 286 352 47,443 150 12,987 60,429 21%
Jun '25 309 11 286 297 47,454 210 12,924 60,377 21% D
2025/26 Jul '25 310 44 286 330 47,213 170 12,992 60,204 22% E
Aug '25 311 34 286 320 47,244 180 13,171 60,414 22% N
Sep '25 312 57 286 343 47,086 160 13,300 60,385 22% N
Oct '25 313 91 286 377 47,102 130 13,354 60,455 22% A
Nov '25 314 138 286 424 47,199 80 13,413 60,611 22% L
Dec '25 315 215 286 501 47,322 0 13,285 60,606 22% P
Jan '26 316 208 286 494 47,193 10 13,234 60,426 22%
Feb '26 317 229 286 515 47,363 0 13,145 60,507 22%
Mar '26 318 121 286 407 47,307 100 13,198 60,504 22%
Apr '26 319 121 286 407 47,404 100 13,171 60,574 22%
May '26 320 66 286 352 47,273 150 13,202 60,474 22%
Jun '26 321 11 286 297 47,283 210 13,202 60,484 22%
2026/27 Jul '26 322 44 286 330 47,325 170 13,259 60,583 22%
Aug '26 323 34 286 320 47,359 180 13,350 60,708 22%
Sep '26 324 57 286 343 47,413 160 13,278 60,690 22%
Oct '26 325 91 286 377 47,457 130 13,175 60,631 22%
Nov '26 326 138 286 424 47,509 80 13,143 60,651 22%
Dec '26 327 215 286 501 47,201 0 13,143 60,343 22%
Jan '27 328 208 286 494 47,092 10 13,153 60,244 22%
Feb '27 329 229 286 515 46,983 0 13,153 60,135 22%
Mar '27 330 229 286 515 47,196 100 13,130 60,325 22%
Apr '27 331 229 286 515 47,416 100 13,040 60,455 22%
May '27 332 229 286 515 47,608 150 12,940 60,547 21%
Jun '27 333 229 286 515 47,837 210 13,001 60,837 21%
2027/28 Jul '27 318 121 286 407 47,307 170 13,198 60,504 22%
Aug '27 319 121 286 407 47,404 180 13,171 60,574 22%
Sep '27 320 66 286 352 47,273 160 13,202 60,474 22%
Oct '27 321 11 286 297 47,283 130 13,202 60,484 22%
Nov '27 322 44 286 330 47,325 80 13,259 60,583 22%
Dec '27 323 34 286 320 47,359 0 13,350 60,708 22%
Jan '28 324 57 286 343 47,413 10 13,278 60,690 22%
Feb '28 325 91 286 377 47,457 0 13,175 60,631 22%
Mar '28 326 138 286 424 47,509 100 13,143 60,651 22%
Apr '28 327 215 286 501 47,201 100 13,143 60,343 22%
May '28 328 208 286 494 47,092 150 13,153 60,244 22%
Jun '28 329 229 286 515 46,983 210 13,153 60,135 22%
Notes:
DW = Diluent Water; Total DW is the sum of Stormwater & Local Runoff (SW), Imported Water from the State Water Project (MWD), and groundwater underflow.
RW = Recycled Water
RWC = 120-month running total of recycled water / 120-month running total of all diluent and recycled water.
While an RWC calculation is provided starting on the first month of RW recharge, 120 months of data may not be available until 10 years of recharge operations.
RWC maximum = 0.5 mg/L / the Running Average of Total Organic Carbon (TOC) determined from a recharge site's start-up period
Page 3 of 3
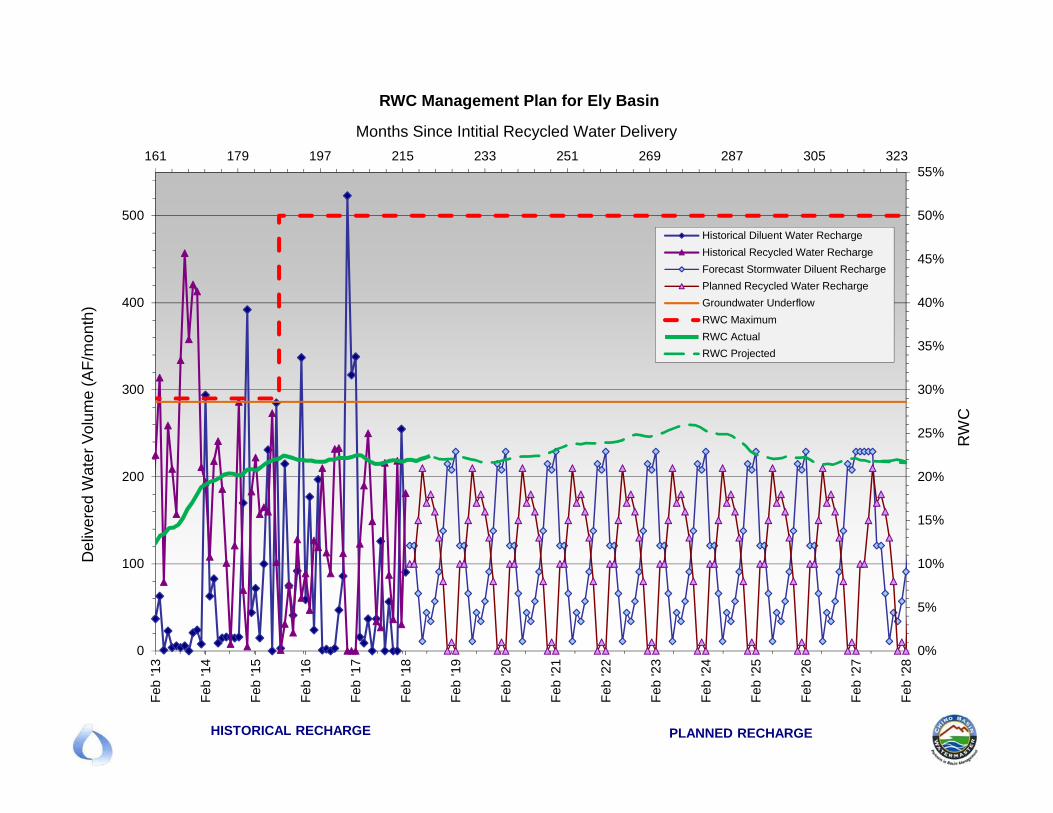
0%
5%
10%
15%
20%
25%
30%
35%
40%
45%
50%
55%161 179 197 215 233 251 269 287 305 323
0
100
200
300
400
500
Feb
'13
Feb
'14
Feb
'15
Feb
'16
Feb
'17
Feb
'18
Feb
'19
Feb
'20
Feb
'21
Feb
'22
Feb
'23
Feb
'24
Feb
'25
Feb
'26
Feb
'27
Feb
'28
RW
C
Months Since Intitial Recycled Water Delivery
De
live
red
Wat
er
Vo
lum
e (
AF
/mo
nth
)
RWC Management Plan for Ely Basin
Historical Diluent Water Recharge
Historical Recycled Water Recharge
Forecast Stormwater Diluent Recharge
Planned Recycled Water Recharge
Groundwater Underflow
RWC Maximum
RWC Actual
RWC Projected
HISTORICAL RECHARGE PLANNED RECHARGE
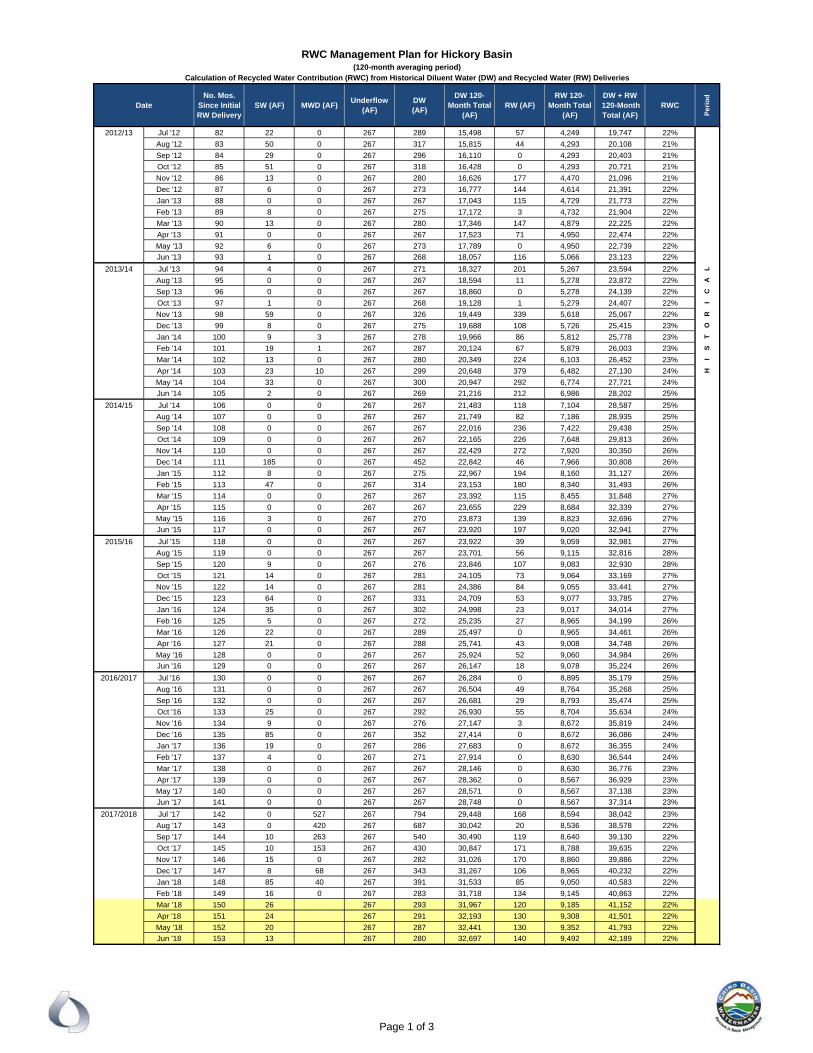
DateNo. Mos.
Since Initial RW Delivery
SW (AF) MWD (AF)Underflow
(AF)DW(AF)
DW 120-Month Total
(AF)RW (AF)
RW 120-Month Total
(AF)
DW + RW 120-Month Total (AF)
RWC
Per
iod
2012/13 Jul '12 82 22 0 267 289 15,498 57 4,249 19,747 22%
Aug '12 83 50 0 267 317 15,815 44 4,293 20,108 21%
Sep '12 84 29 0 267 296 16,110 0 4,293 20,403 21%
Oct '12 85 51 0 267 318 16,428 0 4,293 20,721 21%
Nov '12 86 13 0 267 280 16,626 177 4,470 21,096 21%
Dec '12 87 6 0 267 273 16,777 144 4,614 21,391 22%
Jan '13 88 0 0 267 267 17,043 115 4,729 21,773 22%
Feb '13 89 8 0 267 275 17,172 3 4,732 21,904 22%
Mar '13 90 13 0 267 280 17,346 147 4,879 22,225 22%
Apr '13 91 0 0 267 267 17,523 71 4,950 22,474 22%
May '13 92 6 0 267 273 17,789 0 4,950 22,739 22%
Jun '13 93 1 0 267 268 18,057 116 5,066 23,123 22%
2013/14 Jul '13 94 4 0 267 271 18,327 201 5,267 23,594 22% L
Aug '13 95 0 0 267 267 18,594 11 5,278 23,872 22% A
Sep '13 96 0 0 267 267 18,860 0 5,278 24,139 22% C
Oct '13 97 1 0 267 268 19,128 1 5,279 24,407 22% I
Nov '13 98 59 0 267 326 19,449 339 5,618 25,067 22% R
Dec '13 99 8 0 267 275 19,688 108 5,726 25,415 23% O
Jan '14 100 9 3 267 278 19,966 86 5,812 25,778 23% T
Feb '14 101 19 1 267 287 20,124 67 5,879 26,003 23% S
Mar '14 102 13 0 267 280 20,349 224 6,103 26,452 23% I
Apr '14 103 23 10 267 299 20,648 379 6,482 27,130 24% H
May '14 104 33 0 267 300 20,947 292 6,774 27,721 24%
Jun '14 105 2 0 267 269 21,216 212 6,986 28,202 25%
2014/15 Jul '14 106 0 0 267 267 21,483 118 7,104 28,587 25%
Aug '14 107 0 0 267 267 21,749 82 7,186 28,935 25%
Sep '14 108 0 0 267 267 22,016 236 7,422 29,438 25%
Oct '14 109 0 0 267 267 22,165 226 7,648 29,813 26%
Nov '14 110 0 0 267 267 22,429 272 7,920 30,350 26%
Dec '14 111 185 0 267 452 22,842 46 7,966 30,808 26%
Jan '15 112 8 0 267 275 22,967 194 8,160 31,127 26%
Feb '15 113 47 0 267 314 23,153 180 8,340 31,493 26%
Mar '15 114 0 0 267 267 23,392 115 8,455 31,848 27%
Apr '15 115 0 0 267 267 23,655 229 8,684 32,339 27%
May '15 116 3 0 267 270 23,873 139 8,823 32,696 27%
Jun '15 117 0 0 267 267 23,920 197 9,020 32,941 27%
2015/16 Jul '15 118 0 0 267 267 23,922 39 9,059 32,981 27%
Aug '15 119 0 0 267 267 23,701 56 9,115 32,816 28%
Sep '15 120 9 0 267 276 23,846 107 9,083 32,930 28%
Oct '15 121 14 0 267 281 24,105 73 9,064 33,169 27%
Nov '15 122 14 0 267 281 24,386 84 9,055 33,441 27%
Dec '15 123 64 0 267 331 24,709 53 9,077 33,785 27%
Jan '16 124 35 0 267 302 24,998 23 9,017 34,014 27%
Feb '16 125 5 0 267 272 25,235 27 8,965 34,199 26%
Mar '16 126 22 0 267 289 25,497 0 8,965 34,461 26%
Apr '16 127 21 0 267 288 25,741 43 9,008 34,748 26%
May '16 128 0 0 267 267 25,924 52 9,060 34,984 26%
Jun '16 129 0 0 267 267 26,147 18 9,078 35,224 26%
2016/2017 Jul '16 130 0 0 267 267 26,284 0 8,895 35,179 25%
Aug '16 131 0 0 267 267 26,504 49 8,764 35,268 25%
Sep '16 132 0 0 267 267 26,681 29 8,793 35,474 25%
Oct '16 133 25 0 267 292 26,930 55 8,704 35,634 24%
Nov '16 134 9 0 267 276 27,147 3 8,672 35,819 24%
Dec '16 135 85 0 267 352 27,414 0 8,672 36,086 24%
Jan '17 136 19 0 267 286 27,683 0 8,672 36,355 24%
Feb '17 137 4 0 267 271 27,914 0 8,630 36,544 24%
Mar '17 138 0 0 267 267 28,146 0 8,630 36,776 23%
Apr '17 139 0 0 267 267 28,362 0 8,567 36,929 23%
May '17 140 0 0 267 267 28,571 0 8,567 37,138 23%
Jun '17 141 0 0 267 267 28,748 0 8,567 37,314 23%
2017/2018 Jul '17 142 0 527 267 794 29,448 168 8,594 38,042 23%
Aug '17 143 0 420 267 687 30,042 20 8,536 38,578 22%
Sep '17 144 10 263 267 540 30,490 119 8,640 39,130 22%
Oct '17 145 10 153 267 430 30,847 171 8,788 39,635 22%
Nov '17 146 15 0 267 282 31,026 170 8,860 39,886 22%
Dec '17 147 8 68 267 343 31,267 106 8,965 40,232 22%
Jan '18 148 85 40 267 391 31,533 85 9,050 40,583 22%
Feb '18 149 16 0 267 283 31,718 134 9,145 40,863 22%
Mar '18 150 26 267 293 31,967 120 9,185 41,152 22%
Apr '18 151 24 267 291 32,193 130 9,308 41,501 22%
May '18 152 20 267 287 32,441 130 9,352 41,793 22%
Jun '18 153 13 267 280 32,697 140 9,492 42,189 22%
RWC Management Plan for Hickory Basin(120-month averaging period)
Calculation of Recycled Water Contribution (RWC) from Historical Diluent Water (DW) and Recycled Water (RW) Deliveries
Page 1 of 3
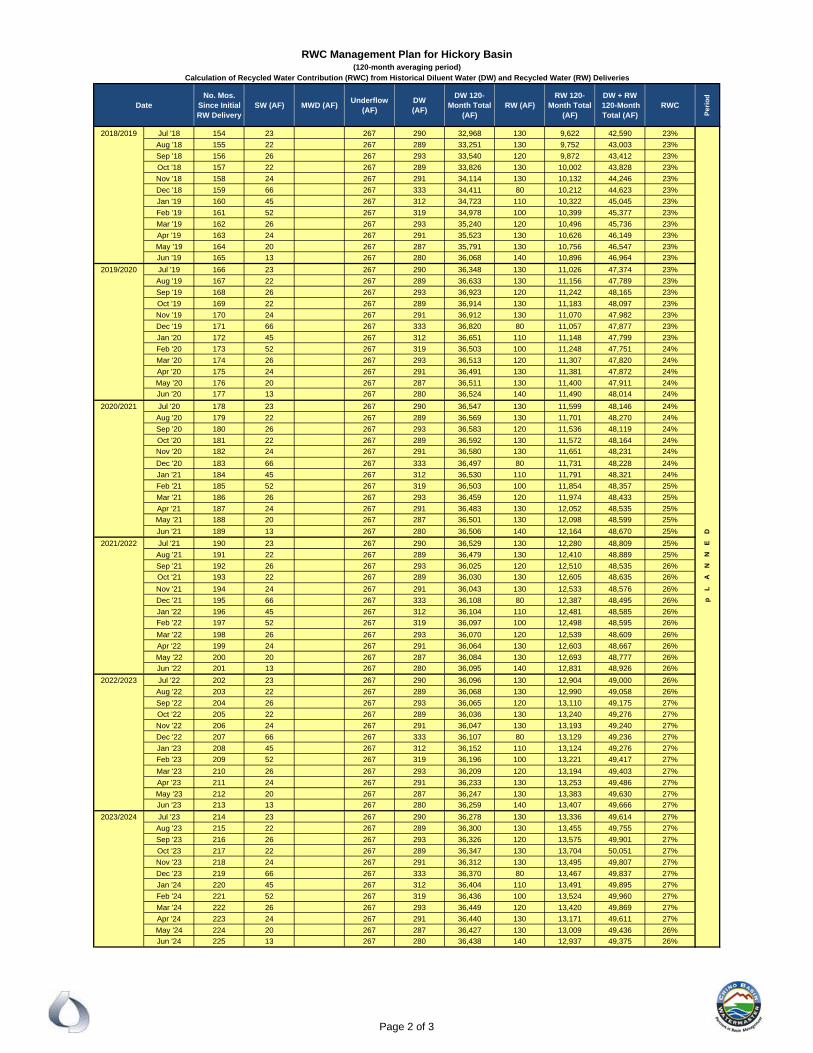
DateNo. Mos.
Since Initial RW Delivery
SW (AF) MWD (AF)Underflow
(AF)DW(AF)
DW 120-Month Total
(AF)RW (AF)
RW 120-Month Total
(AF)
DW + RW 120-Month Total (AF)
RWC
Per
iod
RWC Management Plan for Hickory Basin(120-month averaging period)
Calculation of Recycled Water Contribution (RWC) from Historical Diluent Water (DW) and Recycled Water (RW) Deliveries
2018/2019 Jul '18 154 23 267 290 32,968 130 9,622 42,590 23%
Aug '18 155 22 267 289 33,251 130 9,752 43,003 23%
Sep '18 156 26 267 293 33,540 120 9,872 43,412 23%
Oct '18 157 22 267 289 33,826 130 10,002 43,828 23%
Nov '18 158 24 267 291 34,114 130 10,132 44,246 23%
Dec '18 159 66 267 333 34,411 80 10,212 44,623 23%
Jan '19 160 45 267 312 34,723 110 10,322 45,045 23%
Feb '19 161 52 267 319 34,978 100 10,399 45,377 23%
Mar '19 162 26 267 293 35,240 120 10,496 45,736 23%
Apr '19 163 24 267 291 35,523 130 10,626 46,149 23%
May '19 164 20 267 287 35,791 130 10,756 46,547 23%
Jun '19 165 13 267 280 36,068 140 10,896 46,964 23%
2019/2020 Jul '19 166 23 267 290 36,348 130 11,026 47,374 23%
Aug '19 167 22 267 289 36,633 130 11,156 47,789 23%
Sep '19 168 26 267 293 36,923 120 11,242 48,165 23%
Oct '19 169 22 267 289 36,914 130 11,183 48,097 23%
Nov '19 170 24 267 291 36,912 130 11,070 47,982 23%
Dec '19 171 66 267 333 36,820 80 11,057 47,877 23%
Jan '20 172 45 267 312 36,651 110 11,148 47,799 23%
Feb '20 173 52 267 319 36,503 100 11,248 47,751 24%
Mar '20 174 26 267 293 36,513 120 11,307 47,820 24%
Apr '20 175 24 267 291 36,491 130 11,381 47,872 24%
May '20 176 20 267 287 36,511 130 11,400 47,911 24%
Jun '20 177 13 267 280 36,524 140 11,490 48,014 24%
2020/2021 Jul '20 178 23 267 290 36,547 130 11,599 48,146 24%
Aug '20 179 22 267 289 36,569 130 11,701 48,270 24%
Sep '20 180 26 267 293 36,583 120 11,536 48,119 24%
Oct '20 181 22 267 289 36,592 130 11,572 48,164 24%
Nov '20 182 24 267 291 36,580 130 11,651 48,231 24%
Dec '20 183 66 267 333 36,497 80 11,731 48,228 24%
Jan '21 184 45 267 312 36,530 110 11,791 48,321 24%
Feb '21 185 52 267 319 36,503 100 11,854 48,357 25%
Mar '21 186 26 267 293 36,459 120 11,974 48,433 25%
Apr '21 187 24 267 291 36,483 130 12,052 48,535 25%
May '21 188 20 267 287 36,501 130 12,098 48,599 25%
Jun '21 189 13 267 280 36,506 140 12,164 48,670 25% D
2021/2022 Jul '21 190 23 267 290 36,529 130 12,280 48,809 25% E
Aug '21 191 22 267 289 36,479 130 12,410 48,889 25% N
Sep '21 192 26 267 293 36,025 120 12,510 48,535 26% N
Oct '21 193 22 267 289 36,030 130 12,605 48,635 26% A
Nov '21 194 24 267 291 36,043 130 12,533 48,576 26% L
Dec '21 195 66 267 333 36,108 80 12,387 48,495 26% p
Jan '22 196 45 267 312 36,104 110 12,481 48,585 26%
Feb '22 197 52 267 319 36,097 100 12,498 48,595 26%
Mar '22 198 26 267 293 36,070 120 12,539 48,609 26%
Apr '22 199 24 267 291 36,064 130 12,603 48,667 26%
May '22 200 20 267 287 36,084 130 12,693 48,777 26%
Jun '22 201 13 267 280 36,095 140 12,831 48,926 26%
2022/2023 Jul '22 202 23 267 290 36,096 130 12,904 49,000 26%
Aug '22 203 22 267 289 36,068 130 12,990 49,058 26%
Sep '22 204 26 267 293 36,065 120 13,110 49,175 27%
Oct '22 205 22 267 289 36,036 130 13,240 49,276 27%
Nov '22 206 24 267 291 36,047 130 13,193 49,240 27%
Dec '22 207 66 267 333 36,107 80 13,129 49,236 27%
Jan '23 208 45 267 312 36,152 110 13,124 49,276 27%
Feb '23 209 52 267 319 36,196 100 13,221 49,417 27%
Mar '23 210 26 267 293 36,209 120 13,194 49,403 27%
Apr '23 211 24 267 291 36,233 130 13,253 49,486 27%
May '23 212 20 267 287 36,247 130 13,383 49,630 27%
Jun '23 213 13 267 280 36,259 140 13,407 49,666 27%
2023/2024 Jul '23 214 23 267 290 36,278 130 13,336 49,614 27%
Aug '23 215 22 267 289 36,300 130 13,455 49,755 27%
Sep '23 216 26 267 293 36,326 120 13,575 49,901 27%
Oct '23 217 22 267 289 36,347 130 13,704 50,051 27%
Nov '23 218 24 267 291 36,312 130 13,495 49,807 27%
Dec '23 219 66 267 333 36,370 80 13,467 49,837 27%
Jan '24 220 45 267 312 36,404 110 13,491 49,895 27%
Feb '24 221 52 267 319 36,436 100 13,524 49,960 27%
Mar '24 222 26 267 293 36,449 120 13,420 49,869 27%
Apr '24 223 24 267 291 36,440 130 13,171 49,611 27%
May '24 224 20 267 287 36,427 130 13,009 49,436 26%
Jun '24 225 13 267 280 36,438 140 12,937 49,375 26%
Page 2 of 3
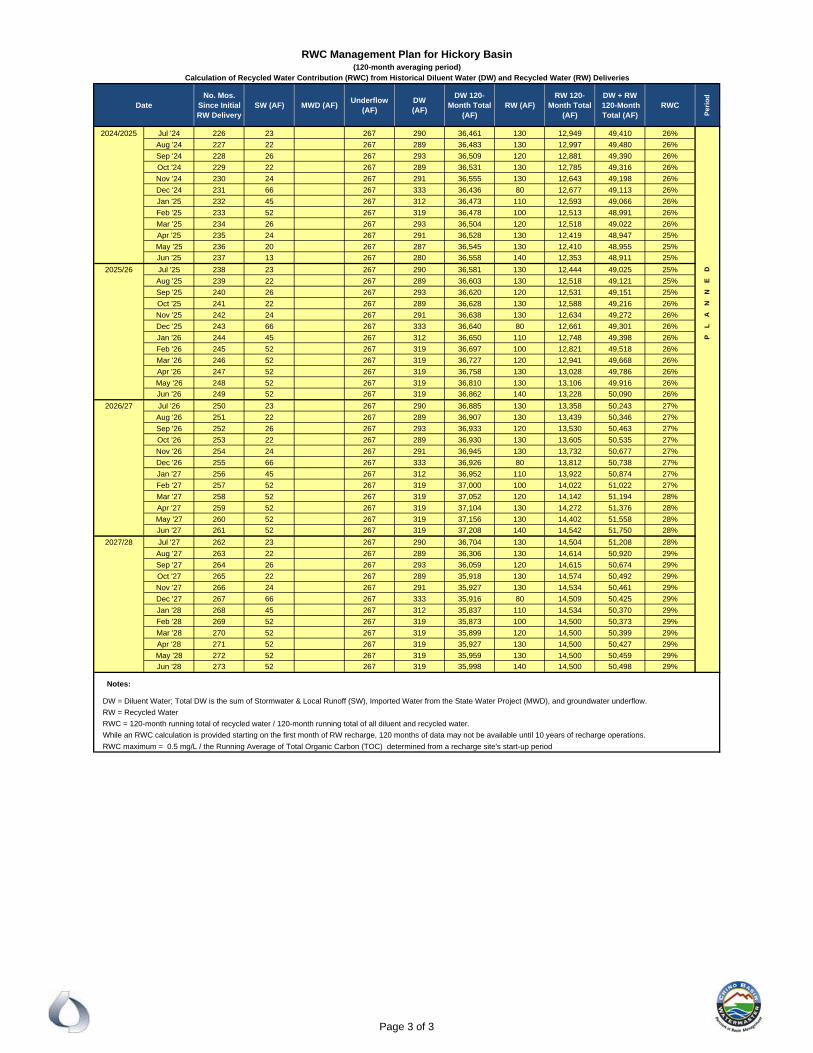
DateNo. Mos.
Since Initial RW Delivery
SW (AF) MWD (AF)Underflow
(AF)DW(AF)
DW 120-Month Total
(AF)RW (AF)
RW 120-Month Total
(AF)
DW + RW 120-Month Total (AF)
RWC
Per
iod
RWC Management Plan for Hickory Basin(120-month averaging period)
Calculation of Recycled Water Contribution (RWC) from Historical Diluent Water (DW) and Recycled Water (RW) Deliveries
2024/2025 Jul '24 226 23 267 290 36,461 130 12,949 49,410 26%
Aug '24 227 22 267 289 36,483 130 12,997 49,480 26%
Sep '24 228 26 267 293 36,509 120 12,881 49,390 26%
Oct '24 229 22 267 289 36,531 130 12,785 49,316 26%
Nov '24 230 24 267 291 36,555 130 12,643 49,198 26%
Dec '24 231 66 267 333 36,436 80 12,677 49,113 26%
Jan '25 232 45 267 312 36,473 110 12,593 49,066 26%
Feb '25 233 52 267 319 36,478 100 12,513 48,991 26%
Mar '25 234 26 267 293 36,504 120 12,518 49,022 26%
Apr '25 235 24 267 291 36,528 130 12,419 48,947 25%
May '25 236 20 267 287 36,545 130 12,410 48,955 25%
Jun '25 237 13 267 280 36,558 140 12,353 48,911 25%
2025/26 Jul '25 238 23 267 290 36,581 130 12,444 49,025 25% D
Aug '25 239 22 267 289 36,603 130 12,518 49,121 25% E
Sep '25 240 26 267 293 36,620 120 12,531 49,151 25% N
Oct '25 241 22 267 289 36,628 130 12,588 49,216 26% N
Nov '25 242 24 267 291 36,638 130 12,634 49,272 26% A
Dec '25 243 66 267 333 36,640 80 12,661 49,301 26% L
Jan '26 244 45 267 312 36,650 110 12,748 49,398 26% P
Feb '26 245 52 267 319 36,697 100 12,821 49,518 26%
Mar '26 246 52 267 319 36,727 120 12,941 49,668 26%
Apr '26 247 52 267 319 36,758 130 13,028 49,786 26%
May '26 248 52 267 319 36,810 130 13,106 49,916 26%
Jun '26 249 52 267 319 36,862 140 13,228 50,090 26%
2026/27 Jul '26 250 23 267 290 36,885 130 13,358 50,243 27%
Aug '26 251 22 267 289 36,907 130 13,439 50,346 27%
Sep '26 252 26 267 293 36,933 120 13,530 50,463 27%
Oct '26 253 22 267 289 36,930 130 13,605 50,535 27%
Nov '26 254 24 267 291 36,945 130 13,732 50,677 27%
Dec '26 255 66 267 333 36,926 80 13,812 50,738 27%
Jan '27 256 45 267 312 36,952 110 13,922 50,874 27%
Feb '27 257 52 267 319 37,000 100 14,022 51,022 27%
Mar '27 258 52 267 319 37,052 120 14,142 51,194 28%
Apr '27 259 52 267 319 37,104 130 14,272 51,376 28%
May '27 260 52 267 319 37,156 130 14,402 51,558 28%
Jun '27 261 52 267 319 37,208 140 14,542 51,750 28%
2027/28 Jul '27 262 23 267 290 36,704 130 14,504 51,208 28%
Aug '27 263 22 267 289 36,306 130 14,614 50,920 29%
Sep '27 264 26 267 293 36,059 120 14,615 50,674 29%
Oct '27 265 22 267 289 35,918 130 14,574 50,492 29%
Nov '27 266 24 267 291 35,927 130 14,534 50,461 29%
Dec '27 267 66 267 333 35,916 80 14,509 50,425 29%
Jan '28 268 45 267 312 35,837 110 14,534 50,370 29%
Feb '28 269 52 267 319 35,873 100 14,500 50,373 29%
Mar '28 270 52 267 319 35,899 120 14,500 50,399 29%
Apr '28 271 52 267 319 35,927 130 14,500 50,427 29%
May '28 272 52 267 319 35,959 130 14,500 50,459 29%
Jun '28 273 52 267 319 35,998 140 14,500 50,498 29%
Notes:
DW = Diluent Water; Total DW is the sum of Stormwater & Local Runoff (SW), Imported Water from the State Water Project (MWD), and groundwater underflow.
RW = Recycled Water
RWC = 120-month running total of recycled water / 120-month running total of all diluent and recycled water.
While an RWC calculation is provided starting on the first month of RW recharge, 120 months of data may not be available until 10 years of recharge operations.
RWC maximum = 0.5 mg/L / the Running Average of Total Organic Carbon (TOC) determined from a recharge site's start-up period
Page 3 of 3
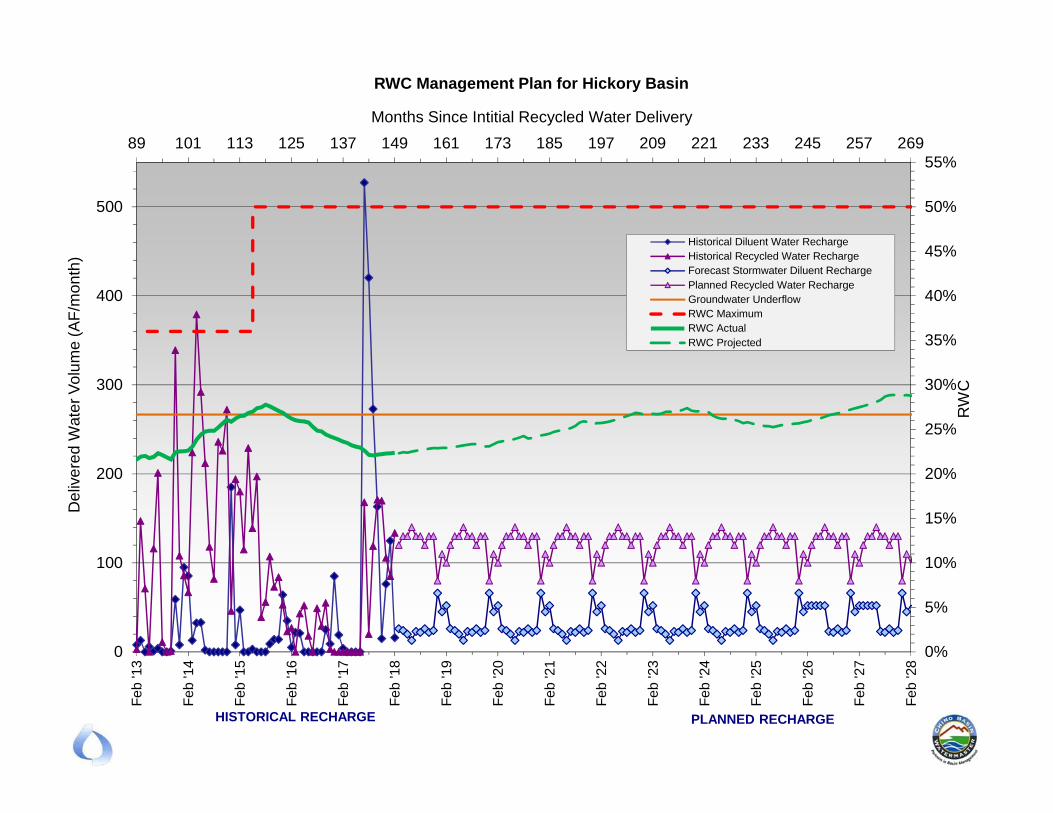
0%
5%
10%
15%
20%
25%
30%
35%
40%
45%
50%
55%89 101 113 125 137 149 161 173 185 197 209 221 233 245 257 269
0
100
200
300
400
500
Feb
'13
Feb
'14
Feb
'15
Feb
'16
Feb
'17
Feb
'18
Feb
'19
Feb
'20
Feb
'21
Feb
'22
Feb
'23
Feb
'24
Feb
'25
Feb
'26
Feb
'27
Feb
'28
RW
C
Months Since Intitial Recycled Water Delivery
De
live
red
Wat
er
Vo
lum
e (
AF
/mo
nth
) RWC Management Plan for Hickory Basin
Historical Diluent Water RechargeHistorical Recycled Water RechargeForecast Stormwater Diluent RechargePlanned Recycled Water RechargeGroundwater UnderflowRWC MaximumRWC ActualRWC Projected
HISTORICAL RECHARGE PLANNED RECHARGE
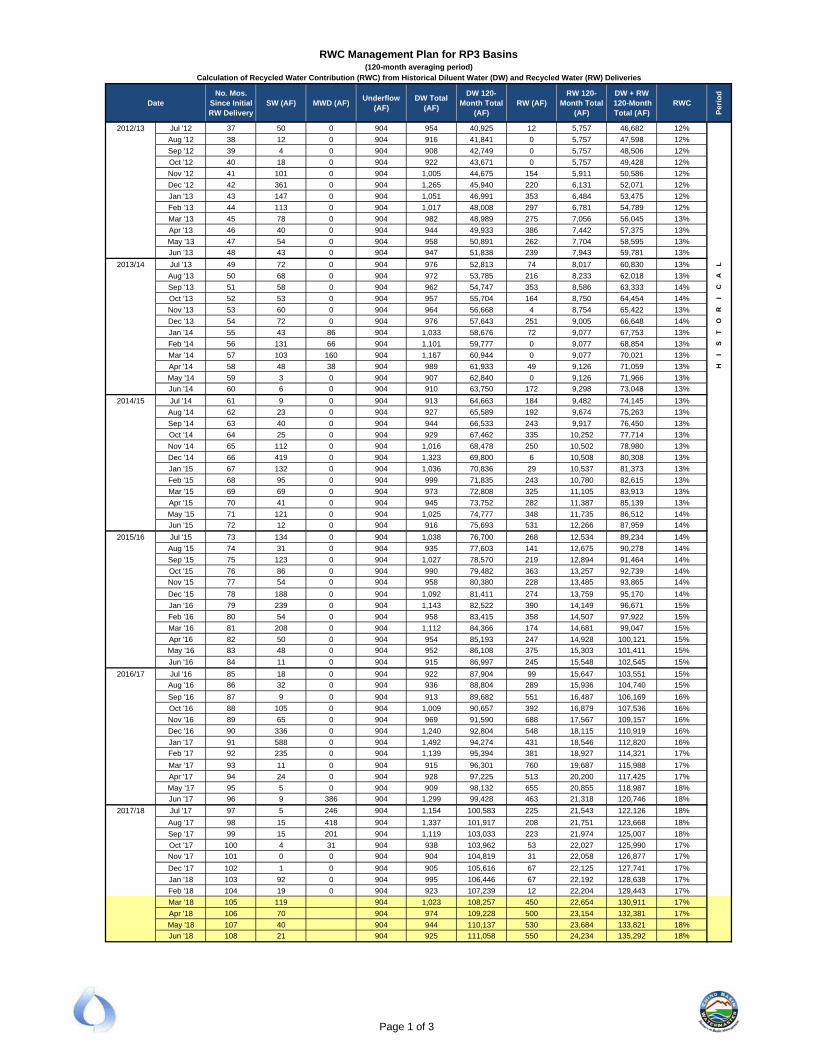
DateNo. Mos.
Since Initial RW Delivery
SW (AF) MWD (AF)Underflow
(AF)DW Total
(AF)
DW 120-Month Total
(AF)RW (AF)
RW 120-Month Total
(AF)
DW + RW 120-Month Total (AF)
RWC
Pe
rio
d
2012/13 Jul '12 37 50 0 904 954 40,925 12 5,757 46,682 12%
Aug '12 38 12 0 904 916 41,841 0 5,757 47,598 12%
Sep '12 39 4 0 904 908 42,749 0 5,757 48,506 12%
Oct '12 40 18 0 904 922 43,671 0 5,757 49,428 12%
Nov '12 41 101 0 904 1,005 44,675 154 5,911 50,586 12%
Dec '12 42 361 0 904 1,265 45,940 220 6,131 52,071 12%
Jan '13 43 147 0 904 1,051 46,991 353 6,484 53,475 12%
Feb '13 44 113 0 904 1,017 48,008 297 6,781 54,789 12%
Mar '13 45 78 0 904 982 48,989 275 7,056 56,045 13%
Apr '13 46 40 0 904 944 49,933 386 7,442 57,375 13%
May '13 47 54 0 904 958 50,891 262 7,704 58,595 13%
Jun '13 48 43 0 904 947 51,838 239 7,943 59,781 13%
2013/14 Jul '13 49 72 0 904 976 52,813 74 8,017 60,830 13% L
Aug '13 50 68 0 904 972 53,785 216 8,233 62,018 13% A
Sep '13 51 58 0 904 962 54,747 353 8,586 63,333 14% C
Oct '13 52 53 0 904 957 55,704 164 8,750 64,454 14% I
Nov '13 53 60 0 904 964 56,668 4 8,754 65,422 13% R
Dec '13 54 72 0 904 976 57,643 251 9,005 66,648 14% O
Jan '14 55 43 86 904 1,033 58,676 72 9,077 67,753 13% T
Feb '14 56 131 66 904 1,101 59,777 0 9,077 68,854 13% S
Mar '14 57 103 160 904 1,167 60,944 0 9,077 70,021 13% I
Apr '14 58 48 38 904 989 61,933 49 9,126 71,059 13% H
May '14 59 3 0 904 907 62,840 0 9,126 71,966 13%
Jun '14 60 6 0 904 910 63,750 172 9,298 73,048 13%
2014/15 Jul '14 61 9 0 904 913 64,663 184 9,482 74,145 13%
Aug '14 62 23 0 904 927 65,589 192 9,674 75,263 13%
Sep '14 63 40 0 904 944 66,533 243 9,917 76,450 13%
Oct '14 64 25 0 904 929 67,462 335 10,252 77,714 13%
Nov '14 65 112 0 904 1,016 68,478 250 10,502 78,980 13%
Dec '14 66 419 0 904 1,323 69,800 6 10,508 80,308 13%
Jan '15 67 132 0 904 1,036 70,836 29 10,537 81,373 13%
Feb '15 68 95 0 904 999 71,835 243 10,780 82,615 13%
Mar '15 69 69 0 904 973 72,808 325 11,105 83,913 13%
Apr '15 70 41 0 904 945 73,752 282 11,387 85,139 13%
May '15 71 121 0 904 1,025 74,777 348 11,735 86,512 14%
Jun '15 72 12 0 904 916 75,693 531 12,266 87,959 14%
2015/16 Jul '15 73 134 0 904 1,038 76,700 268 12,534 89,234 14%
Aug '15 74 31 0 904 935 77,603 141 12,675 90,278 14%
Sep '15 75 123 0 904 1,027 78,570 219 12,894 91,464 14%
Oct '15 76 86 0 904 990 79,482 363 13,257 92,739 14%
Nov '15 77 54 0 904 958 80,380 228 13,485 93,865 14%
Dec '15 78 188 0 904 1,092 81,411 274 13,759 95,170 14%
Jan '16 79 239 0 904 1,143 82,522 390 14,149 96,671 15%
Feb '16 80 54 0 904 958 83,415 358 14,507 97,922 15%
Mar '16 81 208 0 904 1,112 84,366 174 14,681 99,047 15%
Apr '16 82 50 0 904 954 85,193 247 14,928 100,121 15%
May '16 83 48 0 904 952 86,108 375 15,303 101,411 15%
Jun '16 84 11 0 904 915 86,997 245 15,548 102,545 15%
2016/17 Jul '16 85 18 0 904 922 87,904 99 15,647 103,551 15%
Aug '16 86 32 0 904 936 88,804 289 15,936 104,740 15%
Sep '16 87 9 0 904 913 89,682 551 16,487 106,169 16%
Oct '16 88 105 0 904 1,009 90,657 392 16,879 107,536 16%
Nov '16 89 65 0 904 969 91,590 688 17,567 109,157 16%
Dec '16 90 336 0 904 1,240 92,804 548 18,115 110,919 16%
Jan '17 91 588 0 904 1,492 94,274 431 18,546 112,820 16%
Feb '17 92 235 0 904 1,139 95,394 381 18,927 114,321 17%
Mar '17 93 11 0 904 915 96,301 760 19,687 115,988 17%
Apr '17 94 24 0 904 928 97,225 513 20,200 117,425 17%
May '17 95 5 0 904 909 98,132 655 20,855 118,987 18%
Jun '17 96 9 386 904 1,299 99,428 463 21,318 120,746 18%
2017/18 Jul '17 97 5 246 904 1,154 100,583 225 21,543 122,126 18%
Aug '17 98 15 418 904 1,337 101,917 208 21,751 123,668 18%
Sep '17 99 15 201 904 1,119 103,033 223 21,974 125,007 18%
Oct '17 100 4 31 904 938 103,962 53 22,027 125,990 17%
Nov '17 101 0 0 904 904 104,819 31 22,058 126,877 17%
Dec '17 102 1 0 904 905 105,616 67 22,125 127,741 17%
Jan '18 103 92 0 904 995 106,446 67 22,192 128,638 17%
Feb '18 104 19 0 904 923 107,239 12 22,204 129,443 17%
Mar '18 105 119 904 1,023 108,257 450 22,654 130,911 17%
Apr '18 106 70 904 974 109,228 500 23,154 132,381 17%
May '18 107 40 904 944 110,137 530 23,684 133,821 18%
Jun '18 108 21 904 925 111,058 550 24,234 135,292 18%
Calculation of Recycled Water Contribution (RWC) from Historical Diluent Water (DW) and Recycled Water (RW) Deliveries
(120-month averaging period)
RWC Management Plan for RP3 Basins
Page 1 of 3
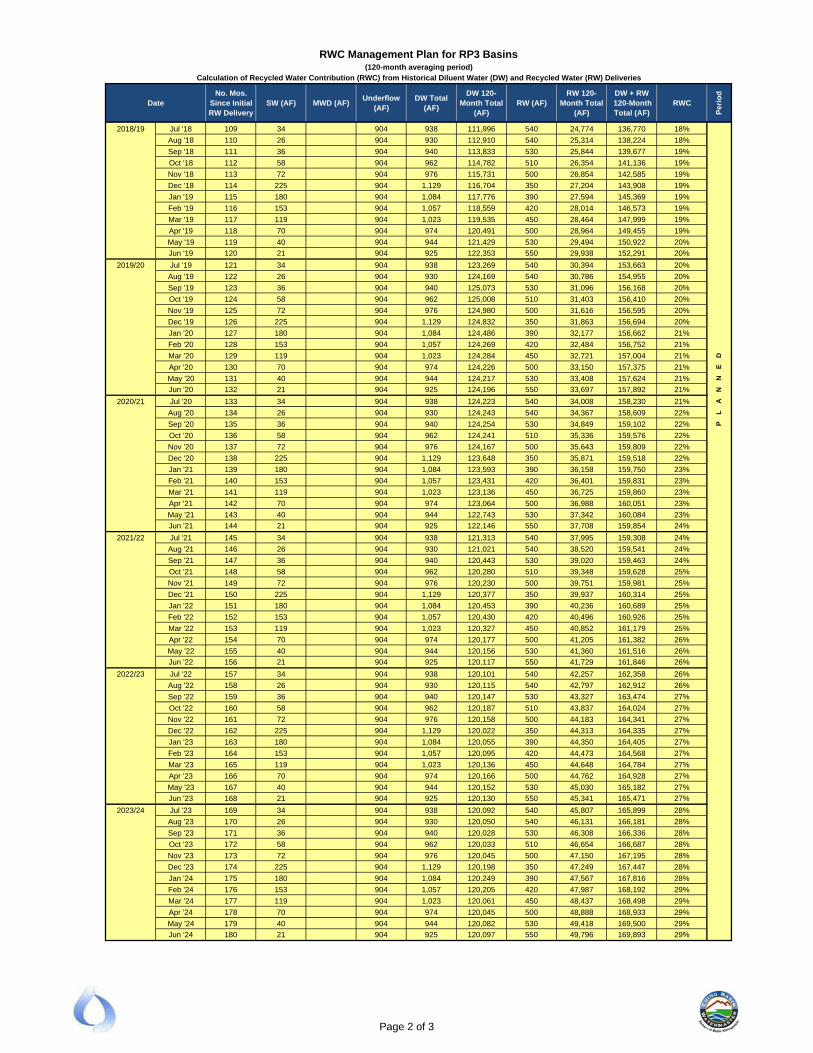
DateNo. Mos.
Since Initial RW Delivery
SW (AF) MWD (AF)Underflow
(AF)DW Total
(AF)
DW 120-Month Total
(AF)RW (AF)
RW 120-Month Total
(AF)
DW + RW 120-Month Total (AF)
RWC
Pe
rio
d
Calculation of Recycled Water Contribution (RWC) from Historical Diluent Water (DW) and Recycled Water (RW) Deliveries
(120-month averaging period)
RWC Management Plan for RP3 Basins
2018/19 Jul '18 109 34 904 938 111,996 540 24,774 136,770 18%
Aug '18 110 26 904 930 112,910 540 25,314 138,224 18%
Sep '18 111 36 904 940 113,833 530 25,844 139,677 19%
Oct '18 112 58 904 962 114,782 510 26,354 141,136 19%
Nov '18 113 72 904 976 115,731 500 26,854 142,585 19%
Dec '18 114 225 904 1,129 116,704 350 27,204 143,908 19%
Jan '19 115 180 904 1,084 117,776 390 27,594 145,369 19%
Feb '19 116 153 904 1,057 118,559 420 28,014 146,573 19%
Mar '19 117 119 904 1,023 119,535 450 28,464 147,999 19%
Apr '19 118 70 904 974 120,491 500 28,964 149,455 19%
May '19 119 40 904 944 121,429 530 29,494 150,922 20%
Jun '19 120 21 904 925 122,353 550 29,938 152,291 20%
2019/20 Jul '19 121 34 904 938 123,269 540 30,394 153,663 20%
Aug '19 122 26 904 930 124,169 540 30,786 154,955 20%
Sep '19 123 36 904 940 125,073 530 31,096 156,168 20%
Oct '19 124 58 904 962 125,008 510 31,403 156,410 20%
Nov '19 125 72 904 976 124,980 500 31,616 156,595 20%
Dec '19 126 225 904 1,129 124,832 350 31,863 156,694 20%
Jan '20 127 180 904 1,084 124,486 390 32,177 156,662 21%
Feb '20 128 153 904 1,057 124,269 420 32,484 156,752 21%
Mar '20 129 119 904 1,023 124,284 450 32,721 157,004 21% D
Apr '20 130 70 904 974 124,226 500 33,150 157,375 21% E
May '20 131 40 904 944 124,217 530 33,408 157,624 21% N
Jun '20 132 21 904 925 124,196 550 33,697 157,892 21% N
2020/21 Jul '20 133 34 904 938 124,223 540 34,008 158,230 21% A
Aug '20 134 26 904 930 124,243 540 34,367 158,609 22% L
Sep '20 135 36 904 940 124,254 530 34,849 159,102 22% P
Oct '20 136 58 904 962 124,241 510 35,336 159,576 22%
Nov '20 137 72 904 976 124,167 500 35,643 159,809 22%
Dec '20 138 225 904 1,129 123,648 350 35,871 159,518 22%
Jan '21 139 180 904 1,084 123,593 390 36,158 159,750 23%
Feb '21 140 153 904 1,057 123,431 420 36,401 159,831 23%
Mar '21 141 119 904 1,023 123,136 450 36,725 159,860 23%
Apr '21 142 70 904 974 123,064 500 36,988 160,051 23%
May '21 143 40 904 944 122,743 530 37,342 160,084 23%
Jun '21 144 21 904 925 122,146 550 37,708 159,854 24%
2021/22 Jul '21 145 34 904 938 121,313 540 37,995 159,308 24%
Aug '21 146 26 904 930 121,021 540 38,520 159,541 24%
Sep '21 147 36 904 940 120,443 530 39,020 159,463 24%
Oct '21 148 58 904 962 120,280 510 39,348 159,628 25%
Nov '21 149 72 904 976 120,230 500 39,751 159,981 25%
Dec '21 150 225 904 1,129 120,377 350 39,937 160,314 25%
Jan '22 151 180 904 1,084 120,453 390 40,236 160,689 25%
Feb '22 152 153 904 1,057 120,430 420 40,496 160,926 25%
Mar '22 153 119 904 1,023 120,327 450 40,852 161,179 25%
Apr '22 154 70 904 974 120,177 500 41,205 161,382 26%
May '22 155 40 904 944 120,156 530 41,360 161,516 26%
Jun '22 156 21 904 925 120,117 550 41,729 161,846 26%
2022/23 Jul '22 157 34 904 938 120,101 540 42,257 162,358 26%
Aug '22 158 26 904 930 120,115 540 42,797 162,912 26%
Sep '22 159 36 904 940 120,147 530 43,327 163,474 27%
Oct '22 160 58 904 962 120,187 510 43,837 164,024 27%
Nov '22 161 72 904 976 120,158 500 44,183 164,341 27%
Dec '22 162 225 904 1,129 120,022 350 44,313 164,335 27%
Jan '23 163 180 904 1,084 120,055 390 44,350 164,405 27%
Feb '23 164 153 904 1,057 120,095 420 44,473 164,568 27%
Mar '23 165 119 904 1,023 120,136 450 44,648 164,784 27%
Apr '23 166 70 904 974 120,166 500 44,762 164,928 27%
May '23 167 40 904 944 120,152 530 45,030 165,182 27%
Jun '23 168 21 904 925 120,130 550 45,341 165,471 27%
2023/24 Jul '23 169 34 904 938 120,092 540 45,807 165,899 28%
Aug '23 170 26 904 930 120,050 540 46,131 166,181 28%
Sep '23 171 36 904 940 120,028 530 46,308 166,336 28%
Oct '23 172 58 904 962 120,033 510 46,654 166,687 28%
Nov '23 173 72 904 976 120,045 500 47,150 167,195 28%
Dec '23 174 225 904 1,129 120,198 350 47,249 167,447 28%
Jan '24 175 180 904 1,084 120,249 390 47,567 167,816 28%
Feb '24 176 153 904 1,057 120,205 420 47,987 168,192 29%
Mar '24 177 119 904 1,023 120,061 450 48,437 168,498 29%
Apr '24 178 70 904 974 120,045 500 48,888 168,933 29%
May '24 179 40 904 944 120,082 530 49,418 169,500 29%
Jun '24 180 21 904 925 120,097 550 49,796 169,893 29%
Page 2 of 3
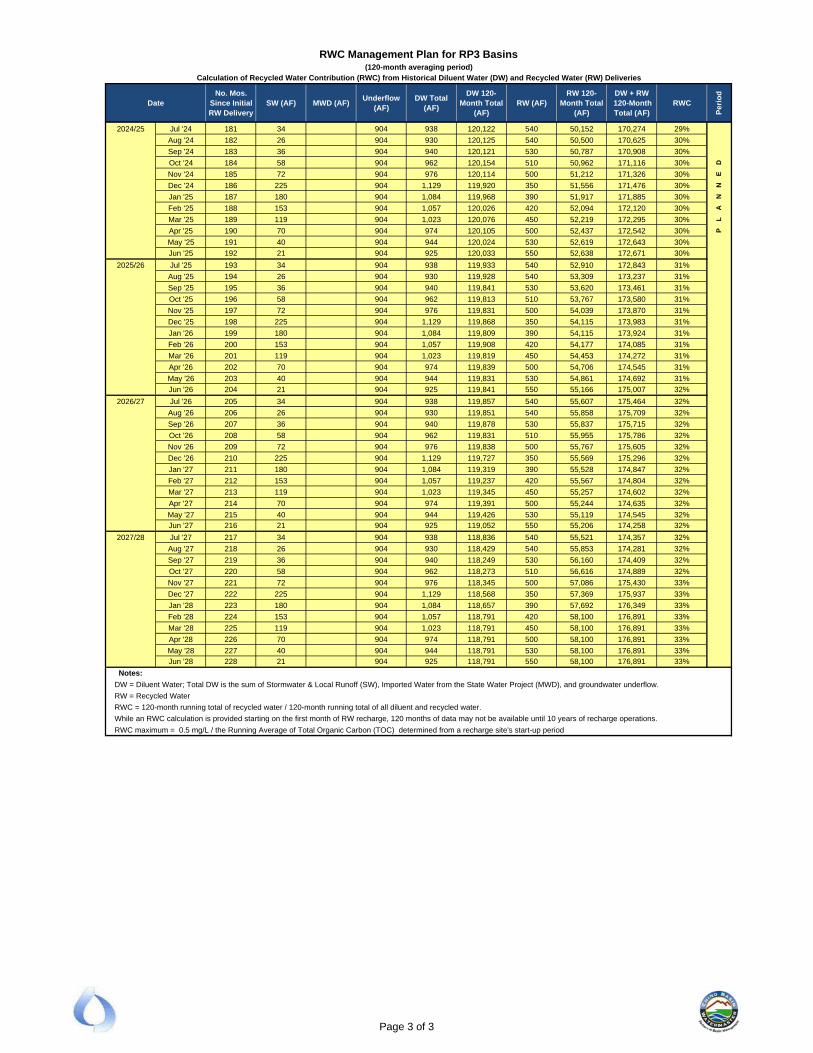
DateNo. Mos.
Since Initial RW Delivery
SW (AF) MWD (AF)Underflow
(AF)DW Total
(AF)
DW 120-Month Total
(AF)RW (AF)
RW 120-Month Total
(AF)
DW + RW 120-Month Total (AF)
RWC
Pe
rio
d
Calculation of Recycled Water Contribution (RWC) from Historical Diluent Water (DW) and Recycled Water (RW) Deliveries
(120-month averaging period)
RWC Management Plan for RP3 Basins
2024/25 Jul '24 181 34 904 938 120,122 540 50,152 170,274 29%
Aug '24 182 26 904 930 120,125 540 50,500 170,625 30%
Sep '24 183 36 904 940 120,121 530 50,787 170,908 30%
Oct '24 184 58 904 962 120,154 510 50,962 171,116 30% D
Nov '24 185 72 904 976 120,114 500 51,212 171,326 30% E
Dec '24 186 225 904 1,129 119,920 350 51,556 171,476 30% N
Jan '25 187 180 904 1,084 119,968 390 51,917 171,885 30% N
Feb '25 188 153 904 1,057 120,026 420 52,094 172,120 30% A
Mar '25 189 119 904 1,023 120,076 450 52,219 172,295 30% L
Apr '25 190 70 904 974 120,105 500 52,437 172,542 30% P
May '25 191 40 904 944 120,024 530 52,619 172,643 30%
Jun '25 192 21 904 925 120,033 550 52,638 172,671 30%
2025/26 Jul '25 193 34 904 938 119,933 540 52,910 172,843 31%
Aug '25 194 26 904 930 119,928 540 53,309 173,237 31%
Sep '25 195 36 904 940 119,841 530 53,620 173,461 31%
Oct '25 196 58 904 962 119,813 510 53,767 173,580 31%
Nov '25 197 72 904 976 119,831 500 54,039 173,870 31%
Dec '25 198 225 904 1,129 119,868 350 54,115 173,983 31%
Jan '26 199 180 904 1,084 119,809 390 54,115 173,924 31%
Feb '26 200 153 904 1,057 119,908 420 54,177 174,085 31%
Mar '26 201 119 904 1,023 119,819 450 54,453 174,272 31%
Apr '26 202 70 904 974 119,839 500 54,706 174,545 31%
May '26 203 40 904 944 119,831 530 54,861 174,692 31%
Jun '26 204 21 904 925 119,841 550 55,166 175,007 32%
2026/27 Jul '26 205 34 904 938 119,857 540 55,607 175,464 32%
Aug '26 206 26 904 930 119,851 540 55,858 175,709 32%
Sep '26 207 36 904 940 119,878 530 55,837 175,715 32%
Oct '26 208 58 904 962 119,831 510 55,955 175,786 32%
Nov '26 209 72 904 976 119,838 500 55,767 175,605 32%
Dec '26 210 225 904 1,129 119,727 350 55,569 175,296 32%
Jan '27 211 180 904 1,084 119,319 390 55,528 174,847 32%
Feb '27 212 153 904 1,057 119,237 420 55,567 174,804 32%
Mar '27 213 119 904 1,023 119,345 450 55,257 174,602 32%
Apr '27 214 70 904 974 119,391 500 55,244 174,635 32%
May '27 215 40 904 944 119,426 530 55,119 174,545 32%
Jun '27 216 21 904 925 119,052 550 55,206 174,258 32%
2027/28 Jul '27 217 34 904 938 118,836 540 55,521 174,357 32%
Aug '27 218 26 904 930 118,429 540 55,853 174,281 32%
Sep '27 219 36 904 940 118,249 530 56,160 174,409 32%
Oct '27 220 58 904 962 118,273 510 56,616 174,889 32%
Nov '27 221 72 904 976 118,345 500 57,086 175,430 33%
Dec '27 222 225 904 1,129 118,568 350 57,369 175,937 33%
Jan '28 223 180 904 1,084 118,657 390 57,692 176,349 33%
Feb '28 224 153 904 1,057 118,791 420 58,100 176,891 33%
Mar '28 225 119 904 1,023 118,791 450 58,100 176,891 33%
Apr '28 226 70 904 974 118,791 500 58,100 176,891 33%
May '28 227 40 904 944 118,791 530 58,100 176,891 33%
Jun '28 228 21 904 925 118,791 550 58,100 176,891 33%
Notes:
DW = Diluent Water; Total DW is the sum of Stormwater & Local Runoff (SW), Imported Water from the State Water Project (MWD), and groundwater underflow.
RW = Recycled Water
RWC = 120-month running total of recycled water / 120-month running total of all diluent and recycled water.
While an RWC calculation is provided starting on the first month of RW recharge, 120 months of data may not be available until 10 years of recharge operations.
RWC maximum = 0.5 mg/L / the Running Average of Total Organic Carbon (TOC) determined from a recharge site's start-up period
Page 3 of 3

0%
5%
10%
15%
20%
25%
30%
35%
40%
45%
50%
55%44 56 68 80 92 104 116 128 140 152 164 176 188 200 212 224
0
100
200
300
400
500
600
700
800
900
1000
1100
Feb
'13
Feb
'14
Feb
'15
Feb
'16
Feb
'17
Feb
'18
Feb
'19
Feb
'20
Feb
'21
Feb
'22
Feb
'23
Feb
'24
Feb
'25
Feb
'26
Feb
'27
Feb
'28
RW
C
De
live
red
Wat
er
Vo
lum
e (
AF
/mo
nth
) RWC Management Plan - RP3 Basin
Months Since Initial Recycled Water Delivery
Historical Diluent Water Recharge
Historical Recycled Water Recharge
Forecast Stormwater Diluent Recharge
Planned Recycled Water Recharge
Groundwater Underflow
RWC Actual
RWC Projected
RWC Maximum
HISTORICAL RECHARGE PLANNED RECHARGE
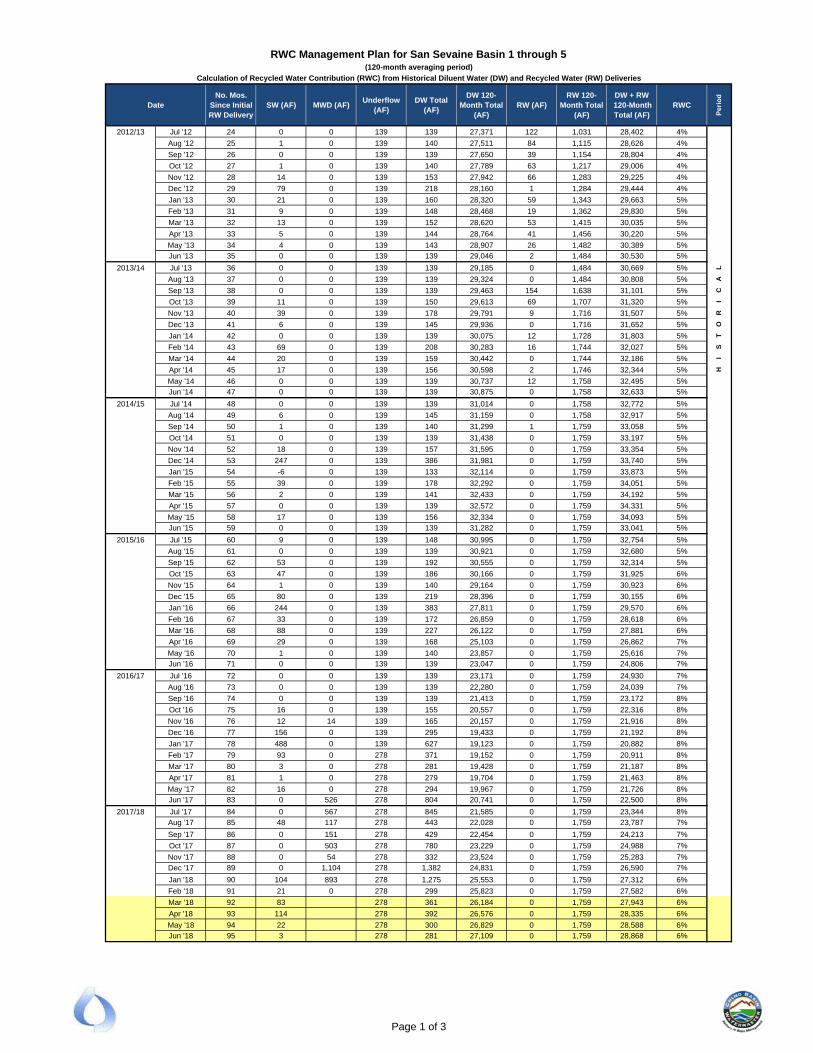
RWC Management Plan for San Sevaine Basin 1 through 5(120-month averaging period)
Calculation of Recycled Water Contribution (RWC) from Historical Diluent Water (DW) and Recycled Water (RW) Deliveries
DateNo. Mos.
Since Initial RW Delivery
SW (AF) MWD (AF)Underflow
(AF)DW Total
(AF)
DW 120-Month Total
(AF)RW (AF)
RW 120-Month Total
(AF)
DW + RW 120-Month Total (AF)
RWC
Per
iod
2012/13 Jul '12 24 0 0 139 139 27,371 122 1,031 28,402 4%
Aug '12 25 1 0 139 140 27,511 84 1,115 28,626 4%
Sep '12 26 0 0 139 139 27,650 39 1,154 28,804 4%
Oct '12 27 1 0 139 140 27,789 63 1,217 29,006 4%
Nov '12 28 14 0 139 153 27,942 66 1,283 29,225 4%
Dec '12 29 79 0 139 218 28,160 1 1,284 29,444 4%
Jan '13 30 21 0 139 160 28,320 59 1,343 29,663 5%
Feb '13 31 9 0 139 148 28,468 19 1,362 29,830 5%
Mar '13 32 13 0 139 152 28,620 53 1,415 30,035 5%
Apr '13 33 5 0 139 144 28,764 41 1,456 30,220 5%
May '13 34 4 0 139 143 28,907 26 1,482 30,389 5%
Jun '13 35 0 0 139 139 29,046 2 1,484 30,530 5%
2013/14 Jul '13 36 0 0 139 139 29,185 0 1,484 30,669 5% L
Aug '13 37 0 0 139 139 29,324 0 1,484 30,808 5% A
Sep '13 38 0 0 139 139 29,463 154 1,638 31,101 5% C
Oct '13 39 11 0 139 150 29,613 69 1,707 31,320 5% I
Nov '13 40 39 0 139 178 29,791 9 1,716 31,507 5% R
Dec '13 41 6 0 139 145 29,936 0 1,716 31,652 5% O
Jan '14 42 0 0 139 139 30,075 12 1,728 31,803 5% T
Feb '14 43 69 0 139 208 30,283 16 1,744 32,027 5% S
Mar '14 44 20 0 139 159 30,442 0 1,744 32,186 5% I
Apr '14 45 17 0 139 156 30,598 2 1,746 32,344 5% H
May '14 46 0 0 139 139 30,737 12 1,758 32,495 5%
Jun '14 47 0 0 139 139 30,875 0 1,758 32,633 5%
2014/15 Jul '14 48 0 0 139 139 31,014 0 1,758 32,772 5%
Aug '14 49 6 0 139 145 31,159 0 1,758 32,917 5%
Sep '14 50 1 0 139 140 31,299 1 1,759 33,058 5%
Oct '14 51 0 0 139 139 31,438 0 1,759 33,197 5%
Nov '14 52 18 0 139 157 31,595 0 1,759 33,354 5%
Dec '14 53 247 0 139 386 31,981 0 1,759 33,740 5%
Jan '15 54 -6 0 139 133 32,114 0 1,759 33,873 5%
Feb '15 55 39 0 139 178 32,292 0 1,759 34,051 5%
Mar '15 56 2 0 139 141 32,433 0 1,759 34,192 5%
Apr '15 57 0 0 139 139 32,572 0 1,759 34,331 5%
May '15 58 17 0 139 156 32,334 0 1,759 34,093 5%
Jun '15 59 0 0 139 139 31,282 0 1,759 33,041 5%
2015/16 Jul '15 60 9 0 139 148 30,995 0 1,759 32,754 5%
Aug '15 61 0 0 139 139 30,921 0 1,759 32,680 5%
Sep '15 62 53 0 139 192 30,555 0 1,759 32,314 5%
Oct '15 63 47 0 139 186 30,166 0 1,759 31,925 6%
Nov '15 64 1 0 139 140 29,164 0 1,759 30,923 6%
Dec '15 65 80 0 139 219 28,396 0 1,759 30,155 6%
Jan '16 66 244 0 139 383 27,811 0 1,759 29,570 6%
Feb '16 67 33 0 139 172 26,859 0 1,759 28,618 6%
Mar '16 68 88 0 139 227 26,122 0 1,759 27,881 6%
Apr '16 69 29 0 139 168 25,103 0 1,759 26,862 7%
May '16 70 1 0 139 140 23,857 0 1,759 25,616 7%
Jun '16 71 0 0 139 139 23,047 0 1,759 24,806 7%
2016/17 Jul '16 72 0 0 139 139 23,171 0 1,759 24,930 7%
Aug '16 73 0 0 139 139 22,280 0 1,759 24,039 7%
Sep '16 74 0 0 139 139 21,413 0 1,759 23,172 8%
Oct '16 75 16 0 139 155 20,557 0 1,759 22,316 8%
Nov '16 76 12 14 139 165 20,157 0 1,759 21,916 8%
Dec '16 77 156 0 139 295 19,433 0 1,759 21,192 8%
Jan '17 78 488 0 139 627 19,123 0 1,759 20,882 8%
Feb '17 79 93 0 278 371 19,152 0 1,759 20,911 8%
Mar '17 80 3 0 278 281 19,428 0 1,759 21,187 8%
Apr '17 81 1 0 278 279 19,704 0 1,759 21,463 8%
May '17 82 16 0 278 294 19,967 0 1,759 21,726 8%
Jun '17 83 0 526 278 804 20,741 0 1,759 22,500 8%
2017/18 Jul '17 84 0 567 278 845 21,585 0 1,759 23,344 8%
Aug '17 85 48 117 278 443 22,028 0 1,759 23,787 7%
Sep '17 86 0 151 278 429 22,454 0 1,759 24,213 7%
Oct '17 87 0 503 278 780 23,229 0 1,759 24,988 7%
Nov '17 88 0 54 278 332 23,524 0 1,759 25,283 7%
Dec '17 89 0 1,104 278 1,382 24,831 0 1,759 26,590 7%
Jan '18 90 104 893 278 1,275 25,553 0 1,759 27,312 6%
Feb '18 91 21 0 278 299 25,823 0 1,759 27,582 6%
Mar '18 92 83 278 361 26,184 0 1,759 27,943 6%
Apr '18 93 114 278 392 26,576 0 1,759 28,335 6%
May '18 94 22 278 300 26,829 0 1,759 28,588 6%
Jun '18 95 3 278 281 27,109 0 1,759 28,868 6%
Page 1 of 3
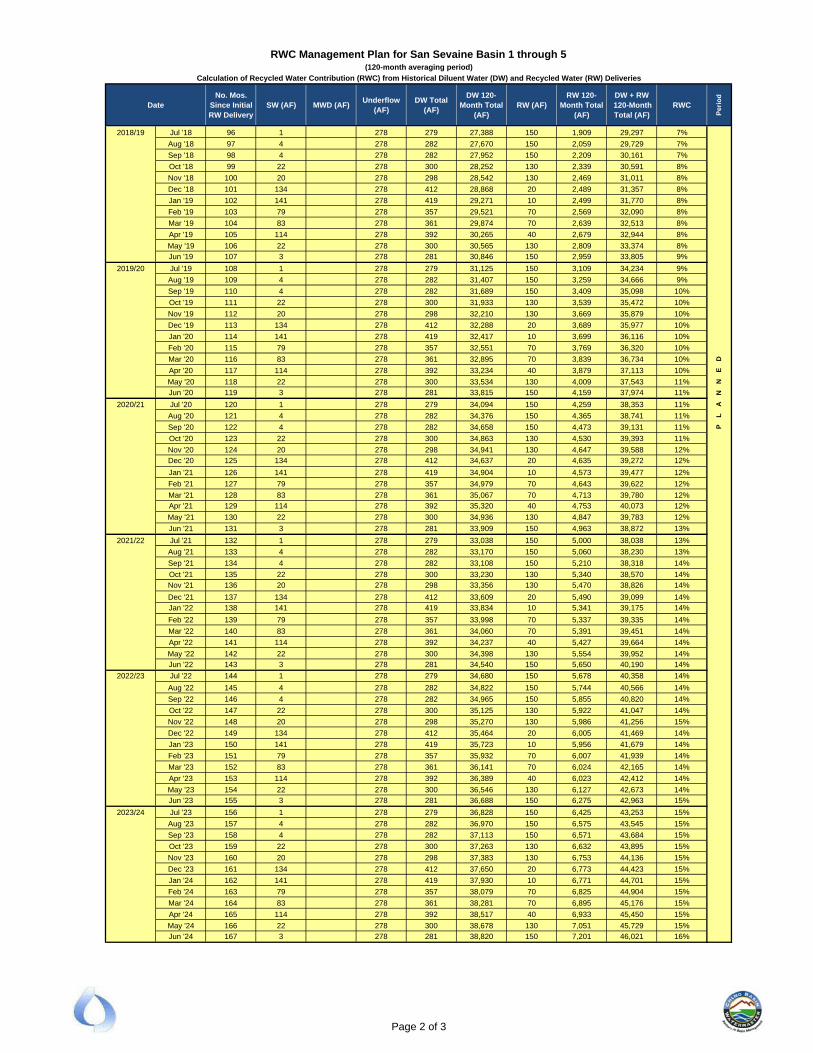
RWC Management Plan for San Sevaine Basin 1 through 5(120-month averaging period)
Calculation of Recycled Water Contribution (RWC) from Historical Diluent Water (DW) and Recycled Water (RW) Deliveries
DateNo. Mos.
Since Initial RW Delivery
SW (AF) MWD (AF)Underflow
(AF)DW Total
(AF)
DW 120-Month Total
(AF)RW (AF)
RW 120-Month Total
(AF)
DW + RW 120-Month Total (AF)
RWC
Per
iod
2018/19 Jul '18 96 1 278 279 27,388 150 1,909 29,297 7%
Aug '18 97 4 278 282 27,670 150 2,059 29,729 7%
Sep '18 98 4 278 282 27,952 150 2,209 30,161 7%
Oct '18 99 22 278 300 28,252 130 2,339 30,591 8%
Nov '18 100 20 278 298 28,542 130 2,469 31,011 8%
Dec '18 101 134 278 412 28,868 20 2,489 31,357 8%
Jan '19 102 141 278 419 29,271 10 2,499 31,770 8%
Feb '19 103 79 278 357 29,521 70 2,569 32,090 8%
Mar '19 104 83 278 361 29,874 70 2,639 32,513 8%
Apr '19 105 114 278 392 30,265 40 2,679 32,944 8%
May '19 106 22 278 300 30,565 130 2,809 33,374 8%
Jun '19 107 3 278 281 30,846 150 2,959 33,805 9%
2019/20 Jul '19 108 1 278 279 31,125 150 3,109 34,234 9%
Aug '19 109 4 278 282 31,407 150 3,259 34,666 9%
Sep '19 110 4 278 282 31,689 150 3,409 35,098 10%
Oct '19 111 22 278 300 31,933 130 3,539 35,472 10%
Nov '19 112 20 278 298 32,210 130 3,669 35,879 10%
Dec '19 113 134 278 412 32,288 20 3,689 35,977 10%
Jan '20 114 141 278 419 32,417 10 3,699 36,116 10%
Feb '20 115 79 278 357 32,551 70 3,769 36,320 10%
Mar '20 116 83 278 361 32,895 70 3,839 36,734 10% D
Apr '20 117 114 278 392 33,234 40 3,879 37,113 10% E
May '20 118 22 278 300 33,534 130 4,009 37,543 11% N
Jun '20 119 3 278 281 33,815 150 4,159 37,974 11% N
2020/21 Jul '20 120 1 278 279 34,094 150 4,259 38,353 11% A
Aug '20 121 4 278 282 34,376 150 4,365 38,741 11% L
Sep '20 122 4 278 282 34,658 150 4,473 39,131 11% P
Oct '20 123 22 278 300 34,863 130 4,530 39,393 11%
Nov '20 124 20 278 298 34,941 130 4,647 39,588 12%
Dec '20 125 134 278 412 34,637 20 4,635 39,272 12%
Jan '21 126 141 278 419 34,904 10 4,573 39,477 12%
Feb '21 127 79 278 357 34,979 70 4,643 39,622 12%
Mar '21 128 83 278 361 35,067 70 4,713 39,780 12%
Apr '21 129 114 278 392 35,320 40 4,753 40,073 12%
May '21 130 22 278 300 34,936 130 4,847 39,783 12%
Jun '21 131 3 278 281 33,909 150 4,963 38,872 13%
2021/22 Jul '21 132 1 278 279 33,038 150 5,000 38,038 13%
Aug '21 133 4 278 282 33,170 150 5,060 38,230 13%
Sep '21 134 4 278 282 33,108 150 5,210 38,318 14%
Oct '21 135 22 278 300 33,230 130 5,340 38,570 14%
Nov '21 136 20 278 298 33,356 130 5,470 38,826 14%
Dec '21 137 134 278 412 33,609 20 5,490 39,099 14%
Jan '22 138 141 278 419 33,834 10 5,341 39,175 14%
Feb '22 139 79 278 357 33,998 70 5,337 39,335 14%
Mar '22 140 83 278 361 34,060 70 5,391 39,451 14%
Apr '22 141 114 278 392 34,237 40 5,427 39,664 14%
May '22 142 22 278 300 34,398 130 5,554 39,952 14%
Jun '22 143 3 278 281 34,540 150 5,650 40,190 14%
2022/23 Jul '22 144 1 278 279 34,680 150 5,678 40,358 14%
Aug '22 145 4 278 282 34,822 150 5,744 40,566 14%
Sep '22 146 4 278 282 34,965 150 5,855 40,820 14%
Oct '22 147 22 278 300 35,125 130 5,922 41,047 14%
Nov '22 148 20 278 298 35,270 130 5,986 41,256 15%
Dec '22 149 134 278 412 35,464 20 6,005 41,469 14%
Jan '23 150 141 278 419 35,723 10 5,956 41,679 14%
Feb '23 151 79 278 357 35,932 70 6,007 41,939 14%
Mar '23 152 83 278 361 36,141 70 6,024 42,165 14%
Apr '23 153 114 278 392 36,389 40 6,023 42,412 14%
May '23 154 22 278 300 36,546 130 6,127 42,673 14%
Jun '23 155 3 278 281 36,688 150 6,275 42,963 15%
2023/24 Jul '23 156 1 278 279 36,828 150 6,425 43,253 15%
Aug '23 157 4 278 282 36,970 150 6,575 43,545 15%
Sep '23 158 4 278 282 37,113 150 6,571 43,684 15%
Oct '23 159 22 278 300 37,263 130 6,632 43,895 15%
Nov '23 160 20 278 298 37,383 130 6,753 44,136 15%
Dec '23 161 134 278 412 37,650 20 6,773 44,423 15%
Jan '24 162 141 278 419 37,930 10 6,771 44,701 15%
Feb '24 163 79 278 357 38,079 70 6,825 44,904 15%
Mar '24 164 83 278 361 38,281 70 6,895 45,176 15%
Apr '24 165 114 278 392 38,517 40 6,933 45,450 15%
May '24 166 22 278 300 38,678 130 7,051 45,729 15%
Jun '24 167 3 278 281 38,820 150 7,201 46,021 16%
Page 2 of 3
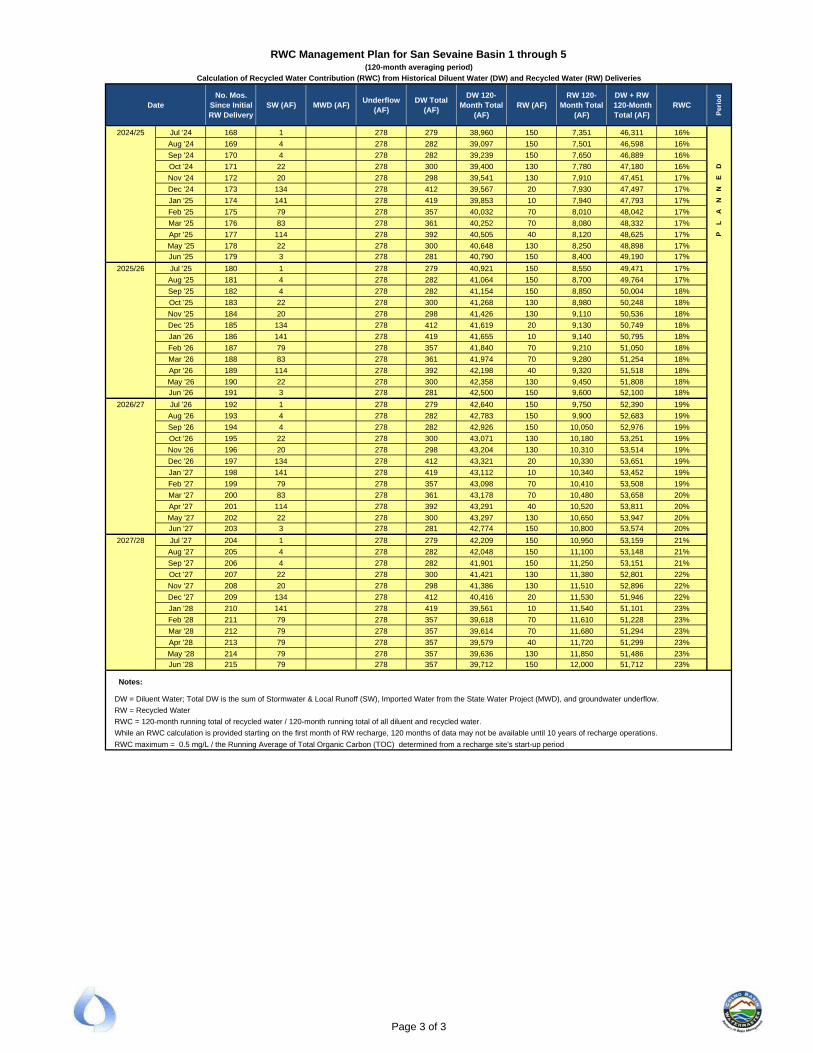
RWC Management Plan for San Sevaine Basin 1 through 5(120-month averaging period)
Calculation of Recycled Water Contribution (RWC) from Historical Diluent Water (DW) and Recycled Water (RW) Deliveries
DateNo. Mos.
Since Initial RW Delivery
SW (AF) MWD (AF)Underflow
(AF)DW Total
(AF)
DW 120-Month Total
(AF)RW (AF)
RW 120-Month Total
(AF)
DW + RW 120-Month Total (AF)
RWC
Per
iod
2024/25 Jul '24 168 1 278 279 38,960 150 7,351 46,311 16%
Aug '24 169 4 278 282 39,097 150 7,501 46,598 16%
Sep '24 170 4 278 282 39,239 150 7,650 46,889 16%
Oct '24 171 22 278 300 39,400 130 7,780 47,180 16% D
Nov '24 172 20 278 298 39,541 130 7,910 47,451 17% E
Dec '24 173 134 278 412 39,567 20 7,930 47,497 17% N
Jan '25 174 141 278 419 39,853 10 7,940 47,793 17% N
Feb '25 175 79 278 357 40,032 70 8,010 48,042 17% A
Mar '25 176 83 278 361 40,252 70 8,080 48,332 17% L
Apr '25 177 114 278 392 40,505 40 8,120 48,625 17% P
May '25 178 22 278 300 40,648 130 8,250 48,898 17%
Jun '25 179 3 278 281 40,790 150 8,400 49,190 17%
2025/26 Jul '25 180 1 278 279 40,921 150 8,550 49,471 17%
Aug '25 181 4 278 282 41,064 150 8,700 49,764 17%
Sep '25 182 4 278 282 41,154 150 8,850 50,004 18%
Oct '25 183 22 278 300 41,268 130 8,980 50,248 18%
Nov '25 184 20 278 298 41,426 130 9,110 50,536 18%
Dec '25 185 134 278 412 41,619 20 9,130 50,749 18%
Jan '26 186 141 278 419 41,655 10 9,140 50,795 18%
Feb '26 187 79 278 357 41,840 70 9,210 51,050 18%
Mar '26 188 83 278 361 41,974 70 9,280 51,254 18%
Apr '26 189 114 278 392 42,198 40 9,320 51,518 18%
May '26 190 22 278 300 42,358 130 9,450 51,808 18%
Jun '26 191 3 278 281 42,500 150 9,600 52,100 18%
2026/27 Jul '26 192 1 278 279 42,640 150 9,750 52,390 19%
Aug '26 193 4 278 282 42,783 150 9,900 52,683 19%
Sep '26 194 4 278 282 42,926 150 10,050 52,976 19%
Oct '26 195 22 278 300 43,071 130 10,180 53,251 19%
Nov '26 196 20 278 298 43,204 130 10,310 53,514 19%
Dec '26 197 134 278 412 43,321 20 10,330 53,651 19%
Jan '27 198 141 278 419 43,112 10 10,340 53,452 19%
Feb '27 199 79 278 357 43,098 70 10,410 53,508 19%
Mar '27 200 83 278 361 43,178 70 10,480 53,658 20%
Apr '27 201 114 278 392 43,291 40 10,520 53,811 20%
May '27 202 22 278 300 43,297 130 10,650 53,947 20%
Jun '27 203 3 278 281 42,774 150 10,800 53,574 20%
2027/28 Jul '27 204 1 278 279 42,209 150 10,950 53,159 21%
Aug '27 205 4 278 282 42,048 150 11,100 53,148 21%
Sep '27 206 4 278 282 41,901 150 11,250 53,151 21%
Oct '27 207 22 278 300 41,421 130 11,380 52,801 22%
Nov '27 208 20 278 298 41,386 130 11,510 52,896 22%
Dec '27 209 134 278 412 40,416 20 11,530 51,946 22%
Jan '28 210 141 278 419 39,561 10 11,540 51,101 23%
Feb '28 211 79 278 357 39,618 70 11,610 51,228 23%
Mar '28 212 79 278 357 39,614 70 11,680 51,294 23%
Apr '28 213 79 278 357 39,579 40 11,720 51,299 23%
May '28 214 79 278 357 39,636 130 11,850 51,486 23%
Jun '28 215 79 278 357 39,712 150 12,000 51,712 23%
Notes:
DW = Diluent Water; Total DW is the sum of Stormwater & Local Runoff (SW), Imported Water from the State Water Project (MWD), and groundwater underflow.
RW = Recycled Water
RWC = 120-month running total of recycled water / 120-month running total of all diluent and recycled water.
While an RWC calculation is provided starting on the first month of RW recharge, 120 months of data may not be available until 10 years of recharge operations.
RWC maximum = 0.5 mg/L / the Running Average of Total Organic Carbon (TOC) determined from a recharge site's start-up period
Page 3 of 3
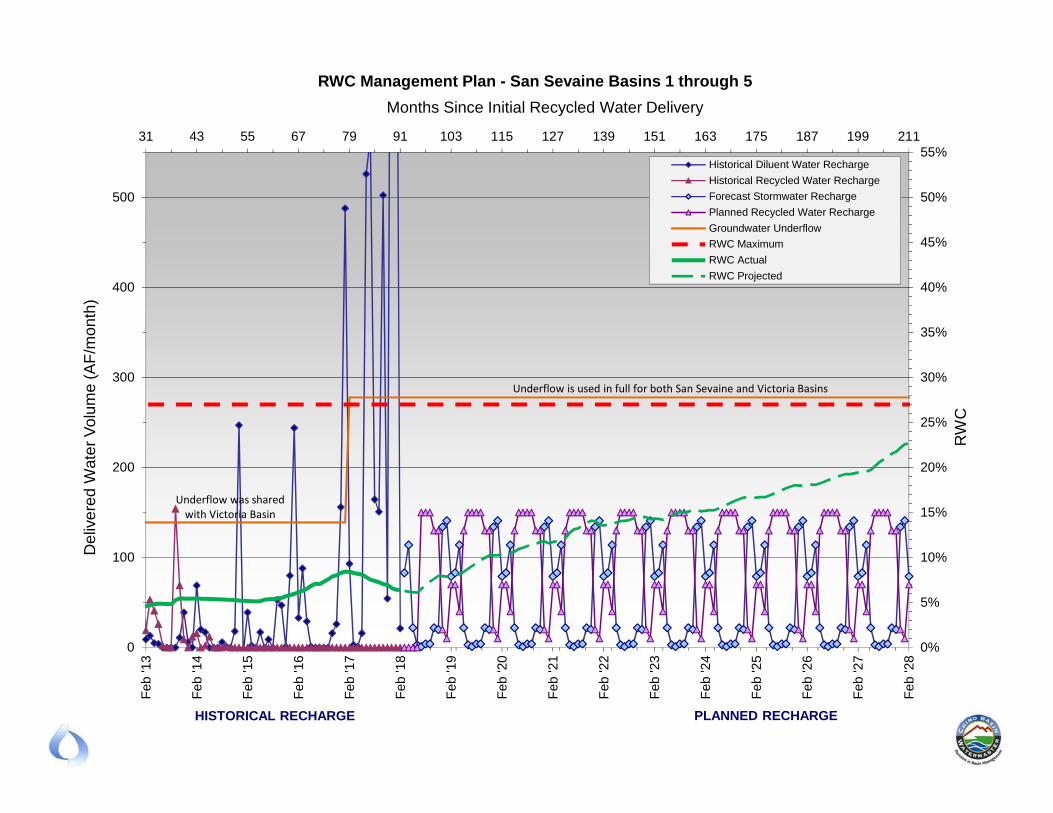
0%
5%
10%
15%
20%
25%
30%
35%
40%
45%
50%
55%31 43 55 67 79 91 103 115 127 139 151 163 175 187 199 211
0
100
200
300
400
500
Feb
'13
Feb
'14
Feb
'15
Feb
'16
Feb
'17
Feb
'18
Feb
'19
Feb
'20
Feb
'21
Feb
'22
Feb
'23
Feb
'24
Feb
'25
Feb
'26
Feb
'27
Feb
'28
RW
C
Months Since Initial Recycled Water DeliveryD
eliv
ere
d W
ate
r V
olu
me
(A
F/m
on
th)
RWC Management Plan - San Sevaine Basins 1 through 5
Historical Diluent Water Recharge
Historical Recycled Water Recharge
Forecast Stormwater Recharge
Planned Recycled Water Recharge
Groundwater Underflow
RWC Maximum
RWC Actual
RWC Projected
HISTORICAL RECHARGE PLANNED RECHARGE
Underflow was shared with Victoria Basin
Underflow is used in full for both San Sevaine and Victoria Basins
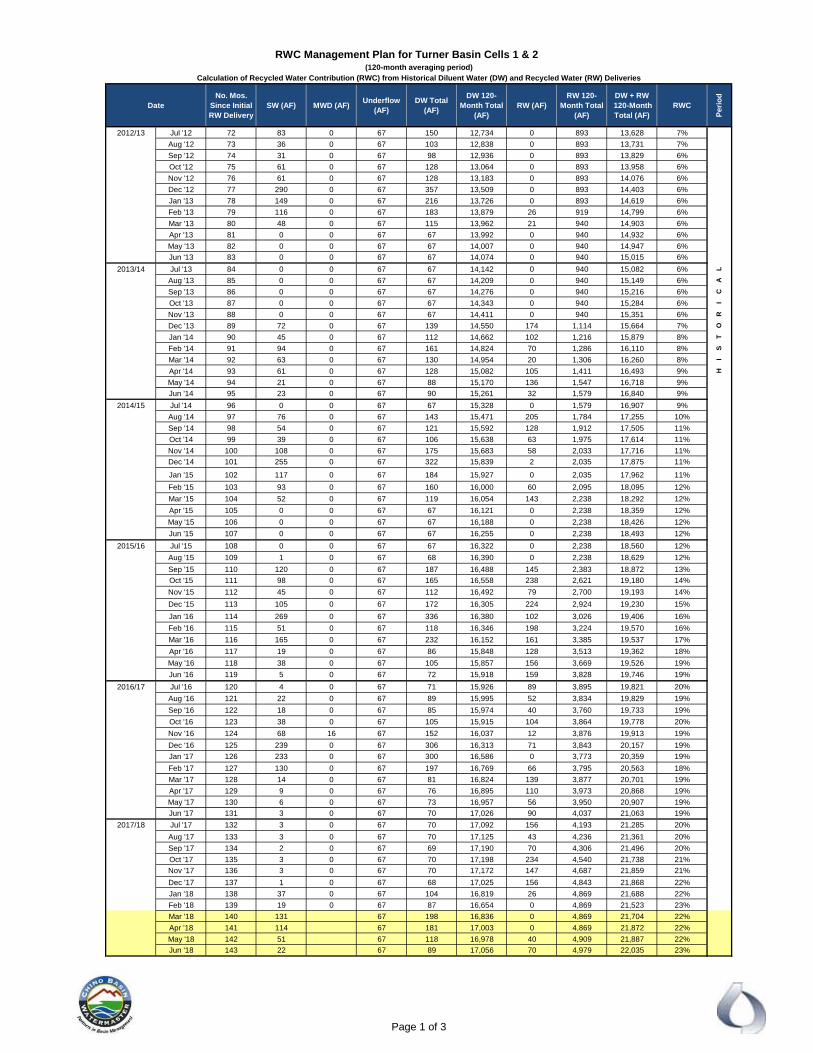
RWC Management Plan for Turner Basin Cells 1 & 2(120-month averaging period)
Calculation of Recycled Water Contribution (RWC) from Historical Diluent Water (DW) and Recycled Water (RW) Deliveries
DateNo. Mos.
Since Initial RW Delivery
SW (AF) MWD (AF)Underflow
(AF)DW Total
(AF)
DW 120-Month Total
(AF)RW (AF)
RW 120-Month Total
(AF)
DW + RW 120-Month Total (AF)
RWC
Pe
rio
d
2012/13 Jul '12 72 83 0 67 150 12,734 0 893 13,628 7%
Aug '12 73 36 0 67 103 12,838 0 893 13,731 7%
Sep '12 74 31 0 67 98 12,936 0 893 13,829 6%
Oct '12 75 61 0 67 128 13,064 0 893 13,958 6%
Nov '12 76 61 0 67 128 13,183 0 893 14,076 6%
Dec '12 77 290 0 67 357 13,509 0 893 14,403 6%
Jan '13 78 149 0 67 216 13,726 0 893 14,619 6%
Feb '13 79 116 0 67 183 13,879 26 919 14,799 6%
Mar '13 80 48 0 67 115 13,962 21 940 14,903 6%
Apr '13 81 0 0 67 67 13,992 0 940 14,932 6%
May '13 82 0 0 67 67 14,007 0 940 14,947 6%
Jun '13 83 0 0 67 67 14,074 0 940 15,015 6%
2013/14 Jul '13 84 0 0 67 67 14,142 0 940 15,082 6% L
Aug '13 85 0 0 67 67 14,209 0 940 15,149 6% A
Sep '13 86 0 0 67 67 14,276 0 940 15,216 6% C
Oct '13 87 0 0 67 67 14,343 0 940 15,284 6% I
Nov '13 88 0 0 67 67 14,411 0 940 15,351 6% R
Dec '13 89 72 0 67 139 14,550 174 1,114 15,664 7% O
Jan '14 90 45 0 67 112 14,662 102 1,216 15,879 8% T
Feb '14 91 94 0 67 161 14,824 70 1,286 16,110 8% S
Mar '14 92 63 0 67 130 14,954 20 1,306 16,260 8% I
Apr '14 93 61 0 67 128 15,082 105 1,411 16,493 9% H
May '14 94 21 0 67 88 15,170 136 1,547 16,718 9%
Jun '14 95 23 0 67 90 15,261 32 1,579 16,840 9%
2014/15 Jul '14 96 0 0 67 67 15,328 0 1,579 16,907 9%
Aug '14 97 76 0 67 143 15,471 205 1,784 17,255 10%
Sep '14 98 54 0 67 121 15,592 128 1,912 17,505 11%
Oct '14 99 39 0 67 106 15,638 63 1,975 17,614 11%
Nov '14 100 108 0 67 175 15,683 58 2,033 17,716 11%
Dec '14 101 255 0 67 322 15,839 2 2,035 17,875 11%
Jan '15 102 117 0 67 184 15,927 0 2,035 17,962 11%
Feb '15 103 93 0 67 160 16,000 60 2,095 18,095 12%
Mar '15 104 52 0 67 119 16,054 143 2,238 18,292 12%
Apr '15 105 0 0 67 67 16,121 0 2,238 18,359 12%
May '15 106 0 0 67 67 16,188 0 2,238 18,426 12%
Jun '15 107 0 0 67 67 16,255 0 2,238 18,493 12%
2015/16 Jul '15 108 0 0 67 67 16,322 0 2,238 18,560 12%
Aug '15 109 1 0 67 68 16,390 0 2,238 18,629 12%
Sep '15 110 120 0 67 187 16,488 145 2,383 18,872 13%
Oct '15 111 98 0 67 165 16,558 238 2,621 19,180 14%
Nov '15 112 45 0 67 112 16,492 79 2,700 19,193 14%
Dec '15 113 105 0 67 172 16,305 224 2,924 19,230 15%
Jan '16 114 269 0 67 336 16,380 102 3,026 19,406 16%
Feb '16 115 51 0 67 118 16,346 198 3,224 19,570 16%
Mar '16 116 165 0 67 232 16,152 161 3,385 19,537 17%
Apr '16 117 19 0 67 86 15,848 128 3,513 19,362 18%
May '16 118 38 0 67 105 15,857 156 3,669 19,526 19%
Jun '16 119 5 0 67 72 15,918 159 3,828 19,746 19%
2016/17 Jul '16 120 4 0 67 71 15,926 89 3,895 19,821 20%
Aug '16 121 22 0 67 89 15,995 52 3,834 19,829 19%
Sep '16 122 18 0 67 85 15,974 40 3,760 19,733 19%
Oct '16 123 38 0 67 105 15,915 104 3,864 19,778 20%
Nov '16 124 68 16 67 152 16,037 12 3,876 19,913 19%
Dec '16 125 239 0 67 306 16,313 71 3,843 20,157 19%
Jan '17 126 233 0 67 300 16,586 0 3,773 20,359 19%
Feb '17 127 130 0 67 197 16,769 66 3,795 20,563 18%
Mar '17 128 14 0 67 81 16,824 139 3,877 20,701 19%
Apr '17 129 9 0 67 76 16,895 110 3,973 20,868 19%
May '17 130 6 0 67 73 16,957 56 3,950 20,907 19%
Jun '17 131 3 0 67 70 17,026 90 4,037 21,063 19%
2017/18 Jul '17 132 3 0 67 70 17,092 156 4,193 21,285 20%
Aug '17 133 3 0 67 70 17,125 43 4,236 21,361 20%
Sep '17 134 2 0 67 69 17,190 70 4,306 21,496 20%
Oct '17 135 3 0 67 70 17,198 234 4,540 21,738 21%
Nov '17 136 3 0 67 70 17,172 147 4,687 21,859 21%
Dec '17 137 1 0 67 68 17,025 156 4,843 21,868 22%
Jan '18 138 37 0 67 104 16,819 26 4,869 21,688 22%
Feb '18 139 19 0 67 87 16,654 0 4,869 21,523 23%
Mar '18 140 131 67 198 16,836 0 4,869 21,704 22%
Apr '18 141 114 67 181 17,003 0 4,869 21,872 22%
May '18 142 51 67 118 16,978 40 4,909 21,887 22%
Jun '18 143 22 67 89 17,056 70 4,979 22,035 23%
Page 1 of 3
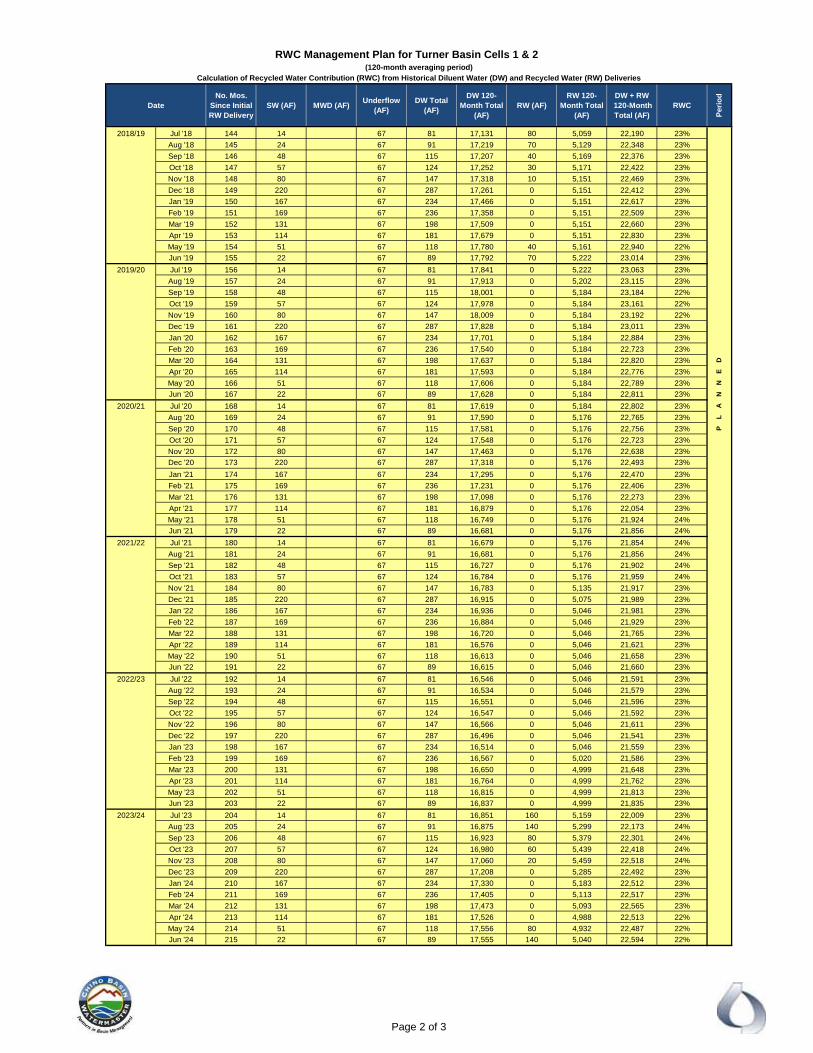
RWC Management Plan for Turner Basin Cells 1 & 2(120-month averaging period)
Calculation of Recycled Water Contribution (RWC) from Historical Diluent Water (DW) and Recycled Water (RW) Deliveries
DateNo. Mos.
Since Initial RW Delivery
SW (AF) MWD (AF)Underflow
(AF)DW Total
(AF)
DW 120-Month Total
(AF)RW (AF)
RW 120-Month Total
(AF)
DW + RW 120-Month Total (AF)
RWC
Pe
rio
d
2018/19 Jul '18 144 14 67 81 17,131 80 5,059 22,190 23%
Aug '18 145 24 67 91 17,219 70 5,129 22,348 23%
Sep '18 146 48 67 115 17,207 40 5,169 22,376 23%
Oct '18 147 57 67 124 17,252 30 5,171 22,422 23%
Nov '18 148 80 67 147 17,318 10 5,151 22,469 23%
Dec '18 149 220 67 287 17,261 0 5,151 22,412 23%
Jan '19 150 167 67 234 17,466 0 5,151 22,617 23%
Feb '19 151 169 67 236 17,358 0 5,151 22,509 23%
Mar '19 152 131 67 198 17,509 0 5,151 22,660 23%
Apr '19 153 114 67 181 17,679 0 5,151 22,830 23%
May '19 154 51 67 118 17,780 40 5,161 22,940 22%
Jun '19 155 22 67 89 17,792 70 5,222 23,014 23%
2019/20 Jul '19 156 14 67 81 17,841 0 5,222 23,063 23%
Aug '19 157 24 67 91 17,913 0 5,202 23,115 23%
Sep '19 158 48 67 115 18,001 0 5,184 23,184 22%
Oct '19 159 57 67 124 17,978 0 5,184 23,161 22%
Nov '19 160 80 67 147 18,009 0 5,184 23,192 22%
Dec '19 161 220 67 287 17,828 0 5,184 23,011 23%
Jan '20 162 167 67 234 17,701 0 5,184 22,884 23%
Feb '20 163 169 67 236 17,540 0 5,184 22,723 23%
Mar '20 164 131 67 198 17,637 0 5,184 22,820 23% D
Apr '20 165 114 67 181 17,593 0 5,184 22,776 23% E
May '20 166 51 67 118 17,606 0 5,184 22,789 23% N
Jun '20 167 22 67 89 17,628 0 5,184 22,811 23% N
2020/21 Jul '20 168 14 67 81 17,619 0 5,184 22,802 23% A
Aug '20 169 24 67 91 17,590 0 5,176 22,765 23% L
Sep '20 170 48 67 115 17,581 0 5,176 22,756 23% P
Oct '20 171 57 67 124 17,548 0 5,176 22,723 23%
Nov '20 172 80 67 147 17,463 0 5,176 22,638 23%
Dec '20 173 220 67 287 17,318 0 5,176 22,493 23%
Jan '21 174 167 67 234 17,295 0 5,176 22,470 23%
Feb '21 175 169 67 236 17,231 0 5,176 22,406 23%
Mar '21 176 131 67 198 17,098 0 5,176 22,273 23%
Apr '21 177 114 67 181 16,879 0 5,176 22,054 23%
May '21 178 51 67 118 16,749 0 5,176 21,924 24%
Jun '21 179 22 67 89 16,681 0 5,176 21,856 24%
2021/22 Jul '21 180 14 67 81 16,679 0 5,176 21,854 24%
Aug '21 181 24 67 91 16,681 0 5,176 21,856 24%
Sep '21 182 48 67 115 16,727 0 5,176 21,902 24%
Oct '21 183 57 67 124 16,784 0 5,176 21,959 24%
Nov '21 184 80 67 147 16,783 0 5,135 21,917 23%
Dec '21 185 220 67 287 16,915 0 5,075 21,989 23%
Jan '22 186 167 67 234 16,936 0 5,046 21,981 23%
Feb '22 187 169 67 236 16,884 0 5,046 21,929 23%
Mar '22 188 131 67 198 16,720 0 5,046 21,765 23%
Apr '22 189 114 67 181 16,576 0 5,046 21,621 23%
May '22 190 51 67 118 16,613 0 5,046 21,658 23%
Jun '22 191 22 67 89 16,615 0 5,046 21,660 23%
2022/23 Jul '22 192 14 67 81 16,546 0 5,046 21,591 23%
Aug '22 193 24 67 91 16,534 0 5,046 21,579 23%
Sep '22 194 48 67 115 16,551 0 5,046 21,596 23%
Oct '22 195 57 67 124 16,547 0 5,046 21,592 23%
Nov '22 196 80 67 147 16,566 0 5,046 21,611 23%
Dec '22 197 220 67 287 16,496 0 5,046 21,541 23%
Jan '23 198 167 67 234 16,514 0 5,046 21,559 23%
Feb '23 199 169 67 236 16,567 0 5,020 21,586 23%
Mar '23 200 131 67 198 16,650 0 4,999 21,648 23%
Apr '23 201 114 67 181 16,764 0 4,999 21,762 23%
May '23 202 51 67 118 16,815 0 4,999 21,813 23%
Jun '23 203 22 67 89 16,837 0 4,999 21,835 23%
2023/24 Jul '23 204 14 67 81 16,851 160 5,159 22,009 23%
Aug '23 205 24 67 91 16,875 140 5,299 22,173 24%
Sep '23 206 48 67 115 16,923 80 5,379 22,301 24%
Oct '23 207 57 67 124 16,980 60 5,439 22,418 24%
Nov '23 208 80 67 147 17,060 20 5,459 22,518 24%
Dec '23 209 220 67 287 17,208 0 5,285 22,492 23%
Jan '24 210 167 67 234 17,330 0 5,183 22,512 23%
Feb '24 211 169 67 236 17,405 0 5,113 22,517 23%
Mar '24 212 131 67 198 17,473 0 5,093 22,565 23%
Apr '24 213 114 67 181 17,526 0 4,988 22,513 22%
May '24 214 51 67 118 17,556 80 4,932 22,487 22%
Jun '24 215 22 67 89 17,555 140 5,040 22,594 22%
Page 2 of 3
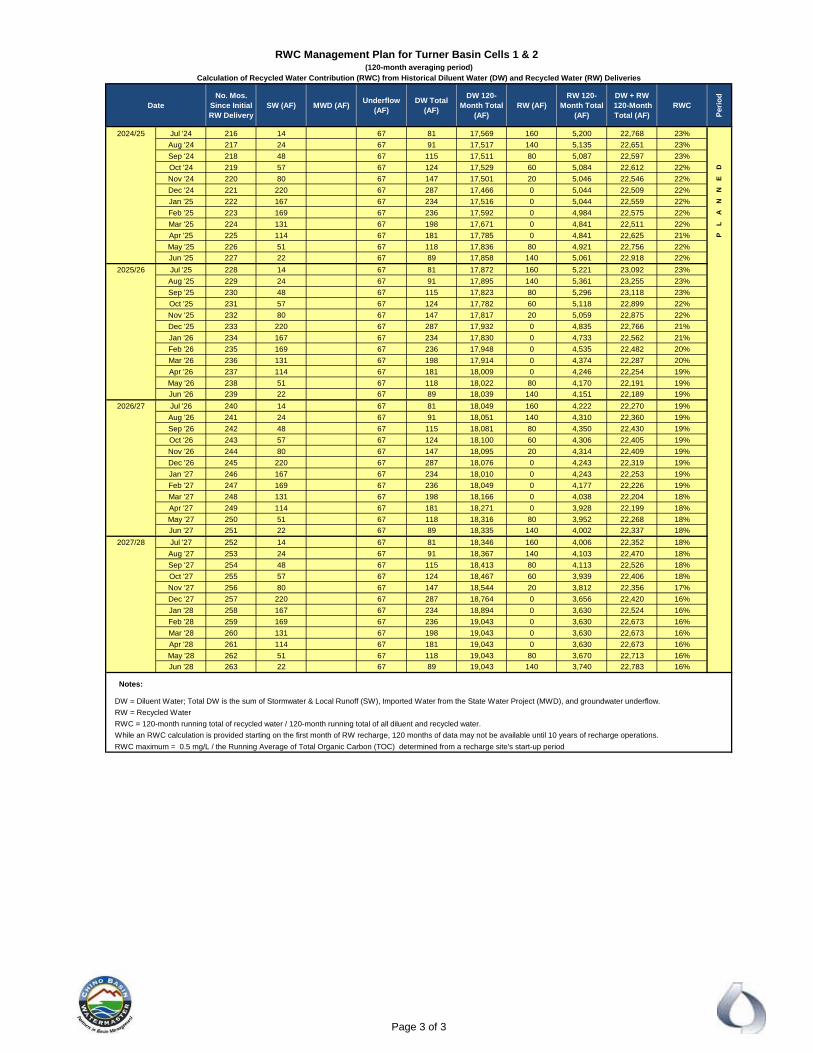
RWC Management Plan for Turner Basin Cells 1 & 2(120-month averaging period)
Calculation of Recycled Water Contribution (RWC) from Historical Diluent Water (DW) and Recycled Water (RW) Deliveries
DateNo. Mos.
Since Initial RW Delivery
SW (AF) MWD (AF)Underflow
(AF)DW Total
(AF)
DW 120-Month Total
(AF)RW (AF)
RW 120-Month Total
(AF)
DW + RW 120-Month Total (AF)
RWC
Pe
rio
d
2024/25 Jul '24 216 14 67 81 17,569 160 5,200 22,768 23%
Aug '24 217 24 67 91 17,517 140 5,135 22,651 23%
Sep '24 218 48 67 115 17,511 80 5,087 22,597 23%
Oct '24 219 57 67 124 17,529 60 5,084 22,612 22% D
Nov '24 220 80 67 147 17,501 20 5,046 22,546 22% E
Dec '24 221 220 67 287 17,466 0 5,044 22,509 22% N
Jan '25 222 167 67 234 17,516 0 5,044 22,559 22% N
Feb '25 223 169 67 236 17,592 0 4,984 22,575 22% A
Mar '25 224 131 67 198 17,671 0 4,841 22,511 22% L
Apr '25 225 114 67 181 17,785 0 4,841 22,625 21% P
May '25 226 51 67 118 17,836 80 4,921 22,756 22%
Jun '25 227 22 67 89 17,858 140 5,061 22,918 22%
2025/26 Jul '25 228 14 67 81 17,872 160 5,221 23,092 23%
Aug '25 229 24 67 91 17,895 140 5,361 23,255 23%
Sep '25 230 48 67 115 17,823 80 5,296 23,118 23%
Oct '25 231 57 67 124 17,782 60 5,118 22,899 22%
Nov '25 232 80 67 147 17,817 20 5,059 22,875 22%
Dec '25 233 220 67 287 17,932 0 4,835 22,766 21%
Jan '26 234 167 67 234 17,830 0 4,733 22,562 21%
Feb '26 235 169 67 236 17,948 0 4,535 22,482 20%
Mar '26 236 131 67 198 17,914 0 4,374 22,287 20%
Apr '26 237 114 67 181 18,009 0 4,246 22,254 19%
May '26 238 51 67 118 18,022 80 4,170 22,191 19%
Jun '26 239 22 67 89 18,039 140 4,151 22,189 19%
2026/27 Jul '26 240 14 67 81 18,049 160 4,222 22,270 19%
Aug '26 241 24 67 91 18,051 140 4,310 22,360 19%
Sep '26 242 48 67 115 18,081 80 4,350 22,430 19%
Oct '26 243 57 67 124 18,100 60 4,306 22,405 19%
Nov '26 244 80 67 147 18,095 20 4,314 22,409 19%
Dec '26 245 220 67 287 18,076 0 4,243 22,319 19%
Jan '27 246 167 67 234 18,010 0 4,243 22,253 19%
Feb '27 247 169 67 236 18,049 0 4,177 22,226 19%
Mar '27 248 131 67 198 18,166 0 4,038 22,204 18%
Apr '27 249 114 67 181 18,271 0 3,928 22,199 18%
May '27 250 51 67 118 18,316 80 3,952 22,268 18%
Jun '27 251 22 67 89 18,335 140 4,002 22,337 18%
2027/28 Jul '27 252 14 67 81 18,346 160 4,006 22,352 18%
Aug '27 253 24 67 91 18,367 140 4,103 22,470 18%
Sep '27 254 48 67 115 18,413 80 4,113 22,526 18%
Oct '27 255 57 67 124 18,467 60 3,939 22,406 18%
Nov '27 256 80 67 147 18,544 20 3,812 22,356 17%
Dec '27 257 220 67 287 18,764 0 3,656 22,420 16%
Jan '28 258 167 67 234 18,894 0 3,630 22,524 16%
Feb '28 259 169 67 236 19,043 0 3,630 22,673 16%
Mar '28 260 131 67 198 19,043 0 3,630 22,673 16%
Apr '28 261 114 67 181 19,043 0 3,630 22,673 16%
May '28 262 51 67 118 19,043 80 3,670 22,713 16%
Jun '28 263 22 67 89 19,043 140 3,740 22,783 16%
Notes:
DW = Diluent Water; Total DW is the sum of Stormwater & Local Runoff (SW), Imported Water from the State Water Project (MWD), and groundwater underflow.
RW = Recycled Water
RWC = 120-month running total of recycled water / 120-month running total of all diluent and recycled water.
While an RWC calculation is provided starting on the first month of RW recharge, 120 months of data may not be available until 10 years of recharge operations.
RWC maximum = 0.5 mg/L / the Running Average of Total Organic Carbon (TOC) determined from a recharge site's start-up period
Page 3 of 3

0%
5%
10%
15%
20%
25%
30%
35%
40%
45%
50%
55%79 91 103 115 127 139 151 163 175 187 199 211 223 235 247 259
0
100
200
300
400
500
Feb
'13
Feb
'14
Feb
'15
Feb
'16
Feb
'17
Feb
'18
Feb
'19
Feb
'20
Feb
'21
Feb
'22
Feb
'23
Feb
'24
Feb
'25
Feb
'26
Feb
'27
Feb
'28
RW
C
Months Since Initial Recycled Water Delivery
De
live
red
Wat
er
Vo
lum
e (
AF
/mo
nth
)
RWC Management Plan for Turner Basin Cells 1 & 2
Historical Diluent Water Recharge
Historical Recycled Water Recharge
Forecast Stormwater Diluent Recharge
Planned Recycled Water Recharge
Groundwater Underflow
RWC Maximum
RWC Actual
RWC Projected
HISTORICAL RECHARGE PLANNED RECHARGE
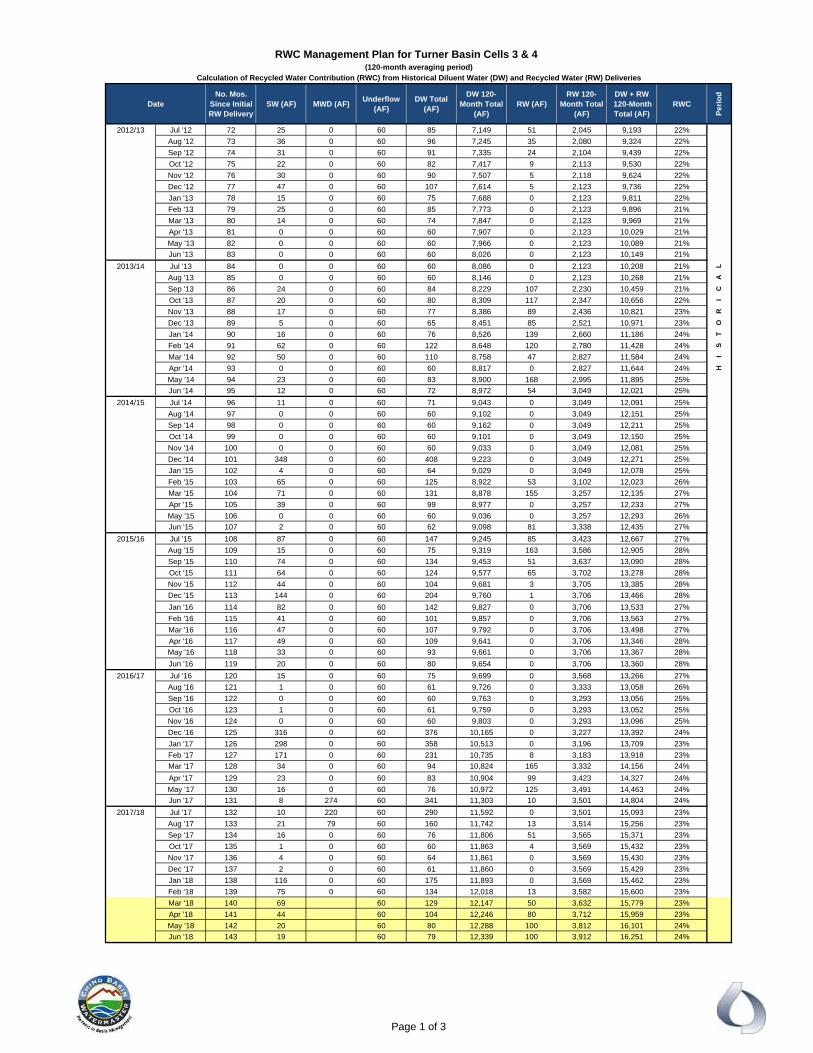
RWC Management Plan for Turner Basin Cells 3 & 4(120-month averaging period)
Calculation of Recycled Water Contribution (RWC) from Historical Diluent Water (DW) and Recycled Water (RW) Deliveries
DateNo. Mos.
Since Initial RW Delivery
SW (AF) MWD (AF)Underflow
(AF)DW Total
(AF)
DW 120-Month Total
(AF)RW (AF)
RW 120-Month Total
(AF)
DW + RW 120-Month Total (AF)
RWC
Pe
rio
d
2012/13 Jul '12 72 25 0 60 85 7,149 51 2,045 9,193 22%
Aug '12 73 36 0 60 96 7,245 35 2,080 9,324 22%
Sep '12 74 31 0 60 91 7,335 24 2,104 9,439 22%
Oct '12 75 22 0 60 82 7,417 9 2,113 9,530 22%
Nov '12 76 30 0 60 90 7,507 5 2,118 9,624 22%
Dec '12 77 47 0 60 107 7,614 5 2,123 9,736 22%
Jan '13 78 15 0 60 75 7,688 0 2,123 9,811 22%
Feb '13 79 25 0 60 85 7,773 0 2,123 9,896 21%
Mar '13 80 14 0 60 74 7,847 0 2,123 9,969 21%
Apr '13 81 0 0 60 60 7,907 0 2,123 10,029 21%
May '13 82 0 0 60 60 7,966 0 2,123 10,089 21%
Jun '13 83 0 0 60 60 8,026 0 2,123 10,149 21%
2013/14 Jul '13 84 0 0 60 60 8,086 0 2,123 10,208 21% L
Aug '13 85 0 0 60 60 8,146 0 2,123 10,268 21% A
Sep '13 86 24 0 60 84 8,229 107 2,230 10,459 21% C
Oct '13 87 20 0 60 80 8,309 117 2,347 10,656 22% I
Nov '13 88 17 0 60 77 8,386 89 2,436 10,821 23% R
Dec '13 89 5 0 60 65 8,451 85 2,521 10,971 23% O
Jan '14 90 16 0 60 76 8,526 139 2,660 11,186 24% T
Feb '14 91 62 0 60 122 8,648 120 2,780 11,428 24% S
Mar '14 92 50 0 60 110 8,758 47 2,827 11,584 24% I
Apr '14 93 0 0 60 60 8,817 0 2,827 11,644 24% H
May '14 94 23 0 60 83 8,900 168 2,995 11,895 25%
Jun '14 95 12 0 60 72 8,972 54 3,049 12,021 25%
2014/15 Jul '14 96 11 0 60 71 9,043 0 3,049 12,091 25%
Aug '14 97 0 0 60 60 9,102 0 3,049 12,151 25%
Sep '14 98 0 0 60 60 9,162 0 3,049 12,211 25%
Oct '14 99 0 0 60 60 9,101 0 3,049 12,150 25%
Nov '14 100 0 0 60 60 9,033 0 3,049 12,081 25%
Dec '14 101 348 0 60 408 9,223 0 3,049 12,271 25%
Jan '15 102 4 0 60 64 9,029 0 3,049 12,078 25%
Feb '15 103 65 0 60 125 8,922 53 3,102 12,023 26%
Mar '15 104 71 0 60 131 8,878 155 3,257 12,135 27%
Apr '15 105 39 0 60 99 8,977 0 3,257 12,233 27%
May '15 106 0 0 60 60 9,036 0 3,257 12,293 26%
Jun '15 107 2 0 60 62 9,098 81 3,338 12,435 27%
2015/16 Jul '15 108 87 0 60 147 9,245 85 3,423 12,667 27%
Aug '15 109 15 0 60 75 9,319 163 3,586 12,905 28%
Sep '15 110 74 0 60 134 9,453 51 3,637 13,090 28%
Oct '15 111 64 0 60 124 9,577 65 3,702 13,278 28%
Nov '15 112 44 0 60 104 9,681 3 3,705 13,385 28%
Dec '15 113 144 0 60 204 9,760 1 3,706 13,466 28%
Jan '16 114 82 0 60 142 9,827 0 3,706 13,533 27%
Feb '16 115 41 0 60 101 9,857 0 3,706 13,563 27%
Mar '16 116 47 0 60 107 9,792 0 3,706 13,498 27%
Apr '16 117 49 0 60 109 9,641 0 3,706 13,346 28%
May '16 118 33 0 60 93 9,661 0 3,706 13,367 28%
Jun '16 119 20 0 60 80 9,654 0 3,706 13,360 28%
2016/17 Jul '16 120 15 0 60 75 9,699 0 3,568 13,266 27%
Aug '16 121 1 0 60 61 9,726 0 3,333 13,058 26%
Sep '16 122 0 0 60 60 9,763 0 3,293 13,056 25%
Oct '16 123 1 0 60 61 9,759 0 3,293 13,052 25%
Nov '16 124 0 0 60 60 9,803 0 3,293 13,096 25%
Dec '16 125 316 0 60 376 10,165 0 3,227 13,392 24%
Jan '17 126 298 0 60 358 10,513 0 3,196 13,709 23%
Feb '17 127 171 0 60 231 10,735 8 3,183 13,918 23%
Mar '17 128 34 0 60 94 10,824 165 3,332 14,156 24%
Apr '17 129 23 0 60 83 10,904 99 3,423 14,327 24%
May '17 130 16 0 60 76 10,972 125 3,491 14,463 24%
Jun '17 131 8 274 60 341 11,303 10 3,501 14,804 24%
2017/18 Jul '17 132 10 220 60 290 11,592 0 3,501 15,093 23%
Aug '17 133 21 79 60 160 11,742 13 3,514 15,256 23%
Sep '17 134 16 0 60 76 11,806 51 3,565 15,371 23%
Oct '17 135 1 0 60 60 11,863 4 3,569 15,432 23%
Nov '17 136 4 0 60 64 11,861 0 3,569 15,430 23%
Dec '17 137 2 0 60 61 11,860 0 3,569 15,429 23%
Jan '18 138 116 0 60 175 11,893 0 3,569 15,462 23%
Feb '18 139 75 0 60 134 12,018 13 3,582 15,600 23%
Mar '18 140 69 60 129 12,147 50 3,632 15,779 23%
Apr '18 141 44 60 104 12,246 80 3,712 15,959 23%
May '18 142 20 60 80 12,288 100 3,812 16,101 24%
Jun '18 143 19 60 79 12,339 100 3,912 16,251 24%
Page 1 of 3
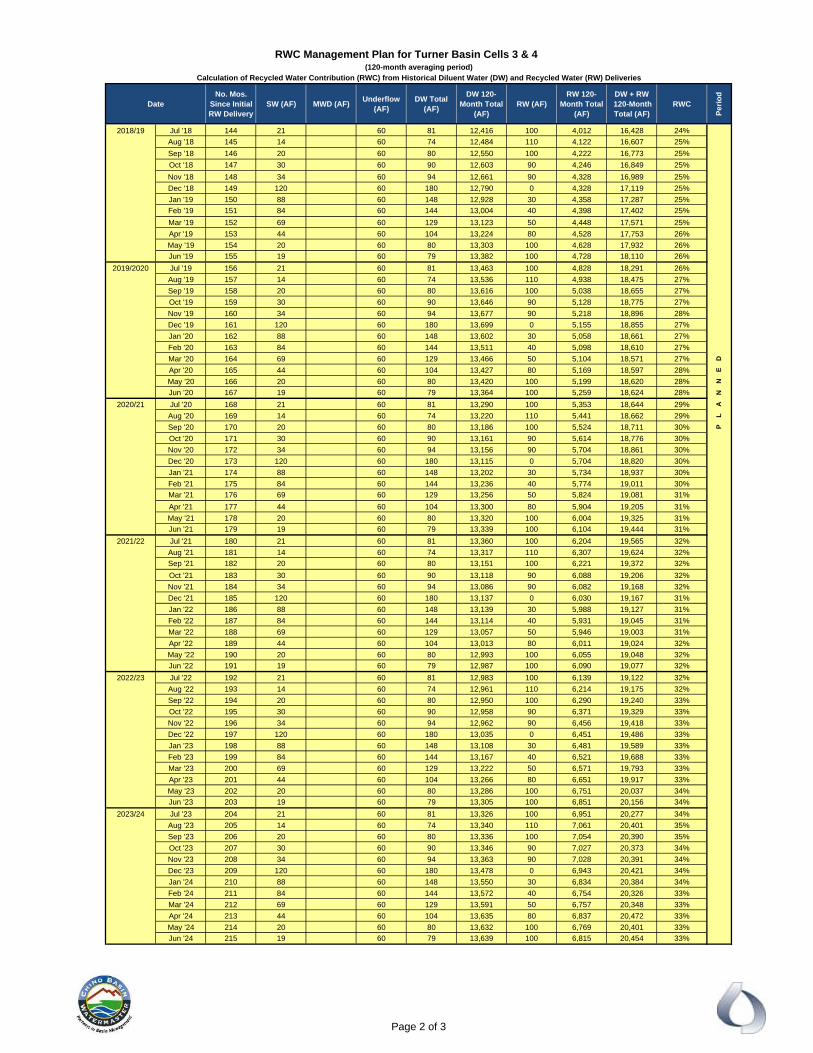
RWC Management Plan for Turner Basin Cells 3 & 4(120-month averaging period)
Calculation of Recycled Water Contribution (RWC) from Historical Diluent Water (DW) and Recycled Water (RW) Deliveries
DateNo. Mos.
Since Initial RW Delivery
SW (AF) MWD (AF)Underflow
(AF)DW Total
(AF)
DW 120-Month Total
(AF)RW (AF)
RW 120-Month Total
(AF)
DW + RW 120-Month Total (AF)
RWC
Pe
rio
d
2018/19 Jul '18 144 21 60 81 12,416 100 4,012 16,428 24%
Aug '18 145 14 60 74 12,484 110 4,122 16,607 25%
Sep '18 146 20 60 80 12,550 100 4,222 16,773 25%
Oct '18 147 30 60 90 12,603 90 4,246 16,849 25%
Nov '18 148 34 60 94 12,661 90 4,328 16,989 25%
Dec '18 149 120 60 180 12,790 0 4,328 17,119 25%
Jan '19 150 88 60 148 12,928 30 4,358 17,287 25%
Feb '19 151 84 60 144 13,004 40 4,398 17,402 25%
Mar '19 152 69 60 129 13,123 50 4,448 17,571 25%
Apr '19 153 44 60 104 13,224 80 4,528 17,753 26%
May '19 154 20 60 80 13,303 100 4,628 17,932 26%
Jun '19 155 19 60 79 13,382 100 4,728 18,110 26%
2019/2020 Jul '19 156 21 60 81 13,463 100 4,828 18,291 26%
Aug '19 157 14 60 74 13,536 110 4,938 18,475 27%
Sep '19 158 20 60 80 13,616 100 5,038 18,655 27%
Oct '19 159 30 60 90 13,646 90 5,128 18,775 27%
Nov '19 160 34 60 94 13,677 90 5,218 18,896 28%
Dec '19 161 120 60 180 13,699 0 5,155 18,855 27%
Jan '20 162 88 60 148 13,602 30 5,058 18,661 27%
Feb '20 163 84 60 144 13,511 40 5,098 18,610 27%
Mar '20 164 69 60 129 13,466 50 5,104 18,571 27% D
Apr '20 165 44 60 104 13,427 80 5,169 18,597 28% E
May '20 166 20 60 80 13,420 100 5,199 18,620 28% N
Jun '20 167 19 60 79 13,364 100 5,259 18,624 28% N
2020/21 Jul '20 168 21 60 81 13,290 100 5,353 18,644 29% A
Aug '20 169 14 60 74 13,220 110 5,441 18,662 29% L
Sep '20 170 20 60 80 13,186 100 5,524 18,711 30% P
Oct '20 171 30 60 90 13,161 90 5,614 18,776 30%
Nov '20 172 34 60 94 13,156 90 5,704 18,861 30%
Dec '20 173 120 60 180 13,115 0 5,704 18,820 30%
Jan '21 174 88 60 148 13,202 30 5,734 18,937 30%
Feb '21 175 84 60 144 13,236 40 5,774 19,011 30%
Mar '21 176 69 60 129 13,256 50 5,824 19,081 31%
Apr '21 177 44 60 104 13,300 80 5,904 19,205 31%
May '21 178 20 60 80 13,320 100 6,004 19,325 31%
Jun '21 179 19 60 79 13,339 100 6,104 19,444 31%
2021/22 Jul '21 180 21 60 81 13,360 100 6,204 19,565 32%
Aug '21 181 14 60 74 13,317 110 6,307 19,624 32%
Sep '21 182 20 60 80 13,151 100 6,221 19,372 32%
Oct '21 183 30 60 90 13,118 90 6,088 19,206 32%
Nov '21 184 34 60 94 13,086 90 6,082 19,168 32%
Dec '21 185 120 60 180 13,137 0 6,030 19,167 31%
Jan '22 186 88 60 148 13,139 30 5,988 19,127 31%
Feb '22 187 84 60 144 13,114 40 5,931 19,045 31%
Mar '22 188 69 60 129 13,057 50 5,946 19,003 31%
Apr '22 189 44 60 104 13,013 80 6,011 19,024 32%
May '22 190 20 60 80 12,993 100 6,055 19,048 32%
Jun '22 191 19 60 79 12,987 100 6,090 19,077 32%
2022/23 Jul '22 192 21 60 81 12,983 100 6,139 19,122 32%
Aug '22 193 14 60 74 12,961 110 6,214 19,175 32%
Sep '22 194 20 60 80 12,950 100 6,290 19,240 33%
Oct '22 195 30 60 90 12,958 90 6,371 19,329 33%
Nov '22 196 34 60 94 12,962 90 6,456 19,418 33%
Dec '22 197 120 60 180 13,035 0 6,451 19,486 33%
Jan '23 198 88 60 148 13,108 30 6,481 19,589 33%
Feb '23 199 84 60 144 13,167 40 6,521 19,688 33%
Mar '23 200 69 60 129 13,222 50 6,571 19,793 33%
Apr '23 201 44 60 104 13,266 80 6,651 19,917 33%
May '23 202 20 60 80 13,286 100 6,751 20,037 34%
Jun '23 203 19 60 79 13,305 100 6,851 20,156 34%
2023/24 Jul '23 204 21 60 81 13,326 100 6,951 20,277 34%
Aug '23 205 14 60 74 13,340 110 7,061 20,401 35%
Sep '23 206 20 60 80 13,336 100 7,054 20,390 35%
Oct '23 207 30 60 90 13,346 90 7,027 20,373 34%
Nov '23 208 34 60 94 13,363 90 7,028 20,391 34%
Dec '23 209 120 60 180 13,478 0 6,943 20,421 34%
Jan '24 210 88 60 148 13,550 30 6,834 20,384 34%
Feb '24 211 84 60 144 13,572 40 6,754 20,326 33%
Mar '24 212 69 60 129 13,591 50 6,757 20,348 33%
Apr '24 213 44 60 104 13,635 80 6,837 20,472 33%
May '24 214 20 60 80 13,632 100 6,769 20,401 33%
Jun '24 215 19 60 79 13,639 100 6,815 20,454 33%
Page 2 of 3
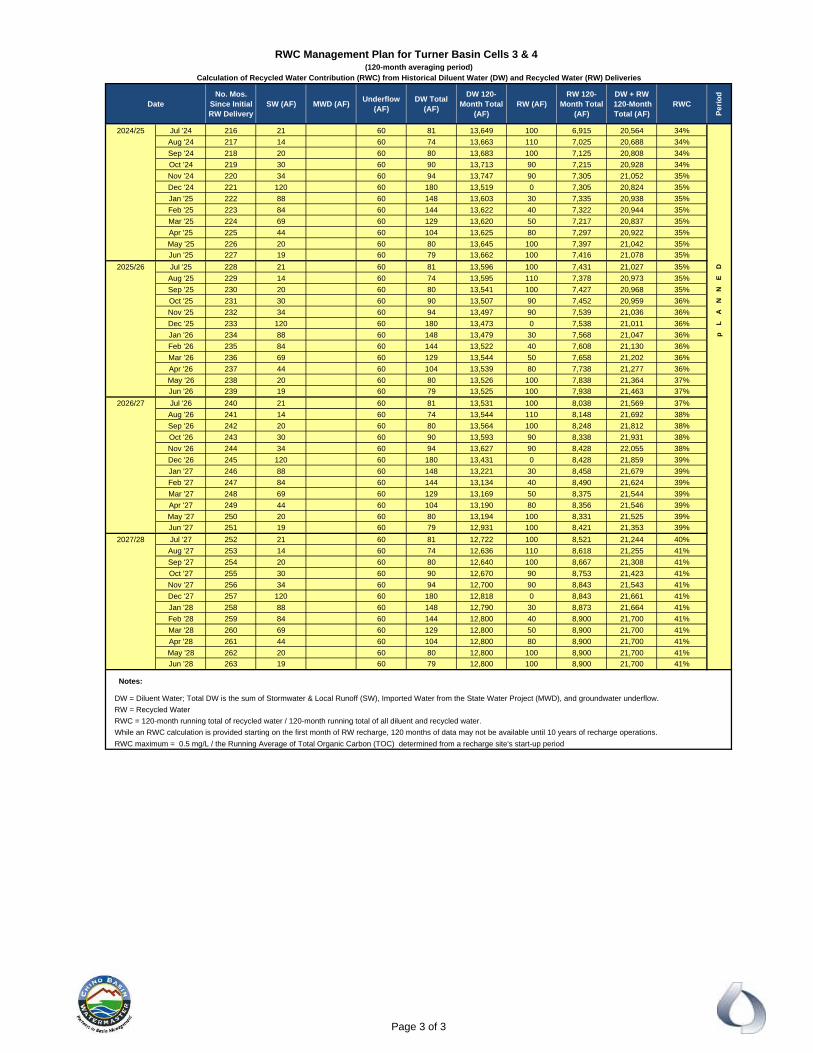
RWC Management Plan for Turner Basin Cells 3 & 4(120-month averaging period)
Calculation of Recycled Water Contribution (RWC) from Historical Diluent Water (DW) and Recycled Water (RW) Deliveries
DateNo. Mos.
Since Initial RW Delivery
SW (AF) MWD (AF)Underflow
(AF)DW Total
(AF)
DW 120-Month Total
(AF)RW (AF)
RW 120-Month Total
(AF)
DW + RW 120-Month Total (AF)
RWC
Pe
rio
d
2024/25 Jul '24 216 21 60 81 13,649 100 6,915 20,564 34%
Aug '24 217 14 60 74 13,663 110 7,025 20,688 34%
Sep '24 218 20 60 80 13,683 100 7,125 20,808 34%
Oct '24 219 30 60 90 13,713 90 7,215 20,928 34%
Nov '24 220 34 60 94 13,747 90 7,305 21,052 35%
Dec '24 221 120 60 180 13,519 0 7,305 20,824 35%
Jan '25 222 88 60 148 13,603 30 7,335 20,938 35%
Feb '25 223 84 60 144 13,622 40 7,322 20,944 35%
Mar '25 224 69 60 129 13,620 50 7,217 20,837 35%
Apr '25 225 44 60 104 13,625 80 7,297 20,922 35%
May '25 226 20 60 80 13,645 100 7,397 21,042 35%
Jun '25 227 19 60 79 13,662 100 7,416 21,078 35%
2025/26 Jul '25 228 21 60 81 13,596 100 7,431 21,027 35% D
Aug '25 229 14 60 74 13,595 110 7,378 20,973 35% E
Sep '25 230 20 60 80 13,541 100 7,427 20,968 35% N
Oct '25 231 30 60 90 13,507 90 7,452 20,959 36% N
Nov '25 232 34 60 94 13,497 90 7,539 21,036 36% A
Dec '25 233 120 60 180 13,473 0 7,538 21,011 36% L
Jan '26 234 88 60 148 13,479 30 7,568 21,047 36% p
Feb '26 235 84 60 144 13,522 40 7,608 21,130 36%
Mar '26 236 69 60 129 13,544 50 7,658 21,202 36%
Apr '26 237 44 60 104 13,539 80 7,738 21,277 36%
May '26 238 20 60 80 13,526 100 7,838 21,364 37%
Jun '26 239 19 60 79 13,525 100 7,938 21,463 37%
2026/27 Jul '26 240 21 60 81 13,531 100 8,038 21,569 37%
Aug '26 241 14 60 74 13,544 110 8,148 21,692 38%
Sep '26 242 20 60 80 13,564 100 8,248 21,812 38%
Oct '26 243 30 60 90 13,593 90 8,338 21,931 38%
Nov '26 244 34 60 94 13,627 90 8,428 22,055 38%
Dec '26 245 120 60 180 13,431 0 8,428 21,859 39%
Jan '27 246 88 60 148 13,221 30 8,458 21,679 39%
Feb '27 247 84 60 144 13,134 40 8,490 21,624 39%
Mar '27 248 69 60 129 13,169 50 8,375 21,544 39%
Apr '27 249 44 60 104 13,190 80 8,356 21,546 39%
May '27 250 20 60 80 13,194 100 8,331 21,525 39%
Jun '27 251 19 60 79 12,931 100 8,421 21,353 39%
2027/28 Jul '27 252 21 60 81 12,722 100 8,521 21,244 40%
Aug '27 253 14 60 74 12,636 110 8,618 21,255 41%
Sep '27 254 20 60 80 12,640 100 8,667 21,308 41%
Oct '27 255 30 60 90 12,670 90 8,753 21,423 41%
Nov '27 256 34 60 94 12,700 90 8,843 21,543 41%
Dec '27 257 120 60 180 12,818 0 8,843 21,661 41%
Jan '28 258 88 60 148 12,790 30 8,873 21,664 41%
Feb '28 259 84 60 144 12,800 40 8,900 21,700 41%
Mar '28 260 69 60 129 12,800 50 8,900 21,700 41%
Apr '28 261 44 60 104 12,800 80 8,900 21,700 41%
May '28 262 20 60 80 12,800 100 8,900 21,700 41%
Jun '28 263 19 60 79 12,800 100 8,900 21,700 41%
Notes:
DW = Diluent Water; Total DW is the sum of Stormwater & Local Runoff (SW), Imported Water from the State Water Project (MWD), and groundwater underflow.
RW = Recycled Water
RWC = 120-month running total of recycled water / 120-month running total of all diluent and recycled water.
While an RWC calculation is provided starting on the first month of RW recharge, 120 months of data may not be available until 10 years of recharge operations.
RWC maximum = 0.5 mg/L / the Running Average of Total Organic Carbon (TOC) determined from a recharge site's start-up period
Page 3 of 3
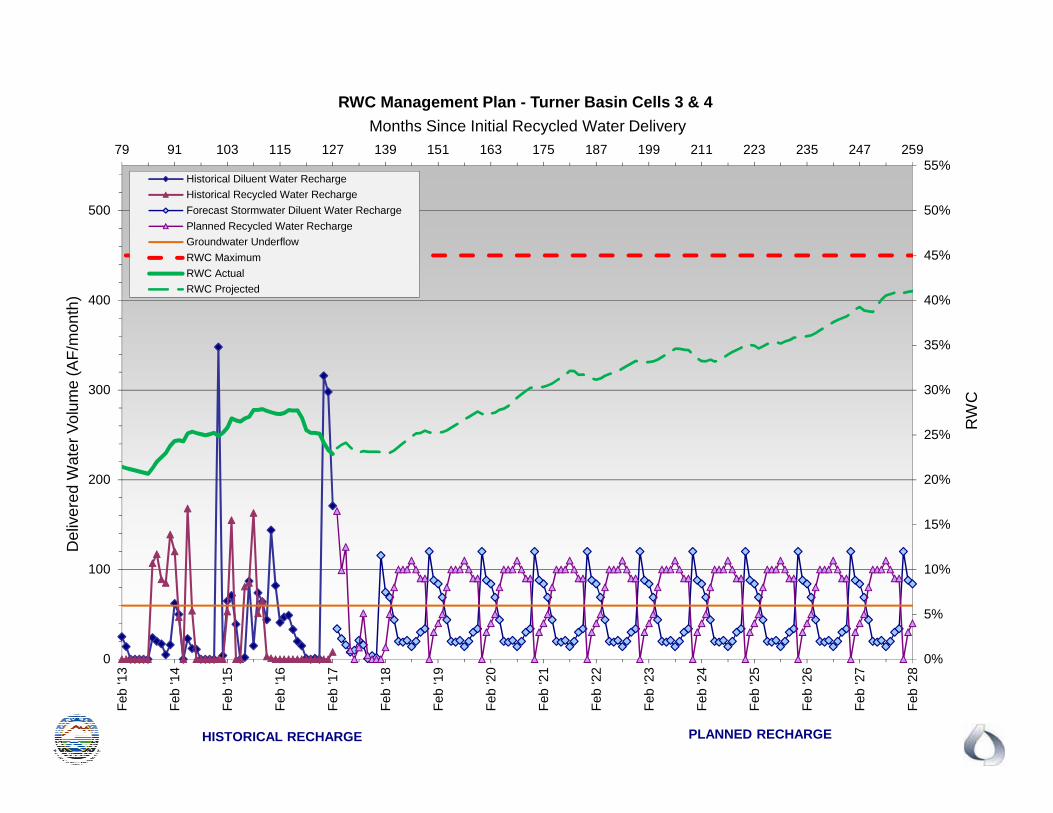
0%
5%
10%
15%
20%
25%
30%
35%
40%
45%
50%
55%79 91 103 115 127 139 151 163 175 187 199 211 223 235 247 259
0
100
200
300
400
500
Feb
'13
Feb
'14
Feb
'15
Feb
'16
Feb
'17
Feb
'18
Feb
'19
Feb
'20
Feb
'21
Feb
'22
Feb
'23
Feb
'24
Feb
'25
Feb
'26
Feb
'27
Feb
'28
RW
C
Months Since Initial Recycled Water Delivery
De
live
red
Wat
er
Vo
lum
e (
AF
/mo
nth
)
RWC Management Plan - Turner Basin Cells 3 & 4
Historical Diluent Water Recharge
Historical Recycled Water Recharge
Forecast Stormwater Diluent Water Recharge
Planned Recycled Water Recharge
Groundwater Underflow
RWC Maximum
RWC Actual
RWC Projected
HISTORICAL RECHARGE PLANNED RECHARGE
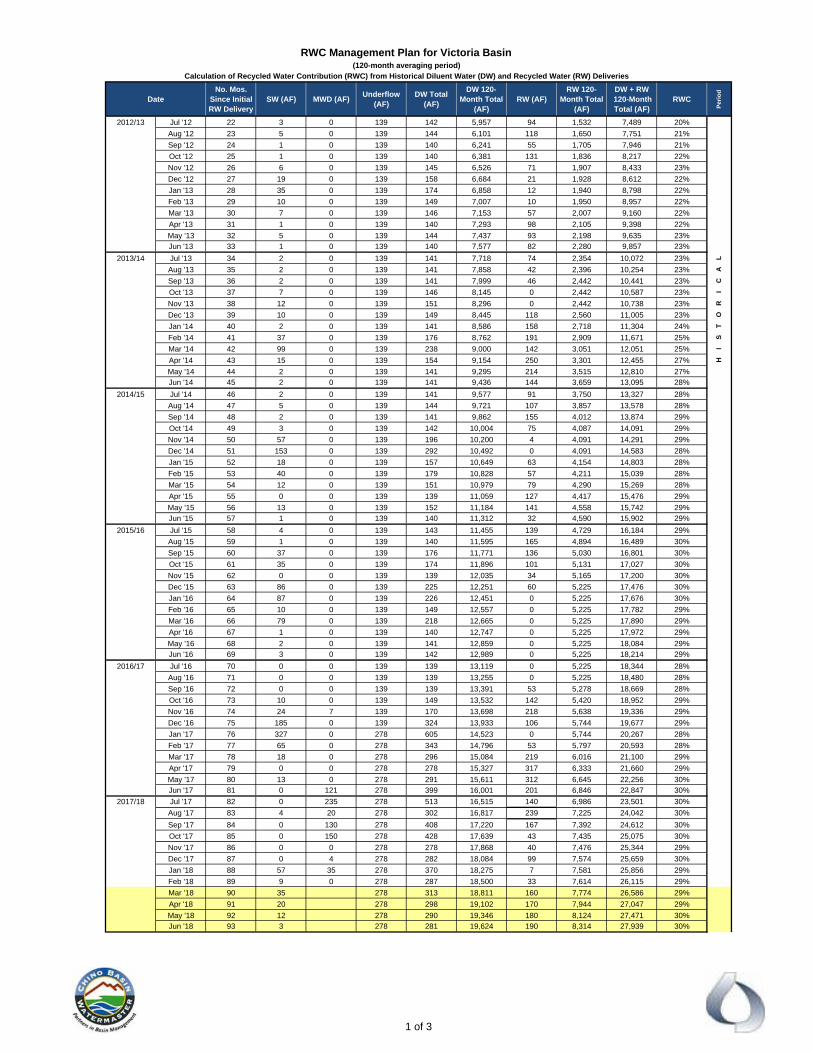
RWC Management Plan for Victoria Basin(120-month averaging period)
Calculation of Recycled Water Contribution (RWC) from Historical Diluent Water (DW) and Recycled Water (RW) Deliveries
DateNo. Mos.
Since Initial RW Delivery
SW (AF) MWD (AF)Underflow
(AF)DW Total
(AF)
DW 120-Month Total
(AF)RW (AF)
RW 120-Month Total
(AF)
DW + RW 120-Month Total (AF)
RWC
Per
iod
2012/13 Jul '12 22 3 0 139 142 5,957 94 1,532 7,489 20%
Aug '12 23 5 0 139 144 6,101 118 1,650 7,751 21%
Sep '12 24 1 0 139 140 6,241 55 1,705 7,946 21%
Oct '12 25 1 0 139 140 6,381 131 1,836 8,217 22%
Nov '12 26 6 0 139 145 6,526 71 1,907 8,433 23%
Dec '12 27 19 0 139 158 6,684 21 1,928 8,612 22%
Jan '13 28 35 0 139 174 6,858 12 1,940 8,798 22%
Feb '13 29 10 0 139 149 7,007 10 1,950 8,957 22%
Mar '13 30 7 0 139 146 7,153 57 2,007 9,160 22%
Apr '13 31 1 0 139 140 7,293 98 2,105 9,398 22%
May '13 32 5 0 139 144 7,437 93 2,198 9,635 23%
Jun '13 33 1 0 139 140 7,577 82 2,280 9,857 23%
2013/14 Jul '13 34 2 0 139 141 7,718 74 2,354 10,072 23% L
Aug '13 35 2 0 139 141 7,858 42 2,396 10,254 23% A
Sep '13 36 2 0 139 141 7,999 46 2,442 10,441 23% C
Oct '13 37 7 0 139 146 8,145 0 2,442 10,587 23% I
Nov '13 38 12 0 139 151 8,296 0 2,442 10,738 23% R
Dec '13 39 10 0 139 149 8,445 118 2,560 11,005 23% O
Jan '14 40 2 0 139 141 8,586 158 2,718 11,304 24% T
Feb '14 41 37 0 139 176 8,762 191 2,909 11,671 25% S
Mar '14 42 99 0 139 238 9,000 142 3,051 12,051 25% I
Apr '14 43 15 0 139 154 9,154 250 3,301 12,455 27% H
May '14 44 2 0 139 141 9,295 214 3,515 12,810 27%
Jun '14 45 2 0 139 141 9,436 144 3,659 13,095 28%
2014/15 Jul '14 46 2 0 139 141 9,577 91 3,750 13,327 28%
Aug '14 47 5 0 139 144 9,721 107 3,857 13,578 28%
Sep '14 48 2 0 139 141 9,862 155 4,012 13,874 29%
Oct '14 49 3 0 139 142 10,004 75 4,087 14,091 29%
Nov '14 50 57 0 139 196 10,200 4 4,091 14,291 29%
Dec '14 51 153 0 139 292 10,492 0 4,091 14,583 28%
Jan '15 52 18 0 139 157 10,649 63 4,154 14,803 28%
Feb '15 53 40 0 139 179 10,828 57 4,211 15,039 28%
Mar '15 54 12 0 139 151 10,979 79 4,290 15,269 28%
Apr '15 55 0 0 139 139 11,059 127 4,417 15,476 29%
May '15 56 13 0 139 152 11,184 141 4,558 15,742 29%
Jun '15 57 1 0 139 140 11,312 32 4,590 15,902 29%
2015/16 Jul '15 58 4 0 139 143 11,455 139 4,729 16,184 29%
Aug '15 59 1 0 139 140 11,595 165 4,894 16,489 30%
Sep '15 60 37 0 139 176 11,771 136 5,030 16,801 30%
Oct '15 61 35 0 139 174 11,896 101 5,131 17,027 30%
Nov '15 62 0 0 139 139 12,035 34 5,165 17,200 30%
Dec '15 63 86 0 139 225 12,251 60 5,225 17,476 30%
Jan '16 64 87 0 139 226 12,451 0 5,225 17,676 30%
Feb '16 65 10 0 139 149 12,557 0 5,225 17,782 29%
Mar '16 66 79 0 139 218 12,665 0 5,225 17,890 29%
Apr '16 67 1 0 139 140 12,747 0 5,225 17,972 29%
May '16 68 2 0 139 141 12,859 0 5,225 18,084 29%
Jun '16 69 3 0 139 142 12,989 0 5,225 18,214 29%
2016/17 Jul '16 70 0 0 139 139 13,119 0 5,225 18,344 28%
Aug '16 71 0 0 139 139 13,255 0 5,225 18,480 28%
Sep '16 72 0 0 139 139 13,391 53 5,278 18,669 28%
Oct '16 73 10 0 139 149 13,532 142 5,420 18,952 29%
Nov '16 74 24 7 139 170 13,698 218 5,638 19,336 29%
Dec '16 75 185 0 139 324 13,933 106 5,744 19,677 29%
Jan '17 76 327 0 278 605 14,523 0 5,744 20,267 28%
Feb '17 77 65 0 278 343 14,796 53 5,797 20,593 28%
Mar '17 78 18 0 278 296 15,084 219 6,016 21,100 29%
Apr '17 79 0 0 278 278 15,327 317 6,333 21,660 29%
May '17 80 13 0 278 291 15,611 312 6,645 22,256 30%
Jun '17 81 0 121 278 399 16,001 201 6,846 22,847 30%
2017/18 Jul '17 82 0 235 278 513 16,515 140 6,986 23,501 30%
Aug '17 83 4 20 278 302 16,817 239 7,225 24,042 30%
Sep '17 84 0 130 278 408 17,220 167 7,392 24,612 30%
Oct '17 85 0 150 278 428 17,639 43 7,435 25,075 30%
Nov '17 86 0 0 278 278 17,868 40 7,476 25,344 29%
Dec '17 87 0 4 278 282 18,084 99 7,574 25,659 30%
Jan '18 88 57 35 278 370 18,275 7 7,581 25,856 29%
Feb '18 89 9 0 278 287 18,500 33 7,614 26,115 29%
Mar '18 90 35 278 313 18,811 160 7,774 26,586 29%
Apr '18 91 20 278 298 19,102 170 7,944 27,047 29%
May '18 92 12 278 290 19,346 180 8,124 27,471 30%
Jun '18 93 3 278 281 19,624 190 8,314 27,939 30%
1 of 3
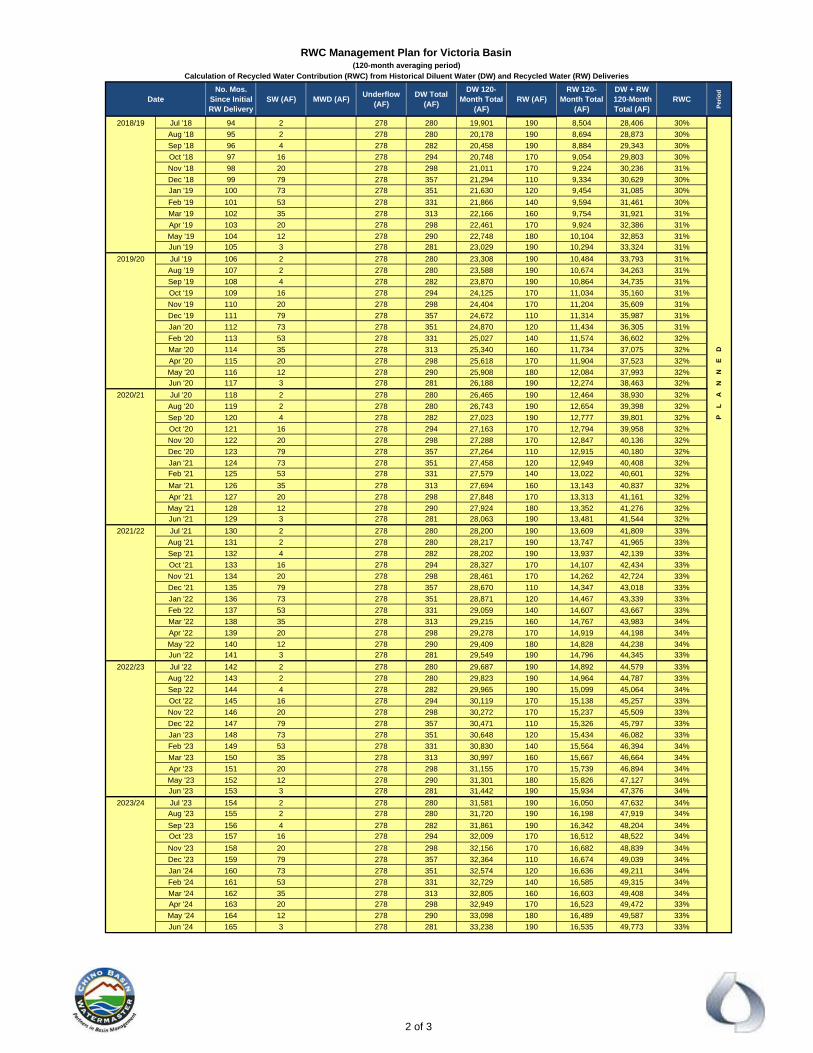
RWC Management Plan for Victoria Basin(120-month averaging period)
Calculation of Recycled Water Contribution (RWC) from Historical Diluent Water (DW) and Recycled Water (RW) Deliveries
DateNo. Mos.
Since Initial RW Delivery
SW (AF) MWD (AF)Underflow
(AF)DW Total
(AF)
DW 120-Month Total
(AF)RW (AF)
RW 120-Month Total
(AF)
DW + RW 120-Month Total (AF)
RWC
Per
iod
2018/19 Jul '18 94 2 278 280 19,901 190 8,504 28,406 30%
Aug '18 95 2 278 280 20,178 190 8,694 28,873 30%
Sep '18 96 4 278 282 20,458 190 8,884 29,343 30%
Oct '18 97 16 278 294 20,748 170 9,054 29,803 30%
Nov '18 98 20 278 298 21,011 170 9,224 30,236 31%
Dec '18 99 79 278 357 21,294 110 9,334 30,629 30%
Jan '19 100 73 278 351 21,630 120 9,454 31,085 30%
Feb '19 101 53 278 331 21,866 140 9,594 31,461 30%
Mar '19 102 35 278 313 22,166 160 9,754 31,921 31%
Apr '19 103 20 278 298 22,461 170 9,924 32,386 31%
May '19 104 12 278 290 22,748 180 10,104 32,853 31%
Jun '19 105 3 278 281 23,029 190 10,294 33,324 31%
2019/20 Jul '19 106 2 278 280 23,308 190 10,484 33,793 31%
Aug '19 107 2 278 280 23,588 190 10,674 34,263 31%
Sep '19 108 4 278 282 23,870 190 10,864 34,735 31%
Oct '19 109 16 278 294 24,125 170 11,034 35,160 31%
Nov '19 110 20 278 298 24,404 170 11,204 35,609 31%
Dec '19 111 79 278 357 24,672 110 11,314 35,987 31%
Jan '20 112 73 278 351 24,870 120 11,434 36,305 31%
Feb '20 113 53 278 331 25,027 140 11,574 36,602 32%
Mar '20 114 35 278 313 25,340 160 11,734 37,075 32% D
Apr '20 115 20 278 298 25,618 170 11,904 37,523 32% E
May '20 116 12 278 290 25,908 180 12,084 37,993 32% N
Jun '20 117 3 278 281 26,188 190 12,274 38,463 32% N
2020/21 Jul '20 118 2 278 280 26,465 190 12,464 38,930 32% A
Aug '20 119 2 278 280 26,743 190 12,654 39,398 32% L
Sep '20 120 4 278 282 27,023 190 12,777 39,801 32% P
Oct '20 121 16 278 294 27,163 170 12,794 39,958 32%
Nov '20 122 20 278 298 27,288 170 12,847 40,136 32%
Dec '20 123 79 278 357 27,264 110 12,915 40,180 32%
Jan '21 124 73 278 351 27,458 120 12,949 40,408 32%
Feb '21 125 53 278 331 27,579 140 13,022 40,601 32%
Mar '21 126 35 278 313 27,694 160 13,143 40,837 32%
Apr '21 127 20 278 298 27,848 170 13,313 41,161 32%
May '21 128 12 278 290 27,924 180 13,352 41,276 32%
Jun '21 129 3 278 281 28,063 190 13,481 41,544 32%
2021/22 Jul '21 130 2 278 280 28,200 190 13,609 41,809 33%
Aug '21 131 2 278 280 28,217 190 13,747 41,965 33%
Sep '21 132 4 278 282 28,202 190 13,937 42,139 33%
Oct '21 133 16 278 294 28,327 170 14,107 42,434 33%
Nov '21 134 20 278 298 28,461 170 14,262 42,724 33%
Dec '21 135 79 278 357 28,670 110 14,347 43,018 33%
Jan '22 136 73 278 351 28,871 120 14,467 43,339 33%
Feb '22 137 53 278 331 29,059 140 14,607 43,667 33%
Mar '22 138 35 278 313 29,215 160 14,767 43,983 34%
Apr '22 139 20 278 298 29,278 170 14,919 44,198 34%
May '22 140 12 278 290 29,409 180 14,828 44,238 34%
Jun '22 141 3 278 281 29,549 190 14,796 44,345 33%
2022/23 Jul '22 142 2 278 280 29,687 190 14,892 44,579 33%
Aug '22 143 2 278 280 29,823 190 14,964 44,787 33%
Sep '22 144 4 278 282 29,965 190 15,099 45,064 34%
Oct '22 145 16 278 294 30,119 170 15,138 45,257 33%
Nov '22 146 20 278 298 30,272 170 15,237 45,509 33%
Dec '22 147 79 278 357 30,471 110 15,326 45,797 33%
Jan '23 148 73 278 351 30,648 120 15,434 46,082 33%
Feb '23 149 53 278 331 30,830 140 15,564 46,394 34%
Mar '23 150 35 278 313 30,997 160 15,667 46,664 34%
Apr '23 151 20 278 298 31,155 170 15,739 46,894 34%
May '23 152 12 278 290 31,301 180 15,826 47,127 34%
Jun '23 153 3 278 281 31,442 190 15,934 47,376 34%
2023/24 Jul '23 154 2 278 280 31,581 190 16,050 47,632 34%
Aug '23 155 2 278 280 31,720 190 16,198 47,919 34%
Sep '23 156 4 278 282 31,861 190 16,342 48,204 34%
Oct '23 157 16 278 294 32,009 170 16,512 48,522 34%
Nov '23 158 20 278 298 32,156 170 16,682 48,839 34%
Dec '23 159 79 278 357 32,364 110 16,674 49,039 34%
Jan '24 160 73 278 351 32,574 120 16,636 49,211 34%
Feb '24 161 53 278 331 32,729 140 16,585 49,315 34%
Mar '24 162 35 278 313 32,805 160 16,603 49,408 34%
Apr '24 163 20 278 298 32,949 170 16,523 49,472 33%
May '24 164 12 278 290 33,098 180 16,489 49,587 33%
Jun '24 165 3 278 281 33,238 190 16,535 49,773 33%
2 of 3
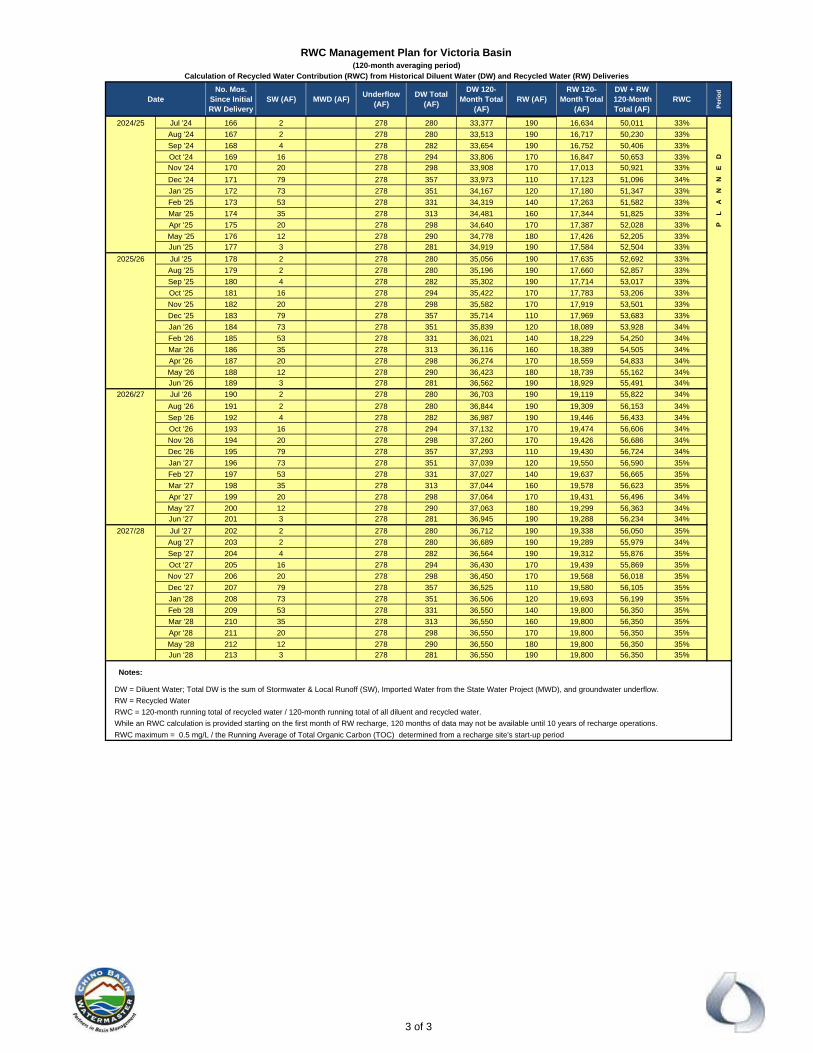
RWC Management Plan for Victoria Basin(120-month averaging period)
Calculation of Recycled Water Contribution (RWC) from Historical Diluent Water (DW) and Recycled Water (RW) Deliveries
DateNo. Mos.
Since Initial RW Delivery
SW (AF) MWD (AF)Underflow
(AF)DW Total
(AF)
DW 120-Month Total
(AF)RW (AF)
RW 120-Month Total
(AF)
DW + RW 120-Month Total (AF)
RWC
Per
iod
2024/25 Jul '24 166 2 278 280 33,377 190 16,634 50,011 33%
Aug '24 167 2 278 280 33,513 190 16,717 50,230 33%
Sep '24 168 4 278 282 33,654 190 16,752 50,406 33%
Oct '24 169 16 278 294 33,806 170 16,847 50,653 33% D
Nov '24 170 20 278 298 33,908 170 17,013 50,921 33% E
Dec '24 171 79 278 357 33,973 110 17,123 51,096 34% N
Jan '25 172 73 278 351 34,167 120 17,180 51,347 33% N
Feb '25 173 53 278 331 34,319 140 17,263 51,582 33% A
Mar '25 174 35 278 313 34,481 160 17,344 51,825 33% L
Apr '25 175 20 278 298 34,640 170 17,387 52,028 33% P
May '25 176 12 278 290 34,778 180 17,426 52,205 33%
Jun '25 177 3 278 281 34,919 190 17,584 52,504 33%
2025/26 Jul '25 178 2 278 280 35,056 190 17,635 52,692 33%
Aug '25 179 2 278 280 35,196 190 17,660 52,857 33%
Sep '25 180 4 278 282 35,302 190 17,714 53,017 33%
Oct '25 181 16 278 294 35,422 170 17,783 53,206 33%
Nov '25 182 20 278 298 35,582 170 17,919 53,501 33%
Dec '25 183 79 278 357 35,714 110 17,969 53,683 33%
Jan '26 184 73 278 351 35,839 120 18,089 53,928 34%
Feb '26 185 53 278 331 36,021 140 18,229 54,250 34%
Mar '26 186 35 278 313 36,116 160 18,389 54,505 34%
Apr '26 187 20 278 298 36,274 170 18,559 54,833 34%
May '26 188 12 278 290 36,423 180 18,739 55,162 34%
Jun '26 189 3 278 281 36,562 190 18,929 55,491 34%
2026/27 Jul '26 190 2 278 280 36,703 190 19,119 55,822 34%
Aug '26 191 2 278 280 36,844 190 19,309 56,153 34%
Sep '26 192 4 278 282 36,987 190 19,446 56,433 34%
Oct '26 193 16 278 294 37,132 170 19,474 56,606 34%
Nov '26 194 20 278 298 37,260 170 19,426 56,686 34%
Dec '26 195 79 278 357 37,293 110 19,430 56,724 34%
Jan '27 196 73 278 351 37,039 120 19,550 56,590 35%
Feb '27 197 53 278 331 37,027 140 19,637 56,665 35%
Mar '27 198 35 278 313 37,044 160 19,578 56,623 35%
Apr '27 199 20 278 298 37,064 170 19,431 56,496 34%
May '27 200 12 278 290 37,063 180 19,299 56,363 34%
Jun '27 201 3 278 281 36,945 190 19,288 56,234 34%
2027/28 Jul '27 202 2 278 280 36,712 190 19,338 56,050 35%
Aug '27 203 2 278 280 36,689 190 19,289 55,979 34%
Sep '27 204 4 278 282 36,564 190 19,312 55,876 35%
Oct '27 205 16 278 294 36,430 170 19,439 55,869 35%
Nov '27 206 20 278 298 36,450 170 19,568 56,018 35%
Dec '27 207 79 278 357 36,525 110 19,580 56,105 35%
Jan '28 208 73 278 351 36,506 120 19,693 56,199 35%
Feb '28 209 53 278 331 36,550 140 19,800 56,350 35%
Mar '28 210 35 278 313 36,550 160 19,800 56,350 35%
Apr '28 211 20 278 298 36,550 170 19,800 56,350 35%
May '28 212 12 278 290 36,550 180 19,800 56,350 35%
Jun '28 213 3 278 281 36,550 190 19,800 56,350 35%
Notes:
DW = Diluent Water; Total DW is the sum of Stormwater & Local Runoff (SW), Imported Water from the State Water Project (MWD), and groundwater underflow.
RW = Recycled Water
RWC = 120-month running total of recycled water / 120-month running total of all diluent and recycled water.
While an RWC calculation is provided starting on the first month of RW recharge, 120 months of data may not be available until 10 years of recharge operations.
RWC maximum = 0.5 mg/L / the Running Average of Total Organic Carbon (TOC) determined from a recharge site's start-up period
3 of 3
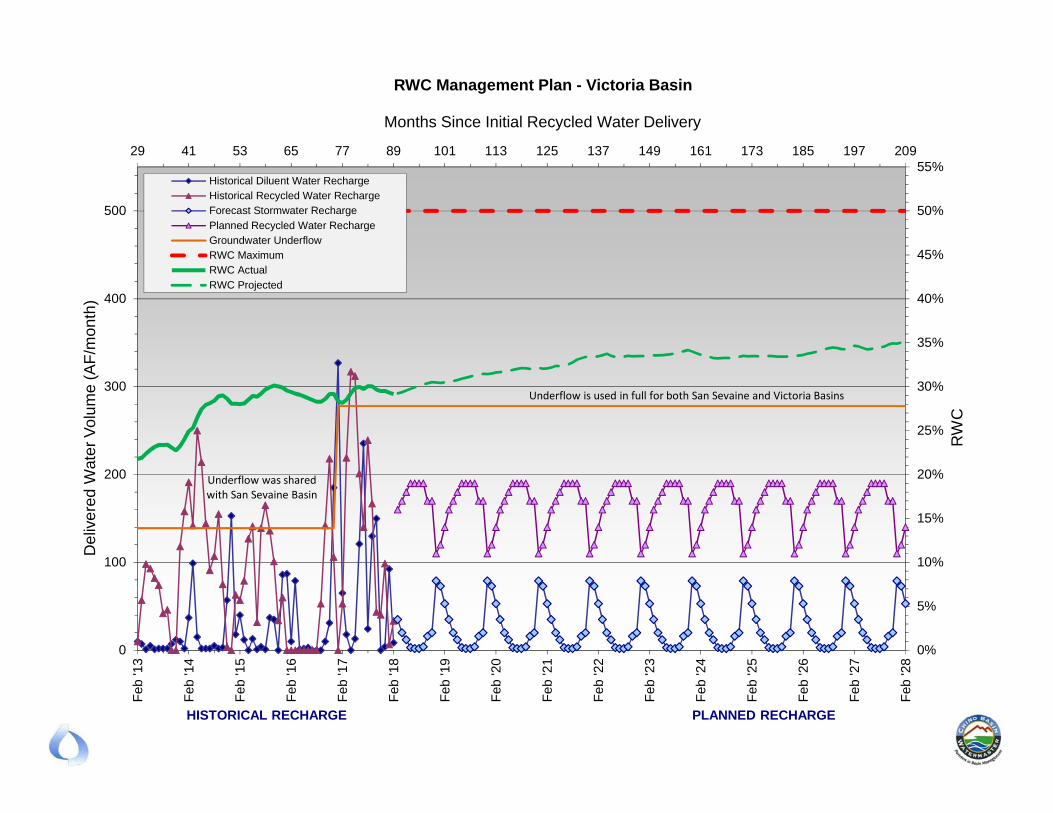
0%
5%
10%
15%
20%
25%
30%
35%
40%
45%
50%
55%29 41 53 65 77 89 101 113 125 137 149 161 173 185 197 209
0
100
200
300
400
500
Feb
'13
Feb
'14
Feb
'15
Feb
'16
Feb
'17
Feb
'18
Feb
'19
Feb
'20
Feb
'21
Feb
'22
Feb
'23
Feb
'24
Feb
'25
Feb
'26
Feb
'27
Feb
'28
RW
C
Months Since Initial Recycled Water Delivery
De
live
red
Wat
er
Vo
lum
e (
AF
/mo
nth
)
RWC Management Plan - Victoria Basin
Historical Diluent Water RechargeHistorical Recycled Water RechargeForecast Stormwater Recharge
Planned Recycled Water RechargeGroundwater UnderflowRWC MaximumRWC Actual
RWC Projected
HISTORICAL RECHARGE PLANNED RECHARGE
Underflow was shared with San Sevaine Basin
Underflow is used in full for both San Sevaine and Victoria Basins
APPENDIX C
EVIDENCE FOR BLENDING:
EC, TDS, CHLORIDE TIME‐SERIES GRAPHS
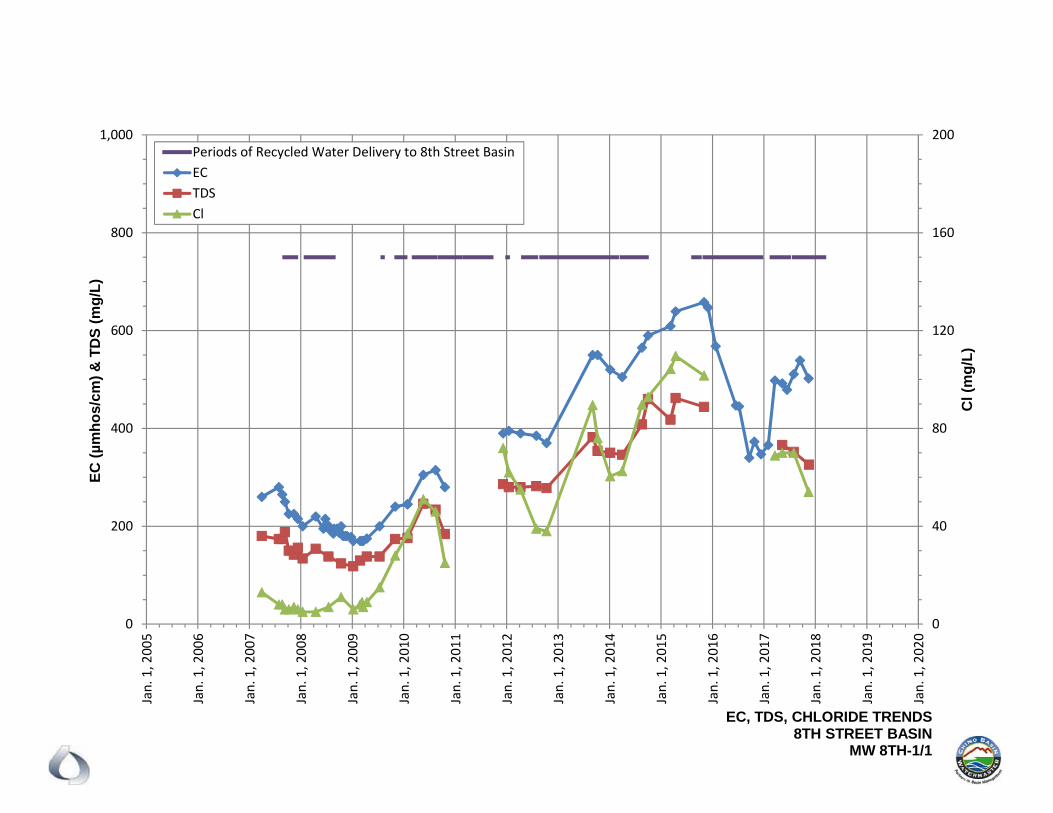
0
40
80
120
160
200
0
200
400
600
800
1,000Jan. 1, 2005
Jan. 1, 2006
Jan. 1, 2007
Jan. 1, 2008
Jan. 1, 2009
Jan. 1, 2010
Jan. 1, 2011
Jan. 1, 2012
Jan. 1, 2013
Jan. 1, 2014
Jan. 1, 2015
Jan. 1, 2016
Jan. 1, 2017
Jan. 1, 2018
Jan. 1, 2019
Jan. 1, 2020
Cl (
mg
/L)
EC
(µ
mh
os/
cm)
& T
DS
(m
g/L
)
Periods of Recycled Water Delivery to 8th Street BasinECTDSCl
EC, TDS, CHLORIDE TRENDS8TH STREET BASIN
MW 8TH-1/1
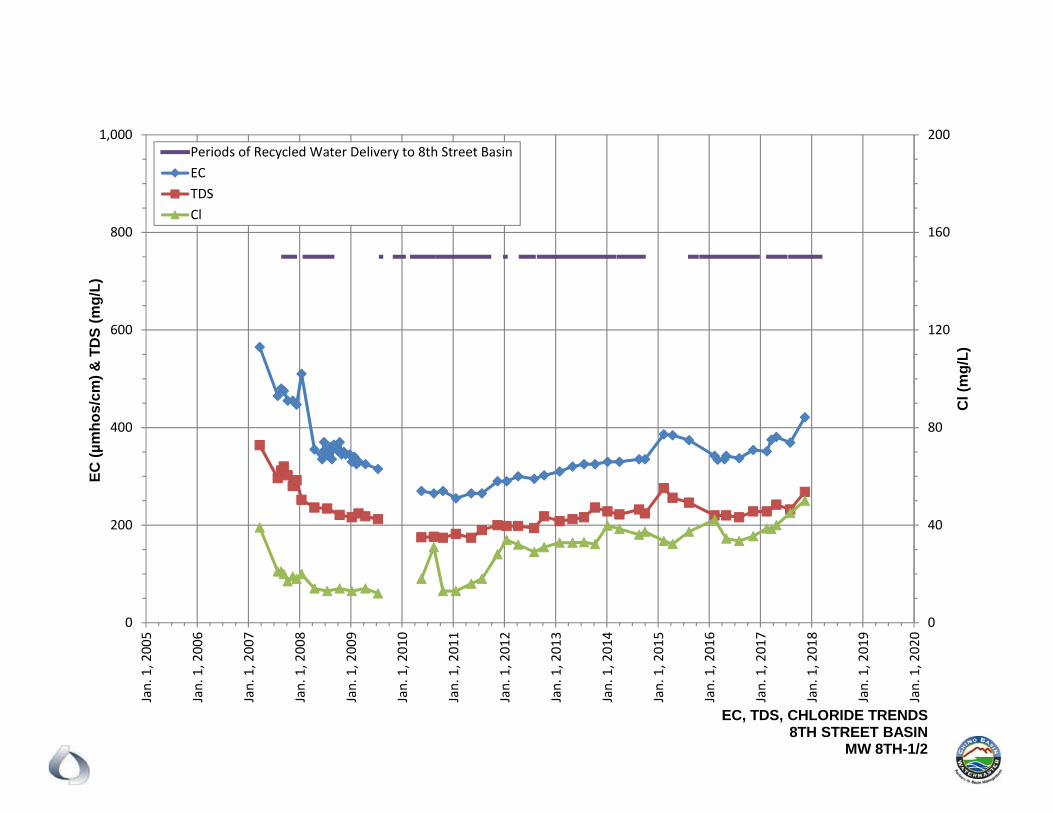
0
40
80
120
160
200
0
200
400
600
800
1,000Jan. 1, 2005
Jan. 1, 2006
Jan. 1, 2007
Jan. 1, 2008
Jan. 1, 2009
Jan. 1, 2010
Jan. 1, 2011
Jan. 1, 2012
Jan. 1, 2013
Jan. 1, 2014
Jan. 1, 2015
Jan. 1, 2016
Jan. 1, 2017
Jan. 1, 2018
Jan. 1, 2019
Jan. 1, 2020
Cl (
mg
/L)
EC
(µ
mh
os/
cm)
& T
DS
(m
g/L
)
Periods of Recycled Water Delivery to 8th Street BasinECTDSCl
EC, TDS, CHLORIDE TRENDS8TH STREET BASIN
MW 8TH-1/2
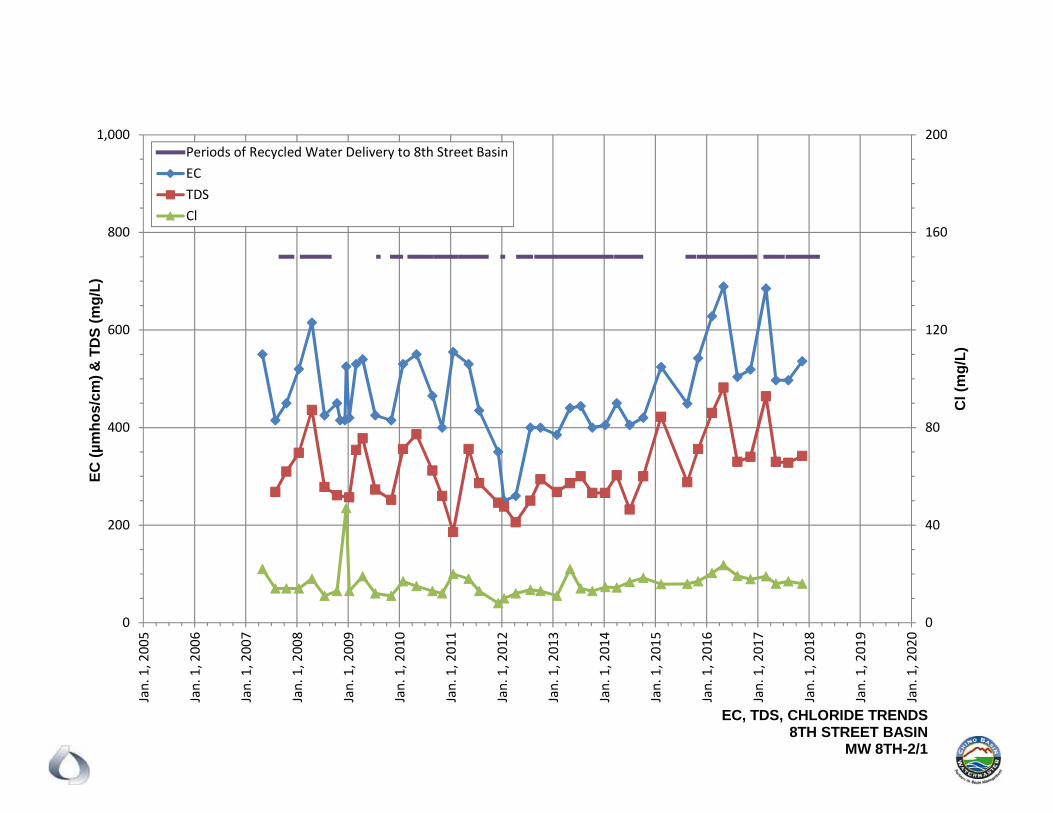
0
40
80
120
160
200
0
200
400
600
800
1,000Jan. 1, 2005
Jan. 1, 2006
Jan. 1, 2007
Jan. 1, 2008
Jan. 1, 2009
Jan. 1, 2010
Jan. 1, 2011
Jan. 1, 2012
Jan. 1, 2013
Jan. 1, 2014
Jan. 1, 2015
Jan. 1, 2016
Jan. 1, 2017
Jan. 1, 2018
Jan. 1, 2019
Jan. 1, 2020
Cl (
mg
/L)
EC
(µ
mh
os/
cm)
& T
DS
(m
g/L
)
Periods of Recycled Water Delivery to 8th Street BasinECTDSCl
EC, TDS, CHLORIDE TRENDS8TH STREET BASIN
MW 8TH-2/1
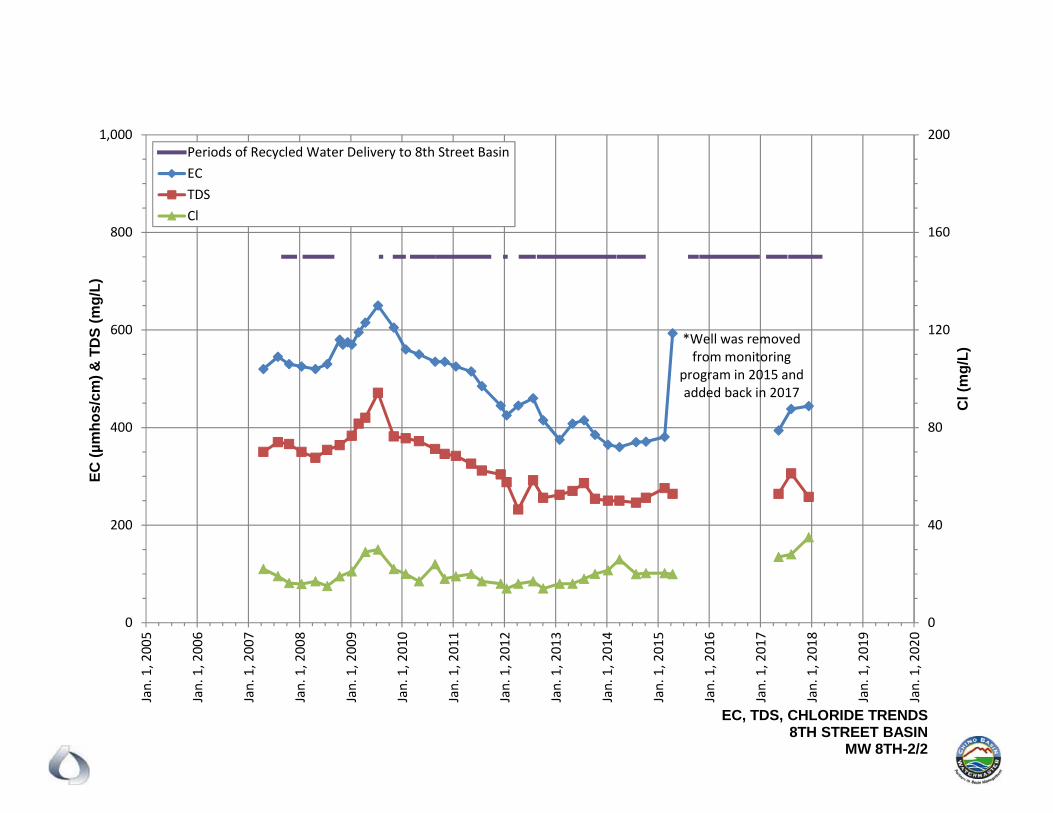
0
40
80
120
160
200
0
200
400
600
800
1,000Jan. 1, 2005
Jan. 1, 2006
Jan. 1, 2007
Jan. 1, 2008
Jan. 1, 2009
Jan. 1, 2010
Jan. 1, 2011
Jan. 1, 2012
Jan. 1, 2013
Jan. 1, 2014
Jan. 1, 2015
Jan. 1, 2016
Jan. 1, 2017
Jan. 1, 2018
Jan. 1, 2019
Jan. 1, 2020
Cl (
mg
/L)
EC
(µ
mh
os/
cm)
& T
DS
(m
g/L
)
Periods of Recycled Water Delivery to 8th Street BasinECTDSCl
EC, TDS, CHLORIDE TRENDS8TH STREET BASIN
MW 8TH-2/2
*Well was removed from monitoring
program in 2015 and added back in 2017
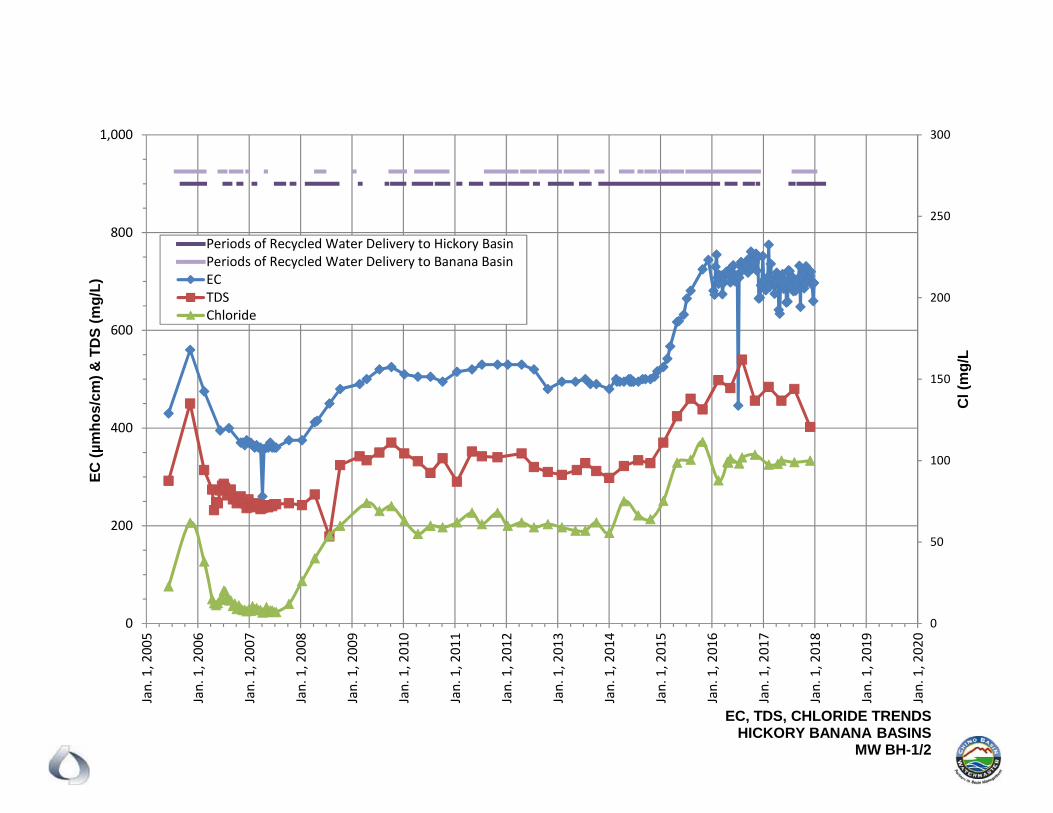
0
50
100
150
200
250
300
0
200
400
600
800
1,000Jan. 1, 2005
Jan. 1, 2006
Jan. 1, 2007
Jan. 1, 2008
Jan. 1, 2009
Jan. 1, 2010
Jan. 1, 2011
Jan. 1, 2012
Jan. 1, 2013
Jan. 1, 2014
Jan. 1, 2015
Jan. 1, 2016
Jan. 1, 2017
Jan. 1, 2018
Jan. 1, 2019
Jan. 1, 2020
Cl (
mg
/L
EC
(µ
mh
os/
cm)
& T
DS
(m
g/L
)
Periods of Recycled Water Delivery to Hickory BasinPeriods of Recycled Water Delivery to Banana BasinECTDSChloride
EC, TDS, CHLORIDE TRENDSHICKORY BANANA BASINS
MW BH-1/2
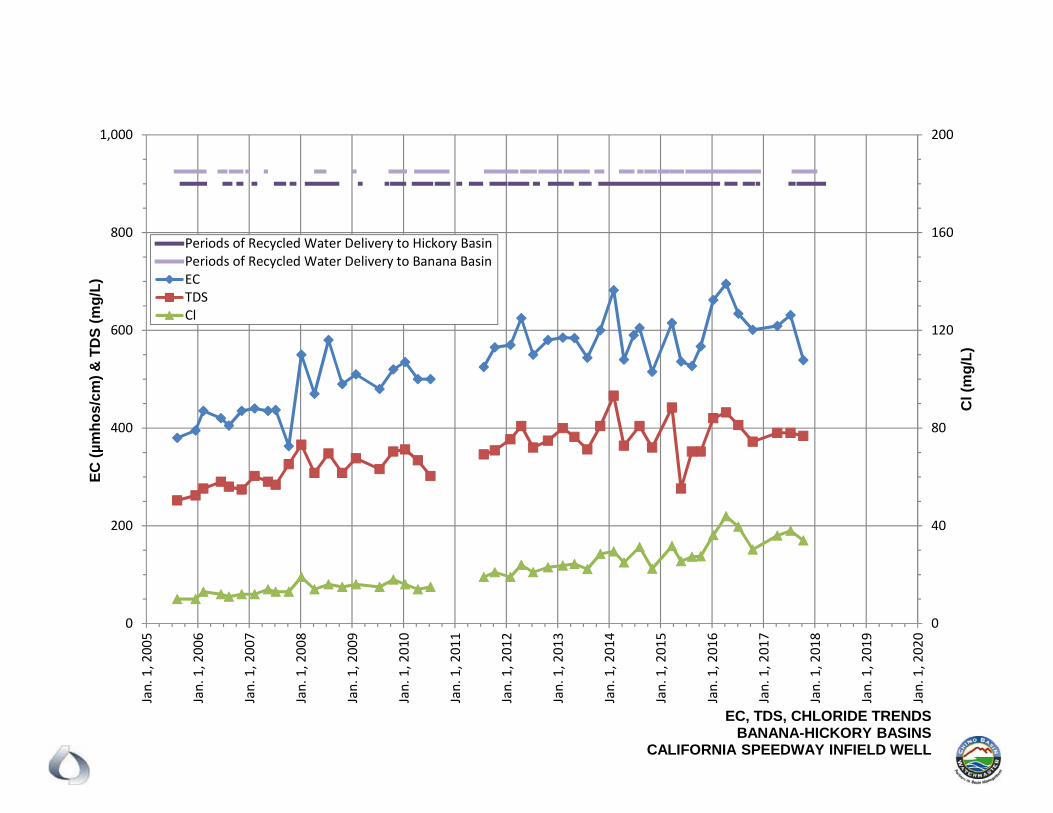
0
40
80
120
160
200
0
200
400
600
800
1,000Jan. 1, 2005
Jan. 1, 2006
Jan. 1, 2007
Jan. 1, 2008
Jan. 1, 2009
Jan. 1, 2010
Jan. 1, 2011
Jan. 1, 2012
Jan. 1, 2013
Jan. 1, 2014
Jan. 1, 2015
Jan. 1, 2016
Jan. 1, 2017
Jan. 1, 2018
Jan. 1, 2019
Jan. 1, 2020
Cl (
mg
/L)
EC
(µ
mh
os/
cm)
& T
DS
(m
g/L
)
Periods of Recycled Water Delivery to Hickory BasinPeriods of Recycled Water Delivery to Banana BasinECTDSCl
EC, TDS, CHLORIDE TRENDSBANANA-HICKORY BASINS
CALIFORNIA SPEEDWAY INFIELD WELL
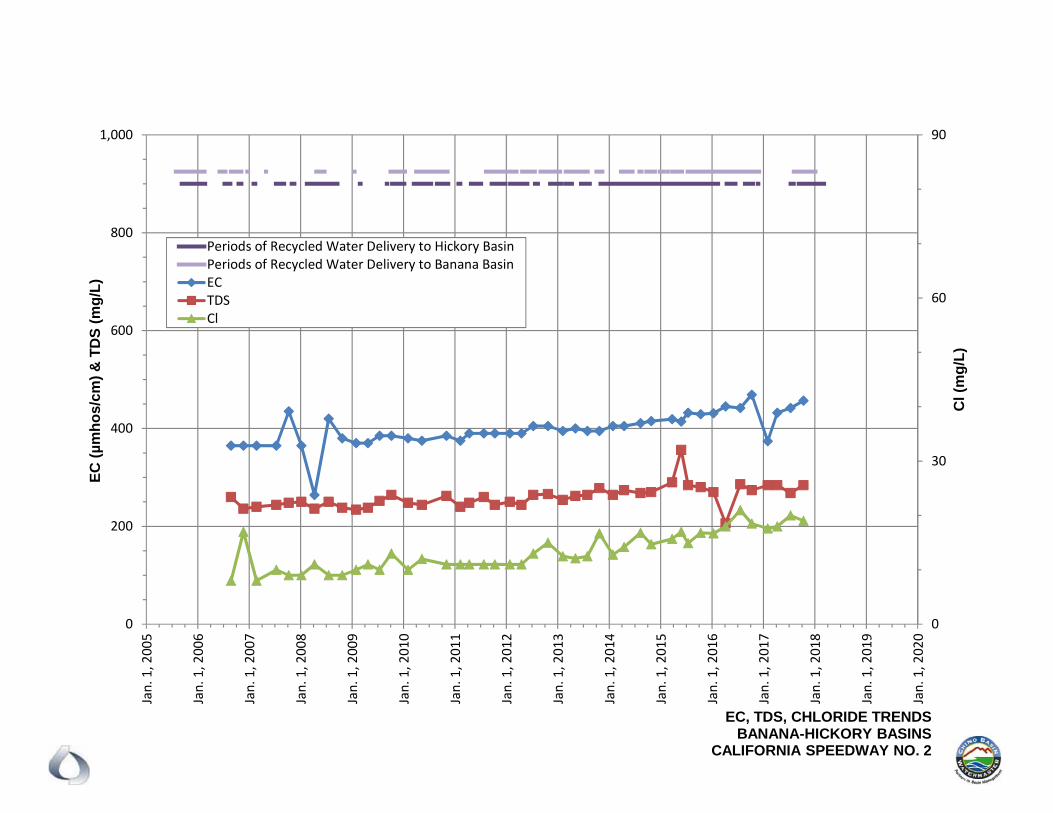
0
30
60
90
0
200
400
600
800
1,000Jan. 1, 2005
Jan. 1, 2006
Jan. 1, 2007
Jan. 1, 2008
Jan. 1, 2009
Jan. 1, 2010
Jan. 1, 2011
Jan. 1, 2012
Jan. 1, 2013
Jan. 1, 2014
Jan. 1, 2015
Jan. 1, 2016
Jan. 1, 2017
Jan. 1, 2018
Jan. 1, 2019
Jan. 1, 2020
Cl (
mg
/L)
EC
(µ
mh
os/
cm)
& T
DS
(m
g/L
)
Periods of Recycled Water Delivery to Hickory BasinPeriods of Recycled Water Delivery to Banana BasinECTDSCl
EC, TDS, CHLORIDE TRENDSBANANA-HICKORY BASINS
CALIFORNIA SPEEDWAY NO. 2
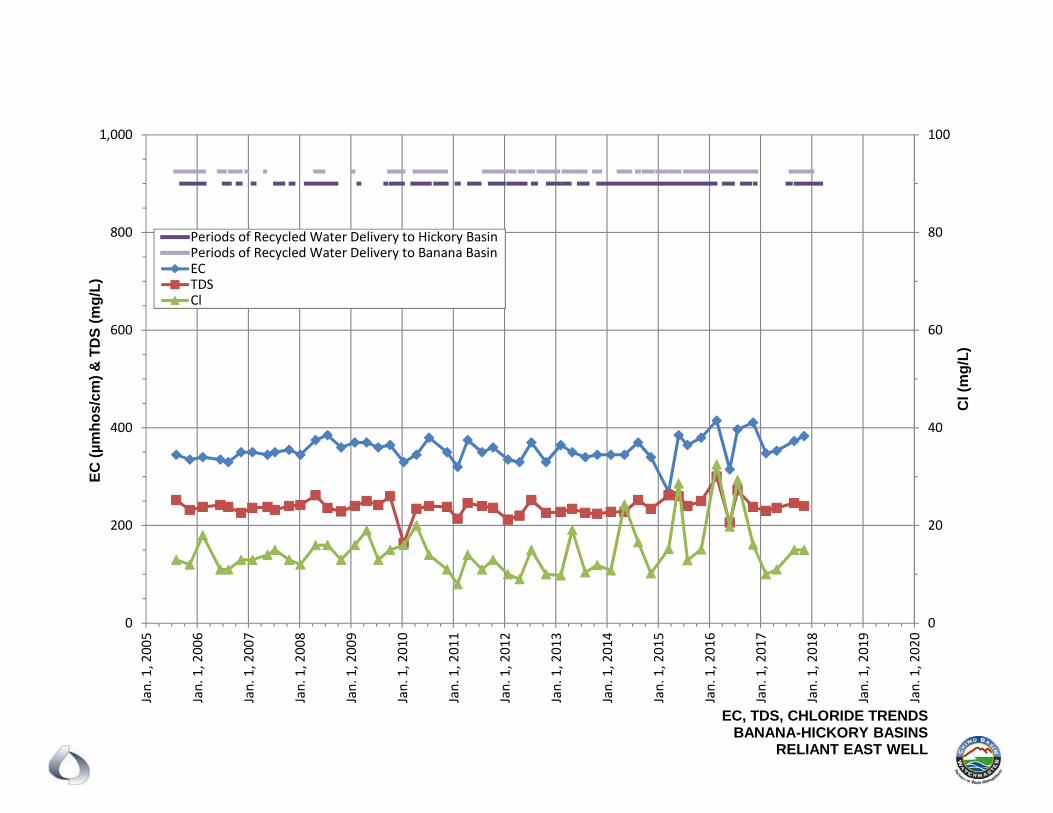
0
20
40
60
80
100
0
200
400
600
800
1,000Jan. 1, 2005
Jan. 1, 2006
Jan. 1, 2007
Jan. 1, 2008
Jan. 1, 2009
Jan. 1, 2010
Jan. 1, 2011
Jan. 1, 2012
Jan. 1, 2013
Jan. 1, 2014
Jan. 1, 2015
Jan. 1, 2016
Jan. 1, 2017
Jan. 1, 2018
Jan. 1, 2019
Jan. 1, 2020
Cl (
mg
/L)
EC
(µ
mh
os/
cm)
& T
DS
(m
g/L
)
Periods of Recycled Water Delivery to Hickory BasinPeriods of Recycled Water Delivery to Banana BasinECTDSCl
EC, TDS, CHLORIDE TRENDSBANANA-HICKORY BASINS
RELIANT EAST WELL

0
40
80
120
160
200
0
200
400
600
800
1,000Jan. 1, 2005
Jan. 1, 2006
Jan. 1, 2007
Jan. 1, 2008
Jan. 1, 2009
Jan. 1, 2010
Jan. 1, 2011
Jan. 1, 2012
Jan. 1, 2013
Jan. 1, 2014
Jan. 1, 2015
Jan. 1, 2016
Jan. 1, 2017
Jan. 1, 2018
Jan. 1, 2019
Jan. 1, 2020
Cl (
mg
/L)
EC
(µ
mh
os/
cm)
& T
DS
(m
g/L
)
Periods of Recycled Water Delivery to Hickory BasinPeriods of Recycled Water Delivery to Banana BasinECTDSCl
EC, TDS, CHLORIDE TRENDSBANANA-HICKORY BASINSFONTANA WATER CO. 37A
Well No Longer Active ‐ will be replaced by F7A
in 2018
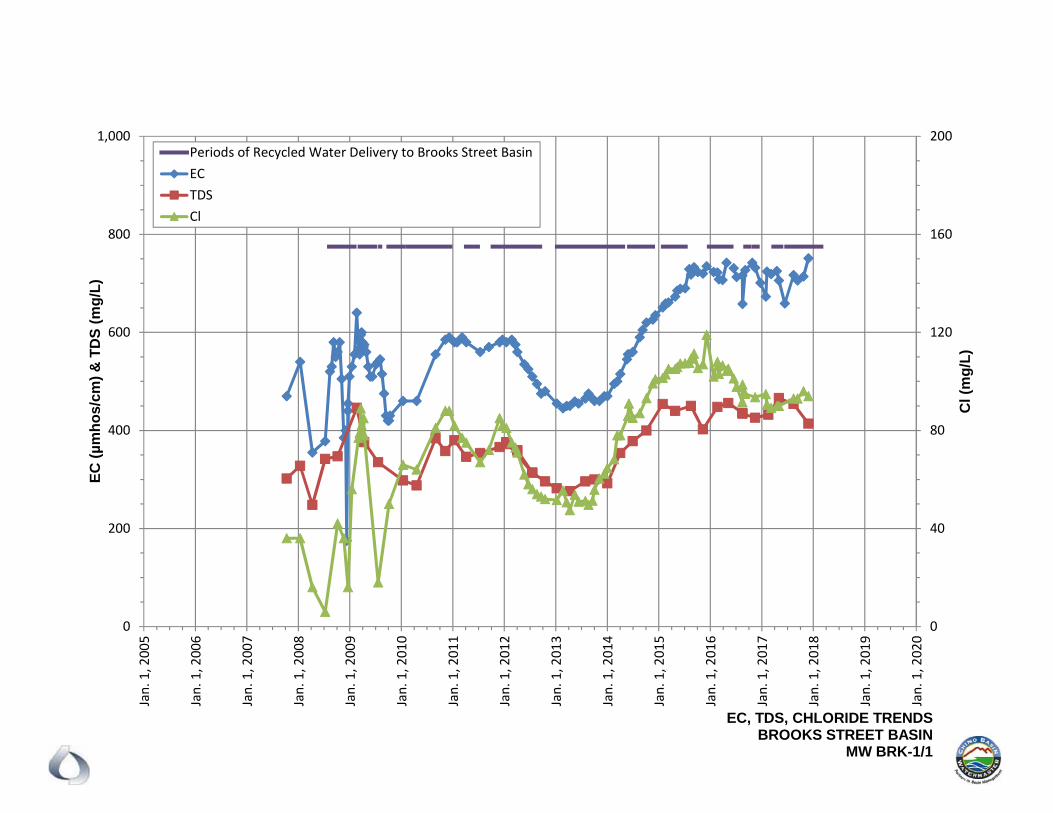
0
40
80
120
160
200
0
200
400
600
800
1,000Jan. 1, 2005
Jan. 1, 2006
Jan. 1, 2007
Jan. 1, 2008
Jan. 1, 2009
Jan. 1, 2010
Jan. 1, 2011
Jan. 1, 2012
Jan. 1, 2013
Jan. 1, 2014
Jan. 1, 2015
Jan. 1, 2016
Jan. 1, 2017
Jan. 1, 2018
Jan. 1, 2019
Jan. 1, 2020
Cl (
mg
/L)
EC
(µ
mh
os/
cm)
& T
DS
(m
g/L
)
Periods of Recycled Water Delivery to Brooks Street BasinECTDSCl
EC, TDS, CHLORIDE TRENDSBROOKS STREET BASIN
MW BRK-1/1
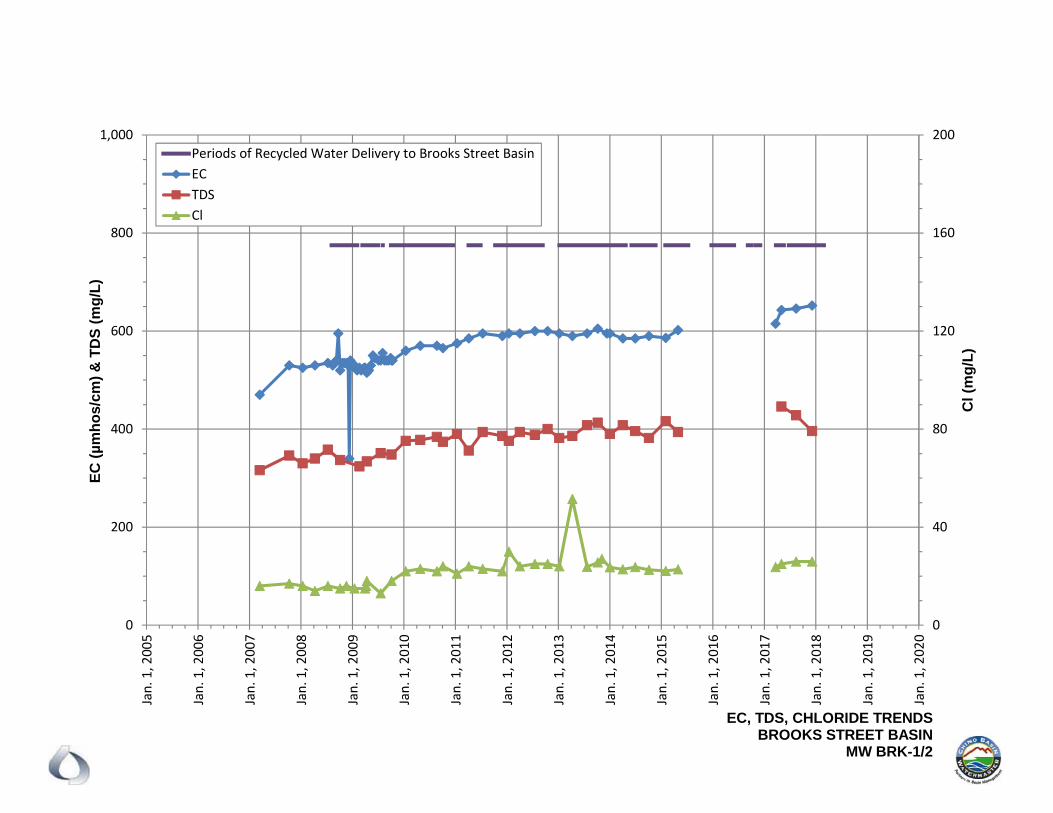
0
40
80
120
160
200
0
200
400
600
800
1,000Jan. 1, 2005
Jan. 1, 2006
Jan. 1, 2007
Jan. 1, 2008
Jan. 1, 2009
Jan. 1, 2010
Jan. 1, 2011
Jan. 1, 2012
Jan. 1, 2013
Jan. 1, 2014
Jan. 1, 2015
Jan. 1, 2016
Jan. 1, 2017
Jan. 1, 2018
Jan. 1, 2019
Jan. 1, 2020
Cl (
mg
/L)
EC
(µ
mh
os/
cm)
& T
DS
(m
g/L
)
Periods of Recycled Water Delivery to Brooks Street BasinECTDSCl
EC, TDS, CHLORIDE TRENDSBROOKS STREET BASIN
MW BRK-1/2
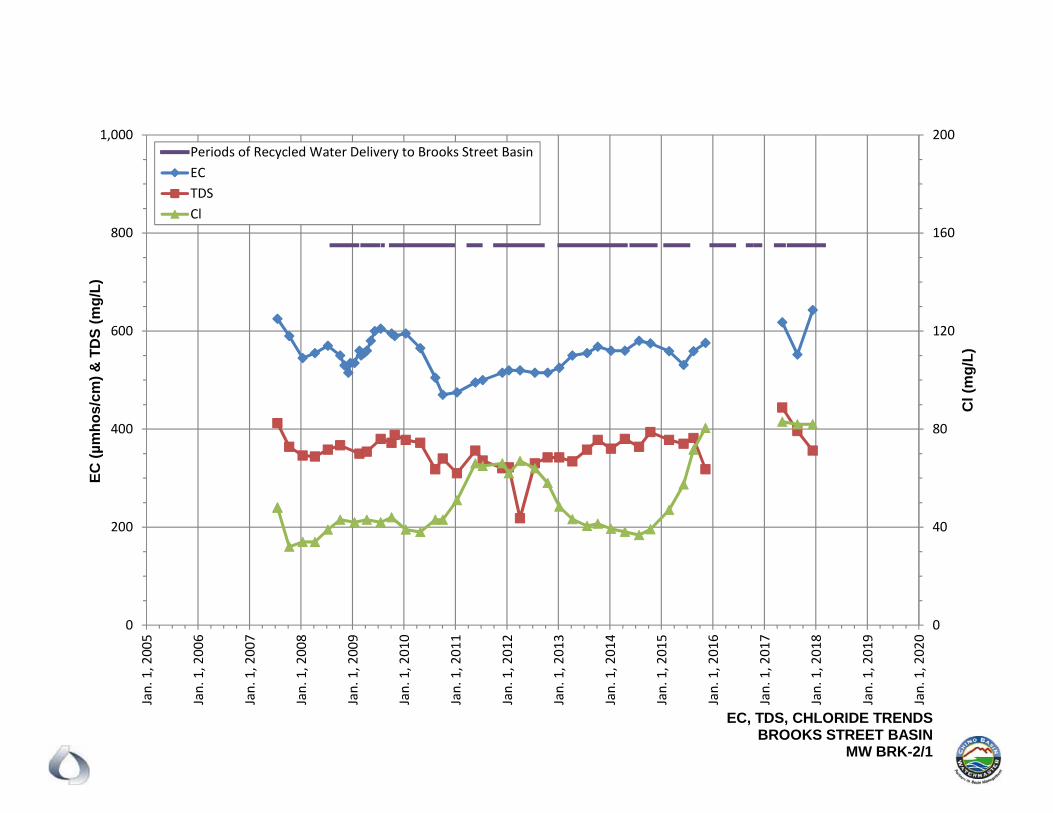
0
40
80
120
160
200
0
200
400
600
800
1,000Jan. 1, 2005
Jan. 1, 2006
Jan. 1, 2007
Jan. 1, 2008
Jan. 1, 2009
Jan. 1, 2010
Jan. 1, 2011
Jan. 1, 2012
Jan. 1, 2013
Jan. 1, 2014
Jan. 1, 2015
Jan. 1, 2016
Jan. 1, 2017
Jan. 1, 2018
Jan. 1, 2019
Jan. 1, 2020
Cl (
mg
/L)
EC
(µ
mh
os/
cm)
& T
DS
(m
g/L
)
Periods of Recycled Water Delivery to Brooks Street BasinECTDSCl
EC, TDS, CHLORIDE TRENDSBROOKS STREET BASIN
MW BRK-2/1
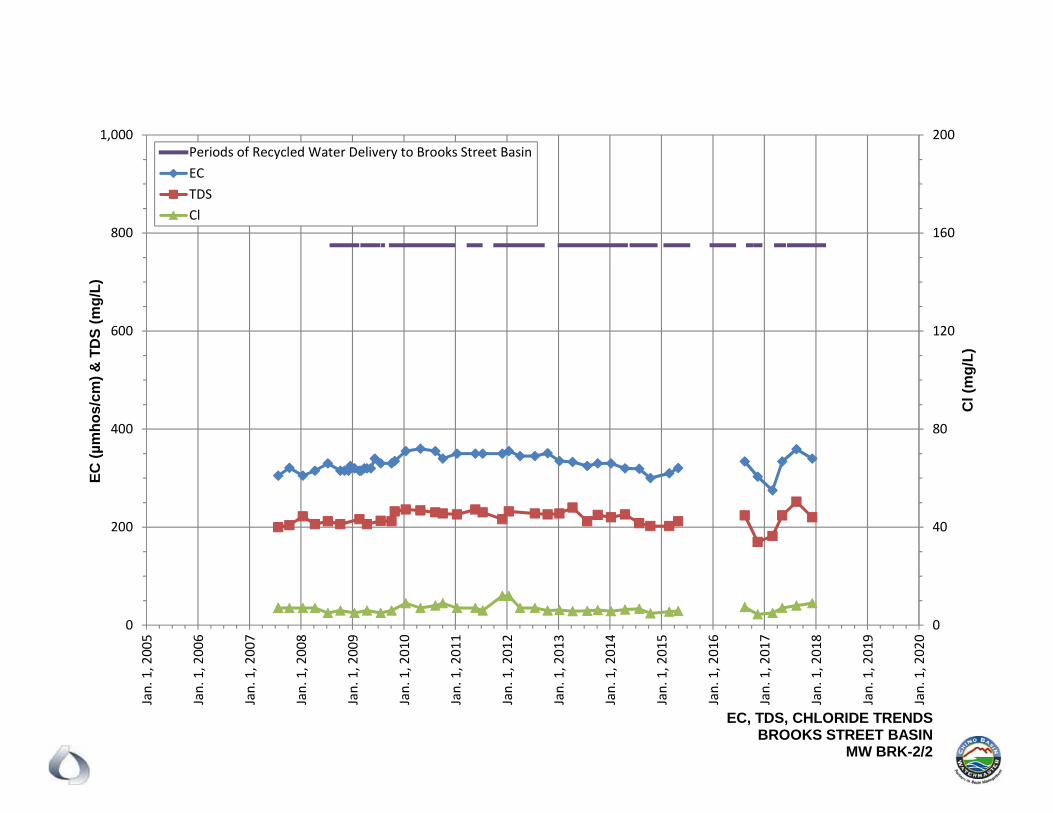
0
40
80
120
160
200
0
200
400
600
800
1,000Jan. 1, 2005
Jan. 1, 2006
Jan. 1, 2007
Jan. 1, 2008
Jan. 1, 2009
Jan. 1, 2010
Jan. 1, 2011
Jan. 1, 2012
Jan. 1, 2013
Jan. 1, 2014
Jan. 1, 2015
Jan. 1, 2016
Jan. 1, 2017
Jan. 1, 2018
Jan. 1, 2019
Jan. 1, 2020
Cl (
mg
/L)
EC
(µ
mh
os/
cm)
& T
DS
(m
g/L
)
Periods of Recycled Water Delivery to Brooks Street BasinECTDSCl
EC, TDS, CHLORIDE TRENDSBROOKS STREET BASIN
MW BRK-2/2
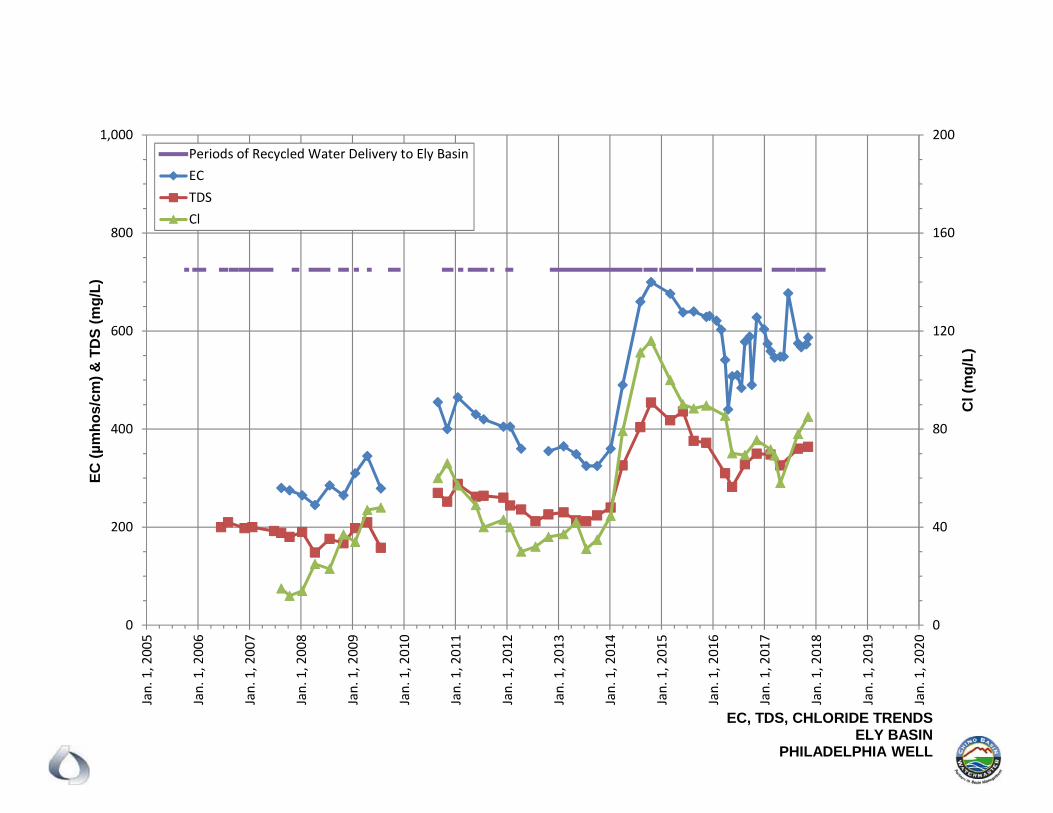
0
40
80
120
160
200
0
200
400
600
800
1,000Jan. 1, 2005
Jan. 1, 2006
Jan. 1, 2007
Jan. 1, 2008
Jan. 1, 2009
Jan. 1, 2010
Jan. 1, 2011
Jan. 1, 2012
Jan. 1, 2013
Jan. 1, 2014
Jan. 1, 2015
Jan. 1, 2016
Jan. 1, 2017
Jan. 1, 2018
Jan. 1, 2019
Jan. 1, 2020
Cl (
mg
/L)
EC
(µ
mh
os/
cm)
& T
DS
(m
g/L
)
Periods of Recycled Water Delivery to Ely BasinECTDSCl
EC, TDS, CHLORIDE TRENDSELY BASIN
PHILADELPHIA WELL

0
50
100
150
200
250
300
0
250
500
750
1000
1250
1500
1750
2000Jan. 1, 2005
Jan. 1, 2006
Jan. 1, 2007
Jan. 1, 2008
Jan. 1, 2009
Jan. 1, 2010
Jan. 1, 2011
Jan. 1, 2012
Jan. 1, 2013
Jan. 1, 2014
Jan. 1, 2015
Jan. 1, 2016
Jan. 1, 2017
Jan. 1, 2018
Jan. 1, 2019
Jan. 1, 2020
Cl (
mg
/L)
EC
(µ
mh
os/
cm)
& T
DS
(m
g/L
)
Periods of Recycled Water Delivery to Ely BasinECTDSCl
EC, TDS, CHLORIDE TRENDSELY BASIN
WALNUT WELL
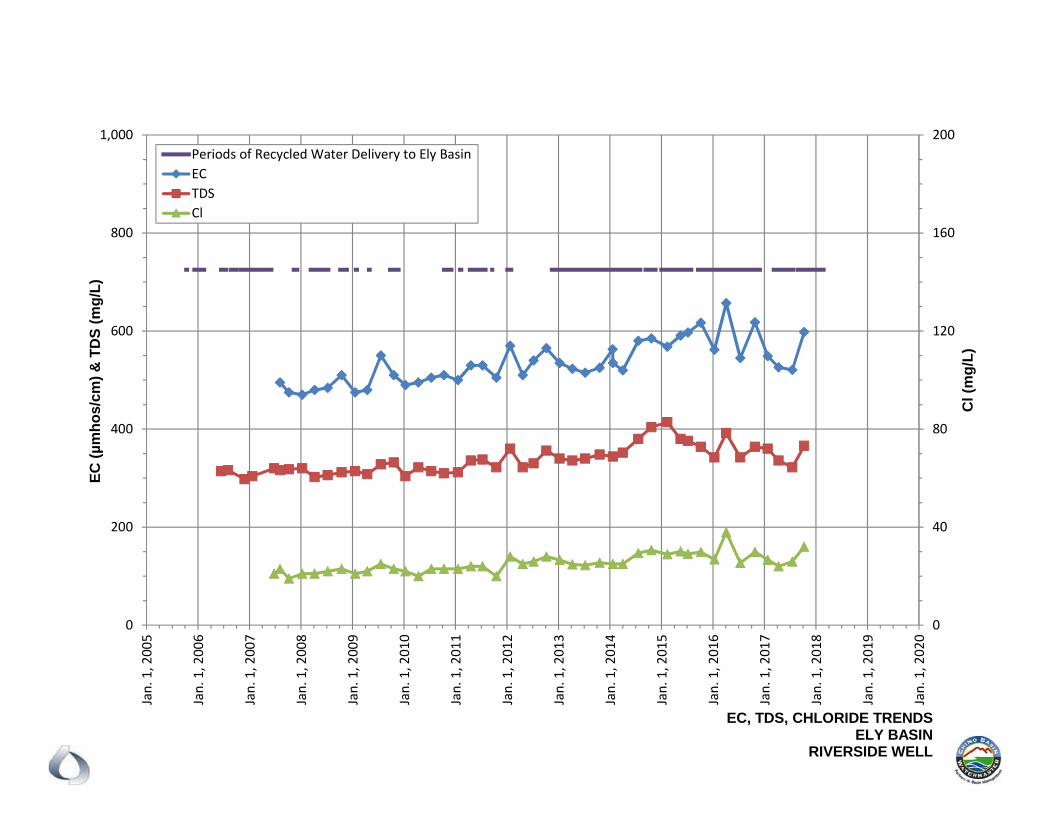
0
40
80
120
160
200
0
200
400
600
800
1,000Jan. 1, 2005
Jan. 1, 2006
Jan. 1, 2007
Jan. 1, 2008
Jan. 1, 2009
Jan. 1, 2010
Jan. 1, 2011
Jan. 1, 2012
Jan. 1, 2013
Jan. 1, 2014
Jan. 1, 2015
Jan. 1, 2016
Jan. 1, 2017
Jan. 1, 2018
Jan. 1, 2019
Jan. 1, 2020
Cl (
mg
/L)
EC
(µ
mh
os/
cm)
& T
DS
(m
g/L
)
Periods of Recycled Water Delivery to Ely BasinECTDSCl
EC, TDS, CHLORIDE TRENDSELY BASIN
RIVERSIDE WELL
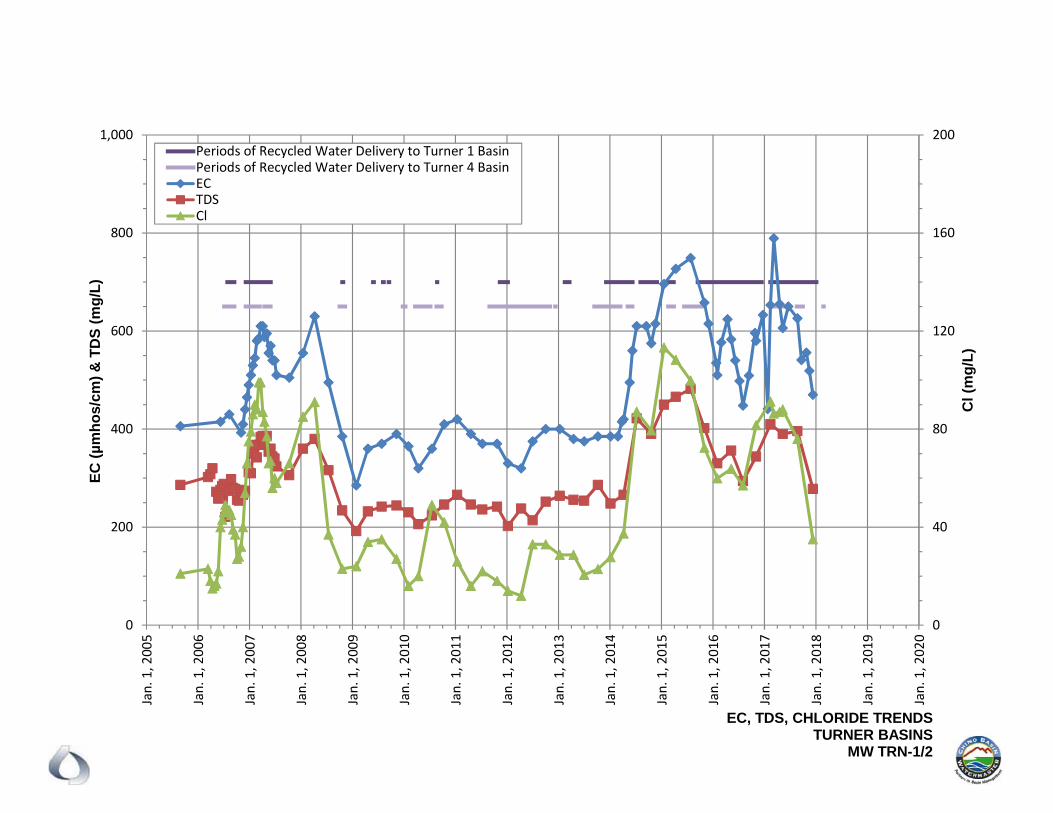
0
40
80
120
160
200
0
200
400
600
800
1,000Jan. 1, 2005
Jan. 1, 2006
Jan. 1, 2007
Jan. 1, 2008
Jan. 1, 2009
Jan. 1, 2010
Jan. 1, 2011
Jan. 1, 2012
Jan. 1, 2013
Jan. 1, 2014
Jan. 1, 2015
Jan. 1, 2016
Jan. 1, 2017
Jan. 1, 2018
Jan. 1, 2019
Jan. 1, 2020
Cl (
mg
/L)
EC
(µ
mh
os/
cm)
& T
DS
(m
g/L
)
Periods of Recycled Water Delivery to Turner 1 BasinPeriods of Recycled Water Delivery to Turner 4 BasinECTDSCl
EC, TDS, CHLORIDE TRENDSTURNER BASINS
MW TRN-1/2
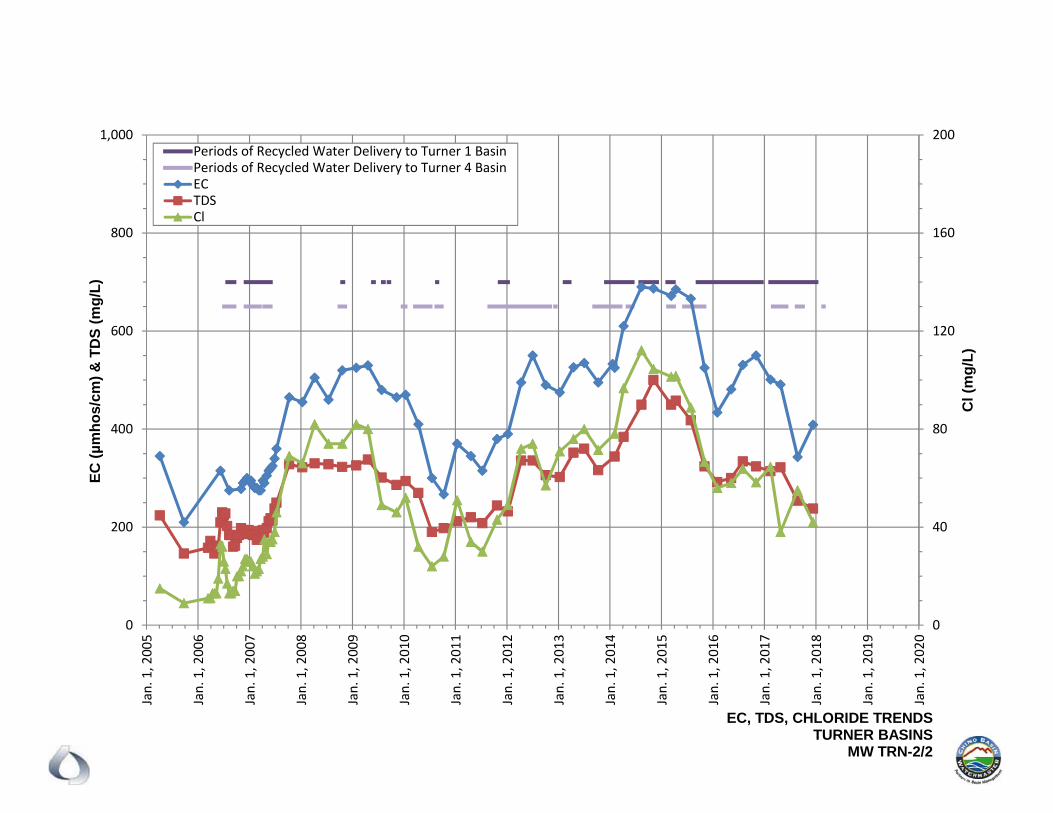
0
40
80
120
160
200
0
200
400
600
800
1,000Jan. 1, 2005
Jan. 1, 2006
Jan. 1, 2007
Jan. 1, 2008
Jan. 1, 2009
Jan. 1, 2010
Jan. 1, 2011
Jan. 1, 2012
Jan. 1, 2013
Jan. 1, 2014
Jan. 1, 2015
Jan. 1, 2016
Jan. 1, 2017
Jan. 1, 2018
Jan. 1, 2019
Jan. 1, 2020
Cl (
mg
/L)
EC
(µ
mh
os/
cm)
& T
DS
(m
g/L
)
Periods of Recycled Water Delivery to Turner 1 BasinPeriods of Recycled Water Delivery to Turner 4 BasinECTDSCl
EC, TDS, CHLORIDE TRENDSTURNER BASINS
MW TRN-2/2
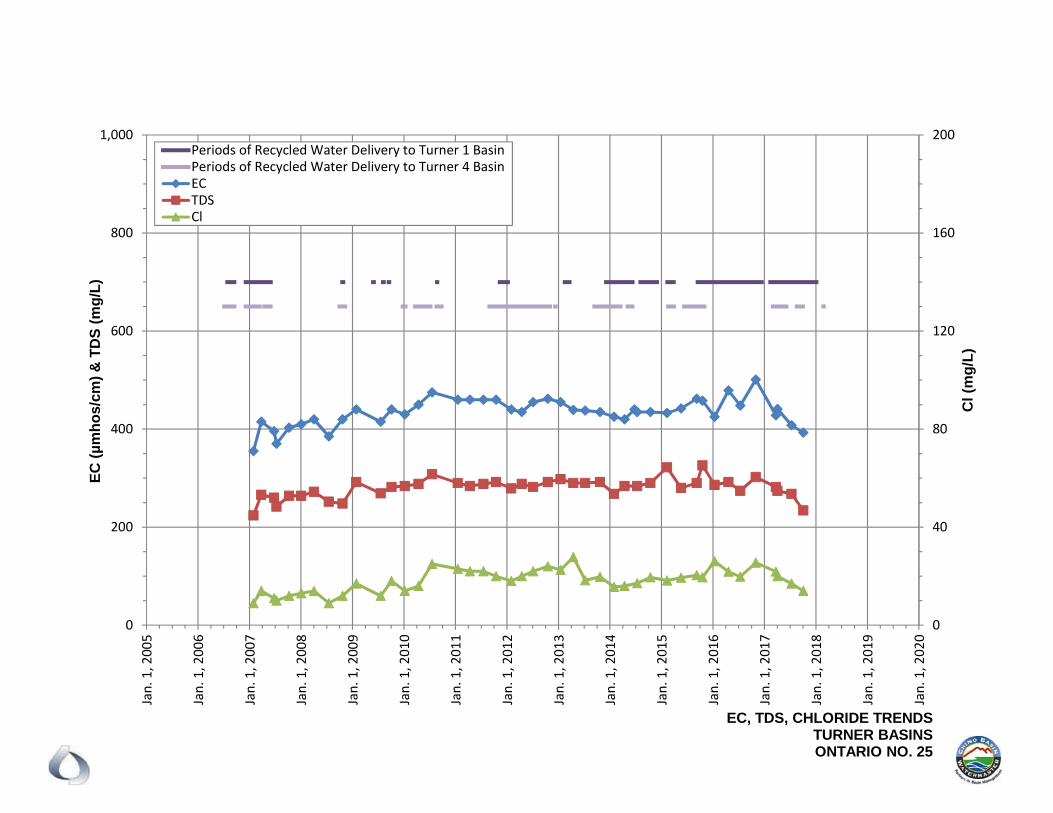
0
40
80
120
160
200
0
200
400
600
800
1,000Jan. 1, 2005
Jan. 1, 2006
Jan. 1, 2007
Jan. 1, 2008
Jan. 1, 2009
Jan. 1, 2010
Jan. 1, 2011
Jan. 1, 2012
Jan. 1, 2013
Jan. 1, 2014
Jan. 1, 2015
Jan. 1, 2016
Jan. 1, 2017
Jan. 1, 2018
Jan. 1, 2019
Jan. 1, 2020
Cl (
mg
/L)
EC
(µ
mh
os/
cm)
& T
DS
(m
g/L
)
Periods of Recycled Water Delivery to Turner 1 BasinPeriods of Recycled Water Delivery to Turner 4 BasinECTDSCl
EC, TDS, CHLORIDE TRENDSTURNER BASINSONTARIO NO. 25
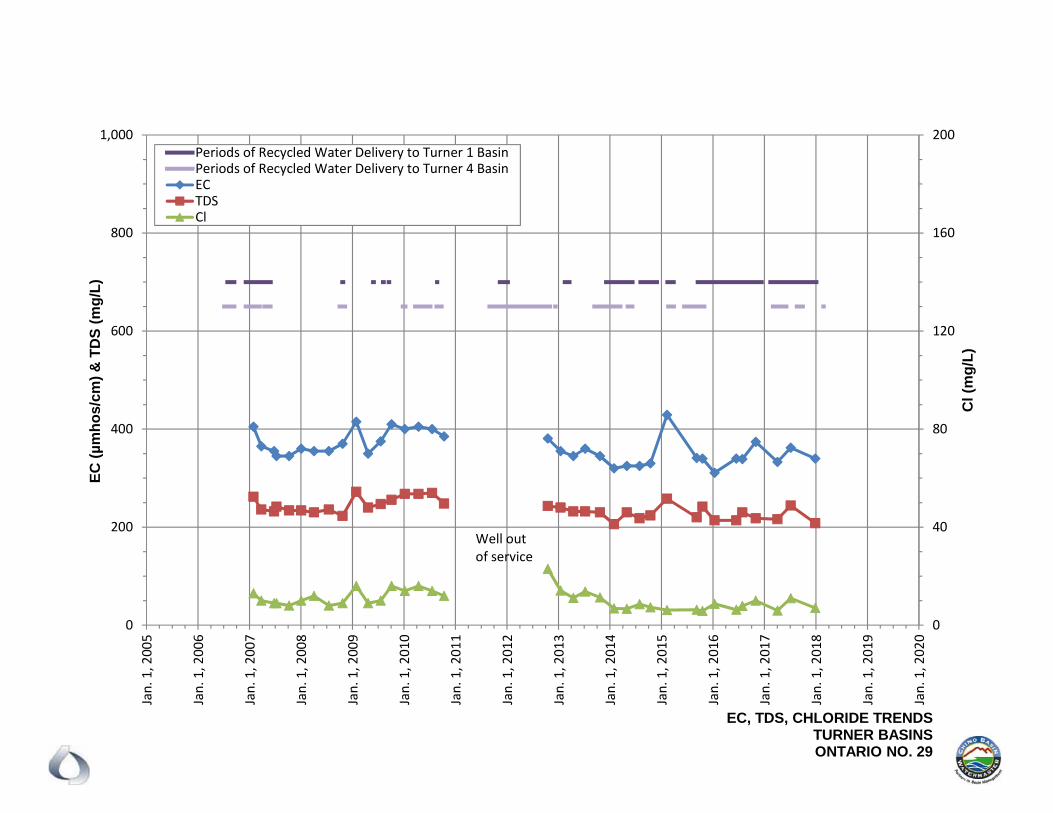
0
40
80
120
160
200
0
200
400
600
800
1,000Jan. 1, 2005
Jan. 1, 2006
Jan. 1, 2007
Jan. 1, 2008
Jan. 1, 2009
Jan. 1, 2010
Jan. 1, 2011
Jan. 1, 2012
Jan. 1, 2013
Jan. 1, 2014
Jan. 1, 2015
Jan. 1, 2016
Jan. 1, 2017
Jan. 1, 2018
Jan. 1, 2019
Jan. 1, 2020
Cl (
mg
/L)
EC
(µ
mh
os/
cm)
& T
DS
(m
g/L
)
Periods of Recycled Water Delivery to Turner 1 BasinPeriods of Recycled Water Delivery to Turner 4 BasinECTDSCl
EC, TDS, CHLORIDE TRENDSTURNER BASINSONTARIO NO. 29
Well outof service
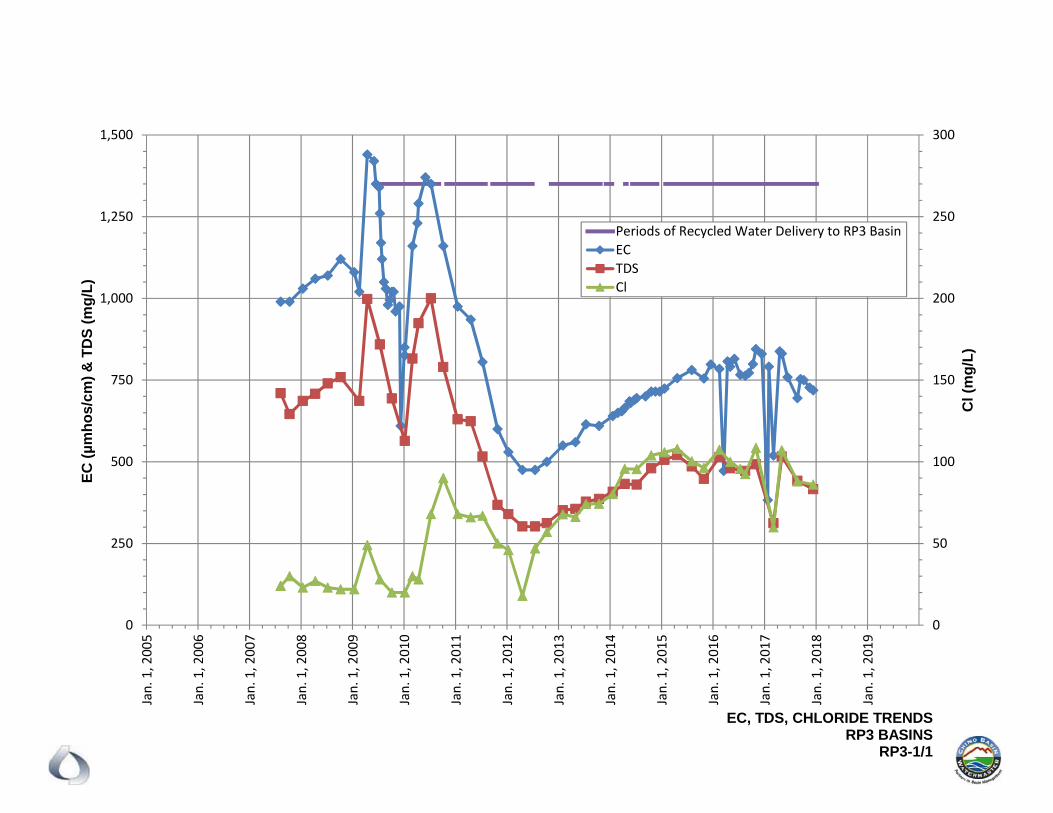
0
50
100
150
200
250
300
0
250
500
750
1,000
1,250
1,500Jan. 1, 2005
Jan. 1, 2006
Jan. 1, 2007
Jan. 1, 2008
Jan. 1, 2009
Jan. 1, 2010
Jan. 1, 2011
Jan. 1, 2012
Jan. 1, 2013
Jan. 1, 2014
Jan. 1, 2015
Jan. 1, 2016
Jan. 1, 2017
Jan. 1, 2018
Jan. 1, 2019
Cl (
mg
/L)
EC
(µ
mh
os/
cm)
& T
DS
(m
g/L
)
Periods of Recycled Water Delivery to RP3 BasinECTDSCl
EC, TDS, CHLORIDE TRENDSRP3 BASINS
RP3-1/1
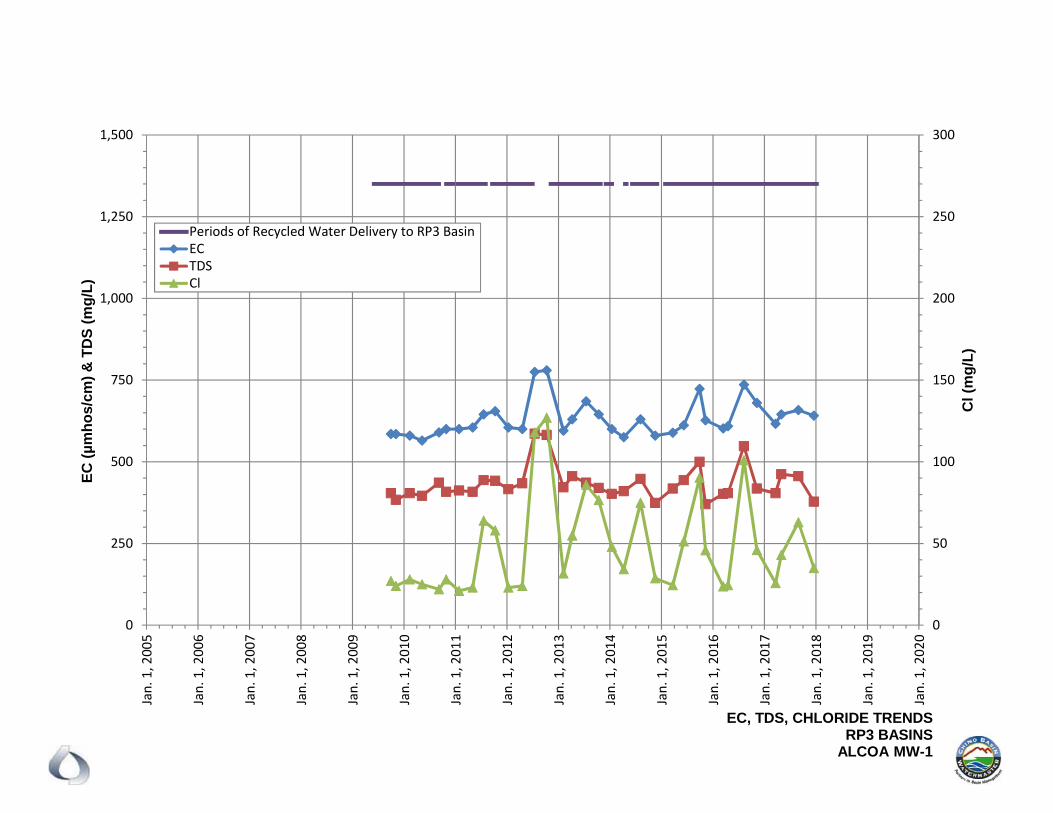
0
50
100
150
200
250
300
0
250
500
750
1,000
1,250
1,500Jan. 1, 2005
Jan. 1, 2006
Jan. 1, 2007
Jan. 1, 2008
Jan. 1, 2009
Jan. 1, 2010
Jan. 1, 2011
Jan. 1, 2012
Jan. 1, 2013
Jan. 1, 2014
Jan. 1, 2015
Jan. 1, 2016
Jan. 1, 2017
Jan. 1, 2018
Jan. 1, 2019
Jan. 1, 2020
Cl (
mg
/L)
EC
(µ
mh
os/
cm)
& T
DS
(m
g/L
)
Periods of Recycled Water Delivery to RP3 BasinECTDSCl
EC, TDS, CHLORIDE TRENDSRP3 BASINS
ALCOA MW-1
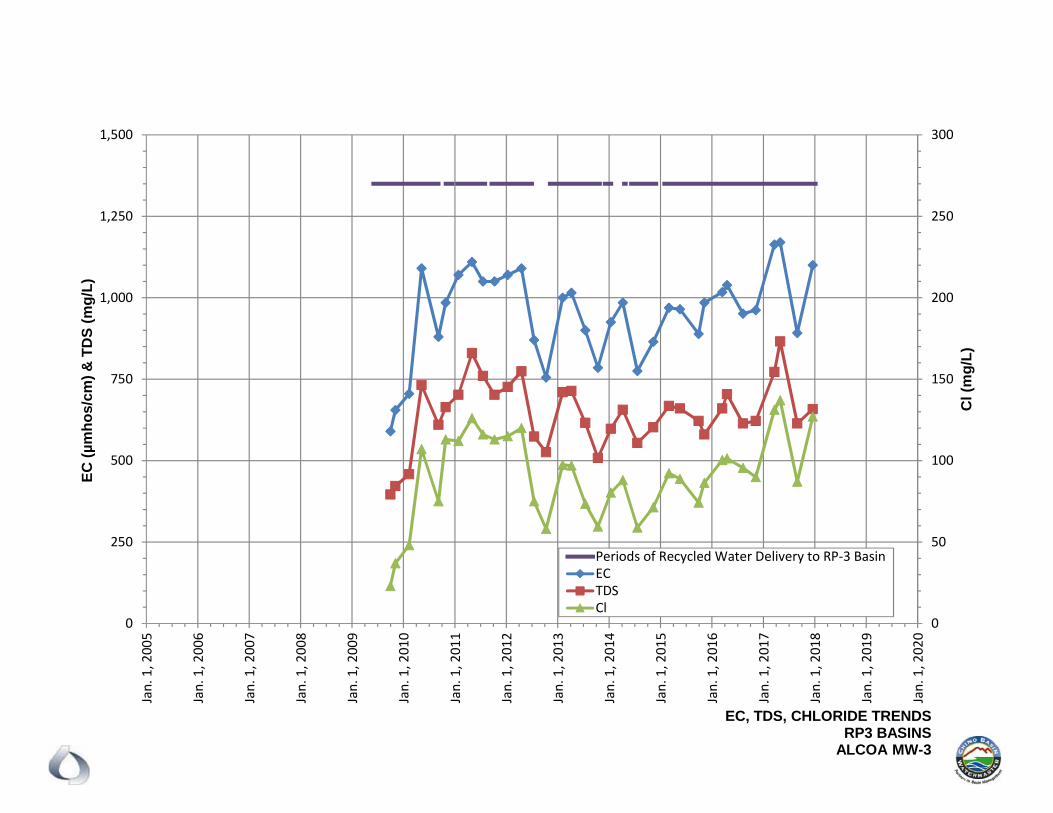
0
50
100
150
200
250
300
0
250
500
750
1,000
1,250
1,500Jan. 1, 2005
Jan. 1, 2006
Jan. 1, 2007
Jan. 1, 2008
Jan. 1, 2009
Jan. 1, 2010
Jan. 1, 2011
Jan. 1, 2012
Jan. 1, 2013
Jan. 1, 2014
Jan. 1, 2015
Jan. 1, 2016
Jan. 1, 2017
Jan. 1, 2018
Jan. 1, 2019
Jan. 1, 2020
Cl (
mg
/L)
EC
(µ
mh
os/
cm)
& T
DS
(m
g/L
)
Periods of Recycled Water Delivery to RP‐3 BasinECTDSCl
EC, TDS, CHLORIDE TRENDSRP3 BASINS
ALCOA MW-3
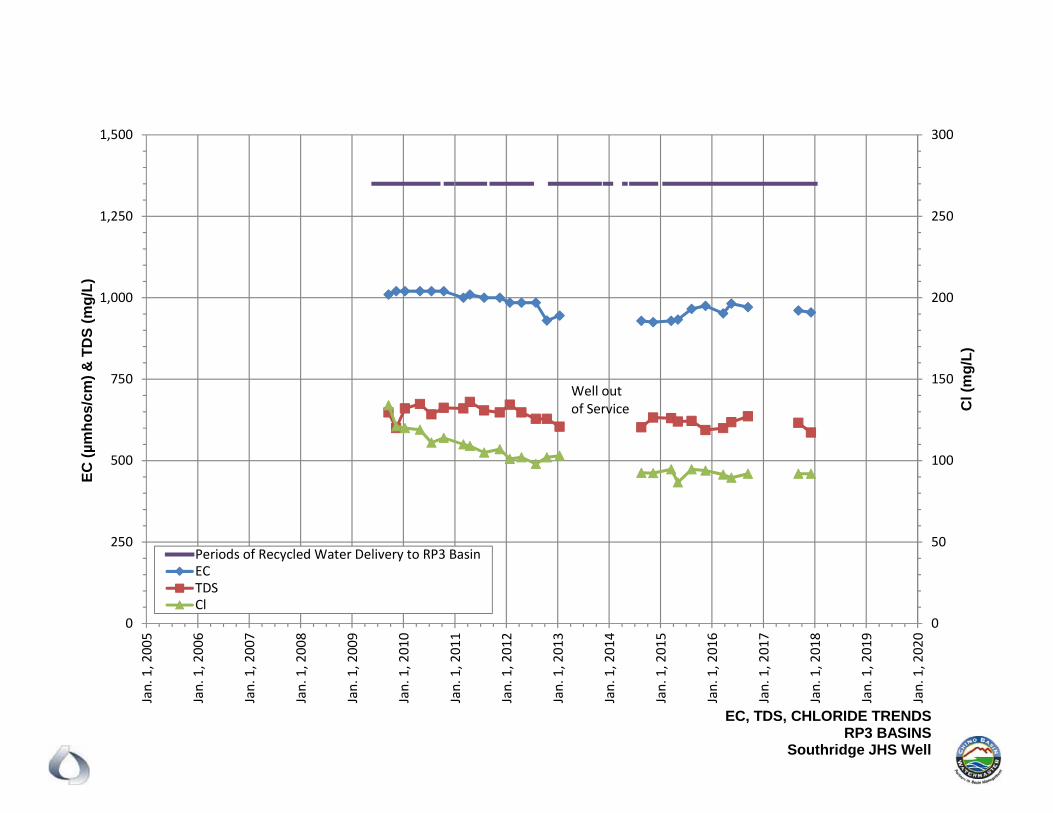
0
50
100
150
200
250
300
0
250
500
750
1,000
1,250
1,500Jan. 1, 2005
Jan. 1, 2006
Jan. 1, 2007
Jan. 1, 2008
Jan. 1, 2009
Jan. 1, 2010
Jan. 1, 2011
Jan. 1, 2012
Jan. 1, 2013
Jan. 1, 2014
Jan. 1, 2015
Jan. 1, 2016
Jan. 1, 2017
Jan. 1, 2018
Jan. 1, 2019
Jan. 1, 2020
Cl (
mg
/L)
EC
(µ
mh
os/
cm)
& T
DS
(m
g/L
)
Periods of Recycled Water Delivery to RP3 BasinECTDSCl
EC, TDS, CHLORIDE TRENDSRP3 BASINS
Southridge JHS Well
Well out of Service
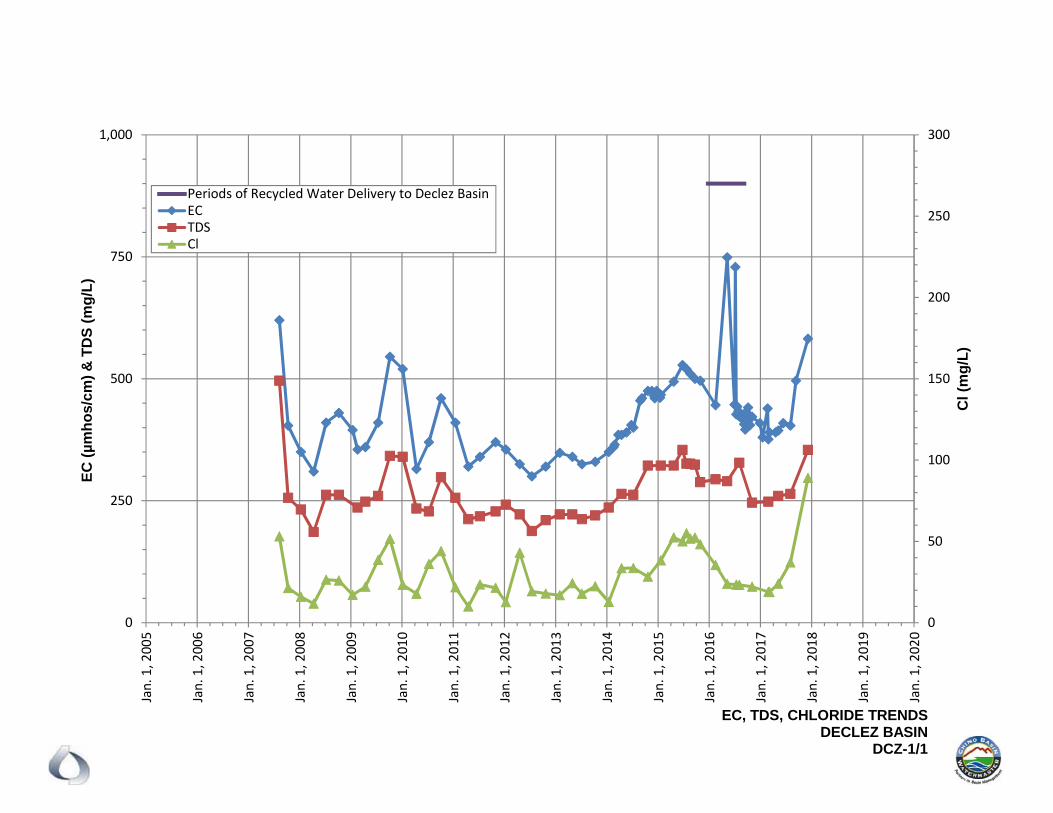
0
50
100
150
200
250
300
0
250
500
750
1,000Jan. 1, 2005
Jan. 1, 2006
Jan. 1, 2007
Jan. 1, 2008
Jan. 1, 2009
Jan. 1, 2010
Jan. 1, 2011
Jan. 1, 2012
Jan. 1, 2013
Jan. 1, 2014
Jan. 1, 2015
Jan. 1, 2016
Jan. 1, 2017
Jan. 1, 2018
Jan. 1, 2019
Jan. 1, 2020
Cl (
mg
/L)
EC
(µ
mh
os/
cm)
& T
DS
(m
g/L
)
Periods of Recycled Water Delivery to Declez BasinECTDSCl
EC, TDS, CHLORIDE TRENDSDECLEZ BASIN
DCZ-1/1
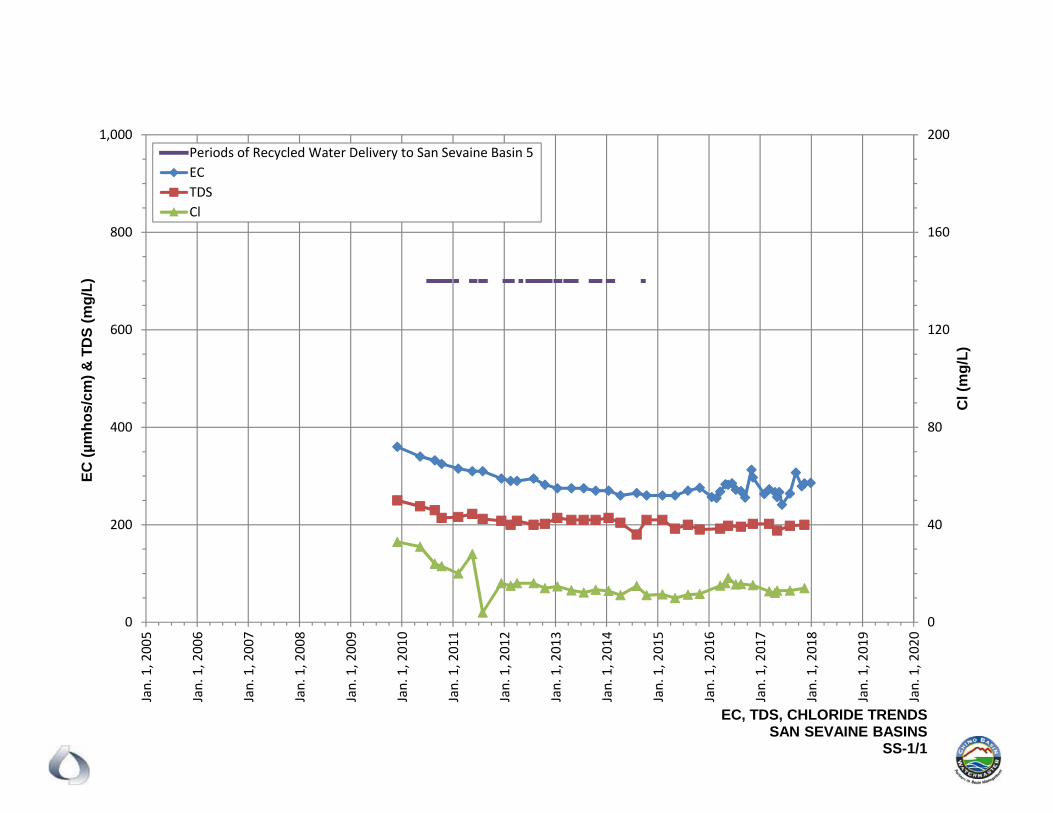
0
40
80
120
160
200
0
200
400
600
800
1,000Jan. 1, 2005
Jan. 1, 2006
Jan. 1, 2007
Jan. 1, 2008
Jan. 1, 2009
Jan. 1, 2010
Jan. 1, 2011
Jan. 1, 2012
Jan. 1, 2013
Jan. 1, 2014
Jan. 1, 2015
Jan. 1, 2016
Jan. 1, 2017
Jan. 1, 2018
Jan. 1, 2019
Jan. 1, 2020
Cl (
mg
/L)
EC
(µ
mh
os/
cm)
& T
DS
(m
g/L
)
Periods of Recycled Water Delivery to San Sevaine Basin 5ECTDSCl
EC, TDS, CHLORIDE TRENDSSAN SEVAINE BASINS
SS-1/1
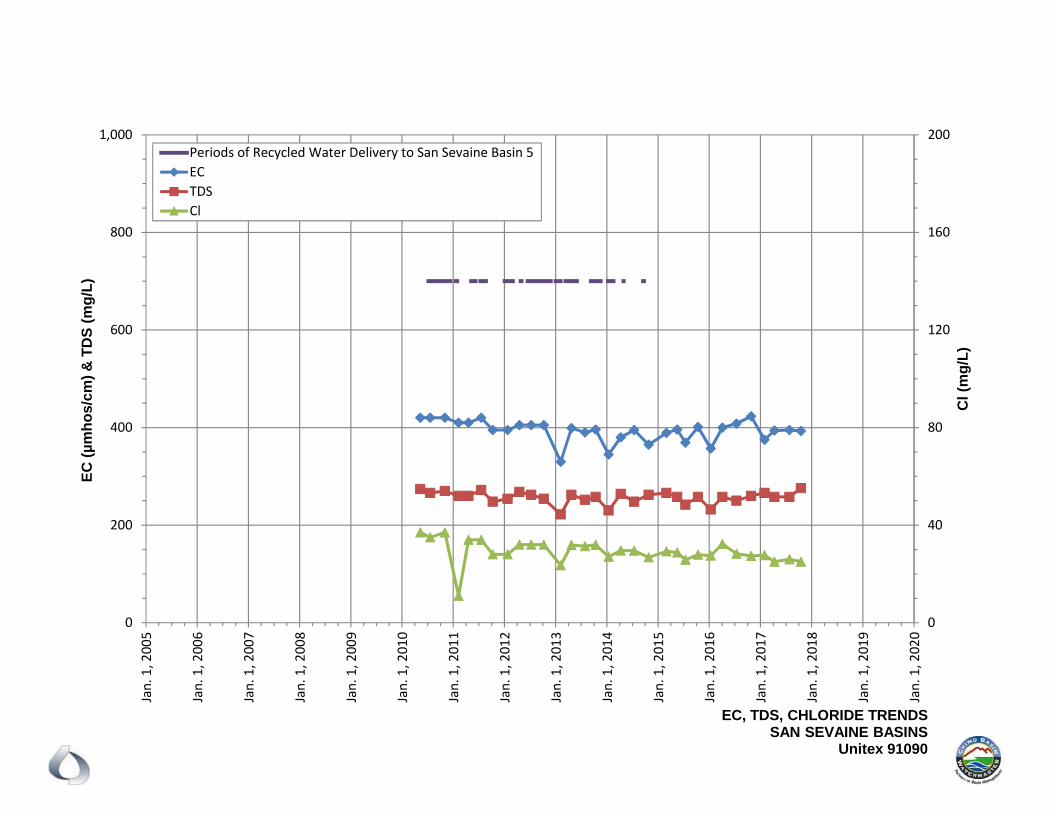
0
40
80
120
160
200
0
200
400
600
800
1,000Jan. 1, 2005
Jan. 1, 2006
Jan. 1, 2007
Jan. 1, 2008
Jan. 1, 2009
Jan. 1, 2010
Jan. 1, 2011
Jan. 1, 2012
Jan. 1, 2013
Jan. 1, 2014
Jan. 1, 2015
Jan. 1, 2016
Jan. 1, 2017
Jan. 1, 2018
Jan. 1, 2019
Jan. 1, 2020
Cl (
mg
/L)
EC
(µ
mh
os/
cm)
& T
DS
(m
g/L
)
Periods of Recycled Water Delivery to San Sevaine Basin 5ECTDSCl
EC, TDS, CHLORIDE TRENDSSAN SEVAINE BASINS
Unitex 91090
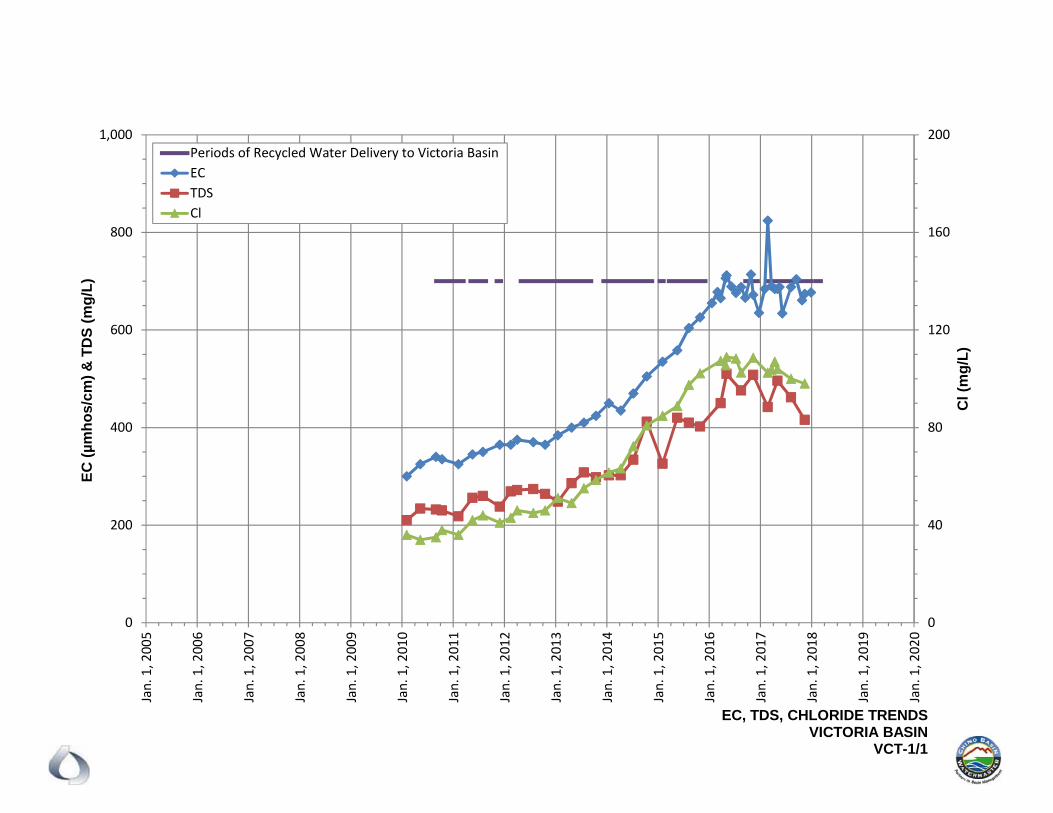
0
40
80
120
160
200
0
200
400
600
800
1,000Jan. 1, 2005
Jan. 1, 2006
Jan. 1, 2007
Jan. 1, 2008
Jan. 1, 2009
Jan. 1, 2010
Jan. 1, 2011
Jan. 1, 2012
Jan. 1, 2013
Jan. 1, 2014
Jan. 1, 2015
Jan. 1, 2016
Jan. 1, 2017
Jan. 1, 2018
Jan. 1, 2019
Jan. 1, 2020
Cl (
mg
/L)
EC
(µ
mh
os/
cm)
& T
DS
(m
g/L
)
Periods of Recycled Water Delivery to Victoria BasinECTDSCl
EC, TDS, CHLORIDE TRENDSVICTORIA BASIN
VCT-1/1

0
40
80
120
160
200
0
200
400
600
800
1,000Jan. 1, 2005
Jan. 1, 2006
Jan. 1, 2007
Jan. 1, 2008
Jan. 1, 2009
Jan. 1, 2010
Jan. 1, 2011
Jan. 1, 2012
Jan. 1, 2013
Jan. 1, 2014
Jan. 1, 2015
Jan. 1, 2016
Jan. 1, 2017
Jan. 1, 2018
Jan. 1, 2019
Jan. 1, 2020
Cl (
mg
/L)
EC
(µ
mh
os/
cm)
& T
DS
(m
g/L
)
Periods of Recycled Water Delivery to Victoria BasinECTDSCl
EC, TDS, CHLORIDE TRENDSVICTORIA BASIN
VCT-2/2
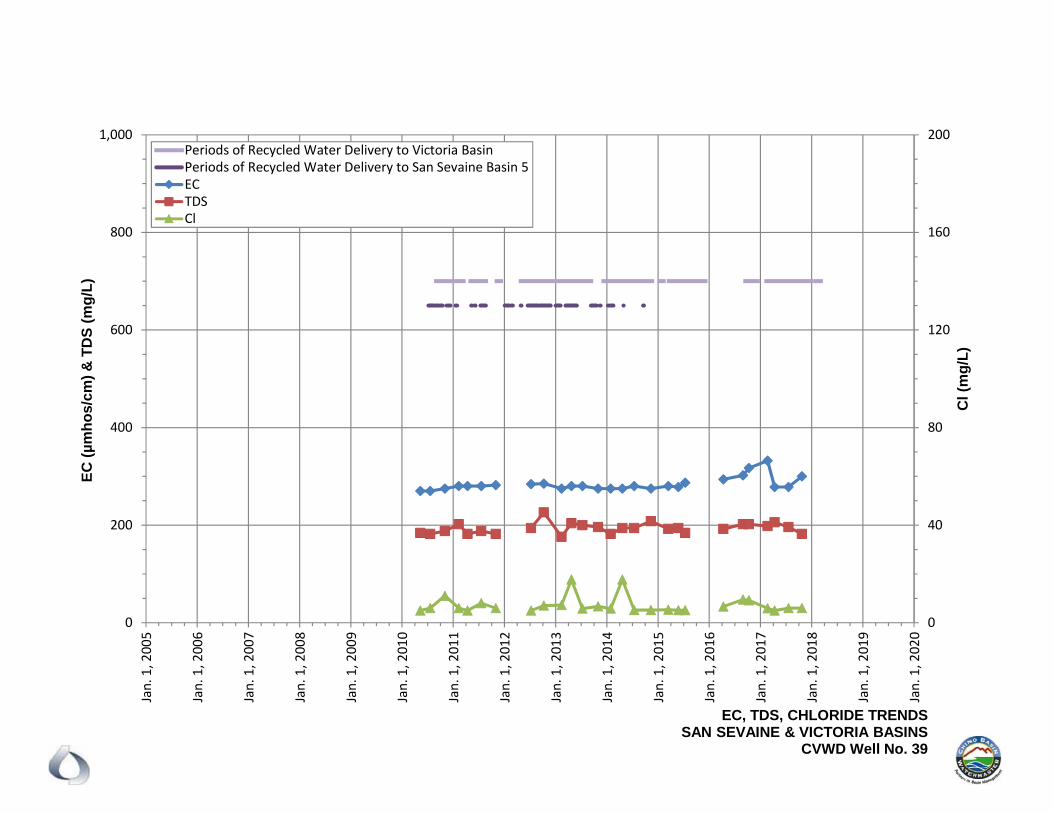
0
40
80
120
160
200
0
200
400
600
800
1,000Jan. 1, 2005
Jan. 1, 2006
Jan. 1, 2007
Jan. 1, 2008
Jan. 1, 2009
Jan. 1, 2010
Jan. 1, 2011
Jan. 1, 2012
Jan. 1, 2013
Jan. 1, 2014
Jan. 1, 2015
Jan. 1, 2016
Jan. 1, 2017
Jan. 1, 2018
Jan. 1, 2019
Jan. 1, 2020
Cl (
mg
/L)
EC
(µ
mh
os/
cm)
& T
DS
(m
g/L
)
Periods of Recycled Water Delivery to Victoria BasinPeriods of Recycled Water Delivery to San Sevaine Basin 5ECTDSCl
EC, TDS, CHLORIDE TRENDSSAN SEVAINE & VICTORIA BASINS
CVWD Well No. 39

APPENDIX D
MONITORING WELL HYDROGRAPHS
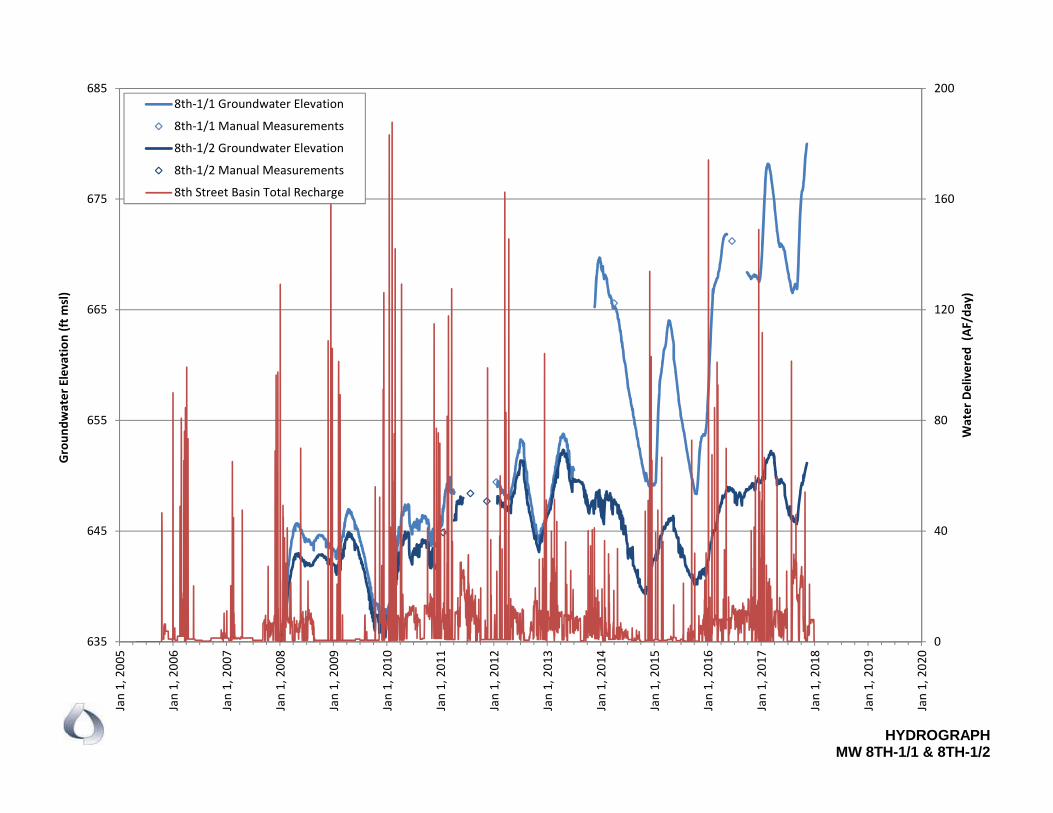
0
40
80
120
160
200
635
645
655
665
675
685
Jan 1, 200
5
Jan 1, 200
6
Jan 1, 200
7
Jan 1, 200
8
Jan 1, 200
9
Jan 1, 201
0
Jan 1, 201
1
Jan 1, 201
2
Jan 1, 201
3
Jan 1, 201
4
Jan 1, 201
5
Jan 1, 201
6
Jan 1, 201
7
Jan 1, 201
8
Jan 1, 201
9
Jan 1, 202
0
Water Delivered
(AF
/day)
Groun
dwater Elevatio
n (ft m
sl)
8th‐1/1 Groundwater Elevation
8th‐1/1 Manual Measurements
8th‐1/2 Groundwater Elevation
8th‐1/2 Manual Measurements
8th Street Basin Total Recharge
HYDROGRAPHMW 8TH-1/1 & 8TH-1/2
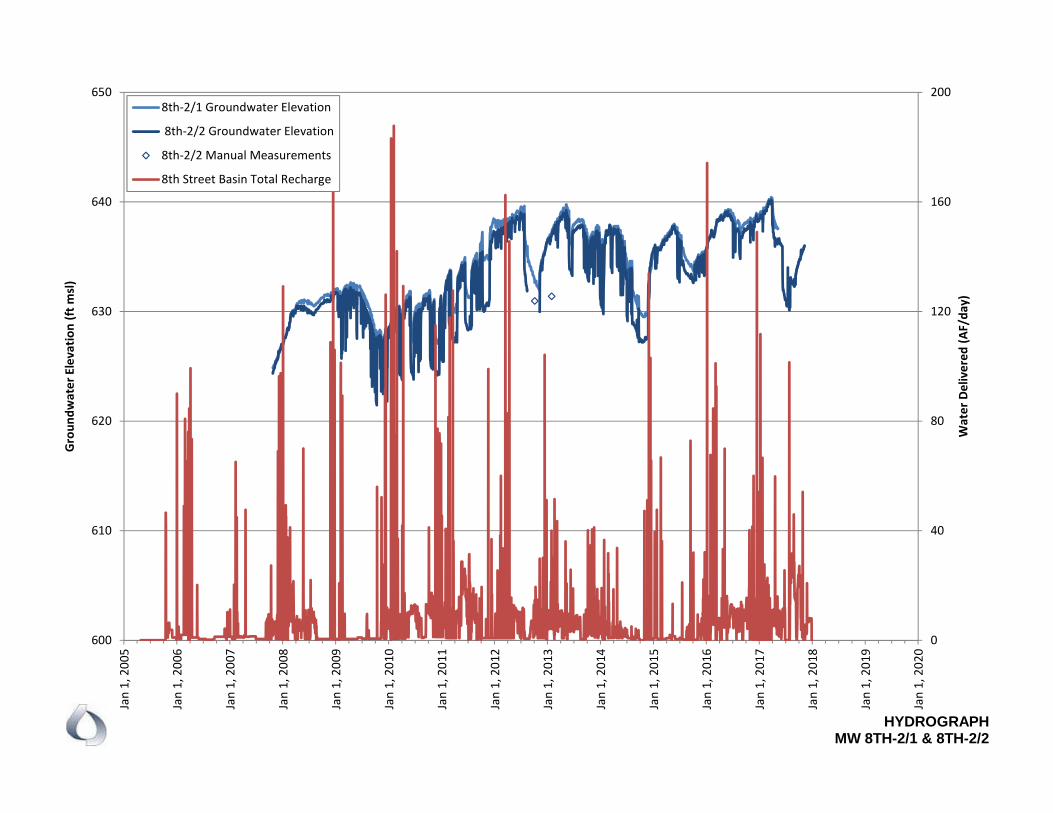
0
40
80
120
160
200
600
610
620
630
640
650
Jan 1, 200
5
Jan 1, 200
6
Jan 1, 200
7
Jan 1, 200
8
Jan 1, 200
9
Jan 1, 201
0
Jan 1, 201
1
Jan 1, 201
2
Jan 1, 201
3
Jan 1, 201
4
Jan 1, 201
5
Jan 1, 201
6
Jan 1, 201
7
Jan 1, 201
8
Jan 1, 201
9
Jan 1, 202
0
Water Delivered
(AF/da
y)
Groun
dwater Elevatio
n (ft m
sl)
8th‐2/1 Groundwater Elevation
8th‐2/2 Groundwater Elevation
8th‐2/2 Manual Measurements
8th Street Basin Total Recharge
HYDROGRAPHMW 8TH-2/1 & 8TH-2/2
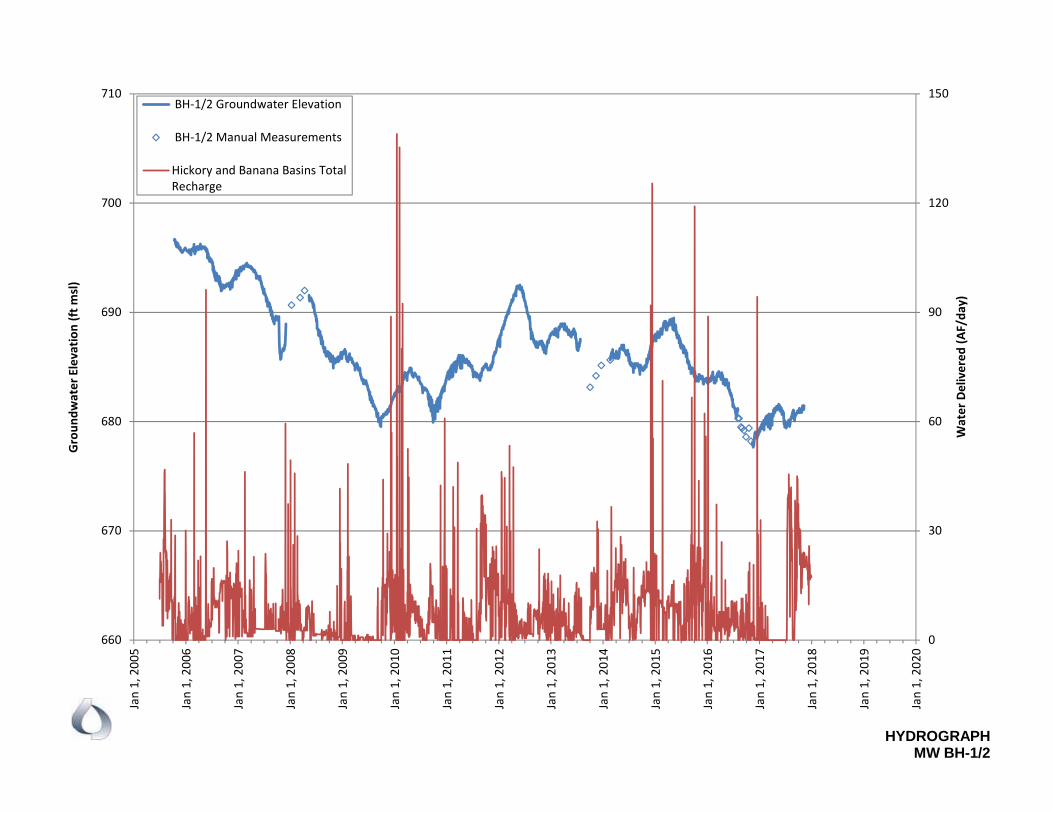
0
30
60
90
120
150
660
670
680
690
700
710
Jan 1, 200
5
Jan 1, 200
6
Jan 1, 200
7
Jan 1, 200
8
Jan 1, 200
9
Jan 1, 201
0
Jan 1, 201
1
Jan 1, 201
2
Jan 1, 201
3
Jan 1, 201
4
Jan 1, 201
5
Jan 1, 201
6
Jan 1, 201
7
Jan 1, 201
8
Jan 1, 201
9
Jan 1, 202
0
Water Delivered
(AF/da
y)
Groun
dwater Elevatio
n (ft m
sl)
BH‐1/2 Groundwater Elevation
BH‐1/2 Manual Measurements
Hickory and Banana Basins TotalRecharge
HYDROGRAPHMW BH-1/2
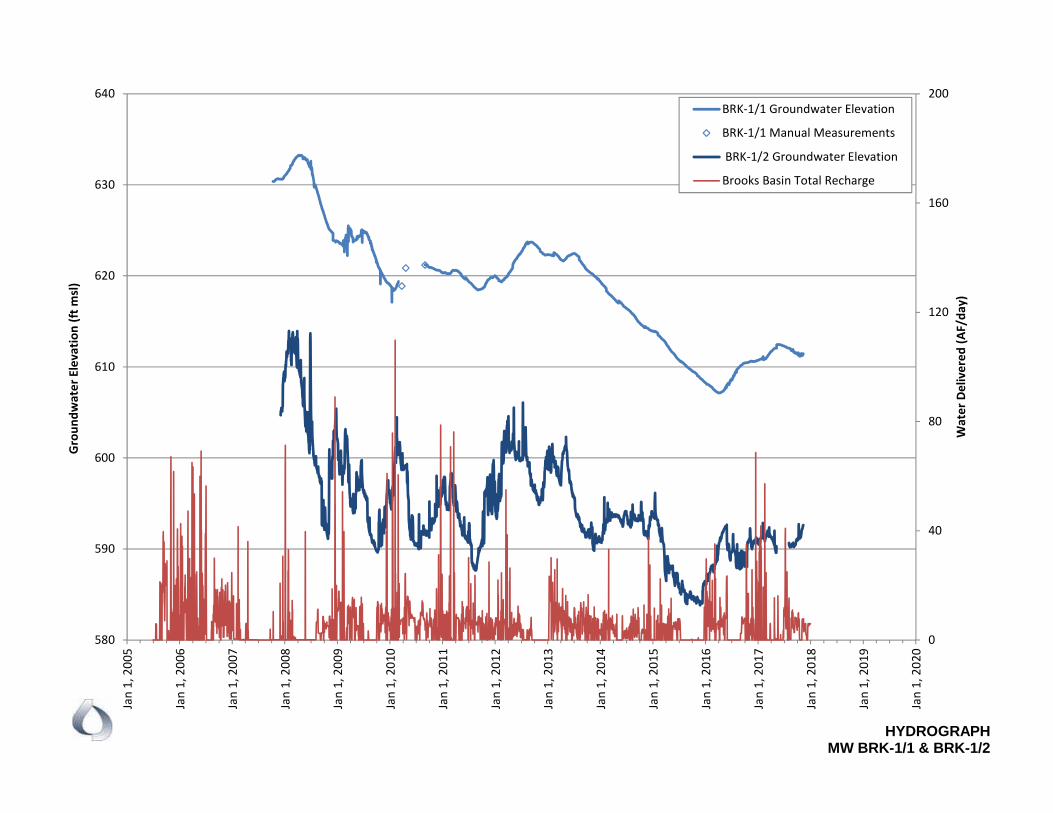
0
40
80
120
160
200
580
590
600
610
620
630
640
Jan 1, 200
5
Jan 1, 200
6
Jan 1, 200
7
Jan 1, 200
8
Jan 1, 200
9
Jan 1, 201
0
Jan 1, 201
1
Jan 1, 201
2
Jan 1, 201
3
Jan 1, 201
4
Jan 1, 201
5
Jan 1, 201
6
Jan 1, 201
7
Jan 1, 201
8
Jan 1, 201
9
Jan 1, 202
0
Water Delivered
(AF/da
y)
Groun
dwater Elevatio
n (ft m
sl)
BRK‐1/1 Groundwater Elevation
BRK‐1/1 Manual Measurements
BRK‐1/2 Groundwater Elevation
Brooks Basin Total Recharge
HYDROGRAPHMW BRK-1/1 & BRK-1/2
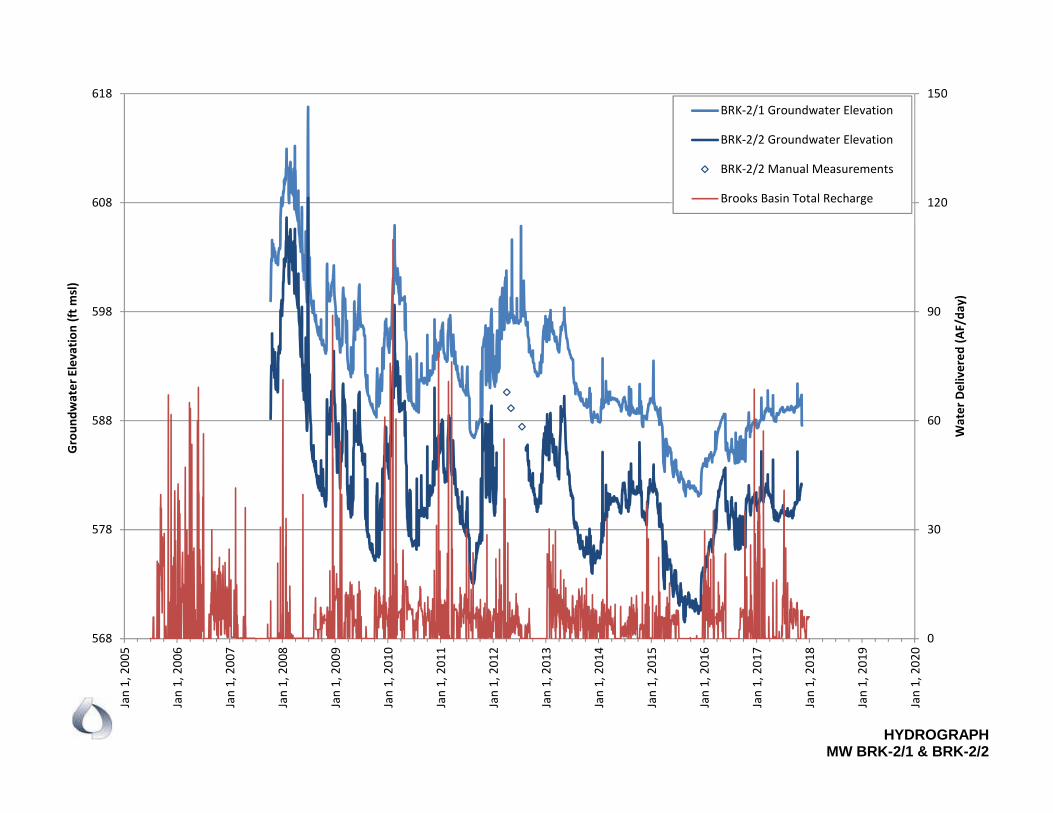
0
30
60
90
120
150
568
578
588
598
608
618
Jan 1, 200
5
Jan 1, 200
6
Jan 1, 200
7
Jan 1, 200
8
Jan 1, 200
9
Jan 1, 201
0
Jan 1, 201
1
Jan 1, 201
2
Jan 1, 201
3
Jan 1, 201
4
Jan 1, 201
5
Jan 1, 201
6
Jan 1, 201
7
Jan 1, 201
8
Jan 1, 201
9
Jan 1, 202
0
Water Delivered
(AF/da
y)
Groun
dwater Elevatio
n (ft m
sl)
BRK‐2/1 Groundwater Elevation
BRK‐2/2 Groundwater Elevation
BRK‐2/2 Manual Measurements
Brooks Basin Total Recharge
HYDROGRAPHMW BRK-2/1 & BRK-2/2
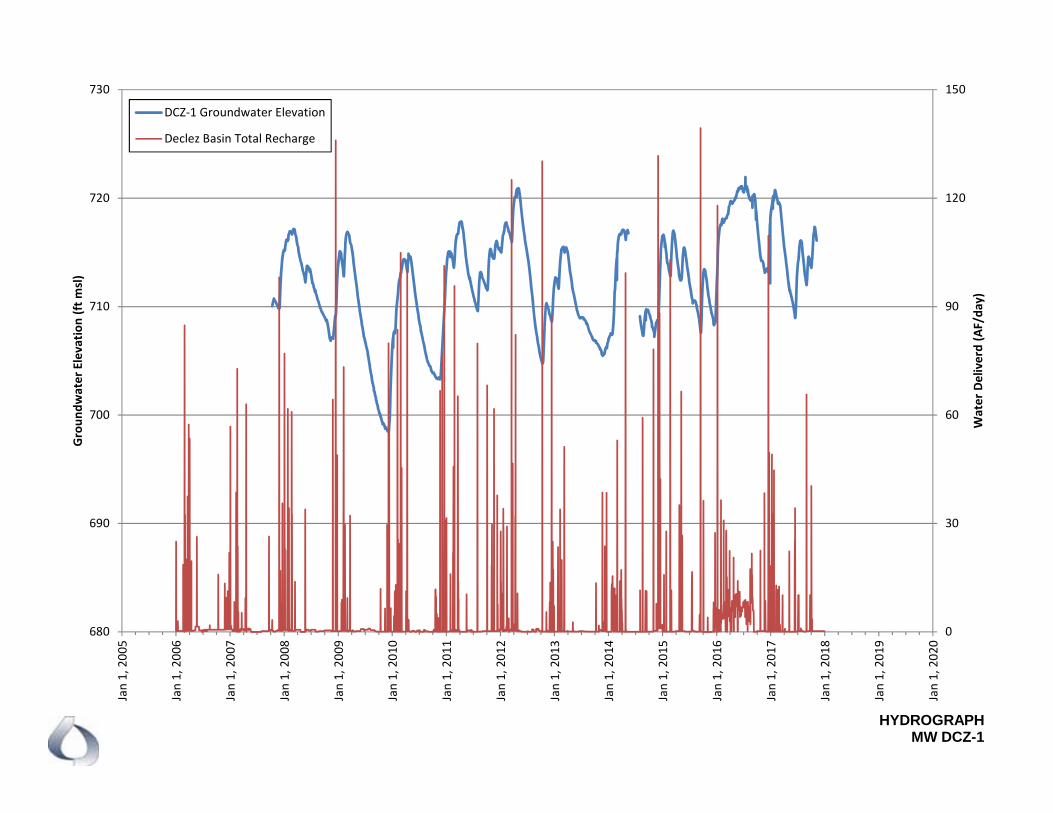
0
30
60
90
120
150
680
690
700
710
720
730
Jan 1, 200
5
Jan 1, 200
6
Jan 1, 200
7
Jan 1, 200
8
Jan 1, 200
9
Jan 1, 201
0
Jan 1, 201
1
Jan 1, 201
2
Jan 1, 201
3
Jan 1, 201
4
Jan 1, 201
5
Jan 1, 201
6
Jan 1, 201
7
Jan 1, 201
8
Jan 1, 201
9
Jan 1, 202
0
Water Deliverd (AF/da
y)
Groun
dwater Elevatio
n (ft m
sl)
DCZ‐1 Groundwater Elevation
Declez Basin Total Recharge
HYDROGRAPHMW DCZ-1
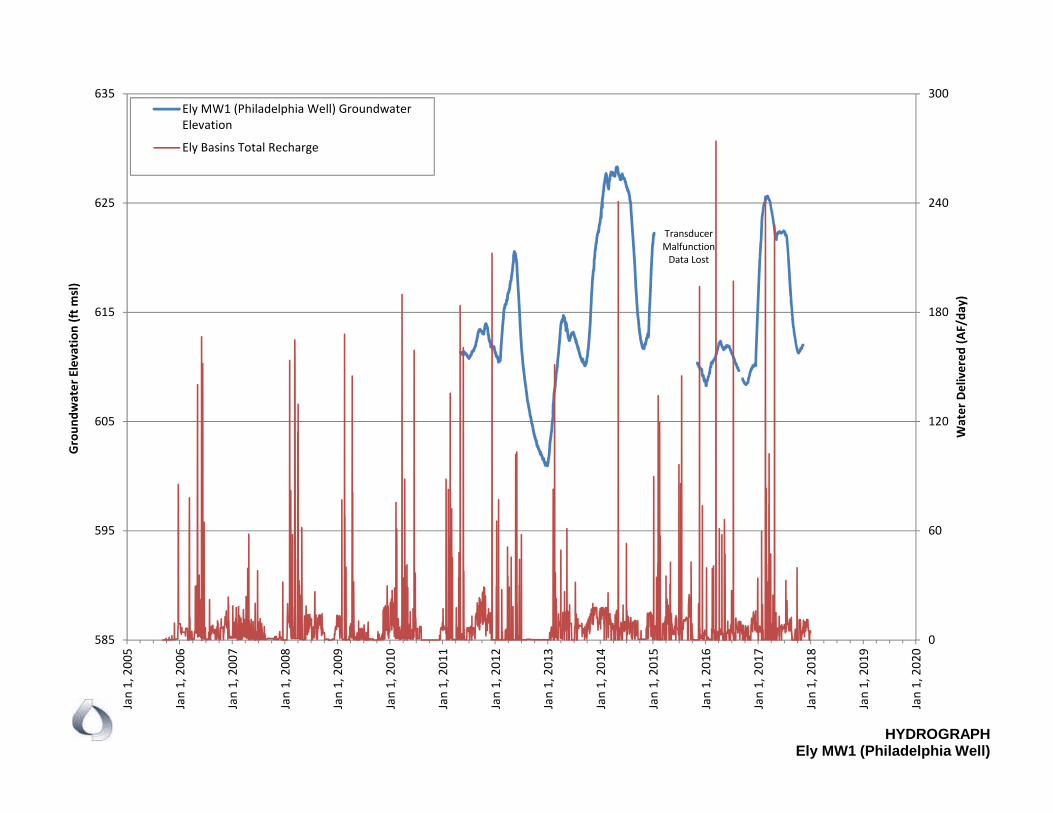
0
60
120
180
240
300
585
595
605
615
625
635
Jan 1, 200
5
Jan 1, 200
6
Jan 1, 200
7
Jan 1, 200
8
Jan 1, 200
9
Jan 1, 201
0
Jan 1, 201
1
Jan 1, 201
2
Jan 1, 201
3
Jan 1, 201
4
Jan 1, 201
5
Jan 1, 201
6
Jan 1, 201
7
Jan 1, 201
8
Jan 1, 201
9
Jan 1, 202
0
Water Delivered
(AF/da
y)
Groun
dwater Elevatio
n (ft m
sl)
Ely MW1 (Philadelphia Well) GroundwaterElevation
Ely Basins Total Recharge
HYDROGRAPHEly MW1 (Philadelphia Well)
Transducer MalfunctionData Lost
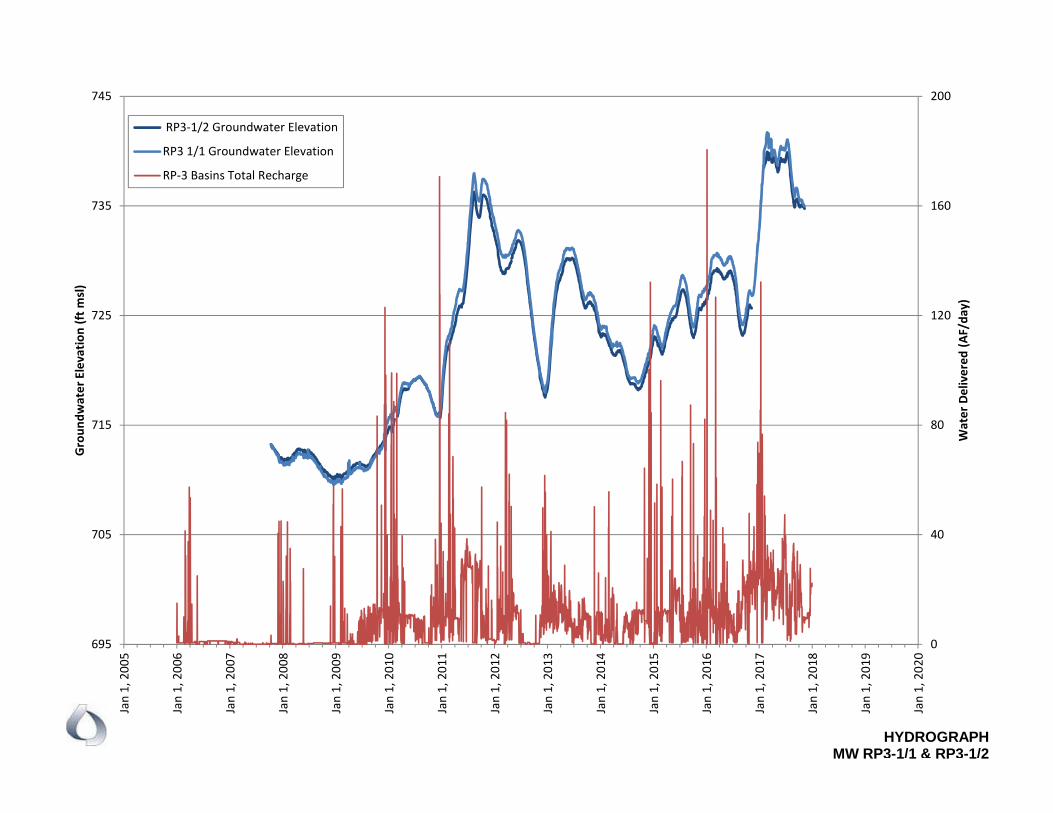
0
40
80
120
160
200
695
705
715
725
735
745
Jan 1, 200
5
Jan 1, 200
6
Jan 1, 200
7
Jan 1, 200
8
Jan 1, 200
9
Jan 1, 201
0
Jan 1, 201
1
Jan 1, 201
2
Jan 1, 201
3
Jan 1, 201
4
Jan 1, 201
5
Jan 1, 201
6
Jan 1, 201
7
Jan 1, 201
8
Jan 1, 201
9
Jan 1, 202
0
Water Delivered
(AF/da
y)
Groun
dwater Elevatio
n (ft m
sl)
RP3‐1/2 Groundwater Elevation
RP3 1/1 Groundwater Elevation
RP‐3 Basins Total Recharge
HYDROGRAPHMW RP3-1/1 & RP3-1/2
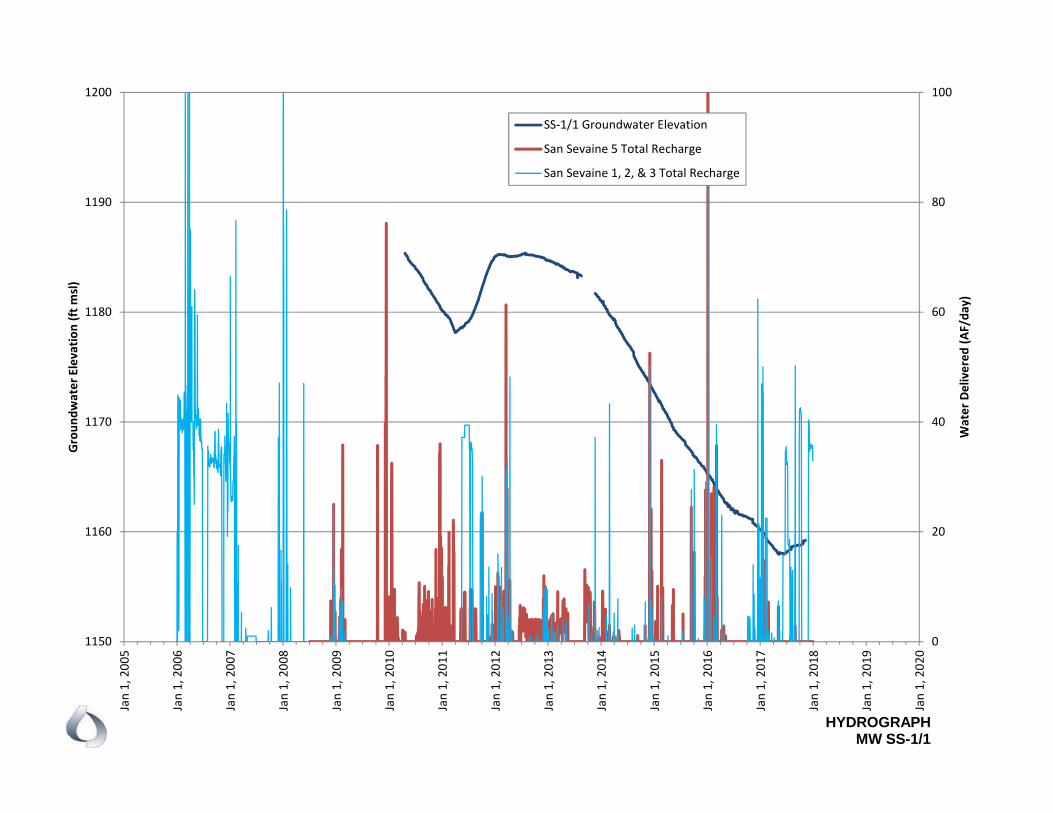
0
20
40
60
80
100
1150
1160
1170
1180
1190
1200
Jan 1, 200
5
Jan 1, 200
6
Jan 1, 200
7
Jan 1, 200
8
Jan 1, 200
9
Jan 1, 201
0
Jan 1, 201
1
Jan 1, 201
2
Jan 1, 201
3
Jan 1, 201
4
Jan 1, 201
5
Jan 1, 201
6
Jan 1, 201
7
Jan 1, 201
8
Jan 1, 201
9
Jan 1, 202
0
Water Delivered
(AF/da
y)
Groun
dwater Elevatio
n (ft m
sl)
SS‐1/1 Groundwater Elevation
San Sevaine 5 Total Recharge
San Sevaine 1, 2, & 3 Total Recharge
HYDROGRAPHMW SS-1/1
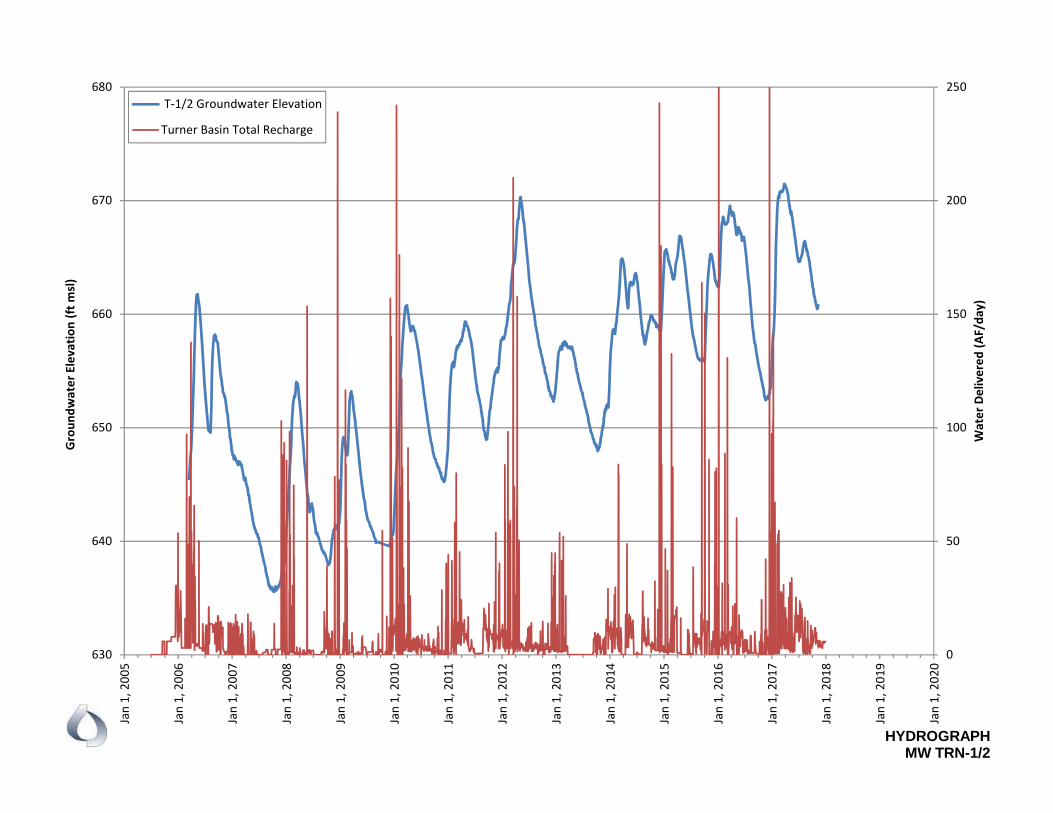
0
50
100
150
200
250
630
640
650
660
670
680
Jan 1, 200
5
Jan 1, 200
6
Jan 1, 200
7
Jan 1, 200
8
Jan 1, 200
9
Jan 1, 201
0
Jan 1, 201
1
Jan 1, 201
2
Jan 1, 201
3
Jan 1, 201
4
Jan 1, 201
5
Jan 1, 201
6
Jan 1, 201
7
Jan 1, 201
8
Jan 1, 201
9
Jan 1, 202
0
Water Delivered
(AF/da
y)
Groun
dwater Elevatio
n (ft m
sl)
T‐1/2 Groundwater Elevation
Turner Basin Total Recharge
HYDROGRAPHMW TRN-1/2
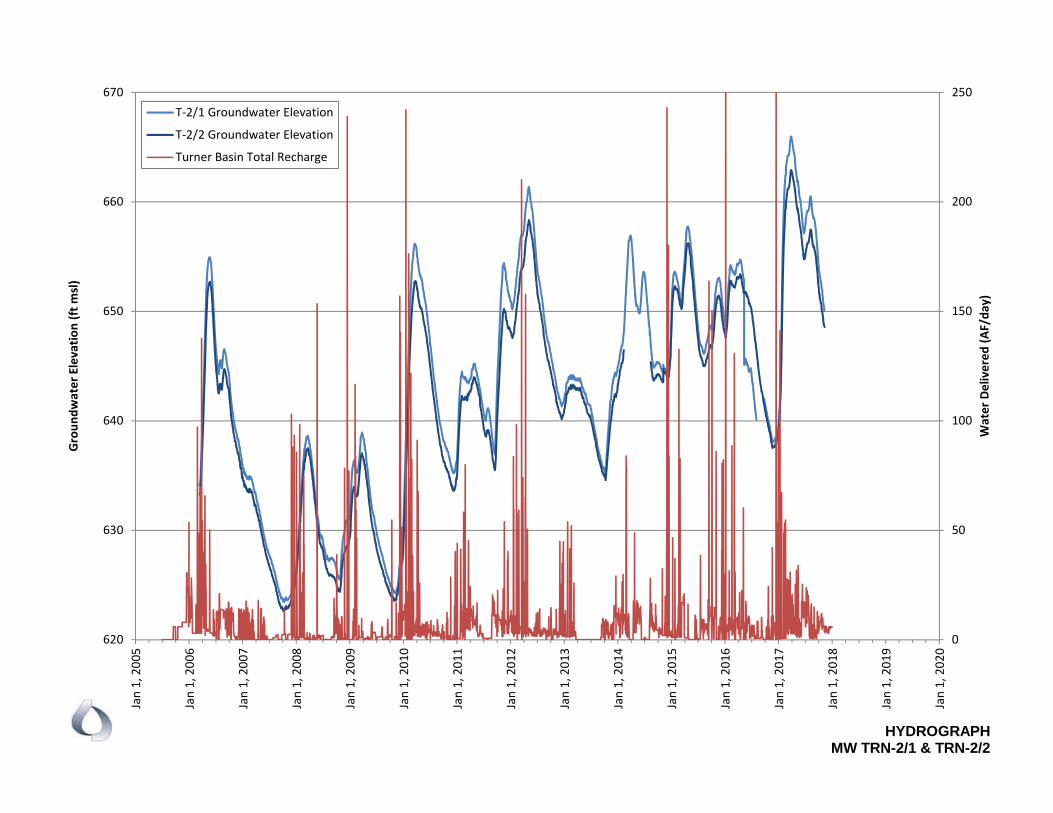
0
50
100
150
200
250
620
630
640
650
660
670
Jan 1, 200
5
Jan 1, 200
6
Jan 1, 200
7
Jan 1, 200
8
Jan 1, 200
9
Jan 1, 201
0
Jan 1, 201
1
Jan 1, 201
2
Jan 1, 201
3
Jan 1, 201
4
Jan 1, 201
5
Jan 1, 201
6
Jan 1, 201
7
Jan 1, 201
8
Jan 1, 201
9
Jan 1, 202
0
Water Delivered
(AF/da
y)
Groun
dwater Elevatio
n (ft m
sl)
T‐2/1 Groundwater Elevation
T‐2/2 Groundwater Elevation
Turner Basin Total Recharge
HYDROGRAPHMW TRN-2/1 & TRN-2/2
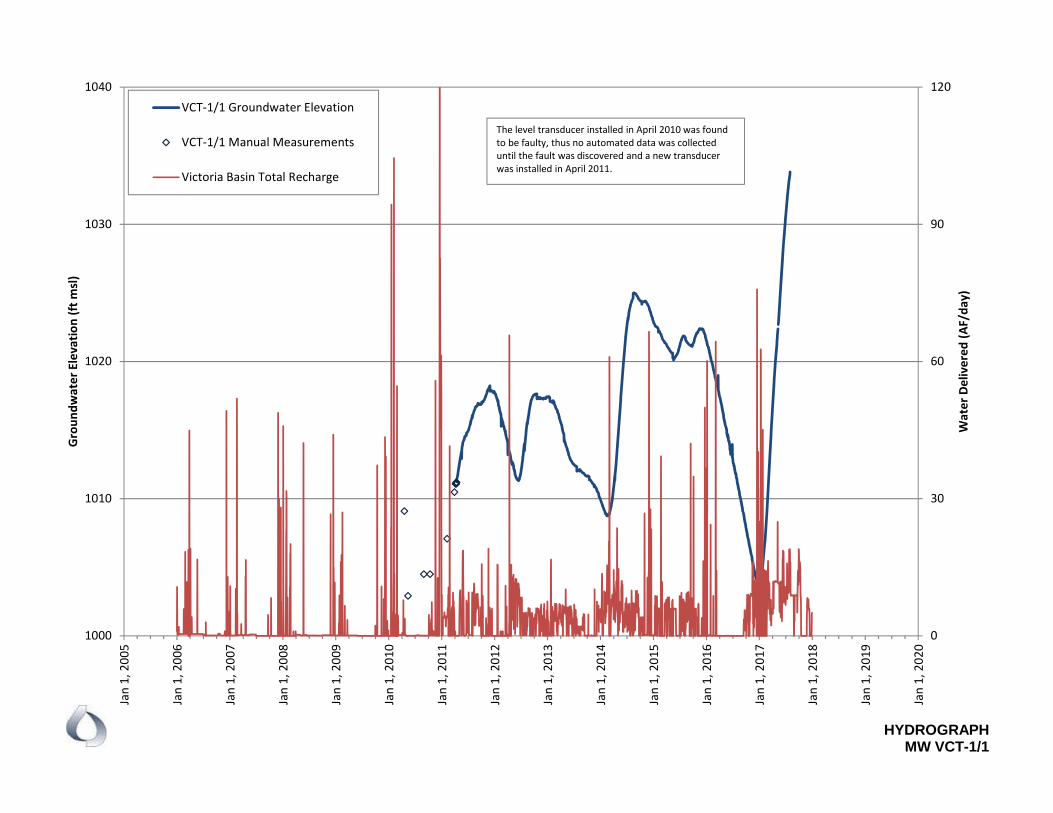
0
30
60
90
120
1000
1010
1020
1030
1040
Jan 1, 200
5
Jan 1, 200
6
Jan 1, 200
7
Jan 1, 200
8
Jan 1, 200
9
Jan 1, 201
0
Jan 1, 201
1
Jan 1, 201
2
Jan 1, 201
3
Jan 1, 201
4
Jan 1, 201
5
Jan 1, 201
6
Jan 1, 201
7
Jan 1, 201
8
Jan 1, 201
9
Jan 1, 202
0
Water Delivered
(AF/da
y)
Groun
dwater Elevatio
n (ft m
sl)
VCT‐1/1 Groundwater Elevation
VCT‐1/1 Manual Measurements
Victoria Basin Total Recharge
HYDROGRAPHMW VCT-1/1
The level transducer installed in April 2010 was found to be faulty, thus no automated data was collected until the fault was discovered and a new transducer was installed in April 2011.
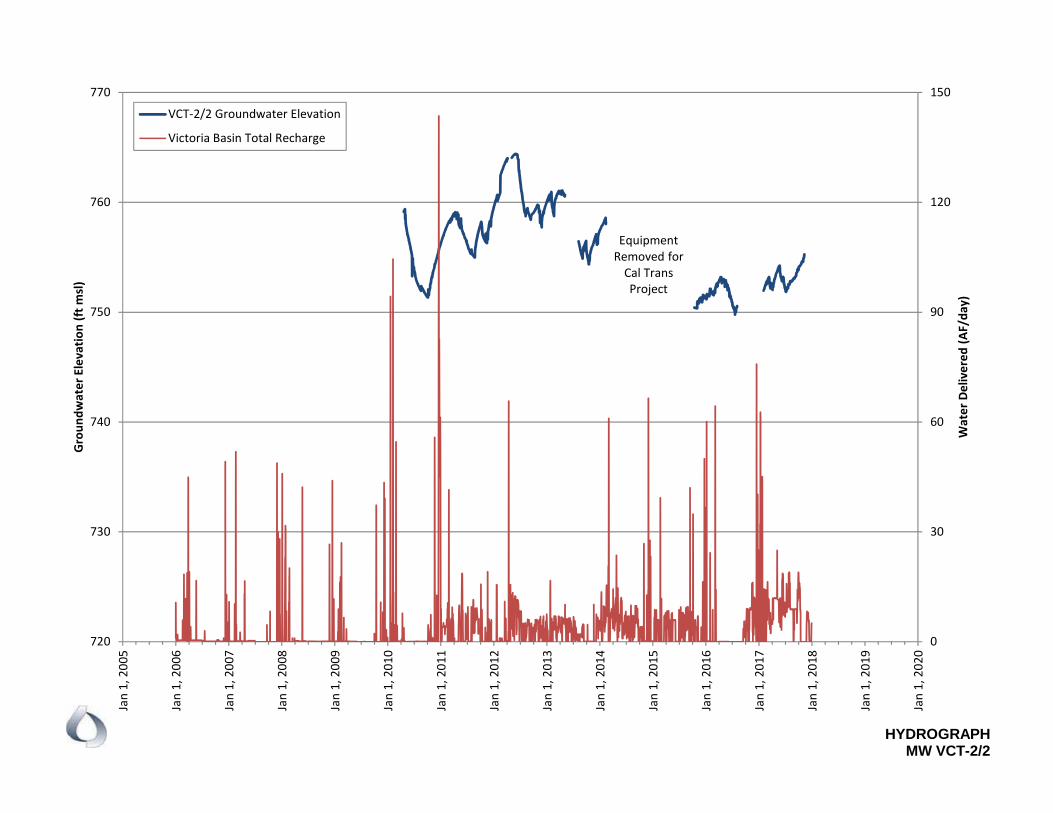
0
30
60
90
120
150
720
730
740
750
760
770
Jan 1, 200
5
Jan 1, 200
6
Jan 1, 200
7
Jan 1, 200
8
Jan 1, 200
9
Jan 1, 201
0
Jan 1, 201
1
Jan 1, 201
2
Jan 1, 201
3
Jan 1, 201
4
Jan 1, 201
5
Jan 1, 201
6
Jan 1, 201
7
Jan 1, 201
8
Jan 1, 201
9
Jan 1, 202
0
Water Delivered
(AF/da
y)
Groun
dwater Elevatio
n (ft m
sl)
VCT‐2/2 Groundwater Elevation
Victoria Basin Total Recharge
HYDROGRAPHMW VCT-2/2
EquipmentRemoved for Cal Trans Project

APPENDIX E
GROUNDWATER ELEVATION CONTOUR MAPS
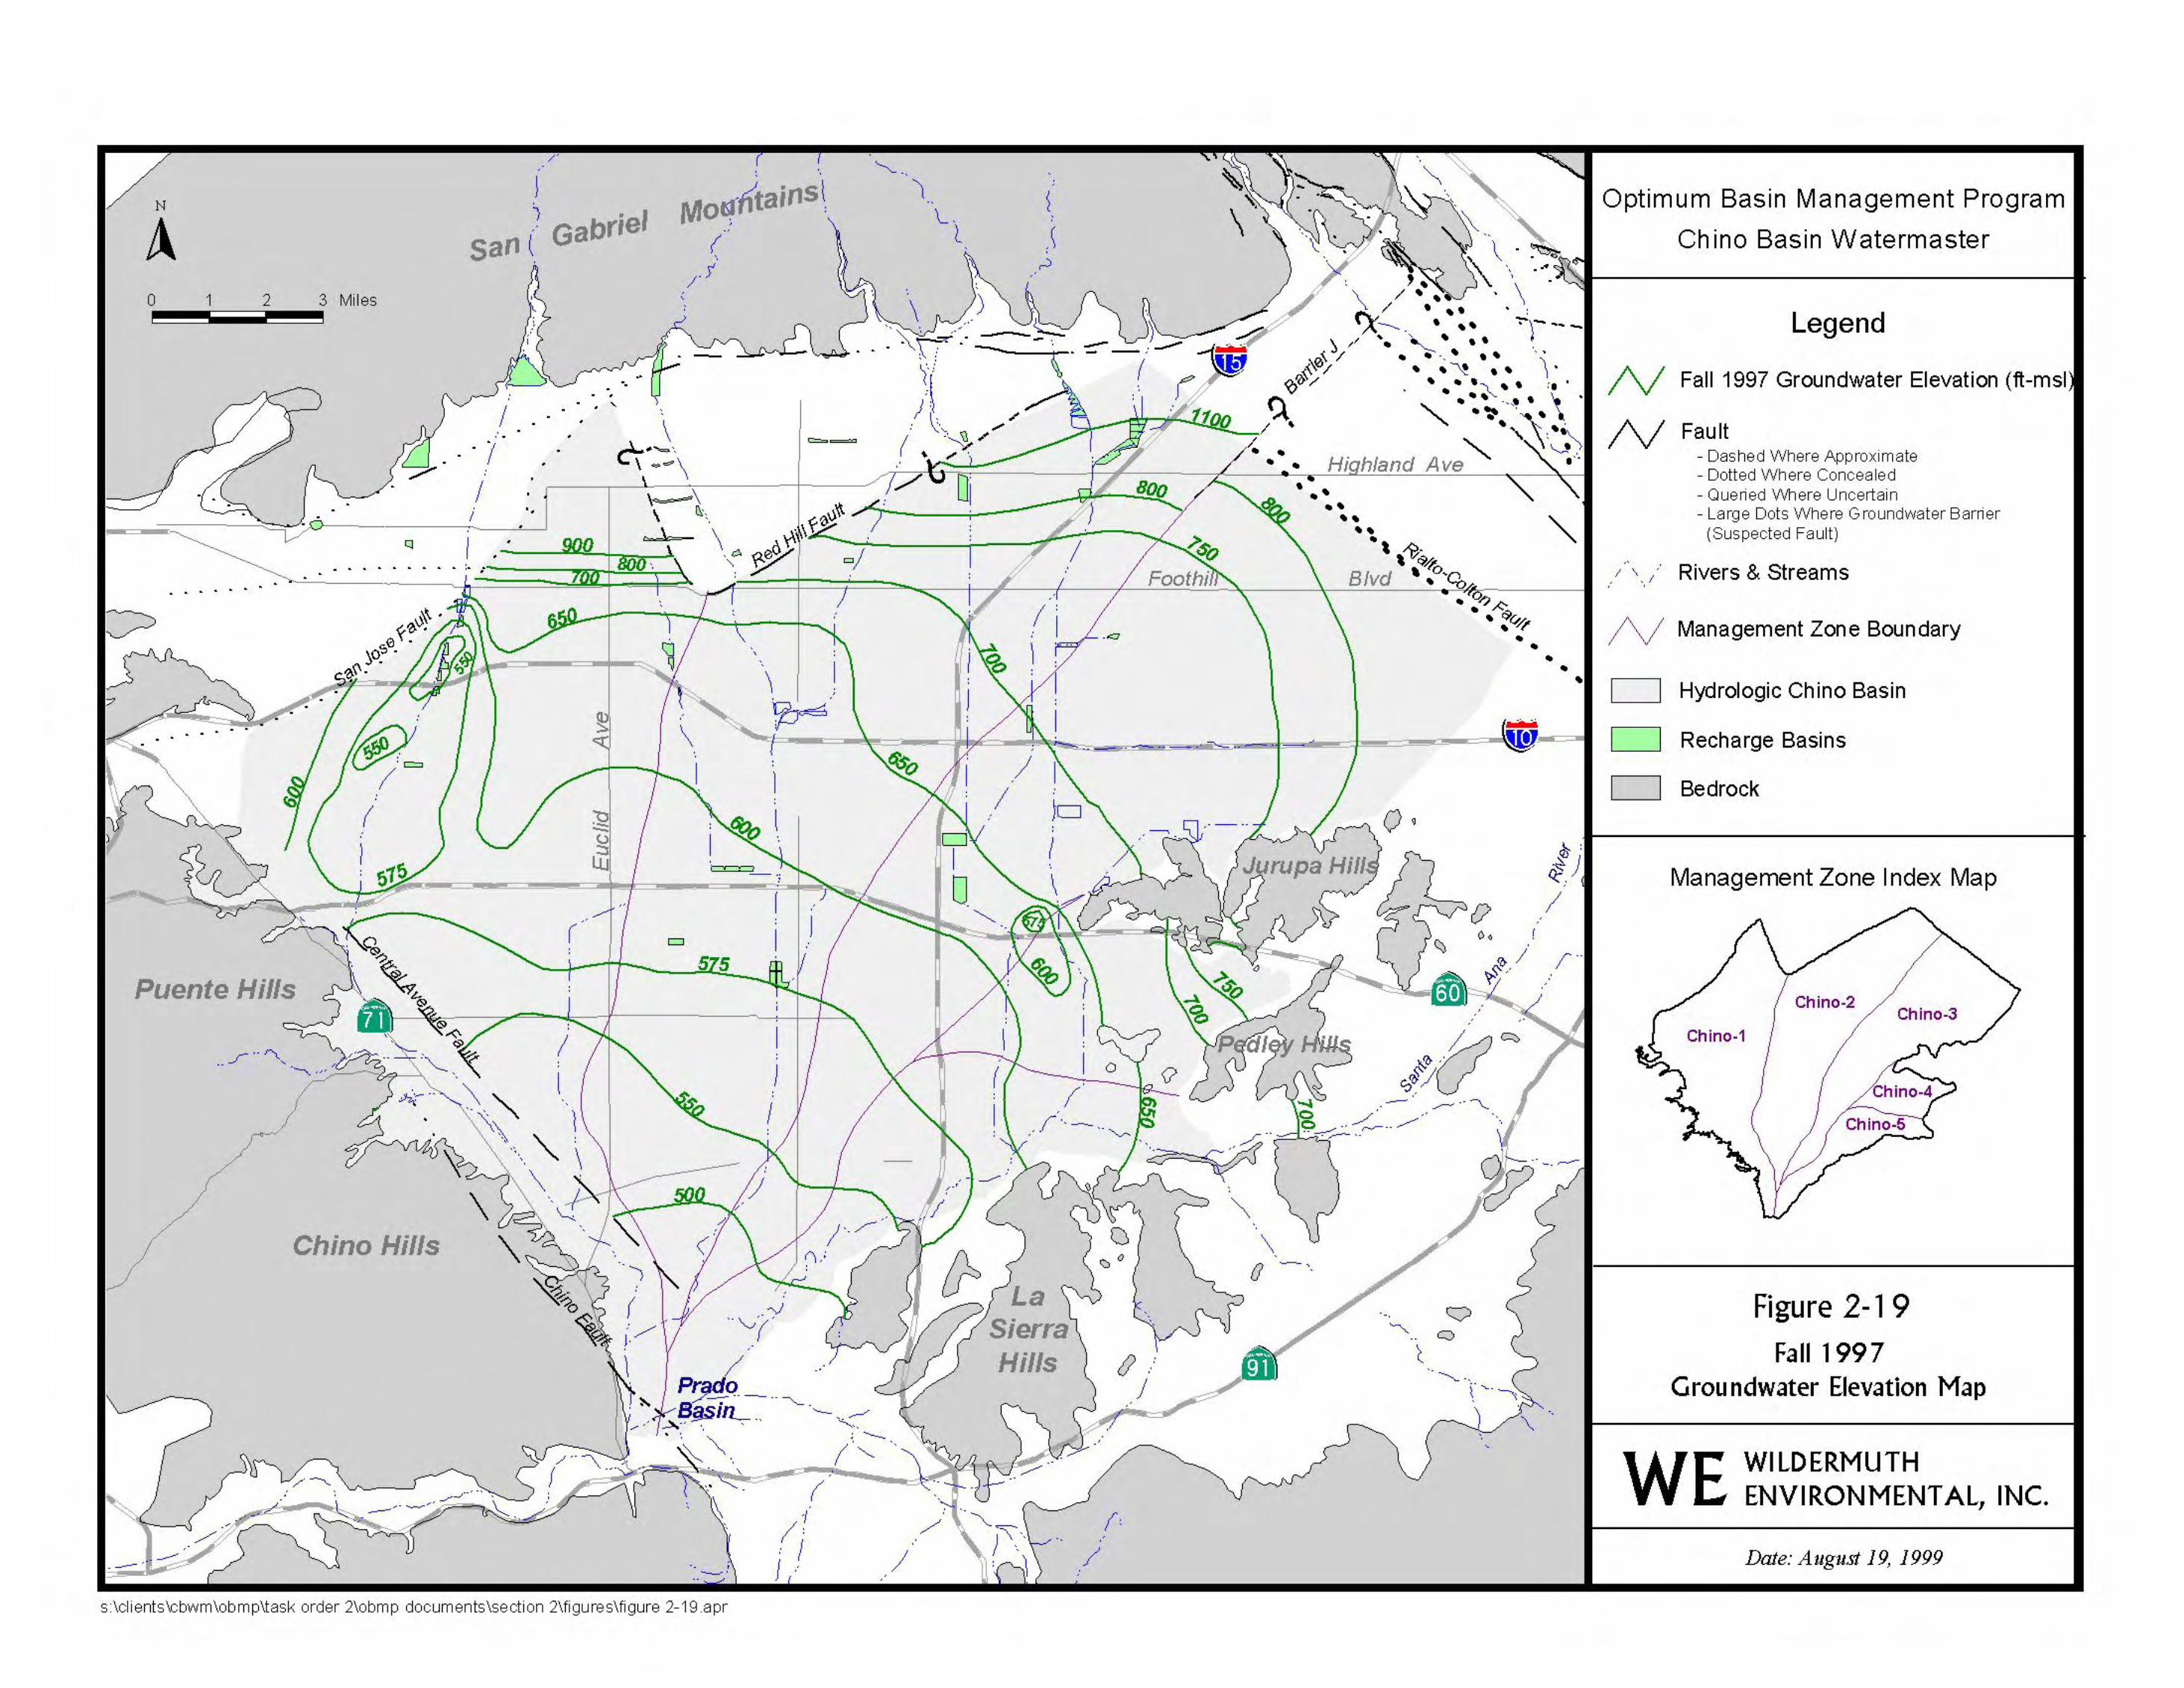
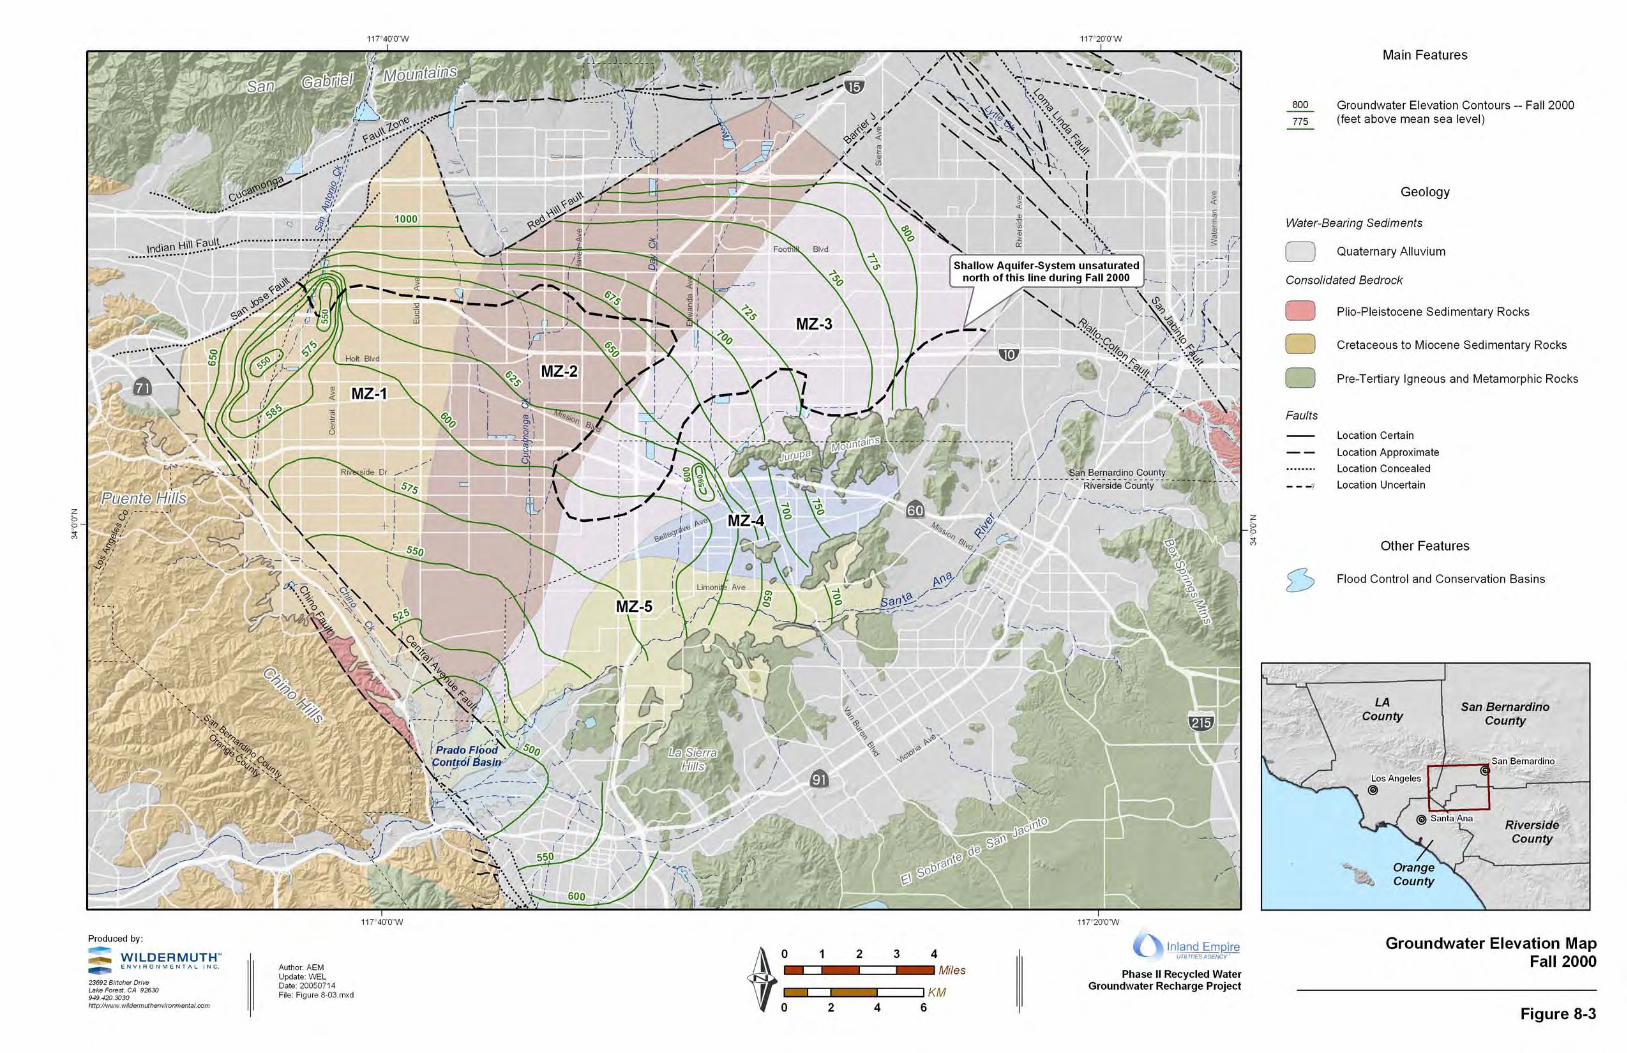
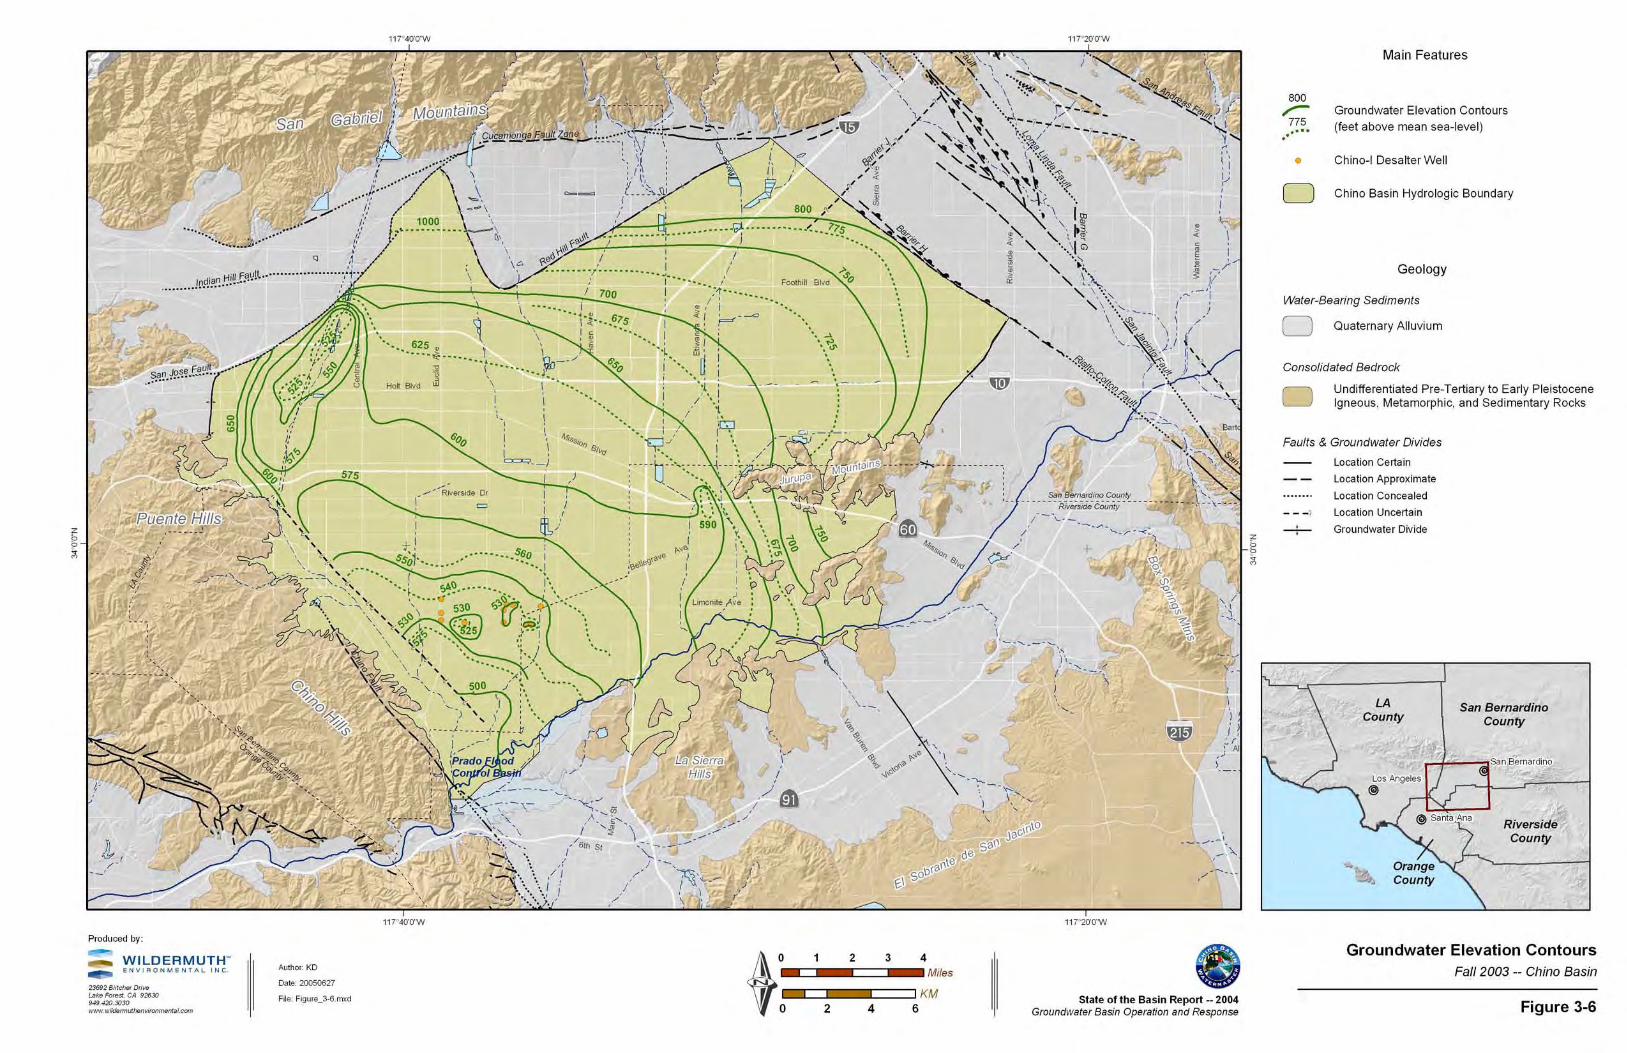
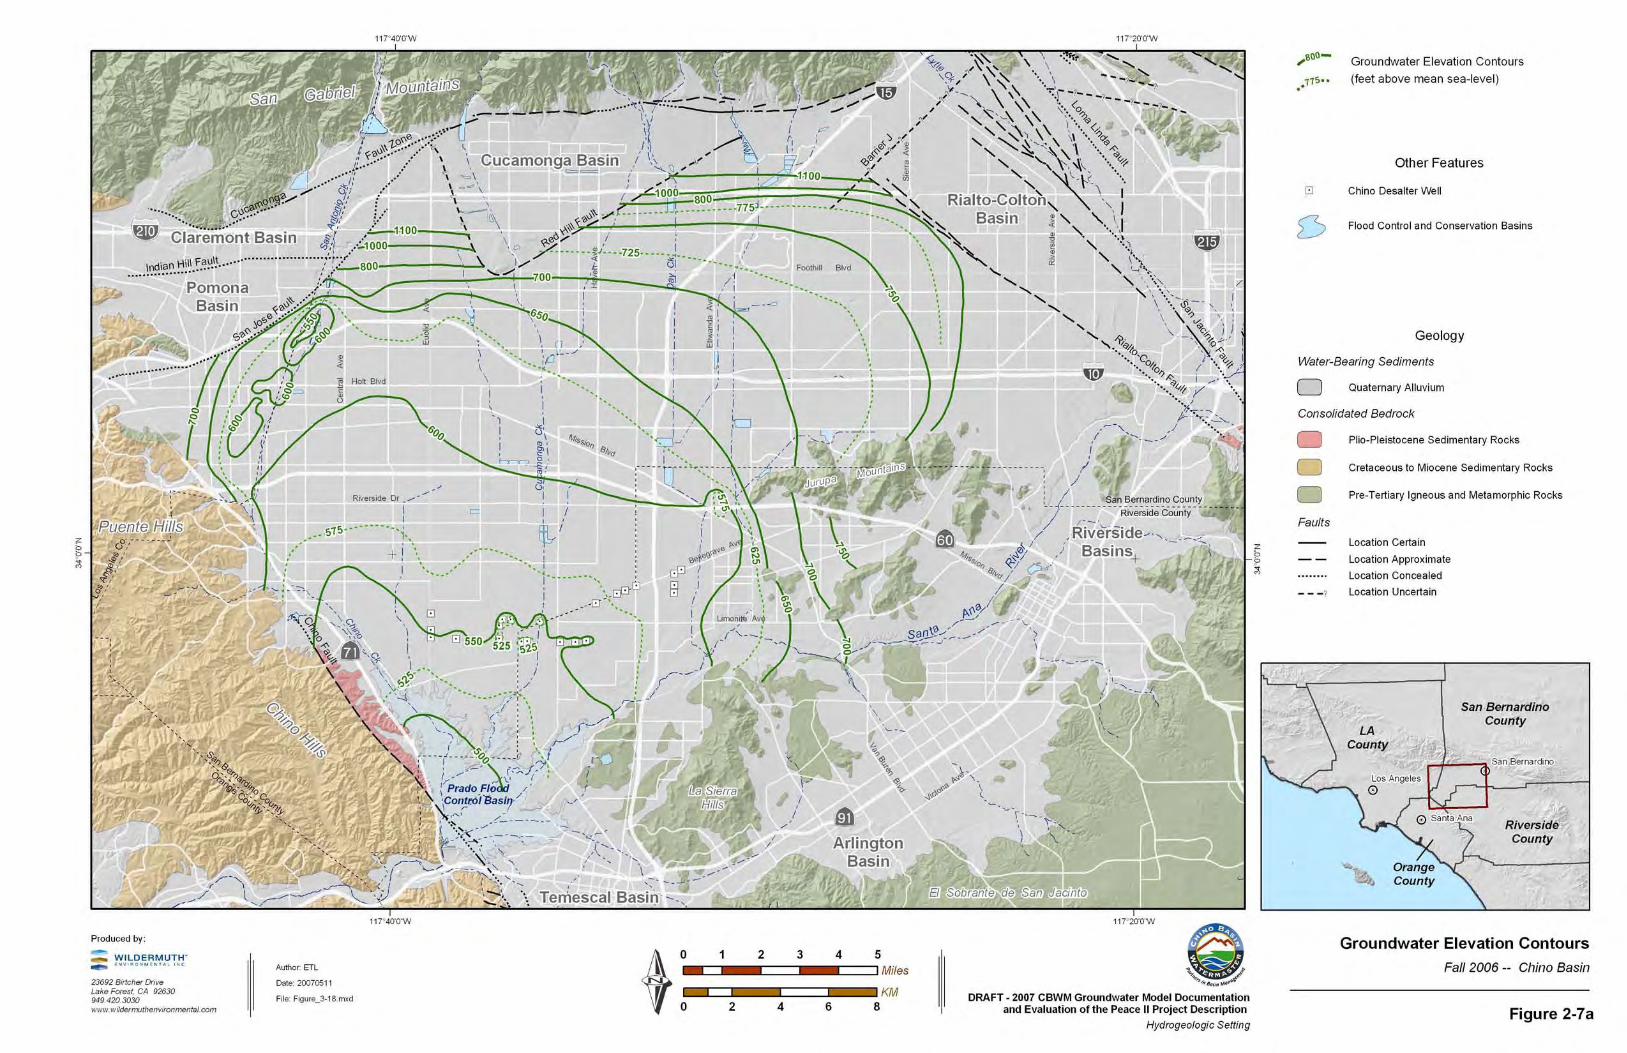
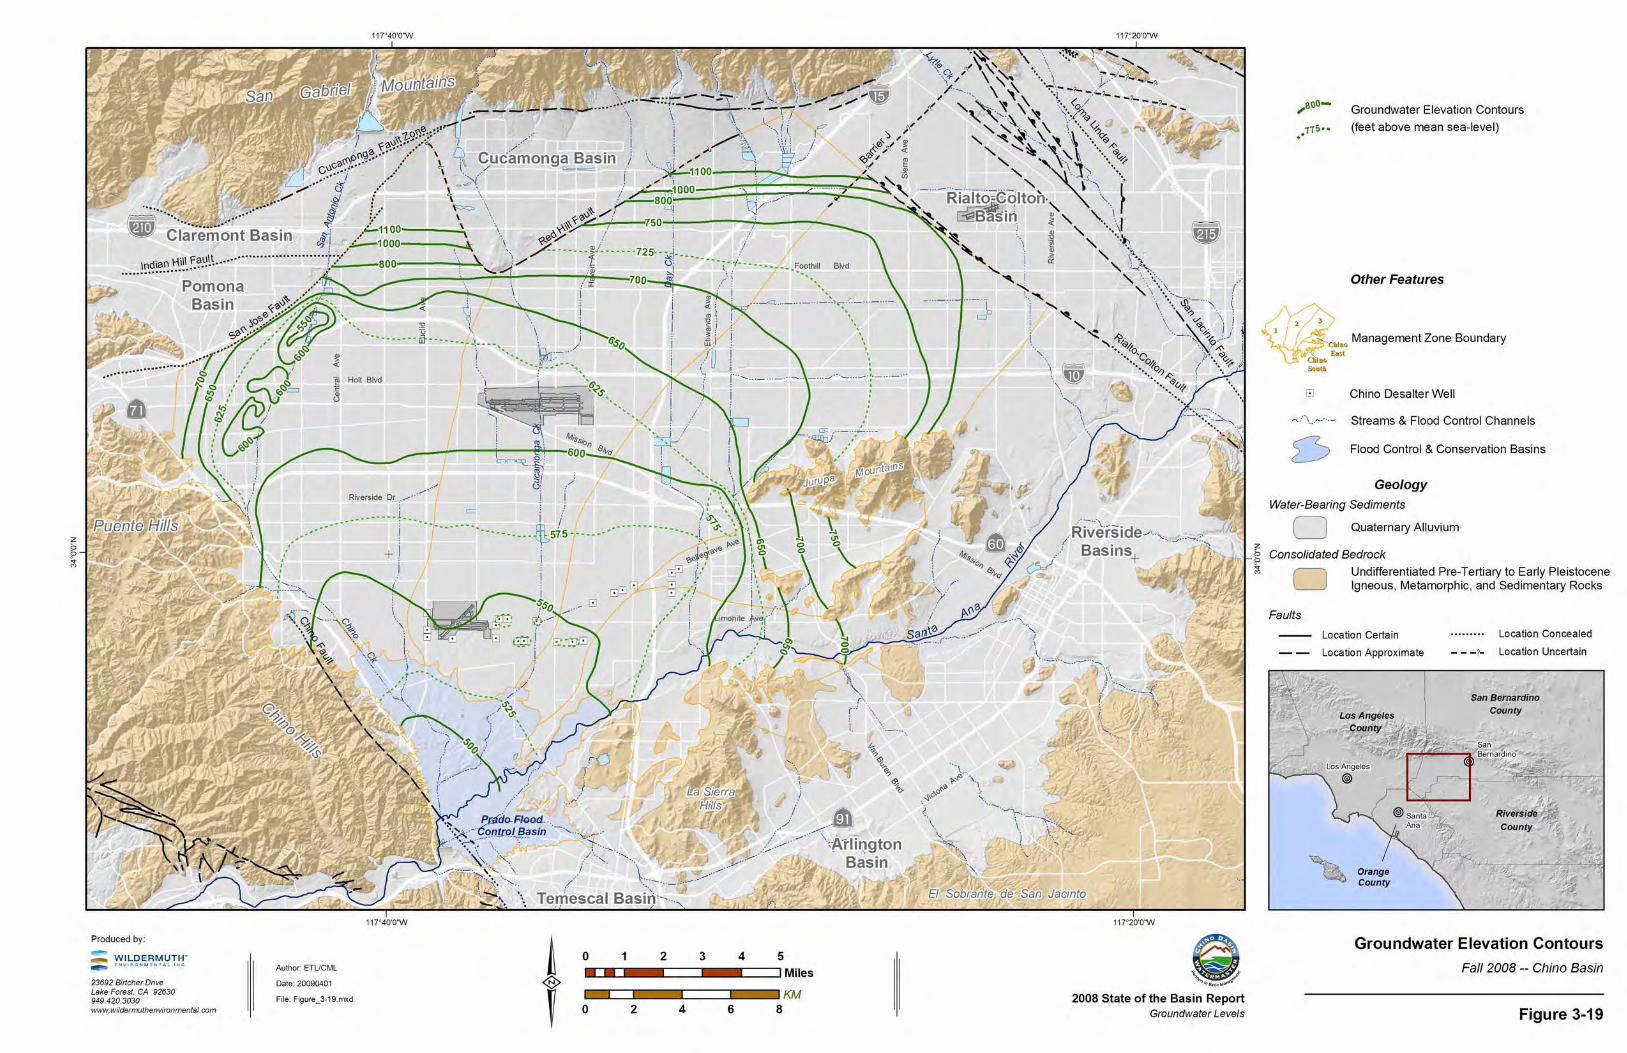
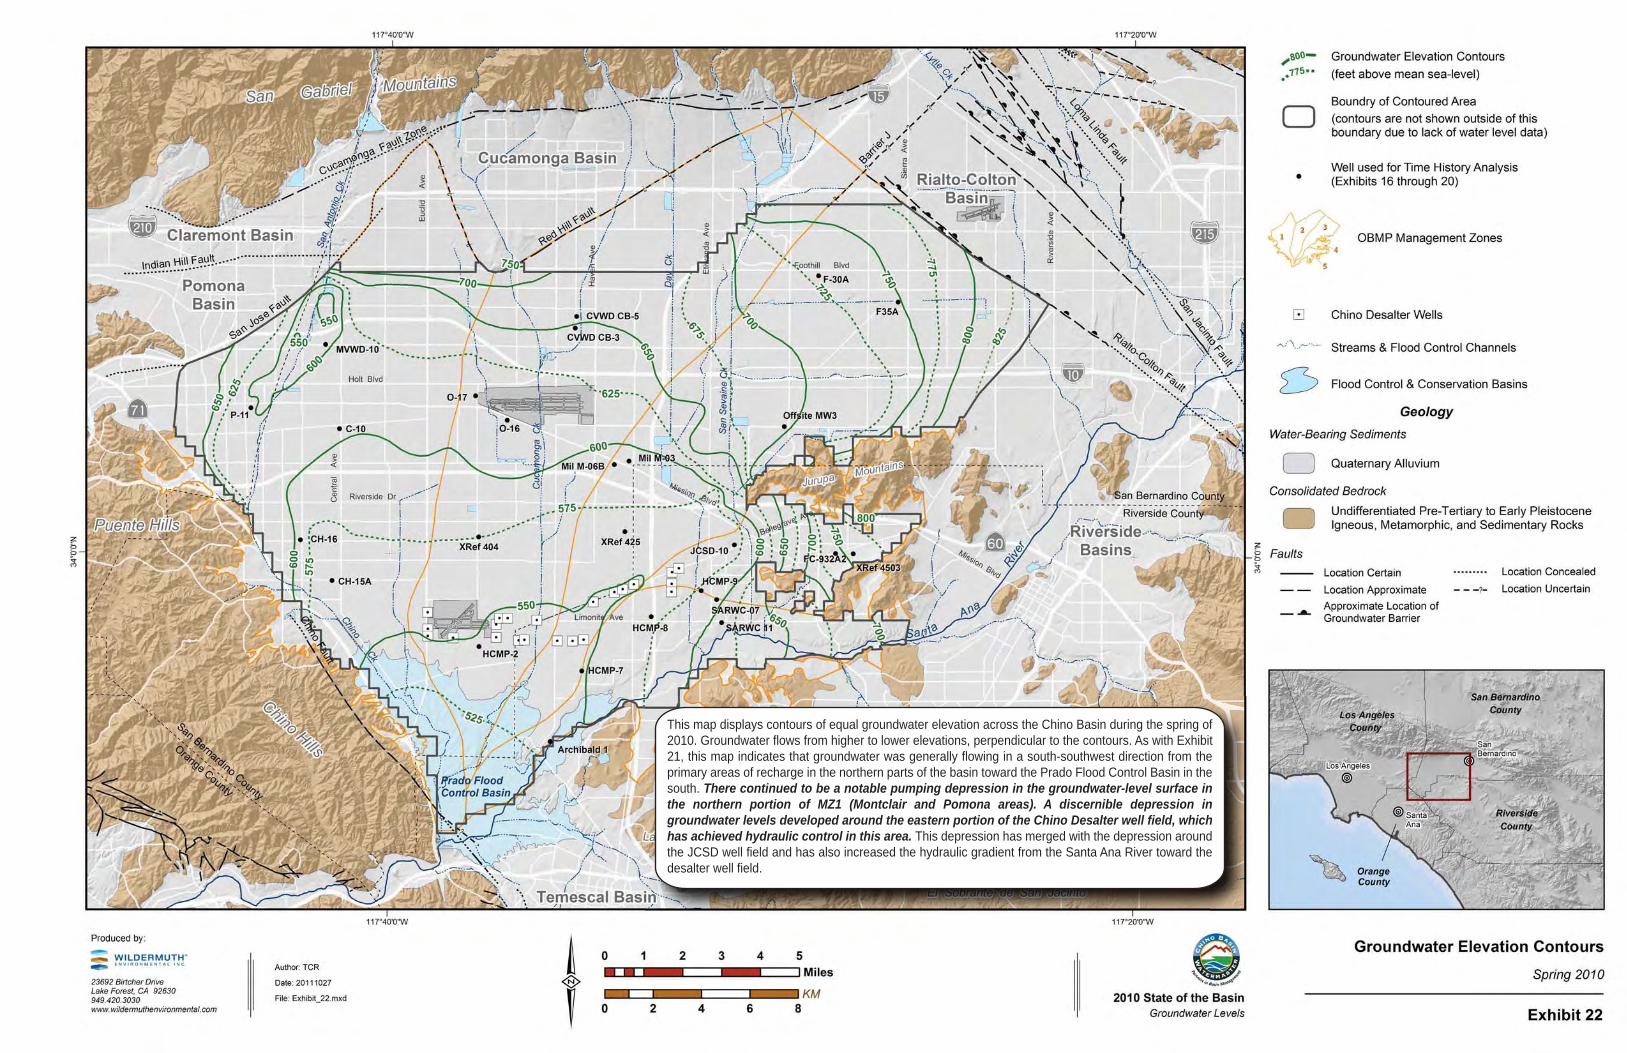
This map displays contours of equal groundwater elevation across the Chino Basin during the spring of 2010. Groundwater flows from higher to lower elevations, perpendicular to the contours. As with Exhibit 21, this map indicates that groundwater was generally flowing in a south-southwest direction from the primary areas of recharge in the northern parts of the basin toward the Prado Flood Control Basin in the south. There continued to be a notable pumping depression in the groundwater-level surface in the northern portion of MZ1 (Montclair and Pomona areas). A discernible depression in groundwater levels developed around the eastern portion of the Chino Desalter well field, which has achieved hydraulic control in this area. This depression has merged with the depression around the JCSD well field and has also increased the hydraulic gradient from the Santa Ana River toward the desalter well field.
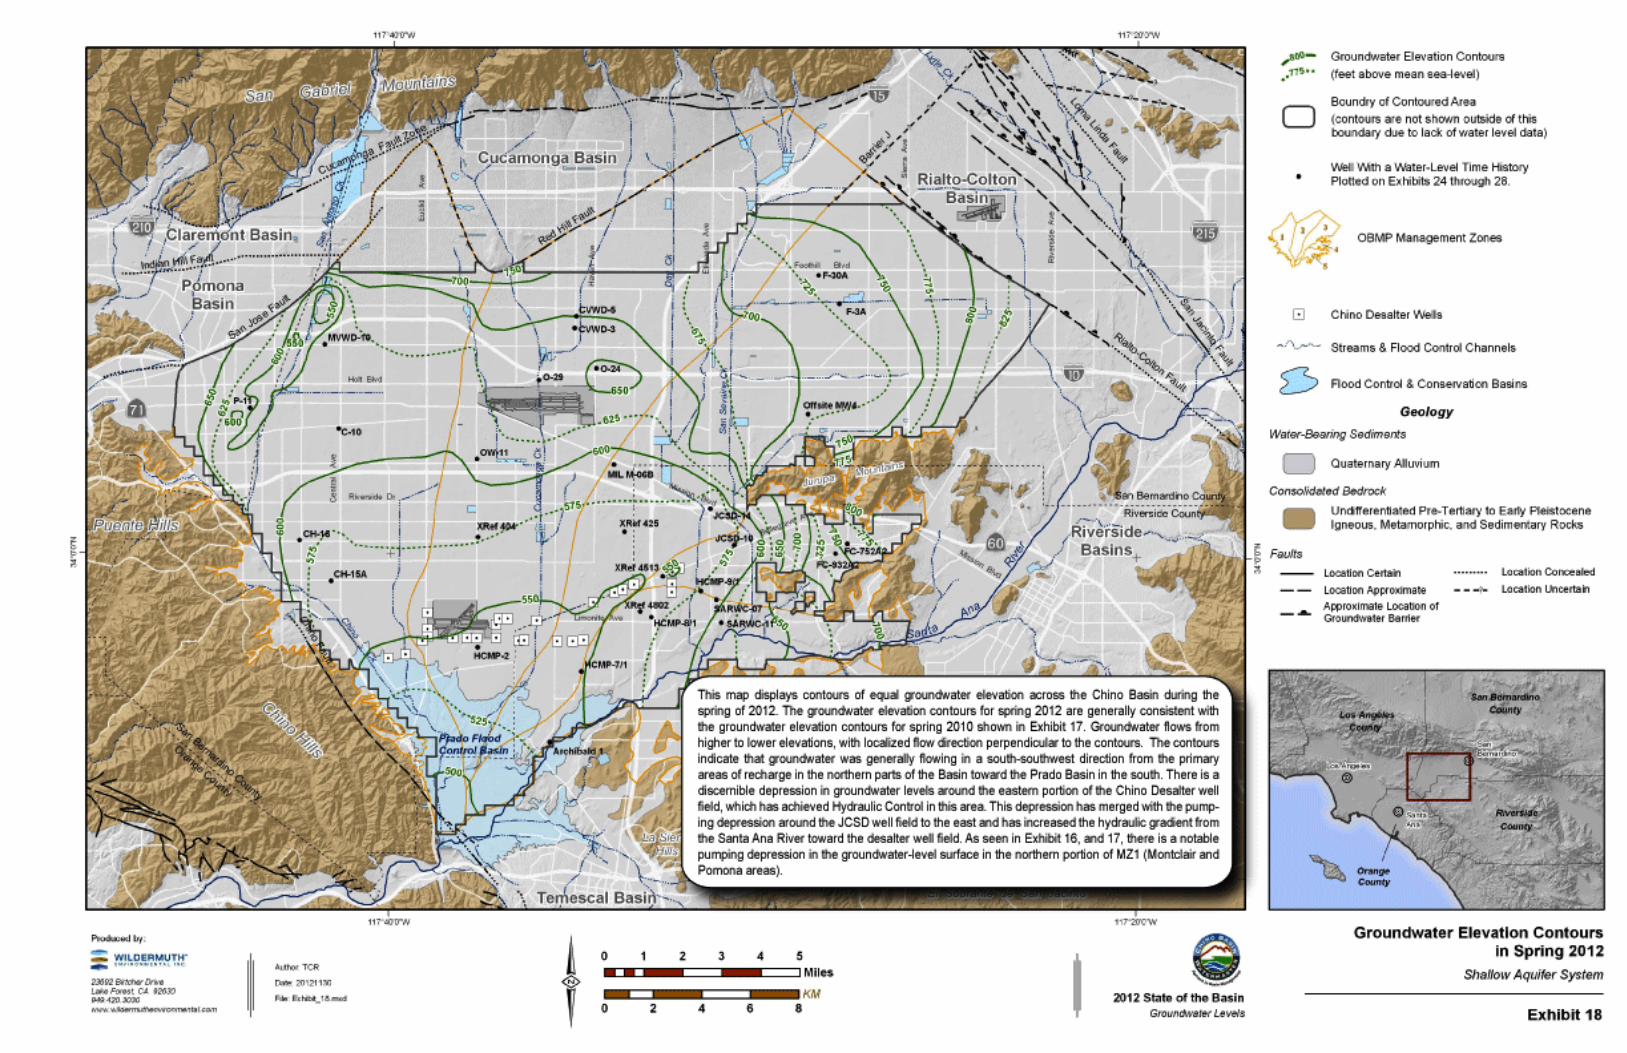
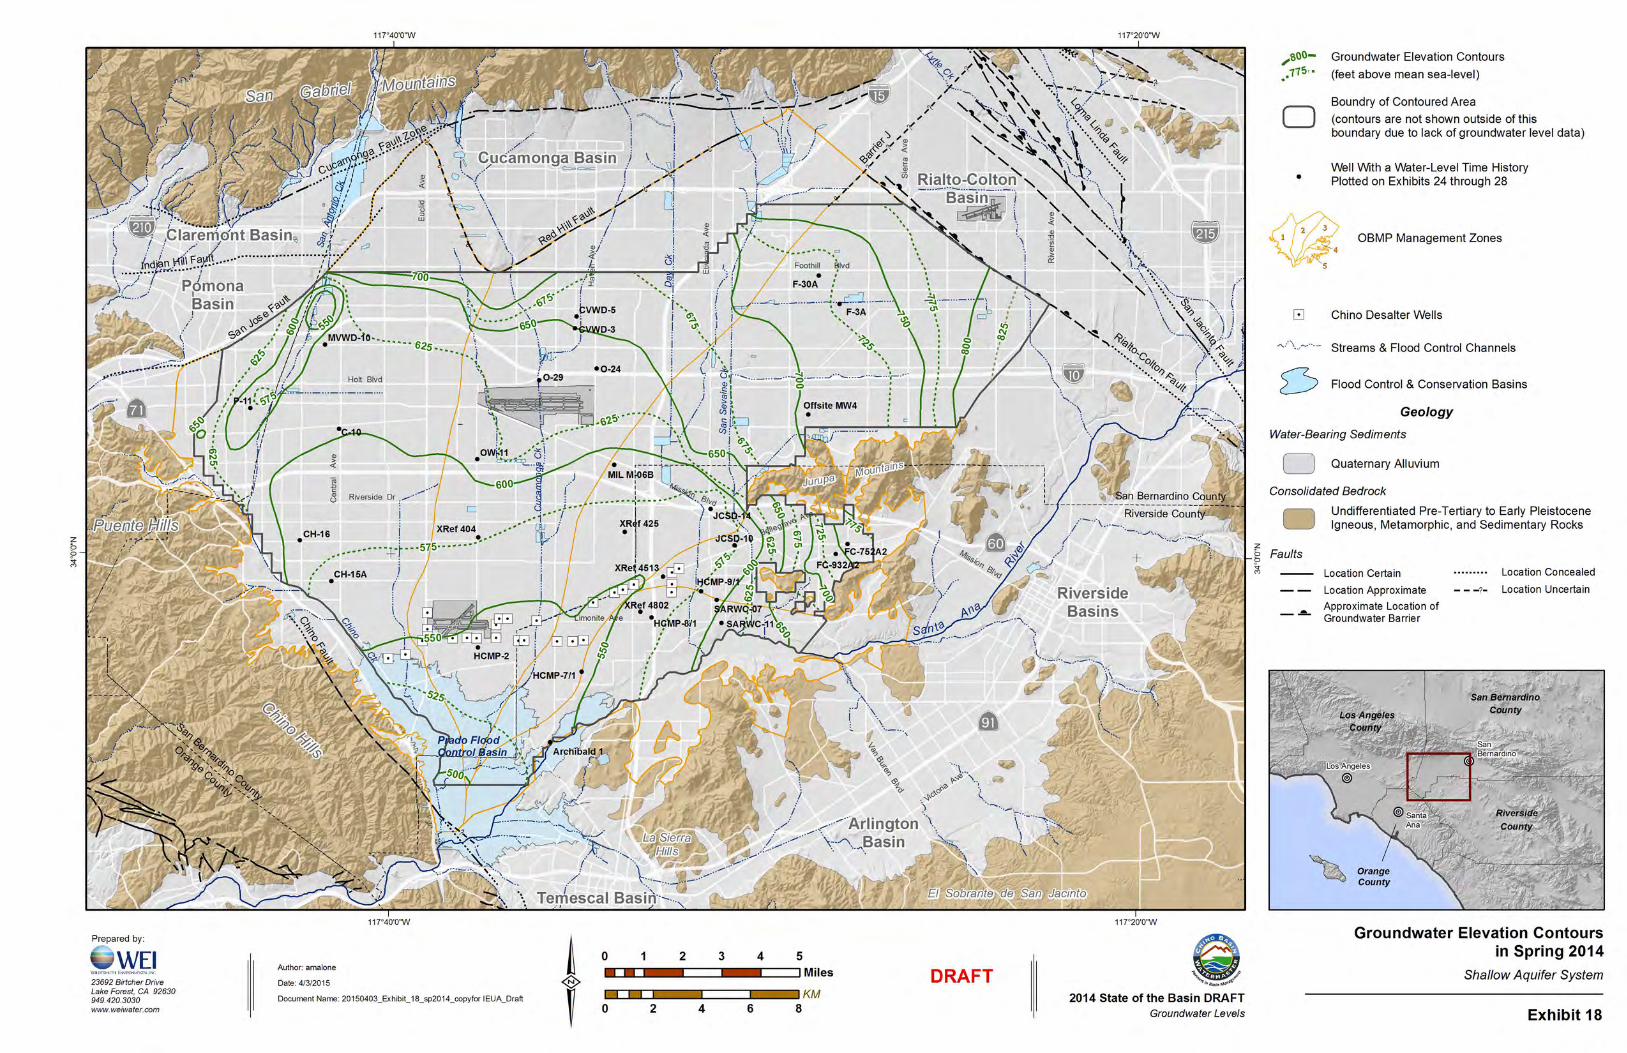

This map displays contours of equal groundwater elevation across the Chino Basin during the spring of 2016—showing the effects of about 16 years of OBMP implementation. The contours are generally consistent with the groundwater-elevation contours for spring 2014, indicating regional groundwater flow in a south-southwest direction from the primary areas of recharge in the northern parts of the Basin toward the Prado Basin in the south. There continued to be a discernible depression in groundwater levels around the eastern portion of the Chino Basin Desalter well field, which demonstrates the achievement of Hydraulic Control in this area. This depression merged with the pumping depression around the JCSD well field to the east and increased the hydraulic gradient from the Santa Ana River toward the desalter well field. As was the case in 2000 and 2014, there continued to be a notable pumping depression in the groundwater-level surface in the northern portion of MZ1 (Montclair and Pomona areas).
Related Documents