Chinese Cities of Opportunity 2017 Harbin Shenyang Dalian Urumqi Lanzhou Xi’an Taiyuan Tianjin Shijiazhuang Jinan Qingdao Zhengzhou Nanjing Wuhan Wuxi Suzhou Hangzhou Ningbo Fuzhou Xiamen Changsha Guangzhou Shenzhen Zhuhai Chengdu Chongqing Kunming Guiyang

Welcome message from author
This document is posted to help you gain knowledge. Please leave a comment to let me know what you think about it! Share it to your friends and learn new things together.
Transcript

Chinese Cities of Opportunity 2017
HarbinShenyangDalianUrumqi
LanzhouXi’anTaiyuanTianjin
ShijiazhuangJinanQingdaoZhengzhou
NanjingWuhanWuxiSuzhou
HangzhouNingboFuzhouXiamen
ChangshaGuangzhouShenzhenZhuhai
ChengduChongqingKunmingGuiyang

Urbanisation is not only the inevitable course to modernisation, but also the largest driving force in unlocking domestic demand potential and development momentum in today’s China. Since the promulgation of the National New-type Urbanisation Plan (2014-2020), China has been actively promoting a new people-centred path to urbanisation, which has greatly improved the level and quality of urbanisation. By 2016, the urbanisation rate of China’s permanent residents and registered population reached 57.35% and 41.2% respectively, making great strides towards meeting the 2020 objective in an orderly and steady manner.
China not only needs to comprehensively drive and optimise its urbanisation, it also needs to focus on the large cities in every region. In a market economy, all the elements of quality production are concentrated in large cities, where quality resources are cultivated and significant economies of scale and agglomeration are produced, resulting in these cities becoming the primary drivers of regional economic growth. In China, urban clusters formed around municipalities, provincial cities and other sub-provincial cities are becoming the most economically developed and innovatively active regions. Focusing on these large cities and the urban clusters forming around them is the key to capturing the next phase of China’s development and transformation.
Since 2014, China Development Research Foundation and PwC have jointly released three issues of the Chinese Cities of Opportunity report, focusing on the state of development
of large representative cities in China. Chinese Cities of Opportunity is the China edition of PwC’s series of reports on global urban development, Cities of Opportunity. This report draws on the perspectives and analytical research framework of Cities of Opportunity and combines them with the actual conditions in China to construct a set of indicators reflecting current urban development conditions, using 10 dimensions and 57 variables to provide a comprehensive assessment of the competitiveness, influence and potential of urban development. To date, the report has made a positive impact on policies and the society. Drawing on our previous experience, we have increased the number of sample cities to 28 this year and measured the advantages, potential and shortcomings of the development of these cities by vertically and horizontally comparing them using the indicators, so as to facilitate mutual learning between the cities, stimulate their vitality and further promote the new people-centred urbanisation model.
The China Development Research Foundation team participated in discussions throughout all stages of preparing this report, not only making contributions, but also using it as an important opportunity to learn. I would like to take this opportunity to express my appreciation and admiration for PwC’s commitment to social responsibility and dedication to China’s development, and my gratitude to PwC and the Foundation team for their hard work. I look forward to continuing and deepening our cooperation in the future in the contribution of valuable knowledge products to society.
Focusing on large cities and urban clusters is the key to capturing the next phase of China’s development
Lu Mai
Vice Chairman and Secretary General China Development Research Foundation

The growth and rise of China since its reforms has manifested in many ways – and perhaps one of the most important is its cities and urban development. Recognising this fact, PwC China and the China Development Research Foundation (CDRF) have jointly released the fourth Chinese Cities of Opportunity report for this year. With the support of the CDRF, the research team has conducted continuous study and observation of cities on mainland China, establishing a unique brand in urban research.
In selecting the research sample for Chinese Cities of Opportunity, the China version of PwC’s global Cities of Opportunity report, the focus was on 28 Chinese provincial capitals and cities of comparable size. At the same time, separate observations were conducted on Beijing and Shanghai for special analysis of these two megacities from PwC’s global Cities of Opportunity report.
The Chinese Cities of Opportunity report aims to track better development opportunities. The Chinese government’s proposed “new urbanisation” development strategy in the 13th Five-Year Plan (2016-2020), explicitly advocating a new people-centred urbanisation model and promoting coordinated development between large, medium and small cities. This
report can help provide points of reference for advancing the concept of new urbanisation. Indeed, a healthy development of Chinese cities will add to China’s growth as well as the global economy.
PwC has always viewed the prospects of China’s reforms with enthusiasm. With its recent participation in the United Nations Climate Change Conference in Paris, to leading the creation of the Asian Infrastructure Investment Bank to hosting the G20 summit, China has demonstrated its commitment to serving as an important voice in the global landscape.
The China Development Forum, led by the Development Research Centre of the State Council and hosted by the CDRF, is an important channel for the Chinese government to engage with world leaders on major issues on China’s economic and social development. PwC China and the PwC network of firms appreciate the trust and support that the CDRF has provided over the past four years. We hope the Chinese Cities of Opportunity research will offer a unique perspective and contribute to the dialogue around China’s economic and social development.
New people-centred urbanisation model will drive global development
Bob E. Moritz
Global Chairman, PwC

Contents
Overview ................................................................................................................. 6
Selection of cities ..................................................................................................................... 6
Research model ........................................................................................................................ 6
Scoring..................................................................................................................................... 7
Data sources ............................................................................................................................. 7
Observation results .................................................................................................................. 7
In-depth interviews .................................................................................................................. 8
Comparison and analysis of rankings
I. Intellectual capital and innovation ........................................................................................10
Interview: Creating smart cities for better living ...................................................................... 12
II. Technology readiness ..........................................................................................................14
Interview: China’s current specific need to develop internet finance .......................................... 16
III. Important regional cities ................................................................................................... 18
Interview: Tourism – an important component of the urban economy .......................................20
IV. Healthcare, safety and public security ............................................................................... 22
Interview: Family doctors contracting services are a safeguard for urban residents’ health ........24
V. Transportation and urban planning .................................................................................... 26
VI. Sustainability and the natural environment ...................................................................... 28

VII. Culture and lifestyle ........................................................................................................30
Interview: The cultural industry has become an important part of the urban services sector .... 32
VIII. Economic Clout ............................................................................................................... 34
Interview: Agricultural mechanisation and urbanisation ........................................................36
IX. Cost ................................................................................................................................. 38
X. Ease of doing business ........................................................................................................ 40
Variables................................................................................................................ 42
Appendix ............................................................................................................... 50
Acknowledgements ............................................................................................... 54
For further information ........................................................................................ 55

6
Overview
Cities are the carriers of civilisation. Human civilisation has shaped cities, while cities have enriched civilisation. In terms of social formation, a city is an organism whose formation and development constitute the rich cultural features and diverse technological applications of human society. The observation of urban development will always be fraught with challenges.
Chinese Cities of Opportunity 2017 is the fourth in the series of reports providing observations of Chinese cities using the same perspective for observing global cities.
As each Chinese city forms and develops in its own unique way, in our investigation and research, we’ve always started with the facts, constantly built on our experience and improved our understanding and awareness, so that our observation of China’s cities can be as pertinent to their current circumstances as possible. Compared to the previous three reports, Chinese Cities of Opportunity 2017 has a broader range of observation and much improved data selection.
Selection of citiesIn addition to the previous year’s foundation of 24 cities, this report includes six new cities, namely Jinan, Taiyuan, Shijiazhuang, Wuxi, Zhuhai and Guiyang. We made observations of a total of 30 cities. However, as the statistical data of some cities are not currently available, only 28 cities make it into our sample of observation objects – Harbin, Shenyang, Dalian, Urumqi, Lanzhou, Xi’an, Taiyuan, Tianjin, Shijiazhuang, Jinan, Qingdao, Zhengzhou, Nanjing, Wuhan, Wuxi, Suzhou, Hangzhou, Ningbo, Fuzhou, Xiamen, Changsha, Guangzhou, Shenzhen, Zhuhai, Chengdu, Chongqing, Kunming and Guiyang. Among these cities, there are two municipalities, 18 provincial (capital) cities, five sub-provincial cities and three important
economic cities. Beijing and Shanghai, both being incomparable metropolises, are handled the same way as in previous reports, with their study results put in the Appendix of this report for reference.
Most of the sample cities are capital cities or cities under separate state planning, the majority being “sub-provincial cities” or cities which are headed by deputy provincial leaders. However, this was not the starting point in our selection of cities. Our scope of observation depends to a large degree on the uniformity of statistical data sources. Cities in China differ from those in Europe and America in both their formation and development. The modern patterns of cities in Europe and America emerged in tandem with the development of capitalism, predominantly driven by the market economy; whereas Chinese cities remain tied to their administrative statuses from the ancient Qin and Han dynasties, even more so today. In China, a city’s administrative status determines its scale and pace of development. Since the beginning of reform and opening-up, a considerable number of prefecture-level cities, even county-level cities, have sprung up, whose economic strength has far surpassed that of their counterparts or above. Still, due to the lack of consistent statistical standards, it has been extremely difficult to find comparable data during the same period among cities at different administrative levels. That is why Chinese Cities of Opportunity selects cities of the same type.
Research modelCities can be observed from at least two basic perspectives: one is to view a city as the antithesis of natural ecosystems, such as mountains, rivers and plains, and a man-made environment characterised by steel and concrete; the other is to see it as an organism, a form with its own life force, shaped by humans, while providing a vast space for human
survival and evolution. The former looks at objects, observing the physical patterns of cities, while the latter looks at people, observing the social patterns. PwC prefers the latter. It is not enough to observe a city’s social pattern from one or several aspects. Instead, it is best to observe all aspects. Thus, the Chinese Cities of Opportunity selects multiple perspectives from available data to describe our observation objects, namely “intellectual capital and innovation”, “technology readiness”, “important regional cities”, “healthcare, safety and security”, “transportation and urban planning”, “sustainability and the natural environment”, “culture and lifestyle”, “economic clout”, “cost” and “ease of doing business”. We call these our ten indicators. Of course, these ten indicators cannot fully and vividly describe each city, but as we are observing cities from economic, cultural, educational, hygiene, environmental and social governance perspectives, we believe our research could describe each city’s situation to the fullest extent possible, and identify future development opportunities.
To provide a more detailed observation of the cities, we further divide each indicator into four to seven observation values, which are called variables. This year, there are a total of 57 variables. To get around some of the sampling limitations, we start from the definitions of these variables and select two or more secondary variables from different angles to calculate and consolidate into composite variables. The value of a composite variable is the same as that of a single variable. Composite variables account for 23% of the total variables in this report. In addition, we made adjustments to the sampling angles of approximately 10% of the variables. The relevant variable definitions and data sources are set out and explained in the Appendix to this report.
PwC 7
As the observation angles differ from those used to observe cities globally, we take into account the specific characteristics of Chinese cities when selecting data, and choose to use authoritative data available on the Chinese market provided the general research model remains unchanged.
ScoringTo ensure that the statistics only reflect the city rankings rather than the differences between the cities, Chinese Cities of Opportunity adopts a sequential scoring method. In this method, the size of the scoring gap between two cities ranked consecutively before or after one another have no bearing on their rankings. When the sample cities are ranked for each variable, one point is accumulated for each place in the ranking. Thus, the top ranking city accumulates 28 points and the last accumulates 1 point. Those with the same scores accumulate the same number of points. Of course, in terms of scores for the cost variable, the city with the highest cost accumulates 1 point, and the one with the lowest cost accumulates 28 points. The same is true of the urban expansion rate variable.
The ranking of 28 cities within each indicator is based on the total points each city accumulates in all variables of that indicator, while the final ranking of this report is subject to the total points of each city in all variables across all ten indicators.
Data sourcesChinese Cities of Opportunity 2017 adheres to the principles of openness, reliability and consistency in data collection. All data are collected from public channels, primarily the publications of national statistical agencies, including statistical bulletins and various city statistical yearbooks. In order to conduct our wide scope of observation, we also sought out statistical data issued by relevant ministries and commissions of the State Council, such as the National Development and Reform Commission, the Ministry of Housing and Urban-Rural Development, the Ministry of Science and Technology, the Ministry of Environmental Protection, the Ministry
of Human Resources and Social Security and the Ministry of Education, which can then be verified against data from statistical agencies. In certain cases, we consulted research results published by scientific research institutions and think tanks to supplement multi-dimensional observations.
The data point-in-time for this report is the end of 2015. For certain variables, we have selected 2016 data. We use 2014 data for the exceptional variables whose data has not been updated. All such instances are noted in the Appendix.
Observation resultsAccording to the ranking based on total scores, Guangzhou topped the overall ranking, in keeping with last year’s survey results, followed closely by Shenzhen. Hangzhou again ranks third. Wuhan and Nanjing, at fourth and fifth respectively, have switched their former rankings. The sixth to ninth are Chengdu, Xiamen, Xi’an and Tianjin. Suzhou, the seventh last year, ranks tenth this year. The 11th to 20th are Zhuhai, Changsha, Zhengzhou, Chongqing, Jinan, Kunming, Qingdao, Ningbo, Shenyang and Dalian, followed by Fuzhou, Guiyang, Taiyuan, Wuxi, Urumqi and Shijiazhuang; Harbin and Lanzhou tie for last place.
As there are four additional cities in Chinese Cities of Opportunity 2017, it is not possible to do a one-on-one comparison with last year’s city rankings. It is worth noting that Guangzhou, Shenzhen and Hangzhou remain in the lead, continuing to show strong overall competitiveness, while Harbin and Lanzhou being at the bottom suggest that the old industrial base in the northeast and the important northwestern city still have considerable growth potential.
Though the cities we observe are ranked in our research, behind the statistics they have several common features: firstly, city administrators regard scientific and technological innovation as the driver of long-term development and thus place great emphasis on the role of technological progress, innovation and entrepreneurship in setting urban development trends; secondly, these cities are conscious of the green economy and environmental protection, and
thus strike a better balance between production and daily life; thirdly, they focus on high-efficiency agriculture and promote integrated rural-urban development; fourthly, they raise awareness of social governance, hence their city management systems have become increasingly sophisticated. As the quality of city management continues to improve, we have high hopes for the potential development opportunities of these cities.
In the subsequent analysis of each indicator, we comment briefly on those cities with outstanding performance for that indicator. Given the limited space, we cannot analyse all aspects of all cities, but there is an abundance of information in data. Interested readers can conduct analyses and arrive at their own conclusions using the ten indicators and 57 variables coupled with the potential and opportunities of specific cities.
* Cities of Opportunity 7, PwC’s report on cities around the world, was released by PwC New York in September 2016. Please visit http://www.pwccn.com/home/eng/cities_of_opportunity_7.html to read these reports.

8
In-depth interviewsInterviews are one of the features of Chinese Cities of Opportunity research reports. We have enriched the research dimensions by interviewing experts on city management.
Chinese Cities of Opportunity 2017 is honoured to invite a number of distinguished professionals to share their insights on the topics touched on in this report. They are Zhu Hongren, the former Chief Engineer of the Ministry of Industry and Information Technology, Dr. Yang Jichuan, CEO of Hfax.com, Dr. Vong Chuk Kwan, President of Institute for Tourism Studies, Macau, Professor Qiu Yulin of the School of Labour Relations and Human Resources of
Renmin University of China, John Xu, Senior Vice President of China Capital Management Co., Ltd. and Xu Zhijian, Researcher at China Agricultural Machinery Testing Centre. Since this study report is not for profit and one of our corporate social responsibility initiatives, these professionals’ participation is not only an expression of their ideas, but also of their desire to give back to society.
Zhu Hongren’s topic is “Creating smart cities for better living”. Dr. Yang Jichuan has a unique understanding of internet finance because of his exceptional experience working on Wall Street. Dr. Vong Chuk Kwan, presents her ideas on tourism in mainland China from a foreigner’s perspective. Professor
Qiu Yulin discusses “Family doctors contracting services are a safeguard for urban residents’ health”. Previously an auditor with PwC and now working in investment banking, Senior Vice President John Xu shares his views on the development of the cultural sector. Finally, Researcher Xu Zhijian writes on the topic of “Agricultural Mechanisation and Urbanisation”, which looks at new urbanisation in China from the perspective of intensive agriculture and highlights the feature of Chinese cities where “the development of cities drives that of counties and villages”.
Their generous contributions have deepened our observations in this report.
Intellectual capital and innovation
Technology readiness
Important regional cities
Healthcare, safety and security
Transportation and urban planning
Culture and lifestyle Economic clout Cost ScoreEase of doing business
Sustainability and the natural environment
1
2
3
4
5
6
7
8
9
10
11
12
13
14
15
1718
19
20
21
22
23
24
25
26
27
28
16
Guangzhou
Shenzhen
Hangzhou
Wuhan
Nanjing
Chengdu
Xiamen
Xi’an
Tianjin
Suzhou
Zhuhai
Changsha
Zhengzhou
Chongqing
Jinan
Kunming
Qingdao
Ningbo
Shenyang
Dalian
Fuzhou
Guiyang
Taiyuan
Wuxi
Urumqi
Shijiazhuang
Harbin
Lanzhou
70
51617 24 51 85 52 24 46 96 7150
57938 57 60 57 30 26 77 124 6545
62629 29 80 67 53 43 57 139 7554
69012 43 75 124 65 29 64 120 9860
69853 31 34 98 67 69 42 83 121100
71719 29 91 80 52 51 89 145 8873
71918 83 87 78 67 49 65 120 7874
72661 68 48 77 87 89 67 73 9066
74849 73 66 105 37 60 65 109 10183
75961 85 66 109 42 61 39 134 6399
76147 78 51 75 64 78 85 74 11099
78163 102 61 73 75 41 99 79 9296
78433 78 121 61 39 67 143 8884
78861 83 84 90 85 50 88 86 9665
79660 151 56 61 54 34 99 96 9788
81646 75 82 101 83 40 67 102 13684
85558 87 89 74 70 88 104 77 93115
86140 51 79 156 93 101 72 42 109118
88181 83 51 98 60 65 84 80 143136
91774 114 61 103 91 54 110 81 100129
94075 125 90 109 55 56 101 98 115116
95864 97 73 132 93 83 96 76 130114
97088 128 96 91 104 45 100 82 104132
103594 112 67 146 57 89 110 55 142163
104290 122 96 123 109 70 114 84 103131
106995 124 92 125 104 65 136 32 131165
1155107 145 94 156 118 76 157 12 144146
1162102 165 100 142 105 69 148 13 143175

PwC 9
Intellectual capital and innovation
Technology readiness
Important regional cities
Healthcare, safety and security
Transportation and urban planning
Culture and lifestyle Economic clout Cost ScoreEase of doing business
Sustainability and the natural environment
1
2
3
4
5
6
7
8
9
10
11
12
13
14
15
1718
19
20
21
22
23
24
25
26
27
28
16
Guangzhou
Shenzhen
Hangzhou
Wuhan
Nanjing
Chengdu
Xiamen
Xi’an
Tianjin
Suzhou
Zhuhai
Changsha
Zhengzhou
Chongqing
Jinan
Kunming
Qingdao
Ningbo
Shenyang
Dalian
Fuzhou
Guiyang
Taiyuan
Wuxi
Urumqi
Shijiazhuang
Harbin
Lanzhou
70
51617 24 51 85 52 24 46 96 7150
57938 57 60 57 30 26 77 124 6545
62629 29 80 67 53 43 57 139 7554
69012 43 75 124 65 29 64 120 9860
69853 31 34 98 67 69 42 83 121100
71719 29 91 80 52 51 89 145 8873
71918 83 87 78 67 49 65 120 7874
72661 68 48 77 87 89 67 73 9066
74849 73 66 105 37 60 65 109 10183
75961 85 66 109 42 61 39 134 6399
76147 78 51 75 64 78 85 74 11099
78163 102 61 73 75 41 99 79 9296
78433 78 121 61 39 67 143 8884
78861 83 84 90 85 50 88 86 9665
79660 151 56 61 54 34 99 96 9788
81646 75 82 101 83 40 67 102 13684
85558 87 89 74 70 88 104 77 93115
86140 51 79 156 93 101 72 42 109118
88181 83 51 98 60 65 84 80 143136
91774 114 61 103 91 54 110 81 100129
94075 125 90 109 55 56 101 98 115116
95864 97 73 132 93 83 96 76 130114
97088 128 96 91 104 45 100 82 104132
103594 112 67 146 57 89 110 55 142163
104290 122 96 123 109 70 114 84 103131
106995 124 92 125 104 65 136 32 131165
1155107 145 94 156 118 76 157 12 144146
1162102 165 100 142 105 69 148 13 143175
Guangzhou Photo by Wang Rui

10
Chinese Cities of Opportunity
2017
I. Intellectual capital and innovation
Intellectual capital and innovation includes two aspects: the first is a city’s investment in skilled workers and scientific and technological development (referred to as intellectual capital) is observed from the perspectives of the extent of education and scientific research input and measured by four variables, namely full-time teachers’ turnover rate, scale of secondary vocational education, proportion of expenditure on science and technology and research and development level; the second is a city’s potential in mass innovation and entrepreneurship, which is assessed by looking at its past innovation and entrepreneurship achievements, which is represented by three variables, namely index of comprehensive scientific and technological progress, entrepreneurial environment and innovation application.
The results rank the top five as Guangzhou, Hangzhou, Nanjing, Shenzhen and Suzhou, similar to the results of the previous year, showing that eastern coastal cities continue to lead in intellectual capital and innovation. Guangzhou has topped the ranking for two consecutive years. It claims the top spot in scale of secondary vocational education and ranks high in several other variables, indicating the city has benefited from balanced development over all areas.
This year’s variables design is further refined by adding the variable, scale of secondary vocational education. We took into account that secondary vocational schools are an important source of skilled workers. As most of their graduates remain in the cities where their schools are located, their numbers can more directly reflect a city’s investment in intellectual capacity. Apart from Guangzhou, who tops the ranking in scale of secondary vocational education, Zhengzhou, Guiyang, Kunming and Nanjing also make it into the top five. The results, on the one hand, reflect the achievements made in accumulating skilled workers in central hubs and important node cities along the “Belt and Road” route, while building our hopes that economic development, both in scope and depth, will continue its advance from coastal to inland cities.
A city’s intellectual capital can be further illustrated with the proportion of expenditure on science and technology variable. China’s fiscal expenditure on science and technology grew 8.5% to over RMB 700 billion in 2015, RMB 55.13 billion more than the previous year, and represented 3.98% of China’s fiscal expenditure for the year. Sustained growth in research and development (R&D) input is attributed to China’s promotion of the strategy of innovation-driven development. Battelle Memorial Institute and R&D Magazine predict that Asia, China in particular, will devote an increasing proportion of spending to science and technology, and will overtake the U.S. by 2022 in this respect. All of the top eight observed cities surpass the national level, including Zhuhai, a city included for observation for the first time this year. Zhuhai ranks first in proportion of expenditure on science and technology, highlighting the great emphasis the city places on technological development and innovation, and echoing its vision to become a key city on the west bank of the Pearl River by building an international innovative city, as stated in its urban strategy plan.
1
2
3
4
5
6
7
8
9
10
11
12
13
14
14
1718
18
20
21
22
23
24
25
26
27
28
16
Guangzhou
Hangzhou
Nanjing
Shenzhen
Suzhou
Chengdu
Wuhan
Tianjin
Zhuhai
Xi’an
Changsha
Xiamen
Wuxi
Shenyang
Ningbo
Qingdao
Chongqing
Zhengzhou
Kunming
Dalian
Guiyang
Taiyuan
Fuzhou
Jinan
Urumqi
Shijiazhuang
Lanzhou
Harbin
21
24
16
28
26
17
3
15
19
5
25
27
11
6
20
12
10
9
22
13
23
8
2
14
18
7
4
1
28
15
24
1
7
23
22
5
14
20
6
10
13
17
4
12
8
27
25
11
26
21
16
2
19
9
18
3
175
165
163
146
136
132
131
129
118
116
115
114
100
99
99
96
88
84
84
83
74
73
66
65
60
54
50
45
24
26
22
27
25
8
23
19
28
14
13
15
21
17
20
11
3
6
12
10
16
18
5
7
9
4
2
1
26
25
28
10
6
22
28
20
1
24
22
14
5
19
2
17
23
9
11
17
5
12
7
15
3
8
13
18
24
21
27
24
27
12
13
28
24
19
8
11
27
18
21
16
14
5
3
18
1
7
11
16
2
4
6
9
26
27
25
28
22
24
23
21
13
19
17
20
7
12
10
14
18
15
6
8
2
4
16
9
1
11
3
5
26
27
21
28
23
26
19
21
19
15
24
17
16
10
22
14
12
13
5
6
1
3
9
2
8
11
4
8
Full-time teachers’turnover rate
Scale of secondary vocational education
Proportion of expenditure on science and technology
Research and development level
Index of comprehensive scientific and technological progress
Entrepreneurial environment
Innovation application
Score

PwC 11
Chinese Cities of Opportunity
2017
1
2
3
4
5
6
7
8
9
10
11
12
13
14
14
1718
18
20
21
22
23
24
25
26
27
28
16
Guangzhou
Hangzhou
Nanjing
Shenzhen
Suzhou
Chengdu
Wuhan
Tianjin
Zhuhai
Xi’an
Changsha
Xiamen
Wuxi
Shenyang
Ningbo
Qingdao
Chongqing
Zhengzhou
Kunming
Dalian
Guiyang
Taiyuan
Fuzhou
Jinan
Urumqi
Shijiazhuang
Lanzhou
Harbin
21
24
16
28
26
17
3
15
19
5
25
27
11
6
20
12
10
9
22
13
23
8
2
14
18
7
4
1
28
15
24
1
7
23
22
5
14
20
6
10
13
17
4
12
8
27
25
11
26
21
16
2
19
9
18
3
175
165
163
146
136
132
131
129
118
116
115
114
100
99
99
96
88
84
84
83
74
73
66
65
60
54
50
45
24
26
22
27
25
8
23
19
28
14
13
15
21
17
20
11
3
6
12
10
16
18
5
7
9
4
2
1
26
25
28
10
6
22
28
20
1
24
22
14
5
19
2
17
23
9
11
17
5
12
7
15
3
8
13
18
24
21
27
24
27
12
13
28
24
19
8
11
27
18
21
16
14
5
3
18
1
7
11
16
2
4
6
9
26
27
25
28
22
24
23
21
13
19
17
20
7
12
10
14
18
15
6
8
2
4
16
9
1
11
3
5
26
27
21
28
23
26
19
21
19
15
24
17
16
10
22
14
12
13
5
6
1
3
9
2
8
11
4
8
Full-time teachers’turnover rate
Scale of secondary vocational education
Proportion of expenditure on science and technology
Research and development level
Index of comprehensive scientific and technological progress
Entrepreneurial environment
Innovation application
Score

12
Every step of improvement in human civilisation have left its mark in the development of our cities. With the advent of a new technological revolution and industrial transformation, smart cities embody people’s hopes for a better life. A “smart city” can be defined as an intelligent system in which urban planning, construction, management and services are structured applying the latest information technology including the Internet of Things (IoT), cloud computing, big data and spatial-geographic information integration. Building smart cities will seamlessly combine urbanisation and information technology to create a highly advanced form of cities, significantly enhance residents’ living standards, and enable us to live in harmony with the urban environment. So far, developed countries, such as the U.S., the U.K., Germany and Japan have formulated strategies to speed up the construction of smart cities, and some developing countries have also ramped up input to follow in their footsteps.
The Chinese government views the construction of smart cities as a matter of great importance. In 2014, the State Council issued the National Plan for New Urbanisation (2014-2020), requiring that new industrialisation, information technology development, urbanisation and agricultural modernisation should be simultaneously promoted and seamlessly integrated, so that smart cities become an important pillar in China’s new urbanisation plan. In August 2015, with the approval of the State Council, the National Development and Reform Commission (NDRC), the Ministry of Industry and Information Technology (MIIT), and six other national departments and commissions jointly issued the Guidance for Promoting Healthy Development of Smart Cities, setting out a comprehensive plan for the construction of smart cities and stipulating for a group of smart cities with unique characteristics to be built by 2020. The 13th Five-Year Plan (2016-2020) explicitly called on all government departments to support smart city initiatives.
According to incomplete statistics, the smart city development plan has been introduced in all cities at and above sub-provincial level, in 90% of prefecture-level cities and 50% of county-level cities. Nearly 500 smart city model projects above the county-level have been approved by relevant departments. The projects cover more than 20 public services, ranging from transportation and public utilities to emergency response and education.
Interview: Creating smart cities for better living
Zhu HongrenFormer Chief Engineer at the Ministry of Industry and Information Technology
PwC 13
Smart cities are built in different parts of the world with different priorities: “technology-based smart cities” are built as digital cities, focusing on increasing the level of informatisation in cities through the development of advanced information communication technology and infrastructure construction; “management-oriented smart cities” focus on intelligent management, where information communication technology is applied in government management to enhance the efficiency of urban management and operations; “people-oriented smart cities” focus on the creation of smart living, where information communication technology is applied in public services and cultural consumption to enhance the cities’ habitability and humanistic qualities. So far, relevant efforts in China have been mostly focused on the construction of technology-based smart cities, while management-oriented smart cities are being gradually implemented in some areas. People-oriented smart cities remains a topic confined to academia.
As the Chinese economy enters the new normal era, smart cities have been developing at an accelerating rate, highlighting the following issues.
Firstly, place a greater emphasis on top-level design, and implement centralised planning. Effective design at the top level is critical because building smart cities encompasses various aspects of urban development and requires systematic planning. Resources should be reasonably allocated to establish scientific and effective long-term organisation and management mechanisms with due consideration given to eco-friendly cities and towns with special characteristics; pilot projects should be implemented in stages, so that efforts can be pooled together to guide the healthy development of smart cities and the continuous exploration of new models of urban transformation in China in an orderly and coordinated manner.
Secondly, follow an overall propulsion approach, while focusing on key construction projects. The designation of priorities is important in the establishment of smart cities, by taking urban planning and management, public services, social administration, industry development and other aspects into consideration. The top priority, however, must be broadband infrastructure construction. A centralised solution (guided by market demand) should be found for issues inhibiting urban development, by applying IoT, cloud computing, big data
and other new generation information technological tools to strengthen information sharing.
Third, emphasis should be placed on technology innovation, while ensuring information security. As the development of new generation information technologies is still in its infancy, particular attention should be paid to promoting innovation and using new technology in the process of building smart cities, so as to create a favourable environment for mass entrepreneurial and innovation projects. As online information security is an integral part of information-based development, more resources should be invested into improving information security in the course of promoting the development of new technologies, so as to effectively ensure cyber information security.
I believe, through the collaborative efforts between the government, enterprises, industry organisations and the general public, and China’s cooperation with other countries, China will be able to unlock the full potential of smart cities and further enhance and improve everyone’s quality of life.
Dalian Photo by Eric Li (PwC)

14
Chinese Cities of Opportunity
2017
II. Technology readiness
Technology readiness aims to evaluate the state of a city’s high-tech industry. In this report, this is observed through the four variables of Internet Plus, digital economy, software development and multimedia design and technology market size. The design of this dimension is weighted towards the level of innovation-driven Internet economy development. Due to a certain correlation between this dimension and intellectual capital and innovation, the two rankings show similar results. Shenzhen ranks first in Internet Plus and software development and multimedia design, indicating a high degree of Internet and software development and other industries related to the Internet economy. Guangzhou, Hangzhou, Nanjing, Wuhan, Chengdu, Suzhou, Xi’an, Tianjin and Xiamen take second to tenth places respectively, after Shenzhen.
In contrast to last year, we replace Internet penetration with Internet Plus this year. Internet Plus not only covers Internet usage, but also represents the combination of mobile Internet, cloud computing, big data and the Internet of Things with modern manufacturing industries. Chinese Cities of Opportunity adopts a China Internet Plus index to assess Internet application and penetration in various cities. The level of Internet Plus development also indicates a city’s innovative capacity and technological openness.
We use e-commerce index to analyse the development level of a city’s digital economy. Hangzhou, where Alibaba Group’s headquarters is located, tops the ranking in this respect. A 2016 ranking of the ten largest e-commerce firms by market share revealed that Alibaba retained top spot with a 26.6% market share, more than double of the 13%
market share claimed by Amazon in second place. Moreover, coastal cities in southeastern China, including Guangzhou, Shenzhen, Xiamen and Suzhou, display higher degrees of e-commerce development and are highly ranked in terms of digital economy.
Tianjin, Wuhan and Xi’an are ranked as the top three in technology market size, with technology input and output turnover per 10,000 people as the variable parameter. Xi’an and Tianjin’s large technology turnover can be attributed to their abundance of colleges and universities, with “211 Project” universities and institutions accounting for over 50% of technology transfers. Wuhan, meanwhile, has had a relatively large technology output turnover. As a leading city in the middle reaches of the Yangtze River, Wuhan will be a driving force in The Rise of Central China Plan through technological development.
Internet Plus Digital economy Technology market sizeSoftware development and multimedia design
Score
1
2
3
4
5
6
7
8
9
10
11
12
12
12
15
1718
19
20
21
22
23
24
25
26
27
28
16
Shenzhen
Guangzhou
Hangzhou
Nanjing
Wuhan
Chengdu
Suzhou
Xi’an
Tianjin
Xiamen
Qingdao
Jinan
Shenyang
Fuzhou
Chongqing
Changsha
Wuxi
Dalian
Ningbo
Zhengzhou
Zhuhai
Harbin
Kunming
Shijiazhuang
Taiyuan
Guiyang
Lanzhou
Urumqi
28
27
26
20
23
25
15
19
18
16
14
11
13
21
24
22
6
7
8
17
4
10
12
9
5
3
1
2
26
27
28
22
23
19
24
12
11
25
14
13
7
16
5
17
15
6
20
18
21
1
8
10
9
4
2
3
28
25
26
27
16
23
20
18
17
15
19
24
21
12
13
9
14
22
11
7
10
8
4
6
1
5
2
3
25
23
15
25
28
21
22
26
28
8
16
13
20
12
18
10
18
14
8
4
5
19
9
4
4
6
12
4
107
102
95
94
90
88
81
75
74
64
63
61
61
61
60
58
53
49
47
46
40
38
33
29
19
18
17
12

PwC 15
Chinese Cities of Opportunity
2017
Looking at this year’s technology readiness, we find Wuhan, Chengdu, Suzhou, Xi’an, Tianjin and Xiamen ranked among the top ten, which indicates that as increasing emphasis is placed on innovation and technology, city managers now attach greater importance to promoting technological progress and the leading roles that mass innovation and entrepreneurship play in urban development.
Internet Plus Digital economy Technology market sizeSoftware development and multimedia design
Score
1
2
3
4
5
6
7
8
9
10
11
12
12
12
15
1718
19
20
21
22
23
24
25
26
27
28
16
Shenzhen
Guangzhou
Hangzhou
Nanjing
Wuhan
Chengdu
Suzhou
Xi’an
Tianjin
Xiamen
Qingdao
Jinan
Shenyang
Fuzhou
Chongqing
Changsha
Wuxi
Dalian
Ningbo
Zhengzhou
Zhuhai
Harbin
Kunming
Shijiazhuang
Taiyuan
Guiyang
Lanzhou
Urumqi
28
27
26
20
23
25
15
19
18
16
14
11
13
21
24
22
6
7
8
17
4
10
12
9
5
3
1
2
26
27
28
22
23
19
24
12
11
25
14
13
7
16
5
17
15
6
20
18
21
1
8
10
9
4
2
3
28
25
26
27
16
23
20
18
17
15
19
24
21
12
13
9
14
22
11
7
10
8
4
6
1
5
2
3
25
23
15
25
28
21
22
26
28
8
16
13
20
12
18
10
18
14
8
4
5
19
9
4
4
6
12
4
107
102
95
94
90
88
81
75
74
64
63
61
61
61
60
58
53
49
47
46
40
38
33
29
19
18
17
12

16
Interview:China’s current specific need to develop Internet finance
There are currently numerous forms of Internet finance services available in the Chinese market, including finance, insurance, payment, asset management, fund management, investment management, wealth management and online lending, as well as stock exchanges, trading centres, P2P lending and equity-based crowdfunding. These are all essentially intermediary services created to meet the investment and financing needs of small and medium-sized businesses and the general public. As these services are conducted over the Internet and closely connected with finance, these services have become collectively known as “Internet finance”.
It can be said that Internet finance emerged and developed as a result of China’s current economic development and financial market structure. Small and medium businesses needed solutions for their financing difficulties, and the high costs involved and the lack of wealth management products for ordinary Chinese investors are just two instances of the many challenges that became the breeding ground for Internet finance.
So why is there a lack of large Internet finance companies in the U.S.? Because the American financial system is relatively mature, well developed and thus better equipped to meet the actual needs of its people. In China, however, financial services have very limited coverage of small and medium enterprises, in stark contrast to over 80% in the U.S. Even if Chinese small and medium companies manage to receive financing, the cost of financing is usually very high. As the Internet and financial systems in the U.S. are already quite advanced, Internet finance exists as an essential part of financial services, which is why it hasn’t developed into an independent sector.
Internet finance not only actively meets the financial needs in China’s real economy and people’s everyday lives, it also fills in the gaps not covered by traditional finance. In particular, internet finance fills those small and scattered gaps that are closest to the real economy and people’s actual needs by combining the latest finance and Internet technologies to provide professional services to meet financial needs arising from all scenarios. There are some overlap between customers served by Internet finance and banks. For example, banks generally prefer to lend to customers with a good credit history and such customers are relatively wealthier, but they don’t provide wealth management products suitable for these customers. Internet finance companies can offer a diverse range of wealth management products to meet these customers’ needs.
Dr. Yang JichuanCEO of Hfax.com

PwC 17
Another salient characteristic of Internet finance is payment flexibility. With advances in technology, the demand for convenience has continued to grow across different consumption channels, hence the proliferation of payment service providers. This is just one form of Internet finance, not a representative of the entire sector. As Internet finance companies seek to satisfy all kinds of financial needs, the attributes of Internet finance will inevitably increase. For example, professional Internet finance companies with lending capabilities can offer solutions to small and medium businesses who encounter difficulties borrowing from banks and the capital market.
Risk management is an important aspect of Internet finance. Firstly, we need to consider the borrowers. Why is it difficult for small and medium businesses to borrow from banks or the capital market? Precisely because information about their creditworthiness is not accepted. Start-ups, for example, do not have an adequate credit history to meet the banks’ borrowing requirements. However, if a start-up has a viable business model, a professional team and a certain level of risk control capability, it may be eligible for loans offered by Internet finance companies, who use big data and quantitative credit systems to assess the eligibility of loan applicants, rather than be constrained by traditional financing channels. For example, a start-up used Internet technology to simplify the delivery of flowers from flower growers to their customers and developed the most cost-effective and efficient solution for delivering fresh flowers to florists in cities. As an early-stage start-up, it had limited financial capacity and backing, and was still far from an initial public offering of their shares. So where could it go for financing? Banks are out of the question. This start-up team turned market demand into a feasible plan and managed to prove the viability of their business plan after developing their business over a few years. On the face of it, a business who would be rejected outright by banks may be acceptable to Internet finance companies. This is what makes Internet finance so interesting. There are innumerous young dynamic start-ups in China like the one mentioned above, with many more emerging everyday. However, due to the higher risks associated with lending to early-stage start-ups, Internet finance companies lending to them need to have highly capable and strong risk control teams to ensure effective risk management. A good team must possess both financial and technical capabilities. Such capabilities are valuable because they cannot be easily replicated or imitated.
In addition to customer-related risks, Internet finance companies also need to pay heed to systemic risks associated with the market. Systemic risks affect the entire financial market, but companies who have strong risk controls are likely to be less affected by them. At present, these emerging financial companies are smaller in size and have low market concentration, giving them a unique edge over traditional financial institutions.
From what we can see now, China’s Internet finance has a bright future ahead.
Qingdao Photo by David Zou (PwC)

18
Chinese Cities of Opportunity
2017
III. Important regional cities
Important regional cities reflect the target cities’ significance in the region and includes the following six variables: star graded hotels, international tourists, inbound and outbound flights, total passenger flows, freight transport volume and exhibition/convention economic development. Our observation objects are not only central cities in their respective regions, but also gateway cities with multiple international relationships. The different aspects represented by these variables reflect these cities’ regional status. Freight transport volume was added as a variable for observation this year to further improve our observation of the cities’ regional economic influence.
Statistics show that Guangzhou, Chongqing, Shenzhen, Chengdu, Xi’an and Hangzhou occupied the top six places in the ranking, the same as last year. Guangzhou and Shenzhen have alternated between first and second places for star graded hotels, international tourists and inbound and outbound flights, an indication of these hub cities’ importance in the Pearl River Delta in terms of regional cooperation and opening-up.
We also note that Chongqing, Kunming, Guiyang and other central and western cities rank prominently in certain variables. Chongqing ranks third in total passenger flows and first in freight transport volume, and its strategic position as a southwest transport hub cannot be underestimated. Kunming ranks third in inbound and outbound flights, behind Guangzhou and Shenzhen. National Urban Circulation node layout plan (2015-2020) unveiled a “three vertical and five horizontal” national backbone large circulation channel system. In particular, it promotes construction of circulation
infrastructure in the western region along the western Hohhot-Kunming Circulation Channel, with the western cities of Chongqing and Kunming as hubs, and led by national-level new areas along the line such as Liangjiang New Area in Chongqing. The Shanghai-Kunming Circulation Channel, on the other hand, relies on the integrated transport system comprising Shanghai-Kunming High-Speed Railway, Shanghai-Kunming Railway and so on to form a large channel traversing the eastern and central regions and connecting to South Asia. Guiyang ranks second only to Guangzhou in total passenger flows, mainly owing to the city’s constant industrial upgrades and increased inflow of talent. Since the 2016 Second Big Data Expo held in Guiyang, China’s three major telecommunication operators, together with Alibaba, Tencent, Foxconn and other technology companies, have been building large computer rooms and data centres in Guiyang and the surrounding areas, and the government has been steadily pursuing a big data strategy.
It is worth mentioning that, in compliance with the National New-type Urbanisation Plan (2014-2020) and other national strategies, the 13th Five-Year Plan for Civilian Airport Construction replaced the point-to-point airport and route design with the concept of urban clusters, aiming to develop hub airports and create world-class airport clusters in the Beijing-Tianjin-Hebei, Yangtze River Delta and Pearl River Delta regions. Cities in these three economic belts will usher in a new round of international development opportunities.
Star graded hotels International tourists Inbound and outbound flights
Total passenger flows Freight transport volume Exhibition/conventioneconomic development
Score
165
151
145
128
125
124
122
114
112
102
97
87
85
83
83
83
78
78
75
73
68
57
51
43
31
29
29
24
27
24
28
22
20
26
12
7
25
21
23
20
10
15
13
18
5
12
1
7
15
16
18
8
2
3
4
9
27
23
28
21
18
20
22
26
16
19
17
7
12
25
3
6
13
11
8
15
14
5
24
9
10
4
2
1
28
23
27
25
24
22
19
14
20
18
21
16
10
4
12
8
26
4
17
13
9
11
2
15
1
7
5
6
28
26
17
25
22
21
23
19
16
6
7
11
20
24
27
15
10
14
18
9
13
12
3
1
8
2
5
4
27
28
19
12
24
16
25
26
17
14
13
20
8
4
18
21
15
23
11
22
9
1
3
6
5
7
10
2
28
27
26
23
17
19
21
22
18
24
16
13
25
11
10
15
9
14
20
7
8
12
1
4
5
6
3
2
1
2
3
4
5
6
7
8
9
10
11
12
13
14
14
1717
19
20
21
22
23
24
25
26
26
28
14
Guangzhou
Chongqing
Shenzhen
Chengdu
Xi’an
Hangzhou
Wuhan
Tianjin
Nanjing
Qingdao
Xiamen
Changsha
Shenyang
Suzhou
Guiyang
Jinan
Kunming
Ningbo
Zhengzhou
Dalian
Fuzhou
Harbin
Zhuhai
Urumqi
Wuxi
Taiyuan
Shijiazhuang
Lanzhou

PwC 19
Chinese Cities of Opportunity
2017
Star graded hotels International tourists Inbound and outbound flights
Total passenger flows Freight transport volume Exhibition/conventioneconomic development
Score
165
151
145
128
125
124
122
114
112
102
97
87
85
83
83
83
78
78
75
73
68
57
51
43
31
29
29
24
27
24
28
22
20
26
12
7
25
21
23
20
10
15
13
18
5
12
1
7
15
16
18
8
2
3
4
9
27
23
28
21
18
20
22
26
16
19
17
7
12
25
3
6
13
11
8
15
14
5
24
9
10
4
2
1
28
23
27
25
24
22
19
14
20
18
21
16
10
4
12
8
26
4
17
13
9
11
2
15
1
7
5
6
28
26
17
25
22
21
23
19
16
6
7
11
20
24
27
15
10
14
18
9
13
12
3
1
8
2
5
4
27
28
19
12
24
16
25
26
17
14
13
20
8
4
18
21
15
23
11
22
9
1
3
6
5
7
10
2
28
27
26
23
17
19
21
22
18
24
16
13
25
11
10
15
9
14
20
7
8
12
1
4
5
6
3
2
1
2
3
4
5
6
7
8
9
10
11
12
13
14
14
1717
19
20
21
22
23
24
25
26
26
28
14
Guangzhou
Chongqing
Shenzhen
Chengdu
Xi’an
Hangzhou
Wuhan
Tianjin
Nanjing
Qingdao
Xiamen
Changsha
Shenyang
Suzhou
Guiyang
Jinan
Kunming
Ningbo
Zhengzhou
Dalian
Fuzhou
Harbin
Zhuhai
Urumqi
Wuxi
Taiyuan
Shijiazhuang
Lanzhou
20
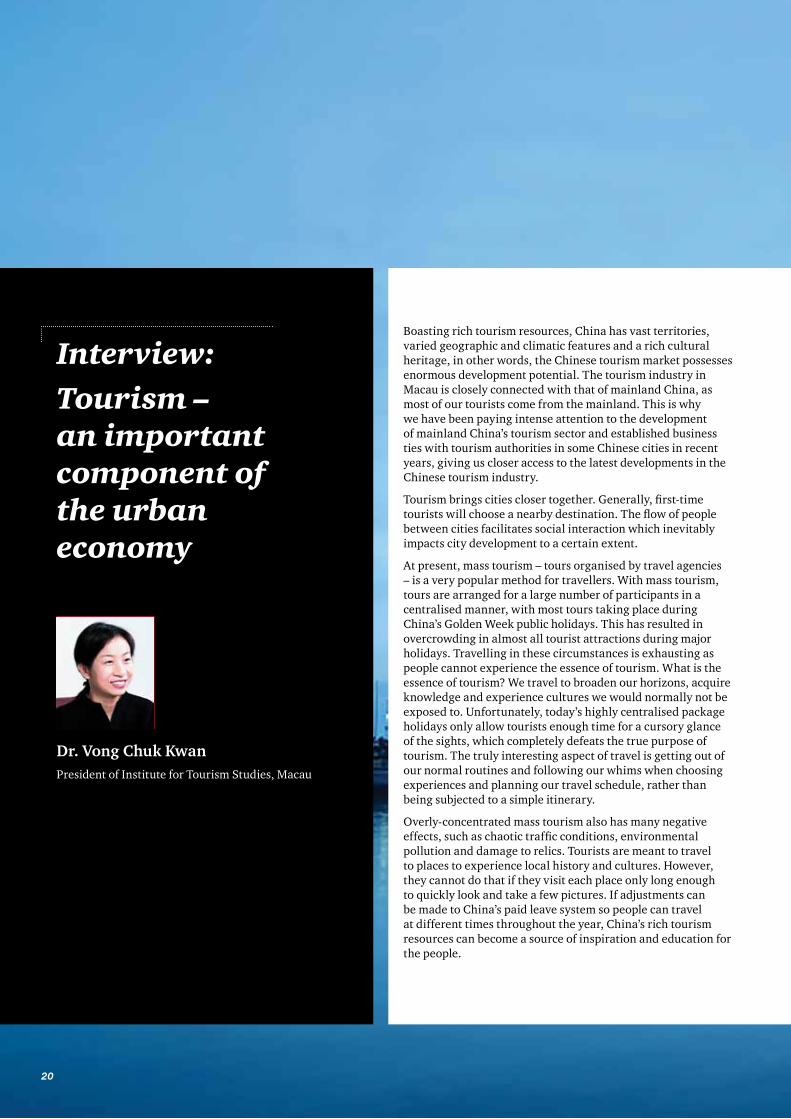
Interview:Tourism – an important component of the urban economy
Boasting rich tourism resources, China has vast territories, varied geographic and climatic features and a rich cultural heritage, in other words, the Chinese tourism market possesses enormous development potential. The tourism industry in Macau is closely connected with that of mainland China, as most of our tourists come from the mainland. This is why we have been paying intense attention to the development of mainland China’s tourism sector and established business ties with tourism authorities in some Chinese cities in recent years, giving us closer access to the latest developments in the Chinese tourism industry.
Tourism brings cities closer together. Generally, first-time tourists will choose a nearby destination. The flow of people between cities facilitates social interaction which inevitably impacts city development to a certain extent.
At present, mass tourism – tours organised by travel agencies – is a very popular method for travellers. With mass tourism, tours are arranged for a large number of participants in a centralised manner, with most tours taking place during China’s Golden Week public holidays. This has resulted in overcrowding in almost all tourist attractions during major holidays. Travelling in these circumstances is exhausting as people cannot experience the essence of tourism. What is the essence of tourism? We travel to broaden our horizons, acquire knowledge and experience cultures we would normally not be exposed to. Unfortunately, today’s highly centralised package holidays only allow tourists enough time for a cursory glance of the sights, which completely defeats the true purpose of tourism. The truly interesting aspect of travel is getting out of our normal routines and following our whims when choosing experiences and planning our travel schedule, rather than being subjected to a simple itinerary.
Overly-concentrated mass tourism also has many negative effects, such as chaotic traffic conditions, environmental pollution and damage to relics. Tourists are meant to travel to places to experience local history and cultures. However, they cannot do that if they visit each place only long enough to quickly look and take a few pictures. If adjustments can be made to China’s paid leave system so people can travel at different times throughout the year, China’s rich tourism resources can become a source of inspiration and education for the people.
Dr. Vong Chuk KwanPresident of Institute for Tourism Studies, Macau

PwC 21
Tourism also leads to the commercialisation of local features. Popular tourist sites often attract more visitors than they can handle. In order to cater to their needs, similar looking places have been built to meet this growing demand, but often the authenticity of the original site is lost in the process. When tourists travel from one place to another, what they really want to see is the local culture, traditions, customs and so on in the original form, things they cannot see anywhere else. Unfortunately, many tourist sites today are patently artificial. This is not a phenomenon which is unique to China, as tourist attractions in other countries also have varying degrees of artificialisation. In fact, the intentions behind the relevant policies for site construction are generally good – to retain the authenticity of the local culture as much as possible – but compromises are often made in their implementation due to commercial considerations. Macau has set a very good example in terms of preserving authentic local features. The mingling of centuries of Chinese and western cultures is evident in the streets and architecture of Macau. The foreign cultural elements brought by the Portuguese to Macau during the Age of Exploration can be found all over the city, showcasing a remarkable harmonious fusion of eastern and western cultures.
Tourism can have a multi-faceted impact on a city’s economic development. The State Council has promulgated in an official document that tourism will be one of the driving forces for local economic development for the following reasons. Firstly, tourism is eco-friendly and can create job opportunities at the grassroots level. Secondly, tourism expands the influence of economic development to the outskirts and diverts economic growth drivers to the suburbs, which is a great way to urbanise suburban areas. The U.N. World Tourism Organization has always encouraged developing nations to develop or tap into their tourism resources, because tourism is the most direct economic driver, and enables remote areas and undereducated people to benefit from economic growth. The emerging Internet tourism model is also a new driver of economic development.
Not only is tourism an economic driver, it is also a social engine. Tourism, such as border tourism, can be a means of social interaction between people and between cities. Leveraging tourism as a diplomatic strategy, we can attract
tourists from neighbouring countries, and foster friendly relations with these countries in the process.
Improving infrastructure is a critical step in China’s transition from a major tourist destination into a tourism superpower. There is still much room for improvement in many aspects of China’s tourism infrastructure. China National Tourism Administration’s “Toilet Revolution” campaign has facilitated the construction of public toilet facilities in urban and rural areas. In the meantime, it is necessary to cultivate tourism etiquette – on one hand, foreign tourists visiting China should experience the country’s traditional culture of comity and civility; on the other hand, Chinese tourists’ behaviour while travelling abroad can be improved. Tourism plays an important role in shaping people’s worldview, as they learn of the world’s established norms of behaviour when they are exposed to different cultures.
Qingdao Photo by David Zou (PwC)

22
Chinese Cities of Opportunity
2017
Healthcare resources ScoreMedical facilities Elderly care services Urban traffic safety index Disaster loss
100
96
96
94
92
91
90
89
87
84
82
80
79
75
73
70
67
66
66
61
61
60
56
51
51
51
48
34
23
14
27
25
4
20
21
19
13
18
26
24
22
15
6
17
3
9
11
10
12
28
8
16
2
7
5
1
19
22
17
6
26
28
16
23
18
27
7
12
20
25
9
24
10
15
11
3
14
2
1
21
13
5
4
8
28
21
27
11
24
24
25
11
19
14
8
15
2
14
8
5
22
16
14
27
5
19
21
11
5
2
19
8
27
19
7
28
26
2
15
9
14
18
13
4
25
12
24
3
21
20
11
17
8
6
10
1
23
22
5
16
3
20
18
24
12
17
13
27
23
7
28
25
10
9
26
21
11
6
19
4
22
5
16
2
8
15
15
1
1
2
2
4
5
6
7
8
9
10
11
12
13
14
15
1718
18
20
20
22
23
24
24
24
27
28
16
Guangzhou
Chengdu
Wuhan
Shenzhen
Hangzhou
Taiyuan
Xi’an
Changsha
Guiyang
Jinan
Zhengzhou
Shijiazhuang
Zhuhai
Urumqi
Xiamen
Kunming
Nanjing
Shenyang
Dalian
Tianjin
Qingdao
Harbin
Chongqing
Lanzhou
Ningbo
Suzhou
Fuzhou
Wuxi
IV. Healthcare, safety and public security
For healthcare, safety and public security, we designed five variables, namely healthcare resources, medical facilities, elderly care services, urban traffic safety index and disaster loss. There’s a certain degree of difficulty with the observation of this dimension, the primary one being the description of data acquisition limitations. In our current data, only road traffic mortality is selected for urban traffic safety index. In addition, disaster loss is a new variable added to this year’s report, the degree of which is described using the property insurance claim rate of insurance companies. The above variables only provide glimpses into a city’s medical care, pension and overall security, which is enough for observing and comparing cities, but for specific cities, observation of more detailed factors needs to be carried out.
The top ranking six cities for this dimension are Guangzhou, Chengdu and Wuhan (tied), Shenzhen, Hangzhou and Taiyuan, followed by Xi’an, Changsha, Guiyang and Jinan. There is no obvious geographical differentiation in the distribution of these cities, but it can be seen that the top cities are mainly provincial capitals. This is because China’s medical resources are primarily concentrated in provincial capital cities and the city management of big cities is also of higher quality.
Taiyuan, a newly included city for this year’s report, tops the healthcare
resources ranking. In all of the 28 cities, Taiyuan boasts the largest number of (assistant) medical practitioners per 10,000 people, an indication that the city’s investment in residents’ health has been quite effective. Meanwhile, Taiyuan ranks fifth for medical facilities. The city has a total of 13 third-level A-grade hospitals, behind Guangzhou with 20, Tianjin and Wuhan (17) and Xi’an (16). In addition, Urumqi ranks high (fourth) in healthcare resources, an indication of the country’s increasing support for border areas.
This year, the parameter, urban pension insurance coverage, is used. The reason for this is because after 20 years of development, urban pension insurance has basically achieved wide coverage and is now working towards multi-level sustainability. Shenzhen and Guangzhou score high in the elderly care services variable, indicating that urban workers who have basic pension insurance account for a large proportion of the city’s residential population.
Chengdu and Wuhan tie for second place. Although both cities failed to top the ranking of any one variable and their development in other aspects has been average, they have done relatively well at supporting their residents’ lifestyle, health and public security.

PwC 23
Chinese Cities of Opportunity
2017
Healthcare resources ScoreMedical facilities Elderly care services Urban traffic safety index Disaster loss
100
96
96
94
92
91
90
89
87
84
82
80
79
75
73
70
67
66
66
61
61
60
56
51
51
51
48
34
23
14
27
25
4
20
21
19
13
18
26
24
22
15
6
17
3
9
11
10
12
28
8
16
2
7
5
1
19
22
17
6
26
28
16
23
18
27
7
12
20
25
9
24
10
15
11
3
14
2
1
21
13
5
4
8
28
21
27
11
24
24
25
11
19
14
8
15
2
14
8
5
22
16
14
27
5
19
21
11
5
2
19
8
27
19
7
28
26
2
15
9
14
18
13
4
25
12
24
3
21
20
11
17
8
6
10
1
23
22
5
16
3
20
18
24
12
17
13
27
23
7
28
25
10
9
26
21
11
6
19
4
22
5
16
2
8
15
15
1
1
2
2
4
5
6
7
8
9
10
11
12
13
14
15
1718
18
20
20
22
23
24
24
24
27
28
16
Guangzhou
Chengdu
Wuhan
Shenzhen
Hangzhou
Taiyuan
Xi’an
Changsha
Guiyang
Jinan
Zhengzhou
Shijiazhuang
Zhuhai
Urumqi
Xiamen
Kunming
Nanjing
Shenyang
Dalian
Tianjin
Qingdao
Harbin
Chongqing
Lanzhou
Ningbo
Suzhou
Fuzhou
Wuxi
重庆市渝中区解放碑全景
Hangzhou Photo by Ethan Zhu

24
Interview: Family doctors contracting services are a safeguard for urban residents’ health
A report published by the World Health Organization (WHO) reveals that decisive factors affecting people’s heath today include medical services, genetics, lifestyle and environment. Specifically, medical services contribute 10%, genetics 15%, lifestyle 60% and environment 15%. In other words, lifestyle has become the leading decisive factor of physical well-being. In early 20th century, acute and chronic infections, malnutrition and parasitic diseases posed the biggest threat to public health. However, the spectrum of human diseases has changed radically from the second half of the 20th century and chronic illnesses have become the most serious threat to people’s wellbeing. At present, the three diseases with the highest mortality rates in China are cancer, heart disease and cerebrovascular disease, all of which are caused by unhealthy lifestyles, and can be prevented and controlled through effective health management, such as disease prevention measures, physical examination, promotion of a healthy lifestyle and balanced diet.
Family doctors, also known as general practitioners (GPs), mainly provide day-to-day healthcare services, including personalised disease prevention, healthcare, medical treatment, rehabilitation and health education and guidance, to local residents in their neighbourhoods, and have been called the “gatekeepers” of healthcare. The GP system is well-established in most developed countries, such as the UK and Canada, and all residents are required to choose a contracted GP who is their first point of contact when they fall ill. The GP may refer them to a specialist or general hospital at a higher level where necessary. Family doctors’ clinics are typically located within residential communities for the convenience of local patients. GPs are qualified and experienced general physicians who are capable of providing local residents with timely and effective treatment of general health issues and minor ailments. In particular, due to their close connection with their local communities, GPs can offer health management services to local residents to help prevent diseases, safeguard their health and improve their living standards.
In fact, Chinese cities also had a similar medical care system in the past. I remember when I was a child, there was a community clinic in every alleyway in Beijing. They were generally small government-run clinics attended by trained
Dr. Qiu YulinProfessor and PhD Supervisor at School of Labour Relations and Human Resources, Renmin University of China

PwC 25
doctors, offering medical treatment of minor illnesses for local residents. The clinics were poorly equipped but very convenient for local residents, allowing them to receive treatment for headaches, fevers and other ailments without leaving their neighbourhood. However, in the last 20 to 30 years, medical resources in Chinese cities have become excessively centralised and hospitals have become bigger, especially since municipal governments have been enthusiastically building more third-level A-grade hospitals . The Chinese have also developed a blind faith in big hospitals, increasingly seeking treatment for both major and minor illnesses at big hospitals, which has resulted in overcrowding, significant difficulties registering for doctor appointments and high medical costs.
According to medical research, 80% of human diseases can be treated in community hospitals or clinics, and only 20% require treatment in big hospitals. It is therefore imperative to encourage residents to take a rational approach when seeking medical treatment by first going to community hospitals and clinics in their neighbourhoods and to launch and develop the family doctor contracting system. As healthcare reforms deepen, introducing a multi-layer GP system has become the top priority. On 25 October 2016, the CPC Central Committee and State Council issued the Healthy China 2030 Planning Outline, stressing that efforts will be made to “safeguard the health of the masses through the implementation of preventive care, promoting healthy lifestyles, reducing the occurrences of diseases and improving early detection, early treatment and speedy recovery measures”. One of the key steps in the implementation of this national healthcare strategy is to establish the family doctor system, which the public and private sectors collaborate to promote and improve. Family doctor contracting pilot programmes were launched in Beijing, Shanghai, Wuhan, Shenzhen, Qingdao and other Chinese cities in 2011, but this system is problematic and still not widely available. Firstly, there is a severe shortage of GPs. According to statistics published by the National Health and Family Planning Commission, as of the end of 2015, there were only 18,900 qualified GPs in China, accounting for merely 6.6% of the total number of medical practitioners, way below the target specified in the document issued by the State Council, namely “2-3 qualified GPs for every 10,000 urban and rural residents”. Secondly, GPs need to be structurally diversified to bring in competition from non-profit organisations. Thirdly,
the demand for GP services is not high. Due to widespread distrust of grassroots-level medical institutions, the Chinese have become accustomed to seeking treatment from their preferred medical service providers and are unwilling to voluntarily visit grassroots-level clinics for initial diagnoses; furthermore, third-level hospitals frequently offer outpatient appointments, rendering grassroots-level medical institutions’ price differentiation less attractive to patients .
Going forward, improving the utilisation rate of primary medical services should be established as the top priority in promoting the family doctor system. Based on people’s demand for basic medical services, the quantity and quality of primary medical care – provided mainly by GPs – should be optimised through competition, patient referrals, qualification schemes and other tactics.
In the future, the GP system should be introduced to more cities, drawing on international best practices and the past experience of family doctor contracting services in developed cities. Health management must be offered on a personal level and GPs need to shoulder the mission and responsibility to safeguard the health of the urban masses.

26
Chinese Cities of Opportunity
2017
V. Transportation and urban planning
Traffic congestion is a current phenomenon in most Chinese cities that adversely affects their residents’ commute and economic development. Solutions to most traffic issues need to start with the urban structure, using rational spacial planning and continuous optimisation of the traffic network to improve the cities’ operating efficiency. Transportation and urban planning is described with seven variables, including road area per capita, public transit system, rail transit coverage, urban expansion rate, state of urban floating population, green area and housing availability for residents.
Zhuhai and Shenzhen have the highest scores for this dimension, as they rank high across most variables. They are followed by Nanjing, Guangzhou, Xiamen, Hangzhou, Urumqi, Wuhan, Kunming, and Xi’an and Shenyang (tied). Because of its small residential population, Zhuhai ranks high by four variables that use data on a per capita or per 10,000 people basis, specifically road area per capita, public transit system, green area and housing availability for residents. In recent years, local governments have been focusing more on rail transit as the new means of transport and the solution to urban congestion and improving the urban environment. Almost every city’s 13th Five-Year Plan refers to the construction of rail transit as a key project. This is why we have chosen rail transit coverage as a variable for three consecutive years. Nanjing, with the highest mileage of railway tracks built over many years, again tops the ranking for rail transit mileage per 10,000 people. It is noteworthy that, although the bottom ranking eight cities do not have any rail transit mileage in operation, they all have rail transit systems planned or under construction. We are definitely
looking forward to seeing China further optimising its allocation of traffic resources in the future.
Urban expansion rate is a new variable this year. Due to limited arable land per capita, China has been very cautious about the expansion of its cities’ borders. In this survey, we specifically incorporated statistics on newly requisitioned land area as a proportion of the built-up area of cities
and included urban development scale in our observation. From the perspective of controlling the development scale of large cities, the logic of the ranking is to give priority to slower expansion. Shijiazhuang, as the “third pole” of the Beijing-Tianjin-Hebei urban clusters, has gradually slowed its pace of growth and has been moving towards intensive and large-scale development. It tops the ranking for this variable.
Score
156
156
146
142
132
125
124
123
121
109
109
105
103
101
98
98
91
90
85
80
78
77
75
74
73
67
61
57
28
23
27
14
21
11
19
17
12
16
25
10
18
3
13
22
5
26
24
20
8
1
2
7
15
4
6
9
26
25
19
24
27
22
28
18
18
23
10
18
10
5
6
2
14
18
20
8
7
4
13
21
11
1
3
12
4
24
28
26
8
19
5
21
18
11
23
27
20
16
14
17
22
1
25
3
7
6
13
12
9
2
15
10
27
26
12
21
9
17
20
10
24
8
7
11
16
18
22
14
19
5
4
13
1
15
25
3
3
28
6
23
17
25
10
21
24
11
27
23
12
8
6
2
28
26
3
5
13
16
4
7
22
19
9
20
14
18
15
1
26
28
28
25
24
19
21
7
16
18
21
24
4
9
17
22
6
9
6
15
13
14
3
2
13
11
10
1
28
5
22
11
19
26
4
27
21
25
17
13
7
24
23
16
12
15
2
14
20
18
10
9
8
3
6
1
1
1
3
4
5
6
7
8
9
10
10
12
13
14
15
1718
19
20
21
22
23
24
25
26
27
28
15
Zhuhai
Shenzhen
Nanjing
Guangzhou
Xiamen
Hangzhou
Urumqi
Wuhan
Kunming
Xi’an
Shenyang
Dalian
Tianjin
Zhengzhou
Suzhou
Wuxi
Chengdu
Jinan
Lanzhou
Taiyuan
Guiyang
Fuzhou
Ningbo
Changsha
Qingdao
Shijiazhuang
Chongqing
Harbin
Road area per capita Public transit system Rail transit coverage Urban expansion rate State of urban floating population
Green area Housing availability forresidents

PwC 27
Chinese Cities of Opportunity
2017
Score
156
156
146
142
132
125
124
123
121
109
109
105
103
101
98
98
91
90
85
80
78
77
75
74
73
67
61
57
28
23
27
14
21
11
19
17
12
16
25
10
18
3
13
22
5
26
24
20
8
1
2
7
15
4
6
9
26
25
19
24
27
22
28
18
18
23
10
18
10
5
6
2
14
18
20
8
7
4
13
21
11
1
3
12
4
24
28
26
8
19
5
21
18
11
23
27
20
16
14
17
22
1
25
3
7
6
13
12
9
2
15
10
27
26
12
21
9
17
20
10
24
8
7
11
16
18
22
14
19
5
4
13
1
15
25
3
3
28
6
23
17
25
10
21
24
11
27
23
12
8
6
2
28
26
3
5
13
16
4
7
22
19
9
20
14
18
15
1
26
28
28
25
24
19
21
7
16
18
21
24
4
9
17
22
6
9
6
15
13
14
3
2
13
11
10
1
28
5
22
11
19
26
4
27
21
25
17
13
7
24
23
16
12
15
2
14
20
18
10
9
8
3
6
1
1
1
3
4
5
6
7
8
9
10
10
12
13
14
15
1718
19
20
21
22
23
24
25
26
27
28
15
Zhuhai
Shenzhen
Nanjing
Guangzhou
Xiamen
Hangzhou
Urumqi
Wuhan
Kunming
Xi’an
Shenyang
Dalian
Tianjin
Zhengzhou
Suzhou
Wuxi
Chengdu
Jinan
Lanzhou
Taiyuan
Guiyang
Fuzhou
Ningbo
Changsha
Qingdao
Shijiazhuang
Chongqing
Harbin
Road area per capita Public transit system Rail transit coverage Urban expansion rate State of urban floating population
Green area Housing availability forresidents
Of particular note is that Xiamen has risen five places for this dimension this year, primarily by virtue of its strength in public transit system and green area. With an urban green area rate of 41%, Xiamen is true to its reputation as a “garden city.”

28
Chinese Cities of Opportunity
2017
VI. Sustainability and the natural environment
Building ecological green cities is an objective requirement of sustainable development. China also attaches great importance to the goal of sustainable development. Last year at the G20 Hangzhou Summit, China advocated the formulation of a G20 Action Plan on the 2030 Agenda for Sustainable Development, and this goal had previously been integrated into the Outline of the 13th Five-Year Plan for National Economic and Social Development.
There has been a slight change to sustainability and the natural environment, compared with last year. On the basis of last year’s variable design, it has been pared down to three aspects that affect sustainable development and reflect the natural environment: water resource management and resource utilisation, labour supply and carbon emissions. We selected five variables to observe: rate of change in household water consumption per capita, centralised sewage treatment rate and decontamination rate of household waste, labour supply, rate of change of floating population and carbon emissions. The results show that the top seven cities are Shenzhen, Wuhan, Guangzhou, Hangzhou and Chengdu (tied), and Zhuhai and Xiamen (tied).
The new variable, rate of change in household water consumption per capita, compares daily domestic water use per capita this year with that of the previous year. Chengdu, Hangzhou and Lanzhou are the top three cities for this variable. Apart from the top three cities, Fuzhou, Guangzhou, Wuhan, Jinan, Ningbo, Tianjin, Taiyuan, Urumqi and Shenzhen recorded declining water consumption per capita, reflecting local residents’ growing awareness of sustainable development. At the same time, the variable, centralised sewage treatment rate and decontamination rate of household waste, measures the efficiency of resource utilisation in each city from an urban management perspective, which in turn reflects differences in the development of the cities’ recycling economies. Changsha is ranked first by this variable with over 97% centralised sewage treatment rate and 100% decontamination rate of household waste. As a unique city in central China, Changsha has attached great importance to sustainable development in recent years while continuing to develop its economy, and is ranked third for the carbon emissions variable.
In 2015, China’s Ministry of Environmental Protection resumed calculation of Green GDP 2.0, which deducts the cost of ecological destruction and the cost of pollution control from GDP to reflect the environmental cost of economic activities. Echoing the green GDP concept, the measurement standard for the carbon emissions variable is carbon emissions from coal,
crude oil and natural gas consumption of each city per unit of GDP. Shenzhen and Zhuhai are the top two cities for this variable, reflecting their cumulative long-term achievements in resource and environmental protection.
Overall, the cities with high rankings in this dimension are more economically developed, primarily focused on intensive economic development, and have a geographical and industrial upper hand in terms of resource utilisation, labour supply and the natural environment.
Centralised sewage treatment rate and decontamination rate of household waste
Rate of change of floating population
Carbon emissions ScoreLabour supply
1
2
3
4
4
6
6
8
9
10
11
12
13
14
14
1718
19
20
21
22
23
24
24
26
27
28
16
Shenzhen
Wuhan
Guangzhou
Hangzhou
Chengdu
Zhuhai
Xiamen
Tianjin
Fuzhou
Jinan
Zhengzhou
Qingdao
Changsha
Wuxi
Guiyang
Urumqi
Ningbo
Kunming
Suzhou
Nanjing
Xi’an
Chongqing
Shijiazhuang
Lanzhou
Taiyuan
Shenyang
Dalian
Harbin
Rate of change in household water consumption per capita
118
109
105
104
104
93
93
91
87
85
83
75
70
67
67
65
64
61
60
57
55
54
53
52
52
42
37
30
17
23
24
27
28
12
16
20
25
22
9
10
1
7
4
18
21
8
5
15
13
11
2
26
19
3
6
14
27
19
7
20
23
24
18
4
15
26
25
22
28
17
12
3
12
6
13
10
16
8
10
1
5
21
14
2
18
24
26
20
16
7
11
25
27
12
28
17
10
8
22
21
6
19
6
9
4
23
14
13
15
3
2
1
28
19
25
17
15
23
27
24
6
8
14
11
5
22
13
20
21
16
26
18
3
1
2
10
12
7
9
4
28
24
23
20
22
27
21
18
14
17
7
15
26
13
16
3
4
12
10
5
19
11
25
2
1
8
6
9

PwC 29
Chinese Cities of Opportunity
2017
大连市星海广场Centralised sewage treatment rate and decontamination rate of household waste
Rate of change of floating population
Carbon emissions ScoreLabour supply
1
2
3
4
4
6
6
8
9
10
11
12
13
14
14
1718
19
20
21
22
23
24
24
26
27
28
16
Shenzhen
Wuhan
Guangzhou
Hangzhou
Chengdu
Zhuhai
Xiamen
Tianjin
Fuzhou
Jinan
Zhengzhou
Qingdao
Changsha
Wuxi
Guiyang
Urumqi
Ningbo
Kunming
Suzhou
Nanjing
Xi’an
Chongqing
Shijiazhuang
Lanzhou
Taiyuan
Shenyang
Dalian
Harbin
Rate of change in household water consumption per capita
118
109
105
104
104
93
93
91
87
85
83
75
70
67
67
65
64
61
60
57
55
54
53
52
52
42
37
30
17
23
24
27
28
12
16
20
25
22
9
10
1
7
4
18
21
8
5
15
13
11
2
26
19
3
6
14
27
19
7
20
23
24
18
4
15
26
25
22
28
17
12
3
12
6
13
10
16
8
10
1
5
21
14
2
18
24
26
20
16
7
11
25
27
12
28
17
10
8
22
21
6
19
6
9
4
23
14
13
15
3
2
1
28
19
25
17
15
23
27
24
6
8
14
11
5
22
13
20
21
16
26
18
3
1
2
10
12
7
9
4
28
24
23
20
22
27
21
18
14
17
7
15
26
13
16
3
4
12
10
5
19
11
25
2
1
8
6
9
Tianjin Photo by Lily Wang

30
Chinese Cities of Opportunity
2017
VII. Culture and lifestyle
Residents are the heart of a city and culture is its soul. The focus on people’s livelihood in China’s 13th Five-Year Plan means caring about the lives of residents and exploring the potential and opportunities for urban development and improvement of local residents’ living standards, in order to make cities better places to work and live in.
This year, culture and lifestyle still has four variables: cultural dynamism, traffic congestion, air quality and standard of living. Although there are only a few variables, the number of actual lifestyle elements summarised by this dimension is greater than the number of variables suggests, as the observational coverage of the constituent variables needs to be further subdivided. Among them, standard of living comprise retail sales of consumer goods per capita and domestic electricity consumption of rural and urban residents per capita so as to reflect local residents’ actual living conditions. Zhuhai ultimately ranks first for this dimension by virtue of its high air quality and standard of living, followed by Nanjing and Fuzhou, tied for second place, and Changsha and Xiamen rank fourth and fifth respectively.
Changsha ranks second in cultural dynamism, a variable that evaluates the size of a city’s cultural industry by looking at its fiscal expenditure on culture, sports and media and the proportion of people employed in culture, sports and entertainment. As the cultural capital of central China, Changsha aims to become a “regional creative design centre with global influence” and a “city of world media and arts.” Changsha has maintained about 15% growth for many years, as the scale of its cultural industry enjoys year-on-year expansion and the total size of its cultural industry grows steadily.
Traffic congestion is one of the urban diseases that comes with urban development. The common thread linking the four cities with the least traffic congestion — Wuxi, Ningbo, Suzhou and Nanjing — is that they have a high level of economic development and focused on the construction of diversified public transport systems. Nanjing is committed to becoming a “public transport city”. It aims to build an urban public transport system with rail transit as its backbone, ground public transport as the main body, public bicycles and ferries as extensions, and
taxis as a customisable supplement. Therefore, building a multi-level, diversified public transport system and encouraging the use of intelligent transportation systems will effectively improve urban traffic conditions.
A city’s air quality affects its residents’ well-being, which is why we maintain our observation of air quality. Looking at the results, top-ranked Xiamen, Fuzhou, Shenzhen and Zhuhai are all economically-developed southern coastal cities, while the bottom-ranking Harbin, Tianjin, Taiyuan, Shenyang, Shijiazhuang, Jinan and Zhengzhou are cities in the central, western and northeastern regions. For these cities, improving air quality by adjusting their urban industrial structures has become a key livelihood topic that demands greater attention.
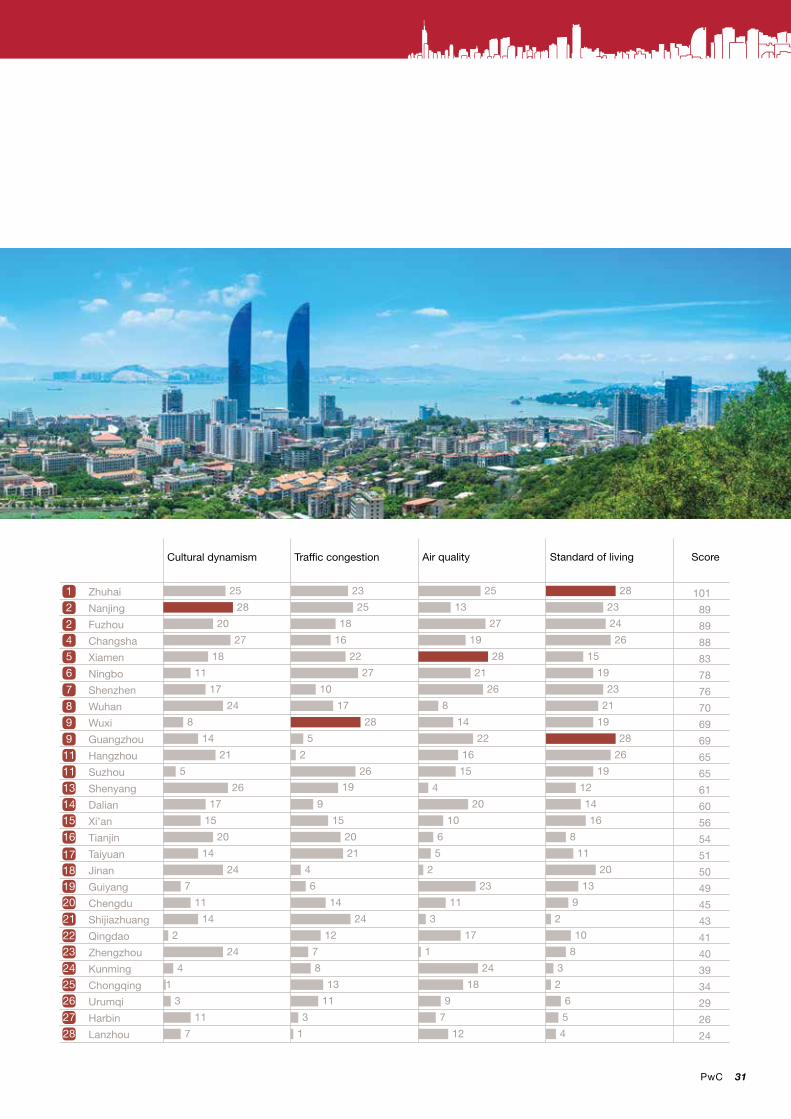
PwC 31
Chinese Cities of Opportunity
2017
Cultural dynamism Traffic congestion
1
2
2
4
5
6
7
8
9
9
11
11
13
14
15
1718
19
20
21
22
23
24
25
26
27
28
16
Zhuhai
Nanjing
Fuzhou
Changsha
Xiamen
Ningbo
Shenzhen
Wuhan
Wuxi
Guangzhou
Hangzhou
Suzhou
Shenyang
Dalian
Xi’an
Tianjin
Taiyuan
Jinan
Guiyang
Chengdu
Shijiazhuang
Qingdao
Zhengzhou
Kunming
Chongqing
Urumqi
Harbin
Lanzhou
101
89
89
88
83
78
76
70
69
69
65
65
61
60
56
54
51
50
49
45
43
41
40
39
34
29
26
24
ScoreAir quality Standard of living
25
28
20
27
18
11
17
24
8
14
21
5
26
17
15
20
14
24
7
11
14
2
24
4
1
3
11
7
23
25
18
16
22
27
10
17
28
5
2
26
19
9
15
20
21
4
6
14
24
12
7
8
13
11
3
1
25
13
27
19
28
21
26
8
14
22
16
15
4
20
10
6
5
2
23
11
3
17
1
24
18
9
7
12
28
23
24
26
15
19
23
21
19
28
26
19
12
14
16
8
11
20
13
9
2
10
8
3
2
6
5
4

32
As China’s national economy grows and its general population’s standard of living improves, their spiritual and cultural needs have also increased. Since the implementation of China’s economic reform over 30 years ago, our energies have been primarily focused on increasing total economic output. In 2011, the 6th Plenary Session of the 17th CPC Central Committee promulgated the Decision of the CPC Central Committee on Major Issues Pertaining to Deepening Reform of the Cultural System and Promoting the Development and Prosperity of Socialist Culture, the first legislation propelling the cultural industry to become one of the pillars of China’s economy. This was the first time that the cultural industry was raised to this status by the national government, thereby ushering in culture and media’s Golden Decade.
We have seen past examples from around the world where countries inevitably go through a period of economic transformation, gear changing and slowdown after experiencing rapid economic growth, shifting from fast, comprehensive growth to moderate and higher quality development. During this transition period, we typically see sagging market demand, flagging real economic performance, declining profitability and rising unemployment. Employees work less overtime during an economic downturn, which means they have more leisure time. Armed with higher incomes resulting from rapid economic growth over the preceding years, they can now afford most cultural consumer products. In the face of declining employment, the government is highly motivated to develop the cultural sector so as to soften the impact of macro-economic adjustments on social stability.
A number of factors have combined to usher in major development opportunities in the cultural and media markets. In recent years, capital markets and businesses have benefited from explosive growth in the cultural and media sectors, be it movies, gaming, TV series, network television series, animation, publishing and Internet advertising. Cinemas are attracting more and more moviegoers, with box office receipts in China totalling RMB 44 billion in 2015. Watching online series has become a popular trend, and young people with their heads bent over playing games on their smartphones is becoming a ubiquitous sight in subways. Some media outlets have even trumpeted that China has entered the era of “mass entertainment”. The sector’s current bout of prosperity is the result of a release of mass demand for cultural products and services after the general population’s material needs have been met.
Interview: The cultural industry has become an important part of the urban services sector
John XuSenior Vice President China Capital Management Co., Ltd Certified Public Accountant

PwC 33
Since 2013, mergers and acquisitions (M&A) and asset restructuring among cultural and media companies have caused quite a stir in the A-share market, as market values of all listed companies with any kind of culture and media sector exposure have risen sharply, creating a clear hierarchy. Tier-1 companies comprise the earliest batch of publicly listed and established cultural enterprises, represented by Wanda Cinemas, Huayi Brothers, Enlight Media, Huace Film & TV, New Culture Media and Hualu Baina, who are striving to develop their brands into upstream and downstream segments of the cultural industry chain through M&As. Tier-2 companies comprise companies who entered the capital markets through backdoor-listings, represented by Zhongnan Red Culture Group, Lead Eastern Investment, Zeus Entertainment, Cultural Investment Holdings, Sanqi Interactive Entertainment Network Technology, Youzu Interactive, Kingnet Network and Ciwen Media, who are also striving to integrate different cultural and media markets segments through M&As and restructuring to maximise returns, by relying on the crossover effect of blockbusters. Tier-3 companies have launched cultural and media operations in addition to their core businesses in hopes of benefiting from the booming cultural and media markets. Jetsen Technology, Hubei TECH Semiconductors, Lugang Culture and Gettop Acoustic are representatives of this group of companies.
The level of development and prosperity of cultural and media industries varies from city to city, and is often a reflection of their different stages of regional economic development and positioning.
As the capital, and traditional political, economic and cultural centre of China, Beijing has a strong cultural heritage. It is home to the national cultural and media regulators – the Publicity Department of the CPC Central Committee, State Administration of Press, Publication, Radio, Film and Television and the Ministry of Industry and Information Technology. This is why most Chinese film and TV drama production companies, including Wanda Cinemas, Huayi Brothers, Enlight Media, Cultural Investment Holdings and Zeus Entertainment, are based in Beijing.
As an important economic centre of China, Shanghai was the first city exposed to western culture with a solid foundation for the development of cultural and media businesses. However, due to its status as the national financial centre, middle-class and white-collar self-centred sentiments are prevalent, where more emphasis is placed on niche cultural consumption. As
a result, there has been a lack of large companies producing creative content in the city, and a proliferation of downstream businesses, such as theatres and cinema chains.
Shenzhen is a city built on innovation, with technology and the Internet being its lifeblood. It is home to Tencent, the “T” of the BAT (Baidu, Alibaba, Tencent) companies, and its local cultural and media industries are generally dominated by dotcom companies, social media and game developers. Technology is genetically rooted in the corporate cultures of almost all companies in Shenzhen, including the leading animation producers, Huaqiang Holdings. The notion of “shaping culture through technology” is clearly at work in all Fantawild parks managed by the company.
Hangzhou is the birthplace of Alibaba, which explains why e-commerce strongly characterises many of the local cultural and creative companies. Livestreaming, visual effects, cross-border e-commerce and artificial intelligence (AI) have all been developed as spinoffs to commerce in Hangzhou. In addition, Hangzhou has a thriving tourism sector, thanks to its renowned West Lake and a unique natural environment. The local market leader, Songcheng Performance Development, has successfully scaled up business operations and replicated its successful business models revolving around live entertainment projects, establishing itself as a prominent listed company valued at nearly RMB 40 billion.
Chengdu has the most dynamic cultural industry in southwest China. Gaming is the largest and most developed of all Chengdu’s cultural and media segments, with the highest concentration of listed companies. This is due to a steady supply of highly qualified college graduates in the city, relatively low labour costs, effective government incentives and the gaming industry’s cluster effect.
These five cities have the most developed cultural industries in China, but it does not necessarily mean that there are no benchmark cultural companies in other Chinese cities. It is mainly a reflection of the fact that systematic and sizable cultural output, mature cultural consumers and a capitalised cultural industry chain have yet to emerge from other cities. We firmly believe that cultural businesses will become a pillar industry in more Chinese cities, as the economy continues to grow and the national cultural industry continues to prosper.

34
Chinese Cities of Opportunity
2017
Number of well-known enterprises
Number of financial professionals
1
2
3
4
5
5
7
8
9
10
10
12
13
14
15
1718
19
19
19
22
22
24
25
26
27
28
16
Shenzhen
Guangzhou
Hangzhou
Wuhan
Nanjing
Tianjin
Changsha
Xi’an
Chengdu
Chongqing
Qingdao
Xiamen
Taiyuan
Jinan
Ningbo
Suzhou
Harbin
Zhuhai
Zhengzhou
Fuzhou
Kunming
Guiyang
Dalian
Urumqi
Shijiazhuang
Lanzhou
Wuxi
Shenyang
Foreign direct investment Nominal growth rate of gross regional product
Total power of agricultural machinery
ScoreProportion of the urban service industry
157
148
136
114
110
110
104
101
100
99
99
96
89
88
85
84
77
72
67
67
67
65
65
64
57
46
42
39
23
27
22
12
21
13
1
24
15
5
14
17
26
20
2
10
18
6
7
8
16
19
11
28
3
25
9
4
25
20
24
19
27
5
23
9
15
26
14
11
18
10
6
8
16
21
17
22
12
28
1
13
7
4
3
2
28
26
27
24
25
17
20
18
23
22
7
20
13
9
21
17
14
5
5
11
12
2
10
17
6
1
3
8
26
24
27
19
10
28
17
23
20
25
15
7
5
22
21
14
18
1
11
8
9
4
16
2
12
3
6
13
27
25
23
20
16
28
16
10
22
20
25
18
9
5
21
26
8
18
11
14
8
4
12
2
4
1
14
6
28
26
13
20
11
19
27
17
5
1
24
23
18
22
14
9
3
21
16
4
10
8
15
2
25
12
7
6
VIII. Economic cloutEconomic clout consists of six variables: number of well-known enterprises, number of financial professionals, foreign direct investment, proportion of the urban service industry, nominal growth rate of gross regional product and total power of agricultural machinery. Shenzhen and Guangzhou have consistently maintained leading economic positions, followed by Hangzhou, Wuhan, and Nanjing and Tianjin (tied) in second to fifth places.
The number of well-known enterprises variable takes into account the number of Fortune 500 companies and the number of listed companies on the Shanghai and Shenzhen A-share markets. Shenzhen has a leading edge in the number of well-known enterprises. Companies headquartered in Shenzhen, like Huawei, Tencent and ZTE, are not only household names in China, but are continually increasing their international influence through their overseas mergers and acquisitions process.
Tianjin is ranked first in both number of financial professionals and foreign direct investment. In particular for number of financial professionals, Tianjin has leaped from fourth place last year to first. This is because Tianjin’s government has been attaching great importance to financial reform and innovation, vigorously supporting the development of private financial institutions, and encouraging the congregation of financial leasing and other new and emerging financial businesses in the city. The Tianjin Pilot Free Trade Zone was established in June 2015 to attract banks, insurance agencies, securities firms, financial leasing companies and many other financial institutions to set up their operations there. The Tianjin Free Trade Zone is now home to more than 100 financial institutions of all levels. With the implementation of the Three-Year Action Plan for Tianjin Financial Reform and Innovation (2016-2018), Tianjin’s financial industry development and economic influence is expected to continue improving.
Urumqi, Guangzhou, Taiyuan, Lanzhou and Xi’an are ranked in the top five by proportion of the urban service industry.
Although these cities are in different regions, they have similar economic structures based predominantly on tertiary and service industries. Guiyang, Nanjing and Chongqing are ranked as the top three cities by nominal growth rate of gross regional product, the result of industrial structural adjustments to stimulate economic vitality.
The total power of agricultural machinery variable is new this year. Chinese cities have a prominent feature that sets them apart from cities in most developed countries, that is, cities have administrative governance over counties, townships and villages. Since each city has a relatively broad rural hinterland, integrated urban and rural development has become a feature of China’s new urbanisation. The National Agricultural Modernisation Plan (2016-
2020) issued by the State Council pointed out that China should vigorously promote agricultural modernisation and accelerate transformation of the agricultural development model through agricultural mechanisation, scientific production technology, agricultural industrialisation and agricultural informatisation. We therefore chose total power of agricultural machinery to reflect this feature. From a long-term perspective, the intensification of agricultural production is also one of the important driving forces promoting and guiding the development of urbanisation. From the results, Shenzhen, Changsha and Guangzhou are ranked as the top three. Their relatively high scores in total power of agricultural machinery per 10,000 hectares of arable land reflect the higher degree of agricultural modernisation in these cities.

PwC 35
Chinese Cities of Opportunity
2017
Number of well-known enterprises
Number of financial professionals
1
2
3
4
5
5
7
8
9
10
10
12
13
14
15
1718
19
19
19
22
22
24
25
26
27
28
16
Shenzhen
Guangzhou
Hangzhou
Wuhan
Nanjing
Tianjin
Changsha
Xi’an
Chengdu
Chongqing
Qingdao
Xiamen
Taiyuan
Jinan
Ningbo
Suzhou
Harbin
Zhuhai
Zhengzhou
Fuzhou
Kunming
Guiyang
Dalian
Urumqi
Shijiazhuang
Lanzhou
Wuxi
Shenyang
Foreign direct investment Nominal growth rate of gross regional product
Total power of agricultural machinery
ScoreProportion of the urban service industry
157
148
136
114
110
110
104
101
100
99
99
96
89
88
85
84
77
72
67
67
67
65
65
64
57
46
42
39
23
27
22
12
21
13
1
24
15
5
14
17
26
20
2
10
18
6
7
8
16
19
11
28
3
25
9
4
25
20
24
19
27
5
23
9
15
26
14
11
18
10
6
8
16
21
17
22
12
28
1
13
7
4
3
2
28
26
27
24
25
17
20
18
23
22
7
20
13
9
21
17
14
5
5
11
12
2
10
17
6
1
3
8
26
24
27
19
10
28
17
23
20
25
15
7
5
22
21
14
18
1
11
8
9
4
16
2
12
3
6
13
27
25
23
20
16
28
16
10
22
20
25
18
9
5
21
26
8
18
11
14
8
4
12
2
4
1
14
6
28
26
13
20
11
19
27
17
5
1
24
23
18
22
14
9
3
21
16
4
10
8
15
2
25
12
7
6

36
Interview: Agricultural echanisation and urbanisation
As an important and integral part of China’s new urbanisation plan, agricultural mechanisation has a direct impact on the movements and size of China’s rural population.
With the liberalisation of agricultural markets in urban and rural areas and the rise of thousands of township and village enterprises since the 1980s, a large proportion of Chinese farmers left the land that their families had tilled for generations and migrated to towns and major cities to work temporarily away from home. Some of them also found jobs in local township and village enterprises, leading to a proliferation of new small towns across the country.
Most who migrated from villages to cities were young able-bodied adults aged between 18 and 30. Their departure from the front lines of agricultural production to cities resulted in severe manpower shortages in agricultural production and aggravated the urban supply burden of grain, oil, meat, eggs, poultry, milk, vegetables and other agricultural products. According to a small tractor safety survey conducted by the Ministry of Agriculture in 2006, 41% of tractor drivers in the nine Chinese provinces and autonomous regions with the highest agricultural machinery usage rates were aged 40 and above. The agricultural labour shortage situation caused by the flow of the rural population into cities can only be effectively resolved by significantly raising existing agricultural mechanisation levels all over the country. This will also act as an indispensable pillar for China’s population urbanisation. Agricultural mechanisation is an inevitable product of the social division of labour supporting the continuous large-scale migration of the farming population to cities and one of the driving forces behind China’s new urbanisation plan.
Agriculture has underpinned China’s national economy and will continue to do so. All of the No.1 Documents of the central government between 1982 and 1986 focused on agriculture, setting out concrete arrangements for rural reforms and agricultural development. The Three Rural Issues remained the main theme of all No.1 Documents issued from 2004 to 2016. In particular, in 2004’s No.1 Document, the central government proposed subsidies for farmers purchasing agricultural machinery, marking an important milestone in agricultural mechanisation in China. In the same year, the central government allocated RMB 70 million of subsidy funds, driving provincial governments to contribute RMB 300 million of matching funds, to subsidise farmers’ agricultural machinery purchases in 66 counties. In addition, the National People’s Congress (NPC) issued the Law of the People’s Republic
Xu ZhijianFormer Director of No. 2 Testing Office, Researcher, China Agricultural Machinery Testing Centre

PwC 37
of China on Promotion of Agricultural Mechanisation in 2004 to legalise agricultural machinery subsidies. From 2004 to 2015, the central government increased total funding for nationwide agricultural machinery subsidies from RMB 30 million to RMB 22.18 billion. A total of over 38.5 million items of agricultural machinery were subsidised with a total government expenditure of over RMB 140 billion. This extensive and intensive subsidy scheme aroused enormous enthusiasm for agricultural machinery purchases among Chinese farmers. From 2004 to 2013, total power consumption in rural areas grew from 640 million kW to 1.117 billion kW, ownership of large and medium tractors surged from 1.116 million to 9.620 million units, and ownership of combine harvesters rose from 406,600 to 1.739 million units.
China has achieved remarkable progress in agricultural mechanisation over the past decade or so. The rates of mechanised wheat sowing and harvesting increased respectively from 80.9% and 76.2% in 2004 to 86.7% and 93.8% in 2013. The rates of mechanised rice planting and harvesting increased respectively from 6.3% and 27.3% in 2004 to 36.1% and 80.9% in 2013, and for corn from 47.8% and 2.47% in 2004 to 84.1% and 51.6% in 2013. Overall, tractor-ploughing, mechanised sowing and mechanised harvesting were adopted respectively in 80.43%, 52.08% and 53.40% of total arable areas in China by 2015.
In the meantime, China’s total grain output grew continuously over these years, from 469 billion kg in 2004 to 621.435 billion kg in 2015. The overall increase of total grain output was over 150 billion kg. The rising grain output triggered rapid growth in meat, poultry, egg and dairy production to meet the demands of the growing urban population.
There has been an increasing number of greenhouses built close to the cities to meet urban residents’ demands for vegetables and fruit. Greenhouses, as a form of facility agriculture, also fall under the category of agricultural machinery. Between 2004 and 2013, the total area of greenhouse farming tripled, from 6.62 billion square meters to 19.95 billion square meters. Furthermore, the lighting, temperature, humidity control, drip irrigation, sprinkler and ventilation systems installed in greenhouses became increasingly automated and intelligent over the years. At the same time, mini-tillers, plant protection machines, low chassis tractors (known as “Greenhouse Kings”), and other machines specially designed for working inside greenhouses emerged to meet demands.
Since 2004, the agricultural machinery sector has been outperforming all other segments of the Chinese machinery industry, with total output soaring from RMB 82.4 billion in 2004 to RMB 357.1 billion in 2013. In recent years, enticed by the favourable prospects of the agricultural machinery market, many automakers, construction equipment and other manufacturers transformed their operations to produce agricultural machinery. For instance, Kattier, a subsidiary of Xuzhou Construction Machinery Group, independently developed and patented a 400-hp large tractor with collinear technology, drastically reducing the technology gap between Chinese large tractor products and their foreign counterparts. Several Chinese producers of large agricultural machinery, such as YTO Group and Foton Lovol International Heavy Industry, acquired foreign farming machinery manufacturers and established R&D bases abroad. Furthermore, all the well-known agricultural machinery multinationals, including John Deere, CNH Industrial, Same Deutz-Fahr, Yanmar and Kubota, have all launched products in the Chinese market, enabling Chinese farmers to use the world’s most advanced farming equipment on their own land.
The 13th Five-year Plan (2016-2020) envisages 60% of the Chinese population becoming permanent urban residents by 2020, meaning that around 200 million people will be relocated from villages to urban areas. The relocation of 200 million people from rural areas to cities is a huge undertaking. At the same time, Chinese cities’ already substantial appetite for agricultural products, such as grains, oil, meat, poultry, eggs, milk and vegetables will grow exponentially. This is why agricultural development cannot afford to slacken in the slightest, and agricultural mechanisation must maintain its momentum and efficiency of development.
It is clear that full-scale agricultural mechanisation will lead to a profound transformation of China’s social-ecological structure, significantly supporting and facilitating implementation of the country’s new urbanisation plan.
Dalian Photo by Eric Li (PwC)

38
Chinese Cities of Opportunity
2017
IX. Cost
Production and living costs are important factors in determining infrastructure investment, and have a long and profound impact on the future development opportunities and sustainable development of a city. China has a vast territory, with a hugely diverse range of natural environments, cultural traditions and lifestyles. After over three decades of reform and opening up resulting in China’s rapid economic development, production and living costs in cities have also undergone substantial changes. The continuous observation of a city’s production and living costs constitutes a special aspect that sets Chinese Cities of Opportunity studies apart from others.
The cost dimension describes a city’s costs across six aspects. Its sorting principle is the reverse of the other nine dimensions, which go from high to low. With cost, the lower the value of the variable, the higher the score will be. We generally carry out a comprehensive analysis from the perspective of labour costs, production and operation costs and the cost of living. Labour costs are depicted by the variable average wage of workers, production and operation costs are depicted by commercial land cost, and the cost of living is depicted by public transport cost, residential price index, food prices and domestic service prices.
The results show that Taiyuan, Kunming, Shijiazhuang, Shenyang, Harbin, and Urumqi and Guiyang (tied) make up the top six. This dimension has the opposite effect of economic influence, as it can be seen that the more economically developed cities have relatively higher production and living costs, while the low-cost cities have the advantages of lower production and living costs, although their degree of economic development is slightly lower and they are attractive investment destinations. Among the top six cities, Taiyuan sits at the core hub of the Belt and Road route, Kunming is located in the hub position
in the Greater Mekong Subregion Development Strategy, Shenyang and Harbin, as provincial capital cities, are the strategic core of Northeast Revitalisation Plan, Urumqi is a core regional city of the Silk Road Economic Belt Core Area, and Guiyang is a key channel city for cooperation with ASEAN economies. We believe that with the continuous advancement of China’s national strategy, these cities will strike the best balance between creating a good living and production environment and controlling costs, and constantly enhance their economic influence.
Average wage of workers Cost of public transport
1
2
3
4
5
6
6
8
9
10
11
11
13
14
15
1718
19
20
21
22
23
24
25
26
27
28
16
Taiyuan
Kunming
Shijiazhuang
Shenyang
Harbin
Urumqi
Guiyang
Dalian
Zhengzhou
Xi’an
Lanzhou
Chongqing
Jinan
Wuhan
Wuxi
Chengdu
Tianjin
Suzhou
Qingdao
Changsha
Xiamen
Ningbo
Fuzhou
Nanjing
Zhuhai
Hangzhou
Guangzhou
Shenzhen
Commercial land cost Food prices Domestic service prices ScoreResidential price index
25
23
27
24
26
14
18
10
28
19
21
22
12
17
8
11
1
7
9
15
16
6
20
3
13
5
2
4
28
22
25
19
19
16
25
6
12
23
16
8
20
19
27
4
9
22
26
8
16
5
10
11
13
2
1
3
23
28
27
26
15
21
24
25
7
9
11
14
4
18
14
20
16
5
6
19
18
22
8
10
4
12
1
2
145
143
139
134
124
120
120
109
102
98
96
96
86
84
83
82
81
80
79
77
76
74
73
55
42
32
13
12
23
19
17
27
22
25
28
14
11
26
20
21
15
12
13
18
9
7
16
24
2
10
8
4
6
3
5
1
25
23
26
25
22
19
11
27
17
11
5
9
28
13
12
18
22
20
14
4
7
16
9
15
3
6
2
1
21
28
17
13
20
25
14
27
27
10
23
22
7
5
9
11
24
19
8
7
17
15
18
12
3
4
2
1

PwC 39
Chinese Cities of Opportunity
2017
Average wage of workers Cost of public transport
1
2
3
4
5
6
6
8
9
10
11
11
13
14
15
1718
19
20
21
22
23
24
25
26
27
28
16
Taiyuan
Kunming
Shijiazhuang
Shenyang
Harbin
Urumqi
Guiyang
Dalian
Zhengzhou
Xi’an
Lanzhou
Chongqing
Jinan
Wuhan
Wuxi
Chengdu
Tianjin
Suzhou
Qingdao
Changsha
Xiamen
Ningbo
Fuzhou
Nanjing
Zhuhai
Hangzhou
Guangzhou
Shenzhen
Commercial land cost Food prices Domestic service prices ScoreResidential price index
25
23
27
24
26
14
18
10
28
19
21
22
12
17
8
11
1
7
9
15
16
6
20
3
13
5
2
4
28
22
25
19
19
16
25
6
12
23
16
8
20
19
27
4
9
22
26
8
16
5
10
11
13
2
1
3
23
28
27
26
15
21
24
25
7
9
11
14
4
18
14
20
16
5
6
19
18
22
8
10
4
12
1
2
145
143
139
134
124
120
120
109
102
98
96
96
86
84
83
82
81
80
79
77
76
74
73
55
42
32
13
12
23
19
17
27
22
25
28
14
11
26
20
21
15
12
13
18
9
7
16
24
2
10
8
4
6
3
5
1
25
23
26
25
22
19
11
27
17
11
5
9
28
13
12
18
22
20
14
4
7
16
9
15
3
6
2
1
21
28
17
13
20
25
14
27
27
10
23
22
7
5
9
11
24
19
8
7
17
15
18
12
3
4
2
1

40
Chinese Cities of Opportunity
2017
X. Ease of doing business
A city’s ease of doing business is the soft power for attracting investment from domestic and foreign enterprises to support the development of local enterprises. The ease of doing business dimension in the Chinese Cities of Opportunity reports resembles aspects of a liveable city, but our observation is from the investors’ perspective. It is also a dimension with many variables, including ease of starting a business, personnel management risk, logistics efficiency, capital market competitiveness, business operation risks, fiscal balance and reliance on foreign trade. It reflects a city’s governance and market economy environment. After assessing these
variables for the 28 cities, Shenzhen, Guangzhou and Suzhou (tied), and Nanjing take the top three spots.
Shenzhen tops the ranking for ease of starting a business. Shenzhen has always been a strong supporter of entrepreneurial innovation. The Ten Actions Plans it has implemented have laid the groundwork for a new round of innovation, covering innovative hardware, infrastructure, spatial vectors and industrial layout, which is a systematic layout from the sources of innovation to upstream and downstream industry chains and supporting services. Moreover, owing to its excellent financial sector performance, financial
Capital market competitiveness
Fiscal balance Reliance on foreign trade ScoreBusiness operation risks
144
143
143
142
136
131
130
121
115
110
109
104
103
101
100
98
97
96
93
92
90
88
88
78
75
71
65
63
1
2
2
4
5
6
7
8
9
10
11
12
13
14
15
1718
19
20
21
22
22
24
25
26
27
28
16
Shenzhen
Guangzhou
Suzhou
Nanjing
Zhengzhou
Hangzhou
Xiamen
Wuxi
Xi’an
Ningbo
Zhuhai
Chengdu
Wuhan
Dalian
Tianjin
Urumqi
Chongqing
Jinan
Changsha
Qingdao
Fuzhou
Kunming
Taiyuan
Guiyang
Shijiazhuang
Lanzhou
Harbin
Shenyang
Ease of starting a business Personnel management risk Logistics efficiency
6
6
14
14
24
10
21
14
25
10
6
11
15
8
2
18
1
17
19
17
21
26
27
3
22
28
23
8
28
25
24
23
19
26
19
19
19
22
4
27
4
19
12
12
21
12
21
12
12
12
19
4
12
4
19
12
19
28
13
24
12
23
26
14
20
25
27
6
21
17
9
12
6
22
19
7
12
9
16
15
3
3
1
4
28
27
21
22
18
24
14
6
20
10
15
26
16
19
25
5
23
13
7
11
17
8
3
2
4
1
9
12
24
24
20
20
21
4
2
20
10
4
24
9
17
14
16
27
28
7
12
7
2
8
5
16
25
26
11
14
11
13
26
24
20
27
21
25
8
15
7
14
22
5
18
19
4
23
12
17
10
16
6
28
3
2
1
9
28
20
25
15
22
17
27
23
13
24
26
11
8
19
18
5
14
2
3
21
16
9
12
10
6
7
1
4
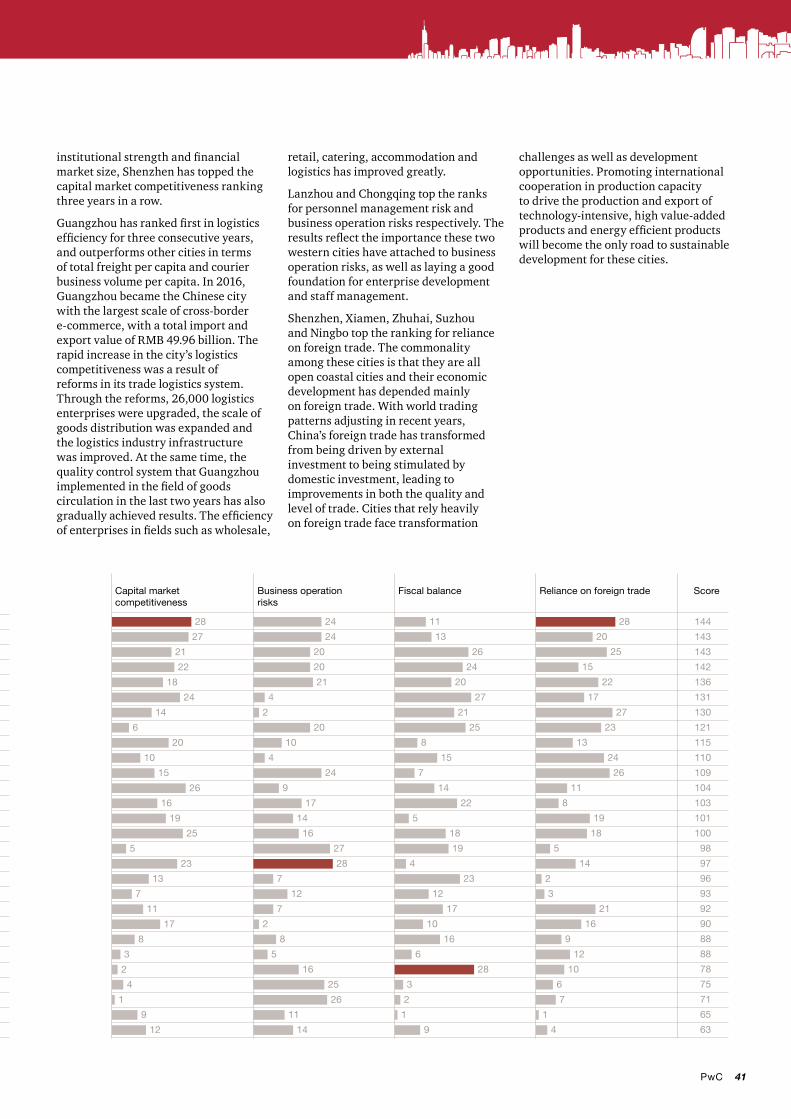
PwC 41
Chinese Cities of Opportunity
2017
institutional strength and financial market size, Shenzhen has topped the capital market competitiveness ranking three years in a row.
Guangzhou has ranked first in logistics efficiency for three consecutive years, and outperforms other cities in terms of total freight per capita and courier business volume per capita. In 2016, Guangzhou became the Chinese city with the largest scale of cross-border e-commerce, with a total import and export value of RMB 49.96 billion. The rapid increase in the city’s logistics competitiveness was a result of reforms in its trade logistics system. Through the reforms, 26,000 logistics enterprises were upgraded, the scale of goods distribution was expanded and the logistics industry infrastructure was improved. At the same time, the quality control system that Guangzhou implemented in the field of goods circulation in the last two years has also gradually achieved results. The efficiency of enterprises in fields such as wholesale,
retail, catering, accommodation and logistics has improved greatly.
Lanzhou and Chongqing top the ranks for personnel management risk and business operation risks respectively. The results reflect the importance these two western cities have attached to business operation risks, as well as laying a good foundation for enterprise development and staff management.
Shenzhen, Xiamen, Zhuhai, Suzhou and Ningbo top the ranking for reliance on foreign trade. The commonality among these cities is that they are all open coastal cities and their economic development has depended mainly on foreign trade. With world trading patterns adjusting in recent years, China’s foreign trade has transformed from being driven by external investment to being stimulated by domestic investment, leading to improvements in both the quality and level of trade. Cities that rely heavily on foreign trade face transformation
Capital market competitiveness
Fiscal balance Reliance on foreign trade ScoreBusiness operation risks
144
143
143
142
136
131
130
121
115
110
109
104
103
101
100
98
97
96
93
92
90
88
88
78
75
71
65
63
1
2
2
4
5
6
7
8
9
10
11
12
13
14
15
1718
19
20
21
22
22
24
25
26
27
28
16
Shenzhen
Guangzhou
Suzhou
Nanjing
Zhengzhou
Hangzhou
Xiamen
Wuxi
Xi’an
Ningbo
Zhuhai
Chengdu
Wuhan
Dalian
Tianjin
Urumqi
Chongqing
Jinan
Changsha
Qingdao
Fuzhou
Kunming
Taiyuan
Guiyang
Shijiazhuang
Lanzhou
Harbin
Shenyang
Ease of starting a business Personnel management risk Logistics efficiency
6
6
14
14
24
10
21
14
25
10
6
11
15
8
2
18
1
17
19
17
21
26
27
3
22
28
23
8
28
25
24
23
19
26
19
19
19
22
4
27
4
19
12
12
21
12
21
12
12
12
19
4
12
4
19
12
19
28
13
24
12
23
26
14
20
25
27
6
21
17
9
12
6
22
19
7
12
9
16
15
3
3
1
4
28
27
21
22
18
24
14
6
20
10
15
26
16
19
25
5
23
13
7
11
17
8
3
2
4
1
9
12
24
24
20
20
21
4
2
20
10
4
24
9
17
14
16
27
28
7
12
7
2
8
5
16
25
26
11
14
11
13
26
24
20
27
21
25
8
15
7
14
22
5
18
19
4
23
12
17
10
16
6
28
3
2
1
9
28
20
25
15
22
17
27
23
13
24
26
11
8
19
18
5
14
2
3
21
16
9
12
10
6
7
1
4
challenges as well as development opportunities. Promoting international cooperation in production capacity to drive the production and export of technology-intensive, high value-added products and energy efficient products will become the only road to sustainable development for these cities.

42
Variables
I. Intellectual capital and innovationFull-time teachers’ turnover rateEach city’s investment in educational resources is measured by the ratio of the number of primary and secondary schools teachers in 2015 to that in 2010. The data are from the statistical yearbooks of the respective cities and the China City Statistical Yearbook 2011.
Scale of secondary vocational educationSkilled workers are a vital force for urban development. Calculated as the proportion of secondary vocational students in the total number of students pursuing secondary education, this variable reflects the scale of each city’s secondary vocational education and the supply of skilled workers in the future. The data are from the statistical yearbooks of the respective cities.
Proportion of expenditure on science and technologyThis variable uses the proportion of public expenditure going towards science and technology to measure each city’s investment in scientific and technological resources. The data are from the statistical yearbooks of the respective cities.
Research and development levelThis variable mainly examines a city’s innovative technology reserves and scientific research potential. The references used were lists of National Key Laboratories (including company laboratories) issued by the Ministry of Education, the Statistical Yearbook on Science and Technology 2016 and the ranking of total scores on the scientific research level of key universities among the 2016 Ranking of 734 Chinese Universities by Wu Shulian.
Index of comprehensive scientific and technological progressThe index of comprehensive scientific and technological progress disclosed in the Compilation of China Statistical Data on Science and Technology is applied to compare the pace of the cities’ scientific and technological development.
Entrepreneurial environmentEach city’s entrepreneurial environment is assessed in light of the China Entrepreneurship and Innovation Index released by the Administrative Committees of the Zhongguancun Science Park, Beijing.
Innovation applicationThis variable examines the socioeconomic benefits derived from innovation as a basic driving force behind urban development, and the contribution of innovative industries to the cities’ economic growth. Given that the Growth Enterprise Market (GEM) serves as an important funding platform for supporting independent innovation and fostering the growth of small/medium-scale hi-tech enterprises, this report assesses the local level of innovation applications by measuring the number and revenues of GEM-listed companies in the respective cities. The data are from Wind database.

PwC 43
II. Technology readinessInternet PlusThe Internet Plus composite index presented in the China Internet Plus Index report by Tencent Research Institute is adopted to evaluate the application of Internet and its access in cities.
Digital economyEach city’s digital economy development level is ranked using the e-commerce development ranking in China Urban E-commerce Development Index Report 2015. It reflects the status of a city’s digital economy, and by extension, its progress towards industry restructuring.
Software development and multimedia designThis variable uses software sector revenues of the cities to evaluate the development of the software services market and the effectiveness of industrial structural upgrades. Data are from the Verified Final Statistics of the Software Industry in Central Cities in 2015 released by the Ministry of Industry and Information Technology. For those cities who has yet to disclose software sector revenues, data for their respective provincial-level administrative areas are used to calculate the scores.
Technology market sizeThis indicator uses technology output turnover and technology input turnover to evaluate the cities’ hi-tech research commercialisation and hi-tech sector incubation capabilities. The data are from the Annual Report on National Technology Markets Statistics 2016 issued by the Ministry of Science and Technology. For cities who have yet to disclose the required data, data for their respective provincial-level administrative areas are used to calculate the scores.
III. Important regional citiesStar graded hotelsThe number and average occupancy rate of hotels rated three stars or above are used to gauge supply and demand and market saturation levels of star graded hotels in the cities. The data are from the appendix of the 2015 statistical bulletin on star graded hotels in China provided by the National Tourism Administration.
International touristsThe appeal of cities to international travellers is measured by entry and overnight visits by overseas tourists and average stay per arrival. The data for this indicator are from the Yearbook of China Tourism 2016.

44
Inbound and outbound flightsThis variable aims to reflect the cities’ air passenger and cargo transport demand. The ranking is based on the number of inbound and outbound flights to and from the cities’ main airports, including international and domestic civil flights, cargo flights and non-revenue flights (excluding military aircraft). As there is no airport in Suzhou, we referred to the nearby city, Ningbo, for its ranking in this field. The data are from the Rankings of Handling Capacity of Civil Aviation Airports 2015 provided by the Civil Aviation Administration of China.
Total passenger flowsTotal passenger traffic includes rail, civil aviation, road and waterway passenger traffic. It reflects the size of the local passenger transportation market and passenger transportation capacity of a city. The data are from the statistical yearbooks of the respective cities.
Freight transport volumeAs an indicator of transportation and production results, freight transport volume refers to the amount of goods transported by rail, road and air, and reflects the pivotal role of a city’s logistics sector in the regional economy. The data are from the statistical yearbooks of the respective cities.
Exhibition/convention economic developmentBased on the composite exhibition/convention industry development index disclosed of the cities in the China Convention and Exhibition Industry Development Report 2016, this variable gives a comprehensive evaluation of the state of the exhibition/convention industry in various cities by taking into account the number of professional exhibition venues in a city, their interior floor area, number of exhibitions hosted annually and the exhibition floor area.
IV. Healthcare, safety and public securityHealthcare resourcesThe healthcare resources variable measures medical services supply capacity of the cities based on the number of (assistant) medical practitioners available for every 10,000 people. The data are from the National Bureau of Statistics.
Medical facilitiesThis variable assesses the service level and facility resources of the healthcare system in the cities based on the number of third-level A-grade hospitals. The data are from the National Health and Family Planning Commission’s website.
Elderly care servicesThe development of elderly care service systems in the cities is assessed by the coverage rate of basic urban pension insurance. The data are from the statistical yearbooks of the respective cities.
Urban traffic safety indexThis index uses road traffic mortality to reflect a city’s traffic safety. The data are from the Second Research Report on Road Traffic Development in China’s Major Cities.
Disaster lossBy calculating the ratio of property insurance compensation expense to the associated premium revenue, this variable measures the economic losses caused by disasters. The data are from the Statistical Yearbook of China Insurance 2016.

PwC 45
V. Transportation and urban planningRoad area per capitaThe data to evaluate road facilities in the cities are taken from the China Urban Construction Statistical Yearbook.
Public transit systemThis variable uses the number of buses available for every 10,000 people and the turnover rate of public transit passengers to gauge the passenger transport capacity and operational efficiency of the cities’ public transit networks. The data are from the statistical yearbooks of the respective cities.
Rail transit coverageThe current state of rail transit in the cities is measured by rail transport mileage for every 10,000 people, thereby revealing their thinking and forward-looking perspectives in urban planning. The data are from the 2015 Annual Statistical and Analysis Report on Urban Rail Transit issued by the China Association of Metros.
Urban expansion rateThe urban expansion rate is measured as the ratio of the requisitioned land area to the built-up area. The data are from the China Urban Construction Statistical Yearbook 2015.
State of urban floating populationThe ratio of resident population in 2015 to that in 2010 is used to illustrate changes in the sources of the labour force and the speed of population migration. The data are from the statistical yearbooks of the respective cities and the 2010 Population Census.
Green areaGreen area per capita and green coverage rate of built-up areas are chosen as indicators of a city’s green area. The data are from the China Urban Construction Statistical Yearbook.
Housing availability for residentsThis variable assesses the cities’ capital investment in improving their residents’ housing conditions and related market regulation efforts by examining per capita investment in residential property development. The data are from the statistical yearbooks of the respective cities.
VI. Sustainability and the natural environmentRate of change in household water consumption per capitaThis variable compares daily domestic water use per capita in the current year with that of the previous year to reveal residents’ water conservation awareness and show how much progress has been made in raising the awareness of sustainable development. The data are from the China Urban Construction Statistical Yearbook.
Centralised sewage treatment rate and decontamination rate of household wasteThis variable gives a comprehensive evaluation of the efficiency of resource utilisation in various cities in terms of sewage treatment and decontamination of household waste, which in turn reflects the various states of development of the cities’ recycling economies. The data are from the China Urban Construction Statistical Yearbook.

46
Labour supplyBy comparing the current year’s employee population in a city to that of the previous year, this variable assesses the changes in working-age population in the cities. The data are from the statistical yearbooks of the respective cities.
Rate of change of floating populationThis variable employs the ratio of resident population to registered population to reflect migrant labour supply conditions in the cities. The data are from the statistical yearbooks of the respective cities and the National Bureau of Statistics.
Carbon emissionsThis variable measures carbon emissions per unit of GDP based on the utilisation of raw coal, crude oil and natural gas, thereby reflecting the level of greenhouse effect in the cities. The data are from the statistical yearbooks of the respective cities.
VII. Culture and lifestyleCultural dynamismThis variable evaluates the size of the cultural industry in a city in terms of its fiscal expenditure on culture, sports and media industries and the proportion of people employed in culture, sports and entertainment industries. The data are from the statistical yearbooks and bulletins of the respective cities.
Traffic congestionThis variable is evaluated in accordance with the all-day congestion and delay index drawn from the 2015 Chinese Traffic Congestion Survey Data issued by AutoNavi. 2016 report data are used for cities that are not listed in the 2015 report.
Air qualityThe overall picture of a city’s air quality is represented by the annual average comprehensive air quality index. This variable provides a comprehensive assessment of pollution caused by six pollutants, namely PM2.5, PM10, SO2, NO2, O3 and CO. Higher index values correspond to heavier pollution. The data are from monthly reports on air quality in 74 cities issued by the China National Environmental Monitoring Centre (CNEMC).
Standard of livingThis variable is examined from two perspectives. The first is residents’ spending power, measured by retail sales of consumer goods per capita, and the second is domestic electricity consumption of rural and urban residents per capita, included to reflect residents’ demand for daily convenience and comfort. The data are from the National Bureau of Statistics and the statistical yearbooks and bulletins of the respective cities.

PwC 47
VIII. Economic cloutNumber of well-known enterprisesThis variable reflects each city’s position in the regional economic structure and its economic influence over the surrounding areas through the number of top-500 Chinese enterprise headquarters registered there and the number of companies there listed on the Shanghai and Shenzhen A-share stock markets. The data are from the “China Top 500” released by Fortune’s Chinese website and Wind database.
Number of financial professionalsThis variable uses the number of financial professionals working in the cities to reflect the scale of development in the financial industry. The data are from the statistical yearbooks and bulletins of the respective cities.
Foreign direct investmentThis variable reflects the development of the externally oriented economy of cities by examining the number of newly signed foreign investment agreements or projects and the yearly amount of foreign investment actually received. The data are from the statistical yearbooks and bulletins of the respective cities.
Proportion of the urban service industryThis variable uses the proportion of tertiary industry added value in regional GDP to highlight changes in the cities’ economic structures and the transition from light and heavy industry-oriented to service-oriented economies. The data are from the National Bureau of Statistics.
Nominal growth rate of gross regional productNominal of gross regional GDP is the result of comparing the ending GDP calculated at current prices and that in the base period. It is a dynamic indicator of the level of activity within a particular economy. The data are from the National Bureau of Statistics.
Total power of agricultural machineryAgricultural mechanisation is the physical foundation for the development of modern agriculture and an important component of sustainable development for the new socialist countryside with a significant economic impact. This variable measures the level of agricultural mechanisation in each city as the total power of agricultural machinery per 10,000 hectares of arable land. The data are from the statistical yearbooks and bulletins of the respective cities.

48
IX. CostAverage wage of workersThis variable uses the average wage of workers to compare the salary costs of the cities’ enterprises. The data are from the National Bureau of Statistics.
Cost of public transportThis variable measures the cost of urban travel by examining the cost of buses and taxis. The data are from the China Price Information Network.
Commercial land costCommercial land costs in the cities are compared by examining their office lease prices and commercial property rentals. Because Suzhou, Wuxi and Zhuhai did not disclose their data, their residential price indices were used instead. The data are from the China Price Information Network.
Residential price indexThis variable measures residential costs in each city through the average price of sampled newly built dwellings disclosed by the China Real Estate Index System.
Food pricesThe variable measures each city’s food prices mainly through the prices of rice, soybean oil, pork, eggs, apples, Chinese cabbage, mustard greens and other food items. The data are from the China Price Information Network.
Domestic service pricesThis variable focuses on measuring the cost of four daily domestic services: residential property service, residential electricity, natural gas and monthly cable (digital) TV charges. The data are from the China Price Information Network.
X. Ease of doing businessEase of starting a businessThis variable measures each city’s entrepreneurial environment through the growth of non-state-owned enterprises, i.e. the number of non-state-owned listed companies. The data are from Wind database.
Personnel management riskThis variable adopts the number of accepted labour dispute cases per 10,000 employees as the measurement criterion. The data are from the China Labour Statistical Yearbook. Since the data disclosed in the yearbook are limited to provincial-level administrative areas (including autonomous regions and municipalities), the cities are assessed according to the provincial-level data provided.

PwC 49
Logistics efficiencyAs an indicator of the development status of logistics services in the cities, this variable examines logistics efficiency in commodity circulation based on total freight per capita, courier business volume per capita and courier service income per capita. The efficiency of logistics services reflects a city’s basic conditions and overall operational standards in terms of transportation, information and communication, and warehouse facilities. The data are from the statistical yearbooks of the respective cities and the State Post Bureau.
Capital market competitivenessThe cities’ financial competitiveness is assessed based on the performance of the local financial services industry, the strength of financial institutions and financial market size. Data are from China’s Financial Centre Index (CDI CFCI) report.
Business operation risksThe non-performing loan ratios of commercial banks are used as an index to measure the potential risks associated with business operation in each city. The data are from the China Banking Regulatory Commission 2015 Annual Report. Since information disclosed in the report is limited to provincial-level administrative areas (including autonomous regions and municipalities), cities at a lower level are assessed based on data released for their provincial administrative areas.
Fiscal balanceThe degree of fiscal balance is measured through the ratio of general budgetary revenue to general budgetary expenditure. The data are from the National Bureau of Statistics.
Reliance on foreign tradeA city’s reliance on foreign trade is indicated as the ratio of import and export volume to GDP. It reflects the impact of foreign trade activities on local economic growth. The data are from the National Bureau of Statistics.

50
#3 overall for city gateway & economic cloutAmong these 10 indicators, Beijing comes in third in city gateway and economic clout. Overall, the Chinese capital maintains its 19th position in Cities of Opportunity 7,making significant improvements in intellectual capital and innovation (up four places) and technology readiness (up five places). However,there has been no improvement for the city in the cost indicator, in which it remains at #30.
#1 in hotel rooms & #2 in airport to CBD accessDespite falling one place since our last report, Beijing still remains in the top five as a city gateway (#3) just behind London (#1) and Paris (#2), but ahead of both its Chinese sister cities, Hong Kong (#5) and Shanghai (#7). The city rises from second place in 2014 to become the top-ranked city this year in hotel rooms. It also ranks #2 in airport to CBD access; #7 in international association meetings, incoming/outgoing passenger flows, and World Top 100 airports; and 10th in airport connectivity.
Beijing
AppendixExtract from Cities of Opportunity 7:
Overall#17 Dubai
#18 Milan
#19 Beijing
#20 Kuala Lumpur
#21 Shanghai
#1 London
#2 Paris
#3 Beijing
#4 Dubai
#5 Hong Kong
City gateway
The Appendix is extracted from Cities of Opportunity 7 launched by PwC global network in September 2016. Since its launch in 2007, PwC has published seven editions of the Cities of Opportunity report. Cities of Opportunity 7 provides balanced benchmarking of the social and economic health of 30 of the world’s leading cities, including Beijing, Shanghai and Hong Kong, by measuring the cities’ performances against 10 indicators and 67 variables. The aim is to provide reference points for policy formulation and development roadmap for major world cities.
In the overall rankings this year, London again takes the top position, having continued to build across its balanced array of strengths. Singapore follows in second place, benefiting from the momentum of planned development. Toronto ranks third, with quality of living at its core. Paris, Amsterdam, New York, Stockholm and San Francisco take fourth to eighth places respectively. Chinese cities are included in the rankings, namely Beijing, Shanghai and Hong Kong. The highlights of Beijing and Shanghai are set out as follows.

PwC 51
Still an economic powerhouse at #3 in economic cloutAlong with city gateway, Beijing finishes third overall in economic clout. Although stumbling one spot since 2014, it remains among the three global leaders in this indicator, highlighting its economic prowess. Further proof of its dominance is its top five rankings in four of the six variables here, with a #1 finish in two of them. Specifically, it ranks first in number of Global 500 headquarters and rate of real GDP growth, and fifth in financial and business services employment as well as in attracting FDI. The two variables in which Beijing doesn’t score in the top half are employment growth rate (#16) and productivity (#23), so addressing these two variables can lead to further improvement in this indicator for the city.
#5 in higher education & #6 in math/science skillsAlthough it does not break into the top half in intellectual capital and innovation, Beijing is at the very top of the lower half of the rankings (#16), ahead of every other emerging city, except Seoul, and above the two European cities of Madrid and Milan. Beijing’s performance in this indicator is primarily due to its very strong finish in percent of population with higher education (#5) and math/science skills attainment (#6).
The challenges ahead: cost; health, safety, and security; sustainability and the natural environment; ease of doing businessBeijing remains the lowest ranking city in terms of costs. While its cost of living is relatively low (#7 overall), performance in several variables—cost of business occupancy (#28), corporate total tax rate, purchasing power and affordability of rent (#27), and personal tax (#19)—leaves room for improvement. Given these results in the cost indicator, it is understandable that Beijing might find it difficult to do better in ease of doing business (ranking #24)— although it does relatively well for an emerging city in tax efficiency, tying Shanghai for the lead in the lower half of the rankings (#15).
Striving for urban sustainabilityTwo further areas of improvement for Beijing are health, safety, and security (#22) and sustainability and the natural environment (#23, tied with Shanghai). Although its health system performance finishes in the top 10 (#9, tied with Shanghai and Hong Kong), Beijing ranks poorly in end of life care (#28, country level). As the city’s struggles with air pollution are well known, it is unsurprising that it ties Mumbai in this variable for #29. But it also finishes with a low score (#29) in water-related business risk (contending with Mumbai again just below it). Improving its performance in health and sustainability would obviously also enhance Beijing’s overall ranking in this report.
Economic clout#1 London
#2 New York
#3 Beijing
#4 San Francisco
#5 Madrid
Percent of population with higher education
#3 Moscow
#4 London
#5 Beijing
#6 Stockholm
#7 Toronto
Math/science skills attainment
#4 Seoul
#5 Tokyo
#6 Beijing
#7 Amsterdam
#8 Toronto
Cost#26 London
#27 Moscow
#27 Paris
#29 Shanghai
#30 Beijing
Air pollution#26 Mexico City
#27 Shanghai
#28 Lagos
#29 Beijing
#29 Mumbai
Water-related business risk#26 Singapore
#27 Los Angeles
#28 Jakarta
#29 Beijing
#30 Mumbai
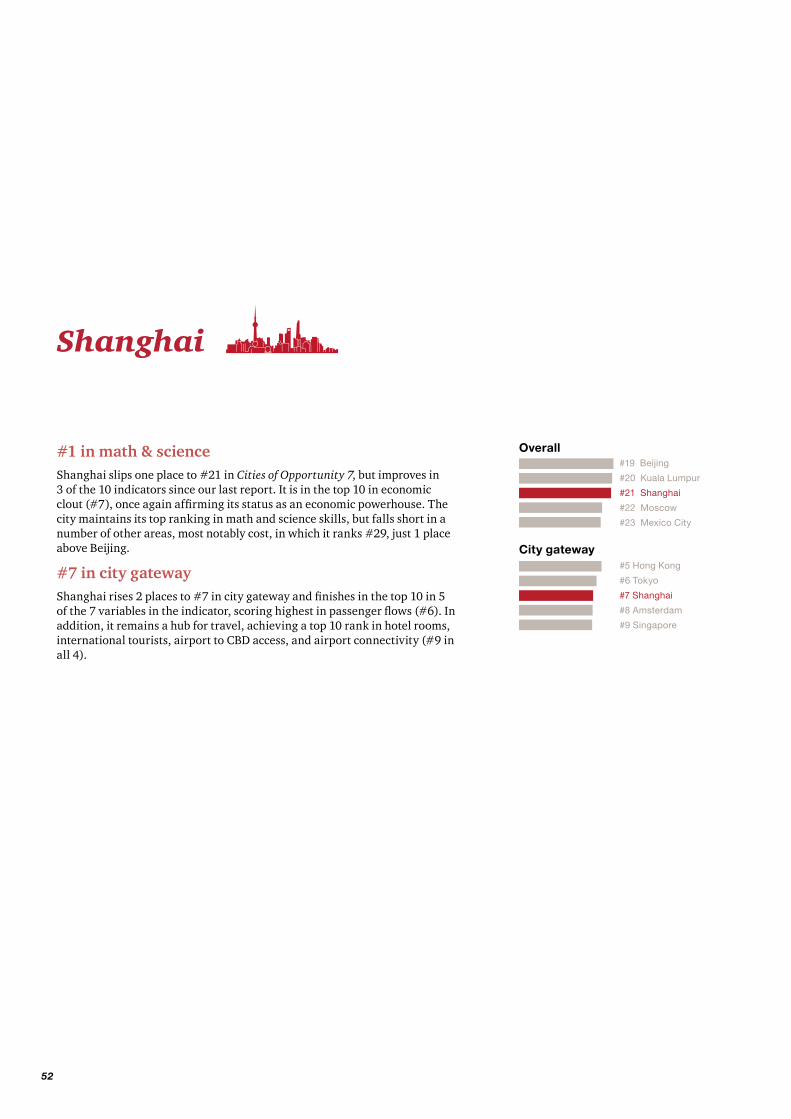
52
#1 in math & scienceShanghai slips one place to #21 in Cities of Opportunity 7, but improves in 3 of the 10 indicators since our last report. It is in the top 10 in economic clout (#7), once again affirming its status as an economic powerhouse. The city maintains its top ranking in math and science skills, but falls short in a number of other areas, most notably cost, in which it ranks #29, just 1 place above Beijing.
#7 in city gatewayShanghai rises 2 places to #7 in city gateway and finishes in the top 10 in 5 of the 7 variables in the indicator, scoring highest in passenger flows (#6). In addition, it remains a hub for travel, achieving a top 10 rank in hotel rooms, international tourists, airport to CBD access, and airport connectivity (#9 in all 4).
Shanghai
Overall
City gateway
#19 Beijing
#20 Kuala Lumpur
#21 Shanghai
#22 Moscow
#23 Mexico City
#5 Hong Kong
#6 Tokyo
#7 Shanghai
#8 Amsterdam
#9 Singapore

PwC 53
Shanghai still an economic heavyweight at #7Shanghai remains a robust competitor in economic clout, sliding only 2 places since our last report to #7. It scores 2 top 3 spots in FDI (#2) and GDP growth (#3), and ranks in the top 10 in Global 500 headquarters (#7), confirming its status as an economic heavyweight.
Rising tech readinessAlthough still just below the first half of the rankings, the indicator in which Shanghai sees the greatest rise is technology readiness, rising 5 places since 2014 to 17th. It finishes in the top 10 in both software development and multi-media design (#6) and mobile broadband speed (#7), but improvement in areas such as ICT usage (#26) and digital security (#22) will lead to further advancement in this indicator overall.
Doing business is not always easyShanghai’s 2nd lowest ranking comes in ease of doing business, dropping 2 places since 2014 to #27, below both of its Chinese sister cities, Beijing and Hong Kong. Among generally low scores, the lowest are in ease of starting a business (#24), ease of entry (#28, tied with Beijing and Mumbai), and shareholder protection (#29, tied with Beijing).
A costly cityThe indicator in which Shanghai loses out most is cost, in which it ranks 29th, just above Beijing. Although it manages a top 10 ranking in cost of living (#8), Shanghai could improve in a number of other variables such as corporate total tax rate (#26), and cost of business occupancy, affordability of rent, and purchasing power (#25 in all 3).
Economic clout#5 Madrid
#6 Sydney
#7 Shanghai
#8 Paris
#9 Singapore
#25 São Paulo
#26 Rio de Janeiro
#27 Shanghai
#28 Mumbai
#29 Jakarta
Technology readiness
Ease of doing business
Cost
#15 Beijing
#16 Moscow
#17 Shanghai
#18 Dubai
#19 Madrid
#26 London
#27 Moscow
#28 Paris
#29 Shanghai
#30 Beijing

54
Acknowledgements
PwC China Senior Advisor Xiaofeng Cai provided guidance on this report. The following individuals and groups in PwC and China Development Research Foundation contributed to the production of this report.
Advisory group
Jin FangDeputy Secretary-General China Development Research Foundation
Jiantuo Yu Director of Research Department I China Development Research Foundation
Frank LynPwC Mainland China and Hong Kong Markets Leader
David WuPwC China Government and Regulatory Affairs Leader PwC China Beijing Senior Partner
Elton HuangPwC China Shanghai Senior Partner
Jun Jin PwC China Strategy Consulting Partner
Jim ChenPwC China Assurance Partner
Research teamVeronica Ni (PwC)Carrie Zhang (PwC)Kelly Lu (PwC)Lan Lan (PwC) Grace Lee (PwC)Mary Ma (PwC)Chunchun Chen (China Development Research Foundation)
Project managementCynara Tan (PwC)Echo Chen (PwC)Faye Ji (PwC)Jenny Yu (PwC)Xue Wang (China Development Research Foundation)Ye Wang (China Development Research Foundation)
DesignShawn Zhang (PwC)Hee He (PwC)
Cover: Sunrise in Guangzhou (photo by Hantian Chen )
Project ConsultationJenny GuanLecturer, Institute for Tourism Studies, Macau
Data supportDella You, etc.

PwC 55
Urban Development Research Team
Jun Jin PwC China Strategy Consulting Partner +86 010 6533 2977 [email protected]
Carrie ZhangPwC China Strategy Consulting Senior Manager +86 010 6533 7569 [email protected]
In recent years, PwC has been closely monitoring development opportunities and urbanisation progress in Chinese cities and has developed a scientific and systematic methodology for assessing urban and regional development through multi-level theoretical exploration and the accumulation of practical overseas and domestic experience. We hope this assessment system will provide cities with a clear picture of their respective development characteristics and core competitiveness so they can form reasonable strategic positioning and direction for development, as well as a basis for scientific research.
Please contact us if you wish to understand the assessment system and research methodology or the benchmarking of specific cities.
For further information
For further information on cooperation with China Development Research Foundation, please contact:
Cynara TanHead of Marketing and CommunicationsAsia Pacific +852 2289 8715 [email protected]
Echo ChenDirector, Marketing and CommunicationsBeijing +86 10 6533 8700 [email protected]
For enquiries about the research methodology, please contact:
Lan LanManager, Marketing and CommunicationsBeijing +86 10 6533 8759 [email protected]
For media enquiries, please contact:
Jenny YuDeputy Manager, Marketing and CommunicationsBeijing +86 10 6533 8723 [email protected]

www.pwccn.com© 2017 PwC. All rights reserved. PwC refers to the PwC network and/or one or more of its member firms, each of which is a separate legal entity.
Please see www.pwc.com/structure for further details. This content is for general information purposes only, and should not be used as a substitute for consultation with professional advisors.
Related Documents


