FOR RELEASE APRIL 28, 2022 China’s Partnership With Russia Seen as Serious Problem for the U.S. Americans see China as a growing superpower – and increasingly say it is the world’s leading economy BY Christine Huang, Laura Silver and Laura Clancy FOR MEDIA OR OTHER INQUIRIES: Laura Silver, Senior Researcher Hannah Klein, Communications Manager Gar Meng Leong, Communications Associate 202.419.4372 www.pewresearch.org RECOMMENDED CITATION Pew Research Center, April, 2022, “China’s Partnership With Russia Seen as Serious Problem for the U.S.” EMBARGOED: NOT FOR RELEASE OR PUBLICATION UNTIL APRIL 28, THURSDAY: 10:00 AM WASHINGTON, D.C.; 16:00 BERLIN; 23:00 TOKYO EMBARGOED: NOT FOR RELEASE OR PUBLICATION UNTIL APRIL 28, THURSDAY: 10:00 AM WASHINGTON, D.C.

Welcome message from author
This document is posted to help you gain knowledge. Please leave a comment to let me know what you think about it! Share it to your friends and learn new things together.
Transcript
FOR RELEASE APRIL 28, 2022
China’s Partnership With Russia Seen as Serious Problem for the U.S. Americans see China as a growing superpower – and increasingly say it is the world’s leading economy
BY Christine Huang, Laura Silver and Laura Clancy
FOR MEDIA OR OTHER INQUIRIES:
Laura Silver, Senior Researcher Hannah Klein, Communications Manager Gar Meng Leong, Communications Associate
202.419.4372
www.pewresearch.org
RECOMMENDED CITATION Pew Research Center, April, 2022, “China’s Partnership With Russia Seen as Serious Problem for the U.S.”
EMBARGOED: NOT FOR RELEASE OR PUBLICATION UNTIL
APRIL 28, THURSDAY: 10:00 AM WASHINGTON, D.C.; 16:00 BERLIN;
23:00 TOKYO
EMBARGOED: NOT FOR RELEASE OR PUBLICATION UNTIL APRIL 28, THURSDAY: 10:00 AM WASHINGTON, D.C.
1 PEW RESEARCH CENTER
www.pewresearch.org
About Pew Research Center Pew Research Center is a nonpartisan, nonadvocacy fact tank that informs the public about the issues, attitudes and trends shaping the world. It does not take policy positions. The Center conducts public opinion polling, demographic research, computational social science research and other data-driven research. It studies politics and policy; news habits and media; the internet and technology; religion; race and ethnicity; international affairs; social, demographic and economic trends; science; research methodology and data science; and immigration and migration. Pew Research Center is a subsidiary of The Pew Charitable Trusts, its primary funder.
© Pew Research Center 2022
EMBARGOED: NOT FOR RELEASE OR PUBLICATION UNTIL APRIL 28, THURSDAY: 10:00 AM WASHINGTON, D.C.
2 PEW RESEARCH CENTER
www.pewresearch.org
How we did this Pew Research Center conducted this study to gauge American views of China. For this analysis, we surveyed 3,581 U.S. adults from March 21 to 27, 2022. Everyone who took part in this survey is a member of the Center’s American Trends Panel (ATP), an online survey panel that is recruited through national, random sampling of residential addresses. This way nearly all U.S. adults have a chance of selection. The survey is weighted to be representative of the U.S. adult population by gender, race, ethnicity, partisan affiliation, education and other categories. Read more about the ATP’s methodology.
Here are the questions used for the report, along with responses and its methodology.
EMBARGOED: NOT FOR RELEASE OR PUBLICATION UNTIL APRIL 28, THURSDAY: 10:00 AM WASHINGTON, D.C.
3 PEW RESEARCH CENTER
www.pewresearch.org
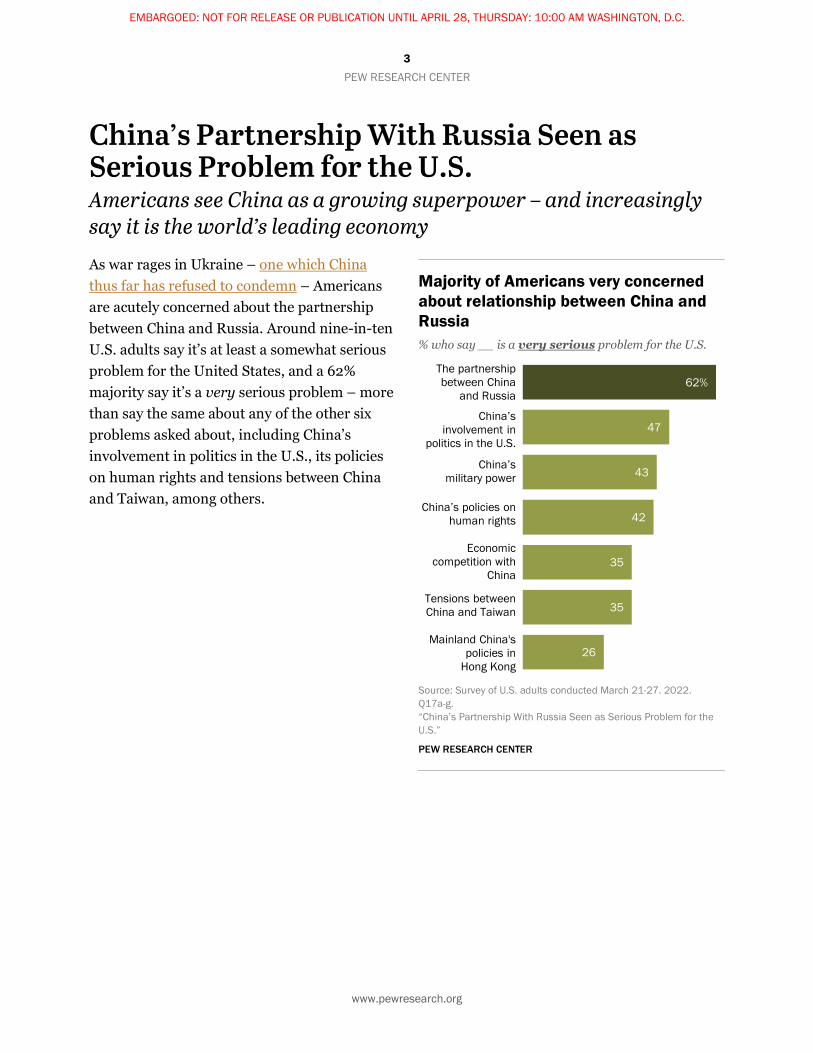
China’s Partnership With Russia Seen as Serious Problem for the U.S. Americans see China as a growing superpower – and increasingly say it is the world’s leading economy As war rages in Ukraine – one which China thus far has refused to condemn – Americans are acutely concerned about the partnership between China and Russia. Around nine-in-ten U.S. adults say it’s at least a somewhat serious problem for the United States, and a 62% majority say it’s a very serious problem – more than say the same about any of the other six problems asked about, including China’s involvement in politics in the U.S., its policies on human rights and tensions between China and Taiwan, among others.
Majority of Americans very concerned about relationship between China and Russia % who say __ is a very serious problem for the U.S.
Source: Survey of U.S. adults conducted March 21-27. 2022. Q17a-g. “China’s Partnership With Russia Seen as Serious Problem for the U.S.”
PEW RESEARCH CENTER
62%
47
43
42
35
35
26
The partnership between China
and Russia
China’s involvement in
politics in the U.S.
China’smilitary power
China’s policies on human rights
Economic competition with
China
Tensions between China and Taiwan
Mainland China's policies in
Hong Kong
EMBARGOED: NOT FOR RELEASE OR PUBLICATION UNTIL APRIL 28, THURSDAY: 10:00 AM WASHINGTON, D.C.
4 PEW RESEARCH CENTER
www.pewresearch.org
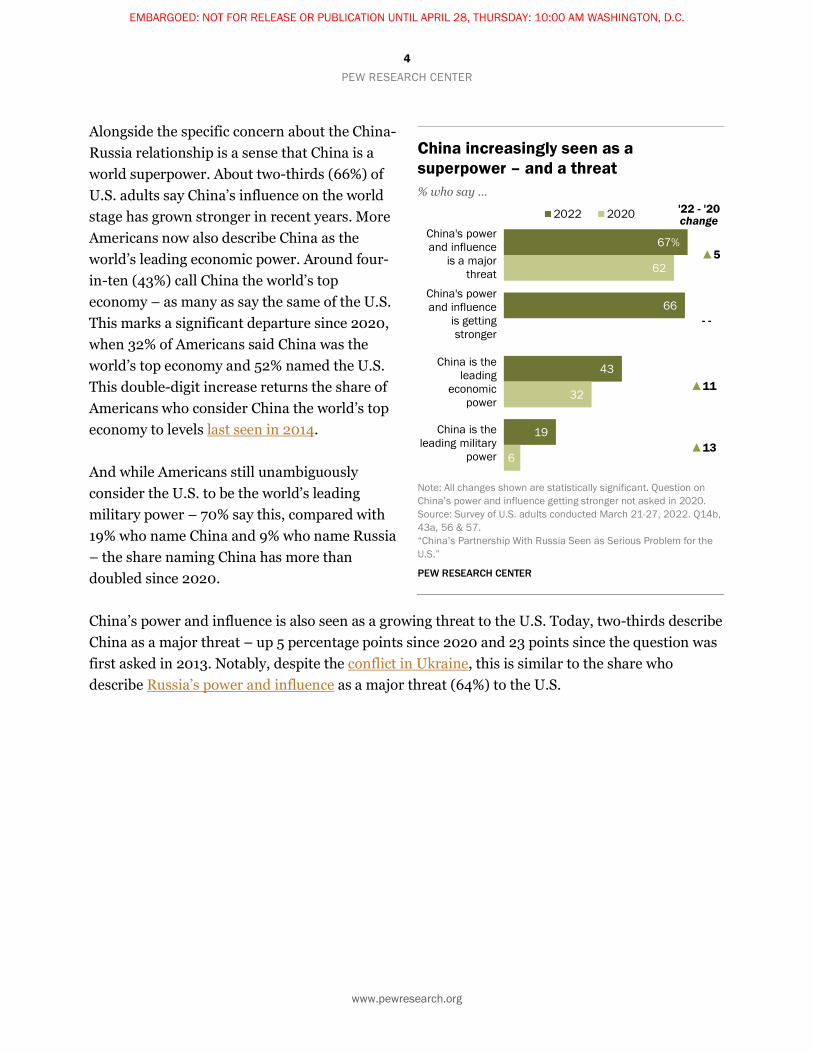
Alongside the specific concern about the China-Russia relationship is a sense that China is a world superpower. About two-thirds (66%) of U.S. adults say China’s influence on the world stage has grown stronger in recent years. More Americans now also describe China as the world’s leading economic power. Around four-in-ten (43%) call China the world’s top economy – as many as say the same of the U.S. This marks a significant departure since 2020, when 32% of Americans said China was the world’s top economy and 52% named the U.S. This double-digit increase returns the share of Americans who consider China the world’s top economy to levels last seen in 2014.
And while Americans still unambiguously consider the U.S. to be the world’s leading military power – 70% say this, compared with 19% who name China and 9% who name Russia – the share naming China has more than doubled since 2020.
China’s power and influence is also seen as a growing threat to the U.S. Today, two-thirds describe China as a major threat – up 5 percentage points since 2020 and 23 points since the question was first asked in 2013. Notably, despite the conflict in Ukraine, this is similar to the share who describe Russia’s power and influence as a major threat (64%) to the U.S.
China increasingly seen as a superpower – and a threat % who say …
Note: All changes shown are statistically significant. Question on China’s power and influence getting stronger not asked in 2020. Source: Survey of U.S. adults conducted March 21-27, 2022. Q14b, 43a, 56 & 57. “China’s Partnership With Russia Seen as Serious Problem for the U.S.”
PEW RESEARCH CENTER
67%
66
43
19
62
0%
32
6
2022 2020
China's power and influence
is getting stronger
China is the leading
economic power
China is the leading military
power
China's power and influence
is a major threat
'22 - '20 change
▲5
▲11
▲13
- -
EMBARGOED: NOT FOR RELEASE OR PUBLICATION UNTIL APRIL 28, THURSDAY: 10:00 AM WASHINGTON, D.C.
5 PEW RESEARCH CENTER
www.pewresearch.org
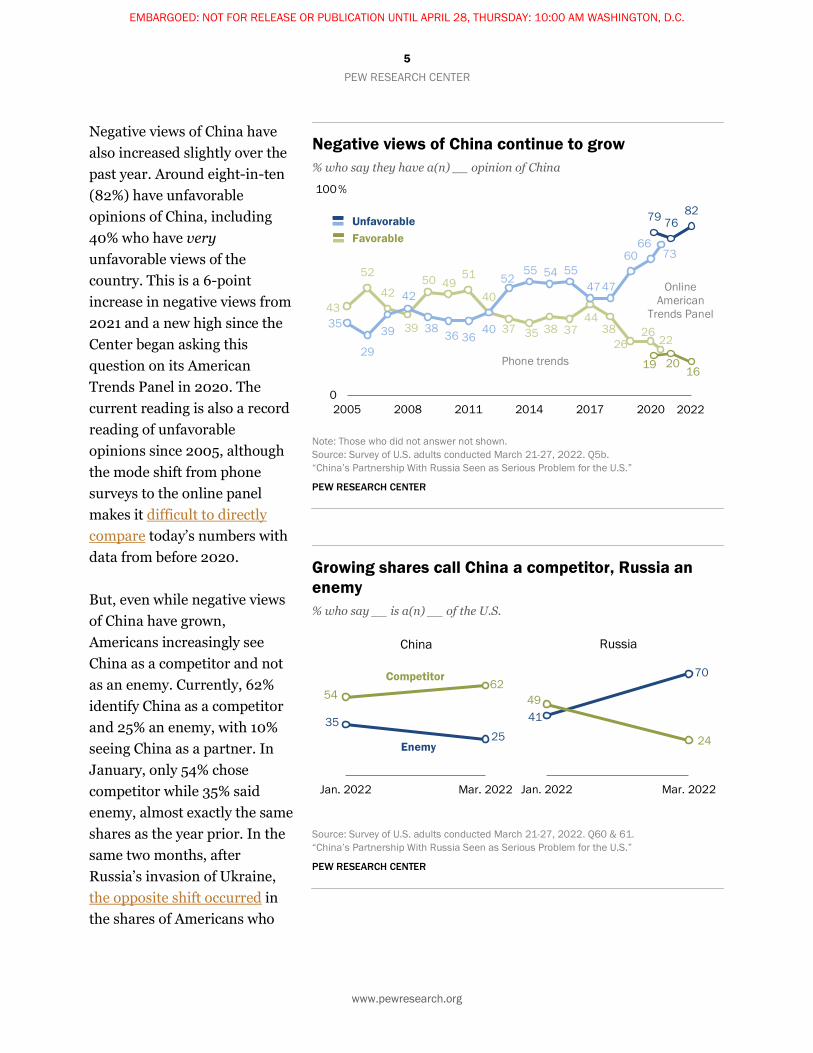
Negative views of China have also increased slightly over the past year. Around eight-in-ten (82%) have unfavorable opinions of China, including 40% who have very unfavorable views of the country. This is a 6-point increase in negative views from 2021 and a new high since the Center began asking this question on its American Trends Panel in 2020. The current reading is also a record reading of unfavorable opinions since 2005, although the mode shift from phone surveys to the online panel makes it difficult to directly compare today’s numbers with data from before 2020.
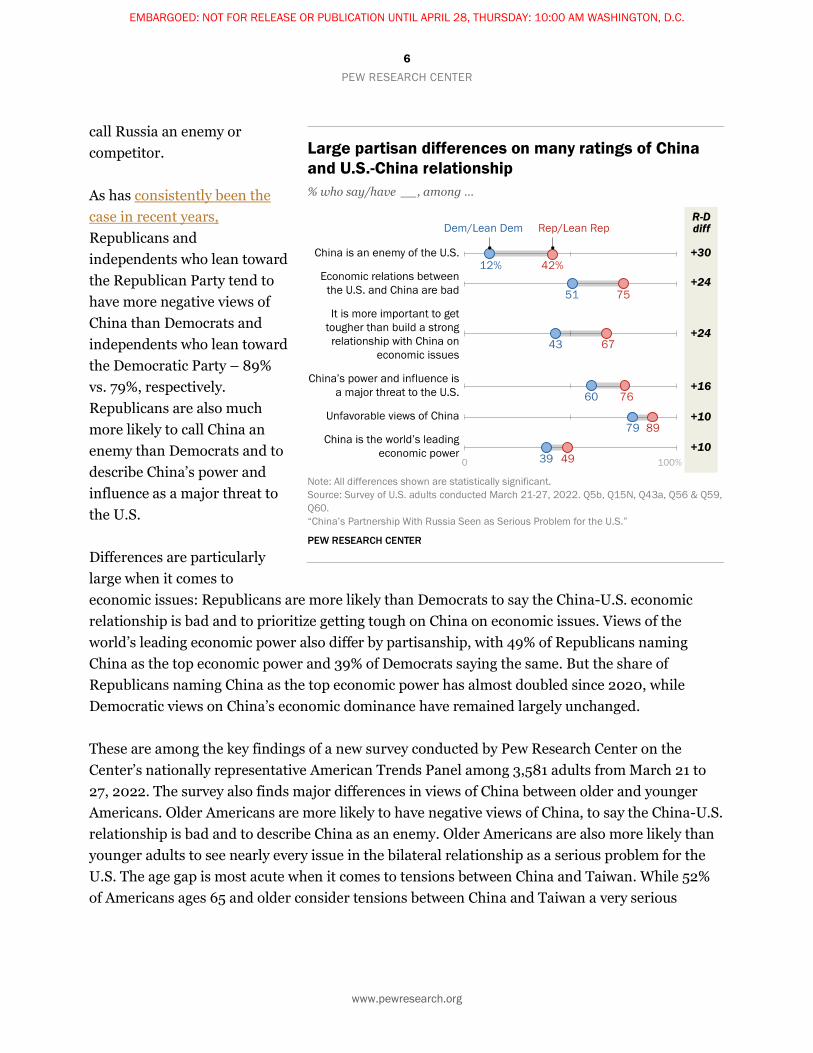
But, even while negative views of China have grown, Americans increasingly see China as a competitor and not as an enemy. Currently, 62% identify China as a competitor and 25% an enemy, with 10% seeing China as a partner. In January, only 54% chose competitor while 35% said enemy, almost exactly the same shares as the year prior. In the same two months, after Russia’s invasion of Ukraine, the opposite shift occurred in the shares of Americans who
Growing shares call China a competitor, Russia an enemy % who say __ is a(n) __ of the U.S.
Source: Survey of U.S. adults conducted March 21-27, 2022. Q60 & 61. “China’s Partnership With Russia Seen as Serious Problem for the U.S.”
PEW RESEARCH CENTER
Negative views of China continue to grow % who say they have a(n) __ opinion of China
Note: Those who did not answer not shown. Source: Survey of U.S. adults conducted March 21-27, 2022. Q5b. “China’s Partnership With Russia Seen as Serious Problem for the U.S.”
PEW RESEARCH CENTER
3525
5462
Jan. 2022 Mar. 2022
China
Enemy
Competitor
41
70
49
24
Jan. 2022 Mar. 2022
Russia
43
52
42
39
50 4951
40
37 35 38 3744
3826
2622
35
29
39
42
38 36 3640
5255 54 55
4747
6066
73
19 2016
79 7682
0
100
2005 2008 2011 2014 2017 2020
FavorableUnfavorable
%
2022
Online American
Trends Panel
Phone trends
EMBARGOED: NOT FOR RELEASE OR PUBLICATION UNTIL APRIL 28, THURSDAY: 10:00 AM WASHINGTON, D.C.
6 PEW RESEARCH CENTER
www.pewresearch.org
call Russia an enemy or competitor.
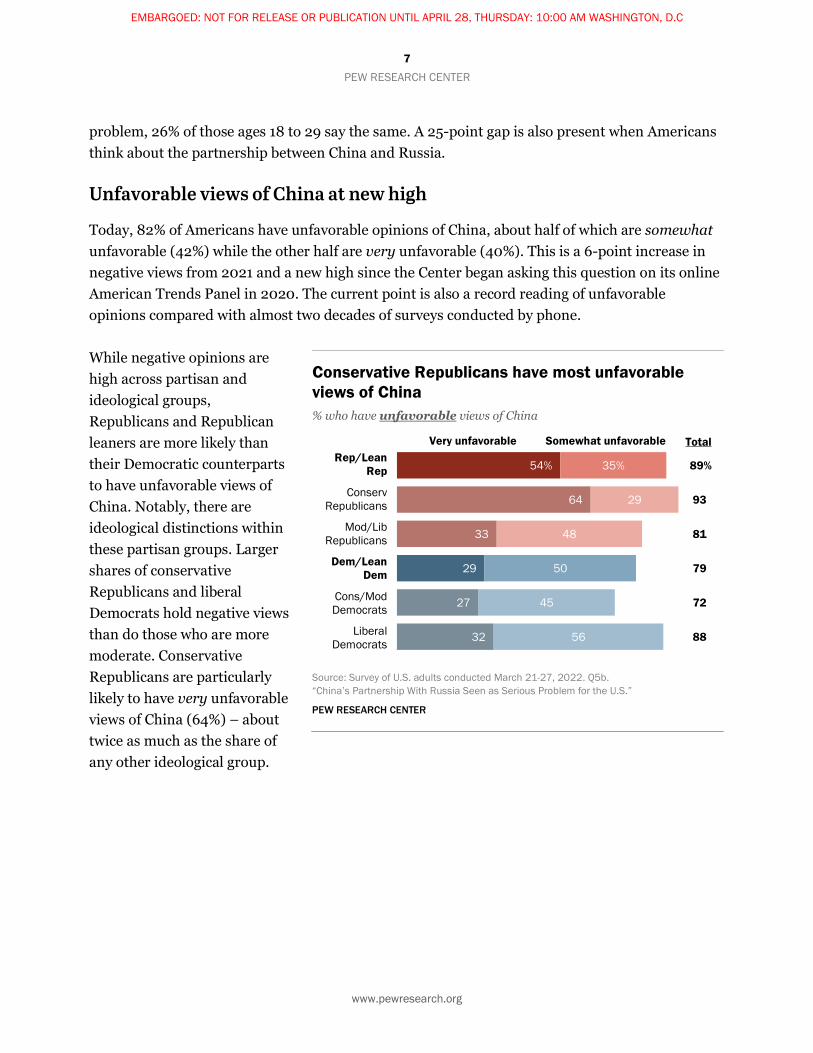
As has consistently been the case in recent years, Republicans and independents who lean toward the Republican Party tend to have more negative views of China than Democrats and independents who lean toward the Democratic Party – 89% vs. 79%, respectively. Republicans are also much more likely to call China an enemy than Democrats and to describe China’s power and influence as a major threat to the U.S.
Differences are particularly large when it comes to economic issues: Republicans are more likely than Democrats to say the China-U.S. economic relationship is bad and to prioritize getting tough on China on economic issues. Views of the world’s leading economic power also differ by partisanship, with 49% of Republicans naming China as the top economic power and 39% of Democrats saying the same. But the share of Republicans naming China as the top economic power has almost doubled since 2020, while Democratic views on China’s economic dominance have remained largely unchanged.
These are among the key findings of a new survey conducted by Pew Research Center on the Center’s nationally representative American Trends Panel among 3,581 adults from March 21 to 27, 2022. The survey also finds major differences in views of China between older and younger Americans. Older Americans are more likely to have negative views of China, to say the China-U.S. relationship is bad and to describe China as an enemy. Older Americans are also more likely than younger adults to see nearly every issue in the bilateral relationship as a serious problem for the U.S. The age gap is most acute when it comes to tensions between China and Taiwan. While 52% of Americans ages 65 and older consider tensions between China and Taiwan a very serious
Large partisan differences on many ratings of China and U.S.-China relationship % who say/have __, among …
Note: All differences shown are statistically significant. Source: Survey of U.S. adults conducted March 21-27, 2022. Q5b, Q15N, Q43a, Q56 & Q59, Q60. “China’s Partnership With Russia Seen as Serious Problem for the U.S.”
PEW RESEARCH CENTER
EMBARGOED: NOT FOR RELEASE OR PUBLICATION UNTIL APRIL 28, THURSDAY: 10:00 AM WASHINGTON, D.C.
7 PEW RESEARCH CENTER
www.pewresearch.org
problem, 26% of those ages 18 to 29 say the same. A 25-point gap is also present when Americans think about the partnership between China and Russia.
Unfavorable views of China at new high
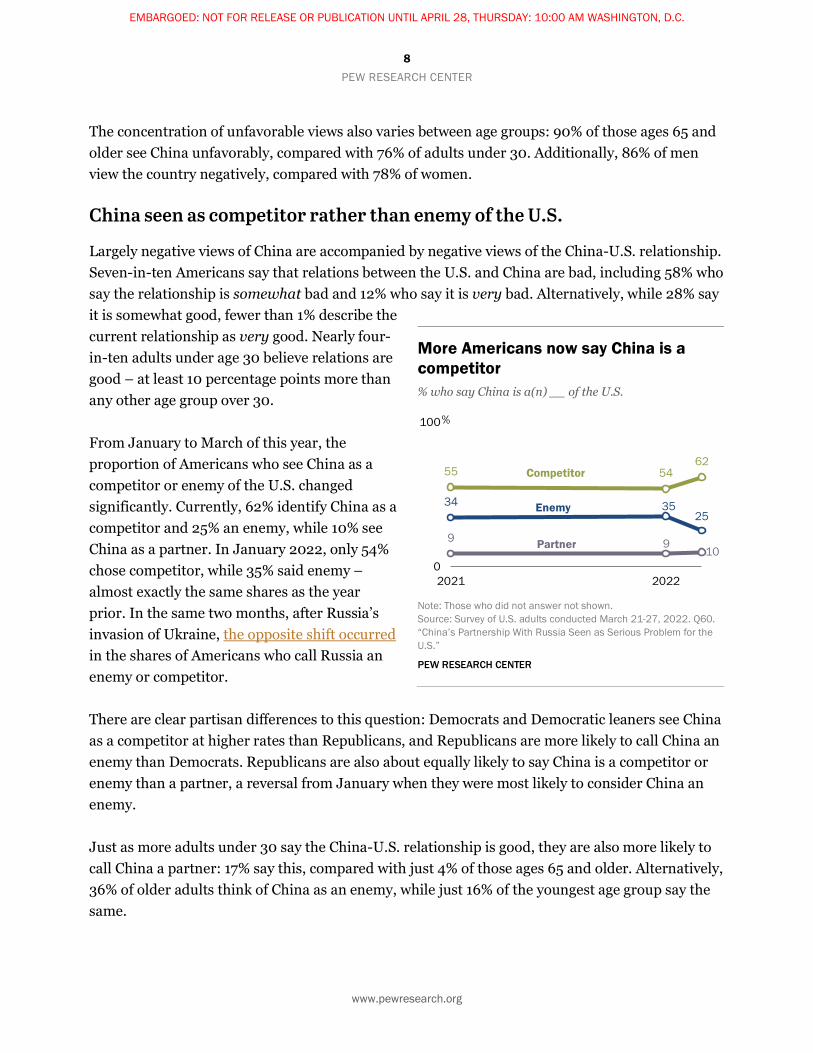
Today, 82% of Americans have unfavorable opinions of China, about half of which are somewhat unfavorable (42%) while the other half are very unfavorable (40%). This is a 6-point increase in negative views from 2021 and a new high since the Center began asking this question on its online American Trends Panel in 2020. The current point is also a record reading of unfavorable opinions compared with almost two decades of surveys conducted by phone.
While negative opinions are high across partisan and ideological groups, Republicans and Republican leaners are more likely than their Democratic counterparts to have unfavorable views of China. Notably, there are ideological distinctions within these partisan groups. Larger shares of conservative Republicans and liberal Democrats hold negative views than do those who are more moderate. Conservative Republicans are particularly likely to have very unfavorable views of China (64%) – about twice as much as the share of any other ideological group.
Conservative Republicans have most unfavorable views of China % who have unfavorable views of China
Source: Survey of U.S. adults conducted March 21-27, 2022. Q5b. “China’s Partnership With Russia Seen as Serious Problem for the U.S.”
PEW RESEARCH CENTER
Very Unfavorable
54%
64
33
29
27
32
35%
29
48
50
45
56
89%
93
81
79
72
88
Rep/Lean Rep
ConservativeRepublicans
Mod/LibRepublicans
Dem/LeanDem
Cons/ModDemocrats
LiberalDemocrats
Rep/Lean Rep
Rep/Lean Rep
ConservRepublicans
Mod/Lib Republicans
Dem/Lean Dem
Cons/Mod Democrats
LiberalDemocrats
Somewhat unfavorable Total Very unfavorable
EMBARGOED: NOT FOR RELEASE OR PUBLICATION UNTIL APRIL 28, THURSDAY: 10:00 AM WASHINGTON, D.C
8 PEW RESEARCH CENTER
www.pewresearch.org
The concentration of unfavorable views also varies between age groups: 90% of those ages 65 and older see China unfavorably, compared with 76% of adults under 30. Additionally, 86% of men view the country negatively, compared with 78% of women.
China seen as competitor rather than enemy of the U.S.
Largely negative views of China are accompanied by negative views of the China-U.S. relationship. Seven-in-ten Americans say that relations between the U.S. and China are bad, including 58% who say the relationship is somewhat bad and 12% who say it is very bad. Alternatively, while 28% say it is somewhat good, fewer than 1% describe the current relationship as very good. Nearly four-in-ten adults under age 30 believe relations are good – at least 10 percentage points more than any other age group over 30.
From January to March of this year, the proportion of Americans who see China as a competitor or enemy of the U.S. changed significantly. Currently, 62% identify China as a competitor and 25% an enemy, while 10% see China as a partner. In January 2022, only 54% chose competitor, while 35% said enemy – almost exactly the same shares as the year prior. In the same two months, after Russia’s invasion of Ukraine, the opposite shift occurred in the shares of Americans who call Russia an enemy or competitor.
There are clear partisan differences to this question: Democrats and Democratic leaners see China as a competitor at higher rates than Republicans, and Republicans are more likely to call China an enemy than Democrats. Republicans are also about equally likely to say China is a competitor or enemy than a partner, a reversal from January when they were most likely to consider China an enemy.
Just as more adults under 30 say the China-U.S. relationship is good, they are also more likely to call China a partner: 17% say this, compared with just 4% of those ages 65 and older. Alternatively, 36% of older adults think of China as an enemy, while just 16% of the youngest age group say the same.
More Americans now say China is a competitor % who say China is a(n) __ of the U.S.
Note: Those who did not answer not shown. Source: Survey of U.S. adults conducted March 21-27, 2022. Q60. “China’s Partnership With Russia Seen as Serious Problem for the U.S.”
PEW RESEARCH CENTER
9 910
34 3525
55 5462
0
100
2021 2022
Competitor
Enemy
%
Partner
EMBARGOED: NOT FOR RELEASE OR PUBLICATION UNTIL APRIL 28, THURSDAY: 10:00 AM WASHINGTON, D.C.
9 PEW RESEARCH CENTER
www.pewresearch.org
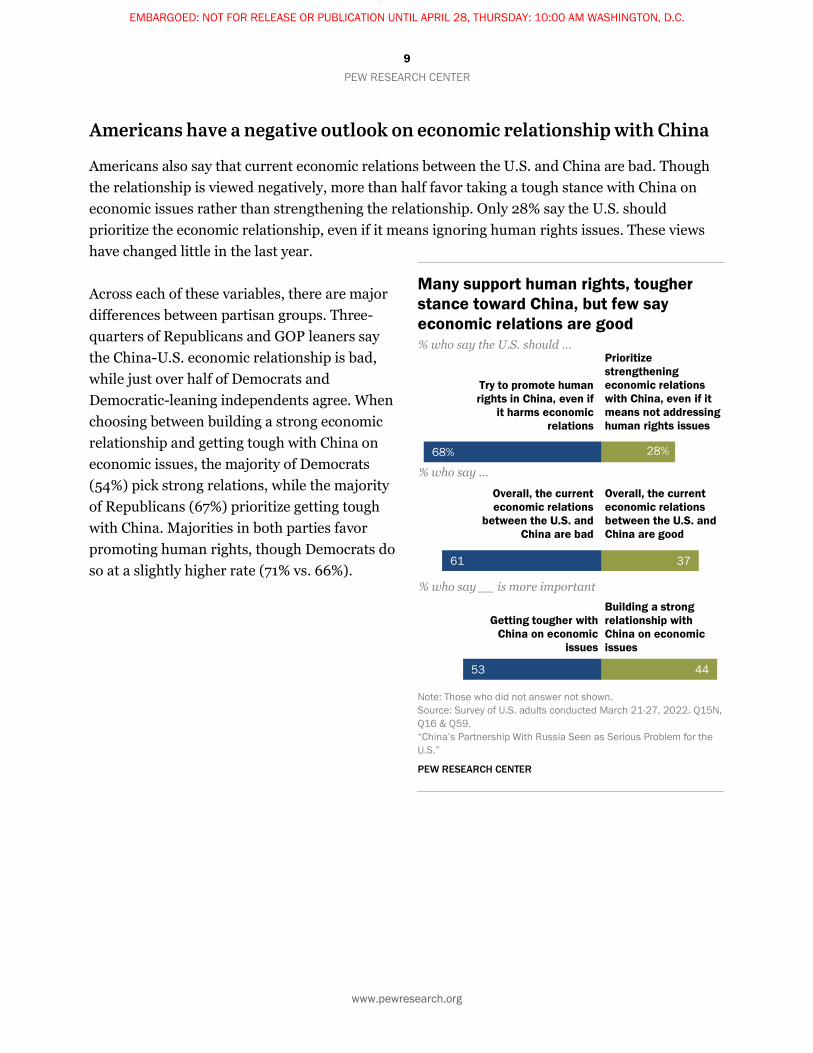
Americans have a negative outlook on economic relationship with China
Americans also say that current economic relations between the U.S. and China are bad. Though the relationship is viewed negatively, more than half favor taking a tough stance with China on economic issues rather than strengthening the relationship. Only 28% say the U.S. should prioritize the economic relationship, even if it means ignoring human rights issues. These views have changed little in the last year.
Across each of these variables, there are major differences between partisan groups. Three-quarters of Republicans and GOP leaners say the China-U.S. economic relationship is bad, while just over half of Democrats and Democratic-leaning independents agree. When choosing between building a strong economic relationship and getting tough with China on economic issues, the majority of Democrats (54%) pick strong relations, while the majority of Republicans (67%) prioritize getting tough with China. Majorities in both parties favor promoting human rights, though Democrats do so at a slightly higher rate (71% vs. 66%).
Many support human rights, tougher stance toward China, but few say economic relations are good
Note: Those who did not answer not shown. Source: Survey of U.S. adults conducted March 21-27, 2022. Q15N, Q16 & Q59. “China’s Partnership With Russia Seen as Serious Problem for the U.S.”
PEW RESEARCH CENTER
68%
61
53
28%
37
44
Overall, the current economic relations
between the U.S. and China are bad
Overall, the current economic relations between the U.S. and China are good
Building a strong relationship with China on economic issues
Getting tougher with China on economic
issues
Try to promote human rights in China, even if
it harms economic relations
Prioritize strengthening economic relations with China, even if it means not addressing human rights issues
% who say __ is more important
% who say …
% who say the U.S. should …
EMBARGOED: NOT FOR RELEASE OR PUBLICATION UNTIL APRIL 28, THURSDAY: 10:00 AM WASHINGTON, D.C.
10 PEW RESEARCH CENTER
www.pewresearch.org
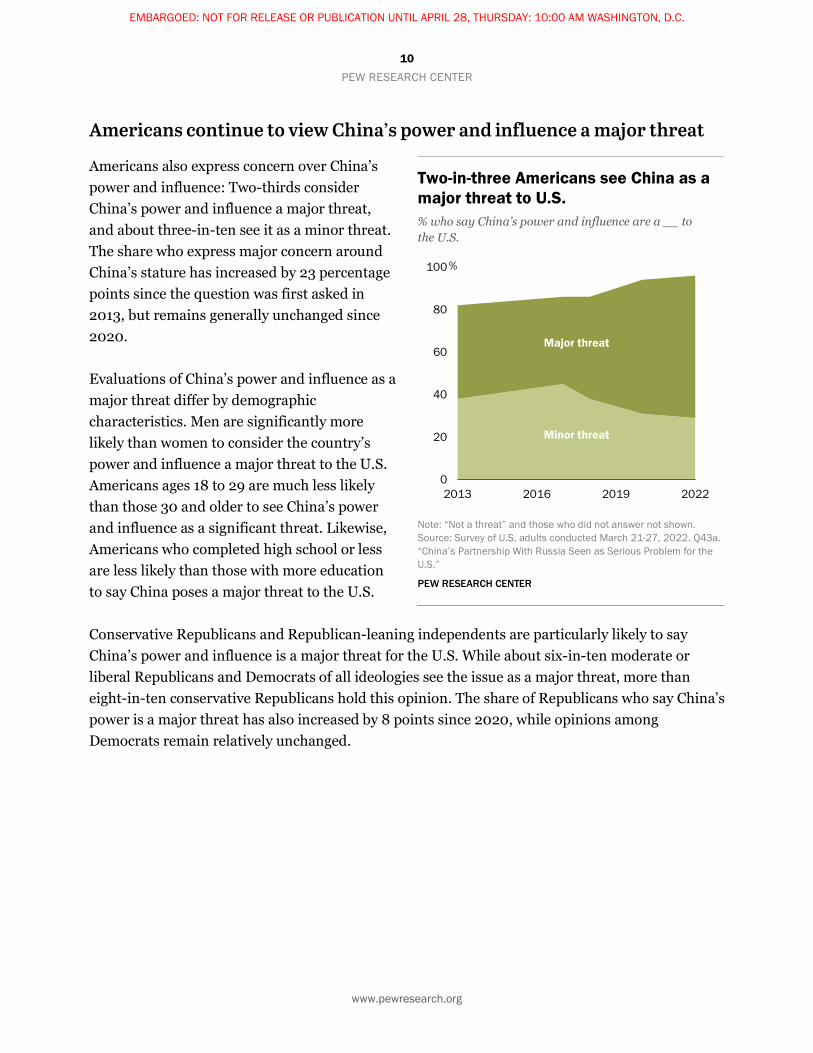
Americans continue to view China’s power and influence a major threat
Americans also express concern over China’s power and influence: Two-thirds consider China’s power and influence a major threat, and about three-in-ten see it as a minor threat. The share who express major concern around China’s stature has increased by 23 percentage points since the question was first asked in 2013, but remains generally unchanged since 2020.
Evaluations of China’s power and influence as a major threat differ by demographic characteristics. Men are significantly more likely than women to consider the country’s power and influence a major threat to the U.S. Americans ages 18 to 29 are much less likely than those 30 and older to see China’s power and influence as a significant threat. Likewise, Americans who completed high school or less are less likely than those with more education to say China poses a major threat to the U.S.
Conservative Republicans and Republican-leaning independents are particularly likely to say China’s power and influence is a major threat for the U.S. While about six-in-ten moderate or liberal Republicans and Democrats of all ideologies see the issue as a major threat, more than eight-in-ten conservative Republicans hold this opinion. The share of Republicans who say China’s power is a major threat has also increased by 8 points since 2020, while opinions among Democrats remain relatively unchanged.
Two-in-three Americans see China as a major threat to U.S. % who say China’s power and influence are a __ to the U.S.
Note: “Not a threat” and those who did not answer not shown. Source: Survey of U.S. adults conducted March 21-27, 2022. Q43a. “China’s Partnership With Russia Seen as Serious Problem for the U.S.”
PEW RESEARCH CENTER
0
20
40
60
80
100
2013 2016 2019 2022
Major threat
Minor threat
%
EMBARGOED: NOT FOR RELEASE OR PUBLICATION UNTIL APRIL 28, THURSDAY: 10:00 AM WASHINGTON, D.C.
11 PEW RESEARCH CENTER
www.pewresearch.org
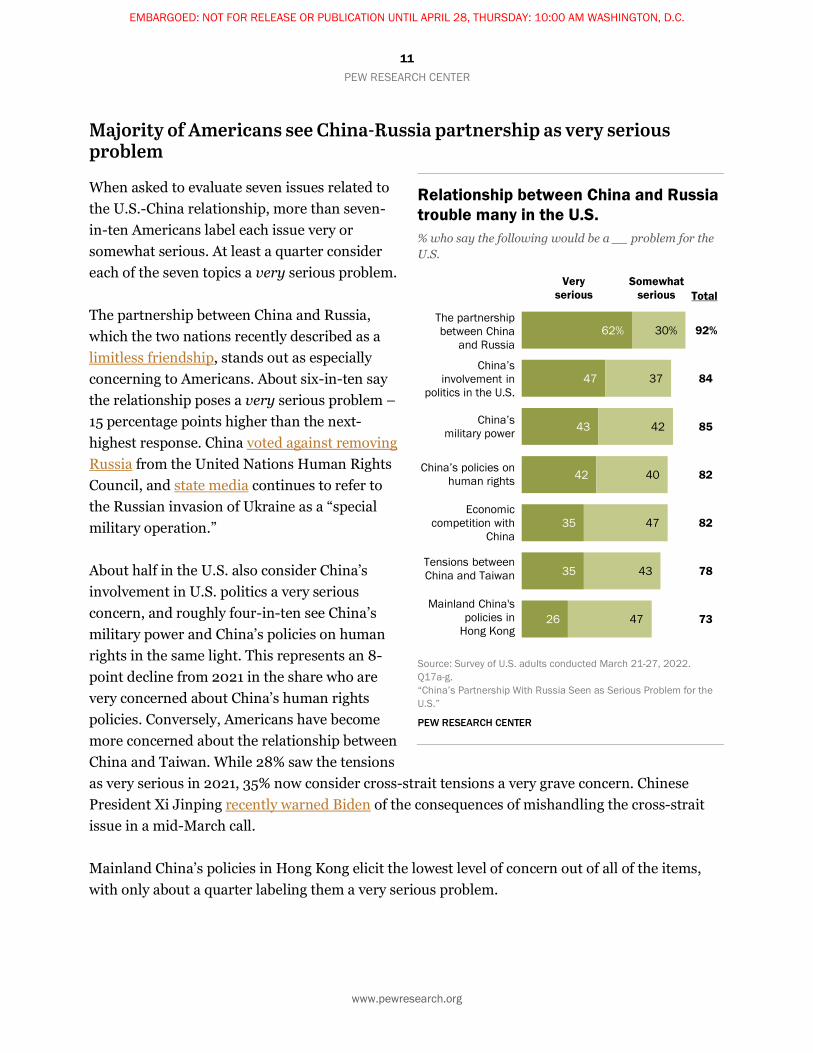
Majority of Americans see China-Russia partnership as very serious problem
When asked to evaluate seven issues related to the U.S.-China relationship, more than seven-in-ten Americans label each issue very or somewhat serious. At least a quarter consider each of the seven topics a very serious problem.
The partnership between China and Russia, which the two nations recently described as a limitless friendship, stands out as especially concerning to Americans. About six-in-ten say the relationship poses a very serious problem – 15 percentage points higher than the next-highest response. China voted against removing Russia from the United Nations Human Rights Council, and state media continues to refer to the Russian invasion of Ukraine as a “special military operation.”
About half in the U.S. also consider China’s involvement in U.S. politics a very serious concern, and roughly four-in-ten see China’s military power and China’s policies on human rights in the same light. This represents an 8-point decline from 2021 in the share who are very concerned about China’s human rights policies. Conversely, Americans have become more concerned about the relationship between China and Taiwan. While 28% saw the tensions as very serious in 2021, 35% now consider cross-strait tensions a very grave concern. Chinese President Xi Jinping recently warned Biden of the consequences of mishandling the cross-strait issue in a mid-March call.
Mainland China’s policies in Hong Kong elicit the lowest level of concern out of all of the items, with only about a quarter labeling them a very serious problem.
Relationship between China and Russia trouble many in the U.S. % who say the following would be a __ problem for the U.S.
Source: Survey of U.S. adults conducted March 21-27, 2022. Q17a-g. “China’s Partnership With Russia Seen as Serious Problem for the U.S.”
PEW RESEARCH CENTER
62%
47
43
42
35
35
26
30%
37
42
40
47
43
47
92%
84
85
82
82
78
73
Very serious Total
Somewhat serious
The partnership between China
and Russia
China’s involvement in
politics in the U.S.
China’smilitary power
China’s policies on human rights
Tensions between China and Taiwan
Economic competition with
China
Mainland China's policies in
Hong Kong
EMBARGOED: NOT FOR RELEASE OR PUBLICATION UNTIL APRIL 28, THURSDAY: 10:00 AM WASHINGTON, D.C.
12 PEW RESEARCH CENTER
www.pewresearch.org
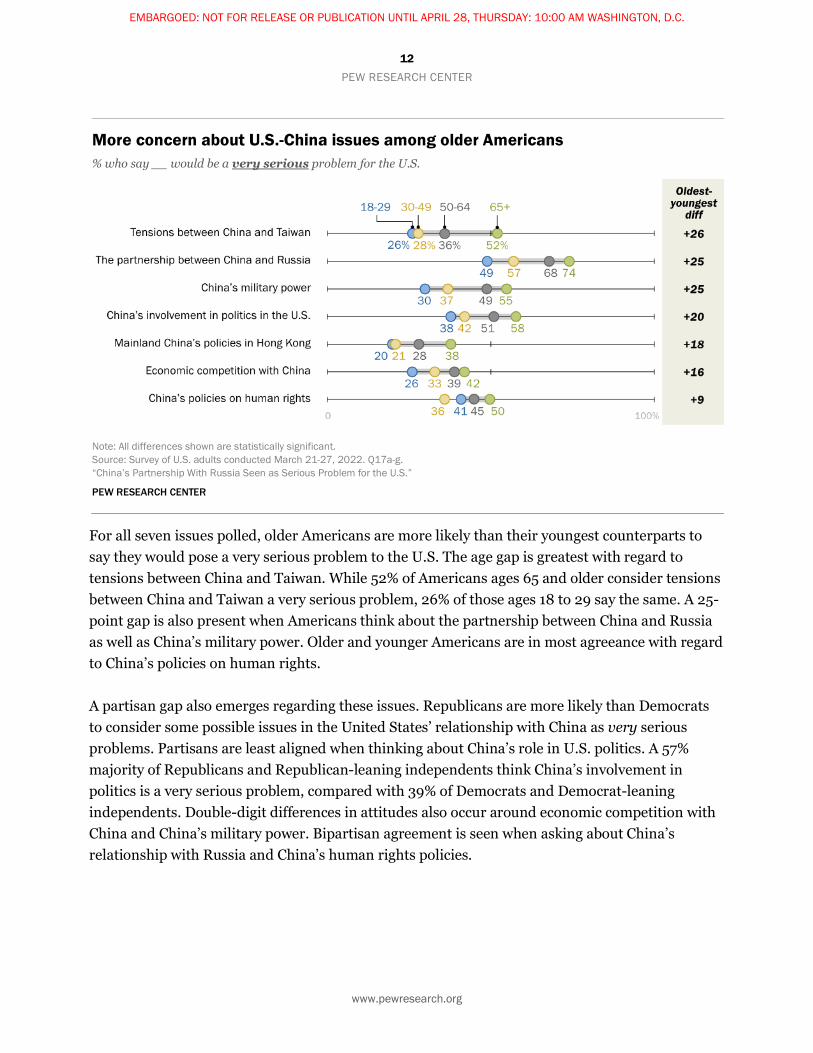
For all seven issues polled, older Americans are more likely than their youngest counterparts to say they would pose a very serious problem to the U.S. The age gap is greatest with regard to tensions between China and Taiwan. While 52% of Americans ages 65 and older consider tensions between China and Taiwan a very serious problem, 26% of those ages 18 to 29 say the same. A 25-point gap is also present when Americans think about the partnership between China and Russia as well as China’s military power. Older and younger Americans are in most agreeance with regard to China’s policies on human rights.
A partisan gap also emerges regarding these issues. Republicans are more likely than Democrats to consider some possible issues in the United States’ relationship with China as very serious problems. Partisans are least aligned when thinking about China’s role in U.S. politics. A 57% majority of Republicans and Republican-leaning independents think China’s involvement in politics is a very serious problem, compared with 39% of Democrats and Democrat-leaning independents. Double-digit differences in attitudes also occur around economic competition with China and China’s military power. Bipartisan agreement is seen when asking about China’s relationship with Russia and China’s human rights policies.
More concern about U.S.-China issues among older Americans % who say __ would be a very serious problem for the U.S.
Note: All differences shown are statistically significant. Source: Survey of U.S. adults conducted March 21-27, 2022. Q17a-g. “China’s Partnership With Russia Seen as Serious Problem for the U.S.”
PEW RESEARCH CENTER
EMBARGOED: NOT FOR RELEASE OR PUBLICATION UNTIL APRIL 28, THURSDAY: 10:00 AM WASHINGTON, D.C.
13 PEW RESEARCH CENTER
www.pewresearch.org
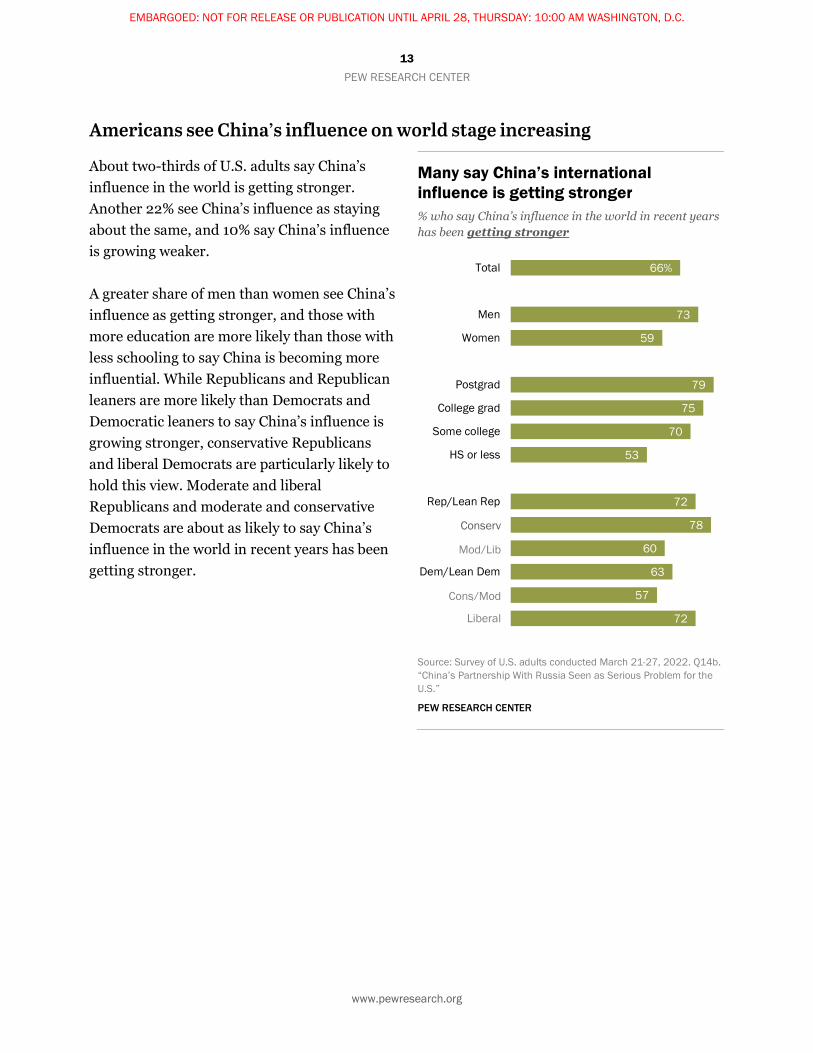
Americans see China’s influence on world stage increasing
About two-thirds of U.S. adults say China’s influence in the world is getting stronger. Another 22% see China’s influence as staying about the same, and 10% say China’s influence is growing weaker.
A greater share of men than women see China’s influence as getting stronger, and those with more education are more likely than those with less schooling to say China is becoming more influential. While Republicans and Republican leaners are more likely than Democrats and Democratic leaners to say China’s influence is growing stronger, conservative Republicans and liberal Democrats are particularly likely to hold this view. Moderate and liberal Republicans and moderate and conservative Democrats are about as likely to say China’s influence in the world in recent years has been getting stronger.
Many say China’s international influence is getting stronger % who say China’s influence in the world in recent years has been getting stronger
Source: Survey of U.S. adults conducted March 21-27, 2022. Q14b. “China’s Partnership With Russia Seen as Serious Problem for the U.S.”
PEW RESEARCH CENTER
66%
73
59
79
75
70
53
72
78
60
63
57
72
Total
Men
Women
Postgrad
College grad
Some college
HS or less
Rep/Lean Rep
Conserv
Mod/Lib
Dem/Lean Dem
Cons/Mod
Liberal
Conserv
Mod/Lib
Cons/Mod
Liberal
EMBARGOED: NOT FOR RELEASE OR PUBLICATION UNTIL APRIL 28, THURSDAY: 10:00 AM WASHINGTON, D.C.
14 PEW RESEARCH CENTER
www.pewresearch.org
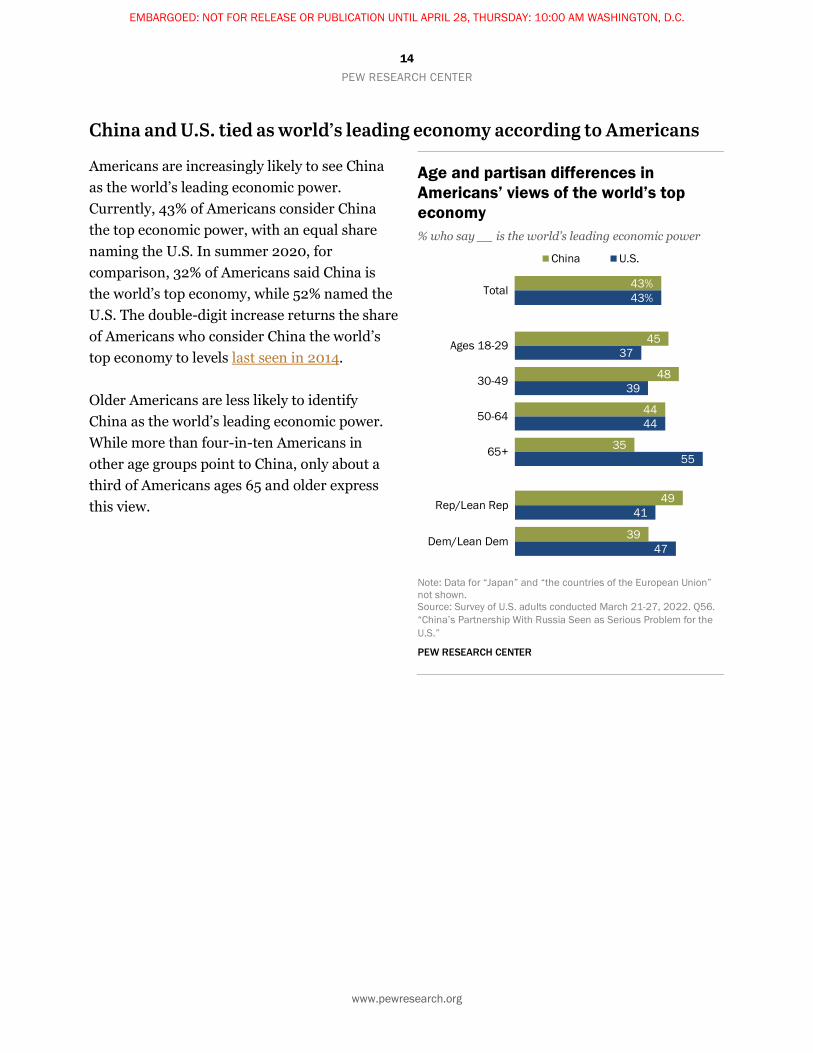
China and U.S. tied as world’s leading economy according to Americans
Americans are increasingly likely to see China as the world’s leading economic power. Currently, 43% of Americans consider China the top economic power, with an equal share naming the U.S. In summer 2020, for comparison, 32% of Americans said China is the world’s top economy, while 52% named the U.S. The double-digit increase returns the share of Americans who consider China the world’s top economy to levels last seen in 2014.
Older Americans are less likely to identify China as the world’s leading economic power. While more than four-in-ten Americans in other age groups point to China, only about a third of Americans ages 65 and older express this view.
Age and partisan differences in Americans’ views of the world’s top economy % who say __ is the world’s leading economic power
Note: Data for “Japan” and “the countries of the European Union” not shown. Source: Survey of U.S. adults conducted March 21-27, 2022. Q56. “China’s Partnership With Russia Seen as Serious Problem for the U.S.”
PEW RESEARCH CENTER
49
39
41
47
Rep/Lean Rep
Dem/Lean Dem
43%43%Total
China U.S.
45
48
44
35
37
39
44
55
Ages 18-29
30-49
50-64
65+
EMBARGOED: NOT FOR RELEASE OR PUBLICATION UNTIL APRIL 28, THURSDAY: 10:00 AM WASHINGTON, D.C.
15 PEW RESEARCH CENTER
www.pewresearch.org
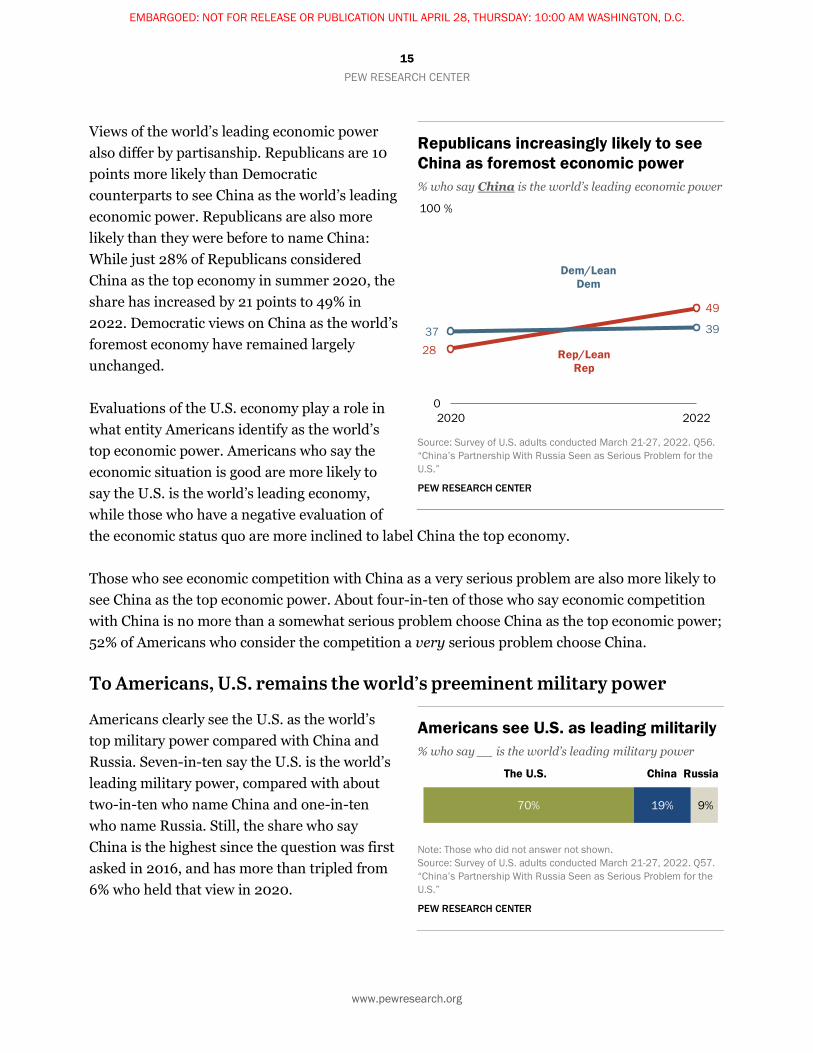
Views of the world’s leading economic power also differ by partisanship. Republicans are 10 points more likely than Democratic counterparts to see China as the world’s leading economic power. Republicans are also more likely than they were before to name China: While just 28% of Republicans considered China as the top economy in summer 2020, the share has increased by 21 points to 49% in 2022. Democratic views on China as the world’s foremost economy have remained largely unchanged.
Evaluations of the U.S. economy play a role in what entity Americans identify as the world’s top economic power. Americans who say the economic situation is good are more likely to say the U.S. is the world’s leading economy, while those who have a negative evaluation of the economic status quo are more inclined to label China the top economy.
Those who see economic competition with China as a very serious problem are also more likely to see China as the top economic power. About four-in-ten of those who say economic competition with China is no more than a somewhat serious problem choose China as the top economic power; 52% of Americans who consider the competition a very serious problem choose China.
To Americans, U.S. remains the world’s preeminent military power
Americans clearly see the U.S. as the world’s top military power compared with China and Russia. Seven-in-ten say the U.S. is the world’s leading military power, compared with about two-in-ten who name China and one-in-ten who name Russia. Still, the share who say China is the highest since the question was first asked in 2016, and has more than tripled from 6% who held that view in 2020.
Republicans increasingly likely to see China as foremost economic power % who say China is the world’s leading economic power
Source: Survey of U.S. adults conducted March 21-27, 2022. Q56. “China’s Partnership With Russia Seen as Serious Problem for the U.S.”
PEW RESEARCH CENTER
Americans see U.S. as leading militarily % who say __ is the world’s leading military power
Note: Those who did not answer not shown. Source: Survey of U.S. adults conducted March 21-27, 2022. Q57. “China’s Partnership With Russia Seen as Serious Problem for the U.S.”
PEW RESEARCH CENTER
70% 19% 9%
The U.S. China Russia
28
49
37 39
0
100
2020 2022
Rep/LeanRep
Dem/Lean Dem
%
EMBARGOED: NOT FOR RELEASE OR PUBLICATION UNTIL APRIL 28, THURSDAY: 10:00 AM WASHINGTON, D.C.
16 PEW RESEARCH CENTER
www.pewresearch.org
Men are more likely than women to identify the U.S. over China or Russia as the world’s top military power. Americans ages 65 and older are more likely than their younger counterparts to hold this view. Partisanship also plays a role, with Democrats – especially liberal Democrats – being more likely than Republicans to say the U.S. is the top military on the world stage.
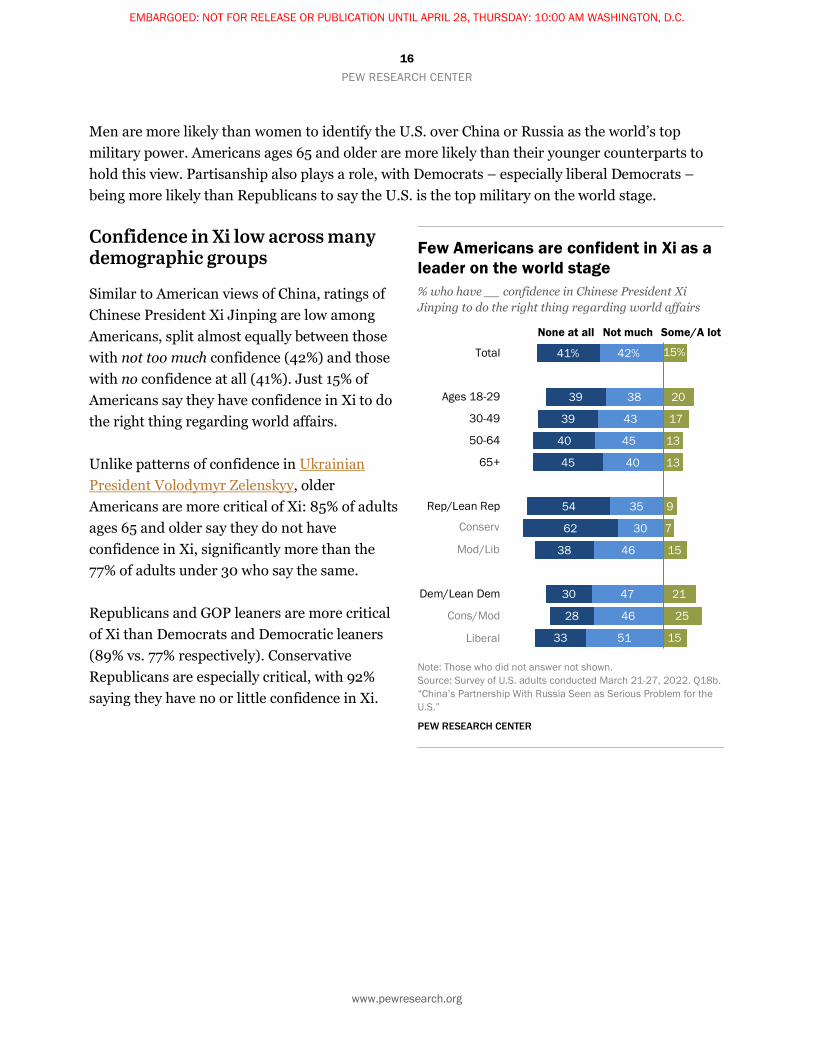
Confidence in Xi low across many demographic groups
Similar to American views of China, ratings of Chinese President Xi Jinping are low among Americans, split almost equally between those with not too much confidence (42%) and those with no confidence at all (41%). Just 15% of Americans say they have confidence in Xi to do the right thing regarding world affairs.
Unlike patterns of confidence in Ukrainian President Volodymyr Zelenskyy, older Americans are more critical of Xi: 85% of adults ages 65 and older say they do not have confidence in Xi, significantly more than the 77% of adults under 30 who say the same.
Republicans and GOP leaners are more critical of Xi than Democrats and Democratic leaners (89% vs. 77% respectively). Conservative Republicans are especially critical, with 92% saying they have no or little confidence in Xi.
Few Americans are confident in Xi as a leader on the world stage % who have __ confidence in Chinese President Xi Jinping to do the right thing regarding world affairs
Note: Those who did not answer not shown. Source: Survey of U.S. adults conducted March 21-27, 2022. Q18b. “China’s Partnership With Russia Seen as Serious Problem for the U.S.”
PEW RESEARCH CENTER
42%
38
43
45
40
35
30
46
47
46
51
41%
39
39
40
45
54
62
38
30
28
33
15%
20
17
13
13
9
7
15
21
25
15
Total
Ages 18-29
30-49
50-64
65+
Rep/Lean Rep
Dem/Lean Dem
Some/A lotNot muchNone at all
Conserv
Mod/Lib
Cons/Mod
Liberal
EMBARGOED: NOT FOR RELEASE OR PUBLICATION UNTIL APRIL 28, THURSDAY: 10:00 AM WASHINGTON, D.C.
17 PEW RESEARCH CENTER
www.pewresearch.org
Acknowledgments This report is a collaborative effort based on the input and analysis of the following individuals.
Christine Huang, Research Analyst
Laura Silver, Senior Researcher
Laura Clancy, Research Assistant
James Bell, Vice President, Global Strategy
Nick Bertoni, Senior Panel Manager
Alexandra Castillo, Research Methodologist
Janakee Chavda, Editorial Assistant
Aidan Connaughton, Research Assistant
Moira Fagan, Research Analyst Janell Fetterolf, Senior Researcher Shannon Greenwood, Digital Producer Sneha Gubbala, Research Assistant Michael Keegan, Senior Information Graphics Designer
David Kent, Senior Copy Editor Hannah Klein, Communications Manager
Gar Meng Leong, Communications Associate Rebecca Leppert, Editorial Assistant Clark Letterman, Senior Survey Manager Gracie Martinez, Senior Administrative Coordinator J.J. Moncus, Research Assistant Patrick Moynihan, Associate Director, International Research Methods
Jacob Poushter, Associate Director, Global Attitudes Research
Shannon Schumacher, Research Associate
Richard Wike, Director, Global Attitudes Research
Adam Wolsky, Research Methodologist
EMBARGOED: NOT FOR RELEASE OR PUBLICATION UNTIL APRIL 28, THURSDAY: 10:00 AM WASHINGTON, D.C.
18 PEW RESEARCH CENTER
www.pewresearch.org
Methodology The American Trends Panel survey methodology
Overview
The American Trends Panel (ATP), created by Pew Research Center, is a nationally representative panel of randomly selected U.S. adults. Panelists participate via self-administered web surveys. Panelists who do not have internet access at home are provided with a tablet and wireless internet connection. Interviews are conducted in both English and Spanish. The panel is being managed by Ipsos.
Data in this report is drawn from the panel wave conducted from March 21 to March 27, 2022. A total of 3,581 panelists responded out of 4,120 who were sampled, for a response rate of 87%. The cumulative response rate accounting for nonresponse to the recruitment surveys and attrition is 3%. The break-off rate among panelists who logged on to the survey and completed at least one item is 1%. The margin of sampling error for the full sample of 3,581 respondents is plus or minus 2.3 percentage points.
Panel recruitment
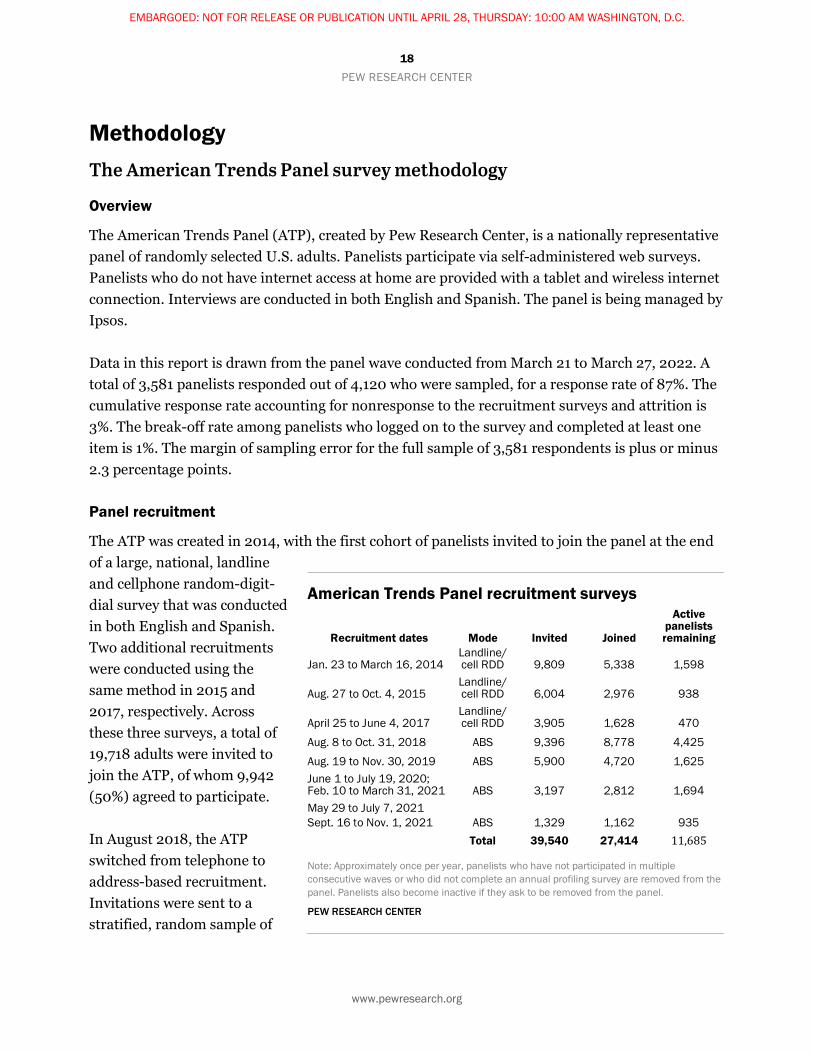
The ATP was created in 2014, with the first cohort of panelists invited to join the panel at the end of a large, national, landline and cellphone random-digit-dial survey that was conducted in both English and Spanish. Two additional recruitments were conducted using the same method in 2015 and 2017, respectively. Across these three surveys, a total of 19,718 adults were invited to join the ATP, of whom 9,942 (50%) agreed to participate.
In August 2018, the ATP switched from telephone to address-based recruitment. Invitations were sent to a stratified, random sample of
American Trends Panel recruitment surveys
Recruitment dates Mode Invited Joined
Active panelists remaining
Jan. 23 to March 16, 2014 Landline/ cell RDD 9,809 5,338 1,598
Aug. 27 to Oct. 4, 2015 Landline/ cell RDD 6,004 2,976 938
April 25 to June 4, 2017 Landline/ cell RDD 3,905 1,628 470
Aug. 8 to Oct. 31, 2018 ABS 9,396 8,778 4,425 Aug. 19 to Nov. 30, 2019 ABS 5,900 4,720 1,625 June 1 to July 19, 2020; Feb. 10 to March 31, 2021 ABS 3,197 2,812 1,694 May 29 to July 7, 2021 Sept. 16 to Nov. 1, 2021 ABS 1,329 1,162 935 Total 39,540 27,414 11,685
Note: Approximately once per year, panelists who have not participated in multiple consecutive waves or who did not complete an annual profiling survey are removed from the panel. Panelists also become inactive if they ask to be removed from the panel.
PEW RESEARCH CENTER
EMBARGOED: NOT FOR RELEASE OR PUBLICATION UNTIL APRIL 28, THURSDAY: 10:00 AM WASHINGTON, D.C.
19 PEW RESEARCH CENTER
www.pewresearch.org
households selected from the U.S. Postal Service’s Delivery Sequence File. Sampled households receive mailings asking a randomly selected adult to complete a survey online. A question at the end of the survey asks if the respondent is willing to join the ATP. Starting in 2020, another stage was added to the recruitment. Households that do not respond to the online survey are sent a paper version of the questionnaire, $5 and a postage-paid return envelope. A subset of the adults returning the paper version of the survey are invited to join the ATP. This subset of adults receive a follow-up mailing with a $10 pre-incentive and invitation to join the ATP.
Across the four address-based recruitments, a total of 19,822 adults were invited to join the ATP, of whom 17,472 agreed to join the panel and completed an initial profile survey. In each household, the adult with the next birthday was asked to go online to complete a survey, at the end of which they were invited to join the panel. Of the 27,414 individuals who have ever joined the ATP, 11,685 remained active panelists and continued to receive survey invitations at the time this survey was conducted.
The U.S. Postal Service’s Delivery Sequence File has been estimated to cover as much as 98% of the population, although some studies suggest that the coverage could be in the low 90% range.1 The American Trends Panel never uses breakout routers or chains that direct respondents to additional surveys.
Sample design
This study featured a stratified random sample from the ATP. The overall target population for this survey was non-institutionalized persons ages 18 and older, living in the U.S., including Alaska and Hawaii.
Questionnaire development and testing
The questionnaire was developed by Pew Research Center in consultation with Ipsos. The web program was rigorously tested on both PC and mobile devices by the Ipsos project management team and Center researchers. The Ipsos project management team also populated test data that was analyzed in SPSS to ensure the logic and randomizations were working as intended before launching the survey.
Incentives
All respondents were offered a post-paid incentive for their participation. Respondents could choose to receive the post-paid incentive in the form of a check or a gift code to Amazon.com or
1 AAPOR Task Force on Address-based Sampling. 2016. “AAPOR Report: Address-based Sampling.”
EMBARGOED: NOT FOR RELEASE OR PUBLICATION UNTIL APRIL 28, THURSDAY: 10:00 AM WASHINGTON, D.C.
20 PEW RESEARCH CENTER
www.pewresearch.org
could choose to decline the incentive. Incentive amounts ranged from $5 to $20 depending on whether the respondent belongs to a part of the population that is harder or easier to reach. Differential incentive amounts were designed to increase panel survey participation among groups that traditionally have low survey response propensities.
Data collection protocol
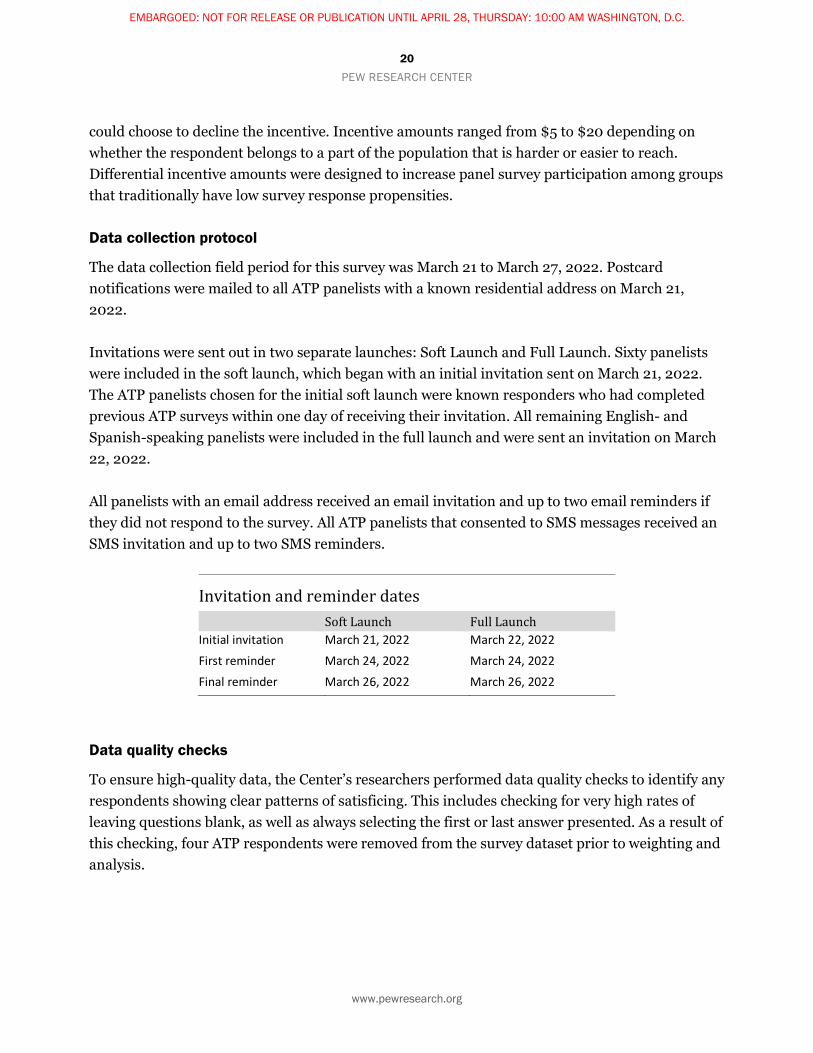
The data collection field period for this survey was March 21 to March 27, 2022. Postcard notifications were mailed to all ATP panelists with a known residential address on March 21, 2022.
Invitations were sent out in two separate launches: Soft Launch and Full Launch. Sixty panelists were included in the soft launch, which began with an initial invitation sent on March 21, 2022. The ATP panelists chosen for the initial soft launch were known responders who had completed previous ATP surveys within one day of receiving their invitation. All remaining English- and Spanish-speaking panelists were included in the full launch and were sent an invitation on March 22, 2022.
All panelists with an email address received an email invitation and up to two email reminders if they did not respond to the survey. All ATP panelists that consented to SMS messages received an SMS invitation and up to two SMS reminders.
Invitation and reminder dates
Soft Launch Full Launch Initial invitation March 21, 2022 March 22, 2022
First reminder March 24, 2022 March 24, 2022 Final reminder March 26, 2022 March 26, 2022
Data quality checks
To ensure high-quality data, the Center’s researchers performed data quality checks to identify any respondents showing clear patterns of satisficing. This includes checking for very high rates of leaving questions blank, as well as always selecting the first or last answer presented. As a result of this checking, four ATP respondents were removed from the survey dataset prior to weighting and analysis.
EMBARGOED: NOT FOR RELEASE OR PUBLICATION UNTIL APRIL 28, THURSDAY: 10:00 AM WASHINGTON, D.C.
21 PEW RESEARCH CENTER
www.pewresearch.org
Weighting
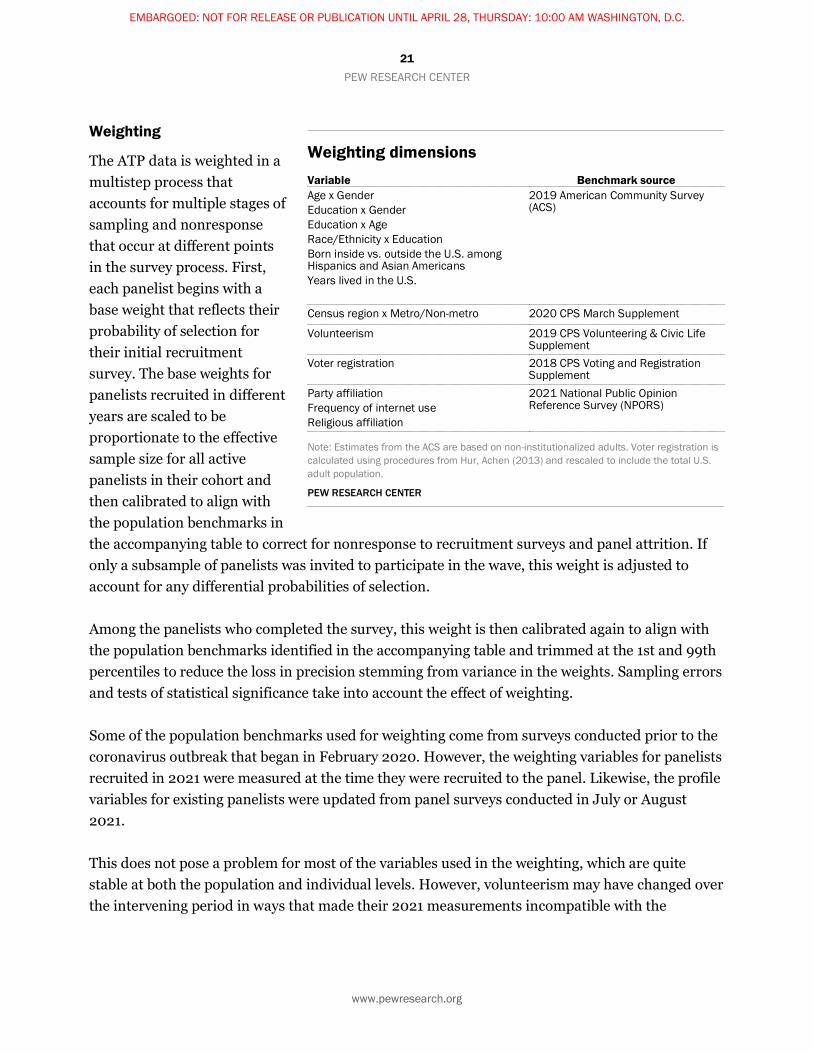
The ATP data is weighted in a multistep process that accounts for multiple stages of sampling and nonresponse that occur at different points in the survey process. First, each panelist begins with a base weight that reflects their probability of selection for their initial recruitment survey. The base weights for panelists recruited in different years are scaled to be proportionate to the effective sample size for all active panelists in their cohort and then calibrated to align with the population benchmarks in the accompanying table to correct for nonresponse to recruitment surveys and panel attrition. If only a subsample of panelists was invited to participate in the wave, this weight is adjusted to account for any differential probabilities of selection.
Among the panelists who completed the survey, this weight is then calibrated again to align with the population benchmarks identified in the accompanying table and trimmed at the 1st and 99th percentiles to reduce the loss in precision stemming from variance in the weights. Sampling errors and tests of statistical significance take into account the effect of weighting.
Some of the population benchmarks used for weighting come from surveys conducted prior to the coronavirus outbreak that began in February 2020. However, the weighting variables for panelists recruited in 2021 were measured at the time they were recruited to the panel. Likewise, the profile variables for existing panelists were updated from panel surveys conducted in July or August 2021.
This does not pose a problem for most of the variables used in the weighting, which are quite stable at both the population and individual levels. However, volunteerism may have changed over the intervening period in ways that made their 2021 measurements incompatible with the
Weighting dimensions Variable Benchmark source Age x Gender Education x Gender Education x Age Race/Ethnicity x Education Born inside vs. outside the U.S. among Hispanics and Asian Americans Years lived in the U.S.
2019 American Community Survey (ACS)
Census region x Metro/Non-metro 2020 CPS March Supplement
Volunteerism 2019 CPS Volunteering & Civic Life Supplement
Voter registration 2018 CPS Voting and Registration Supplement
Party affiliation Frequency of internet use Religious affiliation
2021 National Public Opinion Reference Survey (NPORS)
Note: Estimates from the ACS are based on non-institutionalized adults. Voter registration is calculated using procedures from Hur, Achen (2013) and rescaled to include the total U.S. adult population.
PEW RESEARCH CENTER
EMBARGOED: NOT FOR RELEASE OR PUBLICATION UNTIL APRIL 28, THURSDAY: 10:00 AM WASHINGTON, D.C.
22 PEW RESEARCH CENTER
www.pewresearch.org
available (pre-pandemic) benchmarks. To address this, volunteerism is weighted using the profile variables that were measured in 2020. For all other weighting dimensions, the more recent panelist measurements from 2021 are used.
For panelists recruited in 2021, plausible values were imputed using the 2020 volunteerism values from existing panelists with similar characteristics. This ensures that any patterns of change that were observed in the existing panelists were also reflected in the new recruits when the weighting was performed.
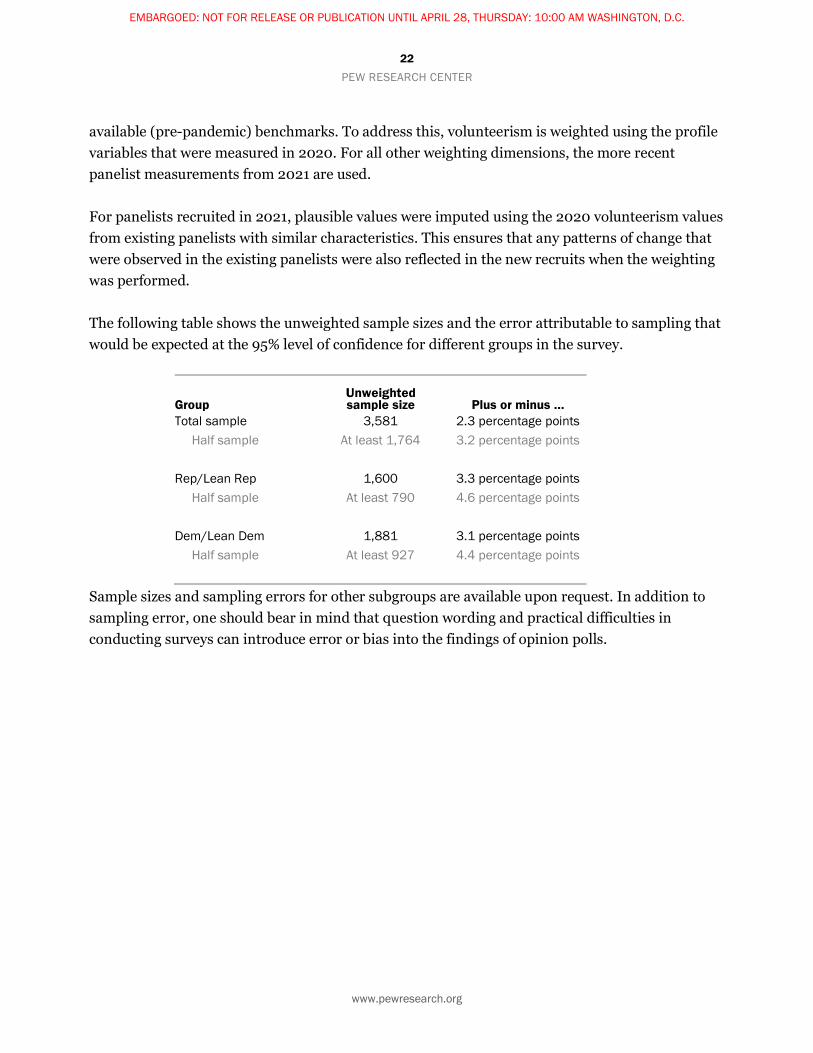
The following table shows the unweighted sample sizes and the error attributable to sampling that would be expected at the 95% level of confidence for different groups in the survey.
Group Unweighted sample size Plus or minus …
Total sample 3,581 2.3 percentage points Half sample At least 1,764 3.2 percentage points Rep/Lean Rep 1,600 3.3 percentage points Half sample At least 790 4.6 percentage points Dem/Lean Dem 1,881 3.1 percentage points Half sample At least 927 4.4 percentage points
Sample sizes and sampling errors for other subgroups are available upon request. In addition to sampling error, one should bear in mind that question wording and practical difficulties in conducting surveys can introduce error or bias into the findings of opinion polls.
EMBARGOED: NOT FOR RELEASE OR PUBLICATION UNTIL APRIL 28, THURSDAY: 10:00 AM WASHINGTON, D.C.
23 PEW RESEARCH CENTER
www.pewresearch.org
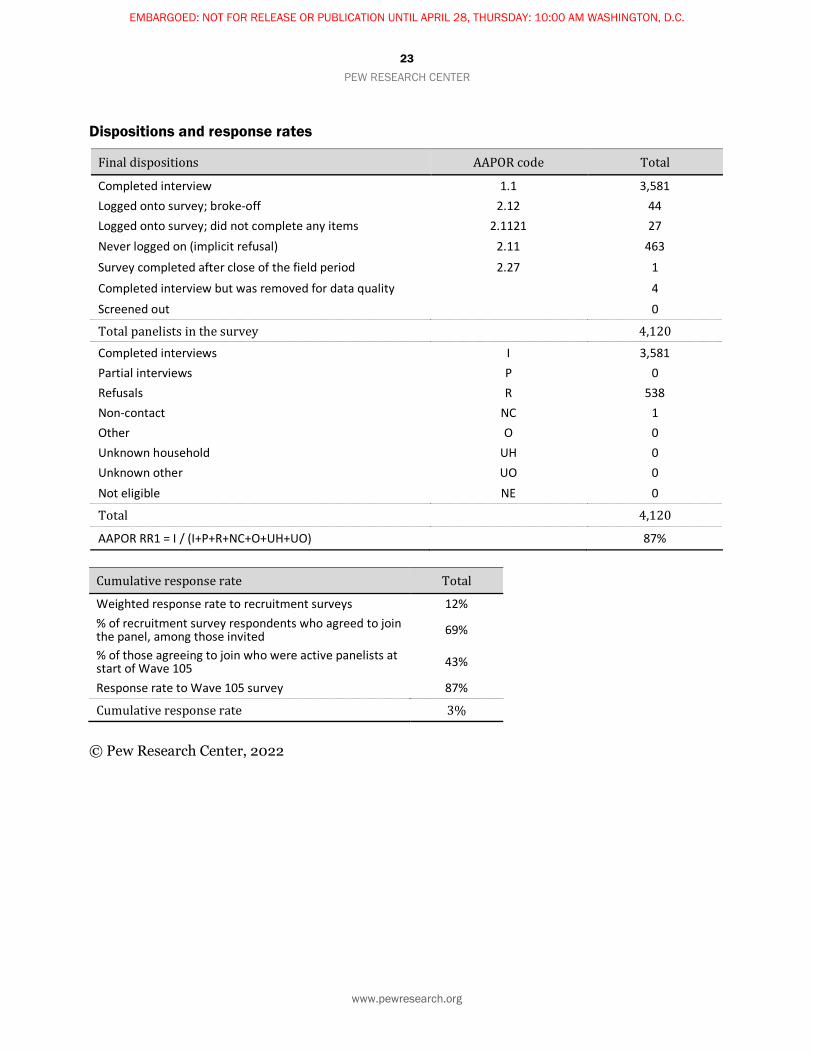
Dispositions and response rates
Final dispositions AAPOR code Total
Completed interview 1.1 3,581 Logged onto survey; broke-off 2.12 44 Logged onto survey; did not complete any items 2.1121 27 Never logged on (implicit refusal) 2.11 463
Survey completed after close of the field period 2.27 1 Completed interview but was removed for data quality 4 Screened out 0
Total panelists in the survey 4,120 Completed interviews I 3,581 Partial interviews P 0 Refusals R 538 Non-contact NC 1 Other O 0 Unknown household UH 0 Unknown other UO 0 Not eligible NE 0
Total 4,120
AAPOR RR1 = I / (I+P+R+NC+O+UH+UO) 87%
Cumulative response rate Total
Weighted response rate to recruitment surveys 12% % of recruitment survey respondents who agreed to join the panel, among those invited 69%
% of those agreeing to join who were active panelists at start of Wave 105 43%
Response rate to Wave 105 survey 87%
Cumulative response rate 3% © Pew Research Center, 2022
EMBARGOED: NOT FOR RELEASE OR PUBLICATION UNTIL APRIL 28, THURSDAY: 10:00 AM WASHINGTON, D.C.
24 PEW RESEARCH CENTER
www.pewresearch.org
Topline questionnaire Pew Research Center
Spring 2022 Global Attitudes Survey April 28, 2022 Release
Methodological notes:
• Survey results are based on national samples. For further details on sample designs, see Methodology section and our international survey methods database.
• Due to rounding, percentages may not total 100%. The topline “total” columns show 100%, because they are based on unrounded numbers.
• Since 2007, Pew Research Center has used an automated process to generate toplines for its Global Attitudes surveys. As a result, numbers may differ slightly from those published prior to 2007.
• The U.S. survey was conducted on Pew Research Center’s American Trends Panel. Many questions have been asked in previous surveys on the phone. Phone trends for comparison are provided in separate tables throughout the topline. The extent of the mode differences varies across questions; while there are negligible differences on some questions, others have more pronounced differences. Caution should be taken when evaluating online and phone estimates.
• Not all questions included in the Spring 2022 Global Attitudes Survey are presented in this topline. Omitted questions have either been previously released or will be released in future reports.
EMBARGOED: NOT FOR RELEASE OR PUBLICATION UNTIL APRIL 28, THURSDAY: 10:00 AM WASHINGTON, D.C.
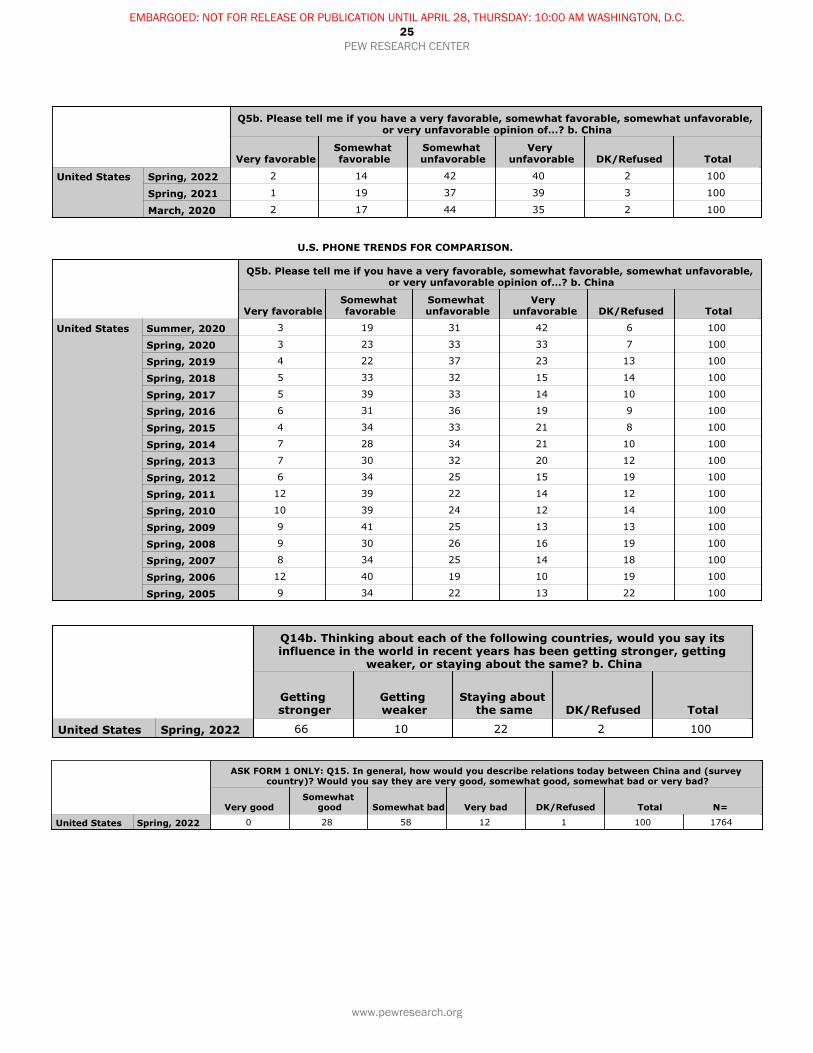
Q5b. Please tell me if you have a very favorable, somewhat favorable, somewhat unfavorable, or very unfavorable opinion of…? b. China
Very favorableSomewhat favorable
Somewhat unfavorable
Very unfavorable DK/Refused Total
United States Spring, 2022
Spring, 2021
March, 2020
2 14 42 40 2 100
1 19 37 39 3 100
2 17 44 35 2 100
U.S. PHONE TRENDS FOR COMPARISON.
Q5b. Please tell me if you have a very favorable, somewhat favorable, somewhat unfavorable, or very unfavorable opinion of…? b. China
Very favorableSomewhat favorable
Somewhat unfavorable
Very unfavorable DK/Refused Total
United States Summer, 2020
Spring, 2020
Spring, 2019
Spring, 2018
Spring, 2017
Spring, 2016
Spring, 2015
Spring, 2014
Spring, 2013
Spring, 2012
Spring, 2011
Spring, 2010
Spring, 2009
Spring, 2008
Spring, 2007
Spring, 2006
Spring, 2005
3 19 31 42 6 100
3 23 33 33 7 100
4 22 37 23 13 100
5 33 32 15 14 100
5 39 33 14 10 100
6 31 36 19 9 100
4 34 33 21 8 100
7 28 34 21 10 100
7 30 32 20 12 100
6 34 25 15 19 100
12 39 22 14 12 100
10 39 24 12 14 100
9 41 25 13 13 100
9 30 26 16 19 100
8 34 25 14 18 100
12 40 19 10 19 100
9 34 22 13 22 100
Q14b. Thinking about each of the following countries, would you say its influence in the world in recent years has been getting stronger, getting
weaker, or staying about the same? b. China
Getting stronger
Getting weaker
Staying about the same DK/Refused Total
United States Spring, 2022 66 10 22 2 100
ASK FORM 1 ONLY: Q15. In general, how would you describe relations today between China and (survey country)? Would you say they are very good, somewhat good, somewhat bad or very bad?
Very goodSomewhat
good Somewhat bad Very bad DK/Refused Total N=
United States Spring, 2022 0 28 58 12 1 100 1764
PEW RESEARCH CENTER
www.pewresearch.org
25EMBARGOED: NOT FOR RELEASE OR PUBLICATION UNTIL APRIL 28, THURSDAY: 10:00 AM WASHINGTON, D.C.
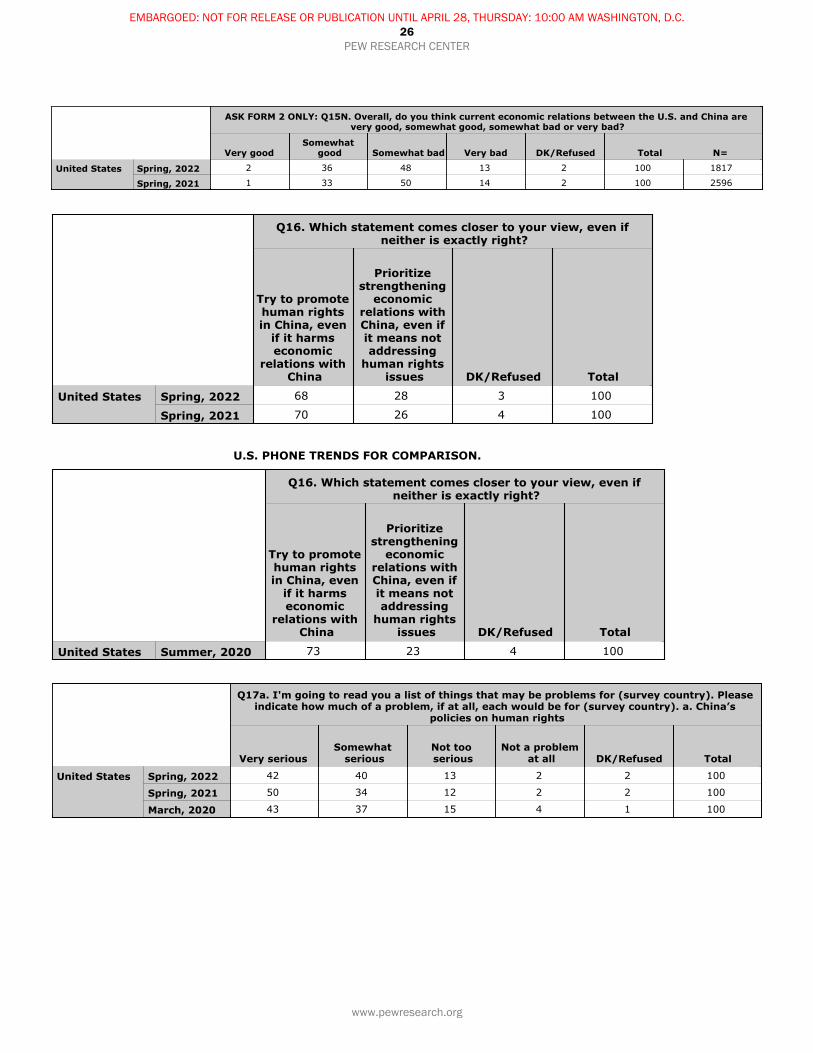
ASK FORM 2 ONLY: Q15N. Overall, do you think current economic relations between the U.S. and China are very good, somewhat good, somewhat bad or very bad?
Very goodSomewhat
good Somewhat bad Very bad DK/Refused Total N=
United States Spring, 2022
Spring, 2021
2 36 48 13 2 100 1817
1 33 50 14 2 100 2596
Q16. Which statement comes closer to your view, even if neither is exactly right?
Try to promote human rights in China, even
if it harms economic
relations with China
Prioritize strengthening
economic relations with China, even if it means not addressing
human rights issues DK/Refused Total
United States Spring, 2022
Spring, 2021
68 28 3 100
70 26 4 100
U.S. PHONE TRENDS FOR COMPARISON.
Q16. Which statement comes closer to your view, even if neither is exactly right?
Try to promote human rights in China, even
if it harms economic
relations with China
Prioritize strengthening
economic relations with China, even if it means not addressing
human rights issues DK/Refused Total
United States Summer, 2020 73 23 4 100
Q17a. I'm going to read you a list of things that may be problems for (survey country). Please indicate how much of a problem, if at all, each would be for (survey country). a. China’s
policies on human rights
Very seriousSomewhat
seriousNot too serious
Not a problem at all DK/Refused Total
United States Spring, 2022
Spring, 2021
March, 2020
42 40 13 2 2 100
50 34 12 2 2 100
43 37 15 4 1 100
PEW RESEARCH CENTER
www.pewresearch.org
26EMBARGOED: NOT FOR RELEASE OR PUBLICATION UNTIL APRIL 28, THURSDAY: 10:00 AM WASHINGTON, D.C.
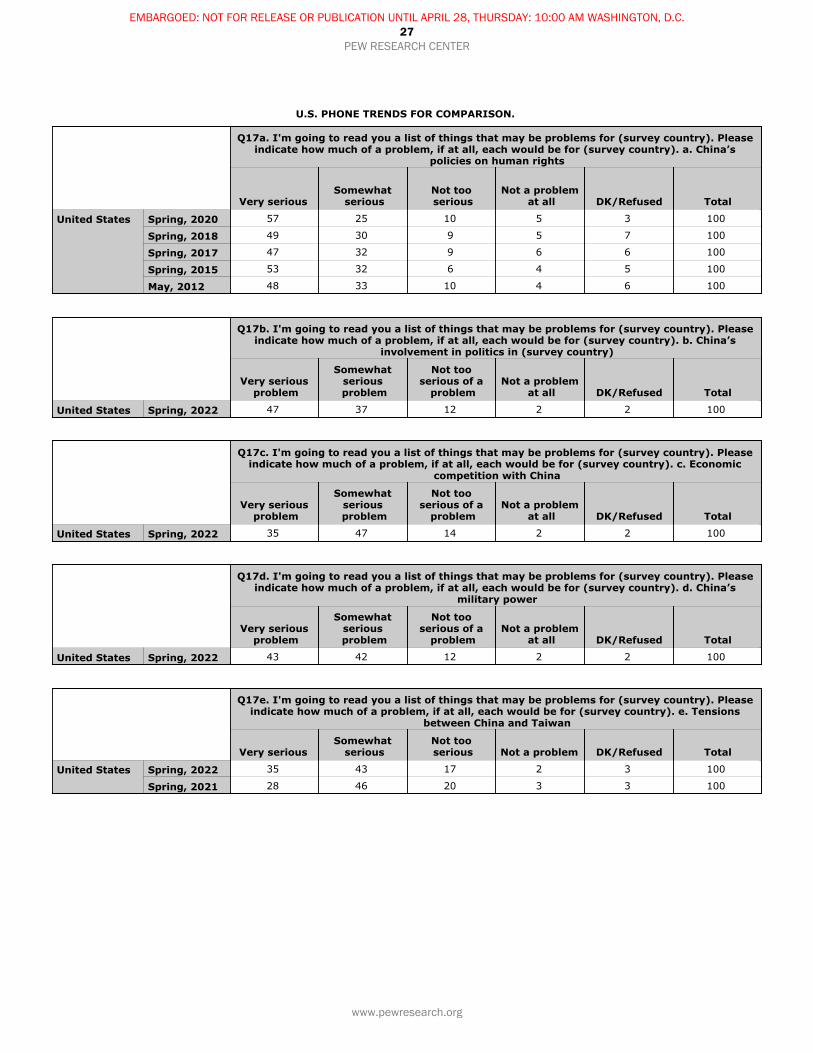
U.S. PHONE TRENDS FOR COMPARISON.
Q17a. I'm going to read you a list of things that may be problems for (survey country). Please indicate how much of a problem, if at all, each would be for (survey country). a. China’s
policies on human rights
Very seriousSomewhat
seriousNot too serious
Not a problem at all DK/Refused Total
United States Spring, 2020
Spring, 2018
Spring, 2017
Spring, 2015
May, 2012
57 25 10 5 3 100
49 30 9 5 7 100
47 32 9 6 6 100
53 32 6 4 5 100
48 33 10 4 6 100
Q17b. I'm going to read you a list of things that may be problems for (survey country). Please indicate how much of a problem, if at all, each would be for (survey country). b. China’s
involvement in politics in (survey country)
Very serious problem
Somewhat serious problem
Not too serious of a
problemNot a problem
at all DK/Refused Total
United States Spring, 2022 47 37 12 2 2 100
Q17c. I'm going to read you a list of things that may be problems for (survey country). Please indicate how much of a problem, if at all, each would be for (survey country). c. Economic
competition with China
Very serious problem
Somewhat serious problem
Not too serious of a
problemNot a problem
at all DK/Refused Total
United States Spring, 2022 35 47 14 2 2 100
Q17d. I'm going to read you a list of things that may be problems for (survey country). Please indicate how much of a problem, if at all, each would be for (survey country). d. China’s
military power
Very serious problem
Somewhat serious problem
Not too serious of a
problemNot a problem
at all DK/Refused Total
United States Spring, 2022 43 42 12 2 2 100
Q17e. I'm going to read you a list of things that may be problems for (survey country). Please indicate how much of a problem, if at all, each would be for (survey country). e. Tensions
between China and Taiwan
Very seriousSomewhat
seriousNot too serious Not a problem DK/Refused Total
United States Spring, 2022
Spring, 2021
35 43 17 2 3 100
28 46 20 3 3 100
PEW RESEARCH CENTER
www.pewresearch.org
27EMBARGOED: NOT FOR RELEASE OR PUBLICATION UNTIL APRIL 28, THURSDAY: 10:00 AM WASHINGTON, D.C.
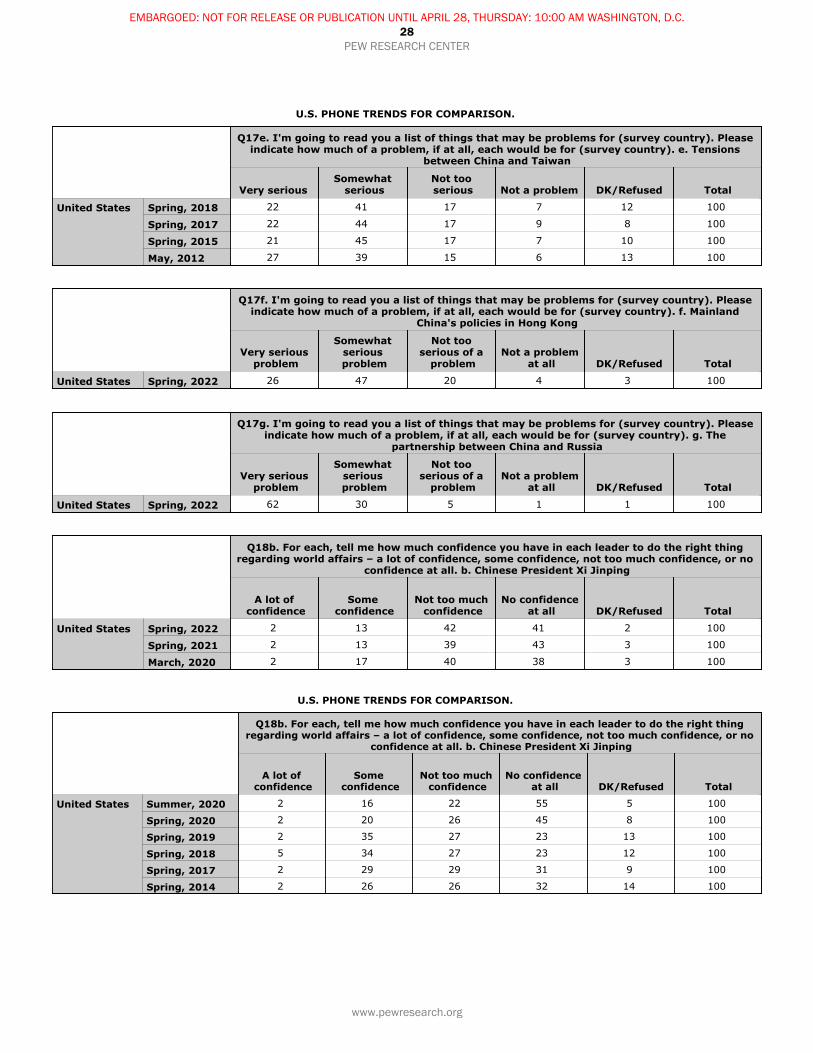
U.S. PHONE TRENDS FOR COMPARISON.
Q17e. I'm going to read you a list of things that may be problems for (survey country). Please indicate how much of a problem, if at all, each would be for (survey country). e. Tensions
between China and Taiwan
Very seriousSomewhat
seriousNot too serious Not a problem DK/Refused Total
United States Spring, 2018
Spring, 2017
Spring, 2015
May, 2012
22 41 17 7 12 100
22 44 17 9 8 100
21 45 17 7 10 100
27 39 15 6 13 100
Q17f. I'm going to read you a list of things that may be problems for (survey country). Please indicate how much of a problem, if at all, each would be for (survey country). f. Mainland
China's policies in Hong Kong
Very serious problem
Somewhat serious problem
Not too serious of a
problemNot a problem
at all DK/Refused Total
United States Spring, 2022 26 47 20 4 3 100
Q17g. I'm going to read you a list of things that may be problems for (survey country). Please indicate how much of a problem, if at all, each would be for (survey country). g. The
partnership between China and Russia
Very serious problem
Somewhat serious problem
Not too serious of a
problemNot a problem
at all DK/Refused Total
United States Spring, 2022 62 30 5 1 1 100
Q18b. For each, tell me how much confidence you have in each leader to do the right thing regarding world affairs – a lot of confidence, some confidence, not too much confidence, or no
confidence at all. b. Chinese President Xi Jinping
A lot of confidence
Some confidence
Not too much confidence
No confidence at all DK/Refused Total
United States Spring, 2022
Spring, 2021
March, 2020
2 13 42 41 2 100
2 13 39 43 3 100
2 17 40 38 3 100
U.S. PHONE TRENDS FOR COMPARISON.
Q18b. For each, tell me how much confidence you have in each leader to do the right thing regarding world affairs – a lot of confidence, some confidence, not too much confidence, or no
confidence at all. b. Chinese President Xi Jinping
A lot of confidence
Some confidence
Not too much confidence
No confidence at all DK/Refused Total
United States Summer, 2020
Spring, 2020
Spring, 2019
Spring, 2018
Spring, 2017
Spring, 2014
2 16 22 55 5 100
2 20 26 45 8 100
2 35 27 23 13 100
5 34 27 23 12 100
2 29 29 31 9 100
2 26 26 32 14 100
PEW RESEARCH CENTER
www.pewresearch.org
28EMBARGOED: NOT FOR RELEASE OR PUBLICATION UNTIL APRIL 28, THURSDAY: 10:00 AM WASHINGTON, D.C.
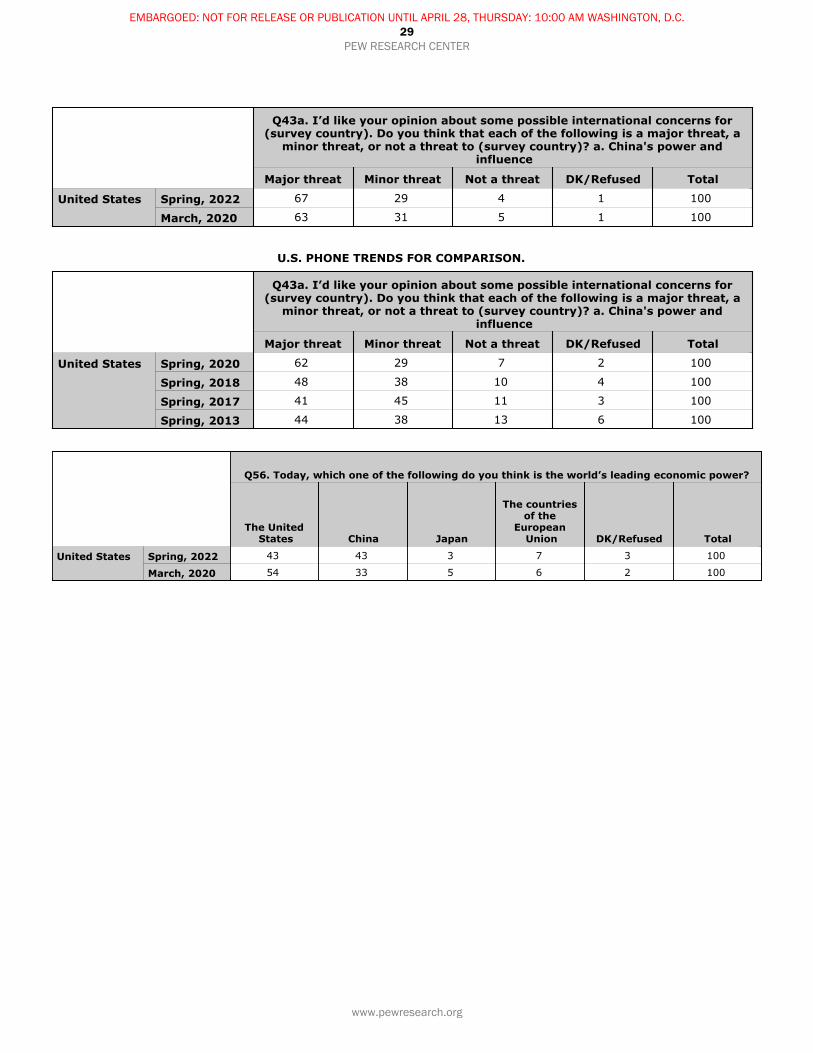
Q43a. I’d like your opinion about some possible international concerns for (survey country). Do you think that each of the following is a major threat, a
minor threat, or not a threat to (survey country)? a. China's power and influence
Major threat Minor threat Not a threat DK/Refused Total
United States Spring, 2022
March, 2020
67 29 4 1 100
63 31 5 1 100
U.S. PHONE TRENDS FOR COMPARISON.
Q43a. I’d like your opinion about some possible international concerns for (survey country). Do you think that each of the following is a major threat, a
minor threat, or not a threat to (survey country)? a. China's power and influence
Major threat Minor threat Not a threat DK/Refused Total
United States Spring, 2020Spring, 2018
Spring, 2017Spring, 2013
62 29 7 2 100
48 38 10 4 100
41 45 11 3 100
44 38 13 6 100
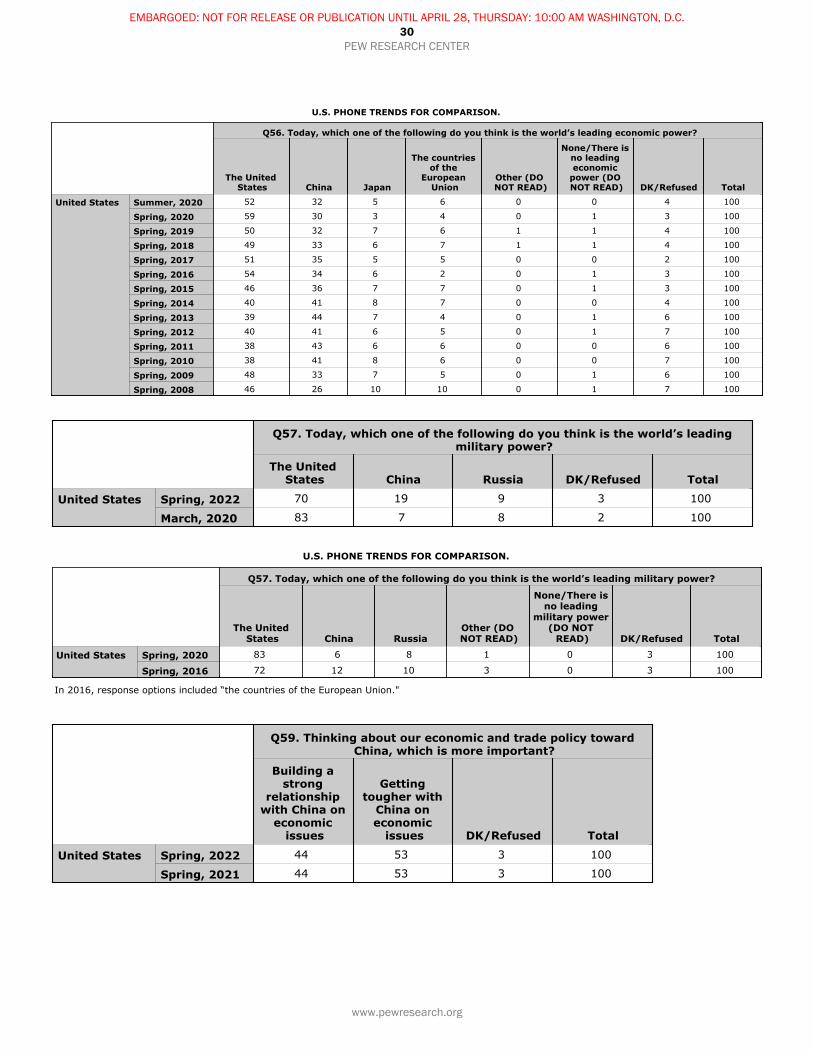
Q56. Today, which one of the following do you think is the world’s leading economic power?
The United States China Japan
The countries of the
European Union DK/Refused Total
United States Spring, 2022
March, 2020
43 43 3 7 3 100
54 33 5 6 2 100
PEW RESEARCH CENTER
www.pewresearch.org
29EMBARGOED: NOT FOR RELEASE OR PUBLICATION UNTIL APRIL 28, THURSDAY: 10:00 AM WASHINGTON, D.C.
U.S. PHONE TRENDS FOR COMPARISON.
Q56. Today, which one of the following do you think is the world’s leading economic power?
The United States China Japan
The countries of the
European Union
Other (DO NOT READ)
None/There is no leading economic
power (DO NOT READ) DK/Refused Total
United States Summer, 2020
Spring, 2020Spring, 2019
Spring, 2018Spring, 2017
Spring, 2016Spring, 2015
Spring, 2014
Spring, 2013Spring, 2012
Spring, 2011Spring, 2010
Spring, 2009Spring, 2008
52 32 5 6 0 0 4 100
59 30 3 4 0 1 3 100
50 32 7 6 1 1 4 100
49 33 6 7 1 1 4 100
51 35 5 5 0 0 2 100
54 34 6 2 0 1 3 100
46 36 7 7 0 1 3 100
40 41 8 7 0 0 4 100
39 44 7 4 0 1 6 100
40 41 6 5 0 1 7 100
38 43 6 6 0 0 6 100
38 41 8 6 0 0 7 100
48 33 7 5 0 1 6 100
46 26 10 10 0 1 7 100
Q57. Today, which one of the following do you think is the world’s leading military power?
The United States China Russia DK/Refused Total
United States Spring, 2022March, 2020
70 19 9 3 100
83 7 8 2 100
U.S. PHONE TRENDS FOR COMPARISON.
Q57. Today, which one of the following do you think is the world’s leading military power?
The United States China Russia
Other (DO NOT READ)
None/There is no leading
military power (DO NOT
READ) DK/Refused Total
United States Spring, 2020
Spring, 2016
83 6 8 1 0 3 100
72 12 10 3 0 3 100
In 2016, response options included “the countries of the European Union."
Q59. Thinking about our economic and trade policy toward China, which is more important?
Building a strong
relationship with China on
economic issues
Getting tougher with
China on economic
issues DK/Refused Total
United States Spring, 2022
Spring, 2021
44 53 3 100
44 53 3 100
PEW RESEARCH CENTER
www.pewresearch.org
30EMBARGOED: NOT FOR RELEASE OR PUBLICATION UNTIL APRIL 28, THURSDAY: 10:00 AM WASHINGTON, D.C.
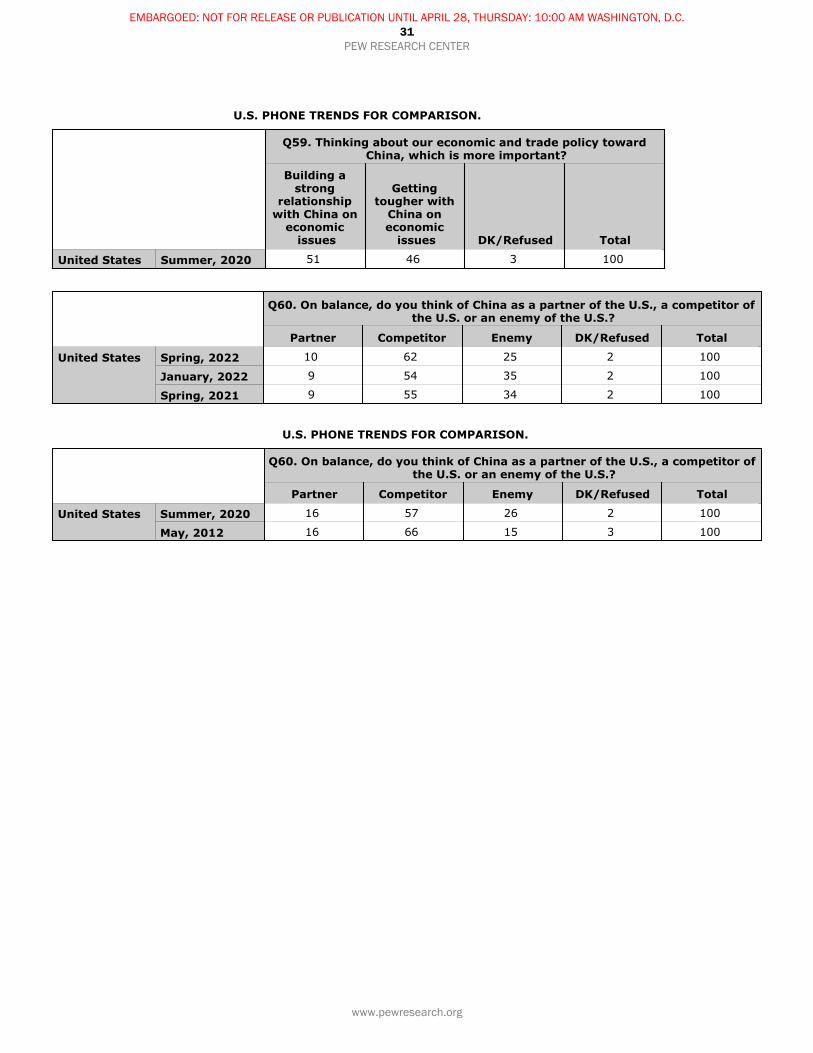
U.S. PHONE TRENDS FOR COMPARISON.
Q59. Thinking about our economic and trade policy toward China, which is more important?
Building a strong
relationship with China on
economic issues
Getting tougher with
China on economic
issues DK/Refused Total
United States Summer, 2020 51 46 3 100
Q60. On balance, do you think of China as a partner of the U.S., a competitor of the U.S. or an enemy of the U.S.?
Partner Competitor Enemy DK/Refused Total
United States Spring, 2022
January, 2022
Spring, 2021
10 62 25 2 100
9 54 35 2 100
9 55 34 2 100
U.S. PHONE TRENDS FOR COMPARISON.
Q60. On balance, do you think of China as a partner of the U.S., a competitor of the U.S. or an enemy of the U.S.?
Partner Competitor Enemy DK/Refused Total
United States Summer, 2020
May, 2012
16 57 26 2 100
16 66 15 3 100
PEW RESEARCH CENTER
www.pewresearch.org
31EMBARGOED: NOT FOR RELEASE OR PUBLICATION UNTIL APRIL 28, THURSDAY: 10:00 AM WASHINGTON, D.C.
Related Documents