China’s Outbound China’s Outbound Tourism Market Tourism Market

Welcome message from author
This document is posted to help you gain knowledge. Please leave a comment to let me know what you think about it! Share it to your friends and learn new things together.
Transcript

China’s Outbound China’s Outbound
Tourism MarketTourism Market
China’s Outbound China’s Outbound
Tourism MarketTourism Market

China Outbound Tourism DChina Outbound Tourism Developmentevelopment
China Outbound Tourism DChina Outbound Tourism Developmentevelopment
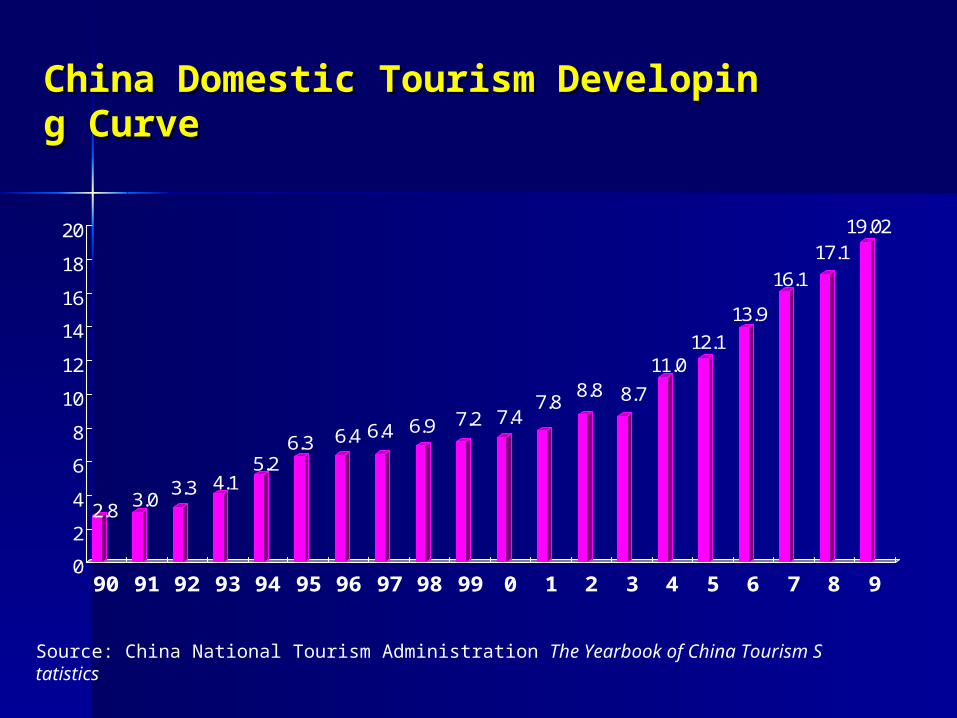
2.83.0
3.3 4.15.2
6.3 6.4 6.4 6.9 7.2 7.47.8
8.8 8.7
11.012.1
13.9
16.1
17.119.02
0
2
4
6
8
10
12
14
16
18
20
90 91 92 93 94 95 96 97 98 99 0 1 2 3 4 5 6 7 8 9
China Domestic Tourism Developing CuChina Domestic Tourism Developing Curverve
Source: China National Tourism Administration The Yearbook of China Tourism Statistics
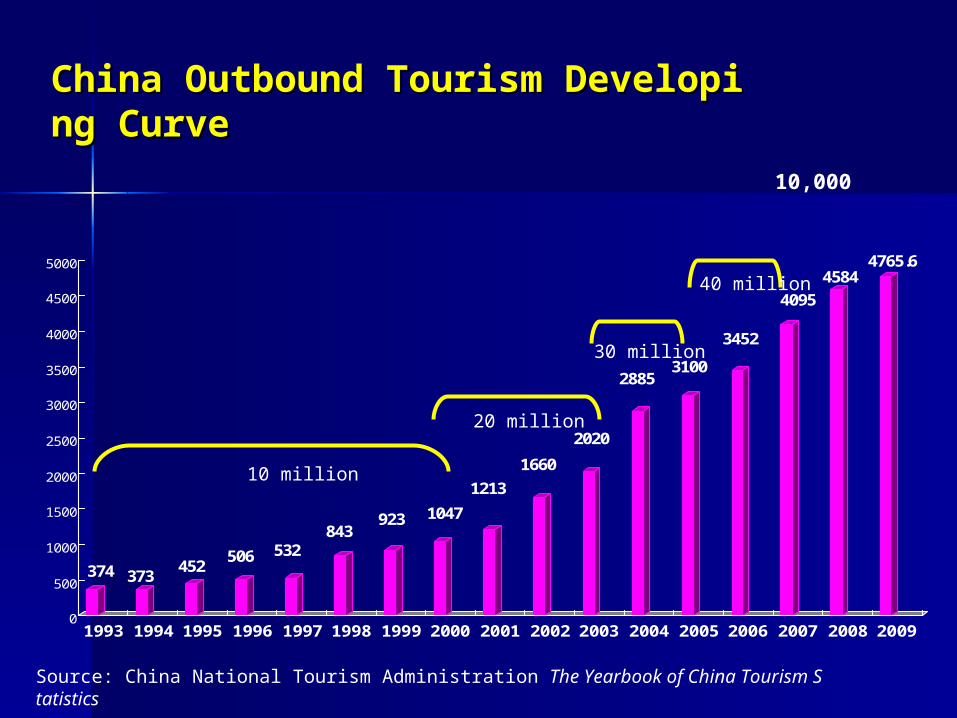
374 373452
506 532843
923 1047
1213
1660
2020
28853100
3452
4095
45844765.6
0
500
1000
1500
2000
2500
3000
3500
4000
4500
5000
1993 1994 1995 1996 1997 1998 1999 2000 2001 2002 2003 2004 2005 2006 2007 2008 2009
China Outbound Tourism Developing CChina Outbound Tourism Developing Curveurve
10,000
Source: China National Tourism Administration The Yearbook of China Tourism Statistics
10 million
20 million
30 million
40 million
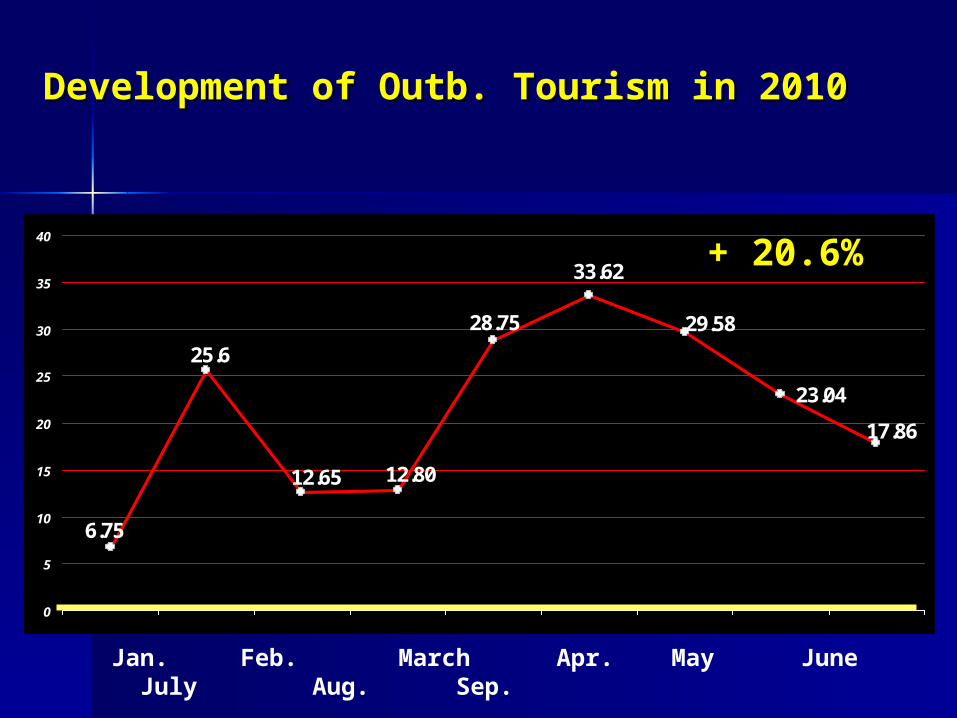
23.04
28.75
33.62
29.58
17.86
12.8012.65
6.75
25.6
0
5
10
15
20
25
30
35
40
Development of Outb. Tourism in 2010 Development of Outb. Tourism in 2010
Jan. Feb. March Apr. May June July Aug. Sep.
++ 20.6%20.6%

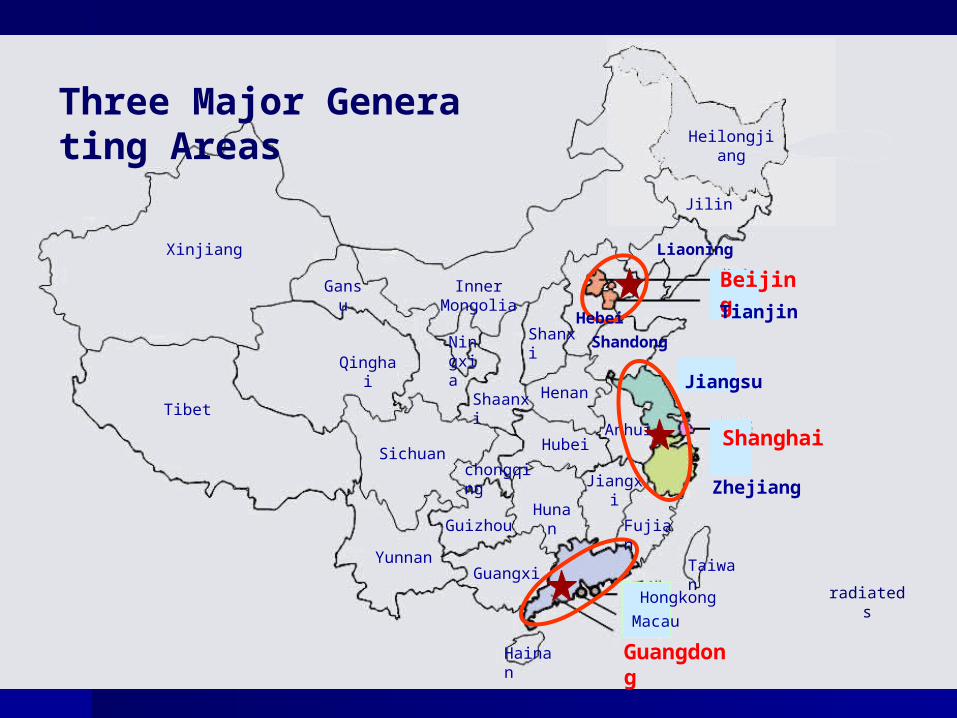
Major Generating AreasMajor Generating Areas
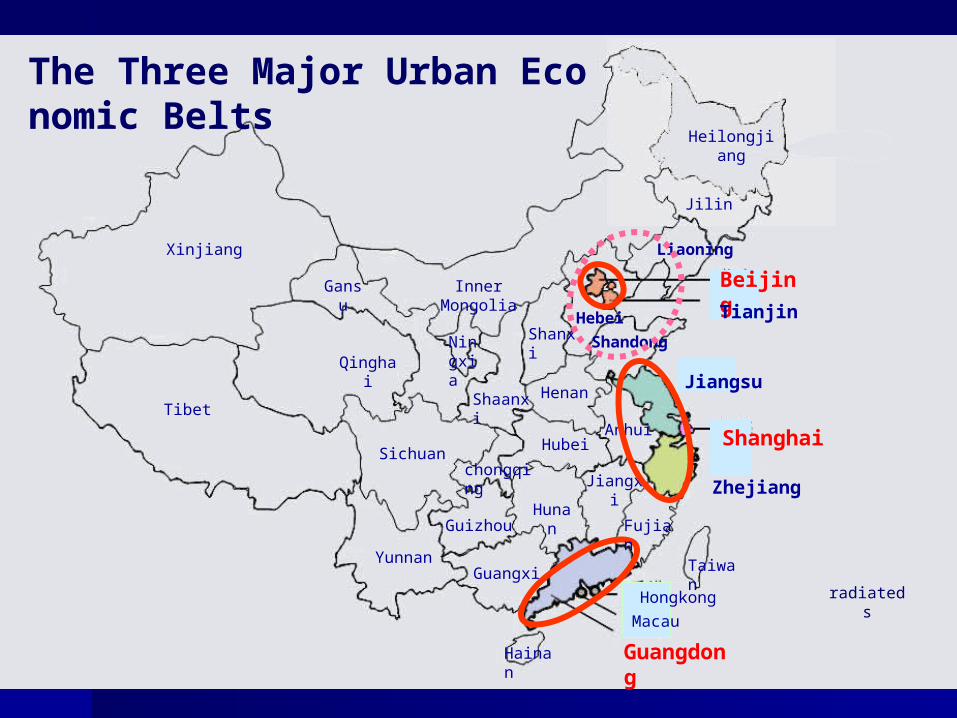
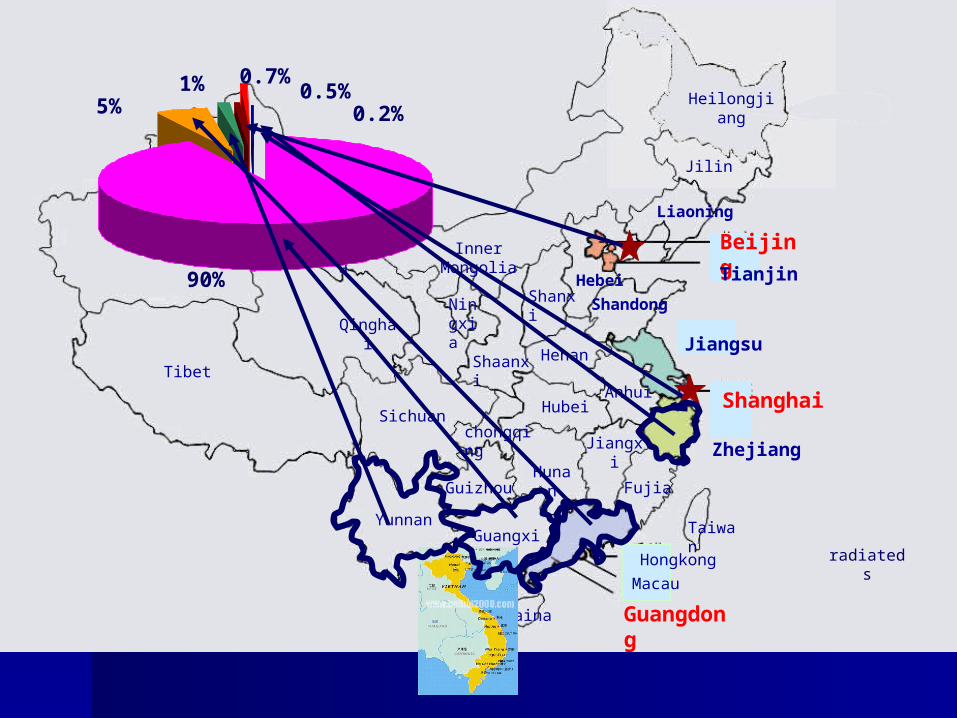
Xinjiang
Qinghai
Gansu
Tibet
Sichuan
Yunnan
Guizhou
Hubei
Hunan
Inner Mongolia
Heilongjiang
Jilin
Liaoning
Shandong
Henan
Anhui
Guangxi
Jiangxi
Hainan
Ningxia
Shaanxi
Shanxi
chongqing
Fujian
Guangdong
Hongkong
Macau
Taiwan
Jiangsu
Beijing
Tianjin
Shanghai
Zhejiang
Hebei
radiateds
The Three Major Urban Economic Belts
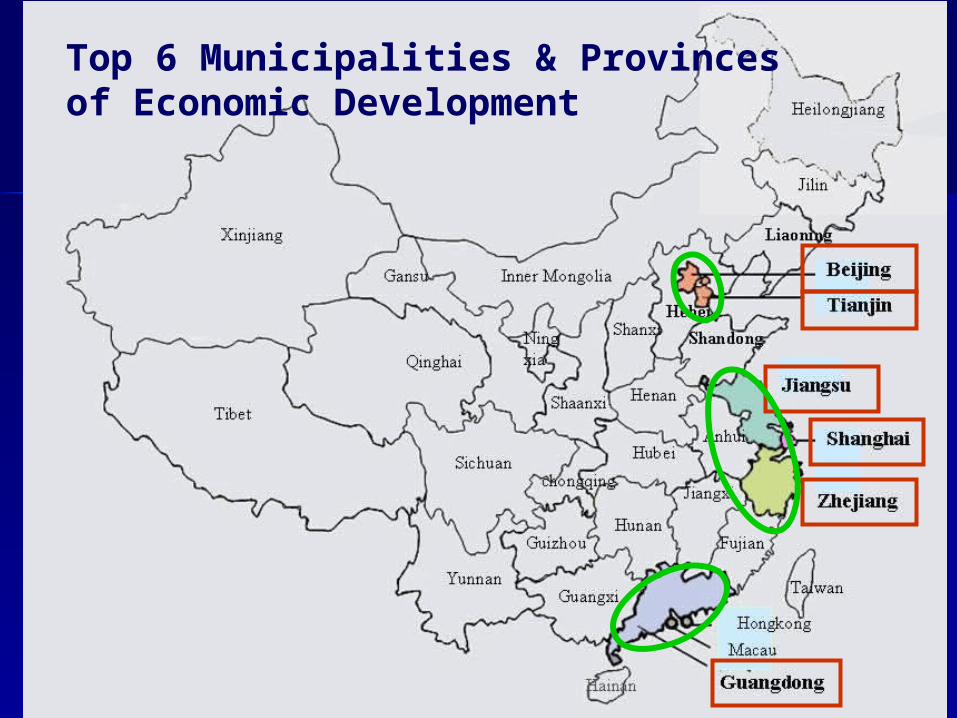
Top 6 Municipalities & Provinces of Economic Development
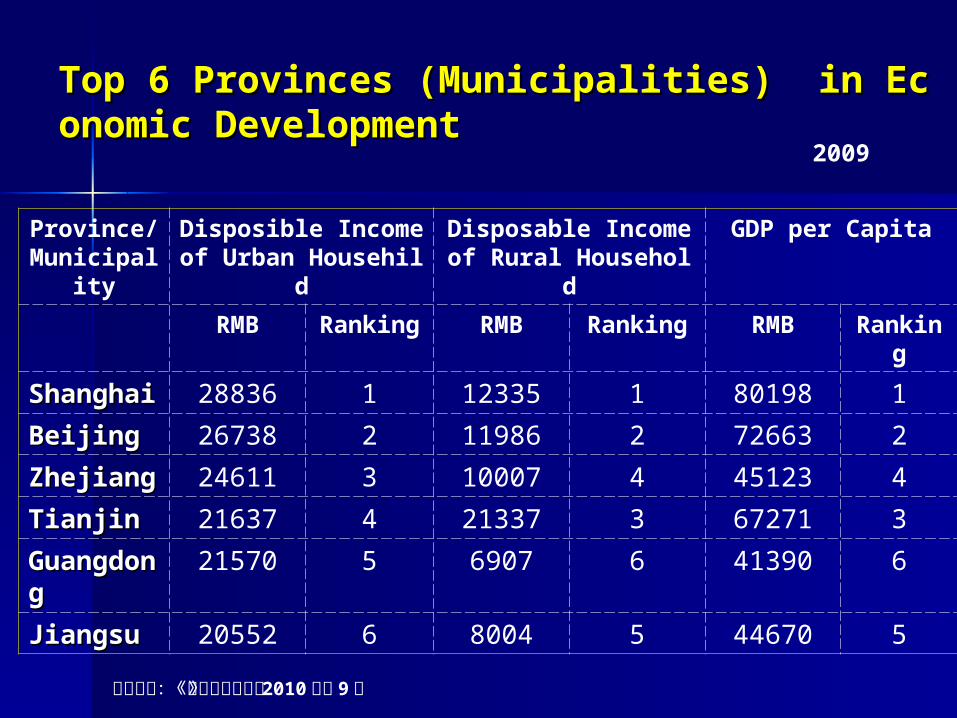
Top 6 Provinces (Municipalities) in Economic DeTop 6 Provinces (Municipalities) in Economic Developmentvelopment
Province/Municipality
Disposible Income of Urban Househild
Disposable Income of Rural Household
GDP per Capita
RMB Ranking RMB Ranking RMB RankingShanghaiShanghai 28836 1 12335 1 80198 1
BeijingBeijing 26738 2 11986 2 72663 2
ZhejiangZhejiang 24611 3 10007 4 45123 4
TianjinTianjin 21637 4 21337 3 67271 3
GuangdoGuangdongng
21570 5 6907 6 41390 6
JiangsuJiangsu 20552 6 8004 5 44670 5
资料来源:《中国经济周刊》 2010年第 9期
2009
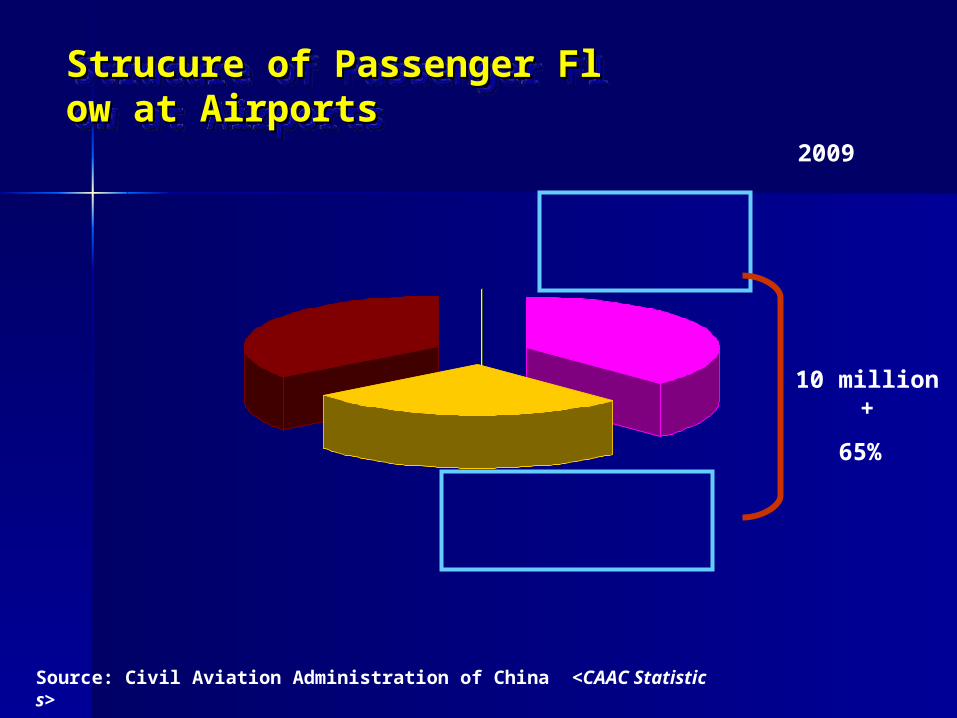
Strucure of Passenger Flow at Strucure of Passenger Flow at AirportsAirportsStrucure of Passenger Flow at Strucure of Passenger Flow at AirportsAirports
2009
Top 5 ai rports37.9%
No.6-No.14ai rports26.8%
The rest 0f 148ai rports35.3%
10 million +
65%
Source: Civil Aviation Administration of China < CAAC Statistics>
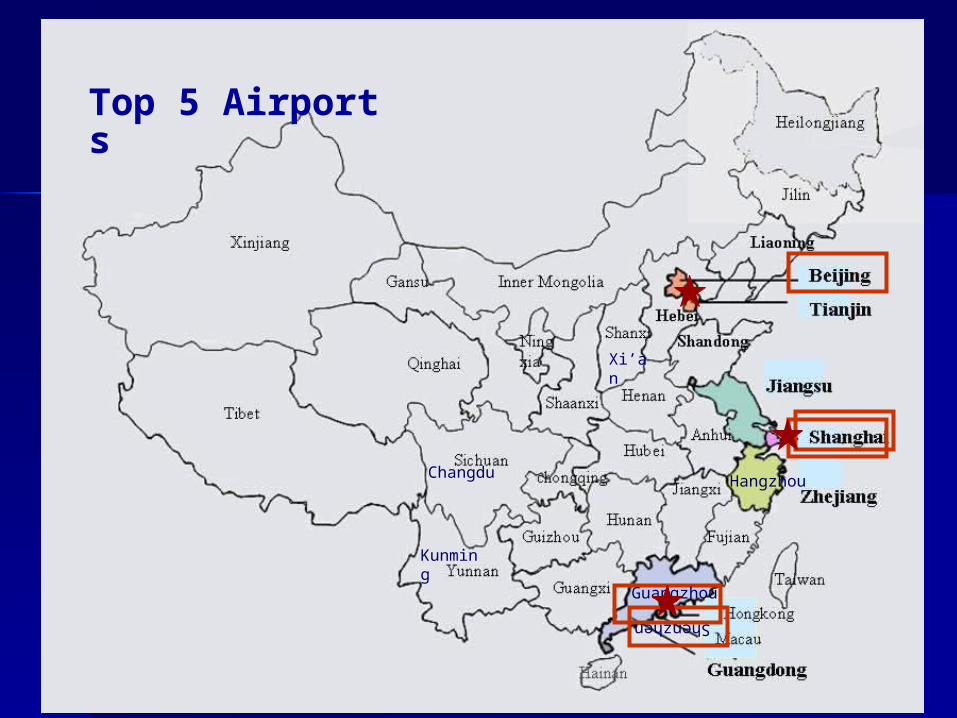
Top 5 Airports
Xi’an
Hangzhou
Kunming
Changdu
Guangzhou
Shenzhen
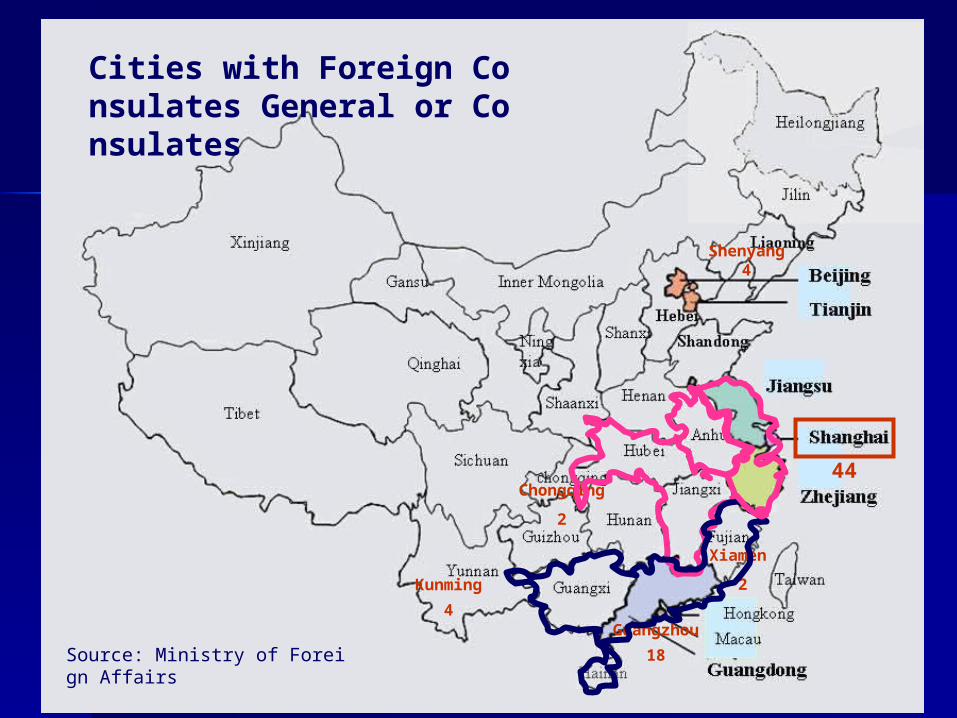
44
Guangzhou18
Shenyang 4
Kunming4
Cities with Foreign Consulates General or Consulates
Source: Ministry of Foreign Affairs
Xiamen
2
Chongqing
2
Xinjiang
Qinghai
Gansu
Tibet
Sichuan
Yunnan
Guizhou
Hubei
Hunan
Inner Mongolia
Heilongjiang
Jilin
Liaoning
Shandong
Henan
Anhui
Guangxi
Jiangxi
Hainan
Ningxia
Shaanxi
Shanxi
chongqing
Fujian
Guangdong
Hongkong
Macau
Taiwan
Jiangsu
Beijing
Tianjin
Shanghai
Zhejiang
Hebei
radiateds
Three Major Generating Areas

Segmentation of Outbound Passengers

· Senior citizens
· Senior citizens
· Wage earners
· White collars
· The rich people

Main Direction Of Outb. Travel Flow
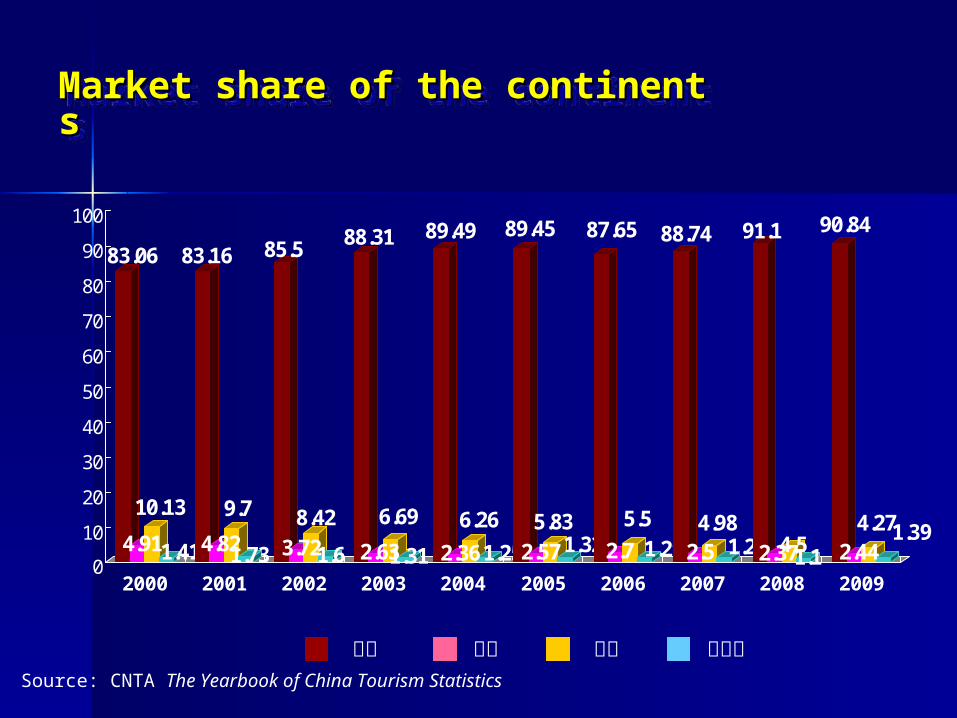
83.06
4.91
10.13
1.41
83.16
4.82
9.7
1.73
85.5
3.72
8.42
1.6
88.31
2.63
6.69
1.31
89.49
2.36
6.26
1.25
89.45
2.57
5.831.32
87.65
2.7
5.5
1.29
88.74
2.54.98
1.21
91.1
2.374.51.1
90.84
2.444.271.39
0
10
20
30
40
50
60
70
80
90
100
2000 2001 2002 2003 2004 2005 2006 2007 2008 2009
亚洲 欧洲美洲 大洋洲
Market share of the continentsMarket share of the continentsMarket share of the continentsMarket share of the continents
Source: CNTA The Yearbook of China Tourism Statistics
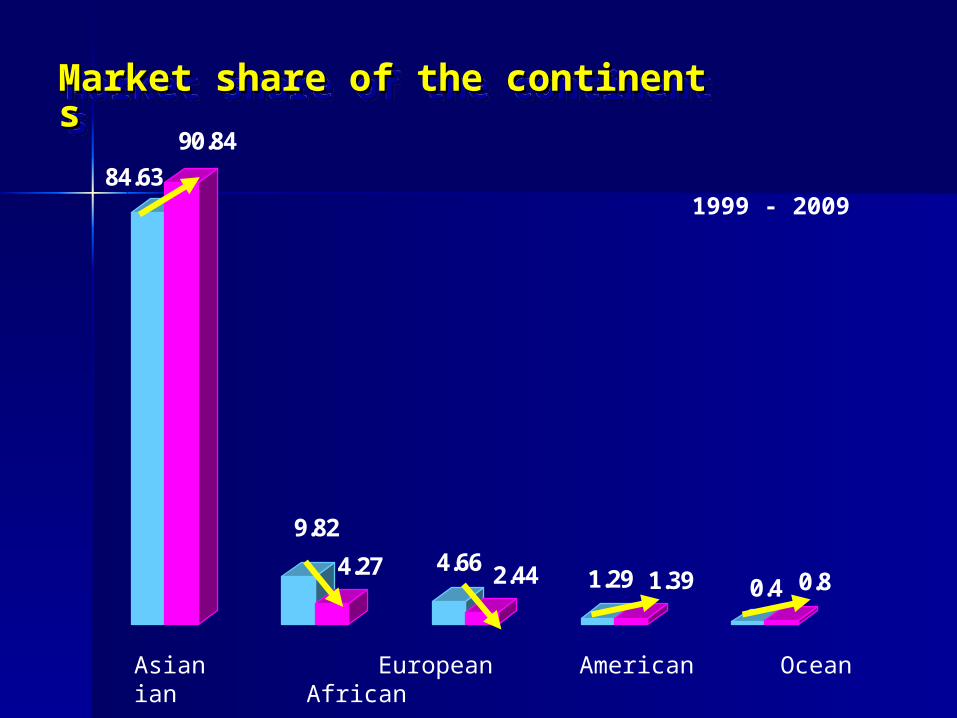
84.63
90.84
9.82
4.27 4.66 2.44 1.29 1.39 0.4 0.8
Asian European American Oceanian African
Market share of the continentsMarket share of the continentsMarket share of the continentsMarket share of the continents
1999 - 2009
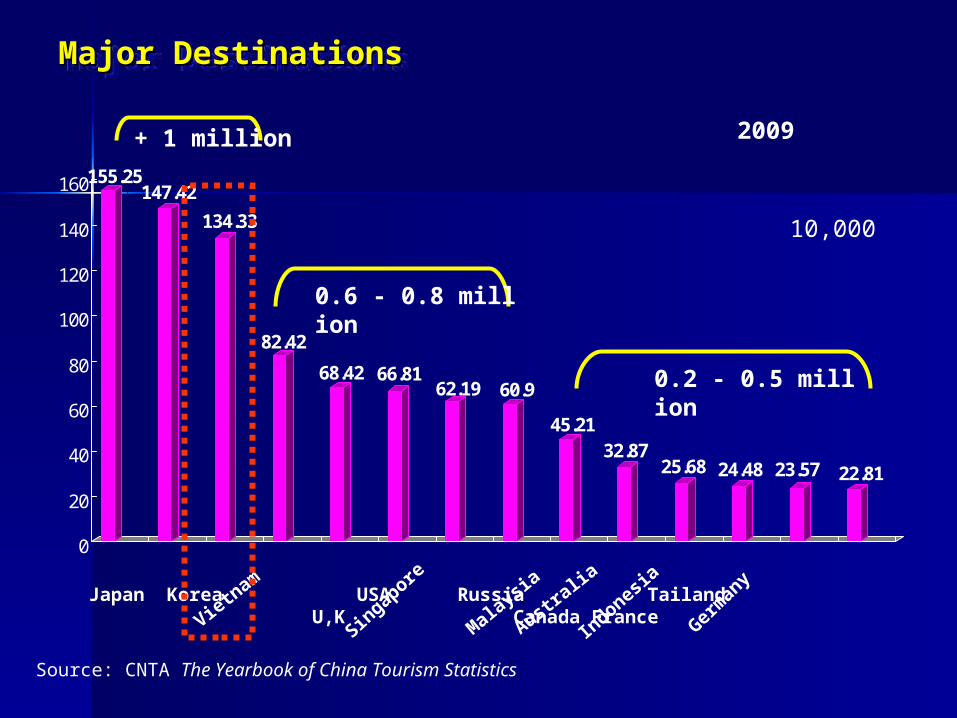
Major DestinationsMajor DestinationsMajor DestinationsMajor Destinations
2009
Source: CNTA The Yearbook of China Tourism Statistics
Japan Korea USA Russia Tailand U,K Canada France
155.25147.42
134.33
82.42
68.42 66.8162.19 60.9
45.2132.87
25.68 24.48 23.57 22.81
0
20
40
60
80
100
120
140
160
10,000
Singa
pore
Austr
alia
Indones
ia
Viet
nam
Malaysia
Germ
any
+ 1 million
0.6 - 0.8 million
0.2 - 0.5 million
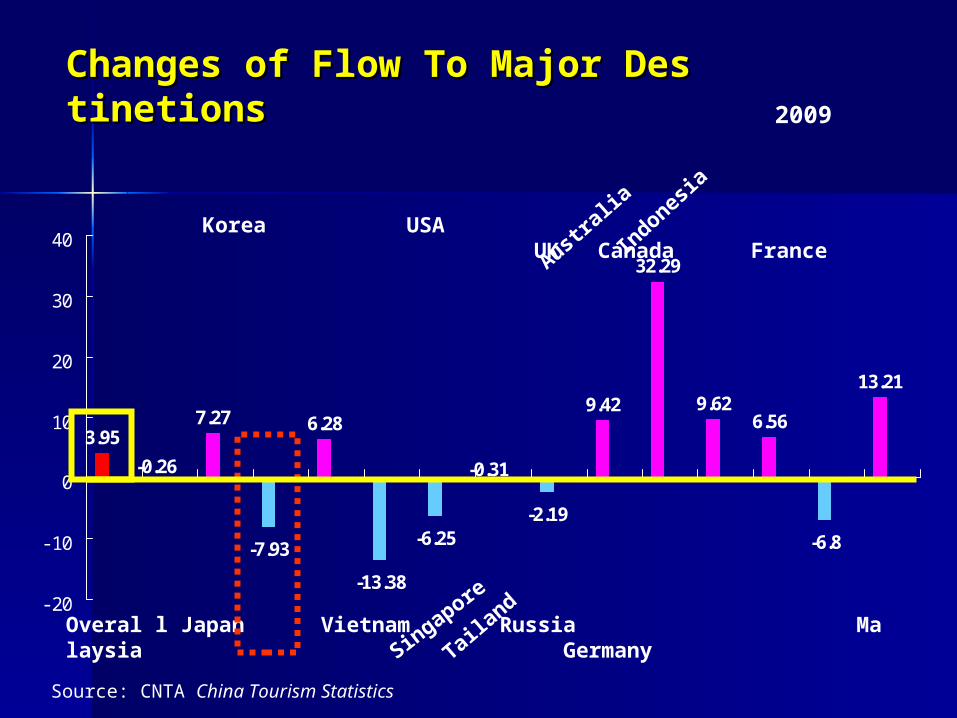
3.957.27
-7.93
6.28
-13.38
-6.25-2.19
9.42
32.29
9.626.56
-6.8
13.21
-0.31-0.26
- 20
- 10
0
10
20
30
40
Overal l Japan Vietnam Russia Malaysia Germany
Korea USA UK Canada France
Changes of Flow To Major DestineChanges of Flow To Major Destinetions tions
Source: CNTA China Tourism Statistics
2009
Tailand
Singapore
Australia
Indon
esia

Chinese Visitors to Vietnam
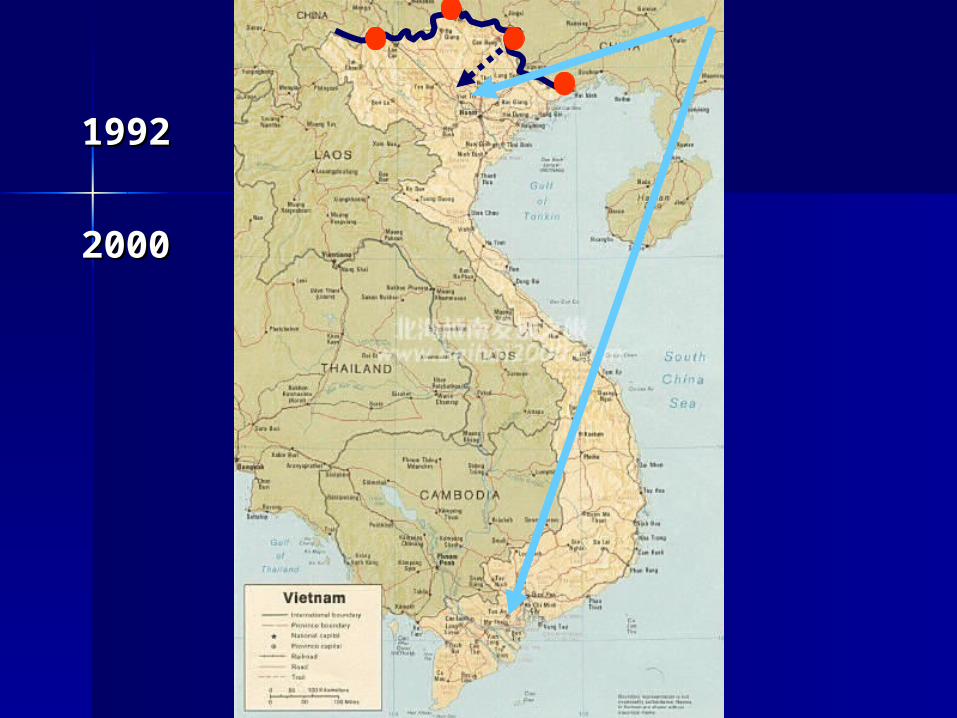
19921992
20002000
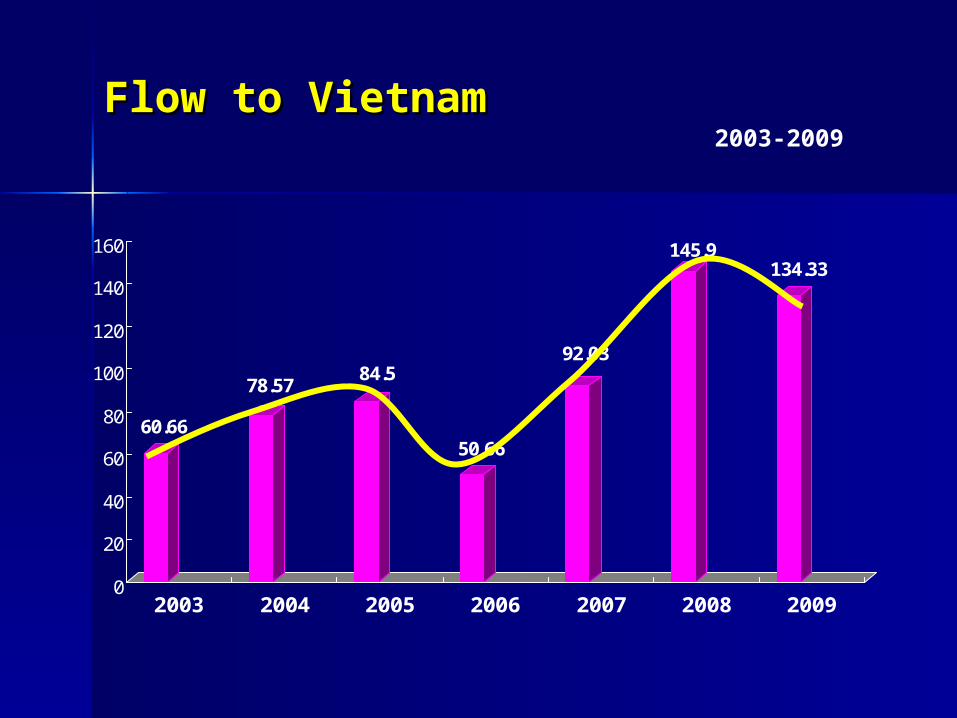
60.66
78.5784.5
50.66
92.03
145.9134.33
0
20
40
60
80
100
120
140
160
2003 2004 2005 2006 2007 2008 2009
Flow to VietnamFlow to Vietnam2003-2009
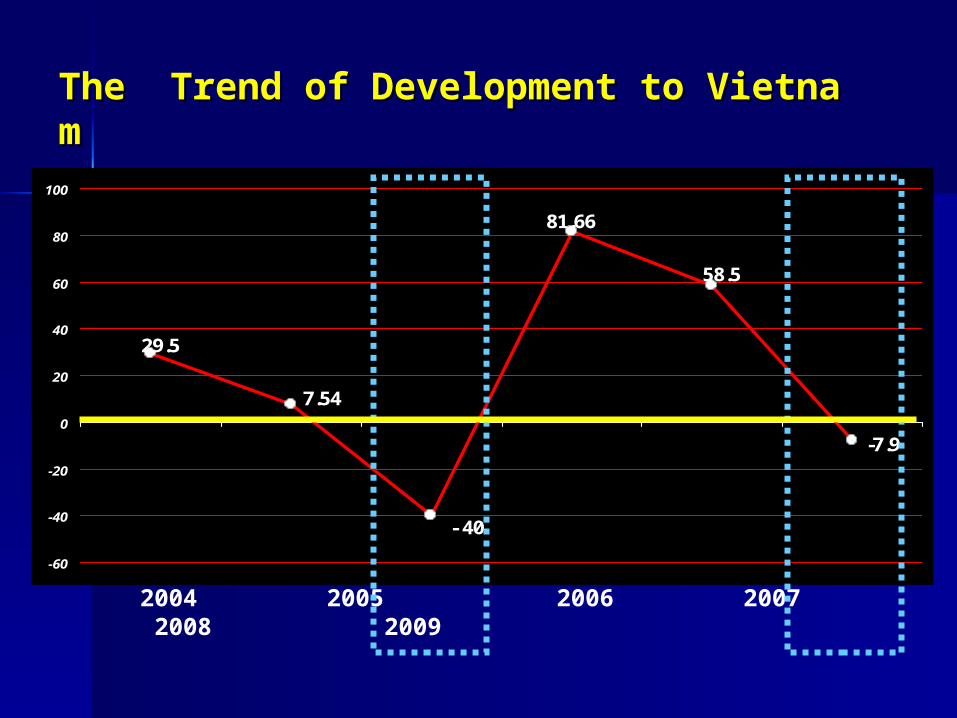
-7.9
58.5
81.66
29.5
7.54
- 40
-60
-40
-20
0
20
40
60
80
100
2004 2005 2006 2007 2008 2009
The Trend of Development to VietnamThe Trend of Development to Vietnam
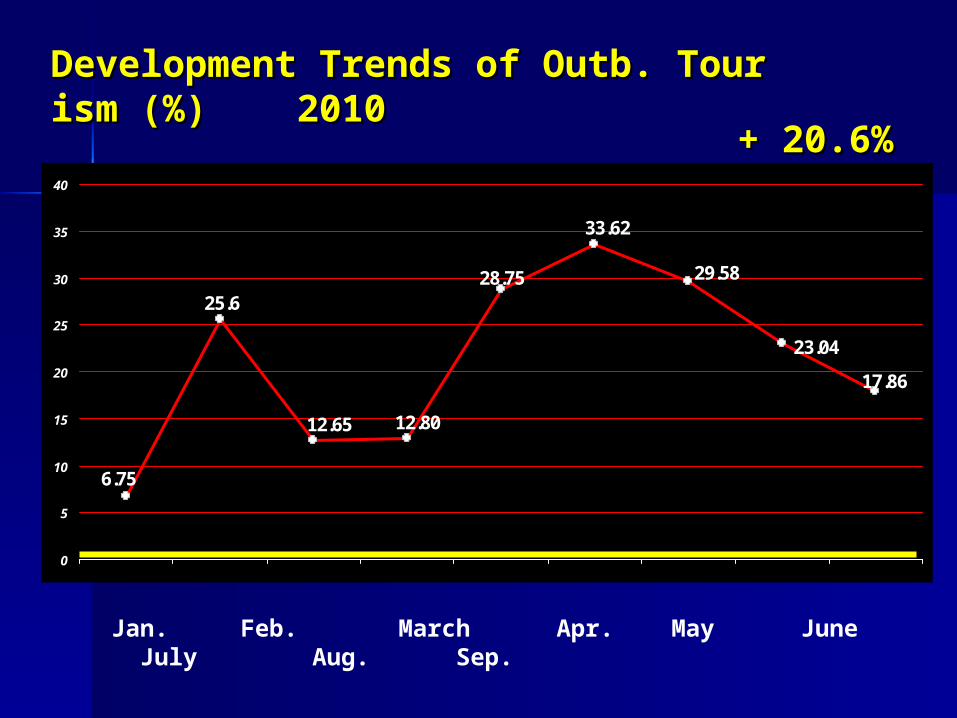
23.04
28.75
33.62
29.58
17.86
12.8012.65
6.75
25.6
0
5
10
15
20
25
30
35
40
Development Trends of Outb. Tourism Development Trends of Outb. Tourism (%) 2010(%) 2010
Jan. Feb. March Apr. May June July Aug. Sep.
++ 20.6%20.6%
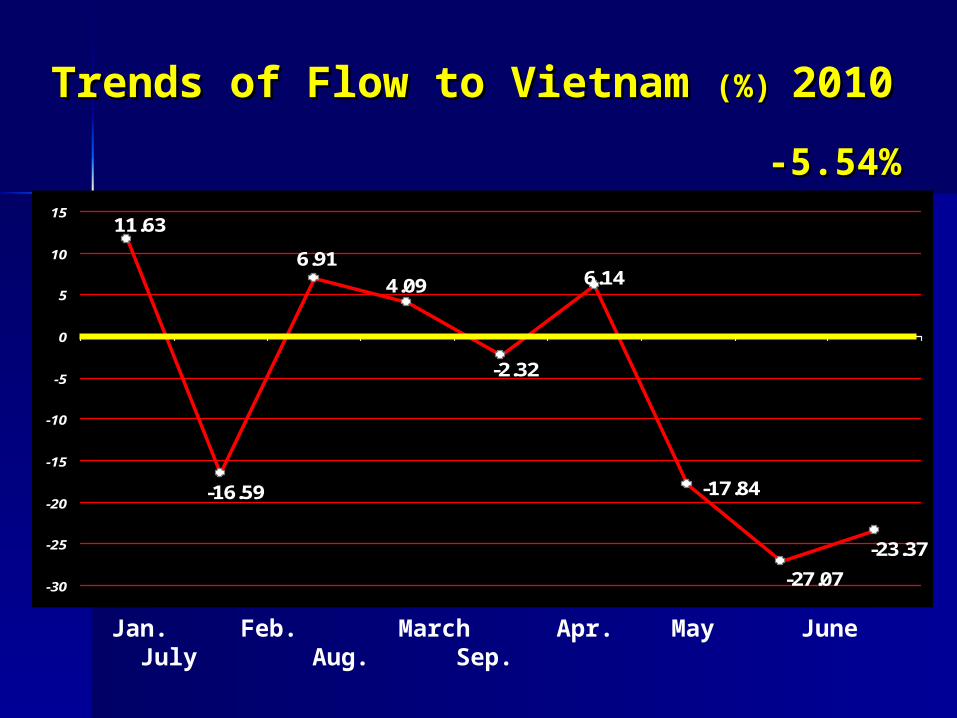
-17.84
-2.32
6.14
-27.07
-23.37
4.09
6.91
-16.59
11.63
-30
-25
-20
-15
-10
-5
0
5
10
15
Trends of Flow to Vietnam Trends of Flow to Vietnam (%) (%) 20102010
Jan. Feb. March Apr. May June July Aug. Sep.
-5.54%-5.54%
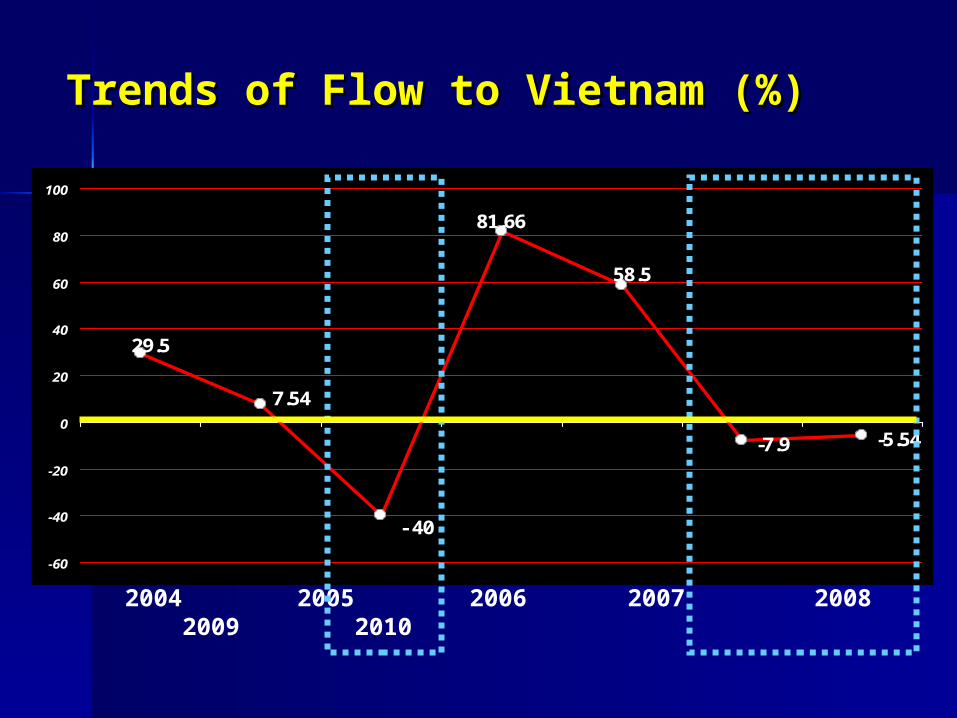
-7.9 -5.54
58.5
81.66
29.5
7.54
- 40
-60
-40
-20
0
20
40
60
80
100
2004 2005 2006 2007 2008 2009 2010
Trends of Flow to Vietnam (%)Trends of Flow to Vietnam (%)
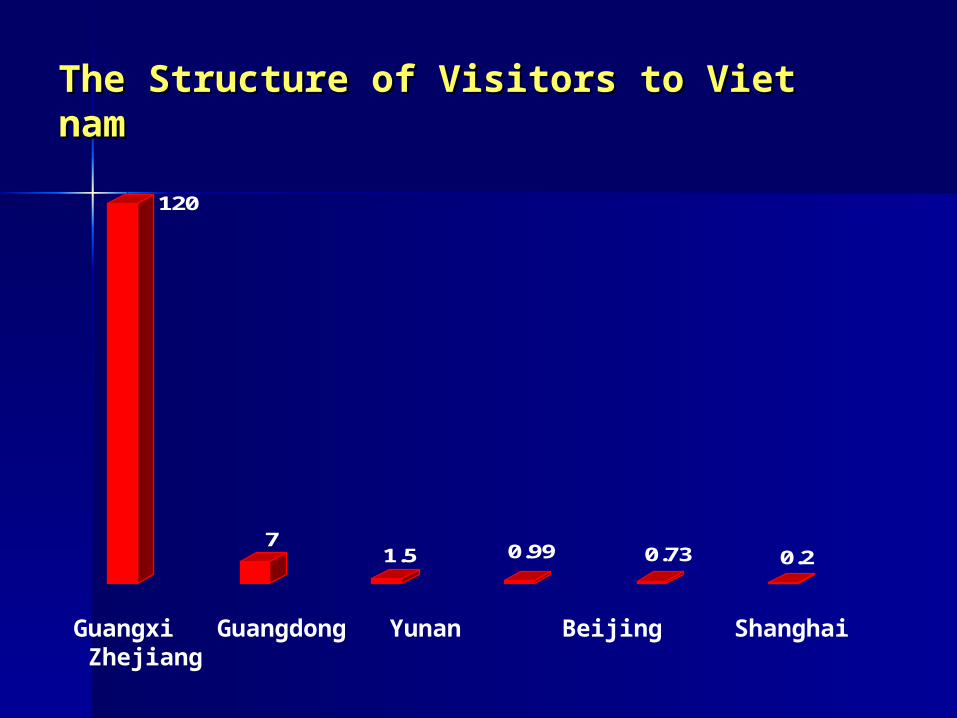
120
71.5 0.99 0.73 0.2
Guangxi Guangdong Yunan Beijing Shanghai Zhejiang
The Structure of Visitors to VietnamThe Structure of Visitors to Vietnam
Xinjiang
Qinghai
Gansu
Tibet
Sichuan
Yunnan
Guizhou
Hubei
Hunan
Inner Mongolia
Heilongjiang
Jilin
Liaoning
Shandong
Henan
Anhui
Guangxi
Jiangxi
Hainan
Ningxia
Shaanxi
Shanxi
chongqing
Fujian
Guangdong
Hongkong
Macau
Taiwan
Jiangsu
Beijing
Tianjin
Shanghai
Zhejiang
Hebei
radiateds
90%
5%1% 0.7% 0.5%
0.2%
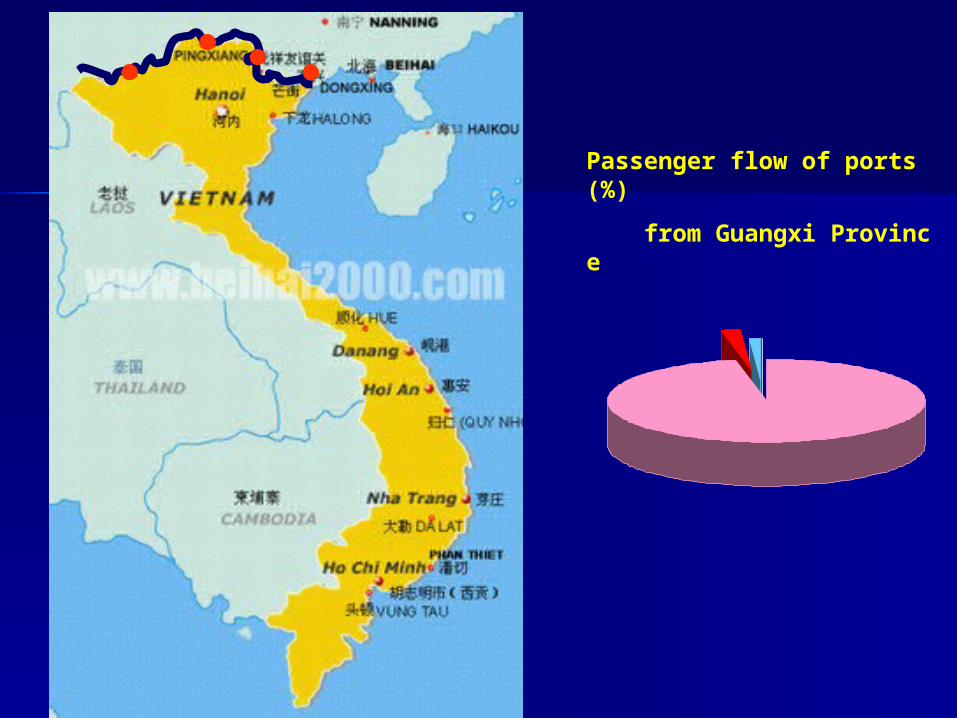
by road 97%
by trai n1.8%
by boat1.1%
Passenger flow of ports(%)
from Guangxi Province
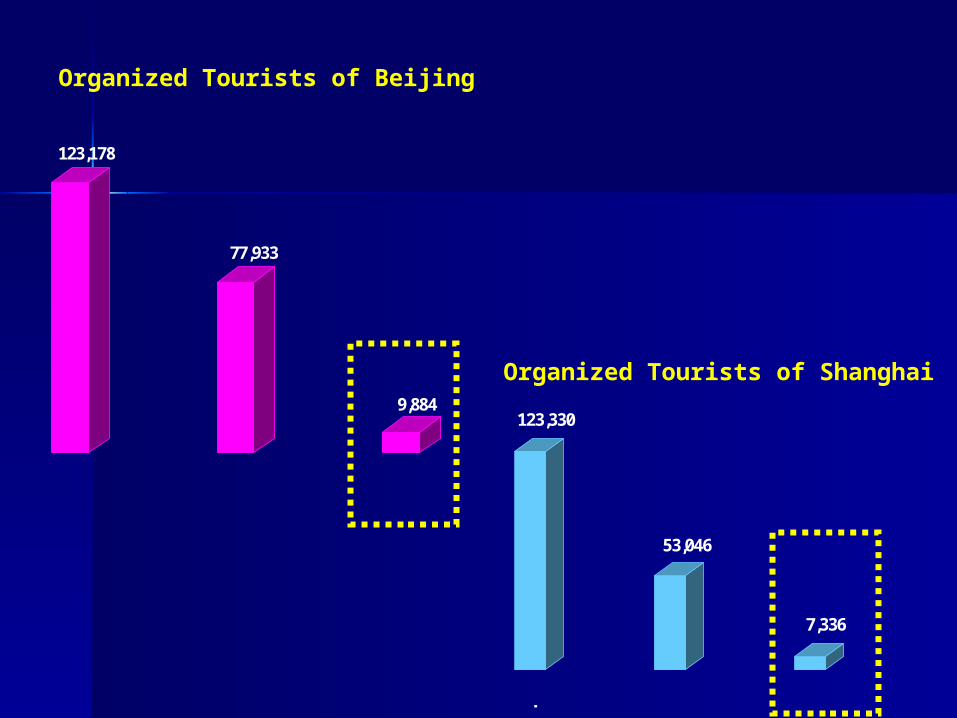
123,178
77,933
9,884
J apan Korea Vi etnam
Organized Tourists of Beijing
123,330
53,046
7,336
J apan Korea Vi etnam
Organized Tourists of Shanghai
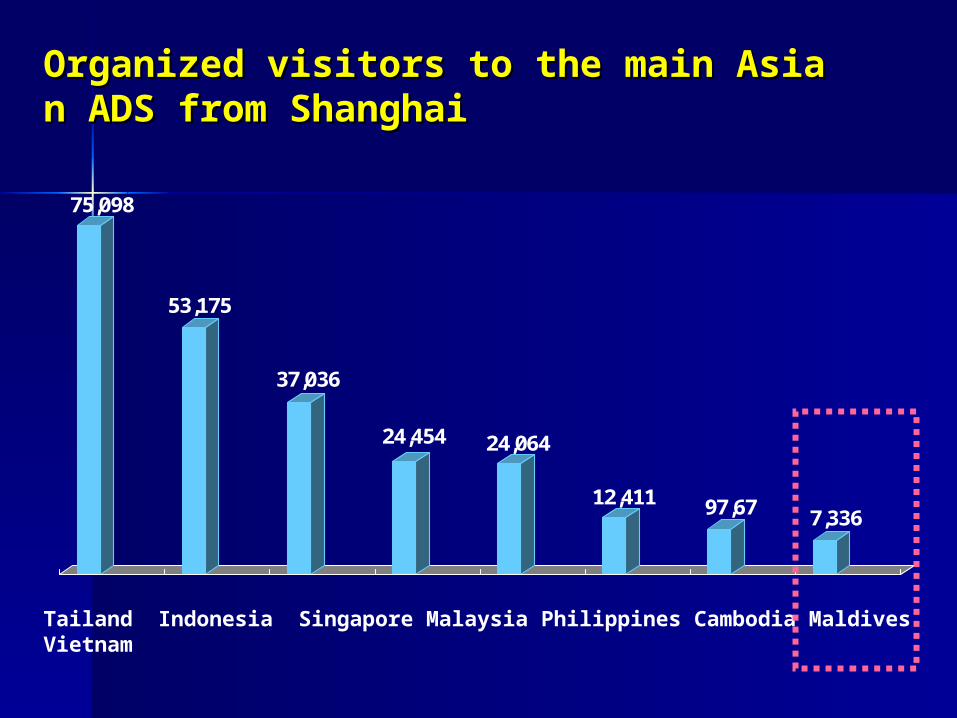
75,098
53,175
37,036
24,454 24,064
12,411 97,67 7,336
Tailand Indonesia Singapore Malaysia Philippines Cambodia Maldives Vietnam
Organized visitors to the main Asian ADS frOrganized visitors to the main Asian ADS from Shanghaiom Shanghai

The Emerging Trends of Outbound Travel Market

More Stylish Mentality · Slowing Down
· Sufficient Leisure

More Stylish Mentality · Slowing Down
· Sufficient Leisure · In-Depth Experience
· Free and easy travel · Wider Options · Attach greater importance to safety · More online booking

www.ctrip.comwww.ctrip.com
DI Y 80%

More Rational Consumption · More Specific Purpose · Higher Revisit Rate · Shorter stay

Spring Festival 7 Days
May Day 7 Days
National Day 7 Days
Spring Festival 7 Days
New Year’s Day 3 Days
Qing Ming 3 Days
Duan Wu 3 Days
Mid-Autumn Festival 3 Days
National Day 7 Days
Feb.
May
Oct.
Jan.
Feb.
Apr.
Jun.
Sep.
Oct.
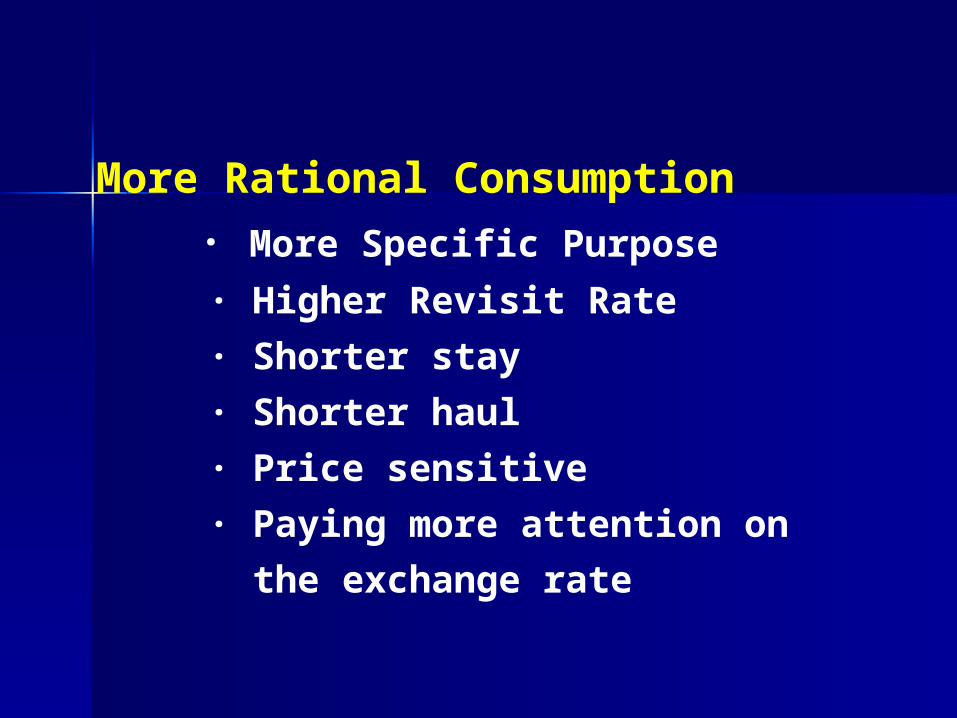
More Rational Consumption · More Specific Purpose · Higher Revisit Rate · Shorter stay · Shorter haul · Price sensitive · Paying more attention on the exchange rate

[email protected]@yahoo.com.cn
Related Documents