Key Tools for World-Class Server Operations ChinaNetCloud Zabbix Monitoring System 云络科技上海总部概览 Customized by and for ChinaNetCloud

Welcome message from author
This document is posted to help you gain knowledge. Please leave a comment to let me know what you think about it! Share it to your friends and learn new things together.
Transcript

Key
To
ols
fo
r W
orl
d-C
lass
Serv
er O
per
atio
ns
ChinaNetCloud Zabbix Monitoring System云络科技上海总部概览
Customized by and for ChinaNetCloud
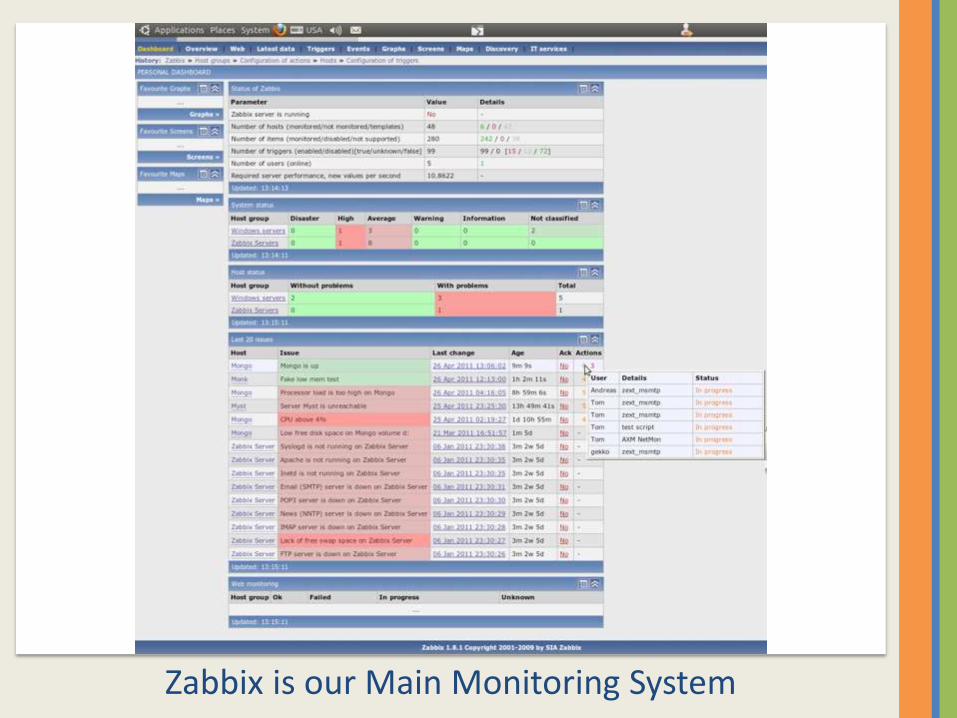
Zabbix is our Main Monitoring System

Very Advanced Architecture & System Integration

Zabbix Monitoring System
• World's Most Advanced Monitoring System
• Designed for Large-Scale Systems
• Heavily customized for our use
• 200+ points per server
• CPU, RAM, I/O, Network, Security
• Databases, Web Servers, Code, Java
• Globally distributed
• Proxies in several countries
• 25 million points/day

Monitor Everything
• Linux OS
• CPU, RAM, I/O
• Network
• Disks & RAID
• Load Balancers
• Web Servers
• PHP & FPM
• MySQL
• MongoDB
• Oracle & PostgreSQL
• MemCache & Redis
• Varnish & Squid
• RabbitMQ
• Switches & Firewalls
• SAN

Basic Monitoring Points
Apache Apache Busy Workers
Apache Bytes per Request
Apache Bytes per Second
Apache CPULoad
Apache Idle Workers
Apache Request Per Seconds
Apache ScoreBoard
Apache Total Accesses
Apache Total kBytes
Availability FS - Free disk space on /
FS - Free disk space on /home
FS - Free disk space on /opt
FS - Free disk space on /tmp
FS - Free disk space on /usr
FS - Free disk space on /var
FS - Free disk space on / in %
FS - Free disk space on /var in %
FS - Free disk space on /home in %
FS - Free disk space on /usr in %
FS - Free disk space on /opt in %
FS - Free disk space on /tmp in %
FS - Total disk space on /
FS - Total disk space on /home
FS - Total disk space on /opt
FS - Total disk space on /tmp
FS - Total disk space on /usr
FS - Used disk space on /
FS - Used disk space on /home
FS - Used disk space on /opt
FS - Used disk space on /tmp
FS - Used disk space on /usr
FS - Used disk space on /var
Memory buffers
Memory cached
Memory free
Memory shared
Memory total physical
Swap Free space
Swap Total space
CPU CPU - idle time (avg1)
CPU - system time (avg1)
CPU - Load avg 15min
CPU - Load avg 1min
CPU - Load avg 5min
CPU - user time (avg1)
OS Host boot time
Host information
Host local time
Host name
Host status
Host uptime (in sec)
Maximum number of opened files
Number of users connected
Performance CPU - idle time (avg1)
CPU - system time (avg1)
CPU - Load avg 15min
CPU - Load avg 1min
CPU - Load avg 5min
CPU - user time (avg1)
Net - Incoming traffic on interface eth0
Net - Incoming traffic on interface lo
Net - Outgoing traffic on interface eth0
Net - Outgoing traffic on interface lo
Processes Number of processes
Number of running processes
Number of running processes zabbix_agentd
Number of running processes inetd
Number of running processes sshd
Number of running processes syslogd
Version of zabbix_agent(d) running
sugarcrm Download speed for scenario 'frontpage'
Download speed for step 'front-page connection' of
scenario 'frontpage'
Failed step of scenario 'frontpage'
Response code for step 'front-page connection' of
scenario 'frontpage'
Response time for step 'front-page connection' of scenario
'frontpage'
Vmstat Amount of idle memory
Amount of memory used as buffers
Amount of memory used as cache
Amount of virtual memory used
CPU Time spent idle
CPU Time spent running kernel code
CPU Time spent running non-kernel code
CPU Time spent waiting for IO
IO Blocks in (bi)
IO Blocks out (bo)
Memory Swap In (si)
Memory Swap Out (so)
Number of context switches per second
Number of interrupts per second
Processes Blocked
Processes Runnable
Filesystem FS - Free disk space on /
FS - Free disk space on /home
FS - Free disk space on /opt
FS - Free disk space on /tmp
FS - Free disk space on /usr
FS - Free disk space on /var
FS - Free disk space on / in %
FS - Free disk space on /var in %
FS - Free disk space on /home in %
FS - Free disk space on /usr in %
FS - Free disk space on /opt in %
FS - Free disk space on /tmp in %
FS - Total disk space on /
FS - Total disk space on /home
FS - Total disk space on /opt
FS - Total disk space on /tmp
FS - Total disk space on /usr
FS - Used disk space on /
FS - Used disk space on /home
FS - Used disk space on /opt
FS - Used disk space on /tmp
FS - Used disk space on /usr
FS - Used disk space on /var
General Host boot time
Host information
Host local time
Host name
Host status
Host uptime (in sec)
Integrity Checksum of /etc/passwd
Checksum of /etc/services
Checksum of /usr/bin/ssh
Checksum of /usr/sbin/sshd
Checksum of /etc/ntp.conf
Checksum of /etc/syslog-ng/syslog-ng.conf
Checksum of /etc/ssh/ssh_config
Checksum of /etc/sysctl.conf
Checksum of /etc/fstab
Checksum of /etc/sysconfig/network
Checksum of /etc/sysconfig/network-scripts/ifcfg-
eth0
Checksum of /etc/hosts
Checksum of /etc/resolv.conf
Log files Size of /var/log/maillog
Size of /var/log/secure
Size of /var/log/messages
Size of /var/log/kern.log
Size of /var/log/kern
Size of /var/log/wtmp
Size of /var/log/btmp
Memory Memory buffers
Memory cached
Memory free
Memory shared
Memory total physical
Swap In Pages
Swap Out Pages
Network Net - Incoming traffic on interface eth0
Net - Incoming traffic on interface lo
Net - Outgoing traffic on interface eth0
Net - Outgoing traffic on interface lo
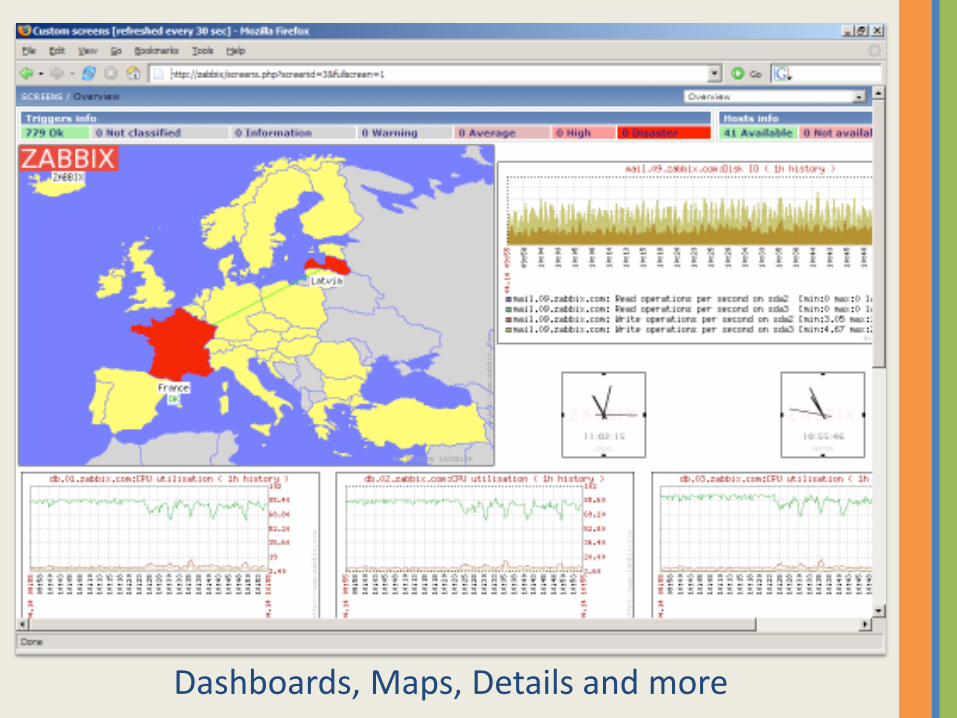
Dashboards, Maps, Details and more

Flexible customized graphs of any metric, any server

Advanced Template System

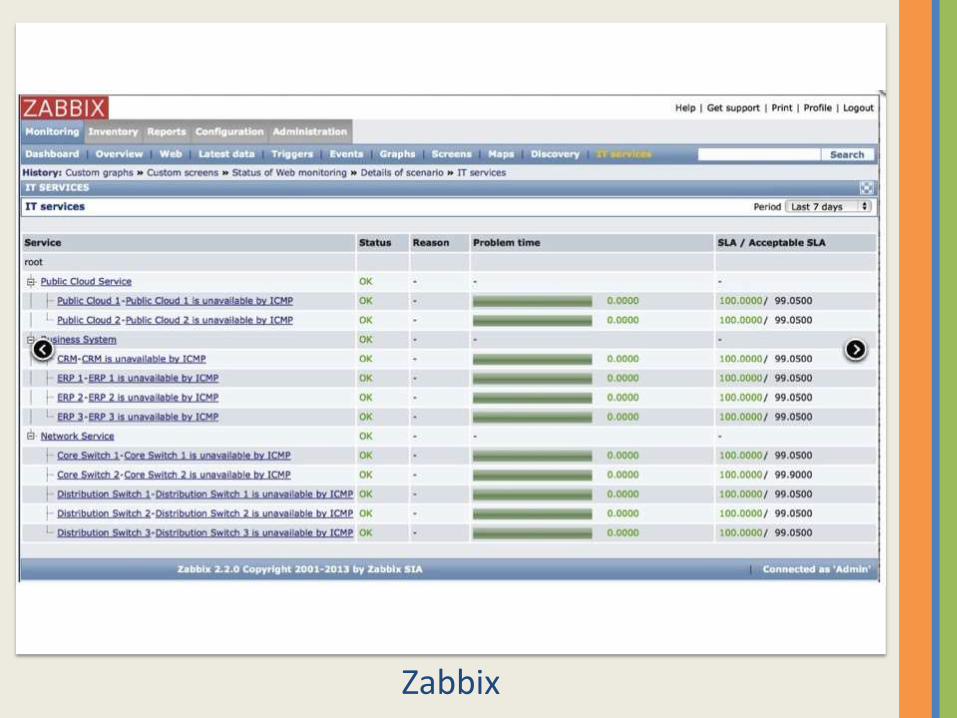
Zabbix

Zabbix

Custom Screens per Customer & Systems

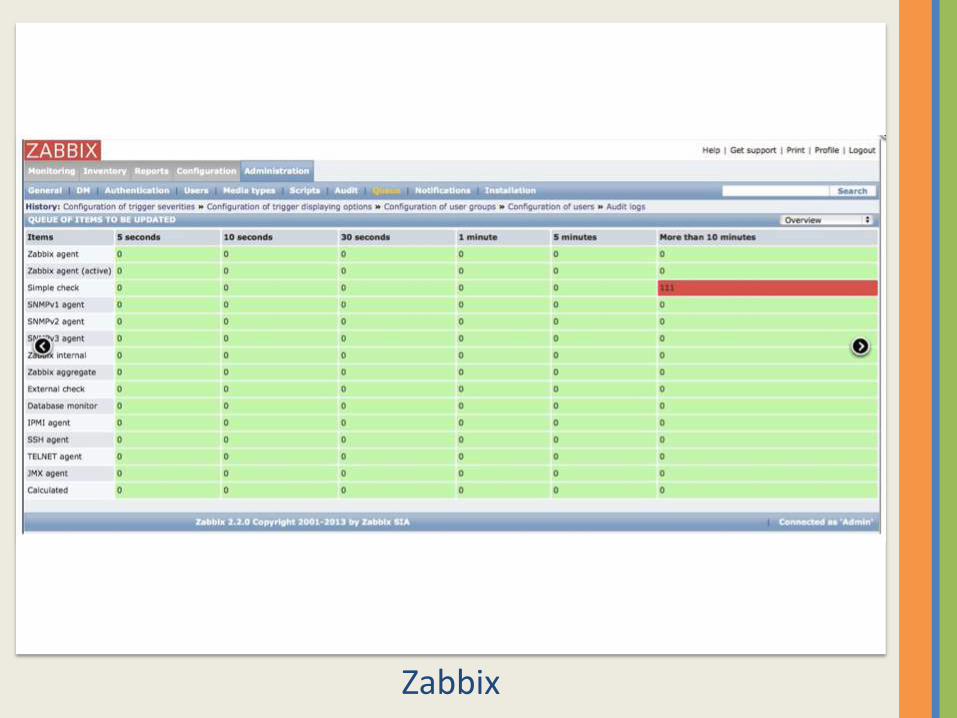
Zabbix

Graphs of Critical Data with Zoom to Detail

Stacked Graphs for Large-Scale Systems
Zabbix

History, Audit, and Tracking

Zabbix
Zabbix

Operations Center – Real-time Alerts & Requests 运维中心-实时警报与在线请求

Operations Center – Real-time Alerts & Requests 运维中心-实时警报与在线请求
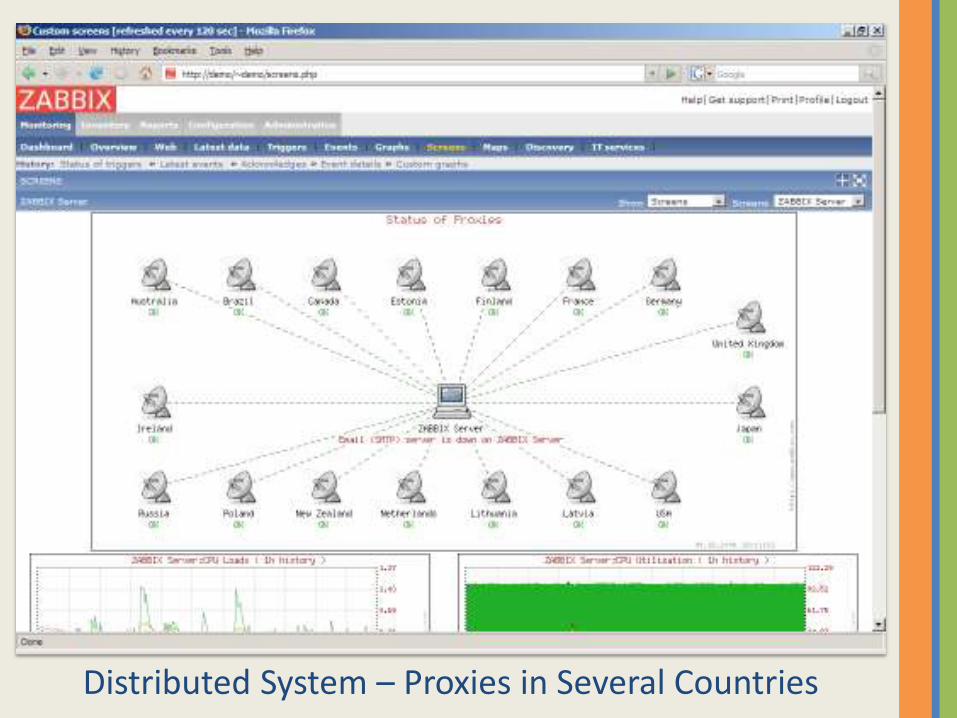
Distributed System – Proxies in Several Countries

Powerful Push Alerts from SEC – e.g. Kernel Errors

Advanced Mapping & Visualization

Dynamic Maps & Displays to Show Alerting Servers


Thank you – ChinaNetCloud
谢谢参观 –云络科技
Ad
dre
ss: X
2 S
pac
e 1
-60
1, 1
23
8 X
ietu
Ro
ad,
Xuh
uiD
istr
ict,
Sh
angh
ai, C
hin
a 2
00
03
2
上海市徐汇区斜土路
12
38号
X2创意空间
1-6
01室

Narrative
• Zabbix is our core monitoring system, over 200 points per server. We run one of the world’s largest monitoring systems with billions of data points per month.
• Zabbix description, world’s most popular large-scale
• Our system is distributed
• Our system is customized on many levels
• We have full deep monitoring, including MySQL, Java JMX, HAProxy, MongoDB, and much more.
• Key is our ticket & wiki integration
• Also automated tickets, automated setup, etc.
Related Documents