CapitalVue Research Analytics China A Shares Recap and Sector Performance – 1Q2013 A Shares 1Q13 recap Stock market trading volume and turnover Major index performance Shanghai, Shenzhen volume and valuation Aggregate earnings and valuation of A share companies Avg estimates for 2013 and 2014 earnings Total A share 1Q equity fundraising Sector index performance 1Q13 performance broken down by 84 industries P/E, P/B, EPS, EPS growth, ROE, net margin for 84 industries Key Data : CSRC, SSE, SZSE, CapitalVue, broker estimates 1 A select sample brought to you by [email protected] Authors: Sean Li, Han Xu

China Stock Market Recap - 1Q2013 (CapitalVue)
Jul 15, 2015
Welcome message from author
This document is posted to help you gain knowledge. Please leave a comment to let me know what you think about it! Share it to your friends and learn new things together.
Transcript
CapitalVue Research Analytics
China A Shares Recap and Sector Performance – 1Q2013
A Shares 1Q13 recap
Stock market trading volume and turnover
Major index performance
Shanghai, Shenzhen volume and valuation
Aggregate earnings and valuation of A share companies
Avg estimates for 2013 and 2014 earnings
Total A share 1Q equity fundraising
Sector index performance
1Q13 performance broken down by 84 industries
P/E, P/B, EPS, EPS growth, ROE, net margin for 84 industries
Key Data : CSRC, SSE, SZSE, CapitalVue, broker estimates
1
A select sample brought to you by [email protected]
Authors: Sean Li, Han Xu
5/7/2013 [email protected] 2
-4% -2% 0% 2% 4% 6% 8%
10% 12%
31-Dec 14-Jan 23-Jan 1-Feb 19-Feb 28-Feb 11-Mar 20-Mar 29-Mar
Major Index Performance
CSI 300 SSE Composite SZSE Component
0
100000
200000
300000
400000
500000
0
1000000
2000000
3000000
4000000
5000000
6000000
7000000 A share Monthly Trading Volume and Turnover
Turnover Value Trading Volume (right) Average Daily Turnover
0
10
20
30
40
50
0
40000
80000
120000
160000
200000 Turnover & Valuation
Average Daily Turnover (Shanghai) Average Daily Turnover (Shenzhen)
Average P/E (Shanghai) Average P/E (Shenzhen)
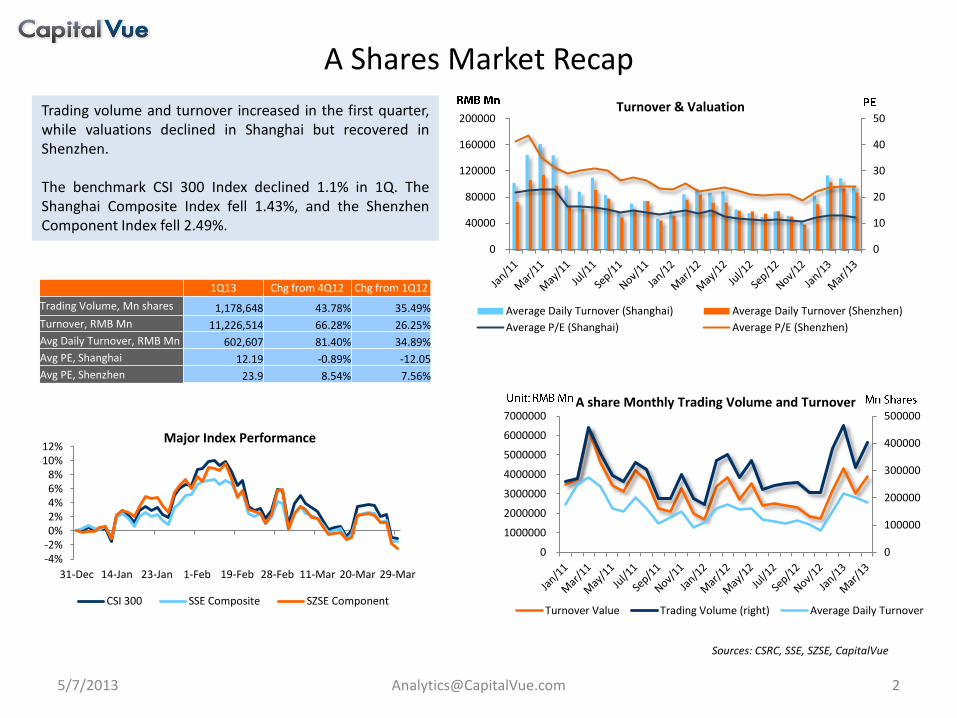
1Q13 Chg from 4Q12 Chg from 1Q12
Trading Volume, Mn shares 1,178,648 43.78% 35.49%
Turnover, RMB Mn 11,226,514 66.28% 26.25%
Avg Daily Turnover, RMB Mn 602,607 81.40% 34.89%
Avg PE, Shanghai 12.19 -0.89% -12.05
Avg PE, Shenzhen 23.9 8.54% 7.56%
Trading volume and turnover increased in the first quarter, while valuations declined in Shanghai but recovered in Shenzhen. The benchmark CSI 300 Index declined 1.1% in 1Q. The Shanghai Composite Index fell 1.43%, and the Shenzhen Component Index fell 2.49%.
Sources: CSRC, SSE, SZSE, CapitalVue
A Shares Market Recap

1Q13 A Shares Profits Up 10.5%
5/7/2013 [email protected] 3
Notes: 1. Avg P/E, net margin EPS, and EPS growth are arithmetic means. 3. Consensus estimates cover all estimates made during 1Q2013. EPS estimates for 2013 covered 1,703 companies and 2014 estimates cover 1,517 companies. 2012 earnings data and 2013 estimates are not comparable as the sample size of companies is significantly different. 4. Two companies that recorded no revenue in 2012 and 6 companies with zero revenue in 1Q13 were not included in net margin calculation. 5. 600769 had net margin of -575204% in 1Q13 and was excluded from our calculation.
Aggregate Performance of A Shares
-5.06%
-5.59%
-0.77%
0.98%
-1.23%
22.54%
-1.68%
13.82%
14.60%
9.74%
-1.10%
-1.43%
-10% 0% 10% 20% 30%
CSI Energy
CSI Materials
CSI Industrials
CSI Consumer Discretionary
CSI Consumer Staples
CSI Health Care
CSI Financials
CSI IT
CSI Telecom Services
CSI Utilities
CSI 300 Index
SSE Composite Index
1Q Sector Index Performance
Source: CapitalVue
Aggregate earnings for all A shares companies rose 10.5% in 1Q13 after flat growth in 2012. Total equity fundraising through the public markets totaled 104.75 billion yuan in the first quarter, almost triple the 36.1 billion yuan raised in 4Q12 and up even from 99 billion yuan raised in 1Q12 when the IPO market was still active, as companies take advantage of the recovery to tap the markets for funding.
0
20000
40000
60000
80000
Jan/11 Apr/11 Jul/11 Oct/11 Jan/12 Apr/12 Jul/12 Oct/12 Jan/13
Total Equity Fundraising (A Shares)
IPO Fundraising (A Share) Additional Public Offering (A Share)
Private Placement (Cash) Right Issue
FY12 1Q13
Net Profit Growth, y/y 0.01% 10.49%
Avg P/E 14.25× 14.42×
Avg Net Margin 15.83% -1.02%
Avg EPS, RMB 0.363 0.076
Avg EPS growth, y/y -25.04% -11.62%
Share Capital Growth, y/y 5.97% 5.70%
Avg Consensus EPS Estimate, 2013, RMB 0.678
Avg Consensus EPS Estimate, 2014, RMB 0.882
Sector CO.(#) CHG(%) GAINERS DECLINERS TOTAL CAP PE PB NET MARGIN (%) ROE (%) Total EPS EPS Growth %
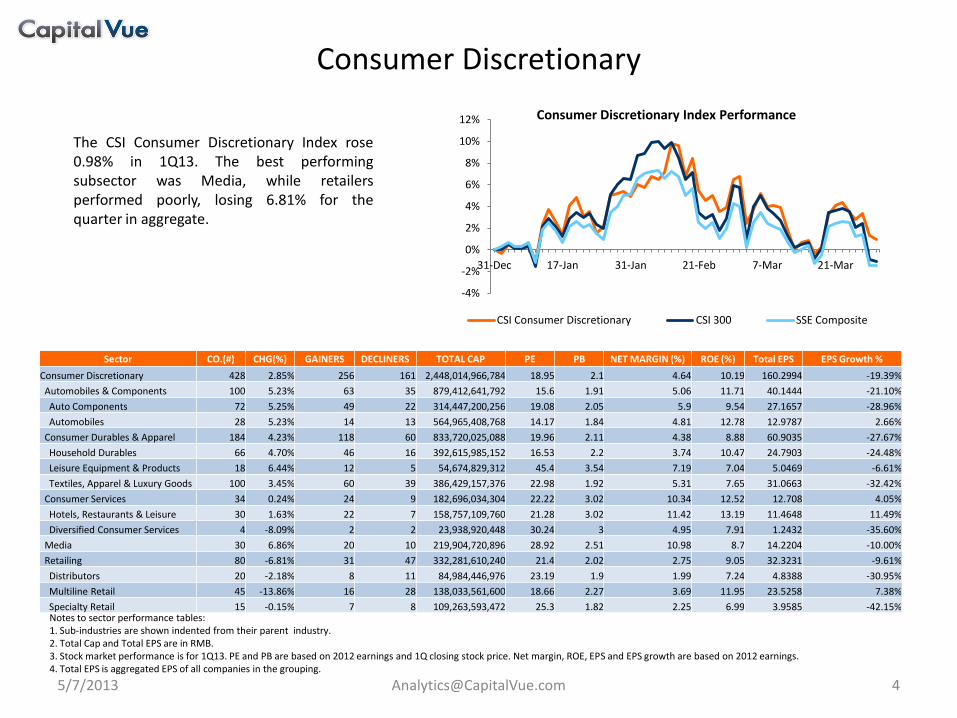
Consumer Discretionary 428 2.85% 256 161 2,448,014,966,784 18.95 2.1 4.64 10.19 160.2994 -19.39%
Automobiles & Components 100 5.23% 63 35 879,412,641,792 15.6 1.91 5.06 11.71 40.1444 -21.10%
Auto Components 72 5.25% 49 22 314,447,200,256 19.08 2.05 5.9 9.54 27.1657 -28.96%
Automobiles 28 5.23% 14 13 564,965,408,768 14.17 1.84 4.81 12.78 12.9787 2.66%
Consumer Durables & Apparel 184 4.23% 118 60 833,720,025,088 19.96 2.11 4.38 8.88 60.9035 -27.67%
Household Durables 66 4.70% 46 16 392,615,985,152 16.53 2.2 3.74 10.47 24.7903 -24.48%
Leisure Equipment & Products 18 6.44% 12 5 54,674,829,312 45.4 3.54 7.19 7.04 5.0469 -6.61%
Textiles, Apparel & Luxury Goods 100 3.45% 60 39 386,429,157,376 22.98 1.92 5.31 7.65 31.0663 -32.42%
Consumer Services 34 0.24% 24 9 182,696,034,304 22.22 3.02 10.34 12.52 12.708 4.05%
Hotels, Restaurants & Leisure 30 1.63% 22 7 158,757,109,760 21.28 3.02 11.42 13.19 11.4648 11.49%
Diversified Consumer Services 4 -8.09% 2 2 23,938,920,448 30.24 3 4.95 7.91 1.2432 -35.60%
Media 30 6.86% 20 10 219,904,720,896 28.92 2.51 10.98 8.7 14.2204 -10.00%
Retailing 80 -6.81% 31 47 332,281,610,240 21.4 2.02 2.75 9.05 32.3231 -9.61%
Distributors 20 -2.18% 8 11 84,984,446,976 23.19 1.9 1.99 7.24 4.8388 -30.95%
Multiline Retail 45 -13.86% 16 28 138,033,561,600 18.66 2.27 3.69 11.95 23.5258 7.38%
Specialty Retail 15 -0.15% 7 8 109,263,593,472 25.3 1.82 2.25 6.99 3.9585 -42.15%
5/7/2013 [email protected] 4
-4%
-2%
0%
2%
4%
6%
8%
10%
12%
31-Dec 17-Jan 31-Jan 21-Feb 7-Mar 21-Mar
Consumer Discretionary Index Performance
CSI Consumer Discretionary CSI 300 SSE Composite
Notes to sector performance tables: 1. Sub-industries are shown indented from their parent industry. 2. Total Cap and Total EPS are in RMB. 3. Stock market performance is for 1Q13. PE and PB are based on 2012 earnings and 1Q closing stock price. Net margin, ROE, EPS and EPS growth are based on 2012 earnings. 4. Total EPS is aggregated EPS of all companies in the grouping.
The CSI Consumer Discretionary Index rose 0.98% in 1Q13. The best performing subsector was Media, while retailers performed poorly, losing 6.81% for the quarter in aggregate.
Consumer Discretionary
5/7/2013 [email protected] 5
Consumer Staples, Energy
Sector CO.(#) CHG(%) GAINERS DECLINERS TOTAL CAP PE PB NET MARGIN (%) ROE (%) Total EPS EPS Growth% YoY
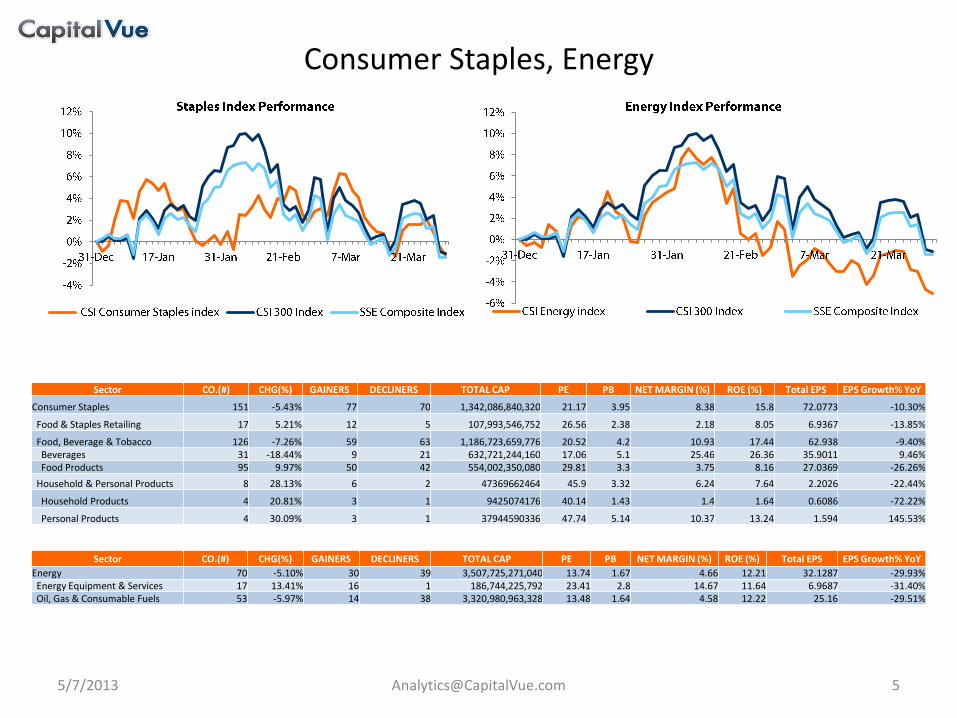
Consumer Staples 151 -5.43% 77 70 1,342,086,840,320 21.17 3.95 8.38 15.8 72.0773 -10.30%
Food & Staples Retailing 17 5.21% 12 5 107,993,546,752 26.56 2.38 2.18 8.05 6.9367 -13.85%
Food, Beverage & Tobacco 126 -7.26% 59 63 1,186,723,659,776 20.52 4.2 10.93 17.44 62.938 -9.40% Beverages 31 -18.44% 9 21 632,721,244,160 17.06 5.1 25.46 26.36 35.9011 9.46% Food Products 95 9.97% 50 42 554,002,350,080 29.81 3.3 3.75 8.16 27.0369 -26.26%
Household & Personal Products 8 28.13% 6 2 47369662464 45.9 3.32 6.24 7.64 2.2026 -22.44%
Household Products 4 20.81% 3 1 9425074176 40.14 1.43 1.4 1.64 0.6086 -72.22%
Personal Products 4 30.09% 3 1 37944590336 47.74 5.14 10.37 13.24 1.594 145.53%
Sector CO.(#) CHG(%) GAINERS DECLINERS TOTAL CAP PE PB NET MARGIN (%) ROE (%) Total EPS EPS Growth% YoY
Energy 70 -5.10% 30 39 3,507,725,271,040 13.74 1.67 4.66 12.21 32.1287 -29.93% Energy Equipment & Services 17 13.41% 16 1 186,744,225,792 23.41 2.8 14.67 11.64 6.9687 -31.40% Oil, Gas & Consumable Fuels 53 -5.97% 14 38 3,320,980,963,328 13.48 1.64 4.58 12.22 25.16 -29.51%

Sector CO.(#) CHG(%) GAINERS DECLINERS TOTAL CAP PE PB NET MARGIN (%) ROE (%) Total EPS EPS Growth% YoY
Financials 174 -0.84% 52 120 9,141,025,243,136 8.18 1.44 28.06 17.04 69.5886 -5.57%
Commercial Banks 16 -0.16% 7 8 6215951712256 6 1 40 19 20 7.18%
Capital Markets 21 -3.17% 7 14 755255541760 28 2 30 4 5 -24.64%
Insurance 4 -16.52% 0 4 1,049,458,966,528 34.02 2.63 3.93 7.63 4.45 -16.98%
Real Estate Development 133 17.36% 38 94 1,121,174,290,432 17.62 2.2 12.79 10.07 40.827 -6.72%
5/7/2013 [email protected] 6
Financials, Health Care
Sector CO.(#) CHG(%) GAINERS DECLINERS TOTAL CAP PE PB NET MARGIN (%) ROE (%) Total EPS EPS Growth% YoY
Health Care 189 18.59% 160 25 1,417,112,584,192 29.47 3.39 7.95 9.89 92.6139 -12.55%
Health Care Equipment & Services 28 16.08% 23 5 193,041,055,744 28.07 2.92 4.5 9.79 17.0348 -1.58%
Health Care Equipment & Supplies 21 14.37% 18 3 106,828,603,392 34.91 3.83 13.38 9.22 12.7774 -2.57%
Health Care Providers & Services 6 16.51% 4 2 75,004,141,568 19.93 2.05 3.11 10.4 4.2535 1.91%
Health Care Technology 1 31.54% 1 0 11,208,312,832 488.66 6.86 2.91 0.28 0.0039 -80.50%
Pharmaceuticals, Biotechnology & Life Sciences 161 19.00% 137 20 1,224,071,446,528 29.71 3.48 9.29 9.91 75.5791 -14.69%
Biotechnology 29 18.16% 22 4 123,930,738,688 41.38 4.07 13.35 8.86 12.2286 -10.39%
Pharmaceuticals 132 19.55% 115 16 1,100,140,773,376 28.81 3.43 9.07 10.21 63.3505 -15.47%
5/7/2013 [email protected] 7
Industrials
Sector CO.(#) CHG(%) GAINERS DECLINERS TOTAL CAP PE PB NET MARGIN (%) ROE (%) Total EPS EPS Growth% YoY
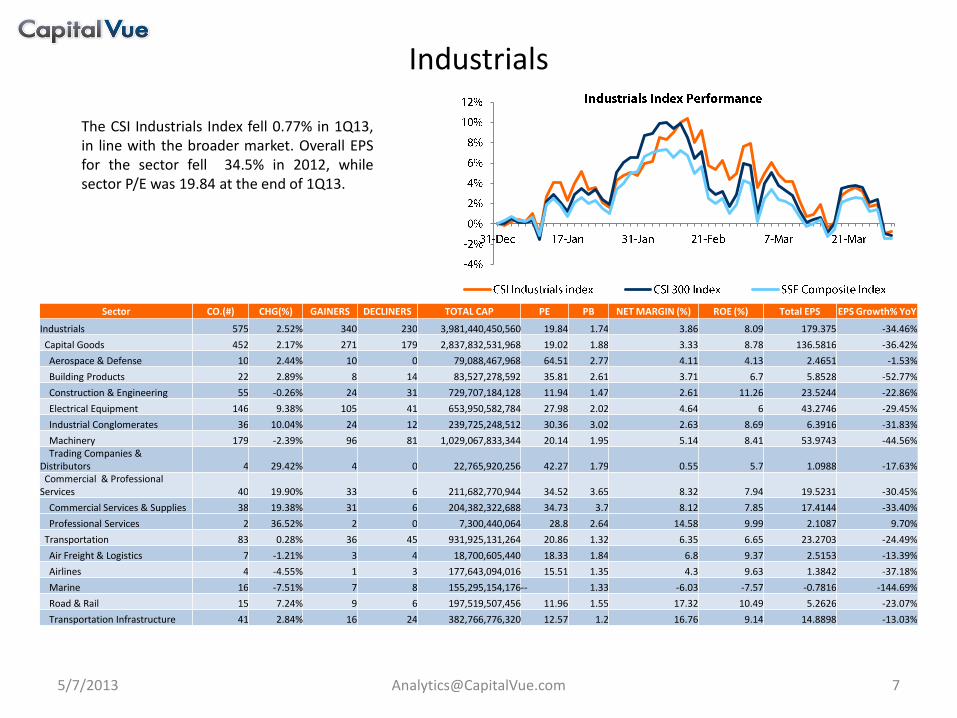
Industrials 575 2.52% 340 230 3,981,440,450,560 19.84 1.74 3.86 8.09 179.375 -34.46%
Capital Goods 452 2.17% 271 179 2,837,832,531,968 19.02 1.88 3.33 8.78 136.5816 -36.42%
Aerospace & Defense 10 2.44% 10 0 79,088,467,968 64.51 2.77 4.11 4.13 2.4651 -1.53%
Building Products 22 2.89% 8 14 83,527,278,592 35.81 2.61 3.71 6.7 5.8528 -52.77%
Construction & Engineering 55 -0.26% 24 31 729,707,184,128 11.94 1.47 2.61 11.26 23.5244 -22.86%
Electrical Equipment 146 9.38% 105 41 653,950,582,784 27.98 2.02 4.64 6 43.2746 -29.45%
Industrial Conglomerates 36 10.04% 24 12 239,725,248,512 30.36 3.02 2.63 8.69 6.3916 -31.83%
Machinery 179 -2.39% 96 81 1,029,067,833,344 20.14 1.95 5.14 8.41 53.9743 -44.56% Trading Companies & Distributors 4 29.42% 4 0 22,765,920,256 42.27 1.79 0.55 5.7 1.0988 -17.63% Commercial & Professional Services 40 19.90% 33 6 211,682,770,944 34.52 3.65 8.32 7.94 19.5231 -30.45%
Commercial Services & Supplies 38 19.38% 31 6 204,382,322,688 34.73 3.7 8.12 7.85 17.4144 -33.40%
Professional Services 2 36.52% 2 0 7,300,440,064 28.8 2.64 14.58 9.99 2.1087 9.70%
Transportation 83 0.28% 36 45 931,925,131,264 20.86 1.32 6.35 6.65 23.2703 -24.49%
Air Freight & Logistics 7 -1.21% 3 4 18,700,605,440 18.33 1.84 6.8 9.37 2.5153 -13.39%
Airlines 4 -4.55% 1 3 177,643,094,016 15.51 1.35 4.3 9.63 1.3842 -37.18%
Marine 16 -7.51% 7 8 155,295,154,176 -- 1.33 -6.03 -7.57 -0.7816 -144.69%
Road & Rail 15 7.24% 9 6 197,519,507,456 11.96 1.55 17.32 10.49 5.2626 -23.07%
Transportation Infrastructure 41 2.84% 16 24 382,766,776,320 12.57 1.2 16.76 9.14 14.8898 -13.03%
The CSI Industrials Index fell 0.77% in 1Q13, in line with the broader market. Overall EPS for the sector fell 34.5% in 2012, while sector P/E was 19.84 at the end of 1Q13.
5/7/2013 [email protected] 8
Information Technology, Materials
Sector CO.(#) CHG(%) GAINERS DECLINERS TOTAL CAP PE PB NET MARGIN (%) ROE (%) Total EPS EPS Growth% YoY
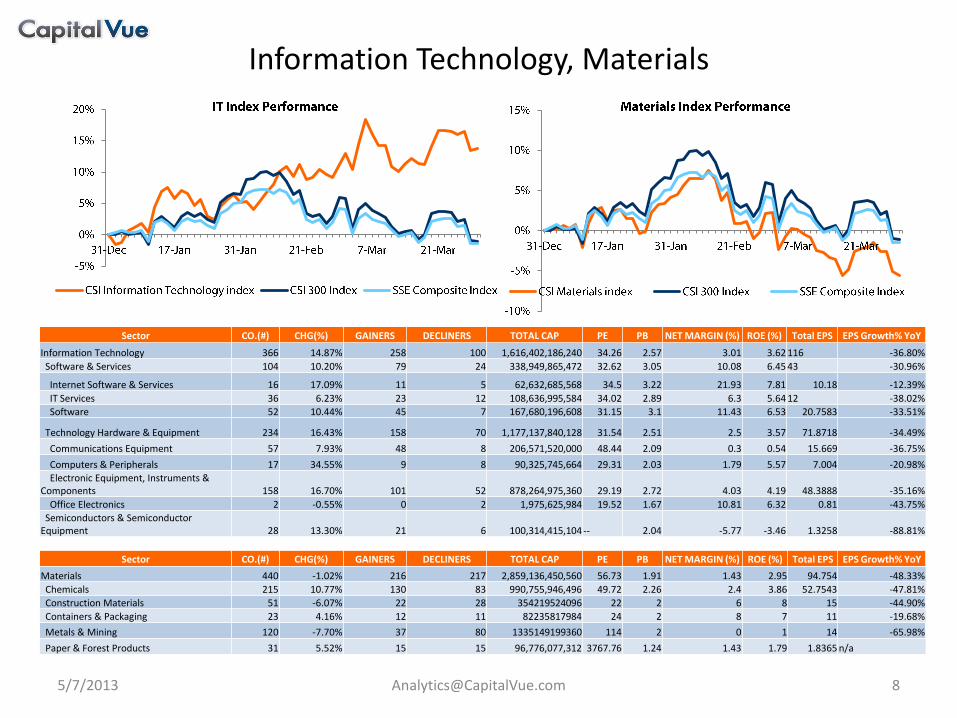
Materials 440 -1.02% 216 217 2,859,136,450,560 56.73 1.91 1.43 2.95 94.754 -48.33%
Chemicals 215 10.77% 130 83 990,755,946,496 49.72 2.26 2.4 3.86 52.7543 -47.81%
Construction Materials 51 -6.07% 22 28 354219524096 22 2 6 8 15 -44.90%
Containers & Packaging 23 4.16% 12 11 82235817984 24 2 8 7 11 -19.68%
Metals & Mining 120 -7.70% 37 80 1335149199360 114 2 0 1 14 -65.98%
Paper & Forest Products 31 5.52% 15 15 96,776,077,312 3767.76 1.24 1.43 1.79 1.8365 n/a
Sector CO.(#) CHG(%) GAINERS DECLINERS TOTAL CAP PE PB NET MARGIN (%) ROE (%) Total EPS EPS Growth% YoY
Information Technology 366 14.87% 258 100 1,616,402,186,240 34.26 2.57 3.01 3.62 116 -36.80%
Software & Services 104 10.20% 79 24 338,949,865,472 32.62 3.05 10.08 6.45 43 -30.96%
Internet Software & Services 16 17.09% 11 5 62,632,685,568 34.5 3.22 21.93 7.81 10.18 -12.39%
IT Services 36 6.23% 23 12 108,636,995,584 34.02 2.89 6.3 5.64 12 -38.02%
Software 52 10.44% 45 7 167,680,196,608 31.15 3.1 11.43 6.53 20.7583 -33.51%
Technology Hardware & Equipment 234 16.43% 158 70 1,177,137,840,128 31.54 2.51 2.5 3.57 71.8718 -34.49%
Communications Equipment 57 7.93% 48 8 206,571,520,000 48.44 2.09 0.3 0.54 15.669 -36.75%
Computers & Peripherals 17 34.55% 9 8 90,325,745,664 29.31 2.03 1.79 5.57 7.004 -20.98%
Electronic Equipment, Instruments & Components 158 16.70% 101 52 878,264,975,360 29.19 2.72 4.03 4.19 48.3888 -35.16%
Office Electronics 2 -0.55% 0 2 1,975,625,984 19.52 1.67 10.81 6.32 0.81 -43.75%
Semiconductors & Semiconductor Equipment 28 13.30% 21 6 100,314,415,104 -- 2.04 -5.77 -3.46 1.3258 -88.81%
Sector CO.(#) CHG(%) GAINERS DECLINERS TOTAL CAP PE PB NET MARGIN (%) ROE (%) Total EPS EPS Growth% YoY
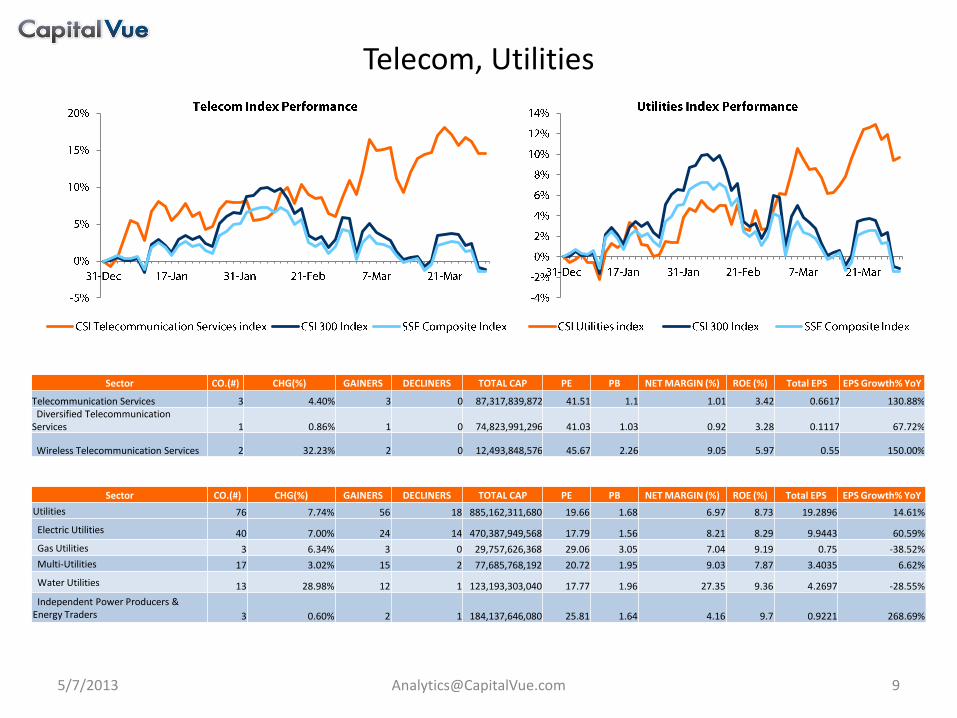
Telecommunication Services 3 4.40% 3 0 87,317,839,872 41.51 1.1 1.01 3.42 0.6617 130.88% Diversified Telecommunication Services 1 0.86% 1 0 74,823,991,296 41.03 1.03 0.92 3.28 0.1117 67.72%
Wireless Telecommunication Services 2 32.23% 2 0 12,493,848,576 45.67 2.26 9.05 5.97 0.55 150.00%
5/7/2013 [email protected] 9
Telecom, Utilities
Sector CO.(#) CHG(%) GAINERS DECLINERS TOTAL CAP PE PB NET MARGIN (%) ROE (%) Total EPS EPS Growth% YoY
Utilities 76 7.74% 56 18 885,162,311,680 19.66 1.68 6.97 8.73 19.2896 14.61%
Electric Utilities 40 7.00% 24 14 470,387,949,568 17.79 1.56 8.21 8.29 9.9443 60.59%
Gas Utilities 3 6.34% 3 0 29,757,626,368 29.06 3.05 7.04 9.19 0.75 -38.52%
Multi-Utilities 17 3.02% 15 2 77,685,768,192 20.72 1.95 9.03 7.87 3.4035 6.62%
Water Utilities 13 28.98% 12 1 123,193,303,040 17.77 1.96 27.35 9.36 4.2697 -28.55%
Independent Power Producers & Energy Traders 3 0.60% 2 1 184,137,646,080 25.81 1.64 4.16 9.7 0.9221 268.69%
Click to access related data on CapitalVue Terminal (subscription required)
10
For more information:
www.capitalvue.com
CSI 300 Index: link Shanghai Composite Index: link Shenzhen Component Index: link A shares trading volume: link A shares turnover: link Average daily A shares turnover: link Average daily turnover (Shanghai): link Average P/E (Shanghai): link Average daily turnover (Shenzhen): link Average P/E (Shenzhen): link Total A shares market cap: link IPO fundraising: link Follow-on fundraising: link Private placement fundraising: link
Sector summary pages: Consumer Discretionary: link Consumer Staples: link Energy: link Financials: link Health Care: link Industrials: link Information Technology: link Materials: link Telecommunication Services: link Utilities: link
Related Documents