www.dbsvickers.com ed-TH / sa- AH Auto sales to remain weak in 3Q July auto sales continued to slow, magnitude of declines larger than in June Passenger vehicle (PV) sales dipped by c.6.6%; commercial vehicle (CV) sales fell nearly 10% y-o-y SUV the only segment recording volume sales growth but price competition is intensifying Top pick is Minth (425 HK); a weaker RMB is expected to benefit its export sale. Automakers are facing pressure due to a weak 3Q Auto sales weakness worse than expected; possible improvement in 4Q. Concerns on the health of the Chinese economy and a volatile stock market continue to weigh on China’s auto sales. Last month, total sales volume fell by 7.1% y-o-y, the largest drop in the past two years. Both PV and CV recorded declines, of 6.6% and 9.9% in July respectively. The Chinese government’s effort to stem further weakness in the economy may ease the macro concerns, which should help to stabilise the auto market. We expect volume sales to see some improvements in 4Q as the industry enters the traditional peak sales season. Due to the slow YTD sales performance, we have revised down our PV volume growth assumption from the previous 8% to about 6% for this year. Overall, the vehicle market is expected to post a slower growth of 3% vs 6.8% last year. PV hit by sharp decline in sedan sales. The sedan market has been weak this year, recording the biggest drop of 19.7% last month. The SUV market is the only strong segment with a 34% y-o-y expansion in July. The Chinese PV brands performed better, expanding by 5.1% last month with a 39% market share. Sales of foreign PV brands were weak, and we expect to see more price competition from the sino-foreign JV brands. Macro weakness hitting CV segment. Sales of CV have been weak since Apr-14 and last month, it contracted by 9.9%. For 7M15, total CV sold fell by 13.7%. The truck segment is the hardest hit, which we attribute to the slowdown of the Chinese economy. We expect total CV sales to decline by at least 10% this year. In 2014, it fell by 6.8%. HSI : 24,498 ANALYST Rachel MIU +852 2863 8843 [email protected] Recommendation & valuation FY15 Upside PE HK$ HK$ % x US$m Auto manufacturers Brilliance China (1114 HK)* 10.46 15.30 46 Hold 7.3 6,786 Dongfeng Motor (489 HK) 9.30 15.70 69 Buy 4.6 10,337 Geely Auto (175 HK)* 3.21 3.70 15 Hold 9.1 3,643 Great Wall Motor (2333 HK)* 24.95 48.10 93 Hold 5.6 9,791 Guangzhou Auto (2238 HK) * 6.44 8.30 29 Buy 7.2 5,345 BAIC Motor (1958 HK)^ 6.72 n.a. n.a. NR 6.7 6,584 CQ Changan 'B' (200625 CH)^ 14.30 21.80 52 NR 5.2 8,602 SAIC Motor 'A' (600104 CH)^ 20.06 n.a. n.a. NR 7.3 35,613 Auto dealers China ZhengTong (1728 HK)* 3.87 5.50 42 Buy 6.4 1,103 Dah Chong Hong (1828 HK) 3.58 4.95 38 Buy 7.1 846 ZhongSheng (881 HK)* 4.37 6.70 53 Buy 5.9 1,211 Auto parts & components Minth Group (425 HK) 15.76 19.10 21 Buy 10.9 2,246 Nexteer Automotive (1316 HK)* 6.93 9.30 34 Buy 10.7 2,233 Xinchen China (1148 HK)* 2.40 4.40 83 Buy 6.6 399 Xingda Int'l (1899 HK)^ 2.04 n.a. n.a. NR 9.4 397 Mkt Cap Company Price Target Price Recom # ^ Consensus * TP & Rating under review # Fair value Source: Thomson Reuters, DBS Vickers DBS Group Research . Equity 12 August 2015 China / Hong Kong Industry Focus China Auto Sector Refer to important disclosures at the end of this report

Welcome message from author
This document is posted to help you gain knowledge. Please leave a comment to let me know what you think about it! Share it to your friends and learn new things together.
Transcript

www.dbsvickers.com
ed-TH / sa- AH
Auto sales to remain weak in 3Q
July auto sales continued to slow, magnitude of declines larger than in June
Passenger vehicle (PV) sales dipped by c.6.6%; commercial vehicle (CV) sales fell nearly 10% y-o-y
SUV the only segment recording volume sales growth but price competition is intensifying
Top pick is Minth (425 HK); a weaker RMB is expected to benefit its export sale. Automakers are facing pressure due to a weak 3Q
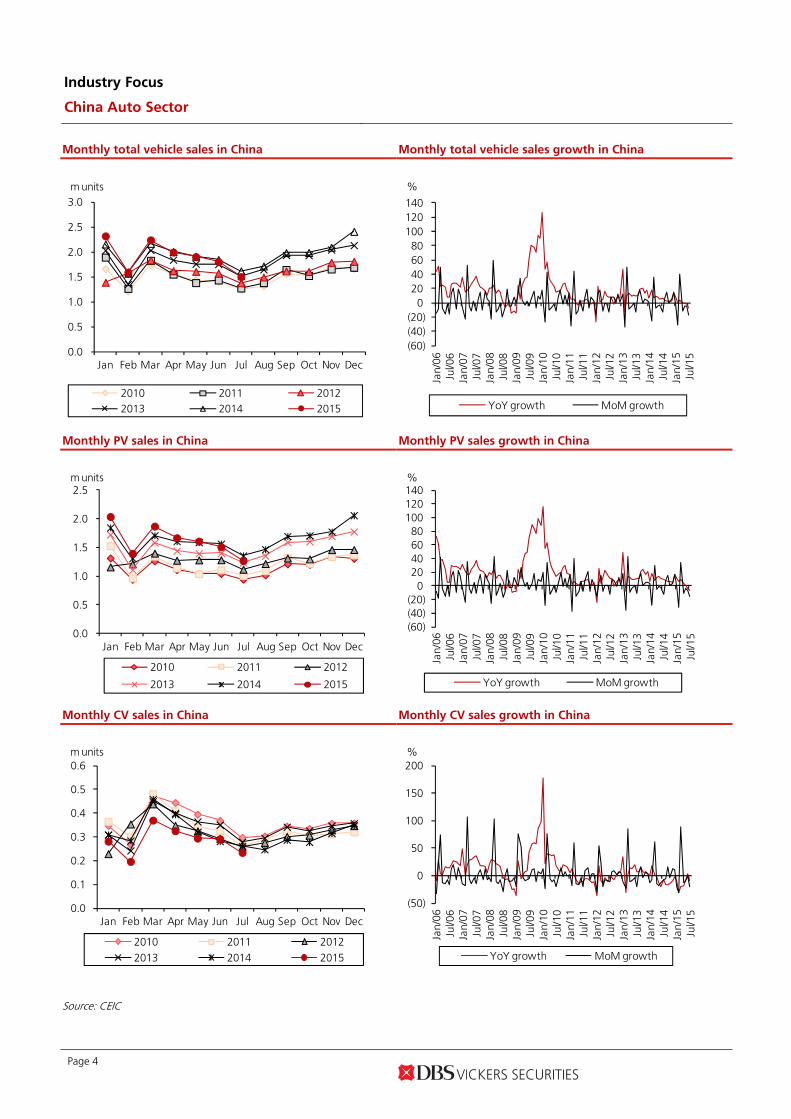
Auto sales weakness worse than expected; possible improvement in 4Q. Concerns on the health of the Chinese economy and a volatile stock market continue to weigh on China’s auto sales. Last month, total sales volume fell by 7.1% y-o-y, the largest drop in the past two years. Both PV and CV recorded declines, of 6.6% and 9.9% in July respectively. The Chinese government’s effort to stem further weakness in the economy may ease the macro concerns, which should help to stabilise the auto market. We expect volume sales to see some improvements in 4Q as the industry enters the traditional peak sales season. Due to the slow YTD sales performance, we have revised down our PV volume growth assumption from the previous 8% to about 6% for this year. Overall, the vehicle market is expected to post a slower growth of 3% vs 6.8% last year.
PV hit by sharp decline in sedan sales. The sedan market has been weak this year, recording the biggest drop of 19.7% last month. The SUV market is the only strong segment with a 34% y-o-y expansion in July. The Chinese PV brands performed better, expanding by 5.1% last month with a 39% market share. Sales of foreign PV brands were weak, and we expect to see more price competition from the sino-foreign JV brands.
Macro weakness hitting CV segment. Sales of CV have been weak since Apr-14 and last month, it contracted by 9.9%. For 7M15, total CV sold fell by 13.7%. The truck segment is the hardest hit, which we attribute to the slowdown of the Chinese economy. We expect total CV sales to decline by at least 10% this year. In 2014, it fell by 6.8%.
HSI : 24,498 ANALYST Rachel MIU +852 2863 8843 [email protected]
Recommendation & valuation
F Y 15Upside PE
HK $ HK $ % x US$m
A ut o manuf ac t urersBrilliance China(1114 HK)*
10.46 15.30 46 Hold 7.3 6,786
Dongfeng Motor(489 HK)
9.30 15.70 69 Buy 4.6 10,337
Geely Auto(175 HK)*
3.21 3.70 15 Hold 9.1 3,643
Great Wall Motor(2333 HK)*
24.95 48.10 93 Hold 5.6 9,791
Guangzhou Auto(2238 HK) *
6.44 8.30 29 Buy 7.2 5,345
BAIC Motor(1958 HK)^
6.72 n.a. n.a. NR 6.7 6,584
CQ Changan 'B'(200625 CH)^
14.30 21.80 52 NR 5.2 8,602
SAIC Motor 'A'(600104 CH)^
20.06 n.a. n.a. NR 7.3 35,613
A ut o dealers
China ZhengTong(1728 HK)*
3.87 5.50 42 Buy 6.4 1,103
Dah Chong Hong(1828 HK)
3.58 4.95 38 Buy 7.1 846
ZhongSheng(881 HK)*
4.37 6.70 53 Buy 5.9 1,211
A ut o part s & component s
Minth Group(425 HK)
15.76 19.10 21 Buy 10.9 2,246
Nexteer Automotive(1316 HK)*
6.93 9.30 34 Buy 10.7 2,233
Xinchen China(1148 HK)*
2.40 4.40 83 Buy 6.6 399
Xingda Int'l(1899 HK)^
2.04 n.a. n.a. NR 9.4 397
M k tCap
Company Pric e T argetPric e
Recom
#
^ Consensus * TP & Rating under review # Fair value Source: Thomson Reuters, DBS Vickers
DBS Group Research . Equity 12 August 2015
China / Hong Kong Industry Focus
China Auto Sector Refer to important disclosures at the end of this report

Industry Focus
China Auto Sector
Page 2
Expect auto market to stay weak in 3Q; expect improvement in 4Q
The Chinese auto market has posted several months’ of sales contraction since Apr-15. According to China Association of Automobile Manufacturers, total sales volume fell by 7.1% y-o-y to 1.5m units in July, the largest drop in the past two years. For 7M15, auto sales in China inched up a mere 0.4%, one of the weakest periods so far. As expected, automakers cut production last month to ease the inventory pressure. Total units produced shrunk by 11.8% y-o-y to about 1.52m units compared to a sales volume of 1.5m units. We also saw the inventory alert index dipping to 53.4% last month compared to 64.6% in June. The SUV segment continued to hog the limelight, indicating that the overall SUV market is still in a robust state. However, we expect price competition to intensify with automakers trying to outsell rivals this year. So far this year, the SUV price index has fallen by c.4ppts.
SUV price index
75
80
85
90
95
100
105
Feb-
07Ju
n-07
Oct
-07
Feb-
08Ju
n-08
Oct
-08
Feb-
09Ju
n-09
Oct
-09
Feb-
10Ju
n-10
Oct
-10
Feb-
11Ju
n-11
Oct
-11
Feb-
12Ju
n-12
Oct
-12
Feb-
13Ju
n-13
Oct
-13
Feb-
14Ju
n-14
Oct
-14
Feb-
15Ju
n-15
Jan-07 = 100
Source: CEIC
Revised down 2015 auto sales projections. The Chinese government’s effort to stem further weakness in the economy may help ease the macro concerns, which should help to stabilise the auto market in China. We expect volume sales to see some improvement in 4Q as the industry enters the traditional peak sales season. Due to the slow YTD sales performance, we have revised down our PV volume growth assumption from the previous 8% to about 6% this year, and total volume sales (including commercial vehicle) at 3%.
Our recommendations
F/X impact and top pick. We prefer Minth (425 HK) as the company derives about 40% of its sales from overseas customers while most of its production costs are in RMB. Notwithstanding the translation impact on US dollar assets and liabilities, a weaker RMB could boost its export competitiveness. A 5% change in RMB against the foreign currency could translate into about 8% impact on post-tax profits.
On the other hand, we expect Nexteer (1316 HK) to post some FX losses, given that about 20% of its revenue is derived from Europe and the depreciation of the euro against the USD would hit its profitability. We estimate a 10% movement in USD against the euro to translate into about 4-5% impact on post-tax profits. This also partly explains the recent weakness in its share price.
Awaiting for better guidance following interim results. All the auto companies will release their interim results this month. There will be better clarity on the individual auto companies with respect to profit margins and volume sales outlook for 2H. At present, we expect Geely and GAC to meet 1H earnings expectations. For the auto dealerships, we foresee the weakness in new car sales gross margins to drag on their 1H profits.

Industry Focus
China Auto Sector
Page 3
Monthly vehicle sales
'000 units J ul/14 J un/15 J ul/15 YoY
growth(%)
MoMgrowth
(%)
7M14 7M15 YTD YoYgrowth
(%)
As a % oftotal PV(7M15)
China total v ehicle sales 1,618 1,803 1,503 (7.1) (16.6) 13,301 13,358 0.4
Passenger Vehicles 1,358 1,511 1,269 (6.6) (16.1) 10,991 11,363 3.4 100%
Sedan 858 846 689 (19.7) (18.6) 7,007 6,478 (7.6) 57%
MPV 119 126 113 (5.3) (10.6) 1,002 1,129 12.7 10%
SUV 293 448 393 34.2 (12.3) 2,117 3,054 44.3 27%Cross 88 91 74 (15.8) (18.3) 865 702 (18.8) 6%
Commercial Vehicles 260 292 234 (9.9) (19.6) 2,311 1,995 (13.7)Bus 40 45 38 (5.2) (16.7) 282 289 2.3Truck 161 189 150 (6.8) (20.5) 1,520 1,312 (13.7)Tow Truck 20 21 17 (14.2) (18.1) 160 144 (10.4)Unfinished Bus 8 6 6 (25.5) 6.2 44 37 (15.0)Unfinished Truck 32 31 24 (25.2) (24.6) 304 212 (30.0)
Source: CEIC
Industry Focus
China Auto Sector
Page 4
Monthly total vehicle sales in China Monthly total vehicle sales growth in China
0.0
0.5
1.0
1.5
2.0
2.5
3.0
Jan Feb Mar Apr May Jun Jul Aug Sep Oct Nov Dec
2010 2011 20122013 2014 2015
m units
(60)(40)(20)
0 20 40 60 80
100 120 140
Jan/
06Ju
l/06
Jan/
07Ju
l/07
Jan/
08Ju
l/08
Jan/
09Ju
l/09
Jan/
10Ju
l/10
Jan/
11Ju
l/11
Jan/
12Ju
l/12
Jan/
13Ju
l/13
Jan/
14Ju
l/14
Jan/
15Ju
l/15
YoY growth MoM growth
%
Monthly PV sales in China Monthly PV sales growth in China
0.0
0.5
1.0
1.5
2.0
2.5
Jan Feb Mar Apr May Jun Jul Aug Sep Oct Nov Dec
2010 2011 2012
2013 2014 2015
m units
(60)(40)(20)
0 20 40 60 80
100 120 140
Jan/
06Ju
l/06
Jan/
07Ju
l/07
Jan/
08Ju
l/08
Jan/
09Ju
l/09
Jan/
10Ju
l/10
Jan/
11Ju
l/11
Jan/
12Ju
l/12
Jan/
13Ju
l/13
Jan/
14Ju
l/14
Jan/
15Ju
l/15YoY growth MoM growth
%
Monthly CV sales in China Monthly CV sales growth in China
0.0
0.1
0.2
0.3
0.4
0.5
0.6
Jan Feb Mar Apr May Jun Jul Aug Sep Oct Nov Dec
2010 2011 20122013 2014 2015
m units
(50)
0
50
100
150
200
Jan/
06Ju
l/06
Jan/
07Ju
l/07
Jan/
08Ju
l/08
Jan/
09Ju
l/09
Jan/
10Ju
l/10
Jan/
11Ju
l/11
Jan/
12Ju
l/12
Jan/
13Ju
l/13
Jan/
14Ju
l/14
Jan/
15Ju
l/15
YoY growth MoM growth
%
Source: CEIC

Industry Focus
China Auto Sector
Page 5
Dongfeng - total monthly sales
Dongfeng - total monthly sales growth
0
50,000
100,000
150,000
200,000
250,000
300,000
Jan
Feb
Mar
Apr
May Jun Jul
Aug Se
p
Oct
Nov
Dec
2012 2013 2014 2015
unit
-60%
-40%
-20%
0%
20%
40%
60%
80%
100%
-60%-40%-20%
0%20%40%60%80%
100%120%140%
Jan-
09A
pr-0
9Ju
l-09
Oct
-09
Jan-
10A
pr-1
0Ju
l-10
Oct
-10
Jan-
11A
pr-1
1Ju
l-11
Oct
-11
Jan-
12A
pr-1
2Ju
l-12
Oct
-12
Jan-
13A
pr-1
3Ju
l-13
Oct
-13
Jan-
14A
pr-1
4Ju
l-14
Oct
-14
Jan-
15A
pr-1
5
Y-o-Y growth (LHS) M-o-M growth (RHS)
GAC – total monthly sales
GAC – total monthly sales growth
0 20,000 40,000 60,000 80,000
100,000 120,000 140,000 160,000 180,000 200,000
Jan
Feb
Mar
Apr
May Jun Jul
Aug Se
p
Oct
Nov
Dec
2012 2013 2014 2015
unit
-100%
-50%
0%
50%
100%
150%
200%
Jan-
10M
ar-1
0M
a y-1
0Ju
l-10
Sep-
10N
ov-1
0Ja
n-11
Mar
-11
Ma y
-11
Jul-1
1Se
p-11
Nov
-11
Jan-
12M
ar-1
2M
a y-1
2Ju
l-12
Sep-
12N
ov-1
2Ja
n-13
Mar
-13
Ma y
-13
Jul-1
3Se
p-13
Nov
-13
Jan-
14M
ar-1
4M
a y-1
4Ju
l-14
Sep-
14N
ov-1
4Ja
n-15
Mar
-15
Ma y
-15
YOY growth MoM growth
Brilliance China – total monthly sales (BMW)
Brilliance China – total monthly sales growth (BMW)
0
5,000
10,000
15,000
20,000
25,000
30,000
35,000
Jan
Feb
Mar
Apr
May Jun Jul
Aug Se
p
Oct
Nov
Dec
2012 2013 2014 2015
unit
(50)
0
50
100
150
200
Jan-
10
Jul-1
0
Jan-
11
Jul-1
1
Jan-
12
Jul-1
2
Jan-
13
Jul-1
3
Jan-
14
Jul-1
4
Jan-
15
Jul-1
5
YoY growth MoM growth
%
Source: Companies

Industry Focus
China Auto Sector
Page 6
Geely – total monthly sales
Geely – total monthly sales growth
0
10,000
20,000
30,000
40,000
50,000
60,000
70,000
Jan
Feb
Mar
Apr
May Jun Jul
Aug Se
p
Oct
Nov
Dec
2012 2013 2014 2015
unit
-100%
-50%
0%
50%
100%
150%
200%
Jan-
09
Jul-0
9
Jan-
10
Jul-1
0
Jan-
11
Jul-1
1
Jan-
12
Jul-1
2
Jan-
13
Jul-1
3
Jan-
14
Jul-1
4
Jan-
15
Jul-1
5
YoY growth MoM growth
Great Wall Motor – total monthly sales
Great Wall Motor – total monthly sales growth
0 10,000 20,000 30,000 40,000 50,000 60,000 70,000 80,000 90,000
100,000
Jan
Feb
Mar
Apr
May Jun Jul
Aug Se
p
Oct
Nov
Dec
2012 2013 2014 2015
unit
-60%
-40%
-20%
0%
20%
40%
60%
80%
100%
Feb-
10Ju
n-10
Oct
-10
Feb-
11Ju
n-11
Oct
-11
Feb-
12Ju
n-12
Oct
-12
Feb-
13Ju
n-13
Oct
-13
Feb-
14Ju
n-14
Oct
-14
Feb-
15Ju
n-15
YoY growth MoM growth
%
Source: Companies
Automobile price index - domestic makes
Vehicle inventory alert index
50
60
70
80
90
100
110
Jan-
04Ju
l-04
Jan-
05Ju
l-05
Jan-
06Ju
l-06
Jan-
07Ju
l-07
Jan-
08Ju
l-08
Jan-
09Ju
l-09
Jan-
10Ju
l-10
Jan-
11Ju
l-11
Jan-
12Ju
l-12
Jan-
13Ju
l-13
Jan-
14
PV MiniSmall Medium classHigh class Luxury
Jan 2004 = 100
0
10
20
30
40
50
60
70
80
Jan-
13Fe
b-13
Mar
-13
Apr
-13
Ma y
-13
Jun-
13Ju
l-13
Au g
-13
Sep-
13O
ct-1
3N
ov-1
3D
ec-1
3Ja
n-14
Feb-
14M
ar-1
4A
pr-1
4M
a y-1
4Ju
n-14
Jul-1
4A
u g-1
4Se
p-14
Oct
-14
Nov
-14
Dec
-14
Jan-
15Fe
b-15
Mar
-15
Apr
-15
May
-15
Jun-
15Ju
l-15
%
Source: CEIC Source: CADA, DBS Vickers

Industry Focus
China Auto Sector
Page 7
NEV sales
PV sales by country mix (Jul-15)
0
10,000
20,000
30,000
40,000
50,000
60,000
70,000
80,000
2012 2013 2014 6M14 6M15
Pure electric Plug in hybrid
units
246%
CAGR: 142%
Self-owned Brands39%
Japanese Brands20%
German Brands19%
American Brands12%
Korean Brands
7%French Brands
3% Audi – monthly sales Audi – monthly sales growth
0
10
20
30
40
50
60
70
Jan
Feb
Mar
Apr
May Jun Jul
Aug Se
p
Oct
Nov
Dec
2012 2013 2014 2015
'000 units
(60)
(40)
(20)
0
20
40
60
80
Jan/
10
Jul/1
0
Jan/
11
Jul/1
1
Jan/
12
Jul/1
2
Jan/
13
Jul/1
3
Jan/
14
Jul/1
4
Jan/
15
YoY growth MoM growth
%
BMW Group – monthly sales
BMW Group – monthly sales growth
0.05.0
10.015.020.025.030.035.040.045.050.0
Jan
Feb
Mar
Apr
May Jun Jul
Aug Se
p
Oct
Nov
Dec
2012 2013 2014 2015
'000 units
(40)
(20)
0
20
40
60
80
100
Jan/
10
Jul/1
0
Jan/
11
Jul/1
1
Jan/
12
Jul/1
2
Jan/
13
Jul/1
3
Jan/
14
Jul/1
4
Jan/
15
YoY growth MoM growth
%
Source: CAAM, Companies

Industry Focus
China Auto Sector
Page 8
Mercedes-Benz – monthly sales
Mercedes-Benz – monthly sales growth
0
5
10
15
20
25
30
35
Jan
Feb
Mar
Apr
May Jun Jul
Aug Se
p
Oct
Nov
Dec
2012 2013 2014 2015
'000 units
(60)
(40)
(20)
0
20
40
60
80
100
Jan/
10
Jul/1
0
Jan/
11
Jul/1
1
Jan/
12
Jul/1
2
Jan/
13
Jul/1
3
Jan/
14
Jul/1
4
Jan/
15
YoY growth MoM growth
%
Source: Companies
Porsche – monthly sales
Porsche – monthly sales growth
0.0
1.0
2.0
3.0
4.0
5.0
6.0
7.0
Jan
Feb
Mar
Apr
May Jun Jul
Aug Se
p
Oct
Nov
Dec
2012 2013 2014 2015
'000 units
(60)(40)(20)
0 20 40 60 80
100 120
Sep/
11
Dec
/11
Mar
/12
Jun/
12
Sep/
12
Dec
/12
Mar
/13
Jun/
13
Sep/
13
Dec
/13
Mar
/14
Jun/
14
Sep/
14
Dec
/14
YoY growth MoM growth
%
Jaguar Land Rover – monthly sales
Jaguar Land Rover – monthly sales growth
0.0
2.0
4.0
6.0
8.0
10.0
12.0
14.0
Jan
Feb
Mar
Apr
May Jun Jul
Aug Se
p
Oct
Nov
Dec
2012 2013 2014 2015
'000 units
(100)
(50)
0
50
100
150
200
250
Feb/
10
Jun/
10
Oct
/10
Feb/
11
Jun/
11
Oct
/11
Feb/
12
Jun/
12
Oct
/12
Feb/
13
Jun/
13
Oct
/13
Feb/
14
Jun/
14
Oct
/14
Feb/
15
YoY growth MoM growth
%
Source: Companies

Industry Focus
China Auto Sector
Page 9
Peers’ valuations – Auto makers
Mk t PE PE Y ield Y ield P/Bk P/Bk EV /EBIT DA ROE ROECurrency Price Cap F iscal 15F 16F 15F 16F 15F 16F 15F 16F 15F 16F
Company Name Code Local$ US$m Yr x x % % x x x x % %Hong KongGZ Auto 'H'* 2238 HK HKD 6.44 5,345 Dec 7.2 6.2 4.2 4.8 0.8 0.8 4.8 4.2 12.3 12.9Sinotruk (Hongkong) 3808 HK HKD 4.29 1,528 Dec 17.2 13.9 2.0 2.3 0.5 0.5 4.4 4.0 2.7 3.2Dongfeng Motor 'H'* 489 HK HKD 9.3 10,337 Dec 4.6 4.0 2.4 2.4 0.7 0.6 2.5 1.8 17.4 17.1Brilliance China* 1114 HK HKD 10.46 6,786 Dec 7.3 6.4 1.3 1.4 1.9 1.4 7.2 6.6 29.3 25.2Great Wall Motor 'H'* 2333 HK HKD 24.95 9,791 Dec 5.6 4.6 6.3 7.6 1.5 1.2 4.5 3.6 28.9 28.4BYD 'H' 1211 HK HKD 36.3 11,593 Dec 29.4 24.1 0.1 0.1 2.1 1.9 11.1 10.3 7.0 6.6Qingling Motors 'H' 1122 HK HKD 2.55 816 Dec 10.2 8.5 8.8 10.3 0.7 0.6 n.a. n.a. 6.1 6.2Geely Automobile* 175 HK HKD 3.21 3,643 Dec 9.1 8.0 1.6 1.9 1.2 1.0 5.0 5.3 13.4 13.6BAIC Motor 'H' 1958 HK HKD 6.72 6,584 Dec 6.7 5.5 6.1 7.8 1.1 1.0 6.7 4.8 15.8 17.3A v erage 8.5~ 7.1~ 3.6 4.3 1.1 1.0 5.8 5.1 14.8 14.5
ChinaSAIC Motor 'A' 600104 CH CNY 20.06 35,613 Dec 7.3 6.7 6.7 7.4 1.2 1.1 7.4 7.2 17.7 17.5Faw Car 'A' 000800 CH CNY 20.41 5,349 Dec 38.3 27.2 0.4 0.6 3.6 3.2 19.5 16.4 6.6 8.8CQ Changan 'A' 000625 CH CNY 17.26 12,959 Dec 7.9 6.6 2.2 2.6 2.4 1.9 10.1 9.4 32.1 30.0CQ Changan 'B' 200625 CH HKD 14.3 8,602 Dec 5.2 4.3 3.3 4.3 1.6 1.3 29.5 24.0 33.9 32.1Beiqi Foton Motor 'A' 600166 CH CNY 7.65 4,108 Dec 16.2 n.a. 1.7 n.a. 1.5 n.a. n.a. n.a. n.a. n.a.Tianjin Faw Xiali 'A' 000927 CH CNY 7 1,798 Dec 233.3 n.a. 0.1 n.a. 3.3 n.a. n.a. n.a. n.a. n.a.Dong Feng Auto 'A' 600006 CH CNY 11.24 3,620 Dec 160.6 n.a. 0.2 n.a. 3.6 n.a. n.a. n.a. n.a. n.a.Anhui J ianghuai 'A' 600418 CH CNY 14.75 3,475 Dec 16.8 12.1 1.9 2.6 2.5 2.1 5.7 4.5 14.2 17.9Yutong Bus 'A' 600066 CH CNY 22.11 7,882 Dec 14.8 12.0 3.2 3.9 3.4 3.1 10.0 8.3 26.6 26.7Haima Automobile 'A' 000572 CH CNY 7.71 2,042 Dec 35.0 n.a. 0.9 n.a. 1.7 n.a. n.a. n.a. n.a. n.a.Great Wall Motor 'A'* 601633 CH CNY 34.33 16,818 Dec 9.8 8.0 3.6 4.4 2.5 2.0 7.5 6.4 28.5 28.1GZ Auto. 'A' 601238 CH CNY 18.87 19,552 Dec 30.7 23.0 1.0 1.2 3.2 2.9 51.5 28.8 10.1 12.3BYD 'A' 002594 CH CNY 65.7 26,194 Dec 75.3 55.7 0.1 0.1 5.5 4.8 18.0 14.5 8.4 9.1A v erage 23.4~ 17.3 1.9 3.0 2.8 2.5 17.7 13.3 19.8 20.3
USFord Motor F US USD 14.99 60,540 Dec 8.9 7.8 3.8 4.1 2.0 1.7 6.0 5.1 28.3 25.4General Motors GM US USD 31.94 50,593 Dec 7.1 6.3 4.3 4.5 1.4 1.2 3.2 2.9 20.6 20.5A v erage 8.0 7.0 4.1 4.3 1.7 1.5 4.6 4.0 24.5 22.9
KoreaKia Motors 000270 KS KRW 41,950 14,670 Dec 5.7 5.4 2.7 3.0 0.7 0.6 4.2 3.8 12.6 12.2Hyundai Motor 005380 KS KRW 139,000 34,232 Dec 5.2 5.1 2.7 3.1 0.6 0.5 5.5 5.2 11.2 10.7A v erage 5.5 5.2 2.7 3.0 0.6 0.6 4.8 4.5 11.9 11.4
J apanToyota Motor# 7203 JP JPY 8122 222,747 Mar 10.4 9.6 2.8 3.1 1.4 1.3 5.5 5.1 14.0 13.8Honda Motor# 7267 JP JPY 4394.5 63,872 Mar 13.1 11.1 2.2 2.6 1.1 1.0 5.9 5.3 8.6 9.6Nissan Motor# 7201 JP JPY 1193.5 43,292 Mar 9.5 8.4 3.5 4.0 1.0 0.9 5.3 4.9 10.5 10.9Suzuki Motor# 7269 JP JPY 4552 20,492 Mar 21.0 19.1 0.7 0.8 1.6 1.5 5.9 5.4 8.0 8.7Mitsubishi# 8306 JP JPY 891.6 101,364 Mar 11.6 10.9 2.2 2.4 0.8 0.7 n.a. n.a. 7.2 7.2A v erage 13.1 11.8 2.3 2.6 1.2 1.1 5.6 5.2 9.6 10.1
EuropeBMW BMW GR EUR 89.612 64,826 Dec 9.6 9.1 3.8 3.8 1.4 1.3 4.3 4.1 16.4 15.1Volkswagen (Swx) VOW GR CHF 185.88 89,892 Dec 7.5 6.7 3.3 3.7 1.1 1.0 2.6 2.4 8.9 13.6Saab 'B' SAABB SS SEK 219.2 2,745 Dec 18.4 15.0 2.3 2.8 2.0 1.8 9.8 8.7 10.3 12.5Peugeot UG FP EUR 17.635 15,636 Dec 13.4 10.3 0.0 0.8 1.4 1.2 2.6 2.4 11.2 11.4Porsche Aml.Hldg.Pref. PAH3 GR EUR 68.2 23,015 Dec 6.1 5.4 3.3 3.8 0.6 0.6 n.a. n.a. 11.5 11.1Daimler DAI GR EUR 80.515 94,918 Dec 10.1 9.1 3.7 4.2 1.7 1.5 5.1 4.7 17.9 17.7F iat Chrysler Auto FCA IM EUR 14.77 20,913 Dec 17.2 10.5 0.1 0.2 1.6 1.4 3.3 2.9 9.6 13.4A v erage 11.8 9.4 2.4 2.8 1.4 1.3 4.6 4.2 12.3 13.5
IndonesiaAstra International ASII IJ IDR 6,175 18,485 Dec 13.9 11.9 3.5 3.7 2.3 2.1 11.8 10.8 17.2 18.3 # FY15: FY16; FY16: FY17 ~ Exclude BYD Source: Thomson Reuters, *DBS Vickers

Industry Focus
China Auto Sector
Page 10
Peers’ valuations – Auto dealers
Mk t PE PE Y ield Y ield P/Bk P/Bk EV /EBIT DA ROE ROE
Currency Price Cap F iscal 15F 16F 15F 16F 15F 16F 15F 16F 15F 16F
Company Name Code Local$ US$m Yr x x % % x x x x % %
Hong Kong
Dah Chong Hong* 1828 HK HKD 3.58 846 Dec 7.1 5.9 4.2 5.1 0.7 0.6 7.2 6.2 9.6 10.6
ZhongSheng* 881 HK HKD 4.37 1,211 Dec 5.9 4.3 3.4 4.6 0.6 0.5 6.6 5.4 11.0 13.3
China ZhengTong* 1728 HK HKD 3.87 1,103 Dec 6.4 5.3 3.1 3.8 0.7 0.6 5.0 4.0 12.3 13.2
Baoxin Auto Group 1293 HK HKD 3.77 1,244 Dec 7.1 6.1 2.8 3.1 1.3 1.1 6.7 5.8 18.2 18.8
China Yongda 3669 HK HKD 4.58 874 Dec 8.2 4.9 3.6 6.0 1.2 0.9 5.0 3.5 16.1 20.6
China Meidong Auto 1268 HK HKD 1.19 169 Dec 7.0 5.2 4.0 5.5 1.3 1.0 n.a. n.a. 24.7 27.3
China Harmony Auto 3836 HK HKD 5.26 1,069 Dec 9.8 7.5 1.6 2.0 1.1 1.0 6.1 4.7 12.7 12.7
Sparkle Roll Group 970 HK HKD 0.44 169 Mar n.a. n.a. n.a. n.a. n.a. n.a. n.a. n.a. n.a. n.a.
Auto Italia Holdings 720 HK HKD 0.475 318 Dec n.a. n.a. n.a. n.a. n.a. n.a. n.a. n.a. n.a. n.a.
New Focus Auto 360 HK HKD 1.15 558 Dec n.a. n.a. n.a. n.a. n.a. n.a. n.a. n.a. n.a. n.a.
China Rundong Auto 1365 HK HKD 3.6 499 Dec 6.0 5.3 0.0 0.0 1.1 0.9 3.8 3.1 21.6 21.9
Sunfonda Group 1771 HK HKD 2.73 211 Dec n.a. n.a. n.a. n.a. n.a. n.a. n.a. n.a. n.a. n.a.
A v erage 7.2 5.6 2.8 3.8 1.0 0.8 5.8 4.7 15.8 17.3
Other A sia
J ardine Cyc.& Carr. JCNC SP SGD 29.91 8,555 Dec 10.6 9.9 3.8 4.2 1.5 1.4 5.4 5.0 14.0 13.4
Tan Chong Intl TCM MK HKD 2.55 662 Dec n.a. n.a. n.a. n.a. n.a. n.a. n.a. n.a. n.a. n.a.
Zhejiang Material 600704 CH CNY 21.75 3,488 Dec 29.0 n.a. 1.0 n.a. 4.2 n.a. n.a. n.a. n.a. n.a.
Power Diversity Auto 601258 CH CNY 5.4 5,635 Dec 62.1 31.2 0.3 n.a. 3.1 2.4 n.a. n.a. 6.5 9.5
Wuhu Yaxia Auto 002607 CH CNY 11.59 666 Dec 30.5 n.a. 0.9 n.a. 3.8 n.a. n.a. n.a. n.a. n.a.
Sinomach Auto 600335 CH CNY 26.28 2,654 Dec 16.6 15.7 n.a. n.a. n.a. n.a. n.a. n.a. 17.0 18.0
Yulon Motor 2201 TT TWD 30 1,495 Dec 14.3 11.8 3.0 3.5 0.7 0.6 8.3 8.5 4.5 5.5
Hotai Motor 2207 TT TWD 422.5 7,309 Dec 23.9 23.4 3.1 3.2 6.1 5.6 16.4 16.7 23.3 23.5
A v erage 26.7 18.4 2.0 3.6 3.2 2.5 10.0 10.0 13.1 14.0
US
Autonation AN US USD 61.27 6,951 Dec 14.8 13.3 0.0 0.0 2.9 2.4 9.1 8.5 21.1 19.0
Group 1 Auto GPI US USD 95.04 2,292 Dec 13.2 12.1 0.6 0.6 2.0 1.8 8.2 7.7 16.4 16.1
Asbury Auto ABG US USD 84.75 2,257 Dec 15.0 13.5 0.0 0.0 4.9 3.9 9.5 8.8 34.5 35.5
Carmax KMX US USD 63.41 13,192 Feb 20.7 18.5 0.0 0.0 3.9 3.5 14.9 13.7 19.4 20.6
Lentuo Intl LAS US USD 0.059 2 Dec n.a. n.a. n.a. n.a. n.a. n.a. n.a. n.a. n.a. n.a.
A v erage 15.9 14.4 0.2 0.2 3.4 2.9 10.4 9.7 22.9 22.8
Source: Thomson Reuters, *DBS Vickers

Industry Focus
China Auto Sector
Page 11
Peers’ valuations – Auto parts
EV / Earnings EarningsMk t PE PE P/Bk EBIT DA ROE Grow th CA GR
Currency Price Cap 15F 16F 15F 15F 15F 15F 16F F Y14-16Company Name Code Local$ US$m x x x x % % % %Hong Kong listedChangan Minsheng 1292 HK HKD 8.55 179 n.a. n.a. n.a. n.a. n.a. n.a. n.a. n.a.China Metal Intl.Hdg. 319 HK HKD 2.28 296 n.a. n.a. n.a. n.a. n.a. n.a. n.a. n.a.China Veh.Compns.Tech. 1269 HK HKD 2.7 134 n.a. n.a. n.a. n.a. n.a. n.a. n.a. n.a.Fortunet E-Commerce Gp. 1039 HK HKD 1.64 324 n.a. n.a. n.a. n.a. n.a. n.a. n.a. n.a.Fuyao Glass Industry Gp. Co.'H' 3606 HK HKD 16.86 5,312 12.5 11.0 2.0 10.0 20.2 17.5 18.2 17.9Huazhong In-Vehicle Hdg. 6830 HK HKD 1.79 369 n.a. n.a. n.a. n.a. n.a. n.a. n.a. n.a.Launch Tech 'H' 2488 HK HKD 13.4 522 n.a. 46.7 5.7 n.a. (1.6) n.a. (878.1) n.a.Minth Group* 425 HK HKD 15.76 2,246 10.9 9.4 1.5 8.1 14.6 13.4 16.2 14.7Nexteer Automotive Group* 1316 HK HKD 6.93 2,233 10.7 8.6 2.6 7.1 27.0 29.1 24.0 26.5Perennial Intl. 725 HK HKD 2.6 67 n.a. n.a. n.a. n.a. n.a. n.a. n.a. n.a.Shougang Ccrd.Cen.Hdg. 103 HK HKD 0.34 84 n.a. n.a. n.a. n.a. n.a. n.a. n.a. n.a.Weichai Power 'H' 2338 HK HKD 11.36 3,641 11.1 10.0 0.9 4.7 9.0 (38.6) 16.4 (15.5)Wuling Motors Holdings 305 HK HKD 0.66 155 n.a. n.a. n.a. n.a. n.a. n.a. n.a. n.a.Xinchen China Power Hdg.* 1148 HK HKD 2.40 399 6.6 4.7 0.9 5.1 14.0 36.7 40.9 38.8Xingda Intl.Holdings 1899 HK HKD 2.04 397 9.4 9.0 n.a. n.a. 5.0 (20.4) 4.6 (8.8)Xiny i Glass Holdings 868 HK HKD 3.99 2,018 8.2 6.5 1.2 7.9 14.9 43.5 23.6 33.2A v erage 9.9 8.5~ 2.1 7.2 12.9 28~ 20.6~ 15.3
China listedAnhui Quanchai Engine 600218 CH CNY 11.47 681 n.a. n.a. n.a. n.a. n.a. n.a. n.a. n.a.Av ic Aero-Engine Cntls. 000738 CH CNY 37.1 6,844 120.1 176.7 n.a. n.a. n.a. n.a. n.a. n.a.Changchai 200570 CH HKD 5.5 398 n.a. n.a. n.a. n.a. n.a. n.a. n.a. n.a.Fangda Special Stl.Tech. 600507 CH CNY 9.36 1,999 18.1 16.8 3.5 n.a. 18.1 20.4 7.9 14.0Faway Auto Compns. 600742 CH CNY 29.19 994 9.3 8.3 1.5 n.a. 16.8 20.4 11.8 16.0Fengfan Stock 600482 CH CNY 42.46 3,668 111.7 98.7 10.2 n.a. 8.6 40.5 13.5 26.3Fuyao Glss.Ind.Group 'A' 600660 CH CNY 13.81 5,432 12.7 11.0 2.2 9.6 21.1 16.2 17.8 17.0Guihang Auto Components 600523 CH CNY 25.26 1,175 n.a. n.a. n.a. n.a. n.a. n.a. n.a. n.a.Harbin Dongan Auto Enn. 600178 CH CNY 11.06 823 n.a. n.a. n.a. n.a. n.a. n.a. n.a. n.a.Huayu Automotive Sys.'A' 600741 CH CNY 17.79 7,400 9.8 8.6 1.8 5.0 19.1 11.2 14.0 12.6J ialeng Songzhi Auto 002454 CH CNY 17.6 1,149 21.2 18.0 2.5 n.a. 12.7 21.6 18.8 20.1J iangnan Mould & Plastic 000700 CH CNY 18.29 1,056 n.a. n.a. n.a. n.a. n.a. n.a. n.a. n.a.J iangsu Pac.Precn.Frgg. 'A' 300258 CH CNY 16.15 702 23.4 19.5 3.3 n.a. 13.0 31.4 35.8 33.6Kunming Yunnei Pwr. 000903 CH CNY 9.04 1,163 29.4 16.7 1.9 n.a. 5.5 52.4 68.7 60.4Liaoning Sg Autv .Gp. 'A' 600303 CH CNY 8.09 808 n.a. n.a. n.a. n.a. n.a. n.a. n.a. n.a.Lingyun Industrial 'A' 600480 CH CNY 19.34 1,126 43.0 36.5 2.6 n.a. 6.9 32.5 18.0 25.1Ningbo Huaxiang Elt. 002048 CH CNY 19.8 1,690 15.1 11.0 2.5 n.a. n.a. 32.3 37.7 35.0Shanghai Aerospace Auto 600151 CH CNY 16.35 3,291 44.3 32.0 5.0 n.a. 9.8 1956.5 38.6 433.9Shanghai J iao Yun Group 600676 CH CNY 12.35 1,715 n.a. n.a. n.a. n.a. n.a. n.a. n.a. n.a.Shenyang J inbei Autv . 600609 CH CNY 7.19 1,265 n.a. n.a. n.a. n.a. n.a. n.a. n.a. n.a.Sic.Chengfei Intg.Tech. 002190 CH CNY 53.8 2,990 n.a. n.a. n.a. n.a. n.a. n.a. n.a. n.a.Sichuan Haowu Erml.'A' 000757 CH CNY 10.81 786 n.a. n.a. n.a. n.a. n.a. n.a. n.a. n.a.Steyr Motors 'A' 000760 CH CNY 7.52 935 n.a. n.a. n.a. n.a. n.a. n.a. n.a. n.a.Wanxiang Qiangchao 'A' 000559 CH CNY 22.3 8,238 57.2 47.4 11.9 n.a. 21.0 25.1 23.2 24.1Weifu High Tech.Gp. 200581 CH HKD 27.28 3,590 11.3 8.8 1.9 11.1 16.7 59.4 28.6 43.1Xuchang Ynd.Drive Shaft 002406 CH CNY 10.73 969 n.a. n.a. n.a. n.a. n.a. n.a. n.a. n.a.Zhejiang Wanliyang Tnsm. 002434 CH CNY 14.6 1,199 28.0 20.9 3.1 n.a. 11.2 41.6 34.6 38.1Zongshen Pwr. Machinery 001696 CH CNY 17.25 3,180 45.8 44.9 5.5 n.a. n.a. 15.1 1.9 8.3China Autv .Sys. CAAS US USD 7.18 231 6.8 5.1 n.a. n.a. n.a. 0.9 33.8 16.2China Yuchai Intl. CYD US USD 14.79 581 6.4 6.0 n.a. n.a. 8.0 (22.4) 7.7 (8.6)Sorl Auto Parts SORL US USD 2.4 46 3.2 n.a. n.a. n.a. n.a. 6.2 n.a. n.a.A v erage 27.7~ 23.7~ 3.9 8.6 13.5 28.3~ 24.6 47.6
Source: Thomson Reuters, *DBS Vickers

Industry Focus
China Auto Sector
Page 12
PE charts
Brilliance China (1114 HK) Dongfeng Motor (489 HK)
0
5
10
15
20
25
Jan-
10
Jun-
10
Dec
-10
May
-11
Nov
-11
Apr
-12
Oct
-12
Mar
-13
Sep-
13
Mar
-14
Aug
-14
Feb-
15
Jul-1
5
x
Avg: 10.9x
+1SD: 14x
-1SD: 7.8x
0
2
4
6
8
10
12
14
Dec
-05
Oct
-07
Aug
-09
Jun-
11
Apr
-13
Feb-
15
x
Avg: 7.2x
+1SD: 9.1x
-1SD: 5.2x
Geely (175 HK) Great Wall Motor (2333 HK)
0
5
10
15
20
25
2008
2009
2010
2011
2012
2013
2014
2015
x
Avg: 10x
+1SD: 14.2x
-1SD: 5.7x
0
5
10
15
20
25
Dec
-03
May
-05
Nov
-06
Apr
-08
Sep-
09
Feb-
11
Aug
-12
Jan-
14
Jun-
15
x
Avg: 7.1x
+1SD: 10.9x
-1SD: 3.4x
Guangzhou Auto (2238 HK) BAIC (1958 HK)
5
10
15
20
25
30
35
40
Aug
-10
Aug
-11
Jul-1
2
Jul-1
3
Jun-
14
May
-15
x
Avg: 14x
+1SD: 19.8x
-1SD: 8.1x
4.0
5.0
6.0
7.0
8.0
9.0
10.0
11.0
Dec
-…D
ec-…
Jan-
15Ja
n-15
Jan-
15Fe
b-15
Feb-
15Fe
b-15
Mar
…M
ar…
Mar
…M
ar…
Apr
-…A
pr-…
Apr
-…M
ay…
May
…M
ay…
May
…Ju
n-15
Jun-
15Ju
n-15
Jul-1
5Ju
l-15
Jul-1
5A
ug…
Aug
…
x
Avg: 8x
+1SD: 9.1x
-1SD: 6.8x
Source: Thomson Reuters, DBS Vickers
Industry Focus
China Auto Sector
Page 13
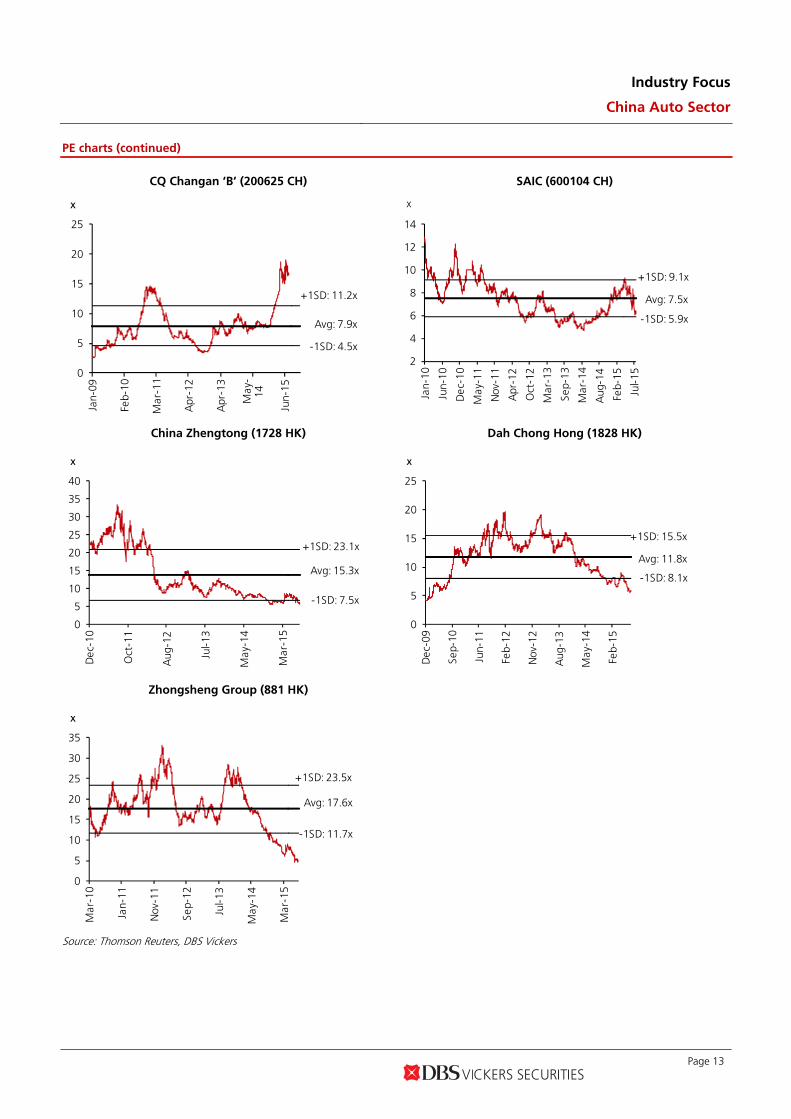
PE charts (continued)
CQ Changan ‘B’ (200625 CH) SAIC (600104 CH)
0
5
10
15
20
25
Jan-
09
Feb-
10
Mar
-11
Apr
-12
Apr
-13
May
-14
Jun-
15
x
Avg: 7.9x
+1SD: 11.2x
-1SD: 4.5x
2
4
6
8
10
12
14
Jan-
10
Jun-
10
Dec
-10
May
-11
Nov
-11
Apr
-12
Oct
-12
Mar
-13
Sep-
13
Mar
-14
Aug
-14
Feb-
15
Jul-1
5
x
Avg: 7.5x
+1SD: 9.1x
-1SD: 5.9x
China Zhengtong (1728 HK) Dah Chong Hong (1828 HK)
0
5
10
15
20
25
30
35
40
Dec
-10
Oct
-11
Aug
-12
Jul-1
3
May
-14
Mar
-15
x
Avg: 15.3x
+1SD: 23.1x
-1SD: 7.5x
0
5
10
15
20
25
Dec
-09
Sep-
10
Jun-
11
Feb-
12
Nov
-12
Aug
-13
May
-14
Feb-
15
x
+1SD: 15.5x
Avg: 11.8x
-1SD: 8.1x
Zhongsheng Group (881 HK)
0
5
10
15
20
25
30
35
Mar
-10
Jan-
11
Nov
-11
Sep-
12
Jul-1
3
May
-14
Mar
-15
x
Avg: 17.6x
+1SD: 23.5x
-1SD: 11.7x
Source: Thomson Reuters, DBS Vickers

Industry Focus
China Auto Sector
Page 14
PE charts (continued)
Minth (425 HK) Nexteer Automotive (1316 HK)
0
5
10
15
20
25
30
Dec
-05
Oct
-07
Aug
-09
Jun-
11
Apr
-13
Feb-
15
x
Avg: 10.8x
+1SD: 14.6x
-1SD: 7.1x
4
6
8
10
12
14
16
Oct
-13
Nov
-13
Jan-
14Fe
b-14
Apr
-14
May
-14
Jun-
14A
ug-1
4Se
p-14
Nov
-14
Dec
-14
Feb-
15M
ar-1
5M
ay-1
5Ju
n-15
Jul-1
5
x
Avg: 10.4x
+1SD: 12.3x
-1SD: 8.5x
+2SD: 14.1x
-2SD: 6.6x
Xinchen (1148 HK) Xingda Int’l (1899 HK)
468
1012141618202224
Mar
-13
Jul-1
3
Dec
-13
May
-14
Sep-
14
Feb-
15
Jun-
15
x
Avg: 11.7x
+1SD: 15.6x
-1SD: 7.9x
0
5
10
15
20
25
30
35
40
Dec
-06
Dec
-07
Dec
-08
Dec
-09
Dec
-10
Dec
-11
Dec
-12
Dec
-13
Dec
-14
Dec
-15
x
Avg: 11.2x
+1SD: 18.2x
-1SD: 4.1x
Source: Thomson Reuters, DBS Vickers

Industry Focus
China Auto Sector
Page 15
PB charts
Brilliance China (1114 HK) Dongfeng Motor (489 HK)
0.0
1.0
2.0
3.0
4.0
5.0
6.0
Jan-
10
Jun-
10
Dec
-10
May
-11
Nov
-11
Apr
-12
Oct
-12
Mar
-13
Sep-
13
Mar
-14
Aug
-14
Feb-
15
Jul-1
5
x
Avg: 2.8x
+1SD: 3.5x
-1SD: 2x
0.0
0.5
1.0
1.5
2.0
2.5
3.0
Dec
-05
Oct
-07
Aug
-09
Jun-
11
Apr
-13
Feb-
15
x
Avg: 1.4x
+1SD: 1.8x
-1SD: 1x
Geely (175 HK) Great Wall Motor (2333 HK)
0.0
0.5
1.0
1.5
2.0
2.5
3.0
3.5
4.0
2008
2009
2010
2011
2012
2013
2014
2015
x
Avg: 1.5x
+1SD: 2.1x
-1SD: 0.9x
0.0
0.5
1.0
1.5
2.0
2.5
3.0
3.5
4.0
Dec
-03
May
-05
Nov
-06
Apr
-08
Sep-
09
Feb-
11
Aug
-12
Jan-
14
Jun-
15
x
Avg: 1.4x
+1SD: 2.1x
-1SD: 0.6x
Guangzhou Auto (2238 HK) BAIC (1958 HK)
0.0
0.5
1.0
1.5
2.0
2.5
Aug
-10
Aug
-11
Jul-1
2
Jul-1
3
Jun-
14
May
-15
x
Avg: 1.2x
+1SD: 1.5x
-1SD: 0.9x
0.60
0.80
1.00
1.20
1.40
1.60
1.80
Dec
-14
Dec
-14
Jan-
15Ja
n-15
Jan-
15Fe
b-15
Feb-
15Fe
b-15
Mar
-15
Mar
-15
Mar
-15
Mar
-15
Apr
-15
Apr
-15
Apr
-15
Ma y
-15
Ma y
-15
Ma y
-15
Ma y
-15
Jun-
15Ju
n-15
Jun-
15Ju
l-15
Jul-1
5Ju
l-15
Au g
-15
Au g
-15
x
Avg: 1.4x
+1SD: 1.6x
-1SD: 1.2x
Source: Thomson Reuters, DBS Vickers

Industry Focus
China Auto Sector
Page 16
PB charts (continued)
CQ Changan ‘B’ (200625 CH) SAIC (600104 CH)
0.0
1.0
2.0
3.0
4.0
5.0
6.0
Jan-
09
Feb-
10
Mar
-11
Apr
-12
Apr
-13
May
-14
Jun-
15
x
Avg: 1.4x
+1SD: 2.3x
-1SD: 0.5x
0.0
0.5
1.0
1.5
2.0
2.5
3.0
3.5
Jan-
10
Jun-
10
Dec
-10
May
-11
Nov
-11
Apr
-12
Oct
-12
Mar
-13
Sep-
13
Mar
-14
Aug
-14
Feb-
15
Jul-1
5
x
Avg: 1.4x
+1SD: 1.8x
-1SD: 1x
China Zhengtong (1728 HK) Dah Chong Hong (1828 HK)
0.0
0.5
1.0
1.5
2.0
2.5
3.0
3.5
Dec
-10
Oct
-11
Aug
-12
Jul-1
3
May
-14
Mar
-15
x
Avg: 1.4x
+1SD: 2.1x
-1SD: 0.9x
0.0
0.5
1.0
1.5
2.0
2.5
3.0
Dec
-09
Sep-
10
Jun-
11
Feb-
12
Nov
-12
Aug
-13
May
-14
Feb-
15
x
+1SD: 1.9x
Avg: 1.4x
-1SD: 0.9x
Zhongsheng Group (881 HK)
0.0
1.0
2.0
3.0
4.0
5.0
6.0
Mar
-10
Jan-
11
Nov
-11
Sep-
12
Jul-1
3
May
-14
Mar
-15
x
Avg: 2.1x
+1SD: 3x
-1SD: 1.2x
Source: Thomson Reuters, DBS Vickers

Industry Focus
China Auto Sector
Page 17
PB charts (continued)
Minth (425 HK) Nexteer (1316 HK)
0.0
0.5
1.0
1.5
2.0
2.5
3.0
3.5
Dec
-05
Oct
-07
Aug
-09
Jun-
11
Apr
-13
Feb-
15
x
Avg: 1.5x
+1SD: 2x
-1SD: 1x
0.5
1.0
1.5
2.0
2.5
3.0
3.5
Oct
-13
Nov
-13
Jan-
14Fe
b-14
Apr
-14
May
-14
Jun-
14A
ug-1
4Se
p-14
Nov
-14
Dec
-14
Feb-
15M
ar-1
5M
ay-1
5Ju
n-15
Jul-1
5
x
Avg: 2.3x
+1SD: 2.8x
-1SD: 1.9x
+2SD: 3.3x
-2SD: 1.4x
Xinchen (1148 HK)
0.60.81.01.21.41.61.82.02.22.42.6
Mar
-13
Jul-1
3
Dec
-13
May
-14
Sep-
14
Feb-
15
Jun-
15
x
Avg: 1.4x
+1SD: 1.8x
-1SD: 1x
Source: Thomson Reuters, DBS Vickers

Industry Focus
China Auto Sector
Page 18
DBSV recommendations are based an Absolute Total Return* Rating system, defined as follows:
STRONG BUY (>20% total return over the next 3 months, with identifiable share price catalysts within this time frame)
BUY (>15% total return over the next 12 months for small caps, >10% for large caps)
HOLD (-10% to +15% total return over the next 12 months for small caps, -10% to +10% for large caps)
FULLY VALUED (negative total return i.e. > -10% over the next 12 months)
SELL (negative total return of > -20% over the next 3 months, with identifiable catalysts within this time frame)
Share price appreciation + dividends GENERAL DISCLOSURE/DISCLAIMER This report is prepared by DBS Vickers (Hong Kong) Limited (“DBSVHK”), a direct wholly-owned subsidiary of DBS Vickers Securities Holdings Pte Ltd ("DBSVH"). This report is intended for clients of DBSV Group only and no part of this document may be (i) copied, photocopied or duplicated in any form or by any means or (ii) redistributed without the prior written consent of DBSVHK. The research set out in this report is based on information obtained from sources believed to be reliable, but we (which collectively refers to DBSVHK and/or DBSVH) do not make any representation or warranty as to its accuracy, completeness or correctness. Opinions expressed are subject to change without notice. This document is prepared for general circulation. Any recommendation contained in this document does not have regard to the specific investment objectives, financial situation and the particular needs of any specific addressee. This document is for the information of addressees only and is not to be taken in substitution for the exercise of judgement by addressees, who should obtain separate independent legal or financial advice. DBSVHK accepts no liability whatsoever for any direct, indirect and/or consequential loss (including any claims for loss of profit) arising from any use of and/or reliance upon this document and/or further communication given in relation to this document. This document is not to be construed as an offer or a solicitation of an offer to buy or sell any securities. DBSVH is a wholly-owned subsidiary of DBS Bank Ltd. DBS Bank Ltd along with its affiliates and/or persons associated with any of them may from time to time have interests in the securities mentioned in this document. DBSVHK, DBS Bank Ltd and their associates, their directors, and/or employees may have positions in, and may effect transactions in securities mentioned herein and may also perform or seek to perform broking, investment banking and other banking services for these companies. Any valuations, opinions, estimates, forecasts, ratings or risk assessments herein constitutes a judgment as of the date of this report, and there can be no assurance that future results or events will be consistent with any such valuations, opinions, estimates, forecasts, ratings or risk assessments. The information in this document is subject to change without notice, its accuracy is not guaranteed, it may be incomplete or condensed and it may not contain all material information concerning the company (or companies) referred to in this report. The valuations, opinions, estimates, forecasts, ratings or risk assessments described in this report were based upon a number of estimates and assumptions and are inherently subject to significant uncertainties and contingencies. It can be expected that one or more of the estimates on which the valuations, opinions, estimates, forecasts, ratings or risk assessments were based will not materialize or will vary significantly from actual results. Therefore, the inclusion of the valuations, opinions, estimates, forecasts, ratings or risk assessments described herein IS NOT TO BE RELIED UPON as a representation and/or warranty by DBSVHK and/or DBSVH (and/or any persons associated with the aforesaid entities), that:
a. such valuations, opinions, estimates, forecasts, ratings or risk assessments or their underlying assumptions will be achieved, and
b. there is any assurance that future results or events will be consistent with any such valuations, opinions, estimates, forecasts, ratings or risk assessments stated therein.
Any assumptions made in this report that refers to commodities, are for the purposes of making forecasts for the company (or companies) mentioned herein. They are not to be construed as recommendations to trade in the physical commodity or in the futures contract relating to the commodity referred to in this report. DBS Vickers Securities (USA) Inc ("DBSVUSA"), a U.S.-registered broker-dealer, does not have its own investment banking or research department, nor has it participated in any investment banking transaction as a manager or co-manager in the past twelve months. ANALYST CERTIFICATION The research analyst primarily responsible for the content of this research report, in part or in whole, certifies that the views about the companies and their securities expressed in this report accurately reflect his/her personal views. The analyst also certifies that no part of his/her compensation was, is, or will be, directly, or indirectly, related to specific recommendations or views expressed in this report. As of the date the report is published, the analyst and his / her spouse and/or relatives and/or associate who are financially dependent on the analyst, do not hold interests in the securities recommended in this report (“interest” includes direct or indirect ownership of securities, directorships and trustee positions).

Industry Focus
China Auto Sector
Page 19
COMPANY-SPECIFIC / REGULATORY DISCLOSURES 1. DBSVHK and its subsidiaries do not have a proprietary position in the securities recommended in this report as of the date the report is
published.
2. DBSVHK, DBSVUSA, DBS Bank Ltd and/or other affiliates may beneficially own a total of 1% or more of any class of common equity securities of the subject companies mentioned in this document as of the latest available date of the updated information.
3. Compensation for investment banking services: DBSVHK, DBSVUSA, DBS Bank Ltd and/or other affiliates have received compensation, within the past 12 months, and within the next 3 months may receive or intends to seek compensation for investment banking services from Astra International Terbuka (ASII IJ) mentioned in this document.
DBSVUSA does not have its own investment banking or research department, nor has it participated in any investment banking transaction as a manager or co-manager in the past twelve months. Any US persons wishing to obtain further information, including any clarification on disclosures in this disclaimer, or to effect a transaction in any security discussed in this document should contact DBSVUSA exclusively.
RESTRICTIONS ON DISTRIBUTION General This report is not directed to, or intended for distribution to or use by, any person or entity who is a citizen or resident of or
located in any locality, state, country or other jurisdiction where such distribution, publication, availability or use would be contrary to law or regulation.
Australia This document is being distributed in Australia by DBSVHK, which is exempted from the requirement to hold an Australian Financial Services Licence under the Corporation Act 2001 [“CA”] in respect of financial services provided to the recipients. DBSVHK is regulated by the Securities and Futures Commission under the laws of Hong KONG, which differ from Australian laws. Distribution of this report is intended only for “wholesale investors” within the meaning of the CA.
Hong Kong This report is being distributed in Hong Kong by DBS Vickers (Hong Kong) Limited which is licensed and regulated by the Hong Kong Securities and Futures Commission.
Indonesia This report is being distributed in Indonesia by PT DBS Vickers Securities Indonesia.
Malaysia This report is distributed in Malaysia by AllianceDBS Research Sdn Bhd ("ADBSR"). Recipients of this report, received from ADBSR are to contact the undersigned at 603-2604 3333 in respect of any matters arising from or in connection with this report. In addition to the General Disclosure/Disclaimer found at the preceding page, recipients of this report are advised that ADBSR (the preparer of this report), its holding company Alliance Investment Bank Berhad, their respective connected and associated corporations, affiliates, their directors, officers, employees, agents and parties related or associated with any of them may have positions in, and may effect transactions in the securities mentioned herein and may also perform or seek to perform broking, investment banking/corporate advisory and other services for the subject companies. They may also have received compensation and/or seek to obtain compensation for broking, investment banking/corporate advisory and other services from the subject companies.
Wong Ming Tek, Executive Director, ADBSR
Singapore This report is distributed in Singapore by DBS Bank Ltd (Company Regn. No. 196800306E) or DBSVS (Company Regn No. 198600294G), both of which are Exempt Financial Advisers as defined in the Financial Advisers Act and regulated by the Monetary Authority of Singapore. DBS Bank Ltd and/or DBSVS, may distribute reports produced by its respective foreign entities, affiliates or other foreign research houses pursuant to an arrangement under Regulation 32C of the Financial Advisers Regulations. Where the report is distributed in Singapore to a person who is not an Accredited Investor, Expert Investor or an Institutional Investor, DBS Bank Ltd accepts legal responsibility for the contents of the report to such persons only to the extent required by law. Singapore recipients should contact DBS Bank Ltd at 6327 2288 for matters arising from, or in connection with the report.
Thailand This report is being distributed in Thailand by DBS Vickers Securities (Thailand) Co Ltd. Research reports distributed are only intended for institutional clients only and no other person may act upon it.
United Kingdom
This report is being distributed in the UK by DBS Vickers Securities (UK) Ltd, who is an authorised person in the meaning of the Financial Services and Markets Act and is regulated by The Financial Conduct Authority. Research distributed in the UK is intended only for institutional clients.
Dubai
This research report is being distributed in The Dubai International Financial Centre (“DIFC”) by DBS Bank Ltd., (DIFC Branch) having its office at PO Box 506538, 3rd Floor, Building 3, East Wing, Gate Precinct, Dubai International Financial Centre (DIFC), Dubai, United Arab Emirates. DBS Bank Ltd., (DIFC Branch) is regulated by The Dubai Financial Services Authority. This research report is intended only for professional clients (as defined in the DFSA rulebook) and no other person may act upon it.
United States Neither this report nor any copy hereof may be taken or distributed into the United States or to any U.S. person except in compliance with any applicable U.S. laws and regulations. It is being distributed in the United States by DBSV US, which accepts responsibility for its contents. Any U.S. person receiving this report who wishes to effect transactions in any securities referred to herein should contact DBS Vickers Securities (USA) Inc (“DBSVUSA”) directly and not its affiliate.
Other jurisdictions
In any other jurisdictions, except if otherwise restricted by laws or regulations, this report is intended only for qualified, professional, institutional or sophisticated investors as defined in the laws and regulations of such jurisdictions.
DBS Vickers (Hong Kong) Limited
18th Floor Man Yee building, 68 Des Voeux Road Central, Central, Hong Kong
Tel: (852) 2820-4888, Fax: (852) 2868-1523
Related Documents