Alma Mater Studiorum – Università di Bologna in cotutela con Università Politecnica di Valencia DOTTORATO DI RICERCA IN CHIMICA Ciclo XXVII Settore Concorsuale di afferenza: CHIM04 Settore Scientifico disciplinare: 03/C2 Glycerol oxidehydration to acrylic acid on complex mixed-metal oxides Presentata da: Chieregato Alessandro Coordinatore Dottorato Relatori Prof. Dr. Aldo Roda Prof. Dr. Fabrizio Cavani (UNIBO) Prof. Dr. José Manuel López Nieto (UPV) Correlatori Prof. Dr. Francesco Basile (UNIBO) Dr. Mª Dolores Soriano Rodriguez (UPV) Esame finale anno 2015

Welcome message from author
This document is posted to help you gain knowledge. Please leave a comment to let me know what you think about it! Share it to your friends and learn new things together.
Transcript
AAllmmaa MMaatteerr SSttuuddiioorruumm –– UUnniivveerrssiittàà ddii BBoollooggnnaa in cotutela con Università Politecnica di Valencia
DOTTORATO DI RICERCA IN
CHIMICA
Ciclo XXVII
Settore Concorsuale di afferenza: CHIM04 Settore Scientifico disciplinare: 03/C2
Glycerol oxidehydration to acrylic acid on complex mixed-metal oxides
Presentata da: Chieregato Alessandro
Coordinatore Dottorato Relatori
Prof. Dr. Aldo Roda Prof. Dr. Fabrizio Cavani (UNIBO)
Prof. Dr. José Manuel López Nieto (UPV)
Correlatori
Prof. Dr. Francesco Basile (UNIBO)
Dr. Mª Dolores Soriano Rodriguez (UPV)
Esame finale anno 2015
2
The degree of civilization of any epoch, people,
or group of peoples, is measured
by ability to utilize energy for human
advancement or people needs
Human Origins, G. G. MacCurdy, 1924
3
PREFACE........................................................................................ 6
1 INTRODUCTION............................................................................. 9
1.1
1.2
1.3
1.4
1.5
1.6
1.7
1.8
From oil to renewables..............................................................................
Green and sustainable chemistry..............................................................
Biorefineries...............................................................................................
Cellulosic biomass to fuels.........................................................................
1.4.1 Biomass gasification.....................................................................
1.4.2 Biomass hydrolysis........................................................................
1.4.3 Bio-oil.............................................................................................
1.4.3.1 Bio-oil from fast pyrolysis................................................
1.4.3.2 Bio-oil from liquefaction..................................................
Vegetable oils and animal fats to fuels......................................................
Platform chemicals for biorefineries..........................................................
Glycerochemistry.......................................................................................
1.7.1 Production of acrolein and acrylic acid from glycerol.......................
1.7.2 Life Cycle Assessment (LCA) for the production of acrolein from
glycerol.......................................................................................................
Vanadium substituted HTBs: complex mixed-oxides for glycerol
oxidehydration to acrylic acid....................................................................
9
11
12
13
13
14
14
15
15
16
17
19
20
23
24
2 EXPERIMENTAL.............................................................................. 33
2.1
2.2
Catalyst synthesis.......................................................................................
2.1.1 Hydrothermal synthesis of HTBs.......................................................
2.1.2 Ion-exchange and Incipient wetness impregnation..........................
2.1.3 Hydrothermal synthesis of modified AlPO-5.....................................
2.1.4 Slurry synthesis of a M5O14-like oxide...............................................
Catalyst characterization...........................................................................
2.2.1 Surface area and textural properties................................................
2.2.2 Scanning electron microscopy (SEM)................................................
2.2.3 Transmission electron microscopy (TEM)..........................................
2.2.4 Powder X-ray Diffraction (Powder-XRD)...........................................
2.2.5 Fourier transform infrared spectroscopy (FTIR)................................
2.2.6 X-ray absorption spectroscopy (XAS)................................................
2.2.7 Pulse chemisorption and temperature-programmed desorption of
ammonia....................................................................................................
2.2.8 FTIR of adsorbed carbon monoxide or ammonia..............................
2.2.9 Raman spectroscopy.........................................................................
2.2.10 X-ray photoelectron spectroscopy (XPS).........................................
33
33
34
36
37
37
37
39
40
41
42
43
44
45
46
47
4
2.3 Catalytic testing ......................................................................................... 49
3 RESULTS AND DISCUSSION............................................................ 53
3.1
3.2
3.3
3.4
3.5
Introduction of Niobium in V-substituted HTBs........................................
3.1.1 Physicochemical properties of the oxides..........................................
3.1.2 Lab-scale reactor tests......................................................................
3.1.3 Conclusions........................................................................................
Nb- and V-substituted HTBs: the influence of reaction conditions on
catalytic performance in glycerol oxidehydration.....................................
3.2.1 Physicochemical properties of the oxides.........................................
3.2.2 Lab-scale reactor tests......................................................................
3.2.3 Conclusions.......................................................................................
3.2.4 Notes on reaction conditions and process safety.............................
Introduction of Molybdenum in V-substituted HTBs.................................
3.3.1 Physicochemical properties of the oxides..........................................
3.3.2 Lab-scale reactor tests......................................................................
3.3..3 Conclusions.......................................................................................
The importance of acid-redox properties and structure-reactivity
correlations in one-pot glycerol oxidehydration........................................
3.4.1 Physicochemical properties of the oxides..........................................
3.4.2 Lab-scale reactor tests......................................................................
3.4.3 Conclusions........................................................................................
X-ray Absorption Spectroscopy (XAS) with synchrotron radiation as a
tool to better comprehend the complex structure of substituted-HTBs...
3.5.1 From reagents to HTBs......................................................................
3.5.2 Vanadium coordination in HTBs........................................................
53
53
58
65
67
67
73
84
85
87
87
93
105
106
107
113
125
127
128
131
4 OVERALL CONCLUSIONS................................................................ 134
5 PUBLICATIONS............................................................................... 136
5.1
5.2
Publications related to the research project presented in this PhD
thesis..........................................................................................................
Publications related to other projects.......................................................
136
136
6 BIBLIOGRAPHY.............................................................................. 137
APPENDIX...................................................................................... 144
(i) Summary in English...............................................................................
(ii) Summary in Spanish.............................................................................
(iii) Summary in Valencian.........................................................................
144
145
146
Acknowledgements....................................................................... 147

5
6
Preface
This PhD thesis relates to the synthesis, characterization and catalytic testing of mixed-metal
oxides for the conversion of glycerol into acrylic acid as a one-pot reaction. The project is based
on a co-supervised collaboration between Università di Bologna, ALMA MATER STUDIORUM
(Italy) and Instituto de Tecnología Química, Universitat Politècnica de València ITQ-UPV-CSIC
(Spain). The thesis work was carried out from January 2012 to December 2014. 20 months were
spent in Bologna and 16 months in Valencia.
After the publication of a first study on Vanadium-substituted Hexagonal-Tungsten-Bronzes
(HTBs) by the group of research [1], the investigation on glycerol oxidehydration has continued
and the results obtained are reported in this thesis. The main objectives have been those of
improving the catalytic performance and gaining further insights at the molecular level. Deeper
characterizations of the titled complex mixed oxides was carried out also by means of X-ray
Absorption Spectroscopy (XAS) using synchrotron radiation and high resolution transmission
electron microscopy (HR-TEM). Attention was focused on the introduction of Niobium or
Molybdenum in V-substituted HTBs. Furthermore, a systematic study on the influence of redox
and acid properties was performed by modifying V-substituted HTBs with potassium. Other
multifunctional oxides were also studied and compared to HTBs.
As it will be further discussed in the following sections, HTBs have been studied and applied for
decades in various fields of material science. However, in spite of their great potential, very
limited attention was given to their application in catalysis. Results reported herein might
represent a contribution for their wider application in catalysis, particularly for the conversion of
renewable polyoxygenated compounds.
Going more into details, the main objectives of this Ph.D. thesis, i.e. the synthesis,
characterization and catalytic testing of mixed-metal oxides for the conversion of glycerol into
7
acrylic acid as a one-pot reaction, have been carried out following different approaches. As far as
the synthesis is concerned, hydrothermal preparation was used as a novel and more controllable
method to introduce niobium or molybdenum in the W-V HTBs, so as to improve respectively the
acid or the redox properties of the catalysts. Compared to the ceramic method (see next
sections), the hydrothermal synthesis allows making mixed-oxide with morphology and
crystalline phases in a much quicker, milder and controllable way. Moreover, the final surface
area of the oxides obtained is consistently higher, hence favoring the catalytic phenomenon.
Finally, vanadium-modified Al-P-Co-oxides were also prepared by hydrothermal synthesis and
used as reference materials along with some commercial samples, both for characterization and
catalytic testing purposes.
Due to the complexity of the materials prepared, an in depth physicochemical characterization
was performed using state-of-the-art techniques. Fresh and spent catalysts were analyzed by
spectroscopic methods such as Raman, FTIR, XPS and XAS to gain insights on the oxidation state,
coordination and surface content of the elements, so as to correlate these features to the
catalytic performance and in turn design new catalysts with tailor-made properties. FTIR studies
with probe molecules (e.g. ammonia and carbon monoxide) were used to study the catalyst
surface properties and H2-TPR tests were used to analyze the redox properties of the mixed-
oxides prepared. Surface area analyses performed by N2-adsorption were also combined with
microscopy characterization using (HR-)SEM and (HR-)TEM to determine the morphology and the
long-range order of the crystals.
Finally, catalytic tests were performed in the gas-phase in lab-scale fixed-bed reactors operating
at atmospheric pressure and temperature variable between 250°C and 410°C. The products
obtained were qualified and quantified by on-line and off-line GC, GC-MS and MS-ESI. The
8
influence of the partial pressures of reactants on the products distribution was studied into
details as well as the catalysts productivity.
The combination of the physicochemical characterization and the catalytic tests allowed
improving the knowledge and the catalytic performance on the one-pot transformation of
glycerol into acrylic acid on single catalysts. Structure-reactivity correlations were also gained
comparing the substituted-HTBs to other multifunctional systems containing vanadium as the
redox element.
9
1. Introduction
1.1 From oil to renewables
Life is unconditionally dependent from energy. In 1944, the Nobel laureate physicist Erwin
Schrödinger used thermodynamic as a tool to explain this relationship [2]: "[...] a living organism
continually increases its entropy -or, as you may say, produces positive entropy- and thus tends to
approach the dangerous state of maximum entropy, which is of death. It can only keep aloof from
it, i.e. alive, by continually drawing from its environment negative entropy, [...] freeing itself from
all the entropy it cannot help producing while alive".
In the last hundred years or so, the human race has got the greatest ever available source of
energy (i.e. negative entropy) thanks to the availability of massive amounts of petroleum. This has
made clearly apparent the existing correlation between energy and life; indeed, such energy has
been transformed into food, fuels, fertilizer, drugs and an enormous quantity of other goods that
have made it possible for (part of) the human race to reach a general status of wellness that had
never been observed before in the human history. For instance, the average life expectancy in
Europe moved from 50 years in 1900 to 80 years in 2008 [3] and the world population moved
from 1.6 billion in 1900 [4] to more than 7 billion today.
However, hand in hand with the oil depletion and related environmental issues, pivotal questions
have been raised on the sustainability of our modern lifestyle and future availability of resources.
Although "degrowth theories" and "degrowth movements" are attracting increasing attention
worldwide [5], it is hard to predict if the model of capitalism so far ruling our society is going to be
replaced soon (particularly in case the current financial and economic crisis reached an endpoint).
Indeed, in the aim of assuring the long-term existence of this economic model, since the 1970s oil
crisis both governments and private corporations have started to look for alternative sources of
10
energy; particularly, due to both the developing mandatory environmental policies and strategic
differentiation of the energy-source portfolio. In this context and with alternate fortune, the
biorefinery [6], green chemistry and sustainability concepts have been developed [7, 8] (however,
even if not explicitly referred to as so, the same general philosophy can be located much earlier in
the history of science).
Before going into details of these subjects, some important but more general points on the future
of the chemical and the fuel industry have to be underlined. In spite of the great environmental
issues and fossil sources exhaustion, as well as the conspicuous worldwide investments in the
renewable sector, energy outlooks for the next 20-40 years seem to firmly assert that
conventional sources (mainly coal, gas and oil) will still represent more than the 60-70% energy
source of the fuel sector [9-11]; in 2035 renewable resources are forecasted to represent only
<7% of the total fuel division. Because of the strict relationship between the fuels and the
chemical industry (only ca. 5% of the total petroleum goes to chemical products and trends are
not expected to change in biorefineries [12]) it appears quite difficult to predict a surpass of
renewable building blocks to the fossil ones in the chemical industry. At least in the next 20 years.
A main player in directing such tendencies might be the availability of natural gas at a cheap price.
With the increasing oil price and the availability of new technologies (e.g. horizontal drilling and
hydraulic fracturing), it is now possible to extract natural gas from shale formations previously
unexploited [13]. Generally speaking, the latter option is considered as a major negative impact to
the development of bio-based chemicals; however, different viewpoints have been recently
proposed [14] and a lack of conventional petrochemical feedstocks in the "shale gas scenario" is
actually proposed as a new opportunity for bio-based chemicals.
Overall, in the current unstable political, economical and energetic worldwide situation any
outlooks is quite likely to be unreliable in the medium-long term. Instead, what is assuredly true is
11
the non-sustainability of fossil resources, as well as the derived environmental issues. Hence,
maybe not in the next 20 years or so, but for sure the next generations will have to face these
problems and the current technological and scientific development is pivotal to pave the way for
a vaster utilization of renewable resources as feedstocks.
1.2 Green and Sustainable Chemistry
The concept of Green Chemistry was introduced in the early 1990s in the USA, and it has reached
its today's relevance with the introduction in 1998 of the twelve principles of Green Chemistry [8].
In the USA and UK "green chemistry" has become synonymous with chemical industrial processes
that avoid (toxic) by-products as much as possible: the greening of industry [7]. However, the
underlying meaning of the terms green chemistry and sustainable chemistry is different.
Sustainable chemistry is the maintenance and continuation of an ecological-sound development,
whereas green chemistry focuses on the design, manufacture, and use of chemicals and chemical
processes that have little or no pollution potential or environmental risk and are both
economically and technologically feasible. In Europe, apart from in the UK, the term sustainable
chemistry is now preferred over green chemistry, but this practice is extending worldwide [7].
Overall, the concept of sustainability as "meeting the needs of the present generation without
compromising the needs of future generations to meet their own needs" [15] is mandatory.
Indeed, without this goal in mind, whatever the energy source is, if we exploit resources at a
higher rate than their ability of formation, the next generations (and likely ourselves, too) will
have to pay a high price in terms of quality of life. Energy efficiency and responsible utilization of
(renewable) resources have to be the cornerstones of a new perspective of doing business.
12
1.3 Biorefineries
The biorefinery concept as we know it today was defined in the 1990s [6] and it is currently
considered as " the sustainable processing of biomass into a spectrum of marketable products
(food, feed, materials, chemicals) and energy (fuels, power, heat)" [16]. In contrast to the oil-
refinery, the bio-refinery consists not only of chemical processes but also fermentations. The
choice of one or the other technology is related to economic and engineering considerations. The
term (industrial) biomass means any organic matter that is available on a renewable or recurring
basis, including dedicated energy crops and trees, agricultural food and feed crop residues,
aquatic plants, wood and wood residues, animal wastes, and other waste materials usable for
industrial purposes (energy, fuels, chemicals, materials) and include wastes and co-wastes of food
and feed processing [6]. Specifically, it is possible to classify the biomass in three different
generations [17]:
1st generation, based on standard crops;
2nd generation, based on residues, agro-industrial residues and non-edible crops;
3rd generation, based on algae.
The first generation raised important ethic issues mainly due to the competition with food
production [18], but it has been crucial for developing the current status of biorefineries. The
second generation, although largely limits the latter problem, it still moves concerns over
competing land use or required land use changes. Hence, the third generation seems to be the
most sustainable option since it avoids strain on world food markets, water shortages and
destruction of the world’s forests [19]. Nonetheless, both for economic and technological reasons,
to date hardly any production of algae is carried out at hundreds ton capacity, as it would be
required for industrial scale synthesis of fuels and chemicals [20, 21]. For these reasons, a great
13
deal of attention has being paid to first and second generation biomass; with particular focus on
(i) cellulosic biomass and (ii) vegetable oils and animal fats.
1.4 Cellulosic biomass to fuels
As far as cellulosic biomass is concerned, the main input of the biorefineries using this raw
material would be a mixture of more or less complex polysaccharides and lignin. Indeed, by
means of new biomass pre-treatment technologies as well as direct- and genetic-manipulations of
the plants, it is now possible to produce lignin feedstocks "easy" to depolymerise with favourable
properties for recovery and downstream conversion [22]. Lignocellulosic material can be
transformed into liquid fuels by three different primary routes [23]:
syngas production by gasification;
hydrolysis of biomass to produce sugar monomer units;
bio-oil production by (fast)pyrolysis or liquefaction.
1.4.1 Biomass gasification
Gasification is an old technological process (already used in 1940s) in which solid or liquid
carbonaceous materials (e.g. biomass) react with oxygen, and/or steam at temperature >700°C to
produce syngas (CO+H2). A complex combination of reactions in the solid, liquid, and gas phases
occurs during biomass gasification, including pyrolysis, partial oxidation, and steam gasification
[23]. Syngas is then used in a number of conventional processes, e.g. water gas shift, Fischer-
Tropsch, methanol synthesis etc. to produce fuels and chemicals.
14
1.4.2 Biomass hydrolysis
This process consists in cellulose depolymerisation into sugar polymers, finally into C5 and C6 sugar
monomers. It can be carried out by fermentations or chemical processes with strong inorganic
acids more or less diluted (from 2% to 30%), under ambient temperature and pressure, or up to
200°C and 30 bar [23, 24]. Another pivotal variable is the biomass pretreatment since it
determines the accessibility of the cellulosic material to acids or microorganisms, which allowed
obtaining sugars yield up to 90% of the theoretical one [24]. Once sugars are obtained, a number
of intermediates can be produced with the final aim of producing bio-fuels and bio-chemicals. For
instance, ethanol can be produced by fermentation processes and used directly as a fuel;
moreover, Hydroxy Methyl Furfural (HMF) can be synthesized by dehydration of all types of C6
carbohydrates [25] and it can be further converted into C9-C12 alkanes [26]. HMF can also be
converted into levulinic acid (LA) which is converted to C9 ketons used as fuels [26]. In turn, LA
can be dehydrated and hydrogenated to ϒ-valerolactone (GVL) which can be upgraded to liquid
alkenes [27]. However, in spite of the great number of papers reported, the overall production of
bio-fuels and bulk-chemicals from biomass hydrolysis is currently generally indicated as leading to
low yields and high production costs [25, 26].
1.4.3 Bio-oil
Bio-oils chemistry is strongly dependent on a great number of variables, as the raw-materials
used, process technologies, etc. Generally speaking, they are characterized by more than 400
compounds, relatively little sulphur and nitrogen and high oxygen content (ca. 40%); the
components are monofunctional, like phenol and acetic acid, and multifunctional, like
hydroxyacetaldehyde and guaiacol. Char and residual alkali metals (e.g., Na, K) are also present
[23, 28].
15
1.4.3.1 Bio-oil from Fast Pyrolysis
Fast pyrolysis is used as an independent process or as a pre-treatment for gasification. To produce
bio-oil, the biomass feedstock is heated (at ca. 500°C) in the absence of air, forming a gaseous
product, which then condenses [23]. The produced pyrolysis bio-oil can either be directly
combusted in a gas turbine to generate electricity or to be fed to a high temperature (1000–
1600°C) gasifier for efficient conversion to syngas and hydrogen [29].
1.4.3.2 Bio-oil from liquefaction
Cellulosic biomass liquefaction consists in the direct conversion of complete plants into liquid
fuels, without the gasification step [30]. After mechanical treatments to reduce the plants into
small particles, the obtained biomass is immersed in a solvent, slurried and heated in a
temperature range 250-450°C and pressures up to 250 bars; in doing so the biomass (cellulose,
hemicellulose, and lignin) is depolymerised to produce smaller molecules. At the same time, by
means of reducing gas (e.g. pure H2 or syngas) and hydrogenating catalysts, the oxygen-to-carbon
ratio of the biomass is reduced and eliminated as water and COx; moreover, the hydrogen-to-
carbon ratio is increased. Therefore, the general stoichiometry characterizing dry wood biomass,
i.e. CH1.4O0.7, is transformed towards the general "CH2" stoichiometry defining conventional fuels
[30]. The overall process can be summarized with the formula: CH1.4O0.7 + H2 (+CO) → CH2 + H2O +
COx. Another option is to perform the liquefaction process without reducing gas; the bio-oil
obtained is therefore separated from light gas and heavy residues, and finally treated with
reducing gas and dehydrogenation catalysts.
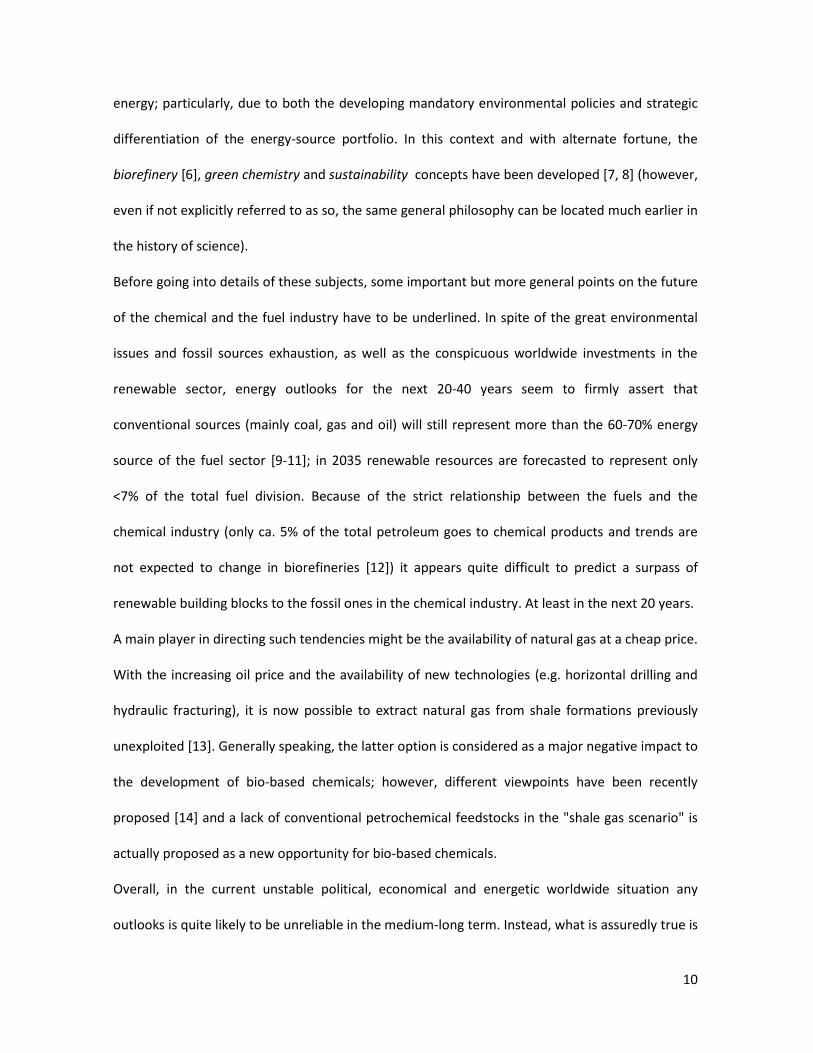
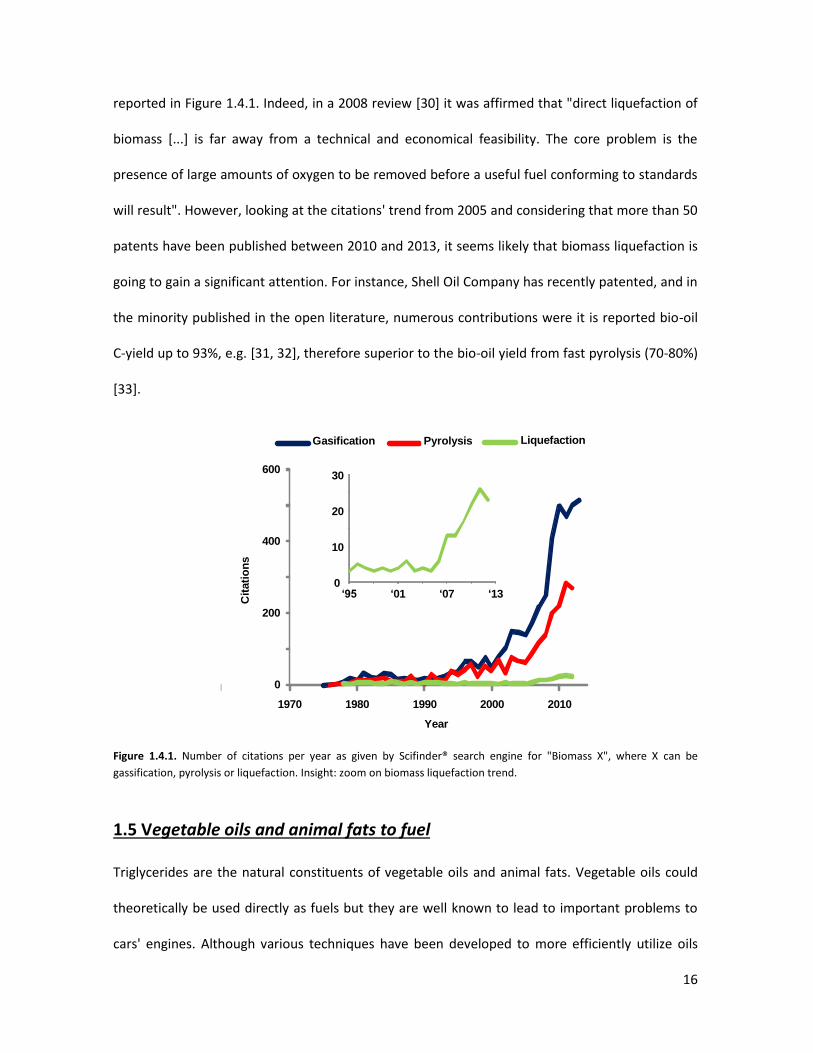
The scientific and industrial interest in biomass liquefaction has been so far definitely less relevant
compared to gasification and pyrolysis, as demonstrated by the number of citations per year
16
reported in Figure 1.4.1. Indeed, in a 2008 review [30] it was affirmed that "direct liquefaction of
biomass [...] is far away from a technical and economical feasibility. The core problem is the
presence of large amounts of oxygen to be removed before a useful fuel conforming to standards
will result". However, looking at the citations' trend from 2005 and considering that more than 50
patents have been published between 2010 and 2013, it seems likely that biomass liquefaction is
going to gain a significant attention. For instance, Shell Oil Company has recently patented, and in
the minority published in the open literature, numerous contributions were it is reported bio-oil
C-yield up to 93%, e.g. [31, 32], therefore superior to the bio-oil yield from fast pyrolysis (70-80%)
[33].
Figure 1.4.1. Number of citations per year as given by Scifinder® search engine for "Biomass X", where X can be
gassification, pyrolysis or liquefaction. Insight: zoom on biomass liquefaction trend.
1.5 Vegetable oils and animal fats to fuel
Triglycerides are the natural constituents of vegetable oils and animal fats. Vegetable oils could
theoretically be used directly as fuels but they are well known to lead to important problems to
cars' engines. Although various techniques have been developed to more efficiently utilize oils
Gasification Pyrolysis Liquefaction
0
200
400
600
1970 1980 1990 2000 2010
Cit
ati
on
s
Year
0
10
20
30
‘95 ‘01 ‘07 ‘13
17
and fats, the transesterification process and the hydrogenation one are the most widely applied
[34]. The former leads to the commercial product known as biodiesel, whereas the latter leads to
green diesel (also called renewable diesel). Biodiesel is a well known product which invention is
dated back to 1938 [35] and its world market is expected to reach 37 billion gallons (ca. 140 billion
liters) by 2016 [36]; the aim of transesterification is the removal of glycerin from natural
triglycerides since the polyol has low calorific power and damages the engines. Hence, triglyceride
are most commonly transesterified with methanol and a mineral homogeneous catalyst (such as
NaOH), producing Fatty Acid Methyl Esters (FAMEs) and glycerol. However, homogeneous
catalysis cause challenging separation problems that have been trying to overcome by new
heterogeneous catalysts [37], even if most of the latter still show unsatisfactory catalytic
performance compared to homogeneous bases.
Green diesel is a much newer product; for its production are used the same raw-materials of
biodiesel (natural triglycerides) which are catalytically hydrogenated to paraffins and propane
[34]. The paraffins obtained are exactly equivalent to the ones derived by oil-distillation, hence
completely compatible with current engines. On one hand, green diesel production is a cleaner
process than the biodiesel one, since it requires less purification steps; on the other hand it needs
more complex apparatus and of bigger volumes. Nonetheless, the latter are already available
technologies currently used in conventional oil-refineries, so the capital expenditure (CAPEX) is
minimized; for these reasons, the main players in the green diesel market are well-known oil
companies as ENI, UOP and Neste Oil [34].
1.6 Platform chemicals for biorefineries
As previously mentioned, the manufacture of chemicals is strictly bounded to fuels production,
since it mostly uses the (valuable) by-products of the latter as feedstocks. Looking at bio-fuels
18
production (reported in the previous sections) it is possible to predict the possible intermediates
and by-products that could be used as platform chemicals in the medium/long-term future. A
general overview on the topic has been recently published by R. A. Sheldon [15] and further
information can be found in a 2007 review by A. Corma et al. [38]. Further details on routes from
bio-oil to chemicals and fuels were published elsewhere [33, 39]. Since in this thesis it is not
possible to develop the topic into further details, the overall discussion will be limited to the
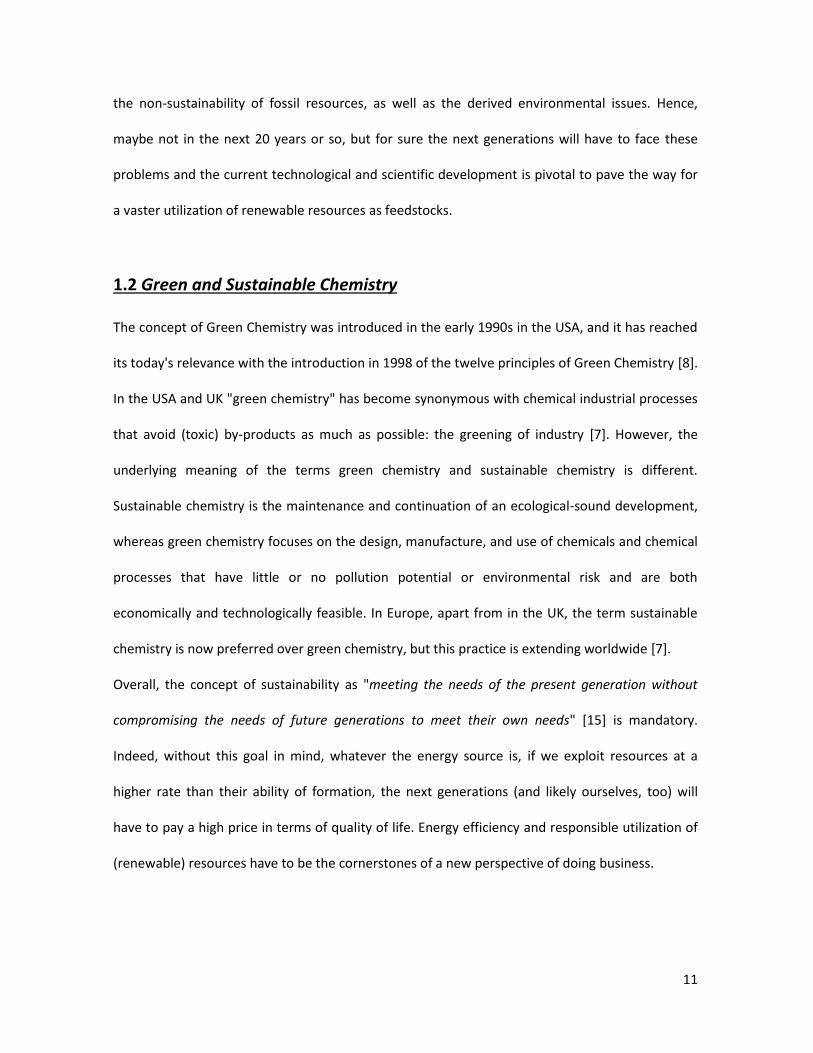
schematic representations reported in figure 1.6.1 and 1.6.2. Nevertheless, for the obvious
affinity to the topic of this thesis, the chemistry of (bio-)glycerol, i.e. the so called
glycerochemistry, will be addresses in a dedicated section with focus on glycerol dehydration and
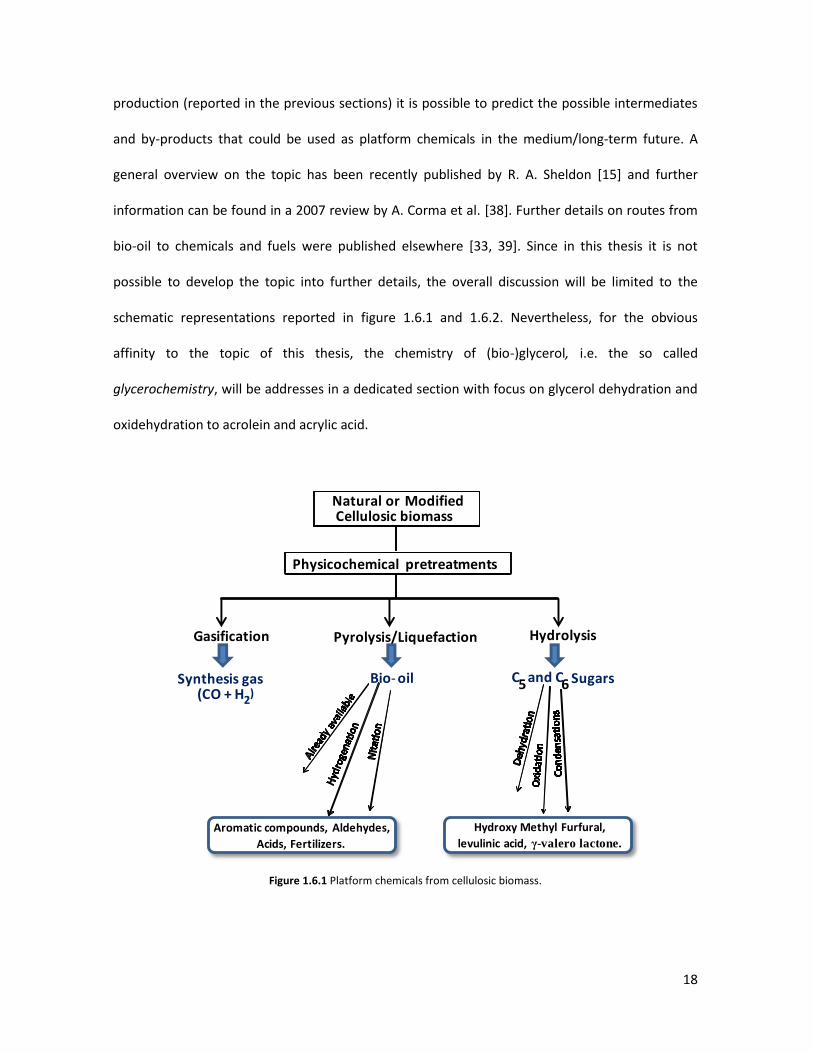
oxidehydration to acrolein and acrylic acid.
Figure 1.6.1 Platform chemicals from cellulosic biomass.
Natural or ModifiedCellulosic biomass
Physicochemical pretreatments
Gasification
Synthesis gas(CO + H2
)
Pyrolysis/Liquefaction
Bio- oil
Aromatic compounds, Aldehydes,
Acids, Fertilizers.
Hydrolysis
C5and C6 Sugars
Hydroxy Methyl Furfural,
levulinic acid, γ-valero lactone.
19
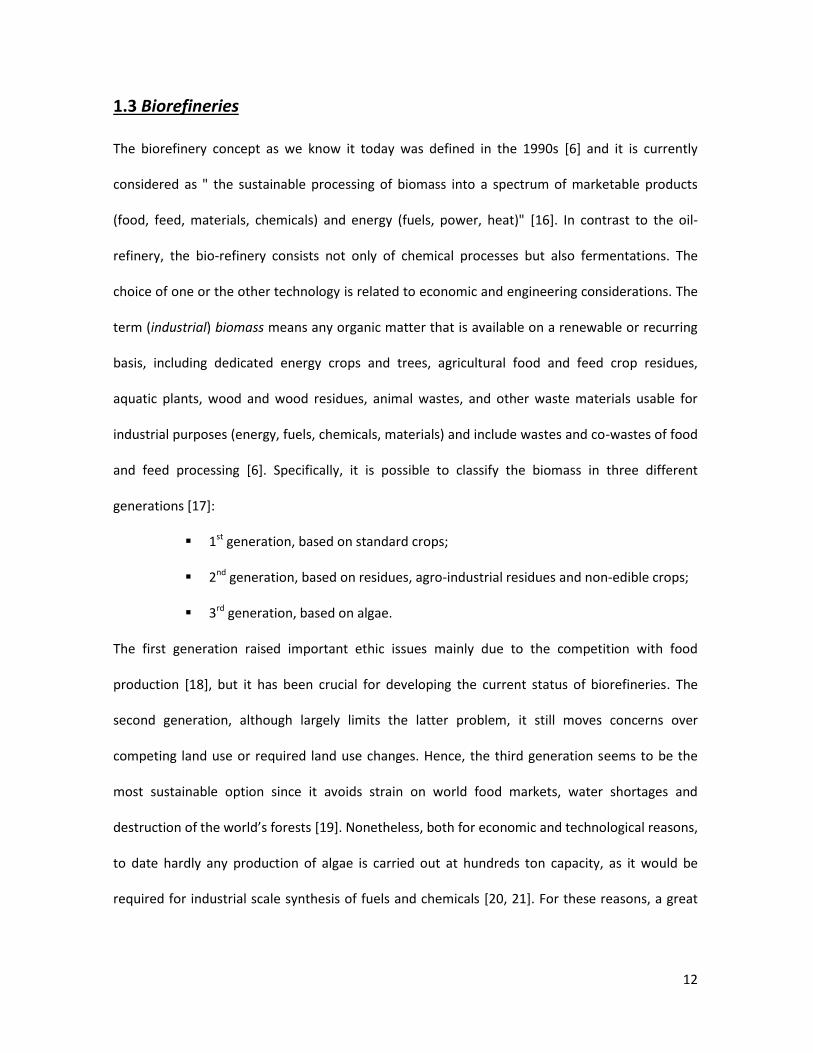
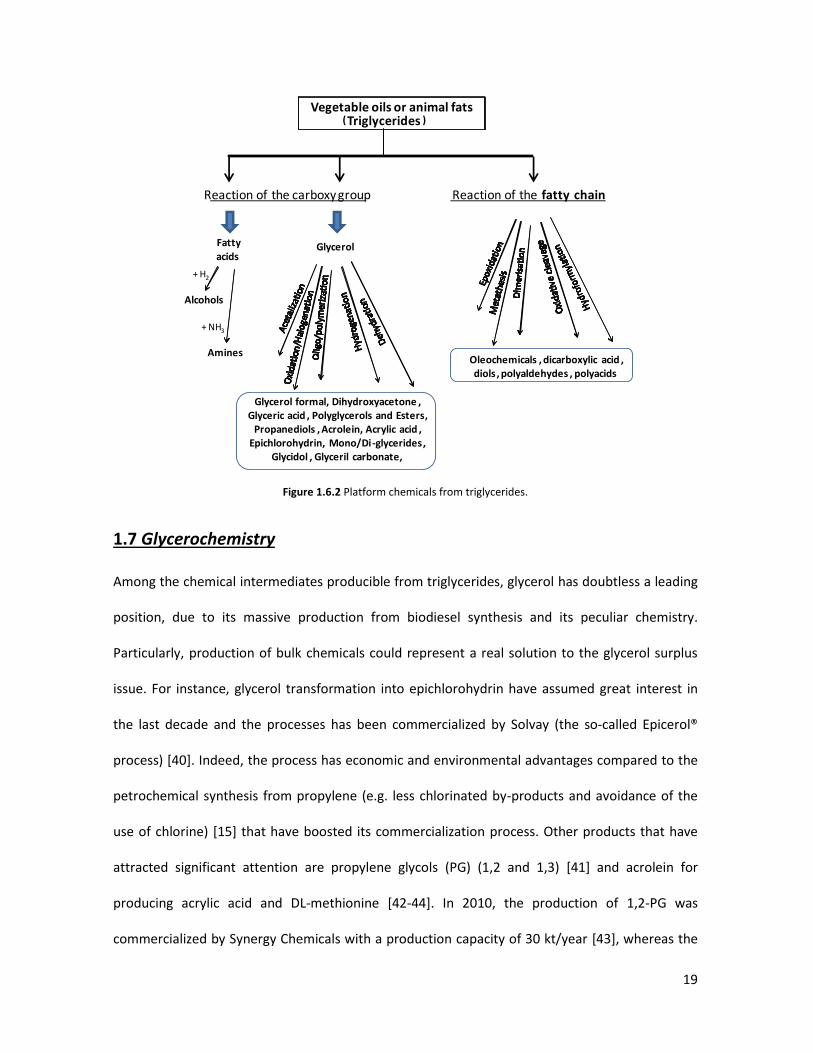
Figure 1.6.2 Platform chemicals from triglycerides.
1.7 Glycerochemistry
Among the chemical intermediates producible from triglycerides, glycerol has doubtless a leading
position, due to its massive production from biodiesel synthesis and its peculiar chemistry.
Particularly, production of bulk chemicals could represent a real solution to the glycerol surplus
issue. For instance, glycerol transformation into epichlorohydrin have assumed great interest in
the last decade and the processes has been commercialized by Solvay (the so-called Epicerol®
process) [40]. Indeed, the process has economic and environmental advantages compared to the
petrochemical synthesis from propylene (e.g. less chlorinated by-products and avoidance of the
use of chlorine) [15] that have boosted its commercialization process. Other products that have
attracted significant attention are propylene glycols (PG) (1,2 and 1,3) [41] and acrolein for
producing acrylic acid and DL-methionine [42-44]. In 2010, the production of 1,2-PG was
commercialized by Synergy Chemicals with a production capacity of 30 kt/year [43], whereas the
+ H2
Amines
+ NH3
Vegetable oils or animal fats(Triglycerides )
Reaction of the carboxy group Reaction of the fatty chain
Fattyacids
Alcohols
Glycerol
Glycerol formal, Dihydroxyacetone , Glyceric acid , Polyglycerols and Esters,
Propanediols , Acrolein, Acrylic acid , Epichlorohydrin, Mono/Di-glycerides,
Glycidol , Glyceril carbonate,
Oleochemicals , dicarboxylic acid , diols , polyaldehydes , polyacids
20
acrolein process hasn't still been commercialized. However, the industrial attention is great and
the French chemical company Arkema seems to be on the way to industrial production [45-47].
Other processes such as direct glycerol oxidation have found considerable interest in literature for
the production of fine chemicals and some of them have been commercialized [48].
1.7.1 Production of acrolein and acrylic acid from glycerol
Amongst the various options for glycerol upgrading, the dehydration process to acrolein is one of
the most debated in literature since this aldehyde is the intermediate molecule for the production
of important chemicals such as DL-methionine and acrylic acid [42-44, 49]. As far as acrylic acid is
concerned, it can be synthesized from glycerol thorough a two-step process where glycerol is first
dehydrated into acrolein and successively oxidized into acrylic acid; this option would need the
utilization of two reactors, the first loaded with an acid catalyst and the second loaded with a
redox one. In order to reduce the CAPEX needed for a “multi-reactor approach”, two options have
been proposed in literature: (i) the location of the two catalysts in a single reactor or (ii) the
design of a multifunctional catalyst able to carry out both the dehydration and the oxidation step.
The first approach is generally mentioned to lead to higher yields into acrylic acid [42] even if,
being forced to use the same temperature for both catalytic beds, important drawbacks in the
catalytic performance are implied. Otherwise, the use of more complicated technologies to
overcome this issue (e.g. inter-stage heat exchange) could severely affect the economic feasibility
of the process and its competitiveness to the current propylene-based one. The second option
would significantly simplify the reactor design and theoretically allow increasing the overall
catalytic performance, since it was demonstrated that proximity of acid and redox sites plays an
important role in the oxidehydration process [50]. On the other hand, the multifunctional catalyst
21
approach is very demanding from the catalyst design perspective, and so far few materials have
shown remarkable acrylic acid yields.
In the following chapters many insights (catalysts features, reaction mechanism, optimal reaction
conditions, etc.) concerning the acrolein and acrylic acid production from glycerol will be
developed. However, some remarkable consideration on the process scale-up feasibility can be
already addressed. The various reviews on glycerol dehydration to acrolein that have been
published in the last years [36, 42-44] share some common conclusions on the main issues that
impede its commercialization:
Glycerol price volatility (both crude and refined) makes it difficult to perform
accurate economic evaluations on the process' feasibility; roughly, 300 US$/ton is
considered the glycerol price needed for a breakthrough from propylene to glycerol [51].
However, current quotation of refined glycerol lies between 900−1000 US$/ton.
Crude glycerol can be purchased for a much cheaper price, around 150 US$/ton;
however its impurities do not allow direct processes for its transformation. Development
of cost-effective purification techniques is pivotal for lowering the polyol's work-up price.
Liquid-phase catalysis still shows unsatisfactory performance and difficult
conditions for process scale-up. Gas-phase catalysis looks more promising, with acrolein
yield >90% at total glycerol conversion [52].
The main problems related to gas-phase synthesis is the fast deactivation of the
catalyst due to cocking and deposition of high-boiling compounds.
Nevertheless, comparing the prices of reactants and products involved in the few commercialized
production from glycerol (epichlorohydrin and 1,2-PG) to the acrolein and acrylic acid process, it is
possible to draw some (partially) alternative conclusions. In order to do so, and because of the
22
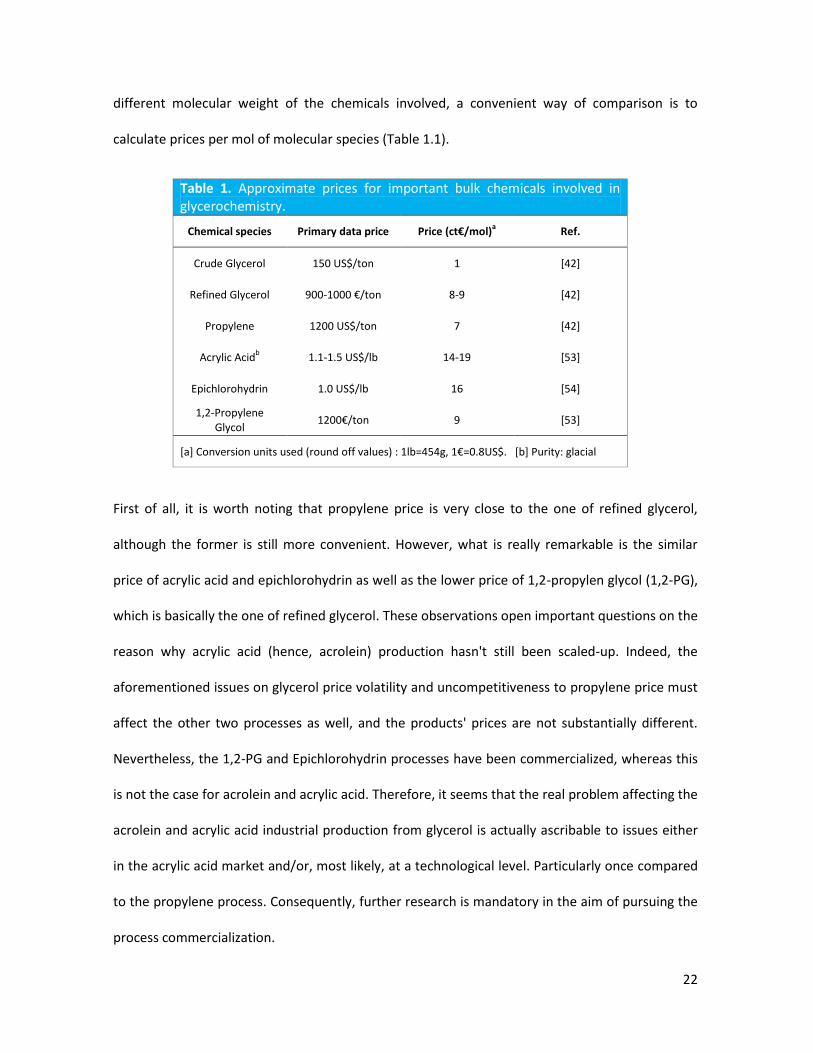
different molecular weight of the chemicals involved, a convenient way of comparison is to
calculate prices per mol of molecular species (Table 1.1).
Table 1. Approximate prices for important bulk chemicals involved in glycerochemistry.
Chemical species Primary data price Price (ct€/mol)a
Ref.
Crude Glycerol 150 US$/ton 1 [42]
Refined Glycerol 900-1000 €/ton 8-9 [42]
Propylene 1200 US$/ton 7 [42]
Acrylic Acidb 1.1-1.5 US$/lb 14-19 [53]
Epichlorohydrin 1.0 US$/lb 16 [54]
1,2-Propylene Glycol
1200€/ton 9 [53]
[a] Conversion units used (round off values) : 1lb=454g, 1€=0.8US$. [b] Purity: glacial
First of all, it is worth noting that propylene price is very close to the one of refined glycerol,
although the former is still more convenient. However, what is really remarkable is the similar
price of acrylic acid and epichlorohydrin as well as the lower price of 1,2-propylen glycol (1,2-PG),
which is basically the one of refined glycerol. These observations open important questions on the
reason why acrylic acid (hence, acrolein) production hasn't still been scaled-up. Indeed, the
aforementioned issues on glycerol price volatility and uncompetitiveness to propylene price must
affect the other two processes as well, and the products' prices are not substantially different.
Nevertheless, the 1,2-PG and Epichlorohydrin processes have been commercialized, whereas this
is not the case for acrolein and acrylic acid. Therefore, it seems that the real problem affecting the
acrolein and acrylic acid industrial production from glycerol is actually ascribable to issues either
in the acrylic acid market and/or, most likely, at a technological level. Particularly once compared
to the propylene process. Consequently, further research is mandatory in the aim of pursuing the
process commercialization.
23
1.7.2 Life Cycle Assessment (LCA) for the production of acrolein from glycerol
We have recently reported in literature a LCA study for the transformation of glycerol to acrolein,
i.e. the intermediate step for the production of acrylic acid [55]. Considering the source of
glycerol, we have compared two real-case industrial scenarios: (i) vegetable oil (from rapeseed)
transesterification for biodiesel synthesis and (ii) fat hydrolysis. The latter process is now
considered to be the second major source of glycerol and, due to the synthesis of fatty acids, its
industrial importance makes it a secure reserve process for glycerol production. Overall, some
interesting conclusions have been drawn:
The major benefits in terms of environment and human health of the overall bio-
acrolein production chain come from the substitution of conventional diesel with
biodiesel (-9.4 Kg of CO2 equivalent);
Transesterification of vegetable oil is less sustainable than animal fat
hydrogenolysis, largely due to land occupation and terrestrial eco-toxicity during the crop
cultivation phase (due to release of pesticide in soil and exploitation of arable land);
although, animal breeding and tallow production are energy intensive stages, too;
Regarding the fossil fuel depletion, a contribution as high as 53% is due to the
cultivation phase, whereas the glycerol dehydration process contributes only for 7%;
Compared to the conventional propylene based scenario and contrary to common
beliefs, fossil fuel depletion and climate change are greatly affected by glycerol
purification, finally making the impact of acrolein from partial oxidation of propylene
lower than the two bio-based scenario.
Therefore, it emerges that the development of a fully integrated bio-refinery (i.e. both for fuels
and chemicals) is the only option to effectively reduce the overall environmental impact. Indeed,
24
not only the raw materials for the chemical industry have to derive from renewable resources, but
also the whole compartment of utilities and energy sources. Moreover, the utilization of third
generation biomass as well as selected cultivation growing in marginal land that do not require
consumption of pesticides have an enormous potential to consistently reduce the impact of
human activities on the environment.
1.8 Vanadium substituted HTBs: complex mixed-oxides for glycerol
oxidehydration to acrylic acid
As previously mentioned, the multifunctional catalyst approach is very demanding from the
catalyst design standpoint, since only fine tuning of acid and redox properties of the material
allows obtaining noteworthy yields into the acid monomer. Indeed, few multifunctional materials
have been so far demonstrated as effective catalysts for the direct transformation of glycerol into
acrylic acid, i.e. FeVO4/Fe2O3 [50], Mo-V-O, Mo-V-Te-Nb-O, W-V-(Nb)-O [1, 56-60] and V-
impregnated zeolites [61]. At present, the complex mixed-oxides related to the hexagonal
tungsten bronzes (HTBs) family, i.e. W-V-(Nb)-(Mo)-O, have shown the best catalytic performance
in the glycerol oxidehydration process on single catalysts.
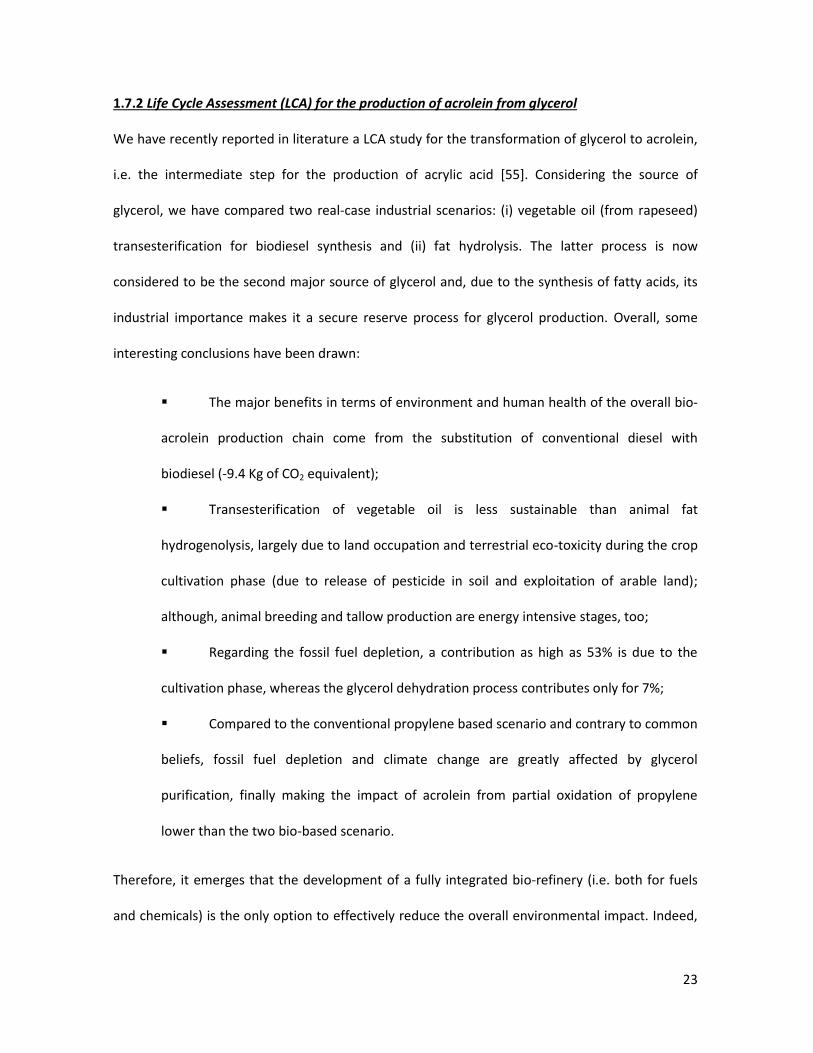
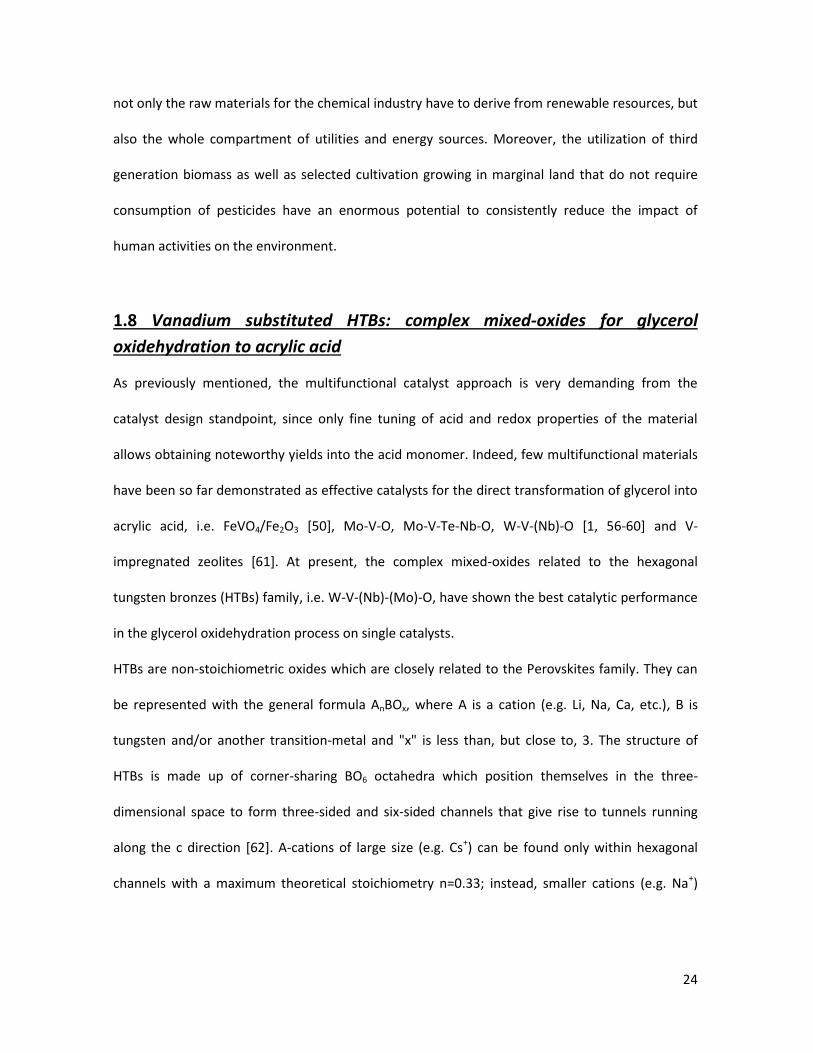
HTBs are non-stoichiometric oxides which are closely related to the Perovskites family. They can
be represented with the general formula AnBOx, where A is a cation (e.g. Li, Na, Ca, etc.), B is
tungsten and/or another transition-metal and "x" is less than, but close to, 3. The structure of
HTBs is made up of corner-sharing BO6 octahedra which position themselves in the three-
dimensional space to form three-sided and six-sided channels that give rise to tunnels running
along the c direction [62]. A-cations of large size (e.g. Cs+) can be found only within hexagonal
channels with a maximum theoretical stoichiometry n=0.33; instead, smaller cations (e.g. Na+)
25
may also be located in three-sided channels, with a maximum total occupancy when n=1 [63]. A
general representation is provided in Figure 1.8.1.
Figure 1.8.1. General representation of the HTB structure.
Due to their electronic structure and the possibility of altering it through both the insertion of A-
cations and the partial substitution of tungsten, HTBs have found a wide range of applications in
electrochromic devices, humidity sensors, solid fuel cells, and ion-sensitive electrodes [64, 65].
However, in spite of their long history in material science, the use of HTBs as catalysts is a major
novelty.
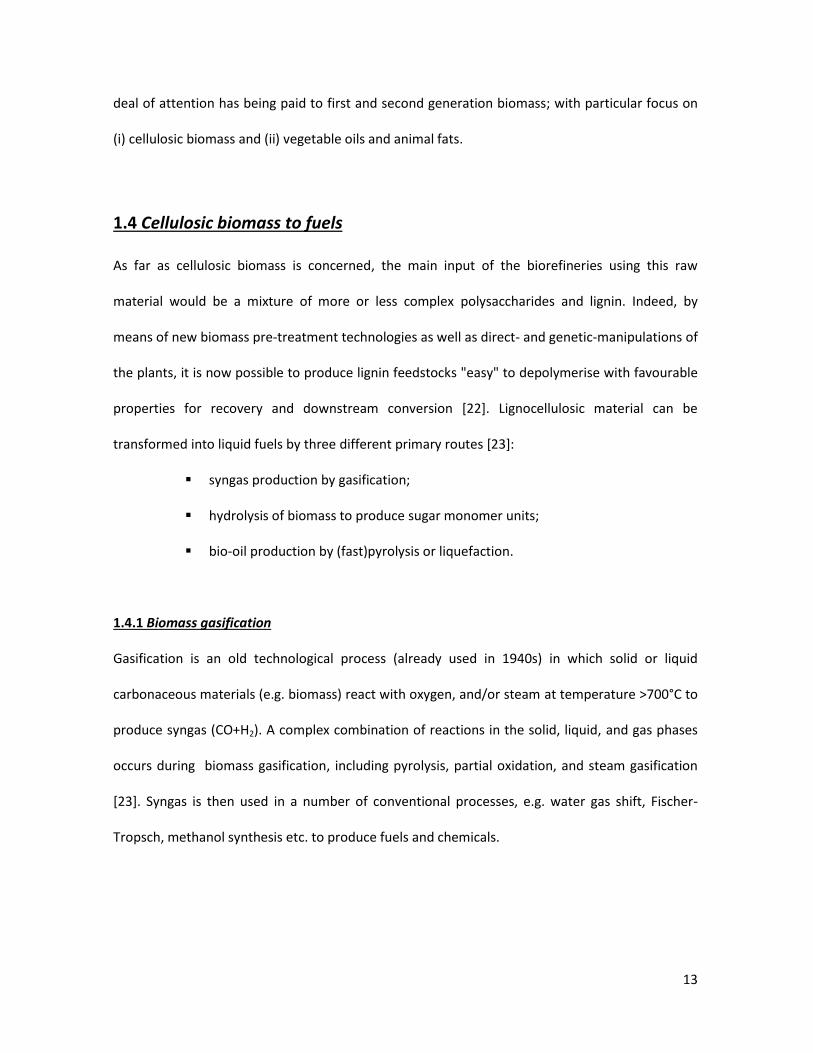
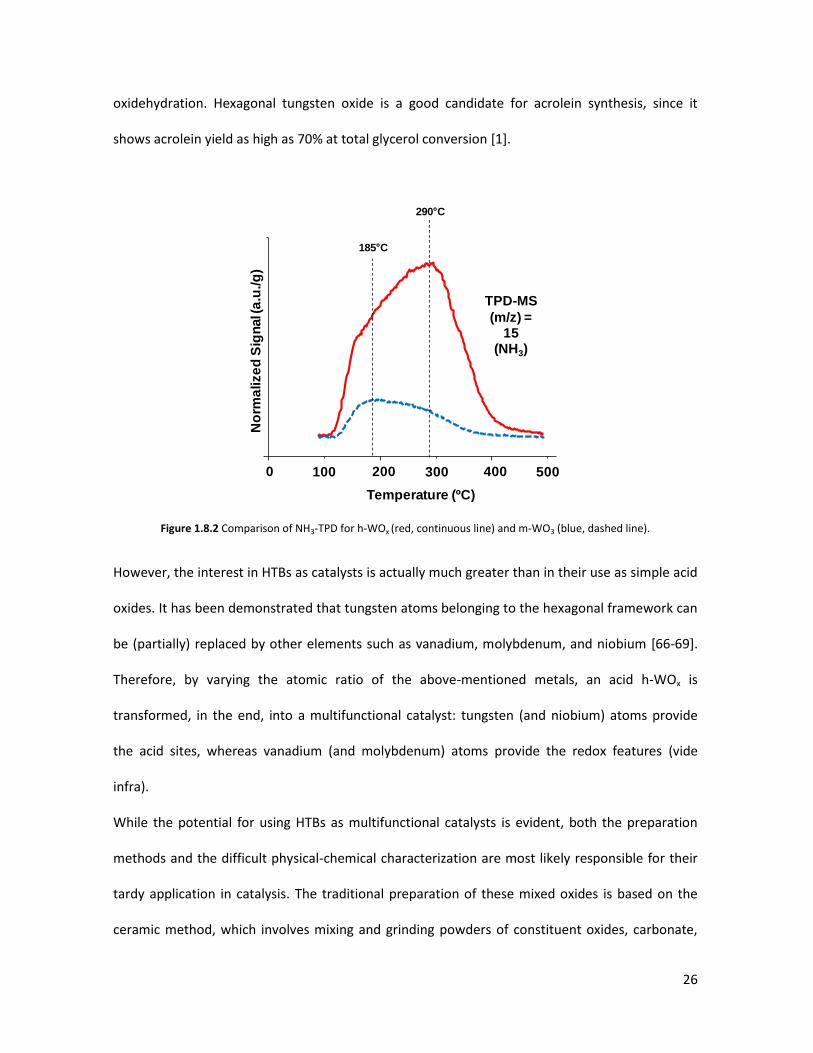
Their potential for such applications is related first of all to the HTBs’ acidity; when comparing a
monoclinic WO3 (m-WO3) and a tungsten-oxide with hexagonal HTB structure (h-WOx), the gap is
apparent: the former has a total acidity of around 20 μmolNH3/g, whereas the latter exceeds 130
μmolNH3/g [1]; the strength of the acid sites is also different, as illustrated in figure 1.8.2. These
features make them interesting for those catalytic processes where a medium-to-strong acidity is
needed; indeed, so far HTBs have been mainly used as catalysts for glycerol dehydration and
26
oxidehydration. Hexagonal tungsten oxide is a good candidate for acrolein synthesis, since it
shows acrolein yield as high as 70% at total glycerol conversion [1].
Figure 1.8.2 Comparison of NH3-TPD for h-WOx (red, continuous line) and m-WO3 (blue, dashed line).
However, the interest in HTBs as catalysts is actually much greater than in their use as simple acid
oxides. It has been demonstrated that tungsten atoms belonging to the hexagonal framework can
be (partially) replaced by other elements such as vanadium, molybdenum, and niobium [66-69].
Therefore, by varying the atomic ratio of the above-mentioned metals, an acid h-WOx is
transformed, in the end, into a multifunctional catalyst: tungsten (and niobium) atoms provide
the acid sites, whereas vanadium (and molybdenum) atoms provide the redox features (vide
infra).
While the potential for using HTBs as multifunctional catalysts is evident, both the preparation
methods and the difficult physical-chemical characterization are most likely responsible for their
tardy application in catalysis. The traditional preparation of these mixed oxides is based on the
ceramic method, which involves mixing and grinding powders of constituent oxides, carbonate,
0 200 400
Temperature (ºC)
No
rma
lize
d S
ign
al (
a.u
./g
)
100 300 500
185 C
290 C
TPD-MS
(m/z) = 15
(NH3)
27
and other compounds and their consequent heating at a high temperature and for a very long
time. However, this “hard” method generally leads to a poor control of structure, stoichiometry,
and phasic purity; moreover, of particular importance for applications in catalysis, the surface
area of the obtained oxides is generally very low (i.e. <5 m2/g). Only starting from the 1980s have
these issues been partially overcome with new “soft” chemical methods (chimie douce) that have
paved the way for the synthesis of metastable compounds with high phase purity and significant
surface area [66, 70]; however, up to the present time, rational design (rather than serendipity) is
still a great challenge even for soft methods such as the most common hydrothermal synthesis
[71], making the preparation of substituted HTBs (i.e. metastable phases) not so straightforward
in the end.
The other big challenge for the development of HTBs as catalysts is their physical-chemical
characterization. Indeed, some of the most common techniques used in the field of catalysis
either provide rather poor information or leave room for ambiguous interpretation. X-ray
diffraction is a paradigmatic example of this; HTBs (and related phases) often form crystals of little
order and poor quality. Moreover, they involve a high absorption of the X-ray radiation, while the
contribution of oxygen atoms to the observed intensities is weak if compared to heavy atoms (B
atoms) [63]. Therefore the results obtained give an approximate position of oxygen atoms and are
frequently affected by the presence of an amorphous phase (due to the poor long-range order of
crystals), thus making it impossible to draw some univocal conclusions on the real nature of the
oxide phase. In this respect, high-resolution electron microscopy (mainly HR-TEM) has been
pivotal; imaging studies allow characterizing the intimate nature of even poorly crystallized
samples, while highlighting the contemporary presence of different crystal phases and on-going
changes [63, 72, 73].
28
As previously discussed, the great interest in hexagonal tungsten bronzes (HTBs) for catalytic
application is mainly related to the possibility of creating multifunctional oxides. In order to do so,
tungsten-atoms belonging to the oxide lattice can be partially substituted with different transition
metals; given the well-known properties of vanadium in oxidation catalysis, the insertion of the
latter element is an interesting option. In literature, the substitution of vanadium in the HTB
structure has been reported on in recent decades, synthesized both through solid-state and
precipitation methods [66, 67, 74]. In both cases, exhaustive characterizations were carried out so
as to assess the physical-chemical features of the W-V oxides obtained; as far as their structure is
concerned, XRD patterns clearly indicated that the V-containing oxides are isostructural with h-
WOx. In particular, the slight decrease in the cell parameters was attributed to the replacement of
large W-atoms by vanadium. The preservation of the hexagonal phase was also unambiguously
determined by HR-TEM/SAED. More recently, hexagonal oxides with tungsten and vanadium (h-
WVOx) were also synthesized by hydrothermal synthesis, with V-content in the range
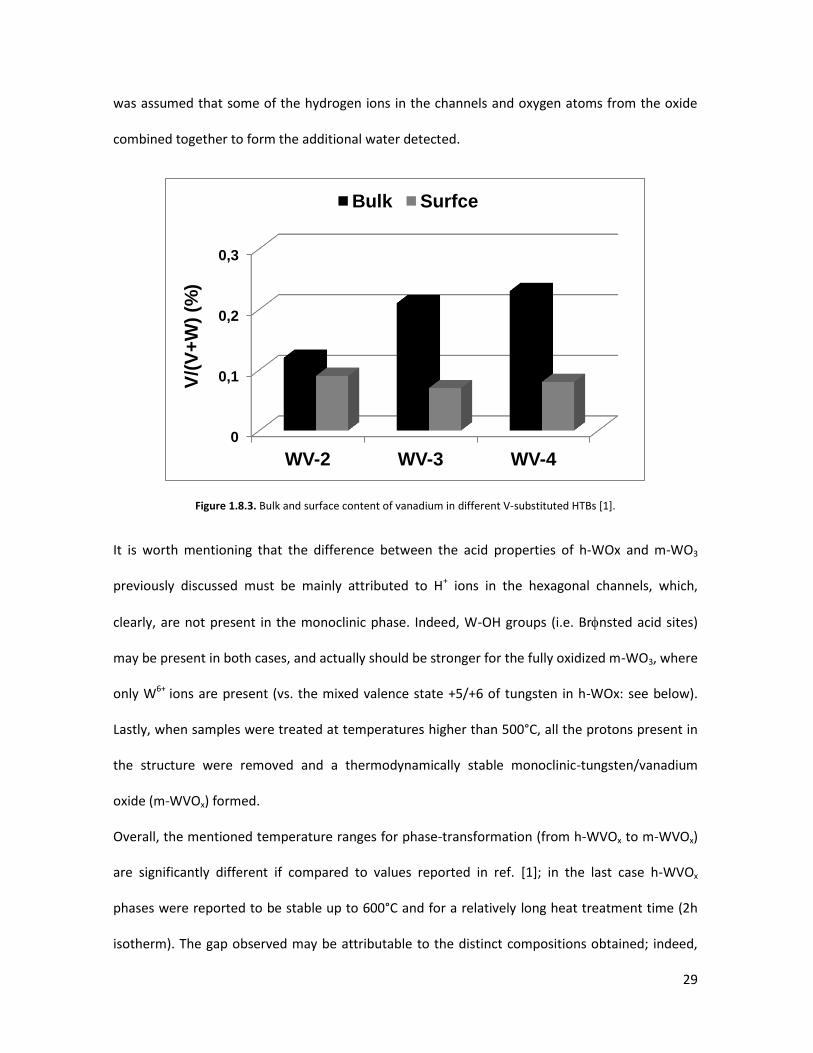
0<[V/(W+V)]<0.24 [1]. When comparing the amount of vanadium on the surface layers of these
samples -from XPS analysis- to its quantity in the bulk -from EDX characterization- (figure 1.8.3),
an almost constant vanadium surface concentration was reported regardless of its bulk content,
thus strongly suggesting the substitution of lattice-W-atoms by vanadium even for the h-WVOx
oxides prepared by hydrothermal method.
The acid properties of h-WVOx oxides (and h-WOx) may be ascribed to (i) H+ cations located in
hexagonal-channels and to (ii) M-OH moieties (M=W, V) present on the oxide surface. Evidence
for the existence of extra-framework protons was clearly provided by TG-analysis [66, 74]; indeed,
water loss between around 100°C and 500°C exceeded the amount of crystallization water which
was stable in the hydrated form at room temperature (molar ratio H2O/(W+V)= 0.33). Therefore it
29
was assumed that some of the hydrogen ions in the channels and oxygen atoms from the oxide
combined together to form the additional water detected.
Figure 1.8.3. Bulk and surface content of vanadium in different V-substituted HTBs [1].
It is worth mentioning that the difference between the acid properties of h-WOx and m-WO3
previously discussed must be mainly attributed to H+ ions in the hexagonal channels, which,
clearly, are not present in the monoclinic phase. Indeed, W-OH groups (i.e. Brnsted acid sites)
may be present in both cases, and actually should be stronger for the fully oxidized m-WO3, where
only W6+ ions are present (vs. the mixed valence state +5/+6 of tungsten in h-WOx: see below).
Lastly, when samples were treated at temperatures higher than 500°C, all the protons present in
the structure were removed and a thermodynamically stable monoclinic-tungsten/vanadium
oxide (m-WVOx) formed.
Overall, the mentioned temperature ranges for phase-transformation (from h-WVOx to m-WVOx)
are significantly different if compared to values reported in ref. [1]; in the last case h-WVOx
phases were reported to be stable up to 600°C and for a relatively long heat treatment time (2h
isotherm). The gap observed may be attributable to the distinct compositions obtained; indeed,
0
0,1
0,2
0,3
WV-2 WV-3 WV-4
V/(
V+
W)
(%)
Bulk Surfce
30
the atomic ratio obtained by the precipitation method was V/(W+V)= 0.27, whereas by
hydrothermal synthesis it was not possible to exceed the atomic ratio 0.24, even for the highest
amount of vanadium added in the parent gel (up to V/(W+V)= 0.33). However, such a difference
for the stability of the h-WVOx phase seems to be too important to be simply attributed to the
slight difference in composition. More likely, an important role is played by contaminants such as
Na+ ions, which are always present when typical lab-glassware is used and also as impurities in
starting materials (W- and V-salts). In fact, in one case, particular precautions were taken to avoid
these contaminations [66, 74], whereas a more common synthetic procedure was used for the
hydrothermal synthesis [1]. Sodium ions, as well as many other cations, are indeed well known to
strongly affect the stabilization of the crystal phases in the W/(V)/O system [63]. If, on the one
hand, the contamination of the hexagonal-phase may be a significant issue for the application of
h-WOx (and substituted analogues) in electrochromic devices and other applications in physics,
from the standpoint of catalysis this contamination may actually represent a great opportunity.
Indeed, since traces of A-cations can significantly thermally stabilize the hexagonal phase without
major effects on its peculiar acid properties, the latter features may also be preserved under in-
situ conditions of gas-phase chemical processes. This is in contrast, for example, with the
degradation phenomena ascribed to Mo/V/P-Keggins [75], therefore offering promising
expectations for industrial applications of these materials. However, pure h-WOx is actually much
less stable than the substituted oxides. The sample made up of only WO6 octahedra prepared by
hydrothermal treatment decomposed at a temperature as low as 450°C; this temperature
corresponds to the complete loss of ammonium-ions present as A-cations. Therefore, the
insertion of different B-atoms into the hexagonal lattice may also have a beneficial effect on
thermal stability. As it will be explained into details in the results and discussion section, the same
phenomenon was also observed for HTBs where both niobium and vanadium were introduced
31
into the lattice. Indeed, even after rather long time-on-stream tests (approximately 100 h) for
glycerol oxidehydration, no significant change was reported for the crystal structure. These
observations may be related to the oxidation state of transition elements. Indeed, pure h-WOx is
made up by both W6+ and W5+ ions, the overall neutral charge of the oxide being preserved by
both A-cations and oxygen vacancies. High temperature (and the presence of oxygen) can
promote structural changes in the metastable hexagonal phase towards stable m-WO3, with all
W-atoms as W6+. The introduction of elements of low and stable valence state (e.g. Nb5+) may
thus preserve the HTB structure even at high temperatures and for fully-oxidized tungsten atoms
(e.g. h-A+nW6+
1-yNb5+yOx). A similar phenomenon may be hypothesized for h-WVOx samples
(without Nb), since V4+/5+ ions make the hexagonal phase stable up to 600°C. However, as it will be
further discussed, the easily changeable oxidation state of vanadium under reaction conditions
might play a role in the stability of the phase and in the catalytic behavior.
The Brnsted acid sites present in HTBs, both in hexagonal channels and surface M-OH moieties,
may be considered to be active sites for glycerol dehydration to acrolein. Extensive studies on the
influence of Brnsted and Lewis acid sites on glycerol dehydration have been carried out in recent
years, and to date it has been clearly demonstrated that Brnsted acid sites are selective and
active in performing the double dehydration to acrolein [76, 77]. Lewis acid sites lead mainly to a
partial dehydration of glycerol into 1-hydroxyacetone and 3-hydroxypropanal, the latter being the
precursors for the formation of other by-products (i.e. formaldehyde, acetaldehyde, vinyl-alcohol,
1,2-propanediol, acetone, etc.) and oligomers (see Results and Discussion section and [60]). The
low selectivity into the mentioned by-products, shown by h-WOx [1] compared to other acid
catalysts [42-44], is good evidence that Brnsted acid sites are predominant in HTBs. In the results
and discussion section, for W-Mo-V samples with HTB-structure it will also be reported a study on
the presence of Brnsted and Lewis acid sites.
32
All in all, limiting the discussion of the catalytic performance of substituted-HTBs to the presence
of (Brnsted) acid sites and vanadium ions would give only a partial view of the topic. One of the
first attempts reported in the open literature to perform the glycerol oxidehydration process on a
single multifunctional catalyst was performed on VPO catalysts [78]. Different VPO-crystalline
phases were used, but the only major change was related to acrolein yields (from 24% to 66%),
basically highlighting the different acid properties of vanadium-phosphorous oxides. Indeed, in
spite of the various oxygen partial pressures used, the acrylic acid yield always was between 0%
and 8% (vs. acrylic acid yields > 50% for substituted HTBs, see results and discussion section).
Considering the well known presence of acid sites (Brnsted and Lewis) and vanadium-ions in
multiple oxidation states in VPO phases, it is of great interest to stress the low selectivities
observed in the partial oxidation product (as well as COx). Therefore, given the important
similarities in the general features of h-WVOx and VPO-catalysts, the significant difference
observed deserve more attention. Hence, we carried out further studies on a commercial VPP
(see chapter 3.4).
33
2. Experimental
2.1 Catalysts synthesis
2.1.1. Hydrothermal synthesis of HTBs
Most of the catalysts reported in this thesis belong to the family of Hexagonal Tungsten Bronzes
(HTBs) and were synthesized through the hydrothermal method. This methodology usually refers
to any heterogeneous reaction in the presence of aqueous solvents under high pressure and
temperature conditions (i.e. supercritical or near-supercritical conditions) to dissolve and re-
crystallize materials that are relatively insoluble under ordinary conditions. Indeed, under such
states, reactants otherwise difficult to dissolve go into solution as complexes allowing chemical
transport reactions [79].
From the catalysts preparation view-point, the hydrothermal synthesis consists in preparing an
aqueous solution (or gel) from the corresponding salts of selected transition-metals. The solution
(or gel) is transferred to a teflon-lined stainless steel autoclave, fitted with two valves that allow
purging it with a flow of nitrogen, so as to create an inert atmosphere -if required- and finally a
wanted pressure. The autoclave is heated-up to a desired temperature and for a selected period
of time. Finally the autoclave is cooled-down, degassed and the solid obtained is filtered and
washed to remove the mother-liquor. The cleaned solid is dried and used for further treatments.
Both bi-component and tri-component HTB-like catalysts were prepared, that is W-V, W-Nb, W-
Mo, W-V-Nb and W-Mo-V. The initial solutions/gels were prepared from the salts of the selected
metals, i.e. ammonium metatungstate hydrate (≥85 wt% WO3 basis, Sigma-Aldrich), vanadium (IV)
oxide sulfate hydrate (≥99.99%, Sigma-Aldrich), niobium oxalate (monooxalate adduct, ABCR) and
ammonium heptamolybdate (GR for analysis, MERCK).
34
In a typical preparation, the tungsten solution is warmed-up to 80°C and stirred for 10 minutes.
For bi-component catalysts, the solution of the second element is added dropwise to the one of
tungsten. For tri-component catalysts the same procedure is followed but the order of addition of
the second and the third components might be pivotal for a reproducible synthesis. Indeed, if the
addition of an element causes the formation of a gel, the following element added might not be
properly dispersed and/or the metal-complexes forming in solution might be of a different nature.
Therefore, for three-component systems, vanadium is always the first element to be added to
tungsten since it forms a stable and transparent-greenish solution. Once all the wanted elements
are added, the obtained solution is left mixing at 80°C for 10 minutes. Hence, the solution/gel is
loaded in a Teflon-lined stainless-steel autoclaves and heated at 175°C for 48h. The solid obtained
is filtered off with approximately 120 ml of distilled water per gram of tungsten salt used in the
initial solution. The filtered solid is washed and dried at 100°C for 16 h. Finally, the solids are heat-
treated at 600°C during 2 h under N2.
2.1.2 Ion-exchange and Incipient wetness impregnation
A vanadium-substituted HTB was used as reference bi-functional material (acid and redox) to
perform a systematic analysis of the influence of acid properties on glycerol oxidehydration (see
chapter 2.7). In order to do so, a W-V catalyst prepared according to the hydrothermal procedure
described above (WV-3 in ref. [1]) was doped with potassium-ions. This procedure was carried out
with two different methods, (i) ion-exchange and (ii) incipient wetness impregnation. Moreover,
to investigate the structure-reactivity correlations in glycerol oxidehydration, a V-exchanged
catalyst was also prepared by ion-exchange.
The first method was already reported in literature using analogous materials; indeed, HTBs
prepared by hydrothermal methods were proved to be effective materials to carry out ion-
35
exchange reactions with various cations [80]. It was demonstrated that the cations present within
the channels of the HTB framework can be exchanged with other cations. In order to do so, the
not heat-treated W-V sample, in the following called "WV-precursor" (i.e. the solid obtained after
the hydrothermal treatment, washed and dried), was left stirring for 4 hours at room temperature
in a solution containing the cation to exchange. By doing so, the new cation substitutes the
ammonium-ions already present in the WV precursor. Specifically, so as to exchange ammonium
for potassium ions, the WV-precursor was stirred in a solution of KHCO3; the operation was
carried out, respectively, with different solutions, the gap of their concentration being calculated
considering the maximum amount of potassium which is theoretically possible to insert into the
HTB structure, according to the approximate stoichiometry K/W=0.3 [63]. Catalysts prepared
according to this procedure where named as "K-n", where "n" indicates the molar concentration
of the KHCO3 solution used to perform the synthesis.
To exchange ammonium for vanadium ions, a tungsten oxide -without vanadium- with HTB
structure, prepared by the formerly reported hydrothermal synthesis but not heat-treated, was
stirred in a solution of VOSO4. The amount of vanadium dissolved was calculated so as to obtain
an oxide with theoretical composition equal to the W-V sample used as reference (V/K=0.21). The
catalyst prepared according to this procedure is named as V/WOx.
After the ion-exchange process, the solid was filtered and washed (ca. 120mL of water per gram
of catalyst) to remove the excess of ions that might have been adsorbed on the surface of the
catalyst rather than incorporated within the channels of the material. Once dried, the solid was
heat-treated in nitrogen at 600°C, except for V/WOx, who was heat-treated at 450°C -see
discussion in chapter 3.4-.
The second method used for preparing K-containing catalysts, i.e. impregnation of the WV
precursor with potassium, was carried out through a conventional wet-impregnation procedure
36
using a solution of KHCO3. The solid was left stirring in the solution for 5 minutes and the water
was following removed by rotavapor. The total amount of potassium impregnated was calculated
so as to obtain an overall atomic composition (calculated by EDX analysis) similar to the selected
catalyst prepared by ion-exchange (i.e. K-0.1), in order to make easier their comparison. Once
dried, the solid was heat-treated in nitrogen at 600°C. The catalyst prepared according to this
procedure is named as K-Imp.
For a batter overview on the influence of the preparation method on K-containing catalysts, a W-
V-K HTB was prepared by the conventional hydrothermal method, adding the alkaline metal
directly in the synthesis gel.
2.1.3 Hydrothermal synthesis of modified AlPO-5
VCoAlPO-5 sample was synthesized by hydrothermal method [81] using triethylamine as a
template. Aluminum hydroxide (Catapal A, Sasol) was added to an 85% solution of phosphoric
acid (Aldrich) in water, and the mixture was stirred until a homogeneous solution was obtained.
Triethylamine was added to this mixture under continuous stirring. Then an aqueous solution of
cobalt (II) acetate was incorporated to the synthesis gel. In the materials with vanadium, this was
added as a V2O5/triethylamine solution. The final reaction mixture was stirred until achieving a
homogeneous gel. The gel was introduced in Teflon-lined stainless steel autoclaves and heated at
200°C for 16 hours. After crystallization, the sample was centrifuged at 10,000 rpm, washed with
deionised water and dried overnight at 100°C.
Vanadium oxide supported on VCoAlPO (sample name V/VCoAlPO) was prepared by wetness
impregnation of the sample V-CoAlPO with an aqueous solution of ammonium metavanadate.
After the impregnation, water was removed by rotavapor and the oxide was dried overnight at
100°C. Dried materials were calcined in air for 6 hours at 550°C.
37
2.1.4 Slurry synthesis of a M5O14-like oxide
A molybdenum-vanadium-tungsten oxide (Mo-V-(W)-O) with the Mo5O14 structure was prepared
by slurry synthesis. This oxide is a well-known catalyst used at industrial level to make the
oxidation of acrolein into acrylic acid [82]. A solution containing the desired amount of the metals
salts was prepared and stirred at 80°C for 10 minutes. The salts used were ammonium
metavanadate (Sigma Aldrich, 99.99% trace metals basis), ammonium metatungstate hydrate
(≥85 wt% WO3 basis, Sigma-Aldrich), and ammonium heptamolybdate (GR for analysis, MERCK).
Sodium oxalate was also added to favor the reduction of the elements so as to form the M5O14
structure. Water was removed by evaporation in a rotavapor (at 50°C). The solid was dried at
100°C overnight and then calcined in air at 350°C. Lastly, the solid was heat-treated in N2 at 500°C
for 2 h.
2.2 Catalyst characterization
Generally speaking, the information reported below was mainly obtained from the reference [83]
and personal laboratory experience. Moreover, in some cases additional details are reported from
various references, respectively mentioned in the text.
A general overview on each technique is given, providing more stress on the practical aspects
needed to carry out the experiments and interpret the data obtained, rather than on the
theoretical aspects. Further details can be found in the mentioned references and bibliography
there reported.
2.2.1 Surface area and textural properties
Analyses of all samples were performed using nitrogen adsorption on a Micromeritics
ASAP 2000 porosimeter. Samples (approx. 200 mg) were degassed under vacuum at
120°C for 2 h prior to analysis using physisorbed N2 at 77K.
38
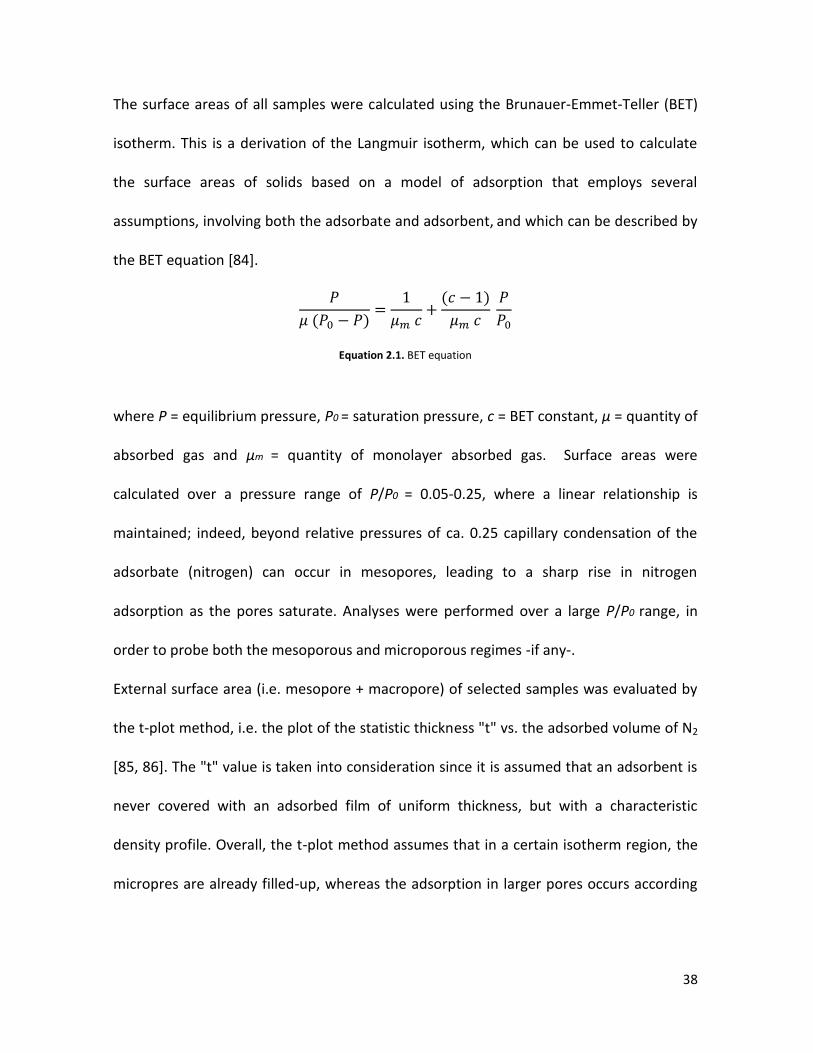
The surface areas of all samples were calculated using the Brunauer-Emmet-Teller (BET)
isotherm. This is a derivation of the Langmuir isotherm, which can be used to calculate
the surface areas of solids based on a model of adsorption that employs several
assumptions, involving both the adsorbate and adsorbent, and which can be described by
the BET equation [84].
Equation 2.1. BET equation
where P = equilibrium pressure, P0 = saturation pressure, c = BET constant, μ = quantity of
absorbed gas and μm = quantity of monolayer absorbed gas. Surface areas were
calculated over a pressure range of P/P0 = 0.05-0.25, where a linear relationship is
maintained; indeed, beyond relative pressures of ca. 0.25 capillary condensation of the
adsorbate (nitrogen) can occur in mesopores, leading to a sharp rise in nitrogen
adsorption as the pores saturate. Analyses were performed over a large P/P0 range, in
order to probe both the mesoporous and microporous regimes -if any-.
External surface area (i.e. mesopore + macropore) of selected samples was evaluated by
the t-plot method, i.e. the plot of the statistic thickness "t" vs. the adsorbed volume of N2
[85, 86]. The "t" value is taken into consideration since it is assumed that an adsorbent is
never covered with an adsorbed film of uniform thickness, but with a characteristic
density profile. Overall, the t-plot method assumes that in a certain isotherm region, the
micropres are already filled-up, whereas the adsorption in larger pores occurs according
39
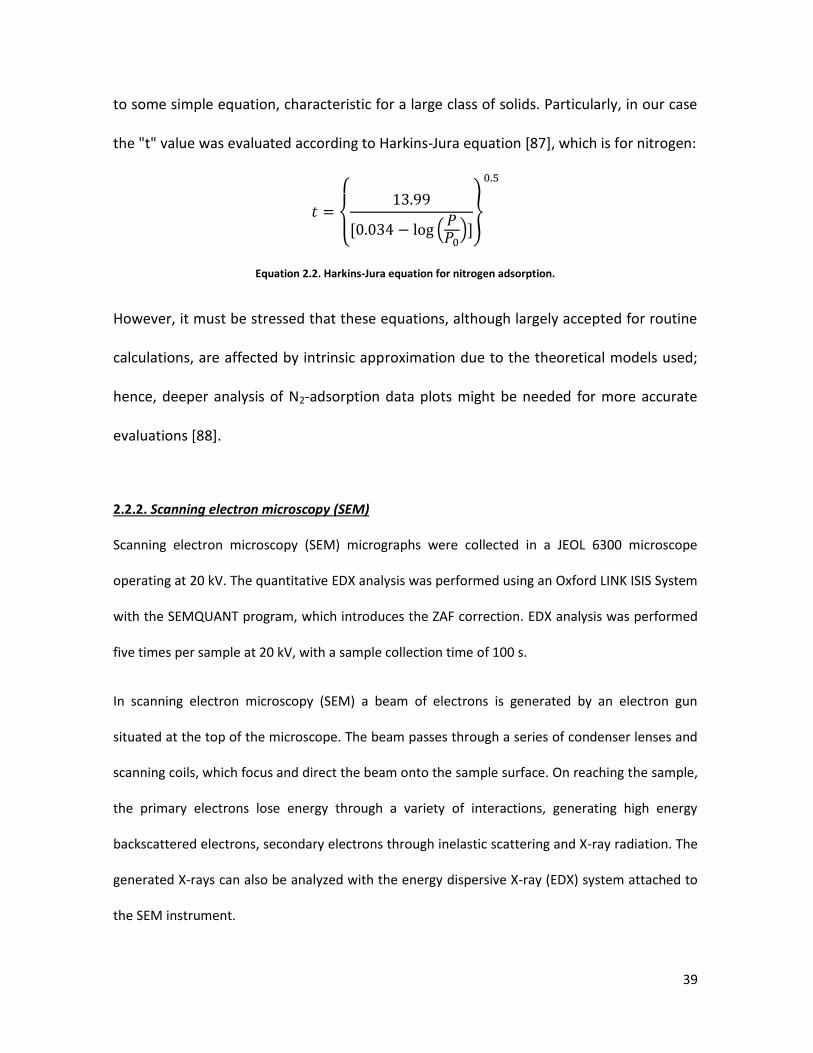
to some simple equation, characteristic for a large class of solids. Particularly, in our case
the "t" value was evaluated according to Harkins-Jura equation [87], which is for nitrogen:
Equation 2.2. Harkins-Jura equation for nitrogen adsorption.
However, it must be stressed that these equations, although largely accepted for routine
calculations, are affected by intrinsic approximation due to the theoretical models used;
hence, deeper analysis of N2-adsorption data plots might be needed for more accurate
evaluations [88].
2.2.2. Scanning electron microscopy (SEM)
Scanning electron microscopy (SEM) micrographs were collected in a JEOL 6300 microscope
operating at 20 kV. The quantitative EDX analysis was performed using an Oxford LINK ISIS System
with the SEMQUANT program, which introduces the ZAF correction. EDX analysis was performed
five times per sample at 20 kV, with a sample collection time of 100 s.
In scanning electron microscopy (SEM) a beam of electrons is generated by an electron gun
situated at the top of the microscope. The beam passes through a series of condenser lenses and
scanning coils, which focus and direct the beam onto the sample surface. On reaching the sample,
the primary electrons lose energy through a variety of interactions, generating high energy
backscattered electrons, secondary electrons through inelastic scattering and X-ray radiation. The
generated X-rays can also be analyzed with the energy dispersive X-ray (EDX) system attached to
the SEM instrument.
40
2.2.3 Transmission electron microscopy (TEM)
High resolution transmission electron microscopy (HR-TEM) and selected area electron diffraction
(SAED) were carried out on a JEOL JEM3000F electron microscope (point resolution of 0.17 nm).
Crystal by crystal XEDS microanalysis was performed by using the same microscope equipped with
an X-ray microanalysis ISIS 300 (Oxford Instruments) with a detector model LINK "Pentafet"
(resolution 135 eV). Samples for TEM were ultrasonically dispersed in n-butanol and transferred
to carbon coated copper grids.
TEM uses transmitted and diffracted electrons, in a sense similar to an optical microscope, if one
replaces optical lenses for electromagnetic ones. Indeed, bright field images are formed when a
beam of electrons, generated by an electron gun at the top of the instrument, is directed at the
sample after passing through one or more condenser lenses. The transmitted, undeviated beam is
focused and magnified by the objective lens and an image is formed on a phosphorescent screen.
Digital images are generated by a charged-coupled device. The theoretical principle of XEDS
micro-analysis is exactly the same of EDX coupled with SEM.
SAED is a crystallographic experimental technique that can be performed inside a transmission
electron microscope (TEM). In a TEM, a thin crystalline specimen is subjected to a parallel beam of
high-energy electrons. As TEM specimens are typically ~100 nm thick, and the electrons typically
have an energy of 100–400 KeV, the electrons pass through the sample easily. In this case,
electrons are treated as wave-like, rather than particle-like. Because the wavelength of high-
energy electrons is a few thousandths of a nanometer and the spacing between atoms in a solid is
about a hundred times larger, the atoms act as a diffraction grating to the electrons, which are
diffracted. That is, some fraction of them will be scattered to particular angles, determined by the
crystal structure of the sample, while others continue to pass through the sample without
deflection. As a result, the image on the screen of the TEM will be a series of spots—the selected
41
area diffraction pattern, SADP, each spot corresponding to a satisfied diffraction condition of the
sample's crystal structure.
2.2.4 Powder X-ray Diffraction
Powder X-ray diffraction (XRD) was used to identify the crystalline phases present in the catalysts.
An Enraf Nonius FR590 sealed tube diffractometer, with a monochromatic CuKα1 source operated
at 40 kV and 30 mA was used. Samples were scanned over a 2θ range of 5-90 ° with a 0.02 ° step
size and a scan speed of 0.04 s/step.
The X-ray source directs photons towards a homogeneous (finely ground powder) solid sample.
Although the powdered samples are polycrystalline in nature and therefore, over the bulk of the
material, consist of randomly-oriented crystal domains, there will nevertheless be a degree of
short-range order within these individual domains. Constructive interference can occur between
incident X-rays when these are diffracted from adjacent crystal Bragg planes within these
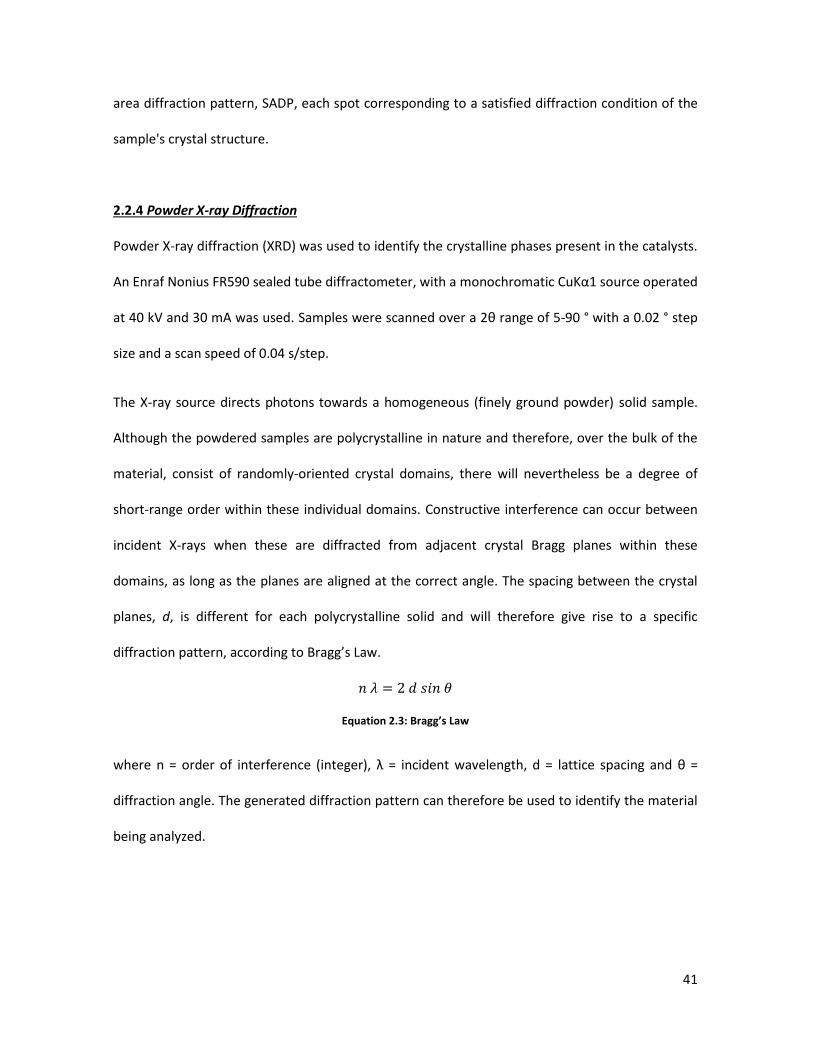
domains, as long as the planes are aligned at the correct angle. The spacing between the crystal
planes, d, is different for each polycrystalline solid and will therefore give rise to a specific
diffraction pattern, according to Bragg’s Law.
Equation 2.3: Bragg’s Law
where n = order of interference (integer), λ = incident wavelength, d = lattice spacing and θ =
diffraction angle. The generated diffraction pattern can therefore be used to identify the material
being analyzed.
42
2.2.5 Fourier transform infrared spectroscopy (FTIR)
Infrared spectra were recorded at room temperature in the 300–3900 cm−1 region with a Nicolet
205xB spectrophotometer, equipped with a Data Station, at a spectral resolution of 1 cm−1 and
accumulations of 128 scans. Pellets were prepared with catalysts and KBr.
Infrared spectroscopy can be considered as the first important modern spectroscopic technique
that has found general acceptance in catalysis. The most common application of infrared
spectroscopy in catalysis is to identify adsorbed species and to study the way in which these
species are chemisorbed on the surface of the catalyst (see below), as well as identifying phases
that are present in the catalyst.
The infrared region between 4000 and 200 cm-1 can be roughly divided into five regions:
The X-H stretch region (4000-2500 cm-1), where strong contributions from OH, NH, CH and
SH stretch vibrations are observed,
The triple bond region (2500-2000 cm-1), where contributions from gas phase CO (2143
cm-1) and linearly adsorbed CO (2000-2200 cm-1) are seen.
The double bond region (2000-1500 cm-1), where in catalytic studies bridgebonded CO, as
well as carbonyl groups in adsorbed molecules (around 1700 cm-1),absorb.
The fingerprint region (1500-500 cm-1), where all single bonds between carbon and
elements such as nitrogen, oxygen, sulfur and halogens absorb
The M-X or metal-adsorbate region (around 200-450 cm-1), where the metal-carbon,
metal-oxygen and metal-nitrogen stretch frequencies in the spectra of adsorbed species
are observed.
The first three regions are clearly meaningful particularly for studying the adsorption of molecules
on the (oxide-)catalysts' surfaces, whereas the last two are fundamental to identify both the
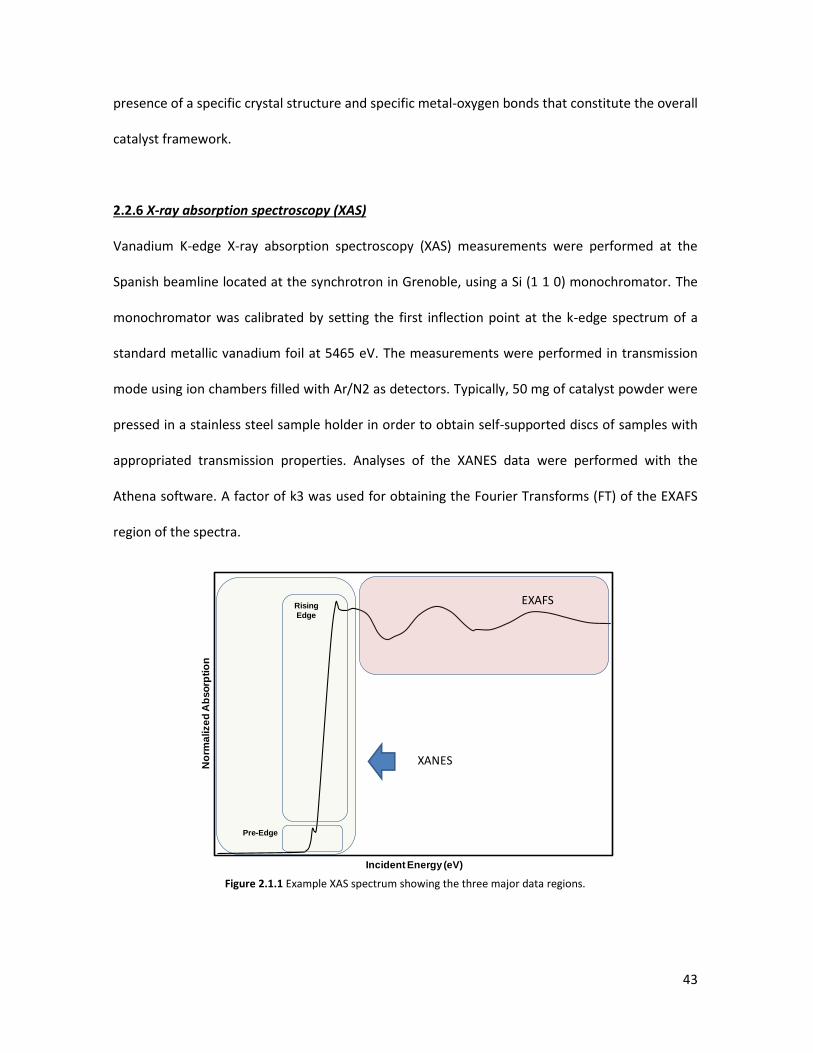
43
presence of a specific crystal structure and specific metal-oxygen bonds that constitute the overall
catalyst framework.
2.2.6 X-ray absorption spectroscopy (XAS)
Vanadium K-edge X-ray absorption spectroscopy (XAS) measurements were performed at the
Spanish beamline located at the synchrotron in Grenoble, using a Si (1 1 0) monochromator. The
monochromator was calibrated by setting the first inflection point at the k-edge spectrum of a
standard metallic vanadium foil at 5465 eV. The measurements were performed in transmission
mode using ion chambers filled with Ar/N2 as detectors. Typically, 50 mg of catalyst powder were
pressed in a stainless steel sample holder in order to obtain self-supported discs of samples with
appropriated transmission properties. Analyses of the XANES data were performed with the
Athena software. A factor of k3 was used for obtaining the Fourier Transforms (FT) of the EXAFS
region of the spectra.
Figure 2.1.1 Example XAS spectrum showing the three major data regions.
No
rma
lize
dA
bso
rpti
on
Incident Energy (eV)
Rising
Edge
EXAFS
Pre-Edge
XANES
44
X-ray absorption spectroscopy (XAS) is a non-destructive technique which employs
monochromatic X-rays, typically from a synchrotron radiation source, to obtain bulk structural
information about a solid. The X-ray absorption spectrum of an hypothetical isolated atom would
show only edges corresponding to the binding energy of all electrons in the atom core levels, but
no further structure. If, however, the atom is bound in a lattice, the absorption is modulated due
to its local coordination, and fine structure arises. X-ray absorption near edge spectroscopy
(XANES) focuses on the shape of the absorption edge -see figure 2.1.1-, and is highly sensitive for
the valence state of the atom and its bonding geometry. Extended X-ray absorption fine structure
(EXAFS) deals with the interference effects visible in the absorption spectrum beyond the edge,
and provides detailed information on the distance, number, and type of neighbors of the
absorbing atom. However, the correct interpretation of the EXAFS region requires utilization of
mathematical modeling and highly technical knowledge in the field that make this technique of
more difficult access compared to XANES.
2.2.7 Pulse chemisorption and temperature-programmed desorption of ammonia
The experiments of chemisorption and subsequent temperature programmed desorption of
ammonia (NH3-TPD) were carried out on a TPD/2900 apparatus from Micromeritics. The samples
(ca. 0.3 g) were pre-treated in an Ar stream at 450ºC for 1 h. Ammonia was chemisorbed by
pulses at 100°C until equilibrium was reached. Then, the sample was fluxed with a He stream for
15 minutes, prior to increase the temperature up to 500°C in a helium stream of 100 ml min-1 and
using a heating rate of 10°C min-1. The NH3 desorption was monitored with a thermal conductivity
detector (TCD) and a mass-spectrometer.
TPD of ammonia is a widely used method for characterization of site densities in solid acids due to
the simplicity of the technique (however, quite time-consuming); it provides information on the
45
surface concentration of acid sites and the relative distribution of their strength. However one
must bear in mind that ammonia often overestimates the quantity of acid sites since its small
molecular size allows ammonia to penetrate into all pores of the solid whereas larger molecules
(e.g. glycerol and acrolein) only have access to large micropores and mesopores. Also, ammonia is
a very basic molecule which is capable of titrating weak acid sites which may not contribute to the
activity of catalysts. The strongly polar adsorbed ammonia is also capable of adsorbing additional
ammonia from the gas phase.
2.2.8 FTIR of adsorbed carbon monoxide or ammonia
IR spectra of adsorbed CO and NH3 were collected with a Nexus 8700 FTIR spectrometer using a
DTGS detector and acquiring at 4 cm−1. An IR cell allowing in situ treatments in controlled
atmospheres and working in the temperature range -176ºC to 500°C has been used. The samples,
prior to CO and NH3 adsorption experiments, were treated at 200°C in vacuum (10-5mbar) for 1.5
h. IR spectra of CO adsorption were recorded at -176°C using CO doses from 0.4-4mbar. In the
case of NH3 adsorption experiments 20 mbar NH3 were adsorbed at 25°C and then desorbed at
increasing temperatures (25°C, 100°C and 200°C).
The nature of the acid sites present on the catalysts prepared can be investigated by means of
infrared spectroscopy using NH3 as the probe molecules. Indeed, ammonia chemisorbed on
Brnsted acid sites or Lewis acid sites presents different modes of vibration that, generally
speaking, allow to discern the respective presence, abundance and strength of the two different
acid sites [89]; particularly when the FTIR experiment is coupled with TPD analysis.
FTIR of adsorbed CO has been extensively used in the literature since it is highly sensitive to the
electron-acceptor properties of the metal ion. Indeed in transition metal oxides the electrophilic
properties of the metal ion depends not only to their coordination but also to the nature and the
46
coordination state of the ligands. Accordingly, IR spectroscopy of CO can be performed in order
to analyze the surface nature of substituted-HTBs. In fact, W6+ and V5+ do not form stable
complexes with CO even at low temperature because of their high coordination saturation [90-
92], while Wn+ (n<6) and Vn+ (n<5) form stable CO carbonyl complexes [90, 93]. The (CO)
frequency as well as the stability of the carbonyl complex is highly depended on the electrophilic
properties of the metal ion, i.e coordination and oxidation state.
Overall, basically for the same reasons previously discussed for NH3-TPD, adsorption of both
ammonia and carbon monoxide cannot give a univocal picture of the real nature of the catalyst's
surface. Therefore, results have to be carefully analyzed and compared to other figures obtained
through various characterization methods.
2.2.9 Raman spectroscopy
Raman spectra were obtained with an “in via” Renishaw spectrometer, equipped with an
Olympus microscope. The exciting wavelength was 514 nm from a Renishaw HPNIR laser with a
power of approximately 15 mW on the sample. The dehydration of catalysts (under 20 mL min-1
argon flow at 150°C) was carried out by using a home-designed microreactor for in situ Raman
spectroscopy measurement.
Raman analyses are typically carried out illuminating a sample with a laser beam. Electromagnetic
radiation from the illuminated spot is collected with a lens and sent to a monochromator. Elastic
scattered radiation at the wavelength corresponding to the laser line (Rayleigh scattering) is
filtered out, while the rest of the collected light is dispersed onto a detector.
In infrared spectroscopy a molecule absorbs photons with the same frequency as its vibrations. In
contrast, Raman spectroscopy is based on the inelastic scattering of photons, which lose energy
by exciting vibrations in the sample. As in infrared spectroscopy, not all vibrations are observable.
47
A vibration is Raman active if it changes the polarizability of the molecule. This requires in general
that the molecule changes its shape. For example, the vibration of a hypothetical spherical
molecule between the extremes of a disk-shaped and a cigar-shaped ellipsoid would be Raman
active. Since the selection rule for infrared spectroscopy needs that a dipole moment changes
during the vibration, some stretch vibrations of for example H2 (4160.2 cm-1), N2 (2330.7 cm-1) and
O2 (1554.7 cm-1) are observed in Raman spectroscopy but not in infrared. Hence, the two
techniques complement each other, in particular for highly symmetrical molecules.
A disadvantage of the technique is the small cross sections for Raman scattering, which makes the
intensity of the inelastic scattered light signal very low, particularly compared to the elastic
scattered light (Rayleigh band). This issue can be overcome coupling the use of intense radiation
sources, e.g. lasers, with high-resolution monochromators. Finally, fluorescence of the sample,
giving rise to spectral backgrounds, may seriously limit the detectability of weak signals.
2.2.10 X-ray photoelectron spectroscopy (XPS)
X-ray photoelectron spectroscopy (XPS) measurements were performed on a SPECS
spectrometer equipped with a Phoibos 150 MCD-9 detector using a monochromatic Al K-alpha
(1486.6 eV) X-ray source. Spectra were recorded using analyzer pass energy of 50 V, an X-ray
power of 200W, and an operating pressure of 10-9 mbar. Spectra treatment was performed using
the CASA software. Binding energies (BE) were referenced to C1s at 284.5 eV.
X-ray photoelectron spectroscopy (XPS) is an analytical technique that characterizes the surface of
a material, providing information about the surface elemental composition and chemical
environment of the sample being probed. XPS operates firing monochromatic X-rays onto the
sample surface. The X-ray photons excite and consequently eject core level electrons from the
atoms in the sample. The binding energy of these electrons -Eb- is the energy required to promote
48
an electron from a given electronic level to the Fermi level and it is characteristic of the elements
in the solid being investigated; this is what gives rise to the discrete peaks in an XP spectrum. The
binding energy can be calculated by measuring the kinetic energy of the emitted electrons
according to the following equation:
Equation 2.4: The binding energy
where Eb = the binding energy of the emitted electron, h ν = the incident X-ray photon energy, EK
= the kinetic energy of the emitted electron and Φ = the spectrometer work function.
When photoemission occurs from non-s orbitals, the peaks in the XP spectrum appear as
doublets. These doublets arise from the coupling between an electron’s orbital angular
momentum, with characteristic quantum number l, and its spin momentum, with characteristic
quantum number s, which can take either of the values ± ½. These can be summed to give the
total angular momentum, possessing the quantum number j, which can take two values when l is
> 0, i.e. in p, d and f orbitals. The full width at half maximum (FWHM) and line-shape are the same
for both of the peaks. Characteristic binding energies and doublet peak separations of different
elements can be readily found on the National Institute of Standards and Technology (NIST) XPS
database [94].
Atoms of the same element in a solid, in dissimilar chemical environments, can give rise to inner
orbital peaks with significantly different binding energies. These so-called ‘chemical shifts’ can be
due to initial and final state effects. Initial state effects relate to the charge on the atom being
probed. An electron in a more electron-deficient environment, in an atom with high oxidation
state for instance, would possess a higher binding energy than one located in an electron-rich
system, in a more reduced atom. Higher energy orbitals are more sensitive to these binding
energy shifts, therefore better resolution of different chemical environments can be achieved by
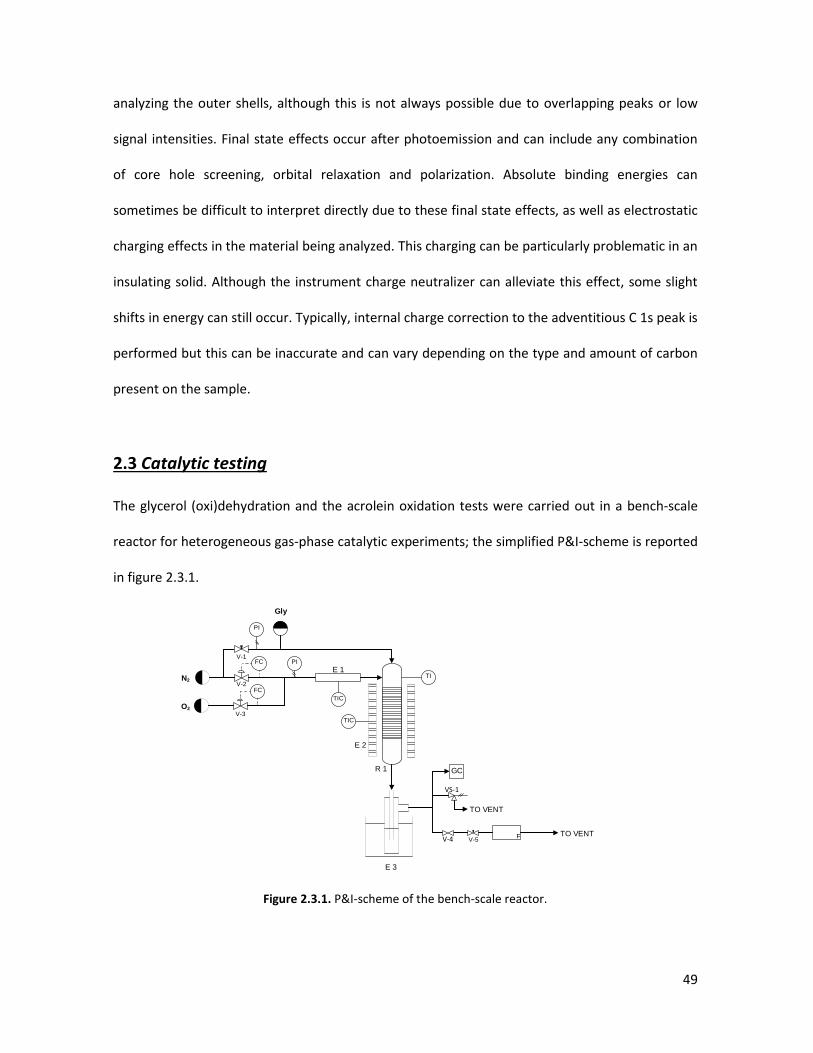
49
analyzing the outer shells, although this is not always possible due to overlapping peaks or low
signal intensities. Final state effects occur after photoemission and can include any combination
of core hole screening, orbital relaxation and polarization. Absolute binding energies can
sometimes be difficult to interpret directly due to these final state effects, as well as electrostatic
charging effects in the material being analyzed. This charging can be particularly problematic in an
insulating solid. Although the instrument charge neutralizer can alleviate this effect, some slight
shifts in energy can still occur. Typically, internal charge correction to the adventitious C 1s peak is
performed but this can be inaccurate and can vary depending on the type and amount of carbon
present on the sample.
2.3 Catalytic testing
The glycerol (oxi)dehydration and the acrolein oxidation tests were carried out in a bench-scale
reactor for heterogeneous gas-phase catalytic experiments; the simplified P&I-scheme is reported
in figure 2.3.1.
Figure 2.3.1. P&I-scheme of the bench-scale reactor.
V-2
FC
V-3
FC
V-1PI
TIC
TI
F
N2
O2
Gly
E 1
E 2
R 1
E 3
GC
TO VENT
TIC
PI
V-5
VS-1
TO VENT
50
The liquid feed (indicated in short as Gly) is injected by means of a programmable infusion pump.
A nitrogen gas stream, regulated by V-1, is used as a carrier gas to help the solution reaching the
reactor. For safety reasons (see paragraph 3.2.4) and to avoid side reactions in the gas phase, the
final mixture is introduced directly into the reactor (R-1), through a 1/16" pipe, ca. 1 cm above the
catalytic bed. The small diameter of the pipe, as well as the reactor temperature and the small
quantity of reactants used, guarantee a fast and complete evaporation of the liquid phase. Two
pressure indicators (PI) are use to monitor the relative pressure in the hole plant.
Oxygen and a second stream of nitrogen, before entering the reactor, are pre-heated by heating
tapes (E1); their respective flows are controlled by two mass flow controllers (FC). The reactor
consists in a quartz tube with an internal diameter of ca. 0.5", operating at atmospheric pressure
and heated by a vertical tube furnaces. The temperature of reaction is measured by means of an
axial thermocouple placed inside the catalytic bed. The effluent stream is bubbled through two in-
series abatement devices (E-3), which are filled with water (but in some cases anhydrous acetone
were used, for the identification of compounds which are less soluble in water) and maintained at
a temperature of 0-2°C; a third refrigerated condenser is left empty. After this abatement, the
gaseous stream, still containing nitrogen, oxygen and carbon oxides, is fed to an automatic
sampling system for gas-chromatography (GC-TCD) analysis. The water solution containing the
unconverted glycerol and reaction products is analyzed by gas-chromatography (GC).
In a typical experiment, from 0.2g to 0.50g of catalyst are loaded either in the form of granules,
with a diameter ranging from 0.25 to 0.60 mm, or in the form of powder; the overall gas inlet flow
rate varied from 25 mL/min up to 60 mL/min (measured at room T). All the contact time values
reported in the next sections are calculated at room temperature. In experiments made with
variation of contact time, the amount of catalyst loaded was varied, whereas the flow was kept
constant. If not different specified, the inlet feed composition was: 2 mol% glycerol, 4 mol%
51
oxygen, 40 mol% water, and 54 mol% helium. Overall reaction conditions are illustrated in each
figure or table.
Gas chromatographic analyses were carried out using a Hewlett-Packard 5890 instrument
equipped with a FID detector. A semi-capillary wide-bore OV 351 (polyethylenglycol treated with
terephthalic acid) column was used for the separation of condensed compounds; oven
temperature was set from 40°C to 190°C (heating rate 10°/min, isothermal step at 190°C, 3 min),
then from 190°C to 225°C (heating rate 30°/min, final isothermal step at 225°C, 30 min). Two
wide-bore columns were used for the separation of incondensable products: a Molsieve 5A for
oxygen and CO, and a Silica Plot for CO2 (oven temperature 80°C). Compounds were identified by
means of both GC-MS and injection of pure reference standards for the comparison of retention
times in the GC columns. Depending on catalyst and reaction condition used, unknown
compounds were also eluted in the GC column; it was attributed to these compounds the same
response factor of the corresponding known compound with the closest retention time. Cyclic
ethers were also sometimes produced; however, because it was not possible to perfectly resolve
each peak corresponding to cyclic ethers with the chromatographic setup used, both the cyclic
ethers and heaviest compounds not eluted from the GC column (left as residues on both the
catalyst surface and reactor walls) were quantified as the remainder of the total carbon balance
and labeled as "heavy compounds". Minor identified products and unknown compounds (except
for ketals) have been grouped together under the heading “Others”. For the sake of completeness
and clarity, only few exceptions to this nomenclature have been reported in this thesis. Where
needed, the various chemical species involved are specified both in the text and figures' caption.
Catalytic tests for methanol conversion were carried out in a fixed bed reactor operating at
atmospheric pressure in the 250–400°C temperature region. The overall set-up being similar to
the one reported in figure 2.3.1. The catalyst weight was either 0.10 g or 0.20 g, and the feed
52
consisted in a methanol/oxygen/nitrogen mixture with a molar ratio of 6/13/81 (total flow of 100
mL min−1). The analysis of reactants and products was carried out by means of on-line gas-
chromatography, using two different chromatographic columns: (i) Molecular sieve 5A (3 m
length) and (ii) RT-U-bond (30 m, 0.53 i.d.).
53
3. Results and discussion
3.1 Introduction of Niobium in V-substituted HTBs
Niobium is a well known element for improving the acid properties of mixed-oxide catalysts and it
was demonstrated to be effective in enhancing the selectivity to acrolein from glycerol [43, 44].
Therefore, the idea at the bases of the research was to introduce niobium in the W-V HTBs
previously studied so as to improve the glycerol dehydration step and hence the overall selectivity
to acrylic acid. Indeed, the possibility of substituting tungsten atoms for niobium in the HTBs
lattice, was already proved in the '80s by means of solid state preparations [95]. Moreover, milder
and more controllable hydrothermal methods would be more desirable from an industrial
perspective.
3.1.1 Physicochemical properties of the oxides
Table 3.1.1 compiles the samples prepared, and summarizes their main characteristics. Different
samples based on hexagonal-WOx were synthesized: (i) bi-component systems made of mixed
oxides of either W-V or W-Nb, and (ii) tri-component systems of W, Nb and V. Provided the results
obtained on W-V catalysts [1], the W/V ratio was maintained also in tri-component systems. The
acronyms used for W-V catalysts, refer to samples studied in [1].
Figure 3.1.1 (left) shows the XRD patterns of samples heat treated at 600°C in N2, except in the
case of pure WOx (hexagonal) sample which was heat-treated at 450°C, which otherwise
decomposes (see paragraph 1.8). All samples present the hexagonal tungsten bronze (HTB)
crystal structure (JCPDS: 85-2460), although smaller changes in the intensity of some of the
diffraction lines might be related to changes in their morphologies [96]. Indeed, SEM images
showed changes in morphology depending on catalysts' composition.
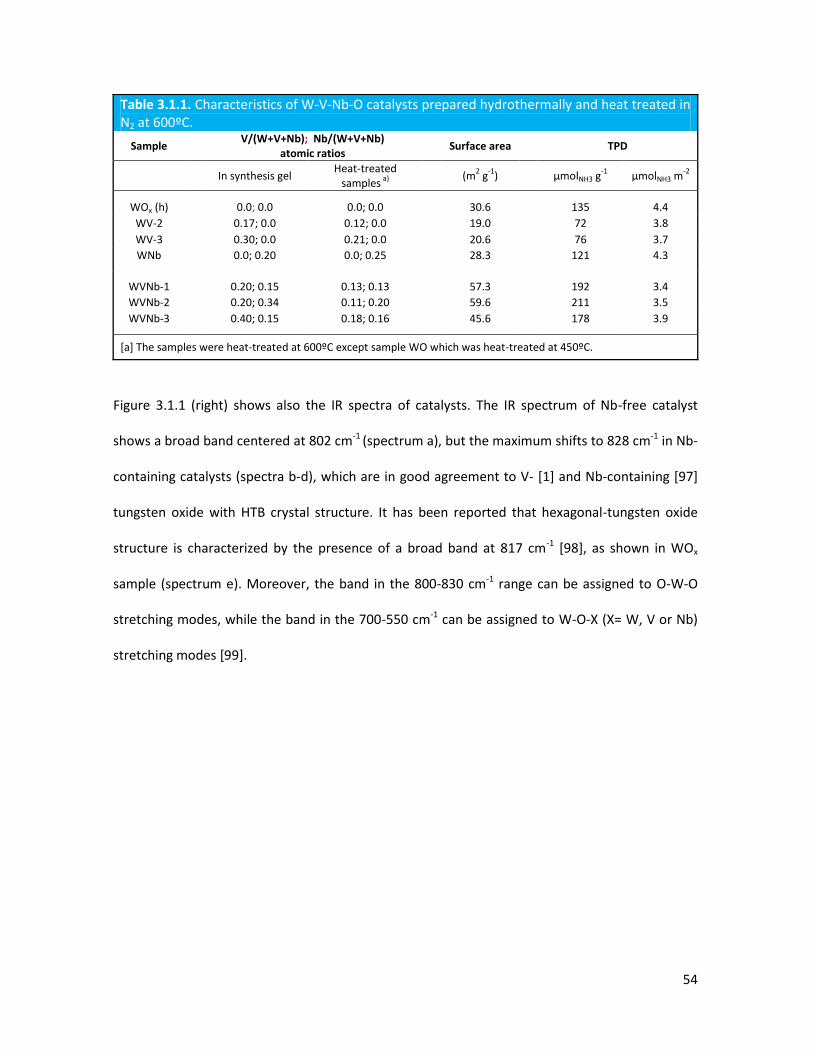
54
Table 3.1.1. Characteristics of W-V-Nb-O catalysts prepared hydrothermally and heat treated in N2 at 600ºC.
Sample V/(W+V+Nb); Nb/(W+V+Nb)
atomic ratios Surface area TPD
In synthesis gel Heat-treated
samples a)
(m
2 g
-1) µmolNH3 g
-1 µmolNH3 m
-2
WOx (h) 0.0; 0.0 0.0; 0.0 30.6 135 4.4
WV-2 0.17; 0.0 0.12; 0.0 19.0 72 3.8
WV-3 0.30; 0.0 0.21; 0.0 20.6 76 3.7
WNb 0.0; 0.20 0.0; 0.25 28.3 121 4.3
WVNb-1 0.20; 0.15 0.13; 0.13 57.3 192 3.4
WVNb-2 0.20; 0.34 0.11; 0.20 59.6 211 3.5
WVNb-3 0.40; 0.15 0.18; 0.16 45.6 178 3.9
[a] The samples were heat-treated at 600ºC except sample WO which was heat-treated at 450ºC.
Figure 3.1.1 (right) shows also the IR spectra of catalysts. The IR spectrum of Nb-free catalyst
shows a broad band centered at 802 cm-1 (spectrum a), but the maximum shifts to 828 cm-1 in Nb-
containing catalysts (spectra b-d), which are in good agreement to V- [1] and Nb-containing [97]
tungsten oxide with HTB crystal structure. It has been reported that hexagonal-tungsten oxide
structure is characterized by the presence of a broad band at 817 cm-1 [98], as shown in WOx
sample (spectrum e). Moreover, the band in the 800-830 cm-1 range can be assigned to O-W-O
stretching modes, while the band in the 700-550 cm-1 can be assigned to W-O-X (X= W, V or Nb)
stretching modes [99].
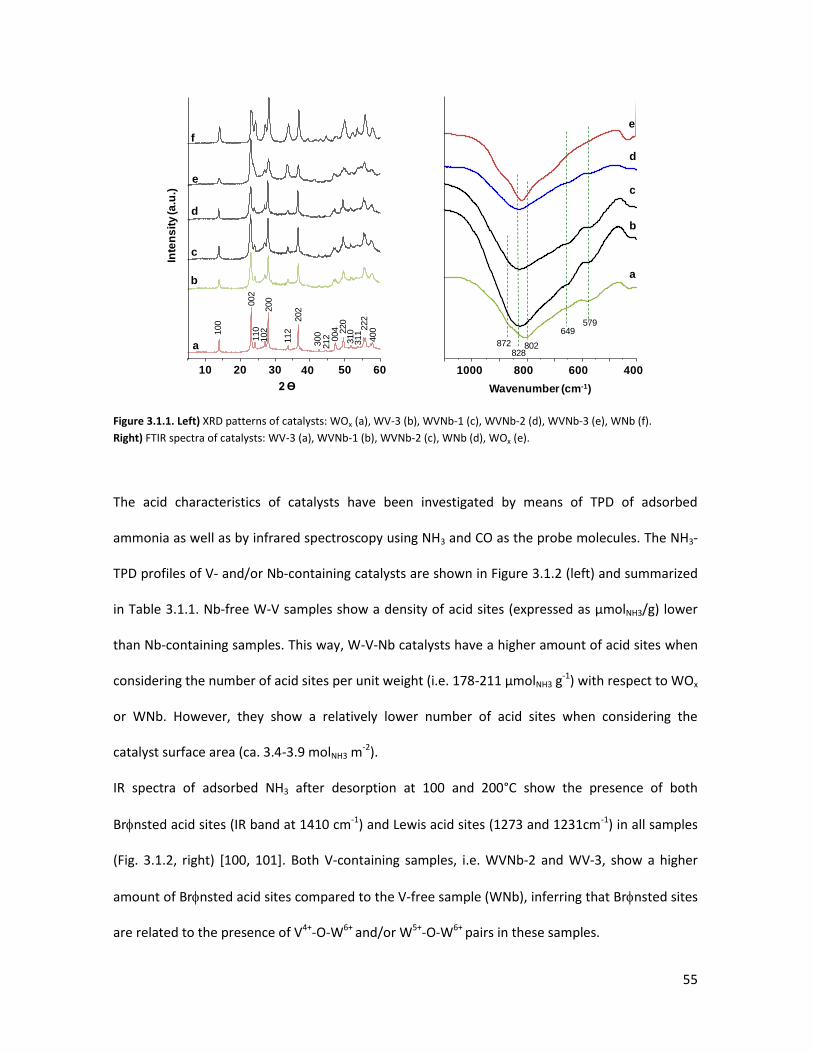
55
Figure 3.1.1. Left) XRD patterns of catalysts: WOx (a), WV-3 (b), WVNb-1 (c), WVNb-2 (d), WVNb-3 (e), WNb (f).
Right) FTIR spectra of catalysts: WV-3 (a), WVNb-1 (b), WVNb-2 (c), WNb (d), WOx (e).
The acid characteristics of catalysts have been investigated by means of TPD of adsorbed
ammonia as well as by infrared spectroscopy using NH3 and CO as the probe molecules. The NH3-
TPD profiles of V- and/or Nb-containing catalysts are shown in Figure 3.1.2 (left) and summarized
in Table 3.1.1. Nb-free W-V samples show a density of acid sites (expressed as µmolNH3/g) lower
than Nb-containing samples. This way, W-V-Nb catalysts have a higher amount of acid sites when
considering the number of acid sites per unit weight (i.e. 178-211 µmolNH3 g-1) with respect to WOx
or WNb. However, they show a relatively lower number of acid sites when considering the
catalyst surface area (ca. 3.4-3.9 molNH3 m-2).
IR spectra of adsorbed NH3 after desorption at 100 and 200°C show the presence of both
Brnsted acid sites (IR band at 1410 cm-1) and Lewis acid sites (1273 and 1231cm-1) in all samples
(Fig. 3.1.2, right) [100, 101]. Both V-containing samples, i.e. WVNb-2 and WV-3, show a higher
amount of Brnsted acid sites compared to the V-free sample (WNb), inferring that Brnsted sites
are related to the presence of V4+‐O‐W6+ and/or W5+‐O‐W6+
pairs in these samples.
10 20 30 40 50 60
2 Ɵ
c
b
a
f
d
e
100
002
110
102
200
112
202
4002
22
220
004
300
212
310
311
Inte
ns
ity
(a.u
.)
1000 800 600 400
828
649579
872 802
a
b
c
d
e
Wavenumber (cm-1)
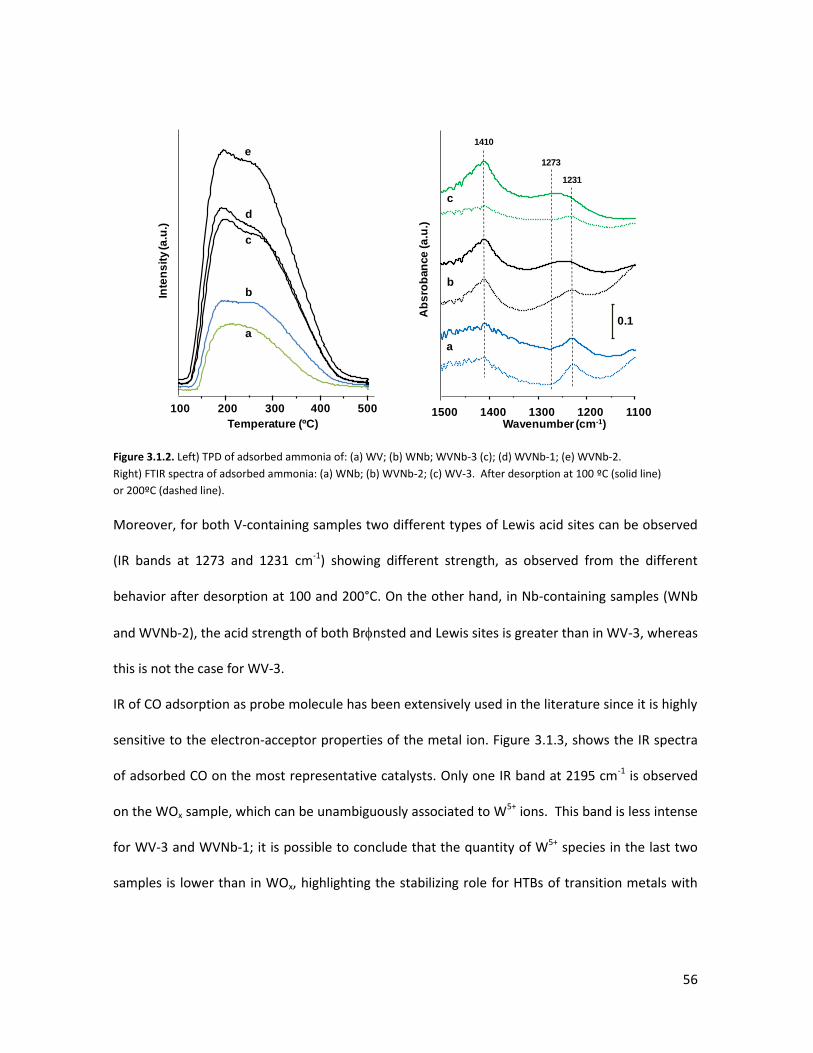
56
Figure 3.1.2. Left) TPD of adsorbed ammonia of: (a) WV; (b) WNb; WVNb-3 (c); (d) WVNb-1; (e) WVNb-2.
Right) FTIR spectra of adsorbed ammonia: (a) WNb; (b) WVNb-2; (c) WV-3. After desorption at 100 ºC (solid line)
or 200ºC (dashed line).
Moreover, for both V-containing samples two different types of Lewis acid sites can be observed
(IR bands at 1273 and 1231 cm-1) showing different strength, as observed from the different
behavior after desorption at 100 and 200°C. On the other hand, in Nb-containing samples (WNb
and WVNb-2), the acid strength of both Brnsted and Lewis sites is greater than in WV-3, whereas
this is not the case for WV-3.
IR of CO adsorption as probe molecule has been extensively used in the literature since it is highly
sensitive to the electron-acceptor properties of the metal ion. Figure 3.1.3, shows the IR spectra
of adsorbed CO on the most representative catalysts. Only one IR band at 2195 cm-1 is observed
on the WOx sample, which can be unambiguously associated to W5+ ions. This band is less intense
for WV-3 and WVNb-1; it is possible to conclude that the quantity of W5+ species in the last two
samples is lower than in WOx, highlighting the stabilizing role for HTBs of transition metals with
1500 1400 1300 1200 1100
1410
1273
1231
c
b
a
0.1
Ab
sro
ban
ce
(a.u
.)Wavenumber (cm-1)
100 200 300
Inte
ns
ity
(a.u
.)
Temperature (ºC)
a
b
c
d
e
400 500
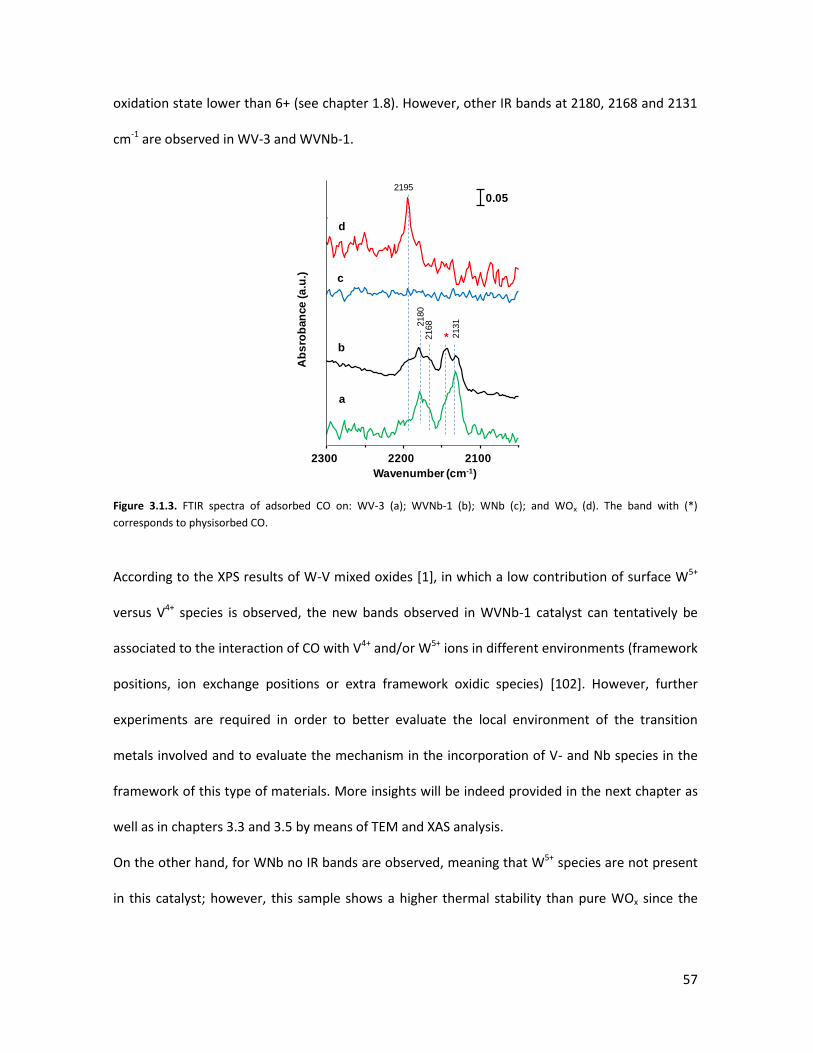
57
oxidation state lower than 6+ (see chapter 1.8). However, other IR bands at 2180, 2168 and 2131
cm-1 are observed in WV-3 and WVNb-1.
Figure 3.1.3. FTIR spectra of adsorbed CO on: WV-3 (a); WVNb-1 (b); WNb (c); and WOx (d). The band with (*)
corresponds to physisorbed CO.
According to the XPS results of W-V mixed oxides [1], in which a low contribution of surface W5+
versus V4+ species is observed, the new bands observed in WVNb-1 catalyst can tentatively be
associated to the interaction of CO with V4+ and/or W5+ ions in different environments (framework
positions, ion exchange positions or extra framework oxidic species) [102]. However, further
experiments are required in order to better evaluate the local environment of the transition
metals involved and to evaluate the mechanism in the incorporation of V- and Nb species in the
framework of this type of materials. More insights will be indeed provided in the next chapter as
well as in chapters 3.3 and 3.5 by means of TEM and XAS analysis.
On the other hand, for WNb no IR bands are observed, meaning that W5+ species are not present
in this catalyst; however, this sample shows a higher thermal stability than pure WOx since the
2300 2200 2100
Ab
sro
ban
ce
(a.u
.)
Wavenumber (cm-1)
2195
2180
2168
2131
0.05
a
b
c
d
*
58
bronze structure of WNb catalysts is stable during the heat-treatment up to 600°C, hence making
it possible to conclude that Nb5+ ions are incorporated in the hexagonal framework.
The main conclusions inferred from the characterization of samples are:
W-V-Nb mixed oxides with the HTB structure can be prepared hydrothermally.
The incorporation of Nb5+ leads to a lower concentration of surface W5+ sites, thus
making possible to form an HTB with fully oxidized (or almost) tungsten atom.
The presence of Nb in tri-component systems (W-V-Nb-O) leads to a remarkable
increase of surface area compared to both W-Nb-O and W-V-O samples.
However, surface area values close to W-V-Nb-O were also obtained for W-Nb-
oxides prepared by hydrothermal methods [103], suggesting that the post-
synthesis treatments (e.g. grinding) and/or synthetic procedure (e.g. pH, directing
agents etc.) are pivotal in governing the final surface area value.
The amount of surface acid sites in W-V-Nb samples is relatively higher than that
in W-V, W-Nb or W- bronzes, but the surface density of acid sites is similar for W-
V and W-V-Nb, and lower than that of W-Nb and W- bronzes. On the other hand,
the fraction of stronger sites is greater in Nb-containing samples.
3.1.2 Lab-scale reactor tests
In figure 3.1.4 are summarized some representative results obtained on the best performing acid
catalysts, i.e. WOx and WNb, as well as bi-functional acid-redox catalysts, i.e. WV-2, WV-3 and
WVNb-1. Data concerning catalysts WV-2 and WOx are reported from [1].
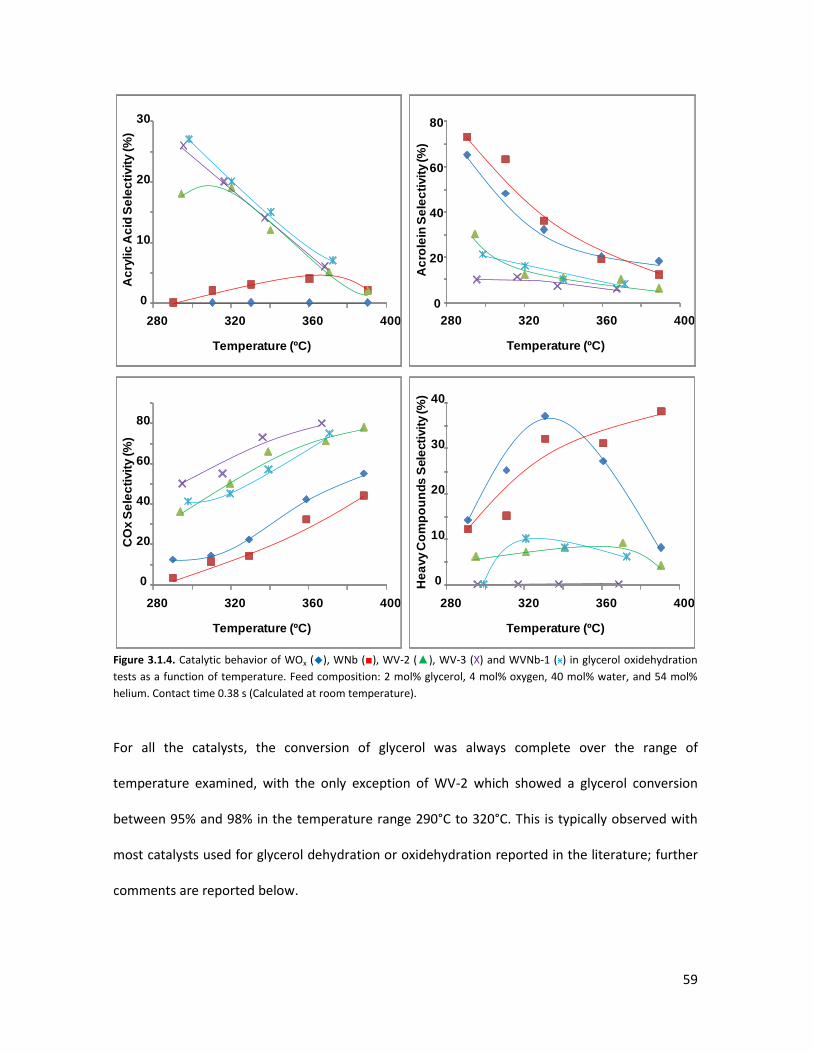
59
Figure 3.1.4. Catalytic behavior of WOx (◆), WNb (■), WV-2 (▲), WV-3 (X) and WVNb-1 (ӿ) in glycerol oxidehydration
tests as a function of temperature. Feed composition: 2 mol% glycerol, 4 mol% oxygen, 40 mol% water, and 54 mol%
helium. Contact time 0.38 s (Calculated at room temperature).
For all the catalysts, the conversion of glycerol was always complete over the range of
temperature examined, with the only exception of WV-2 which showed a glycerol conversion
between 95% and 98% in the temperature range 290°C to 320°C. This is typically observed with
most catalysts used for glycerol dehydration or oxidehydration reported in the literature; further
comments are reported below.
0
10
20
30
280 320 360 400
Ac
rylic
Ac
id S
ele
cti
vit
y (%
)
Temperature (ºC)
280 320 360 400
Ac
role
in S
ele
cti
vit
y (%
)
Temperature (ºC)
0
20
40
60
80
0
20
40
60
80
280 320 360 400
CO
x S
ele
cti
vit
y (%
)
Temperature (ºC)
0
10
20
30
40
280 320 360 400
He
avy C
om
po
un
ds S
ele
cti
vit
y (%
)
Temperature (ºC)
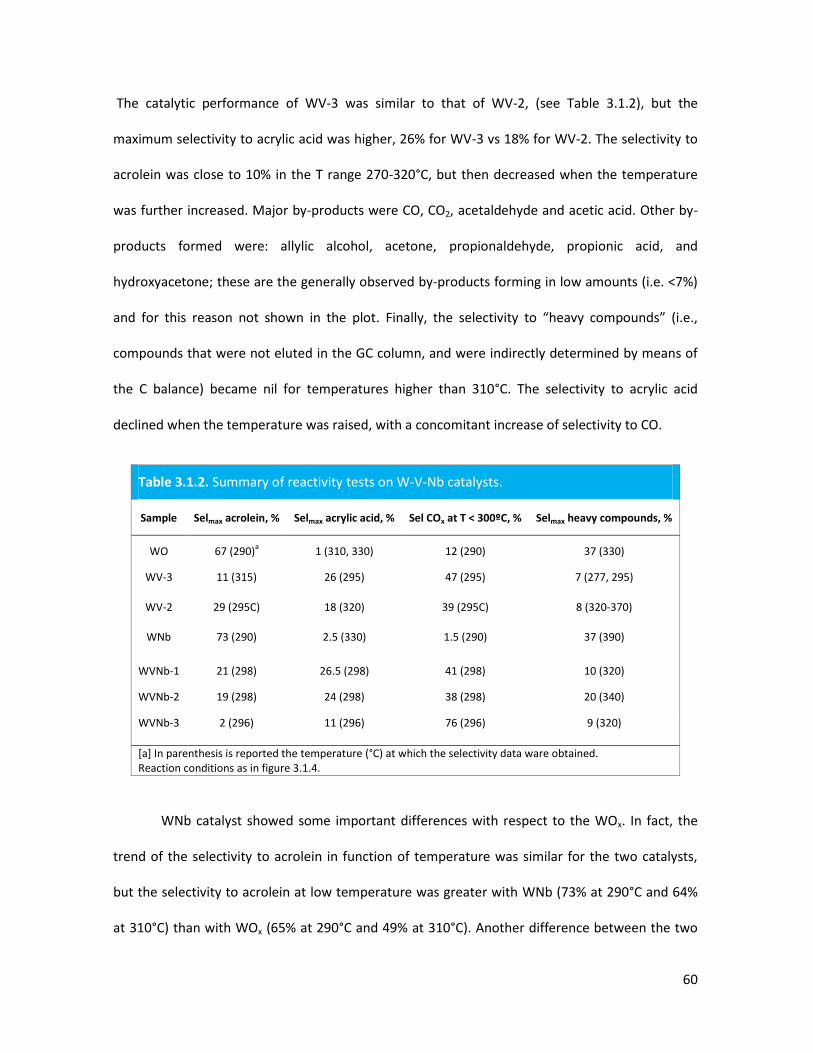
60
The catalytic performance of WV-3 was similar to that of WV-2, (see Table 3.1.2), but the
maximum selectivity to acrylic acid was higher, 26% for WV-3 vs 18% for WV-2. The selectivity to
acrolein was close to 10% in the T range 270-320°C, but then decreased when the temperature
was further increased. Major by-products were CO, CO2, acetaldehyde and acetic acid. Other by-
products formed were: allylic alcohol, acetone, propionaldehyde, propionic acid, and
hydroxyacetone; these are the generally observed by-products forming in low amounts (i.e. <7%)
and for this reason not shown in the plot. Finally, the selectivity to “heavy compounds” (i.e.,
compounds that were not eluted in the GC column, and were indirectly determined by means of
the C balance) became nil for temperatures higher than 310°C. The selectivity to acrylic acid
declined when the temperature was raised, with a concomitant increase of selectivity to CO.
Table 3.1.2. Summary of reactivity tests on W-V-Nb catalysts.
Sample Selmax acrolein, % Selmax acrylic acid, % Sel COx at T < 300ºC, % Selmax heavy compounds, %
WO 67 (290)a
1 (310, 330) 12 (290) 37 (330)
WV-3 11 (315) 26 (295) 47 (295) 7 (277, 295)
WV-2 29 (295C) 18 (320) 39 (295C) 8 (320-370)
WNb 73 (290) 2.5 (330) 1.5 (290) 37 (390)
WVNb-1 21 (298) 26.5 (298) 41 (298) 10 (320)
WVNb-2 19 (298) 24 (298) 38 (298) 20 (340)
WVNb-3 2 (296) 11 (296) 76 (296) 9 (320)
[a] In parenthesis is reported the temperature (°C) at which the selectivity data ware obtained. Reaction conditions as in figure 3.1.4.
WNb catalyst showed some important differences with respect to the WOx. In fact, the
trend of the selectivity to acrolein in function of temperature was similar for the two catalysts,
but the selectivity to acrolein at low temperature was greater with WNb (73% at 290°C and 64%
at 310°C) than with WOx (65% at 290°C and 49% at 310°C). Another difference between the two
61
samples is the selectivity to heavy compounds; indeed, with WOx, they first increased (in
concomitance with the decrease of selectivity to acrolein), reached a maximum value at 330°C,
and finally decreased when the temperature was further raised, with a strong increase of
selectivity to COx. With WNb, instead, the raise of CO selectivity at temperatures higher than
330°C was less relevant than with WOx, and the selectivity to heavy compounds in this
temperature range was ca 30-35%. Differences of catalytic behavior between WOx and WNb can
be attributed to both the presence of Nb5+ sites, probably responsible for the greater fraction of
stronger acid sites (Figure 3.1.2), and to the lower surface concentration of W5+ sites, as inferred
from CO-adsorption experiments (Figure 3.1.3).
It is of interest to compare WVNb-1 to WV-3. At low temperature, the overall selectivity to
acrolein + acrylic acid was greater with WVNb-1 than with WV-3 (47.5% at 298°C for WVNb-1,
33% with WV-3); this difference was mainly due to the greater selectivity to acrolein obtained
with the former catalyst. Moreover, when the temperature was raised with the WVNb-1 catalyst,
the selectivity to both acrolein and acrylic acid declined; at the same time, the selectivity to COx
increased, and that to heavy compounds first increased (selectivity 10% at 320°C), and then
decreased. With WV-3, instead, the selectivity to acrylic acid also declined (with a corresponding
higher selectivity to COx), but that to acrolein changed only at a minor extent, and there was no
formation of heavy compounds at all.
Table 3.1.2 compares the catalytic behavior of WVNb-1, WVNb-2 and WVNb-3; the table compiles
the values of maximum selectivity to acrolein and acrylic acid (both obtained at temperatures
lower than 320°C), the selectivity to CO+CO2 at low temperature, and the maximum selectivity to
heavy compounds. It is shown that the increase of Nb content (sample WVNb-2) led to a worse
catalytic behavior at low temperature, with a slightly lower selectivity to acrolein and acrylic acid
and a higher selectivity to heavy compounds. This indicates that a low amount of Nb favors the
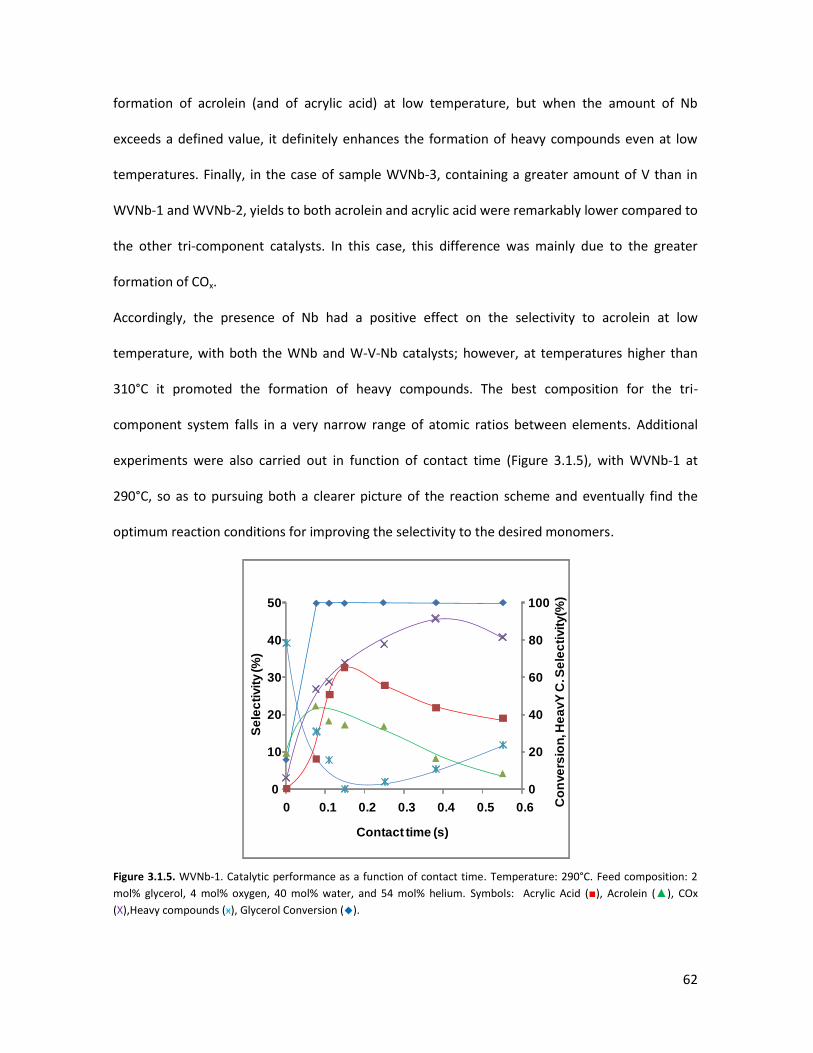
62
formation of acrolein (and of acrylic acid) at low temperature, but when the amount of Nb
exceeds a defined value, it definitely enhances the formation of heavy compounds even at low
temperatures. Finally, in the case of sample WVNb-3, containing a greater amount of V than in
WVNb-1 and WVNb-2, yields to both acrolein and acrylic acid were remarkably lower compared to
the other tri-component catalysts. In this case, this difference was mainly due to the greater
formation of COx.
Accordingly, the presence of Nb had a positive effect on the selectivity to acrolein at low
temperature, with both the WNb and W-V-Nb catalysts; however, at temperatures higher than
310°C it promoted the formation of heavy compounds. The best composition for the tri-
component system falls in a very narrow range of atomic ratios between elements. Additional
experiments were also carried out in function of contact time (Figure 3.1.5), with WVNb-1 at
290°C, so as to pursuing both a clearer picture of the reaction scheme and eventually find the
optimum reaction conditions for improving the selectivity to the desired monomers.
Figure 3.1.5. WVNb-1. Catalytic performance as a function of contact time. Temperature: 290°C. Feed composition: 2
mol% glycerol, 4 mol% oxygen, 40 mol% water, and 54 mol% helium. Symbols: Acrylic Acid (■), Acrolein (▲), COx
(X),Heavy compounds (ӿ), Glycerol Conversion (◆).
0
20
40
60
80
100
0
10
20
30
40
50
0 0.1 0.2 0.3 0.4 0.5 0.6
Contact time (s)
Co
nve
rsio
n, H
ea
vY
C.S
ele
cti
vit
y(%
)
Se
lec
tivit
y (%
)
63
As far as the reaction mechanism is concerned, it is possible to notice that when no catalyst was
present (contact time zero), the glycerol conversion was close to 9% and there was formation of
acrolein. Hence a minor contribution by homogeneous reactivity in the gas phase has to be taken
into account. Moreover, there is a very high formation of heavy compounds, consisting of both
glycerol oligomers and ketals obtained by reaction between glycerol and acrolein (the nature of
heavy compounds was determined by means of ESI-MS). However, it must be stressed that
selectivity values at such low glycerol conversion are affected by a significantly higher
experimental error compared to data obtained at higher conversions.
The presence of the catalyst (contact time < 0.1s and higher) led to total glycerol conversion, and
to a remarkable decrease of the selectivity to heavy compounds. However, the overall yield to the
latter compounds was greater than that obtained with no catalyst at all, meaning that the catalyst
also contributed to their formation. The products formed in the greater amount were acrolein
(selectivity 22%) and COx; acrylic acid selectivity was 8%.
In the 0.08-to-0.20 sec contact time range, the selectivity to heavy compounds decreased
considerably, whereas a rapid decline of selectivity to acrolein led to a corresponding increase of
the selectivity to acrylic acid, a proof for the consecutive oxidation of the aldehyde into the acid.
The maximum yield to acrylic acid, obtained at 0.15s contact time, was 33%.
Contact times higher than 0.20s led to a progressive decline of selectivity to acrylic acid,
acetaldehyde, and acrolein. Conversely, selectivity to COx and acetic acid increased, a clear
indication of the presence of consecutive reactions of oxidative degradation or decomposition. An
unexpected phenomenon was the increase of selectivity to heavy compounds (mainly of
oligomers of acrolein). This might indicate that (total) oxidation and oligomerization are
competitive parallel reactions whose contribution depends on the acid and redox sites relative
distribution and contact time.
64
Finally a time-on-stream test was carried out under the optimal conditions for WVNb-1, that is
290°C and 0.15s contact time (Figure 3.1.6). It must be stressed that, generally speaking, catalyst's
life tests have to be performed at conversion <100%. Indeed, incomplete conversion guarantees
that the whole catalytic bed participates to the reaction under the conditions used. Total
conversion might mask a partial use of the catalyst and forge the time-on-stream tests, leading to
stable long lasting overall catalytic performance, even if the catalytic bed is actually undergoing
deactivation.
In the case of the catalytic test reported in figure 3.1.6, the glycerol conversion was always
complete, therefore potentially leading to the problems just mentioned. However, if different
reaction conditions were used to lower the glycerol conversion, the catalytic performance would
have been significantly affected, particularly due to the formation of heavy compounds. Indeed, it
has been demonstrated above that their selectivity strongly increases when glycerol is present,
(unconverted) in the gas phase, due to the formation of ketals through condensation of
aldehydes with glycerol, as well as glycerol oligomerization (see chapter 3.2). Therefore, reaction
conditions different from the optimal ones, would have led to a faster deactivation of the catalyst,
not representative of the real time-on-stream performance under the optimized conditions.
Overall, taking into consideration the very low amount of catalyst used (ca. 0.3g) and the
relatively long time-on-stream test (ca. 100h), the partial utilization of the catalytic bed is
definitely unlikely, as also proved by the contact time tests in figure 3.1.5.
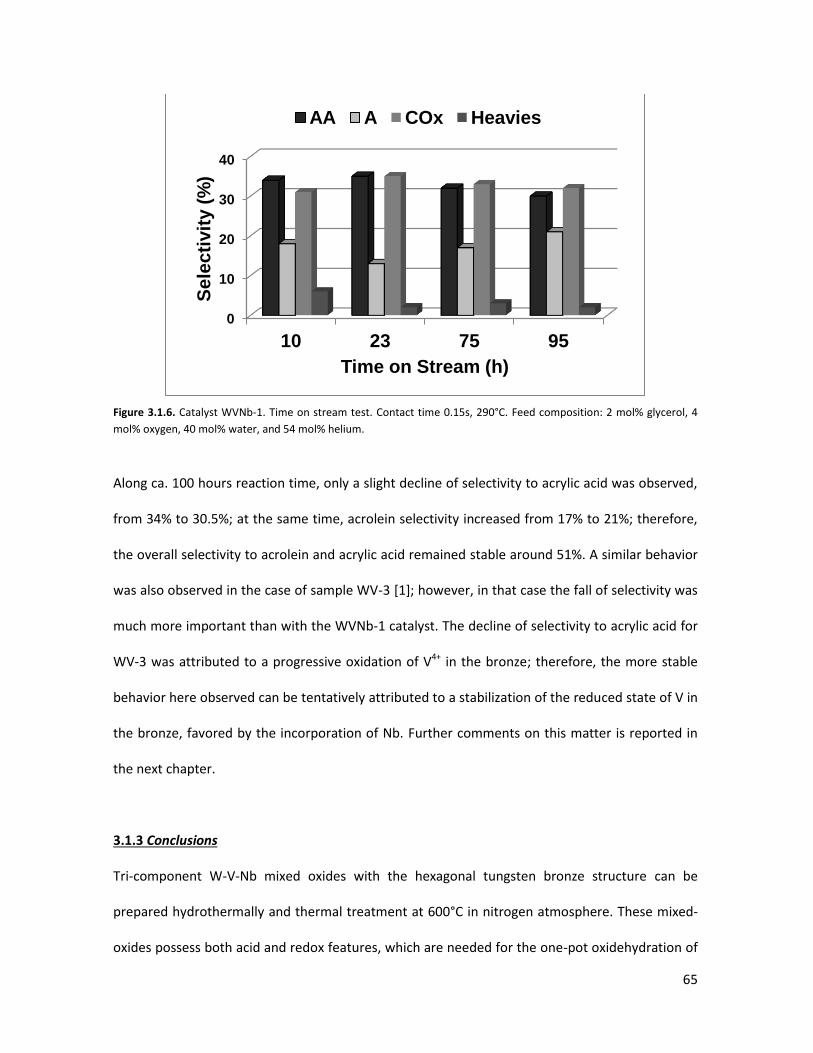
65
Figure 3.1.6. Catalyst WVNb-1. Time on stream test. Contact time 0.15s, 290°C. Feed composition: 2 mol% glycerol, 4
mol% oxygen, 40 mol% water, and 54 mol% helium.
Along ca. 100 hours reaction time, only a slight decline of selectivity to acrylic acid was observed,
from 34% to 30.5%; at the same time, acrolein selectivity increased from 17% to 21%; therefore,
the overall selectivity to acrolein and acrylic acid remained stable around 51%. A similar behavior
was also observed in the case of sample WV-3 [1]; however, in that case the fall of selectivity was
much more important than with the WVNb-1 catalyst. The decline of selectivity to acrylic acid for
WV-3 was attributed to a progressive oxidation of V4+ in the bronze; therefore, the more stable
behavior here observed can be tentatively attributed to a stabilization of the reduced state of V in
the bronze, favored by the incorporation of Nb. Further comments on this matter is reported in
the next chapter.
3.1.3 Conclusions
Tri-component W-V-Nb mixed oxides with the hexagonal tungsten bronze structure can be
prepared hydrothermally and thermal treatment at 600°C in nitrogen atmosphere. These mixed-
oxides possess both acid and redox features, which are needed for the one-pot oxidehydration of
0
10
20
30
40
10 23 75 95
Se
lec
tivit
y (
%)
Time on Stream (h)
AA A COx Heavies
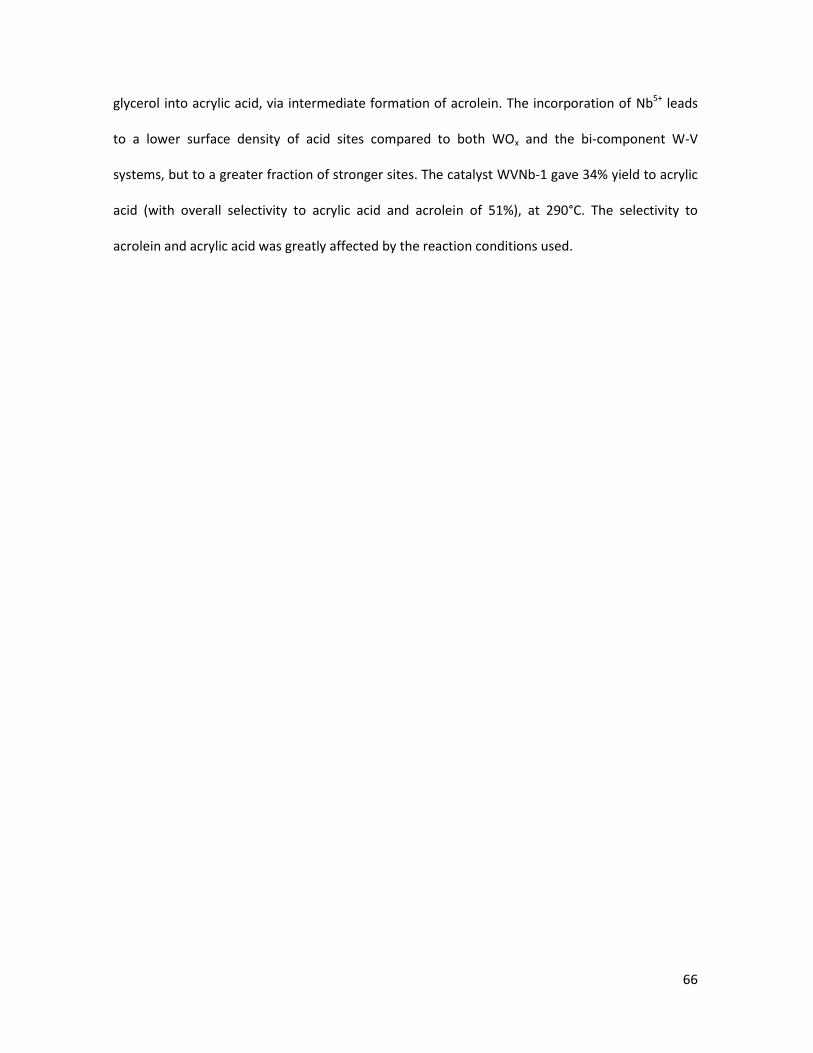
66
glycerol into acrylic acid, via intermediate formation of acrolein. The incorporation of Nb5+ leads
to a lower surface density of acid sites compared to both WOx and the bi-component W-V
systems, but to a greater fraction of stronger sites. The catalyst WVNb-1 gave 34% yield to acrylic
acid (with overall selectivity to acrylic acid and acrolein of 51%), at 290°C. The selectivity to
acrolein and acrylic acid was greatly affected by the reaction conditions used.
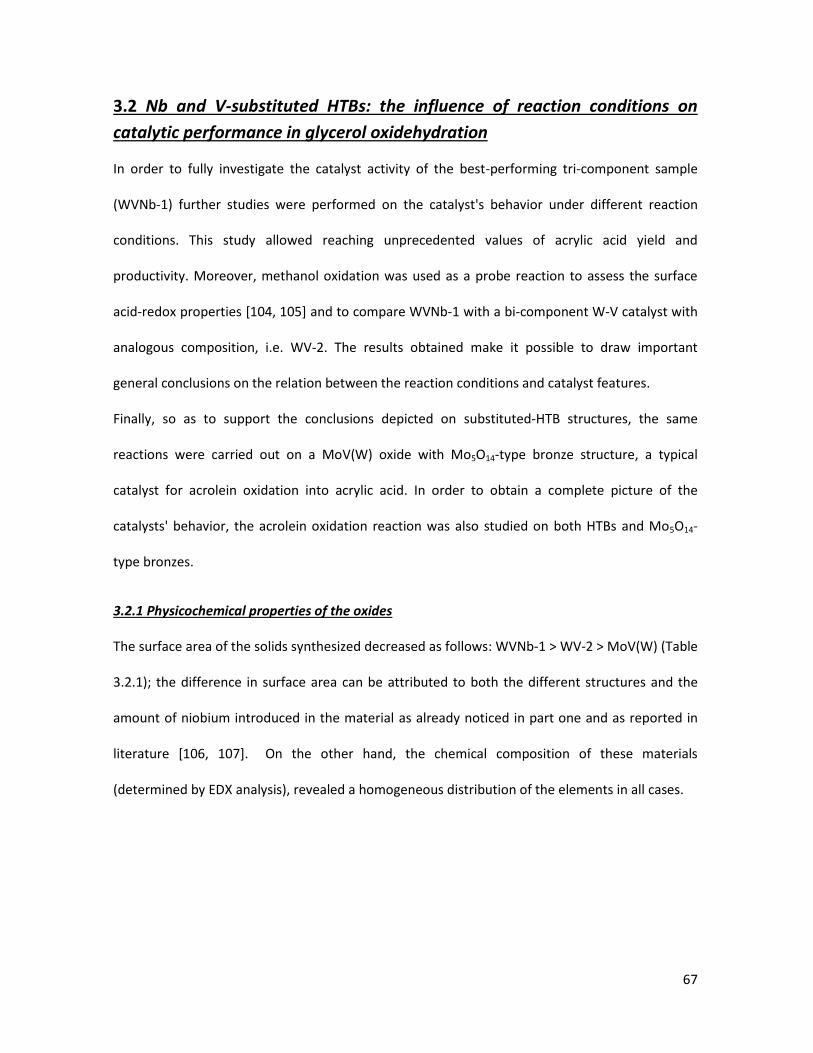
67
3.2 Nb and V-substituted HTBs: the influence of reaction conditions on
catalytic performance in glycerol oxidehydration
In order to fully investigate the catalyst activity of the best-performing tri-component sample
(WVNb-1) further studies were performed on the catalyst's behavior under different reaction
conditions. This study allowed reaching unprecedented values of acrylic acid yield and
productivity. Moreover, methanol oxidation was used as a probe reaction to assess the surface
acid-redox properties [104, 105] and to compare WVNb-1 with a bi-component W-V catalyst with
analogous composition, i.e. WV-2. The results obtained make it possible to draw important
general conclusions on the relation between the reaction conditions and catalyst features.
Finally, so as to support the conclusions depicted on substituted-HTB structures, the same
reactions were carried out on a MoV(W) oxide with Mo5O14-type bronze structure, a typical
catalyst for acrolein oxidation into acrylic acid. In order to obtain a complete picture of the
catalysts' behavior, the acrolein oxidation reaction was also studied on both HTBs and Mo5O14-
type bronzes.
3.2.1 Physicochemical properties of the oxides
The surface area of the solids synthesized decreased as follows: WVNb-1 > WV-2 > MoV(W) (Table
3.2.1); the difference in surface area can be attributed to both the different structures and the
amount of niobium introduced in the material as already noticed in part one and as reported in
literature [106, 107]. On the other hand, the chemical composition of these materials
(determined by EDX analysis), revealed a homogeneous distribution of the elements in all cases.

68
Table 3.2.1. Main physical-chemical features of the selected catalysts
Sample Surface
area (m
2g
-1)
TPD-NH3
µmolNH3g-1
µmolNH3m-2
H2-TPRa
Peak 1 Peak 2 Crystalline
phase Catalyst
compositionc
WV-2 19.0 72 3.8 0.59 2.09 HTB WV0.12
WVNb-1 57.3 192 3.4 n.c. b 3.99 HTB WV0.13Nb0.13
MoV(W) 6.3 21 3.5 0.08 2.91 Mo5O14 Mo0.68V0.23W0.09
[a] H2-TPR results: H2-uptake (in mmolH2 g-1) in the 450-550ºC (peak 1) and 550-750°C (peak 2) temperature region. [b] The H2-uptake have been not calculated since only a shoulder is observed at 590ºC for the first reduction peak. [c] Data calculated by means of SEM-EDX analysis.
Powder XRD analysis of heat-treated materials is presented in Figure 3.2.1. Diffraction maxima
match with those of a basic hexagonal tungsten bronze, HTB structure (JCPDS: 85-2460) for WV-2
and WVNb-1 catalysts, even if, for the latter catalyst, a consistent amount of amorphous phase is
present (ca. 60%, calculated by means of the Rietveld method).
MoV(W) presents diffraction maxima and intensities very similar to those oxides presenting a
Mo5O14-type structure, i.e. Mo5O14 oxide (JCPDS: 12-0517) or Nb0.09Mo0.91O2.8 (JCPDS: 27-1310),
having a tetragonal lattice cell. However, the presence of MoO3 (JCPDS: 5-508), as minority,
cannot be completely excluded.
Figure 3.2.2 (A) shows the IR spectra of catalysts. The IR spectrum of WV-2 and WVNb-1 are very
similar presenting a broad band at ca. 802 cm−1 (spectrum a) or 828 cm−1 (spectrum b),
respectively, which can be assigned to O–W–O stretching modes in tungsten oxide with HTB
crystal structure [1]. Moreover, the broad band in the 700–550 cm−1 range can be assigned to W–
O–X (X = W, V or Nb) moieties [108].
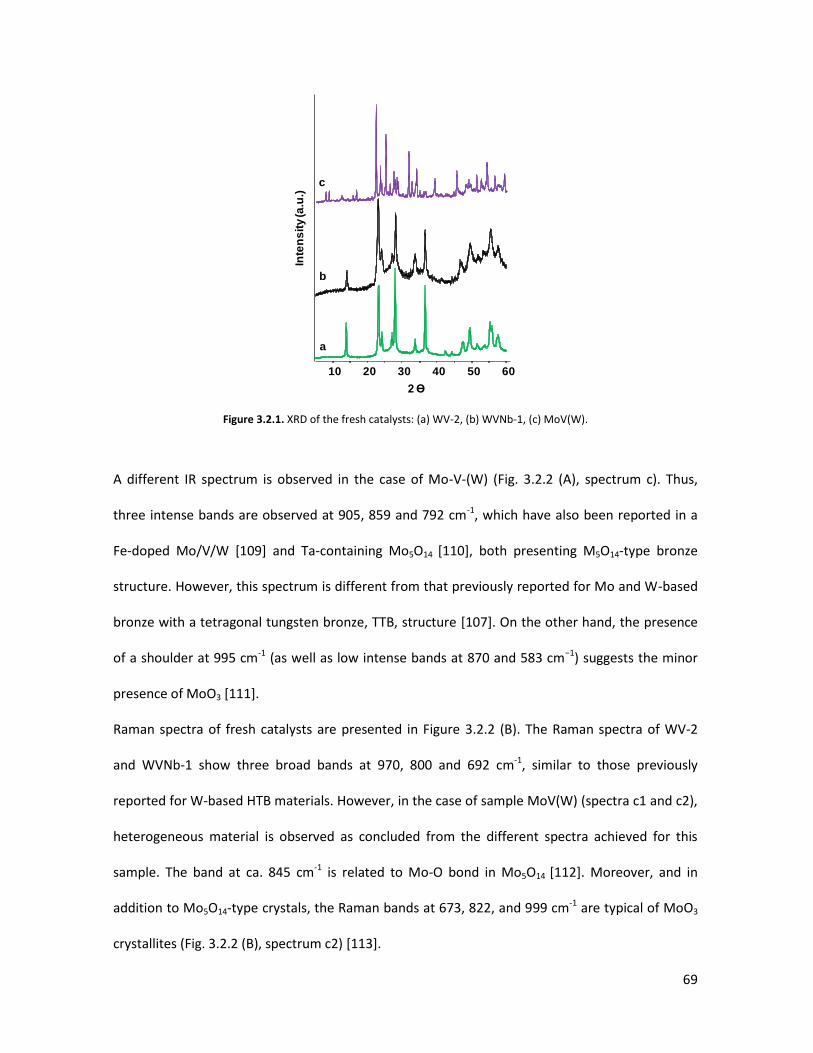
69
Figure 3.2.1. XRD of the fresh catalysts: (a) WV-2, (b) WVNb-1, (c) MoV(W).
A different IR spectrum is observed in the case of Mo-V-(W) (Fig. 3.2.2 (A), spectrum c). Thus,
three intense bands are observed at 905, 859 and 792 cm-1, which have also been reported in a
Fe-doped Mo/V/W [109] and Ta-containing Mo5O14 [110], both presenting M5O14-type bronze
structure. However, this spectrum is different from that previously reported for Mo and W-based
bronze with a tetragonal tungsten bronze, TTB, structure [107]. On the other hand, the presence
of a shoulder at 995 cm-1 (as well as low intense bands at 870 and 583 cm−1) suggests the minor
presence of MoO3 [111].
Raman spectra of fresh catalysts are presented in Figure 3.2.2 (B). The Raman spectra of WV-2
and WVNb-1 show three broad bands at 970, 800 and 692 cm-1, similar to those previously
reported for W-based HTB materials. However, in the case of sample MoV(W) (spectra c1 and c2),
heterogeneous material is observed as concluded from the different spectra achieved for this
sample. The band at ca. 845 cm-1 is related to Mo-O bond in Mo5O14 [112]. Moreover, and in
addition to Mo5O14-type crystals, the Raman bands at 673, 822, and 999 cm-1 are typical of MoO3
crystallites (Fig. 3.2.2 (B), spectrum c2) [113].
10 20 30 40 50 60
a
b
c
2 Ɵ
Inte
ns
ity
(a.u
.)
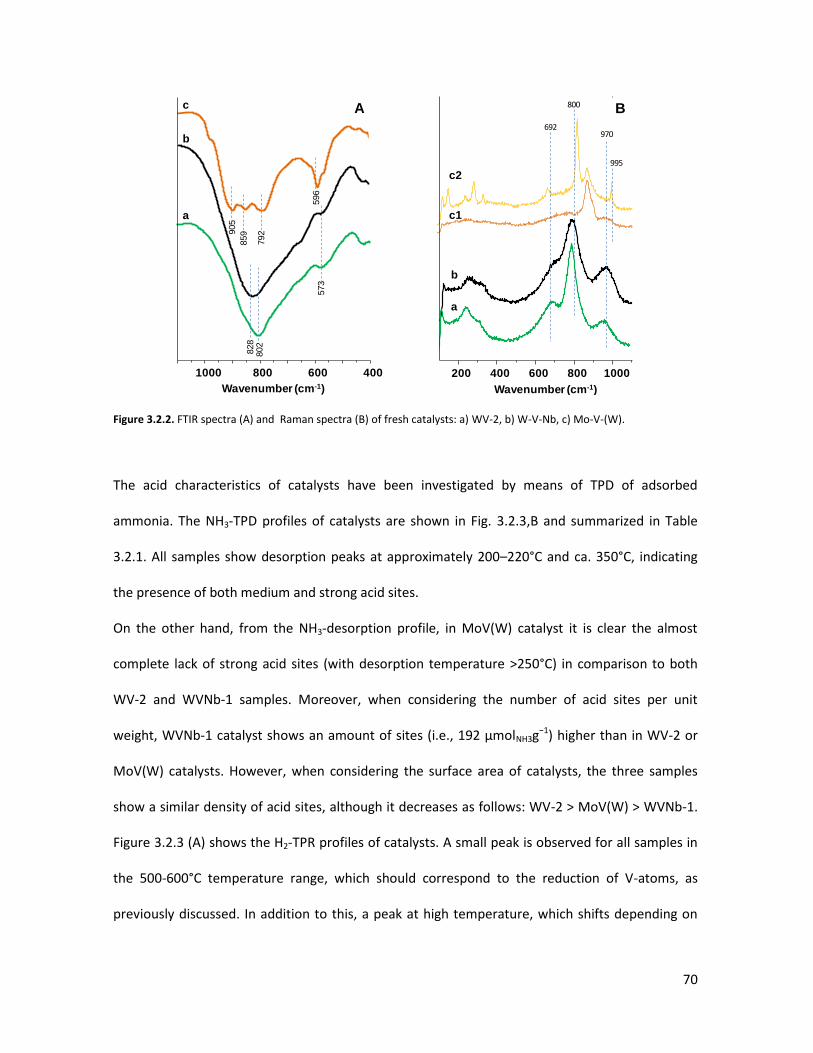
70
Figure 3.2.2. FTIR spectra (A) and Raman spectra (B) of fresh catalysts: a) WV-2, b) W-V-Nb, c) Mo-V-(W).
The acid characteristics of catalysts have been investigated by means of TPD of adsorbed
ammonia. The NH3-TPD profiles of catalysts are shown in Fig. 3.2.3,B and summarized in Table
3.2.1. All samples show desorption peaks at approximately 200–220°C and ca. 350°C, indicating
the presence of both medium and strong acid sites.
On the other hand, from the NH3-desorption profile, in MoV(W) catalyst it is clear the almost
complete lack of strong acid sites (with desorption temperature >250°C) in comparison to both
WV-2 and WVNb-1 samples. Moreover, when considering the number of acid sites per unit
weight, WVNb-1 catalyst shows an amount of sites (i.e., 192 µmolNH3g−1) higher than in WV-2 or
MoV(W) catalysts. However, when considering the surface area of catalysts, the three samples
show a similar density of acid sites, although it decreases as follows: WV-2 > MoV(W) > WVNb-1.
Figure 3.2.3 (A) shows the H2-TPR profiles of catalysts. A small peak is observed for all samples in
the 500-600°C temperature range, which should correspond to the reduction of V-atoms, as
previously discussed. In addition to this, a peak at high temperature, which shifts depending on
200 400 600 800 1000
692970
Wavenumber (cm-1)
800
a
b
c1
c2
995
B
1000 800 600 400
c
905
859
792
b
a
596
802
828
573
A
Wavenumber (cm-1)
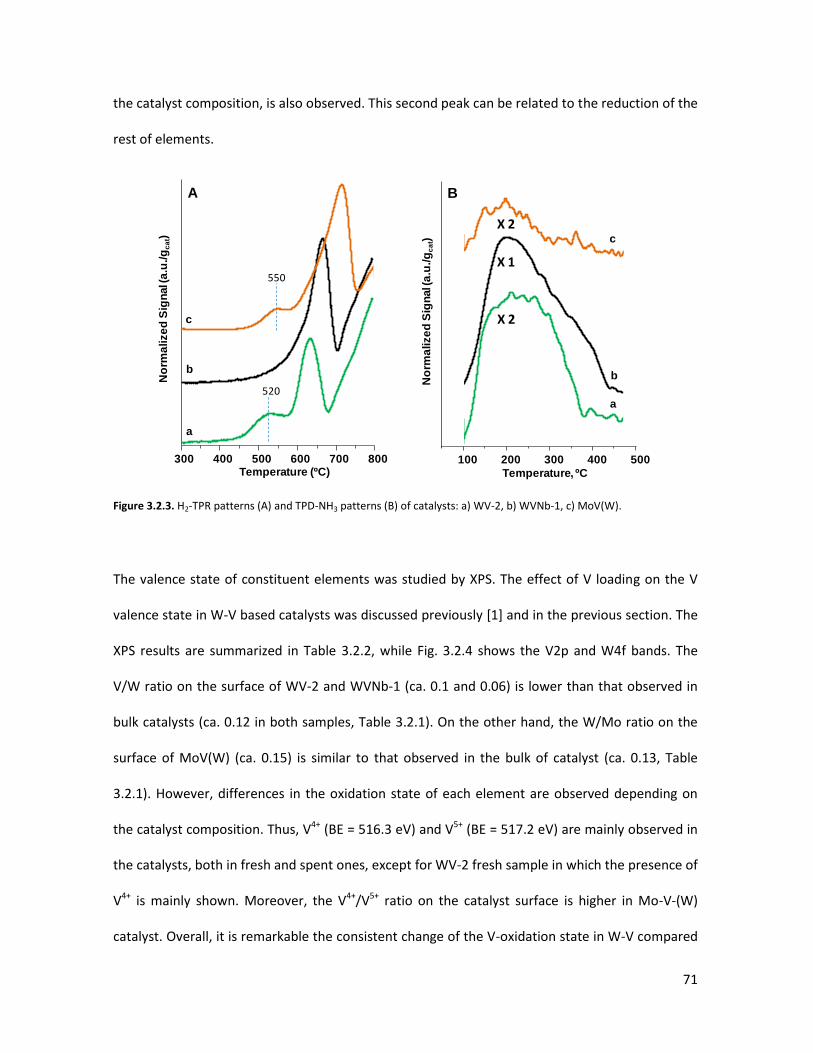
71
the catalyst composition, is also observed. This second peak can be related to the reduction of the
rest of elements.
Figure 3.2.3. H2-TPR patterns (A) and TPD-NH3 patterns (B) of catalysts: a) WV-2, b) WVNb-1, c) MoV(W).
The valence state of constituent elements was studied by XPS. The effect of V loading on the V
valence state in W-V based catalysts was discussed previously [1] and in the previous section. The
XPS results are summarized in Table 3.2.2, while Fig. 3.2.4 shows the V2p and W4f bands. The
V/W ratio on the surface of WV-2 and WVNb-1 (ca. 0.1 and 0.06) is lower than that observed in
bulk catalysts (ca. 0.12 in both samples, Table 3.2.1). On the other hand, the W/Mo ratio on the
surface of MoV(W) (ca. 0.15) is similar to that observed in the bulk of catalyst (ca. 0.13, Table
3.2.1). However, differences in the oxidation state of each element are observed depending on
the catalyst composition. Thus, V4+ (BE = 516.3 eV) and V5+ (BE = 517.2 eV) are mainly observed in
the catalysts, both in fresh and spent ones, except for WV-2 fresh sample in which the presence of
V4+ is mainly shown. Moreover, the V4+/V5+ ratio on the catalyst surface is higher in Mo-V-(W)
catalyst. Overall, it is remarkable the consistent change of the V-oxidation state in W-V compared
100 200 300 400 500
Temperature, ºC
B
X 2
X 2
X 1
a
b
c
No
rma
lize
dS
ign
al(
a.u
./g
ca
t)
300 400 500 600 700 800Temperature (ºC)
a
b
c
520
550
A
No
rma
lize
dS
ign
al(
a.u
./g
ca
t)
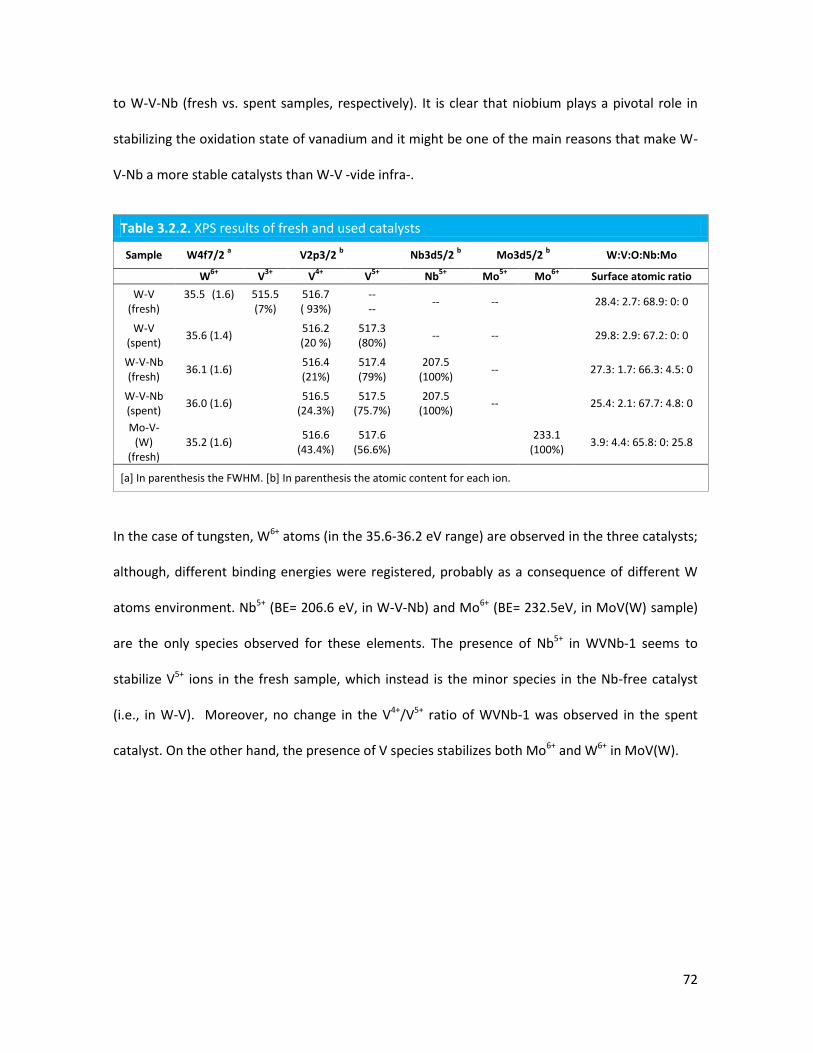
72
to W-V-Nb (fresh vs. spent samples, respectively). It is clear that niobium plays a pivotal role in
stabilizing the oxidation state of vanadium and it might be one of the main reasons that make W-
V-Nb a more stable catalysts than W-V -vide infra-.
Table 3.2.2. XPS results of fresh and used catalysts
Sample W4f7/2 a V2p3/2
b Nb3d5/2
b Mo3d5/2
b W:V:O:Nb:Mo
W6+
V3+
V4+
V5+
Nb5+
Mo5+
Mo6+
Surface atomic ratio
W-V (fresh)
35.5 (1.6)
515.5 (7%)
516.7 ( 93%)
-- --
-- -- 28.4: 2.7: 68.9: 0: 0
W-V (spent)
35.6 (1.4) 516.2 (20 %)
517.3 (80%)
-- -- 29.8: 2.9: 67.2: 0: 0
W-V-Nb (fresh)
36.1 (1.6) 516.4 (21%)
517.4 (79%)
207.5 (100%)
-- 27.3: 1.7: 66.3: 4.5: 0
W-V-Nb (spent)
36.0 (1.6) 516.5
(24.3%) 517.5
(75.7%) 207.5
(100%) -- 25.4: 2.1: 67.7: 4.8: 0
Mo-V-(W)
(fresh) 35.2 (1.6)
516.6 (43.4%)
517.6 (56.6%)
233.1 (100%)
3.9: 4.4: 65.8: 0: 25.8
[a] In parenthesis the FWHM. [b] In parenthesis the atomic content for each ion.
In the case of tungsten, W6+ atoms (in the 35.6-36.2 eV range) are observed in the three catalysts;
although, different binding energies were registered, probably as a consequence of different W
atoms environment. Nb5+ (BE= 206.6 eV, in W-V-Nb) and Mo6+ (BE= 232.5eV, in MoV(W) sample)
are the only species observed for these elements. The presence of Nb5+ in WVNb-1 seems to
stabilize V5+ ions in the fresh sample, which instead is the minor species in the Nb-free catalyst
(i.e., in W-V). Moreover, no change in the V4+/V5+ ratio of WVNb-1 was observed in the spent
catalyst. On the other hand, the presence of V species stabilizes both Mo6+ and W6+ in MoV(W).
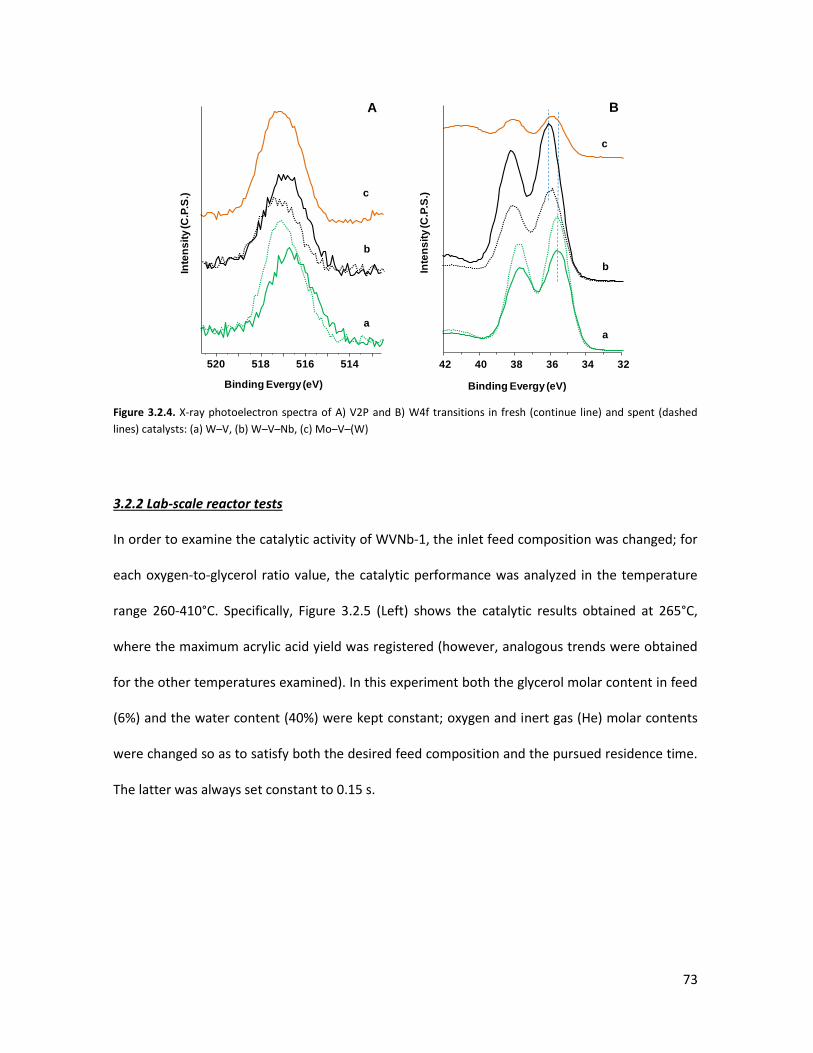
73
Figure 3.2.4. X-ray photoelectron spectra of A) V2P and B) W4f transitions in fresh (continue line) and spent (dashed
lines) catalysts: (a) W–V, (b) W–V–Nb, (c) Mo–V–(W)
3.2.2 Lab-scale reactor tests
In order to examine the catalytic activity of WVNb-1, the inlet feed composition was changed; for
each oxygen-to-glycerol ratio value, the catalytic performance was analyzed in the temperature
range 260-410°C. Specifically, Figure 3.2.5 (Left) shows the catalytic results obtained at 265°C,
where the maximum acrylic acid yield was registered (however, analogous trends were obtained
for the other temperatures examined). In this experiment both the glycerol molar content in feed
(6%) and the water content (40%) were kept constant; oxygen and inert gas (He) molar contents
were changed so as to satisfy both the desired feed composition and the pursued residence time.
The latter was always set constant to 0.15 s.
520 518 516 514
Binding Evergy(eV)
Inte
ns
ity
(C.P
.S.)
A
a
b
c
42 40 38 36 34 32
B
a
b
c
Binding Evergy (eV)
Inte
ns
ity
(C.P
.S.)
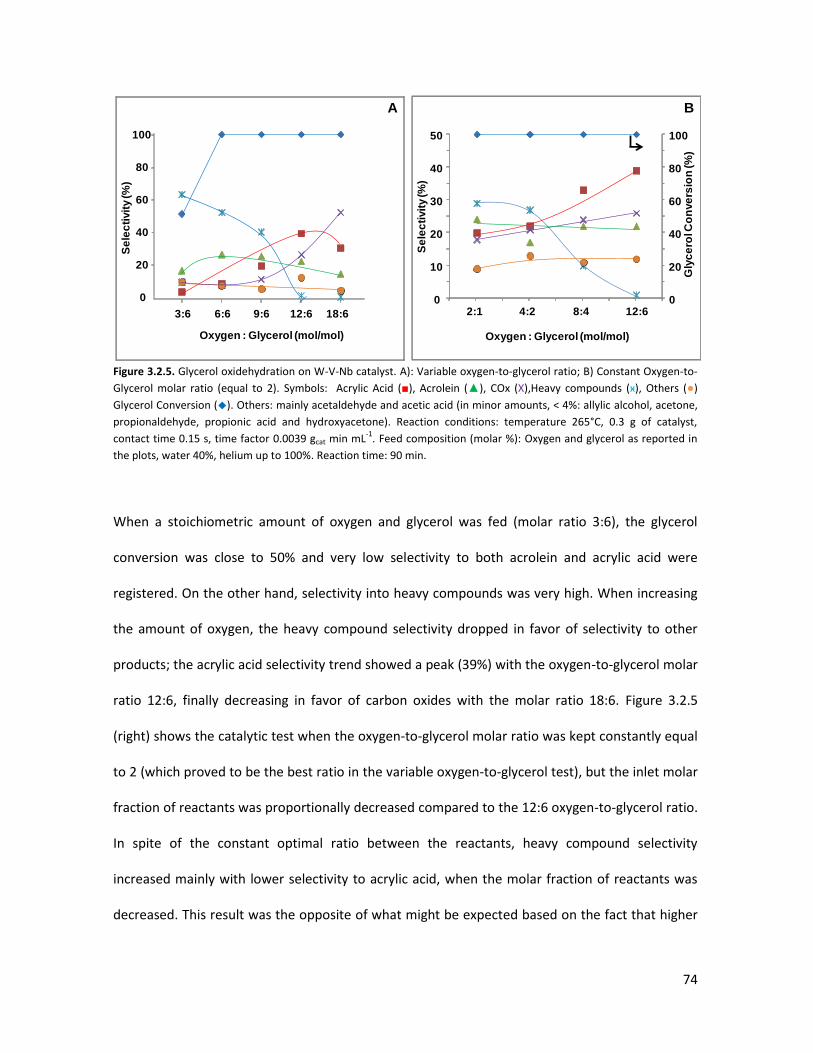
74
Figure 3.2.5. Glycerol oxidehydration on W-V-Nb catalyst. A): Variable oxygen-to-glycerol ratio; B) Constant Oxygen-to-
Glycerol molar ratio (equal to 2). Symbols: Acrylic Acid (■), Acrolein (▲), COx (X),Heavy compounds (ӿ), Others (●)
Glycerol Conversion (◆). Others: mainly acetaldehyde and acetic acid (in minor amounts, < 4%: allylic alcohol, acetone,
propionaldehyde, propionic acid and hydroxyacetone). Reaction conditions: temperature 265°C, 0.3 g of catalyst,
contact time 0.15 s, time factor 0.0039 gcat min mL-1
. Feed composition (molar %): Oxygen and glycerol as reported in
the plots, water 40%, helium up to 100%. Reaction time: 90 min.
When a stoichiometric amount of oxygen and glycerol was fed (molar ratio 3:6), the glycerol
conversion was close to 50% and very low selectivity to both acrolein and acrylic acid were
registered. On the other hand, selectivity into heavy compounds was very high. When increasing
the amount of oxygen, the heavy compound selectivity dropped in favor of selectivity to other
products; the acrylic acid selectivity trend showed a peak (39%) with the oxygen-to-glycerol molar
ratio 12:6, finally decreasing in favor of carbon oxides with the molar ratio 18:6. Figure 3.2.5
(right) shows the catalytic test when the oxygen-to-glycerol molar ratio was kept constantly equal
to 2 (which proved to be the best ratio in the variable oxygen-to-glycerol test), but the inlet molar
fraction of reactants was proportionally decreased compared to the 12:6 oxygen-to-glycerol ratio.
In spite of the constant optimal ratio between the reactants, heavy compound selectivity
increased mainly with lower selectivity to acrylic acid, when the molar fraction of reactants was
decreased. This result was the opposite of what might be expected based on the fact that higher
20
40
60
80
100
3:6 6:6 9:6 12:6 18:6
Se
lec
tivit
y (%
)
Oxygen : Glycerol (mol/mol)
0 0
20
40
60
80
100
0
10
20
30
40
50
2:1 4:2 8:4 12:6
Gly
ce
rol C
on
ve
rsio
n (%
)
Se
lec
tivit
y (%
)
Oxygen : Glycerol (mol/mol)
A B
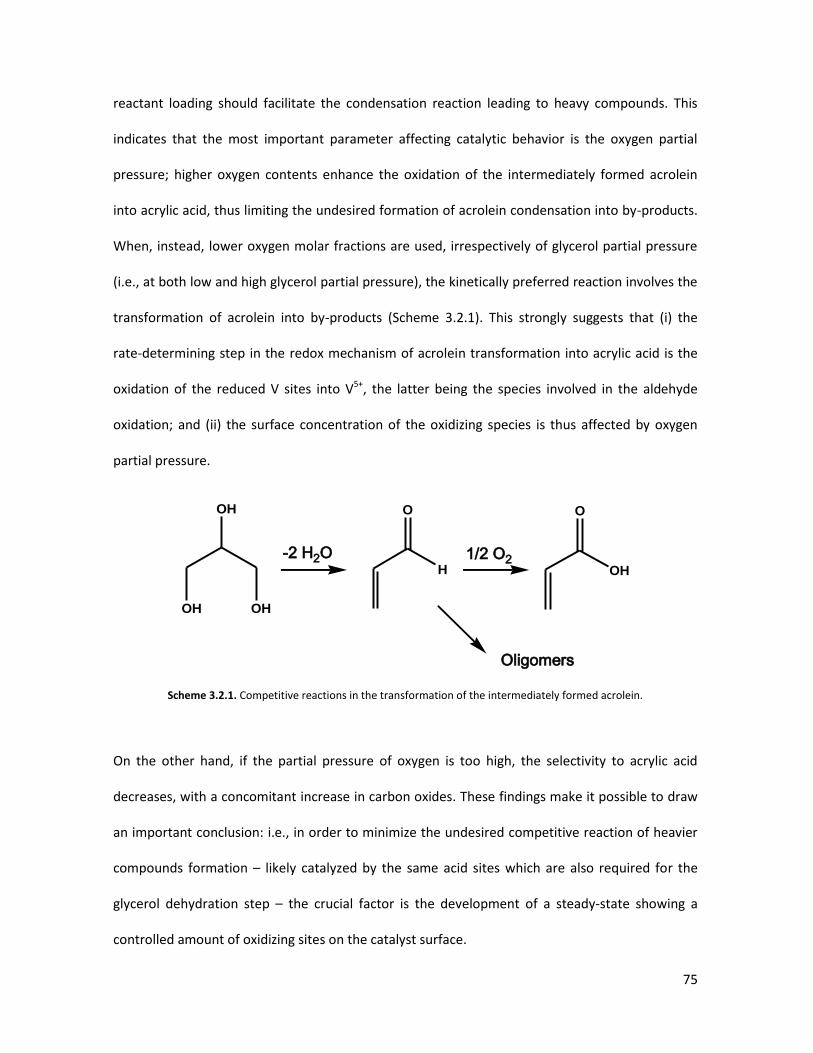
75
reactant loading should facilitate the condensation reaction leading to heavy compounds. This
indicates that the most important parameter affecting catalytic behavior is the oxygen partial
pressure; higher oxygen contents enhance the oxidation of the intermediately formed acrolein
into acrylic acid, thus limiting the undesired formation of acrolein condensation into by-products.
When, instead, lower oxygen molar fractions are used, irrespectively of glycerol partial pressure
(i.e., at both low and high glycerol partial pressure), the kinetically preferred reaction involves the
transformation of acrolein into by-products (Scheme 3.2.1). This strongly suggests that (i) the
rate-determining step in the redox mechanism of acrolein transformation into acrylic acid is the
oxidation of the reduced V sites into V5+, the latter being the species involved in the aldehyde
oxidation; and (ii) the surface concentration of the oxidizing species is thus affected by oxygen
partial pressure.
OH
OH
OH
O
H
O
OH
-2 H2O 1/2 O2
Oligomers
Scheme 3.2.1. Competitive reactions in the transformation of the intermediately formed acrolein.
On the other hand, if the partial pressure of oxygen is too high, the selectivity to acrylic acid
decreases, with a concomitant increase in carbon oxides. These findings make it possible to draw
an important conclusion: i.e., in order to minimize the undesired competitive reaction of heavier
compounds formation – likely catalyzed by the same acid sites which are also required for the
glycerol dehydration step – the crucial factor is the development of a steady-state showing a
controlled amount of oxidizing sites on the catalyst surface.
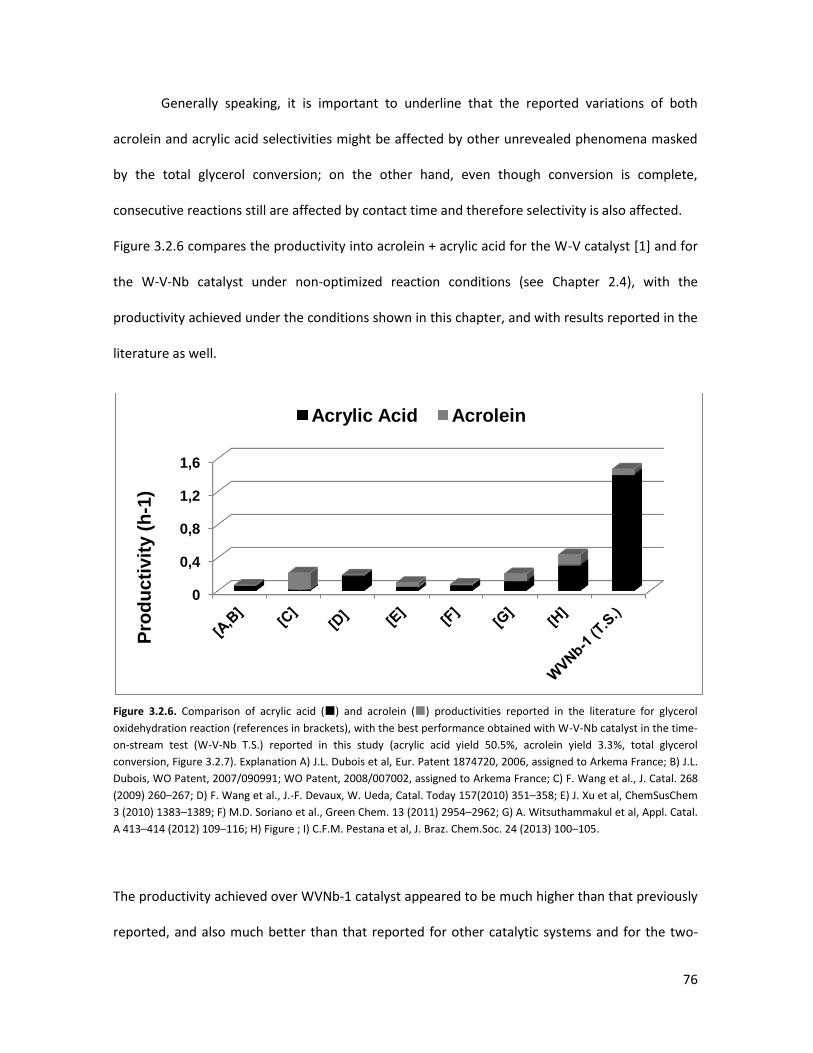
76
Generally speaking, it is important to underline that the reported variations of both
acrolein and acrylic acid selectivities might be affected by other unrevealed phenomena masked
by the total glycerol conversion; on the other hand, even though conversion is complete,
consecutive reactions still are affected by contact time and therefore selectivity is also affected.
Figure 3.2.6 compares the productivity into acrolein + acrylic acid for the W-V catalyst [1] and for
the W-V-Nb catalyst under non-optimized reaction conditions (see Chapter 2.4), with the
productivity achieved under the conditions shown in this chapter, and with results reported in the
literature as well.
Figure 3.2.6. Comparison of acrylic acid () and acrolein () productivities reported in the literature for glycerol
oxidehydration reaction (references in brackets), with the best performance obtained with W-V-Nb catalyst in the time-
on-stream test (W-V-Nb T.S.) reported in this study (acrylic acid yield 50.5%, acrolein yield 3.3%, total glycerol
conversion, Figure 3.2.7). Explanation A) J.L. Dubois et al, Eur. Patent 1874720, 2006, assigned to Arkema France; B) J.L.
Dubois, WO Patent, 2007/090991; WO Patent, 2008/007002, assigned to Arkema France; C) F. Wang et al., J. Catal. 268
(2009) 260–267; D) F. Wang et al., J.-F. Devaux, W. Ueda, Catal. Today 157(2010) 351–358; E) J. Xu et al, ChemSusChem
3 (2010) 1383–1389; F) M.D. Soriano et al., Green Chem. 13 (2011) 2954–2962; G) A. Witsuthammakul et al, Appl. Catal.
A 413–414 (2012) 109–116; H) Figure ; I) C.F.M. Pestana et al, J. Braz. Chem.Soc. 24 (2013) 100–105.
The productivity achieved over WVNb-1 catalyst appeared to be much higher than that previously
reported, and also much better than that reported for other catalytic systems and for the two-
0
0,4
0,8
1,2
1,6
Pro
du
cti
vit
y (
h-1
)
Acrylic Acid Acrolein
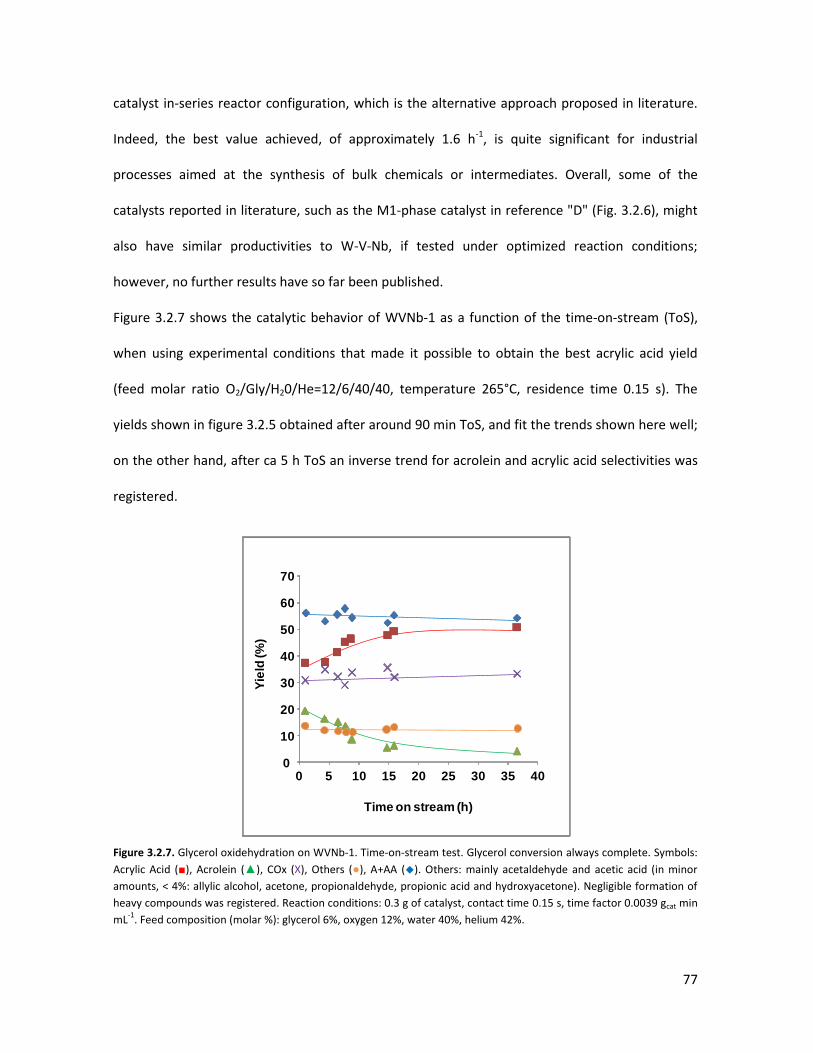
77
catalyst in-series reactor configuration, which is the alternative approach proposed in literature.
Indeed, the best value achieved, of approximately 1.6 h-1, is quite significant for industrial
processes aimed at the synthesis of bulk chemicals or intermediates. Overall, some of the
catalysts reported in literature, such as the M1-phase catalyst in reference "D" (Fig. 3.2.6), might
also have similar productivities to W-V-Nb, if tested under optimized reaction conditions;
however, no further results have so far been published.
Figure 3.2.7 shows the catalytic behavior of WVNb-1 as a function of the time-on-stream (ToS),
when using experimental conditions that made it possible to obtain the best acrylic acid yield
(feed molar ratio O2/Gly/H20/He=12/6/40/40, temperature 265°C, residence time 0.15 s). The
yields shown in figure 3.2.5 obtained after around 90 min ToS, and fit the trends shown here well;
on the other hand, after ca 5 h ToS an inverse trend for acrolein and acrylic acid selectivities was
registered.
Figure 3.2.7. Glycerol oxidehydration on WVNb-1. Time-on-stream test. Glycerol conversion always complete. Symbols:
Acrylic Acid (■), Acrolein (▲), COx (X), Others (●), A+AA (◆). Others: mainly acetaldehyde and acetic acid (in minor
amounts, < 4%: allylic alcohol, acetone, propionaldehyde, propionic acid and hydroxyacetone). Negligible formation of
heavy compounds was registered. Reaction conditions: 0.3 g of catalyst, contact time 0.15 s, time factor 0.0039 gcat min
mL-1
. Feed composition (molar %): glycerol 6%, oxygen 12%, water 40%, helium 42%.
0
10
20
30
40
50
60
70
0 5 10 15 20 25 30 35 40
Yie
ld (%
)
Time on stream (h)
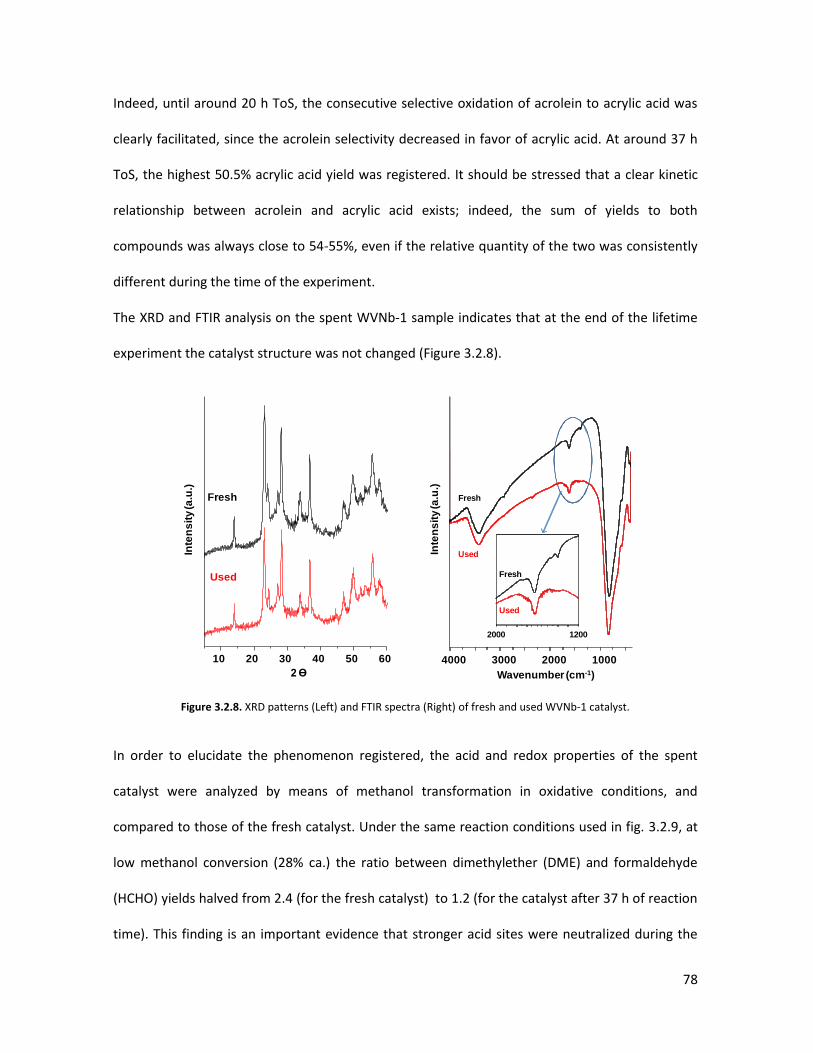
78
Indeed, until around 20 h ToS, the consecutive selective oxidation of acrolein to acrylic acid was
clearly facilitated, since the acrolein selectivity decreased in favor of acrylic acid. At around 37 h
ToS, the highest 50.5% acrylic acid yield was registered. It should be stressed that a clear kinetic
relationship between acrolein and acrylic acid exists; indeed, the sum of yields to both
compounds was always close to 54-55%, even if the relative quantity of the two was consistently
different during the time of the experiment.
The XRD and FTIR analysis on the spent WVNb-1 sample indicates that at the end of the lifetime
experiment the catalyst structure was not changed (Figure 3.2.8).
Figure 3.2.8. XRD patterns (Left) and FTIR spectra (Right) of fresh and used WVNb-1 catalyst.
In order to elucidate the phenomenon registered, the acid and redox properties of the spent
catalyst were analyzed by means of methanol transformation in oxidative conditions, and
compared to those of the fresh catalyst. Under the same reaction conditions used in fig. 3.2.9, at
low methanol conversion (28% ca.) the ratio between dimethylether (DME) and formaldehyde
(HCHO) yields halved from 2.4 (for the fresh catalyst) to 1.2 (for the catalyst after 37 h of reaction
time). This finding is an important evidence that stronger acid sites were neutralized during the
10 20 30 40 50 60
Fresh
Used
2 Ɵ
Inte
ns
ity
(a.u
.)
2000 1200
Fresh
Used
4000 3000 2000 1000
Wavenumber (cm-1)
Fresh
UsedInte
ns
ity
(a.u
.)
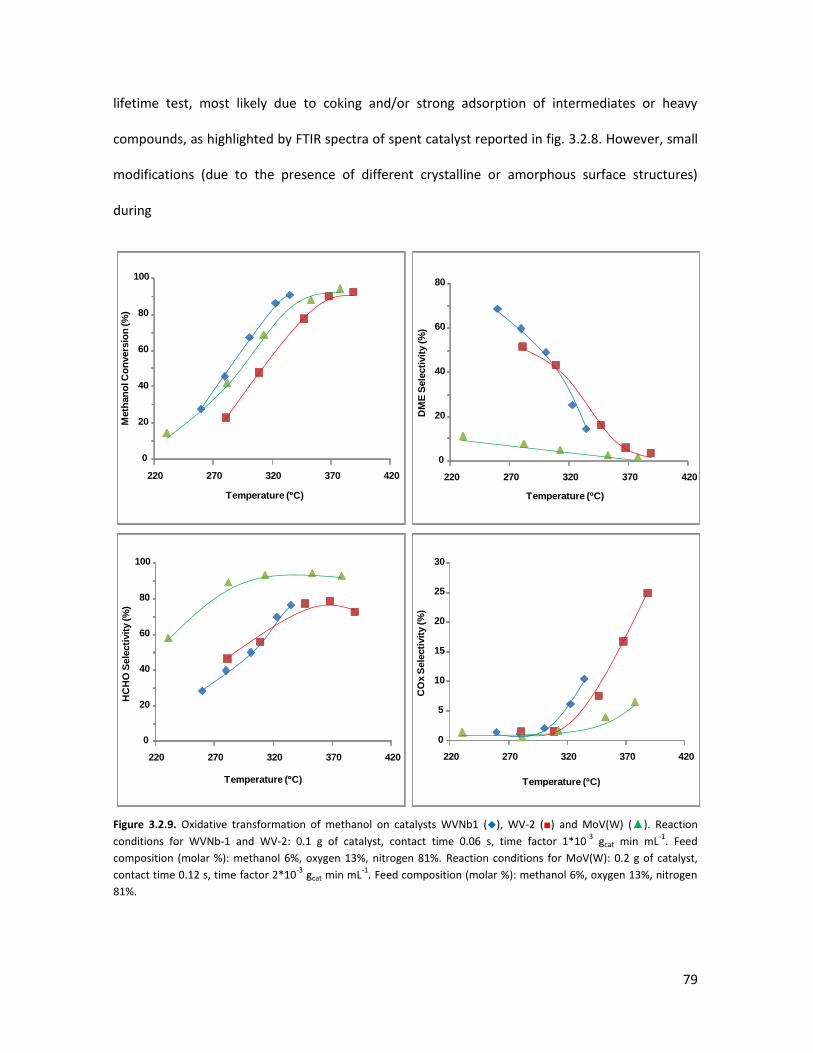
79
lifetime test, most likely due to coking and/or strong adsorption of intermediates or heavy
compounds, as highlighted by FTIR spectra of spent catalyst reported in fig. 3.2.8. However, small
modifications (due to the presence of different crystalline or amorphous surface structures)
during
Figure 3.2.9. Oxidative transformation of methanol on catalysts WVNb1 (◆), WV-2 (■) and MoV(W) (▲). Reaction
conditions for WVNb-1 and WV-2: 0.1 g of catalyst, contact time 0.06 s, time factor 1*10-3
gcat min mL-1
. Feed
composition (molar %): methanol 6%, oxygen 13%, nitrogen 81%. Reaction conditions for MoV(W): 0.2 g of catalyst,
contact time 0.12 s, time factor 2*10-3
gcat min mL-1
. Feed composition (molar %): methanol 6%, oxygen 13%, nitrogen
81%.
0
20
40
60
80
100
220 270 320 370 420
Meth
an
ol C
on
vers
ion
(%
)
Temperature (ºC)
0
20
40
60
80
220 270 320 370 420
DM
E S
ele
cti
vit
y (%
)
Temperature (ºC)
0
20
40
60
80
100
220 270 320 370 420
HC
HO
Sele
cti
vit
y (%
)
Temperature (ºC)
0
5
10
15
20
25
30
220 270 320 370 420
CO
x S
ele
cti
vit
y (%
)
Temperature (ºC)
80
the 5-to-20 h tos cannot be completely ruled out. The formation of more active amorphous
structures is well known to occur on our Mo-V-(W) catalysts – which are similar to those typically
used to selectively oxidize acrolein into acrylic acid [114-116] – and it is not possible to rule out
the possibility that a similar phenomenon may occur on WVNb-1. Figure 3.2.9 show the results
obtained when methanol was made to react in the presence of oxygen on W-V-Nb and W-V
catalysts. As a general trend, at low temperatures the formation of DME was faster than its
oxidation into HCHO (higher DME/HCHO ratio); when the temperature was increased, the
DME/HCHO ratio decreased.
High temperatures led to both decomposition and total oxidation, thus increasing the overall
carbon oxide selectivity, mainly carbon monoxide, through HCHO decomposition. Minor amounts
of dimethoxymethane and methylformiate also formed.
When comparing the catalytic behavior of WV-2 and WVNb-1, it is possible to see that with the
latter sample there was a much higher selectivity to DME, in accordance with its higher acid
strength. With the increase in temperature, the reaction of methanol oxidehydrogenation to
HCHO kinetically prevailed over the etherification reaction; lastly, at high methanol conversion
(90%), HCHO selectivity was almost identical for the two catalysts. Moreover, it is interesting to
note that different temperatures were needed to achieve similar conversions: for the WVNb-1
catalyst, 90% methanol conversion appeared at 330-335°C, whereas for the WV-2 catalyst the
same conversion was achieved at 380°C. This difference is attributable to a higher specific surface
area of the Nb-containing sample, which is one of the main features of this catalyst compared to
the WV-2; moreover, the faster reaction of methanol etherification may also contribute to the
higher activity registered. CO selectivity also was slightly different for the two catalysts,
respectively 10% for WVNb-1 and 16% for WV-2 (at the same methanol conversion of 90%).
Whereas, the lack of strong acid sites in Mo5O14-type bronze, MoV(W), is also evident from the
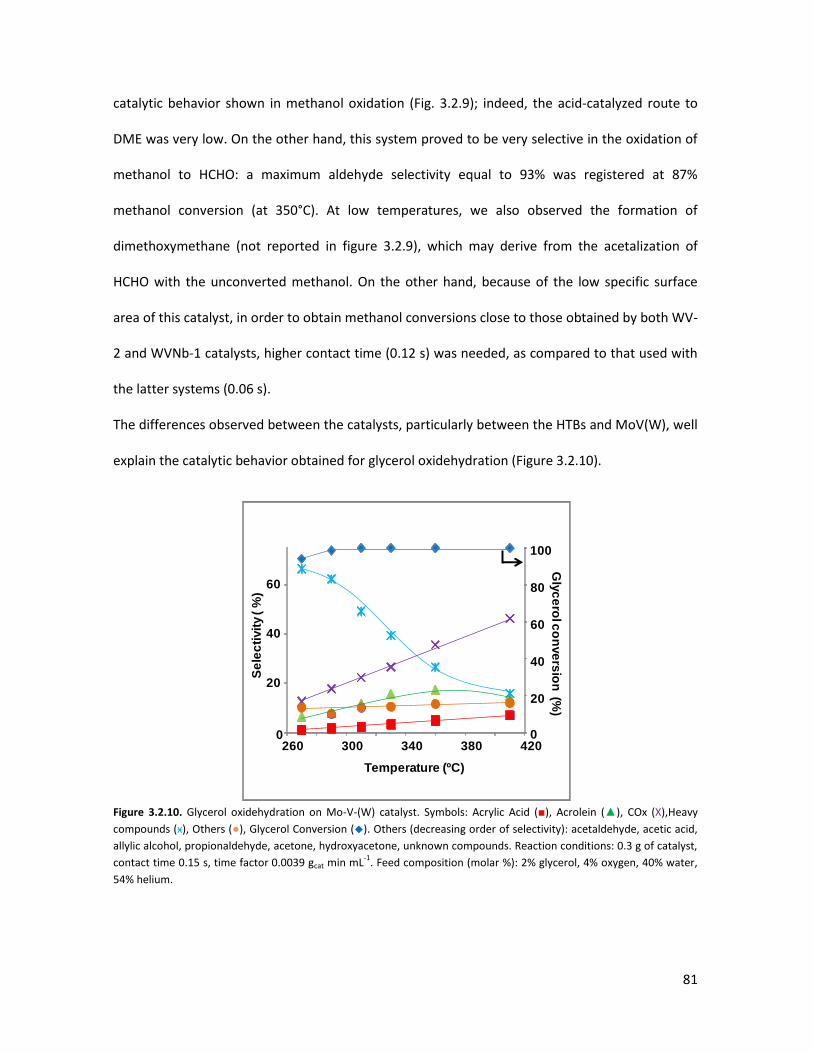
81
catalytic behavior shown in methanol oxidation (Fig. 3.2.9); indeed, the acid-catalyzed route to
DME was very low. On the other hand, this system proved to be very selective in the oxidation of
methanol to HCHO: a maximum aldehyde selectivity equal to 93% was registered at 87%
methanol conversion (at 350°C). At low temperatures, we also observed the formation of
dimethoxymethane (not reported in figure 3.2.9), which may derive from the acetalization of
HCHO with the unconverted methanol. On the other hand, because of the low specific surface
area of this catalyst, in order to obtain methanol conversions close to those obtained by both WV-
2 and WVNb-1 catalysts, higher contact time (0.12 s) was needed, as compared to that used with
the latter systems (0.06 s).
The differences observed between the catalysts, particularly between the HTBs and MoV(W), well
explain the catalytic behavior obtained for glycerol oxidehydration (Figure 3.2.10).
Figure 3.2.10. Glycerol oxidehydration on Mo-V-(W) catalyst. Symbols: Acrylic Acid (■), Acrolein (▲), COx (X),Heavy
compounds (ӿ), Others (●), Glycerol Conversion (◆). Others (decreasing order of selectivity): acetaldehyde, acetic acid,
allylic alcohol, propionaldehyde, acetone, hydroxyacetone, unknown compounds. Reaction conditions: 0.3 g of catalyst,
contact time 0.15 s, time factor 0.0039 gcat min mL-1
. Feed composition (molar %): 2% glycerol, 4% oxygen, 40% water,
54% helium.
0
20
40
60
80
100
0
20
40
60
260 300 340 380 420
Se
lec
tivit
y ( %
)
Temperature (ºC)
Gly
ce
rolc
on
ve
rsio
n(%
)
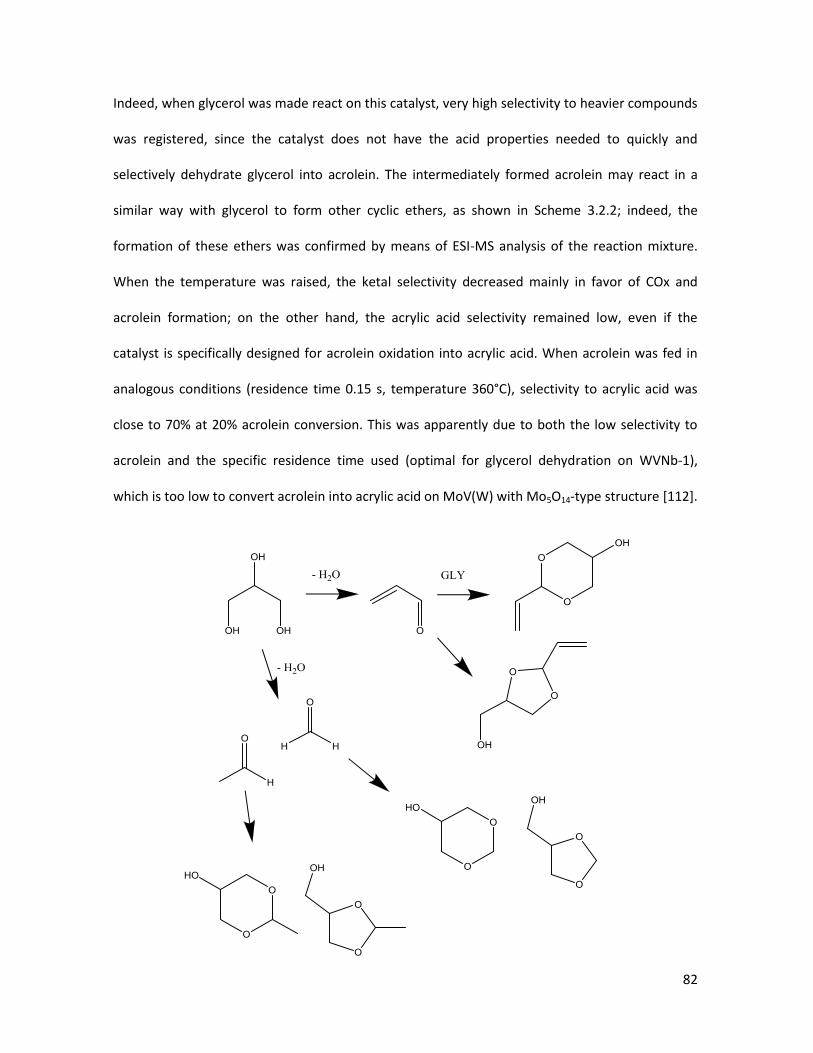
82
Indeed, when glycerol was made react on this catalyst, very high selectivity to heavier compounds
was registered, since the catalyst does not have the acid properties needed to quickly and
selectively dehydrate glycerol into acrolein. The intermediately formed acrolein may react in a
similar way with glycerol to form other cyclic ethers, as shown in Scheme 3.2.2; indeed, the
formation of these ethers was confirmed by means of ESI-MS analysis of the reaction mixture.
When the temperature was raised, the ketal selectivity decreased mainly in favor of COx and
acrolein formation; on the other hand, the acrylic acid selectivity remained low, even if the
catalyst is specifically designed for acrolein oxidation into acrylic acid. When acrolein was fed in
analogous conditions (residence time 0.15 s, temperature 360°C), selectivity to acrylic acid was
close to 70% at 20% acrolein conversion. This was apparently due to both the low selectivity to
acrolein and the specific residence time used (optimal for glycerol dehydration on WVNb-1),
which is too low to convert acrolein into acrylic acid on MoV(W) with Mo5O14-type structure [112].
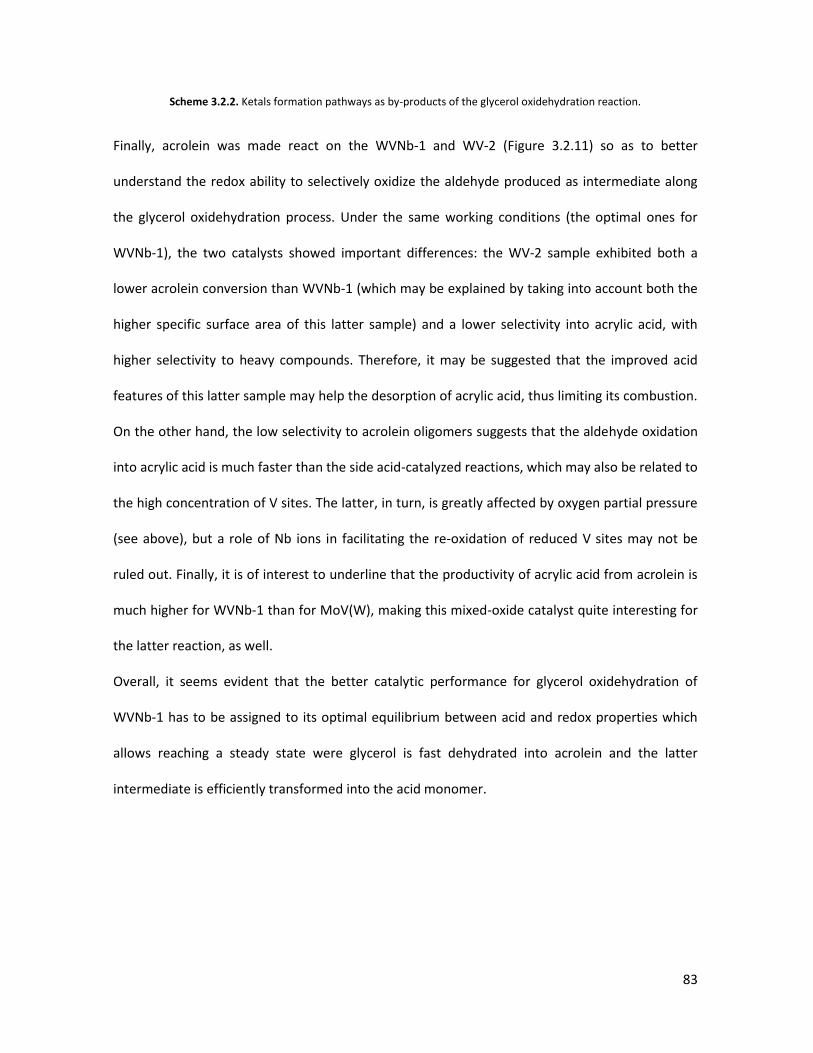
83
Scheme 3.2.2. Ketals formation pathways as by-products of the glycerol oxidehydration reaction.
Finally, acrolein was made react on the WVNb-1 and WV-2 (Figure 3.2.11) so as to better
understand the redox ability to selectively oxidize the aldehyde produced as intermediate along
the glycerol oxidehydration process. Under the same working conditions (the optimal ones for
WVNb-1), the two catalysts showed important differences: the WV-2 sample exhibited both a
lower acrolein conversion than WVNb-1 (which may be explained by taking into account both the
higher specific surface area of this latter sample) and a lower selectivity into acrylic acid, with
higher selectivity to heavy compounds. Therefore, it may be suggested that the improved acid
features of this latter sample may help the desorption of acrylic acid, thus limiting its combustion.
On the other hand, the low selectivity to acrolein oligomers suggests that the aldehyde oxidation
into acrylic acid is much faster than the side acid-catalyzed reactions, which may also be related to
the high concentration of V sites. The latter, in turn, is greatly affected by oxygen partial pressure
(see above), but a role of Nb ions in facilitating the re-oxidation of reduced V sites may not be
ruled out. Finally, it is of interest to underline that the productivity of acrylic acid from acrolein is
much higher for WVNb-1 than for MoV(W), making this mixed-oxide catalyst quite interesting for
the latter reaction, as well.
Overall, it seems evident that the better catalytic performance for glycerol oxidehydration of
WVNb-1 has to be assigned to its optimal equilibrium between acid and redox properties which
allows reaching a steady state were glycerol is fast dehydrated into acrolein and the latter
intermediate is efficiently transformed into the acid monomer.
84
Figure 3.2.11. Acrolein conversion and selectivity to products on W-V-Nb () and W-V () catalysts. Reaction
conditions: 0.3 g of catalyst, contact time 0.15 s, time factor 0.0039 gcat min mL-1
. Feed composition (molar %): 2%
acrolein, 4% oxygen, 40% water, 54% helium.
3.2.3 Conclusions
The studies carried out on both HTBs and Mo5O14-type oxides allow drawing important
conclusions on the relation between reaction conditions and catalyst features needed by
multifunctional oxides for one-pot oxidehydration starting from glycerol. The consecutive
oxidation step must be fast, compared to the dehydration step, in order to avoid the formation of
heavy compounds generated by both ketal formation and oligomerization reactions that take
place from the intermediately formed unsaturated aldehyde. For this reason, the latter being
achieved by using oxygen partial pressures well above that needed for the stoichiometric
oxidehydration of glycerol into acrylic acid, strongly oxidizing conditions are necessary with the
best-performing WVNb-1 catalyst. The latter is characterized by high surface area and high
concentration of stronger acid sites, properties which on the one hand are important for an
efficient dehydration of glycerol into acrolein, but on the other hand might lead to the formation
of undesired by-products. Under selected reaction conditions, an outstanding productivity to
acrolein + acrylic acid close to 1.6 h-1 with a yield to acrylic acid as high as 50.5% were achieved.
0
20
40
60
80
100
Se
lec
tivit
y (
%)
WVNb-1 WV-2
85
3.2.4 Notes on reaction conditions and process safety
Before concluding this chapter, a final note must be added about the reaction conditions used to
reach the improved catalytic performance of the HTBs, that is high partial pressure of oxygen.
Generally speaking, in oxidation processes particular attention has to be paid to the flammability
of the gas mixtures present all along the process, i.e. not only in the reactor but also up-stream
and down-stream. So as to avoid explosions, oxidants (e.g. oxygen, chlorine etc.) and combustive
agents (e.g. organic compounds, ammonia etc.) in the gas phase must be present in relative molar
ratios that guarantee their non-flammability. In order to avoid this problem, it is mandatory to
work outside the explosion limits. The latter vary according to the nature of the chemical species
involved as well as the presence of diluting inert gases (e.g. nitrogen, water etc.). A very
important safety parameter is the Minimum Oxygen Concentration (MOC) since it represents the
limiting concentration of oxygen below which combustion is not possible, independently of the
concentration of fuel [117]. Although, because of the limited availability of data concerning the
specific gaseous mixture of interest, it is good practice to consider the MOC close to 7-8%; indeed,
with few exceptions -e.g. acetylene, which MOC is 6.2%- a great number of organic compounds
have a MOC varying between 10% (e.g. ethylene) and 12% (e.g. propylene). For instance,
ethanol's MOC is 10.5% and the one of gasoline ca. 11% [118].
In the experiments for glycerol oxydehydration reported above and in the following chapters, the
best catalytic performance was actually registered for oxygen-to-glycerol molar ratio 12:6.
Therefore, it might be that under such reaction conditions, the gaseous mixture fed to the reactor
is within the explosion limits or very close to it. So as to avoid safety problems, the lab-scale plant
was designed to limit as much as possible the presence of gaseous stream potentially flammable.
Particularly, glycerol was mixed with oxygen only in close proximity of the catalytic bed, ca. 1 cm
above it: this allows a good mixing of reagents but it limits the risk of potentially explosive
86
gaseous mixtures to a very restricted area of the reactor. Indeed, after the catalytic bed, taking
into consideration an oxygen conversion between 50% and 90% (i.e. typical values obtained in the
catalytic tests performed) the oxygen concentration is well above the MOC, guaranteeing the
process safety. Another precaution is the usage of a glass reactor, which greatly limits the possible
formation of sparks that might act as ignition sources (glycerol flash point 193°C, autoignition
temperature 400°C). Moreover, in case of explosion, the fast increment of the gas' volume -finally
translated into a sudden increment of pressure- would be limited by over pressure valves present
in the lab-scale plant and connected to a vent. Finally, in case of failure of these safety systems,
the small amount of organic fed (between 1 and 2 ml/h of glycerol solution with composition
varying between 20 and 40 wt%) intrinsically guarantees the lab safety.
Nevertheless, more complicated would be the scale-up of these reaction conditions at an
industrial scale. First of all, a complete study on flammability ranges specific for the gaseous
mixtures fed and potentially formed all along the plant should be carried out. In case that the
gaseous mixtures didn't respect the flammability limits, it would be important to study alternative
reaction conditions, maybe close to the optimum but not within the flammability ranges. In case
the catalytic performance varied significantly under "safe working conditions" and if required by
an economic study, some industrial technologies allow to work within the explosion limits. For
instance, with fluidized bed reactor it is possible to work in the latter conditions although keeping
the process safety [117]. Indeed, the solid particles of the catalyst interrupt the propagation of
radical species in the gas phase which would lead to explosions.
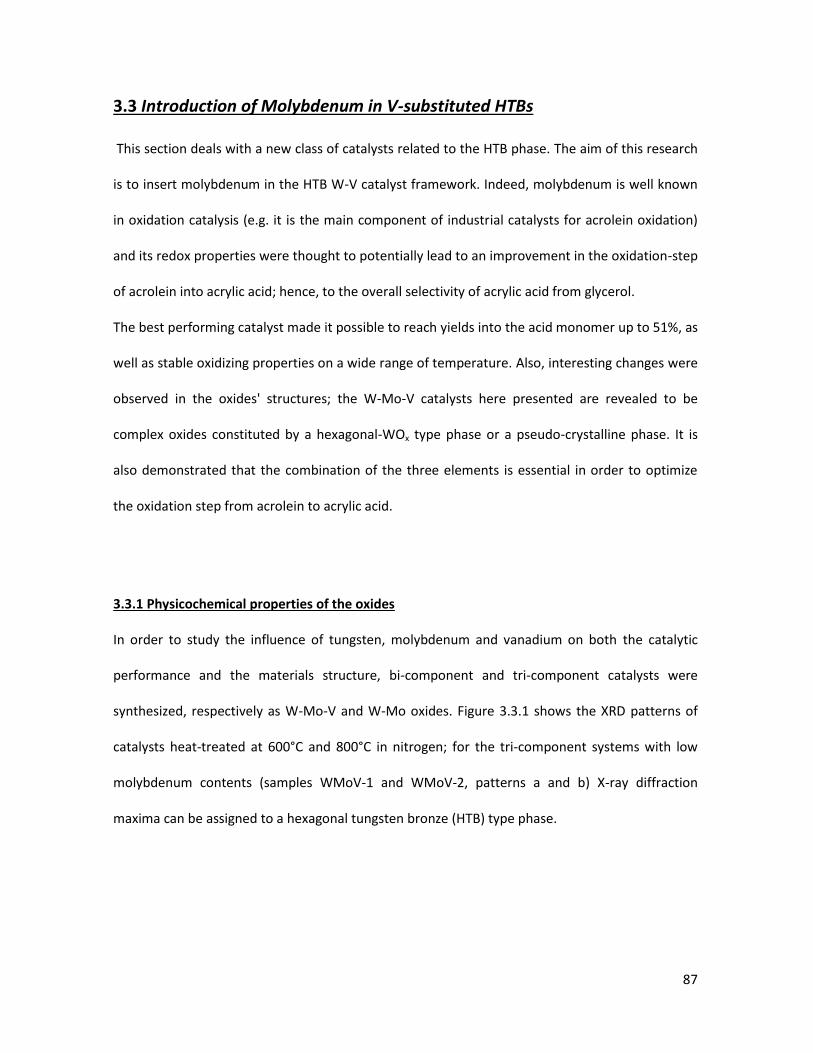
87
3.3 Introduction of Molybdenum in V-substituted HTBs
This section deals with a new class of catalysts related to the HTB phase. The aim of this research
is to insert molybdenum in the HTB W-V catalyst framework. Indeed, molybdenum is well known
in oxidation catalysis (e.g. it is the main component of industrial catalysts for acrolein oxidation)
and its redox properties were thought to potentially lead to an improvement in the oxidation-step
of acrolein into acrylic acid; hence, to the overall selectivity of acrylic acid from glycerol.
The best performing catalyst made it possible to reach yields into the acid monomer up to 51%, as
well as stable oxidizing properties on a wide range of temperature. Also, interesting changes were
observed in the oxides' structures; the W-Mo-V catalysts here presented are revealed to be
complex oxides constituted by a hexagonal-WOx type phase or a pseudo-crystalline phase. It is
also demonstrated that the combination of the three elements is essential in order to optimize
the oxidation step from acrolein to acrylic acid.
3.3.1 Physicochemical properties of the oxides
In order to study the influence of tungsten, molybdenum and vanadium on both the catalytic
performance and the materials structure, bi-component and tri-component catalysts were
synthesized, respectively as W-Mo-V and W-Mo oxides. Figure 3.3.1 shows the XRD patterns of
catalysts heat-treated at 600°C and 800°C in nitrogen; for the tri-component systems with low
molybdenum contents (samples WMoV-1 and WMoV-2, patterns a and b) X-ray diffraction
maxima can be assigned to a hexagonal tungsten bronze (HTB) type phase.
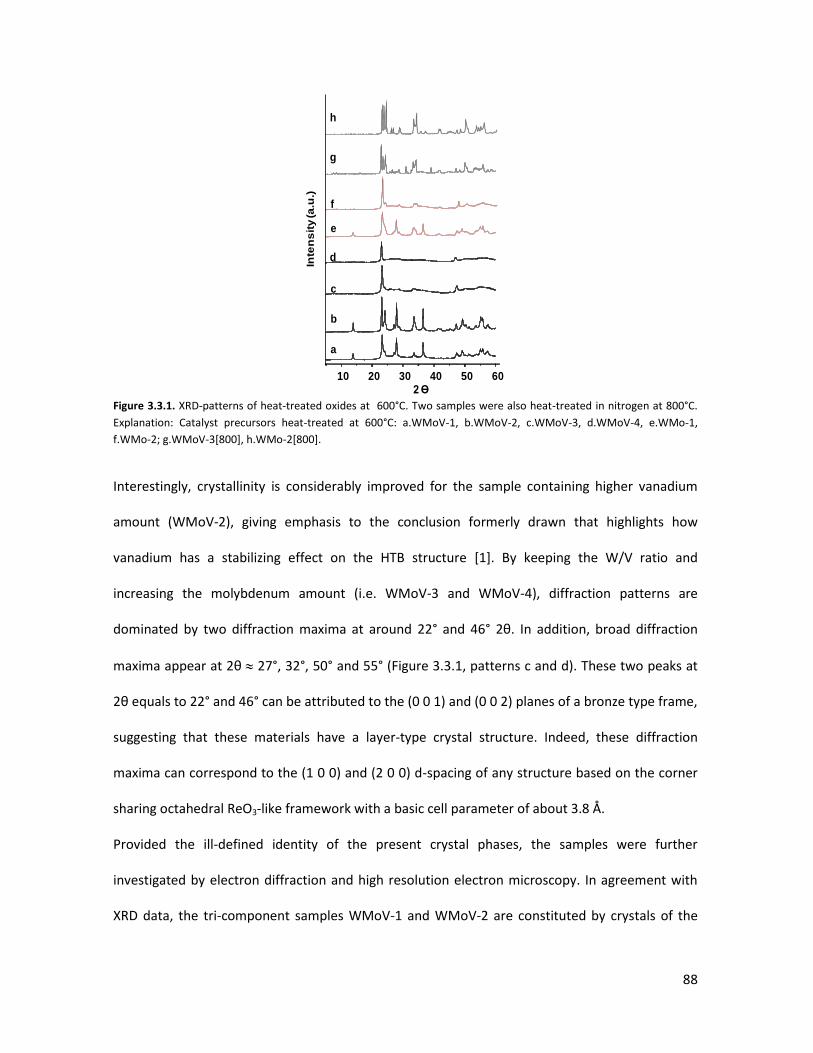
88
Figure 3.3.1. XRD-patterns of heat-treated oxides at 600°C. Two samples were also heat-treated in nitrogen at 800°C.
Explanation: Catalyst precursors heat-treated at 600°C: a.WMoV-1, b.WMoV-2, c.WMoV-3, d.WMoV-4, e.WMo-1,
f.WMo-2; g.WMoV-3[800], h.WMo-2[800].
Interestingly, crystallinity is considerably improved for the sample containing higher vanadium
amount (WMoV-2), giving emphasis to the conclusion formerly drawn that highlights how
vanadium has a stabilizing effect on the HTB structure [1]. By keeping the W/V ratio and
increasing the molybdenum amount (i.e. WMoV-3 and WMoV-4), diffraction patterns are
dominated by two diffraction maxima at around 22° and 46° 2θ. In addition, broad diffraction
maxima appear at 2θ 27°, 32°, 50° and 55° (Figure 3.3.1, patterns c and d). These two peaks at
2θ equals to 22° and 46° can be attributed to the (0 0 1) and (0 0 2) planes of a bronze type frame,
suggesting that these materials have a layer-type crystal structure. Indeed, these diffraction
maxima can correspond to the (1 0 0) and (2 0 0) d-spacing of any structure based on the corner
sharing octahedral ReO3-like framework with a basic cell parameter of about 3.8 Å.
Provided the ill-defined identity of the present crystal phases, the samples were further
investigated by electron diffraction and high resolution electron microscopy. In agreement with
XRD data, the tri-component samples WMoV-1 and WMoV-2 are constituted by crystals of the
h
g
10 20 30 40 50 60
a
2 Ɵ
b
c
d
e
f
Inte
ns
ity (a
.u.)
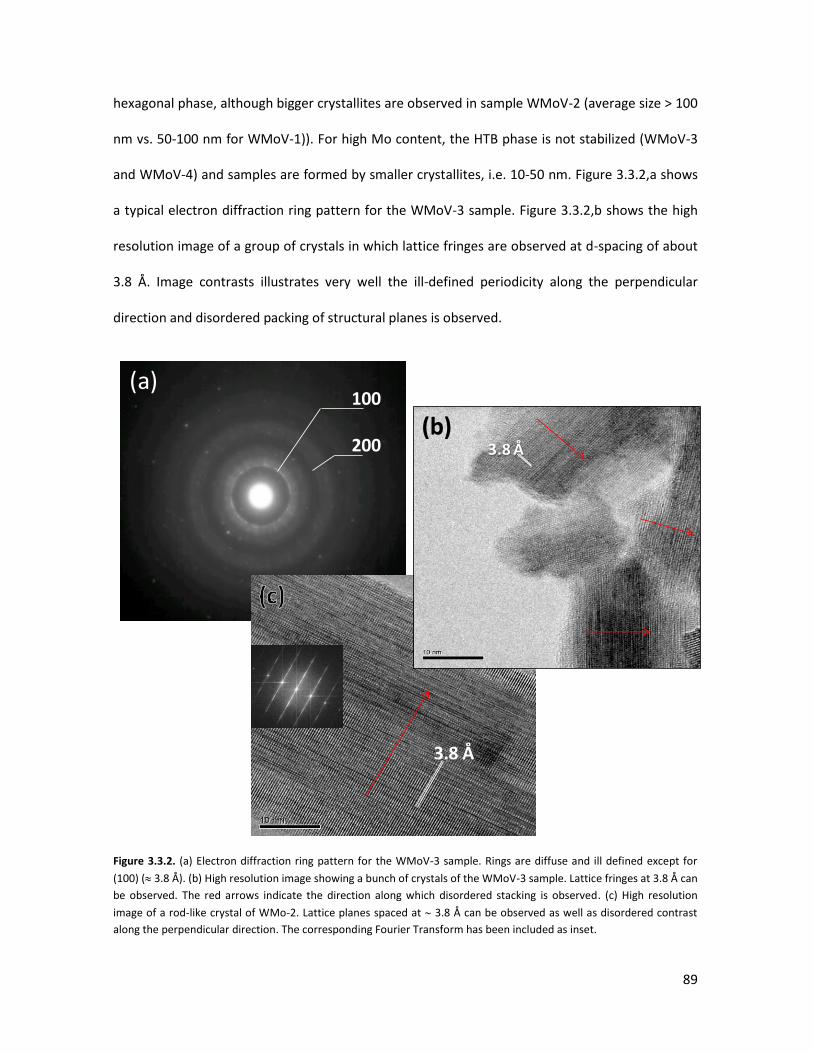
89
hexagonal phase, although bigger crystallites are observed in sample WMoV-2 (average size > 100
nm vs. 50-100 nm for WMoV-1)). For high Mo content, the HTB phase is not stabilized (WMoV-3
and WMoV-4) and samples are formed by smaller crystallites, i.e. 10-50 nm. Figure 3.3.2,a shows
a typical electron diffraction ring pattern for the WMoV-3 sample. Figure 3.3.2,b shows the high
resolution image of a group of crystals in which lattice fringes are observed at d-spacing of about
3.8 Å. Image contrasts illustrates very well the ill-defined periodicity along the perpendicular
direction and disordered packing of structural planes is observed.
Figure 3.3.2. (a) Electron diffraction ring pattern for the WMoV-3 sample. Rings are diffuse and ill defined except for
(100) ( 3.8 Å). (b) High resolution image showing a bunch of crystals of the WMoV-3 sample. Lattice fringes at 3.8 Å can
be observed. The red arrows indicate the direction along which disordered stacking is observed. (c) High resolution
image of a rod-like crystal of WMo-2. Lattice planes spaced at 3.8 Å can be observed as well as disordered contrast
along the perpendicular direction. The corresponding Fourier Transform has been included as inset.
100
200
(a)
3.8 Å
3.8 Å(b)
90
This low resolved structural arrangement is consistent with the previous interpretation of the
corresponding XRD pattern. In the absence of vanadium, XRD patterns show strong similarity with
those of samples containing vanadium, the W/Mo ratio playing a pivotal role in stabilizing the
HTB-type phase. Figure 3.3.2 (c) shows a rod-like crystal of the WMo-2 sample. Lattice planes
equally spaced at 3.8 Å can be observed as well as disordered contrast along the perpendicular
direction and the image contrast is very similar to that on figure 3.3.2 (b) although the average
crystal size is above 100 nm. In order to facilitate the formation of well crystallized phases and as
a help in the elucidation of the nature of these materials, the same catalysts precursors were heat
treated in nitrogen at 800°C -see paragraph 2.3.1-.
XRD patterns of samples heat-treated at 800°C, i.e. WMoV-3[800] and WMo-2[800], are also
shown in Figure 3.3.1 (patterns g and h, respectively). Both patterns reveal the formation of a
monoclinic WO3-type phase. In addition, a certain amount of Mo5O14-type phase is also visible in
the sample containing vanadium (pattern h). The WMoV-3[800] sample is formed by a m-WO3
type phase as major component. The electron microscopy study, see figure figure 3.3.3 (a) shows
that the well grown crystals of m-WO3 type phase do not contain vanadium, the average atomic
composition being W0.7Mo0.3O3. Interestingly, vanadium is segregated into the Mo5O14-type phase
crystals which constitute the minor component of the sample and their atomic average
composition is (W0.64Mo0.3V0.03)5O14 (figure 3.3.3 (b).
All the above results are consistent with the idea that catalysts heat-treated at 600°C are
constituted by a matrix built up by corner sharing MO6 octahedra and distributed in orderly
stacked crystal planes (d 3.8 Å). Inside the planes, further structural reconstruction is needed to
achieve a particular structural type, as demonstrated by the ill-defined diffraction maxima as well
as the disordered contrast observed in the high resolution images.
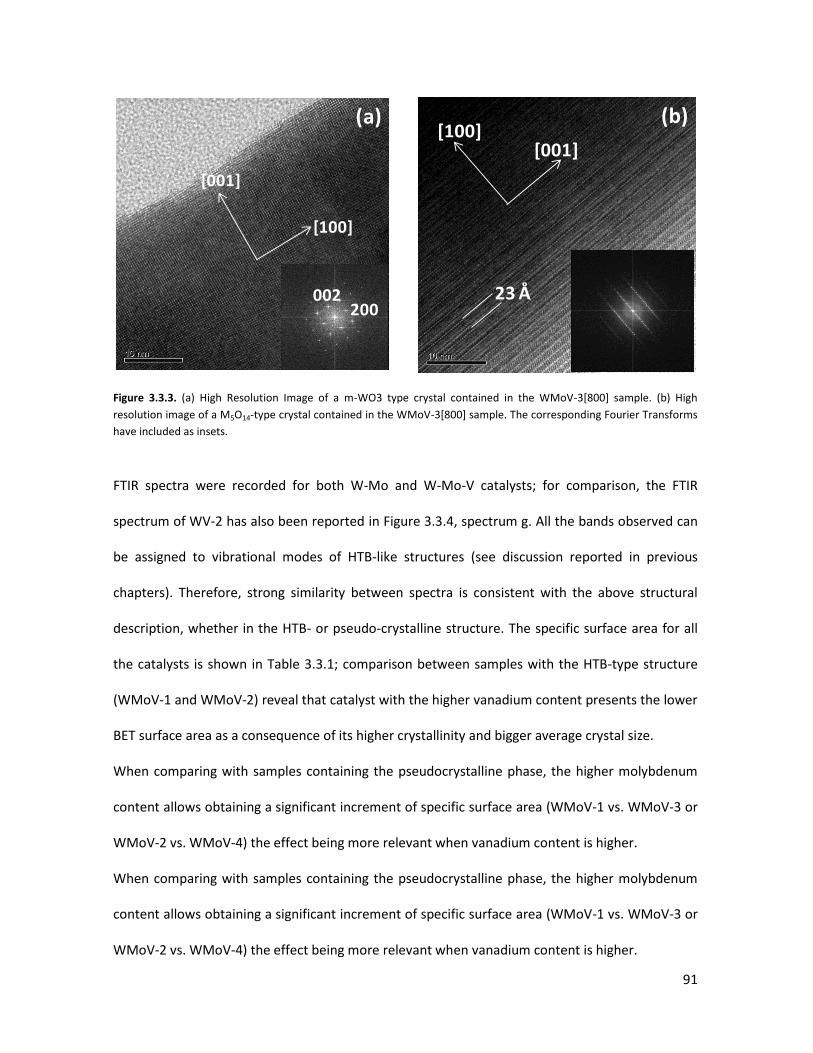
91
Figure 3.3.3. (a) High Resolution Image of a m-WO3 type crystal contained in the WMoV-3[800] sample. (b) High
resolution image of a M5O14-type crystal contained in the WMoV-3[800] sample. The corresponding Fourier Transforms
have included as insets.
FTIR spectra were recorded for both W-Mo and W-Mo-V catalysts; for comparison, the FTIR
spectrum of WV-2 has also been reported in Figure 3.3.4, spectrum g. All the bands observed can
be assigned to vibrational modes of HTB-like structures (see discussion reported in previous
chapters). Therefore, strong similarity between spectra is consistent with the above structural
description, whether in the HTB- or pseudo-crystalline structure. The specific surface area for all
the catalysts is shown in Table 3.3.1; comparison between samples with the HTB-type structure
(WMoV-1 and WMoV-2) reveal that catalyst with the higher vanadium content presents the lower
BET surface area as a consequence of its higher crystallinity and bigger average crystal size.
When comparing with samples containing the pseudocrystalline phase, the higher molybdenum
content allows obtaining a significant increment of specific surface area (WMoV-1 vs. WMoV-3 or
WMoV-2 vs. WMoV-4) the effect being more relevant when vanadium content is higher.
When comparing with samples containing the pseudocrystalline phase, the higher molybdenum
content allows obtaining a significant increment of specific surface area (WMoV-1 vs. WMoV-3 or
WMoV-2 vs. WMoV-4) the effect being more relevant when vanadium content is higher.
[001]
[100]
002200
(a)
23 Å
[001][100]
(b)
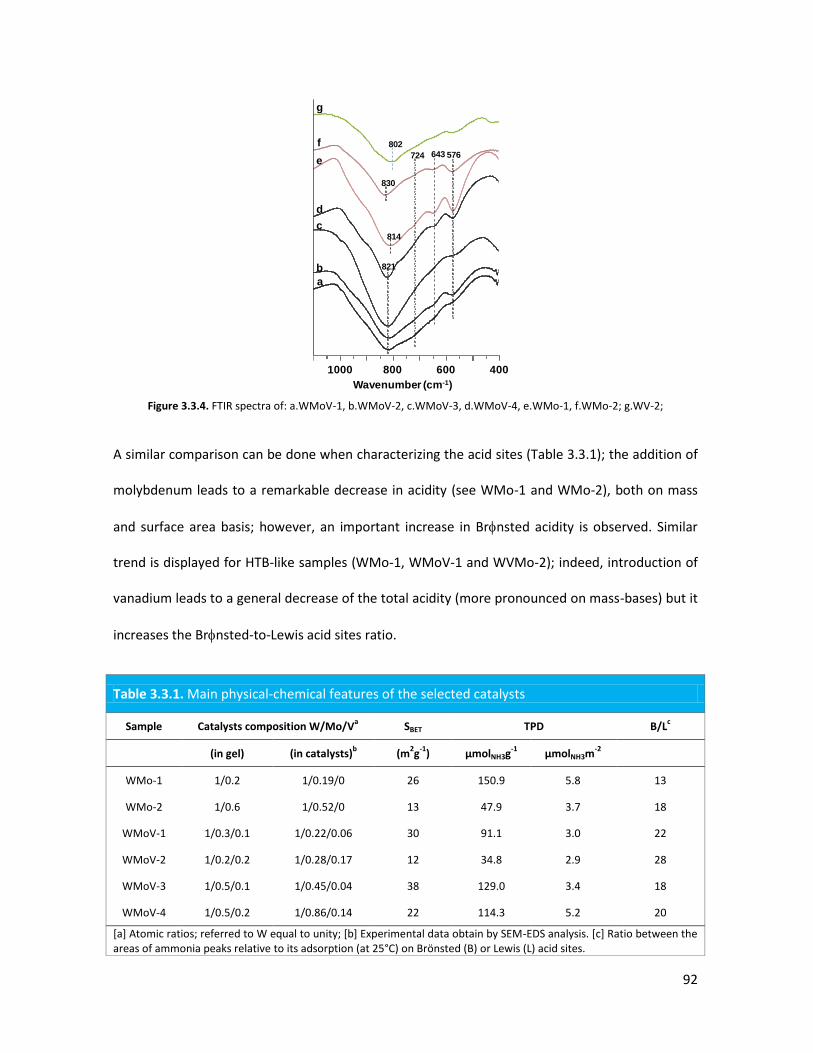
92
Figure 3.3.4. FTIR spectra of: a.WMoV-1, b.WMoV-2, c.WMoV-3, d.WMoV-4, e.WMo-1, f.WMo-2; g.WV-2;
A similar comparison can be done when characterizing the acid sites (Table 3.3.1); the addition of
molybdenum leads to a remarkable decrease in acidity (see WMo-1 and WMo-2), both on mass
and surface area basis; however, an important increase in Brnsted acidity is observed. Similar
trend is displayed for HTB-like samples (WMo-1, WMoV-1 and WVMo-2); indeed, introduction of
vanadium leads to a general decrease of the total acidity (more pronounced on mass-bases) but it
increases the Brnsted-to-Lewis acid sites ratio.
Table 3.3.1. Main physical-chemical features of the selected catalysts
Sample Catalysts composition W/Mo/Va
SBET TPD B/Lc
(in gel) (in catalysts)b (m
2g
-1) µmolNH3g
-1 µmolNH3m
-2
WMo-1 1/0.2 1/0.19/0 26 150.9 5.8 13
WMo-2 1/0.6 1/0.52/0 13 47.9 3.7 18
WMoV-1 1/0.3/0.1 1/0.22/0.06 30 91.1 3.0 22
WMoV-2 1/0.2/0.2 1/0.28/0.17 12 34.8 2.9 28
WMoV-3 1/0.5/0.1 1/0.45/0.04 38 129.0 3.4 18
WMoV-4 1/0.5/0.2 1/0.86/0.14 22 114.3 5.2 20
[a] Atomic ratios; referred to W equal to unity; [b] Experimental data obtain by SEM-EDS analysis. [c] Ratio between the areas of ammonia peaks relative to its adsorption (at 25°C) on Brönsted (B) or Lewis (L) acid sites.
1000 800 600 400
f
e
d
c814
576643724
821
830
b
a
g
802
Wavenumber (cm-1)
93
On the other hand, the introduction of molybdenum in higher amounts, leading to pseudo-
crystalline structures (WMo-2, WMoV-3 and WMoV-4), brings about an increase in total acidity,
but it depresses the presence of Brnsted-type acid sites. These trends make it evident that the
introduction of redox elements (i.e. vanadium and molybdenum) in the WOx framework plays also
a role on the nature of acid sites. Overall, it is important to point out that all the mixed-oxides
studied have a predominant Brnsted acid character, therefore emphasizing the role played by
these acid sites in the glycerol dehydration step [76, 77].
3.3.2 Lab-scale reactor tests
The catalytic behavior of each sample was studied in the temperature range 270-410°C and at
different residence times. It should be mentioned that for all the catalysts and all the reaction
conditions explored, glycerol conversion was always complete, as already pointed out for both W-
V and W-V-Nb catalysts. Moreover, as far as the nature of these compounds is concerned, the
same kind of compounds were detected for the catalysts here studied both at low contact time
and/or low reaction temperature.
In figure 3.3.5 and 3.3.6 are reported the most representative catalytic results obtained in the
oxidehydration of glycerol performed on bi-component W-Mo and tri-component W-Mo-V
catalysts, when it was used a feed with molar ratio Oxygen/Glycerol/Water/Nitrogen=4/2/40/54.
Generally speaking, both bi-component catalysts showed always complete glycerol conversion
and remarkable acrolein yield; however, only low yields in partial oxidation products (mainly
acrylic and acetic acid) were obtained along with high yields in both heavy compounds and COx.
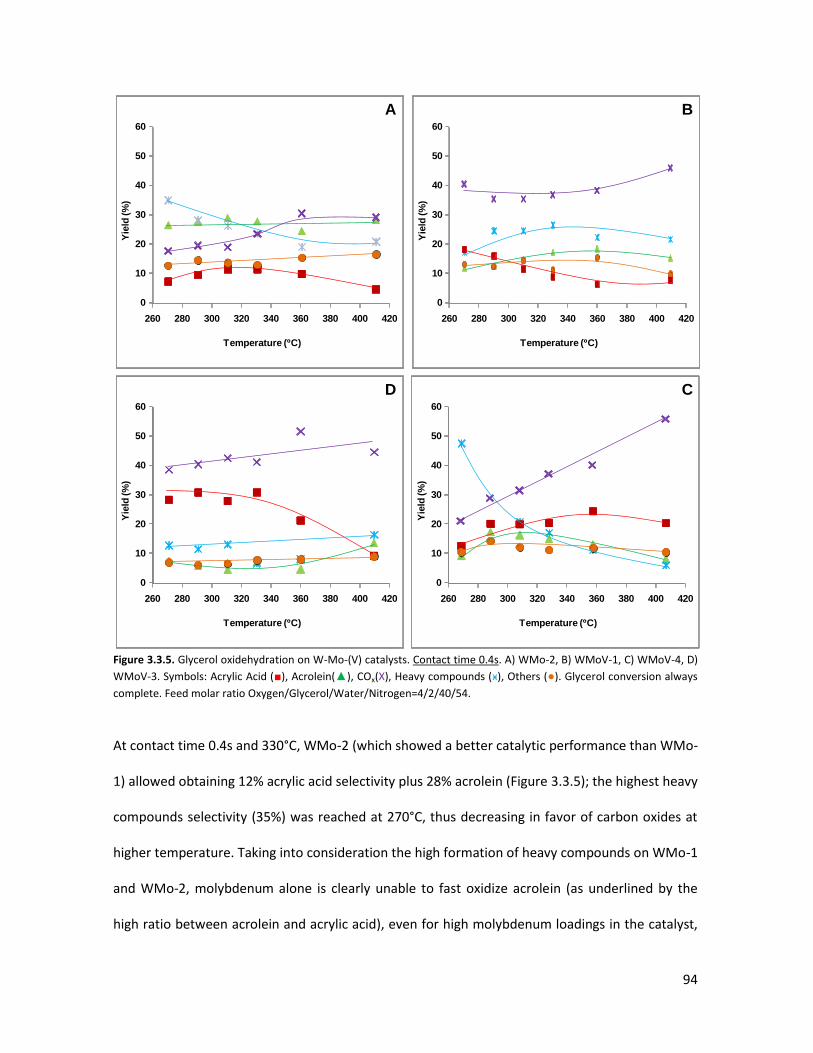
94
Figure 3.3.5. Glycerol oxidehydration on W-Mo-(V) catalysts. Contact time 0.4s. A) WMo-2, B) WMoV-1, C) WMoV-4, D)
WMoV-3. Symbols: Acrylic Acid (■), Acrolein(▲), COx(X), Heavy compounds (ӿ), Others (●). Glycerol conversion always
complete. Feed molar ratio Oxygen/Glycerol/Water/Nitrogen=4/2/40/54.
At contact time 0.4s and 330°C, WMo-2 (which showed a better catalytic performance than WMo-
1) allowed obtaining 12% acrylic acid selectivity plus 28% acrolein (Figure 3.3.5); the highest heavy
compounds selectivity (35%) was reached at 270°C, thus decreasing in favor of carbon oxides at
higher temperature. Taking into consideration the high formation of heavy compounds on WMo-1
and WMo-2, molybdenum alone is clearly unable to fast oxidize acrolein (as underlined by the
high ratio between acrolein and acrylic acid), even for high molybdenum loadings in the catalyst,
0
10
20
30
40
50
60
260 280 300 320 340 360 380 400 420
Yie
ld (%
)
Temperature (ºC)
0
10
20
30
40
50
60
260 280 300 320 340 360 380 400 420
Yie
ld (%
)
Temperature (ºC)
0
10
20
30
40
50
60
260 280 300 320 340 360 380 400 420
Yie
ld (%
)
Temperature (ºC)
0
10
20
30
40
50
60
260 280 300 320 340 360 380 400 420
Yie
ld (%
)
Temperature (ºC)
A B
D C
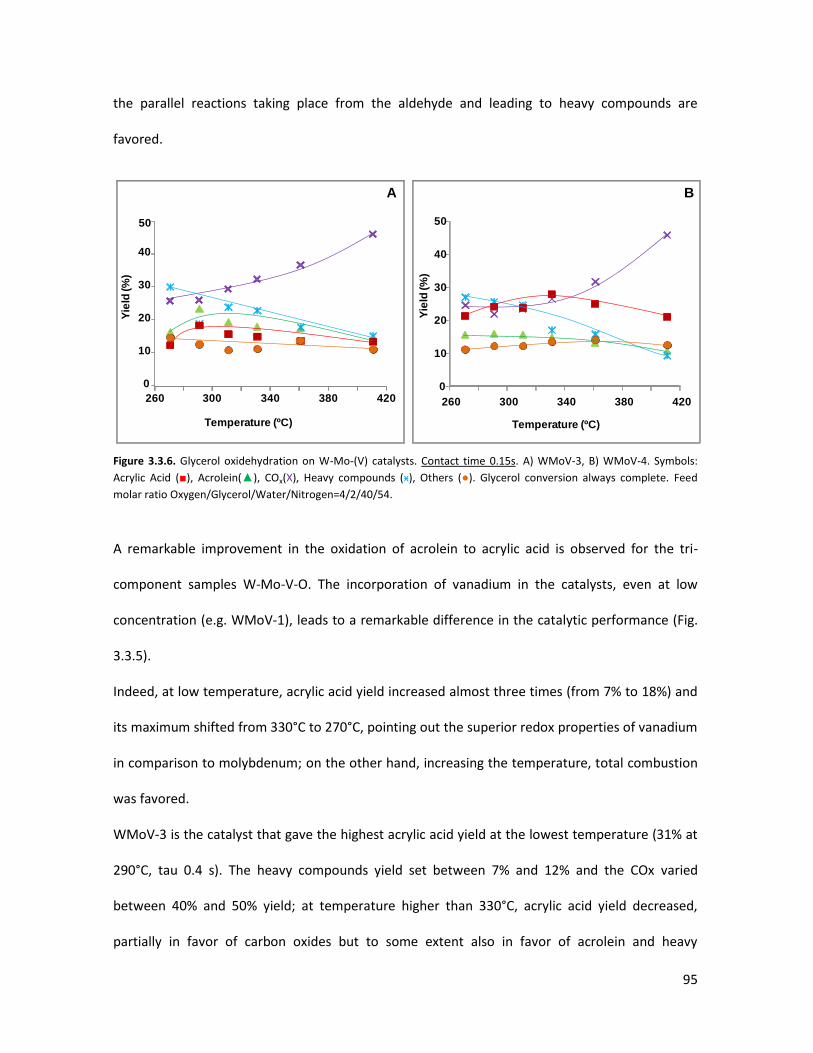
95
the parallel reactions taking place from the aldehyde and leading to heavy compounds are
favored.
Figure 3.3.6. Glycerol oxidehydration on W-Mo-(V) catalysts. Contact time 0.15s. A) WMoV-3, B) WMoV-4. Symbols:
Acrylic Acid (■), Acrolein(▲), COx(X), Heavy compounds (ӿ), Others (●). Glycerol conversion always complete. Feed
molar ratio Oxygen/Glycerol/Water/Nitrogen=4/2/40/54.
A remarkable improvement in the oxidation of acrolein to acrylic acid is observed for the tri-
component samples W-Mo-V-O. The incorporation of vanadium in the catalysts, even at low
concentration (e.g. WMoV-1), leads to a remarkable difference in the catalytic performance (Fig.
3.3.5).
Indeed, at low temperature, acrylic acid yield increased almost three times (from 7% to 18%) and
its maximum shifted from 330°C to 270°C, pointing out the superior redox properties of vanadium
in comparison to molybdenum; on the other hand, increasing the temperature, total combustion
was favored.
WMoV-3 is the catalyst that gave the highest acrylic acid yield at the lowest temperature (31% at
290°C, tau 0.4 s). The heavy compounds yield set between 7% and 12% and the COx varied
between 40% and 50% yield; at temperature higher than 330°C, acrylic acid yield decreased,
partially in favor of carbon oxides but to some extent also in favor of acrolein and heavy
50
Yie
ld (%
)
260 300 340 380 420
Temperature (ºC)
0
10
20
30
40
Yie
ld (%
)
0
10
20
30
40
50
260 300 340 380 420
Temperature (ºC)
A B
96
compounds, suggesting that at higher temperature the oxygen introduced in the feed is not
enough to oxidize acrolein. All in all, a remarkable note for the catalytic performance of WMoV-3
is that acrylic acid yield is almost identical on a wide range of temperature (from 270°C to 330°C);
comparing this catalyst with the ones already reported in literature for the same reaction (vide-
supra) and with W-V oxides, it is evident that this behavior represents an important leap forward
for the design of catalysts more suitable for industrial scale-up, since in oxidation catalysis the
precise control of temperature all along the catalytic bed represents a very challenging task at
industrial scale. Thus, combination of molybdenum and vanadium leads to a better control of the
oxidative properties of the catalysts, smoothing the oxidizing strength of vanadium. In regard to
acrylic acid selectivity as a function of temperature, a similar trend to WMoV-3 was registered for
WMoV-4, but at a lower contact time (0.15 s) (Figure 3.3.6); indeed, from 270°C to 410°C acrylic
acid yield varied of only few percentage points, from 22% to 28%. Comparing WMoV-3 (contact
time 0.4 s) and WMoV-4 (contact time 0.15 s), at low temperature carbon oxides yield was much
lower in the latter case but there was no gain in acrylic acid yield since the difference is basically
accounted in higher formation of heavy compounds; however, comparing WMoV-3 and WMoV-4
tested at contact time 0.15 s, it can be seen that the latter sample leads to higher yields into
acrylic acid and lower yields to COx. Nevertheless, comparing WMoV-3 and WMoV-4 tested at
contact time 0.4 s, higher acrylic acid yields were obtained in the former case as long as lower
yields into acrolein, and much lower yields into heavy compounds, finally corresponding to higher
yield into COx.
Therefore, higher loadings of vanadium improve the oxidation process but lead to total oxidation
products at higher temperature and residence time; on the other hand, high amounts of
molybdenum depress the acrolein oxidation, favoring the parallel reactions leading to heavy
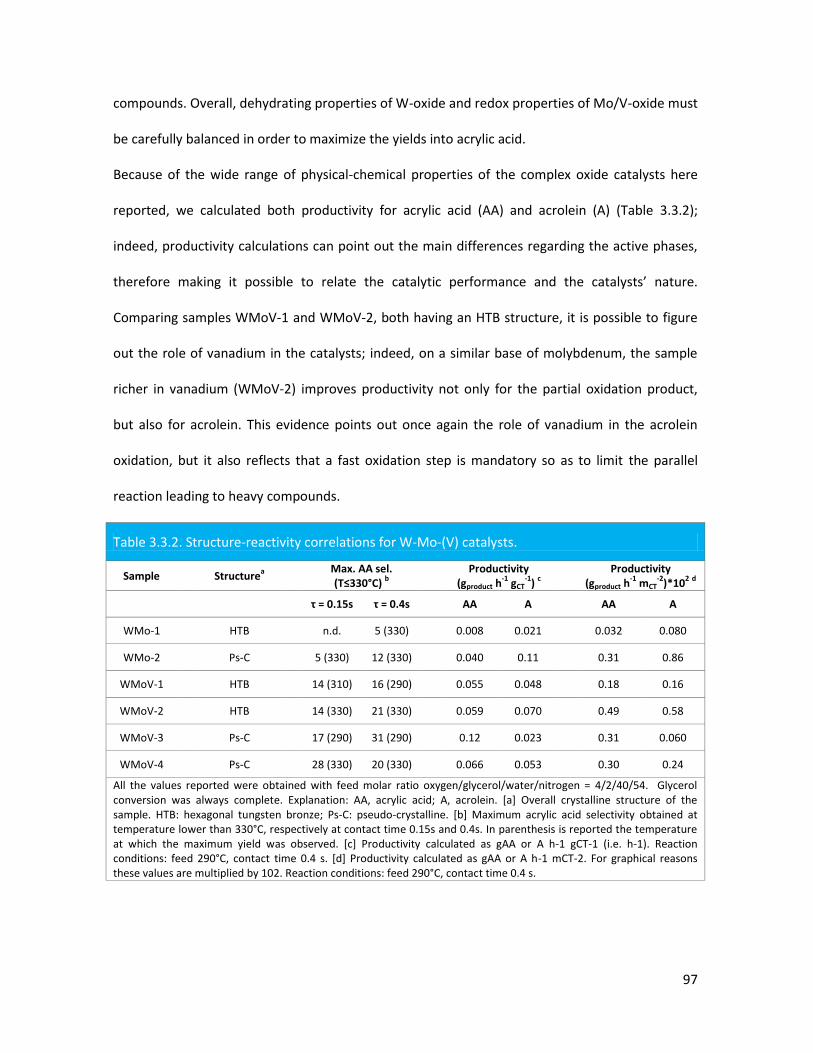
97
compounds. Overall, dehydrating properties of W-oxide and redox properties of Mo/V-oxide must
be carefully balanced in order to maximize the yields into acrylic acid.
Because of the wide range of physical-chemical properties of the complex oxide catalysts here
reported, we calculated both productivity for acrylic acid (AA) and acrolein (A) (Table 3.3.2);
indeed, productivity calculations can point out the main differences regarding the active phases,
therefore making it possible to relate the catalytic performance and the catalysts’ nature.
Comparing samples WMoV-1 and WMoV-2, both having an HTB structure, it is possible to figure
out the role of vanadium in the catalysts; indeed, on a similar base of molybdenum, the sample
richer in vanadium (WMoV-2) improves productivity not only for the partial oxidation product,
but also for acrolein. This evidence points out once again the role of vanadium in the acrolein
oxidation, but it also reflects that a fast oxidation step is mandatory so as to limit the parallel
reaction leading to heavy compounds.
Table 3.3.2. Structure-reactivity correlations for W-Mo-(V) catalysts.
Sample Structurea
Max. AA sel. (T≤330°C)
b Productivity
(gproduct h-1
gCT-1
) c
Productivity (gproduct h
-1 mCT
-2)*10
2 d
τ = 0.15s τ = 0.4s AA A AA A
WMo-1 HTB n.d. 5 (330) 0.008 0.021 0.032 0.080
WMo-2 Ps-C 5 (330) 12 (330) 0.040 0.11 0.31 0.86
WMoV-1 HTB 14 (310) 16 (290) 0.055 0.048 0.18 0.16
WMoV-2 HTB 14 (330) 21 (330) 0.059 0.070 0.49 0.58
WMoV-3 Ps-C 17 (290) 31 (290) 0.12 0.023 0.31 0.060
WMoV-4 Ps-C 28 (330) 20 (330) 0.066 0.053 0.30 0.24
All the values reported were obtained with feed molar ratio oxygen/glycerol/water/nitrogen = 4/2/40/54. Glycerol conversion was always complete. Explanation: AA, acrylic acid; A, acrolein. [a] Overall crystalline structure of the sample. HTB: hexagonal tungsten bronze; Ps-C: pseudo-crystalline. [b] Maximum acrylic acid selectivity obtained at temperature lower than 330°C, respectively at contact time 0.15s and 0.4s. In parenthesis is reported the temperature at which the maximum yield was observed. [c] Productivity calculated as gAA or A h-1 gCT-1 (i.e. h-1). Reaction conditions: feed 290°C, contact time 0.4 s. [d] Productivity calculated as gAA or A h-1 mCT-2. For graphical reasons these values are multiplied by 102. Reaction conditions: feed 290°C, contact time 0.4 s.
98
Molybdenum is also crucial in the oxidation process; indeed, moving from WMoV-1 to WMoV-3
(having similar amount of vanadium but higher content of molybdenum) the acrylic acid
productivity is improved. However, when the amount of molybdenum is higher (WMoV-4 vs.
WMoV-2) the Brnsted to Lewis acid sites ratio decreases and leads also to a variation in the
elements distribution which depress the overall oxidehydration process, as highlighted by the
abrupt overall productivity drop (AA+A) per meter square of catalysts; on the other hand, acrylic
acid productivity on molar bases increases from 0.059 to 0.066 h-1 due to the increased surface
area (from 12 to 22 m2/g). From productivity trends calculated on mass and surface area basis,
the role of the crystal structure can also be outlined. First of all, for tri-component catalysts, it can
be pointed out that AA productivity (on mass- and surface area-bases) has its maximum located in
different position, i.e. WMoV-3 and WMoV-2, respectively. This means that the best catalyst, in
terms of activity per specific surface area, is WMoV-2; however, because of its low area, the
productivity remains scarce. Therefore, it can be deduced that the pseudo-crystalline structure
plays an important role in determining the catalysts productivity per gram of catalyst; indeed, it
has been demonstrated that the highest surface area is obtained for low vanadium- and high
molybdenum-content, which is the condition where the pseudo-crystalline structure forms. On
the other hand, it seems that it is the relative distribution of the elements what has the major
impact in the catalytic performance: productivity trends are clearly a function of the oxide
composition, whether in the HTB or in the pseudo-crystalline phase.
For bi-component (W-Mo) catalysts, it must be mentioned that acrylic acid productivity is
relatively high due to the low surface area; however, acrylic acid productivity per gram of catalyst
is low. Moreover, the high overall acrolein productivity underlines the insufficient redox
properties of V-free catalysts, since acrolein remains mainly unconverted.
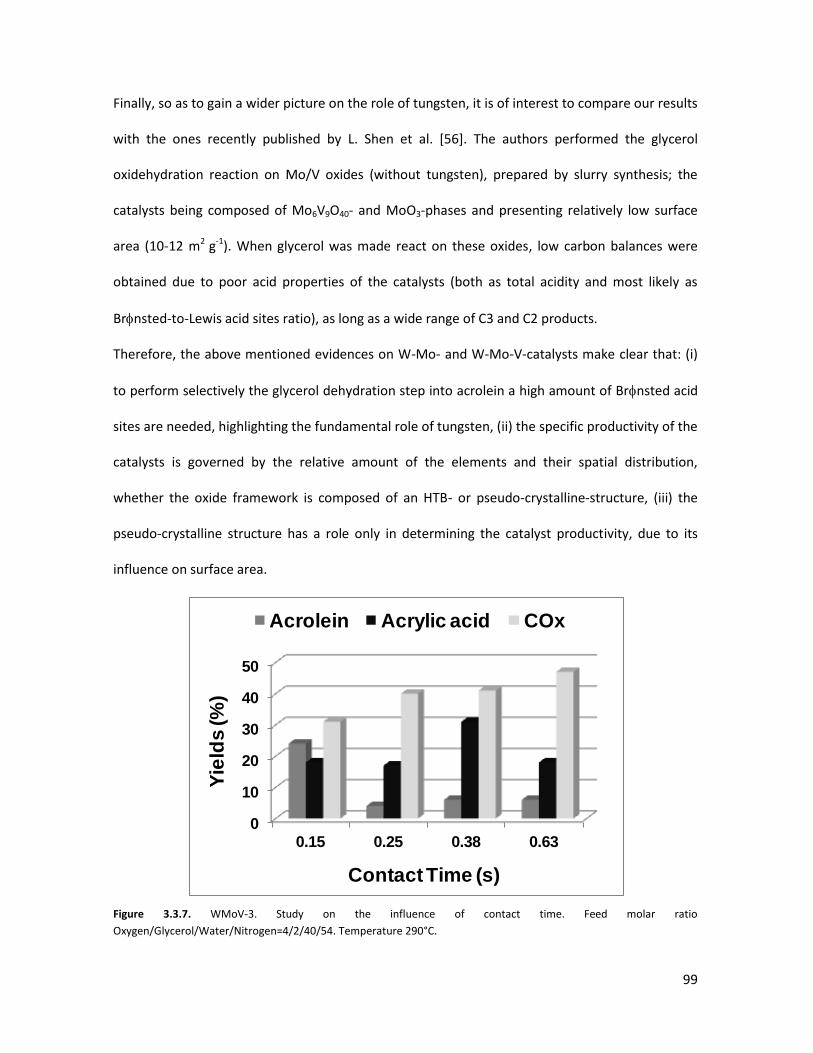
99
Finally, so as to gain a wider picture on the role of tungsten, it is of interest to compare our results
with the ones recently published by L. Shen et al. [56]. The authors performed the glycerol
oxidehydration reaction on Mo/V oxides (without tungsten), prepared by slurry synthesis; the
catalysts being composed of Mo6V9O40- and MoO3-phases and presenting relatively low surface
area (10-12 m2 g-1). When glycerol was made react on these oxides, low carbon balances were
obtained due to poor acid properties of the catalysts (both as total acidity and most likely as
Brnsted-to-Lewis acid sites ratio), as long as a wide range of C3 and C2 products.
Therefore, the above mentioned evidences on W-Mo- and W-Mo-V-catalysts make clear that: (i)
to perform selectively the glycerol dehydration step into acrolein a high amount of Brnsted acid
sites are needed, highlighting the fundamental role of tungsten, (ii) the specific productivity of the
catalysts is governed by the relative amount of the elements and their spatial distribution,
whether the oxide framework is composed of an HTB- or pseudo-crystalline-structure, (iii) the
pseudo-crystalline structure has a role only in determining the catalyst productivity, due to its
influence on surface area.
Figure 3.3.7. WMoV-3. Study on the influence of contact time. Feed molar ratio
Oxygen/Glycerol/Water/Nitrogen=4/2/40/54. Temperature 290°C.
0
10
20
30
40
50
0.15 0.25 0.38 0.63
Yie
lds
(%
)
Contact Time (s)
Acrolein Acrylic acid COx
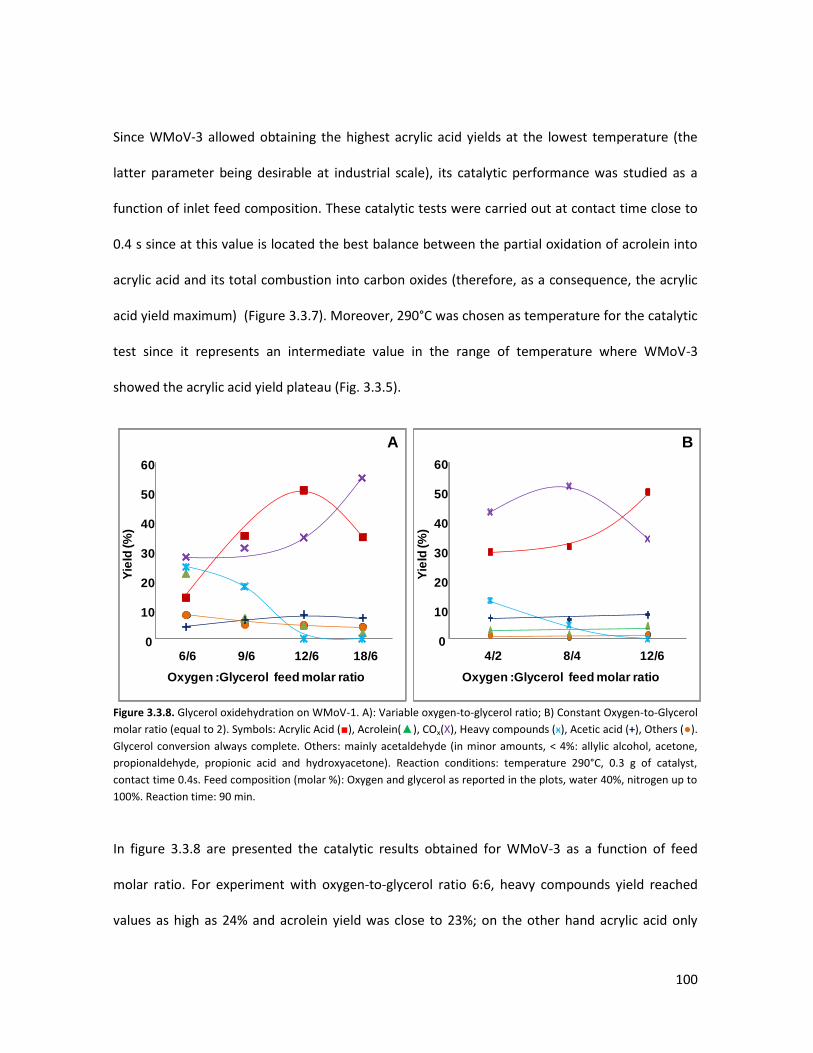
100
Since WMoV-3 allowed obtaining the highest acrylic acid yields at the lowest temperature (the
latter parameter being desirable at industrial scale), its catalytic performance was studied as a
function of inlet feed composition. These catalytic tests were carried out at contact time close to
0.4 s since at this value is located the best balance between the partial oxidation of acrolein into
acrylic acid and its total combustion into carbon oxides (therefore, as a consequence, the acrylic
acid yield maximum) (Figure 3.3.7). Moreover, 290°C was chosen as temperature for the catalytic
test since it represents an intermediate value in the range of temperature where WMoV-3
showed the acrylic acid yield plateau (Fig. 3.3.5).
Figure 3.3.8. Glycerol oxidehydration on WMoV-1. A): Variable oxygen-to-glycerol ratio; B) Constant Oxygen-to-Glycerol
molar ratio (equal to 2). Symbols: Acrylic Acid (■), Acrolein(▲), COx(X), Heavy compounds (ӿ), Acetic acid (+), Others (●).
Glycerol conversion always complete. Others: mainly acetaldehyde (in minor amounts, < 4%: allylic alcohol, acetone,
propionaldehyde, propionic acid and hydroxyacetone). Reaction conditions: temperature 290°C, 0.3 g of catalyst,
contact time 0.4s. Feed composition (molar %): Oxygen and glycerol as reported in the plots, water 40%, nitrogen up to
100%. Reaction time: 90 min.
In figure 3.3.8 are presented the catalytic results obtained for WMoV-3 as a function of feed
molar ratio. For experiment with oxygen-to-glycerol ratio 6:6, heavy compounds yield reached
values as high as 24% and acrolein yield was close to 23%; on the other hand acrylic acid only
A
0
10
20
30
40
50
60
6/6 9/6 12/6 18/6
Yie
ld (%
)
Oxygen :Glycerol feed molar ratio
B
Yie
ld (%
)
Oxygen :Glycerol feed molar ratio
0
10
20
30
40
50
60
4/2 8/4 12/6
101
reached yield close to 14% together with 28% COx yield. Increasing the partial pressure of oxygen,
the acrylic acid yield augmented at a higher rate than COx, since heavy compounds loss was
accounted more into acrylic acid than carbon oxides; acrylic acid yield reached a maximum equal
to 51% at oxygen to glycerol ratio of 12:6, finally decreasing in favor of carbon oxides when the
oxygen to glycerol ratio reached the value 18:6. A similar trend to the one reported for acrolein
and acrylic acid was shown by acetaldehyde and acetic acid, the latter achieving 8% yield at
oxygen-to-glycerol ratio 12:6; the acrylic acid maximum obtained is similar to the one obtained
with WVNb-1 mixed oxide in the same reaction conditions, but the latter being achieved after ca.
37 hours of time on stream (see figure 3.2.5). Very similar catalytic behavior was also observed
when the oxygen to glycerol molar ratio was set constant (equal to 2) (Figure 3.3.8 (B)), since
heavy compounds yield decreased mainly in favor of acrylic acid than COx. Therefore, it is
confirmed that high partial pressures of oxygen play the fundamental role of accelerating the
catalyst re-oxidation process, the latter being depressed by the high reducing power of glycerol
and/or its strong adsorption on the catalyst's surface. Indeed, when acrolein was made react on
WMoV-3 in the same reaction conditions (Fig. 3.1.5) a different behavior was registered since
increasing the partial pressure of both oxygen and glycerol -but keeping constant their ratio- the
acrylic acid selectivity decreased constantly in favor of carbon oxides.
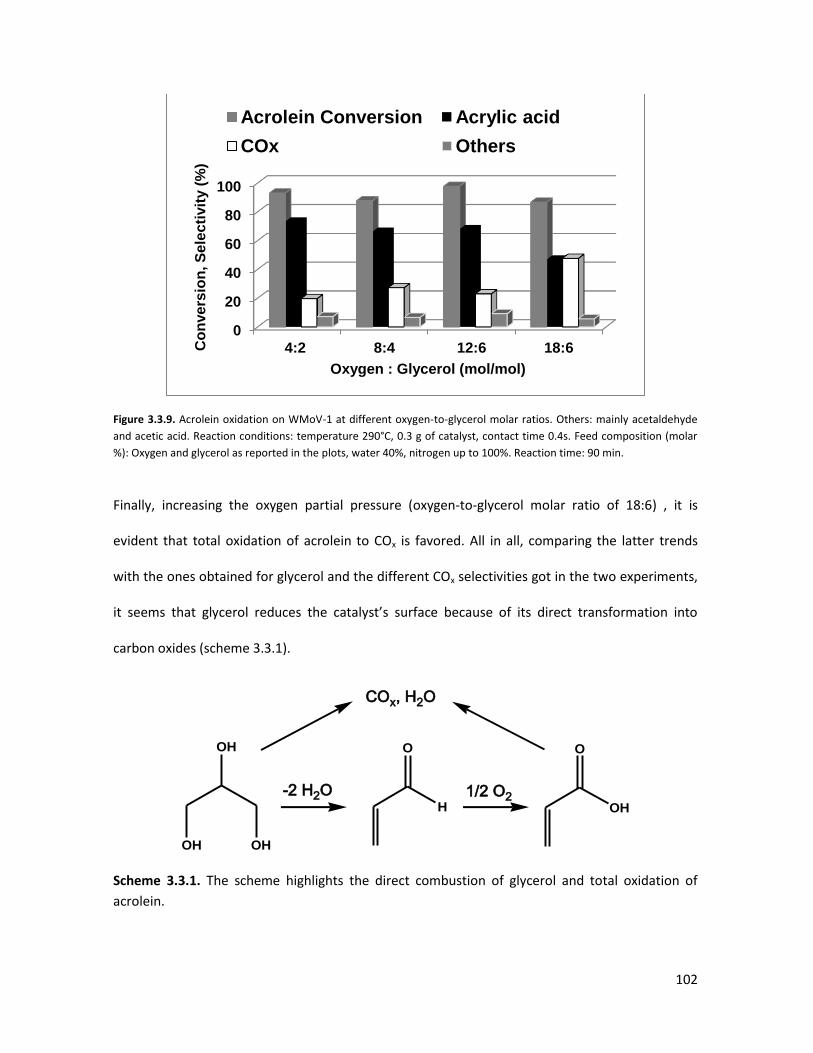
102
Figure 3.3.9. Acrolein oxidation on WMoV-1 at different oxygen-to-glycerol molar ratios. Others: mainly acetaldehyde
and acetic acid. Reaction conditions: temperature 290°C, 0.3 g of catalyst, contact time 0.4s. Feed composition (molar
%): Oxygen and glycerol as reported in the plots, water 40%, nitrogen up to 100%. Reaction time: 90 min.
Finally, increasing the oxygen partial pressure (oxygen-to-glycerol molar ratio of 18:6) , it is
evident that total oxidation of acrolein to COx is favored. All in all, comparing the latter trends
with the ones obtained for glycerol and the different COx selectivities got in the two experiments,
it seems that glycerol reduces the catalyst’s surface because of its direct transformation into
carbon oxides (scheme 3.3.1).
OH
OH
OH
O
H
O
OH
-2 H2O 1/2 O2
COx, H2O
Scheme 3.3.1. The scheme highlights the direct combustion of glycerol and total oxidation of
acrolein.
0
20
40
60
80
100
4:2 8:4 12:6 18:6 Co
nve
rsio
n, S
ele
cti
vit
y (
%)
Oxygen : Glycerol (mol/mol)
Acrolein Conversion Acrylic acid
COx Others
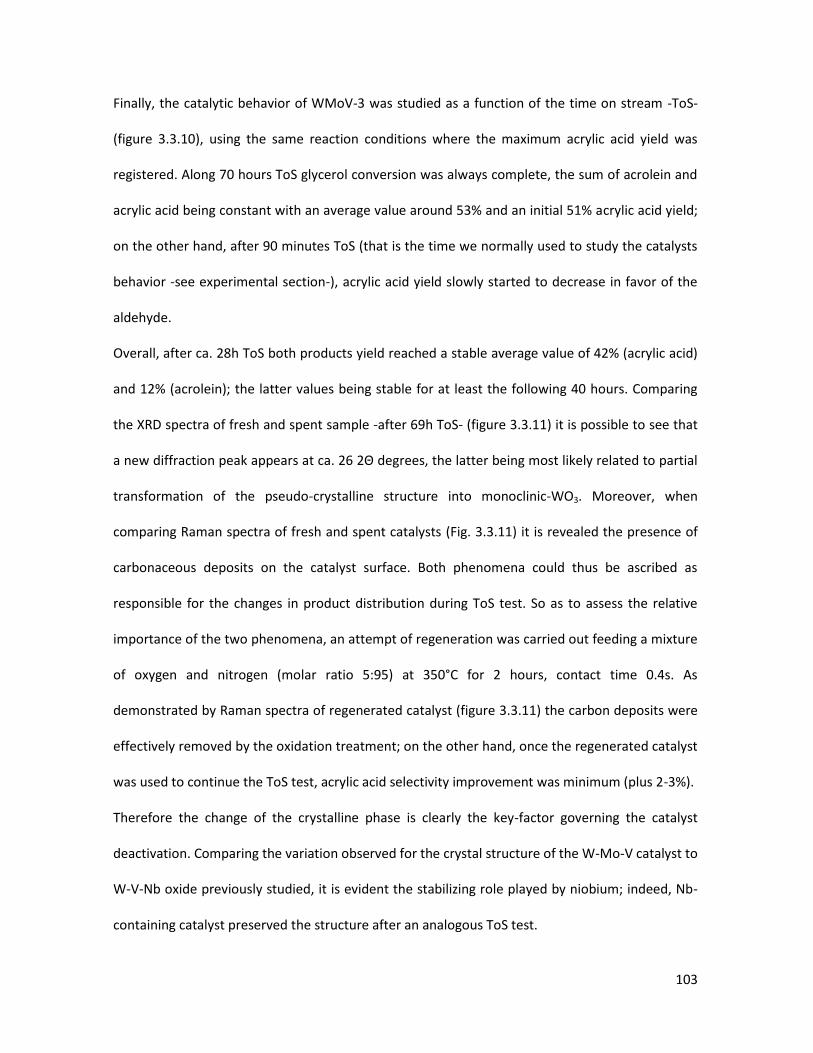
103
Finally, the catalytic behavior of WMoV-3 was studied as a function of the time on stream -ToS-
(figure 3.3.10), using the same reaction conditions where the maximum acrylic acid yield was
registered. Along 70 hours ToS glycerol conversion was always complete, the sum of acrolein and
acrylic acid being constant with an average value around 53% and an initial 51% acrylic acid yield;
on the other hand, after 90 minutes ToS (that is the time we normally used to study the catalysts
behavior -see experimental section-), acrylic acid yield slowly started to decrease in favor of the
aldehyde.
Overall, after ca. 28h ToS both products yield reached a stable average value of 42% (acrylic acid)
and 12% (acrolein); the latter values being stable for at least the following 40 hours. Comparing
the XRD spectra of fresh and spent sample -after 69h ToS- (figure 3.3.11) it is possible to see that
a new diffraction peak appears at ca. 26 2Θ degrees, the latter being most likely related to partial
transformation of the pseudo-crystalline structure into monoclinic-WO3. Moreover, when
comparing Raman spectra of fresh and spent catalysts (Fig. 3.3.11) it is revealed the presence of
carbonaceous deposits on the catalyst surface. Both phenomena could thus be ascribed as
responsible for the changes in product distribution during ToS test. So as to assess the relative
importance of the two phenomena, an attempt of regeneration was carried out feeding a mixture
of oxygen and nitrogen (molar ratio 5:95) at 350°C for 2 hours, contact time 0.4s. As
demonstrated by Raman spectra of regenerated catalyst (figure 3.3.11) the carbon deposits were
effectively removed by the oxidation treatment; on the other hand, once the regenerated catalyst
was used to continue the ToS test, acrylic acid selectivity improvement was minimum (plus 2-3%).
Therefore the change of the crystalline phase is clearly the key-factor governing the catalyst
deactivation. Comparing the variation observed for the crystal structure of the W-Mo-V catalyst to
W-V-Nb oxide previously studied, it is evident the stabilizing role played by niobium; indeed, Nb-
containing catalyst preserved the structure after an analogous ToS test.
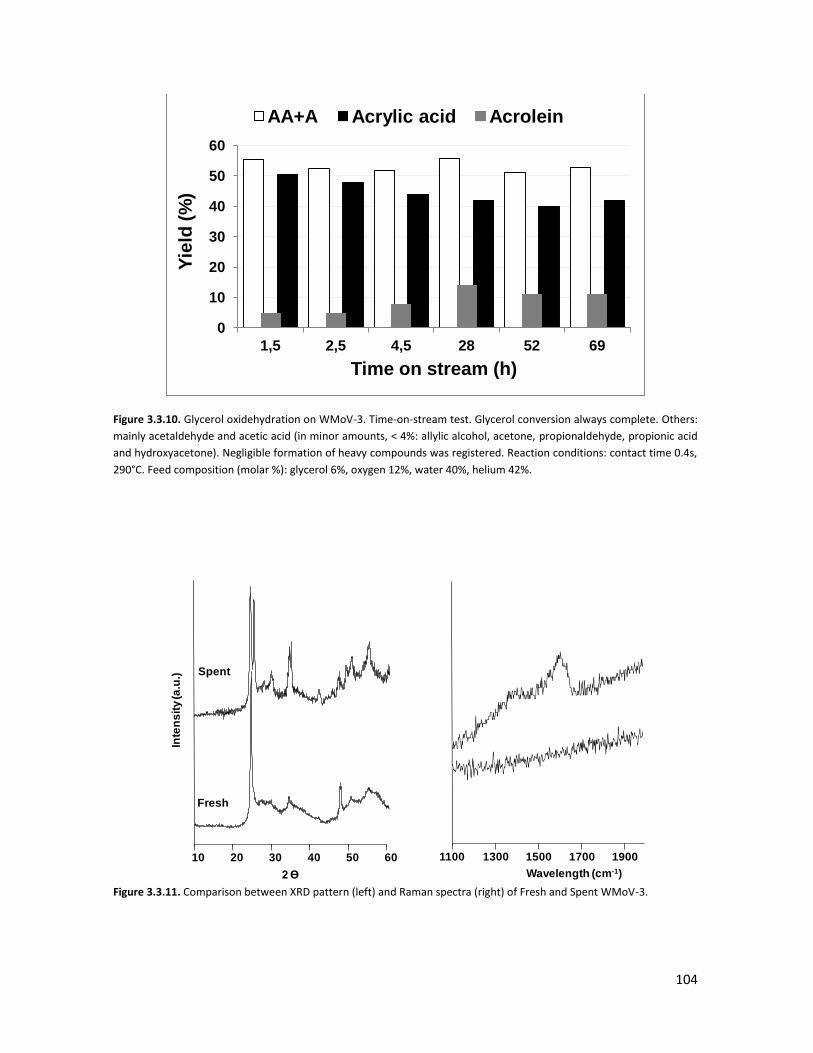
104
Figure 3.3.10. Glycerol oxidehydration on WMoV-3. Time-on-stream test. Glycerol conversion always complete. Others:
mainly acetaldehyde and acetic acid (in minor amounts, < 4%: allylic alcohol, acetone, propionaldehyde, propionic acid
and hydroxyacetone). Negligible formation of heavy compounds was registered. Reaction conditions: contact time 0.4s,
290°C. Feed composition (molar %): glycerol 6%, oxygen 12%, water 40%, helium 42%.
Figure 3.3.11. Comparison between XRD pattern (left) and Raman spectra (right) of Fresh and Spent WMoV-3.
0
10
20
30
40
50
60
1,5 2,5 4,5 28 52 69
Yie
ld (
%)
Time on stream (h)
AA+A Acrylic acid Acrolein
10 20 30 40 50 60
Fresh
Spent
Inte
ns
ity
(a.u
.)
2 Ɵ
1100 1500 1700 19001300
Wavelength (cm-1)
105
3.3.3 Conclusions
The physical-chemical properties and the catalytic performance of W-Mo-(V) oxides make it clear
the main role of each element in the oxide frame: tungsten dehydrates glycerol to acrolein,
vanadium oxidizes acrolein into acrylic acid and molybdenum moderates the strong oxidizing
properties of vanadium. The atomic ratio of the elements is pivotal for tuning redox and acid
properties, but it also plays a role both in the size of the crystals and their long-range distribution,
finally influencing the catalysts' productivity. High oxygen feed molar ratios help the catalyst re-
oxidation step and allowed obtaining acrylic acid yield as high as 51% on the WMoV-3 catalyst.
Acrolein oxidation tests evidence that direct oxidation of glycerol and acrolein also take place.
Time on stream test (ca. 70h) on WMoV-3 reveals a stable overall yield for acrolein and acrylic
acid. Under reaction conditions, evolution of the crystal phase leads to a slight inversion in the
yields of the two consecutive products along the first 5h ToS. However, a stable catalytic behavior
was observed for more than 40 hours ToS.
106
3.4 The importance of acid-redox properties and structure-reactivity
correlations in one-pot glycerol oxidehydration
Revising the results reported in the previous chapters as well as the ones present in the literature,
there is some important lack of information about various insights concerning glycerol
oxidehydration at the molecular level. Considerable attention has been focused in finding the best
performing catalysts for glycerol oxidehydration to acrylic acid, but the more intimate aspects of
the reaction have not been studied into details.
First of all, the studies carried out on the various mixed-oxides discussed previously, have clearly
highlighted that both acid and redox properties have to be carefully tuned in order to keep an
optimal control on the glycerol oxidehydration reaction. Moreover, it was demonstrated that the
same acid sites needed to dehydrate glycerol into acrolein can also catalyze undesired secondary
reactions which lead to numerous by-products such as ketals and oligomers. However, so far it
has not been reported any systematic study which aims to understand if it is possible to both
efficiently dehydrate glycerol into acrolein and also hamper the by-products formation. For
instance, a selective poisoning of the strongest acid sites could depress the formation of by-
products while the medium-to-strong acid sites could be preserved to dehydrate glycerol into
acrolein. With this idea in mind, a systematic study was carried out by poisoning the acid sites of a
vanadium-substituted HTB (WV-3) with potassium. The different preparation methods used as
well as reactivity tests and physicochemical characterizations not only shed light on the influence
of acid and redox properties on by-products formation but also provide some interesting insights
on the structural nature of the substituted-HTBs.
Additionally, revising the literature it can be evinced that some peculiar phenomenon must be
behind the different results obtained for the glycerol one-pot oxidehydration on multifunctional
catalysts. Mixed-oxides with selective acid properties for the dehydration of the polyol to
107
acrolein, showed substantially different selectivity to acrylic acid despite the same redox element,
i.e. vanadium, was present. This was the case of vanadium-substituted HTBs, vanadium-
containing zeolites [61] and Vanadium-Phosphorus-Oxides (VPOs) [78]. Indeed, looking at these
results, catalysts related to the Perovskites family seems to be the only mixed-oxides capable of
efficiently carrying out the whole glycerol oxidehydration to acrylic acid, with selectivities greater
than 50% at total glycerol conversion. The other systems showed significantly lower selectivities:
(i) maximum AA selectivity for V-BEA, 25% at 75% glycerol conversion and (ii) maximum AA
selectivity for VPO, 8% at total glycerol conversion. So as to better examine these peculiar results,
selected mixed oxides where used as reference materials: (i) W-V-oxides with HTB structure, (ii) V-
containing Al-P-(Co)-oxides, (iii) commercial Vanadyl Pyrophosphate -VPP- (DuPont, calcined
[119]) and (iv) a V-exchanged hexagonal-tungsten oxide. The results obtained clearly highlight
that an important structure-reactivity correlation exists and governs the redox features of
vanadium along the oxidation step.
3.4.1 Physicochemical properties of the oxides
WV-3 and WV-2 catalysts were described in the previous chapters and in [1], but they are also
reported in this chapter as reference materials; for an easier comparison, the main features of
these catalyst are also discussed in table 3.4.1 and in the following figures. Generally speaking, all
the K-containing catalysts present a lower BET area than WV-3, which indicates that K-ions block
the channels running along the c-direction of HTBs and/or form additional species on the catalyst
surface that have low specific surface area. The VPP catalyst used is an industrial sample
commercialized by DuPont, whose properties were extensively studied and reported in literature
[119, 120]; particularly, we used the calcined oxide. This sample is made by micrometric spheres
with a core of VPP-phase (ca. 150μm) and surrounded by a layer of porous silica (ca. 2μm) to
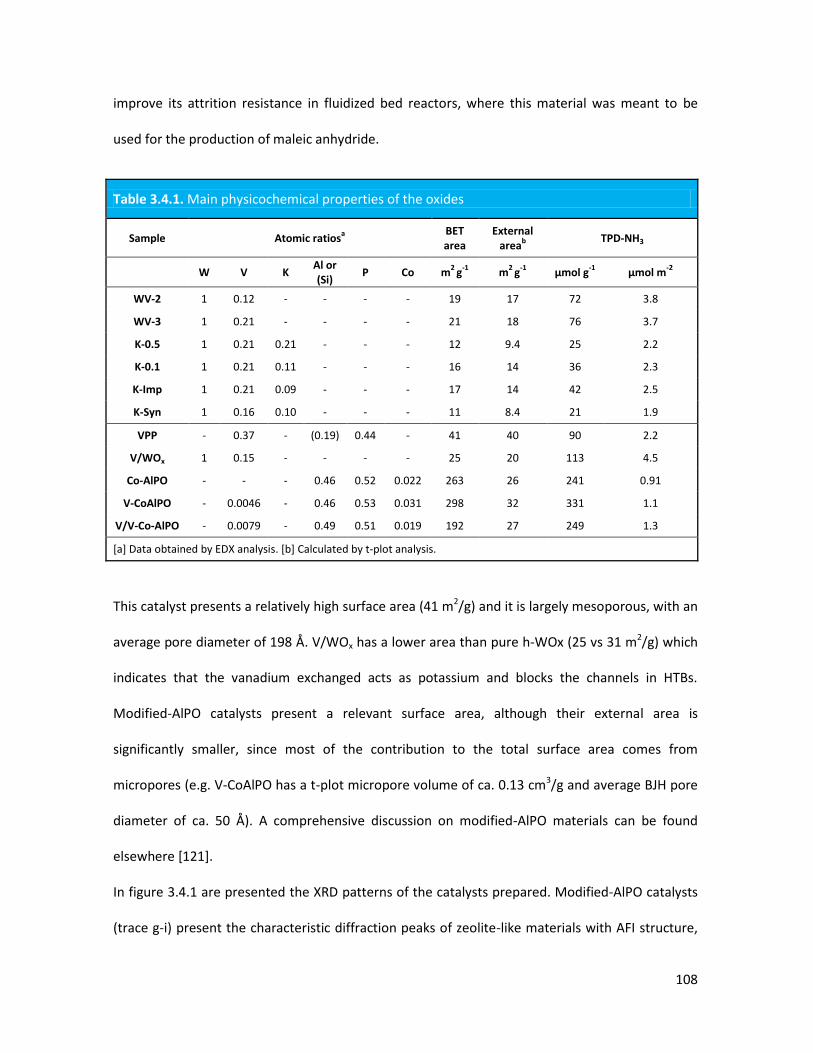
108
improve its attrition resistance in fluidized bed reactors, where this material was meant to be
used for the production of maleic anhydride.
Table 3.4.1. Main physicochemical properties of the oxides
Sample Atomic ratiosa
BET area
External area
b
TPD-NH3
W V K Al or (Si)
P Co m2
g-1
m2
g-1
μmol g-1
μmol m-2
WV-2 1 0.12 - - - - 19 17 72 3.8
WV-3 1 0.21 - - - - 21 18 76 3.7
K-0.5 1 0.21 0.21 - - - 12 9.4 25 2.2
K-0.1 1 0.21 0.11 - - - 16 14 36 2.3
K-Imp 1 0.21 0.09 - - - 17 14 42 2.5
K-Syn 1 0.16 0.10 - - - 11 8.4 21 1.9
VPP - 0.37 - (0.19) 0.44 - 41 40 90 2.2
V/WOx 1 0.15 - - - - 25 20 113 4.5
Co-AlPO - - - 0.46 0.52 0.022 263 26 241 0.91
V-CoAlPO - 0.0046 - 0.46 0.53 0.031 298 32 331 1.1
V/V-Co-AlPO - 0.0079 - 0.49 0.51 0.019 192 27 249 1.3
[a] Data obtained by EDX analysis. [b] Calculated by t-plot analysis.
This catalyst presents a relatively high surface area (41 m2/g) and it is largely mesoporous, with an
average pore diameter of 198 Å. V/WOx has a lower area than pure h-WOx (25 vs 31 m2/g) which
indicates that the vanadium exchanged acts as potassium and blocks the channels in HTBs.
Modified-AlPO catalysts present a relevant surface area, although their external area is
significantly smaller, since most of the contribution to the total surface area comes from
micropores (e.g. V-CoAlPO has a t-plot micropore volume of ca. 0.13 cm3/g and average BJH pore
diameter of ca. 50 Å). A comprehensive discussion on modified-AlPO materials can be found
elsewhere [121].
In figure 3.4.1 are presented the XRD patterns of the catalysts prepared. Modified-AlPO catalysts
(trace g-i) present the characteristic diffraction peaks of zeolite-like materials with AFI structure,
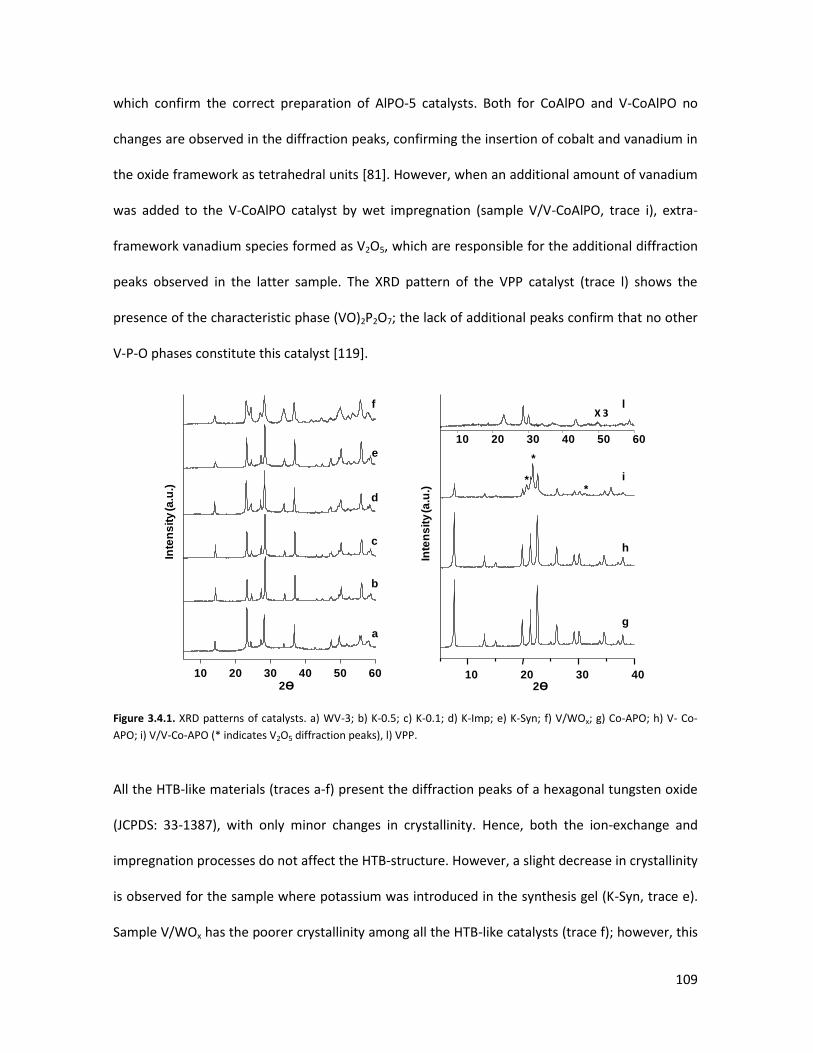
109
which confirm the correct preparation of AlPO-5 catalysts. Both for CoAlPO and V-CoAlPO no
changes are observed in the diffraction peaks, confirming the insertion of cobalt and vanadium in
the oxide framework as tetrahedral units [81]. However, when an additional amount of vanadium
was added to the V-CoAlPO catalyst by wet impregnation (sample V/V-CoAlPO, trace i), extra-
framework vanadium species formed as V2O5, which are responsible for the additional diffraction
peaks observed in the latter sample. The XRD pattern of the VPP catalyst (trace l) shows the
presence of the characteristic phase (VO)2P2O7; the lack of additional peaks confirm that no other
V-P-O phases constitute this catalyst [119].
Figure 3.4.1. XRD patterns of catalysts. a) WV-3; b) K-0.5; c) K-0.1; d) K-Imp; e) K-Syn; f) V/WOx; g) Co-APO; h) V- Co-
APO; i) V/V-Co-APO (* indicates V2O5 diffraction peaks), l) VPP.
All the HTB-like materials (traces a-f) present the diffraction peaks of a hexagonal tungsten oxide
(JCPDS: 33-1387), with only minor changes in crystallinity. Hence, both the ion-exchange and
impregnation processes do not affect the HTB-structure. However, a slight decrease in crystallinity
is observed for the sample where potassium was introduced in the synthesis gel (K-Syn, trace e).
Sample V/WOx has the poorer crystallinity among all the HTB-like catalysts (trace f); however, this
10 20 30 40 50 602Ɵ
a
b
c
d
e
f
Inte
ns
ity
(a.u
.)
10 20 30 402Ɵ
g
h
i*
*
*
l
Inte
ns
ity
(a.u
.)
10 20 30 40 50 60
X 3
110
oxide was heat-treated at 450°C, whereas the other ones up to 600°C. When V/WOx was treated
at temperatures above 450°C, the HTB structure decomposed into a monoclinic-W-V-O. The same
behavior was observed for pure hexagonal tungsten oxide (indicated as WV-0 in [1]) since above
450°C it decomposed into m-WO3. Hence, this is a remarkable evidence that V-ions introduced by
ion-exchange do not enter the hexagonal framework, but rather stay either in the channels or on
the surface of the material; the latter option should play a minor role since the catalyst was
washed with abundant distilled water after the ion-exchange procedure.
As far as catalysts prepared by ion-exchange with potassium are concerned, the V/W ratio is
preserved if compared to WV-3, which allows discarding leaching phenomena during the
preparation, as it was also visible from the color of filtered mother liquors, i.e. colorless. The
increased concentration of KHCO3 in the solution used to carry out the exchange process -see
chapter 2.1.2-, increased the quantity of potassium in the catalyst (see K-0.1 vs. K-0.5). However,
the theoretical atomic ratio K/W=0.3 [63] was never obtained, most likely due to ion-diffusion
problems in the needle-like crystals that characterize ammonium-HTBs, as illustrated in figure
3.4.2 for WV-3.
In figure 3.4.3 and table 3.4.1 are reported the results obtained by ammonia-TPD experiments.
TPD-MS analysis are currently in preparation for the VPP catalyst; however the total acidity value
reported in table 3.4.1 highlights that VPP has relevant acid properties as also reported in the
literature by other authors [78]. Potassium-containing catalysts (traces a-d in figure 3.4.3)
compared to WV-3 sample (trace e) present lower acidity. From desorption profiles it is also
possible to visualize that the strongest acid sites (ammonia desorption range 250-450°C) are the
most affected by the introduction of potassium. Therefore, it is confirmed that the addition of
potassium can selectively poison the strongest acid sites. Instead, V/WOx maintains a significant
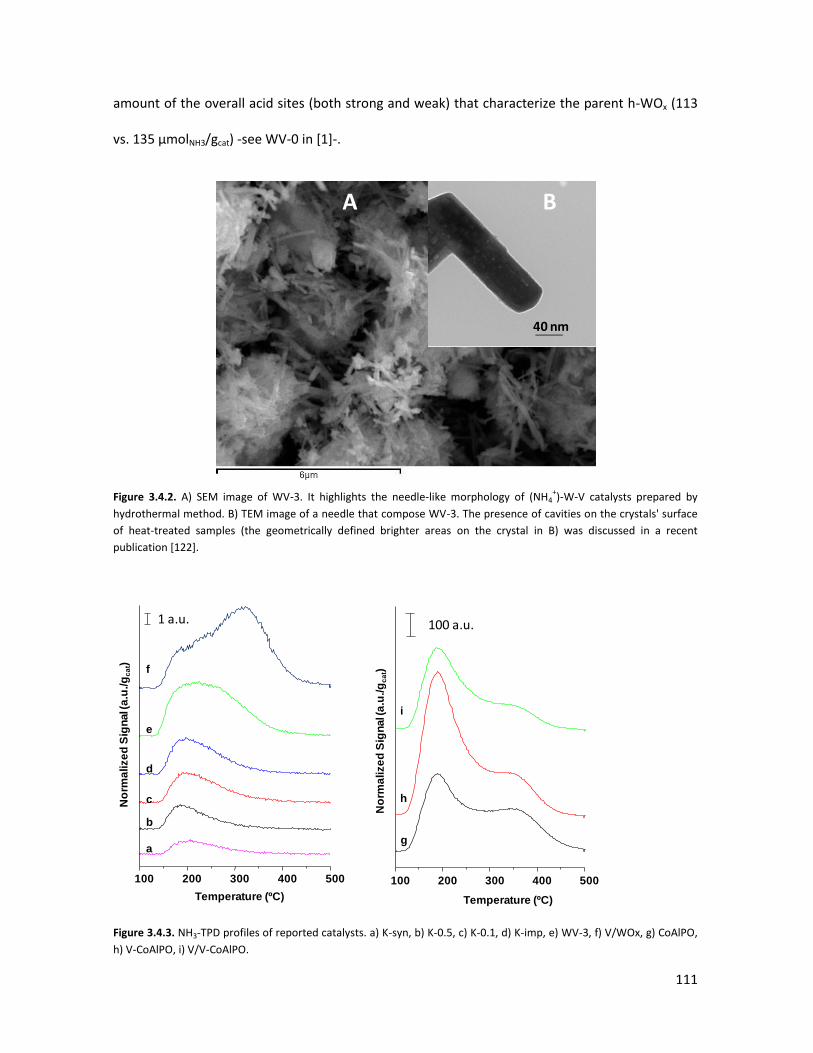
111
amount of the overall acid sites (both strong and weak) that characterize the parent h-WOx (113
vs. 135 μmolNH3/gcat) -see WV-0 in [1]-.
Figure 3.4.2. A) SEM image of WV-3. It highlights the needle-like morphology of (NH4+)-W-V catalysts prepared by
hydrothermal method. B) TEM image of a needle that compose WV-3. The presence of cavities on the crystals' surface
of heat-treated samples (the geometrically defined brighter areas on the crystal in B) was discussed in a recent
publication [122].
Figure 3.4.3. NH3-TPD profiles of reported catalysts. a) K-syn, b) K-0.5, c) K-0.1, d) K-imp, e) WV-3, f) V/WOx, g) CoAlPO,
h) V-CoAlPO, i) V/V-CoAlPO.
A B
40 nm
100 a.u.
100 200 300 400 500
No
rma
lize
d S
ign
al (
a.u
./g
ca
t)
Temperature (ºC)
g
h
i
100 200 300 400 500
No
rma
lize
d S
ign
al (
a.u
./g
ca
t)
Temperature (ºC)
a
b
c
d
e
f
1 a.u.
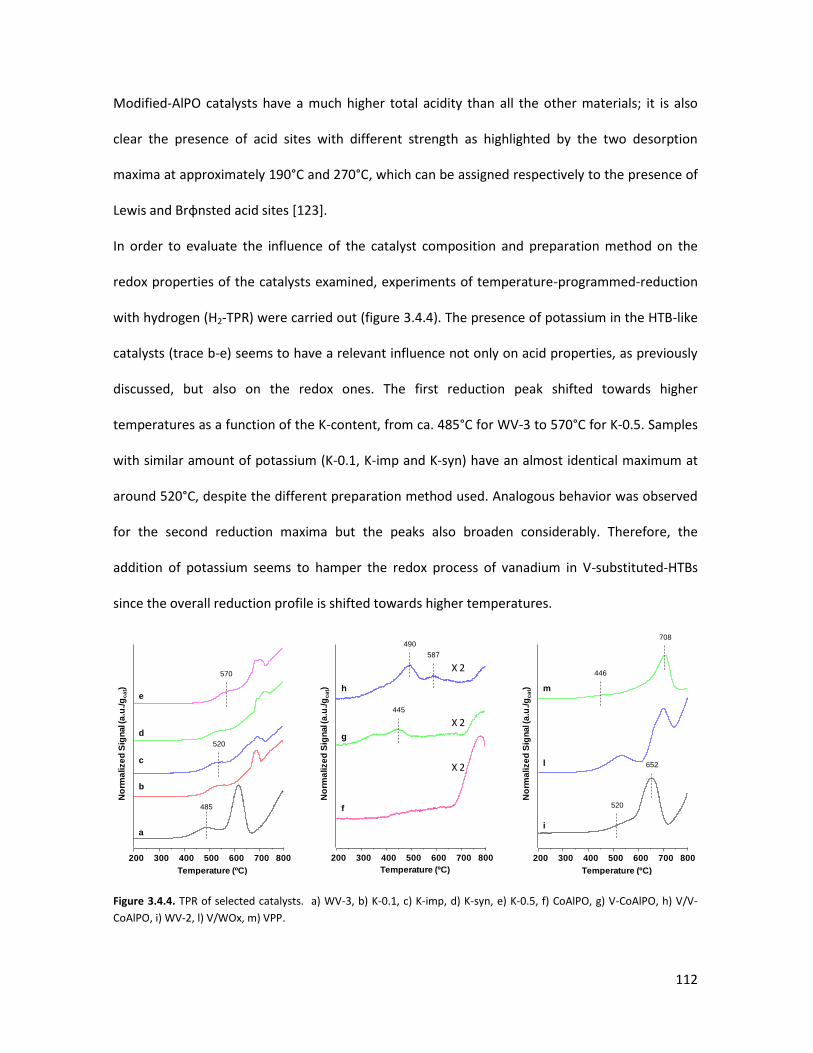
112
Modified-AlPO catalysts have a much higher total acidity than all the other materials; it is also
clear the presence of acid sites with different strength as highlighted by the two desorption
maxima at approximately 190°C and 270°C, which can be assigned respectively to the presence of
Lewis and Brɸnsted acid sites [123].
In order to evaluate the influence of the catalyst composition and preparation method on the
redox properties of the catalysts examined, experiments of temperature-programmed-reduction
with hydrogen (H2-TPR) were carried out (figure 3.4.4). The presence of potassium in the HTB-like
catalysts (trace b-e) seems to have a relevant influence not only on acid properties, as previously
discussed, but also on the redox ones. The first reduction peak shifted towards higher
temperatures as a function of the K-content, from ca. 485°C for WV-3 to 570°C for K-0.5. Samples
with similar amount of potassium (K-0.1, K-imp and K-syn) have an almost identical maximum at
around 520°C, despite the different preparation method used. Analogous behavior was observed
for the second reduction maxima but the peaks also broaden considerably. Therefore, the
addition of potassium seems to hamper the redox process of vanadium in V-substituted-HTBs
since the overall reduction profile is shifted towards higher temperatures.
Figure 3.4.4. TPR of selected catalysts. a) WV-3, b) K-0.1, c) K-imp, d) K-syn, e) K-0.5, f) CoAlPO, g) V-CoAlPO, h) V/V-
CoAlPO, i) WV-2, l) V/WOx, m) VPP.
Temperature (ºC)
No
rma
lize
d S
ign
al (
a.u
./g
ca
t)
a
b
c
d
e
200 300 400 500 600 700 800
No
rma
lize
d S
ign
al (
a.u
./g
ca
t)
Temperature (ºC)
200 300 400 500 600 700 800
X 2
X 2
X 2
f
g
h
Temperature (ºC)
No
rma
lize
d S
ign
al (
a.u
./g
ca
t)
i
l
m
200 300 400 500 600 700 800
570
485
520
445
490
587
446
708
652
520
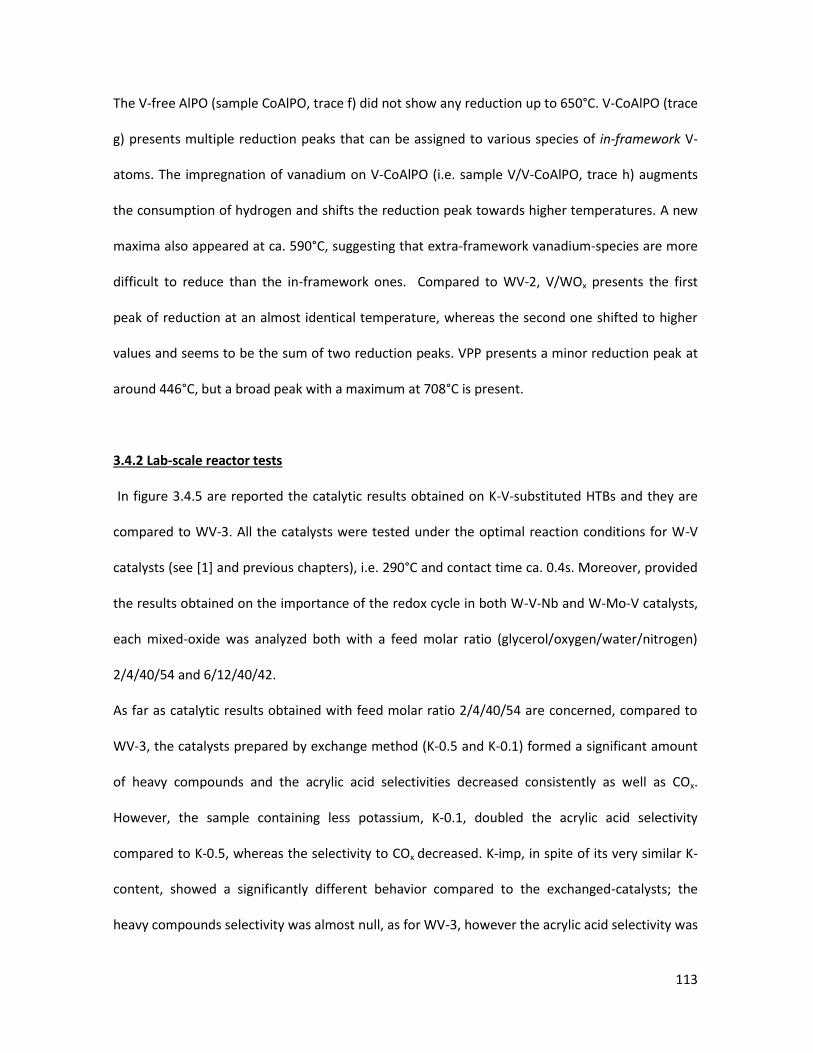
113
The V-free AlPO (sample CoAlPO, trace f) did not show any reduction up to 650°C. V-CoAlPO (trace
g) presents multiple reduction peaks that can be assigned to various species of in-framework V-
atoms. The impregnation of vanadium on V-CoAlPO (i.e. sample V/V-CoAlPO, trace h) augments
the consumption of hydrogen and shifts the reduction peak towards higher temperatures. A new
maxima also appeared at ca. 590°C, suggesting that extra-framework vanadium-species are more
difficult to reduce than the in-framework ones. Compared to WV-2, V/WOx presents the first
peak of reduction at an almost identical temperature, whereas the second one shifted to higher
values and seems to be the sum of two reduction peaks. VPP presents a minor reduction peak at
around 446°C, but a broad peak with a maximum at 708°C is present.
3.4.2 Lab-scale reactor tests
In figure 3.4.5 are reported the catalytic results obtained on K-V-substituted HTBs and they are
compared to WV-3. All the catalysts were tested under the optimal reaction conditions for W-V
catalysts (see [1] and previous chapters), i.e. 290°C and contact time ca. 0.4s. Moreover, provided
the results obtained on the importance of the redox cycle in both W-V-Nb and W-Mo-V catalysts,
each mixed-oxide was analyzed both with a feed molar ratio (glycerol/oxygen/water/nitrogen)
2/4/40/54 and 6/12/40/42.
As far as catalytic results obtained with feed molar ratio 2/4/40/54 are concerned, compared to
WV-3, the catalysts prepared by exchange method (K-0.5 and K-0.1) formed a significant amount
of heavy compounds and the acrylic acid selectivities decreased consistently as well as COx.
However, the sample containing less potassium, K-0.1, doubled the acrylic acid selectivity
compared to K-0.5, whereas the selectivity to COx decreased. K-imp, in spite of its very similar K-
content, showed a significantly different behavior compared to the exchanged-catalysts; the
heavy compounds selectivity was almost null, as for WV-3, however the acrylic acid selectivity was
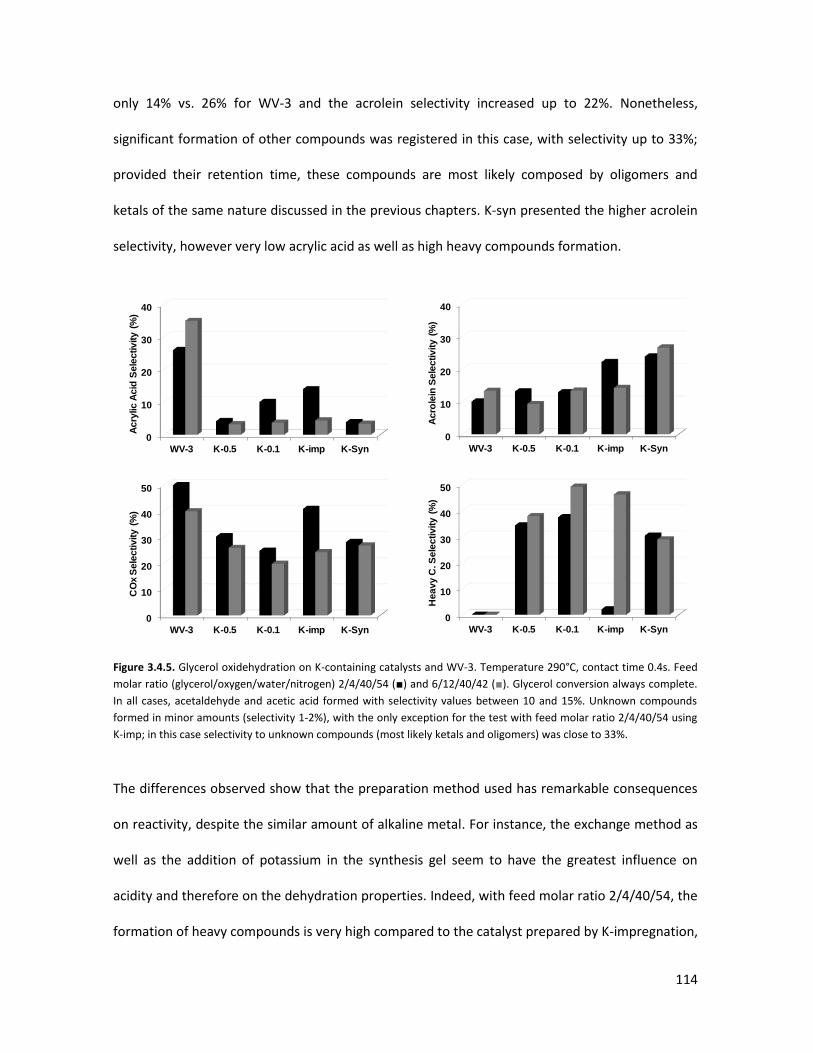
114
only 14% vs. 26% for WV-3 and the acrolein selectivity increased up to 22%. Nonetheless,
significant formation of other compounds was registered in this case, with selectivity up to 33%;
provided their retention time, these compounds are most likely composed by oligomers and
ketals of the same nature discussed in the previous chapters. K-syn presented the higher acrolein
selectivity, however very low acrylic acid as well as high heavy compounds formation.
Figure 3.4.5. Glycerol oxidehydration on K-containing catalysts and WV-3. Temperature 290°C, contact time 0.4s. Feed
molar ratio (glycerol/oxygen/water/nitrogen) 2/4/40/54 (■) and 6/12/40/42 (■). Glycerol conversion always complete.
In all cases, acetaldehyde and acetic acid formed with selectivity values between 10 and 15%. Unknown compounds
formed in minor amounts (selectivity 1-2%), with the only exception for the test with feed molar ratio 2/4/40/54 using
K-imp; in this case selectivity to unknown compounds (most likely ketals and oligomers) was close to 33%.
The differences observed show that the preparation method used has remarkable consequences
on reactivity, despite the similar amount of alkaline metal. For instance, the exchange method as
well as the addition of potassium in the synthesis gel seem to have the greatest influence on
acidity and therefore on the dehydration properties. Indeed, with feed molar ratio 2/4/40/54, the
formation of heavy compounds is very high compared to the catalyst prepared by K-impregnation,
0
10
20
30
40
WV-3 K-0.5 K-0.1 K-imp K-Syn
Acry
lic A
cid
Sele
ctivity (
%)
0
10
20
30
40
WV-3 K-0.5 K-0.1 K-imp K-Syn
Acro
lein
Sele
ctivity (
%)
0
10
20
30
40
50
WV-3 K-0.5 K-0.1 K-imp K-Syn
CO
x S
ele
ctivity (
%)
0
10
20
30
40
50
WV-3 K-0.5 K-0.1 K-imp K-Syn
Heavy C
. S
ele
ctivity (
%)
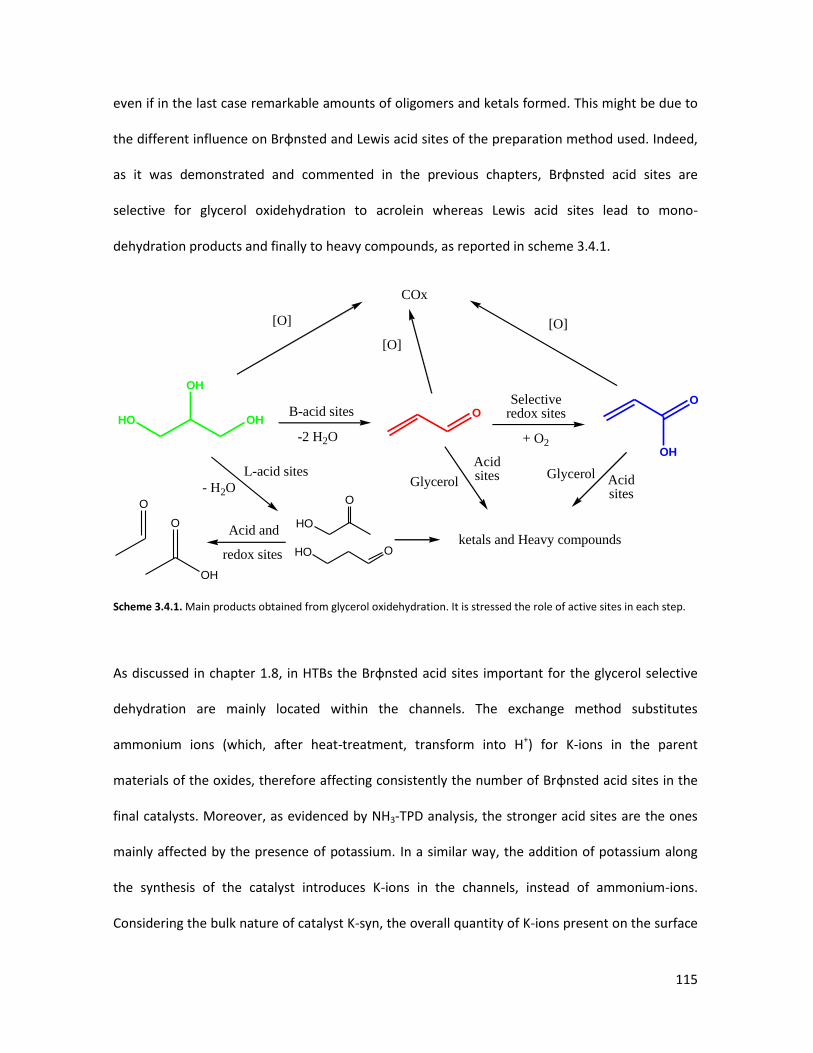
115
even if in the last case remarkable amounts of oligomers and ketals formed. This might be due to
the different influence on Brɸnsted and Lewis acid sites of the preparation method used. Indeed,
as it was demonstrated and commented in the previous chapters, Brɸnsted acid sites are
selective for glycerol oxidehydration to acrolein whereas Lewis acid sites lead to mono-
dehydration products and finally to heavy compounds, as reported in scheme 3.4.1.
Scheme 3.4.1. Main products obtained from glycerol oxidehydration. It is stressed the role of active sites in each step.
As discussed in chapter 1.8, in HTBs the Brɸnsted acid sites important for the glycerol selective
dehydration are mainly located within the channels. The exchange method substitutes
ammonium ions (which, after heat-treatment, transform into H+) for K-ions in the parent
materials of the oxides, therefore affecting consistently the number of Brɸnsted acid sites in the
final catalysts. Moreover, as evidenced by NH3-TPD analysis, the stronger acid sites are the ones
mainly affected by the presence of potassium. In a similar way, the addition of potassium along
the synthesis of the catalyst introduces K-ions in the channels, instead of ammonium-ions.
Considering the bulk nature of catalyst K-syn, the overall quantity of K-ions present on the surface
OH
HO OHOB-acid sites
Selective redox sites
+ O2
O
OH
L-acid sites
-2 H2O
O
HO
HO O
- H2O
AcidsitesGlycerol
O
O
OH
Glycerol Acidsites
ketals and Heavy compoundsAcid and
redox sites
COx
[O]
[O]
[O]
116
(hence accessible to organic molecules) should be less than the total amount found by EDX
analysis, therefore explaining the lower formation of heavy compounds and the higher acrolein
formation for K-syn than K-0.1. Instead, with the impregnation method potassium is dispersed
randomly on the surface and it affects statistically both Lewis and Brɸnsted sites, explaining the
much higher acrolein selectivity and the low formation of heavy compounds. So as to further
support the results just presented, XP-spectroscopy and FTIR analysis with adsorbed ammonia are
currently being carried out for all the catalysts presented in this chapter. These investigations can
provide important insights on the relative distribution of potassium in the catalysts as well as
semi-quantitative figures on the ratio between Brɸnsted and Lewis acid sites. Additionally, from
figure 3.4.4 it is evident that the presence of potassium not only affects the acid properties but
also the redox ones. Acrylic acid and COx selectivities are lower for all the K-containing catalysts
compared to WV-3. The impregnation method also affects less the redox properties compared to
the exchange preparation. Finally, the low selectivity to acrylic acid of K-syn, can be partially
attributed to the lower content of vanadium (0.16 vs. 0.21); however, it cannot be the only
explanation since WV-2 that has V/W ratio equal to 0.12, showed acrylic acid yield up to 18% (vs.
4% for K-syn) [1]. Overall, comparing these results to H2-TPR analysis, some important differences
can be pointed out; catalysts containing significantly different amounts of potassium (i.e. K/W=0,
0.1 or 0.21) presented different reduction profiles. However, when the amount of potassium was
similar (catalysts K-0.1, K-Imp and K-Syn), the H2-TPR profiles where quite similar, particularly for
the first reduction peak. The differences between TPR and catalytic tests suggest that H2-TPR
analysis might not be completely representative of the redox property of vanadium in this
systems; the catalytic phenomenon involves only the oxides surface accessible to the organic
molecules involved, whereas H2-reduction can affect the whole bulk of the catalyst and/or also
the active sites not accessible to larger molecules. However, a univocal rationalization of the
117
reasons why the redox properties are so remarkably affected by potassium is not so
straightforward. The heavy compounds formation (due to the lower acid properties) in such high
amounts is a possible explanation since the deposition of carbonaceous material on the catalysts
surface also lowers the availability of the redox sites. Similarly, the decreased surface area due to
the presence of potassium (see table 3.4.1) leads to the same phenomenon. Potassium might also
directly interact with V-ions because of acid-base affinity, finally poisoning the redox sites.
Remarkable changes in the catalytic performance were observed when the feed molar ratio was
varied from 2/4/40/54 to 6/12/40/42 (glycerol/oxygen/water/nitrogen) -see figure 3.4.5-. Indeed,
as observed for the other substituted-HTBs previously studied, WV-3 improved its catalytic
performance and acrylic acid selectivity up to 35% where reached (further tests and comments on
this mixed-oxide are reported below); however, none of the potassium-containing catalysts
showed this behavior, actually displaying a reverse trend for acrylic acid selectivity. Carbon oxides
also decreased and heavy compounds augmented, particularly for K-imp. In this case, the
oligomers and ketals that formed at lower partial pressures of reactants, might be seen as the
"precursors" of the heavy compounds (not eluted in the GC system, but left as residues on both
reactor walls and catalyst surface) that form in the latter case. These evidences clearly show that
redox sites are poisoned by potassium, making slower their redox cycle and the consecutive
oxidation processes, finally enhancing the by-products formation and polymerizations. The
remarkable change observed for K-imp also indicates that, although the impregnation process
affects less the catalyst, at higher partial pressures of reactants the decreased availability of active
sites becomes more evident.
In order to extend the various conclusions drawn in this thesis on HTB-like systems to other
multifunctional catalysts, modified-AlPO catalysts and commercial VPP were used as reference
118
mixed-oxides. These materials are well known catalysts used in selective oxidation processes,
such as cyclohexane oxidation, ethane-ODH and maleic anhydride synthesis [81, 124, 125].
In figure 3.4.6 are reported the catalytic results obtained on the multifunctional catalysts
analyzed. As an explorative test, the contact time optimal for WV-3 (ca. 0.4s) was used also for
the other oxides. Preliminary studies were also carried out -not reported in figure- using the
CoAlPO catalyst (without vanadium); in spite of the acid properties of this material, glycerol
conversion was complete only at temperature 360°C and no acrylic acid was formed. Moreover,
significant amounts of heavy compounds were formed (selectivity between 50% and 40%).
However, the addition of vanadium consistently improves the activity of the catalyst since in all
cases and for all temperatures, glycerol conversion was always complete both for V-CoAlPO and
V/V-CoAlPO. VPP showed always a complete conversion of glycerol, too. WV-3, as most of the
previously reported substituted-HTBs, displayed the highest acrylic acid yield at low temperature,
which decreased steeply rising the temperature, in favor of carbon oxides. Differently, V-CoAlPO
showed an acrylic acid maximum at 330°C; at higher temperatures, heavy compounds selectivity
decreased not only in favor of COx, but also to acrolein in minor extent.
In an attempt to improve the acrylic acid selectivity of V-CoAlPO, catalyst V/V-CoAlPO was
prepared by impregnation of the latter with additional vanadium -1wt%-. Contrary to the
vanadium present in V-CoAlPO, which is part of the Al-P-(Co)-O lattice, the vanadium impregnated
forms extra-framework species as V2O5 (see discussion for XRD analysis). Taking into consideration
the products distribution obtained on V/V-CoAlPO, the extra-framework vanadium species seem
to (i) block the active in-framework-V-sites, (ii) enhance total oxidation to carbon oxides and (iii)
be completely inactive towards the selective oxidation of acrolein to acrylic acid. It is of interest to
compare our results to the ones obtained by Pestana et al. using vanadium-impregnated zeolite-
beta [61]. Indeed, although extra-framework vanadium species were also present in the latter
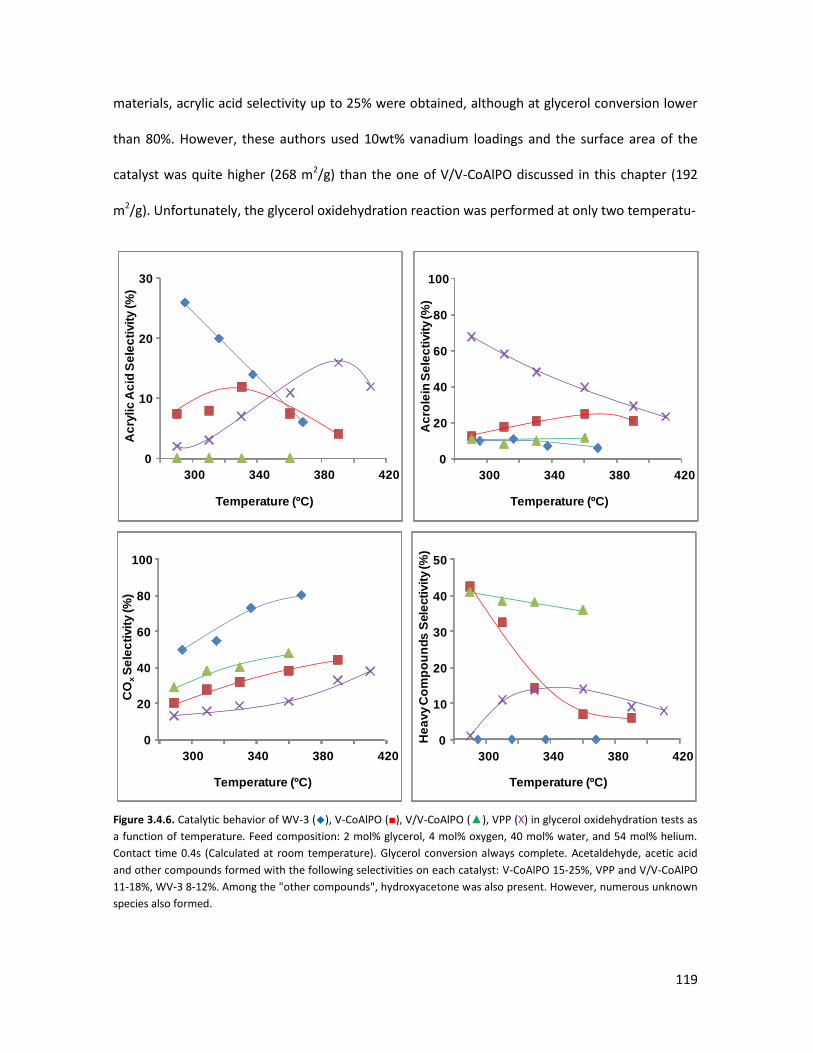
119
materials, acrylic acid selectivity up to 25% were obtained, although at glycerol conversion lower
than 80%. However, these authors used 10wt% vanadium loadings and the surface area of the
catalyst was quite higher (268 m2/g) than the one of V/V-CoAlPO discussed in this chapter (192
m2/g). Unfortunately, the glycerol oxidehydration reaction was performed at only two temperatu-
Figure 3.4.6. Catalytic behavior of WV-3 (◆), V-CoAlPO (■), V/V-CoAlPO (▲), VPP (X) in glycerol oxidehydration tests as
a function of temperature. Feed composition: 2 mol% glycerol, 4 mol% oxygen, 40 mol% water, and 54 mol% helium.
Contact time 0.4s (Calculated at room temperature). Glycerol conversion always complete. Acetaldehyde, acetic acid
and other compounds formed with the following selectivities on each catalyst: V-CoAlPO 15-25%, VPP and V/V-CoAlPO
11-18%, WV-3 8-12%. Among the "other compounds", hydroxyacetone was also present. However, numerous unknown
species also formed.
0
10
20
30
300 340 380 420
Ac
rylic
Ac
id S
ele
cti
vit
y (%
)
Temperature (ºC)
0
20
40
60
80
100
300 340 380 420
Ac
role
in S
ele
cti
vit
y (%
)
Temperature (ºC)
100
0
20
40
60
80
300 340 380 420
CO
xS
ele
cti
vit
y (%
)
Temperature (ºC)
He
avy C
om
po
un
ds S
ele
cti
vit
y (%
)
Temperature (ºC)
0
10
20
30
40
50
300 340 380 420
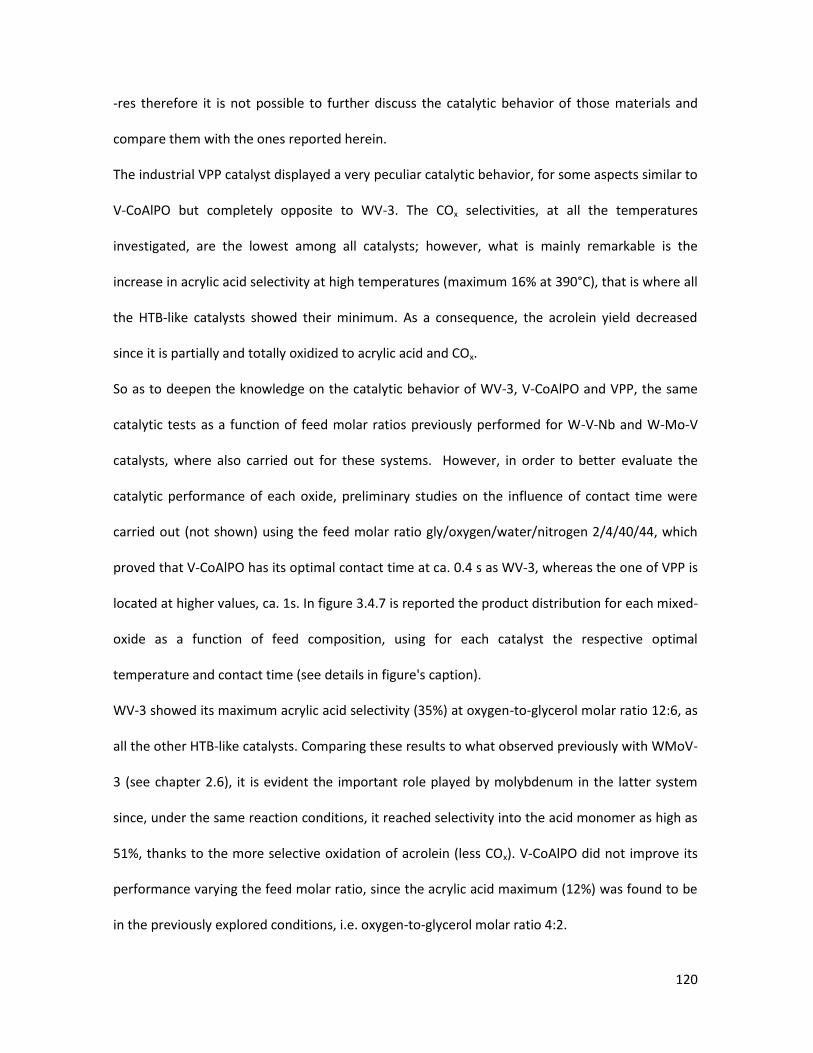
120
-res therefore it is not possible to further discuss the catalytic behavior of those materials and
compare them with the ones reported herein.
The industrial VPP catalyst displayed a very peculiar catalytic behavior, for some aspects similar to
V-CoAlPO but completely opposite to WV-3. The COx selectivities, at all the temperatures
investigated, are the lowest among all catalysts; however, what is mainly remarkable is the
increase in acrylic acid selectivity at high temperatures (maximum 16% at 390°C), that is where all
the HTB-like catalysts showed their minimum. As a consequence, the acrolein yield decreased
since it is partially and totally oxidized to acrylic acid and COx.
So as to deepen the knowledge on the catalytic behavior of WV-3, V-CoAlPO and VPP, the same
catalytic tests as a function of feed molar ratios previously performed for W-V-Nb and W-Mo-V
catalysts, where also carried out for these systems. However, in order to better evaluate the
catalytic performance of each oxide, preliminary studies on the influence of contact time were
carried out (not shown) using the feed molar ratio gly/oxygen/water/nitrogen 2/4/40/44, which
proved that V-CoAlPO has its optimal contact time at ca. 0.4 s as WV-3, whereas the one of VPP is
located at higher values, ca. 1s. In figure 3.4.7 is reported the product distribution for each mixed-
oxide as a function of feed composition, using for each catalyst the respective optimal
temperature and contact time (see details in figure's caption).
WV-3 showed its maximum acrylic acid selectivity (35%) at oxygen-to-glycerol molar ratio 12:6, as
all the other HTB-like catalysts. Comparing these results to what observed previously with WMoV-
3 (see chapter 2.6), it is evident the important role played by molybdenum in the latter system
since, under the same reaction conditions, it reached selectivity into the acid monomer as high as
51%, thanks to the more selective oxidation of acrolein (less COx). V-CoAlPO did not improve its
performance varying the feed molar ratio, since the acrylic acid maximum (12%) was found to be
in the previously explored conditions, i.e. oxygen-to-glycerol molar ratio 4:2.
121
Figure 3.4.7. Glycerol oxidehydration as a function of feed molar ratio on A) WV-3, B) V-CoAlPO, C) VPP. Symbols:
Acrylic Acid (■), Acrolein (▲), COx (X), Heavy compounds (ӿ). Glycerol conversion always complete. Further compounds
detected but not reported in the plot: (i) WV-3: acetic acid and acetaldehyde 2-3%, unknown compounds 2-3%. (ii) V-
CoAlPO: acetaldehyde + acrylic acid 8-17%, unknown compounds 3-7%. (iii) VPP: acetic acid ca. 10%, unknown
compounds 2%. Feed molar ratio Oxygen/Glycerol/Water/Nitrogen=4/2/40/54. Reaction conditions: WV-3: T
(temperature) 290°C, Tau (contact time) 0.4s; V-CoAlPO: T 330°C, Tau 0.4s; VPP: T 390°C, Tau 1s.
Also in this case, VPP showed the opposite behavior than HTB-like catalysts, presenting the
maximum acrylic acid selectivity (28%) at oxygen-to-glycerol molar ratio 2:1. At higher pressures
of reactants both partial and total oxidation were hampered, provoking the increment of the
intermediate product (acrolein) and finally the formation of heavy compounds.
Oxygen : Glycerol (mol/mol)
0
20
40
60
80
100
0
10
20
30
40
50
60
4/2 8/4 12/6
Gly
ce
rol C
on
ve
rsio
n (%
)
Se
lec
tivit
y (%
)
A
Oxygen : Glycerol (mol/mol)
0
20
40
60
80
100
0
10
20
30
40
50
60
2/1 4/2 8/4
Gly
ce
rol C
on
ve
rsio
n (%
)
Se
lec
tivit
y (%
)
B
Oxygen : Glycerol (mol/mol)
0
20
40
60
80
100
0
10
20
30
40
50
60
2/1 4/2 8/4
Gly
ce
rol C
on
ve
rsio
n (%
)
Se
lec
tivit
y (%
)
C
122
At this stage, it is worth mentioning that V-P-oxides have already the been subject of publication
by Ueda and co-workers as catalysts for glycerol dehydration and oxidehydration [78]. Among the
V-P-O materials prepared, these authors found that VOHPO4·0.5H2O was the best performing
phase, with acrolein yield up to 66%. Their vanadyl pyrophosphate showed acrolein selectivity up
to 41% but only traces of acrylic acid. However, whatever the V-P-O phase used, acrylic acid was
always a minor product (maximum selectivity 8% at 350°C). The different results obtained in this
work on the commercial VPP catalyst can be explained as follows: (i) the pyrophosphate catalyst
used in [78] has a significantly lower surface area 8 m2/g (vs. 41m2/g of the commercial VPP); (ii)
the reaction conditions used in [78] are not the optimal ones for VPP, since oxygen-to-glycerol
molar ratio of about 9:1 was used, that is the feed molar ratio we have demonstrated, for this
catalyst, to depress the selective oxidation of acrolein and favor its total combustion (selectivity
up to 22% in COx were obtained associated to the maximum acrylic acid selectivity observed in
[78]); (iii) most likely due to the scarce formation of acrylic acid observed on pyrophosphate
during the preliminary screening tests [78], its catalytic performance was analyzed at a single
temperature, i.e. 300°C (differently to what done for the hydrated V-P-O phase), which is too low
compared to the optimal value, i.e. 390°C; (iv) the presence of silica in the commercial-VPP
catalyst used might play a role in the catalytic result, although considering the absence of redox
properties and the scarce acid features of SiO2, it seems quite unlikely.
All in all, the remarkable difference displayed by HTB-like catalysts and VPP opens important
questions on the reasons why their catalytic behavior for glycerol oxidehydration is opposite. Both
systems are acid catalysts that can efficiently dehydrate glycerol into acrolein; however, the same
active element (vanadium) behaves in an opposite manner in the consecutive oxidation step.
Hence, so as to efficiently carry out the glycerol oxidehydration it is not enough to couple acid and
redox properties in the same catalyst, but it seems to exist a complex structure-reactivity

123
correlation that governs the more or less selective oxidation process. These results could be
explained by (i) a faster re-oxidation ability of vanadium in VPP and/or (ii) by a different
adsorption of glycerol and acrolein on the surface of the catalyst, which in turn doesn't lead to the
fast saturation of the active sites as previously observed in HTB-like catalysts. So as to shed light
on these phenomenon, FTIR studies of adsorbed acrolein are currently being carried out on the
catalysts involved in this chapter.
In an attempt to further explore the structure-reactivity correlations of multifunctional catalysts
for glycerol oxidehydration, the catalytic behavior of HTBs can be compared to an hexagonal
tungsten oxide exchanged with V-ions (catalyst V/WOx). This way, it is possible to compare the
catalytic behavior of vanadium when it either belongs to the HTB framework or it is present as
extra-framework species -see discussion for XRD (vide supra)-. Due to the lower amount of
vanadium that constitute V/WOx compared to WV-3 (V/W 0.15 vs. 0.21), it is more convenient to
compare its performance to WV-2, whose composition is W1V0.12 -see table 3.4.1-. In figure 3.4.8
are reported the results obtained on the two catalysts under the optimal reaction conditions for
WV-2, that is time factor 0.0085 g min ml-1 and 318°C. For both catalysts, glycerol conversion was
always complete.
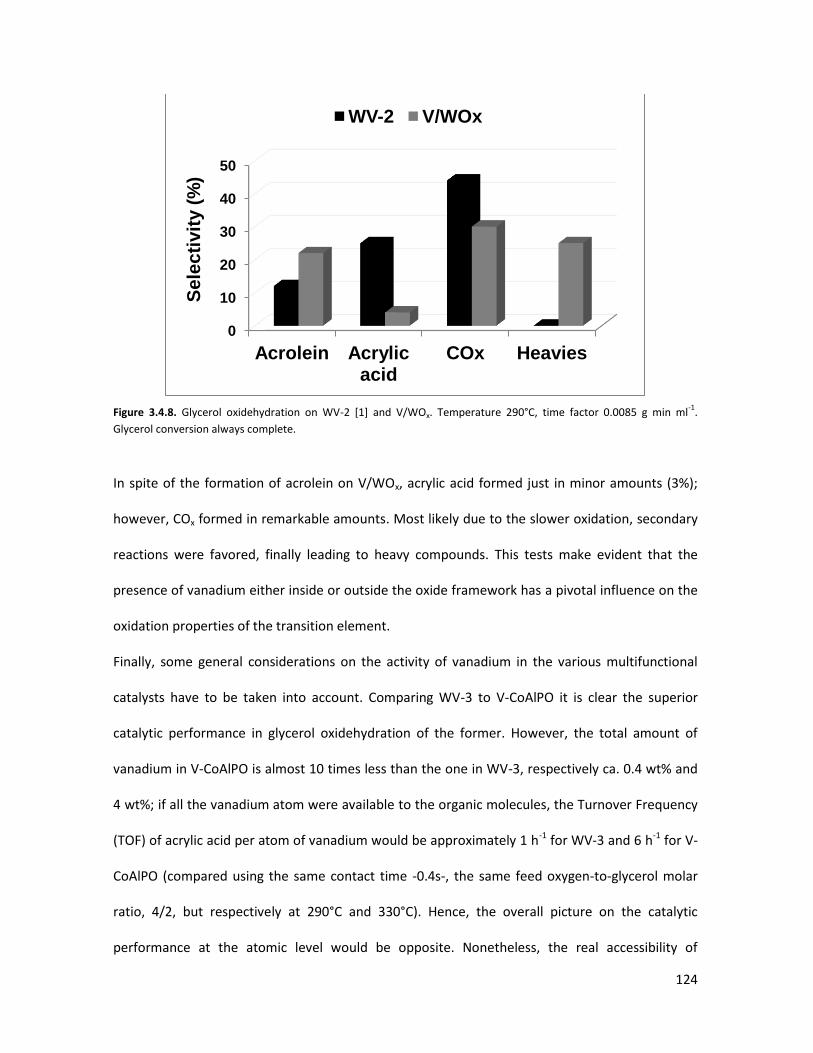
124
Figure 3.4.8. Glycerol oxidehydration on WV-2 [1] and V/WOx. Temperature 290°C, time factor 0.0085 g min ml-1
.
Glycerol conversion always complete.
In spite of the formation of acrolein on V/WOx, acrylic acid formed just in minor amounts (3%);
however, COx formed in remarkable amounts. Most likely due to the slower oxidation, secondary
reactions were favored, finally leading to heavy compounds. This tests make evident that the
presence of vanadium either inside or outside the oxide framework has a pivotal influence on the
oxidation properties of the transition element.
Finally, some general considerations on the activity of vanadium in the various multifunctional
catalysts have to be taken into account. Comparing WV-3 to V-CoAlPO it is clear the superior
catalytic performance in glycerol oxidehydration of the former. However, the total amount of
vanadium in V-CoAlPO is almost 10 times less than the one in WV-3, respectively ca. 0.4 wt% and
4 wt%; if all the vanadium atom were available to the organic molecules, the Turnover Frequency
(TOF) of acrylic acid per atom of vanadium would be approximately 1 h-1 for WV-3 and 6 h-1 for V-
CoAlPO (compared using the same contact time -0.4s-, the same feed oxygen-to-glycerol molar
ratio, 4/2, but respectively at 290°C and 330°C). Hence, the overall picture on the catalytic
performance at the atomic level would be opposite. Nonetheless, the real accessibility of
0
10
20
30
40
50
Acrolein Acrylic acid
COx Heavies
Se
lec
tivit
y (
%)
WV-2 V/WOx
125
vanadium in the two catalysts is considerably different than the total amount present, particularly
for HTBs. Indeed, it has been demonstrated that glycerol and acrolein (as well as the other by-
products) can enter the micropores of zeolites [126] and therefore also the ones of AlPO-5
materials; whereas, only the external surface area of HTBs is available for catalysis since these
mixed-oxides have neither micropores nor any other kind of porosity (see the difference between
BET and external surface area for the various catalysts reported in table 3.4.1). Concluding,
although the quantification of the number of vanadium atoms really accessible by glycerol and
acrolein might be impossible, these observations have to be taken into consideration to make a
right comparison of the catalytic performances. Analogous reflections are appropriate once
considering the mesoporosity of the industrial VPP catalyst used or the availability of vanadium in
V/WOx.
3.4.3 Conclusions
In order to perform the one-pot glycerol oxidehydration on single multifunctional catalysts, the
acid and properties of the mixed-oxide used have to be carefully tuned. In spite that strong acid
sites have been demonstrated to catalyze not only glycerol dehydration to acrolein but also heavy
compounds formation, its presence is mandatory to allow the fast double dehydration of the
polyol. If the strong acid sites are poisoned with potassium, the acrolein formation is hampered
and glycerol is only partially dehydrated; moreover, potassium also affects the redox properties of
vanadium. In the end, both phenomena lead to heavy compounds formation. Therefore, it doesn't
seem possible to avoid the by-products formation by lowering the strength of the acid sites, since
the same acid sites needed for the efficient glycerol oxidehydration are also responsible for
catalyzing polycondensation reactions to ketals and heavy compounds.
126
Glycerol oxidehydration was also perform on various multifunctional catalysts with both acid
properties and vanadium as the redox element. Specifically were used: (i) V-substituted-HTBs, (ii)
V-containing Al-P-(Co)-oxides, (iii) commercial Vanadyl Pyrophosphate -VPP- and (iv) a V-
exchanged hexagonal-tungsten oxide. The results obtained on these materials highlight that
vanadium doesn't behave in the same way in the consecutive oxidation step. For instance, VPP
behaves in an opposite manner than V-substituted-HTBs; the former displays the highest acrylic
acid yield (28%) at high temperature and low feed molar ratios of the reactant, whereas the latter
works better (35% acrylic acid selectivity) at low temperatures and high feed molar ratios.
Moreover, the vanadium redox sites located either inside or outside the oxide framework of HTBs
and modified-AlPOs show very different catalytic behavior. In-framework V-sites seem to be much
more selective toward the partial oxidation of acrolein than extra-framework V-species. Further
analysis are currently in preparation to better define the phenomena observed.
127
3.5 X-ray Absorption Spectroscopy (XAS) with synchrotron radiation as a
tool to better comprehend the complex structure of substituted-HTBs
In the previous chapters, substituted-HTBs have been demonstrated to be complex mixed-oxide
whose structure is strongly influenced by preparation method, elemental composition and post-
synthesis heat-treatments. Their complexity becomes particularly evident in tri-component
oxides, i.e. W-V-Nb and W-Mo-V, respectively discussed in chapter 2.4-2.5 and 3.3. Indeed, the
introduction of vanadium in the HTB structure did not lead to any particular changes in terms of
crystallinity, which made it possible to well-characterize the nature of W-V catalysts by
conventional powder-XRD. However, when either Nb or Mo were introduced, the crystallinity of
these materials significantly decreased, hampering an easy characterization by conventional
analysis. For instance, the best performing W-V-Nb catalyst for glycerol oxidehydration (WVNb-1)
had almost 60% of amorphous phase (see chapter 2.5). W-Mo-V catalysts were even more
complex to characterize since at high contents of molybdenum the only result given by X-ray
diffraction was the presence of a stacked material with cell parameters of ca. 3.8Å.
Even though microscopy (particularly TEM) can give important information to characterize these
oxides in the so-called long range order, it cannot help in clarifying the very intimate nature of the
local-environment around each element in the oxide frame, particularly if the material is poorly
crystallized. For instance, this was the case for the TEM investigation carried out on WMoV-3. A
more appropriate characterization technique for pursuing this piece of information is X-ray
Absorption Spectroscopy (XAS), which however requires highly technological equipments only
available at synchrotron facilities -see chapter 2.2 for more details-. Thanks to the co-supervised
PhD project that characterizes this thesis, it was possible to access the beamline BM25A "Spanish
Line" at the European Synchrotron Radiation Facility (ESFR) in Grenoble (France) (ESFR
experiment n° 25-01-901).
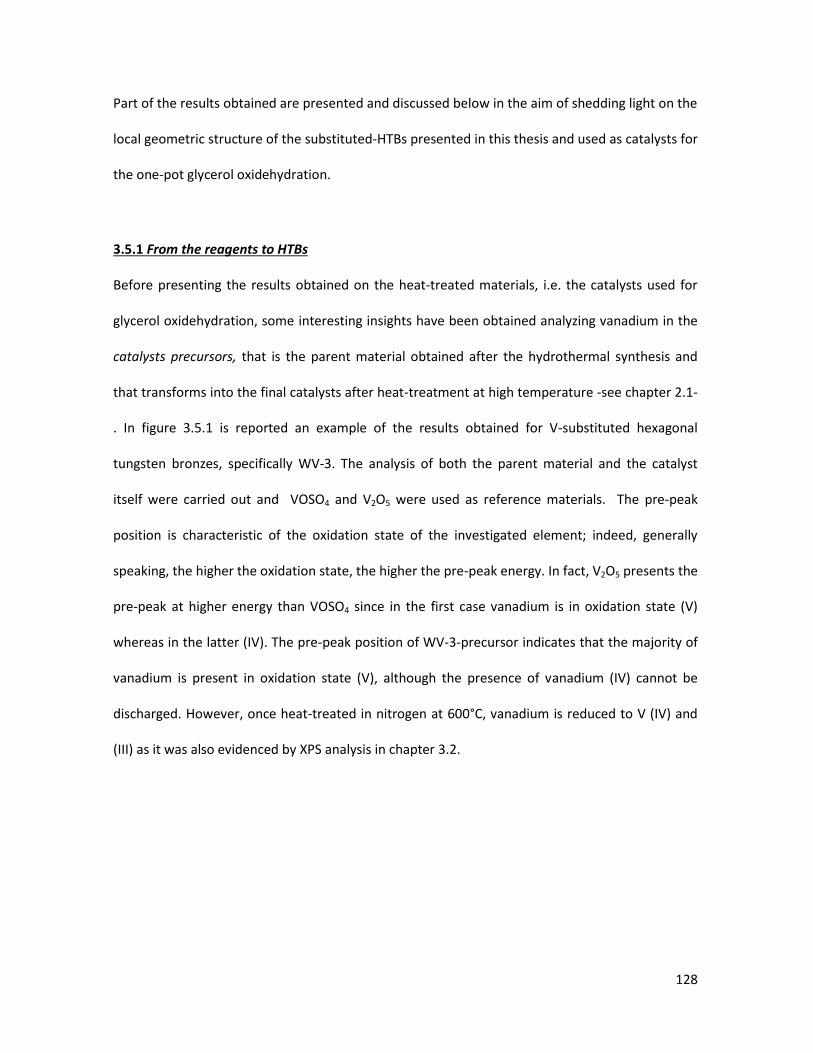
128
Part of the results obtained are presented and discussed below in the aim of shedding light on the
local geometric structure of the substituted-HTBs presented in this thesis and used as catalysts for
the one-pot glycerol oxidehydration.
3.5.1 From the reagents to HTBs
Before presenting the results obtained on the heat-treated materials, i.e. the catalysts used for
glycerol oxidehydration, some interesting insights have been obtained analyzing vanadium in the
catalysts precursors, that is the parent material obtained after the hydrothermal synthesis and
that transforms into the final catalysts after heat-treatment at high temperature -see chapter 2.1-
. In figure 3.5.1 is reported an example of the results obtained for V-substituted hexagonal
tungsten bronzes, specifically WV-3. The analysis of both the parent material and the catalyst
itself were carried out and VOSO4 and V2O5 were used as reference materials. The pre-peak
position is characteristic of the oxidation state of the investigated element; indeed, generally
speaking, the higher the oxidation state, the higher the pre-peak energy. In fact, V2O5 presents the
pre-peak at higher energy than VOSO4 since in the first case vanadium is in oxidation state (V)
whereas in the latter (IV). The pre-peak position of WV-3-precursor indicates that the majority of
vanadium is present in oxidation state (V), although the presence of vanadium (IV) cannot be
discharged. However, once heat-treated in nitrogen at 600°C, vanadium is reduced to V (IV) and
(III) as it was also evidenced by XPS analysis in chapter 3.2.
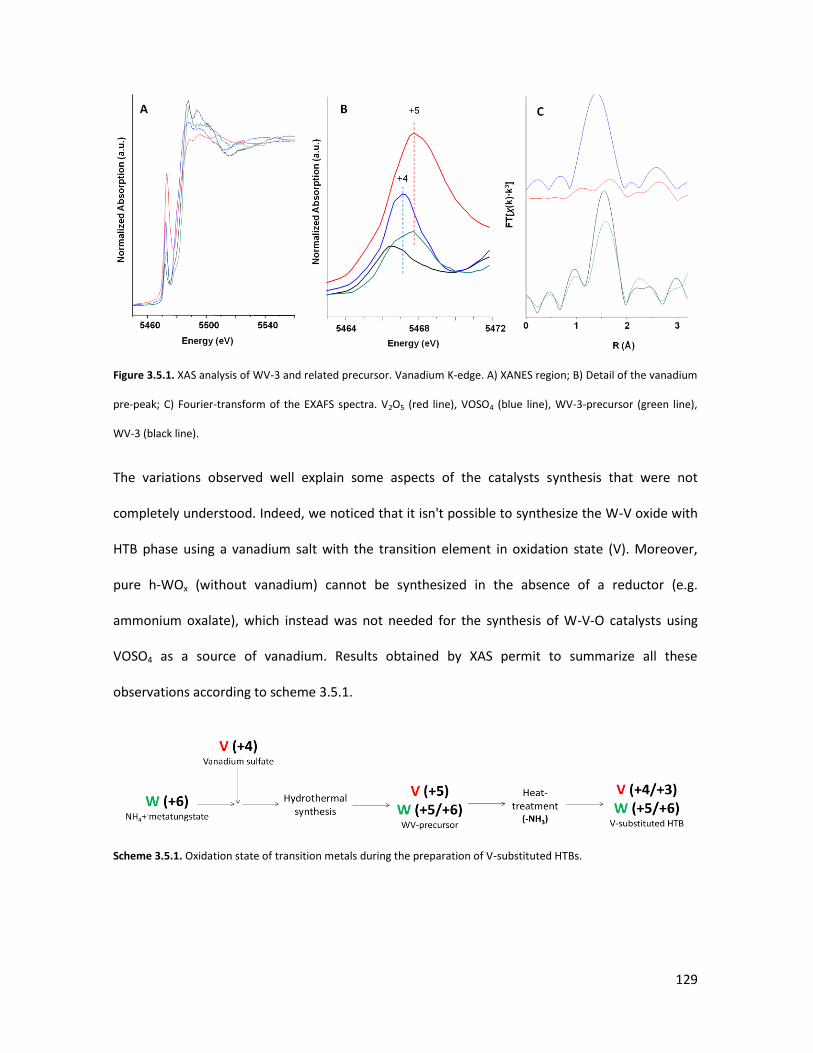
129
Figure 3.5.1. XAS analysis of WV-3 and related precursor. Vanadium K-edge. A) XANES region; B) Detail of the vanadium
pre-peak; C) Fourier-transform of the EXAFS spectra. V2O5 (red line), VOSO4 (blue line), WV-3-precursor (green line),
WV-3 (black line).
The variations observed well explain some aspects of the catalysts synthesis that were not
completely understood. Indeed, we noticed that it isn't possible to synthesize the W-V oxide with
HTB phase using a vanadium salt with the transition element in oxidation state (V). Moreover,
pure h-WOx (without vanadium) cannot be synthesized in the absence of a reductor (e.g.
ammonium oxalate), which instead was not needed for the synthesis of W-V-O catalysts using
VOSO4 as a source of vanadium. Results obtained by XAS permit to summarize all these
observations according to scheme 3.5.1.
Scheme 3.5.1. Oxidation state of transition metals during the preparation of V-substituted HTBs.
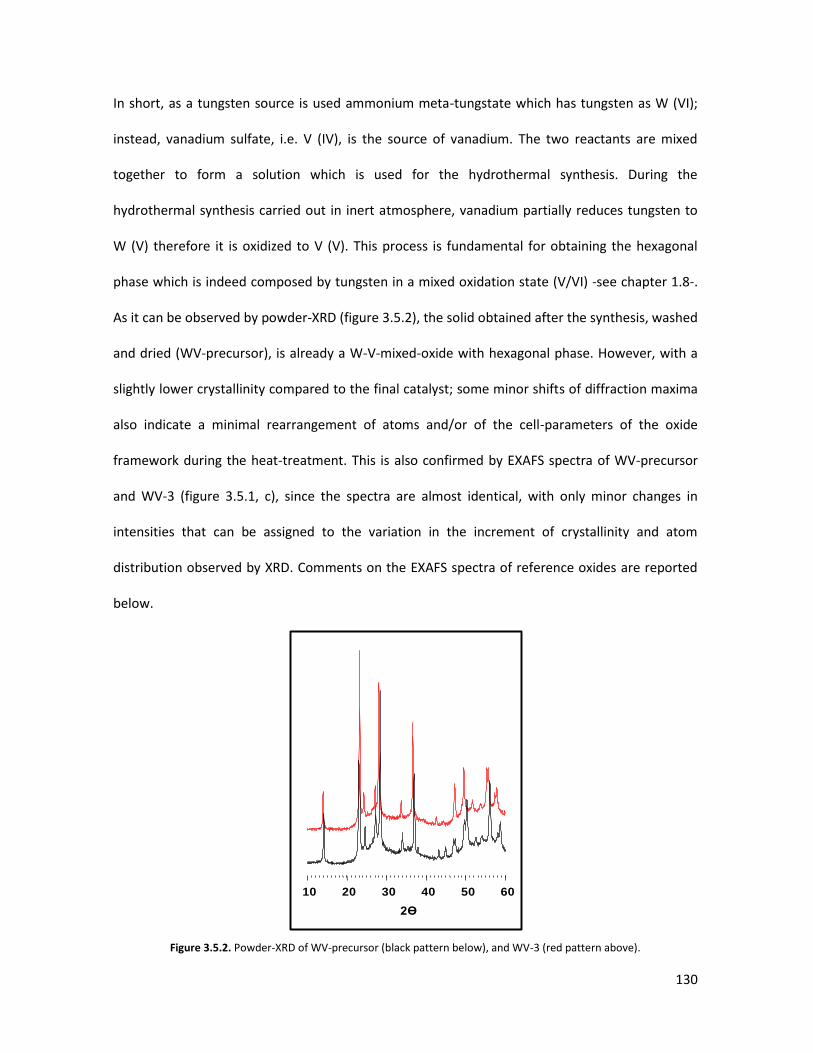
130
In short, as a tungsten source is used ammonium meta-tungstate which has tungsten as W (VI);
instead, vanadium sulfate, i.e. V (IV), is the source of vanadium. The two reactants are mixed
together to form a solution which is used for the hydrothermal synthesis. During the
hydrothermal synthesis carried out in inert atmosphere, vanadium partially reduces tungsten to
W (V) therefore it is oxidized to V (V). This process is fundamental for obtaining the hexagonal
phase which is indeed composed by tungsten in a mixed oxidation state (V/VI) -see chapter 1.8-.
As it can be observed by powder-XRD (figure 3.5.2), the solid obtained after the synthesis, washed
and dried (WV-precursor), is already a W-V-mixed-oxide with hexagonal phase. However, with a
slightly lower crystallinity compared to the final catalyst; some minor shifts of diffraction maxima
also indicate a minimal rearrangement of atoms and/or of the cell-parameters of the oxide
framework during the heat-treatment. This is also confirmed by EXAFS spectra of WV-precursor
and WV-3 (figure 3.5.1, c), since the spectra are almost identical, with only minor changes in
intensities that can be assigned to the variation in the increment of crystallinity and atom
distribution observed by XRD. Comments on the EXAFS spectra of reference oxides are reported
below.
Figure 3.5.2. Powder-XRD of WV-precursor (black pattern below), and WV-3 (red pattern above).
2Ɵ
10 20 30 40 50 60
131
Finally, when WV-precursor is heat-treated in nitrogen up to 600°C, ammonium ions decompose
in H+ and NH3. The protons remains in the channels that characterize the oxide lattice and
generate its characteristic acidity; whereas ammonia leaves the solid favoring the reduction of
vanadium (V) into vanadium (IV). Therefore, XAS results perfectly explain the reason why the
vanadium source must have vanadium in a reduced state (e.g. (IV)) and/or an external source of
reductant (e.g. oxalic acid) must be present to form the hexagonal framework. It also explains the
mixed-oxidation state of tungsten and vanadium observed on the surface of fresh catalysts by XPS
analysis -see chapter 2.5-. Of course, the same conclusions drawn using WV-3 can also be
extended to the tri-component catalysts prepared, W-V-Nb and W-Mo-V, taking also into
consideration the constant oxidation state of Nb (V) and the easily interchangeable oxidation
state of molybdenum (V/VI).
3.5.2 Vanadium coordination in HTBs
The studies carried out by studying the K-edge of vanadium in W-V, W-V-Nb and W-Mo-V, has
also allowed us to gain additional knowledge on the local geometry of the transition element in
the three series of substituted-HTBs. In figure 3.5.3 are reported the EXAFS spectra of
representative samples of each series and compared to reference materials. EXAFS spectra of
catalysts prove that vanadium has a very similar oxygen coordination shell in all three samples,
despite XRD analysis showed either the presence of a well-crystallized hexagonal phase (WV-3), or
consistent presence of amorphous phase (WVNb-1), or simply a structure with orderly stacked
crystal planes (WMoV-3) -see previous chapters-. Provided the similarities among them,
comparing these catalysts to reference materials (V2O5 and VOSO4) it can be deduced that the
local geometry of vanadium in the catalysts is much more similar to V2O5 than VOSO4.
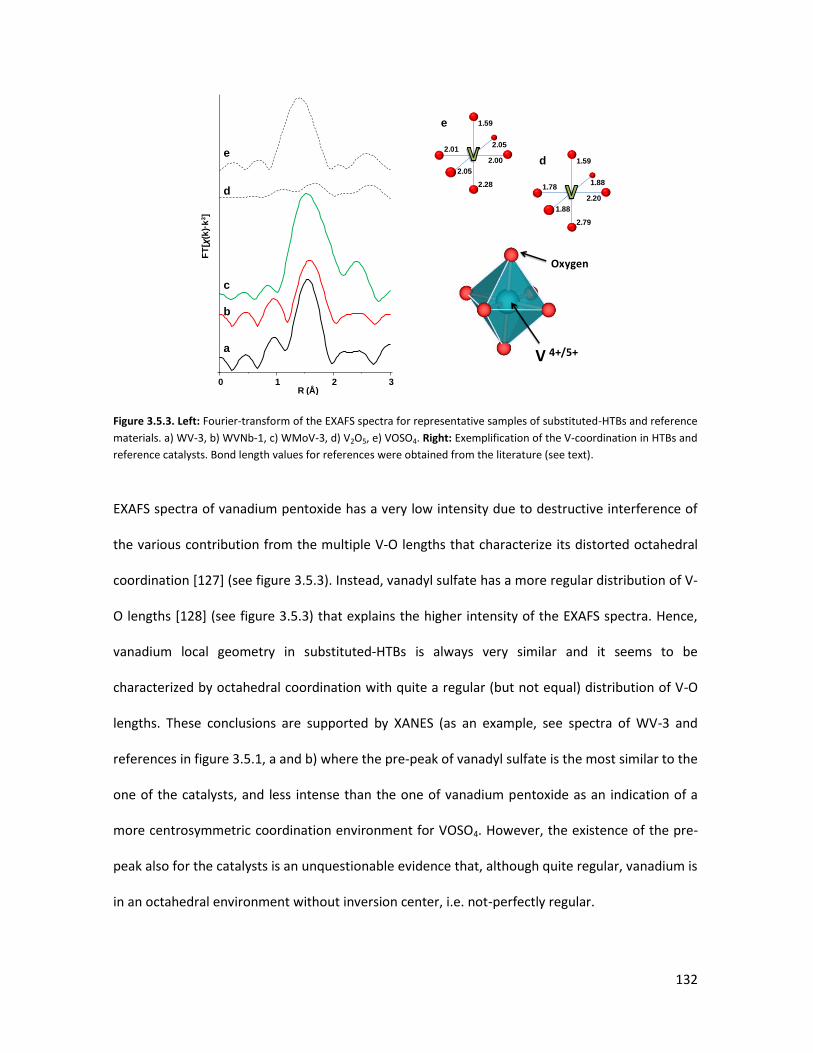
132
Figure 3.5.3. Left: Fourier-transform of the EXAFS spectra for representative samples of substituted-HTBs and reference
materials. a) WV-3, b) WVNb-1, c) WMoV-3, d) V2O5, e) VOSO4. Right: Exemplification of the V-coordination in HTBs and
reference catalysts. Bond length values for references were obtained from the literature (see text).
EXAFS spectra of vanadium pentoxide has a very low intensity due to destructive interference of
the various contribution from the multiple VO lengths that characterize its distorted octahedral
coordination [127] (see figure 3.5.3). Instead, vanadyl sulfate has a more regular distribution of V-
O lengths [128] (see figure 3.5.3) that explains the higher intensity of the EXAFS spectra. Hence,
vanadium local geometry in substituted-HTBs is always very similar and it seems to be
characterized by octahedral coordination with quite a regular (but not equal) distribution of V-O
lengths. These conclusions are supported by XANES (as an example, see spectra of WV-3 and
references in figure 3.5.1, a and b) where the pre-peak of vanadyl sulfate is the most similar to the
one of the catalysts, and less intense than the one of vanadium pentoxide as an indication of a
more centrosymmetric coordination environment for VOSO4. However, the existence of the pre-
peak also for the catalysts is an unquestionable evidence that, although quite regular, vanadium is
in an octahedral environment without inversion center, i.e. not-perfectly regular.
0 1 2 3R (Å)
FT
[χ(k
)·k
3]
Oxygen
V 4+/5+a
b
c
d
e 2.01
2.00
2.05
2.05
1.59
2.28
e
1.78
2.20
1.88
1.88
1.59
2.79
d
133
Concluding, the various catalysts prepared consist of mixed-oxide with hexagonal tungsten bronze
structure, which is well or poorly crystallized depending on elemental composition, preparation
method and post-synthesis heat treatments. These features characterize the long-range order of
crystals, which can be observed by transmission electron microscopy. However, the transition
elements that constitute these materials (W, V, Nb, Mo) are organized in corner-sharing
octahedra more or less distorted which form orderly stacked crystal planes with d-spacing of ca.
3.8 Å, typical of any ReO3-like crystal structures, to whom hexagonal tungsten bronzes belong.
Computational studies aimed at simulate the EXAFS spectra obtained at the synchrotron are
currently in preparation; this way, a quantitative evaluation of the various metal-oxygen distances
can be achieved.
134
4. Overall Conclusions
Hexagonal Tungsten Bronzes (HTBs) and related oxides are a very interesting family of materials
with a great potential for innovative application in catalysis. The acid properties related to their
peculiar structure make them valuable catalysts for applications where medium-to-strong acidity
is needed, particularly if Brɸnsted acid sites are required. Moreover, a great number of elements
can be incorporated inside or outside the hexagonal framework, giving to these oxides an amazing
potential as multifunctional catalysts. However, probably due to the complexity of these materials
as well as their difficult characterization, their use in catalysis has been significantly hampered.
Along the PhD promgram, three years of research were dedicated to the synthesis,
characterization and utilization as catalysts of multifunctional HTB-like materials, thanks to an
international collaboration between ITQ-UPV (Spain) and University of Bologna (Italy). "Soft"-
chemical methods were used to revise and improve the synthesis of HTBs and a number of
physicochemical techniques (among which HR-TEM and XAS) were utilized to fully comprehend
their nature. Introduction of niobium in W-V HTBs was proved to be possible also through
hydrothermal synthesis; moreover, for the first time in literature, new W-Mo-V oxides with HTB-
like structure were obtained. These materials were applied as catalysts for the one-pot glycerol
oxidehydration, a reaction potentially able to find a viable solution for the glycerol surplus from
the biodiesel synthesis. The catalytic results obtained position these multifunctional HTBs as the
most effective catalysts so far reported in literature for this reaction. Finally, a comparison of V-
containing HTBs to other multifunctional (acid and redox) catalysts containing vanadium was
performed. The results clearly indicate that a peculiar structure-reactivity correlation exists and
the local environment of vanadium seems to govern its redox properties.

135
The overall results reported herein might represent a significant contribution for future
applications of HTBs in catalysis as well as a general guideline for a multifaceted approach for
their physicochemical characterization.
136
5. Publications
Along the three year of the PhD program various papers were published, both directly related to
the topic of this PhD thesis and about other projects not discussed herein.
5.1. Publications related to the research project presented in this PhD thesis
A. Chieregato, F. Basile, P. Concepción, S. Guidetti, G. Liosi, M. Dolores Soriano, C.
Trevisanut, F. Cavani, José M. López Nieto, Glycerol oxidehydration into acrolein and
acrylic acid over W–V–Nb–O bronzes with hexagonal structure, Catalysis Today, Volume
197, Issue 1, 2012, Pages 58-65.
A. Chieregato, M. Dolores Soriano, F. Basile, G. Liosi, S. Zamora, P. Concepción, F. Cavani,
José M. López Nieto, One-pot glycerol oxidehydration to acrylic acid on multifunctional
catalysts: Focus on the influence of the reaction parameters in respect to the catalytic
performance, Applied Catalysis B: Environmental, Volumes 150–151, 2014, Pages 37-46.
A. Chieregato, M. Dolores Soriano, E. García-González, G. Puglia, F. Basile, P. Concepción,
C. Bandinelli, José M. López Nieto, Fabrizio Cavani, Multielement Crystalline and
Pseudocrystalline Oxides as Efficient Catalysts for the Direct Transformation of Glycerol
into Acrylic Acid, ChemSusChem, DOI: 10.1002/cssc.201402721.
5.2. Publications related to other projects
J. J. Creasey, A. Chieregato, J. C. Manayil, C. M. A. Parlett, K. Wilson, Adam F. Lee, Alkali-
and nitrate-free synthesis of highly active Mg–Al hydrotalcite-coated alumina for FAME
production, Catalysis Science & Technology, Volume 4, 2014, Pages 861-870.
D. Cespi, F. Passarini, G. Mastragostino, I. Vassura, S. Larocca, A. Iaconi, A. Chieregato, J.-
L. Dubois, F. Cavani, Glycerol as feedstock in the synthesis of chemicals: a life cycle analysis
for acrolein production, Green Chemistry, DOI: 10.1039/c4gc01497a.
A. Chieregato, J. Velasquez Ochoa, C. Bandinelli, G. Fornasari, F. Cavani, M. Mella, On the
Chemistry of Ethanol on Basic Oxides: Revising Mechanisms and Intermediates in the
Lebedev and Guerbet reactions, ChemSusChem, DOI: 10.1002/cssc.201402632.
A. Chieregato, José M. López Nieto, F. Cavani, Mixed-oxide catalysts with Vanadium as the
key element for gas-phase reactions, Coordination Chemistry Reviews,
DOI:10.1016/j.ccr.2014.12.003.
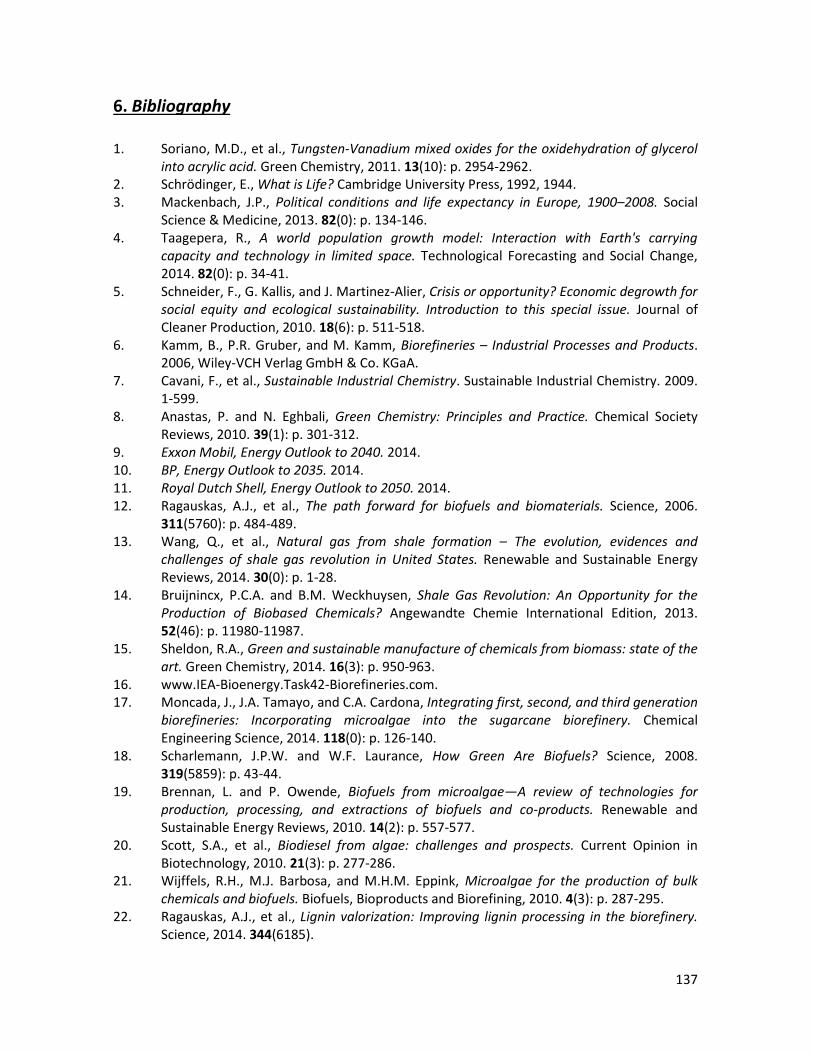
137
6. Bibliography
1. Soriano, M.D., et al., Tungsten-Vanadium mixed oxides for the oxidehydration of glycerol into acrylic acid. Green Chemistry, 2011. 13(10): p. 2954-2962.
2. Schrödinger, E., What is Life? Cambridge University Press, 1992, 1944. 3. Mackenbach, J.P., Political conditions and life expectancy in Europe, 1900–2008. Social
Science & Medicine, 2013. 82(0): p. 134-146. 4. Taagepera, R., A world population growth model: Interaction with Earth's carrying
capacity and technology in limited space. Technological Forecasting and Social Change, 2014. 82(0): p. 34-41.
5. Schneider, F., G. Kallis, and J. Martinez-Alier, Crisis or opportunity? Economic degrowth for social equity and ecological sustainability. Introduction to this special issue. Journal of Cleaner Production, 2010. 18(6): p. 511-518.
6. Kamm, B., P.R. Gruber, and M. Kamm, Biorefineries – Industrial Processes and Products. 2006, Wiley-VCH Verlag GmbH & Co. KGaA.
7. Cavani, F., et al., Sustainable Industrial Chemistry. Sustainable Industrial Chemistry. 2009. 1-599.
8. Anastas, P. and N. Eghbali, Green Chemistry: Principles and Practice. Chemical Society Reviews, 2010. 39(1): p. 301-312.
9. Exxon Mobil, Energy Outlook to 2040. 2014. 10. BP, Energy Outlook to 2035. 2014. 11. Royal Dutch Shell, Energy Outlook to 2050. 2014. 12. Ragauskas, A.J., et al., The path forward for biofuels and biomaterials. Science, 2006.
311(5760): p. 484-489. 13. Wang, Q., et al., Natural gas from shale formation – The evolution, evidences and
challenges of shale gas revolution in United States. Renewable and Sustainable Energy Reviews, 2014. 30(0): p. 1-28.
14. Bruijnincx, P.C.A. and B.M. Weckhuysen, Shale Gas Revolution: An Opportunity for the Production of Biobased Chemicals? Angewandte Chemie International Edition, 2013. 52(46): p. 11980-11987.
15. Sheldon, R.A., Green and sustainable manufacture of chemicals from biomass: state of the art. Green Chemistry, 2014. 16(3): p. 950-963.
16. www.IEA-Bioenergy.Task42-Biorefineries.com. 17. Moncada, J., J.A. Tamayo, and C.A. Cardona, Integrating first, second, and third generation
biorefineries: Incorporating microalgae into the sugarcane biorefinery. Chemical Engineering Science, 2014. 118(0): p. 126-140.
18. Scharlemann, J.P.W. and W.F. Laurance, How Green Are Biofuels? Science, 2008. 319(5859): p. 43-44.
19. Brennan, L. and P. Owende, Biofuels from microalgae—A review of technologies for production, processing, and extractions of biofuels and co-products. Renewable and Sustainable Energy Reviews, 2010. 14(2): p. 557-577.
20. Scott, S.A., et al., Biodiesel from algae: challenges and prospects. Current Opinion in Biotechnology, 2010. 21(3): p. 277-286.
21. Wijffels, R.H., M.J. Barbosa, and M.H.M. Eppink, Microalgae for the production of bulk chemicals and biofuels. Biofuels, Bioproducts and Biorefining, 2010. 4(3): p. 287-295.
22. Ragauskas, A.J., et al., Lignin valorization: Improving lignin processing in the biorefinery. Science, 2014. 344(6185).
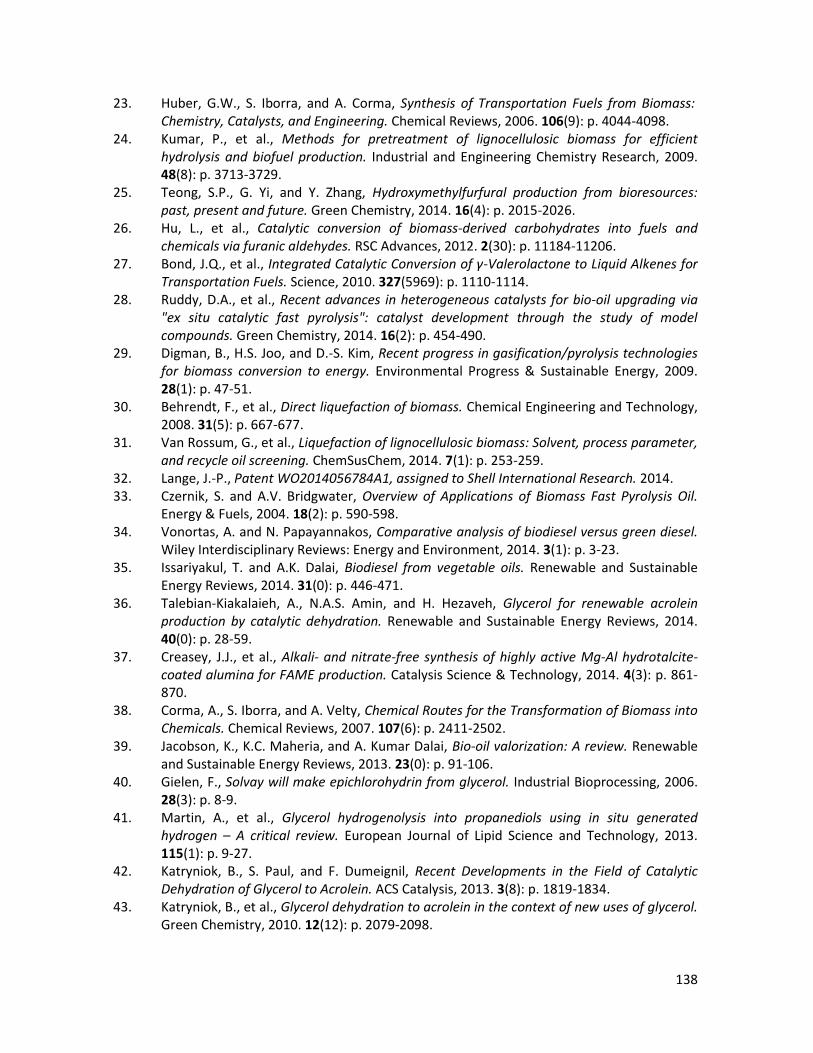
138
23. Huber, G.W., S. Iborra, and A. Corma, Synthesis of Transportation Fuels from Biomass: Chemistry, Catalysts, and Engineering. Chemical Reviews, 2006. 106(9): p. 4044-4098.
24. Kumar, P., et al., Methods for pretreatment of lignocellulosic biomass for efficient hydrolysis and biofuel production. Industrial and Engineering Chemistry Research, 2009. 48(8): p. 3713-3729.
25. Teong, S.P., G. Yi, and Y. Zhang, Hydroxymethylfurfural production from bioresources: past, present and future. Green Chemistry, 2014. 16(4): p. 2015-2026.
26. Hu, L., et al., Catalytic conversion of biomass-derived carbohydrates into fuels and chemicals via furanic aldehydes. RSC Advances, 2012. 2(30): p. 11184-11206.
27. Bond, J.Q., et al., Integrated Catalytic Conversion of γ-Valerolactone to Liquid Alkenes for Transportation Fuels. Science, 2010. 327(5969): p. 1110-1114.
28. Ruddy, D.A., et al., Recent advances in heterogeneous catalysts for bio-oil upgrading via "ex situ catalytic fast pyrolysis": catalyst development through the study of model compounds. Green Chemistry, 2014. 16(2): p. 454-490.
29. Digman, B., H.S. Joo, and D.-S. Kim, Recent progress in gasification/pyrolysis technologies for biomass conversion to energy. Environmental Progress & Sustainable Energy, 2009. 28(1): p. 47-51.
30. Behrendt, F., et al., Direct liquefaction of biomass. Chemical Engineering and Technology, 2008. 31(5): p. 667-677.
31. Van Rossum, G., et al., Liquefaction of lignocellulosic biomass: Solvent, process parameter, and recycle oil screening. ChemSusChem, 2014. 7(1): p. 253-259.
32. Lange, J.-P., Patent WO2014056784A1, assigned to Shell International Research. 2014. 33. Czernik, S. and A.V. Bridgwater, Overview of Applications of Biomass Fast Pyrolysis Oil.
Energy & Fuels, 2004. 18(2): p. 590-598. 34. Vonortas, A. and N. Papayannakos, Comparative analysis of biodiesel versus green diesel.
Wiley Interdisciplinary Reviews: Energy and Environment, 2014. 3(1): p. 3-23. 35. Issariyakul, T. and A.K. Dalai, Biodiesel from vegetable oils. Renewable and Sustainable
Energy Reviews, 2014. 31(0): p. 446-471. 36. Talebian-Kiakalaieh, A., N.A.S. Amin, and H. Hezaveh, Glycerol for renewable acrolein
production by catalytic dehydration. Renewable and Sustainable Energy Reviews, 2014. 40(0): p. 28-59.
37. Creasey, J.J., et al., Alkali- and nitrate-free synthesis of highly active Mg-Al hydrotalcite-coated alumina for FAME production. Catalysis Science & Technology, 2014. 4(3): p. 861-870.
38. Corma, A., S. Iborra, and A. Velty, Chemical Routes for the Transformation of Biomass into Chemicals. Chemical Reviews, 2007. 107(6): p. 2411-2502.
39. Jacobson, K., K.C. Maheria, and A. Kumar Dalai, Bio-oil valorization: A review. Renewable and Sustainable Energy Reviews, 2013. 23(0): p. 91-106.
40. Gielen, F., Solvay will make epichlorohydrin from glycerol. Industrial Bioprocessing, 2006. 28(3): p. 8-9.
41. Martin, A., et al., Glycerol hydrogenolysis into propanediols using in situ generated hydrogen – A critical review. European Journal of Lipid Science and Technology, 2013. 115(1): p. 9-27.
42. Katryniok, B., S. Paul, and F. Dumeignil, Recent Developments in the Field of Catalytic Dehydration of Glycerol to Acrolein. ACS Catalysis, 2013. 3(8): p. 1819-1834.
43. Katryniok, B., et al., Glycerol dehydration to acrolein in the context of new uses of glycerol. Green Chemistry, 2010. 12(12): p. 2079-2098.
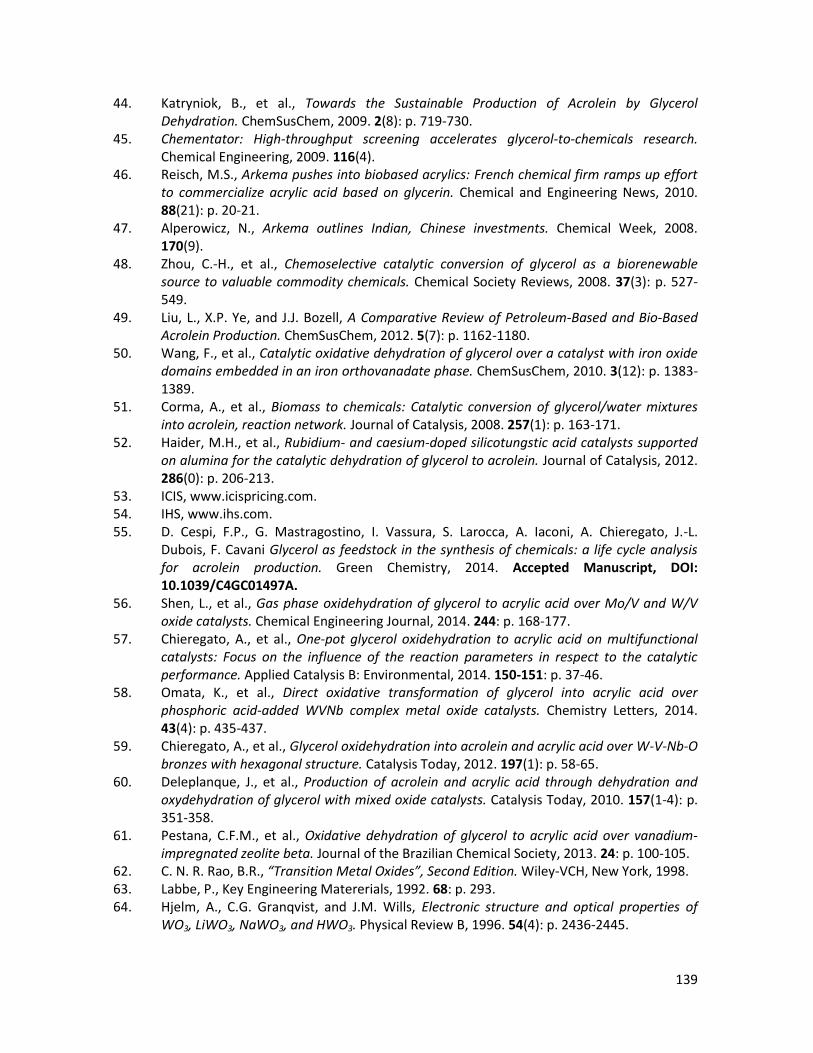
139
44. Katryniok, B., et al., Towards the Sustainable Production of Acrolein by Glycerol Dehydration. ChemSusChem, 2009. 2(8): p. 719-730.
45. Chementator: High-throughput screening accelerates glycerol-to-chemicals research. Chemical Engineering, 2009. 116(4).
46. Reisch, M.S., Arkema pushes into biobased acrylics: French chemical firm ramps up effort to commercialize acrylic acid based on glycerin. Chemical and Engineering News, 2010. 88(21): p. 20-21.
47. Alperowicz, N., Arkema outlines Indian, Chinese investments. Chemical Week, 2008. 170(9).
48. Zhou, C.-H., et al., Chemoselective catalytic conversion of glycerol as a biorenewable source to valuable commodity chemicals. Chemical Society Reviews, 2008. 37(3): p. 527-549.
49. Liu, L., X.P. Ye, and J.J. Bozell, A Comparative Review of Petroleum-Based and Bio-Based Acrolein Production. ChemSusChem, 2012. 5(7): p. 1162-1180.
50. Wang, F., et al., Catalytic oxidative dehydration of glycerol over a catalyst with iron oxide domains embedded in an iron orthovanadate phase. ChemSusChem, 2010. 3(12): p. 1383-1389.
51. Corma, A., et al., Biomass to chemicals: Catalytic conversion of glycerol/water mixtures into acrolein, reaction network. Journal of Catalysis, 2008. 257(1): p. 163-171.
52. Haider, M.H., et al., Rubidium- and caesium-doped silicotungstic acid catalysts supported on alumina for the catalytic dehydration of glycerol to acrolein. Journal of Catalysis, 2012. 286(0): p. 206-213.
53. ICIS, www.icispricing.com. 54. IHS, www.ihs.com. 55. D. Cespi, F.P., G. Mastragostino, I. Vassura, S. Larocca, A. Iaconi, A. Chieregato, J.-L.
Dubois, F. Cavani Glycerol as feedstock in the synthesis of chemicals: a life cycle analysis for acrolein production. Green Chemistry, 2014. Accepted Manuscript, DOI: 10.1039/C4GC01497A.
56. Shen, L., et al., Gas phase oxidehydration of glycerol to acrylic acid over Mo/V and W/V oxide catalysts. Chemical Engineering Journal, 2014. 244: p. 168-177.
57. Chieregato, A., et al., One-pot glycerol oxidehydration to acrylic acid on multifunctional catalysts: Focus on the influence of the reaction parameters in respect to the catalytic performance. Applied Catalysis B: Environmental, 2014. 150-151: p. 37-46.
58. Omata, K., et al., Direct oxidative transformation of glycerol into acrylic acid over phosphoric acid-added WVNb complex metal oxide catalysts. Chemistry Letters, 2014. 43(4): p. 435-437.
59. Chieregato, A., et al., Glycerol oxidehydration into acrolein and acrylic acid over W-V-Nb-O bronzes with hexagonal structure. Catalysis Today, 2012. 197(1): p. 58-65.
60. Deleplanque, J., et al., Production of acrolein and acrylic acid through dehydration and oxydehydration of glycerol with mixed oxide catalysts. Catalysis Today, 2010. 157(1-4): p. 351-358.
61. Pestana, C.F.M., et al., Oxidative dehydration of glycerol to acrylic acid over vanadium-impregnated zeolite beta. Journal of the Brazilian Chemical Society, 2013. 24: p. 100-105.
62. C. N. R. Rao, B.R., “Transition Metal Oxides”, Second Edition. Wiley-VCH, New York, 1998. 63. Labbe, P., Key Engineering Matererials, 1992. 68: p. 293. 64. Hjelm, A., C.G. Granqvist, and J.M. Wills, Electronic structure and optical properties of
WO3, LiWO3, NaWO3, and HWO3. Physical Review B, 1996. 54(4): p. 2436-2445.

140
65. Tsuyumoto, I. and T. Kudo, Humidity sensor using potassium hexagonal tungsten bronze synthesized from peroxo-pokytungstic acid. Sensors and Actuators B: Chemical, 1996. 30(2): p. 95-99.
66. Dupont, L., et al., Synthesis and characterization of new oxide hydrates Hx(VxMo1-x)O3 • 0. 3H2O and H0.27(V0.27W0.73)O3 • 1/3H2O. Journal of Solid State Chemistry, 1996. 121(2): p. 339-349.
67. Gopalakrishnan, J., N.S.P. Bhuvanesh, and A.R. Raju, Soft chemical synthesis of new layered and three-dimensional oxide hydrates, HxVxW1-xO3·yH2O, related to WO3·2H2O and WO3·1/3H2O. Chemistry of Materials, 1994. 6(4): p. 373-379.
68. Sharma, R., Bronzoid phases in the pseudo-binary system AxNbxW1−xO3 with A = K and Cs. Materials Research Bulletin, 1985. 20(11): p. 1373-1381.
69. A. Deschanvres, C.M., B. Raveau, Bulletin de la Société Chimique de France, 1968. 12: p. 4805.
70. Gopalakrishnan, J., Chimie douce approaches to the synthesis of metastable oxide materials. Chemistry of Materials, 1995. 7(7): p. 1265-1275.
71. Michailovski, A. and G.R. Patzke, Hydrothermal synthesis of molybdenum oxide based materials: Strategy and structural chemistry. Chemistry - A European Journal, 2006. 12(36): p. 9122-9134.
72. Chemseddine, A. and U. Bloeck, How isopolyanions self-assemble and condense into a 2D tungsten oxide crystal: HRTEM imaging of atomic arrangement in an intermediate new hexagonal phase. Journal of Solid State Chemistry, 2008. 181(10): p. 2731-2736.
73. Tao, Y., M.-S. Hu, and D. Feng, Direct observation of α–β phase transition in KNbW2O9 by transmission electron microscopy. physica status solidi (a), 1988. 109(2): p. 435-444.
74. Dupont, L. and M. Sundberg, The Phase Transitions between H0.27V0.27W0.73O3·13 H2O and V0.27W0.73O2.865: An X-Ray, Thermal Analysis, and HREM Study. Journal of Solid State Chemistry, 1998. 136(2): p. 284-292.
75. Mestl, G., et al., Thermally and chemically induced structural transformations of Keggin-type heteropoly acid catalysts. Applied Catalysis A: General, 2001. 210(1–2): p. 13-34.
76. Massa, M., et al., Gas-phase dehydration of glycerol to acrolein over Al2O3-, SiO2-, and TiO2-supported Nb- and W-oxide catalysts. Journal of Catalysis, 2013. 307(0): p. 170-184.
77. Liu, R., et al., Highly selective and stable CsPW/Nb2O5 catalysts for dehydration of glycerol to acrolein. Chinese Journal of Catalysis, 2013. 34(12): p. 2174-2182.
78. Wang, F., J.-L. Dubois, and W. Ueda, Catalytic dehydration of glycerol over vanadium phosphate oxides in the presence of molecular oxygen. Journal of Catalysis, 2009. 268(2): p. 260-267.
79. Byrappa, K. and M. Yoshimura, 1 - Hydrothermal Technology—Principles and Applications, in Handbook of Hydrothermal Technology, K.B. Yoshimura, Editor. 2001, William Andrew Publishing: Norwich, NY. p. 1-52.
80. Griffith, C.S. and V. Luca, Ion-Exchange Properties of Microporous Tungstates. Chemistry of Materials, 2004. 16(24): p. 4992-4999.
81. Concepción, P., et al., Preparation, characterization and reactivity of V- and/or Co-containing AlPO-18 materials (VCoAPO-18) in the oxidative dehydrogenation of ethane. Microporous and Mesoporous Materials, 2004. 67(2–3): p. 215-227.
82. Tichý, J., Oxidation of acrolein to acrylic acid over vanadium-molybdenum oxide catalysts. Applied Catalysis A: General, 1997. 157(1–2): p. 363-385.
83. Niemantsverdriet, J.W., Spectroscopy in Catalysis, 3rd, Completely Revised and Enlarged Edition. Wiley-WCH, 2007.
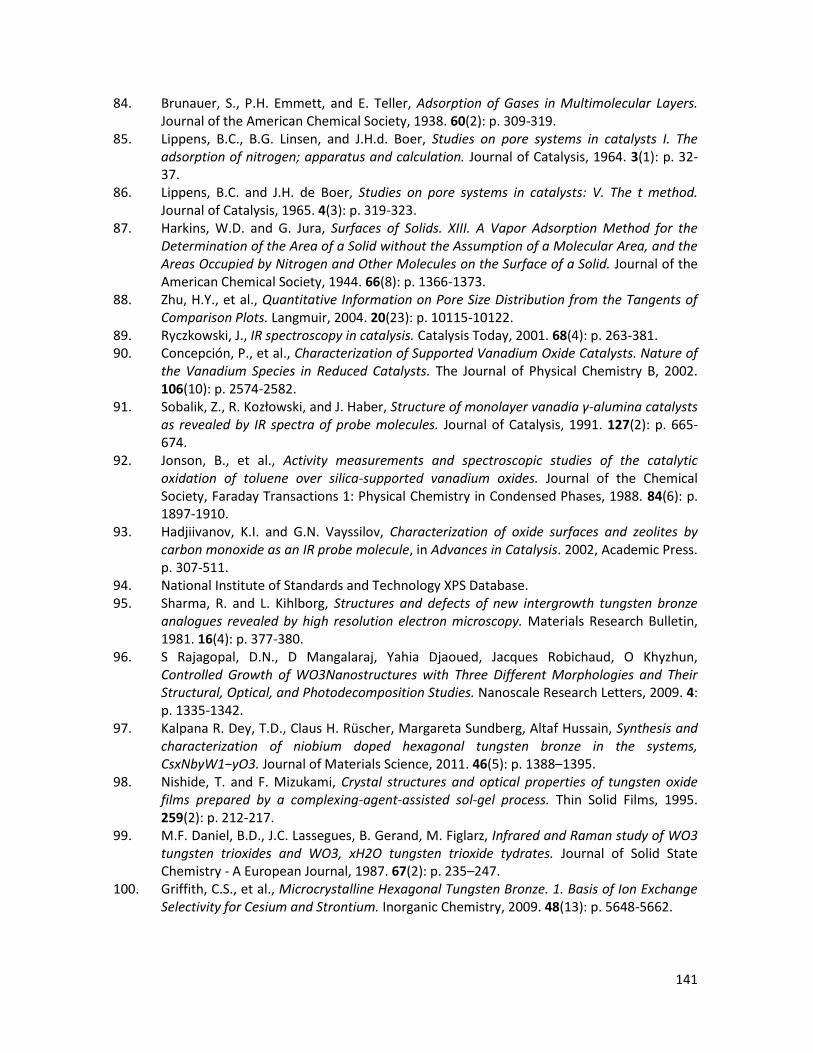
141
84. Brunauer, S., P.H. Emmett, and E. Teller, Adsorption of Gases in Multimolecular Layers. Journal of the American Chemical Society, 1938. 60(2): p. 309-319.
85. Lippens, B.C., B.G. Linsen, and J.H.d. Boer, Studies on pore systems in catalysts I. The adsorption of nitrogen; apparatus and calculation. Journal of Catalysis, 1964. 3(1): p. 32-37.
86. Lippens, B.C. and J.H. de Boer, Studies on pore systems in catalysts: V. The t method. Journal of Catalysis, 1965. 4(3): p. 319-323.
87. Harkins, W.D. and G. Jura, Surfaces of Solids. XIII. A Vapor Adsorption Method for the Determination of the Area of a Solid without the Assumption of a Molecular Area, and the Areas Occupied by Nitrogen and Other Molecules on the Surface of a Solid. Journal of the American Chemical Society, 1944. 66(8): p. 1366-1373.
88. Zhu, H.Y., et al., Quantitative Information on Pore Size Distribution from the Tangents of Comparison Plots. Langmuir, 2004. 20(23): p. 10115-10122.
89. Ryczkowski, J., IR spectroscopy in catalysis. Catalysis Today, 2001. 68(4): p. 263-381. 90. Concepción, P., et al., Characterization of Supported Vanadium Oxide Catalysts. Nature of
the Vanadium Species in Reduced Catalysts. The Journal of Physical Chemistry B, 2002. 106(10): p. 2574-2582.
91. Sobalik, Z., R. Kozłowski, and J. Haber, Structure of monolayer vanadia γ-alumina catalysts as revealed by IR spectra of probe molecules. Journal of Catalysis, 1991. 127(2): p. 665-674.
92. Jonson, B., et al., Activity measurements and spectroscopic studies of the catalytic oxidation of toluene over silica-supported vanadium oxides. Journal of the Chemical Society, Faraday Transactions 1: Physical Chemistry in Condensed Phases, 1988. 84(6): p. 1897-1910.
93. Hadjiivanov, K.I. and G.N. Vayssilov, Characterization of oxide surfaces and zeolites by carbon monoxide as an IR probe molecule, in Advances in Catalysis. 2002, Academic Press. p. 307-511.
94. National Institute of Standards and Technology XPS Database. 95. Sharma, R. and L. Kihlborg, Structures and defects of new intergrowth tungsten bronze
analogues revealed by high resolution electron microscopy. Materials Research Bulletin, 1981. 16(4): p. 377-380.
96. S Rajagopal, D.N., D Mangalaraj, Yahia Djaoued, Jacques Robichaud, O Khyzhun, Controlled Growth of WO3Nanostructures with Three Different Morphologies and Their Structural, Optical, and Photodecomposition Studies. Nanoscale Research Letters, 2009. 4: p. 1335-1342.
97. Kalpana R. Dey, T.D., Claus H. Rüscher, Margareta Sundberg, Altaf Hussain, Synthesis and characterization of niobium doped hexagonal tungsten bronze in the systems, CsxNbyW1−yO3. Journal of Materials Science, 2011. 46(5): p. 1388–1395.
98. Nishide, T. and F. Mizukami, Crystal structures and optical properties of tungsten oxide films prepared by a complexing-agent-assisted sol-gel process. Thin Solid Films, 1995. 259(2): p. 212-217.
99. M.F. Daniel, B.D., J.C. Lassegues, B. Gerand, M. Figlarz, Infrared and Raman study of WO3 tungsten trioxides and WO3, xH2O tungsten trioxide tydrates. Journal of Solid State Chemistry - A European Journal, 1987. 67(2): p. 235–247.
100. Griffith, C.S., et al., Microcrystalline Hexagonal Tungsten Bronze. 1. Basis of Ion Exchange Selectivity for Cesium and Strontium. Inorganic Chemistry, 2009. 48(13): p. 5648-5662.
142
101. Schneider, H., et al., In Situ Diffuse Reflectance FTIR Study of the Selective Catalytic Reduction of NO by NH3 over Vanadia-Titania Aerogels. Journal of Catalysis, 1994. 147(1): p. 5-14.
102. Ivanova, E., et al., FT-IR study of CO and NO adsorption on a VSiBEA zeolite. Microporous and Mesoporous Materials, 2006. 89(1–3): p. 69-77.
103. Okumura, K., et al., Hydrothermal synthesis and catalysis of Nb2O5-WOx nanofiber crystal. Journal of Materials Chemistry, 2011. 21(1): p. 229-235.
104. Badlani, M. and I. Wachs, Methanol: A “Smart” Chemical Probe Molecule. Catalysis Letters, 2001. 75(3-4): p. 137-149.
105. Tatibouët, J.M., Methanol oxidation as a catalytic surface probe. Applied Catalysis A: General, 1997. 148(2): p. 213-252.
106. Blanch-Raga, N., et al., Catalytic abatement of trichloroethylene over Mo and/or W-based bronzes. Applied Catalysis B: Environmental, 2013. 130–131(0): p. 36-43.
107. Botella, P., et al., Mo–W-containing tetragonal tungsten bronzes through isomorphic substitution of molybdenum by tungsten. Catalysis Today, 2010. 158(1–2): p. 162-169.
108. Rodella, C.B., et al., Chemical and structural characterization of V2O5/TiO2 catalysts. Journal of Vacuum Science & Technology A, 2001. 19(4): p. 1158-1163.
109. Bhat, B.R., J.S. Choi, and T.H. Kim, Synthesis and characterization of nanocrystalline Mo-V-W-Fe-O mixed oxide catalyst and its performance in selective methanol oxidation. Catalysis Letters, 2007. 117(3-4): p. 136-139.
110. Cariati, F., J.C.J. Bart, and A. Sgamellotti, Spectroscopic analysis of mixed valence molybdenum oxides. Inorganica Chimica Acta, 1981. 48(0): p. 97-103.
111. Petrini, G. and J.C.J. Bart, Das Phasendiagramm des Systems TeO2–MoO3. Zeitschrift für anorganische und allgemeine Chemie, 1981. 474(3): p. 229-232.
112. Knobl, S., et al., The synthesis and structure of a single-phase, nanocrystalline MoVW mixed-oxide catalyst of the Mo5O14 type. Journal of Catalysis, 2003. 215(2): p. 177-187.
113. Mestl, G. and T.K.K. Srinivasan, Raman Spectroscopy of Monolayer-Type Catalysts: Supported Molybdenum Oxides. Catalysis Reviews, 1998. 40(4): p. 451-570.
114. Giebeler, L., et al., Structural changes of vanadium–molybdenum–tungsten mixed oxide catalysts during the selective oxidation of acrolein to acrylic acid. Journal of Molecular Catalysis A: Chemical, 2006. 259(1–2): p. 309-318.
115. Endres, S., et al., The influence of tungsten on structure and activity of Mo–V–W-mixed oxide catalysts for acrolein oxidation. Applied Catalysis A: General, 2007. 325(2): p. 237-243.
116. Kampe, P., et al., Heterogeneously catalysed partial oxidation of acrolein to acrylic acid-structure, function and dynamics of the V-Mo-W mixed oxides. Physical Chemistry Chemical Physics, 2007. 9(27): p. 3577-3589.
117. P. Arpentinier, F.C., F. Trifirò, The Technology of Catalytic Oxidations. Editions Technip, Paris, 2001.
118. Mashuga, C.V. and D.A. Crowl, Application of the flammability diagram for evaluation of fire and explosion hazards of flammable vapors. Process Safety Progress, 1998. 17(3): p. 176-183.
119. Dummer, N.F., et al., Structural evolution and catalytic performance of DuPont V-P-O/SiO2 materials designed for fluidized bed applications. Applied Catalysis A: General, 2010. 376(1–2): p. 47-55.
120. Pérez-Moreno, L., et al., Effect of the use in circulating fluidized bed on the performance of a VPO catalyst: Characterization and transient studies. Chemical Engineering Journal, 2009. 147(2–3): p. 330-335.
143
121. Pastore, H.O., S. Coluccia, and L. Marchese, POROUS ALUMINOPHOSPHATES :From Molecular Sieves to Designed Acid Catalysts. Annual Review of Materials Research, 2005. 35(1): p. 351-395.
122. Garcia-Gonzalez, E., et al., On the origin of the spontaneous formation of nanocavities in hexagonal bronzes (W,V)O3. Dalton Transactions, 2014. 43(39): p. 14644-14652.
123. Concepción, P. and J.M. López Nieto, Novel synthesis of a vanadium–cobalt aluminophosphate molecular sieve of AEI structure (VCoAPO-18) and its catalytic behaviour for the ethane oxidation. Catalysis Communications, 2001. 2(11–12): p. 363-367.
124. Hutchings, G.J., Vanadium phosphate: A new look at the active components of catalysts for the oxidation of butane to maleic anhydride. Journal of Materials Chemistry, 2004. 14(23): p. 3385-3395.
125. López Nieto, J.M., Microporous and mesoporous materials with isolated vanadium species as selective catalysts in the gas phase oxidation reactions. Topics in Catalysis, 2001. 15(2-4): p. 189-194.
126. Possato, L.G., et al., A comparative study of glycerol dehydration catalyzed by micro/mesoporous MFI zeolites. Journal of Catalysis, 2013. 300(0): p. 102-112.
127. Haa, et al., X-Ray absorption and X-ray diffraction studies on molybdenum doped vanadium pentoxide. Physical Chemistry Chemical Physics, 2003. 5(19): p. 4317-4324.
128. P. Kierkegaard, J.M.L., The crystal structure of vanadium (IV) oxide sulphate, VOSO4. Acta Chemica Scandinavica, 1965. 19: p. 1906-1914.
144
Appendix
(i) Summary in English
The project of this Ph.D. thesis is based on a co-supervised collaboration between Università di
Bologna, ALMA MATER STUDIORUM (Italy) and Instituto de Tecnología Química, Universitat
Politècnica de València ITQ-UPV (Spain).
This Ph.D. thesis is about the synthesis, characterization and catalytic testing of complex mixed-
oxide catalysts mainly related to the family of Hexagonal Tungsten Bronzes (HTBs). The latter have
been little explored as catalysts, although they have a great potential as multifunctional materials.
Their peculiar acid properties can be coupled to other functionalities (e.g. redox sites) by
isomorphous substitution of tungsten atoms with other transition metals such as vanadium,
niobium and molybdenum.
In this PhD thesis, it was demonstrated how it is possible to prepare substituted-HTBs by
hydrothermal synthesis; these mixed-oxide were fully characterize by a number of
physicochemical techniques such as XPS, HR-TEM, XAS etc. They were also used as catalysts for
the one-pot glycerol oxidehydration to acrylic acid; this reaction might represent a viable chemical
route to solve the important issue related to the co-production of glycerin along the biodiesel
production chain. Acrylic acid yields as high as 51% were obtained and important structure-
reactivity correlations were proved to govern the catalytic performance; only fine tuning of acid
and redox properties as well as the in-framework presence of vanadium are fundamental to
achieve noteworthy yields into the acid monomer.
The overall results reported herein might represent an important contribution for future
applications of HTBs in catalysis as well as a general guideline for a multifaceted approach for
their physicochemical characterization.
145
(ii) Summary in Spanish
Esta tesis doctoral está realizada bajo un convenio de cotutela firmado por la Università di
Bologna, ALMA MATER STUDIORUM (Italia) y el Instituto de Tecnología Química, Universitat
Politècnica de València ITQ-UPV (España).
La presente tesis doctoral estudia la síntesis, caracterización y ensayos catalíticos de óxidos mixtos
relacionados con la familia de los bronces de tungsteno hexagonales. Estos materiales presentan
un importante potencial como materiales multifuncionales, aunque han sido utilizados
minoritariamente como catalizadores. . Sus peculiares propiedades ácidas pueden ser acopladas
con otras características (por ejemplo, sitios redox) a través de la substitución isomórfica de
átomos de tungsteno con otros metales de transición como vanadio, niobio y molibdeno.
En esta tesis doctoral se ha demostrado cómo es posible preparar bronces de tungsteno
hexagonales substituidos a través de síntesis hidrotermal; estos óxidos mixtos han sido
caracterizados empleando numerosas técnicas de caracterización físico-químicas - como XPS, HR-
TEM, XAS etc. Por otro lado se han utilizado como catalizadores para la síntesis directa de acido
acrílico a partir de glicerol.Esta reacción puede representar una solución viable para el problema
relacionado con la co-producción de glicerina a lo largo de la cadena productiva del biodiesel. Se
han obtenido rendimientos a acido acrílico del 51% . Además, se han observado importantes
relaciones entre las estructuras y la actividad catalítica , las cuales han sido determinantes para el
proceso catalítico. El ajuste de las propiedades acidas y redox y la presencia en-red de vanadio son
esenciales para conseguir rendimientos relevantes en el monómero acido.
En general, los resultados presentados en esta tesis doctoral pueden ser una contribución
relevante para futuras aplicaciones de los bronces de tungsteno hexagonales en catálisis y
también como una guía general para una completa caracterización físico-química de estos óxidos.
146
(iii) Summary in Valencian
Esta tesi doctoral està basada en un conveni de cotutela signat per la Università di Bologna, ALMA
MATER STUDIORUM (Italia) i el Institut de Tecnologia Química , Universitat Politècnica de València
ITQ-UPV(Espanya).
La present tesi doctoral estudia la síntesis, caracterització i assajos catalítics de òxids mixtes
relacionats amb la família dels bronzes de tungstèn hexagonals. Aquestos materials presenten un
gran potencial com materials multi funcionals, encara que no han sigut molt emprats com
catalitzadors. Les propietats àcides particulars de aquestos materials poden ser potenciades amb
altres característiques (per exemple, llocs redox) mitjançant la substitució isomòrfica d’àtoms de
tungstèn amb altres metalls de transició com vanadi, niobi i molibdè.
En aquesta tesi doctoral es demostra com es possible sintetitzar bronzes de tungstèn hexagonals
substituïts a partir de síntesis hidrotermal. Aquestos òxids mixtes han segut caracteritzats
emprant diverses tècniques de caracterització físico-químiques com XPS, HR-TEM, XAS, etc...Per
altra part, s’han utilitzat com catalitzadors per a la síntesis directa de àcid acrílic a partir de
glicerol, aquesta reacció pot representar una solució viable per al problema relacionat amb la
coproducció de glicerina al llarg de la cadena productiva de biodiesel. S’han obtingut rendiments a
àcid acrílic del 51%. A més, s’han observat importants relacions entre les estructures i la activitat
catalítica, les quals han sigut determinants per al procés catalític. El ajust de les propietats àcides i
redox i la presència en red de vanadi són essencials per a obtindre rendiments rellevants en el
monòmer àcid.
En general, el resultats presentats en aquesta tesi doctoral poden ser una contribució rellevant
per a futures aplicacions del bronzes de tungstèn hexagonal en catàlisis i també com una guia
general per a una completa caracterització físico-química d’aquestos òxids.

147
Acknowledgements
The work presented in this Ph.D. thesis is not just my work, but also the work of other people that
have given a lot of their time and passion to develop this project. First of all, and with great
pleasure, I want to thank my supervisors Prof. Fabrizio Cavani and Prof. José Manuel López Nieto,
not only for passing me some of their invaluable scientific knowledge and enthusiasm for science
but also for their kindness and help all along these years. No further words can express the
gratitude I have towards them.
I also want to thank Dr. Mª Dolores Soriano Rodriguez (Dolo) for teaching me so much about the
synthesis and characterization of HTBs as well as her patience and kindness; and, very important,
for teaching me how to cook paella! I would also like to thank Claudia Bandinelli for sharing with
me all the lab work in Bologna and carry on with the reaction tests... and, also, for her patience!
Both in Italy and in Spain many people gave me advice and help or shared with me beautiful
moments. Amada, Daniel, Lidia, Federico, Davide, Thomas... and all the people from the labs at
ITQ and DCI. All of them gave me something invaluable for my professional and personal
development.
Thank you very much!
Related Documents