Welcome message from author
This document is posted to help you gain knowledge. Please leave a comment to let me know what you think about it! Share it to your friends and learn new things together.
Transcript
SECOND NATIONAL COMMUNICATION OF CHILE TO THE UNITED NATIONS FRAMEWORK
CONVENTION ON CLIMATE CHANGE
Santiago, 2011
“All maps and references contained in this document that are related to or refer to the international frontiers
and borders of Chile’s national territory are authorized under Resolution N°322 dated 2 August 2011 of the
National Directorate of State Frontiers and Borders.
The publication and circulation of maps, geographic charts and other printed material and documents refer-
ring or related to the frontiers and borders of Chile are in no way binding upon the State of Chile, as per Article 2,
clause g) of DFL N°83 of 1979 of the Ministry of Foreign Relations of Chile.”
“Cartographic representations from foreign sources are the exclusive responsibility of their authors and are
in no way binding upon the State of Chile.”
SECOND NATIONAL COMMUNICATION OF CHILE TO THE UNITED NATIONS FRAMEWORK CONVENTION ON CLIMATE CHANGE
Project Implementation:Ministry of the Environment (2010–2011)National Environmental Commission (2007–2010)
General Project Coordinators:Andrea Rudnick (2010–2011) (Ministry of the Environment)Claudia Ferreiro (2008–2010) (National Environmental Commission)Hans Willumsen (2007–2008) (National Environmental Commission)
Technical Coordinator:Fernando Farías (Ministry of the Environment)
Executive Coordinators:Alexa Kleysteuber (2008–2011) (Ministry of the Environment)Gerardo Canales (2007–2008) (National Environmental Commission)
Proofreading (Spanish version): Mariel Sagredo, Carolina Reinoso, Fernanda Araya, Javier García and Alida Mayne-Nichols.English Translation: Joan Donaghey
Design and layout (English version): Gráfica Metropolitana. www.graficametropolitana.cl
Intellectual property registration: 207-538 (2011)
ISBN: 978-956-7204-39-7.
1. National Circumstances Chapter Coordinator:
Alexa Kleysteuber (Ministry of the Environment)Collaborators:Sebastián Vicuña, Francisco Meza, Nicolás Bambach (Center for Global Change, P.Universidad Católica)
Jenny Mager (Ministry of the Environment)
2. National Inventory of Greenhouse Gas Emissions and Removals Chapter Coordinator:
Fernando Farías (Ministry of the Environment)Collaborators:
Sergio González (Ministry of Agriculture, INIA)Aquiles Neueschwander (Ministry of Agriculture, FIA)
Paulo Cornejo (Ministry of the Environment)Sing-hi Wang (Universidad de Chile)
3. Vulnerability and Adaptation to Climate Change Chapter Coordinator:
Alexa Kleysteuber (Ministry of the Environment)Collaborators:Sebastián Vicuña, Francisco Meza, Nicolás Bambach (Center for Global Change, P. Universidad Católica)
4. Mitigation of Greenhouse Gases Chapter Coordinator:
Fernando Farías (Ministry of the Environment)Collaborators:
Jaime Bravo, Ignacio Fernández (Ministry of Energy)Daniel Barrera (Ministry of Agriculture, ODEPA)
Rubén Triviño (Ministry of Transportation and Telecommunications, SECTRA)Sarita Pimentel (Ministry of Mining, COCHILCO)
Andrea Rudnick, Alexa Kleysteuber, Jenny Mager (Ministry of the Environment)
5. Other Information Relevant to the Achievement of the Convention’s ObjectiveChapter Coordinators:
Alexa Kleysteuber and Fernando Farías (Ministry of the Environment)Collaborators:
José Luis Opazo, Ignacio Rebolledo, Luis Costa, Natalia Tobar (POCH Ambiental)Alexandra Ross (Ministry of the Environment)
6. Financial, Technical and Capacity Barriers, Gaps and NeedsChapter Coordinator:
Fernando Farías (Ministry of the Environment)Collaborators:
Alexa Kleysteuber, Alexandra Ross (Ministry of the Environment)
CHAPTER AUTHORS
I N D E X
EXECUTIVE SUMMARY
CHAPTER 1: NATIONAL CIRCUMSTANCES1. Geography and Social Development
1.1 Territory
1.2 Climate
1.3 Population
1.4 Social Development
1.5 Education
1.6 Science, Technology and Innovation
1.7 Technology Transfer
2. Economy
2.1 Chile’s Economy
2.2 Energy Sector 73
2.3 Forestry, Agriculture and Livestock Sector
2.4 Fishing Sector
2.5 Mining Sector
3. Environmental Policy
4. Institutional Structure
4.1 The Ministry of the Environment and the New
Environmental Institutional Framework
4.2 Institutional Framework for Climate Change in Chile
4.3 Sectoral Institutional Structure
Bibliography
CHAPTER 2: NATIONAL INVENTORY OF GREENHOUSE GAS EMISSIONS AND REMOVALS1. Chile’s National Greenhouse Gas Inventory (INGEI)
2. Methodological Aspects
2.1 General Characteristics of Inventories
2.2 Characteristics of the Chilean Inventory
3. GHG Emissions in Chile
3.1 Summary of the 2000 and 2006 Greenhouse Gas Inventories
3.2 Description and Interpretation of Trends in Aggregate GHG Values
3.3 Description and interpretation of trends for individual GHGs
3.4 Detailed Description and Interpretation of Emission Trends by Sector
4. GHG Emissions Memo Items
4.1 Memo Item: GHG Emission from Bunker Fuels
3.1 Economic Instruments Oriented Towards Mitigation
3.2 Other Instruments for Mitigating GHGs
3.3 Additional Proposals for Mitigating Greenhouse Gases in Chile
Bibliography
CHAPTER 5: OTHER INFORMATION RELEVANT TO THE ACHIEVEMENT OF THE CONVENTION’S OBJECTIVE 1. Introduction
2. Technology Transfer
2.1 Chile’s Technology Transfer and Innovation System
2.2 Technology Needs Assessment
2.3 Pilot Programs and Other Technology Transfer experiences in
Chile Oriented Towards Climate Change
2.4 Technology Transfer Activities and National Planning
3. Systematic Observation of Climate Variability and Climate Change
3.1 National Climate Observation Programs
3.2 Participation of Chilean institutions in
International Climate Observation
3.3 Gaps in Climate Observation
4. Climate Change Research Programs
4.1 Research Programs
4.2 Chile’s Participation in Research Activities with International,
Multilateral and Bilateral Institutions
4.3 Chilean Research Centers Working on Issues Related
to Climate Change
4.4 Strengthening Research Programs; Specific Needs and Priorities
5. Education, Training and Awareness Raising for Climate Change
5.1 Legal and Institutional Framework for Promoting Climate Change
Education and Awareness in Chile
5.2 Projects and Programs Planned and Implemented in Primary,
Secondary and Higher Education
5.3 Public Education and Awareness Campaigns Implemented by
the Government of Chile
5.4 Compendium of Climate Change Activities in the 2000–2009 Period
5.5 Gaps, Needs and Priorities for Climate
Change Education and Awareness
4.2 Memo Item: Emissions form Consumption of Wood Fuel and Biogas
5. Uncertainty in Chile’s National GHG Inventory
Bibliography
CHAPTER 3: CHILE’S VULNERABILITY AND ADAPTATION TO CLIMATE CHANGE1. Introduction
2. General Background and National Policies
2.1 Vulnerability and Adaptation in the National Climate Change Action Plan
3. Chile’s Vulnerability to Climate Change
3.1 Climatic Trends
3.2 Climate Projections
3.3 Extreme Climatic Events and Projections
3.4 Water Resources
3.5 Agriculture and Forestry Sector
3.6 Biodiversity
3.7 Coastal Zones and Sea Level Increases
4. Adaptation to Climate Change
4.1 Water Resources
4.2 Hydroelectricity Sector
4.3 Mining Sector
4.4 Forestry and Agriculture Sector
4.5 Biodiversity
4.6 Other sectors
Bibliography
CHAPTER 4: MITIGATION OF GREENHOUSE GASES 1. Introduction
1.1 Greenhouse Gas Mitigation in Chile
1.2 Mitigation in the National Climate Change Action Plan
1.3 GHG Mitigation in Chile
1.4 Results of the GHG Emissions Inventory and Identification of
Relevant Emission Sources and Sinks
2. Sector Specific Analyses
2.1 Energy Sector
2.2 Agriculture, livestock and Forestry Sector
2.3 Transportation Sector
2.4 Copper Mining Sector
3. Cross-Sectoral Actions
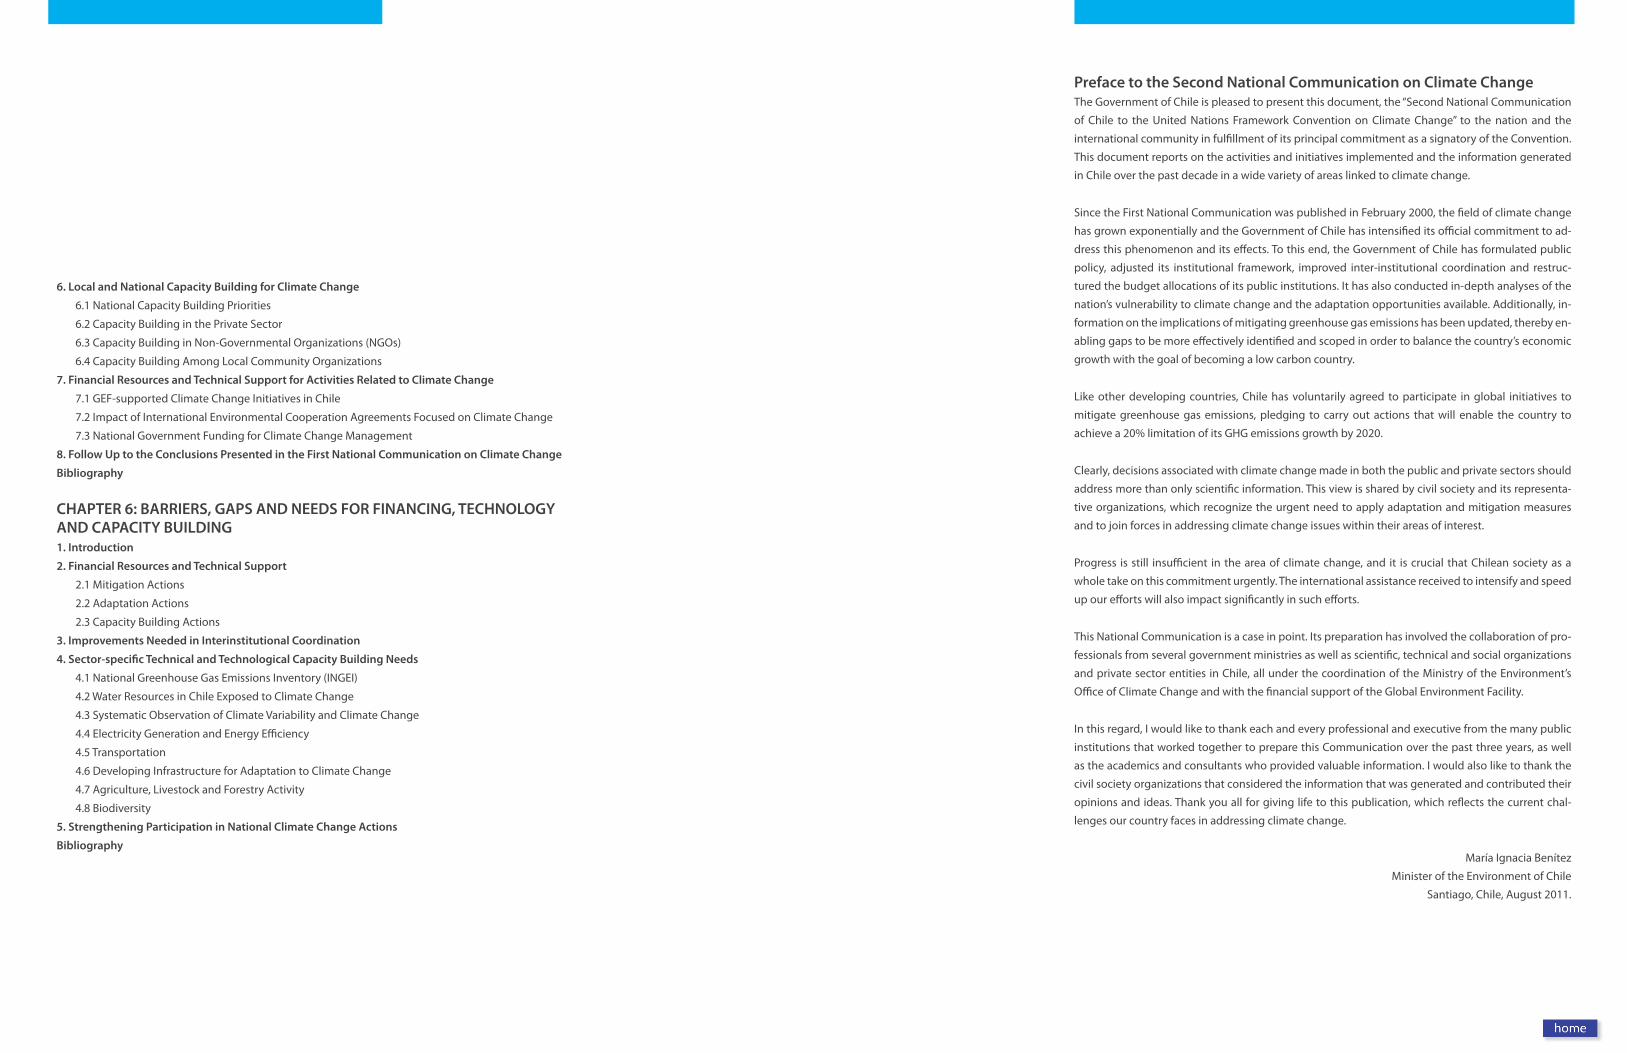
Preface to the Second National Communication on Climate Change The Government of Chile is pleased to present this document, the “Second National Communication
of Chile to the United Nations Framework Convention on Climate Change” to the nation and the
international community in fulfillment of its principal commitment as a signatory of the Convention.
This document reports on the activities and initiatives implemented and the information generated
in Chile over the past decade in a wide variety of areas linked to climate change.
Since the First National Communication was published in February 2000, the field of climate change
has grown exponentially and the Government of Chile has intensified its official commitment to ad-
dress this phenomenon and its effects. To this end, the Government of Chile has formulated public
policy, adjusted its institutional framework, improved inter-institutional coordination and restruc-
tured the budget allocations of its public institutions. It has also conducted in-depth analyses of the
nation’s vulnerability to climate change and the adaptation opportunities available. Additionally, in-
formation on the implications of mitigating greenhouse gas emissions has been updated, thereby en-
abling gaps to be more effectively identified and scoped in order to balance the country’s economic
growth with the goal of becoming a low carbon country.
Like other developing countries, Chile has voluntarily agreed to participate in global initiatives to
mitigate greenhouse gas emissions, pledging to carry out actions that will enable the country to
achieve a 20% limitation of its GHG emissions growth by 2020.
Clearly, decisions associated with climate change made in both the public and private sectors should
address more than only scientific information. This view is shared by civil society and its representa-
tive organizations, which recognize the urgent need to apply adaptation and mitigation measures
and to join forces in addressing climate change issues within their areas of interest.
Progress is still insufficient in the area of climate change, and it is crucial that Chilean society as a
whole take on this commitment urgently. The international assistance received to intensify and speed
up our efforts will also impact significantly in such efforts.
This National Communication is a case in point. Its preparation has involved the collaboration of pro-
fessionals from several government ministries as well as scientific, technical and social organizations
and private sector entities in Chile, all under the coordination of the Ministry of the Environment’s
Office of Climate Change and with the financial support of the Global Environment Facility.
In this regard, I would like to thank each and every professional and executive from the many public
institutions that worked together to prepare this Communication over the past three years, as well
as the academics and consultants who provided valuable information. I would also like to thank the
civil society organizations that considered the information that was generated and contributed their
opinions and ideas. Thank you all for giving life to this publication, which reflects the current chal-
lenges our country faces in addressing climate change.
María Ignacia Benítez
Minister of the Environment of Chile
Santiago, Chile, August 2011.
6. Local and National Capacity Building for Climate Change
6.1 National Capacity Building Priorities
6.2 Capacity Building in the Private Sector
6.3 Capacity Building in Non-Governmental Organizations (NGOs)
6.4 Capacity Building Among Local Community Organizations
7. Financial Resources and Technical Support for Activities Related to Climate Change
7.1 GEF-supported Climate Change Initiatives in Chile
7.2 Impact of International Environmental Cooperation Agreements Focused on Climate Change
7.3 National Government Funding for Climate Change Management
8. Follow Up to the Conclusions Presented in the First National Communication on Climate Change
Bibliography
CHAPTER 6: BARRIERS, GAPS AND NEEDS FOR FINANCING, TECHNOLOGY AND CAPACITY BUILDING1. Introduction
2. Financial Resources and Technical Support
2.1 Mitigation Actions
2.2 Adaptation Actions
2.3 Capacity Building Actions
3. Improvements Needed in Interinstitutional Coordination
4. Sector-specific Technical and Technological Capacity Building Needs
4.1 National Greenhouse Gas Emissions Inventory (INGEI)
4.2 Water Resources in Chile Exposed to Climate Change
4.3 Systematic Observation of Climate Variability and Climate Change
4.4 Electricity Generation and Energy Efficiency
4.5 Transportation
4.6 Developing Infrastructure for Adaptation to Climate Change
4.7 Agriculture, Livestock and Forestry Activity
4.8 Biodiversity
5. Strengthening Participation in National Climate Change Actions
Bibliography
13
Executive Summary
1. NATIONAL CIRCUMSTANCES
1.1 MAIN CHARACTERISTICS OF THE COUNTRY
Territory
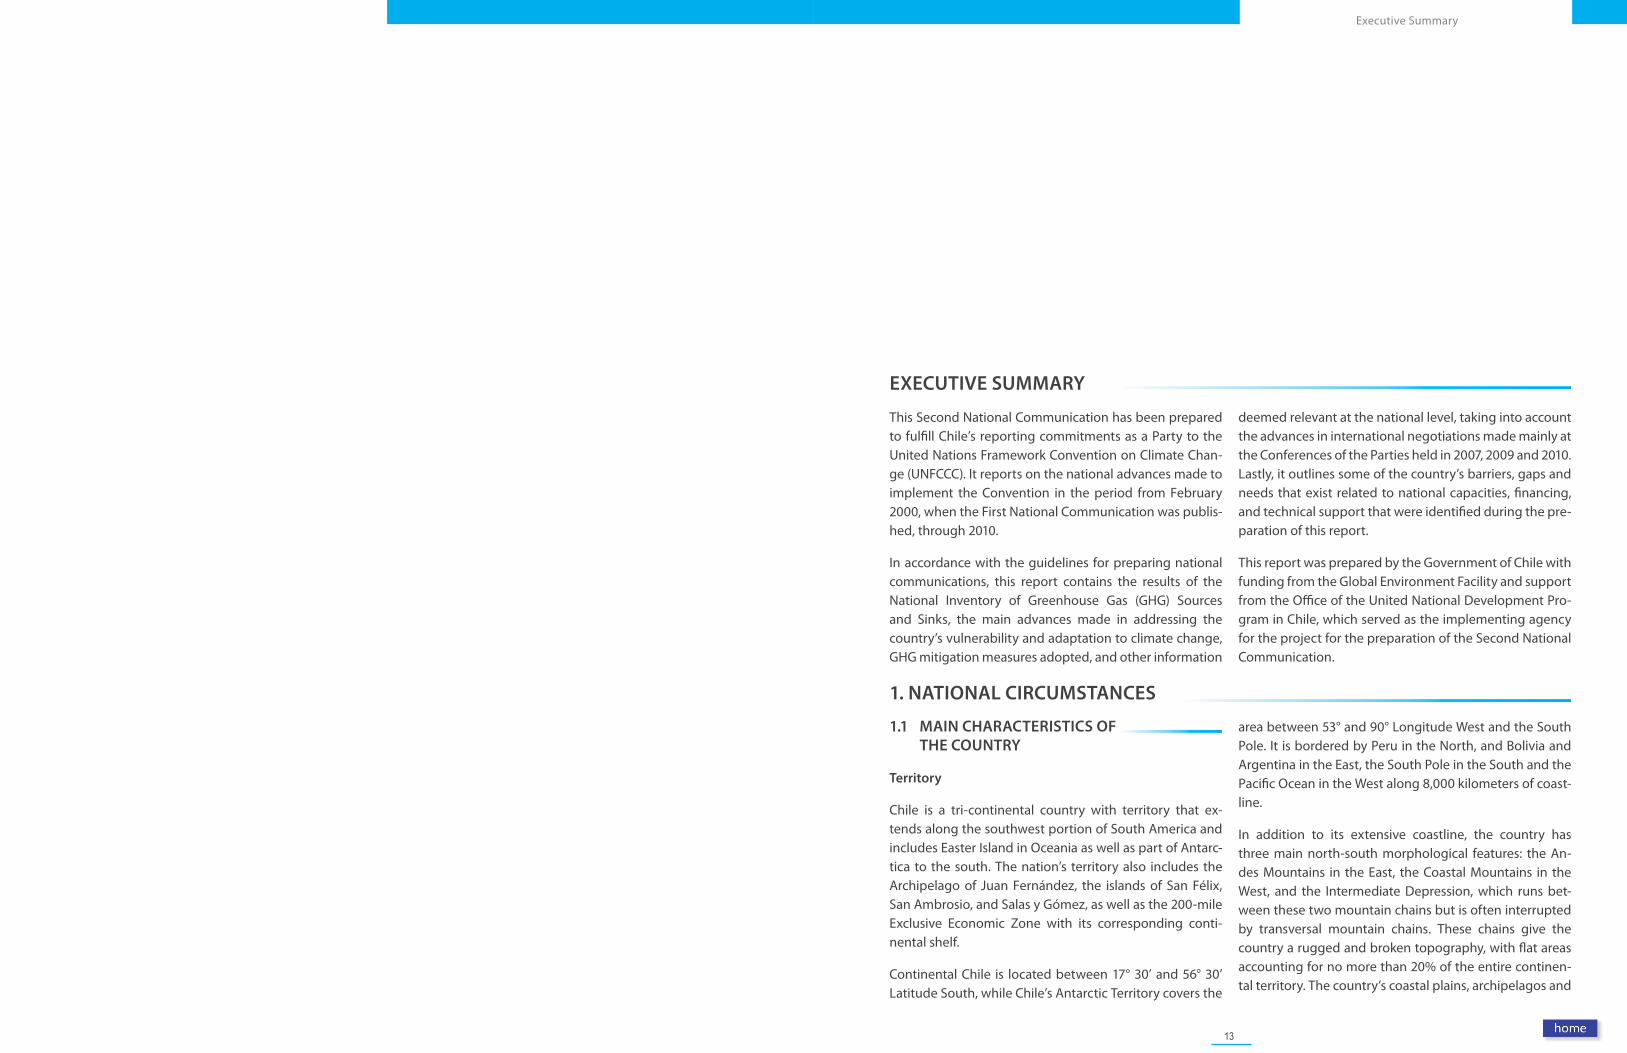
Chile is a tri-continental country with territory that ex-tends along the southwest portion of South America and includes Easter Island in Oceania as well as part of Antarc-tica to the south. The nation’s territory also includes the Archipelago of Juan Fernández, the islands of San Félix, San Ambrosio, and Salas y Gómez, as well as the 200-mile Exclusive Economic Zone with its corresponding conti-nental shelf.
Continental Chile is located between 17° 30’ and 56° 30’ Latitude South, while Chile’s Antarctic Territory covers the
area between 53° and 90° Longitude West and the South Pole. It is bordered by Peru in the North, and Bolivia and Argentina in the East, the South Pole in the South and the Pacific Ocean in the West along 8,000 kilometers of coast-line.
In addition to its extensive coastline, the country has three main north-south morphological features: the An-des Mountains in the East, the Coastal Mountains in the West, and the Intermediate Depression, which runs bet-ween these two mountain chains but is often interrupted by transversal mountain chains. These chains give the country a rugged and broken topography, with flat areas accounting for no more than 20% of the entire continen-tal territory. The country’s coastal plains, archipelagos and
EXECUTIVE SUMMARY
This Second National Communication has been prepared to fulfill Chile’s reporting commitments as a Party to the United Nations Framework Convention on Climate Chan-ge (UNFCCC). It reports on the national advances made to implement the Convention in the period from February 2000, when the First National Communication was publis-hed, through 2010.
In accordance with the guidelines for preparing national communications, this report contains the results of the National Inventory of Greenhouse Gas (GHG) Sources and Sinks, the main advances made in addressing the country’s vulnerability and adaptation to climate change, GHG mitigation measures adopted, and other information
deemed relevant at the national level, taking into account the advances in international negotiations made mainly at the Conferences of the Parties held in 2007, 2009 and 2010. Lastly, it outlines some of the country’s barriers, gaps and needs that exist related to national capacities, financing, and technical support that were identified during the pre-paration of this report.
This report was prepared by the Government of Chile with funding from the Global Environment Facility and support from the Office of the United National Development Pro-gram in Chile, which served as the implementing agency for the project for the preparation of the Second National Communication.
14 15
Executive SummarySecond National Communication of Chile
1.2 ENVIRONMENTAL POLICY AND INSTITUTIONAL STRUCTURE
Environmental Policy
The country´s comprehensive development strategy in-cludes national policies oriented to foster sustainable de-velopment. Chile’s Constitution guarantees its citizens the basic right to live in an environment free of pollution and makes the State responsible for safeguarding and preser-ving nature and the country’s environmental heritage.
The country faces numerous environmental challenges, however, such as achieving compliance with primary air quality standards in several of its cities. One especially im-portant issue is agricultural soil degradation. The amount
of land affected by water and wind erosion, salinity, con-tamination, gravel extraction and other activities has in-creased dramatically, and it is estimated that virtually all of the country’s soils display some level of degradation. The absence of effective soil management and soil conserva-tion objectives has led to a major loss of fertility as well as much desertification and flooding.
In regard to water resources, freshwater extraction increa-sed by 160% between 1990 and 2002. The Government of Chile estimates that by 2017, water demand by house-holds, mining and industry will have practically doubled over 1992 levels, and agricultural use will have risen by 20%. Water for irrigation accounts for most of the water consumed in Chile, and major advances are being made
TABLE 1. Chile’s Key Indicators
Information Source
Geography
Total Area (km2) 2,006,096 Military Geographical Institute
Population in 2000 15,397,784 National Statistics Institute
Population in 2010 17,094,275 National Statistics Institute
Projected population in 2050 20,204,779 National Statistics Institute
Rural population (% of the total, 2009) 11% World Bank
Forested Area (2007) 22% National Forestry Corporation
Human Development
Human Development Index (2010) 0.783 UNDP
Literacy Rate (2008) 99% World Bank
Life Expectancy at Birth (2010) 78.8 World Bank
Infant mortality per 1000 live births (2007) 7 World Bank
Potable water coverage (2009) 99.8% Superintendency of Sanitation Services
Sewerage coverage (2009) 95.6% Superintendency of Sanitation Services
Public spending on Education as a % of GDP (2008) 4.2% Ministry of Education
Public spending on R&D 2008 (millions 2008 US$) 351.7 Ministry of Economy
Economic Activity
GDP (PPP) estimated for 2011 (millions of 2011 US$) 276,053 International Monetary Fund
GDP (PPP) per capita estimated for 2011 (US$) 15,866 International Monetary Fund
GDP (PPP) growth in 2009 -0.8% International Monetary Fund
GDP (PPP) growth in 2010 6.3% International Monetary Fund
Estimated GDP (PPP) growth in 2011 6 -7% Chilean Central Bank
Goods and services exported (% of GDP, 2009) 38% World Bank
Sectoral Activity
Renewable energy (% of energy mix in 2009) 29% Ministry of Energy
Imports of primary energy (% of energy use, 2009) 62% Ministry of Energy
Consumption of fossil fuel as primary energy (% of total, in 2009) 71% Ministry of Energy
Water consumption by irrigation (as a % of total national water use) 84.5% General Directorate of Water
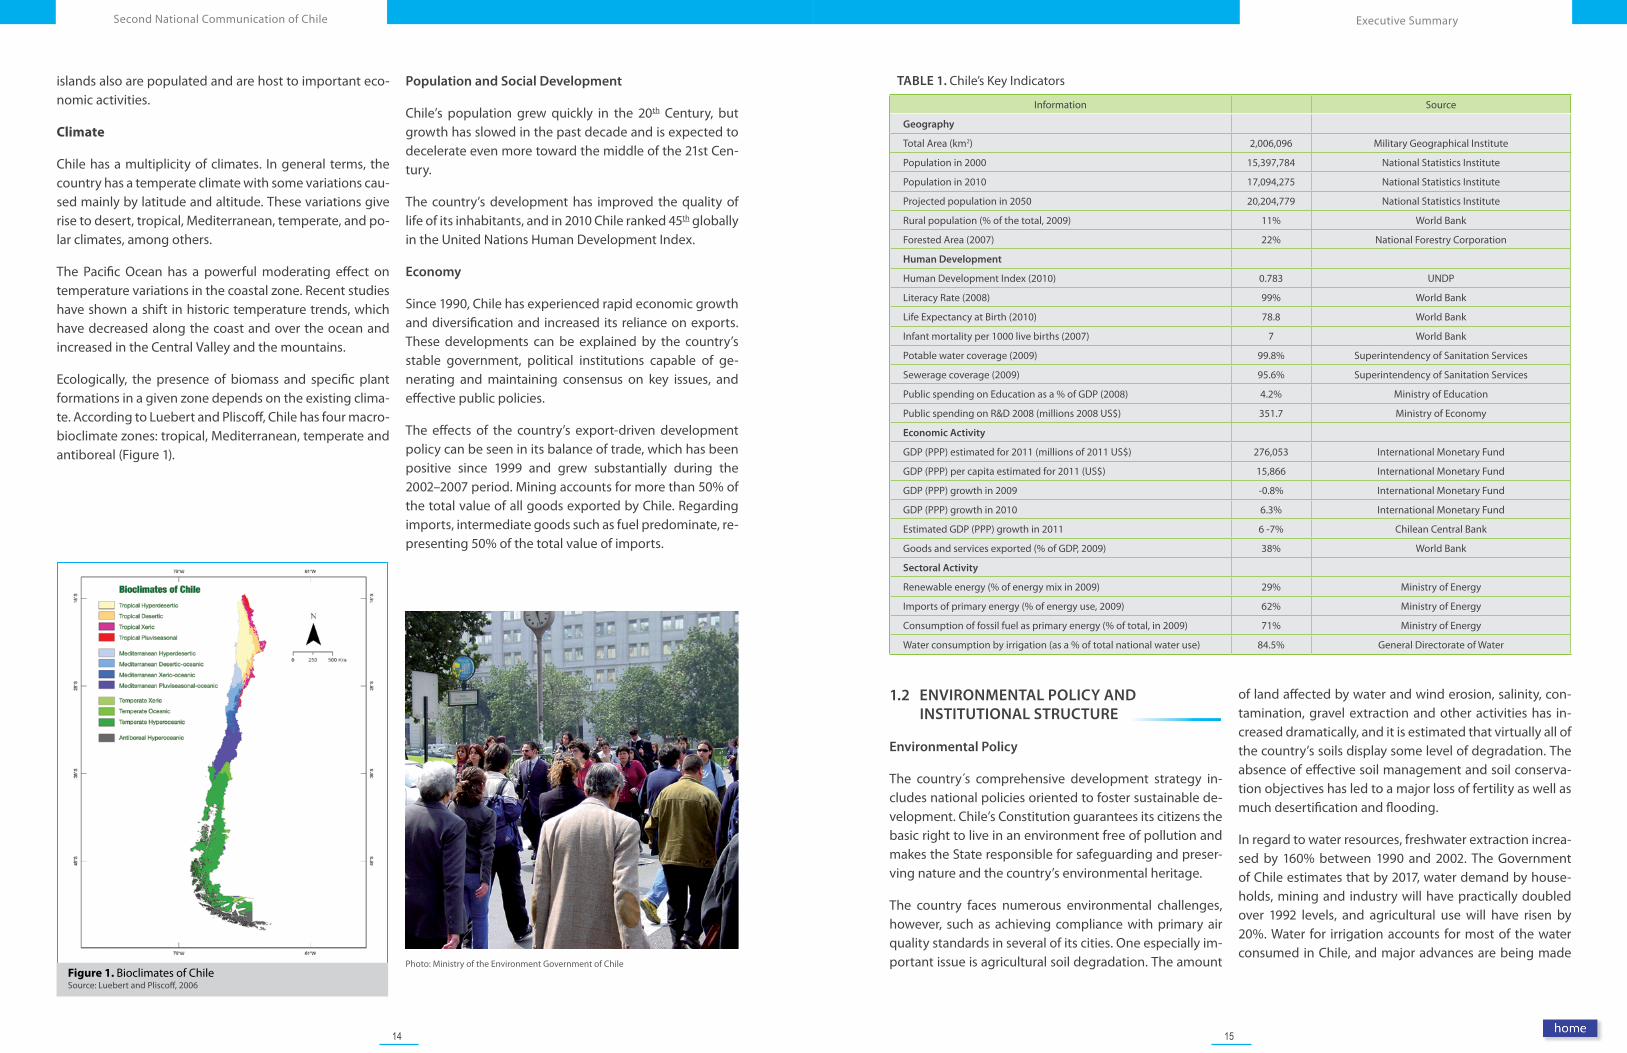
Figure 1. Bioclimates of ChileSource: Luebert and Pliscoff, 2006
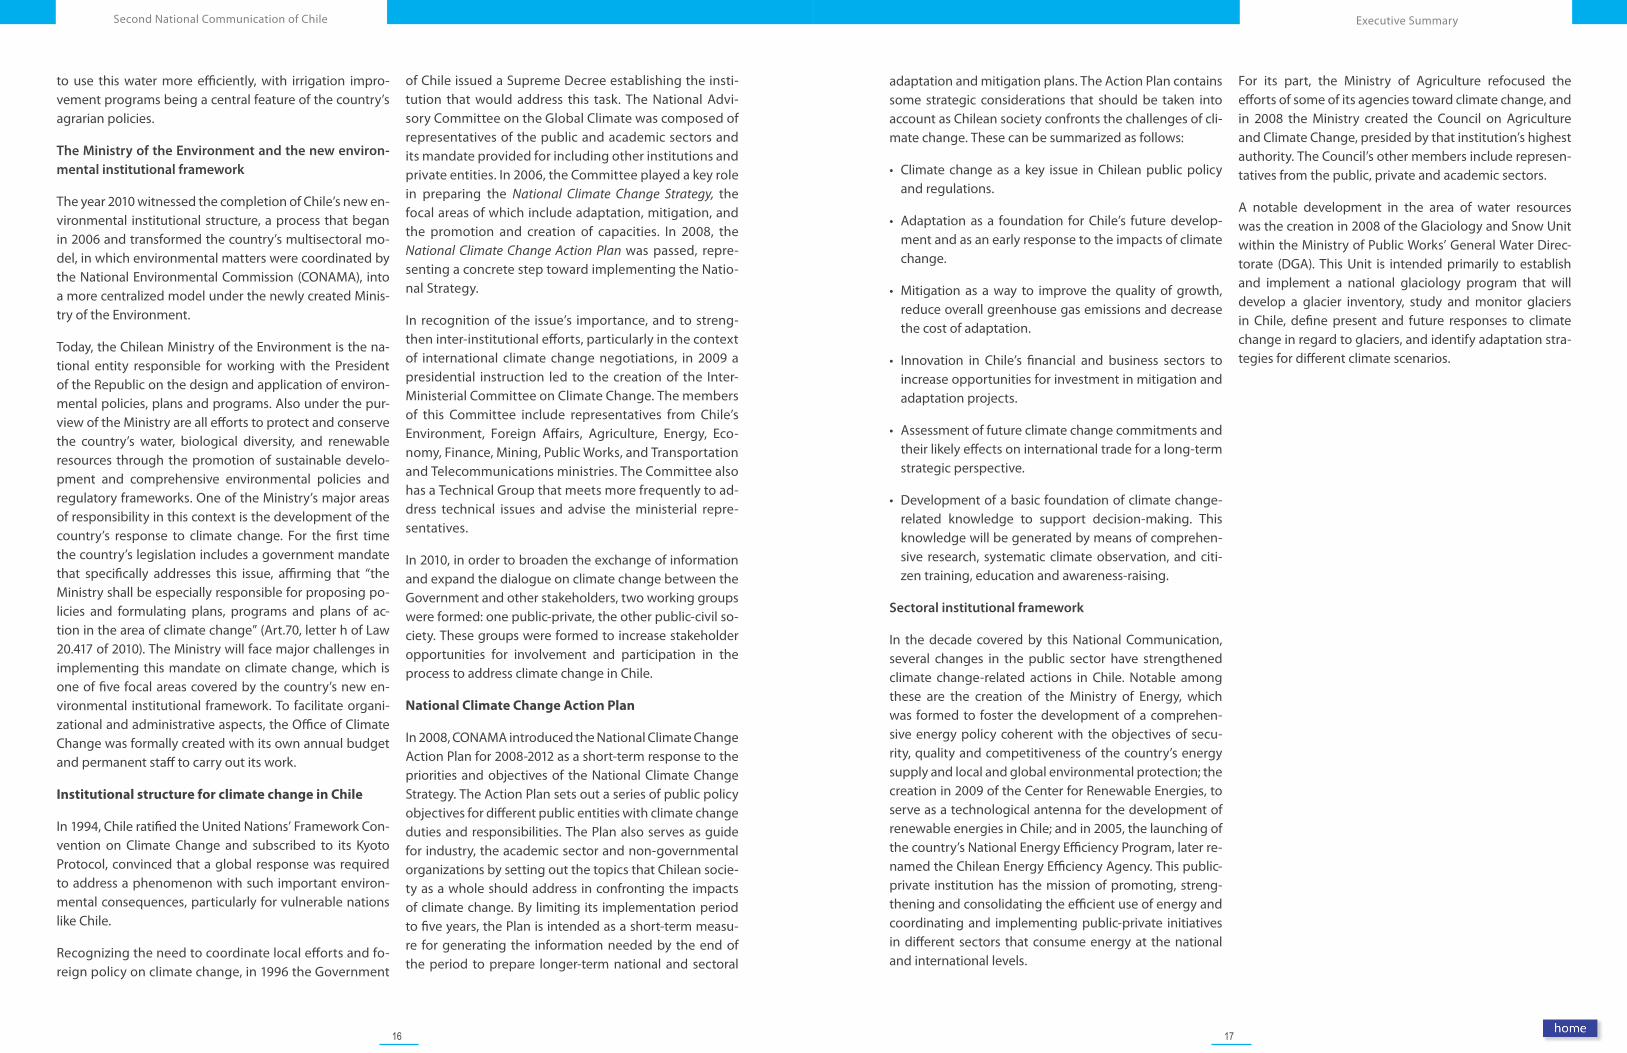
Photo: Ministry of the Environment Government of Chile
islands also are populated and are host to important eco-nomic activities.
Climate
Chile has a multiplicity of climates. In general terms, the country has a temperate climate with some variations cau-sed mainly by latitude and altitude. These variations give rise to desert, tropical, Mediterranean, temperate, and po-lar climates, among others.
The Pacific Ocean has a powerful moderating effect on temperature variations in the coastal zone. Recent studies have shown a shift in historic temperature trends, which have decreased along the coast and over the ocean and increased in the Central Valley and the mountains.
Ecologically, the presence of biomass and specific plant formations in a given zone depends on the existing clima-te. According to Luebert and Pliscoff, Chile has four macro-bioclimate zones: tropical, Mediterranean, temperate and antiboreal (Figure 1).
Population and Social Development
Chile’s population grew quickly in the 20th Century, but growth has slowed in the past decade and is expected to decelerate even more toward the middle of the 21st Cen-tury.
The country’s development has improved the quality of life of its inhabitants, and in 2010 Chile ranked 45th globally in the United Nations Human Development Index.
Economy
Since 1990, Chile has experienced rapid economic growth and diversification and increased its reliance on exports. These developments can be explained by the country’s stable government, political institutions capable of ge-nerating and maintaining consensus on key issues, and effective public policies.
The effects of the country’s export-driven development policy can be seen in its balance of trade, which has been positive since 1999 and grew substantially during the 2002–2007 period. Mining accounts for more than 50% of the total value of all goods exported by Chile. Regarding imports, intermediate goods such as fuel predominate, re-presenting 50% of the total value of imports.
16 17
Executive SummarySecond National Communication of Chile
adaptation and mitigation plans. The Action Plan contains some strategic considerations that should be taken into account as Chilean society confronts the challenges of cli-mate change. These can be summarized as follows:
• Climate change as a key issue in Chilean public policy and regulations.
• Adaptation as a foundation for Chile’s future develop-ment and as an early response to the impacts of climate change.
• Mitigation as a way to improve the quality of growth, reduce overall greenhouse gas emissions and decrease the cost of adaptation.
• Innovation in Chile’s financial and business sectors to increase opportunities for investment in mitigation and adaptation projects.
• Assessment of future climate change commitments and their likely effects on international trade for a long-term strategic perspective.
• Development of a basic foundation of climate change-related knowledge to support decision-making. This knowledge will be generated by means of comprehen-sive research, systematic climate observation, and citi-zen training, education and awareness-raising.
Sectoral institutional framework
In the decade covered by this National Communication, several changes in the public sector have strengthened climate change-related actions in Chile. Notable among these are the creation of the Ministry of Energy, which was formed to foster the development of a comprehen-sive energy policy coherent with the objectives of secu-rity, quality and competitiveness of the country’s energy supply and local and global environmental protection; the creation in 2009 of the Center for Renewable Energies, to serve as a technological antenna for the development of renewable energies in Chile; and in 2005, the launching of the country’s National Energy Efficiency Program, later re-named the Chilean Energy Efficiency Agency. This public-private institution has the mission of promoting, streng-thening and consolidating the efficient use of energy and coordinating and implementing public-private initiatives in different sectors that consume energy at the national and international levels.
For its part, the Ministry of Agriculture refocused the efforts of some of its agencies toward climate change, and in 2008 the Ministry created the Council on Agriculture and Climate Change, presided by that institution’s highest authority. The Council’s other members include represen-tatives from the public, private and academic sectors.
A notable development in the area of water resources was the creation in 2008 of the Glaciology and Snow Unit within the Ministry of Public Works’ General Water Direc-torate (DGA). This Unit is intended primarily to establish and implement a national glaciology program that will develop a glacier inventory, study and monitor glaciers in Chile, define present and future responses to climate change in regard to glaciers, and identify adaptation stra-tegies for different climate scenarios.
to use this water more efficiently, with irrigation impro-vement programs being a central feature of the country’s agrarian policies.
The Ministry of the Environment and the new environ-mental institutional framework
The year 2010 witnessed the completion of Chile’s new en-vironmental institutional structure, a process that began in 2006 and transformed the country’s multisectoral mo-del, in which environmental matters were coordinated by the National Environmental Commission (CONAMA), into a more centralized model under the newly created Minis-try of the Environment.
Today, the Chilean Ministry of the Environment is the na-tional entity responsible for working with the President of the Republic on the design and application of environ-mental policies, plans and programs. Also under the pur-view of the Ministry are all efforts to protect and conserve the country’s water, biological diversity, and renewable resources through the promotion of sustainable develo-pment and comprehensive environmental policies and regulatory frameworks. One of the Ministry’s major areas of responsibility in this context is the development of the country’s response to climate change. For the first time the country’s legislation includes a government mandate that specifically addresses this issue, affirming that “the Ministry shall be especially responsible for proposing po-licies and formulating plans, programs and plans of ac-tion in the area of climate change” (Art.70, letter h of Law 20.417 of 2010). The Ministry will face major challenges in implementing this mandate on climate change, which is one of five focal areas covered by the country’s new en-vironmental institutional framework. To facilitate organi-zational and administrative aspects, the Office of Climate Change was formally created with its own annual budget and permanent staff to carry out its work.
Institutional structure for climate change in Chile
In 1994, Chile ratified the United Nations’ Framework Con-vention on Climate Change and subscribed to its Kyoto Protocol, convinced that a global response was required to address a phenomenon with such important environ-mental consequences, particularly for vulnerable nations like Chile.
Recognizing the need to coordinate local efforts and fo-reign policy on climate change, in 1996 the Government
of Chile issued a Supreme Decree establishing the insti-tution that would address this task. The National Advi-sory Committee on the Global Climate was composed of representatives of the public and academic sectors and its mandate provided for including other institutions and private entities. In 2006, the Committee played a key role in preparing the National Climate Change Strategy, the focal areas of which include adaptation, mitigation, and the promotion and creation of capacities. In 2008, the National Climate Change Action Plan was passed, repre-senting a concrete step toward implementing the Natio-nal Strategy.
In recognition of the issue’s importance, and to streng-then inter-institutional efforts, particularly in the context of international climate change negotiations, in 2009 a presidential instruction led to the creation of the Inter-Ministerial Committee on Climate Change. The members of this Committee include representatives from Chile’s Environment, Foreign Affairs, Agriculture, Energy, Eco-nomy, Finance, Mining, Public Works, and Transportation and Telecommunications ministries. The Committee also has a Technical Group that meets more frequently to ad-dress technical issues and advise the ministerial repre-sentatives.
In 2010, in order to broaden the exchange of information and expand the dialogue on climate change between the Government and other stakeholders, two working groups were formed: one public-private, the other public-civil so-ciety. These groups were formed to increase stakeholder opportunities for involvement and participation in the process to address climate change in Chile.
National Climate Change Action Plan
In 2008, CONAMA introduced the National Climate Change Action Plan for 2008-2012 as a short-term response to the priorities and objectives of the National Climate Change Strategy. The Action Plan sets out a series of public policy objectives for different public entities with climate change duties and responsibilities. The Plan also serves as guide for industry, the academic sector and non-governmental organizations by setting out the topics that Chilean socie-ty as a whole should address in confronting the impacts of climate change. By limiting its implementation period to five years, the Plan is intended as a short-term measu-re for generating the information needed by the end of the period to prepare longer-term national and sectoral
18 19
Executive SummarySecond National Communication of Chile
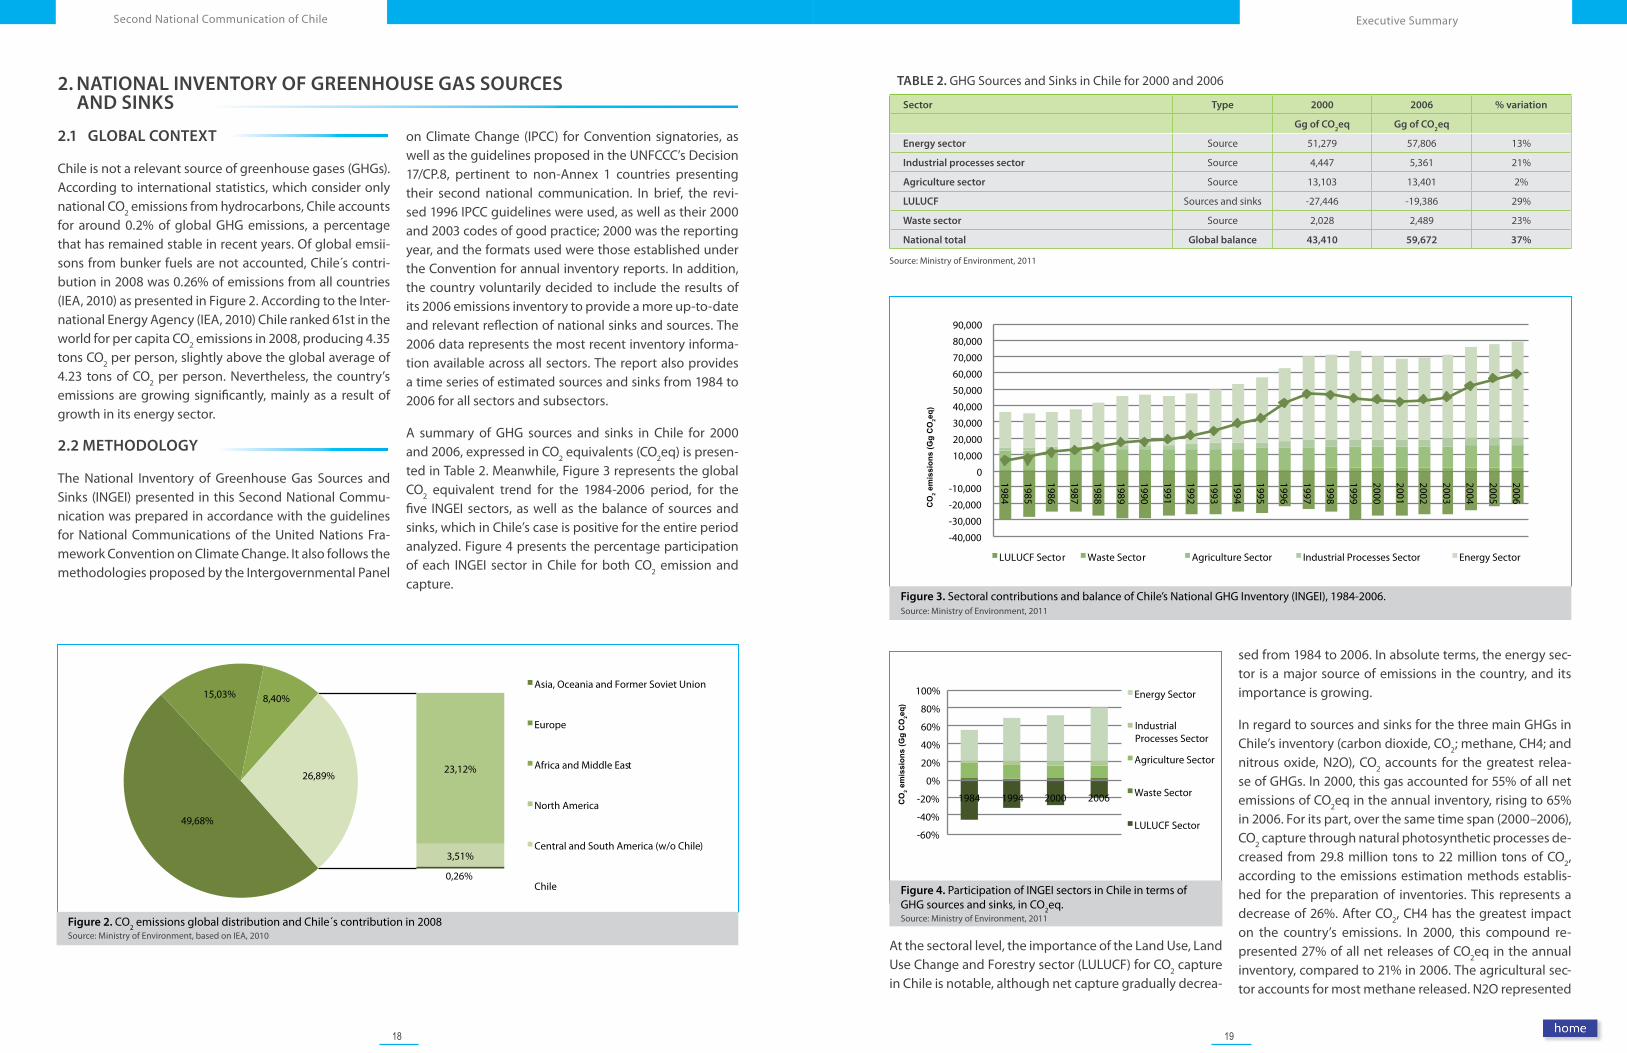
Figure 3. Sectoral contributions and balance of Chile’s National GHG Inventory (INGEI), 1984-2006.Source: Ministry of Environment, 2011
Figure 4. Participation of INGEI sectors in Chile in terms of GHG sources and sinks, in CO2eq.Source: Ministry of Environment, 2011
TABLE 2. GHG Sources and Sinks in Chile for 2000 and 2006
Sector Type 2000 2006 % variation
Gg of CO2eq Gg of CO
2eq
Energy sector Source 51,279 57,806 13%
Industrial processes sector Source 4,447 5,361 21%
Agriculture sector Source 13,103 13,401 2%
LULUCF Sources and sinks -27,446 -19,386 29%
Waste sector Source 2,028 2,489 23%
National total Global balance 43,410 59,672 37%
Source: Ministry of Environment, 2011
sed from 1984 to 2006. In absolute terms, the energy sec-tor is a major source of emissions in the country, and its importance is growing.
In regard to sources and sinks for the three main GHGs in Chile’s inventory (carbon dioxide, CO2; methane, CH4; and nitrous oxide, N2O), CO2 accounts for the greatest relea-se of GHGs. In 2000, this gas accounted for 55% of all net emissions of CO2eq in the annual inventory, rising to 65% in 2006. For its part, over the same time span (2000–2006), CO2 capture through natural photosynthetic processes de-creased from 29.8 million tons to 22 million tons of CO2, according to the emissions estimation methods establis-hed for the preparation of inventories. This represents a decrease of 26%. After CO2, CH4 has the greatest impact on the country’s emissions. In 2000, this compound re-presented 27% of all net releases of CO2eq in the annual inventory, compared to 21% in 2006. The agricultural sec-tor accounts for most methane released. N2O represented
At the sectoral level, the importance of the Land Use, Land Use Change and Forestry sector (LULUCF) for CO2 capture in Chile is notable, although net capture gradually decrea-
CO
2 em
issi
ons
(Gg
CO
2eq)
-60%
-40%
-20%
0%
20%
40%
60%
80%
100%
1984 1994 2000 2006
Energy Sector
Agriculture Sector
Waste Sector
LULUCF Sector
Industrial Processes Sector
-40,000
-30,000
-20,000
-10,000
0
10,000
20,000
30,000
40,000
50,000
60,000
70,000
80,000
90,000
1984
1985
1986
1987
1988
1989
1990
1991
1992
1993
1994
1995
1996
1997
1998
1999
2000
2001
2002
2003
2004
2005
2006 CO
2 em
issi
ons
(Gg
CO
2eq)
LULUCF Sector Waste Sector Agriculture Sector Industrial Processes Sector Energy Sector
2. NATIONAL INVENTORY OF GREENHOUSE GAS SOURCES AND SINKS
2.1 GLOBAL CONTEXT
Chile is not a relevant source of greenhouse gases (GHGs). According to international statistics, which consider only national CO2 emissions from hydrocarbons, Chile accounts for around 0.2% of global GHG emissions, a percentage that has remained stable in recent years. Of global emsii-sons from bunker fuels are not accounted, Chile´s contri-bution in 2008 was 0.26% of emissions from all countries (IEA, 2010) as presented in Figure 2. According to the Inter-national Energy Agency (IEA, 2010) Chile ranked 61st in the world for per capita CO2 emissions in 2008, producing 4.35 tons CO2 per person, slightly above the global average of 4.23 tons of CO2 per person. Nevertheless, the country’s emissions are growing significantly, mainly as a result of growth in its energy sector.
2.2 METHODOLOGY
The National Inventory of Greenhouse Gas Sources and Sinks (INGEI) presented in this Second National Commu-nication was prepared in accordance with the guidelines for National Communications of the United Nations Fra-mework Convention on Climate Change. It also follows the methodologies proposed by the Intergovernmental Panel
on Climate Change (IPCC) for Convention signatories, as well as the guidelines proposed in the UNFCCC’s Decision 17/CP.8, pertinent to non-Annex 1 countries presenting their second national communication. In brief, the revi-sed 1996 IPCC guidelines were used, as well as their 2000 and 2003 codes of good practice; 2000 was the reporting year, and the formats used were those established under the Convention for annual inventory reports. In addition, the country voluntarily decided to include the results of its 2006 emissions inventory to provide a more up-to-date and relevant reflection of national sinks and sources. The 2006 data represents the most recent inventory informa-tion available across all sectors. The report also provides a time series of estimated sources and sinks from 1984 to 2006 for all sectors and subsectors.
A summary of GHG sources and sinks in Chile for 2000 and 2006, expressed in CO2 equivalents (CO2eq) is presen-ted in Table 2. Meanwhile, Figure 3 represents the global CO2 equivalent trend for the 1984-2006 period, for the five INGEI sectors, as well as the balance of sources and sinks, which in Chile’s case is positive for the entire period analyzed. Figure 4 presents the percentage participation of each INGEI sector in Chile for both CO2 emission and capture.
Figure 2. CO2 emissions global distribution and Chile´s contribution in 2008Source: Ministry of Environment, based on IEA, 2010
49,68%
15,03% 8,40%
23,12%
3,51%
0,26%
26,89%
Asia, Oceania and Former Soviet Union
Europe
Africa and Middle East
North America
Central and South America (w/o Chile)
Chile
20 21
Executive SummarySecond National Communication of Chile
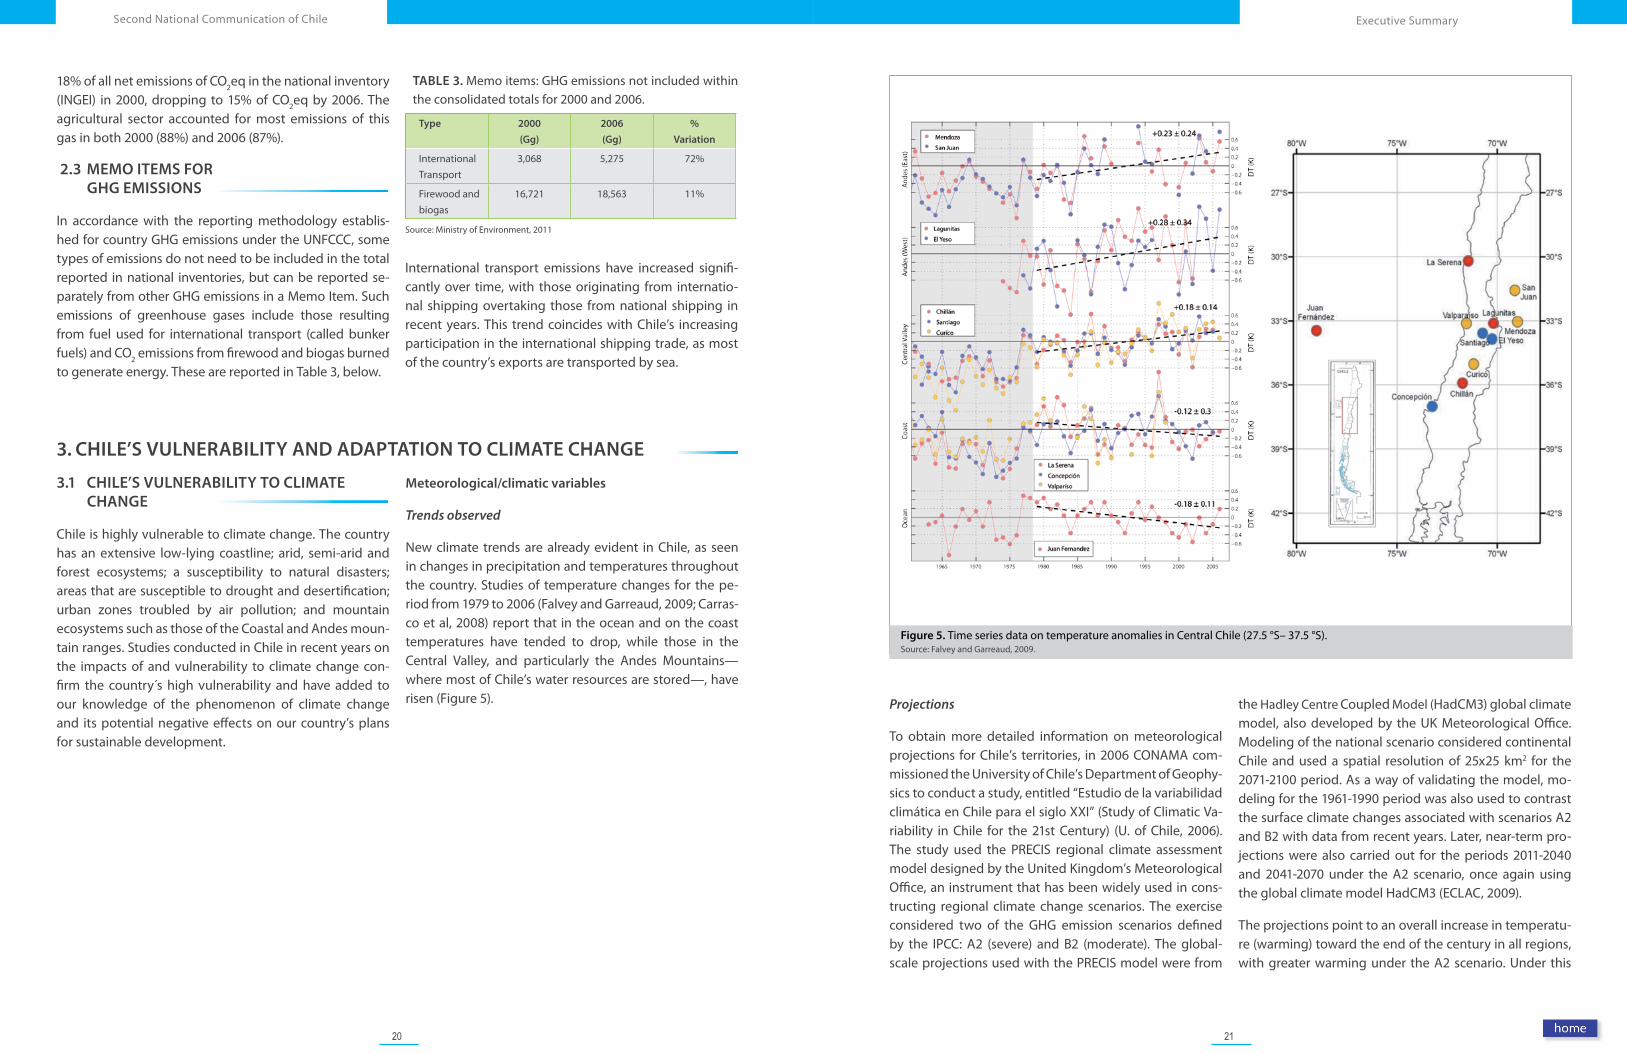
Figure 5. Time series data on temperature anomalies in Central Chile (27.5 °S– 37.5 °S).Source: Falvey and Garreaud, 2009.
Projections
To obtain more detailed information on meteorological projections for Chile’s territories, in 2006 CONAMA com-missioned the University of Chile’s Department of Geophy-sics to conduct a study, entitled “Estudio de la variabilidad climática en Chile para el siglo XXI” (Study of Climatic Va-riability in Chile for the 21st Century) (U. of Chile, 2006). The study used the PRECIS regional climate assessment model designed by the United Kingdom’s Meteorological Office, an instrument that has been widely used in cons-tructing regional climate change scenarios. The exercise considered two of the GHG emission scenarios defined by the IPCC: A2 (severe) and B2 (moderate). The global-scale projections used with the PRECIS model were from
the Hadley Centre Coupled Model (HadCM3) global climate model, also developed by the UK Meteorological Office. Modeling of the national scenario considered continental Chile and used a spatial resolution of 25x25 km2 for the 2071-2100 period. As a way of validating the model, mo-deling for the 1961-1990 period was also used to contrast the surface climate changes associated with scenarios A2 and B2 with data from recent years. Later, near-term pro-jections were also carried out for the periods 2011-2040 and 2041-2070 under the A2 scenario, once again using the global climate model HadCM3 (ECLAC, 2009).
The projections point to an overall increase in temperatu-re (warming) toward the end of the century in all regions, with greater warming under the A2 scenario. Under this
18% of all net emissions of CO2eq in the national inventory (INGEI) in 2000, dropping to 15% of CO2eq by 2006. The agricultural sector accounted for most emissions of this gas in both 2000 (88%) and 2006 (87%).
2.3 MEMO ITEMS FOR GHG EMISSIONS
In accordance with the reporting methodology establis-hed for country GHG emissions under the UNFCCC, some types of emissions do not need to be included in the total reported in national inventories, but can be reported se-parately from other GHG emissions in a Memo Item. Such emissions of greenhouse gases include those resulting from fuel used for international transport (called bunker fuels) and CO2 emissions from firewood and biogas burned to generate energy. These are reported in Table 3, below.
TABLE 3. Memo items: GHG emissions not included within the consolidated totals for 2000 and 2006.
Type 2000
(Gg)
2006
(Gg)
%
Variation
International Transport
3,068 5,275 72%
Firewood and biogas
16,721 18,563 11%
Source: Ministry of Environment, 2011
International transport emissions have increased signifi-cantly over time, with those originating from internatio-nal shipping overtaking those from national shipping in recent years. This trend coincides with Chile’s increasing participation in the international shipping trade, as most of the country’s exports are transported by sea.
3. CHILE’S VULNERABILITY AND ADAPTATION TO CLIMATE CHANGE
3.1 CHILE’S VULNERABILITY TO CLIMATE CHANGE
Chile is highly vulnerable to climate change. The country has an extensive low-lying coastline; arid, semi-arid and forest ecosystems; a susceptibility to natural disasters; areas that are susceptible to drought and desertification; urban zones troubled by air pollution; and mountain ecosystems such as those of the Coastal and Andes moun-tain ranges. Studies conducted in Chile in recent years on the impacts of and vulnerability to climate change con-firm the country´s high vulnerability and have added to our knowledge of the phenomenon of climate change and its potential negative effects on our country’s plans for sustainable development.
Meteorological/climatic variables
Trends observed
New climate trends are already evident in Chile, as seen in changes in precipitation and temperatures throughout the country. Studies of temperature changes for the pe-riod from 1979 to 2006 (Falvey and Garreaud, 2009; Carras-co et al, 2008) report that in the ocean and on the coast temperatures have tended to drop, while those in the Central Valley, and particularly the Andes Mountains—where most of Chile’s water resources are stored—, have risen (Figure 5).
22 23
Executive SummarySecond National Communication of Chile
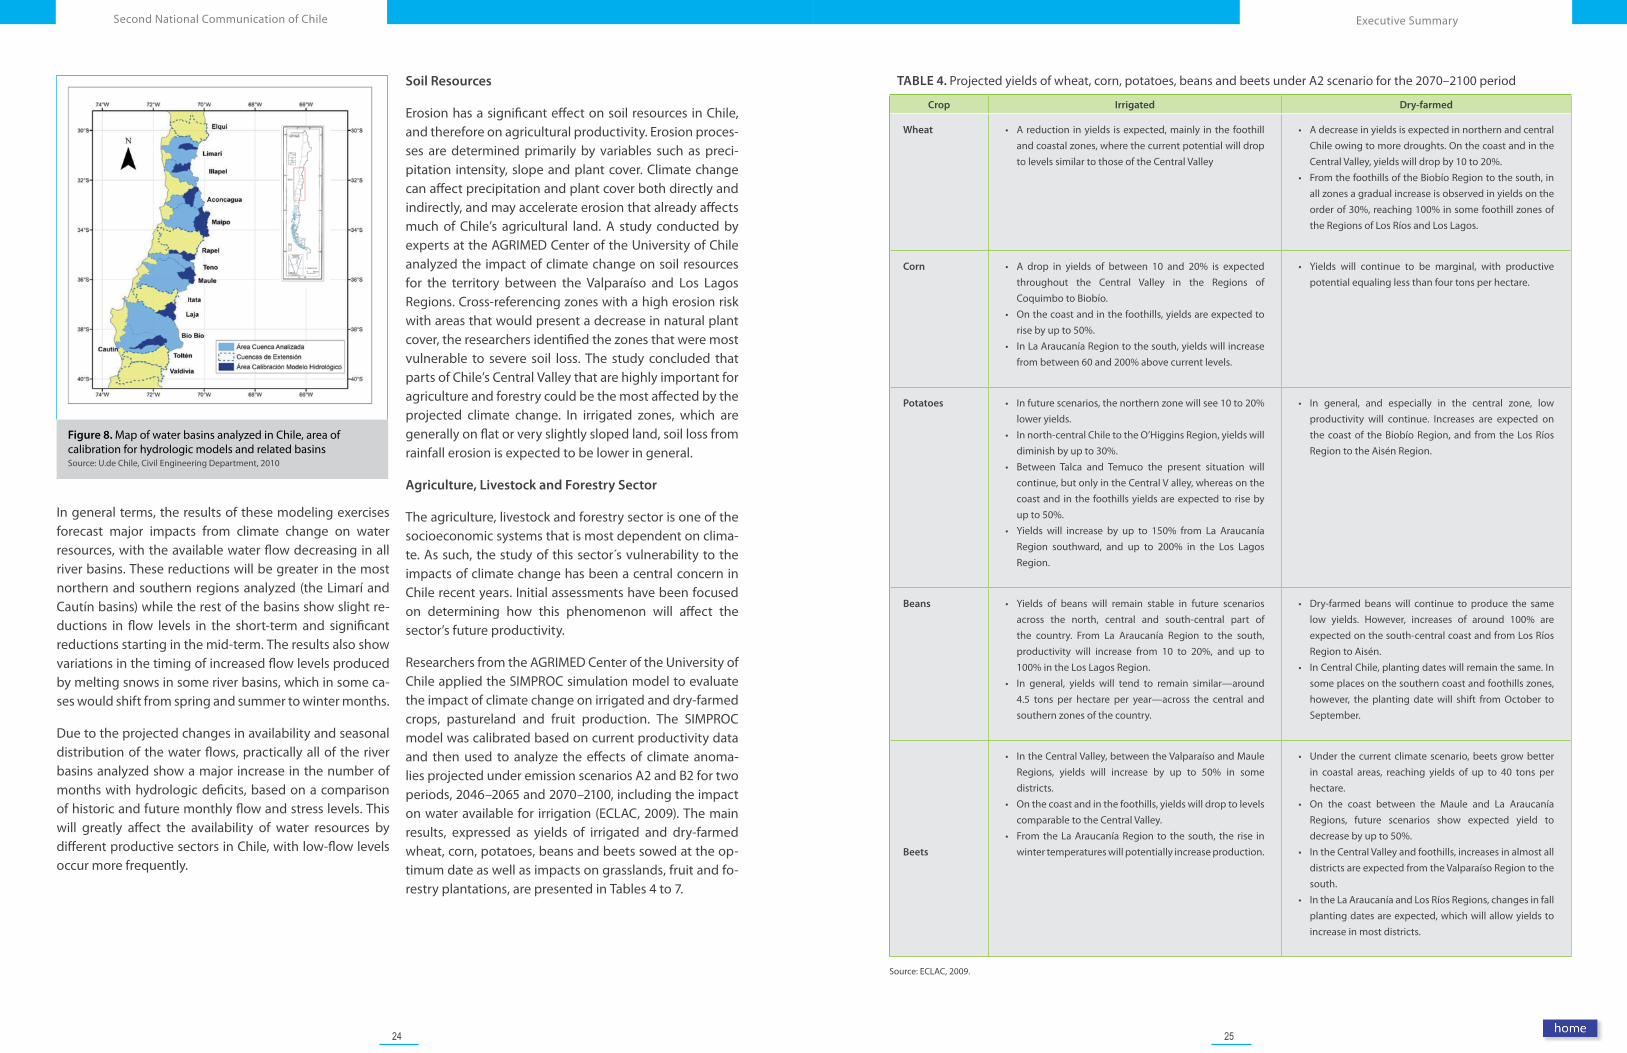
Figure 7. Percentages from models projecting an increase in precipitation in Chile for the 2010–2040 period.Source: ECLAC, 2009
Water Resources
In Chile, the availability of water resources is closely tied to the climate, and it is therefore expected that changes in temperature and precipitation predicted by the models used to forecast the continental Chilean climate in the 21st Century will affect these resources, especially under the most severe scenarios (A2).
The expected temperature increases associated with cli-mate change will reduce the mountainous area capable of storing snow over successive years. This occurs as the 0°C isothermal line, or snow line, shifts to higher altitudes, lea-ding to an increase in melt water and river volume during winter months and a reduction in water reserves stored as snow (Carrasco et al, 2005).
Glaciers
Glaciers act as strategic water reserves, as they not only supply water to river basins in summer, but are the single most important source of replenishment for rivers, lakes and groundwater in arid regions and during periods of drought. Chile has the highest continental concentration of glaciers in the Southern Hemisphere. According to an inventory supplied by the Glaciology and Snow Unit of the General Directorate of Water, in 2007 the country’s 1,835 glaciers composed an total area of 15,500 km2. Non-inventoried ice is estimated to cover an additional 4,700 km2, meaning that the country has more than 20,000 km2 of ice reserves, 75% of which is found in the Northern and Southern Patagonian Ice Fields located in the Aisén and Magallanes Regions.
Studies conducted on Chile’s glaciers indicate that many of them are in retreat. Of 100 glaciers assessed by Rivera et al. in 2000, 87% displayed shrinkage associated with chan-ges in historic patterns of climatic variables. For example, in the last 50 years the Cipreses glacier, which feeds the Cachapoal River basin with its runoff, has been retreating at a rate of 27 meters per year, 3 times as fast as the rate observed since 1860 (Rivera et. al, 2007). It is estimated that increases in temperature and solar radiation in the mountains and decreases in precipitation will continue to shrink the area covered by Andean glaciers; this in turn will continue to impact the availability of water in basins with significant meltwater runoff, mainly those located between the Aconcagua and Cachapoal rivers and some in the north of the country. This effect will become increa-singly apparent in summer and fall, when the supply of water from precipitation and melting snow usually drops.
Hydrologic analysis of selected basins
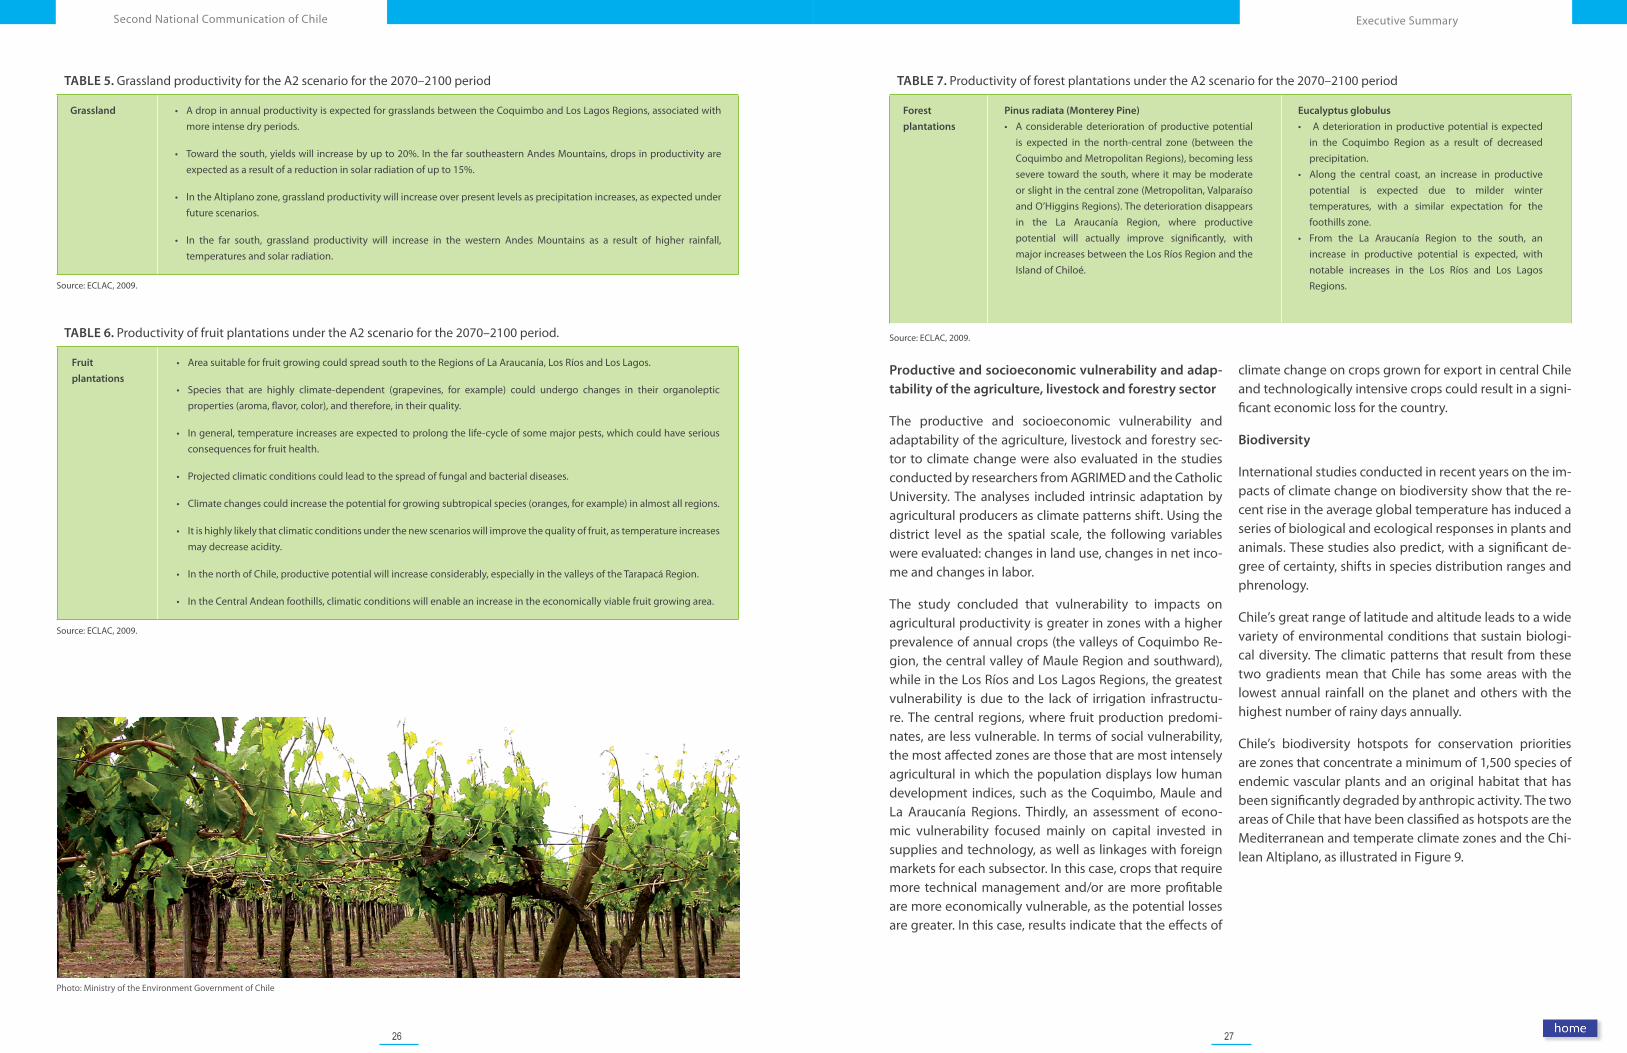
Studies conducted by researchers from the University of Chile and the Catholic University of Chile between 2008 and 2010 used hydrologic models to carry out the first ever quantification of the impacts climate change on water re-sources in Chile. The research looked at the impacts that predicted changes in temperature, evapotranspiration and precipitation under the A2 scenario of the HadCM3 would have on hydrologic resources eight river basins lo-cated along the central valley of Chile, located from the Regions of Coquimbo to La Araucanía. Figure 8 shows the results of this exercise.
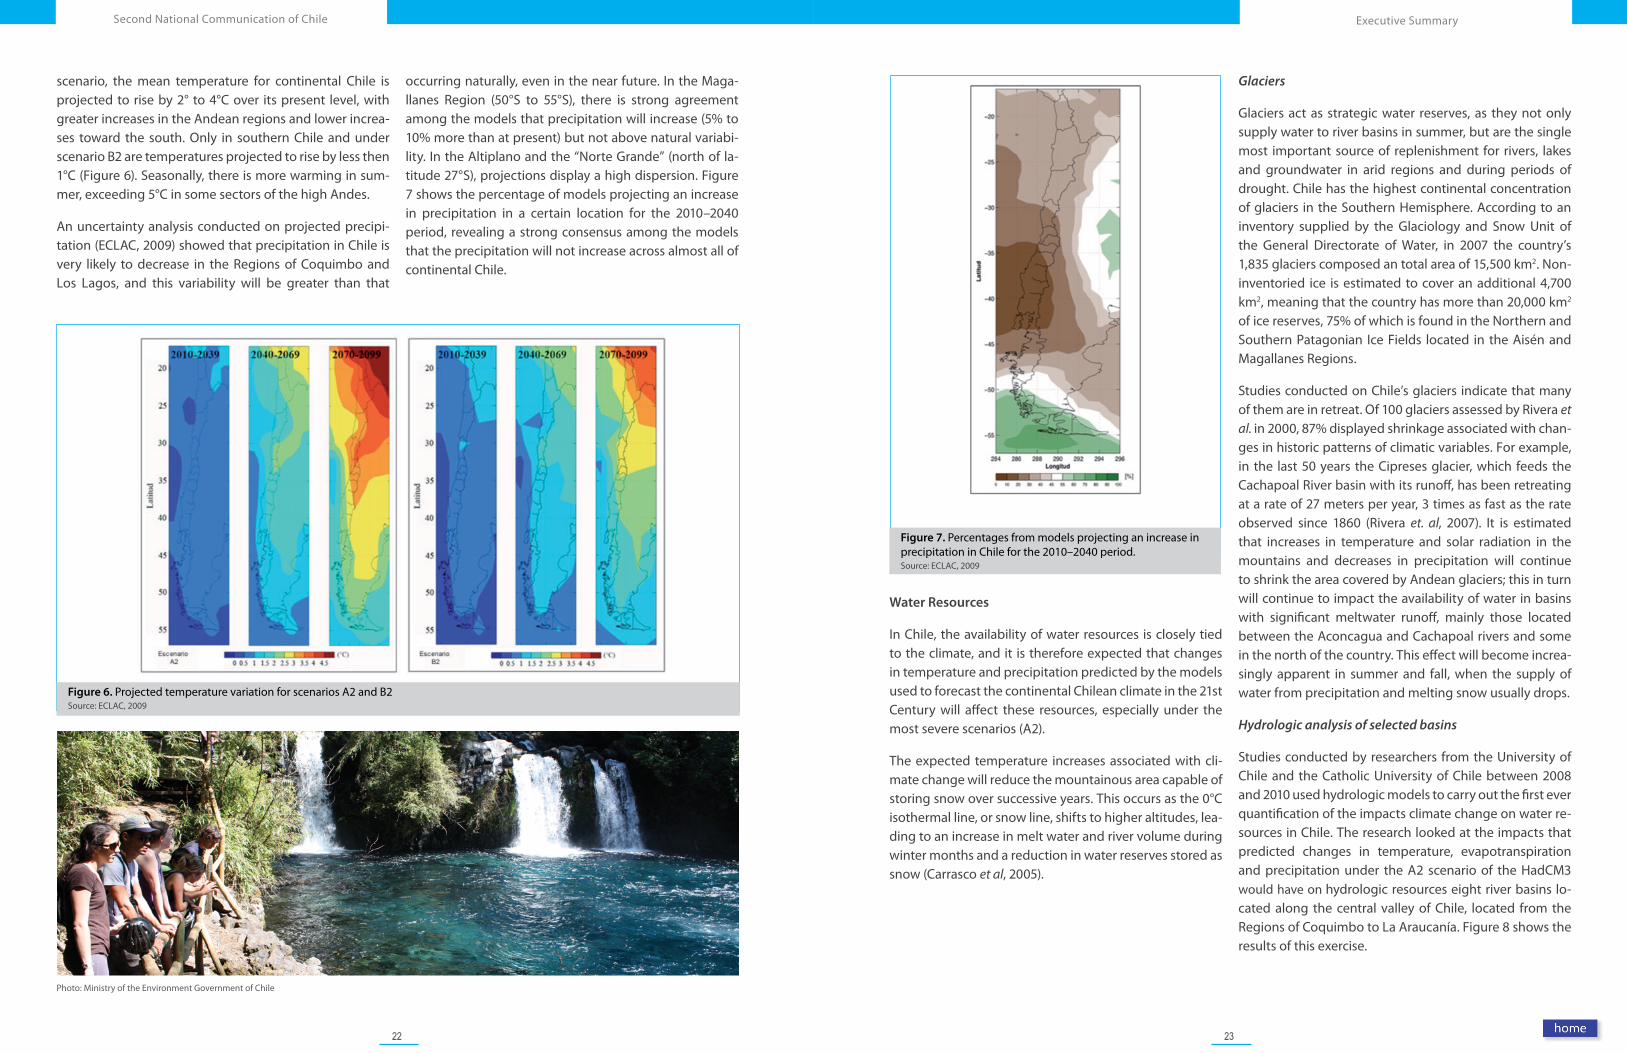
Figure 6. Projected temperature variation for scenarios A2 and B2Source: ECLAC, 2009
Photo: Ministry of the Environment Government of Chile
scenario, the mean temperature for continental Chile is projected to rise by 2° to 4°C over its present level, with greater increases in the Andean regions and lower increa-ses toward the south. Only in southern Chile and under scenario B2 are temperatures projected to rise by less then 1°C (Figure 6). Seasonally, there is more warming in sum-mer, exceeding 5°C in some sectors of the high Andes.
An uncertainty analysis conducted on projected precipi-tation (ECLAC, 2009) showed that precipitation in Chile is very likely to decrease in the Regions of Coquimbo and Los Lagos, and this variability will be greater than that
occurring naturally, even in the near future. In the Maga-llanes Region (50°S to 55°S), there is strong agreement among the models that precipitation will increase (5% to 10% more than at present) but not above natural variabi-lity. In the Altiplano and the “Norte Grande” (north of la-titude 27°S), projections display a high dispersion. Figure 7 shows the percentage of models projecting an increase in precipitation in a certain location for the 2010–2040 period, revealing a strong consensus among the models that the precipitation will not increase across almost all of continental Chile.
24 25
Executive SummarySecond National Communication of Chile
TABLE 4. Projected yields of wheat, corn, potatoes, beans and beets under A2 scenario for the 2070–2100 period
Crop Irrigated Dry-farmed
Wheat • A reduction in yields is expected, mainly in the foothill and coastal zones, where the current potential will drop to levels similar to those of the Central Valley
• A decrease in yields is expected in northern and central Chile owing to more droughts. On the coast and in the Central Valley, yields will drop by 10 to 20%.
• From the foothills of the Biobío Region to the south, in all zones a gradual increase is observed in yields on the order of 30%, reaching 100% in some foothill zones of the Regions of Los Ríos and Los Lagos.
Corn • A drop in yields of between 10 and 20% is expected throughout the Central Valley in the Regions of Coquimbo to Biobío.
• On the coast and in the foothills, yields are expected to rise by up to 50%.
• In La Araucanía Region to the south, yields will increase from between 60 and 200% above current levels.
• Yields will continue to be marginal, with productive potential equaling less than four tons per hectare.
Potatoes • In future scenarios, the northern zone will see 10 to 20% lower yields.
• In north-central Chile to the O’Higgins Region, yields will diminish by up to 30%.
• Between Talca and Temuco the present situation will continue, but only in the Central V alley, whereas on the coast and in the foothills yields are expected to rise by up to 50%.
• Yields will increase by up to 150% from La Araucanía Region southward, and up to 200% in the Los Lagos Region.
• In general, and especially in the central zone, low productivity will continue. Increases are expected on the coast of the Biobío Region, and from the Los Ríos Region to the Aisén Region.
Beans • Yields of beans will remain stable in future scenarios across the north, central and south-central part of the country. From La Araucanía Region to the south, productivity will increase from 10 to 20%, and up to 100% in the Los Lagos Region.
• In general, yields will tend to remain similar—around 4.5 tons per hectare per year—across the central and southern zones of the country.
• Dry-farmed beans will continue to produce the same low yields. However, increases of around 100% are expected on the south-central coast and from Los Ríos Region to Aisén.
• In Central Chile, planting dates will remain the same. In some places on the southern coast and foothills zones, however, the planting date will shift from October to September.
Beets
• In the Central Valley, between the Valparaíso and Maule Regions, yields will increase by up to 50% in some districts.
• On the coast and in the foothills, yields will drop to levels comparable to the Central Valley.
• From the La Araucanía Region to the south, the rise in winter temperatures will potentially increase production.
• Under the current climate scenario, beets grow better in coastal areas, reaching yields of up to 40 tons per hectare.
• On the coast between the Maule and La Araucanía Regions, future scenarios show expected yield to decrease by up to 50%.
• In the Central Valley and foothills, increases in almost all districts are expected from the Valparaíso Region to the south.
• In the La Araucanía and Los Ríos Regions, changes in fall planting dates are expected, which will allow yields to increase in most districts.
Source: ECLAC, 2009.
Figure 8. Map of water basins analyzed in Chile, area of calibration for hydrologic models and related basins Source: U.de Chile, Civil Engineering Department, 2010
In general terms, the results of these modeling exercises forecast major impacts from climate change on water resources, with the available water flow decreasing in all river basins. These reductions will be greater in the most northern and southern regions analyzed (the Limarí and Cautín basins) while the rest of the basins show slight re-ductions in flow levels in the short-term and significant reductions starting in the mid-term. The results also show variations in the timing of increased flow levels produced by melting snows in some river basins, which in some ca-ses would shift from spring and summer to winter months.
Due to the projected changes in availability and seasonal distribution of the water flows, practically all of the river basins analyzed show a major increase in the number of months with hydrologic deficits, based on a comparison of historic and future monthly flow and stress levels. This will greatly affect the availability of water resources by different productive sectors in Chile, with low-flow levels occur more frequently.
Soil Resources
Erosion has a significant effect on soil resources in Chile, and therefore on agricultural productivity. Erosion proces-ses are determined primarily by variables such as preci-pitation intensity, slope and plant cover. Climate change can affect precipitation and plant cover both directly and indirectly, and may accelerate erosion that already affects much of Chile’s agricultural land. A study conducted by experts at the AGRIMED Center of the University of Chile analyzed the impact of climate change on soil resources for the territory between the Valparaíso and Los Lagos Regions. Cross-referencing zones with a high erosion risk with areas that would present a decrease in natural plant cover, the researchers identified the zones that were most vulnerable to severe soil loss. The study concluded that parts of Chile’s Central Valley that are highly important for agriculture and forestry could be the most affected by the projected climate change. In irrigated zones, which are generally on flat or very slightly sloped land, soil loss from rainfall erosion is expected to be lower in general.
Agriculture, Livestock and Forestry Sector
The agriculture, livestock and forestry sector is one of the socioeconomic systems that is most dependent on clima-te. As such, the study of this sector´s vulnerability to the impacts of climate change has been a central concern in Chile recent years. Initial assessments have been focused on determining how this phenomenon will affect the sector’s future productivity.
Researchers from the AGRIMED Center of the University of Chile applied the SIMPROC simulation model to evaluate the impact of climate change on irrigated and dry-farmed crops, pastureland and fruit production. The SIMPROC model was calibrated based on current productivity data and then used to analyze the effects of climate anoma-lies projected under emission scenarios A2 and B2 for two periods, 2046–2065 and 2070–2100, including the impact on water available for irrigation (ECLAC, 2009). The main results, expressed as yields of irrigated and dry-farmed wheat, corn, potatoes, beans and beets sowed at the op-timum date as well as impacts on grasslands, fruit and fo-restry plantations, are presented in Tables 4 to 7.
26 27
Executive SummarySecond National Communication of Chile
TABLE 7. Productivity of forest plantations under the A2 scenario for the 2070–2100 period
Forest
plantations
Pinus radiata (Monterey Pine)
• A considerable deterioration of productive potential is expected in the north-central zone (between the Coquimbo and Metropolitan Regions), becoming less severe toward the south, where it may be moderate or slight in the central zone (Metropolitan, Valparaíso and O’Higgins Regions). The deterioration disappears in the La Araucanía Region, where productive potential will actually improve significantly, with major increases between the Los Ríos Region and the Island of Chiloé.
Eucalyptus globulus
• A deterioration in productive potential is expected in the Coquimbo Region as a result of decreased precipitation.
• Along the central coast, an increase in productive potential is expected due to milder winter temperatures, with a similar expectation for the foothills zone.
• From the La Araucanía Region to the south, an increase in productive potential is expected, with notable increases in the Los Ríos and Los Lagos Regions.
Source: ECLAC, 2009.
Productive and socioeconomic vulnerability and adap-tability of the agriculture, livestock and forestry sector
The productive and socioeconomic vulnerability and adaptability of the agriculture, livestock and forestry sec-tor to climate change were also evaluated in the studies conducted by researchers from AGRIMED and the Catholic University. The analyses included intrinsic adaptation by agricultural producers as climate patterns shift. Using the district level as the spatial scale, the following variables were evaluated: changes in land use, changes in net inco-me and changes in labor.
The study concluded that vulnerability to impacts on agricultural productivity is greater in zones with a higher prevalence of annual crops (the valleys of Coquimbo Re-gion, the central valley of Maule Region and southward), while in the Los Ríos and Los Lagos Regions, the greatest vulnerability is due to the lack of irrigation infrastructu-re. The central regions, where fruit production predomi-nates, are less vulnerable. In terms of social vulnerability, the most affected zones are those that are most intensely agricultural in which the population displays low human development indices, such as the Coquimbo, Maule and La Araucanía Regions. Thirdly, an assessment of econo-mic vulnerability focused mainly on capital invested in supplies and technology, as well as linkages with foreign markets for each subsector. In this case, crops that require more technical management and/or are more profitable are more economically vulnerable, as the potential losses are greater. In this case, results indicate that the effects of
climate change on crops grown for export in central Chile and technologically intensive crops could result in a signi-ficant economic loss for the country.
Biodiversity
International studies conducted in recent years on the im-pacts of climate change on biodiversity show that the re-cent rise in the average global temperature has induced a series of biological and ecological responses in plants and animals. These studies also predict, with a significant de-gree of certainty, shifts in species distribution ranges and phrenology.
Chile’s great range of latitude and altitude leads to a wide variety of environmental conditions that sustain biologi-cal diversity. The climatic patterns that result from these two gradients mean that Chile has some areas with the lowest annual rainfall on the planet and others with the highest number of rainy days annually.
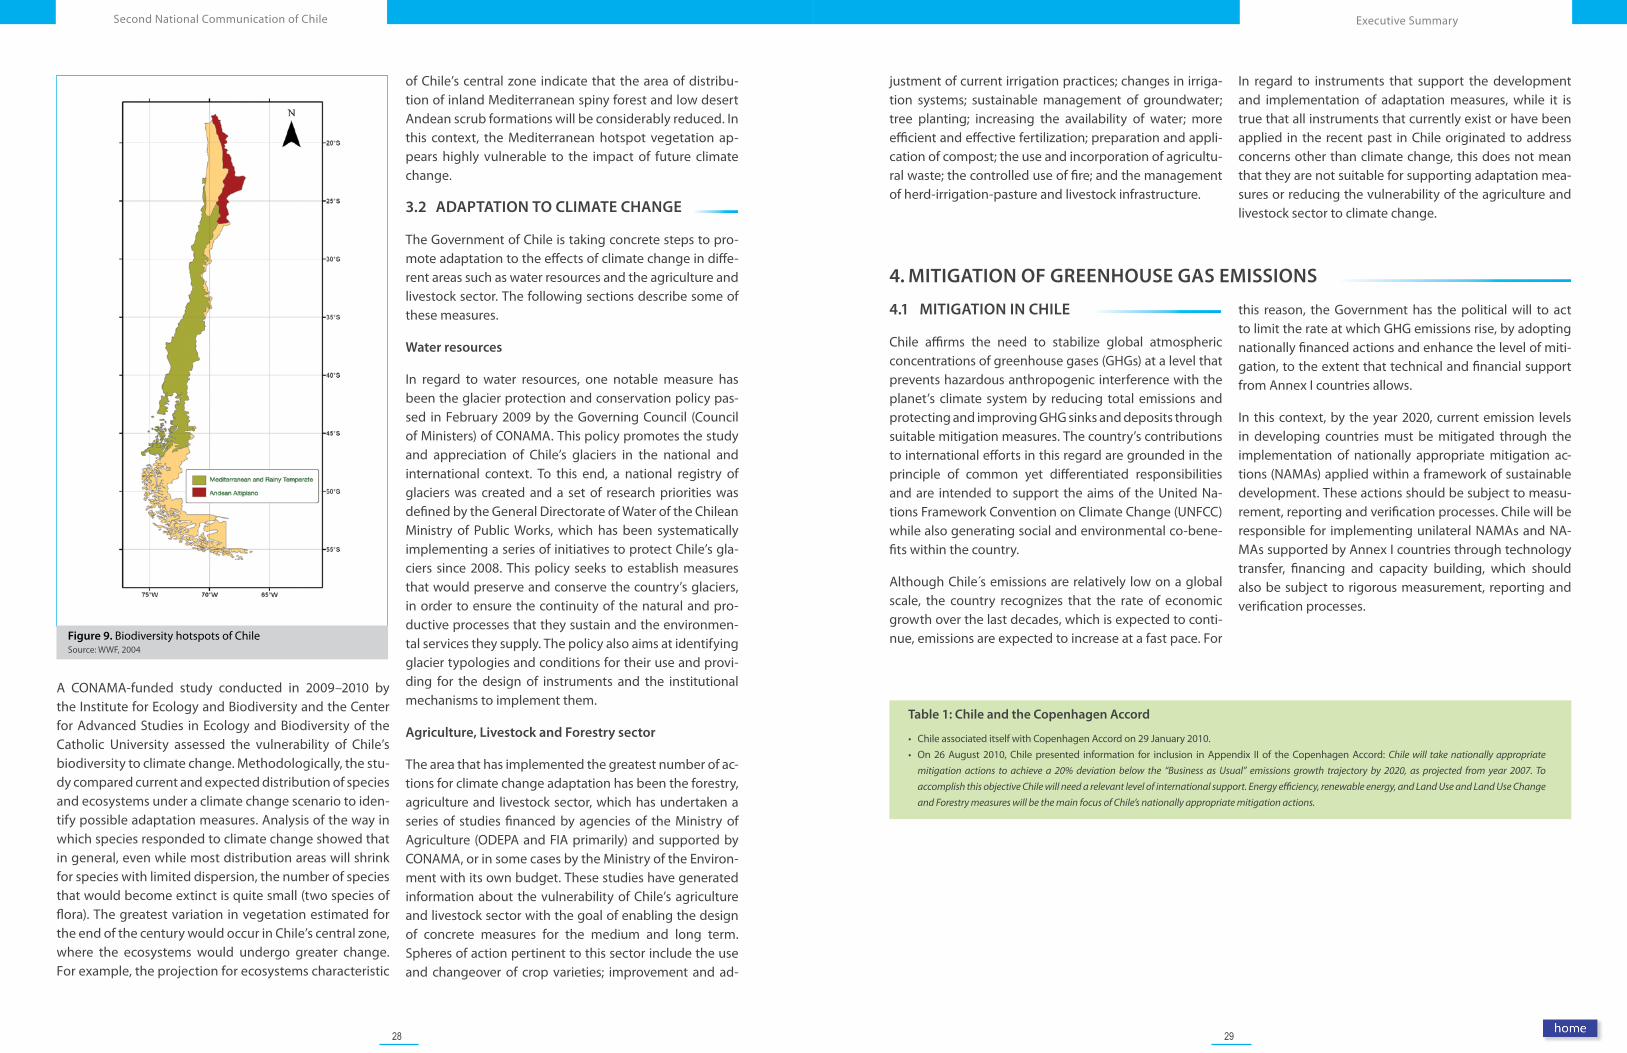
Chile’s biodiversity hotspots for conservation priorities are zones that concentrate a minimum of 1,500 species of endemic vascular plants and an original habitat that has been significantly degraded by anthropic activity. The two areas of Chile that have been classified as hotspots are the Mediterranean and temperate climate zones and the Chi-lean Altiplano, as illustrated in Figure 9.
Photo: Ministry of the Environment Government of Chile
TABLE 5. Grassland productivity for the A2 scenario for the 2070–2100 period
Grassland • A drop in annual productivity is expected for grasslands between the Coquimbo and Los Lagos Regions, associated with more intense dry periods.
• Toward the south, yields will increase by up to 20%. In the far southeastern Andes Mountains, drops in productivity are expected as a result of a reduction in solar radiation of up to 15%.
• In the Altiplano zone, grassland productivity will increase over present levels as precipitation increases, as expected under future scenarios.
• In the far south, grassland productivity will increase in the western Andes Mountains as a result of higher rainfall, temperatures and solar radiation.
Source: ECLAC, 2009.
TABLE 6. Productivity of fruit plantations under the A2 scenario for the 2070–2100 period.
Fruit
plantations
• Area suitable for fruit growing could spread south to the Regions of La Araucanía, Los Ríos and Los Lagos.
• Species that are highly climate-dependent (grapevines, for example) could undergo changes in their organoleptic properties (aroma, flavor, color), and therefore, in their quality.
• In general, temperature increases are expected to prolong the life-cycle of some major pests, which could have serious consequences for fruit health.
• Projected climatic conditions could lead to the spread of fungal and bacterial diseases.
• Climate changes could increase the potential for growing subtropical species (oranges, for example) in almost all regions.
• It is highly likely that climatic conditions under the new scenarios will improve the quality of fruit, as temperature increases may decrease acidity.
• In the north of Chile, productive potential will increase considerably, especially in the valleys of the Tarapacá Region.
• In the Central Andean foothills, climatic conditions will enable an increase in the economically viable fruit growing area.
Source: ECLAC, 2009.
28 29
Executive SummarySecond National Communication of Chile
Table 1: Chile and the Copenhagen Accord
• Chile associated itself with Copenhagen Accord on 29 January 2010. • On 26 August 2010, Chile presented information for inclusion in Appendix II of the Copenhagen Accord: Chile will take nationally appropriate
mitigation actions to achieve a 20% deviation below the “Business as Usual” emissions growth trajectory by 2020, as projected from year 2007. To
accomplish this objective Chile will need a relevant level of international support. Energy efficiency, renewable energy, and Land Use and Land Use Change
and Forestry measures will be the main focus of Chile’s nationally appropriate mitigation actions.
justment of current irrigation practices; changes in irriga-tion systems; sustainable management of groundwater; tree planting; increasing the availability of water; more efficient and effective fertilization; preparation and appli-cation of compost; the use and incorporation of agricultu-ral waste; the controlled use of fire; and the management of herd-irrigation-pasture and livestock infrastructure.
In regard to instruments that support the development and implementation of adaptation measures, while it is true that all instruments that currently exist or have been applied in the recent past in Chile originated to address concerns other than climate change, this does not mean that they are not suitable for supporting adaptation mea-sures or reducing the vulnerability of the agriculture and livestock sector to climate change.
4. MITIGATION OF GREENHOUSE GAS EMISSIONS
4.1 MITIGATION IN CHILE
Chile affirms the need to stabilize global atmospheric concentrations of greenhouse gases (GHGs) at a level that prevents hazardous anthropogenic interference with the planet’s climate system by reducing total emissions and protecting and improving GHG sinks and deposits through suitable mitigation measures. The country’s contributions to international efforts in this regard are grounded in the principle of common yet differentiated responsibilities and are intended to support the aims of the United Na-tions Framework Convention on Climate Change (UNFCC) while also generating social and environmental co-bene-fits within the country.
Although Chile´s emissions are relatively low on a global scale, the country recognizes that the rate of economic growth over the last decades, which is expected to conti-nue, emissions are expected to increase at a fast pace. For
this reason, the Government has the political will to act to limit the rate at which GHG emissions rise, by adopting nationally financed actions and enhance the level of miti-gation, to the extent that technical and financial support from Annex I countries allows.
In this context, by the year 2020, current emission levels in developing countries must be mitigated through the implementation of nationally appropriate mitigation ac-tions (NAMAs) applied within a framework of sustainable development. These actions should be subject to measu-rement, reporting and verification processes. Chile will be responsible for implementing unilateral NAMAs and NA-MAs supported by Annex I countries through technology transfer, financing and capacity building, which should also be subject to rigorous measurement, reporting and verification processes.
Figure 9. Biodiversity hotspots of ChileSource: WWF, 2004
of Chile’s central zone indicate that the area of distribu-tion of inland Mediterranean spiny forest and low desert Andean scrub formations will be considerably reduced. In this context, the Mediterranean hotspot vegetation ap-pears highly vulnerable to the impact of future climate change.
3.2 ADAPTATION TO CLIMATE CHANGE
The Government of Chile is taking concrete steps to pro-mote adaptation to the effects of climate change in diffe-rent areas such as water resources and the agriculture and livestock sector. The following sections describe some of these measures.
Water resources
In regard to water resources, one notable measure has been the glacier protection and conservation policy pas-sed in February 2009 by the Governing Council (Council of Ministers) of CONAMA. This policy promotes the study and appreciation of Chile’s glaciers in the national and international context. To this end, a national registry of glaciers was created and a set of research priorities was defined by the General Directorate of Water of the Chilean Ministry of Public Works, which has been systematically implementing a series of initiatives to protect Chile’s gla-ciers since 2008. This policy seeks to establish measures that would preserve and conserve the country’s glaciers, in order to ensure the continuity of the natural and pro-ductive processes that they sustain and the environmen-tal services they supply. The policy also aims at identifying glacier typologies and conditions for their use and provi-ding for the design of instruments and the institutional mechanisms to implement them.
Agriculture, Livestock and Forestry sector
The area that has implemented the greatest number of ac-tions for climate change adaptation has been the forestry, agriculture and livestock sector, which has undertaken a series of studies financed by agencies of the Ministry of Agriculture (ODEPA and FIA primarily) and supported by CONAMA, or in some cases by the Ministry of the Environ-ment with its own budget. These studies have generated information about the vulnerability of Chile’s agriculture and livestock sector with the goal of enabling the design of concrete measures for the medium and long term. Spheres of action pertinent to this sector include the use and changeover of crop varieties; improvement and ad-
A CONAMA-funded study conducted in 2009–2010 by the Institute for Ecology and Biodiversity and the Center for Advanced Studies in Ecology and Biodiversity of the Catholic University assessed the vulnerability of Chile’s biodiversity to climate change. Methodologically, the stu-dy compared current and expected distribution of species and ecosystems under a climate change scenario to iden-tify possible adaptation measures. Analysis of the way in which species responded to climate change showed that in general, even while most distribution areas will shrink for species with limited dispersion, the number of species that would become extinct is quite small (two species of flora). The greatest variation in vegetation estimated for the end of the century would occur in Chile’s central zone, where the ecosystems would undergo greater change. For example, the projection for ecosystems characteristic
30 31
Executive SummarySecond National Communication of Chile
• Improve information available about the country’s ener-gy resources in order to formulate a policy to promote energy efficiency and energy saving projects.
• Advance in energy efficiency certification and establish energy efficiency standards for residential construction, domestic appliances, lighting and vehicle fleets.
In the decade covered by this National Communication, the Government of Chile has been active in establishing a suitable regulatory framework for mitigating GHG emissions in the energy sector. Notable advances in this area include incentives for the use of non-conventional renewable energies, the Geothermal Law and the 2008 Law on Non-conventional Renewable Energies (NCRE). Others include the tax exemption for solar thermal sys-tems in 2009 and the regulatory framework for the ener-gy efficiency incentive, which includes energy efficien-cy labeling, home heating regulations, and minimum energy performance standards. Over the same decade, the Government of Chile created several institutions to oversee the implementation of this wide range of instru-ments.
In regard to Non-conventional Renewable Energy (NCRE), the Government has developed a policy that supports competitive energy generation based on these energy sources by identifying barriers to their introduction and creating lines of action intended to remove those barriers. The barriers themselves include a lack of information, precarious infrastructure, uncertainty about new tech-nologies and difficulties in accessing credit. In cases such as geothermal energy, among others, the barriers are as-sociated with the high cost of exploration. Nevertheless, in four years Chile has doubled its installed capacity of NCRE for electricity generation, which rose from 286 MW (representing 2.4% of total installed capacity) in late 2005 to 600 MW (4% of the total capacity) by the end of 2009, and continues to rise. Furthermore, of the energy projects submitted to the Environmental Impact Assessment Sys-tem (SEIA in Chile) between 2004 and the end of 2009, 2000 MW of the total 2,553 MW were for wind power.
In the area of energy efficiency, Chile has channeled most of its efforts through the National Energy Efficiency Pro-gram and the Chilean Energy Efficiency Agency. Since
2009, these programs have enabled the implementation of pre-investment and loan programs that have advanced energy efficiency in the industrial, residential, public and commercial sectors.
The country’s energy sector has great potential for miti-gating GHG emissions in both generation and consump-tion. On the other hand, there is uncertainty about the penetration rates of these technologies and about the improvement of technical capacities that will enable the-se technologies to be taken advantage of in Chile. Some variables that contribute to this uncertainty include the future price of generation and consumption technologies, future international fossil fuel prices, and the rate of natio-nal economic growth.
Agriculture, Livestock and Forestry Sector
Chile’s agriculture and livestock sector, which includes the forestry, agriculture and livestock subsectors, is re-cognized as carbon neutral, meaning that the emissions counted in the GHG inventories from this sector’s activi-ties are equal (in tons of CO
2 equivalent) to those captured through forestry activity.
While the Ministry of Agriculture’s regulatory frameworks and incentives are not explicitly directed at addressing cli-mate change, the Ministry has made available to this sec-tor several instruments that lead to the mitigation of GHG emissions.
According to the Ministry of Agriculture, GHG emissions associated with this sector’s activities can be reduced by increasing energy efficiency and productive efficiency, applying better agricultural practices in both productive and environmental terms, reducing forest fires, increasing the forestry sector’s capacity for capturing GHG emissions through sustainable native forest management and de-creasing soil degradation.
In accordance with its commitments under the Conven-tion, Chile considers it necessary to take firm and concrete steps toward achieving a lower carbon economy (Table 1). In this context, the Chilean Government began working in 2010 on several instruments that will provide informa-tion for decision-making about mitigation. In the next few years, the Government of Chile will design and implement a strategy for mitigating its emissions.
Some concrete advances that are expected in this area in-clude:
• Strengthening capacities related to the country’s emis-sions inventories through the implementation of a na-tional GHG Inventory Office (more details of this can be found in Chapter 6 of this National Communication);
• Integration of sector-specific efforts to prepare emission projections for the coming years, to establish a Govern-ment-sanctioned national baseline that will enable mi-nistries to conduct their emission projection exercises in a complementary fashion and from a common founda-tion;
• Generation of information to enable Chile to produce NAMAs in the short term, especially in the energy and LULUCF sectors.
Beginning in 2011, the Government of Chile will also em-bark on an extensive exercise to prepare long term miti-gation scenarios based on a methodology developed and applied in South Africa prior to the 15th Conference of the Parties. This exercise will include input from different stakeholders in identifying possible future climate actions and estimating their costs, social implications and barriers to their implementation. The exercise will take two to three years and is expected to generate the best informa-tion possible for configuring public policy in this area in the remaining years of the decade.
At present, a variety of sector-specific initiatives are al-ready being organized by different ministries to generate preliminary information about possible mitigation actions in Chile. These analyses do not claim to be exhaustive, but are rather intended to be indicative. In any case, one of the steps in the near future will be to look for a way to prioriti-ze these various options.
4.2 ANALYSIS BY SECTOR
Energy Sector
The country’s energy policy is founded on the legal and regulatory role carried out by the State through its Minis-try of Energy and related agencies, with the private sector taking responsibility for the investments. This arrange-ment means that way policies are defined does have an impact on limiting increases in greenhouse gas emissions. The following are some of the main definitions that have been identified by the Administration of President Sebas-tián Piñera Echenique:
• Increase energy availability to meet the rise in demand related to the average economic growth rate of 6% per year projected up to 2020.
• Increase the security of energy supply in the short, me-dium and long term, by encouraging energy generation projects that reduce the risks of failure and reinforcing fuel supply to enable the effective and timely response to eventualities and contingencies.
• Promote competitive and sustainable investment in the sector.
• Work toward having 20% of the energy generated in Chile supplied by nonconventional renewable energy sources–our own local and global resources–by 2020.
• Achieve greater energy independence and increase pri-vate investment in hydrocarbon exploration and deve-lopment.
• Improve current regulations governing access to energy resources, in order to increase investment in renewable energies in Chile.
• Carry out further studies and strengthen the institutio-nal framework to enable the future development of any cost-efficient energy source.
• Promote research programs on energy and raise the awareness of younger generations about energy sa-vings and energy efficiency.
32 33
Executive SummarySecond National Communication of Chile
Transportation Sector
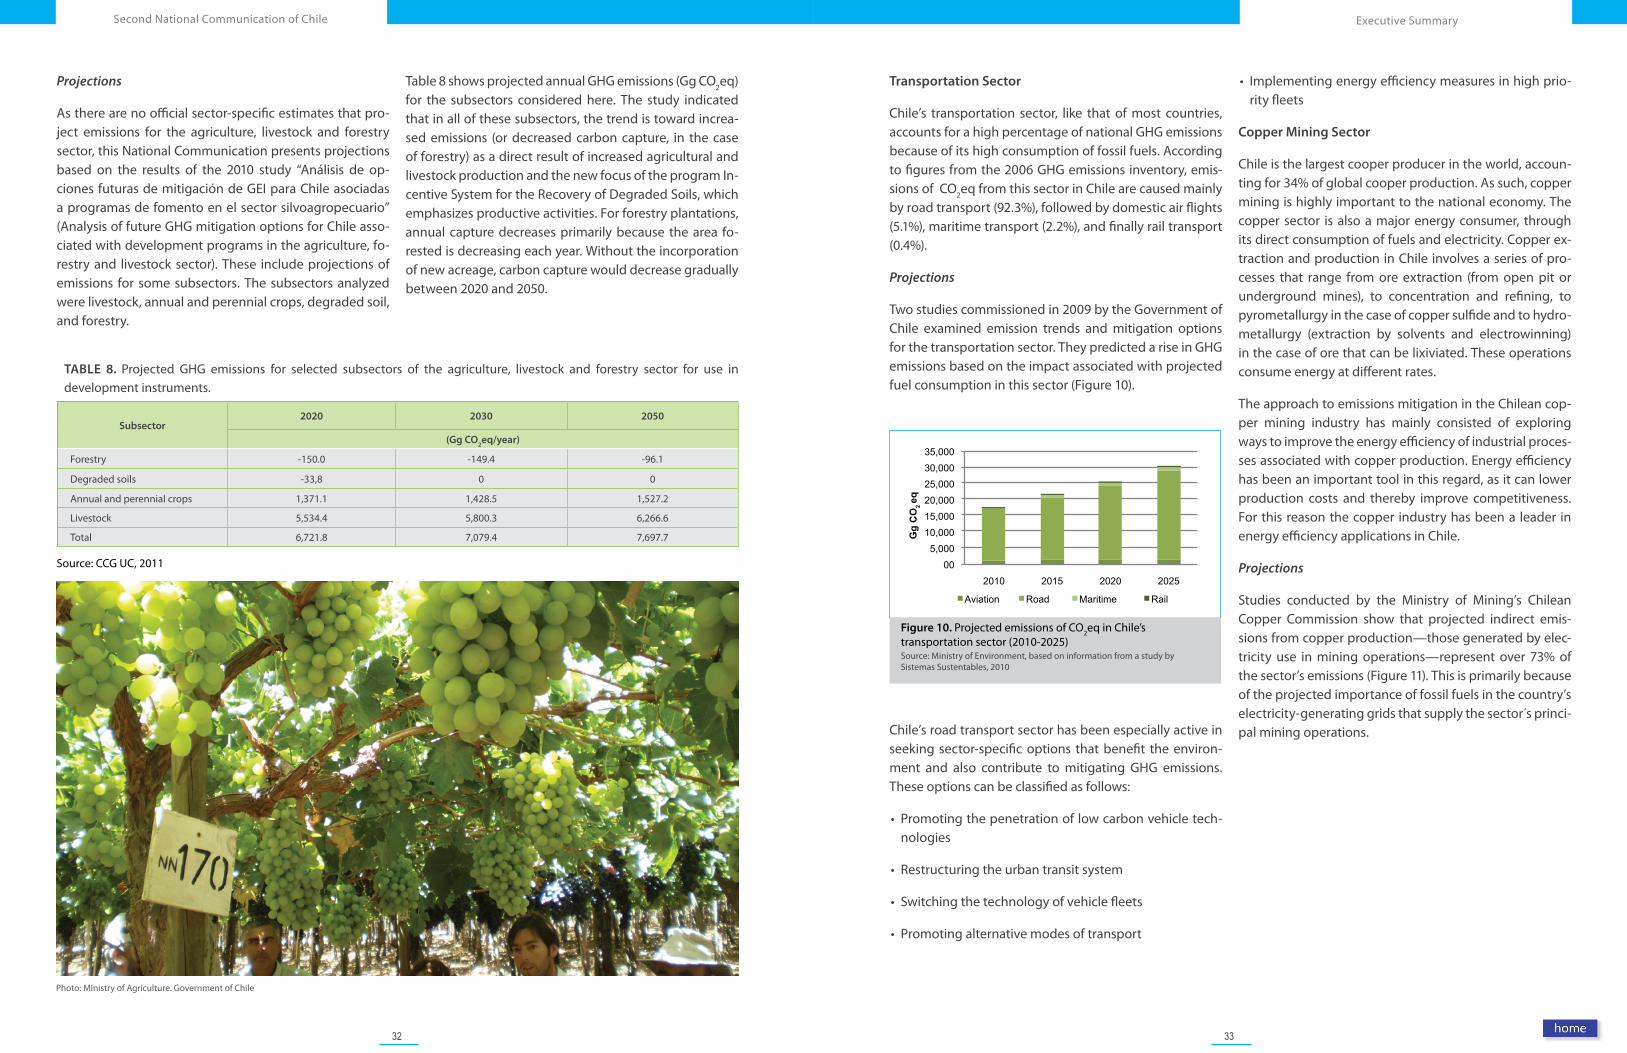
Chile’s transportation sector, like that of most countries, accounts for a high percentage of national GHG emissions because of its high consumption of fossil fuels. According to figures from the 2006 GHG emissions inventory, emis-sions of CO2eq from this sector in Chile are caused mainly by road transport (92.3%), followed by domestic air flights (5.1%), maritime transport (2.2%), and finally rail transport (0.4%).
Projections
Two studies commissioned in 2009 by the Government of Chile examined emission trends and mitigation options for the transportation sector. They predicted a rise in GHG emissions based on the impact associated with projected fuel consumption in this sector (Figure 10).
Figure 10. Projected emissions of CO2eq in Chile’s transportation sector (2010-2025)Source: Ministry of Environment, based on information from a study by Sistemas Sustentables, 2010
Chile’s road transport sector has been especially active in seeking sector-specific options that benefit the environ-ment and also contribute to mitigating GHG emissions. These options can be classified as follows:
• Promoting the penetration of low carbon vehicle tech-nologies
• Restructuring the urban transit system
• Switching the technology of vehicle fleets
• Promoting alternative modes of transport
• Implementing energy efficiency measures in high prio-rity fleets
Copper Mining Sector
Chile is the largest cooper producer in the world, accoun-ting for 34% of global cooper production. As such, copper mining is highly important to the national economy. The copper sector is also a major energy consumer, through its direct consumption of fuels and electricity. Copper ex-traction and production in Chile involves a series of pro-cesses that range from ore extraction (from open pit or underground mines), to concentration and refining, to pyrometallurgy in the case of copper sulfide and to hydro-metallurgy (extraction by solvents and electrowinning) in the case of ore that can be lixiviated. These operations consume energy at different rates.
The approach to emissions mitigation in the Chilean cop-per mining industry has mainly consisted of exploring ways to improve the energy efficiency of industrial proces-ses associated with copper production. Energy efficiency has been an important tool in this regard, as it can lower production costs and thereby improve competitiveness. For this reason the copper industry has been a leader in energy efficiency applications in Chile.
Projections
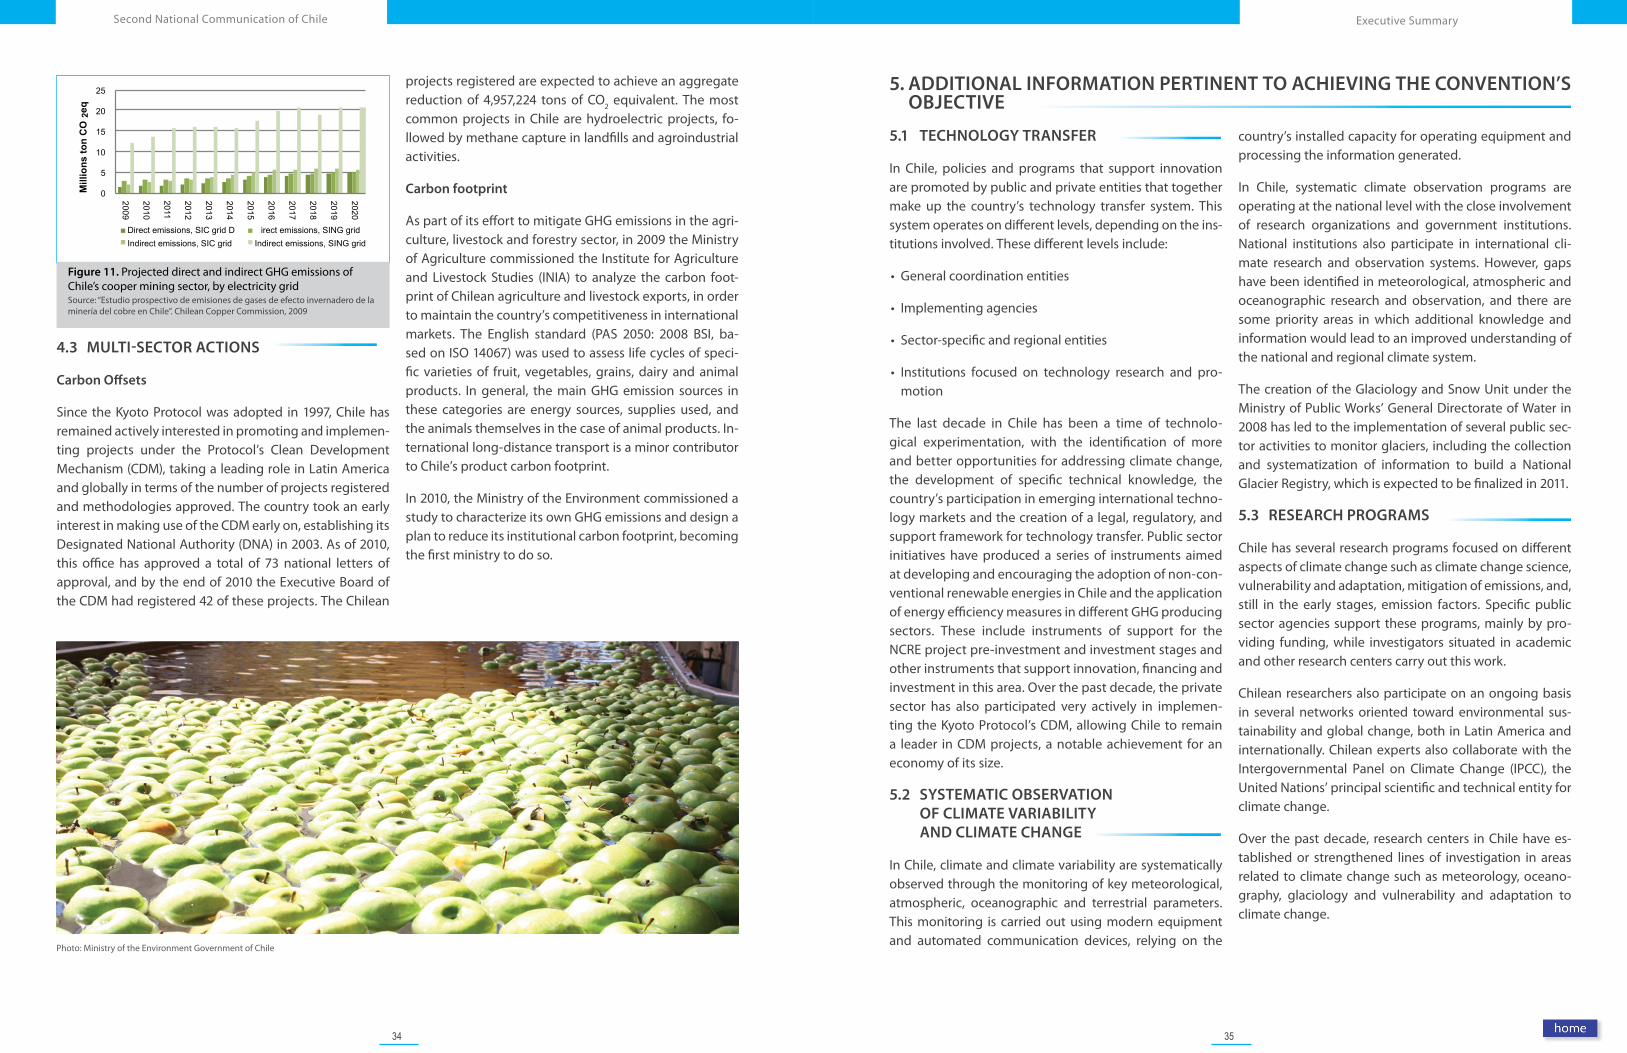
Studies conducted by the Ministry of Mining’s Chilean Copper Commission show that projected indirect emis-sions from copper production—those generated by elec-tricity use in mining operations—represent over 73% of the sector’s emissions (Figure 11). This is primarily because of the projected importance of fossil fuels in the country’s electricity-generating grids that supply the sector´s princi-pal mining operations.
00 5,000
10,000 15,000 20,000 25,000 30,000 35,000
2010 2015 2020 2025
Gg
CO
2eq
Aviation Road Maritime Rail
Photo: MInistry of Agriculture. Government of Chile
Projections
As there are no official sector-specific estimates that pro-ject emissions for the agriculture, livestock and forestry sector, this National Communication presents projections based on the results of the 2010 study “Análisis de op-ciones futuras de mitigación de GEI para Chile asociadas a programas de fomento en el sector silvoagropecuario” (Analysis of future GHG mitigation options for Chile asso-ciated with development programs in the agriculture, fo-restry and livestock sector). These include projections of emissions for some subsectors. The subsectors analyzed were livestock, annual and perennial crops, degraded soil, and forestry.
Table 8 shows projected annual GHG emissions (Gg CO2eq) for the subsectors considered here. The study indicated that in all of these subsectors, the trend is toward increa-sed emissions (or decreased carbon capture, in the case of forestry) as a direct result of increased agricultural and livestock production and the new focus of the program In-centive System for the Recovery of Degraded Soils, which emphasizes productive activities. For forestry plantations, annual capture decreases primarily because the area fo-rested is decreasing each year. Without the incorporation of new acreage, carbon capture would decrease gradually between 2020 and 2050.
TABLE 8. Projected GHG emissions for selected subsectors of the agriculture, livestock and forestry sector for use in development instruments.
Subsector2020 2030 2050
(Gg CO2eq/year)
Forestry -150.0 -149.4 -96.1
Degraded soils -33,8 0 0
Annual and perennial crops 1,371.1 1,428.5 1,527.2
Livestock 5,534.4 5,800.3 6,266.6
Total 6,721.8 7,079.4 7,697.7
Source: CCG UC, 2011
34 35
Executive SummarySecond National Communication of Chile
5. ADDITIONAL INFORMATION PERTINENT TO ACHIEVING THE CONVENTION’S OBJECTIVE
5.1 TECHNOLOGY TRANSFER
In Chile, policies and programs that support innovation are promoted by public and private entities that together make up the country’s technology transfer system. This system operates on different levels, depending on the ins-titutions involved. These different levels include:
• General coordination entities
• Implementing agencies
• Sector-specific and regional entities
• Institutions focused on technology research and pro-motion
The last decade in Chile has been a time of technolo-gical experimentation, with the identification of more and better opportunities for addressing climate change, the development of specific technical knowledge, the country’s participation in emerging international techno-logy markets and the creation of a legal, regulatory, and support framework for technology transfer. Public sector initiatives have produced a series of instruments aimed at developing and encouraging the adoption of non-con-ventional renewable energies in Chile and the application of energy efficiency measures in different GHG producing sectors. These include instruments of support for the NCRE project pre-investment and investment stages and other instruments that support innovation, financing and investment in this area. Over the past decade, the private sector has also participated very actively in implemen-ting the Kyoto Protocol’s CDM, allowing Chile to remain a leader in CDM projects, a notable achievement for an economy of its size.
5.2 SYSTEMATIC OBSERVATION OF CLIMATE VARIABILITY AND CLIMATE CHANGE
In Chile, climate and climate variability are systematically observed through the monitoring of key meteorological, atmospheric, oceanographic and terrestrial parameters. This monitoring is carried out using modern equipment and automated communication devices, relying on the
country’s installed capacity for operating equipment and processing the information generated.
In Chile, systematic climate observation programs are operating at the national level with the close involvement of research organizations and government institutions. National institutions also participate in international cli-mate research and observation systems. However, gaps have been identified in meteorological, atmospheric and oceanographic research and observation, and there are some priority areas in which additional knowledge and information would lead to an improved understanding of the national and regional climate system.
The creation of the Glaciology and Snow Unit under the Ministry of Public Works’ General Directorate of Water in 2008 has led to the implementation of several public sec-tor activities to monitor glaciers, including the collection and systematization of information to build a National Glacier Registry, which is expected to be finalized in 2011.
5.3 RESEARCH PROGRAMS
Chile has several research programs focused on different aspects of climate change such as climate change science, vulnerability and adaptation, mitigation of emissions, and, still in the early stages, emission factors. Specific public sector agencies support these programs, mainly by pro-viding funding, while investigators situated in academic and other research centers carry out this work.
Chilean researchers also participate on an ongoing basis in several networks oriented toward environmental sus-tainability and global change, both in Latin America and internationally. Chilean experts also collaborate with the Intergovernmental Panel on Climate Change (IPCC), the United Nations’ principal scientific and technical entity for climate change.
Over the past decade, research centers in Chile have es-tablished or strengthened lines of investigation in areas related to climate change such as meteorology, oceano-graphy, glaciology and vulnerability and adaptation to climate change.
0
5
10
15
20
25
2009
2010
2011
2012
2013
2014
2015
2016
2017
2018
2019
2020
Direct emissions, SIC grid D irect emissions, SING gridIndirect emissions, SIC grid Indirect emissions, SING grid
Mill
ions
ton
CO
2eq
Figure 11. Projected direct and indirect GHG emissions of Chile’s cooper mining sector, by electricity gridSource: “Estudio prospectivo de emisiones de gases de efecto invernadero de la minería del cobre en Chile”. Chilean Copper Commission, 2009
Photo: Ministry of the Environment Government of Chile
4.3 MULTI-SECTOR ACTIONS
Carbon Offsets
Since the Kyoto Protocol was adopted in 1997, Chile has remained actively interested in promoting and implemen-ting projects under the Protocol’s Clean Development Mechanism (CDM), taking a leading role in Latin America and globally in terms of the number of projects registered and methodologies approved. The country took an early interest in making use of the CDM early on, establishing its Designated National Authority (DNA) in 2003. As of 2010, this office has approved a total of 73 national letters of approval, and by the end of 2010 the Executive Board of the CDM had registered 42 of these projects. The Chilean
projects registered are expected to achieve an aggregate reduction of 4,957,224 tons of CO2 equivalent. The most common projects in Chile are hydroelectric projects, fo-llowed by methane capture in landfills and agroindustrial activities.
Carbon footprint
As part of its effort to mitigate GHG emissions in the agri-culture, livestock and forestry sector, in 2009 the Ministry of Agriculture commissioned the Institute for Agriculture and Livestock Studies (INIA) to analyze the carbon foot-print of Chilean agriculture and livestock exports, in order to maintain the country’s competitiveness in international markets. The English standard (PAS 2050: 2008 BSI, ba-sed on ISO 14067) was used to assess life cycles of speci-fic varieties of fruit, vegetables, grains, dairy and animal products. In general, the main GHG emission sources in these categories are energy sources, supplies used, and the animals themselves in the case of animal products. In-ternational long-distance transport is a minor contributor to Chile’s product carbon footprint.
In 2010, the Ministry of the Environment commissioned a study to characterize its own GHG emissions and design a plan to reduce its institutional carbon footprint, becoming the first ministry to do so.
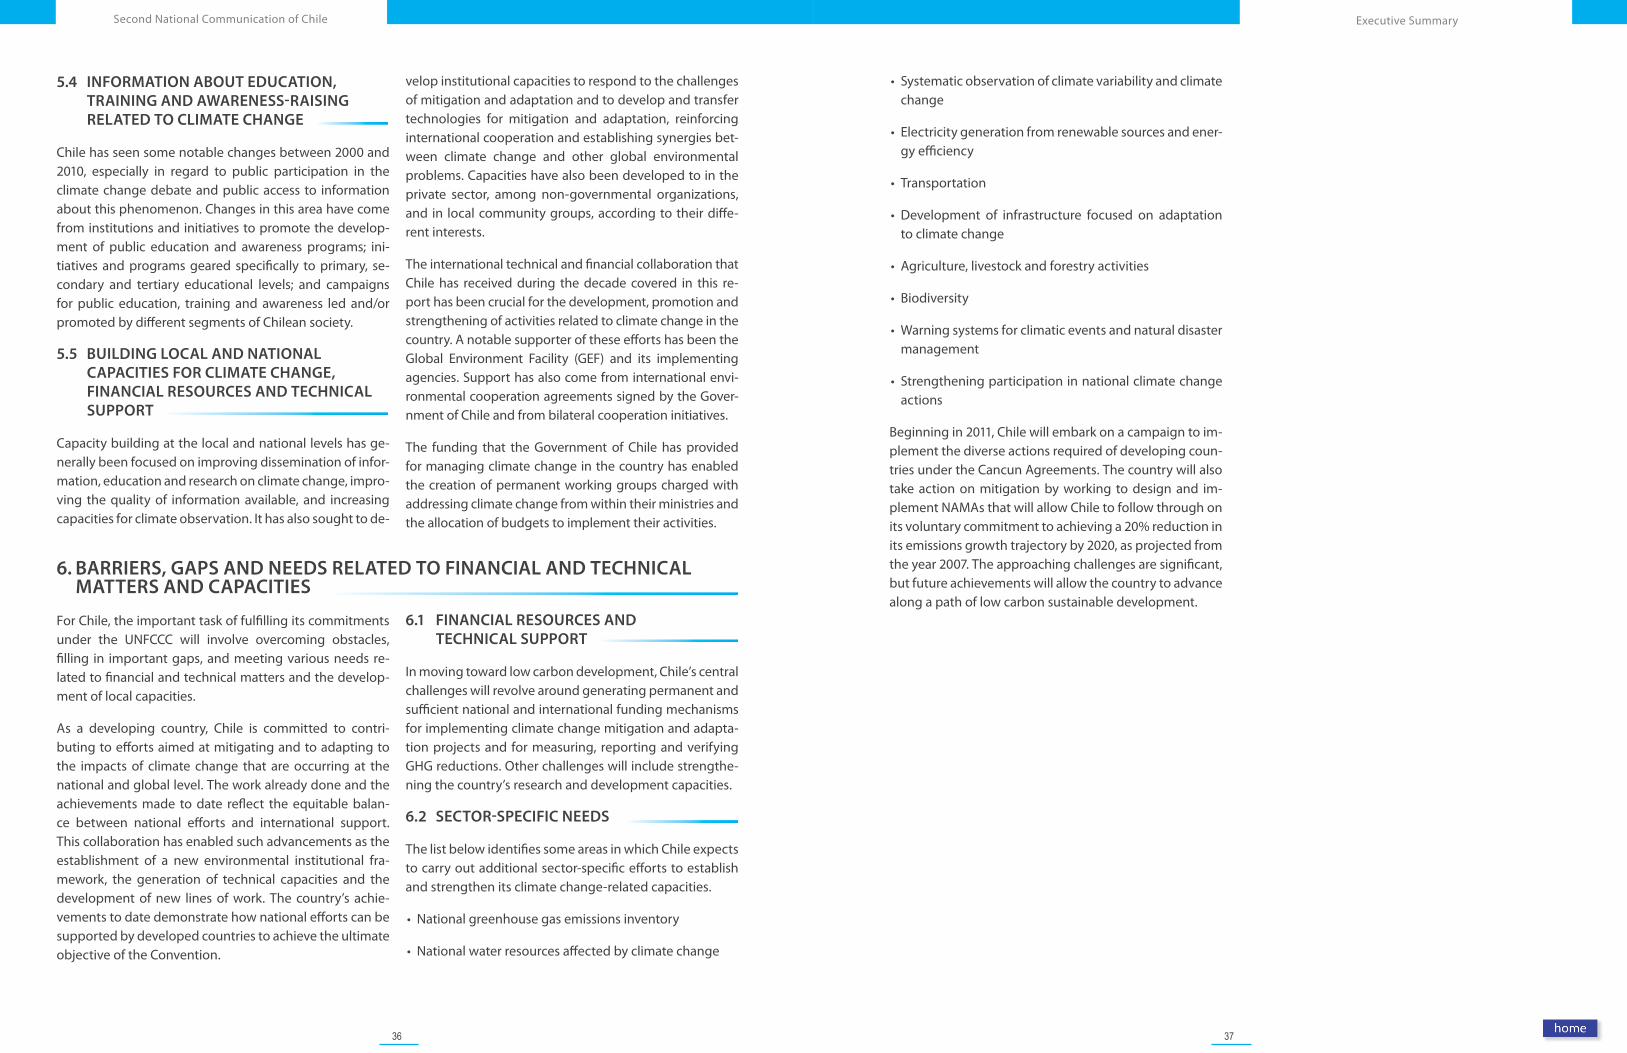
36 37
Executive SummarySecond National Communication of Chile
• Systematic observation of climate variability and climate change
• Electricity generation from renewable sources and ener-gy efficiency
• Transportation
• Development of infrastructure focused on adaptation to climate change
• Agriculture, livestock and forestry activities
• Biodiversity
• Warning systems for climatic events and natural disaster management
• Strengthening participation in national climate change actions
Beginning in 2011, Chile will embark on a campaign to im-plement the diverse actions required of developing coun-tries under the Cancun Agreements. The country will also take action on mitigation by working to design and im-plement NAMAs that will allow Chile to follow through on its voluntary commitment to achieving a 20% reduction in its emissions growth trajectory by 2020, as projected from the year 2007. The approaching challenges are significant, but future achievements will allow the country to advance along a path of low carbon sustainable development.
5.4 INFORMATION ABOUT EDUCATION, TRAINING AND AWARENESS-RAISING RELATED TO CLIMATE CHANGE
Chile has seen some notable changes between 2000 and 2010, especially in regard to public participation in the climate change debate and public access to information about this phenomenon. Changes in this area have come from institutions and initiatives to promote the develop-ment of public education and awareness programs; ini-tiatives and programs geared specifically to primary, se-condary and tertiary educational levels; and campaigns for public education, training and awareness led and/or promoted by different segments of Chilean society.
5.5 BUILDING LOCAL AND NATIONAL CAPACITIES FOR CLIMATE CHANGE, FINANCIAL RESOURCES AND TECHNICAL SUPPORT
Capacity building at the local and national levels has ge-nerally been focused on improving dissemination of infor-mation, education and research on climate change, impro-ving the quality of information available, and increasing capacities for climate observation. It has also sought to de-
velop institutional capacities to respond to the challenges of mitigation and adaptation and to develop and transfer technologies for mitigation and adaptation, reinforcing international cooperation and establishing synergies bet-ween climate change and other global environmental problems. Capacities have also been developed to in the private sector, among non-governmental organizations, and in local community groups, according to their diffe-rent interests.
The international technical and financial collaboration that Chile has received during the decade covered in this re-port has been crucial for the development, promotion and strengthening of activities related to climate change in the country. A notable supporter of these efforts has been the Global Environment Facility (GEF) and its implementing agencies. Support has also come from international envi-ronmental cooperation agreements signed by the Gover-nment of Chile and from bilateral cooperation initiatives.
The funding that the Government of Chile has provided for managing climate change in the country has enabled the creation of permanent working groups charged with addressing climate change from within their ministries and the allocation of budgets to implement their activities.
6. BARRIERS, GAPS AND NEEDS RELATED TO FINANCIAL AND TECHNICAL MATTERS AND CAPACITIES
For Chile, the important task of fulfilling its commitments under the UNFCCC will involve overcoming obstacles, filling in important gaps, and meeting various needs re-lated to financial and technical matters and the develop-ment of local capacities.
As a developing country, Chile is committed to contri-buting to efforts aimed at mitigating and to adapting to the impacts of climate change that are occurring at the national and global level. The work already done and the achievements made to date reflect the equitable balan-ce between national efforts and international support. This collaboration has enabled such advancements as the establishment of a new environmental institutional fra-mework, the generation of technical capacities and the development of new lines of work. The country’s achie-vements to date demonstrate how national efforts can be supported by developed countries to achieve the ultimate objective of the Convention.
6.1 FINANCIAL RESOURCES AND TECHNICAL SUPPORT
In moving toward low carbon development, Chile’s central challenges will revolve around generating permanent and sufficient national and international funding mechanisms for implementing climate change mitigation and adapta-tion projects and for measuring, reporting and verifying GHG reductions. Other challenges will include strengthe-ning the country’s research and development capacities.
6.2 SECTOR-SPECIFIC NEEDS
The list below identifies some areas in which Chile expects to carry out additional sector-specific efforts to establish and strengthen its climate change-related capacities.
• National greenhouse gas emissions inventory
• National water resources affected by climate change
PHOTO: MINISTRY OF THE ENVIRONMENT
CHAPTER 1National Circumstances
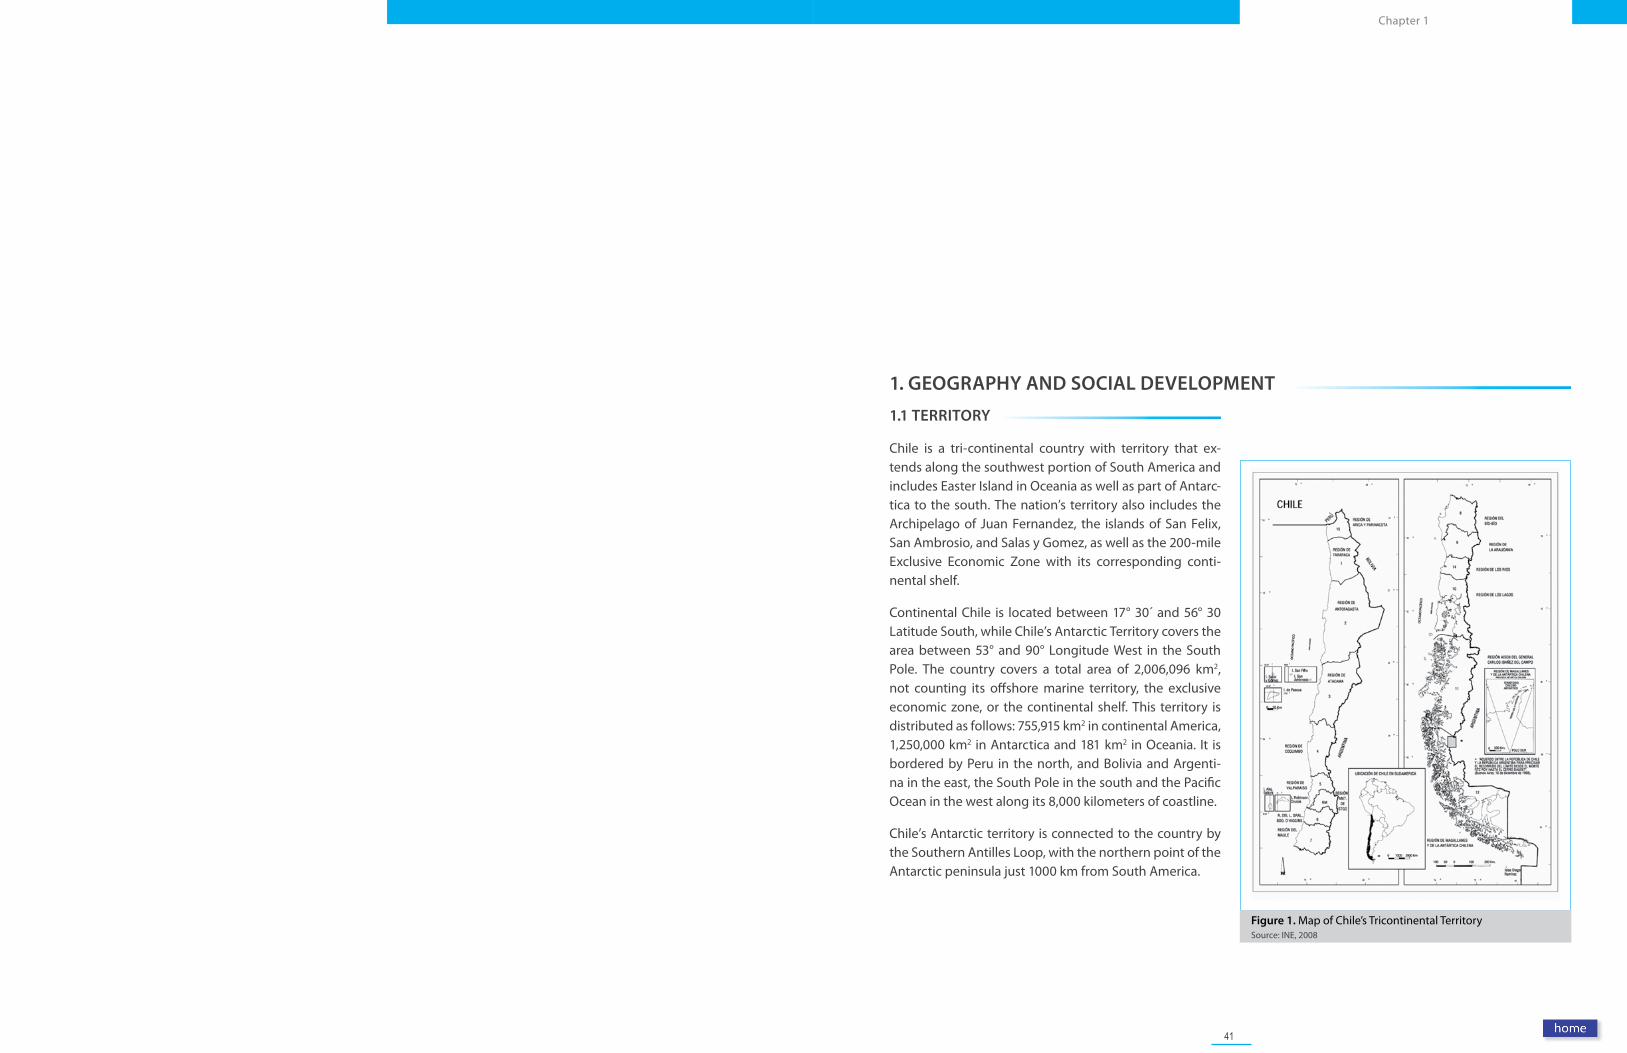
41
Chapter 1
Figure 1. Map of Chile’s Tricontinental TerritorySource: INE, 2008
1.1 TERRITORY
Chile is a tri-continental country with territory that ex-tends along the southwest portion of South America and includes Easter Island in Oceania as well as part of Antarc-tica to the south. The nation’s territory also includes the Archipelago of Juan Fernandez, the islands of San Felix, San Ambrosio, and Salas y Gomez, as well as the 200-mile Exclusive Economic Zone with its corresponding conti-nental shelf.
Continental Chile is located between 17° 30´ and 56° 30 Latitude South, while Chile’s Antarctic Territory covers the area between 53° and 90° Longitude West in the South Pole. The country covers a total area of 2,006,096 km2, not counting its offshore marine territory, the exclusive economic zone, or the continental shelf. This territory is distributed as follows: 755,915 km2 in continental America, 1,250,000 km2 in Antarctica and 181 km2 in Oceania. It is bordered by Peru in the north, and Bolivia and Argenti-na in the east, the South Pole in the south and the Pacific Ocean in the west along its 8,000 kilometers of coastline.
Chile’s Antarctic territory is connected to the country by the Southern Antilles Loop, with the northern point of the Antarctic peninsula just 1000 km from South America.
1. GEOGRAPHY AND SOCIAL DEVELOPMENT
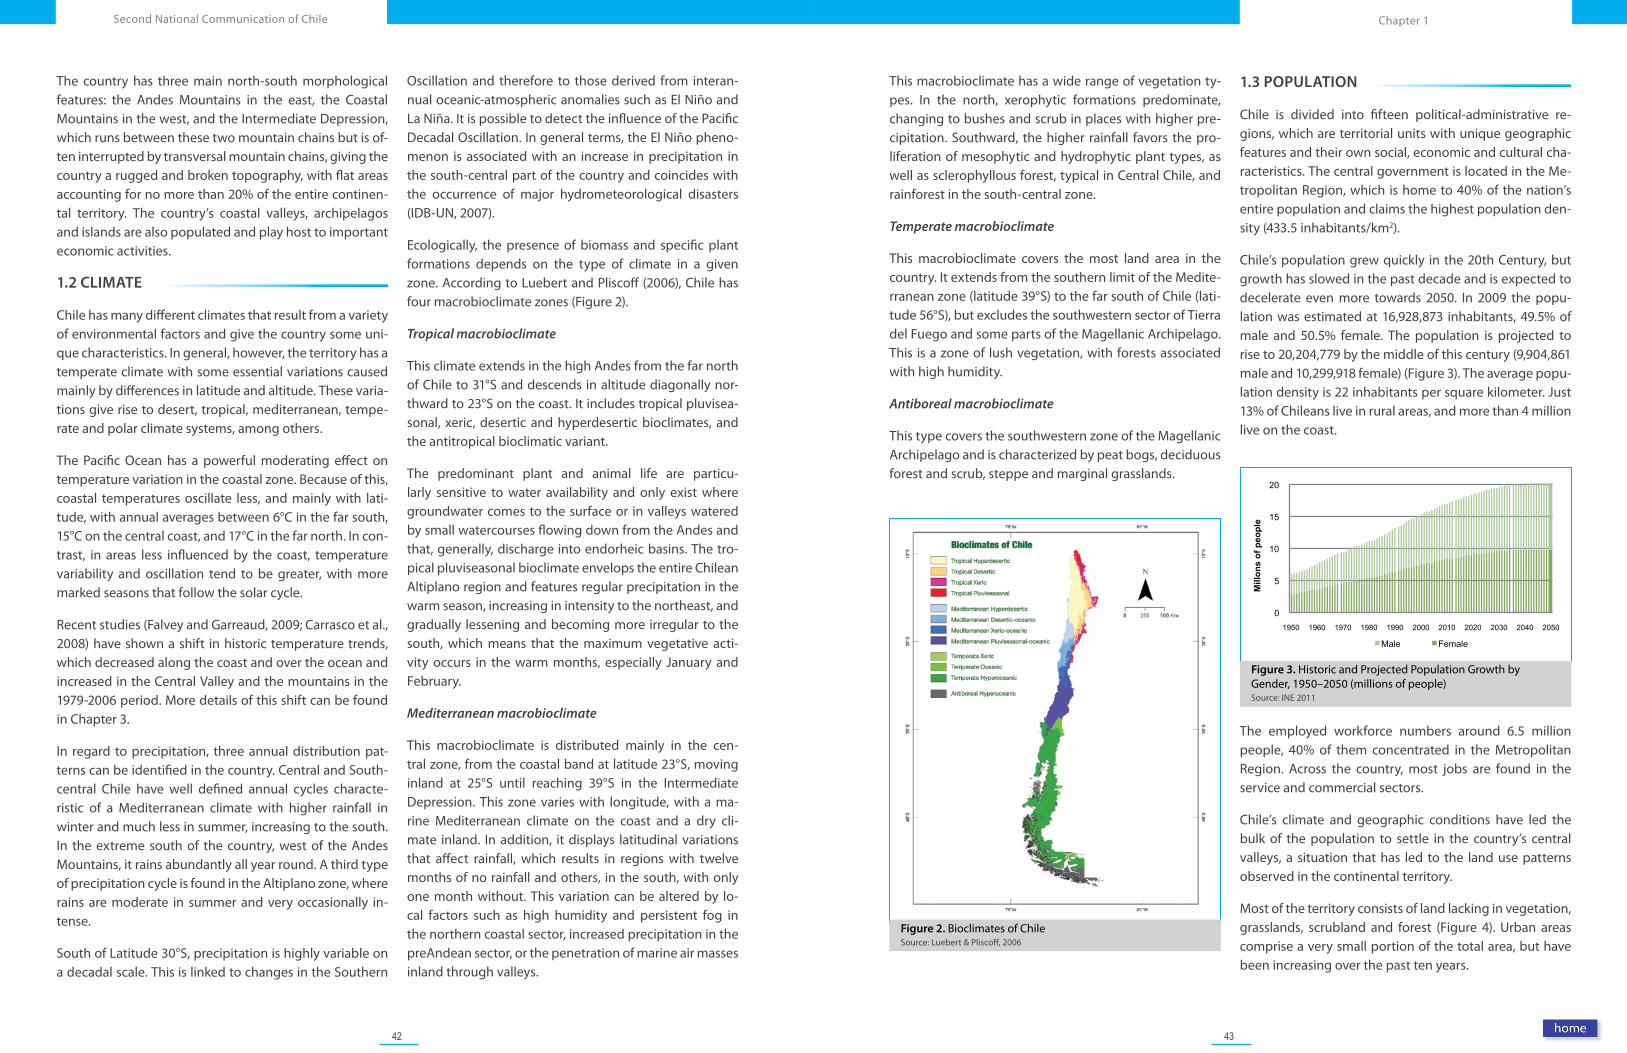
42 43
Chapter 1Second National Communication of Chile
Figure 2. Bioclimates of ChileSource: Luebert & Pliscoff, 2006
This macrobioclimate has a wide range of vegetation ty-pes. In the north, xerophytic formations predominate, changing to bushes and scrub in places with higher pre-cipitation. Southward, the higher rainfall favors the pro-liferation of mesophytic and hydrophytic plant types, as well as sclerophyllous forest, typical in Central Chile, and rainforest in the south-central zone.
Temperate macrobioclimate
This macrobioclimate covers the most land area in the country. It extends from the southern limit of the Medite-rranean zone (latitude 39°S) to the far south of Chile (lati-tude 56°S), but excludes the southwestern sector of Tierra del Fuego and some parts of the Magellanic Archipelago. This is a zone of lush vegetation, with forests associated with high humidity.
Antiboreal macrobioclimate
This type covers the southwestern zone of the Magellanic Archipelago and is characterized by peat bogs, deciduous forest and scrub, steppe and marginal grasslands.
1.3 POPULATION
Chile is divided into fifteen political-administrative re-gions, which are territorial units with unique geographic features and their own social, economic and cultural cha-racteristics. The central government is located in the Me-tropolitan Region, which is home to 40% of the nation’s entire population and claims the highest population den-sity (433.5 inhabitants/km2).
Chile’s population grew quickly in the 20th Century, but growth has slowed in the past decade and is expected to decelerate even more towards 2050. In 2009 the popu-lation was estimated at 16,928,873 inhabitants, 49.5% of male and 50.5% female. The population is projected to rise to 20,204,779 by the middle of this century (9,904,861 male and 10,299,918 female) (Figure 3). The average popu-lation density is 22 inhabitants per square kilometer. Just 13% of Chileans live in rural areas, and more than 4 million live on the coast.
The employed workforce numbers around 6.5 million people, 40% of them concentrated in the Metropolitan Region. Across the country, most jobs are found in the service and commercial sectors.
Chile’s climate and geographic conditions have led the bulk of the population to settle in the country’s central valleys, a situation that has led to the land use patterns observed in the continental territory.
Most of the territory consists of land lacking in vegetation, grasslands, scrubland and forest (Figure 4). Urban areas comprise a very small portion of the total area, but have been increasing over the past ten years.
Figure 3. Historic and Projected Population Growth by Gender, 1950–2050 (millions of people)Source: INE 2011
0
5
10
15
20
1950 1960 1970 1980 1990 2000 2010 2020 2030 2040 2050
Mill
ons
of p
eopl
e
Male
Female
The country has three main north-south morphological features: the Andes Mountains in the east, the Coastal Mountains in the west, and the Intermediate Depression, which runs between these two mountain chains but is of-ten interrupted by transversal mountain chains, giving the country a rugged and broken topography, with flat areas accounting for no more than 20% of the entire continen-tal territory. The country’s coastal valleys, archipelagos and islands are also populated and play host to important economic activities.
1.2 CLIMATE
Chile has many different climates that result from a variety of environmental factors and give the country some uni-que characteristics. In general, however, the territory has a temperate climate with some essential variations caused mainly by differences in latitude and altitude. These varia-tions give rise to desert, tropical, mediterranean, tempe-rate and polar climate systems, among others.
The Pacific Ocean has a powerful moderating effect on temperature variation in the coastal zone. Because of this, coastal temperatures oscillate less, and mainly with lati-tude, with annual averages between 6°C in the far south, 15°C on the central coast, and 17°C in the far north. In con-trast, in areas less influenced by the coast, temperature variability and oscillation tend to be greater, with more marked seasons that follow the solar cycle.
Recent studies (Falvey and Garreaud, 2009; Carrasco et al., 2008) have shown a shift in historic temperature trends, which decreased along the coast and over the ocean and increased in the Central Valley and the mountains in the 1979-2006 period. More details of this shift can be found in Chapter 3.
In regard to precipitation, three annual distribution pat-terns can be identified in the country. Central and South-central Chile have well defined annual cycles characte-ristic of a Mediterranean climate with higher rainfall in winter and much less in summer, increasing to the south. In the extreme south of the country, west of the Andes Mountains, it rains abundantly all year round. A third type of precipitation cycle is found in the Altiplano zone, where rains are moderate in summer and very occasionally in-tense.
South of Latitude 30°S, precipitation is highly variable on a decadal scale. This is linked to changes in the Southern
Oscillation and therefore to those derived from interan-nual oceanic-atmospheric anomalies such as El Niño and La Niña. It is possible to detect the influence of the Pacific Decadal Oscillation. In general terms, the El Niño pheno-menon is associated with an increase in precipitation in the south-central part of the country and coincides with the occurrence of major hydrometeorological disasters (IDB-UN, 2007).
Ecologically, the presence of biomass and specific plant formations depends on the type of climate in a given zone. According to Luebert and Pliscoff (2006), Chile has four macrobioclimate zones (Figure 2).
Tropical macrobioclimate
This climate extends in the high Andes from the far north of Chile to 31°S and descends in altitude diagonally nor-thward to 23°S on the coast. It includes tropical pluvisea-sonal, xeric, desertic and hyperdesertic bioclimates, and the antitropical bioclimatic variant.
The predominant plant and animal life are particu-larly sensitive to water availability and only exist where groundwater comes to the surface or in valleys watered by small watercourses flowing down from the Andes and that, generally, discharge into endorheic basins. The tro-pical pluviseasonal bioclimate envelops the entire Chilean Altiplano region and features regular precipitation in the warm season, increasing in intensity to the northeast, and gradually lessening and becoming more irregular to the south, which means that the maximum vegetative acti-vity occurs in the warm months, especially January and February.
Mediterranean macrobioclimate
This macrobioclimate is distributed mainly in the cen-tral zone, from the coastal band at latitude 23°S, moving inland at 25°S until reaching 39°S in the Intermediate Depression. This zone varies with longitude, with a ma-rine Mediterranean climate on the coast and a dry cli-mate inland. In addition, it displays latitudinal variations that affect rainfall, which results in regions with twelve months of no rainfall and others, in the south, with only one month without. This variation can be altered by lo-cal factors such as high humidity and persistent fog in the northern coastal sector, increased precipitation in the preAndean sector, or the penetration of marine air masses inland through valleys.
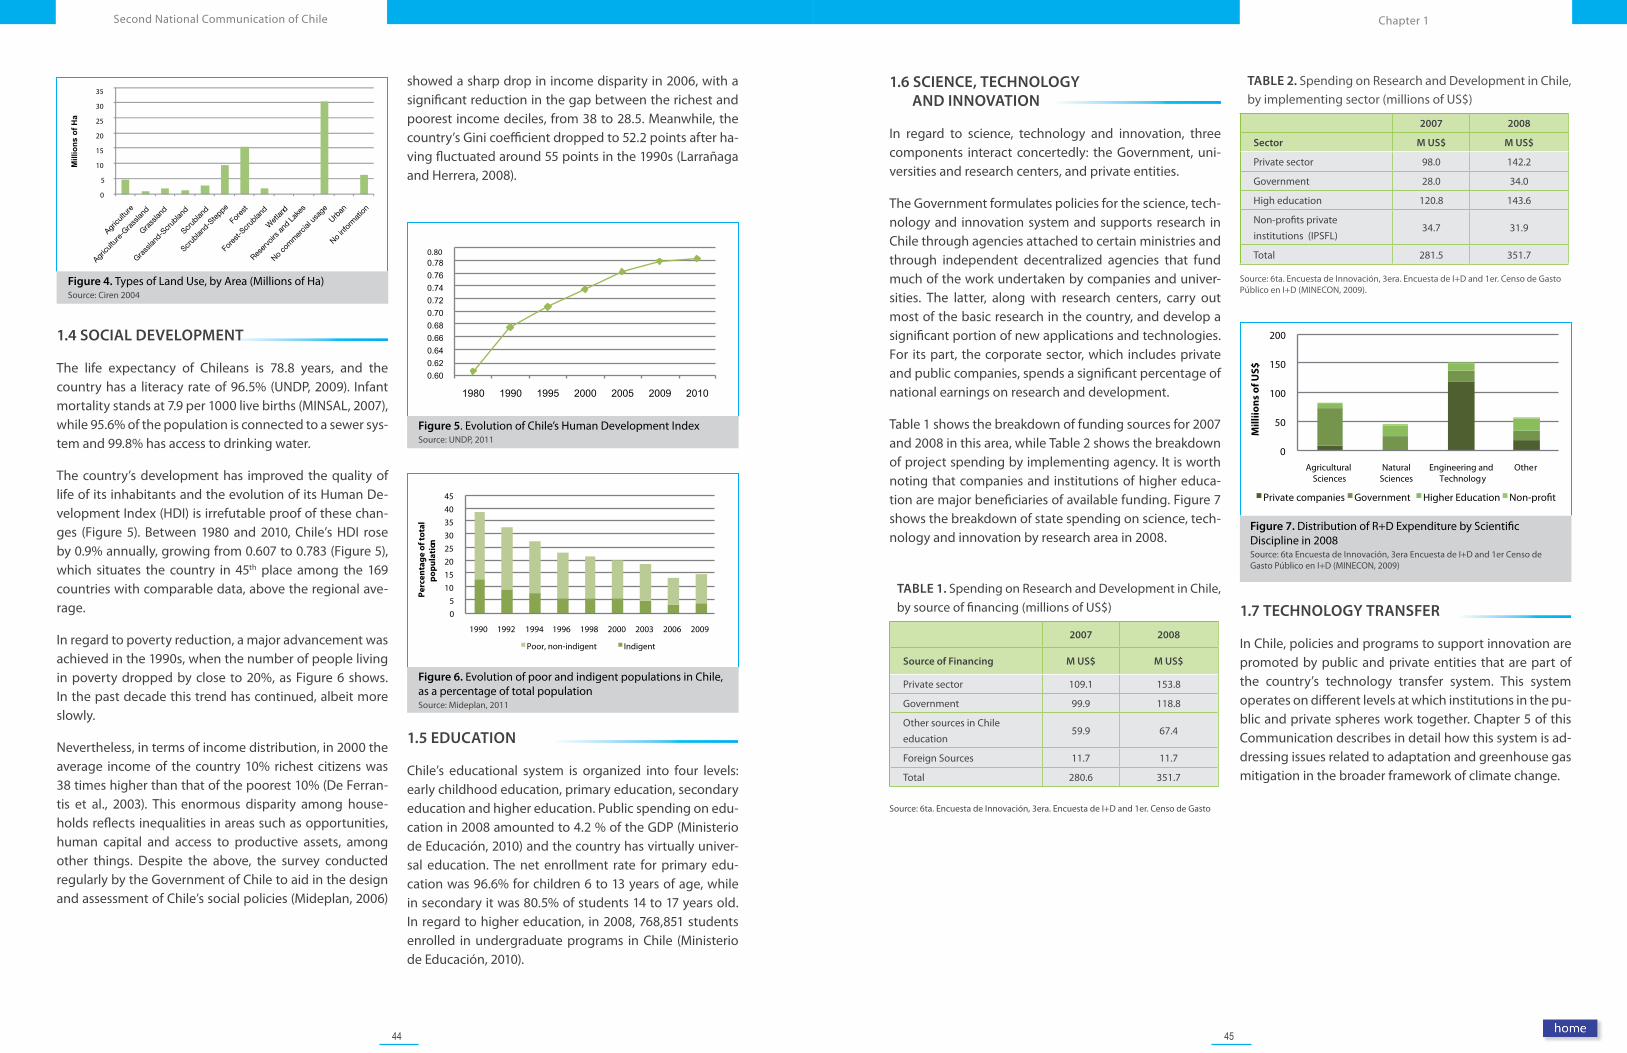
44 45
Chapter 1Second National Communication of Chile
1.6 SCIENCE, TECHNOLOGY AND INNOVATION
In regard to science, technology and innovation, three components interact concertedly: the Government, uni-versities and research centers, and private entities.
The Government formulates policies for the science, tech-nology and innovation system and supports research in Chile through agencies attached to certain ministries and through independent decentralized agencies that fund much of the work undertaken by companies and univer-sities. The latter, along with research centers, carry out most of the basic research in the country, and develop a significant portion of new applications and technologies. For its part, the corporate sector, which includes private and public companies, spends a significant percentage of national earnings on research and development.
Table 1 shows the breakdown of funding sources for 2007 and 2008 in this area, while Table 2 shows the breakdown of project spending by implementing agency. It is worth noting that companies and institutions of higher educa-tion are major beneficiaries of available funding. Figure 7 shows the breakdown of state spending on science, tech-nology and innovation by research area in 2008.
TABLE 1. Spending on Research and Development in Chile, by source of financing (millions of US$)
2007 2008
Source of Financing M US$ M US$
Private sector 109.1 153.8
Government 99.9 118.8
Other sources in Chile education
59.9 67.4
Foreign Sources 11.7 11.7
Total 280.6 351.7
Source: 6ta. Encuesta de Innovación, 3era. Encuesta de I+D and 1er. Censo de Gasto
TABLE 2. Spending on Research and Development in Chile, by implementing sector (millions of US$)
2007 2008
Sector M US$ M US$
Private sector 98.0 142.2
Government 28.0 34.0
High education 120.8 143.6
Non-profits private institutions (IPSFL)
34.7 31.9
Total 281.5 351.7
Source: 6ta. Encuesta de Innovación, 3era. Encuesta de I+D and 1er. Censo de Gasto Público en I+D (MINECON, 2009).
1.7 TECHNOLOGY TRANSFER
In Chile, policies and programs to support innovation are promoted by public and private entities that are part of the country’s technology transfer system. This system operates on different levels at which institutions in the pu-blic and private spheres work together. Chapter 5 of this Communication describes in detail how this system is ad-dressing issues related to adaptation and greenhouse gas mitigation in the broader framework of climate change.
Figure 7. Distribution of R+D Expenditure by Scientific Discipline in 2008Source: 6ta Encuesta de Innovación, 3era Encuesta de I+D and 1er Censo de Gasto Público en I+D (MINECON, 2009)
Figure 4. Types of Land Use, by Area (Millions of Ha) Source: Ciren 2004
Agricu
lture
Agricu
lture
-Gra
sslan
d
Grass
land
Grass
land-S
crub
land
Scrub
land
Scrub
land-S
teppe
Fore
st
Fore
st-Scr
ublan
d
Wet
land
Reser
voirs
and L
akes
No co
mm
ercia
l usa
ge
Urban
No inf
orm
ation
0 5
10 15 20 25 30 35 40 45
1990 1992 1994 1996 1998 2000 2003 2006 2009
Per
cen
tag
e o
f to
tal
po
pu
lati
on
Poor, non-indigent Indigent
Figure 6. Evolution of poor and indigent populations in Chile, as a percentage of total populationSource: Mideplan, 2011
1.4 SOCIAL DEVELOPMENT
The life expectancy of Chileans is 78.8 years, and the country has a literacy rate of 96.5% (UNDP, 2009). Infant mortality stands at 7.9 per 1000 live births (MINSAL, 2007), while 95.6% of the population is connected to a sewer sys-tem and 99.8% has access to drinking water.
The country’s development has improved the quality of life of its inhabitants and the evolution of its Human De-velopment Index (HDI) is irrefutable proof of these chan-ges (Figure 5). Between 1980 and 2010, Chile’s HDI rose by 0.9% annually, growing from 0.607 to 0.783 (Figure 5), which situates the country in 45th place among the 169 countries with comparable data, above the regional ave-rage.
In regard to poverty reduction, a major advancement was achieved in the 1990s, when the number of people living in poverty dropped by close to 20%, as Figure 6 shows. In the past decade this trend has continued, albeit more slowly.
Nevertheless, in terms of income distribution, in 2000 the average income of the country 10% richest citizens was 38 times higher than that of the poorest 10% (De Ferran-tis et al., 2003). This enormous disparity among house-holds reflects inequalities in areas such as opportunities, human capital and access to productive assets, among other things. Despite the above, the survey conducted regularly by the Government of Chile to aid in the design and assessment of Chile’s social policies (Mideplan, 2006)
showed a sharp drop in income disparity in 2006, with a significant reduction in the gap between the richest and poorest income deciles, from 38 to 28.5. Meanwhile, the country’s Gini coefficient dropped to 52.2 points after ha-ving fluctuated around 55 points in the 1990s (Larrañaga and Herrera, 2008).
1.5 EDUCATION
Chile’s educational system is organized into four levels: early childhood education, primary education, secondary education and higher education. Public spending on edu-cation in 2008 amounted to 4.2 % of the GDP (Ministerio de Educación, 2010) and the country has virtually univer-sal education. The net enrollment rate for primary edu-cation was 96.6% for children 6 to 13 years of age, while in secondary it was 80.5% of students 14 to 17 years old. In regard to higher education, in 2008, 768,851 students enrolled in undergraduate programs in Chile (Ministerio de Educación, 2010).
Figure 5. Evolution of Chile’s Human Development Index Source: UNDP, 2011
1980 1990 1995 2000 2005 2009 2010
0
5
10
15
20
25
30
35
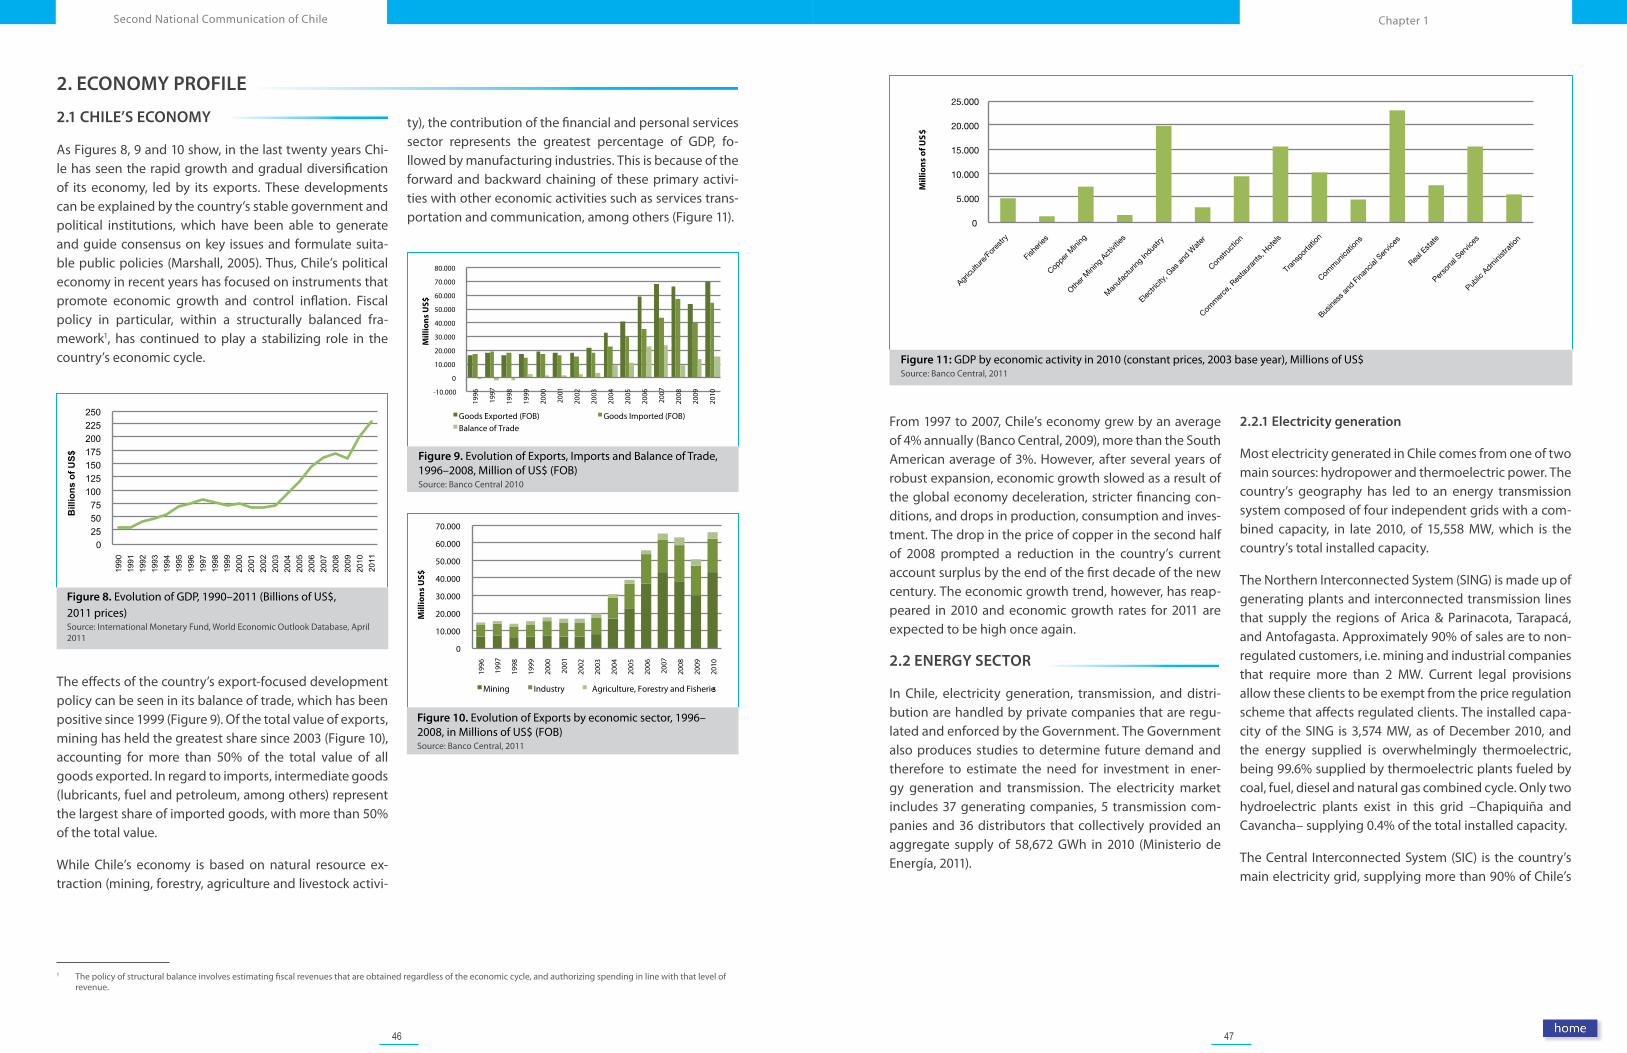
46 47
Chapter 1Second National Communication of Chile
Figure 11: GDP by economic activity in 2010 (constant prices, 2003 base year), Millions of US$ Source: Banco Central, 2011
0
5.000
10.000
15.000
20.000
25.000
Agricu
lture
/For
estry
Fishe
ries
Cop
per M
ining
Oth
er M
ining
Act
ivitie
s
Man
ufac
turin
g Ind
ustry
Electri
city,
Gas an
d Wat
er
Constr
uctio
n
Comm
erce
, Res
taur
ants,
Hot
els
Tran
spor
tatio
n
Comm
unica
tions
Busine
ss an
d Fina
ncial
Ser
vices
Real E
state
Perso
nal S
ervic
es
Public
Adm
inistr
ation
Mill
ion
s o
f US
$
From 1997 to 2007, Chile’s economy grew by an average of 4% annually (Banco Central, 2009), more than the South American average of 3%. However, after several years of robust expansion, economic growth slowed as a result of the global economy deceleration, stricter financing con-ditions, and drops in production, consumption and inves-tment. The drop in the price of copper in the second half of 2008 prompted a reduction in the country’s current account surplus by the end of the first decade of the new century. The economic growth trend, however, has reap-peared in 2010 and economic growth rates for 2011 are expected to be high once again.
2.2 ENERGY SECTOR
In Chile, electricity generation, transmission, and distri-bution are handled by private companies that are regu-lated and enforced by the Government. The Government also produces studies to determine future demand and therefore to estimate the need for investment in ener-gy generation and transmission. The electricity market includes 37 generating companies, 5 transmission com-panies and 36 distributors that collectively provided an aggregate supply of 58,672 GWh in 2010 (Ministerio de Energía, 2011).
2.2.1 Electricity generation
Most electricity generated in Chile comes from one of two main sources: hydropower and thermoelectric power. The country’s geography has led to an energy transmission system composed of four independent grids with a com-bined capacity, in late 2010, of 15,558 MW, which is the country’s total installed capacity.
The Northern Interconnected System (SING) is made up of generating plants and interconnected transmission lines that supply the regions of Arica & Parinacota, Tarapacá, and Antofagasta. Approximately 90% of sales are to non-regulated customers, i.e. mining and industrial companies that require more than 2 MW. Current legal provisions allow these clients to be exempt from the price regulation scheme that affects regulated clients. The installed capa-city of the SING is 3,574 MW, as of December 2010, and the energy supplied is overwhelmingly thermoelectric, being 99.6% supplied by thermoelectric plants fueled by coal, fuel, diesel and natural gas combined cycle. Only two hydroelectric plants exist in this grid –Chapiquiña and Cavancha– supplying 0.4% of the total installed capacity.
The Central Interconnected System (SIC) is the country’s main electricity grid, supplying more than 90% of Chile’s
1 The policy of structural balance involves estimating fiscal revenues that are obtained regardless of the economic cycle, and authorizing spending in line with that level of revenue.
2. ECONOMY PROFILE
2.1 CHILE’S ECONOMY
As Figures 8, 9 and 10 show, in the last twenty years Chi-le has seen the rapid growth and gradual diversification of its economy, led by its exports. These developments can be explained by the country’s stable government and political institutions, which have been able to generate and guide consensus on key issues and formulate suita-ble public policies (Marshall, 2005). Thus, Chile’s political economy in recent years has focused on instruments that promote economic growth and control inflation. Fiscal policy in particular, within a structurally balanced fra-mework1, has continued to play a stabilizing role in the country’s economic cycle.
The effects of the country’s export-focused development policy can be seen in its balance of trade, which has been positive since 1999 (Figure 9). Of the total value of exports, mining has held the greatest share since 2003 (Figure 10), accounting for more than 50% of the total value of all goods exported. In regard to imports, intermediate goods (lubricants, fuel and petroleum, among others) represent the largest share of imported goods, with more than 50% of the total value.
While Chile’s economy is based on natural resource ex-traction (mining, forestry, agriculture and livestock activi-
ty), the contribution of the financial and personal services sector represents the greatest percentage of GDP, fo-llowed by manufacturing industries. This is because of the forward and backward chaining of these primary activi-ties with other economic activities such as services trans-portation and communication, among others (Figure 11).
Figure 8. Evolution of GDP, 1990–2011 (Billions of US$, 2011 prices)Source: International Monetary Fund, World Economic Outlook Database, April 2011
Figure 9. Evolution of Exports, Imports and Balance of Trade, 1996–2008, Million of US$ (FOB)Source: Banco Central 2010
-10.000
0
10.000
20.000
30.000
40.000
50.000
60.000
70.000
80.000
1996
1997
1998
1999
2000
2001
2002
2003
2004
2005
2006
2007
2008
2009
2010
Goods Exported (FOB)
Goods Imported (FOB) Balance of Trade M
illio
ns
US$
Figure 10. Evolution of Exports by economic sector, 1996–2008, in Millions of US$ (FOB)Source: Banco Central, 2011
0
10.000
20.000
30.000
40.000
50.000
60.000
70.000
1996
1997
1998
1999
2000
2001
2002
2003
2004
2005
2006
2007
2008
2009
2010
Mill
ion
s U
S$
Mining Industry Agriculture, Forestry and Fisheries
0 25 50 75
100 125 150 175 200 225 250
1990
19
91
1992
19
93
1994
19
95
1996
19
97
1998
19
99
2000
20
01
2002
20
03
2004
20
05
2006
20
07
2008
20
09
2010
20
11
Bill
ions
of U
S$
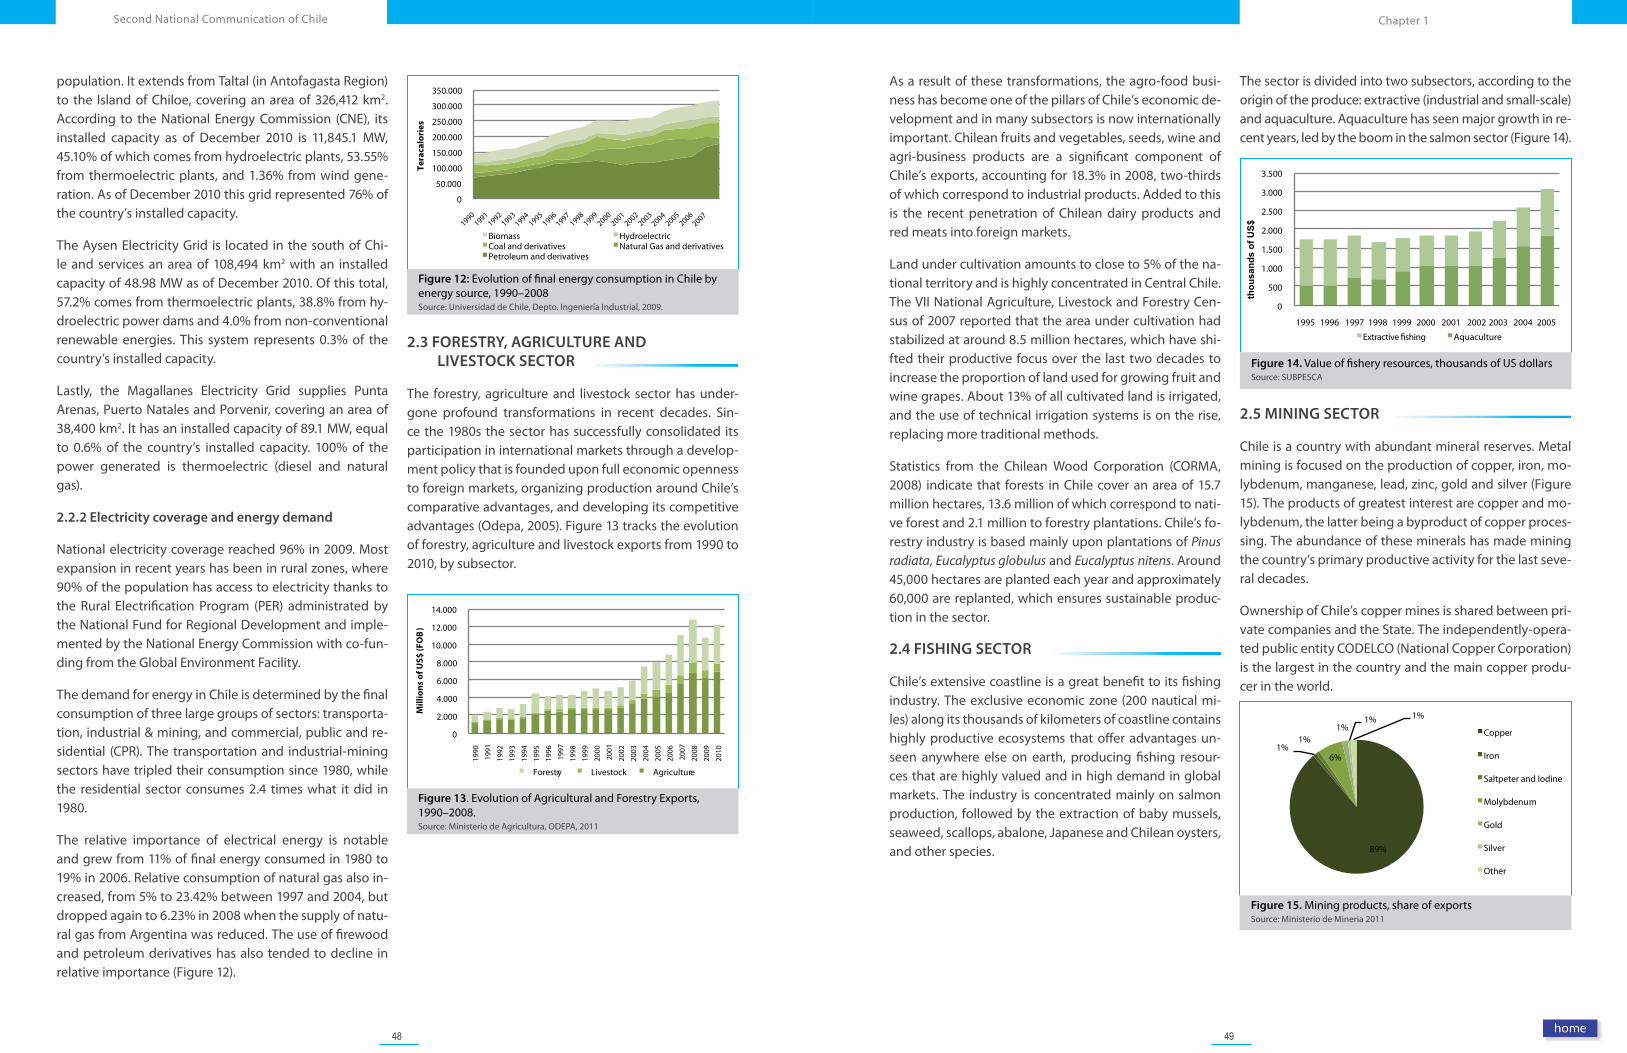
48 49
Chapter 1Second National Communication of Chile
Figure 14. Value of fishery resources, thousands of US dollars Source: SUBPESCA
89%
1% 1%
6%
1% 1% 1%
Copper
Iron
Saltpeter and Iodine
Molybdenum
Gold
Silver
Other
Figure 15. Mining products, share of exports Source: Ministerio de Mineria 2011
As a result of these transformations, the agro-food busi-ness has become one of the pillars of Chile’s economic de-velopment and in many subsectors is now internationally important. Chilean fruits and vegetables, seeds, wine and agri-business products are a significant component of Chile’s exports, accounting for 18.3% in 2008, two-thirds of which correspond to industrial products. Added to this is the recent penetration of Chilean dairy products and red meats into foreign markets.
Land under cultivation amounts to close to 5% of the na-tional territory and is highly concentrated in Central Chile. The VII National Agriculture, Livestock and Forestry Cen-sus of 2007 reported that the area under cultivation had stabilized at around 8.5 million hectares, which have shi-fted their productive focus over the last two decades to increase the proportion of land used for growing fruit and wine grapes. About 13% of all cultivated land is irrigated, and the use of technical irrigation systems is on the rise, replacing more traditional methods.
Statistics from the Chilean Wood Corporation (CORMA, 2008) indicate that forests in Chile cover an area of 15.7 million hectares, 13.6 million of which correspond to nati-ve forest and 2.1 million to forestry plantations. Chile’s fo-restry industry is based mainly upon plantations of Pinus radiata, Eucalyptus globulus and Eucalyptus nitens. Around 45,000 hectares are planted each year and approximately 60,000 are replanted, which ensures sustainable produc-tion in the sector.
2.4 FISHING SECTOR
Chile’s extensive coastline is a great benefit to its fishing industry. The exclusive economic zone (200 nautical mi-les) along its thousands of kilometers of coastline contains highly productive ecosystems that offer advantages un-seen anywhere else on earth, producing fishing resour-ces that are highly valued and in high demand in global markets. The industry is concentrated mainly on salmon production, followed by the extraction of baby mussels, seaweed, scallops, abalone, Japanese and Chilean oysters, and other species.
The sector is divided into two subsectors, according to the origin of the produce: extractive (industrial and small-scale) and aquaculture. Aquaculture has seen major growth in re-cent years, led by the boom in the salmon sector (Figure 14).
2.5 MINING SECTOR
Chile is a country with abundant mineral reserves. Metal mining is focused on the production of copper, iron, mo-lybdenum, manganese, lead, zinc, gold and silver (Figure 15). The products of greatest interest are copper and mo-lybdenum, the latter being a byproduct of copper proces-sing. The abundance of these minerals has made mining the country’s primary productive activity for the last seve-ral decades.
Ownership of Chile’s copper mines is shared between pri-vate companies and the State. The independently-opera-ted public entity CODELCO (National Copper Corporation) is the largest in the country and the main copper produ-cer in the world.
0
500
1.000
1.500
2.000
2.500
3.000
3.500
1995 1996 1997 1998 1999 2000 2001 2002 2003 2004 2005
thou
sand
s of
US$
Aquaculture
0
2.000
4.000
6.000
8.000
10.000
12.000
14.000
1990
1991
1992
1993
1994
1995
1996
1997
1998
1999
2000
2001
2002
2003
2004
2005
2006
2007
2008
2009
2010
Mill
ion
s o
f US$
(FO
B)
Forestry Livestock Agriculture
0
50.000
100.000
150.000
200.000
250.000
300.000
350.000
19901991
19921993
19941995
19961997
19981999
20002001
20022003
20042005
20062007
Tera
calo
ries
Biomass Hydroelectric Coal and derivatives Natural Gas and derivativesPetroleum and derivatives
Figure 12: Evolution of final energy consumption in Chile by energy source, 1990–2008Source: Universidad de Chile, Depto. Ingeniería Industrial, 2009.
Figure 13. Evolution of Agricultural and Forestry Exports, 1990–2008.Source: Ministerio de Agricultura, ODEPA, 2011
population. It extends from Taltal (in Antofagasta Region) to the Island of Chiloe, covering an area of 326,412 km2. According to the National Energy Commission (CNE), its installed capacity as of December 2010 is 11,845.1 MW, 45.10% of which comes from hydroelectric plants, 53.55% from thermoelectric plants, and 1.36% from wind gene-ration. As of December 2010 this grid represented 76% of the country’s installed capacity.
The Aysen Electricity Grid is located in the south of Chi-le and services an area of 108,494 km2 with an installed capacity of 48.98 MW as of December 2010. Of this total, 57.2% comes from thermoelectric plants, 38.8% from hy-droelectric power dams and 4.0% from non-conventional renewable energies. This system represents 0.3% of the country’s installed capacity.
Lastly, the Magallanes Electricity Grid supplies Punta Arenas, Puerto Natales and Porvenir, covering an area of 38,400 km2. It has an installed capacity of 89.1 MW, equal to 0.6% of the country’s installed capacity. 100% of the power generated is thermoelectric (diesel and natural gas).
2.2.2 Electricity coverage and energy demand
National electricity coverage reached 96% in 2009. Most expansion in recent years has been in rural zones, where 90% of the population has access to electricity thanks to the Rural Electrification Program (PER) administrated by the National Fund for Regional Development and imple-mented by the National Energy Commission with co-fun-ding from the Global Environment Facility.
The demand for energy in Chile is determined by the final consumption of three large groups of sectors: transporta-tion, industrial & mining, and commercial, public and re-sidential (CPR). The transportation and industrial-mining sectors have tripled their consumption since 1980, while the residential sector consumes 2.4 times what it did in 1980.
The relative importance of electrical energy is notable and grew from 11% of final energy consumed in 1980 to 19% in 2006. Relative consumption of natural gas also in-creased, from 5% to 23.42% between 1997 and 2004, but dropped again to 6.23% in 2008 when the supply of natu-ral gas from Argentina was reduced. The use of firewood and petroleum derivatives has also tended to decline in relative importance (Figure 12).
2.3 FORESTRY, AGRICULTURE AND LIVESTOCK SECTOR
The forestry, agriculture and livestock sector has under-gone profound transformations in recent decades. Sin-ce the 1980s the sector has successfully consolidated its participation in international markets through a develop-ment policy that is founded upon full economic openness to foreign markets, organizing production around Chile’s comparative advantages, and developing its competitive advantages (Odepa, 2005). Figure 13 tracks the evolution of forestry, agriculture and livestock exports from 1990 to 2010, by subsector.
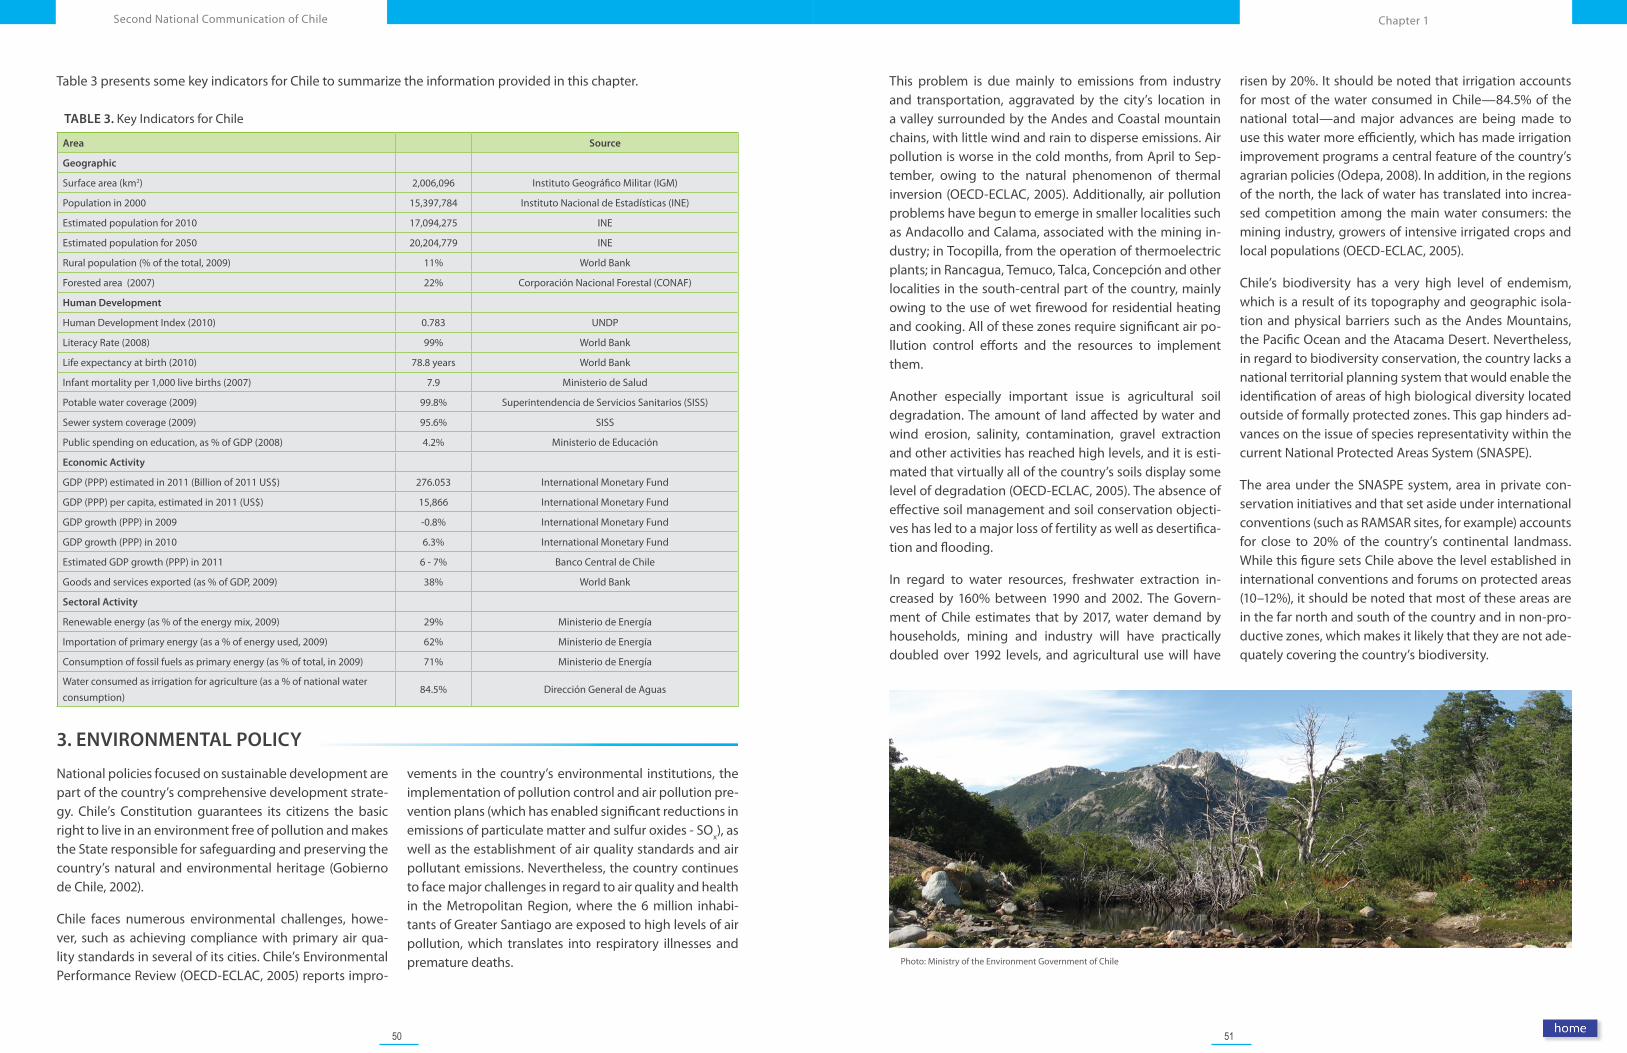
50 51
Chapter 1Second National Communication of Chile
Photo: Ministry of the Environment Government of Chile
This problem is due mainly to emissions from industry and transportation, aggravated by the city’s location in a valley surrounded by the Andes and Coastal mountain chains, with little wind and rain to disperse emissions. Air pollution is worse in the cold months, from April to Sep-tember, owing to the natural phenomenon of thermal inversion (OECD-ECLAC, 2005). Additionally, air pollution problems have begun to emerge in smaller localities such as Andacollo and Calama, associated with the mining in-dustry; in Tocopilla, from the operation of thermoelectric plants; in Rancagua, Temuco, Talca, Concepción and other localities in the south-central part of the country, mainly owing to the use of wet firewood for residential heating and cooking. All of these zones require significant air po-llution control efforts and the resources to implement them.
Another especially important issue is agricultural soil degradation. The amount of land affected by water and wind erosion, salinity, contamination, gravel extraction and other activities has reached high levels, and it is esti-mated that virtually all of the country’s soils display some level of degradation (OECD-ECLAC, 2005). The absence of effective soil management and soil conservation objecti-ves has led to a major loss of fertility as well as desertifica-tion and flooding.
In regard to water resources, freshwater extraction in-creased by 160% between 1990 and 2002. The Govern-ment of Chile estimates that by 2017, water demand by households, mining and industry will have practically doubled over 1992 levels, and agricultural use will have
risen by 20%. It should be noted that irrigation accounts for most of the water consumed in Chile—84.5% of the national total—and major advances are being made to use this water more efficiently, which has made irrigation improvement programs a central feature of the country’s agrarian policies (Odepa, 2008). In addition, in the regions of the north, the lack of water has translated into increa-sed competition among the main water consumers: the mining industry, growers of intensive irrigated crops and local populations (OECD-ECLAC, 2005).
Chile’s biodiversity has a very high level of endemism, which is a result of its topography and geographic isola-tion and physical barriers such as the Andes Mountains, the Pacific Ocean and the Atacama Desert. Nevertheless, in regard to biodiversity conservation, the country lacks a national territorial planning system that would enable the identification of areas of high biological diversity located outside of formally protected zones. This gap hinders ad-vances on the issue of species representativity within the current National Protected Areas System (SNASPE).
The area under the SNASPE system, area in private con-servation initiatives and that set aside under international conventions (such as RAMSAR sites, for example) accounts for close to 20% of the country’s continental landmass. While this figure sets Chile above the level established in international conventions and forums on protected areas (10–12%), it should be noted that most of these areas are in the far north and south of the country and in non-pro-ductive zones, which makes it likely that they are not ade-quately covering the country’s biodiversity.
Table 3 presents some key indicators for Chile to summarize the information provided in this chapter.
TABLE 3. Key Indicators for Chile
Area Source
Geographic
Surface area (km2) 2,006,096 Instituto Geográfico Militar (IGM)
Population in 2000 15,397,784 Instituto Nacional de Estadísticas (INE)
Estimated population for 2010 17,094,275 INE
Estimated population for 2050 20,204,779 INE
Rural population (% of the total, 2009) 11% World Bank
Forested area (2007) 22% Corporación Nacional Forestal (CONAF)
Human Development
Human Development Index (2010) 0.783 UNDP
Literacy Rate (2008) 99% World Bank
Life expectancy at birth (2010) 78.8 years World Bank
Infant mortality per 1,000 live births (2007) 7.9 Ministerio de Salud
Potable water coverage (2009) 99.8% Superintendencia de Servicios Sanitarios (SISS)
Sewer system coverage (2009) 95.6% SISS
Public spending on education, as % of GDP (2008) 4.2% Ministerio de Educación
Economic Activity
GDP (PPP) estimated in 2011 (Billion of 2011 US$) 276.053 International Monetary Fund
GDP (PPP) per capita, estimated in 2011 (US$) 15,866 International Monetary Fund
GDP growth (PPP) in 2009 -0.8% International Monetary Fund
GDP growth (PPP) in 2010 6.3% International Monetary Fund
Estimated GDP growth (PPP) in 2011 6 - 7% Banco Central de Chile
Goods and services exported (as % of GDP, 2009) 38% World Bank
Sectoral Activity
Renewable energy (as % of the energy mix, 2009) 29% Ministerio de Energía
Importation of primary energy (as a % of energy used, 2009) 62% Ministerio de Energía
Consumption of fossil fuels as primary energy (as % of total, in 2009) 71% Ministerio de Energía
Water consumed as irrigation for agriculture (as a % of national water consumption)
84.5% Dirección General de Aguas
3. ENVIRONMENTAL POLICY
National policies focused on sustainable development are part of the country’s comprehensive development strate-gy. Chile’s Constitution guarantees its citizens the basic right to live in an environment free of pollution and makes the State responsible for safeguarding and preserving the country’s natural and environmental heritage (Gobierno de Chile, 2002).
Chile faces numerous environmental challenges, howe-ver, such as achieving compliance with primary air qua-lity standards in several of its cities. Chile’s Environmental Performance Review (OECD-ECLAC, 2005) reports impro-
vements in the country’s environmental institutions, the implementation of pollution control and air pollution pre-vention plans (which has enabled significant reductions in emissions of particulate matter and sulfur oxides - SOx), as well as the establishment of air quality standards and air pollutant emissions. Nevertheless, the country continues to face major challenges in regard to air quality and health in the Metropolitan Region, where the 6 million inhabi-tants of Greater Santiago are exposed to high levels of air pollution, which translates into respiratory illnesses and premature deaths.
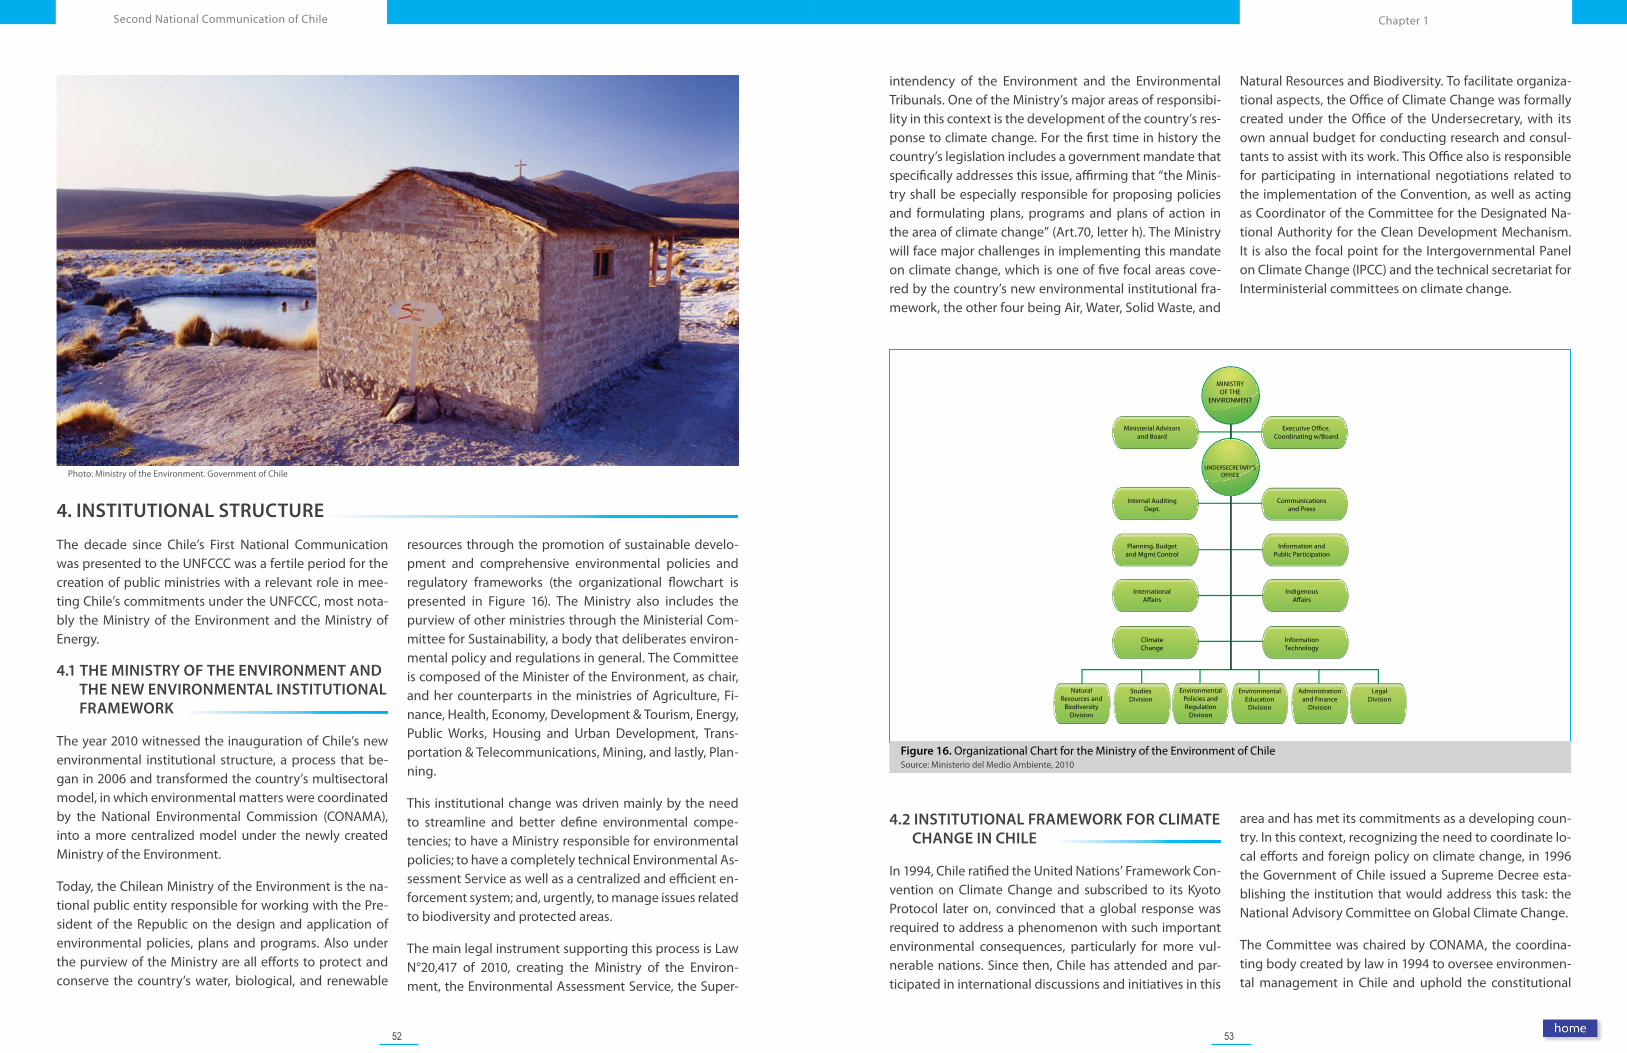
52 53
Chapter 1Second National Communication of Chile
intendency of the Environment and the Environmental Tribunals. One of the Ministry’s major areas of responsibi-lity in this context is the development of the country’s res-ponse to climate change. For the first time in history the country’s legislation includes a government mandate that specifically addresses this issue, affirming that “the Minis-try shall be especially responsible for proposing policies and formulating plans, programs and plans of action in the area of climate change” (Art.70, letter h). The Ministry will face major challenges in implementing this mandate on climate change, which is one of five focal areas cove-red by the country’s new environmental institutional fra-mework, the other four being Air, Water, Solid Waste, and
Natural Resources and Biodiversity. To facilitate organiza-tional aspects, the Office of Climate Change was formally created under the Office of the Undersecretary, with its own annual budget for conducting research and consul-tants to assist with its work. This Office also is responsible for participating in international negotiations related to the implementation of the Convention, as well as acting as Coordinator of the Committee for the Designated Na-tional Authority for the Clean Development Mechanism. It is also the focal point for the Intergovernmental Panel on Climate Change (IPCC) and the technical secretariat for Interministerial committees on climate change.
Figure 16. Organizational Chart for the Ministry of the Environment of Chile Source: Ministerio del Medio Ambiente, 2010
4.2 INSTITUTIONAL FRAMEWORK FOR CLIMATE CHANGE IN CHILE
In 1994, Chile ratified the United Nations’ Framework Con-vention on Climate Change and subscribed to its Kyoto Protocol later on, convinced that a global response was required to address a phenomenon with such important environmental consequences, particularly for more vul-nerable nations. Since then, Chile has attended and par-ticipated in international discussions and initiatives in this
area and has met its commitments as a developing coun-try. In this context, recognizing the need to coordinate lo-cal efforts and foreign policy on climate change, in 1996 the Government of Chile issued a Supreme Decree esta-blishing the institution that would address this task: the National Advisory Committee on Global Climate Change.
The Committee was chaired by CONAMA, the coordina-ting body created by law in 1994 to oversee environmen-tal management in Chile and uphold the constitutional
Photo: Ministry of the Environment. Government of Chile
4. INSTITUTIONAL STRUCTURE
The decade since Chile’s First National Communication was presented to the UNFCCC was a fertile period for the creation of public ministries with a relevant role in mee-ting Chile’s commitments under the UNFCCC, most nota-bly the Ministry of the Environment and the Ministry of Energy.
4.1 THE MINISTRY OF THE ENVIRONMENT AND THE NEW ENVIRONMENTAL INSTITUTIONAL FRAMEWORK
The year 2010 witnessed the inauguration of Chile’s new environmental institutional structure, a process that be-gan in 2006 and transformed the country’s multisectoral model, in which environmental matters were coordinated by the National Environmental Commission (CONAMA), into a more centralized model under the newly created Ministry of the Environment.
Today, the Chilean Ministry of the Environment is the na-tional public entity responsible for working with the Pre-sident of the Republic on the design and application of environmental policies, plans and programs. Also under the purview of the Ministry are all efforts to protect and conserve the country’s water, biological, and renewable
resources through the promotion of sustainable develo-pment and comprehensive environmental policies and regulatory frameworks (the organizational flowchart is presented in Figure 16). The Ministry also includes the purview of other ministries through the Ministerial Com-mittee for Sustainability, a body that deliberates environ-mental policy and regulations in general. The Committee is composed of the Minister of the Environment, as chair, and her counterparts in the ministries of Agriculture, Fi-nance, Health, Economy, Development & Tourism, Energy, Public Works, Housing and Urban Development, Trans-portation & Telecommunications, Mining, and lastly, Plan-ning.
This institutional change was driven mainly by the need to streamline and better define environmental compe-tencies; to have a Ministry responsible for environmental policies; to have a completely technical Environmental As-sessment Service as well as a centralized and efficient en-forcement system; and, urgently, to manage issues related to biodiversity and protected areas.
The main legal instrument supporting this process is Law N°20,417 of 2010, creating the Ministry of the Environ-ment, the Environmental Assessment Service, the Super-
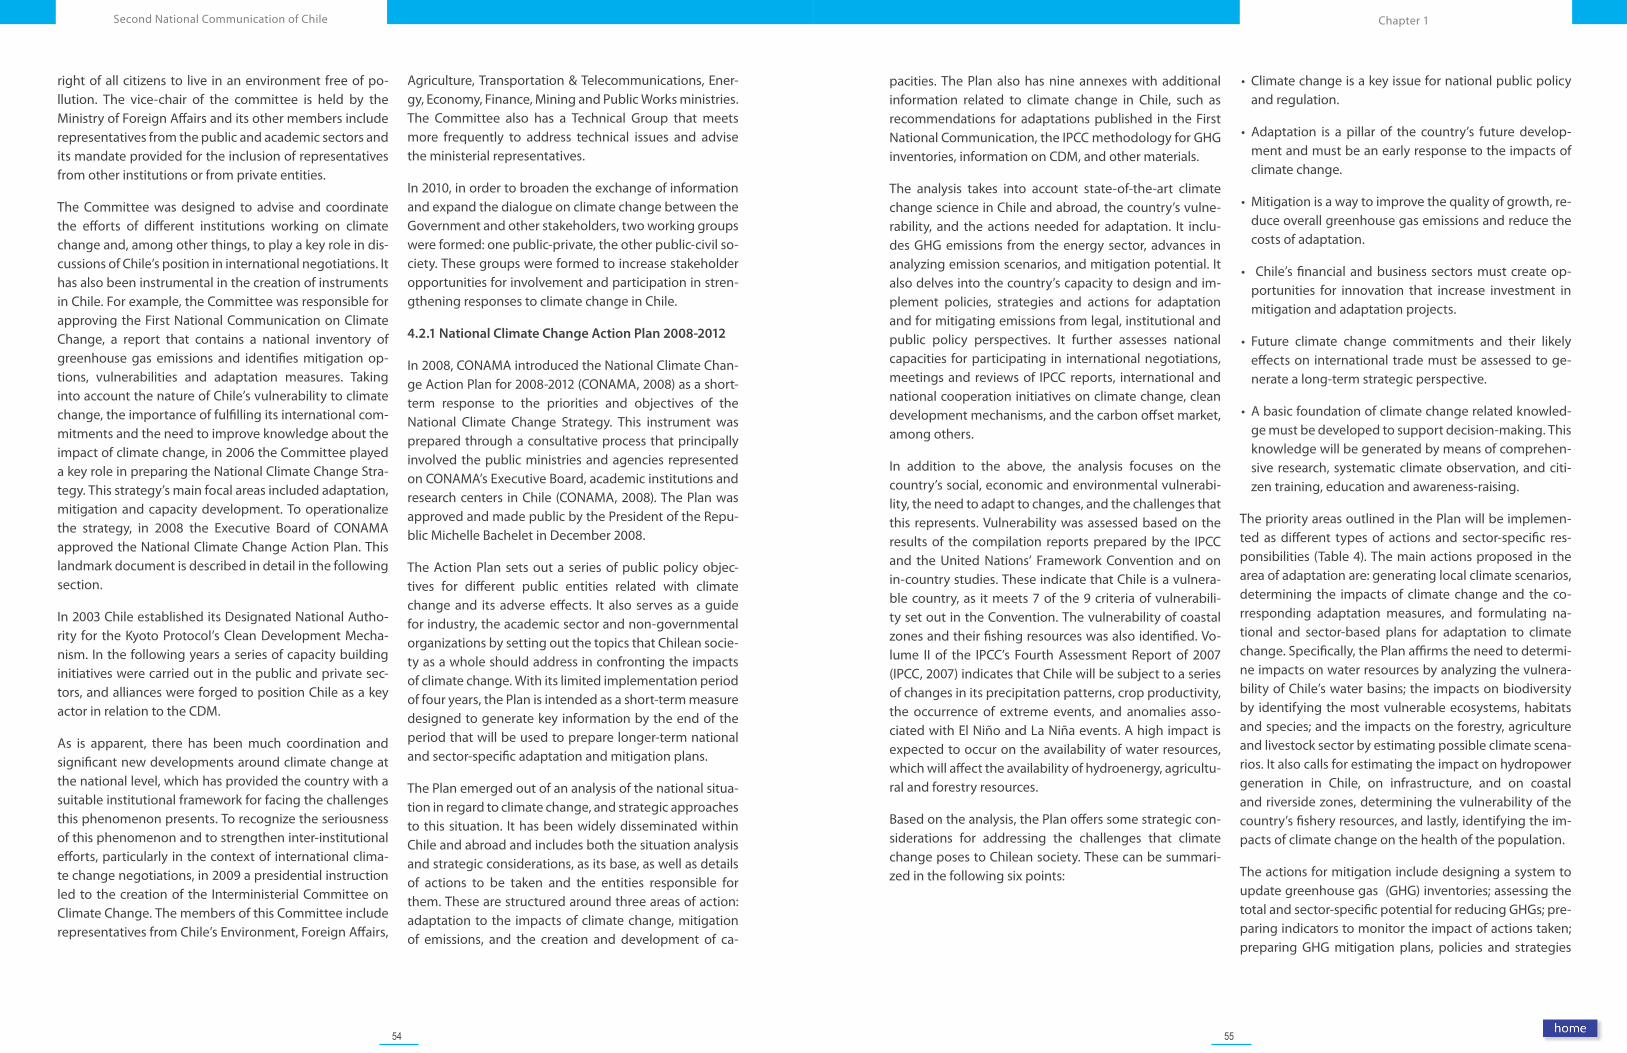
54 55
Chapter 1Second National Communication of Chile
pacities. The Plan also has nine annexes with additional information related to climate change in Chile, such as recommendations for adaptations published in the First National Communication, the IPCC methodology for GHG inventories, information on CDM, and other materials.
The analysis takes into account state-of-the-art climate change science in Chile and abroad, the country’s vulne-rability, and the actions needed for adaptation. It inclu-des GHG emissions from the energy sector, advances in analyzing emission scenarios, and mitigation potential. It also delves into the country’s capacity to design and im-plement policies, strategies and actions for adaptation and for mitigating emissions from legal, institutional and public policy perspectives. It further assesses national capacities for participating in international negotiations, meetings and reviews of IPCC reports, international and national cooperation initiatives on climate change, clean development mechanisms, and the carbon offset market, among others.
In addition to the above, the analysis focuses on the country’s social, economic and environmental vulnerabi-lity, the need to adapt to changes, and the challenges that this represents. Vulnerability was assessed based on the results of the compilation reports prepared by the IPCC and the United Nations’ Framework Convention and on in-country studies. These indicate that Chile is a vulnera-ble country, as it meets 7 of the 9 criteria of vulnerabili-ty set out in the Convention. The vulnerability of coastal zones and their fishing resources was also identified. Vo-lume II of the IPCC’s Fourth Assessment Report of 2007 (IPCC, 2007) indicates that Chile will be subject to a series of changes in its precipitation patterns, crop productivity, the occurrence of extreme events, and anomalies asso-ciated with El Niño and La Niña events. A high impact is expected to occur on the availability of water resources, which will affect the availability of hydroenergy, agricultu-ral and forestry resources.
Based on the analysis, the Plan offers some strategic con-siderations for addressing the challenges that climate change poses to Chilean society. These can be summari-zed in the following six points:
• Climate change is a key issue for national public policy and regulation.
• Adaptation is a pillar of the country’s future develop-ment and must be an early response to the impacts of climate change.
• Mitigation is a way to improve the quality of growth, re-duce overall greenhouse gas emissions and reduce the costs of adaptation.
• Chile’s financial and business sectors must create op-portunities for innovation that increase investment in mitigation and adaptation projects.
• Future climate change commitments and their likely effects on international trade must be assessed to ge-nerate a long-term strategic perspective.
• A basic foundation of climate change related knowled-ge must be developed to support decision-making. This knowledge will be generated by means of comprehen-sive research, systematic climate observation, and citi-zen training, education and awareness-raising.
The priority areas outlined in the Plan will be implemen-ted as different types of actions and sector-specific res-ponsibilities (Table 4). The main actions proposed in the area of adaptation are: generating local climate scenarios, determining the impacts of climate change and the co-rresponding adaptation measures, and formulating na-tional and sector-based plans for adaptation to climate change. Specifically, the Plan affirms the need to determi-ne impacts on water resources by analyzing the vulnera-bility of Chile’s water basins; the impacts on biodiversity by identifying the most vulnerable ecosystems, habitats and species; and the impacts on the forestry, agriculture and livestock sector by estimating possible climate scena-rios. It also calls for estimating the impact on hydropower generation in Chile, on infrastructure, and on coastal and riverside zones, determining the vulnerability of the country’s fishery resources, and lastly, identifying the im-pacts of climate change on the health of the population.
The actions for mitigation include designing a system to update greenhouse gas (GHG) inventories; assessing the total and sector-specific potential for reducing GHGs; pre-paring indicators to monitor the impact of actions taken; preparing GHG mitigation plans, policies and strategies
right of all citizens to live in an environment free of po-llution. The vice-chair of the committee is held by the Ministry of Foreign Affairs and its other members include representatives from the public and academic sectors and its mandate provided for the inclusion of representatives from other institutions or from private entities.
The Committee was designed to advise and coordinate the efforts of different institutions working on climate change and, among other things, to play a key role in dis-cussions of Chile’s position in international negotiations. It has also been instrumental in the creation of instruments in Chile. For example, the Committee was responsible for approving the First National Communication on Climate Change, a report that contains a national inventory of greenhouse gas emissions and identifies mitigation op-tions, vulnerabilities and adaptation measures. Taking into account the nature of Chile’s vulnerability to climate change, the importance of fulfilling its international com-mitments and the need to improve knowledge about the impact of climate change, in 2006 the Committee played a key role in preparing the National Climate Change Stra-tegy. This strategy’s main focal areas included adaptation, mitigation and capacity development. To operationalize the strategy, in 2008 the Executive Board of CONAMA approved the National Climate Change Action Plan. This landmark document is described in detail in the following section.
In 2003 Chile established its Designated National Autho-rity for the Kyoto Protocol’s Clean Development Mecha-nism. In the following years a series of capacity building initiatives were carried out in the public and private sec-tors, and alliances were forged to position Chile as a key actor in relation to the CDM.
As is apparent, there has been much coordination and significant new developments around climate change at the national level, which has provided the country with a suitable institutional framework for facing the challenges this phenomenon presents. To recognize the seriousness of this phenomenon and to strengthen inter-institutional efforts, particularly in the context of international clima-te change negotiations, in 2009 a presidential instruction led to the creation of the Interministerial Committee on Climate Change. The members of this Committee include representatives from Chile’s Environment, Foreign Affairs,
Agriculture, Transportation & Telecommunications, Ener-gy, Economy, Finance, Mining and Public Works ministries. The Committee also has a Technical Group that meets more frequently to address technical issues and advise the ministerial representatives.
In 2010, in order to broaden the exchange of information and expand the dialogue on climate change between the Government and other stakeholders, two working groups were formed: one public-private, the other public-civil so-ciety. These groups were formed to increase stakeholder opportunities for involvement and participation in stren-gthening responses to climate change in Chile.
4.2.1 National Climate Change Action Plan 2008-2012
In 2008, CONAMA introduced the National Climate Chan-ge Action Plan for 2008-2012 (CONAMA, 2008) as a short-term response to the priorities and objectives of the National Climate Change Strategy. This instrument was prepared through a consultative process that principally involved the public ministries and agencies represented on CONAMA’s Executive Board, academic institutions and research centers in Chile (CONAMA, 2008). The Plan was approved and made public by the President of the Repu-blic Michelle Bachelet in December 2008.
The Action Plan sets out a series of public policy objec-tives for different public entities related with climate change and its adverse effects. It also serves as a guide for industry, the academic sector and non-governmental organizations by setting out the topics that Chilean socie-ty as a whole should address in confronting the impacts of climate change. With its limited implementation period of four years, the Plan is intended as a short-term measure designed to generate key information by the end of the period that will be used to prepare longer-term national and sector-specific adaptation and mitigation plans.
The Plan emerged out of an analysis of the national situa-tion in regard to climate change, and strategic approaches to this situation. It has been widely disseminated within Chile and abroad and includes both the situation analysis and strategic considerations, as its base, as well as details of actions to be taken and the entities responsible for them. These are structured around three areas of action: adaptation to the impacts of climate change, mitigation of emissions, and the creation and development of ca-
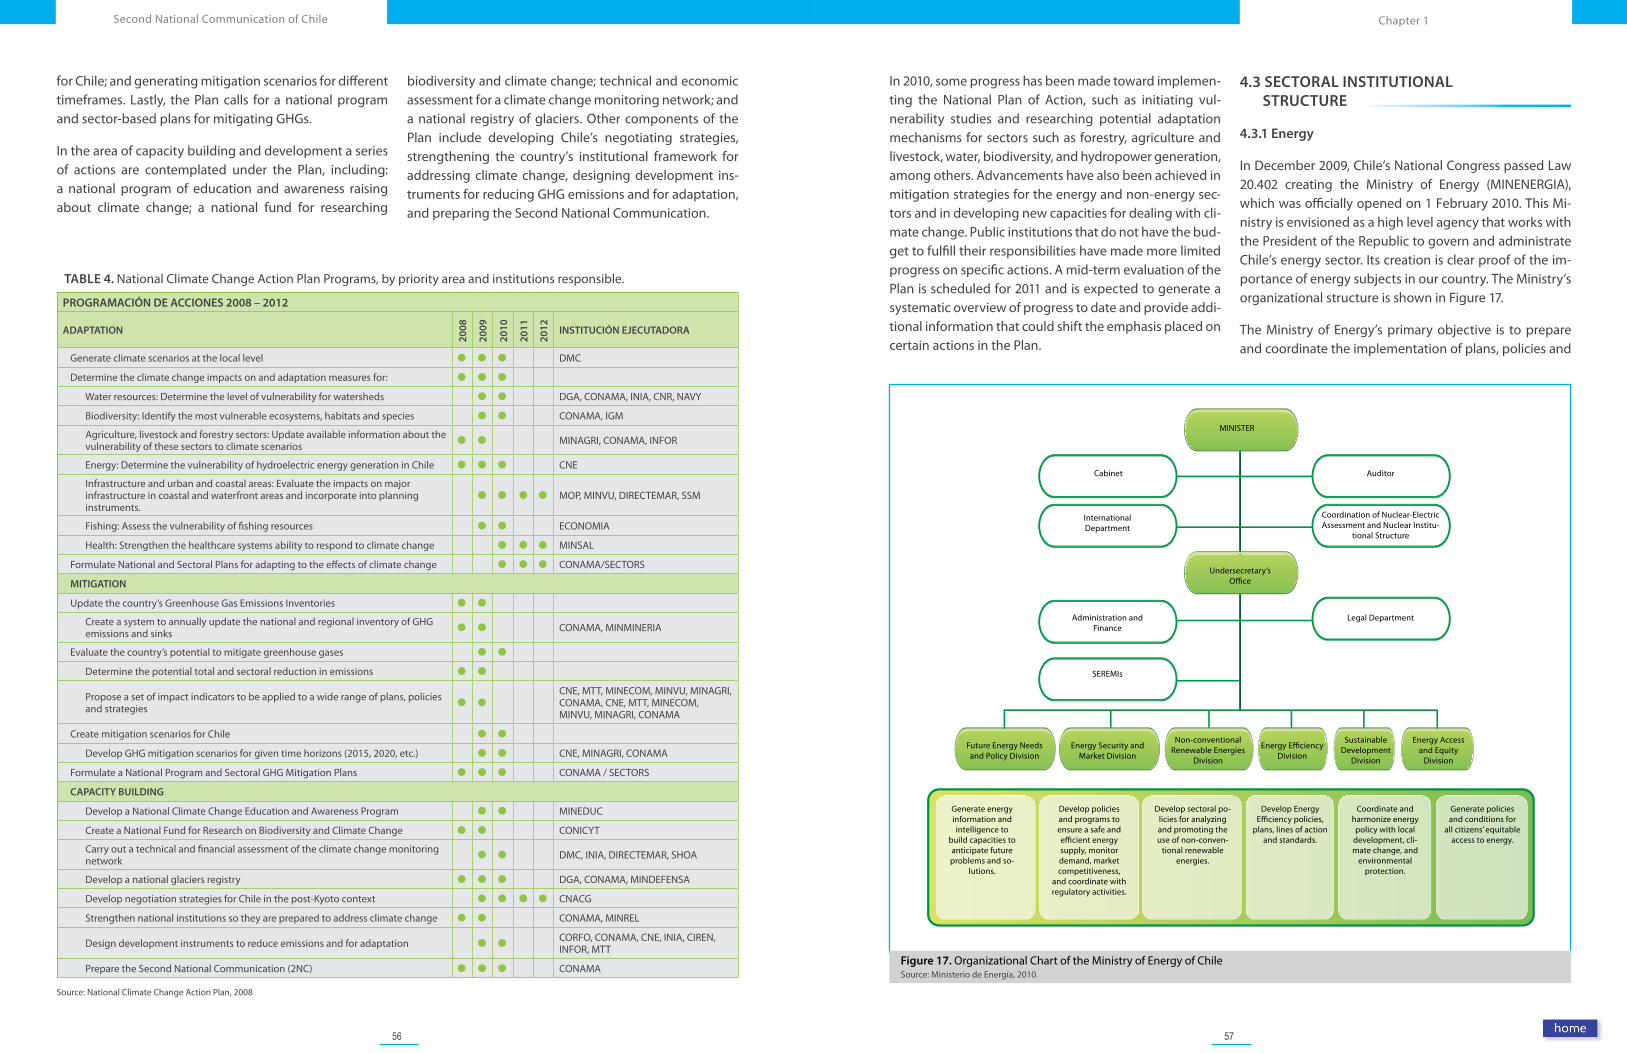
56 57
Chapter 1Second National Communication of Chile
In 2010, some progress has been made toward implemen-ting the National Plan of Action, such as initiating vul-nerability studies and researching potential adaptation mechanisms for sectors such as forestry, agriculture and livestock, water, biodiversity, and hydropower generation, among others. Advancements have also been achieved in mitigation strategies for the energy and non-energy sec-tors and in developing new capacities for dealing with cli-mate change. Public institutions that do not have the bud-get to fulfill their responsibilities have made more limited progress on specific actions. A mid-term evaluation of the Plan is scheduled for 2011 and is expected to generate a systematic overview of progress to date and provide addi-tional information that could shift the emphasis placed on certain actions in the Plan.
4.3 SECTORAL INSTITUTIONAL STRUCTURE
4.3.1 Energy
In December 2009, Chile’s National Congress passed Law 20.402 creating the Ministry of Energy (MINENERGIA), which was officially opened on 1 February 2010. This Mi-nistry is envisioned as a high level agency that works with the President of the Republic to govern and administrate Chile’s energy sector. Its creation is clear proof of the im-portance of energy subjects in our country. The Ministry’s organizational structure is shown in Figure 17.
The Ministry of Energy’s primary objective is to prepare and coordinate the implementation of plans, policies and
Fuente: Plan de Acción Nacional de Cambio Climático, 2008
for Chile; and generating mitigation scenarios for different timeframes. Lastly, the Plan calls for a national program and sector-based plans for mitigating GHGs.
In the area of capacity building and development a series of actions are contemplated under the Plan, including: a national program of education and awareness raising about climate change; a national fund for researching
biodiversity and climate change; technical and economic assessment for a climate change monitoring network; and a national registry of glaciers. Other components of the Plan include developing Chile’s negotiating strategies, strengthening the country’s institutional framework for addressing climate change, designing development ins-truments for reducing GHG emissions and for adaptation, and preparing the Second National Communication.
TABLE 4. National Climate Change Action Plan Programs, by priority area and institutions responsible.
PROGRAMACIÓN DE ACCIONES 2008 – 2012
ADAPTATION
2008
2009
2010
2011
2012 INSTITUCIÓN EJECUTADORA
Generate climate scenarios at the local level DMC
Determine the climate change impacts on and adaptation measures for:
Water resources: Determine the level of vulnerability for watersheds DGA, CONAMA, INIA, CNR, NAVY
Biodiversity: Identify the most vulnerable ecosystems, habitats and species CONAMA, IGM
Agriculture, livestock and forestry sectors: Update available information about the vulnerability of these sectors to climate scenarios MINAGRI, CONAMA, INFOR
Energy: Determine the vulnerability of hydroelectric energy generation in Chile CNE
Infrastructure and urban and coastal areas: Evaluate the impacts on major infrastructure in coastal and waterfront areas and incorporate into planning instruments.
MOP, MINVU, DIRECTEMAR, SSM
Fishing: Assess the vulnerability of fishing resources ECONOMIA
Health: Strengthen the healthcare systems ability to respond to climate change MINSAL
Formulate National and Sectoral Plans for adapting to the effects of climate change CONAMA/SECTORS
MITIGATION
Update the country’s Greenhouse Gas Emissions Inventories
Create a system to annually update the national and regional inventory of GHG emissions and sinks CONAMA, MINMINERIA
Evaluate the country’s potential to mitigate greenhouse gases
Determine the potential total and sectoral reduction in emissions
Propose a set of impact indicators to be applied to a wide range of plans, policies and strategies
CNE, MTT, MINECOM, MINVU, MINAGRI, CONAMA, CNE, MTT, MINECOM, MINVU, MINAGRI, CONAMA
Create mitigation scenarios for Chile
Develop GHG mitigation scenarios for given time horizons (2015, 2020, etc.) CNE, MINAGRI, CONAMA
Formulate a National Program and Sectoral GHG Mitigation Plans CONAMA / SECTORS
CAPACITY BUILDING
Develop a National Climate Change Education and Awareness Program MINEDUC
Create a National Fund for Research on Biodiversity and Climate Change CONICYT
Carry out a technical and financial assessment of the climate change monitoring network DMC, INIA, DIRECTEMAR, SHOA
Develop a national glaciers registry DGA, CONAMA, MINDEFENSA
Develop negotiation strategies for Chile in the post-Kyoto context CNACG
Strengthen national institutions so they are prepared to address climate change CONAMA, MINREL
Design development instruments to reduce emissions and for adaptation CORFO, CONAMA, CNE, INIA, CIREN, INFOR, MTT
Prepare the Second National Communication (2NC) CONAMA
Source: National Climate Change Action Plan, 2008
Figure 17. Organizational Chart of the Ministry of Energy of ChileSource: Ministerio de Energía, 2010.
Cabinet
International Department
Administration and Finance
SEREMIs
Legal Department
Coordination of Nuclear-Electric Assessment and Nuclear Institu-
tional Structure
Auditor
MINISTER
Undersecretary’s Office
Future Energy Needs and Policy Division
Generate energy information and intelligence to
build capacities to anticipate future problems and so-
lutions.
Develop policies and programs to ensure a safe and efficient energy supply, monitor demand, market competitiveness,
and coordinate with regulatory activities.
Develop sectoral po-licies for analyzing and promoting the use of non-conven-
tional renewable energies.
Develop Energy Efficiency policies,
plans, lines of action and standards.
Coordinate and harmonize energy policy with local
development, cli-mate change, and
environmental protection.
Generate policies and conditions for
all citizens’ equitable access to energy.
Energy Security and Market Division
Non-conventional Renewable Energies
Division
Energy Efficiency Division
Sustainable Development
Division
Energy Access and Equity
Division
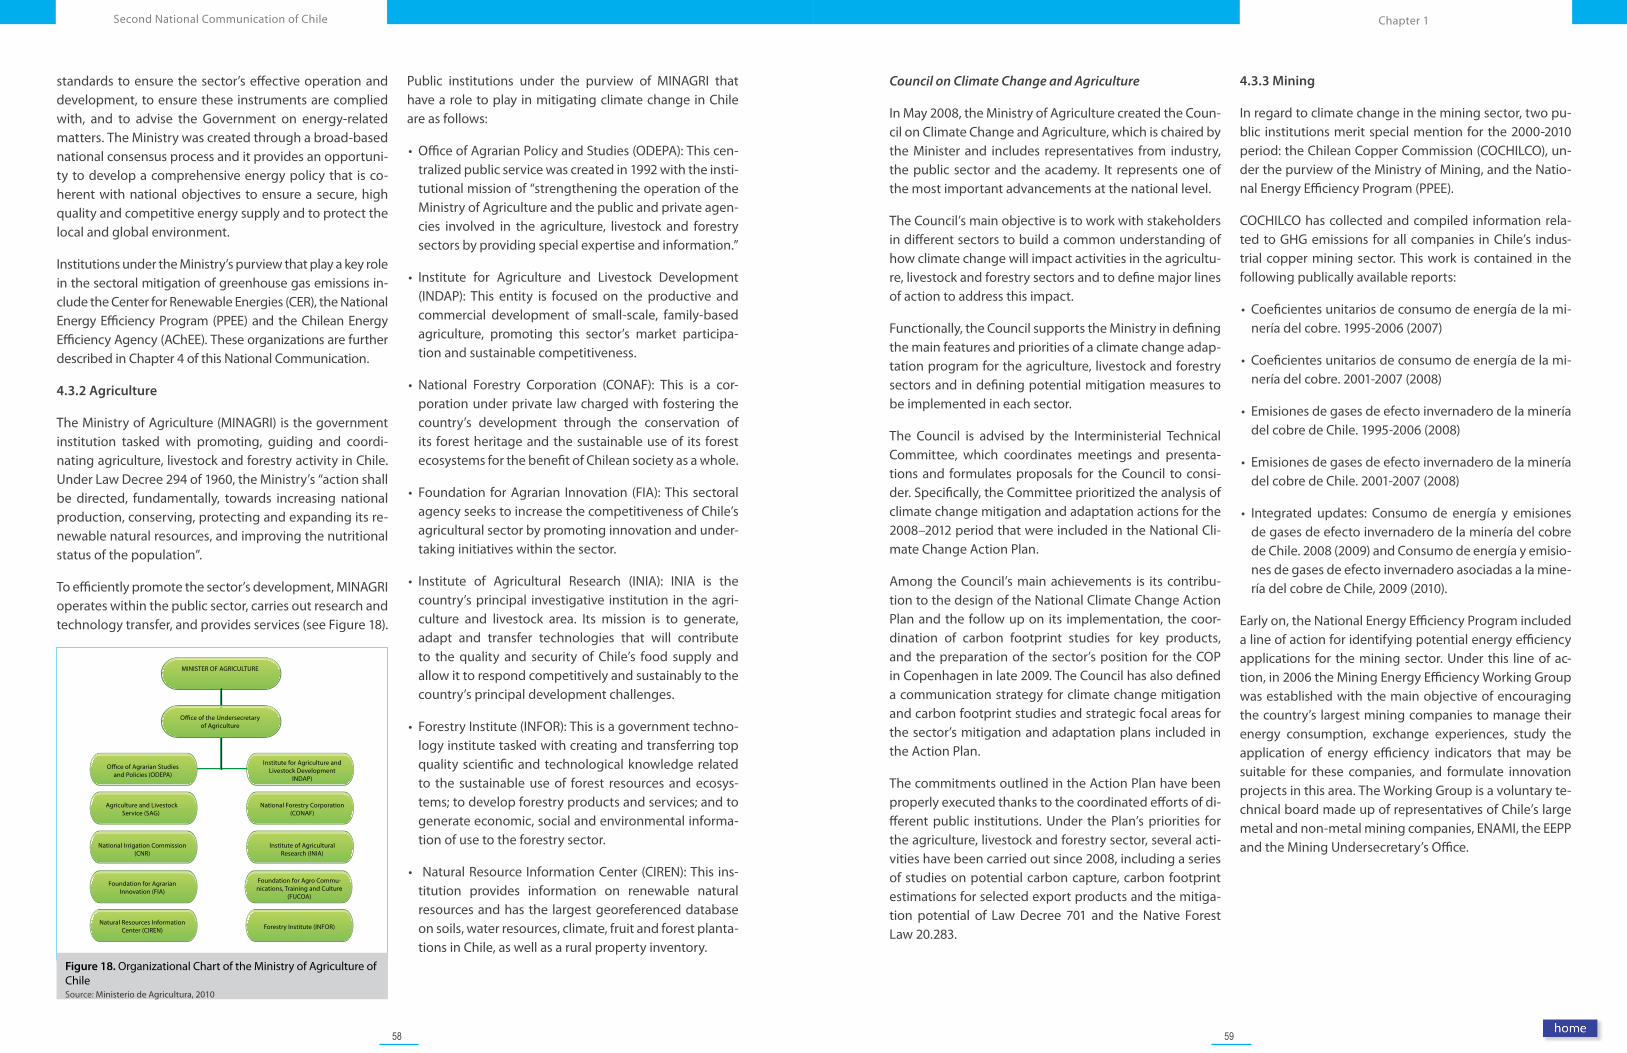
58 59
Chapter 1Second National Communication of Chile
Council on Climate Change and Agriculture
In May 2008, the Ministry of Agriculture created the Coun-cil on Climate Change and Agriculture, which is chaired by the Minister and includes representatives from industry, the public sector and the academy. It represents one of the most important advancements at the national level.
The Council’s main objective is to work with stakeholders in different sectors to build a common understanding of how climate change will impact activities in the agricultu-re, livestock and forestry sectors and to define major lines of action to address this impact.
Functionally, the Council supports the Ministry in defining the main features and priorities of a climate change adap-tation program for the agriculture, livestock and forestry sectors and in defining potential mitigation measures to be implemented in each sector.
The Council is advised by the Interministerial Technical Committee, which coordinates meetings and presenta-tions and formulates proposals for the Council to consi-der. Specifically, the Committee prioritized the analysis of climate change mitigation and adaptation actions for the 2008–2012 period that were included in the National Cli-mate Change Action Plan.
Among the Council’s main achievements is its contribu-tion to the design of the National Climate Change Action Plan and the follow up on its implementation, the coor-dination of carbon footprint studies for key products, and the preparation of the sector’s position for the COP in Copenhagen in late 2009. The Council has also defined a communication strategy for climate change mitigation and carbon footprint studies and strategic focal areas for the sector’s mitigation and adaptation plans included in the Action Plan.
The commitments outlined in the Action Plan have been properly executed thanks to the coordinated efforts of di-fferent public institutions. Under the Plan’s priorities for the agriculture, livestock and forestry sector, several acti-vities have been carried out since 2008, including a series of studies on potential carbon capture, carbon footprint estimations for selected export products and the mitiga-tion potential of Law Decree 701 and the Native Forest Law 20.283.
4.3.3 Mining
In regard to climate change in the mining sector, two pu-blic institutions merit special mention for the 2000-2010 period: the Chilean Copper Commission (COCHILCO), un-der the purview of the Ministry of Mining, and the Natio-nal Energy Efficiency Program (PPEE).
COCHILCO has collected and compiled information rela-ted to GHG emissions for all companies in Chile’s indus-trial copper mining sector. This work is contained in the following publically available reports:
• Coeficientes unitarios de consumo de energía de la mi-nería del cobre. 1995-2006 (2007)
• Coeficientes unitarios de consumo de energía de la mi-nería del cobre. 2001-2007 (2008)
• Emisiones de gases de efecto invernadero de la minería del cobre de Chile. 1995-2006 (2008)
• Emisiones de gases de efecto invernadero de la minería del cobre de Chile. 2001-2007 (2008)
• Integrated updates: Consumo de energía y emisiones de gases de efecto invernadero de la minería del cobre de Chile. 2008 (2009) and Consumo de energía y emisio-nes de gases de efecto invernadero asociadas a la mine-ría del cobre de Chile, 2009 (2010).
Early on, the National Energy Efficiency Program included a line of action for identifying potential energy efficiency applications for the mining sector. Under this line of ac-tion, in 2006 the Mining Energy Efficiency Working Group was established with the main objective of encouraging the country’s largest mining companies to manage their energy consumption, exchange experiences, study the application of energy efficiency indicators that may be suitable for these companies, and formulate innovation projects in this area. The Working Group is a voluntary te-chnical board made up of representatives of Chile’s large metal and non-metal mining companies, ENAMI, the EEPP and the Mining Undersecretary’s Office.
Figure 18. Organizational Chart of the Ministry of Agriculture of ChileSource: Ministerio de Agricultura, 2010
standards to ensure the sector’s effective operation and development, to ensure these instruments are complied with, and to advise the Government on energy-related matters. The Ministry was created through a broad-based national consensus process and it provides an opportuni-ty to develop a comprehensive energy policy that is co-herent with national objectives to ensure a secure, high quality and competitive energy supply and to protect the local and global environment.
Institutions under the Ministry’s purview that play a key role in the sectoral mitigation of greenhouse gas emissions in-clude the Center for Renewable Energies (CER), the National Energy Efficiency Program (PPEE) and the Chilean Energy Efficiency Agency (AChEE). These organizations are further described in Chapter 4 of this National Communication.
4.3.2 Agriculture
The Ministry of Agriculture (MINAGRI) is the government institution tasked with promoting, guiding and coordi-nating agriculture, livestock and forestry activity in Chile. Under Law Decree 294 of 1960, the Ministry’s “action shall be directed, fundamentally, towards increasing national production, conserving, protecting and expanding its re-newable natural resources, and improving the nutritional status of the population”.
To efficiently promote the sector’s development, MINAGRI operates within the public sector, carries out research and technology transfer, and provides services (see Figure 18).
Public institutions under the purview of MINAGRI that have a role to play in mitigating climate change in Chile are as follows:
• Office of Agrarian Policy and Studies (ODEPA): This cen-tralized public service was created in 1992 with the insti-tutional mission of “strengthening the operation of the Ministry of Agriculture and the public and private agen-cies involved in the agriculture, livestock and forestry sectors by providing special expertise and information.”
• Institute for Agriculture and Livestock Development (INDAP): This entity is focused on the productive and commercial development of small-scale, family-based agriculture, promoting this sector’s market participa-tion and sustainable competitiveness.
• National Forestry Corporation (CONAF): This is a cor-poration under private law charged with fostering the country’s development through the conservation of its forest heritage and the sustainable use of its forest ecosystems for the benefit of Chilean society as a whole.
• Foundation for Agrarian Innovation (FIA): This sectoral agency seeks to increase the competitiveness of Chile’s agricultural sector by promoting innovation and under-taking initiatives within the sector.
• Institute of Agricultural Research (INIA): INIA is the country’s principal investigative institution in the agri-culture and livestock area. Its mission is to generate, adapt and transfer technologies that will contribute to the quality and security of Chile’s food supply and allow it to respond competitively and sustainably to the country’s principal development challenges.
• Forestry Institute (INFOR): This is a government techno-logy institute tasked with creating and transferring top quality scientific and technological knowledge related to the sustainable use of forest resources and ecosys-tems; to develop forestry products and services; and to generate economic, social and environmental informa-tion of use to the forestry sector.
• Natural Resource Information Center (CIREN): This ins-titution provides information on renewable natural resources and has the largest georeferenced database on soils, water resources, climate, fruit and forest planta-tions in Chile, as well as a rural property inventory.
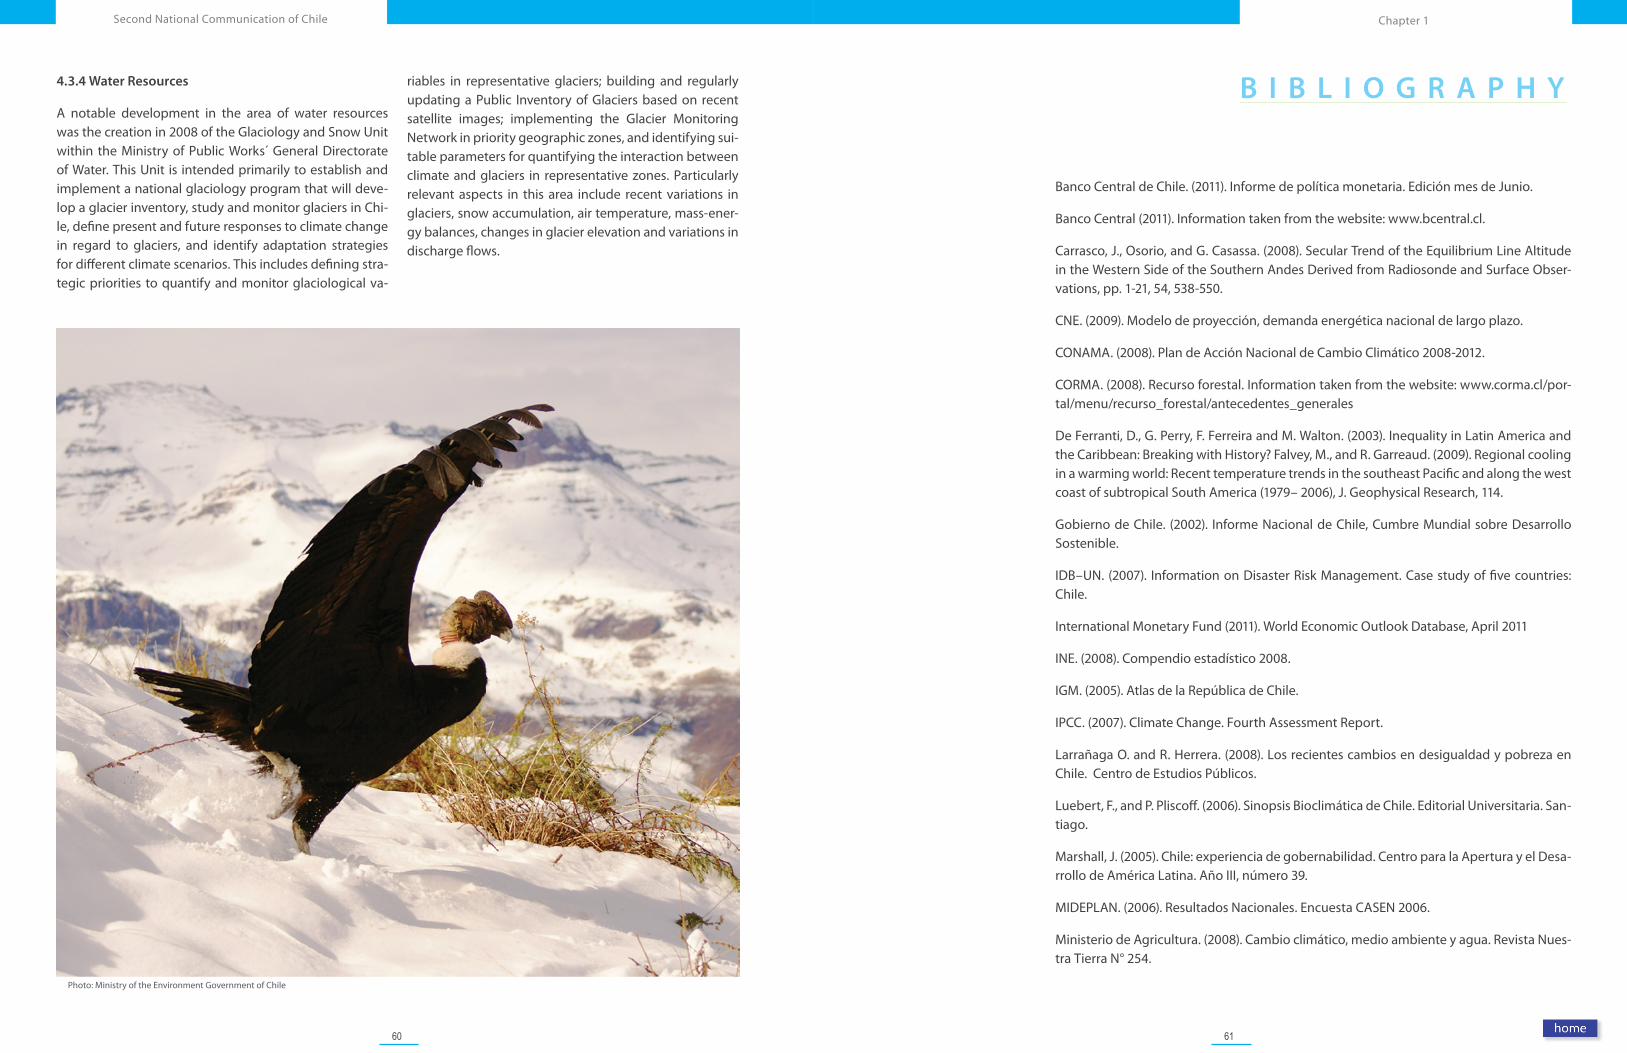
60 61
Chapter 1Second National Communication of Chile
B I B L I O G R A P H Y
Banco Central de Chile. (2011). Informe de política monetaria. Edición mes de Junio.
Banco Central (2011). Information taken from the website: www.bcentral.cl.
Carrasco, J., Osorio, and G. Casassa. (2008). Secular Trend of the Equilibrium Line Altitude in the Western Side of the Southern Andes Derived from Radiosonde and Surface Obser-vations, pp. 1-21, 54, 538-550.
CNE. (2009). Modelo de proyección, demanda energética nacional de largo plazo.
CONAMA. (2008). Plan de Acción Nacional de Cambio Climático 2008-2012.
CORMA. (2008). Recurso forestal. Information taken from the website: www.corma.cl/por-tal/menu/recurso_forestal/antecedentes_generales
De Ferranti, D., G. Perry, F. Ferreira and M. Walton. (2003). Inequality in Latin America and the Caribbean: Breaking with History? Falvey, M., and R. Garreaud. (2009). Regional cooling in a warming world: Recent temperature trends in the southeast Pacific and along the west coast of subtropical South America (1979– 2006), J. Geophysical Research, 114.
Gobierno de Chile. (2002). Informe Nacional de Chile, Cumbre Mundial sobre Desarrollo Sostenible.
IDB–UN. (2007). Information on Disaster Risk Management. Case study of five countries: Chile.
International Monetary Fund (2011). World Economic Outlook Database, April 2011
INE. (2008). Compendio estadístico 2008.
IGM. (2005). Atlas de la República de Chile.
IPCC. (2007). Climate Change. Fourth Assessment Report.
Larrañaga O. and R. Herrera. (2008). Los recientes cambios en desigualdad y pobreza en Chile. Centro de Estudios Públicos.
Luebert, F., and P. Pliscoff. (2006). Sinopsis Bioclimática de Chile. Editorial Universitaria. San-tiago.
Marshall, J. (2005). Chile: experiencia de gobernabilidad. Centro para la Apertura y el Desa-rrollo de América Latina. Año III, número 39.
MIDEPLAN. (2006). Resultados Nacionales. Encuesta CASEN 2006.
Ministerio de Agricultura. (2008). Cambio climático, medio ambiente y agua. Revista Nues-tra Tierra N° 254.
Photo: Ministry of the Environment Government of Chile
4.3.4 Water Resources
A notable development in the area of water resources was the creation in 2008 of the Glaciology and Snow Unit within the Ministry of Public Works´ General Directorate of Water. This Unit is intended primarily to establish and implement a national glaciology program that will deve-lop a glacier inventory, study and monitor glaciers in Chi-le, define present and future responses to climate change in regard to glaciers, and identify adaptation strategies for different climate scenarios. This includes defining stra-tegic priorities to quantify and monitor glaciological va-
riables in representative glaciers; building and regularly updating a Public Inventory of Glaciers based on recent satellite images; implementing the Glacier Monitoring Network in priority geographic zones, and identifying sui-table parameters for quantifying the interaction between climate and glaciers in representative zones. Particularly relevant aspects in this area include recent variations in glaciers, snow accumulation, air temperature, mass-ener-gy balances, changes in glacier elevation and variations in discharge flows.
62
Second National Communication of Chile
Ministerio de Economía. (2009). 6ta Encuesta de Innovación, 3era Encuesta de I+D y 1er Censo de Gasto Público en I+D.
Ministerio de Educación. (2010). Indicadores de la Educación en Chile 2007 - 2009. Departa-mento de Estudio y Desarrollo de la División de Planificación y Presupuesto.
Ministerio de Educación. (2010) Estadísticas de la Educación 2008. Departamento de Estu-dio y Desarrollo de la División de Planificación y Presupuesto.
Ministerio de Minería. (2009). Información extraída del portal virtual : www.minmineria.cl/574/channel.html
Ministerio de Salud.(2007). Indicadores de salud. Chile.
OECD-ECLAC. (2005). Environmental Performance Review. Chile.
ODEPA. (2005) Agricultura chilena 2014: Una perspectiva de mediano plazo.
ODEPA. (2008). Examen OCDE de políticas agrícolas. Informe de resultados.
ODEPA. (2009). Panorama de la Agricultura Chilena . Segunda edición.
UNDP. (2009). Desarrollo Humano en Chile: La manera de hacer las cosas.
UNDP. (2009). Human Development Report 2009. Overcoming barriers: human mobility and development.
Universidad de Chile, Depto. Ingeniería Industrial. (2009). Diseño de un modelo de proyec-ción de demanda energética global nacional de largo plazo.
World Bank. (2011). Information taken from the website: datos.bancomundial.org.
PHOTO: MINISTRY OF THE ENVIRONMENT
CHAPTER 2National Inventory of Greenhouse gas emissions and removals
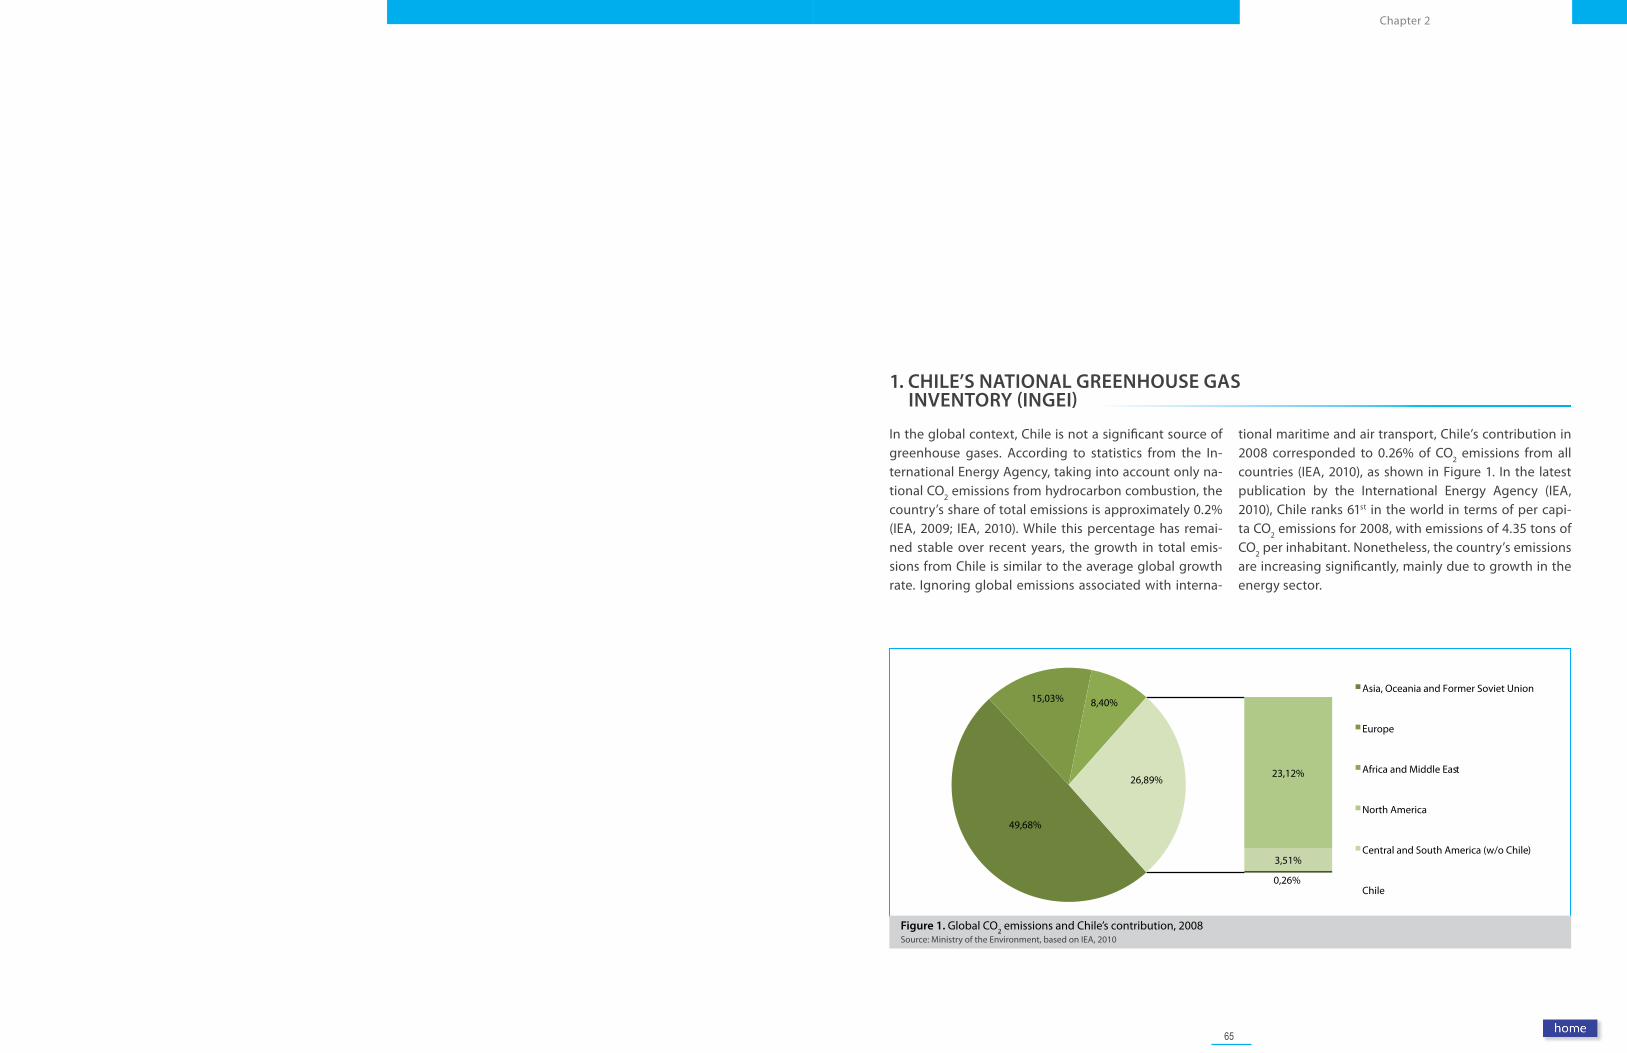
65
Chapter 2
49,68%
15,03% 8,40%
23,12%
3,51%
0,26%
26,89%
Asia, Oceania and Former Soviet Union
Europe
Africa and Middle East
North America
Central and South America (w/o Chile)
Chile
Figure 1. Global CO2 emissions and Chile’s contribution, 2008Source: Ministry of the Environment, based on IEA, 2010
1. CHILE’S NATIONAL GREENHOUSE GAS INVENTORY (INGEI)
In the global context, Chile is not a significant source of greenhouse gases. According to statistics from the In-ternational Energy Agency, taking into account only na-tional CO2 emissions from hydrocarbon combustion, the country’s share of total emissions is approximately 0.2% (IEA, 2009; IEA, 2010). While this percentage has remai-ned stable over recent years, the growth in total emis-sions from Chile is similar to the average global growth rate. Ignoring global emissions associated with interna-
tional maritime and air transport, Chile’s contribution in 2008 corresponded to 0.26% of CO2 emissions from all countries (IEA, 2010), as shown in Figure 1. In the latest publication by the International Energy Agency (IEA, 2010), Chile ranks 61st in the world in terms of per capi-ta CO2 emissions for 2008, with emissions of 4.35 tons of CO2 per inhabitant. Nonetheless, the country’s emissions are increasing significantly, mainly due to growth in the energy sector.
66 67
Chapter 2Second National Communication of Chile
1 All tables in this chapter were prepared by the authors of this chapter, except where otherwise indicated.
• IPCC Good Practice Guidance for LULUCF, published in 2003
• 2006 IPCC Guidelines
As agreed by the Parties of the Convention (Decision 17/CP.8 of January 2003) countries not listed in Annex I, such as Chile, must draw up annual inventories using the 1996 methodology plus the 2000 and 2003 GPG, where possi-ble. Within this framework, greenhouse gas sources and sinks must be reported for each sector, category, and sub-category. The six sectors considered are: Energy; Industrial Processes; Solvent and Other Product Use; Agriculture; Land Use, Land Use Change and Forestry (LULUCF); and Waste.
The gases to be included are, first, greenhouse gases: car-bon dioxide (CO2), methane (CH4), nitrous oxide (N2O), hy-drofluorcarbons (HFCs), perfluorocarbons (PFCs), and sul-fur hexafluoride (SF6); and secondly, indirect greenhouse gases: carbon monoxide (CO), total nitrogen oxides (NOX), non-CH4 volatile organic compounds (NMVOCs), and sul-fur oxides (SOX).
GHG emissions are calculated using activity data for each sector for which emissions and emission factors are asses-sed. These factors are needed to quantify emissions and removals, and several default values are listed in the IPCC documents mentioned above, although specific values may also be used. Depending on the sector being analy-zed, there may be several local and/or international sou-rces of publically available activity data. For the Energy sector, the National Energy Balance prepared annually by the Ministry of Energy is the most significant source of in-formation used for building Chile’s inventory.
Lastly, the global warming potential (GWP) of each non-CO2 gas is used so values may be added together. This enables emissions (and removals) of all gases to be expres-sed in terms of CO2 equivalents (CO2eq = Gas x GWP).
2.1.2 Key categories in the Inventory
The IPCC sets out three methods for estimations of GHGs (tiers 1, 2, and 3), the use of which depends on the specific
category’s importance to total national emissions and the availability of country-specific activity data and/or emis-sion factors.
Tier 1 is the default method and the simplest methodo-logy. It is applied when country-specific emission factors or activity data are not available. However, this method carries the risk of failing to adequately reflect national cir-cumstances. Tier 2 uses the same methodological proce-dure as Tier 1, but employs activity data and/or emission factors that are specific to the country or to a region of the country. This method will always achieve more accurate estimations of greenhouse gas emissions/removals and should be applied in key categories. Tier 3 corresponds to country-specific methodologies (models, censuses, and other), the application of which is recommended provi-ded they have been duly validated and, in the case of mo-dels, published in peer-reviewed journals.
In order to determine which method should be used for each category, key categories must first be identified. Key categories are those whose collective contribution is dee-med to have a significant influence on the total inventory, expressed as 95% in the IPCC 2003 Good Practice Guidan-ce. Once these are identified, the most precise method possible for each category can be chosen based on the level of information that is available.
2.2 CHARACTERISTICS OF THE CHILEAN INVENTORY
2.2.1 Preparation of the Inventory and institutional arrangements
The Chilean Ministry of the Environment (MMA) is the suc-cessor institution of the National Commission for the En-vironment (CONAMA) and the technical body responsible for the preparation of this Communication. The Ministry has structured its work on the Inventory under its Office of Climate Change, which is tasked with preparing emissions reports and the Inventory as a whole. Both the first and se-cond National Communications relied heavily on the work of studies conducted by experts external to CONAMA, some of whom are permanent employees in the public sector, and others in the private sector (see Table 1)1.
National emissions inventories are designed to provide detailed information on countries’ contributions to global warming. They identify which sectors generate the largest share of emissions and even show specific contributions by province or region if data is available. An inventory should also help guide country’s efforts to formulate more effective mitigation strategies.
Chile’s National GHG Inventory was built in accordance with the recommendations of the United Nations Fra-mework Convention on Climate Change (UNFCCC) for the preparation of national communications. Methods propo-sed by the Intergovernmental Panel on Climate Change (IPCC) for signatories of the Convention were also used, as were the recommendations proposed in Decision 17/CP.8 of the UNFCCC relating to countries presenting their second national communications. Specifically, the revi-sed IPCC 1996 guidelines were used, along with the Good Practice Guidances for 2000 and 2003; the reporting year 2000 was defined for the inventory, and the Convention’s annual inventory formats were completed with Chile´s data. Chile also has voluntarily included the results of its 2006 emissions inventory, since the time elapsed since the
year 2000 may affect the representativeness of GHG emis-sion and removal figures for the country, whereas 2006 is the most recent year in which all sectors were inventoried. The chapter also presents the results of GHG emission and removal estimations from 1984 to 2006 in time-series for-mat for all sectors and subsectors of the National Inven-tory. Furthermore, emissions associated with the Memo Items set forth in the Convention are also reported along-side the National Inventory. Finally, this chapter contains a preliminary overview of the uncertainty associated with the results presented and identifies gaps that should be addressed to improve the accuracy of Chile’s inventory.
In this regard, it is increasingly important that the country update its inventory more frequently to obtain informa-tion on short-term changes and medium term trends for each sector and category.
The inventory presented in this Chapter was supported by UNDP-UNEP s “National Communications Support Pro-gramme” (NCSP) and Fundacion Bariloche. Officials from these institutions provided technical comments of the contents of this inventory. This support is very appreciated.
2. METHODOLOGICAL ASPECTS
2.1 GENERAL CHARACTERISTICS OF INVENTORIES
In the context of the UNFCCC, an inventory is an exhaus-tive numerical listing, by source, of annual GHG emissions and removals that result directly from human activity in the reporting country.
In creating their inventories, countries should observe the following basic principles:
• Completeness: the inventory must be complete in terms of gases, categories, and territorial coverage.
• Accuracy: it must be constructed with as much detail as possible to ensure results are accurate and prevent, where possible, over- or under-estimations of emissions and/or removals.
• Transparency: it must be based on publically available activity data and considering explicit assumptions.
• Consistency: each category must employ the same methodological approach, including the same emission factors and activity data over the years indicated unless an objective reason exists to proceed otherwise.
• Comparability: internationally accepted methodologies should be followed.
2.1.1 Methodology used to report inventories to the UNFCCC
GHG emissions and removals can be quantified using the calculation methods provided by the IPCC for the prepara-tion of national inventories. The following methodological documents have been prepared by the IPCC and are now available for use:
• Revised 1996 IPCC Guidelines
• IPCC Good Practice Guidance and Uncertainty Manage-ment, published in 2000
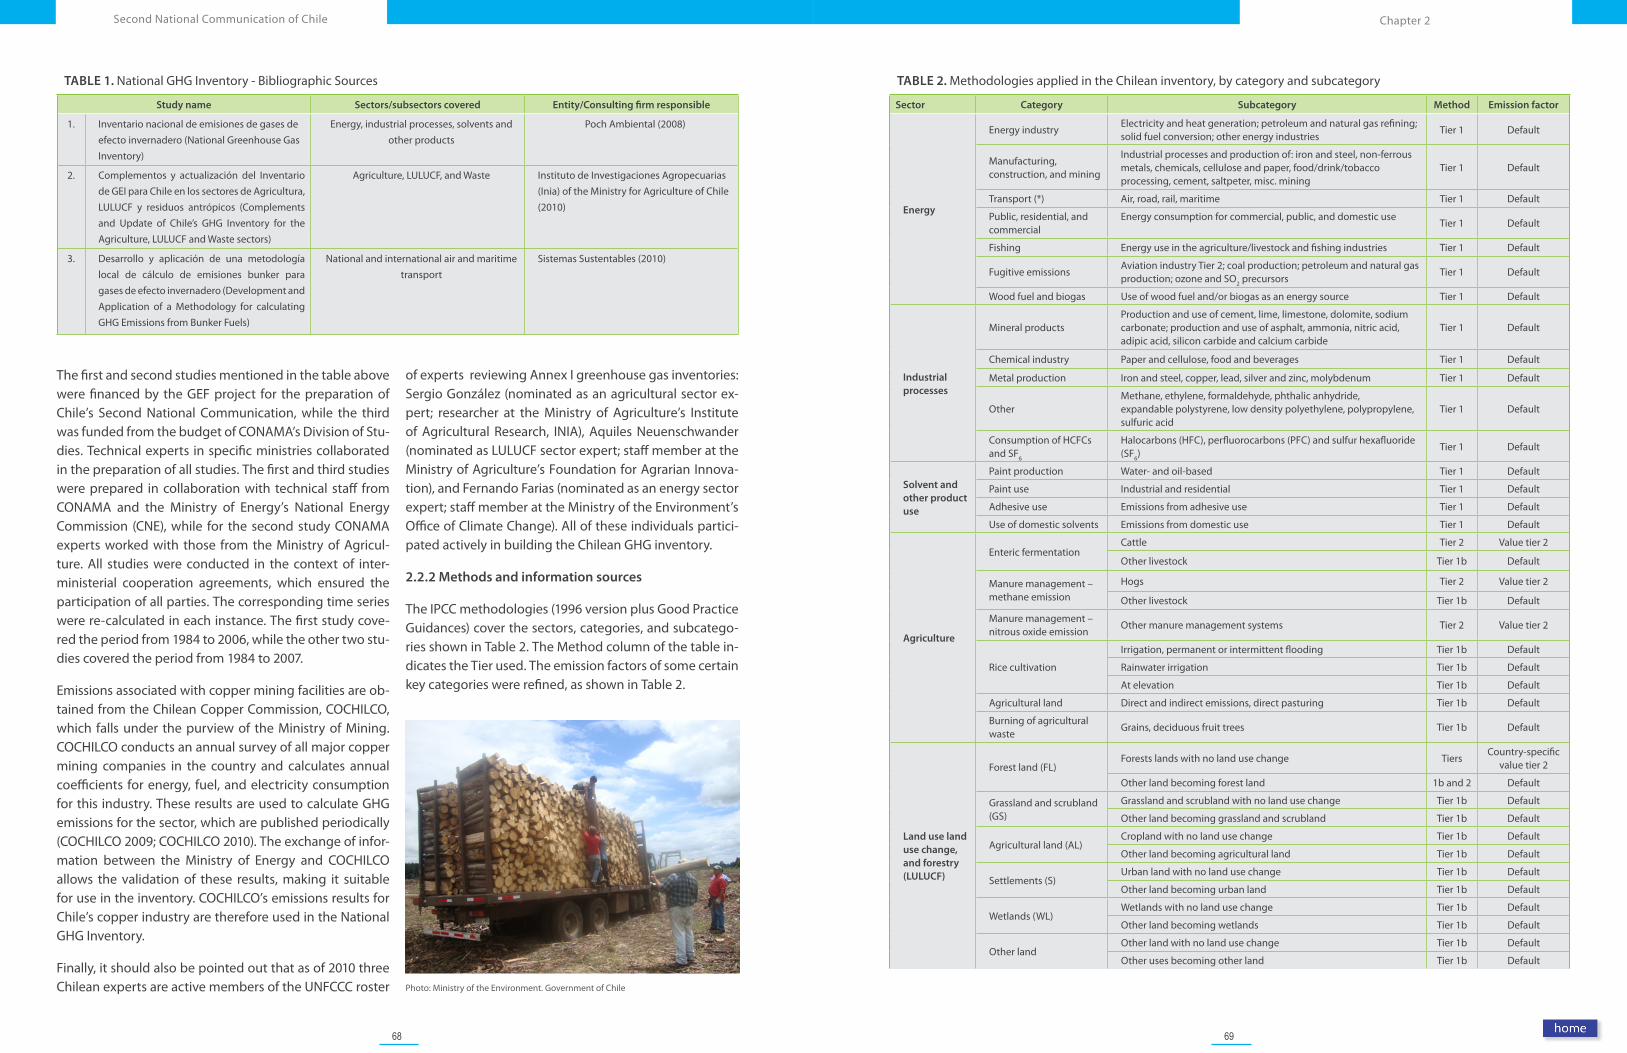
68 69
Chapter 2Second National Communication of Chile
TABLE 2. Methodologies applied in the Chilean inventory, by category and subcategory
Sector Category Subcategory Method Emission factor
Energy
Energy industryElectricity and heat generation; petroleum and natural gas refining; solid fuel conversion; other energy industries
Tier 1 Default
Manufacturing, construction, and mining
Industrial processes and production of: iron and steel, non-ferrous metals, chemicals, cellulose and paper, food/drink/tobacco processing, cement, saltpeter, misc. mining
Tier 1 Default
Transport (*) Air, road, rail, maritime Tier 1 Default
Public, residential, and commercial
Energy consumption for commercial, public, and domestic useTier 1 Default
Fishing Energy use in the agriculture/livestock and fishing industries Tier 1 Default
Fugitive emissionsAviation industry Tier 2; coal production; petroleum and natural gas production; ozone and SO2 precursors
Tier 1 Default
Wood fuel and biogas Use of wood fuel and/or biogas as an energy source Tier 1 Default
Industrial processes
Mineral productsProduction and use of cement, lime, limestone, dolomite, sodium carbonate; production and use of asphalt, ammonia, nitric acid, adipic acid, silicon carbide and calcium carbide
Tier 1 Default
Chemical industry Paper and cellulose, food and beverages Tier 1 Default
Metal production Iron and steel, copper, lead, silver and zinc, molybdenum Tier 1 Default
OtherMethane, ethylene, formaldehyde, phthalic anhydride, expandable polystyrene, low density polyethylene, polypropylene, sulfuric acid
Tier 1 Default
Consumption of HCFCs and SF6
Halocarbons (HFC), perfluorocarbons (PFC) and sulfur hexafluoride (SF6)
Tier 1 Default
Solvent and other product use
Paint production Water- and oil-based Tier 1 Default
Paint use Industrial and residential Tier 1 Default
Adhesive use Emissions from adhesive use Tier 1 Default
Use of domestic solvents Emissions from domestic use Tier 1 Default
Agriculture
Enteric fermentationCattle Tier 2 Value tier 2
Other livestock Tier 1b Default
Manure management – methane emission
Hogs Tier 2 Value tier 2
Other livestock Tier 1b Default
Manure management – nitrous oxide emission
Other manure management systems Tier 2 Value tier 2
Rice cultivation
Irrigation, permanent or intermittent flooding Tier 1b Default
Rainwater irrigation Tier 1b Default
At elevation Tier 1b Default
Agricultural land Direct and indirect emissions, direct pasturing Tier 1b Default
Burning of agricultural waste
Grains, deciduous fruit trees Tier 1b Default
Land use land use change, and forestry (LULUCF)
Forest land (FL)Forests lands with no land use change Tiers
Country-specific value tier 2
Other land becoming forest land 1b and 2 Default
Grassland and scrubland (GS)
Grassland and scrubland with no land use change Tier 1b Default
Other land becoming grassland and scrubland Tier 1b Default
Agricultural land (AL)Cropland with no land use change Tier 1b Default
Other land becoming agricultural land Tier 1b Default
Settlements (S)Urban land with no land use change Tier 1b Default
Other land becoming urban land Tier 1b Default
Wetlands (WL)Wetlands with no land use change Tier 1b Default
Other land becoming wetlands Tier 1b Default
Other land Other land with no land use change Tier 1b Default
Other uses becoming other land Tier 1b Default
Photo: Ministry of the Environment. Government of Chile
TABLE 1. National GHG Inventory - Bibliographic Sources
Study name Sectors/subsectors covered Entity/Consulting firm responsible
1. Inventario nacional de emisiones de gases de efecto invernadero (National Greenhouse Gas Inventory)
Energy, industrial processes, solvents and other products
Poch Ambiental (2008)
2. Complementos y actualización del Inventario de GEI para Chile en los sectores de Agricultura, LULUCF y residuos antrópicos (Complements and Update of Chile’s GHG Inventory for the Agriculture, LULUCF and Waste sectors)
Agriculture, LULUCF, and Waste Instituto de Investigaciones Agropecuarias (Inia) of the Ministry for Agriculture of Chile (2010)
3. Desarrollo y aplicación de una metodología local de cálculo de emisiones bunker para gases de efecto invernadero (Development and Application of a Methodology for calculating GHG Emissions from Bunker Fuels)
National and international air and maritime transport
Sistemas Sustentables (2010)
The first and second studies mentioned in the table above were financed by the GEF project for the preparation of Chile’s Second National Communication, while the third was funded from the budget of CONAMA’s Division of Stu-dies. Technical experts in specific ministries collaborated in the preparation of all studies. The first and third studies were prepared in collaboration with technical staff from CONAMA and the Ministry of Energy’s National Energy Commission (CNE), while for the second study CONAMA experts worked with those from the Ministry of Agricul-ture. All studies were conducted in the context of inter-ministerial cooperation agreements, which ensured the participation of all parties. The corresponding time series were re-calculated in each instance. The first study cove-red the period from 1984 to 2006, while the other two stu-dies covered the period from 1984 to 2007.
Emissions associated with copper mining facilities are ob-tained from the Chilean Copper Commission, COCHILCO, which falls under the purview of the Ministry of Mining. COCHILCO conducts an annual survey of all major copper mining companies in the country and calculates annual coefficients for energy, fuel, and electricity consumption for this industry. These results are used to calculate GHG emissions for the sector, which are published periodically (COCHILCO 2009; COCHILCO 2010). The exchange of infor-mation between the Ministry of Energy and COCHILCO allows the validation of these results, making it suitable for use in the inventory. COCHILCO’s emissions results for Chile’s copper industry are therefore used in the National GHG Inventory.
Finally, it should also be pointed out that as of 2010 three Chilean experts are active members of the UNFCCC roster
of experts reviewing Annex I greenhouse gas inventories: Sergio González (nominated as an agricultural sector ex-pert; researcher at the Ministry of Agriculture’s Institute of Agricultural Research, INIA), Aquiles Neuenschwander (nominated as LULUCF sector expert; staff member at the Ministry of Agriculture’s Foundation for Agrarian Innova-tion), and Fernando Farias (nominated as an energy sector expert; staff member at the Ministry of the Environment’s Office of Climate Change). All of these individuals partici-pated actively in building the Chilean GHG inventory.
2.2.2 Methods and information sources
The IPCC methodologies (1996 version plus Good Practice Guidances) cover the sectors, categories, and subcatego-ries shown in Table 2. The Method column of the table in-dicates the Tier used. The emission factors of some certain key categories were refined, as shown in Table 2.
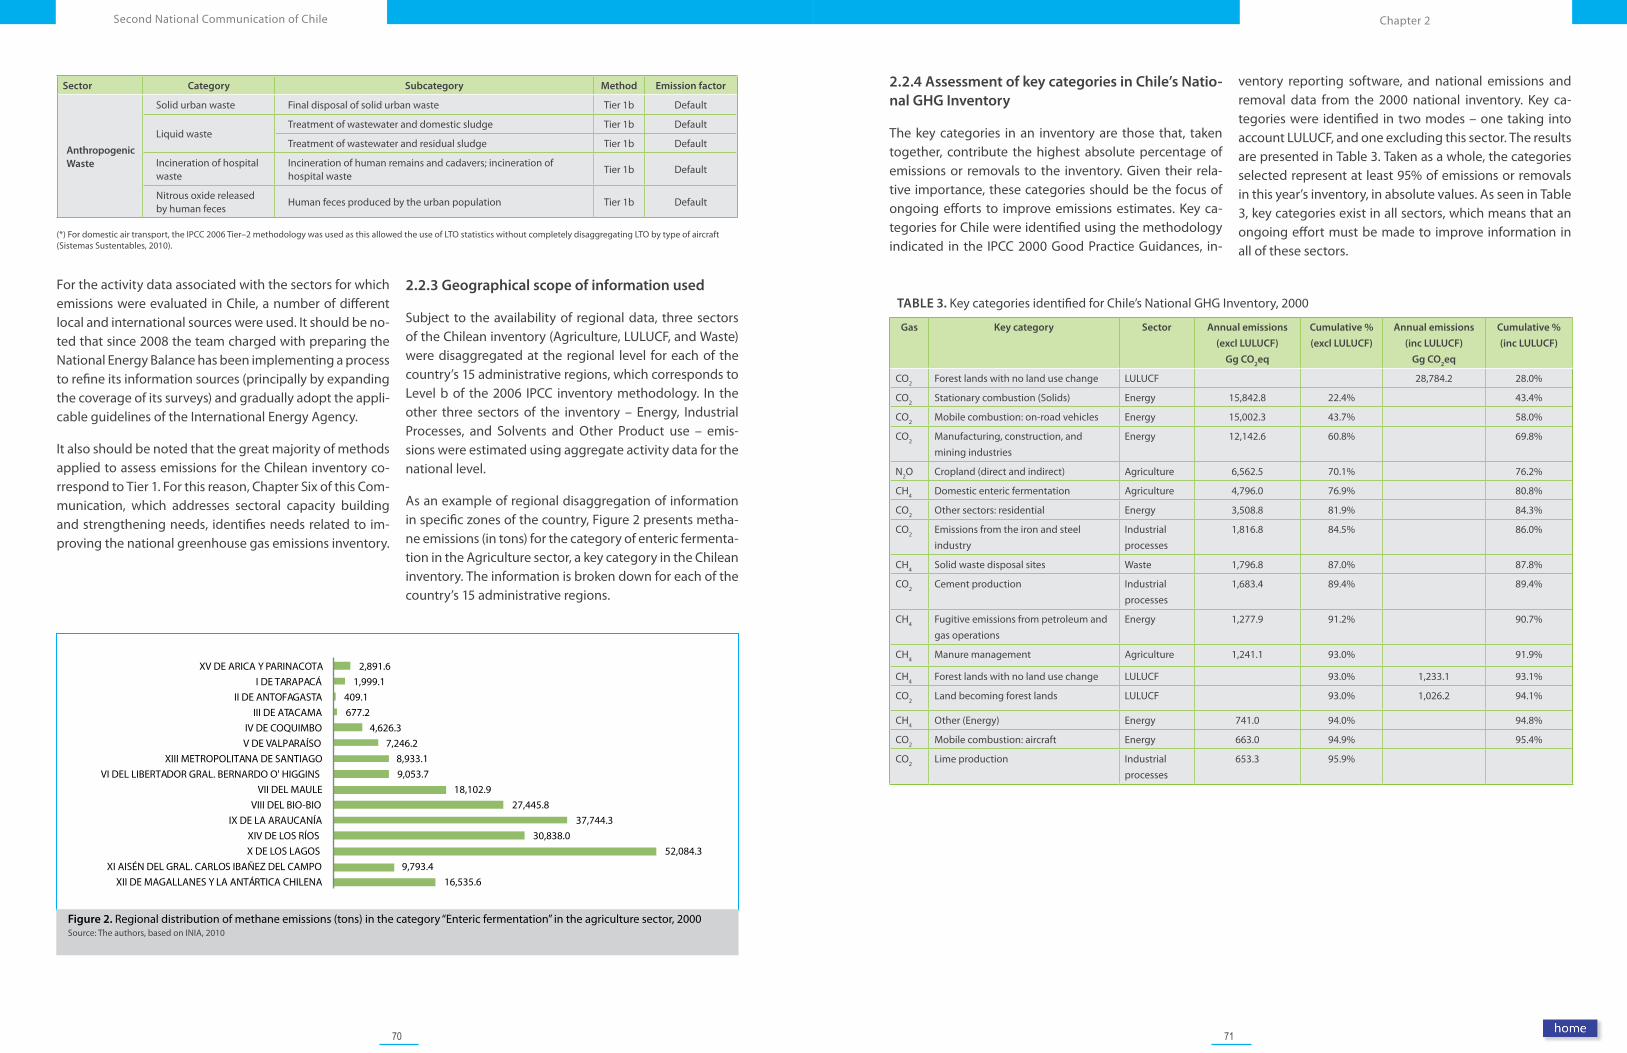
70 71
Chapter 2Second National Communication of Chile
2.2.4 Assessment of key categories in Chile’s Natio-nal GHG Inventory
The key categories in an inventory are those that, taken together, contribute the highest absolute percentage of emissions or removals to the inventory. Given their rela-tive importance, these categories should be the focus of ongoing efforts to improve emissions estimates. Key ca-tegories for Chile were identified using the methodology indicated in the IPCC 2000 Good Practice Guidances, in-
ventory reporting software, and national emissions and removal data from the 2000 national inventory. Key ca-tegories were identified in two modes – one taking into account LULUCF, and one excluding this sector. The results are presented in Table 3. Taken as a whole, the categories selected represent at least 95% of emissions or removals in this year’s inventory, in absolute values. As seen in Table 3, key categories exist in all sectors, which means that an ongoing effort must be made to improve information in all of these sectors.
TABLE 3. Key categories identified for Chile’s National GHG Inventory, 2000
Gas Key category Sector Annual emissions
(excl LULUCF)
Gg CO2eq
Cumulative %
(excl LULUCF)
Annual emissions
(inc LULUCF)
Gg CO2eq
Cumulative %
(inc LULUCF)
CO2 Forest lands with no land use change LULUCF 28,784.2 28.0%
CO2 Stationary combustion (Solids) Energy 15,842.8 22.4% 43.4%
CO2 Mobile combustion: on-road vehicles Energy 15,002.3 43.7% 58.0%
CO2 Manufacturing, construction, and mining industries
Energy 12,142.6 60.8% 69.8%
N2O Cropland (direct and indirect) Agriculture 6,562.5 70.1% 76.2%
CH4 Domestic enteric fermentation Agriculture 4,796.0 76.9% 80.8%
CO2 Other sectors: residential Energy 3,508.8 81.9% 84.3%
CO2 Emissions from the iron and steel industry
Industrial processes
1,816.8 84.5% 86.0%
CH4 Solid waste disposal sites Waste 1,796.8 87.0% 87.8%
CO2 Cement production Industrial processes
1,683.4 89.4% 89.4%
CH4 Fugitive emissions from petroleum and gas operations
Energy 1,277.9 91.2% 90.7%
CH4 Manure management Agriculture 1,241.1 93.0% 91.9%
CH4 Forest lands with no land use change LULUCF 93.0% 1,233.1 93.1%
CO2 Land becoming forest lands LULUCF 93.0% 1,026.2 94.1%
CH4 Other (Energy) Energy 741.0 94.0% 94.8%
CO2 Mobile combustion: aircraft Energy 663.0 94.9% 95.4%
CO2 Lime production Industrial processes
653.3 95.9%
Figure 2. Regional distribution of methane emissions (tons) in the category “Enteric fermentation” in the agriculture sector, 2000Source: The authors, based on INIA, 2010
For the activity data associated with the sectors for which emissions were evaluated in Chile, a number of different local and international sources were used. It should be no-ted that since 2008 the team charged with preparing the National Energy Balance has been implementing a process to refine its information sources (principally by expanding the coverage of its surveys) and gradually adopt the appli-cable guidelines of the International Energy Agency.
It also should be noted that the great majority of methods applied to assess emissions for the Chilean inventory co-rrespond to Tier 1. For this reason, Chapter Six of this Com-munication, which addresses sectoral capacity building and strengthening needs, identifies needs related to im-proving the national greenhouse gas emissions inventory.
2.2.3 Geographical scope of information used
Subject to the availability of regional data, three sectors of the Chilean inventory (Agriculture, LULUCF, and Waste) were disaggregated at the regional level for each of the country’s 15 administrative regions, which corresponds to Level b of the 2006 IPCC inventory methodology. In the other three sectors of the inventory – Energy, Industrial Processes, and Solvents and Other Product use – emis-sions were estimated using aggregate activity data for the national level.
As an example of regional disaggregation of information in specific zones of the country, Figure 2 presents metha-ne emissions (in tons) for the category of enteric fermenta-tion in the Agriculture sector, a key category in the Chilean inventory. The information is broken down for each of the country’s 15 administrative regions.
Sector Category Subcategory Method Emission factor
Anthropogenic Waste
Solid urban waste Final disposal of solid urban waste Tier 1b Default
Liquid wasteTreatment of wastewater and domestic sludge Tier 1b Default
Treatment of wastewater and residual sludge Tier 1b Default
Incineration of hospital waste
Incineration of human remains and cadavers; incineration of hospital waste
Tier 1b Default
Nitrous oxide released by human feces
Human feces produced by the urban population Tier 1b Default
(*) For domestic air transport, the IPCC 2006 Tier–2 methodology was used as this allowed the use of LTO statistics without completely disaggregating LTO by type of aircraft (Sistemas Sustentables, 2010).
16,535.6 9,793.4
52,084.3 30,838.0
37,744.3 27,445.8
18,102.9 9,053.7 8,933.1
7,246.2 4,626.3
677.2 409.1
1,999.1 2,891.6
XII DE MAGALLANES Y LA ANTÁRTICA CHILENA XI AISÉN DEL GRAL. CARLOS IBAÑEZ DEL CAMPO
X DE LOS LAGOS XIV DE LOS RÍOS
IX DE LA ARAUCANÍA VIII DEL BIO-BIO
VII DEL MAULE VI DEL LIBERTADOR GRAL. BERNARDO O' HIGGINS
XIII METROPOLITANA DE SANTIAGO V DE VALPARAÍSO IV DE COQUIMBO
III DE ATACAMA II DE ANTOFAGASTA
I DE TARAPACÁ XV DE ARICA Y PARINACOTA
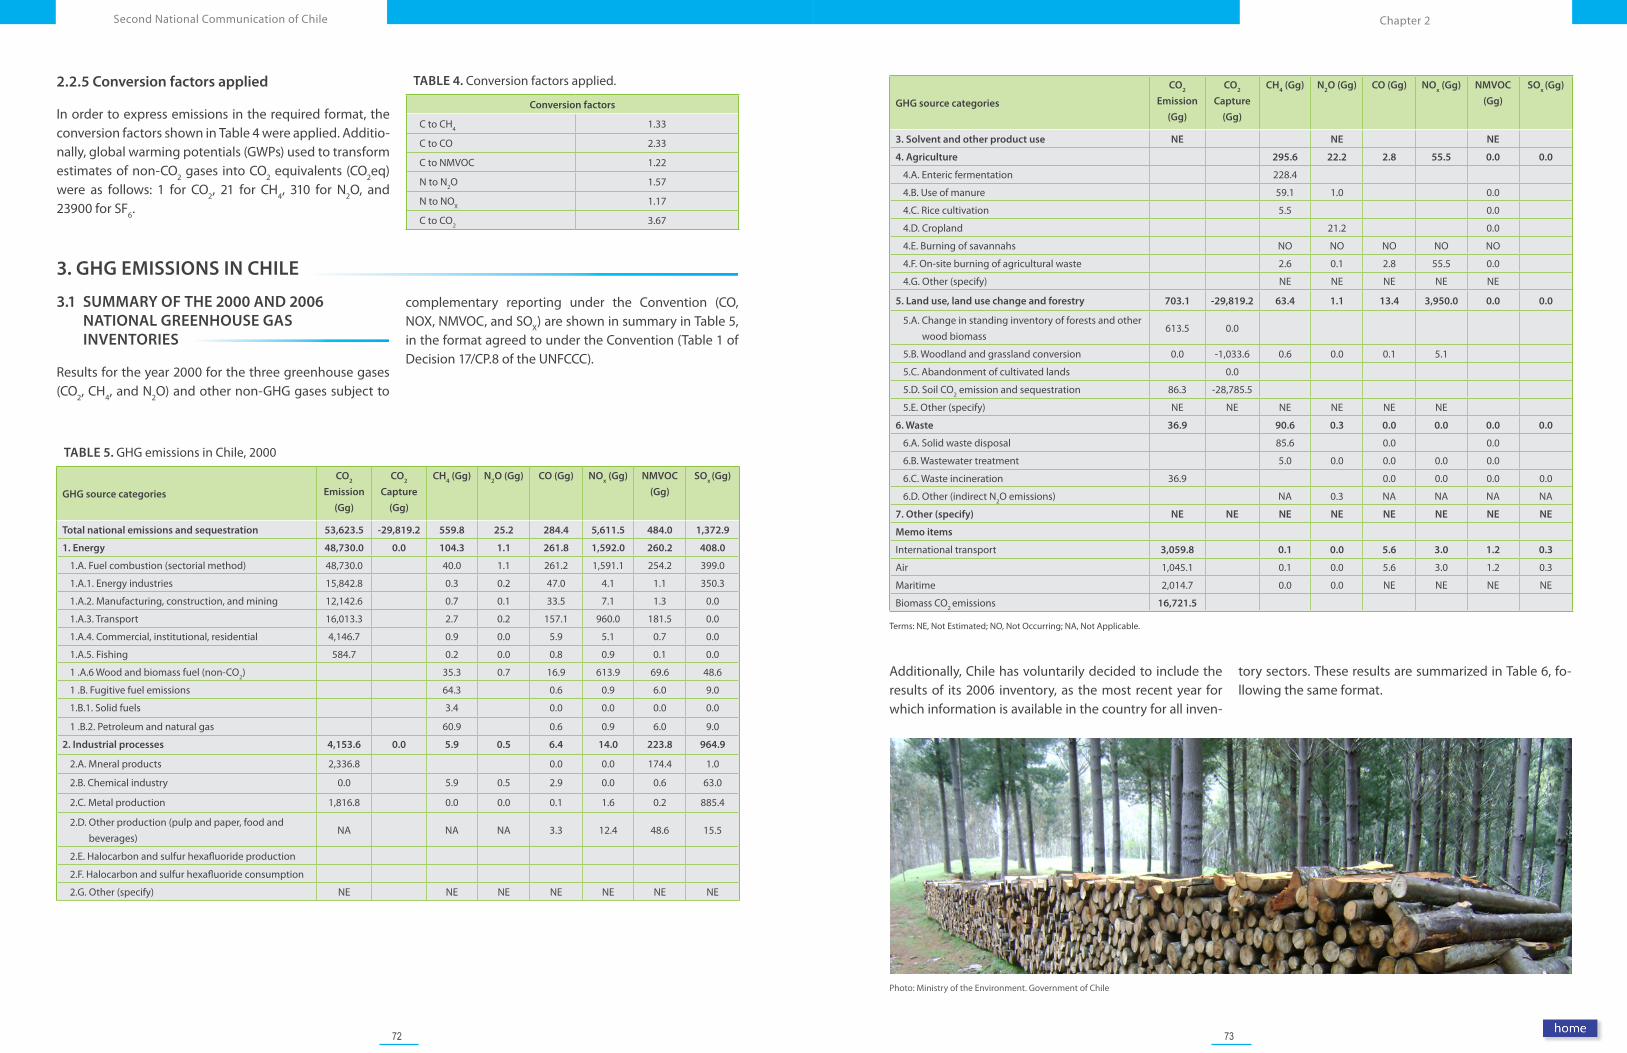
72 73
Chapter 2Second National Communication of Chile
Photo: Ministry of the Environment. Government of Chile
GHG source categories
CO2
Emission
(Gg)
CO2
Capture
(Gg)
CH4 (Gg) N
2O (Gg) CO (Gg) NO
x (Gg) NMVOC
(Gg)
SOx (Gg)
3. Solvent and other product use NE NE NE
4. Agriculture 295.6 22.2 2.8 55.5 0.0 0.0
4.A. Enteric fermentation 228.4
4.B. Use of manure 59.1 1.0 0.0
4.C. Rice cultivation 5.5 0.0
4.D. Cropland 21.2 0.0
4.E. Burning of savannahs NO NO NO NO NO
4.F. On-site burning of agricultural waste 2.6 0.1 2.8 55.5 0.0
4.G. Other (specify) NE NE NE NE NE
5. Land use, land use change and forestry 703.1 -29,819.2 63.4 1.1 13.4 3,950.0 0.0 0.0
5.A. Change in standing inventory of forests and other wood biomass
613.5 0.0
5.B. Woodland and grassland conversion 0.0 -1,033.6 0.6 0.0 0.1 5.1
5.C. Abandonment of cultivated lands 0.0
5.D. Soil CO2 emission and sequestration 86.3 -28,785.5
5.E. Other (specify) NE NE NE NE NE NE
6. Waste 36.9 90.6 0.3 0.0 0.0 0.0 0.0
6.A. Solid waste disposal 85.6 0.0 0.0
6.B. Wastewater treatment 5.0 0.0 0.0 0.0 0.0
6.C. Waste incineration 36.9 0.0 0.0 0.0 0.0
6.D. Other (indirect N2O emissions) NA 0.3 NA NA NA NA
7. Other (specify) NE NE NE NE NE NE NE NE
Memo items
International transport 3,059.8 0.1 0.0 5.6 3.0 1.2 0.3
Air 1,045.1 0.1 0.0 5.6 3.0 1.2 0.3
Maritime 2,014.7 0.0 0.0 NE NE NE NE
Biomass CO2 emissions 16,721.5
Terms: NE, Not Estimated; NO, Not Occurring; NA, Not Applicable.
Additionally, Chile has voluntarily decided to include the results of its 2006 inventory, as the most recent year for which information is available in the country for all inven-
tory sectors. These results are summarized in Table 6, fo-llowing the same format.
2.2.5 Conversion factors applied
In order to express emissions in the required format, the conversion factors shown in Table 4 were applied. Additio-nally, global warming potentials (GWPs) used to transform estimates of non-CO2 gases into CO2 equivalents (CO2eq) were as follows: 1 for CO2, 21 for CH4, 310 for N2O, and 23900 for SF6.
TABLE 4. Conversion factors applied.
Conversion factors
C to CH4 1.33
C to CO 2.33
C to NMVOC 1.22
N to N2O 1.57
N to NOX 1.17
C to CO2 3.67
TABLE 5. GHG emissions in Chile, 2000
GHG source categories
CO2
Emission
(Gg)
CO2
Capture
(Gg)
CH4 (Gg) N
2O (Gg) CO (Gg) NO
x (Gg) NMVOC
(Gg)
SOx (Gg)
Total national emissions and sequestration 53,623.5 -29,819.2 559.8 25.2 284.4 5,611.5 484.0 1,372.9
1. Energy 48,730.0 0.0 104.3 1.1 261.8 1,592.0 260.2 408.0
1.A. Fuel combustion (sectorial method) 48,730.0 40.0 1.1 261.2 1,591.1 254.2 399.0
1.A.1. Energy industries 15,842.8 0.3 0.2 47.0 4.1 1.1 350.3
1.A.2. Manufacturing, construction, and mining 12,142.6 0.7 0.1 33.5 7.1 1.3 0.0
1.A.3. Transport 16,013.3 2.7 0.2 157.1 960.0 181.5 0.0
1.A.4. Commercial, institutional, residential 4,146.7 0.9 0.0 5.9 5.1 0.7 0.0
1.A.5. Fishing 584.7 0.2 0.0 0.8 0.9 0.1 0.0
1 .A.6 Wood and biomass fuel (non-CO2) 35.3 0.7 16.9 613.9 69.6 48.6
1 .B. Fugitive fuel emissions 64.3 0.6 0.9 6.0 9.0
1.B.1. Solid fuels 3.4 0.0 0.0 0.0 0.0
1 .B.2. Petroleum and natural gas 60.9 0.6 0.9 6.0 9.0
2. Industrial processes 4,153.6 0.0 5.9 0.5 6.4 14.0 223.8 964.9
2.A. Mneral products 2,336.8 0.0 0.0 174.4 1.0
2.B. Chemical industry 0.0 5.9 0.5 2.9 0.0 0.6 63.0
2.C. Metal production 1,816.8 0.0 0.0 0.1 1.6 0.2 885.4
2.D. Other production (pulp and paper, food and beverages)
NA NA NA 3.3 12.4 48.6 15.5
2.E. Halocarbon and sulfur hexafluoride production
2.F. Halocarbon and sulfur hexafluoride consumption
2.G. Other (specify) NE NE NE NE NE NE NE
3. GHG EMISSIONS IN CHILE
3.1 SUMMARY OF THE 2000 AND 2006 NATIONAL GREENHOUSE GAS INVENTORIES
Results for the year 2000 for the three greenhouse gases (CO2, CH4, and N2O) and other non-GHG gases subject to
complementary reporting under the Convention (CO, NOX, NMVOC, and SOX) are shown in summary in Table 5, in the format agreed to under the Convention (Table 1 of Decision 17/CP.8 of the UNFCCC).
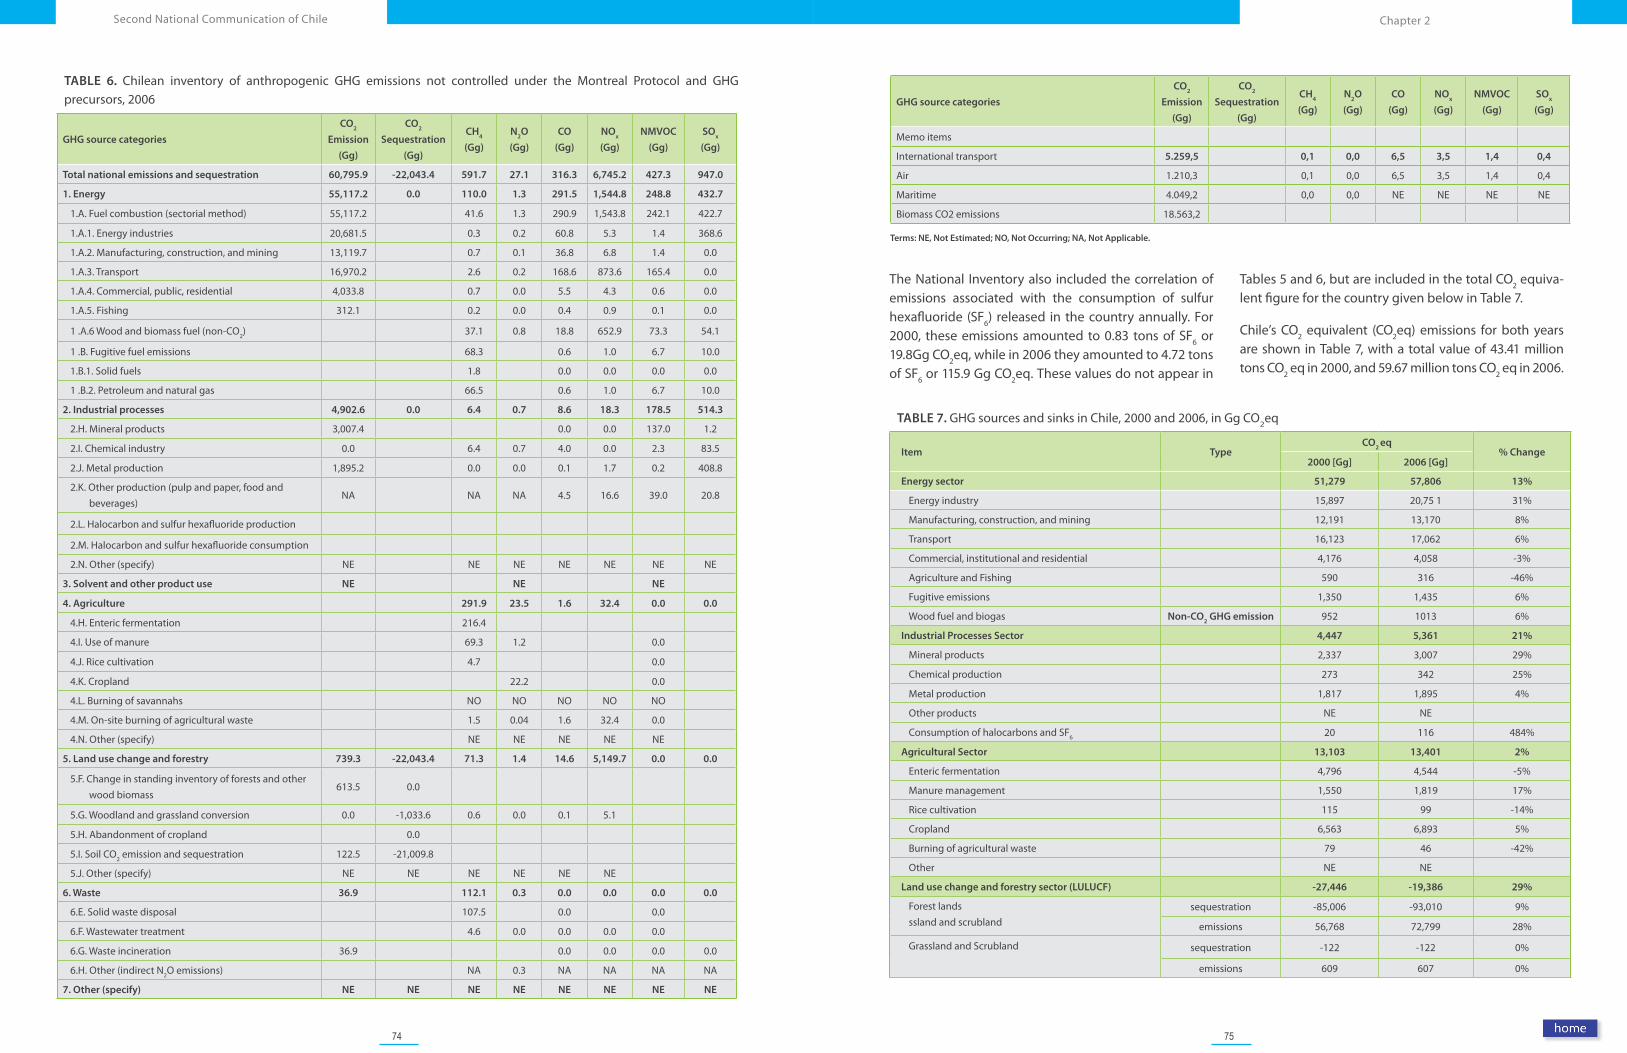
74 75
Chapter 2Second National Communication of Chile
GHG source categories
CO2
Emission
(Gg)
CO2
Sequestration
(Gg)
CH4
(Gg)
N2O
(Gg)
CO
(Gg)
NOx
(Gg)
NMVOC
(Gg)
SOx
(Gg)
Memo items
International transport 5.259,5 0,1 0,0 6,5 3,5 1,4 0,4
Air 1.210,3 0,1 0,0 6,5 3,5 1,4 0,4
Maritime 4.049,2 0,0 0,0 NE NE NE NE
Biomass CO2 emissions 18.563,2
Terms: NE, Not Estimated; NO, Not Occurring; NA, Not Applicable.
TABLE 7. GHG sources and sinks in Chile, 2000 and 2006, in Gg CO2eq
Item TypeCO
2 eq
% Change2000 [Gg] 2006 [Gg]
Energy sector 51,279 57,806 13%
Energy industry 15,897 20,75 1 31%
Manufacturing, construction, and mining 12,191 13,170 8%
Transport 16,123 17,062 6%
Commercial, institutional and residential 4,176 4,058 -3%
Agriculture and Fishing 590 316 -46%
Fugitive emissions 1,350 1,435 6%
Wood fuel and biogas Non-CO2 GHG emission 952 1013 6%
Industrial Processes Sector 4,447 5,361 21%
Mineral products 2,337 3,007 29%
Chemical production 273 342 25%
Metal production 1,817 1,895 4%
Other products NE NE
Consumption of halocarbons and SF6 20 116 484%
Agricultural Sector 13,103 13,401 2%
Enteric fermentation 4,796 4,544 -5%
Manure management 1,550 1,819 17%
Rice cultivation 115 99 -14%
Cropland 6,563 6,893 5%
Burning of agricultural waste 79 46 -42%
Other NE NE
Land use change and forestry sector (LULUCF) -27,446 -19,386 29%
Forest landsssland and scrubland
sequestration -85,006 -93,010 9%
emissions 56,768 72,799 28%
Grassland and Scrubland sequestration -122 -122 0%
emissions 609 607 0%
TABLE 6. Chilean inventory of anthropogenic GHG emissions not controlled under the Montreal Protocol and GHG precursors, 2006
GHG source categories
CO2
Emission
(Gg)
CO2
Sequestration
(Gg)
CH4
(Gg)
N2O
(Gg)
CO
(Gg)
NOx
(Gg)
NMVOC
(Gg)
SOx
(Gg)
Total national emissions and sequestration 60,795.9 -22,043.4 591.7 27.1 316.3 6,745.2 427.3 947.0
1. Energy 55,117.2 0.0 110.0 1.3 291.5 1,544.8 248.8 432.7
1.A. Fuel combustion (sectorial method) 55,117.2 41.6 1.3 290.9 1,543.8 242.1 422.7
1.A.1. Energy industries 20,681.5 0.3 0.2 60.8 5.3 1.4 368.6
1.A.2. Manufacturing, construction, and mining 13,119.7 0.7 0.1 36.8 6.8 1.4 0.0
1.A.3. Transport 16,970.2 2.6 0.2 168.6 873.6 165.4 0.0
1.A.4. Commercial, public, residential 4,033.8 0.7 0.0 5.5 4.3 0.6 0.0
1.A.5. Fishing 312.1 0.2 0.0 0.4 0.9 0.1 0.0
1 .A.6 Wood and biomass fuel (non-CO2) 37.1 0.8 18.8 652.9 73.3 54.1
1 .B. Fugitive fuel emissions 68.3 0.6 1.0 6.7 10.0
1.B.1. Solid fuels 1.8 0.0 0.0 0.0 0.0
1 .B.2. Petroleum and natural gas 66.5 0.6 1.0 6.7 10.0
2. Industrial processes 4,902.6 0.0 6.4 0.7 8.6 18.3 178.5 514.3
2.H. Mineral products 3,007.4 0.0 0.0 137.0 1.2
2.I. Chemical industry 0.0 6.4 0.7 4.0 0.0 2.3 83.5
2.J. Metal production 1,895.2 0.0 0.0 0.1 1.7 0.2 408.8
2.K. Other production (pulp and paper, food and beverages)
NA NA NA 4.5 16.6 39.0 20.8
2.L. Halocarbon and sulfur hexafluoride production
2.M. Halocarbon and sulfur hexafluoride consumption
2.N. Other (specify) NE NE NE NE NE NE NE
3. Solvent and other product use NE NE NE
4. Agriculture 291.9 23.5 1.6 32.4 0.0 0.0
4.H. Enteric fermentation 216.4
4.I. Use of manure 69.3 1.2 0.0
4.J. Rice cultivation 4.7 0.0
4.K. Cropland 22.2 0.0
4.L. Burning of savannahs NO NO NO NO NO
4.M. On-site burning of agricultural waste 1.5 0.04 1.6 32.4 0.0
4.N. Other (specify) NE NE NE NE NE
5. Land use change and forestry 739.3 -22,043.4 71.3 1.4 14.6 5,149.7 0.0 0.0
5.F. Change in standing inventory of forests and other wood biomass
613.5 0.0
5.G. Woodland and grassland conversion 0.0 -1,033.6 0.6 0.0 0.1 5.1
5.H. Abandonment of cropland 0.0
5.I. Soil CO2 emission and sequestration 122.5 -21,009.8
5.J. Other (specify) NE NE NE NE NE NE
6. Waste 36.9 112.1 0.3 0.0 0.0 0.0 0.0
6.E. Solid waste disposal 107.5 0.0 0.0
6.F. Wastewater treatment 4.6 0.0 0.0 0.0 0.0
6.G. Waste incineration 36.9 0.0 0.0 0.0 0.0
6.H. Other (indirect N2O emissions) NA 0.3 NA NA NA NA
7. Other (specify) NE NE NE NE NE NE NE NE
The National Inventory also included the correlation of emissions associated with the consumption of sulfur hexafluoride (SF6) released in the country annually. For 2000, these emissions amounted to 0.83 tons of SF6 or 19.8Gg CO2eq, while in 2006 they amounted to 4.72 tons of SF6 or 115.9 Gg CO2eq. These values do not appear in
Tables 5 and 6, but are included in the total CO2 equiva-lent figure for the country given below in Table 7.
Chile’s CO2 equivalent (CO2eq) emissions for both years are shown in Table 7, with a total value of 43.41 million tons CO2 eq in 2000, and 59.67 million tons CO2 eq in 2006.
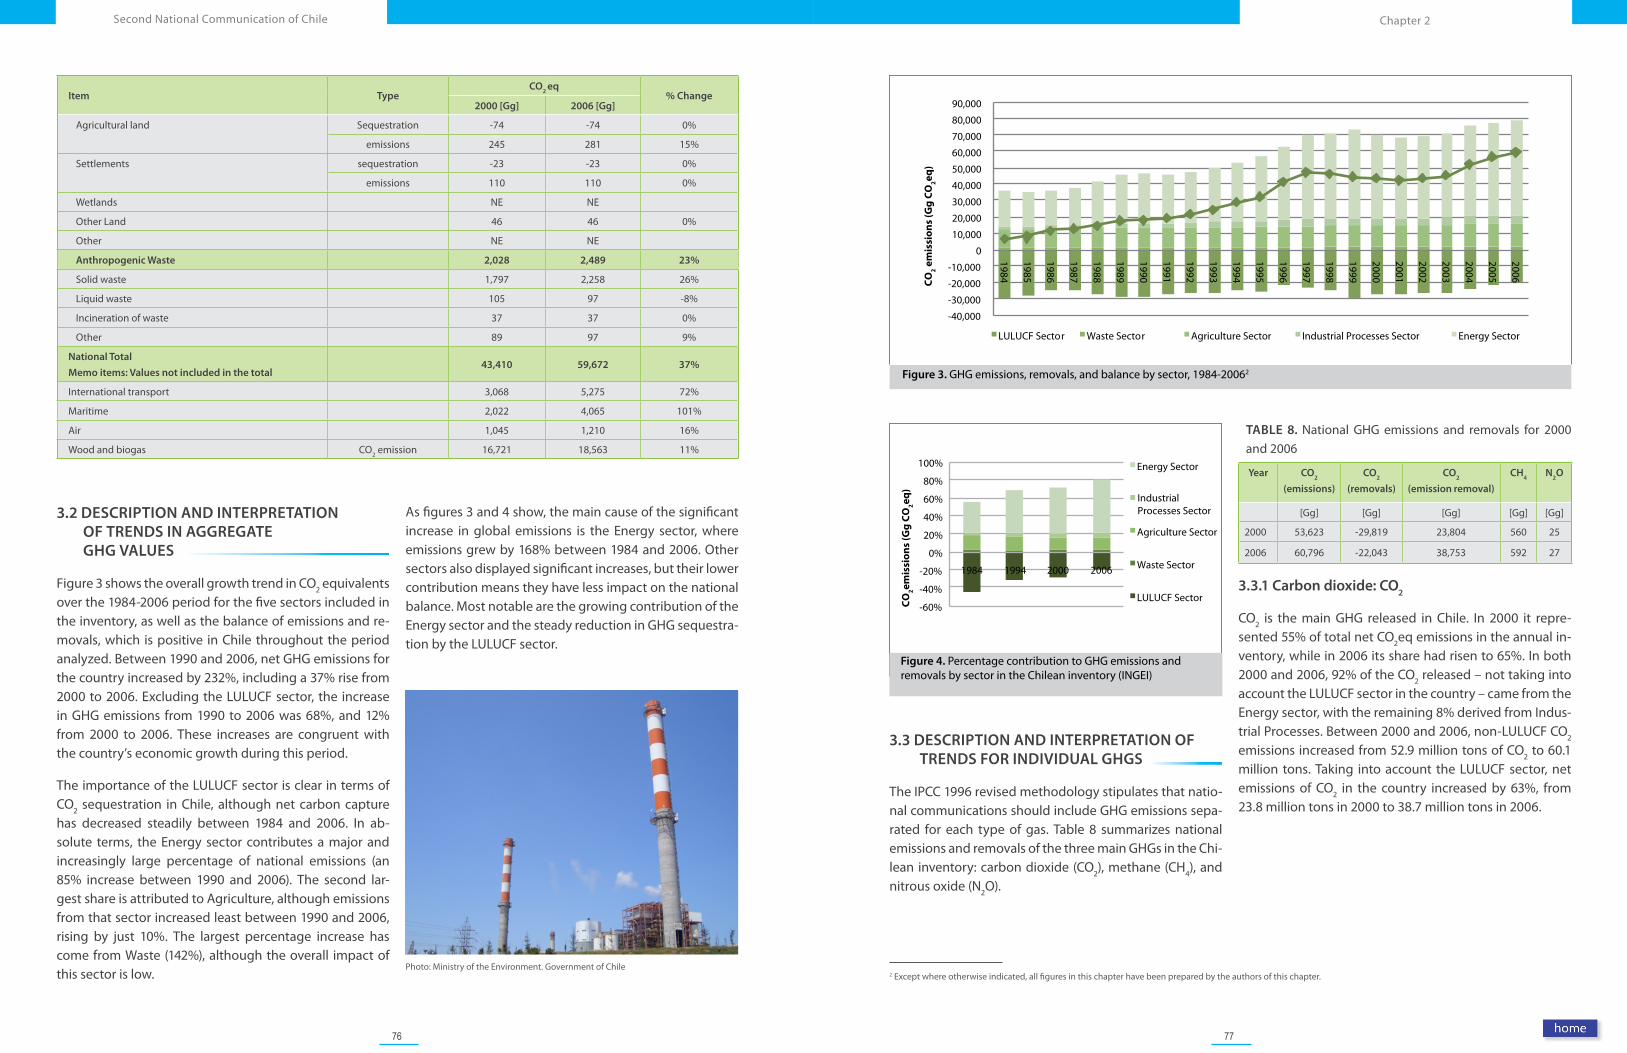
76 77
Chapter 2Second National Communication of Chile
2 Except where otherwise indicated, all figures in this chapter have been prepared by the authors of this chapter.
TABLE 8. National GHG emissions and removals for 2000 and 2006
Year CO2
(emissions)
CO2
(removals)
CO2
(emission removal)
CH4
N2O
[Gg] [Gg] [Gg] [Gg] [Gg]
2000 53,623 -29,819 23,804 560 25
2006 60,796 -22,043 38,753 592 27
3.3.1 Carbon dioxide: CO2
CO2 is the main GHG released in Chile. In 2000 it repre-sented 55% of total net CO2eq emissions in the annual in-ventory, while in 2006 its share had risen to 65%. In both 2000 and 2006, 92% of the CO2 released – not taking into account the LULUCF sector in the country – came from the Energy sector, with the remaining 8% derived from Indus-trial Processes. Between 2000 and 2006, non-LULUCF CO2 emissions increased from 52.9 million tons of CO2 to 60.1 million tons. Taking into account the LULUCF sector, net emissions of CO2 in the country increased by 63%, from 23.8 million tons in 2000 to 38.7 million tons in 2006.
3.3 DESCRIPTION AND INTERPRETATION OF TRENDS FOR INDIVIDUAL GHGS
The IPCC 1996 revised methodology stipulates that natio-nal communications should include GHG emissions sepa-rated for each type of gas. Table 8 summarizes national emissions and removals of the three main GHGs in the Chi-lean inventory: carbon dioxide (CO2), methane (CH4), and nitrous oxide (N2O).
Photo: Ministry of the Environment. Government of Chile
Item TypeCO
2 eq
% Change2000 [Gg] 2006 [Gg]
Agricultural land Sequestration -74 -74 0%
emissions 245 281 15%
Settlements sequestration -23 -23 0%
emissions 110 110 0%
Wetlands NE NE
Other Land 46 46 0%
Other NE NE
Anthropogenic Waste 2,028 2,489 23%
Solid waste 1,797 2,258 26%
Liquid waste 105 97 -8%
Incineration of waste 37 37 0%
Other 89 97 9%
National Total
Memo items: Values not included in the total 43,410 59,672 37%
International transport 3,068 5,275 72%
Maritime 2,022 4,065 101%
Air 1,045 1,210 16%
Wood and biogas CO2 emission 16,721 18,563 11%
3.2 DESCRIPTION AND INTERPRETATION OF TRENDS IN AGGREGATE GHG VALUES
Figure 3 shows the overall growth trend in CO2 equivalents over the 1984-2006 period for the five sectors included in the inventory, as well as the balance of emissions and re-movals, which is positive in Chile throughout the period analyzed. Between 1990 and 2006, net GHG emissions for the country increased by 232%, including a 37% rise from 2000 to 2006. Excluding the LULUCF sector, the increase in GHG emissions from 1990 to 2006 was 68%, and 12% from 2000 to 2006. These increases are congruent with the country’s economic growth during this period.
The importance of the LULUCF sector is clear in terms of CO2 sequestration in Chile, although net carbon capture has decreased steadily between 1984 and 2006. In ab-solute terms, the Energy sector contributes a major and increasingly large percentage of national emissions (an 85% increase between 1990 and 2006). The second lar-gest share is attributed to Agriculture, although emissions from that sector increased least between 1990 and 2006, rising by just 10%. The largest percentage increase has come from Waste (142%), although the overall impact of this sector is low.
As figures 3 and 4 show, the main cause of the significant increase in global emissions is the Energy sector, where emissions grew by 168% between 1984 and 2006. Other sectors also displayed significant increases, but their lower contribution means they have less impact on the national balance. Most notable are the growing contribution of the Energy sector and the steady reduction in GHG sequestra-tion by the LULUCF sector.
Figure 3. GHG emissions, removals, and balance by sector, 1984-20062
Figure 4. Percentage contribution to GHG emissions and removals by sector in the Chilean inventory (INGEI)
-60%
-40%
-20%
0%
20%
40%
60%
80%
100%
1984 1994 2000 2006
CO
2emis
sio
ns
(Gg
CO
2eq)
Energy Sector
Agriculture Sector
Waste Sector
LULUCF Sector
Industrial Processes Sector
-40,000
-30,000
-20,000
-10,000
0
10,000
20,000
30,000
40,000
50,000
60,000
70,000
80,000
90,000
1984
1985
1986
1987
1988
1989
1990
1991
1992
1993
1994
1995
1996
1997
1998
1999
2000
2001
2002
2003
2004
2005
2006 CO
2 em
issi
on
s (G
g C
O2eq
)
LULUCF Sector Waste Sector Agriculture Sector Industrial Processes Sector Energy Sector
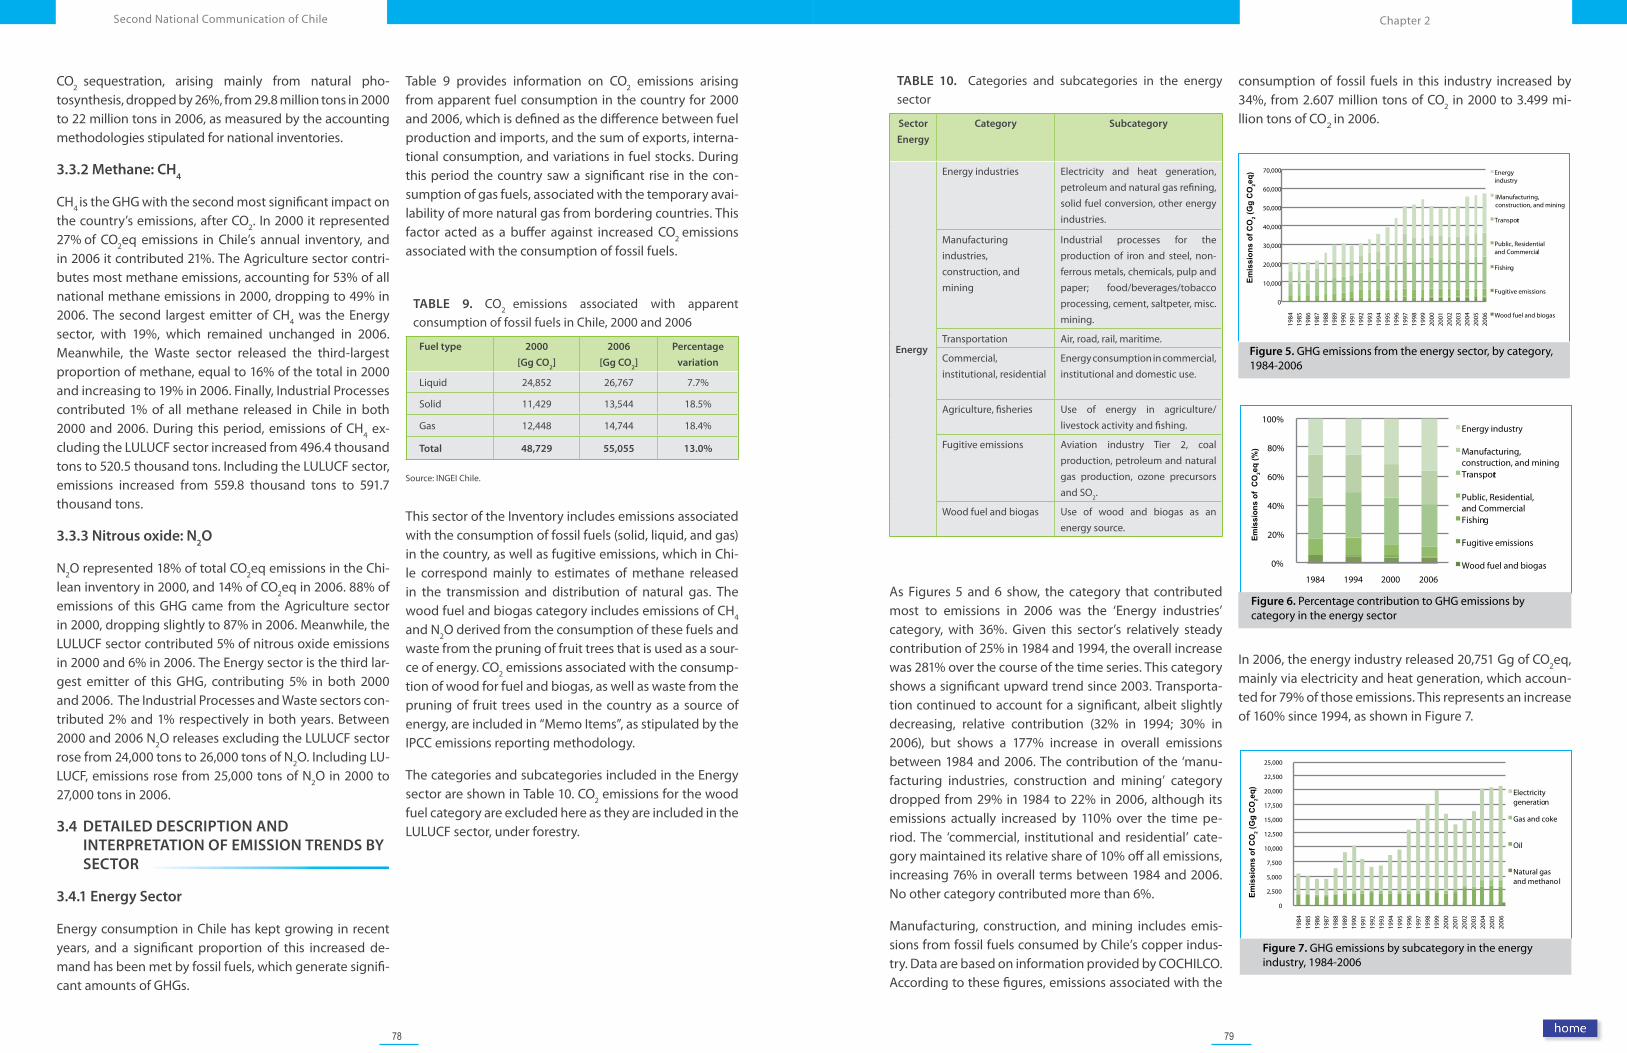
78 79
Chapter 2Second National Communication of Chile
TABLE 10. Categories and subcategories in the energy sector
Sector
Energy
Category Subcategory
Energy
Energy industries Electricity and heat generation, petroleum and natural gas refining, solid fuel conversion, other energy industries.
Manufacturing industries, construction, and mining
Industrial processes for the production of iron and steel, non-ferrous metals, chemicals, pulp and paper; food/beverages/tobacco processing, cement, saltpeter, misc. mining.
Transportation Air, road, rail, maritime.
Commercial, institutional, residential
Energy consumption in commercial, institutional and domestic use.
Agriculture, fisheries Use of energy in agriculture/ livestock activity and fishing.
Fugitive emissions Aviation industry Tier 2, coal production, petroleum and natural gas production, ozone precursors and SO2.
Wood fuel and biogas Use of wood and biogas as an energy source.
As Figures 5 and 6 show, the category that contributed most to emissions in 2006 was the ‘Energy industries’ category, with 36%. Given this sector’s relatively steady contribution of 25% in 1984 and 1994, the overall increase was 281% over the course of the time series. This category shows a significant upward trend since 2003. Transporta-tion continued to account for a significant, albeit slightly decreasing, relative contribution (32% in 1994; 30% in 2006), but shows a 177% increase in overall emissions between 1984 and 2006. The contribution of the ‘manu-facturing industries, construction and mining’ category dropped from 29% in 1984 to 22% in 2006, although its emissions actually increased by 110% over the time pe-riod. The ‘commercial, institutional and residential’ cate-gory maintained its relative share of 10% off all emissions, increasing 76% in overall terms between 1984 and 2006. No other category contributed more than 6%.
Manufacturing, construction, and mining includes emis-sions from fossil fuels consumed by Chile’s copper indus-try. Data are based on information provided by COCHILCO. According to these figures, emissions associated with the
In 2006, the energy industry released 20,751 Gg of CO2eq, mainly via electricity and heat generation, which accoun-ted for 79% of those emissions. This represents an increase of 160% since 1994, as shown in Figure 7.
consumption of fossil fuels in this industry increased by 34%, from 2.607 million tons of CO2 in 2000 to 3.499 mi-llion tons of CO2 in 2006.
CO2 sequestration, arising mainly from natural pho-tosynthesis, dropped by 26%, from 29.8 million tons in 2000 to 22 million tons in 2006, as measured by the accounting methodologies stipulated for national inventories.
3.3.2 Methane: CH4
CH4 is the GHG with the second most significant impact on the country’s emissions, after CO2. In 2000 it represented 27% of CO2eq emissions in Chile’s annual inventory, and in 2006 it contributed 21%. The Agriculture sector contri-butes most methane emissions, accounting for 53% of all national methane emissions in 2000, dropping to 49% in 2006. The second largest emitter of CH4 was the Energy sector, with 19%, which remained unchanged in 2006. Meanwhile, the Waste sector released the third-largest proportion of methane, equal to 16% of the total in 2000 and increasing to 19% in 2006. Finally, Industrial Processes contributed 1% of all methane released in Chile in both 2000 and 2006. During this period, emissions of CH4 ex-cluding the LULUCF sector increased from 496.4 thousand tons to 520.5 thousand tons. Including the LULUCF sector, emissions increased from 559.8 thousand tons to 591.7 thousand tons.
3.3.3 Nitrous oxide: N2O
N2O represented 18% of total CO2eq emissions in the Chi-lean inventory in 2000, and 14% of CO2eq in 2006. 88% of emissions of this GHG came from the Agriculture sector in 2000, dropping slightly to 87% in 2006. Meanwhile, the LULUCF sector contributed 5% of nitrous oxide emissions in 2000 and 6% in 2006. The Energy sector is the third lar-gest emitter of this GHG, contributing 5% in both 2000 and 2006. The Industrial Processes and Waste sectors con-tributed 2% and 1% respectively in both years. Between 2000 and 2006 N2O releases excluding the LULUCF sector rose from 24,000 tons to 26,000 tons of N2O. Including LU-LUCF, emissions rose from 25,000 tons of N2O in 2000 to 27,000 tons in 2006.
3.4 DETAILED DESCRIPTION AND INTERPRETATION OF EMISSION TRENDS BY SECTOR
3.4.1 Energy Sector
Energy consumption in Chile has kept growing in recent years, and a significant proportion of this increased de-mand has been met by fossil fuels, which generate signifi-cant amounts of GHGs.
Table 9 provides information on CO2 emissions arising from apparent fuel consumption in the country for 2000 and 2006, which is defined as the difference between fuel production and imports, and the sum of exports, interna-tional consumption, and variations in fuel stocks. During this period the country saw a significant rise in the con-sumption of gas fuels, associated with the temporary avai-lability of more natural gas from bordering countries. This factor acted as a buffer against increased CO2 emissions associated with the consumption of fossil fuels.
TABLE 9. CO2 emissions associated with apparent consumption of fossil fuels in Chile, 2000 and 2006
Fuel type 2000
[Gg CO2]
2006
[Gg CO2]
Percentage
variation
Liquid 24,852 26,767 7.7%
Solid 11,429 13,544 18.5%
Gas 12,448 14,744 18.4%
Total 48,729 55,055 13.0%
Source: INGEI Chile.
This sector of the Inventory includes emissions associated with the consumption of fossil fuels (solid, liquid, and gas) in the country, as well as fugitive emissions, which in Chi-le correspond mainly to estimates of methane released in the transmission and distribution of natural gas. The wood fuel and biogas category includes emissions of CH4 and N2O derived from the consumption of these fuels and waste from the pruning of fruit trees that is used as a sour-ce of energy. CO2 emissions associated with the consump-tion of wood for fuel and biogas, as well as waste from the pruning of fruit trees used in the country as a source of energy, are included in “Memo Items”, as stipulated by the IPCC emissions reporting methodology.
The categories and subcategories included in the Energy sector are shown in Table 10. CO2 emissions for the wood fuel category are excluded here as they are included in the LULUCF sector, under forestry.
Figure 5. GHG emissions from the energy sector, by category, 1984-2006
Figure 6. Percentage contribution to GHG emissions by category in the energy sector
Figure 7. GHG emissions by subcategory in the energy industry, 1984-2006
0
10,000
20,000
30,000
40,000
50,000
60,000
70,000
1984
19
85
1986
19
87
1988
19
89
1990
19
91
1992
19
93
1994
19
95
1996
19
97
1998
19
99
2000
20
01
2002
20
03
2004
20
05
2006
Energy industry
IManufacturing, construction, and mining
Transport
Public, Residentialand Commercial
Fishing
Fugitive emissions
Wood fuel and biogas
Emis
sion
s of
CO
2 (G
g C
O2e
q)
0%
20%
40%
60%
80%
100%
1984 1994 2000 2006
Emis
sion
s of
CO
2eq
(%)
Energy industry
Manufacturing, construction, and miningTransport
Public, Residential, and CommercialFishing
Fugitive emissions
Wood fuel and biogas
0
2,500
5,000
7,500
10,000
12,500
15,000
17,500
20,000
22,500
25,000
1984
19
85
1986
19
87
1988
19
89
1990
19
91
1992
19
93
1994
19
95
1996
19
97
1998
19
99
2000
20
01
2002
20
03
2004
20
05
2006
Emis
sion
s of
CO
2 (G
g C
O2e
q) Electricity generation
Gas and coke
Oil
Natural gas and methanol
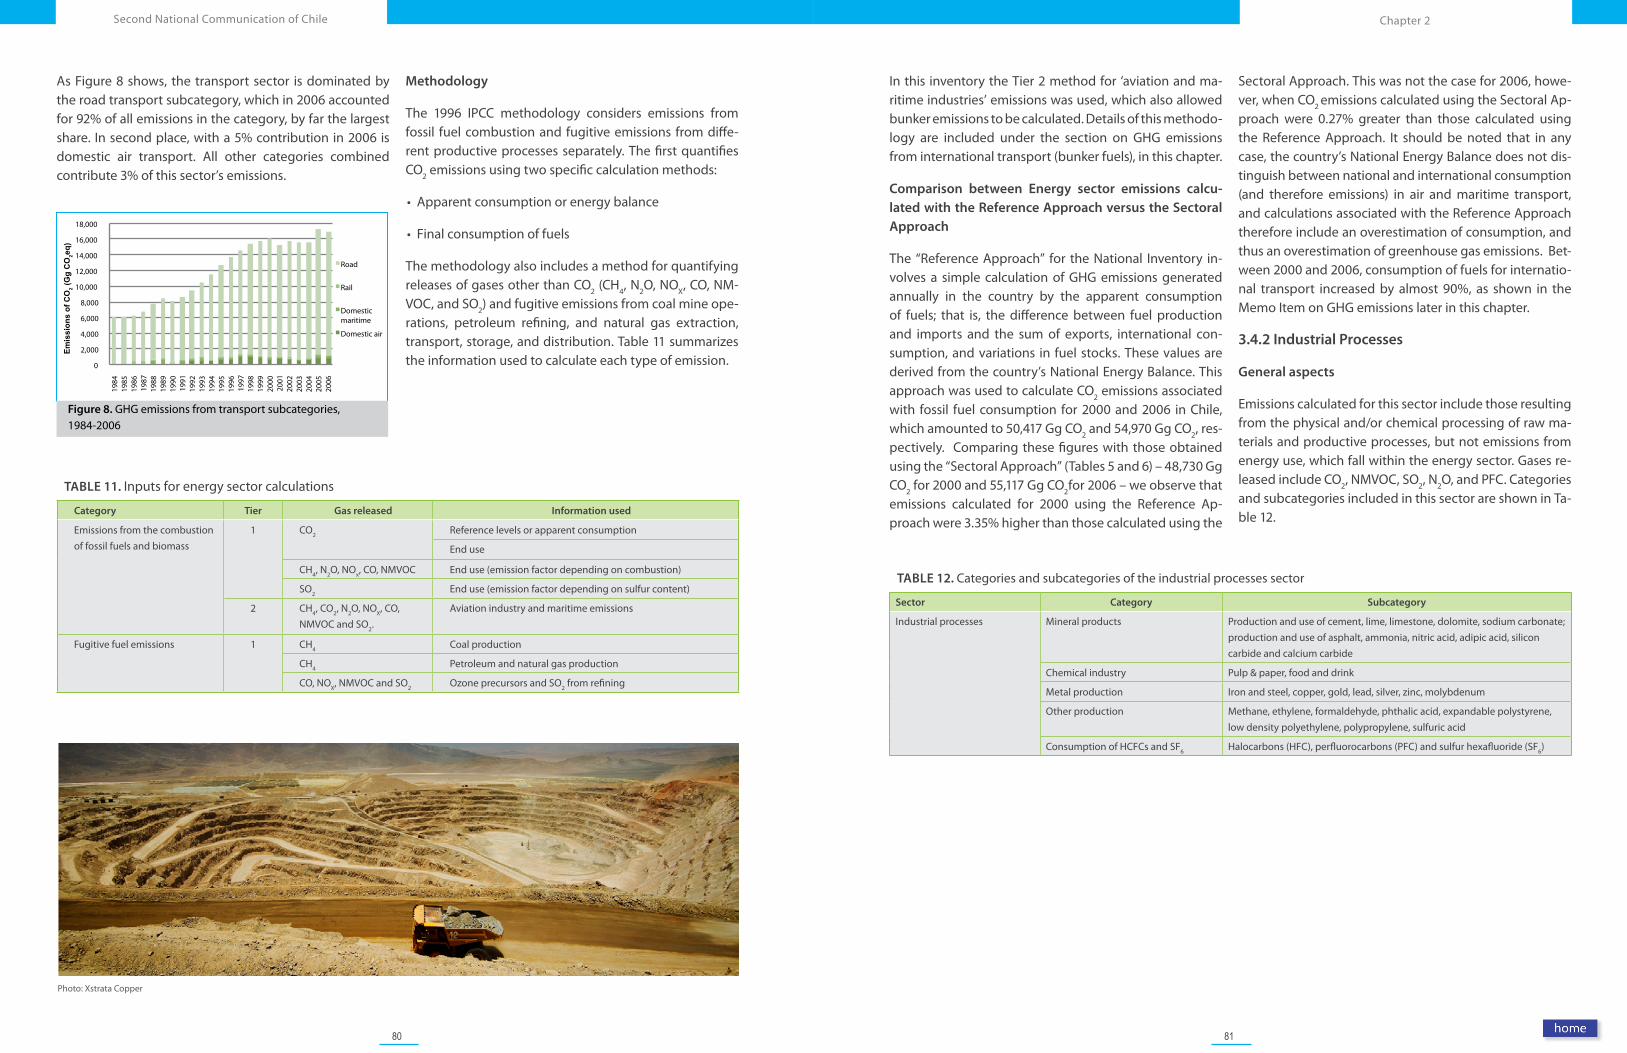
80 81
Chapter 2Second National Communication of Chile
In this inventory the Tier 2 method for ‘aviation and ma-ritime industries’ emissions was used, which also allowed bunker emissions to be calculated. Details of this methodo-logy are included under the section on GHG emissions from international transport (bunker fuels), in this chapter.
Comparison between Energy sector emissions calcu-lated with the Reference Approach versus the Sectoral Approach
The “Reference Approach” for the National Inventory in-volves a simple calculation of GHG emissions generated annually in the country by the apparent consumption of fuels; that is, the difference between fuel production and imports and the sum of exports, international con-sumption, and variations in fuel stocks. These values are derived from the country’s National Energy Balance. This approach was used to calculate CO2 emissions associated with fossil fuel consumption for 2000 and 2006 in Chile, which amounted to 50,417 Gg CO2 and 54,970 Gg CO2, res-pectively. Comparing these figures with those obtained using the “Sectoral Approach” (Tables 5 and 6) – 48,730 Gg CO2 for 2000 and 55,117 Gg CO2for 2006 – we observe that emissions calculated for 2000 using the Reference Ap-proach were 3.35% higher than those calculated using the
Sectoral Approach. This was not the case for 2006, howe-ver, when CO2 emissions calculated using the Sectoral Ap-proach were 0.27% greater than those calculated using the Reference Approach. It should be noted that in any case, the country’s National Energy Balance does not dis-tinguish between national and international consumption (and therefore emissions) in air and maritime transport, and calculations associated with the Reference Approach therefore include an overestimation of consumption, and thus an overestimation of greenhouse gas emissions. Bet-ween 2000 and 2006, consumption of fuels for internatio-nal transport increased by almost 90%, as shown in the Memo Item on GHG emissions later in this chapter.
3.4.2 Industrial Processes
General aspects
Emissions calculated for this sector include those resulting from the physical and/or chemical processing of raw ma-terials and productive processes, but not emissions from energy use, which fall within the energy sector. Gases re-leased include CO2, NMVOC, SO2, N2O, and PFC. Categories and subcategories included in this sector are shown in Ta-ble 12.
TABLE 12. Categories and subcategories of the industrial processes sector
Sector Category Subcategory
Industrial processes Mineral products Production and use of cement, lime, limestone, dolomite, sodium carbonate; production and use of asphalt, ammonia, nitric acid, adipic acid, silicon carbide and calcium carbide
Chemical industry Pulp & paper, food and drink
Metal production Iron and steel, copper, gold, lead, silver, zinc, molybdenum
Other production Methane, ethylene, formaldehyde, phthalic acid, expandable polystyrene, low density polyethylene, polypropylene, sulfuric acid
Consumption of HCFCs and SF6 Halocarbons (HFC), perfluorocarbons (PFC) and sulfur hexafluoride (SF6)
Figure 8. GHG emissions from transport subcategories, 1984-2006
Photo: Xstrata Copper
TABLE 11. Inputs for energy sector calculations
Category Tier Gas released Information used
Emissions from the combustion of fossil fuels and biomass
1 CO2 Reference levels or apparent consumption
End use
CH4, N2O, NOx, CO, NMVOC End use (emission factor depending on combustion)
SO2 End use (emission factor depending on sulfur content)
2 CH4, CO2, N2O, NOX, CO, NMVOC and SO2.
Aviation industry and maritime emissions
Fugitive fuel emissions 1 CH4 Coal production
CH4 Petroleum and natural gas production
CO, NOX, NMVOC and SO2 Ozone precursors and SO2 from refining
As Figure 8 shows, the transport sector is dominated by the road transport subcategory, which in 2006 accounted for 92% of all emissions in the category, by far the largest share. In second place, with a 5% contribution in 2006 is domestic air transport. All other categories combined contribute 3% of this sector’s emissions.
Methodology
The 1996 IPCC methodology considers emissions from fossil fuel combustion and fugitive emissions from diffe-rent productive processes separately. The first quantifies CO2 emissions using two specific calculation methods:
• Apparent consumption or energy balance
• Final consumption of fuels
The methodology also includes a method for quantifying releases of gases other than CO2 (CH4, N2O, NOX, CO, NM-VOC, and SO2) and fugitive emissions from coal mine ope-rations, petroleum refining, and natural gas extraction, transport, storage, and distribution. Table 11 summarizes the information used to calculate each type of emission.0
2,000
4,000
6,000
8,000
10,000
12,000
14,000
16,000
18,000
1984
19
85
1986
19
87
1988
19
89
1990
19
91
1992
19
93
1994
19
95
1996
19
97
1998
19
99
2000
20
01
2002
20
03
2004
20
05
2006
Road
Rail
Domestic maritime
Domestic air
Emis
sion
s of
CO
2 (G
g C
O2e
q)
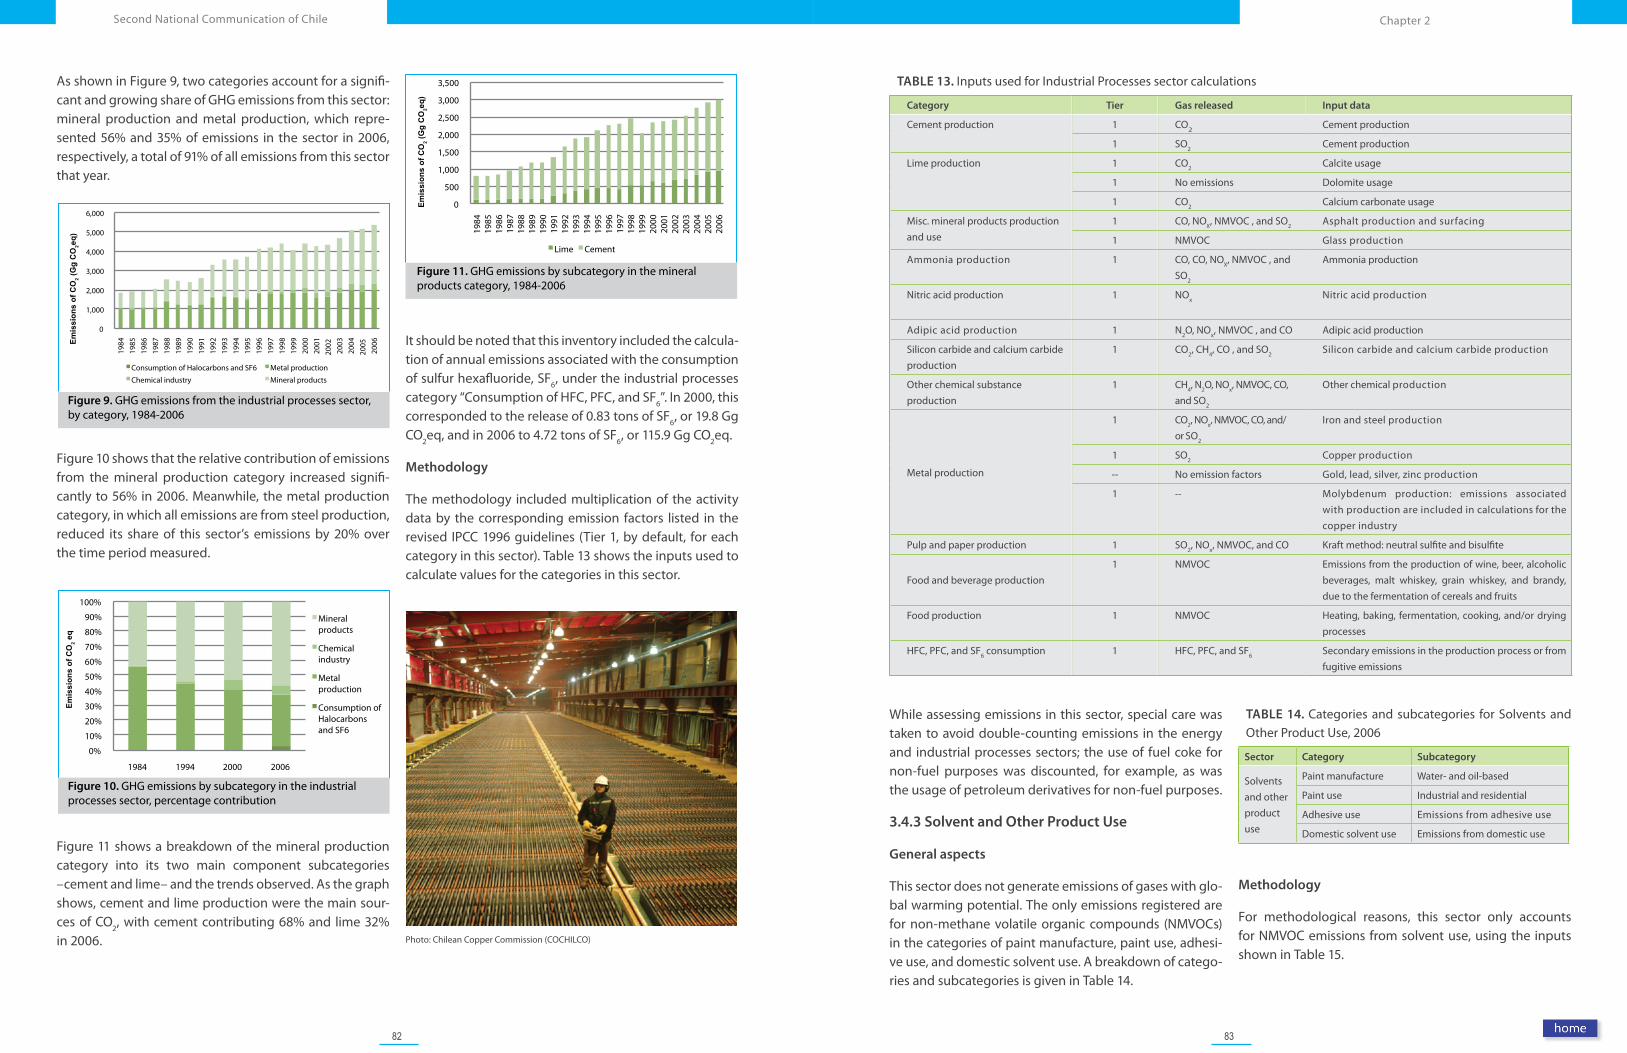
82 83
Chapter 2Second National Communication of Chile
TABLE 13. Inputs used for Industrial Processes sector calculations
Category Tier Gas released Input data
Cement production 1 CO2 Cement production
1 SO2 Cement production
Lime production 1 CO2 Calcite usage
1 No emissions Dolomite usage
1 CO2 Calcium carbonate usage
Misc. mineral products production and use
1 CO, NOX, NMVOC , and SO2 Asphalt production and surfacing
1 NMVOC Glass production
Ammonia production 1 CO, CO, NOX, NMVOC , and SO2
Ammonia production
Nitric acid production 1 NOx Nitric acid production
Adipic acid production 1 N2O, NOx, NMVOC , and CO Adipic acid production
Silicon carbide and calcium carbide production
1 CO2, CH4, CO , and SO2 Silicon carbide and calcium carbide production
Other chemical substance production
1 CH4, N2O, NOx, NMVOC, CO, and SO2
Other chemical production
Metal production
1 CO2, NOx, NMVOC, CO, and/or SO2
Iron and steel production
1 SO2 Copper production
-- No emission factors Gold, lead, silver, zinc production
1 -- Molybdenum production: emissions associated with production are included in calculations for the copper industry
Pulp and paper production 1 SO2, NOx, NMVOC, and CO Kraft method: neutral sulfite and bisulfite
Food and beverage production1 NMVOC Emissions from the production of wine, beer, alcoholic
beverages, malt whiskey, grain whiskey, and brandy, due to the fermentation of cereals and fruits
Food production 1 NMVOC Heating, baking, fermentation, cooking, and/or drying processes
HFC, PFC, and SF6 consumption 1 HFC, PFC, and SF6 Secondary emissions in the production process or from fugitive emissions
While assessing emissions in this sector, special care was taken to avoid double-counting emissions in the energy and industrial processes sectors; the use of fuel coke for non-fuel purposes was discounted, for example, as was the usage of petroleum derivatives for non-fuel purposes.
3.4.3 Solvent and Other Product Use
General aspects
This sector does not generate emissions of gases with glo-bal warming potential. The only emissions registered are for non-methane volatile organic compounds (NMVOCs) in the categories of paint manufacture, paint use, adhesi-ve use, and domestic solvent use. A breakdown of catego-ries and subcategories is given in Table 14.
TABLE 14. Categories and subcategories for Solvents and Other Product Use, 2006
Sector Category Subcategory
Solvents and other product use
Paint manufacture Water- and oil-based
Paint use Industrial and residential
Adhesive use Emissions from adhesive use
Domestic solvent use Emissions from domestic use
Methodology
For methodological reasons, this sector only accounts for NMVOC emissions from solvent use, using the inputs shown in Table 15.
Figure 9. GHG emissions from the industrial processes sector, by category, 1984-2006
Figure 11. GHG emissions by subcategory in the mineral products category, 1984-2006
Figure 10. GHG emissions by subcategory in the industrial processes sector, percentage contribution
Photo: Chilean Copper Commission (COCHILCO)
As shown in Figure 9, two categories account for a signifi-cant and growing share of GHG emissions from this sector: mineral production and metal production, which repre-sented 56% and 35% of emissions in the sector in 2006, respectively, a total of 91% of all emissions from this sector that year.
Figure 10 shows that the relative contribution of emissions from the mineral production category increased signifi-cantly to 56% in 2006. Meanwhile, the metal production category, in which all emissions are from steel production, reduced its share of this sector’s emissions by 20% over the time period measured.
Figure 11 shows a breakdown of the mineral production category into its two main component subcategories –cement and lime– and the trends observed. As the graph shows, cement and lime production were the main sour-ces of CO2, with cement contributing 68% and lime 32% in 2006.
It should be noted that this inventory included the calcula-tion of annual emissions associated with the consumption of sulfur hexafluoride, SF6, under the industrial processes category “Consumption of HFC, PFC, and SF6”. In 2000, this corresponded to the release of 0.83 tons of SF6, or 19.8 Gg CO2eq, and in 2006 to 4.72 tons of SF6, or 115.9 Gg CO2eq.
Methodology
The methodology included multiplication of the activity data by the corresponding emission factors listed in the revised IPCC 1996 guidelines (Tier 1, by default, for each category in this sector). Table 13 shows the inputs used to calculate values for the categories in this sector.
0
1,000
2,000
3,000
4,000
5,000
6,000
1984
19
85
1986
19
87
1988
19
89
1990
19
91
1992
19
93
1994
19
95
1996
19
97
1998
19
99
2000
20
01
2002
20
03
2004
20
05
2006
Consumption of Halocarbons and SF6 Metal production
Chemical industry Mineral products
Emis
sion
s of
CO
2 (G
g C
O2e
q)
0%
10%
20%
30%
40%
50%
60%
70%
80%
90%
100%
1984 1994 2000 2006
Mineral products
Chemical industry
Metal production
Consumption of Halocarbons and SF6
Emis
sion
s of
CO
2 eq
0
500
1,000
1,500
2,000
2,500
3,000
3,500
1984
19
85
1986
19
87
1988
19
89
1990
19
91
1992
19
93
1994
19
95
1996
19
97
1998
19
99
2000
20
01
2002
20
03
2004
20
05
2006
Lime Cement
Emis
sion
s of
CO
2 (G
g C
O2e
q)
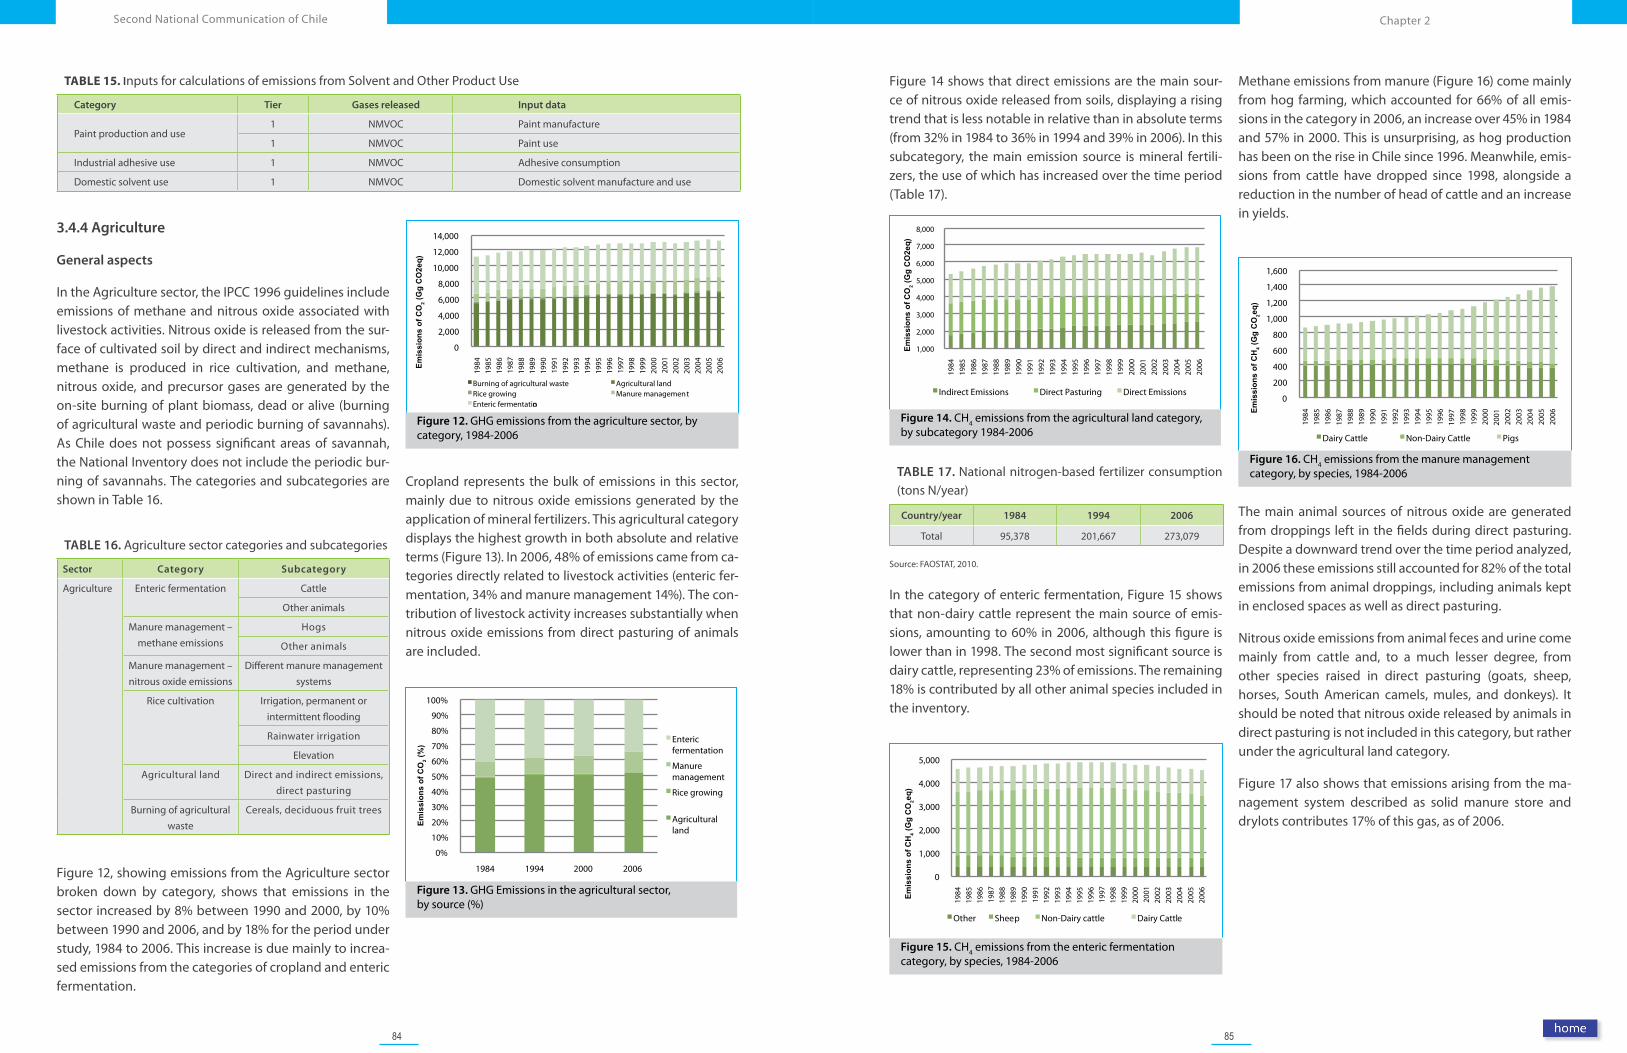
84 85
Chapter 2Second National Communication of Chile
0
2,000
4,000
6,000
8,000
10,000
12,000
14,000
1984
19
85
1986
19
87
1988
19
89
1990
19
91
1992
19
93
1994
19
95
1996
19
97
1998
19
99
2000
20
01
2002
20
03
2004
20
05
2006
Burning of agricultural waste Agricultural landRice growing Manure managementEnteric fermentation
Emis
sion
s of
CO
2 (G
g C
O2e
q)Figure 14. CH4 emissions from the agricultural land category, by subcategory 1984-2006
Figure 16. CH4 emissions from the manure management category, by species, 1984-2006
Figure 14 shows that direct emissions are the main sour-ce of nitrous oxide released from soils, displaying a rising trend that is less notable in relative than in absolute terms (from 32% in 1984 to 36% in 1994 and 39% in 2006). In this subcategory, the main emission source is mineral fertili-zers, the use of which has increased over the time period (Table 17).
TABLE 17. National nitrogen-based fertilizer consumption (tons N/year)
Country/year 1984 1994 2006
Total 95,378 201,667 273,079
Source: FAOSTAT, 2010.
In the category of enteric fermentation, Figure 15 shows that non-dairy cattle represent the main source of emis-sions, amounting to 60% in 2006, although this figure is lower than in 1998. The second most significant source is dairy cattle, representing 23% of emissions. The remaining 18% is contributed by all other animal species included in the inventory.
Methane emissions from manure (Figure 16) come mainly from hog farming, which accounted for 66% of all emis-sions in the category in 2006, an increase over 45% in 1984 and 57% in 2000. This is unsurprising, as hog production has been on the rise in Chile since 1996. Meanwhile, emis-sions from cattle have dropped since 1998, alongside a reduction in the number of head of cattle and an increase in yields.
The main animal sources of nitrous oxide are generated from droppings left in the fields during direct pasturing. Despite a downward trend over the time period analyzed, in 2006 these emissions still accounted for 82% of the total emissions from animal droppings, including animals kept in enclosed spaces as well as direct pasturing.
Nitrous oxide emissions from animal feces and urine come mainly from cattle and, to a much lesser degree, from other species raised in direct pasturing (goats, sheep, horses, South American camels, mules, and donkeys). It should be noted that nitrous oxide released by animals in direct pasturing is not included in this category, but rather under the agricultural land category.
Figure 17 also shows that emissions arising from the ma-nagement system described as solid manure store and drylots contributes 17% of this gas, as of 2006.
Figure 12. GHG emissions from the agriculture sector, by category, 1984-2006
Figure 13. GHG Emissions in the agricultural sector, by source (%)
TABLE 15. Inputs for calculations of emissions from Solvent and Other Product Use
Category Tier Gases released Input data
Paint production and use1 NMVOC Paint manufacture
1 NMVOC Paint use
Industrial adhesive use 1 NMVOC Adhesive consumption
Domestic solvent use 1 NMVOC Domestic solvent manufacture and use
3.4.4 Agriculture
General aspects
In the Agriculture sector, the IPCC 1996 guidelines include emissions of methane and nitrous oxide associated with livestock activities. Nitrous oxide is released from the sur-face of cultivated soil by direct and indirect mechanisms, methane is produced in rice cultivation, and methane, nitrous oxide, and precursor gases are generated by the on-site burning of plant biomass, dead or alive (burning of agricultural waste and periodic burning of savannahs). As Chile does not possess significant areas of savannah, the National Inventory does not include the periodic bur-ning of savannahs. The categories and subcategories are shown in Table 16.
TABLE 16. Agriculture sector categories and subcategories
Sector Category Subcategory
Agriculture Enteric fermentation Cattle
Other animals
Manure management – methane emissions
Hogs
Other animals
Manure management – nitrous oxide emissions
Different manure management systems
Rice cultivation Irrigation, permanent or intermittent flooding
Rainwater irrigation
Elevation
Agricultural land Direct and indirect emissions, direct pasturing
Burning of agricultural waste
Cereals, deciduous fruit trees
Figure 12, showing emissions from the Agriculture sector broken down by category, shows that emissions in the sector increased by 8% between 1990 and 2000, by 10% between 1990 and 2006, and by 18% for the period under study, 1984 to 2006. This increase is due mainly to increa-sed emissions from the categories of cropland and enteric fermentation.
Cropland represents the bulk of emissions in this sector, mainly due to nitrous oxide emissions generated by the application of mineral fertilizers. This agricultural category displays the highest growth in both absolute and relative terms (Figure 13). In 2006, 48% of emissions came from ca-tegories directly related to livestock activities (enteric fer-mentation, 34% and manure management 14%). The con-tribution of livestock activity increases substantially when nitrous oxide emissions from direct pasturing of animals are included.
Figure 15. CH4 emissions from the enteric fermentation category, by species, 1984-2006
0%
10%
20%
30%
40%
50%
60%
70%
80%
90%
100%
1984 1994 2000 2006
Emis
sion
s of
CO
2 (%
) Enteric fermentation
Manure management
Rice growing
Agricultural land
1,000
2,000
3,000
4,000
5,000
6,000
7,000
8,000
1984
19
85
1986
19
87
1988
19
89
1990
19
91
1992
19
93
1994
19
95
1996
19
97
1998
19
99
2000
20
01
2002
20
03
2004
20
05
2006
Emis
sion
s of
CO
2 (G
g C
O2e
q)
Indirect Emissions Direct Pasturing Direct Emissions
0
1,000
2,000
3,000
4,000
5,000
1984
19
85
1986
19
87
1988
19
89
1990
19
91
1992
19
93
1994
19
95
1996
19
97
1998
19
99
2000
20
01
2002
20
03
2004
20
05
2006
Emis
sion
s of
CH
4 (G
g C
O2e
q)Other Sheep Non-Dairy cattle Dairy Cattle
0
200
400
600
800
1,000
1,200
1,400
1,600
1984
19
85
1986
19
87
1988
19
89
1990
19
91
1992
19
93
1994
19
95
1996
19
97
1998
19
99
2000
20
01
2002
20
03
2004
20
05
2006
Dairy Cattle Non-Dairy Cattle Pigs
Emis
sion
s of
CH
4 (G
g C
O2e
q)
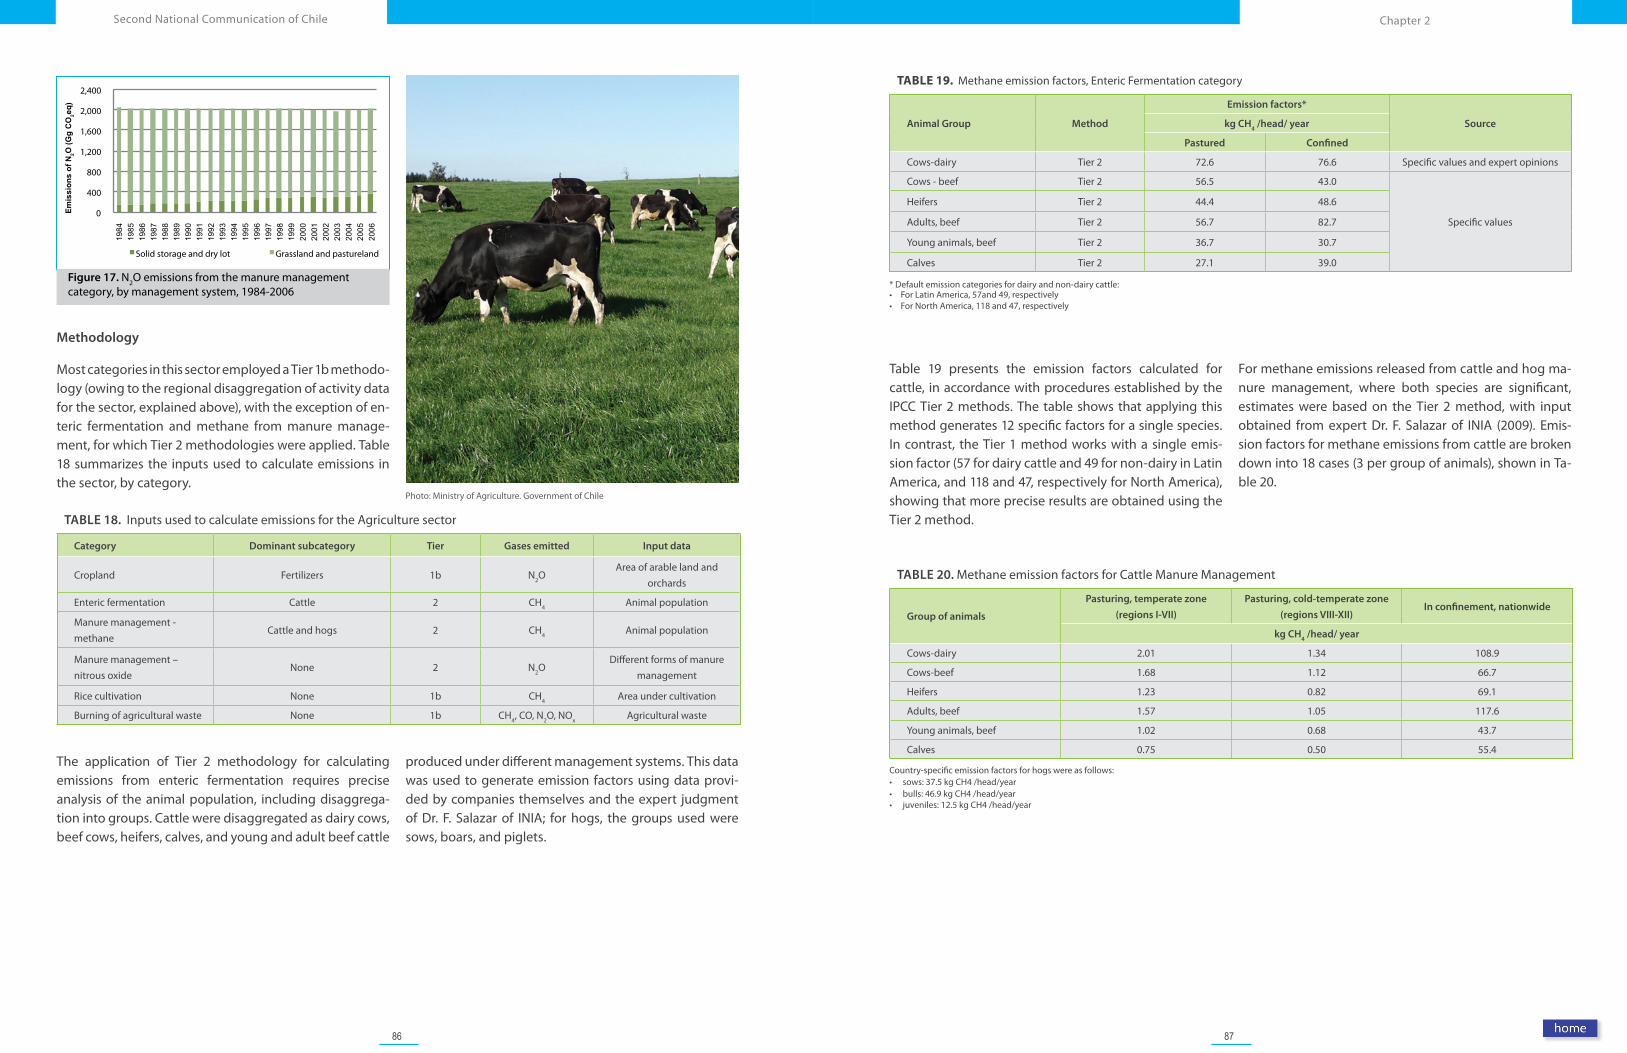
86 87
Chapter 2Second National Communication of Chile
TABLE 19. Methane emission factors, Enteric Fermentation category
Animal Group Method
Emission factors*
Sourcekg CH4 /head/ year
Pastured Confined
Cows-dairy Tier 2 72.6 76.6 Specific values and expert opinions
Cows - beef Tier 2 56.5 43.0
Specific values
Heifers Tier 2 44.4 48.6
Adults, beef Tier 2 56.7 82.7
Young animals, beef Tier 2 36.7 30.7
Calves Tier 2 27.1 39.0
* Default emission categories for dairy and non-dairy cattle:• For Latin America, 57and 49, respectively• For North America, 118 and 47, respectively
Table 19 presents the emission factors calculated for cattle, in accordance with procedures established by the IPCC Tier 2 methods. The table shows that applying this method generates 12 specific factors for a single species. In contrast, the Tier 1 method works with a single emis-sion factor (57 for dairy cattle and 49 for non-dairy in Latin America, and 118 and 47, respectively for North America), showing that more precise results are obtained using the Tier 2 method.
For methane emissions released from cattle and hog ma-nure management, where both species are significant, estimates were based on the Tier 2 method, with input obtained from expert Dr. F. Salazar of INIA (2009). Emis-sion factors for methane emissions from cattle are broken down into 18 cases (3 per group of animals), shown in Ta-ble 20.
TABLE 20. Methane emission factors for Cattle Manure Management
Group of animals
Pasturing, temperate zone
(regions I-VII)
Pasturing, cold-temperate zone
(regions VIII-XII)In confinement, nationwide
kg CH4 /head/ year
Cows-dairy 2.01 1.34 108.9
Cows-beef 1.68 1.12 66.7
Heifers 1.23 0.82 69.1
Adults, beef 1.57 1.05 117.6
Young animals, beef 1.02 0.68 43.7
Calves 0.75 0.50 55.4
Country-specific emission factors for hogs were as follows:• sows: 37.5 kg CH4 /head/year• bulls: 46.9 kg CH4 /head/year• juveniles: 12.5 kg CH4 /head/year
Figure 17. N2O emissions from the manure management category, by management system, 1984-2006
Photo: Ministry of Agriculture. Government of Chile
Methodology
Most categories in this sector employed a Tier 1b methodo-logy (owing to the regional disaggregation of activity data for the sector, explained above), with the exception of en-teric fermentation and methane from manure manage-ment, for which Tier 2 methodologies were applied. Table 18 summarizes the inputs used to calculate emissions in the sector, by category.
TABLE 18. Inputs used to calculate emissions for the Agriculture sector
Category Dominant subcategory Tier Gases emitted Input data
Cropland Fertilizers 1b N2OArea of arable land and
orchards
Enteric fermentation Cattle 2 CH4 Animal population
Manure management - methane
Cattle and hogs 2 CH4 Animal population
Manure management – nitrous oxide
None 2 N2ODifferent forms of manure
management
Rice cultivation None 1b CH4 Area under cultivation
Burning of agricultural waste None 1b CH4, CO, N2O, NOx Agricultural waste
The application of Tier 2 methodology for calculating emissions from enteric fermentation requires precise analysis of the animal population, including disaggrega-tion into groups. Cattle were disaggregated as dairy cows, beef cows, heifers, calves, and young and adult beef cattle
produced under different management systems. This data was used to generate emission factors using data provi-ded by companies themselves and the expert judgment of Dr. F. Salazar of INIA; for hogs, the groups used were sows, boars, and piglets.
0
400
800
1,200
1,600
2,000
2,400
1984
19
85
1986
19
87
1988
19
89
1990
19
91
1992
19
93
1994
19
95
1996
19
97
1998
19
99
2000
20
01
2002
20
03
2004
20
05
2006
Emis
sion
s of
N2O
(Gg
CO
2eq)
Solid storage and dry lot Grassland and pastureland
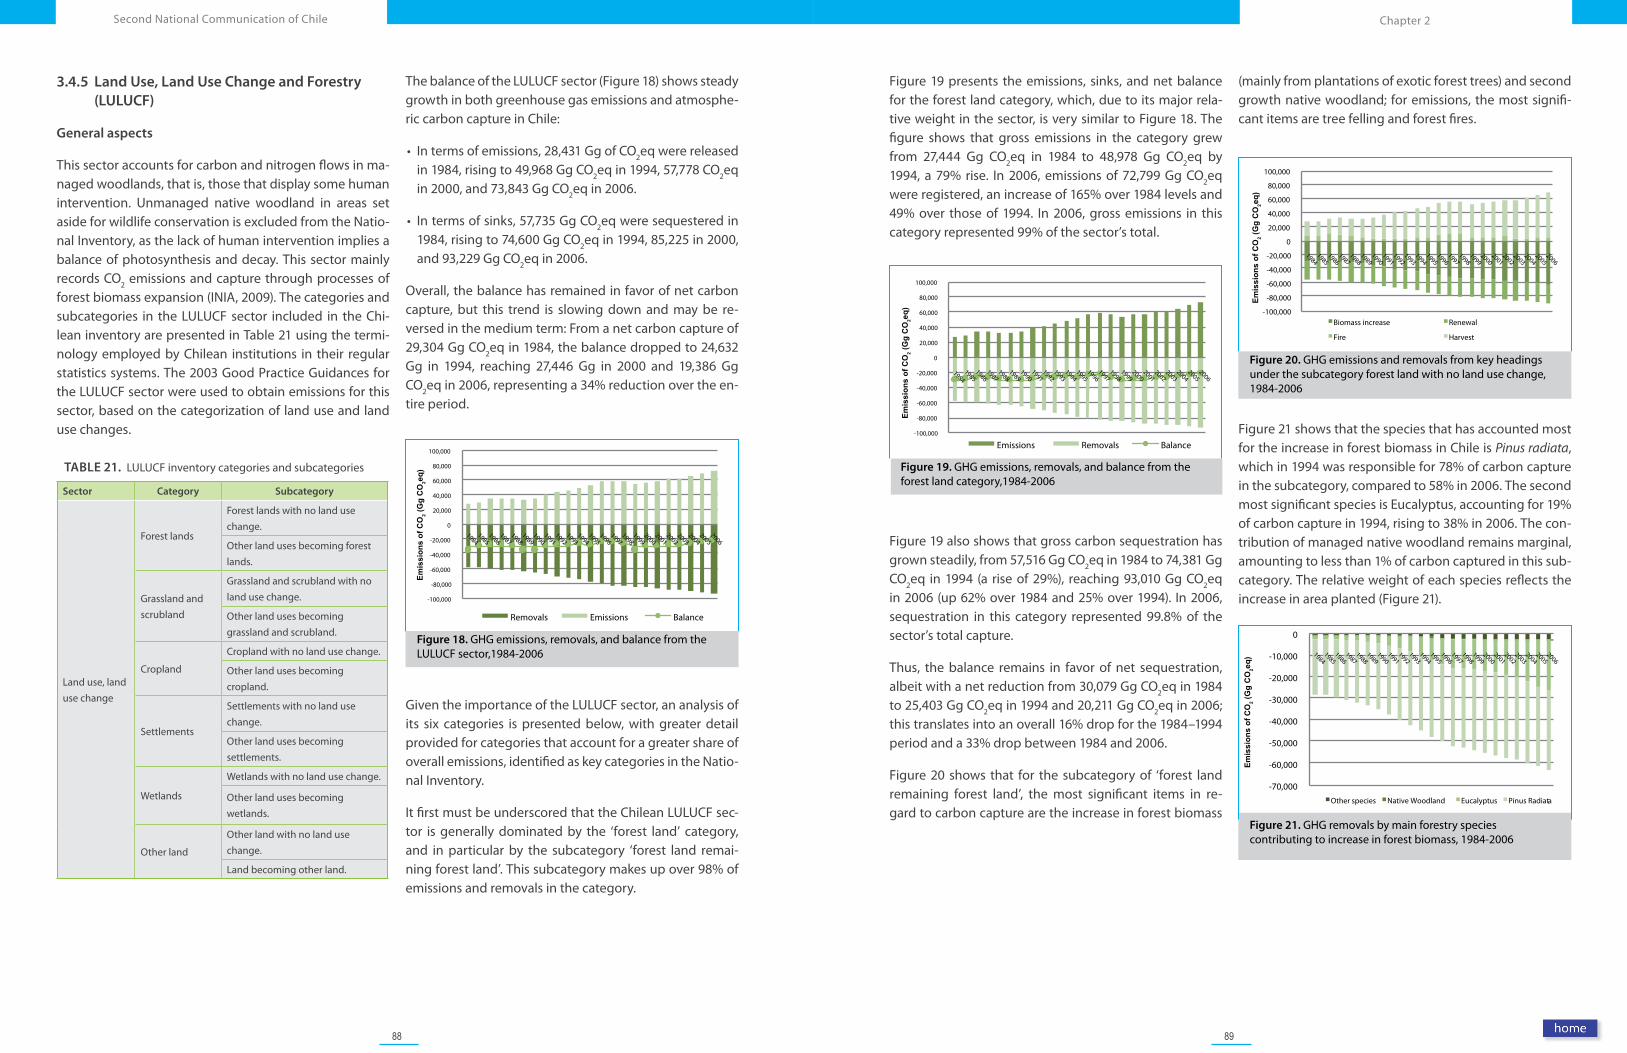
88 89
Chapter 2Second National Communication of Chile
Figure 19. GHG emissions, removals, and balance from the forest land category,1984-2006
Figure 20. GHG emissions and removals from key headings under the subcategory forest land with no land use change, 1984-2006
Figure 21. GHG removals by main forestry species contributing to increase in forest biomass, 1984-2006
Figure 19 presents the emissions, sinks, and net balance for the forest land category, which, due to its major rela-tive weight in the sector, is very similar to Figure 18. The figure shows that gross emissions in the category grew from 27,444 Gg CO2eq in 1984 to 48,978 Gg CO2eq by 1994, a 79% rise. In 2006, emissions of 72,799 Gg CO2eq were registered, an increase of 165% over 1984 levels and 49% over those of 1994. In 2006, gross emissions in this category represented 99% of the sector’s total.
Figure 19 also shows that gross carbon sequestration has grown steadily, from 57,516 Gg CO2eq in 1984 to 74,381 Gg CO2eq in 1994 (a rise of 29%), reaching 93,010 Gg CO2eq in 2006 (up 62% over 1984 and 25% over 1994). In 2006, sequestration in this category represented 99.8% of the sector’s total capture.
Thus, the balance remains in favor of net sequestration, albeit with a net reduction from 30,079 Gg CO2eq in 1984 to 25,403 Gg CO2eq in 1994 and 20,211 Gg CO2eq in 2006; this translates into an overall 16% drop for the 1984–1994 period and a 33% drop between 1984 and 2006.
Figure 20 shows that for the subcategory of ‘forest land remaining forest land’, the most significant items in re-gard to carbon capture are the increase in forest biomass
Figure 21 shows that the species that has accounted most for the increase in forest biomass in Chile is Pinus radiata, which in 1994 was responsible for 78% of carbon capture in the subcategory, compared to 58% in 2006. The second most significant species is Eucalyptus, accounting for 19% of carbon capture in 1994, rising to 38% in 2006. The con-tribution of managed native woodland remains marginal, amounting to less than 1% of carbon captured in this sub-category. The relative weight of each species reflects the increase in area planted (Figure 21).
(mainly from plantations of exotic forest trees) and second growth native woodland; for emissions, the most signifi-cant items are tree felling and forest fires.
Figure 18. GHG emissions, removals, and balance from the LULUCF sector,1984-2006
3.4.5 Land Use, Land Use Change and Forestry (LULUCF)
General aspects
This sector accounts for carbon and nitrogen flows in ma-naged woodlands, that is, those that display some human intervention. Unmanaged native woodland in areas set aside for wildlife conservation is excluded from the Natio-nal Inventory, as the lack of human intervention implies a balance of photosynthesis and decay. This sector mainly records CO2 emissions and capture through processes of forest biomass expansion (INIA, 2009). The categories and subcategories in the LULUCF sector included in the Chi-lean inventory are presented in Table 21 using the termi-nology employed by Chilean institutions in their regular statistics systems. The 2003 Good Practice Guidances for the LULUCF sector were used to obtain emissions for this sector, based on the categorization of land use and land use changes.
TABLE 21. LULUCF inventory categories and subcategories
Sector Category Subcategory
Land use, land use change
Forest lands
Forest lands with no land use change.
Other land uses becoming forest lands.
Grassland and scrubland
Grassland and scrubland with no land use change.
Other land uses becoming grassland and scrubland.
Cropland
Cropland with no land use change.
Other land uses becoming cropland.
Settlements
Settlements with no land use change.
Other land uses becoming settlements.
Wetlands
Wetlands with no land use change.
Other land uses becoming wetlands.
Other land
Other land with no land use change.
Land becoming other land.
The balance of the LULUCF sector (Figure 18) shows steady growth in both greenhouse gas emissions and atmosphe-ric carbon capture in Chile:
• In terms of emissions, 28,431 Gg of CO2eq were released in 1984, rising to 49,968 Gg CO2eq in 1994, 57,778 CO2eq in 2000, and 73,843 Gg CO2eq in 2006.
• In terms of sinks, 57,735 Gg CO2eq were sequestered in 1984, rising to 74,600 Gg CO2eq in 1994, 85,225 in 2000, and 93,229 Gg CO2eq in 2006.
Overall, the balance has remained in favor of net carbon capture, but this trend is slowing down and may be re-versed in the medium term: From a net carbon capture of 29,304 Gg CO2eq in 1984, the balance dropped to 24,632 Gg in 1994, reaching 27,446 Gg in 2000 and 19,386 Gg CO2eq in 2006, representing a 34% reduction over the en-tire period.
Given the importance of the LULUCF sector, an analysis of its six categories is presented below, with greater detail provided for categories that account for a greater share of overall emissions, identified as key categories in the Natio-nal Inventory.
It first must be underscored that the Chilean LULUCF sec-tor is generally dominated by the ‘forest land’ category, and in particular by the subcategory ‘forest land remai-ning forest land’. This subcategory makes up over 98% of emissions and removals in the category.
-100,000
-80,000
-60,000
-40,000
-20,000
0
20,000
40,000
60,000
80,000
100,000
19841985
19861987
19881989
19901991
19921993
19941995
19961997
19981999
20002001
20022003
20042005
2006
Emis
sion
s of
CO
2 (G
g C
O2e
q)
Removals Emissions Balance
-100,000
-80,000
-60,000
-40,000
-20,000
0
20,000
40,000
60,000
80,000
100,000
19841985
19861987
19881989
19901991
19921993
19941995
19961997
19981999
20002001
20022003
20042005
2006
Emissions Removals Balance
Emis
sion
s of
CO
2 (G
g C
O2e
q) -100,000
-80,000
-60,000
-40,000
-20,000
0
20,000
40,000
60,000
80,000
100,000
19841985
19861987
19881989
19901991
19921993
19941995
19961997
19981999
20002001
20022003
20042005
2006
Biomass increase Renewal
Fire Harvest
Emis
sion
s of
CO
2 (G
g C
O2e
q)
-70,000
-60,000
-50,000
-40,000
-30,000
-20,000
-10,000
0
19841985
19861987
19881989
19901991
19921993
19941995
19961997
19981999
20002001
20022003
20042005
2006
Other species Native Woodland Eucalyptus Pinus Radiata
Emis
sion
s of
CO
2 (G
g C
O2e
q)
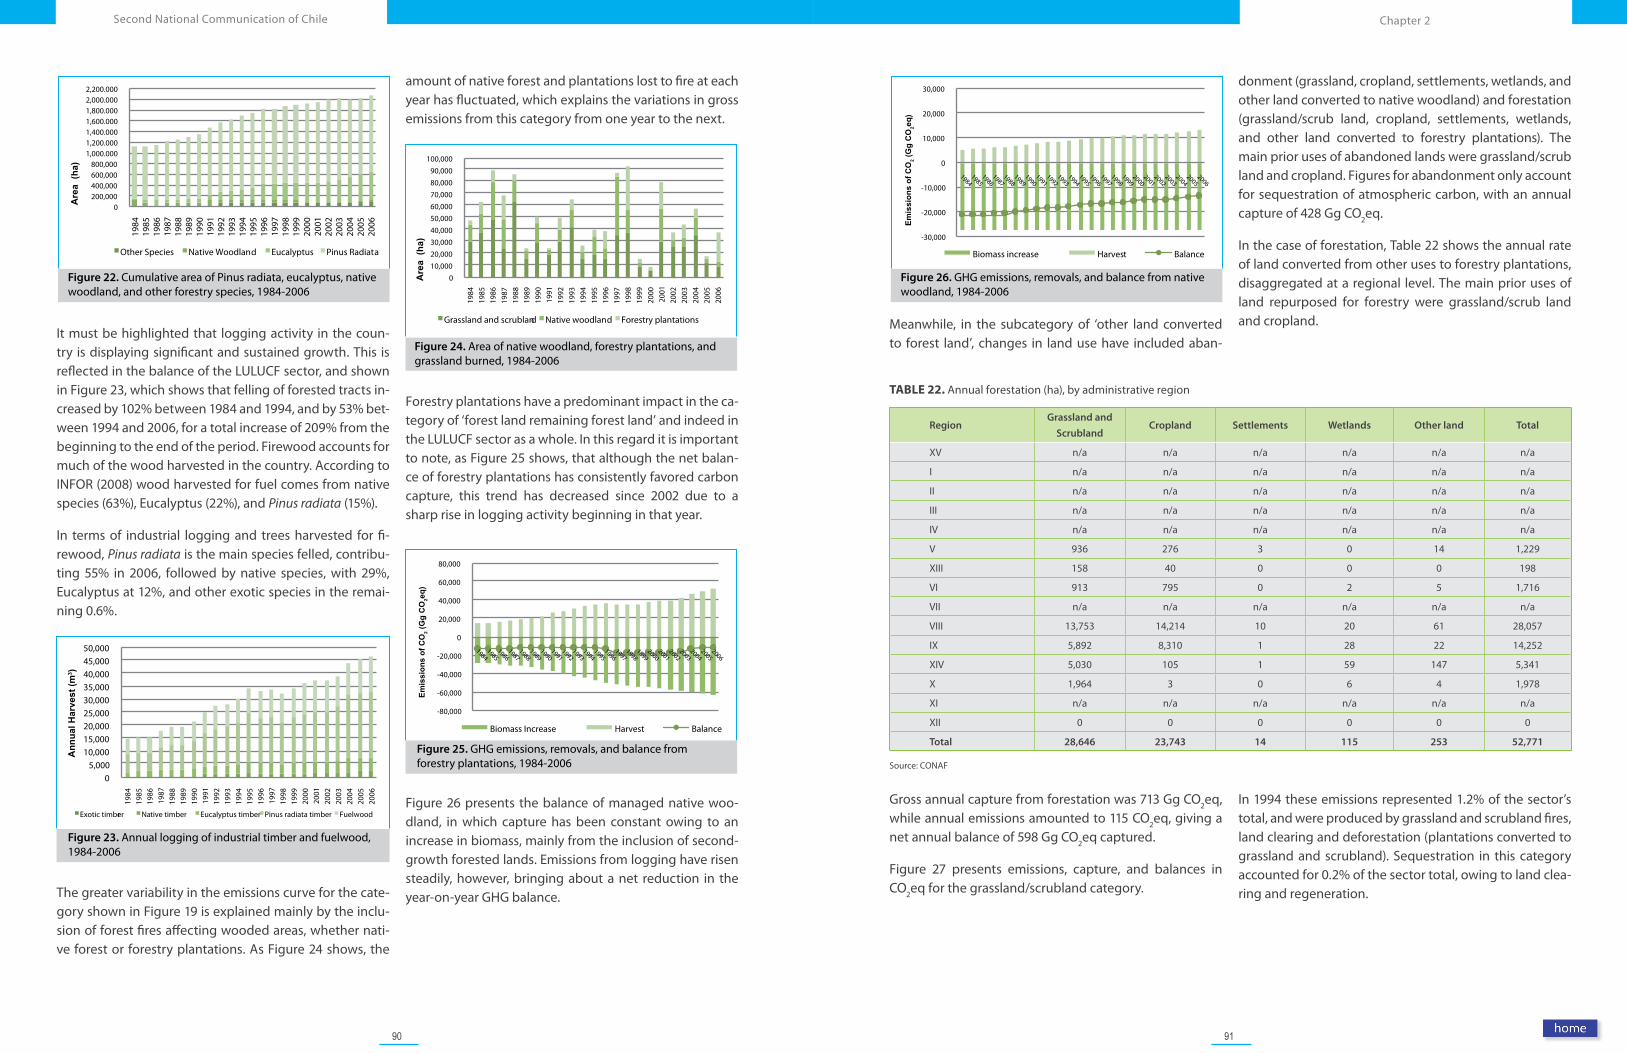
90 91
Chapter 2Second National Communication of Chile
Figure 26. GHG emissions, removals, and balance from native woodland, 1984-2006
TABLE 22. Annual forestation (ha), by administrative region
RegionGrassland and
ScrublandCropland Settlements Wetlands Other land Total
XV n/a n/a n/a n/a n/a n/a
I n/a n/a n/a n/a n/a n/a
II n/a n/a n/a n/a n/a n/a
III n/a n/a n/a n/a n/a n/a
IV n/a n/a n/a n/a n/a n/a
V 936 276 3 0 14 1,229
XIII 158 40 0 0 0 198
VI 913 795 0 2 5 1,716
VII n/a n/a n/a n/a n/a n/a
VIII 13,753 14,214 10 20 61 28,057
IX 5,892 8,310 1 28 22 14,252
XIV 5,030 105 1 59 147 5,341
X 1,964 3 0 6 4 1,978
XI n/a n/a n/a n/a n/a n/a
XII 0 0 0 0 0 0
Total 28,646 23,743 14 115 253 52,771
Source: CONAF
Meanwhile, in the subcategory of ‘other land converted to forest land’, changes in land use have included aban-
donment (grassland, cropland, settlements, wetlands, and other land converted to native woodland) and forestation (grassland/scrub land, cropland, settlements, wetlands, and other land converted to forestry plantations). The main prior uses of abandoned lands were grassland/scrub land and cropland. Figures for abandonment only account for sequestration of atmospheric carbon, with an annual capture of 428 Gg CO2eq.
In the case of forestation, Table 22 shows the annual rate of land converted from other uses to forestry plantations, disaggregated at a regional level. The main prior uses of land repurposed for forestry were grassland/scrub land and cropland.
Gross annual capture from forestation was 713 Gg CO2eq, while annual emissions amounted to 115 CO2eq, giving a net annual balance of 598 Gg CO2eq captured.
Figure 27 presents emissions, capture, and balances in CO2eq for the grassland/scrubland category.
In 1994 these emissions represented 1.2% of the sector’s total, and were produced by grassland and scrubland fires, land clearing and deforestation (plantations converted to grassland and scrubland). Sequestration in this category accounted for 0.2% of the sector total, owing to land clea-ring and regeneration.
Figure 22. Cumulative area of Pinus radiata, eucalyptus, native woodland, and other forestry species, 1984-2006
Figure 23. Annual logging of industrial timber and fuelwood, 1984-2006
Figure 25. GHG emissions, removals, and balance from forestry plantations, 1984-2006
It must be highlighted that logging activity in the coun-try is displaying significant and sustained growth. This is reflected in the balance of the LULUCF sector, and shown in Figure 23, which shows that felling of forested tracts in-creased by 102% between 1984 and 1994, and by 53% bet-ween 1994 and 2006, for a total increase of 209% from the beginning to the end of the period. Firewood accounts for much of the wood harvested in the country. According to INFOR (2008) wood harvested for fuel comes from native species (63%), Eucalyptus (22%), and Pinus radiata (15%).
In terms of industrial logging and trees harvested for fi-rewood, Pinus radiata is the main species felled, contribu-ting 55% in 2006, followed by native species, with 29%, Eucalyptus at 12%, and other exotic species in the remai-ning 0.6%.
The greater variability in the emissions curve for the cate-gory shown in Figure 19 is explained mainly by the inclu-sion of forest fires affecting wooded areas, whether nati-ve forest or forestry plantations. As Figure 24 shows, the
amount of native forest and plantations lost to fire at each year has fluctuated, which explains the variations in gross emissions from this category from one year to the next.
Forestry plantations have a predominant impact in the ca-tegory of ‘forest land remaining forest land’ and indeed in the LULUCF sector as a whole. In this regard it is important to note, as Figure 25 shows, that although the net balan-ce of forestry plantations has consistently favored carbon capture, this trend has decreased since 2002 due to a sharp rise in logging activity beginning in that year.
Figure 26 presents the balance of managed native woo-dland, in which capture has been constant owing to an increase in biomass, mainly from the inclusion of second-growth forested lands. Emissions from logging have risen steadily, however, bringing about a net reduction in the year-on-year GHG balance.
Figure 24. Area of native woodland, forestry plantations, and grassland burned, 1984-2006
0 200,000 400,000 600,000 800,000
1,000.000 1,200.000 1,400.000 1,600.000 1,800.000 2,000.000 2,200.000
1984
19
85
1986
19
87
1988
19
89
1990
19
91
1992
19
93
1994
19
95
1996
19
97
1998
19
99
2000
20
01
2002
20
03
2004
20
05
2006
Are
a (h
a)
Other Species Native Woodland Eucalyptus Pinus Radiata
0 5,000
10,000 15,000 20,000 25,000 30,000 35,000 40,000 45,000 50,000
1984
19
85
1986
19
87
1988
19
89
1990
19
91
1992
19
93
1994
19
95
1996
19
97
1998
19
99
2000
20
01
2002
20
03
2004
20
05
2006
Ann
ual H
arve
st (m
3 )
Exotic timberr Native timber Eucalyptus timber Pinus radiata timber Fuelwood
0 10,000 20,000 30,000 40,000 50,000 60,000 70,000 80,000 90,000
100,000
1984
19
85
1986
19
87
1988
19
89
1990
19
91
1992
19
93
1994
19
95
1996
19
97
1998
19
99
2000
20
01
2002
20
03
2004
20
05
2006
Are
a (h
a)
Grassland and scrubland Native woodland Forestry plantations
-80,000
-60,000
-40,000
-20,000
0
20,000
40,000
60,000
80,000
19841985
19861987
19881989
19901991
19921993
19941995
19961997
19981999
20002001
20022003
20042005
2006
Biomass Increase Harvest Balance
Emis
sion
s of
CO
2 (G
g C
O2e
q)
-30,000
-20,000
-10,000
0
10,000
20,000
30,000
19841985
19861987
19881989
19901991
19921993
19941995
19961997
19981999
20002001
20022003
20042005
2006
Biomass increase Harvest Balance
Emis
sion
s of
CO
2 (G
g C
O2e
q)
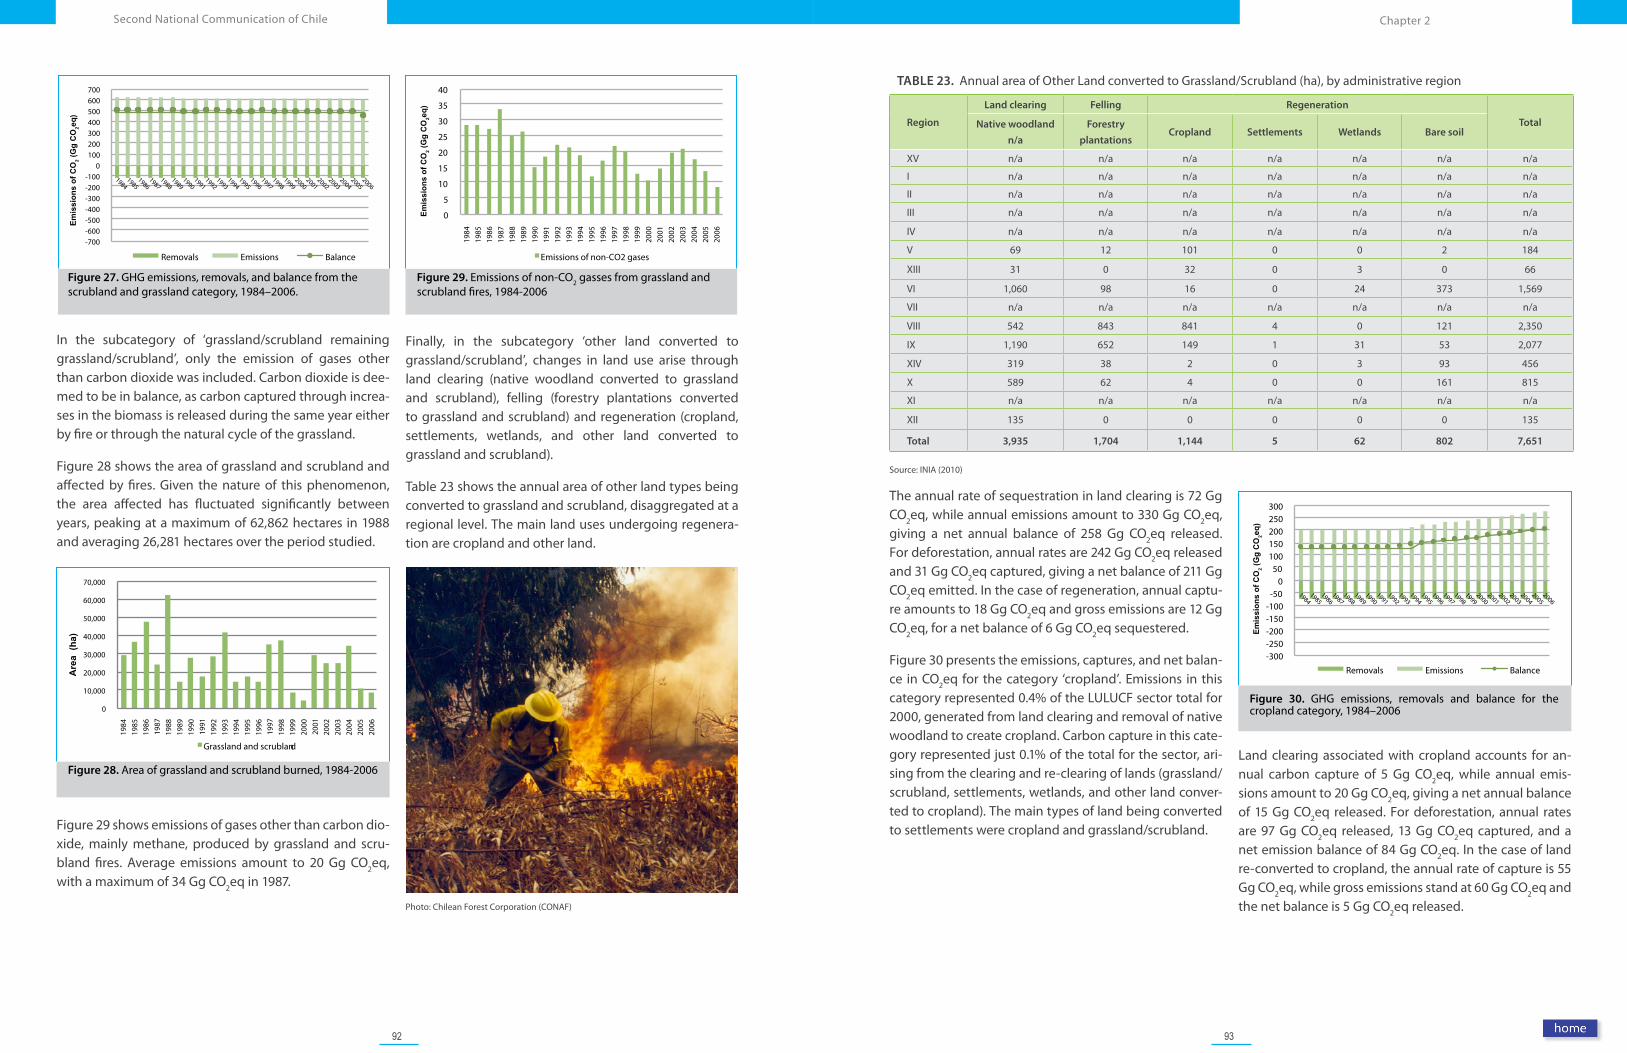
92 93
Chapter 2Second National Communication of Chile
-300 -250 -200 -150 -100
-50 0
50 100 150 200 250 300
19841985
19861987
19881989
19901991
19921993
19941995
19961997
19981999
20002001
20022003
20042005
2006
Removals Emissions Balance
Emis
sion
s of
CO
2 (G
g C
O2e
q)
Figure 30. GHG emissions, removals and balance for the cropland category, 1984–2006
TABLE 23. Annual area of Other Land converted to Grassland/Scrubland (ha), by administrative region
Region
Land clearing Felling Regeneration
TotalNative woodland
n/a
Forestry
plantationsCropland Settlements Wetlands Bare soil
XV n/a n/a n/a n/a n/a n/a n/a
I n/a n/a n/a n/a n/a n/a n/a
II n/a n/a n/a n/a n/a n/a n/a
III n/a n/a n/a n/a n/a n/a n/a
IV n/a n/a n/a n/a n/a n/a n/a
V 69 12 101 0 0 2 184
XIII 31 0 32 0 3 0 66
VI 1,060 98 16 0 24 373 1,569
VII n/a n/a n/a n/a n/a n/a n/a
VIII 542 843 841 4 0 121 2,350
IX 1,190 652 149 1 31 53 2,077
XIV 319 38 2 0 3 93 456
X 589 62 4 0 0 161 815
XI n/a n/a n/a n/a n/a n/a n/a
XII 135 0 0 0 0 0 135
Total 3,935 1,704 1,144 5 62 802 7,651
Source: INIA (2010)
The annual rate of sequestration in land clearing is 72 Gg CO2eq, while annual emissions amount to 330 Gg CO2eq, giving a net annual balance of 258 Gg CO2eq released. For deforestation, annual rates are 242 Gg CO2eq released and 31 Gg CO2eq captured, giving a net balance of 211 Gg CO2eq emitted. In the case of regeneration, annual captu-re amounts to 18 Gg CO2eq and gross emissions are 12 Gg CO2eq, for a net balance of 6 Gg CO2eq sequestered.
Figure 30 presents the emissions, captures, and net balan-ce in CO2eq for the category ‘cropland’. Emissions in this category represented 0.4% of the LULUCF sector total for 2000, generated from land clearing and removal of native woodland to create cropland. Carbon capture in this cate-gory represented just 0.1% of the total for the sector, ari-sing from the clearing and re-clearing of lands (grassland/scrubland, settlements, wetlands, and other land conver-ted to cropland). The main types of land being converted to settlements were cropland and grassland/scrubland.
Land clearing associated with cropland accounts for an-nual carbon capture of 5 Gg CO2eq, while annual emis-sions amount to 20 Gg CO2eq, giving a net annual balance of 15 Gg CO2eq released. For deforestation, annual rates are 97 Gg CO2eq released, 13 Gg CO2eq captured, and a net emission balance of 84 Gg CO2eq. In the case of land re-converted to cropland, the annual rate of capture is 55 Gg CO2eq, while gross emissions stand at 60 Gg CO2eq and the net balance is 5 Gg CO2eq released.
-700 -600 -500 -400 -300 -200 -100
0 100 200 300 400 500 600 700
19841985
19861987
19881989
19901991
19921993
19941995
19961997
19981999
20002001
20022003
20042005
2006
Removals Emissions Balance
Emis
sion
s of
CO
2 (G
g C
O2e
q)
-700 -600 -500 -400 -300 -200 -100
0 100 200 300 400 500 600 700
19841985
19861987
19881989
19901991
19921993
19941995
19961997
19981999
20002001
20022003
20042005
2006
Removals Emissions Balance
Emis
sion
s of
CO
2 (G
g C
O2e
q)
Figure 27. GHG emissions, removals, and balance from the scrubland and grassland category, 1984–2006.
Figure 28. Area of grassland and scrubland burned, 1984-2006
0
5
10
15
20
25
30
35
40
1984
19
85
1986
19
87
1988
19
89
1990
19
91
1992
19
93
1994
19
95
1996
19
97
1998
19
99
2000
20
01
2002
20
03
2004
20
05
2006
Emissions of non-CO2 gases
Emis
sion
s of
CO
2 (G
g C
O2e
q)
Figure 29. Emissions of non-CO2 gasses from grassland and scrubland fires, 1984-2006
Photo: Chilean Forest Corporation (CONAF)
In the subcategory of ‘grassland/scrubland remaining grassland/scrubland’, only the emission of gases other than carbon dioxide was included. Carbon dioxide is dee-med to be in balance, as carbon captured through increa-ses in the biomass is released during the same year either by fire or through the natural cycle of the grassland.
Figure 28 shows the area of grassland and scrubland and affected by fires. Given the nature of this phenomenon, the area affected has fluctuated significantly between years, peaking at a maximum of 62,862 hectares in 1988 and averaging 26,281 hectares over the period studied.
Figure 29 shows emissions of gases other than carbon dio-xide, mainly methane, produced by grassland and scru-bland fires. Average emissions amount to 20 Gg CO2eq, with a maximum of 34 Gg CO2eq in 1987.
Finally, in the subcategory ‘other land converted to grassland/scrubland’, changes in land use arise through land clearing (native woodland converted to grassland and scrubland), felling (forestry plantations converted to grassland and scrubland) and regeneration (cropland, settlements, wetlands, and other land converted to grassland and scrubland).
Table 23 shows the annual area of other land types being converted to grassland and scrubland, disaggregated at a regional level. The main land uses undergoing regenera-tion are cropland and other land.
0
10,000
20,000
30,000
40,000
50,000
60,000
70,000
1984
19
85
1986
19
87
1988
19
89
1990
19
91
1992
19
93
1994
19
95
1996
19
97
1998
19
99
2000
20
01
2002
20
03
2004
20
05
2006
Are
a (h
a)
Grassland and scrubland
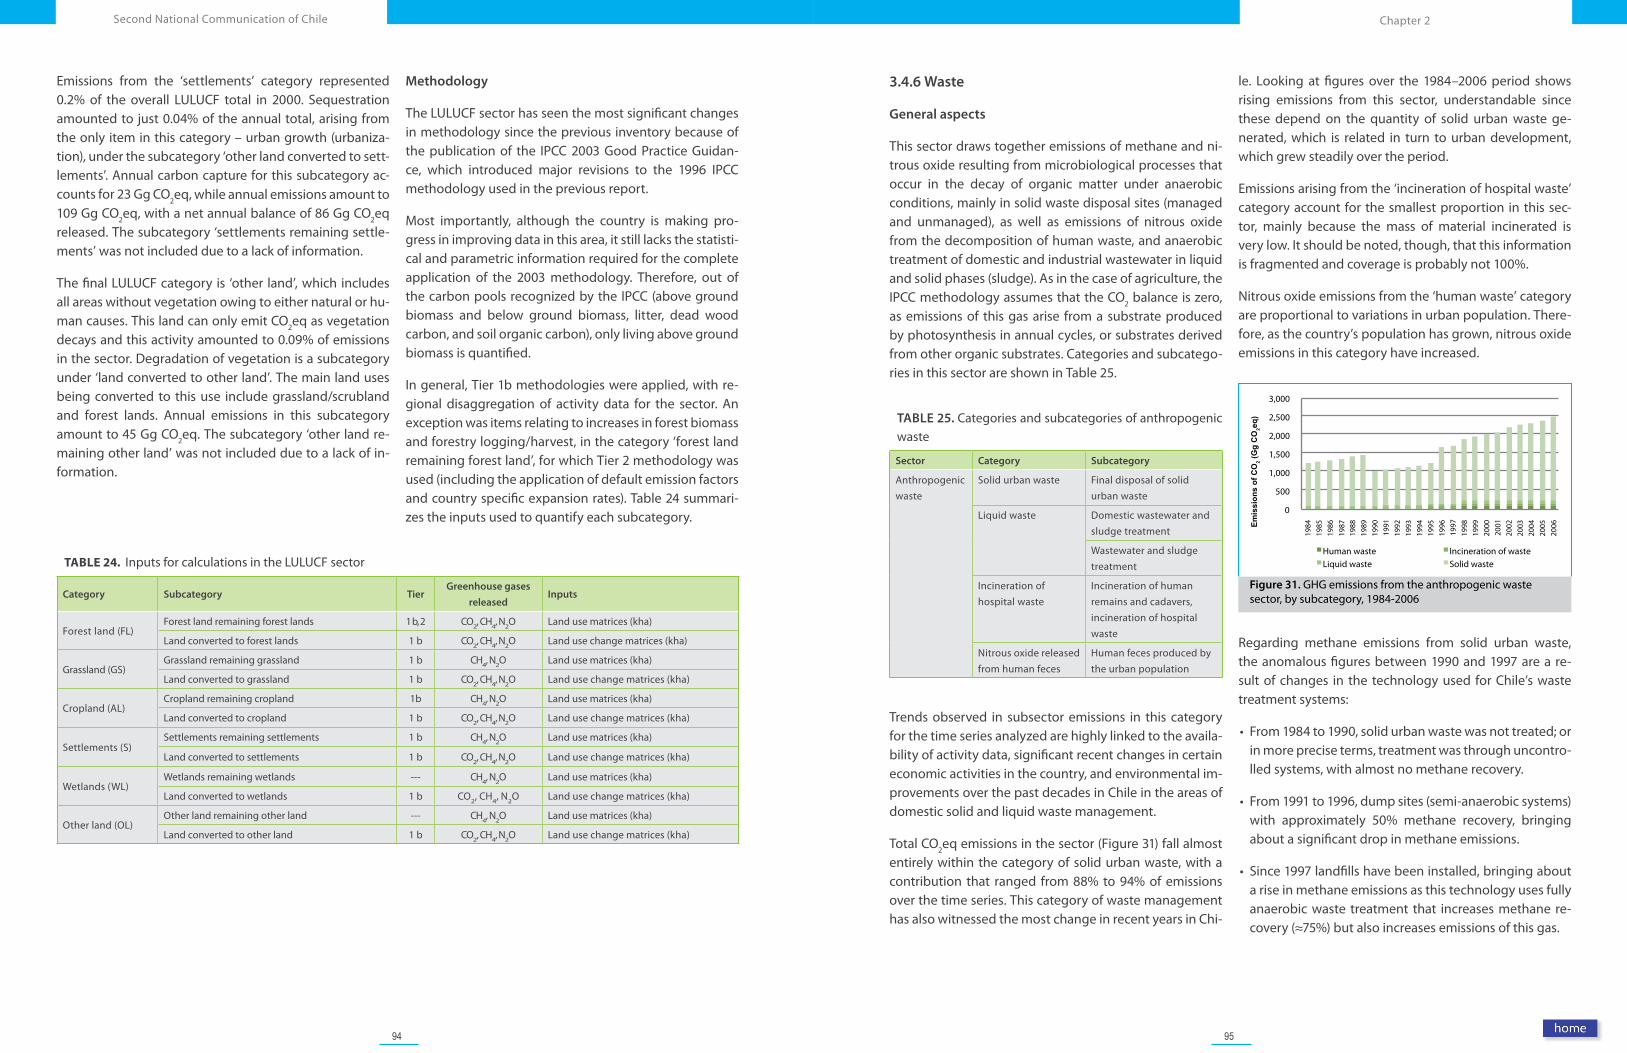
94 95
Chapter 2Second National Communication of Chile
Figure 31. GHG emissions from the anthropogenic waste sector, by subcategory, 1984-2006
3.4.6 Waste
General aspects
This sector draws together emissions of methane and ni-trous oxide resulting from microbiological processes that occur in the decay of organic matter under anaerobic conditions, mainly in solid waste disposal sites (managed and unmanaged), as well as emissions of nitrous oxide from the decomposition of human waste, and anaerobic treatment of domestic and industrial wastewater in liquid and solid phases (sludge). As in the case of agriculture, the IPCC methodology assumes that the CO2 balance is zero, as emissions of this gas arise from a substrate produced by photosynthesis in annual cycles, or substrates derived from other organic substrates. Categories and subcatego-ries in this sector are shown in Table 25.
TABLE 25. Categories and subcategories of anthropogenic waste
Sector Category Subcategory
Anthropogenic waste
Solid urban waste Final disposal of solid urban waste
Liquid waste Domestic wastewater and sludge treatment
Wastewater and sludge treatment
Incineration of hospital waste
Incineration of human remains and cadavers, incineration of hospital waste
Nitrous oxide released from human feces
Human feces produced by the urban population
Trends observed in subsector emissions in this category for the time series analyzed are highly linked to the availa-bility of activity data, significant recent changes in certain economic activities in the country, and environmental im-provements over the past decades in Chile in the areas of domestic solid and liquid waste management.
Total CO2eq emissions in the sector (Figure 31) fall almost entirely within the category of solid urban waste, with a contribution that ranged from 88% to 94% of emissions over the time series. This category of waste management has also witnessed the most change in recent years in Chi-
Regarding methane emissions from solid urban waste, the anomalous figures between 1990 and 1997 are a re-sult of changes in the technology used for Chile’s waste treatment systems:
• From 1984 to 1990, solid urban waste was not treated; or in more precise terms, treatment was through uncontro-lled systems, with almost no methane recovery.
• From 1991 to 1996, dump sites (semi-anaerobic systems) with approximately 50% methane recovery, bringing about a significant drop in methane emissions.
• Since 1997 landfills have been installed, bringing about a rise in methane emissions as this technology uses fully anaerobic waste treatment that increases methane re-covery (≈75%) but also increases emissions of this gas.
le. Looking at figures over the 1984–2006 period shows rising emissions from this sector, understandable since these depend on the quantity of solid urban waste ge-nerated, which is related in turn to urban development, which grew steadily over the period.
Emissions arising from the ‘incineration of hospital waste’ category account for the smallest proportion in this sec-tor, mainly because the mass of material incinerated is very low. It should be noted, though, that this information is fragmented and coverage is probably not 100%.
Nitrous oxide emissions from the ‘human waste’ category are proportional to variations in urban population. There-fore, as the country’s population has grown, nitrous oxide emissions in this category have increased.
Emissions from the ‘settlements’ category represented 0.2% of the overall LULUCF total in 2000. Sequestration amounted to just 0.04% of the annual total, arising from the only item in this category – urban growth (urbaniza-tion), under the subcategory ‘other land converted to sett-lements’. Annual carbon capture for this subcategory ac-counts for 23 Gg CO2eq, while annual emissions amount to 109 Gg CO2eq, with a net annual balance of 86 Gg CO2eq released. The subcategory ‘settlements remaining settle-ments’ was not included due to a lack of information.
The final LULUCF category is ‘other land’, which includes all areas without vegetation owing to either natural or hu-man causes. This land can only emit CO2eq as vegetation decays and this activity amounted to 0.09% of emissions in the sector. Degradation of vegetation is a subcategory under ‘land converted to other land’. The main land uses being converted to this use include grassland/scrubland and forest lands. Annual emissions in this subcategory amount to 45 Gg CO2eq. The subcategory ‘other land re-maining other land’ was not included due to a lack of in-formation.
Methodology
The LULUCF sector has seen the most significant changes in methodology since the previous inventory because of the publication of the IPCC 2003 Good Practice Guidan-ce, which introduced major revisions to the 1996 IPCC methodology used in the previous report.
Most importantly, although the country is making pro-gress in improving data in this area, it still lacks the statisti-cal and parametric information required for the complete application of the 2003 methodology. Therefore, out of the carbon pools recognized by the IPCC (above ground biomass and below ground biomass, litter, dead wood carbon, and soil organic carbon), only living above ground biomass is quantified.
In general, Tier 1b methodologies were applied, with re-gional disaggregation of activity data for the sector. An exception was items relating to increases in forest biomass and forestry logging/harvest, in the category ‘forest land remaining forest land’, for which Tier 2 methodology was used (including the application of default emission factors and country specific expansion rates). Table 24 summari-zes the inputs used to quantify each subcategory.
TABLE 24. Inputs for calculations in the LULUCF sector
Category Subcategory TierGreenhouse gases
releasedInputs
Forest land (FL)Forest land remaining forest lands 1 b, 2 CO2, CH4, N2O Land use matrices (kha)
Land converted to forest lands 1 b CO2, CH4, N2O Land use change matrices (kha)
Grassland (GS)Grassland remaining grassland 1 b CH4, N2O Land use matrices (kha)
Land converted to grassland 1 b CO2, CH4, N2O Land use change matrices (kha)
Cropland (AL)Cropland remaining cropland 1b CH4, N2O Land use matrices (kha)
Land converted to cropland 1 b CO2, CH4, N2O Land use change matrices (kha)
Settlements (S)Settlements remaining settlements 1 b CH4, N2O Land use matrices (kha)
Land converted to settlements 1 b CO2, CH4, N2O Land use change matrices (kha)
Wetlands (WL)Wetlands remaining wetlands --- CH4, N2O Land use matrices (kha)
Land converted to wetlands 1 b CO2, CH4, N2O Land use change matrices (kha)
Other land (OL)Other land remaining other land --- CH4, N2O Land use matrices (kha)
Land converted to other land 1 b CO2, CH4, N2O Land use change matrices (kha)
0
500
1,000
1,500
2,000
2,500
3,000
1984
19
85
1986
19
87
1988
19
89
1990
19
91
1992
19
93
1994
19
95
1996
19
97
1998
19
99
2000
20
01
2002
20
03
2004
20
05
2006
Human waste Incineration of wasteLiquid waste Solid waste
Emis
sion
s of
CO
2 (G
g C
O2e
q)
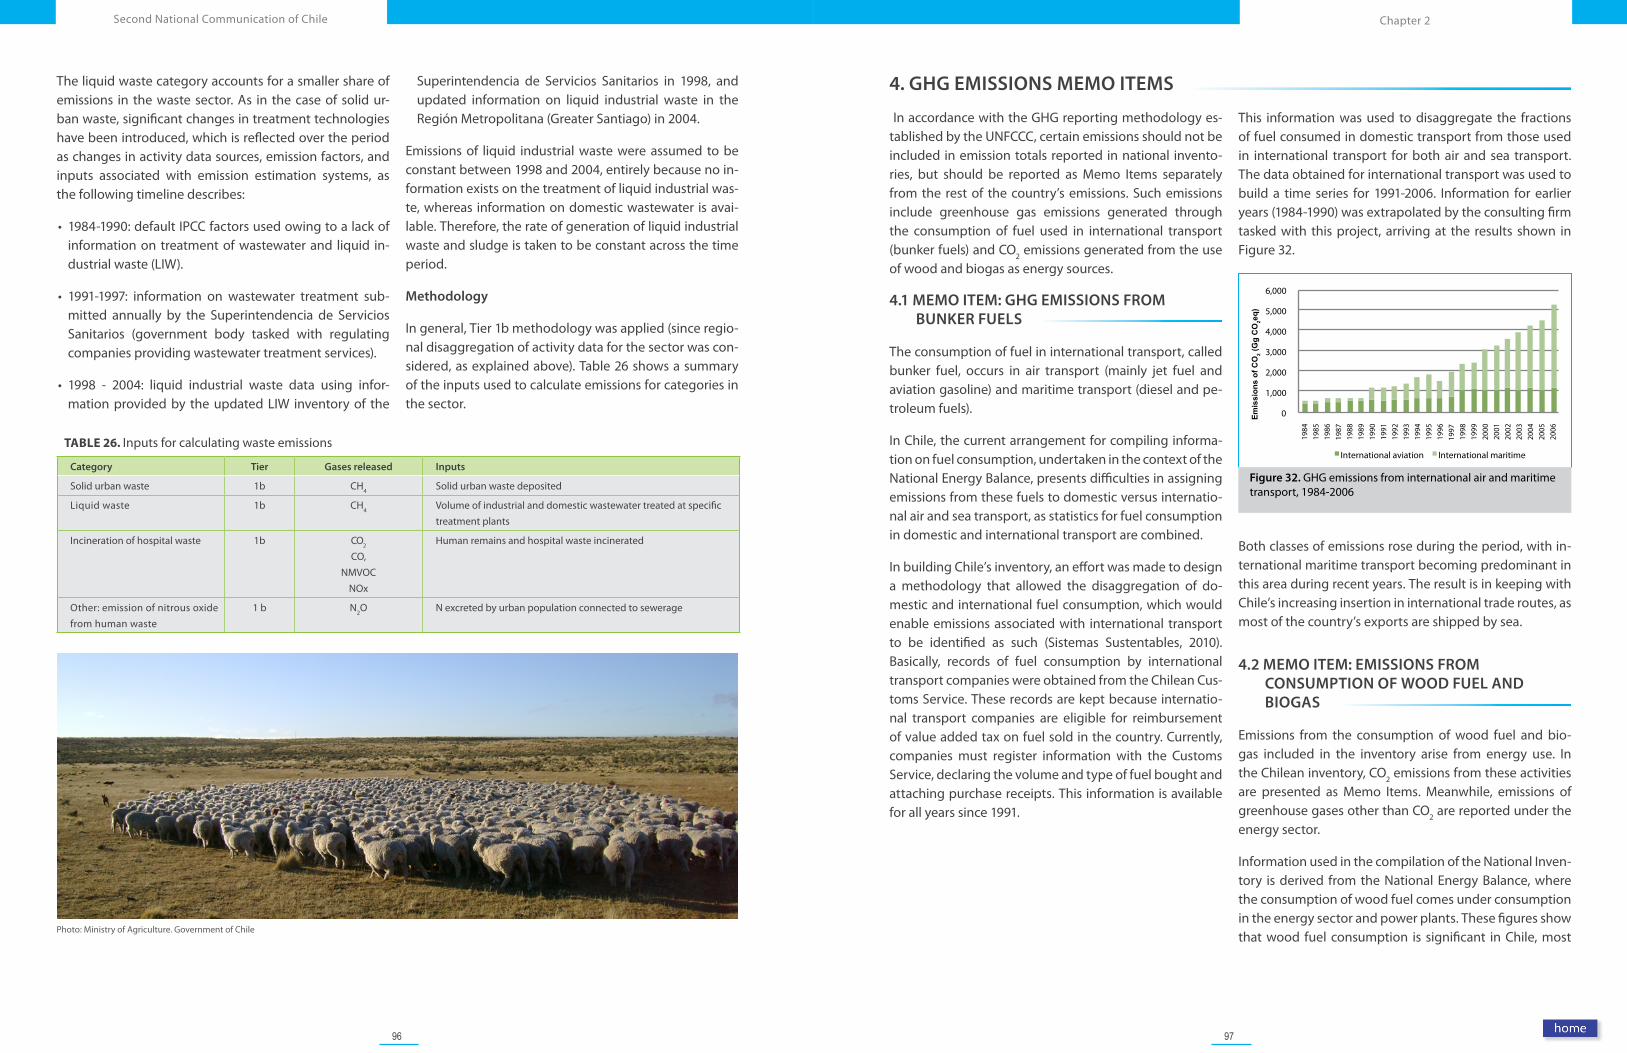
96 97
Chapter 2Second National Communication of Chile
Figure 32. GHG emissions from international air and maritime transport, 1984-2006
4. GHG EMISSIONS MEMO ITEMS
In accordance with the GHG reporting methodology es-tablished by the UNFCCC, certain emissions should not be included in emission totals reported in national invento-ries, but should be reported as Memo Items separately from the rest of the country’s emissions. Such emissions include greenhouse gas emissions generated through the consumption of fuel used in international transport (bunker fuels) and CO2 emissions generated from the use of wood and biogas as energy sources.
4.1 MEMO ITEM: GHG EMISSIONS FROM BUNKER FUELS
The consumption of fuel in international transport, called bunker fuel, occurs in air transport (mainly jet fuel and aviation gasoline) and maritime transport (diesel and pe-troleum fuels).
In Chile, the current arrangement for compiling informa-tion on fuel consumption, undertaken in the context of the National Energy Balance, presents difficulties in assigning emissions from these fuels to domestic versus internatio-nal air and sea transport, as statistics for fuel consumption in domestic and international transport are combined.
In building Chile’s inventory, an effort was made to design a methodology that allowed the disaggregation of do-mestic and international fuel consumption, which would enable emissions associated with international transport to be identified as such (Sistemas Sustentables, 2010). Basically, records of fuel consumption by international transport companies were obtained from the Chilean Cus-toms Service. These records are kept because internatio-nal transport companies are eligible for reimbursement of value added tax on fuel sold in the country. Currently, companies must register information with the Customs Service, declaring the volume and type of fuel bought and attaching purchase receipts. This information is available for all years since 1991.
Both classes of emissions rose during the period, with in-ternational maritime transport becoming predominant in this area during recent years. The result is in keeping with Chile’s increasing insertion in international trade routes, as most of the country’s exports are shipped by sea.
4.2 MEMO ITEM: EMISSIONS FROM CONSUMPTION OF WOOD FUEL AND BIOGAS
Emissions from the consumption of wood fuel and bio-gas included in the inventory arise from energy use. In the Chilean inventory, CO2 emissions from these activities are presented as Memo Items. Meanwhile, emissions of greenhouse gases other than CO2 are reported under the energy sector.
Information used in the compilation of the National Inven-tory is derived from the National Energy Balance, where the consumption of wood fuel comes under consumption in the energy sector and power plants. These figures show that wood fuel consumption is significant in Chile, most
This information was used to disaggregate the fractions of fuel consumed in domestic transport from those used in international transport for both air and sea transport. The data obtained for international transport was used to build a time series for 1991-2006. Information for earlier years (1984-1990) was extrapolated by the consulting firm tasked with this project, arriving at the results shown in Figure 32.
Photo: Ministry of Agriculture. Government of Chile
The liquid waste category accounts for a smaller share of emissions in the waste sector. As in the case of solid ur-ban waste, significant changes in treatment technologies have been introduced, which is reflected over the period as changes in activity data sources, emission factors, and inputs associated with emission estimation systems, as the following timeline describes:
• 1984-1990: default IPCC factors used owing to a lack of information on treatment of wastewater and liquid in-dustrial waste (LIW).
• 1991-1997: information on wastewater treatment sub-mitted annually by the Superintendencia de Servicios Sanitarios (government body tasked with regulating companies providing wastewater treatment services).
• 1998 - 2004: liquid industrial waste data using infor-mation provided by the updated LIW inventory of the
Superintendencia de Servicios Sanitarios in 1998, and updated information on liquid industrial waste in the Región Metropolitana (Greater Santiago) in 2004.
Emissions of liquid industrial waste were assumed to be constant between 1998 and 2004, entirely because no in-formation exists on the treatment of liquid industrial was-te, whereas information on domestic wastewater is avai-lable. Therefore, the rate of generation of liquid industrial waste and sludge is taken to be constant across the time period.
Methodology
In general, Tier 1b methodology was applied (since regio-nal disaggregation of activity data for the sector was con-sidered, as explained above). Table 26 shows a summary of the inputs used to calculate emissions for categories in the sector.
TABLE 26. Inputs for calculating waste emissions
Category Tier Gases released Inputs
Solid urban waste 1b CH4 Solid urban waste deposited
Liquid waste 1b CH4 Volume of industrial and domestic wastewater treated at specific treatment plants
Incineration of hospital waste 1b CO2
CO,NMVOC
NOx
Human remains and hospital waste incinerated
Other: emission of nitrous oxide from human waste
1 b N2O N excreted by urban population connected to sewerage
0
1,000
2,000
3,000
4,000
5,000
6,000
1984
19
85
1986
19
87
1988
19
89
1990
19
91
1992
19
93
1994
19
95
1996
19
97
1998
19
99
2000
20
01
2002
20
03
2004
20
05
2006
International aviation International maritime
Emis
sion
s of
CO
2 (G
g C
O2e
q)
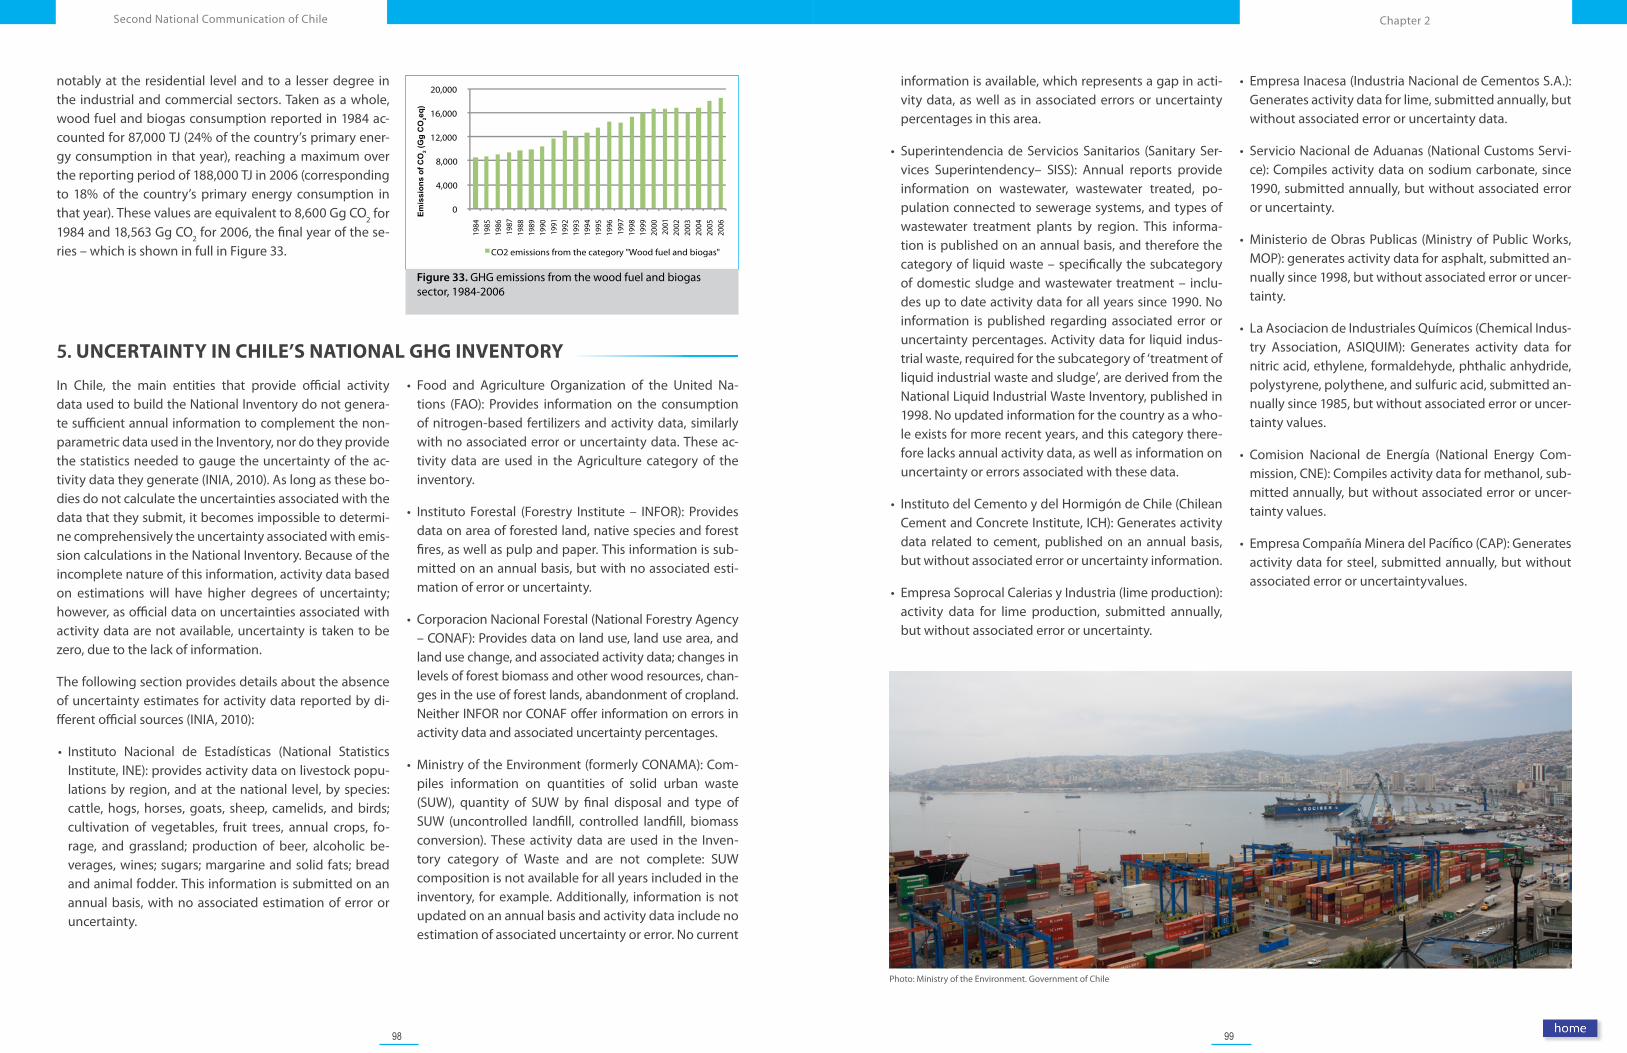
98 99
Chapter 2Second National Communication of Chile
Photo: Ministry of the Environment. Government of Chile
information is available, which represents a gap in acti-vity data, as well as in associated errors or uncertainty percentages in this area.
• Superintendencia de Servicios Sanitarios (Sanitary Ser-vices Superintendency– SISS): Annual reports provide information on wastewater, wastewater treated, po-pulation connected to sewerage systems, and types of wastewater treatment plants by region. This informa-tion is published on an annual basis, and therefore the category of liquid waste – specifically the subcategory of domestic sludge and wastewater treatment – inclu-des up to date activity data for all years since 1990. No information is published regarding associated error or uncertainty percentages. Activity data for liquid indus-trial waste, required for the subcategory of ‘treatment of liquid industrial waste and sludge’, are derived from the National Liquid Industrial Waste Inventory, published in 1998. No updated information for the country as a who-le exists for more recent years, and this category there-fore lacks annual activity data, as well as information on uncertainty or errors associated with these data.
• Instituto del Cemento y del Hormigón de Chile (Chilean Cement and Concrete Institute, ICH): Generates activity data related to cement, published on an annual basis, but without associated error or uncertainty information.
• Empresa Soprocal Calerias y Industria (lime production): activity data for lime production, submitted annually, but without associated error or uncertainty.
• Empresa Inacesa (Industria Nacional de Cementos S.A.): Generates activity data for lime, submitted annually, but without associated error or uncertainty data.
• Servicio Nacional de Aduanas (National Customs Servi-ce): Compiles activity data on sodium carbonate, since 1990, submitted annually, but without associated error or uncertainty.
• Ministerio de Obras Publicas (Ministry of Public Works, MOP): generates activity data for asphalt, submitted an-nually since 1998, but without associated error or uncer-tainty.
• La Asociacion de Industriales Químicos (Chemical Indus-try Association, ASIQUIM): Generates activity data for nitric acid, ethylene, formaldehyde, phthalic anhydride, polystyrene, polythene, and sulfuric acid, submitted an-nually since 1985, but without associated error or uncer-tainty values.
• Comision Nacional de Energía (National Energy Com-mission, CNE): Compiles activity data for methanol, sub-mitted annually, but without associated error or uncer-tainty values.
• Empresa Compañía Minera del Pacífico (CAP): Generates activity data for steel, submitted annually, but without associated error or uncertaintyvalues.
Figure 33. GHG emissions from the wood fuel and biogas sector, 1984-2006
5. UNCERTAINTY IN CHILE’S NATIONAL GHG INVENTORY
In Chile, the main entities that provide official activity data used to build the National Inventory do not genera-te sufficient annual information to complement the non-parametric data used in the Inventory, nor do they provide the statistics needed to gauge the uncertainty of the ac-tivity data they generate (INIA, 2010). As long as these bo-dies do not calculate the uncertainties associated with the data that they submit, it becomes impossible to determi-ne comprehensively the uncertainty associated with emis-sion calculations in the National Inventory. Because of the incomplete nature of this information, activity data based on estimations will have higher degrees of uncertainty; however, as official data on uncertainties associated with activity data are not available, uncertainty is taken to be zero, due to the lack of information.
The following section provides details about the absence of uncertainty estimates for activity data reported by di-fferent official sources (INIA, 2010):
• Instituto Nacional de Estadísticas (National Statistics Institute, INE): provides activity data on livestock popu-lations by region, and at the national level, by species: cattle, hogs, horses, goats, sheep, camelids, and birds; cultivation of vegetables, fruit trees, annual crops, fo-rage, and grassland; production of beer, alcoholic be-verages, wines; sugars; margarine and solid fats; bread and animal fodder. This information is submitted on an annual basis, with no associated estimation of error or uncertainty.
• Food and Agriculture Organization of the United Na-tions (FAO): Provides information on the consumption of nitrogen-based fertilizers and activity data, similarly with no associated error or uncertainty data. These ac-tivity data are used in the Agriculture category of the inventory.
• Instituto Forestal (Forestry Institute – INFOR): Provides data on area of forested land, native species and forest fires, as well as pulp and paper. This information is sub-mitted on an annual basis, but with no associated esti-mation of error or uncertainty.
• Corporacion Nacional Forestal (National Forestry Agency – CONAF): Provides data on land use, land use area, and land use change, and associated activity data; changes in levels of forest biomass and other wood resources, chan-ges in the use of forest lands, abandonment of cropland. Neither INFOR nor CONAF offer information on errors in activity data and associated uncertainty percentages.
• Ministry of the Environment (formerly CONAMA): Com-piles information on quantities of solid urban waste (SUW), quantity of SUW by final disposal and type of SUW (uncontrolled landfill, controlled landfill, biomass conversion). These activity data are used in the Inven-tory category of Waste and are not complete: SUW composition is not available for all years included in the inventory, for example. Additionally, information is not updated on an annual basis and activity data include no estimation of associated uncertainty or error. No current
notably at the residential level and to a lesser degree in the industrial and commercial sectors. Taken as a whole, wood fuel and biogas consumption reported in 1984 ac-counted for 87,000 TJ (24% of the country’s primary ener-gy consumption in that year), reaching a maximum over the reporting period of 188,000 TJ in 2006 (corresponding to 18% of the country’s primary energy consumption in that year). These values are equivalent to 8,600 Gg CO
2 for 1984 and 18,563 Gg CO2 for 2006, the final year of the se-ries – which is shown in full in Figure 33.
0
4,000
8,000
12,000
16,000
20,000
1984
19
85
1986
19
87
1988
19
89
1990
19
91
1992
19
93
1994
19
95
1996
19
97
1998
19
99
2000
20
01
2002
20
03
2004
20
05
2006
Emis
sion
s of
CO
2 (G
g C
O2e
q)
CO2 emissions from the category "Wood fuel and biogas"
100 101
Chapter 2Second National Communication of Chile
COCHILCO. (2010). Consumo de energía y emisiones de gases de efecto invernadero asociadas a la minería del cobre de Chile.
COCHILCO. (2009). Consumo de energía y emisiones de gases de efecto invernadero de la mi-nería del cobre de Chile.
IEA. (2009). Key World Energy Statistics.
IEA. (2010). Key World Energy Statistics.
INIA. (2010). Complementos y actualización del inventario de gases de efecto invernadero (GEI) para Chile en los sectores de agricultura, uso del suelo, cambio de uso del suelo y silvicultura, y residuos antrópicos.
INIA. (2009). Inventarios anuales de gases de efecto invernadero de Chile. Serie Temporal 1984/2003 para sectores no-energía. Boletín INIA 185
IPCC. (1996). IPCC guidelines for national greenhouse gas inventories. Revised in 1996.
IPCC. (2000). Good Practice Guidance and Uncertainty Management in National Greenhouse Gas Inventories.
IPCC. (2003). Good Practice Guidance for Land Use, Land-Use Change and Forestry.
IPCC. (2006). Guidelines for National Greenhouse Gas Inventories
NCSP. (2005). Handbook: Managing the National Greenhouse Gas Inventory Process.
POCH AMBIENTAL. (2008). Inventario nacional de gases de efecto invernadero.
SISTEMAS SUSTENTABLES. (2010). Desarrollo de una metodología local de cálculo de emisio-nes bunker para gases de efecto invernadero.
B I B L I O G R A P H Y
PORTADILLA CAP 3
PHOTO: MINISTRY OF THE ENVIRONMENT
CHAPTER 3Chile’s Vulnerability and Adaptation to Climate Change
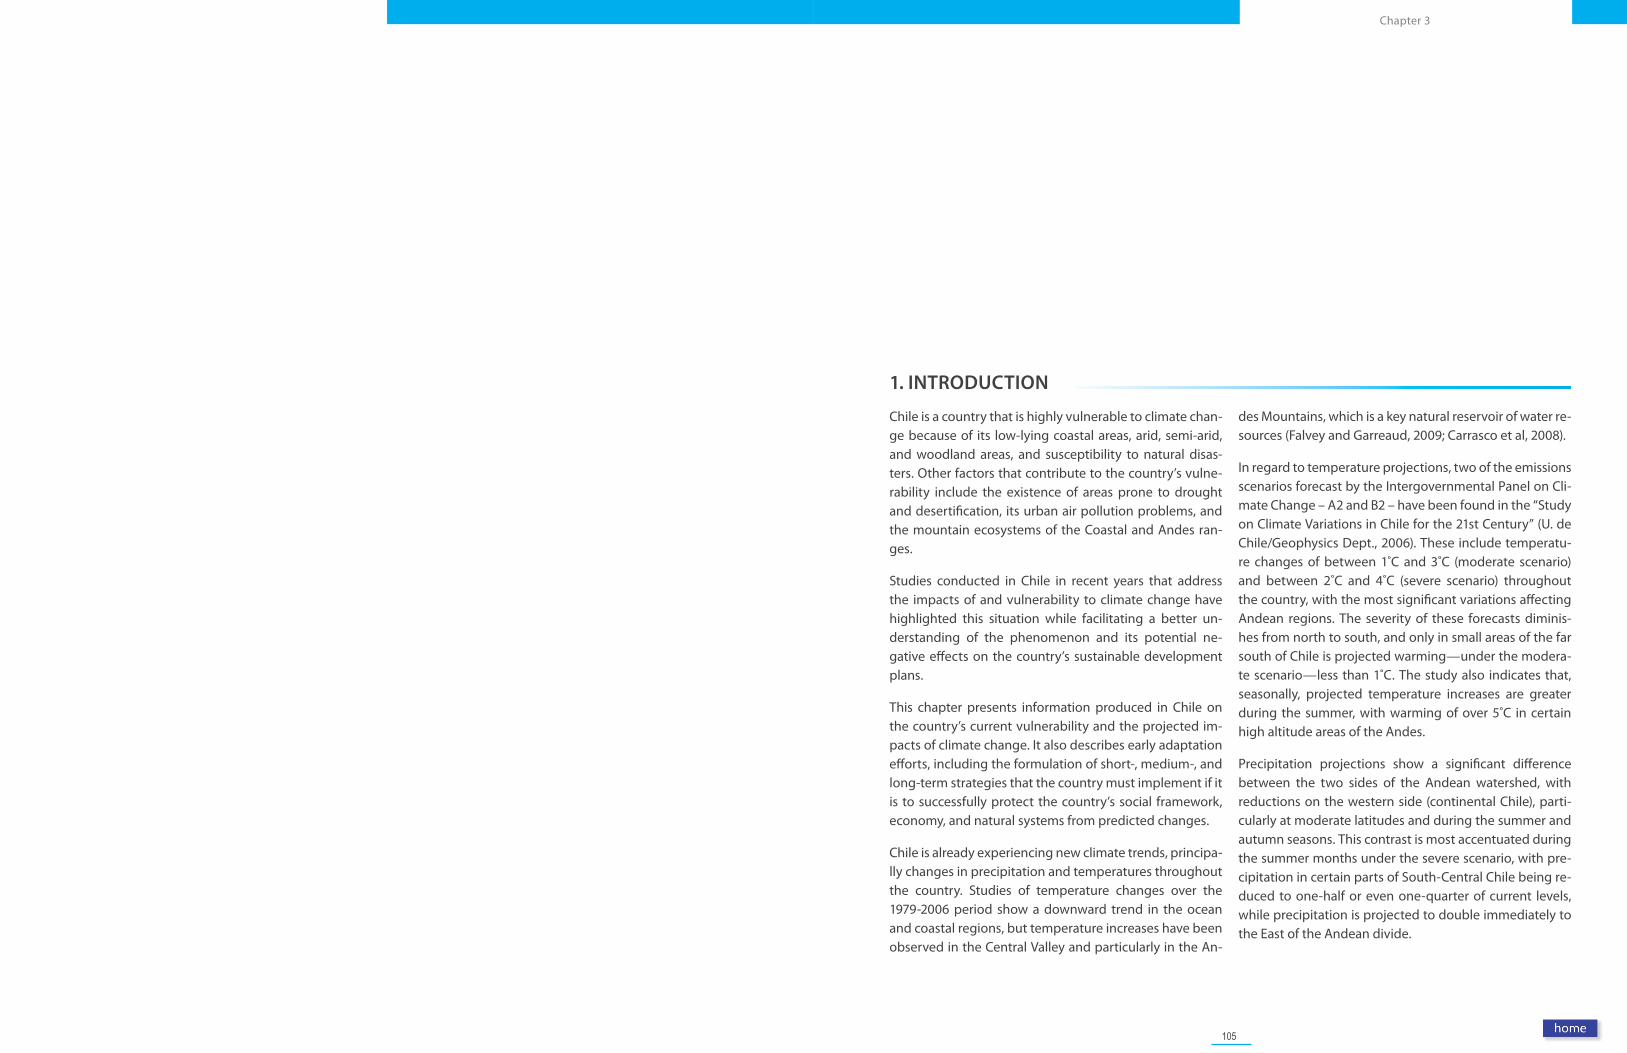
105
Chapter 3
1. INTRODUCTION
Chile is a country that is highly vulnerable to climate chan-ge because of its low-lying coastal areas, arid, semi-arid, and woodland areas, and susceptibility to natural disas-ters. Other factors that contribute to the country’s vulne-rability include the existence of areas prone to drought and desertification, its urban air pollution problems, and the mountain ecosystems of the Coastal and Andes ran-ges.
Studies conducted in Chile in recent years that address the impacts of and vulnerability to climate change have highlighted this situation while facilitating a better un-derstanding of the phenomenon and its potential ne-gative effects on the country’s sustainable development plans.
This chapter presents information produced in Chile on the country’s current vulnerability and the projected im-pacts of climate change. It also describes early adaptation efforts, including the formulation of short-, medium-, and long-term strategies that the country must implement if it is to successfully protect the country’s social framework, economy, and natural systems from predicted changes.
Chile is already experiencing new climate trends, principa-lly changes in precipitation and temperatures throughout the country. Studies of temperature changes over the 1979-2006 period show a downward trend in the ocean and coastal regions, but temperature increases have been observed in the Central Valley and particularly in the An-
des Mountains, which is a key natural reservoir of water re-sources (Falvey and Garreaud, 2009; Carrasco et al, 2008).
In regard to temperature projections, two of the emissions scenarios forecast by the Intergovernmental Panel on Cli-mate Change – A2 and B2 – have been found in the “Study on Climate Variations in Chile for the 21st Century” (U. de Chile/Geophysics Dept., 2006). These include temperatu-re changes of between 1˚C and 3˚C (moderate scenario) and between 2˚C and 4˚C (severe scenario) throughout the country, with the most significant variations affecting Andean regions. The severity of these forecasts diminis-hes from north to south, and only in small areas of the far south of Chile is projected warming—under the modera-te scenario—less than 1˚C. The study also indicates that, seasonally, projected temperature increases are greater during the summer, with warming of over 5˚C in certain high altitude areas of the Andes.
Precipitation projections show a significant difference between the two sides of the Andean watershed, with reductions on the western side (continental Chile), parti-cularly at moderate latitudes and during the summer and autumn seasons. This contrast is most accentuated during the summer months under the severe scenario, with pre-cipitation in certain parts of South-Central Chile being re-duced to one-half or even one-quarter of current levels, while precipitation is projected to double immediately to the East of the Andean divide.
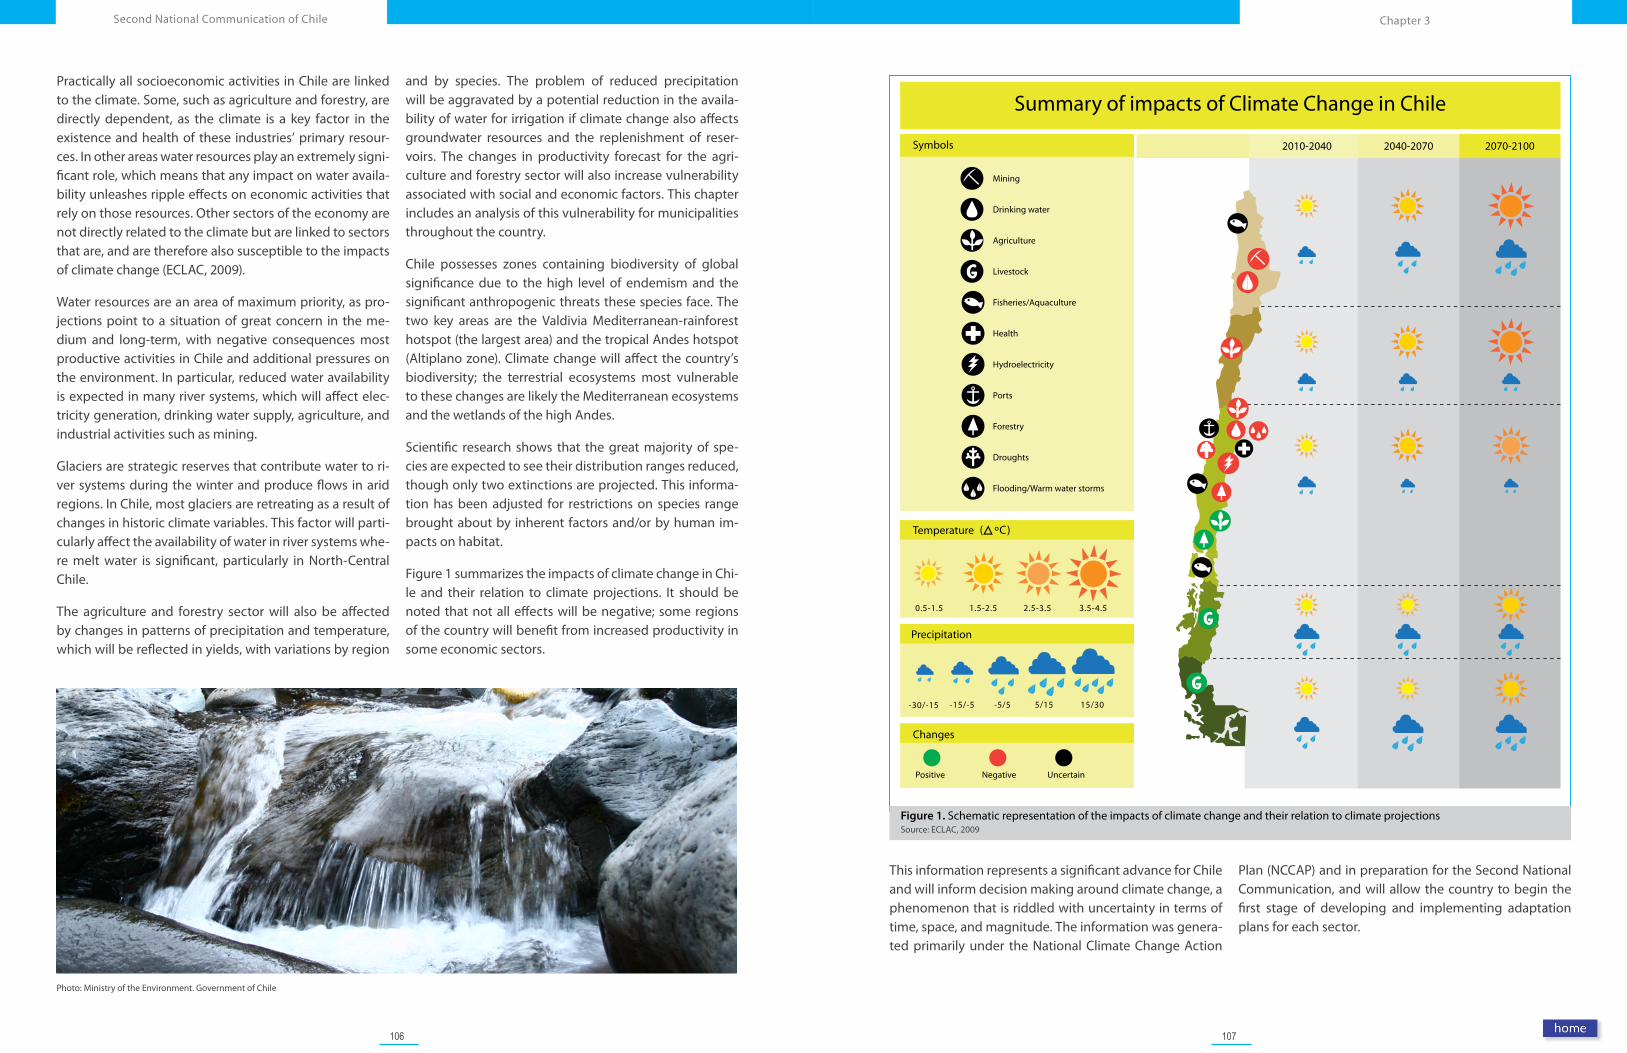
106 107
Chapter 3Second National Communication of Chile
Figure 1. Schematic representation of the impacts of climate change and their relation to climate projections Source: ECLAC, 2009
Practically all socioeconomic activities in Chile are linked to the climate. Some, such as agriculture and forestry, are directly dependent, as the climate is a key factor in the existence and health of these industries’ primary resour-ces. In other areas water resources play an extremely signi-ficant role, which means that any impact on water availa-bility unleashes ripple effects on economic activities that rely on those resources. Other sectors of the economy are not directly related to the climate but are linked to sectors that are, and are therefore also susceptible to the impacts of climate change (ECLAC, 2009).
Water resources are an area of maximum priority, as pro-jections point to a situation of great concern in the me-dium and long-term, with negative consequences most productive activities in Chile and additional pressures on the environment. In particular, reduced water availability is expected in many river systems, which will affect elec-tricity generation, drinking water supply, agriculture, and industrial activities such as mining.
Glaciers are strategic reserves that contribute water to ri-ver systems during the winter and produce flows in arid regions. In Chile, most glaciers are retreating as a result of changes in historic climate variables. This factor will parti-cularly affect the availability of water in river systems whe-re melt water is significant, particularly in North-Central Chile.
The agriculture and forestry sector will also be affected by changes in patterns of precipitation and temperature, which will be reflected in yields, with variations by region
and by species. The problem of reduced precipitation will be aggravated by a potential reduction in the availa-bility of water for irrigation if climate change also affects groundwater resources and the replenishment of reser-voirs. The changes in productivity forecast for the agri-culture and forestry sector will also increase vulnerability associated with social and economic factors. This chapter includes an analysis of this vulnerability for municipalities throughout the country.
Chile possesses zones containing biodiversity of global significance due to the high level of endemism and the significant anthropogenic threats these species face. The two key areas are the Valdivia Mediterranean-rainforest hotspot (the largest area) and the tropical Andes hotspot (Altiplano zone). Climate change will affect the country’s biodiversity; the terrestrial ecosystems most vulnerable to these changes are likely the Mediterranean ecosystems and the wetlands of the high Andes.
Scientific research shows that the great majority of spe-cies are expected to see their distribution ranges reduced, though only two extinctions are projected. This informa-tion has been adjusted for restrictions on species range brought about by inherent factors and/or by human im-pacts on habitat.
Figure 1 summarizes the impacts of climate change in Chi-le and their relation to climate projections. It should be noted that not all effects will be negative; some regions of the country will benefit from increased productivity in some economic sectors.
This information represents a significant advance for Chile and will inform decision making around climate change, a phenomenon that is riddled with uncertainty in terms of time, space, and magnitude. The information was genera-ted primarily under the National Climate Change Action
Plan (NCCAP) and in preparation for the Second National Communication, and will allow the country to begin the first stage of developing and implementing adaptation plans for each sector.
Photo: Ministry of the Environment. Government of Chile
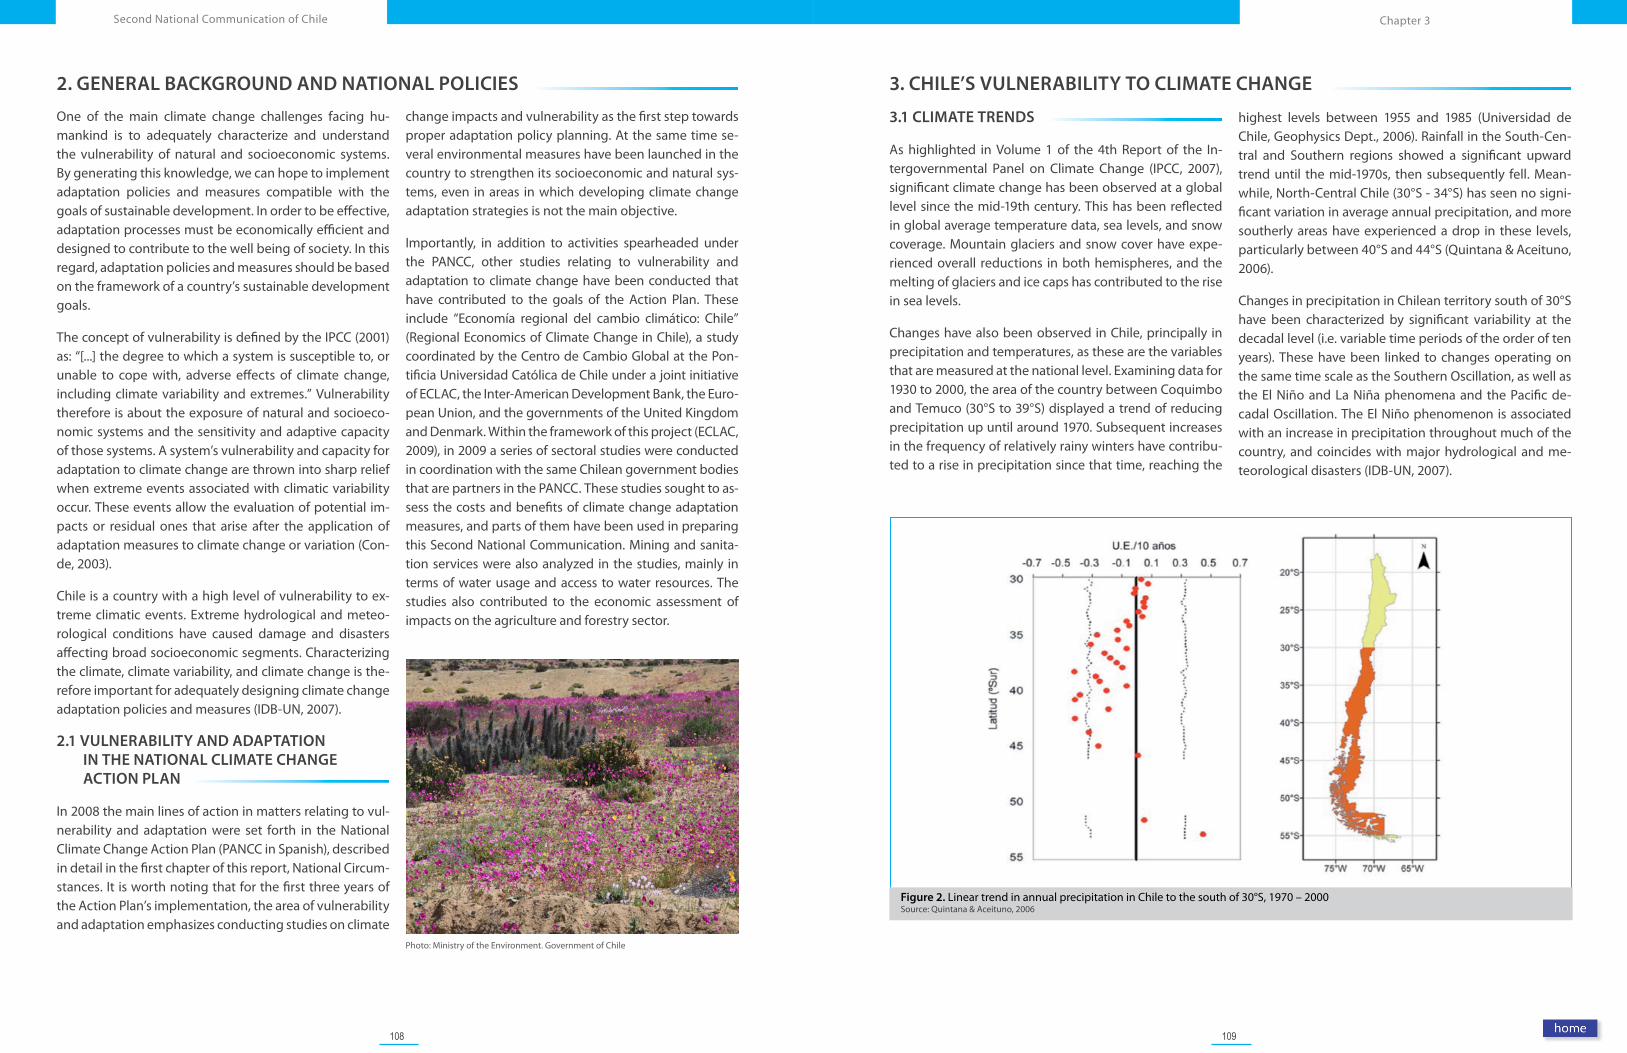
108 109
Chapter 3Second National Communication of Chile
Photo: Ministry of the Environment. Government of Chile
2. GENERAL BACKGROUND AND NATIONAL POLICIES
One of the main climate change challenges facing hu-mankind is to adequately characterize and understand the vulnerability of natural and socioeconomic systems. By generating this knowledge, we can hope to implement adaptation policies and measures compatible with the goals of sustainable development. In order to be effective, adaptation processes must be economically efficient and designed to contribute to the well being of society. In this regard, adaptation policies and measures should be based on the framework of a country’s sustainable development goals.
The concept of vulnerability is defined by the IPCC (2001) as: “[...] the degree to which a system is susceptible to, or unable to cope with, adverse effects of climate change, including climate variability and extremes.” Vulnerability therefore is about the exposure of natural and socioeco-nomic systems and the sensitivity and adaptive capacity of those systems. A system’s vulnerability and capacity for adaptation to climate change are thrown into sharp relief when extreme events associated with climatic variability occur. These events allow the evaluation of potential im-pacts or residual ones that arise after the application of adaptation measures to climate change or variation (Con-de, 2003).
Chile is a country with a high level of vulnerability to ex-treme climatic events. Extreme hydrological and meteo-rological conditions have caused damage and disasters affecting broad socioeconomic segments. Characterizing the climate, climate variability, and climate change is the-refore important for adequately designing climate change adaptation policies and measures (IDB-UN, 2007).
2.1 VULNERABILITY AND ADAPTATION IN THE NATIONAL CLIMATE CHANGE ACTION PLAN
In 2008 the main lines of action in matters relating to vul-nerability and adaptation were set forth in the National Climate Change Action Plan (PANCC in Spanish), described in detail in the first chapter of this report, National Circum-stances. It is worth noting that for the first three years of the Action Plan’s implementation, the area of vulnerability and adaptation emphasizes conducting studies on climate
change impacts and vulnerability as the first step towards proper adaptation policy planning. At the same time se-veral environmental measures have been launched in the country to strengthen its socioeconomic and natural sys-tems, even in areas in which developing climate change adaptation strategies is not the main objective.
Importantly, in addition to activities spearheaded under the PANCC, other studies relating to vulnerability and adaptation to climate change have been conducted that have contributed to the goals of the Action Plan. These include “Economía regional del cambio climático: Chile” (Regional Economics of Climate Change in Chile), a study coordinated by the Centro de Cambio Global at the Pon-tificia Universidad Católica de Chile under a joint initiative of ECLAC, the Inter-American Development Bank, the Euro-pean Union, and the governments of the United Kingdom and Denmark. Within the framework of this project (ECLAC, 2009), in 2009 a series of sectoral studies were conducted in coordination with the same Chilean government bodies that are partners in the PANCC. These studies sought to as-sess the costs and benefits of climate change adaptation measures, and parts of them have been used in preparing this Second National Communication. Mining and sanita-tion services were also analyzed in the studies, mainly in terms of water usage and access to water resources. The studies also contributed to the economic assessment of impacts on the agriculture and forestry sector.
3. CHILE’S VULNERABILITY TO CLIMATE CHANGE
3.1 CLIMATE TRENDS
As highlighted in Volume 1 of the 4th Report of the In-tergovernmental Panel on Climate Change (IPCC, 2007), significant climate change has been observed at a global level since the mid-19th century. This has been reflected in global average temperature data, sea levels, and snow coverage. Mountain glaciers and snow cover have expe-rienced overall reductions in both hemispheres, and the melting of glaciers and ice caps has contributed to the rise in sea levels.
Changes have also been observed in Chile, principally in precipitation and temperatures, as these are the variables that are measured at the national level. Examining data for 1930 to 2000, the area of the country between Coquimbo and Temuco (30°S to 39°S) displayed a trend of reducing precipitation up until around 1970. Subsequent increases in the frequency of relatively rainy winters have contribu-ted to a rise in precipitation since that time, reaching the
highest levels between 1955 and 1985 (Universidad de Chile, Geophysics Dept., 2006). Rainfall in the South-Cen-tral and Southern regions showed a significant upward trend until the mid-1970s, then subsequently fell. Mean-while, North-Central Chile (30°S - 34°S) has seen no signi-ficant variation in average annual precipitation, and more southerly areas have experienced a drop in these levels, particularly between 40°S and 44°S (Quintana & Aceituno, 2006).
Changes in precipitation in Chilean territory south of 30°S have been characterized by significant variability at the decadal level (i.e. variable time periods of the order of ten years). These have been linked to changes operating on the same time scale as the Southern Oscillation, as well as the El Niño and La Niña phenomena and the Pacific de-cadal Oscillation. The El Niño phenomenon is associated with an increase in precipitation throughout much of the country, and coincides with major hydrological and me-teorological disasters (IDB-UN, 2007).
Figure 2. Linear trend in annual precipitation in Chile to the south of 30°S, 1970 – 2000Source: Quintana & Aceituno, 2006
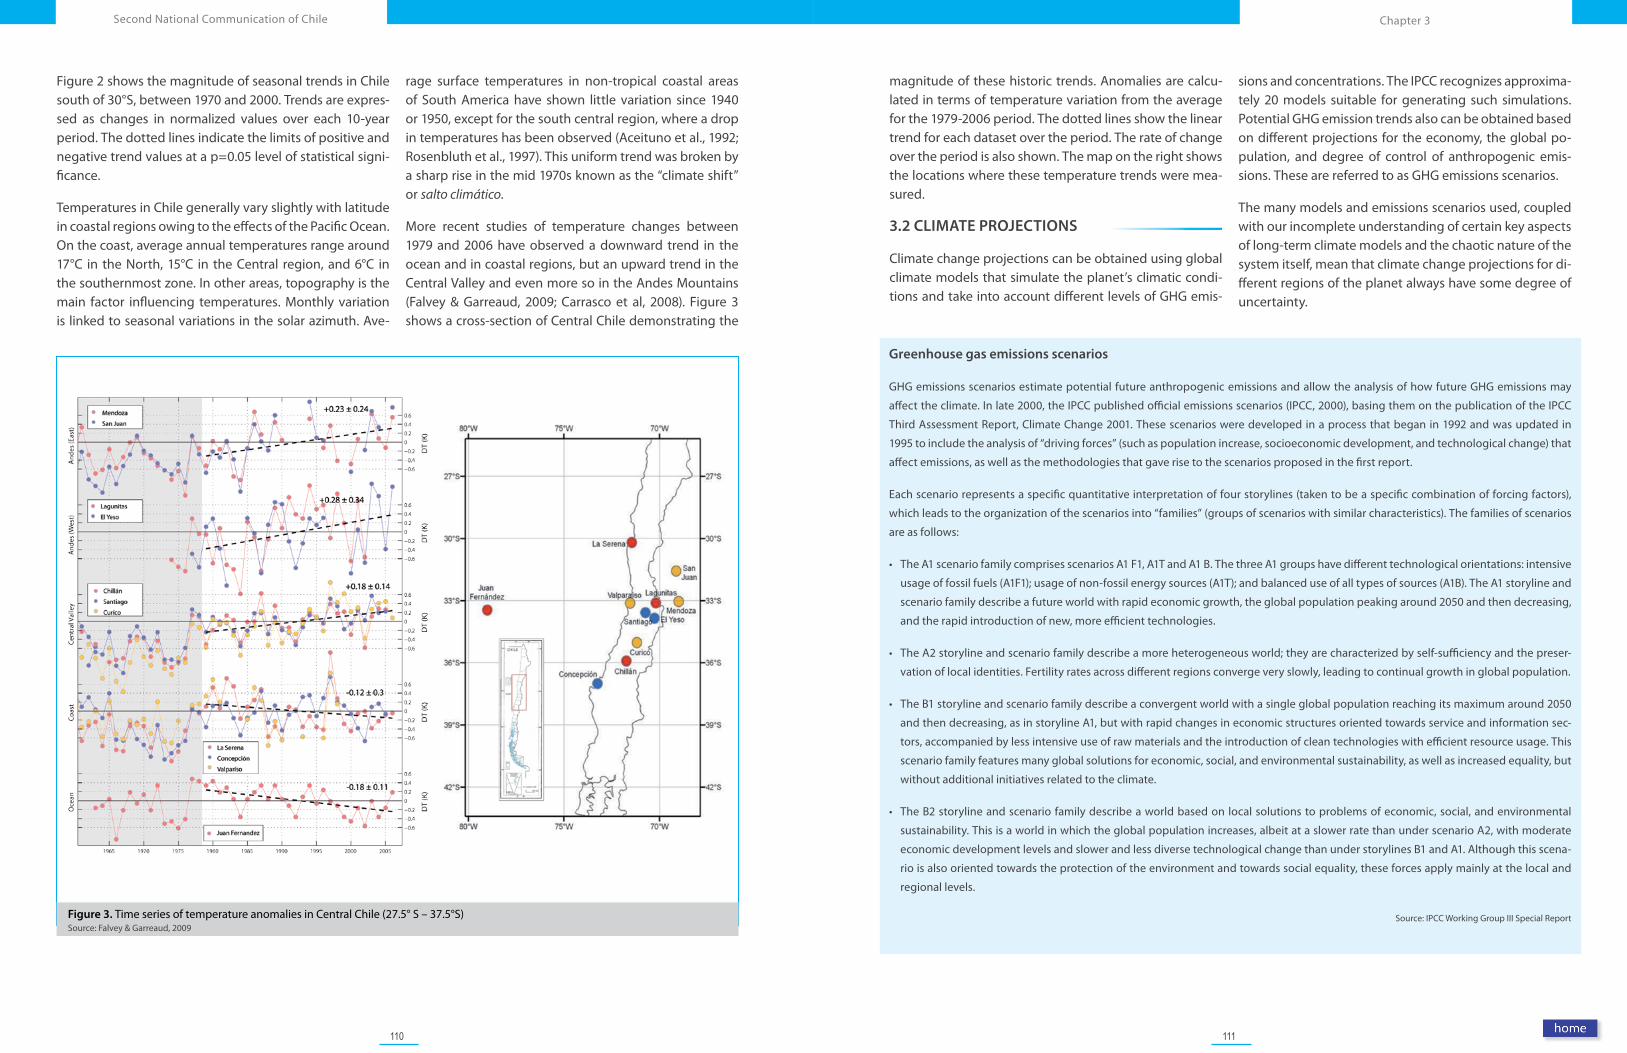
110 111
Chapter 3Second National Communication of Chile
Source: IPCC Working Group III Special Report
Greenhouse gas emissions scenarios
GHG emissions scenarios estimate potential future anthropogenic emissions and allow the analysis of how future GHG emissions may
affect the climate. In late 2000, the IPCC published official emissions scenarios (IPCC, 2000), basing them on the publication of the IPCC
Third Assessment Report, Climate Change 2001. These scenarios were developed in a process that began in 1992 and was updated in
1995 to include the analysis of “driving forces” (such as population increase, socioeconomic development, and technological change) that
affect emissions, as well as the methodologies that gave rise to the scenarios proposed in the first report.
Each scenario represents a specific quantitative interpretation of four storylines (taken to be a specific combination of forcing factors),
which leads to the organization of the scenarios into “families” (groups of scenarios with similar characteristics). The families of scenarios
are as follows:
• The A1 scenario family comprises scenarios A1 F1, A1T and A1 B. The three A1 groups have different technological orientations: intensive
usage of fossil fuels (A1F1); usage of non-fossil energy sources (A1T); and balanced use of all types of sources (A1B). The A1 storyline and
scenario family describe a future world with rapid economic growth, the global population peaking around 2050 and then decreasing,
and the rapid introduction of new, more efficient technologies.
• The A2 storyline and scenario family describe a more heterogeneous world; they are characterized by self-sufficiency and the preser-
vation of local identities. Fertility rates across different regions converge very slowly, leading to continual growth in global population.
• The B1 storyline and scenario family describe a convergent world with a single global population reaching its maximum around 2050
and then decreasing, as in storyline A1, but with rapid changes in economic structures oriented towards service and information sec-
tors, accompanied by less intensive use of raw materials and the introduction of clean technologies with efficient resource usage. This
scenario family features many global solutions for economic, social, and environmental sustainability, as well as increased equality, but
without additional initiatives related to the climate.
• The B2 storyline and scenario family describe a world based on local solutions to problems of economic, social, and environmental
sustainability. This is a world in which the global population increases, albeit at a slower rate than under scenario A2, with moderate
economic development levels and slower and less diverse technological change than under storylines B1 and A1. Although this scena-
rio is also oriented towards the protection of the environment and towards social equality, these forces apply mainly at the local and
regional levels.
Figure 3. Time series of temperature anomalies in Central Chile (27.5° S – 37.5°S)Source: Falvey & Garreaud, 2009
Figure 2 shows the magnitude of seasonal trends in Chile south of 30°S, between 1970 and 2000. Trends are expres-sed as changes in normalized values over each 10-year period. The dotted lines indicate the limits of positive and negative trend values at a p=0.05 level of statistical signi-ficance.
Temperatures in Chile generally vary slightly with latitude in coastal regions owing to the effects of the Pacific Ocean. On the coast, average annual temperatures range around 17°C in the North, 15°C in the Central region, and 6°C in the southernmost zone. In other areas, topography is the main factor influencing temperatures. Monthly variation is linked to seasonal variations in the solar azimuth. Ave-
rage surface temperatures in non-tropical coastal areas of South America have shown little variation since 1940 or 1950, except for the south central region, where a drop in temperatures has been observed (Aceituno et al., 1992; Rosenbluth et al., 1997). This uniform trend was broken by a sharp rise in the mid 1970s known as the “climate shift” or salto climático.
More recent studies of temperature changes between 1979 and 2006 have observed a downward trend in the ocean and in coastal regions, but an upward trend in the Central Valley and even more so in the Andes Mountains (Falvey & Garreaud, 2009; Carrasco et al, 2008). Figure 3 shows a cross-section of Central Chile demonstrating the
magnitude of these historic trends. Anomalies are calcu-lated in terms of temperature variation from the average for the 1979-2006 period. The dotted lines show the linear trend for each dataset over the period. The rate of change over the period is also shown. The map on the right shows the locations where these temperature trends were mea-sured.
3.2 CLIMATE PROJECTIONS
Climate change projections can be obtained using global climate models that simulate the planet’s climatic condi-tions and take into account different levels of GHG emis-
sions and concentrations. The IPCC recognizes approxima-tely 20 models suitable for generating such simulations. Potential GHG emission trends also can be obtained based on different projections for the economy, the global po-pulation, and degree of control of anthropogenic emis-sions. These are referred to as GHG emissions scenarios.
The many models and emissions scenarios used, coupled with our incomplete understanding of certain key aspects of long-term climate models and the chaotic nature of the system itself, mean that climate change projections for di-fferent regions of the planet always have some degree of uncertainty.
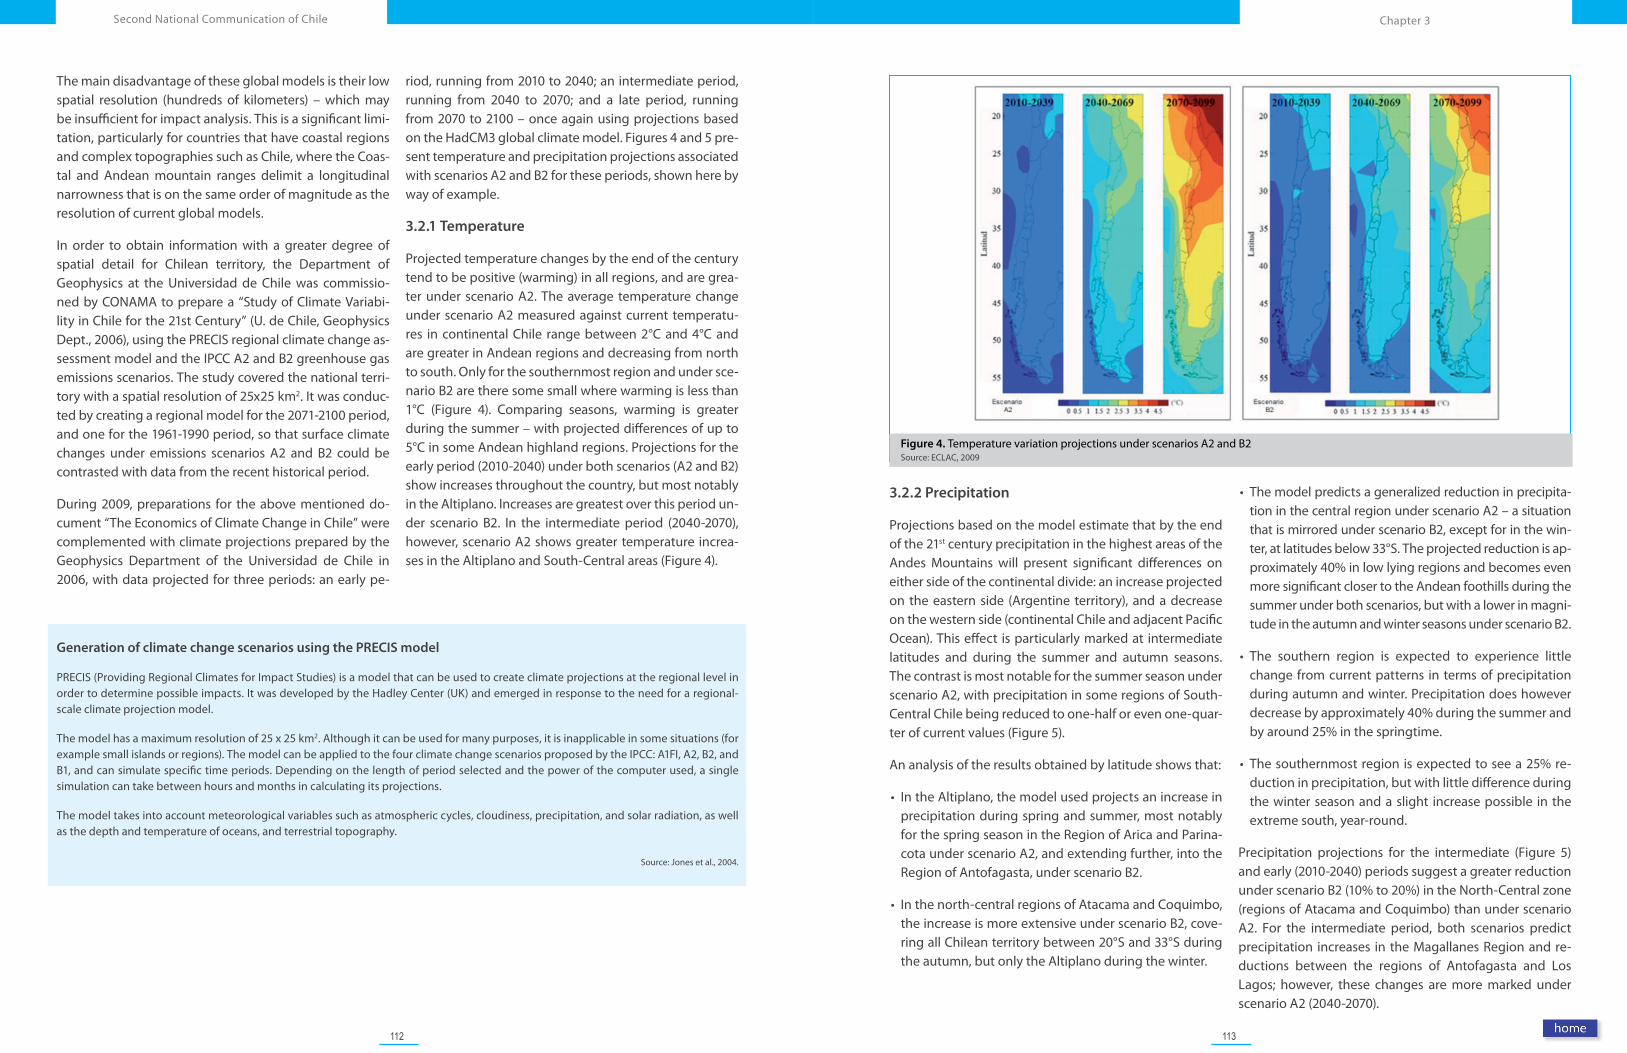
112 113
Chapter 3Second National Communication of Chile
Figure 4. Temperature variation projections under scenarios A2 and B2Source: ECLAC, 2009
Generation of climate change scenarios using the PRECIS model
PRECIS (Providing Regional Climates for Impact Studies) is a model that can be used to create climate projections at the regional level in order to determine possible impacts. It was developed by the Hadley Center (UK) and emerged in response to the need for a regional-scale climate projection model.
The model has a maximum resolution of 25 x 25 km2. Although it can be used for many purposes, it is inapplicable in some situations (for example small islands or regions). The model can be applied to the four climate change scenarios proposed by the IPCC: A1FI, A2, B2, and B1, and can simulate specific time periods. Depending on the length of period selected and the power of the computer used, a single simulation can take between hours and months in calculating its projections.
The model takes into account meteorological variables such as atmospheric cycles, cloudiness, precipitation, and solar radiation, as well as the depth and temperature of oceans, and terrestrial topography.
Source: Jones et al., 2004.
The main disadvantage of these global models is their low spatial resolution (hundreds of kilometers) – which may be insufficient for impact analysis. This is a significant limi-tation, particularly for countries that have coastal regions and complex topographies such as Chile, where the Coas-tal and Andean mountain ranges delimit a longitudinal narrowness that is on the same order of magnitude as the resolution of current global models.
In order to obtain information with a greater degree of spatial detail for Chilean territory, the Department of Geophysics at the Universidad de Chile was commissio-ned by CONAMA to prepare a “Study of Climate Variabi-lity in Chile for the 21st Century” (U. de Chile, Geophysics Dept., 2006), using the PRECIS regional climate change as-sessment model and the IPCC A2 and B2 greenhouse gas emissions scenarios. The study covered the national terri-tory with a spatial resolution of 25x25 km2. It was conduc-ted by creating a regional model for the 2071-2100 period, and one for the 1961-1990 period, so that surface climate changes under emissions scenarios A2 and B2 could be contrasted with data from the recent historical period.
During 2009, preparations for the above mentioned do-cument “The Economics of Climate Change in Chile” were complemented with climate projections prepared by the Geophysics Department of the Universidad de Chile in 2006, with data projected for three periods: an early pe-
riod, running from 2010 to 2040; an intermediate period, running from 2040 to 2070; and a late period, running from 2070 to 2100 – once again using projections based on the HadCM3 global climate model. Figures 4 and 5 pre-sent temperature and precipitation projections associated with scenarios A2 and B2 for these periods, shown here by way of example.
3.2.1 Temperature
Projected temperature changes by the end of the century tend to be positive (warming) in all regions, and are grea-ter under scenario A2. The average temperature change under scenario A2 measured against current temperatu-res in continental Chile range between 2°C and 4°C and are greater in Andean regions and decreasing from north to south. Only for the southernmost region and under sce-nario B2 are there some small where warming is less than 1°C (Figure 4). Comparing seasons, warming is greater during the summer – with projected differences of up to 5°C in some Andean highland regions. Projections for the early period (2010-2040) under both scenarios (A2 and B2) show increases throughout the country, but most notably in the Altiplano. Increases are greatest over this period un-der scenario B2. In the intermediate period (2040-2070), however, scenario A2 shows greater temperature increa-ses in the Altiplano and South-Central areas (Figure 4).
3.2.2 Precipitation
Projections based on the model estimate that by the end of the 21st century precipitation in the highest areas of the Andes Mountains will present significant differences on either side of the continental divide: an increase projected on the eastern side (Argentine territory), and a decrease on the western side (continental Chile and adjacent Pacific Ocean). This effect is particularly marked at intermediate latitudes and during the summer and autumn seasons. The contrast is most notable for the summer season under scenario A2, with precipitation in some regions of South-Central Chile being reduced to one-half or even one-quar-ter of current values (Figure 5).
An analysis of the results obtained by latitude shows that:
• In the Altiplano, the model used projects an increase in precipitation during spring and summer, most notably for the spring season in the Region of Arica and Parina-cota under scenario A2, and extending further, into the Region of Antofagasta, under scenario B2.
• In the north-central regions of Atacama and Coquimbo, the increase is more extensive under scenario B2, cove-ring all Chilean territory between 20°S and 33°S during the autumn, but only the Altiplano during the winter.
• The model predicts a generalized reduction in precipita-tion in the central region under scenario A2 – a situation that is mirrored under scenario B2, except for in the win-ter, at latitudes below 33°S. The projected reduction is ap-proximately 40% in low lying regions and becomes even more significant closer to the Andean foothills during the summer under both scenarios, but with a lower in magni-tude in the autumn and winter seasons under scenario B2.
• The southern region is expected to experience little change from current patterns in terms of precipitation during autumn and winter. Precipitation does however decrease by approximately 40% during the summer and by around 25% in the springtime.
• The southernmost region is expected to see a 25% re-duction in precipitation, but with little difference during the winter season and a slight increase possible in the extreme south, year-round.
Precipitation projections for the intermediate (Figure 5) and early (2010-2040) periods suggest a greater reduction under scenario B2 (10% to 20%) in the North-Central zone (regions of Atacama and Coquimbo) than under scenario A2. For the intermediate period, both scenarios predict precipitation increases in the Magallanes Region and re-ductions between the regions of Antofagasta and Los Lagos; however, these changes are more marked under scenario A2 (2040-2070).
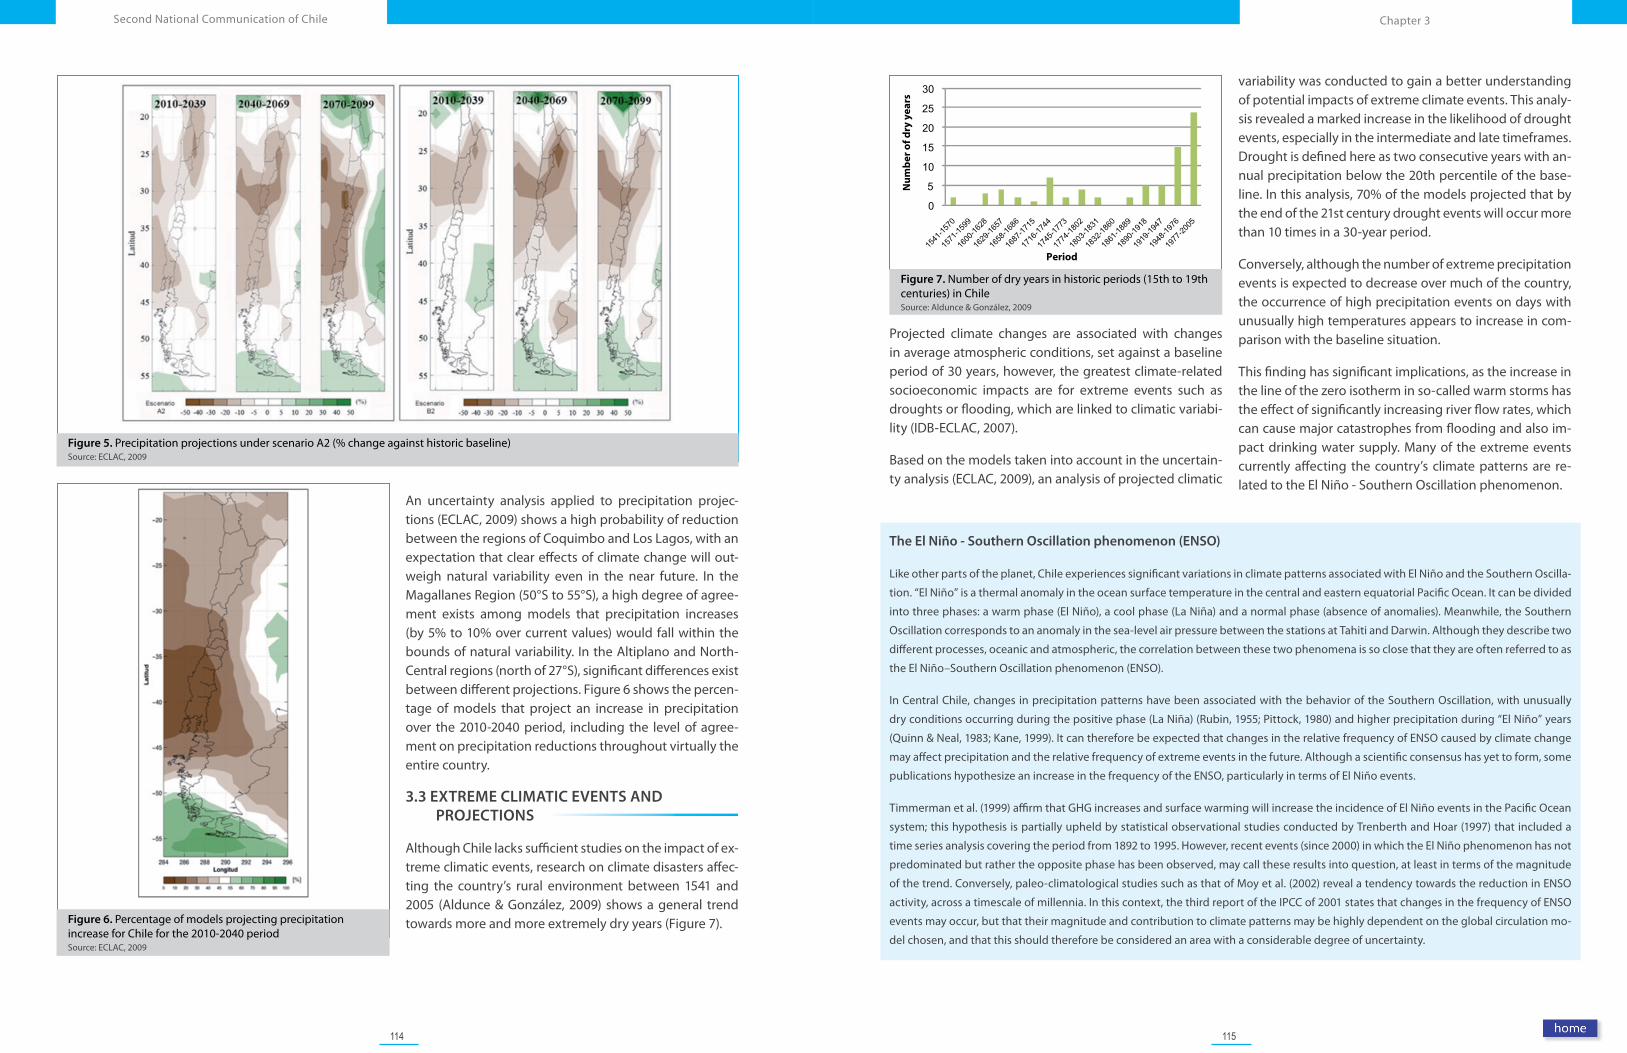
114 115
Chapter 3Second National Communication of Chile
Figure 7. Number of dry years in historic periods (15th to 19th centuries) in ChileSource: Aldunce & González, 2009
The El Niño - Southern Oscillation phenomenon (ENSO)
Like other parts of the planet, Chile experiences significant variations in climate patterns associated with El Niño and the Southern Oscilla-
tion. “El Niño” is a thermal anomaly in the ocean surface temperature in the central and eastern equatorial Pacific Ocean. It can be divided
into three phases: a warm phase (El Niño), a cool phase (La Niña) and a normal phase (absence of anomalies). Meanwhile, the Southern
Oscillation corresponds to an anomaly in the sea-level air pressure between the stations at Tahiti and Darwin. Although they describe two
different processes, oceanic and atmospheric, the correlation between these two phenomena is so close that they are often referred to as
the El Niño–Southern Oscillation phenomenon (ENSO).
In Central Chile, changes in precipitation patterns have been associated with the behavior of the Southern Oscillation, with unusually
dry conditions occurring during the positive phase (La Niña) (Rubin, 1955; Pittock, 1980) and higher precipitation during “El Niño” years
(Quinn & Neal, 1983; Kane, 1999). It can therefore be expected that changes in the relative frequency of ENSO caused by climate change
may affect precipitation and the relative frequency of extreme events in the future. Although a scientific consensus has yet to form, some
publications hypothesize an increase in the frequency of the ENSO, particularly in terms of El Niño events.
Timmerman et al. (1999) affirm that GHG increases and surface warming will increase the incidence of El Niño events in the Pacific Ocean
system; this hypothesis is partially upheld by statistical observational studies conducted by Trenberth and Hoar (1997) that included a
time series analysis covering the period from 1892 to 1995. However, recent events (since 2000) in which the El Niño phenomenon has not
predominated but rather the opposite phase has been observed, may call these results into question, at least in terms of the magnitude
of the trend. Conversely, paleo-climatological studies such as that of Moy et al. (2002) reveal a tendency towards the reduction in ENSO
activity, across a timescale of millennia. In this context, the third report of the IPCC of 2001 states that changes in the frequency of ENSO
events may occur, but that their magnitude and contribution to climate patterns may be highly dependent on the global circulation mo-
del chosen, and that this should therefore be considered an area with a considerable degree of uncertainty.
Figure 5. Precipitation projections under scenario A2 (% change against historic baseline)Source: ECLAC, 2009
Figure 6. Percentage of models projecting precipitation increase for Chile for the 2010-2040 periodSource: ECLAC, 2009
An uncertainty analysis applied to precipitation projec-tions (ECLAC, 2009) shows a high probability of reduction between the regions of Coquimbo and Los Lagos, with an expectation that clear effects of climate change will out-weigh natural variability even in the near future. In the Magallanes Region (50°S to 55°S), a high degree of agree-ment exists among models that precipitation increases (by 5% to 10% over current values) would fall within the bounds of natural variability. In the Altiplano and North-Central regions (north of 27°S), significant differences exist between different projections. Figure 6 shows the percen-tage of models that project an increase in precipitation over the 2010-2040 period, including the level of agree-ment on precipitation reductions throughout virtually the entire country.
3.3 EXTREME CLIMATIC EVENTS AND PROJECTIONS
Although Chile lacks sufficient studies on the impact of ex-treme climatic events, research on climate disasters affec-ting the country’s rural environment between 1541 and 2005 (Aldunce & González, 2009) shows a general trend towards more and more extremely dry years (Figure 7).
Projected climate changes are associated with changes in average atmospheric conditions, set against a baseline period of 30 years, however, the greatest climate-related socioeconomic impacts are for extreme events such as droughts or flooding, which are linked to climatic variabi-lity (IDB-ECLAC, 2007).
Based on the models taken into account in the uncertain-ty analysis (ECLAC, 2009), an analysis of projected climatic
variability was conducted to gain a better understanding of potential impacts of extreme climate events. This analy-sis revealed a marked increase in the likelihood of drought events, especially in the intermediate and late timeframes. Drought is defined here as two consecutive years with an-nual precipitation below the 20th percentile of the base-line. In this analysis, 70% of the models projected that by the end of the 21st century drought events will occur more than 10 times in a 30-year period.
Conversely, although the number of extreme precipitation events is expected to decrease over much of the country, the occurrence of high precipitation events on days with unusually high temperatures appears to increase in com-parison with the baseline situation.
This finding has significant implications, as the increase in the line of the zero isotherm in so-called warm storms has the effect of significantly increasing river flow rates, which can cause major catastrophes from flooding and also im-pact drinking water supply. Many of the extreme events currently affecting the country’s climate patterns are re-lated to the El Niño - Southern Oscillation phenomenon.
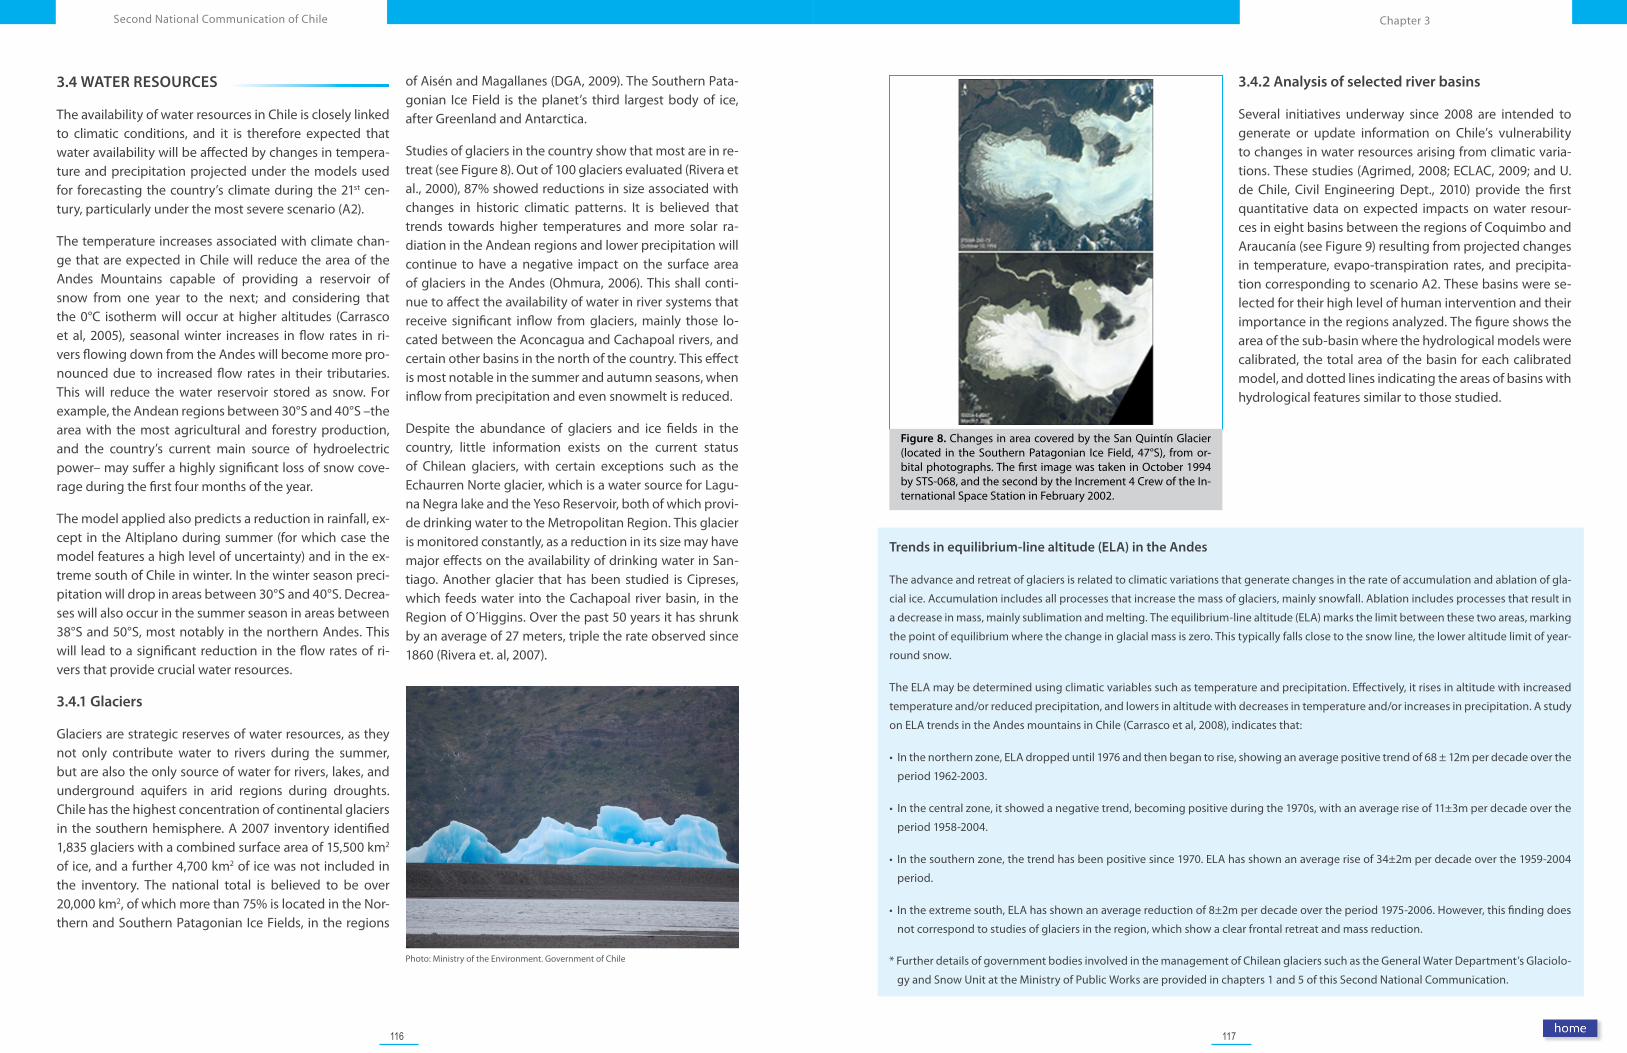
116 117
Chapter 3Second National Communication of Chile
Figure 8. Changes in area covered by the San Quintín Glacier (located in the Southern Patagonian Ice Field, 47°S), from or-bital photographs. The first image was taken in October 1994 by STS-068, and the second by the Increment 4 Crew of the In-ternational Space Station in February 2002.
Trends in equilibrium-line altitude (ELA) in the Andes
The advance and retreat of glaciers is related to climatic variations that generate changes in the rate of accumulation and ablation of gla-
cial ice. Accumulation includes all processes that increase the mass of glaciers, mainly snowfall. Ablation includes processes that result in
a decrease in mass, mainly sublimation and melting. The equilibrium-line altitude (ELA) marks the limit between these two areas, marking
the point of equilibrium where the change in glacial mass is zero. This typically falls close to the snow line, the lower altitude limit of year-
round snow.
The ELA may be determined using climatic variables such as temperature and precipitation. Effectively, it rises in altitude with increased
temperature and/or reduced precipitation, and lowers in altitude with decreases in temperature and/or increases in precipitation. A study
on ELA trends in the Andes mountains in Chile (Carrasco et al, 2008), indicates that:
• Inthenorthernzone,ELAdroppeduntil1976andthenbegantorise,showinganaveragepositivetrendof68±12mperdecadeoverthe
period 1962-2003.
• Inthecentralzone,itshowedanegativetrend,becomingpositiveduringthe1970s,withanaverageriseof11±3mperdecadeoverthe
period 1958-2004.
• Inthesouthernzone,thetrendhasbeenpositivesince1970.ELAhasshownanaverageriseof34±2mperdecadeoverthe1959-2004
period.
• Intheextremesouth,ELAhasshownanaveragereductionof8±2mperdecadeovertheperiod1975-2006.However,thisfindingdoes
not correspond to studies of glaciers in the region, which show a clear frontal retreat and mass reduction.
* Further details of government bodies involved in the management of Chilean glaciers such as the General Water Department’s Glaciolo-
gy and Snow Unit at the Ministry of Public Works are provided in chapters 1 and 5 of this Second National Communication.
Photo: Ministry of the Environment. Government of Chile
3.4 WATER RESOURCES
The availability of water resources in Chile is closely linked to climatic conditions, and it is therefore expected that water availability will be affected by changes in tempera-ture and precipitation projected under the models used for forecasting the country’s climate during the 21st cen-tury, particularly under the most severe scenario (A2).
The temperature increases associated with climate chan-ge that are expected in Chile will reduce the area of the Andes Mountains capable of providing a reservoir of snow from one year to the next; and considering that the 0°C isotherm will occur at higher altitudes (Carrasco et al, 2005), seasonal winter increases in flow rates in ri-vers flowing down from the Andes will become more pro-nounced due to increased flow rates in their tributaries. This will reduce the water reservoir stored as snow. For example, the Andean regions between 30°S and 40°S –the area with the most agricultural and forestry production, and the country’s current main source of hydroelectric power– may suffer a highly significant loss of snow cove-rage during the first four months of the year.
The model applied also predicts a reduction in rainfall, ex-cept in the Altiplano during summer (for which case the model features a high level of uncertainty) and in the ex-treme south of Chile in winter. In the winter season preci-pitation will drop in areas between 30°S and 40°S. Decrea-ses will also occur in the summer season in areas between 38°S and 50°S, most notably in the northern Andes. This will lead to a significant reduction in the flow rates of ri-vers that provide crucial water resources.
3.4.1 Glaciers
Glaciers are strategic reserves of water resources, as they not only contribute water to rivers during the summer, but are also the only source of water for rivers, lakes, and underground aquifers in arid regions during droughts. Chile has the highest concentration of continental glaciers in the southern hemisphere. A 2007 inventory identified 1,835 glaciers with a combined surface area of 15,500 km2 of ice, and a further 4,700 km2 of ice was not included in the inventory. The national total is believed to be over 20,000 km2, of which more than 75% is located in the Nor-thern and Southern Patagonian Ice Fields, in the regions
of Aisén and Magallanes (DGA, 2009). The Southern Pata-gonian Ice Field is the planet’s third largest body of ice, after Greenland and Antarctica.
Studies of glaciers in the country show that most are in re-treat (see Figure 8). Out of 100 glaciers evaluated (Rivera et al., 2000), 87% showed reductions in size associated with changes in historic climatic patterns. It is believed that trends towards higher temperatures and more solar ra-diation in the Andean regions and lower precipitation will continue to have a negative impact on the surface area of glaciers in the Andes (Ohmura, 2006). This shall conti-nue to affect the availability of water in river systems that receive significant inflow from glaciers, mainly those lo-cated between the Aconcagua and Cachapoal rivers, and certain other basins in the north of the country. This effect is most notable in the summer and autumn seasons, when inflow from precipitation and even snowmelt is reduced.
Despite the abundance of glaciers and ice fields in the country, little information exists on the current status of Chilean glaciers, with certain exceptions such as the Echaurren Norte glacier, which is a water source for Lagu-na Negra lake and the Yeso Reservoir, both of which provi-de drinking water to the Metropolitan Region. This glacier is monitored constantly, as a reduction in its size may have major effects on the availability of drinking water in San-tiago. Another glacier that has been studied is Cipreses, which feeds water into the Cachapoal river basin, in the Region of O´Higgins. Over the past 50 years it has shrunk by an average of 27 meters, triple the rate observed since 1860 (Rivera et. al, 2007).
3.4.2 Analysis of selected river basins
Several initiatives underway since 2008 are intended to generate or update information on Chile’s vulnerability to changes in water resources arising from climatic varia-tions. These studies (Agrimed, 2008; ECLAC, 2009; and U. de Chile, Civil Engineering Dept., 2010) provide the first quantitative data on expected impacts on water resour-ces in eight basins between the regions of Coquimbo and Araucanía (see Figure 9) resulting from projected changes in temperature, evapo-transpiration rates, and precipita-tion corresponding to scenario A2. These basins were se-lected for their high level of human intervention and their importance in the regions analyzed. The figure shows the area of the sub-basin where the hydrological models were calibrated, the total area of the basin for each calibrated model, and dotted lines indicating the areas of basins with hydrological features similar to those studied.
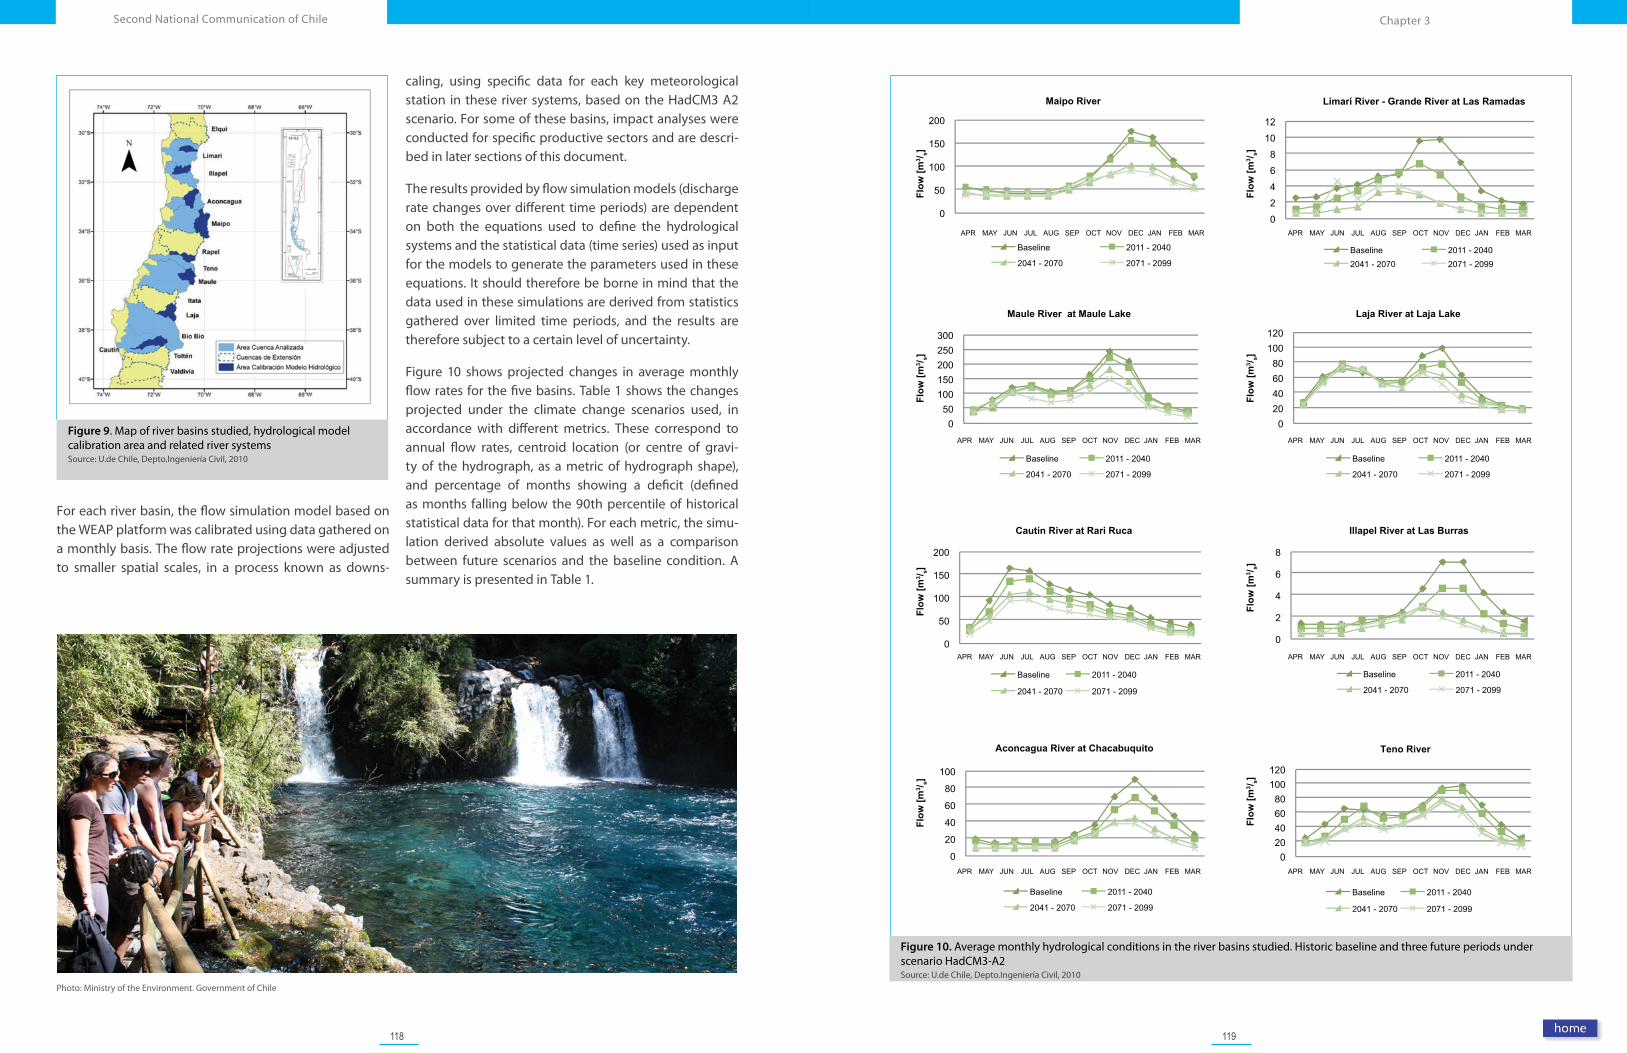
118 119
Chapter 3Second National Communication of Chile
Figure 9. Map of river basins studied, hydrological model calibration area and related river systems Source: U.de Chile, Depto.Ingeniería Civil, 2010
Photo: Ministry of the Environment. Government of Chile
For each river basin, the flow simulation model based on the WEAP platform was calibrated using data gathered on a monthly basis. The flow rate projections were adjusted to smaller spatial scales, in a process known as downs-
caling, using specific data for each key meteorological station in these river systems, based on the HadCM3 A2 scenario. For some of these basins, impact analyses were conducted for specific productive sectors and are descri-bed in later sections of this document.
The results provided by flow simulation models (discharge rate changes over different time periods) are dependent on both the equations used to define the hydrological systems and the statistical data (time series) used as input for the models to generate the parameters used in these equations. It should therefore be borne in mind that the data used in these simulations are derived from statistics gathered over limited time periods, and the results are therefore subject to a certain level of uncertainty.
Figure 10 shows projected changes in average monthly flow rates for the five basins. Table 1 shows the changes projected under the climate change scenarios used, in accordance with different metrics. These correspond to annual flow rates, centroid location (or centre of gravi-ty of the hydrograph, as a metric of hydrograph shape), and percentage of months showing a deficit (defined as months falling below the 90th percentile of historical statistical data for that month). For each metric, the simu-lation derived absolute values as well as a comparison between future scenarios and the baseline condition. A summary is presented in Table 1.
Figure 10. Average monthly hydrological conditions in the river basins studied. Historic baseline and three future periods under scenario HadCM3-A2Source: U.de Chile, Depto.Ingeniería Civil, 2010
0
2
4
6
8
10
12
APR MAY JUN JUL AUG SEP OCT NOV DEC JAN FEB MAR
Limarí River - Grande River at Las Ramadas
Baseline 2011 - 2040 2041 - 2070 2071 - 2099
0
50
100
150
200
Maipo River
Baseline 2011 - 2040
2041 - 2070 2071 - 2099
APR MAY JUN JUL AUG SEP OCT NOV DEC JAN FEB MAR
Flow
[m3 / s]
Flow
[m3 / s]
0 20 40 60 80
100 120
Laja River at Laja Lake
Baseline 2011 - 2040
2041 - 2070 2071 - 2099
APR MAY JUN JUL AUG SEP OCT NOV DEC JAN FEB MAR
0 50
100 150 200 250 300
Maule River at Maule Lake
Baseline 2011 - 2040
2041 - 2070 2071 - 2099
APR MAY JUN JUL AUG SEP OCT NOV DEC JAN FEB MAR
0
2
4
6
8
Illapel River at Las Burras
Baseline 2011 - 2040
2041 - 2070 2071 - 2099
APR MAY JUN JUL AUG SEP OCT NOV DEC JAN FEB MAR 0
50
100
150
200
Cautín River at Rari Ruca
Baseline 2011 - 2040
2041 - 2070 2071 - 2099
APR MAY JUN JUL AUG SEP OCT NOV DEC JAN FEB MAR
0 20 40 60 80
100 120
Teno River
Baseline 2011 - 2040
2041 - 2070 2071 - 2099
APR MAY JUN JUL AUG SEP OCT NOV DEC JAN FEB MAR
0
20
40
60
80
100
Aconcagua River at Chacabuquito
Baseline 2011 - 2040
2041 - 2070 2071 - 2099
APR MAY JUN JUL AUG SEP OCT NOV DEC JAN FEB MAR
Flow
[m3 / s]
Flow
[m3 / s]
Flow
[m3 / s]
Flow
[m3 / s]
Flow
[m3 / s]
Flow
[m3 / s]
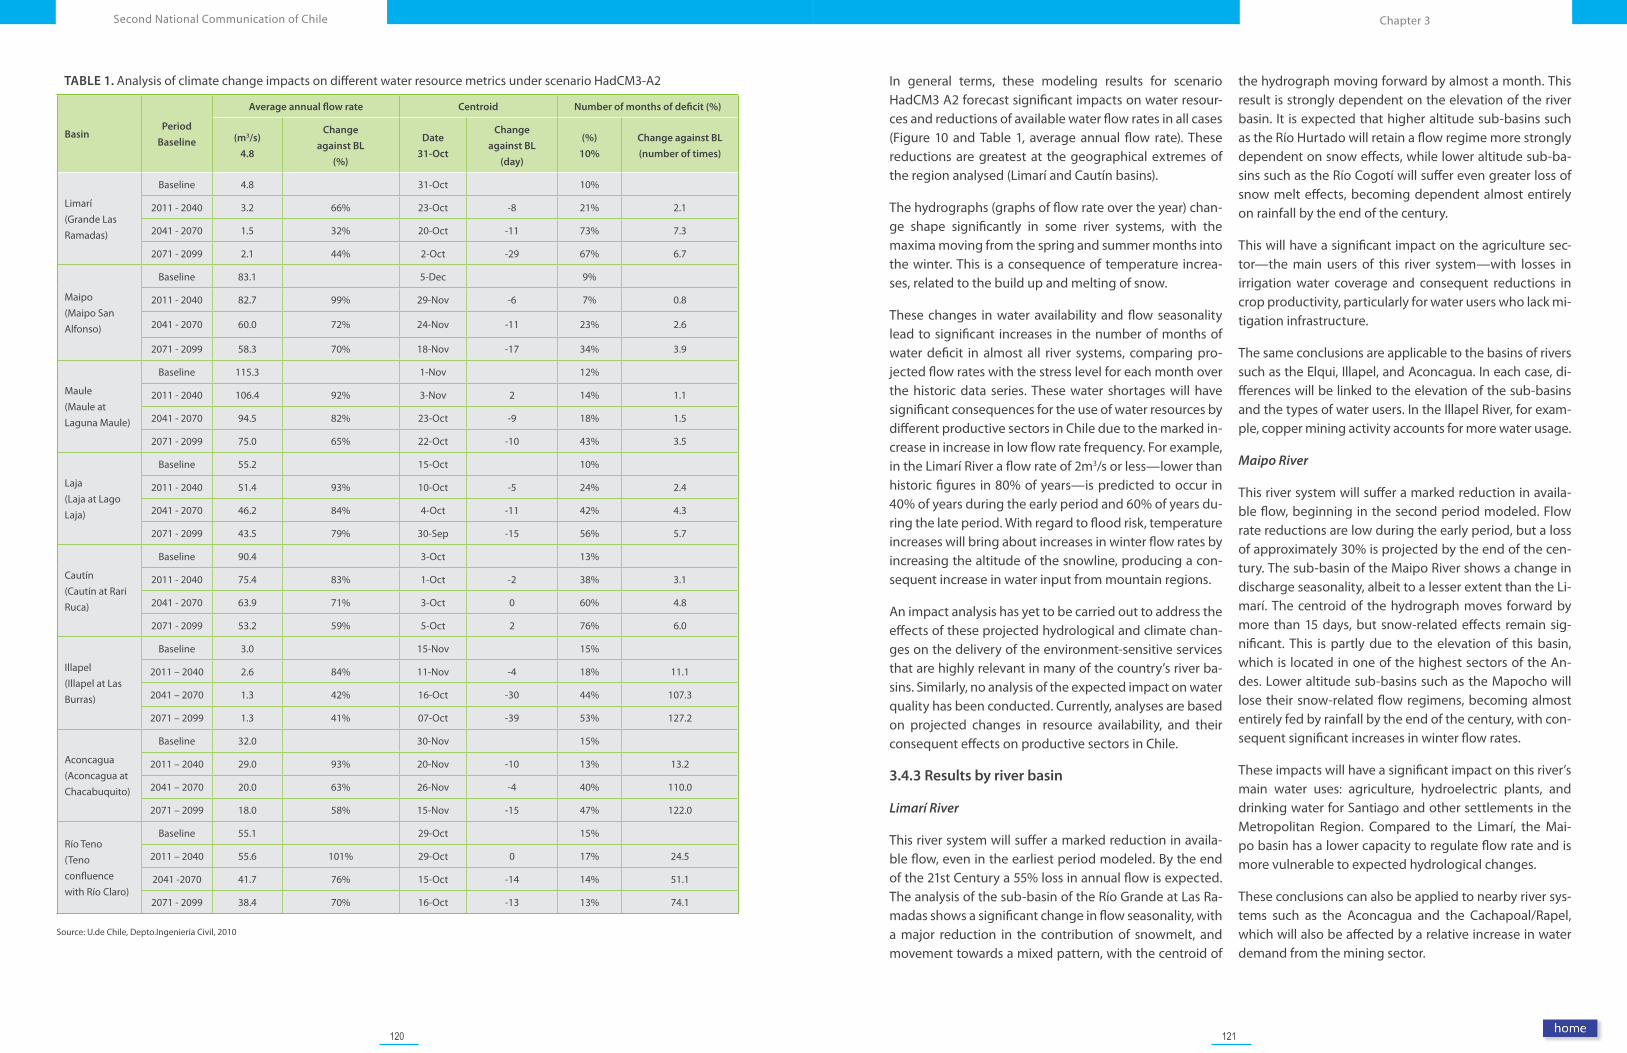
120 121
Chapter 3Second National Communication of Chile
TABLE 1. Analysis of climate change impacts on different water resource metrics under scenario HadCM3-A2
BasinPeriod
Baseline
Average annual flow rate Centroid Number of months of deficit (%)
(m3/s)
4.8
Change
against BL
(%)
Date
31-Oct
Change
against BL
(day)
(%)
10%
Change against BL
(number of times)
Limarí(Grande Las Ramadas)
Baseline 4.8 31-Oct 10%
2011 - 2040 3.2 66% 23-Oct -8 21% 2.1
2041 - 2070 1.5 32% 20-Oct -11 73% 7.3
2071 - 2099 2.1 44% 2-Oct -29 67% 6.7
Maipo(Maipo San Alfonso)
Baseline 83.1 5-Dec 9%
2011 - 2040 82.7 99% 29-Nov -6 7% 0.8
2041 - 2070 60.0 72% 24-Nov -11 23% 2.6
2071 - 2099 58.3 70% 18-Nov -17 34% 3.9
Maule(Maule at Laguna Maule)
Baseline 115.3 1-Nov 12%
2011 - 2040 106.4 92% 3-Nov 2 14% 1.1
2041 - 2070 94.5 82% 23-Oct -9 18% 1.5
2071 - 2099 75.0 65% 22-Oct -10 43% 3.5
Laja(Laja at Lago Laja)
Baseline 55.2 15-Oct 10%
2011 - 2040 51.4 93% 10-Oct -5 24% 2.4
2041 - 2070 46.2 84% 4-Oct -11 42% 4.3
2071 - 2099 43.5 79% 30-Sep -15 56% 5.7
Cautín(Cautín at Rari Ruca)
Baseline 90.4 3-Oct 13%
2011 - 2040 75.4 83% 1-Oct -2 38% 3.1
2041 - 2070 63.9 71% 3-Oct 0 60% 4.8
2071 - 2099 53.2 59% 5-Oct 2 76% 6.0
Illapel(Illapel at Las Burras)
Baseline 3.0 15-Nov 15%
2011 – 2040 2.6 84% 11-Nov -4 18% 11.1
2041 – 2070 1.3 42% 16-Oct -30 44% 107.3
2071 – 2099 1.3 41% 07-Oct -39 53% 127.2
Aconcagua (Aconcagua at Chacabuquito)
Baseline 32.0 30-Nov 15%
2011 – 2040 29.0 93% 20-Nov -10 13% 13.2
2041 – 2070 20.0 63% 26-Nov -4 40% 110.0
2071 – 2099 18.0 58% 15-Nov -15 47% 122.0
Río Teno(Teno confluence with Río Claro)
Baseline 55.1 29-Oct 15%
2011 – 2040 55.6 101% 29-Oct 0 17% 24.5
2041 -2070 41.7 76% 15-Oct -14 14% 51.1
2071 - 2099 38.4 70% 16-Oct -13 13% 74.1
Source: U.de Chile, Depto.Ingeniería Civil, 2010
In general terms, these modeling results for scenario HadCM3 A2 forecast significant impacts on water resour-ces and reductions of available water flow rates in all cases (Figure 10 and Table 1, average annual flow rate). These reductions are greatest at the geographical extremes of the region analysed (Limarí and Cautín basins).
The hydrographs (graphs of flow rate over the year) chan-ge shape significantly in some river systems, with the maxima moving from the spring and summer months into the winter. This is a consequence of temperature increa-ses, related to the build up and melting of snow.
These changes in water availability and flow seasonality lead to significant increases in the number of months of water deficit in almost all river systems, comparing pro-jected flow rates with the stress level for each month over the historic data series. These water shortages will have significant consequences for the use of water resources by different productive sectors in Chile due to the marked in-crease in increase in low flow rate frequency. For example, in the Limarí River a flow rate of 2m3/s or less—lower than historic figures in 80% of years—is predicted to occur in 40% of years during the early period and 60% of years du-ring the late period. With regard to flood risk, temperature increases will bring about increases in winter flow rates by increasing the altitude of the snowline, producing a con-sequent increase in water input from mountain regions.
An impact analysis has yet to be carried out to address the effects of these projected hydrological and climate chan-ges on the delivery of the environment-sensitive services that are highly relevant in many of the country’s river ba-sins. Similarly, no analysis of the expected impact on water quality has been conducted. Currently, analyses are based on projected changes in resource availability, and their consequent effects on productive sectors in Chile.
3.4.3 Results by river basin
Limarí River
This river system will suffer a marked reduction in availa-ble flow, even in the earliest period modeled. By the end of the 21st Century a 55% loss in annual flow is expected. The analysis of the sub-basin of the Río Grande at Las Ra-madas shows a significant change in flow seasonality, with a major reduction in the contribution of snowmelt, and movement towards a mixed pattern, with the centroid of
the hydrograph moving forward by almost a month. This result is strongly dependent on the elevation of the river basin. It is expected that higher altitude sub-basins such as the Río Hurtado will retain a flow regime more strongly dependent on snow effects, while lower altitude sub-ba-sins such as the Río Cogotí will suffer even greater loss of snow melt effects, becoming dependent almost entirely on rainfall by the end of the century.
This will have a significant impact on the agriculture sec-tor—the main users of this river system—with losses in irrigation water coverage and consequent reductions in crop productivity, particularly for water users who lack mi-tigation infrastructure.
The same conclusions are applicable to the basins of rivers such as the Elqui, Illapel, and Aconcagua. In each case, di-fferences will be linked to the elevation of the sub-basins and the types of water users. In the Illapel River, for exam-ple, copper mining activity accounts for more water usage.
Maipo River
This river system will suffer a marked reduction in availa-ble flow, beginning in the second period modeled. Flow rate reductions are low during the early period, but a loss of approximately 30% is projected by the end of the cen-tury. The sub-basin of the Maipo River shows a change in discharge seasonality, albeit to a lesser extent than the Li-marí. The centroid of the hydrograph moves forward by more than 15 days, but snow-related effects remain sig-nificant. This is partly due to the elevation of this basin, which is located in one of the highest sectors of the An-des. Lower altitude sub-basins such as the Mapocho will lose their snow-related flow regimens, becoming almost entirely fed by rainfall by the end of the century, with con-sequent significant increases in winter flow rates.
These impacts will have a significant impact on this river’s main water uses: agriculture, hydroelectric plants, and drinking water for Santiago and other settlements in the Metropolitan Region. Compared to the Limarí, the Mai-po basin has a lower capacity to regulate flow rate and is more vulnerable to expected hydrological changes.
These conclusions can also be applied to nearby river sys-tems such as the Aconcagua and the Cachapoal/Rapel, which will also be affected by a relative increase in water demand from the mining sector.
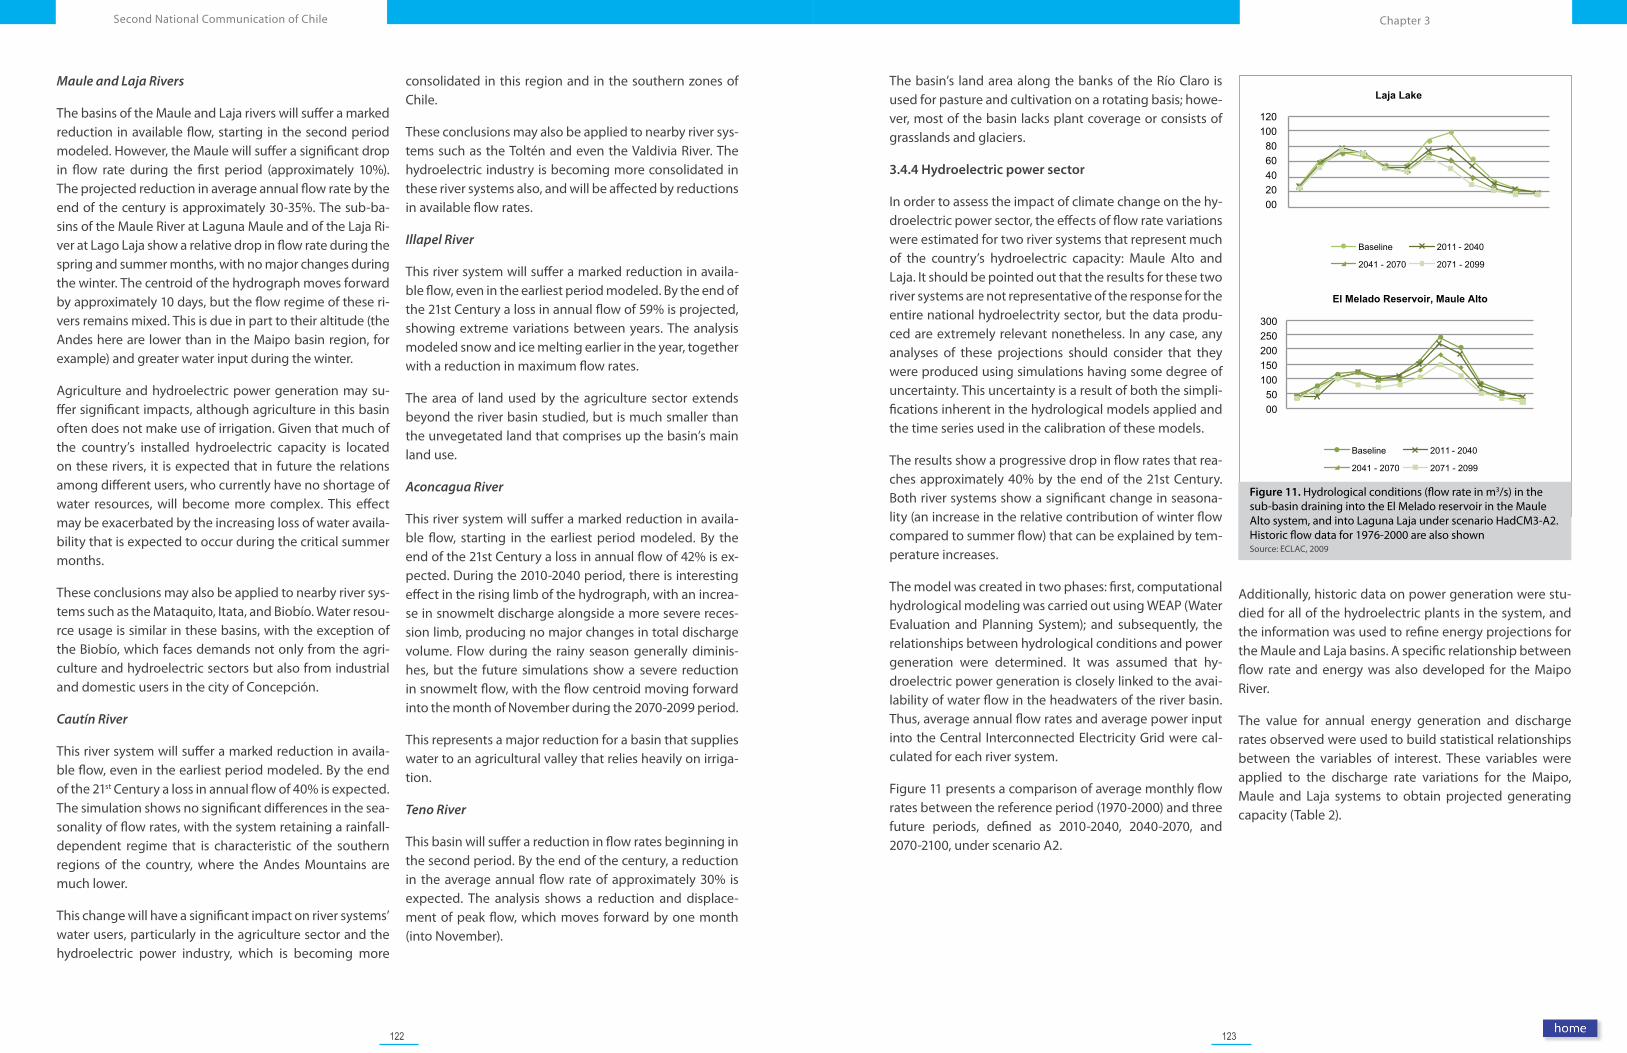
122 123
Chapter 3Second National Communication of Chile
Maule and Laja Rivers
The basins of the Maule and Laja rivers will suffer a marked reduction in available flow, starting in the second period modeled. However, the Maule will suffer a significant drop in flow rate during the first period (approximately 10%). The projected reduction in average annual flow rate by the end of the century is approximately 30-35%. The sub-ba-sins of the Maule River at Laguna Maule and of the Laja Ri-ver at Lago Laja show a relative drop in flow rate during the spring and summer months, with no major changes during the winter. The centroid of the hydrograph moves forward by approximately 10 days, but the flow regime of these ri-vers remains mixed. This is due in part to their altitude (the Andes here are lower than in the Maipo basin region, for example) and greater water input during the winter.
Agriculture and hydroelectric power generation may su-ffer significant impacts, although agriculture in this basin often does not make use of irrigation. Given that much of the country’s installed hydroelectric capacity is located on these rivers, it is expected that in future the relations among different users, who currently have no shortage of water resources, will become more complex. This effect may be exacerbated by the increasing loss of water availa-bility that is expected to occur during the critical summer months.
These conclusions may also be applied to nearby river sys-tems such as the Mataquito, Itata, and Biobío. Water resou-rce usage is similar in these basins, with the exception of the Biobío, which faces demands not only from the agri-culture and hydroelectric sectors but also from industrial and domestic users in the city of Concepción.
Cautín River
This river system will suffer a marked reduction in availa-ble flow, even in the earliest period modeled. By the end of the 21st Century a loss in annual flow of 40% is expected. The simulation shows no significant differences in the sea-sonality of flow rates, with the system retaining a rainfall-dependent regime that is characteristic of the southern regions of the country, where the Andes Mountains are much lower.
This change will have a significant impact on river systems’ water users, particularly in the agriculture sector and the hydroelectric power industry, which is becoming more
consolidated in this region and in the southern zones of Chile.
These conclusions may also be applied to nearby river sys-tems such as the Toltén and even the Valdivia River. The hydroelectric industry is becoming more consolidated in these river systems also, and will be affected by reductions in available flow rates.
Illapel River
This river system will suffer a marked reduction in availa-ble flow, even in the earliest period modeled. By the end of the 21st Century a loss in annual flow of 59% is projected, showing extreme variations between years. The analysis modeled snow and ice melting earlier in the year, together with a reduction in maximum flow rates.
The area of land used by the agriculture sector extends beyond the river basin studied, but is much smaller than the unvegetated land that comprises up the basin’s main land use.
Aconcagua River
This river system will suffer a marked reduction in availa-ble flow, starting in the earliest period modeled. By the end of the 21st Century a loss in annual flow of 42% is ex-pected. During the 2010-2040 period, there is interesting effect in the rising limb of the hydrograph, with an increa-se in snowmelt discharge alongside a more severe reces-sion limb, producing no major changes in total discharge volume. Flow during the rainy season generally diminis-hes, but the future simulations show a severe reduction in snowmelt flow, with the flow centroid moving forward into the month of November during the 2070-2099 period.
This represents a major reduction for a basin that supplies water to an agricultural valley that relies heavily on irriga-tion.
Teno River
This basin will suffer a reduction in flow rates beginning in the second period. By the end of the century, a reduction in the average annual flow rate of approximately 30% is expected. The analysis shows a reduction and displace-ment of peak flow, which moves forward by one month (into November).
The basin’s land area along the banks of the Río Claro is used for pasture and cultivation on a rotating basis; howe-ver, most of the basin lacks plant coverage or consists of grasslands and glaciers.
3.4.4 Hydroelectric power sector
In order to assess the impact of climate change on the hy-droelectric power sector, the effects of flow rate variations were estimated for two river systems that represent much of the country’s hydroelectric capacity: Maule Alto and Laja. It should be pointed out that the results for these two river systems are not representative of the response for the entire national hydroelectrity sector, but the data produ-ced are extremely relevant nonetheless. In any case, any analyses of these projections should consider that they were produced using simulations having some degree of uncertainty. This uncertainty is a result of both the simpli-fications inherent in the hydrological models applied and the time series used in the calibration of these models.
The results show a progressive drop in flow rates that rea-ches approximately 40% by the end of the 21st Century. Both river systems show a significant change in seasona-lity (an increase in the relative contribution of winter flow compared to summer flow) that can be explained by tem-perature increases.
The model was created in two phases: first, computational hydrological modeling was carried out using WEAP (Water Evaluation and Planning System); and subsequently, the relationships between hydrological conditions and power generation were determined. It was assumed that hy-droelectric power generation is closely linked to the avai-lability of water flow in the headwaters of the river basin. Thus, average annual flow rates and average power input into the Central Interconnected Electricity Grid were cal-culated for each river system.
Figure 11 presents a comparison of average monthly flow rates between the reference period (1970-2000) and three future periods, defined as 2010-2040, 2040-2070, and 2070-2100, under scenario A2.
Additionally, historic data on power generation were stu-died for all of the hydroelectric plants in the system, and the information was used to refine energy projections for the Maule and Laja basins. A specific relationship between flow rate and energy was also developed for the Maipo River.
The value for annual energy generation and discharge rates observed were used to build statistical relationships between the variables of interest. These variables were applied to the discharge rate variations for the Maipo, Maule and Laja systems to obtain projected generating capacity (Table 2).
Figure 11. Hydrological conditions (flow rate in m3/s) in the sub-basin draining into the El Melado reservoir in the Maule Alto system, and into Laguna Laja under scenario HadCM3-A2. Historic flow data for 1976-2000 are also shownSource: ECLAC, 2009
Laja Lake
Baseline 2011 - 2040
2041 - 2070 2071 - 2099
00 50
100 150 200 250 300
El Melado Reservoir, Maule Alto
Baseline 2011 - 2040
2041 - 2070 2071 - 2099
1201008060402000
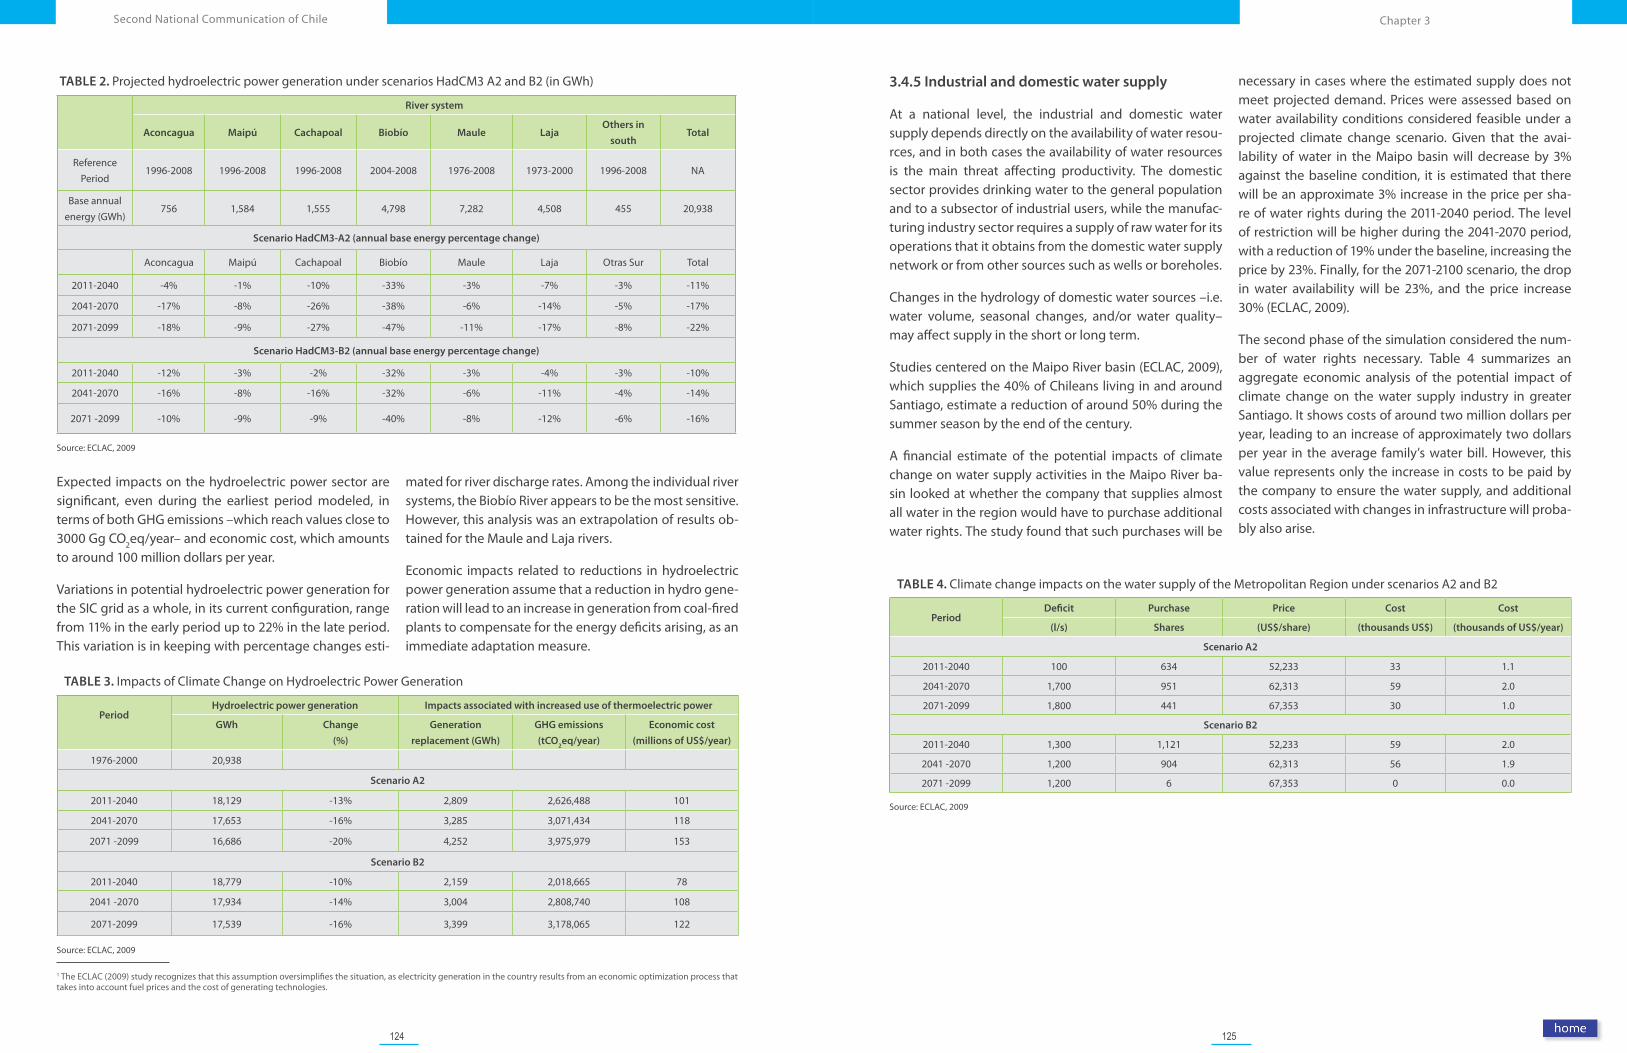
124 125
Chapter 3Second National Communication of Chile
1 The ECLAC (2009) study recognizes that this assumption oversimplifies the situation, as electricity generation in the country results from an economic optimization process that takes into account fuel prices and the cost of generating technologies.
TABLE 2. Projected hydroelectric power generation under scenarios HadCM3 A2 and B2 (in GWh)
River system
Aconcagua Maipú Cachapoal Biobío Maule LajaOthers in
southTotal
ReferencePeriod
1996-2008 1996-2008 1996-2008 2004-2008 1976-2008 1973-2000 1996-2008 NA
Base annual energy (GWh)
756 1,584 1,555 4,798 7,282 4,508 455 20,938
Scenario HadCM3-A2 (annual base energy percentage change)
Aconcagua Maipú Cachapoal Biobío Maule Laja Otras Sur Total
2011-2040 -4% -1% -10% -33% -3% -7% -3% -11%
2041-2070 -17% -8% -26% -38% -6% -14% -5% -17%
2071-2099 -18% -9% -27% -47% -11% -17% -8% -22%
Scenario HadCM3-B2 (annual base energy percentage change)
2011-2040 -12% -3% -2% -32% -3% -4% -3% -10%
2041-2070 -16% -8% -16% -32% -6% -11% -4% -14%
2071 -2099 -10% -9% -9% -40% -8% -12% -6% -16%
Source: ECLAC, 2009
TABLE 3. Impacts of Climate Change on Hydroelectric Power Generation
PeriodHydroelectric power generation Impacts associated with increased use of thermoelectric power
GWh Change
(%)
Generation
replacement (GWh)
GHG emissions
(tCO2eq/year)
Economic cost
(millions of US$/year)
1976-2000 20,938
Scenario A2
2011-2040 18,129 -13% 2,809 2,626,488 101
2041-2070 17,653 -16% 3,285 3,071,434 118
2071 -2099 16,686 -20% 4,252 3,975,979 153
Scenario B2
2011-2040 18,779 -10% 2,159 2,018,665 78
2041 -2070 17,934 -14% 3,004 2,808,740 108
2071-2099 17,539 -16% 3,399 3,178,065 122
Source: ECLAC, 2009
Expected impacts on the hydroelectric power sector are significant, even during the earliest period modeled, in terms of both GHG emissions –which reach values close to 3000 Gg CO2eq/year– and economic cost, which amounts to around 100 million dollars per year.
Variations in potential hydroelectric power generation for the SIC grid as a whole, in its current configuration, range from 11% in the early period up to 22% in the late period. This variation is in keeping with percentage changes esti-
mated for river discharge rates. Among the individual river systems, the Biobío River appears to be the most sensitive. However, this analysis was an extrapolation of results ob-tained for the Maule and Laja rivers.
Economic impacts related to reductions in hydroelectric power generation assume that a reduction in hydro gene-ration will lead to an increase in generation from coal-fired plants to compensate for the energy deficits arising, as an immediate adaptation measure.
3.4.5 Industrial and domestic water supply
At a national level, the industrial and domestic water supply depends directly on the availability of water resou-rces, and in both cases the availability of water resources is the main threat affecting productivity. The domestic sector provides drinking water to the general population and to a subsector of industrial users, while the manufac-turing industry sector requires a supply of raw water for its operations that it obtains from the domestic water supply network or from other sources such as wells or boreholes.
Changes in the hydrology of domestic water sources –i.e. water volume, seasonal changes, and/or water quality– may affect supply in the short or long term.
Studies centered on the Maipo River basin (ECLAC, 2009), which supplies the 40% of Chileans living in and around Santiago, estimate a reduction of around 50% during the summer season by the end of the century.
A financial estimate of the potential impacts of climate change on water supply activities in the Maipo River ba-sin looked at whether the company that supplies almost all water in the region would have to purchase additional water rights. The study found that such purchases will be
necessary in cases where the estimated supply does not meet projected demand. Prices were assessed based on water availability conditions considered feasible under a projected climate change scenario. Given that the avai-lability of water in the Maipo basin will decrease by 3% against the baseline condition, it is estimated that there will be an approximate 3% increase in the price per sha-re of water rights during the 2011-2040 period. The level of restriction will be higher during the 2041-2070 period, with a reduction of 19% under the baseline, increasing the price by 23%. Finally, for the 2071-2100 scenario, the drop in water availability will be 23%, and the price increase 30% (ECLAC, 2009).
The second phase of the simulation considered the num-ber of water rights necessary. Table 4 summarizes an aggregate economic analysis of the potential impact of climate change on the water supply industry in greater Santiago. It shows costs of around two million dollars per year, leading to an increase of approximately two dollars per year in the average family’s water bill. However, this value represents only the increase in costs to be paid by the company to ensure the water supply, and additional costs associated with changes in infrastructure will proba-bly also arise.
TABLE 4. Climate change impacts on the water supply of the Metropolitan Region under scenarios A2 and B2
PeriodDeficit Purchase Price Cost Cost
(l/s) Shares (US$/share) (thousands US$) (thousands of US$/year)
Scenario A2
2011-2040 100 634 52,233 33 1.1
2041-2070 1,700 951 62,313 59 2.0
2071-2099 1,800 441 67,353 30 1.0
Scenario B2
2011-2040 1,300 1,121 52,233 59 2.0
2041 -2070 1,200 904 62,313 56 1.9
2071 -2099 1,200 6 67,353 0 0.0
Source: ECLAC, 2009
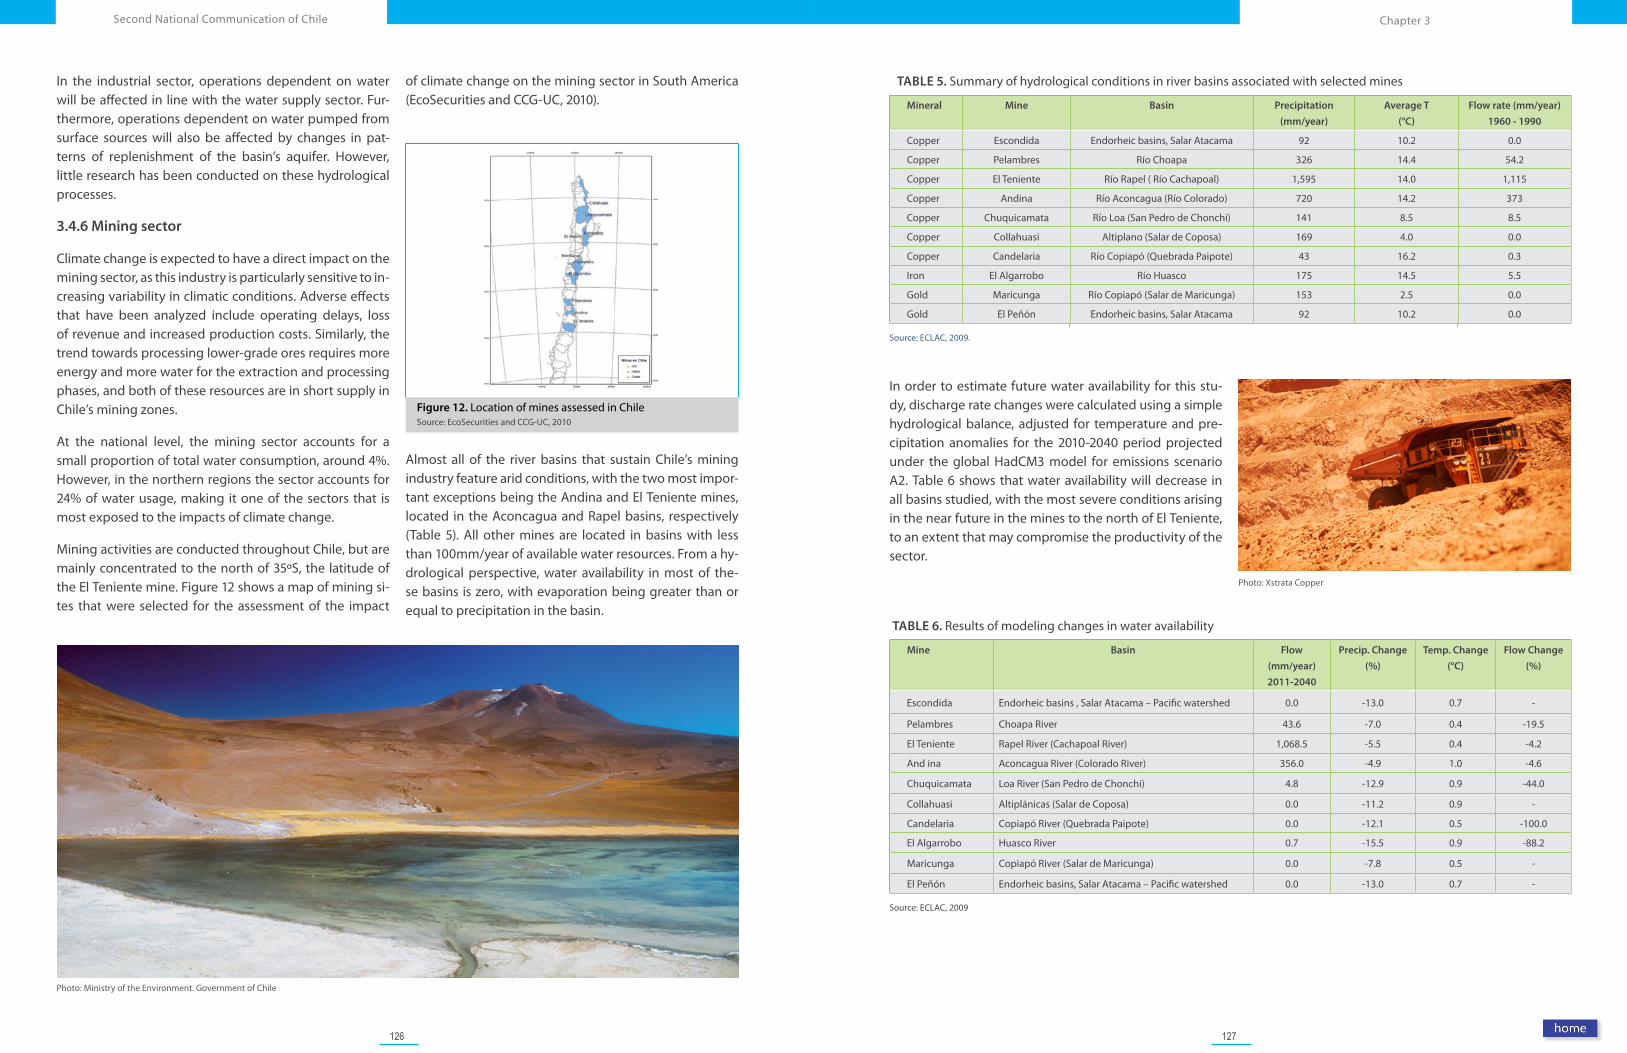
126 127
Chapter 3Second National Communication of Chile
Photo: Xstrata Copper
Figure 12. Location of mines assessed in ChileSource: EcoSecurities and CCG-UC, 2010
Photo: Ministry of the Environment. Government of Chile
In the industrial sector, operations dependent on water will be affected in line with the water supply sector. Fur-thermore, operations dependent on water pumped from surface sources will also be affected by changes in pat-terns of replenishment of the basin’s aquifer. However, little research has been conducted on these hydrological processes.
3.4.6 Mining sector
Climate change is expected to have a direct impact on the mining sector, as this industry is particularly sensitive to in-creasing variability in climatic conditions. Adverse effects that have been analyzed include operating delays, loss of revenue and increased production costs. Similarly, the trend towards processing lower-grade ores requires more energy and more water for the extraction and processing phases, and both of these resources are in short supply in Chile’s mining zones.
At the national level, the mining sector accounts for a small proportion of total water consumption, around 4%. However, in the northern regions the sector accounts for 24% of water usage, making it one of the sectors that is most exposed to the impacts of climate change.
Mining activities are conducted throughout Chile, but are mainly concentrated to the north of 35ºS, the latitude of the El Teniente mine. Figure 12 shows a map of mining si-tes that were selected for the assessment of the impact
of climate change on the mining sector in South America (EcoSecurities and CCG-UC, 2010).
Almost all of the river basins that sustain Chile’s mining industry feature arid conditions, with the two most impor-tant exceptions being the Andina and El Teniente mines, located in the Aconcagua and Rapel basins, respectively (Table 5). All other mines are located in basins with less than 100mm/year of available water resources. From a hy-drological perspective, water availability in most of the-se basins is zero, with evaporation being greater than or equal to precipitation in the basin.
TABLE 5. Summary of hydrological conditions in river basins associated with selected mines
Mineral Mine Basin Precipitation
(mm/year)
Average T
(°C)
Flow rate (mm/year)
1960 - 1990
Copper Escondida Endorheic basins, Salar Atacama 92 10.2 0.0
Copper Pelambres Río Choapa 326 14.4 54.2
Copper El Teniente Río Rapel ( Río Cachapoal) 1,595 14.0 1,115
Copper Andina Río Aconcagua (Río Colorado) 720 14.2 373
Copper Chuquicamata Río Loa (San Pedro de Chonchi) 141 8.5 8.5
Copper Collahuasi Altiplano (Salar de Coposa) 169 4.0 0.0
Copper Candelaria Río Copiapó (Quebrada Paipote) 43 16.2 0.3
Iron El Algarrobo Río Huasco 175 14.5 5.5
Gold Maricunga Río Copiapó (Salar de Maricunga) 153 2.5 0.0
Gold El Peñón Endorheic basins, Salar Atacama 92 10.2 0.0
Source: ECLAC, 2009.
In order to estimate future water availability for this stu-dy, discharge rate changes were calculated using a simple hydrological balance, adjusted for temperature and pre-cipitation anomalies for the 2010-2040 period projected under the global HadCM3 model for emissions scenario A2. Table 6 shows that water availability will decrease in all basins studied, with the most severe conditions arising in the near future in the mines to the north of El Teniente, to an extent that may compromise the productivity of the sector.
TABLE 6. Results of modeling changes in water availability
Mine Basin Flow
(mm/year)
2011-2040
Precip. Change
(%)
Temp. Change
(°C)
Flow Change
(%)
Escondida Endorheic basins , Salar Atacama – Pacific watershed 0.0 -13.0 0.7 -
Pelambres Choapa River 43.6 -7.0 0.4 -19.5
El Teniente Rapel River (Cachapoal River) 1,068.5 -5.5 0.4 -4.2
And ina Aconcagua River (Colorado River) 356.0 -4.9 1.0 -4.6
Chuquicamata Loa River (San Pedro de Chonchi) 4.8 -12.9 0.9 -44.0
Collahuasi Altiplánicas (Salar de Coposa) 0.0 -11.2 0.9 -
Candelaria Copiapó River (Quebrada Paipote) 0.0 -12.1 0.5 -100.0
El Algarrobo Huasco River 0.7 -15.5 0.9 -88.2
Maricunga Copiapó River (Salar de Maricunga) 0.0 -7.8 0.5 -
El Peñón Endorheic basins, Salar Atacama – Pacific watershed 0.0 -13.0 0.7 -
Source: ECLAC, 2009
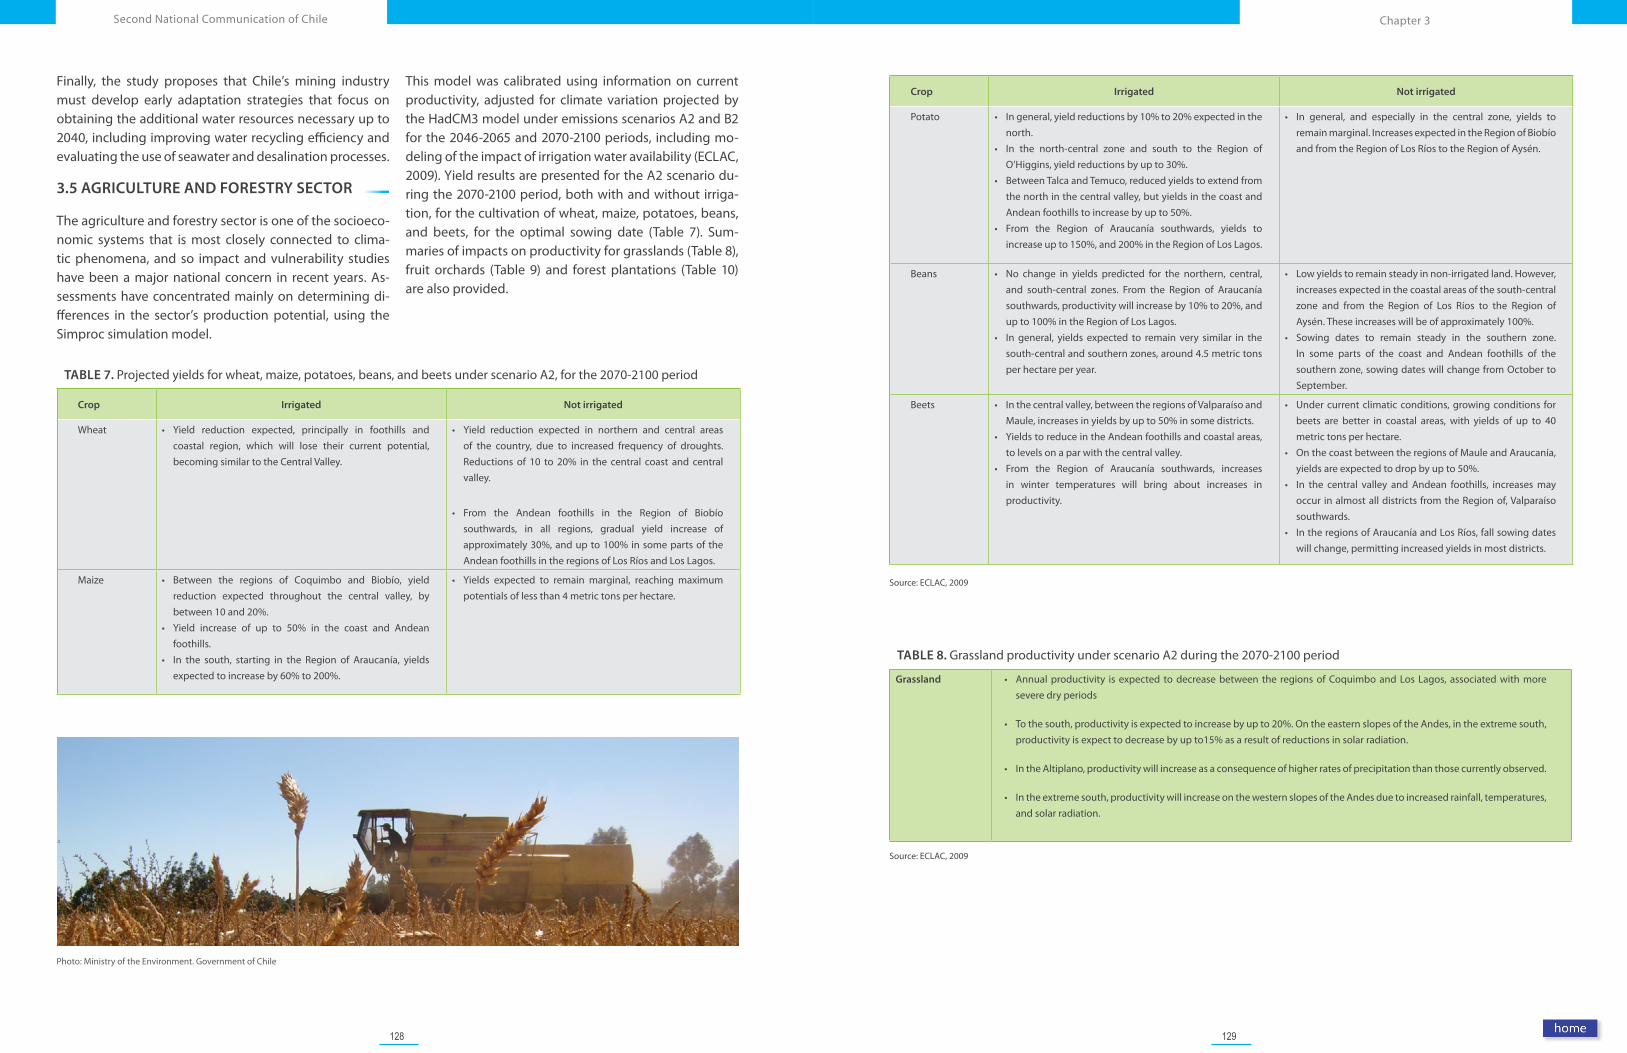
128 129
Chapter 3Second National Communication of Chile
Photo: Ministry of the Environment. Government of Chile
Finally, the study proposes that Chile’s mining industry must develop early adaptation strategies that focus on obtaining the additional water resources necessary up to 2040, including improving water recycling efficiency and evaluating the use of seawater and desalination processes.
3.5 AGRICULTURE AND FORESTRY SECTOR
The agriculture and forestry sector is one of the socioeco-nomic systems that is most closely connected to clima-tic phenomena, and so impact and vulnerability studies have been a major national concern in recent years. As-sessments have concentrated mainly on determining di-fferences in the sector’s production potential, using the Simproc simulation model.
This model was calibrated using information on current productivity, adjusted for climate variation projected by the HadCM3 model under emissions scenarios A2 and B2 for the 2046-2065 and 2070-2100 periods, including mo-deling of the impact of irrigation water availability (ECLAC, 2009). Yield results are presented for the A2 scenario du-ring the 2070-2100 period, both with and without irriga-tion, for the cultivation of wheat, maize, potatoes, beans, and beets, for the optimal sowing date (Table 7). Sum-maries of impacts on productivity for grasslands (Table 8), fruit orchards (Table 9) and forest plantations (Table 10) are also provided.
TABLE 7. Projected yields for wheat, maize, potatoes, beans, and beets under scenario A2, for the 2070-2100 period
Crop Irrigated Not irrigated
Wheat • Yield reduction expected, principally in foothills and coastal region, which will lose their current potential, becoming similar to the Central Valley.
• Yield reduction expected in northern and central areas of the country, due to increased frequency of droughts. Reductions of 10 to 20% in the central coast and central valley.
• From the Andean foothills in the Region of Biobío southwards, in all regions, gradual yield increase of approximately 30%, and up to 100% in some parts of the Andean foothills in the regions of Los Ríos and Los Lagos.
Maize • Between the regions of Coquimbo and Biobío, yield reduction expected throughout the central valley, by between 10 and 20%.
• Yield increase of up to 50% in the coast and Andean foothills.
• In the south, starting in the Region of Araucanía, yields expected to increase by 60% to 200%.
• Yields expected to remain marginal, reaching maximum potentials of less than 4 metric tons per hectare.
Crop Irrigated Not irrigated
Potato • In general, yield reductions by 10% to 20% expected in the north.
• In the north-central zone and south to the Region of O’Higgins, yield reductions by up to 30%.
• Between Talca and Temuco, reduced yields to extend from the north in the central valley, but yields in the coast and Andean foothills to increase by up to 50%.
• From the Region of Araucanía southwards, yields to increase up to 150%, and 200% in the Region of Los Lagos.
• In general, and especially in the central zone, yields to remain marginal. Increases expected in the Region of Biobío and from the Region of Los Ríos to the Region of Aysén.
Beans • No change in yields predicted for the northern, central, and south-central zones. From the Region of Araucanía southwards, productivity will increase by 10% to 20%, and up to 100% in the Region of Los Lagos.
• In general, yields expected to remain very similar in the south-central and southern zones, around 4.5 metric tons per hectare per year.
• Low yields to remain steady in non-irrigated land. However, increases expected in the coastal areas of the south-central zone and from the Region of Los Ríos to the Region of Aysén. These increases will be of approximately 100%.
• Sowing dates to remain steady in the southern zone. In some parts of the coast and Andean foothills of the southern zone, sowing dates will change from October to September.
Beets • In the central valley, between the regions of Valparaíso and Maule, increases in yields by up to 50% in some districts.
• Yields to reduce in the Andean foothills and coastal areas, to levels on a par with the central valley.
• From the Region of Araucanía southwards, increases in winter temperatures will bring about increases in productivity.
• Under current climatic conditions, growing conditions for beets are better in coastal areas, with yields of up to 40 metric tons per hectare.
• On the coast between the regions of Maule and Araucanía, yields are expected to drop by up to 50%.
• In the central valley and Andean foothills, increases may occur in almost all districts from the Region of, Valparaíso southwards.
• In the regions of Araucanía and Los Ríos, fall sowing dates will change, permitting increased yields in most districts.
Source: ECLAC, 2009
TABLE 8. Grassland productivity under scenario A2 during the 2070-2100 period
Grassland • Annual productivity is expected to decrease between the regions of Coquimbo and Los Lagos, associated with more severe dry periods
• To the south, productivity is expected to increase by up to 20%. On the eastern slopes of the Andes, in the extreme south, productivity is expect to decrease by up to15% as a result of reductions in solar radiation.
• In the Altiplano, productivity will increase as a consequence of higher rates of precipitation than those currently observed.
• In the extreme south, productivity will increase on the western slopes of the Andes due to increased rainfall, temperatures, and solar radiation.
Source: ECLAC, 2009
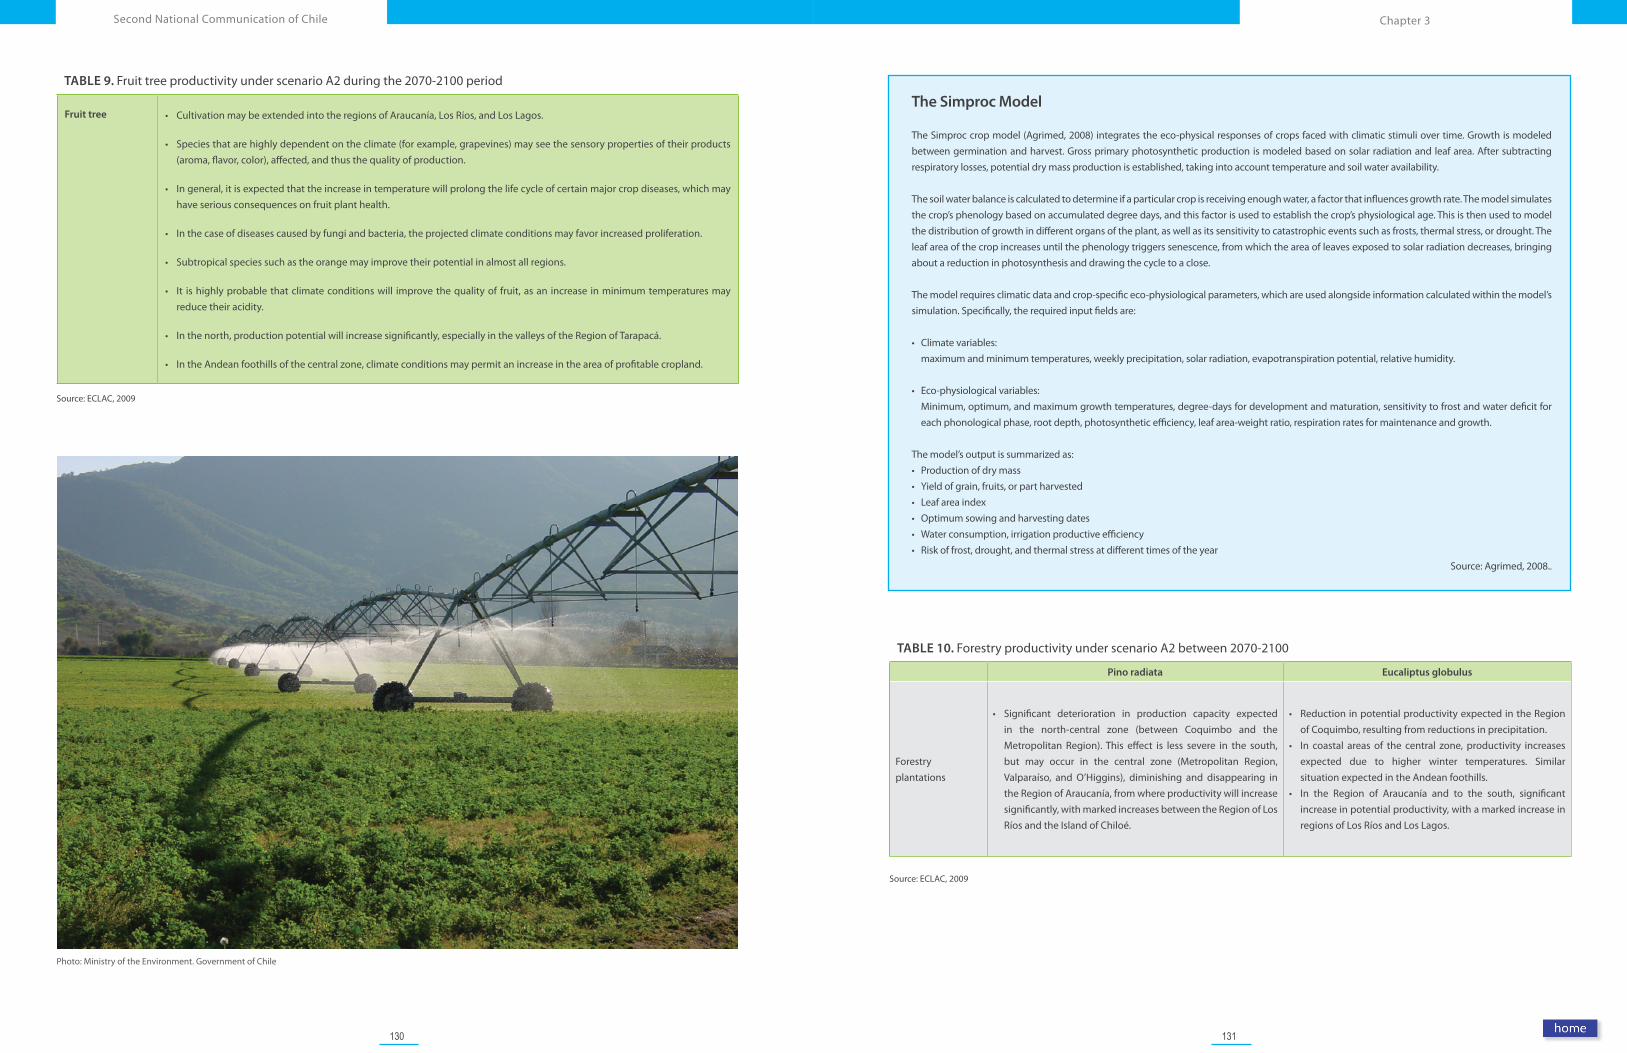
130 131
Chapter 3Second National Communication of Chile
The Simproc Model
The Simproc crop model (Agrimed, 2008) integrates the eco-physical responses of crops faced with climatic stimuli over time. Growth is modeled between germination and harvest. Gross primary photosynthetic production is modeled based on solar radiation and leaf area. After subtracting respiratory losses, potential dry mass production is established, taking into account temperature and soil water availability.
The soil water balance is calculated to determine if a particular crop is receiving enough water, a factor that influences growth rate. The model simulates the crop’s phenology based on accumulated degree days, and this factor is used to establish the crop’s physiological age. This is then used to model the distribution of growth in different organs of the plant, as well as its sensitivity to catastrophic events such as frosts, thermal stress, or drought. The leaf area of the crop increases until the phenology triggers senescence, from which the area of leaves exposed to solar radiation decreases, bringing about a reduction in photosynthesis and drawing the cycle to a close.
The model requires climatic data and crop-specific eco-physiological parameters, which are used alongside information calculated within the model’s simulation. Specifically, the required input fields are:
• Climatevariables: maximum and minimum temperatures, weekly precipitation, solar radiation, evapotranspiration potential, relative humidity.
• Eco-physiologicalvariables: Minimum, optimum, and maximum growth temperatures, degree-days for development and maturation, sensitivity to frost and water deficit for
each phonological phase, root depth, photosynthetic efficiency, leaf area-weight ratio, respiration rates for maintenance and growth.
The model’s output is summarized as:• Productionofdrymass• Yieldofgrain,fruits,orpartharvested• Leafareaindex• Optimumsowingandharvestingdates• Waterconsumption,irrigationproductiveefficiency• Riskoffrost,drought,andthermalstressatdifferenttimesoftheyear
Source: Agrimed, 2008..
Photo: Ministry of the Environment. Government of Chile
TABLE 9. Fruit tree productivity under scenario A2 during the 2070-2100 period
Fruit tree • Cultivation may be extended into the regions of Araucanía, Los Ríos, and Los Lagos.
• Species that are highly dependent on the climate (for example, grapevines) may see the sensory properties of their products (aroma, flavor, color), affected, and thus the quality of production.
• In general, it is expected that the increase in temperature will prolong the life cycle of certain major crop diseases, which may have serious consequences on fruit plant health.
• In the case of diseases caused by fungi and bacteria, the projected climate conditions may favor increased proliferation.
• Subtropical species such as the orange may improve their potential in almost all regions.
• It is highly probable that climate conditions will improve the quality of fruit, as an increase in minimum temperatures may reduce their acidity.
• In the north, production potential will increase significantly, especially in the valleys of the Region of Tarapacá.
• In the Andean foothills of the central zone, climate conditions may permit an increase in the area of profitable cropland.
Source: ECLAC, 2009
TABLE 10. Forestry productivity under scenario A2 between 2070-2100
Pino radiata Eucaliptus globulus
Forestry plantations
• Significant deterioration in production capacity expected in the north-central zone (between Coquimbo and the Metropolitan Region). This effect is less severe in the south, but may occur in the central zone (Metropolitan Region, Valparaíso, and O’Higgins), diminishing and disappearing in the Region of Araucanía, from where productivity will increase significantly, with marked increases between the Region of Los Ríos and the Island of Chiloé.
• Reduction in potential productivity expected in the Region of Coquimbo, resulting from reductions in precipitation.
• In coastal areas of the central zone, productivity increases expected due to higher winter temperatures. Similar situation expected in the Andean foothills.
• In the Region of Araucanía and to the south, significant increase in potential productivity, with a marked increase in regions of Los Ríos and Los Lagos.
Source: ECLAC, 2009
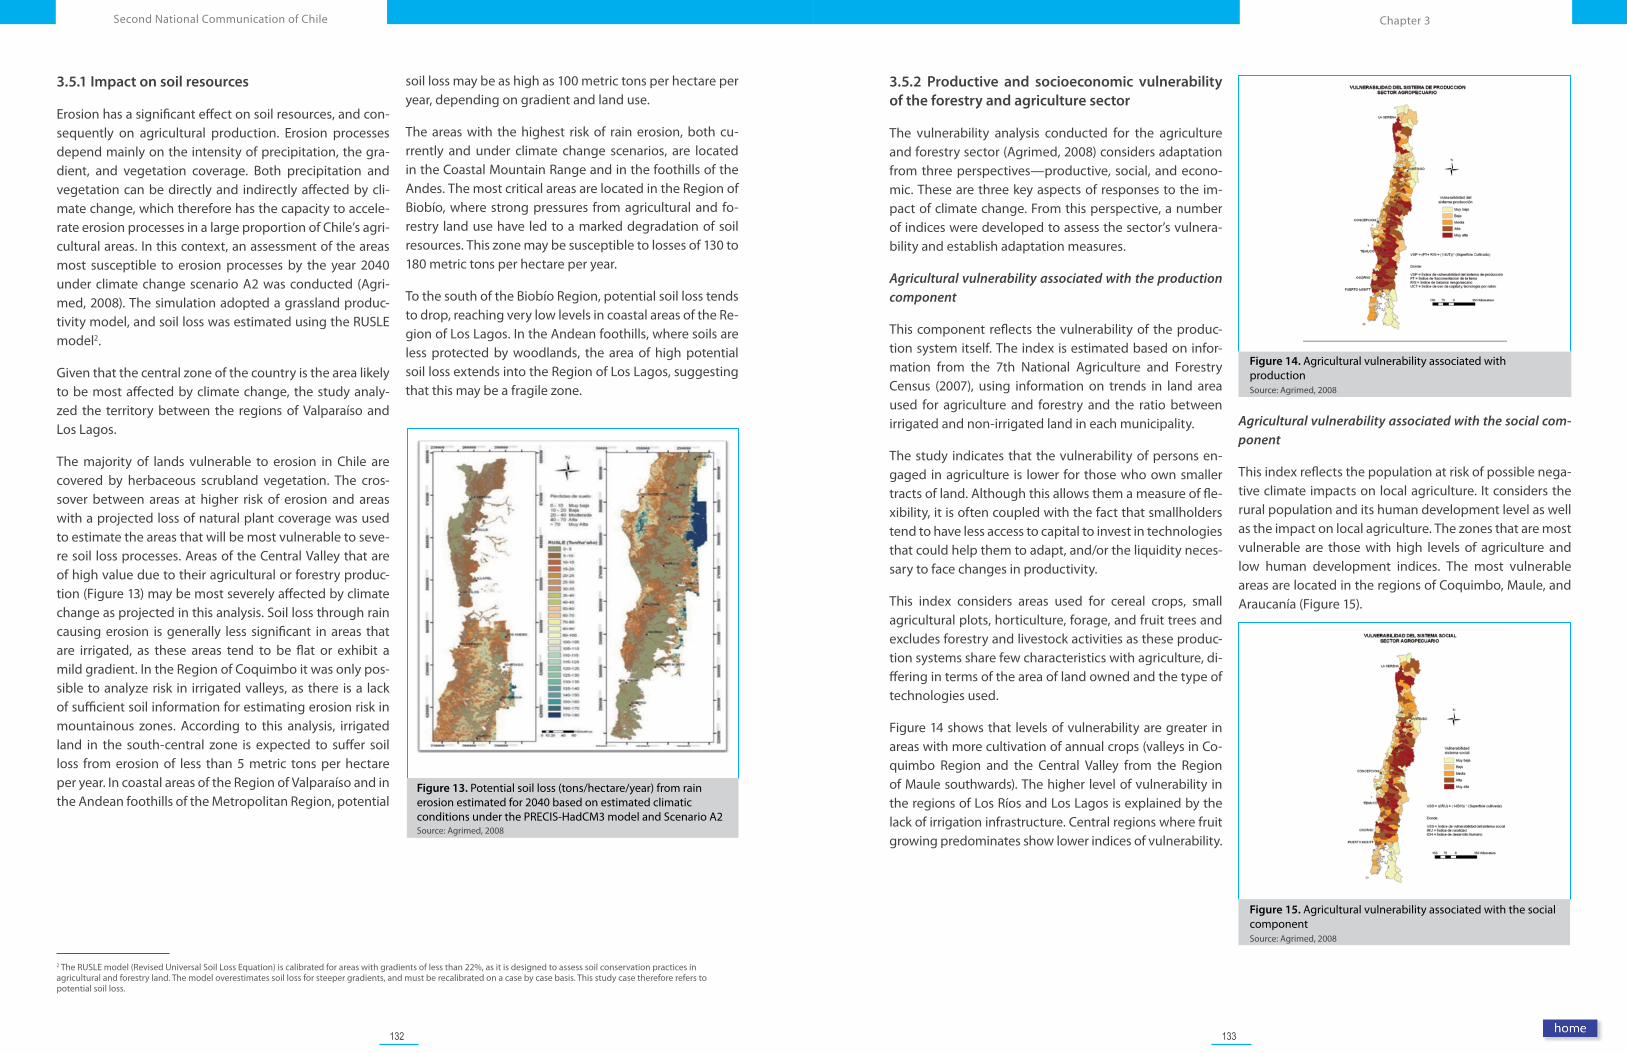
132 133
Chapter 3Second National Communication of Chile
Figure 14. Agricultural vulnerability associated with production Source: Agrimed, 2008
Figure 15. Agricultural vulnerability associated with the social componentSource: Agrimed, 2008
2 The RUSLE model (Revised Universal Soil Loss Equation) is calibrated for areas with gradients of less than 22%, as it is designed to assess soil conservation practices in agricultural and forestry land. The model overestimates soil loss for steeper gradients, and must be recalibrated on a case by case basis. This study case therefore refers to potential soil loss.
Figure 13. Potential soil loss (tons/hectare/year) from rain erosion estimated for 2040 based on estimated climatic conditions under the PRECIS-HadCM3 model and Scenario A2Source: Agrimed, 2008
3.5.1 Impact on soil resources
Erosion has a significant effect on soil resources, and con-sequently on agricultural production. Erosion processes depend mainly on the intensity of precipitation, the gra-dient, and vegetation coverage. Both precipitation and vegetation can be directly and indirectly affected by cli-mate change, which therefore has the capacity to accele-rate erosion processes in a large proportion of Chile’s agri-cultural areas. In this context, an assessment of the areas most susceptible to erosion processes by the year 2040 under climate change scenario A2 was conducted (Agri-med, 2008). The simulation adopted a grassland produc-tivity model, and soil loss was estimated using the RUSLE model2.
Given that the central zone of the country is the area likely to be most affected by climate change, the study analy-zed the territory between the regions of Valparaíso and Los Lagos.
The majority of lands vulnerable to erosion in Chile are covered by herbaceous scrubland vegetation. The cros-sover between areas at higher risk of erosion and areas with a projected loss of natural plant coverage was used to estimate the areas that will be most vulnerable to seve-re soil loss processes. Areas of the Central Valley that are of high value due to their agricultural or forestry produc-tion (Figure 13) may be most severely affected by climate change as projected in this analysis. Soil loss through rain causing erosion is generally less significant in areas that are irrigated, as these areas tend to be flat or exhibit a mild gradient. In the Region of Coquimbo it was only pos-sible to analyze risk in irrigated valleys, as there is a lack of sufficient soil information for estimating erosion risk in mountainous zones. According to this analysis, irrigated land in the south-central zone is expected to suffer soil loss from erosion of less than 5 metric tons per hectare per year. In coastal areas of the Region of Valparaíso and in the Andean foothills of the Metropolitan Region, potential
soil loss may be as high as 100 metric tons per hectare per year, depending on gradient and land use.
The areas with the highest risk of rain erosion, both cu-rrently and under climate change scenarios, are located in the Coastal Mountain Range and in the foothills of the Andes. The most critical areas are located in the Region of Biobío, where strong pressures from agricultural and fo-restry land use have led to a marked degradation of soil resources. This zone may be susceptible to losses of 130 to 180 metric tons per hectare per year.
To the south of the Biobío Region, potential soil loss tends to drop, reaching very low levels in coastal areas of the Re-gion of Los Lagos. In the Andean foothills, where soils are less protected by woodlands, the area of high potential soil loss extends into the Region of Los Lagos, suggesting that this may be a fragile zone.
3.5.2 Productive and socioeconomic vulnerability of the forestry and agriculture sector
The vulnerability analysis conducted for the agriculture and forestry sector (Agrimed, 2008) considers adaptation from three perspectives—productive, social, and econo-mic. These are three key aspects of responses to the im-pact of climate change. From this perspective, a number of indices were developed to assess the sector’s vulnera-bility and establish adaptation measures.
Agricultural vulnerability associated with the production component
This component reflects the vulnerability of the produc-tion system itself. The index is estimated based on infor-mation from the 7th National Agriculture and Forestry Census (2007), using information on trends in land area used for agriculture and forestry and the ratio between irrigated and non-irrigated land in each municipality.
The study indicates that the vulnerability of persons en-gaged in agriculture is lower for those who own smaller tracts of land. Although this allows them a measure of fle-xibility, it is often coupled with the fact that smallholders tend to have less access to capital to invest in technologies that could help them to adapt, and/or the liquidity neces-sary to face changes in productivity.
This index considers areas used for cereal crops, small agricultural plots, horticulture, forage, and fruit trees and excludes forestry and livestock activities as these produc-tion systems share few characteristics with agriculture, di-ffering in terms of the area of land owned and the type of technologies used.
Figure 14 shows that levels of vulnerability are greater in areas with more cultivation of annual crops (valleys in Co-quimbo Region and the Central Valley from the Region of Maule southwards). The higher level of vulnerability in the regions of Los Ríos and Los Lagos is explained by the lack of irrigation infrastructure. Central regions where fruit growing predominates show lower indices of vulnerability.
Agricultural vulnerability associated with the social com-ponent
This index reflects the population at risk of possible nega-tive climate impacts on local agriculture. It considers the rural population and its human development level as well as the impact on local agriculture. The zones that are most vulnerable are those with high levels of agriculture and low human development indices. The most vulnerable areas are located in the regions of Coquimbo, Maule, and Araucanía (Figure 15).
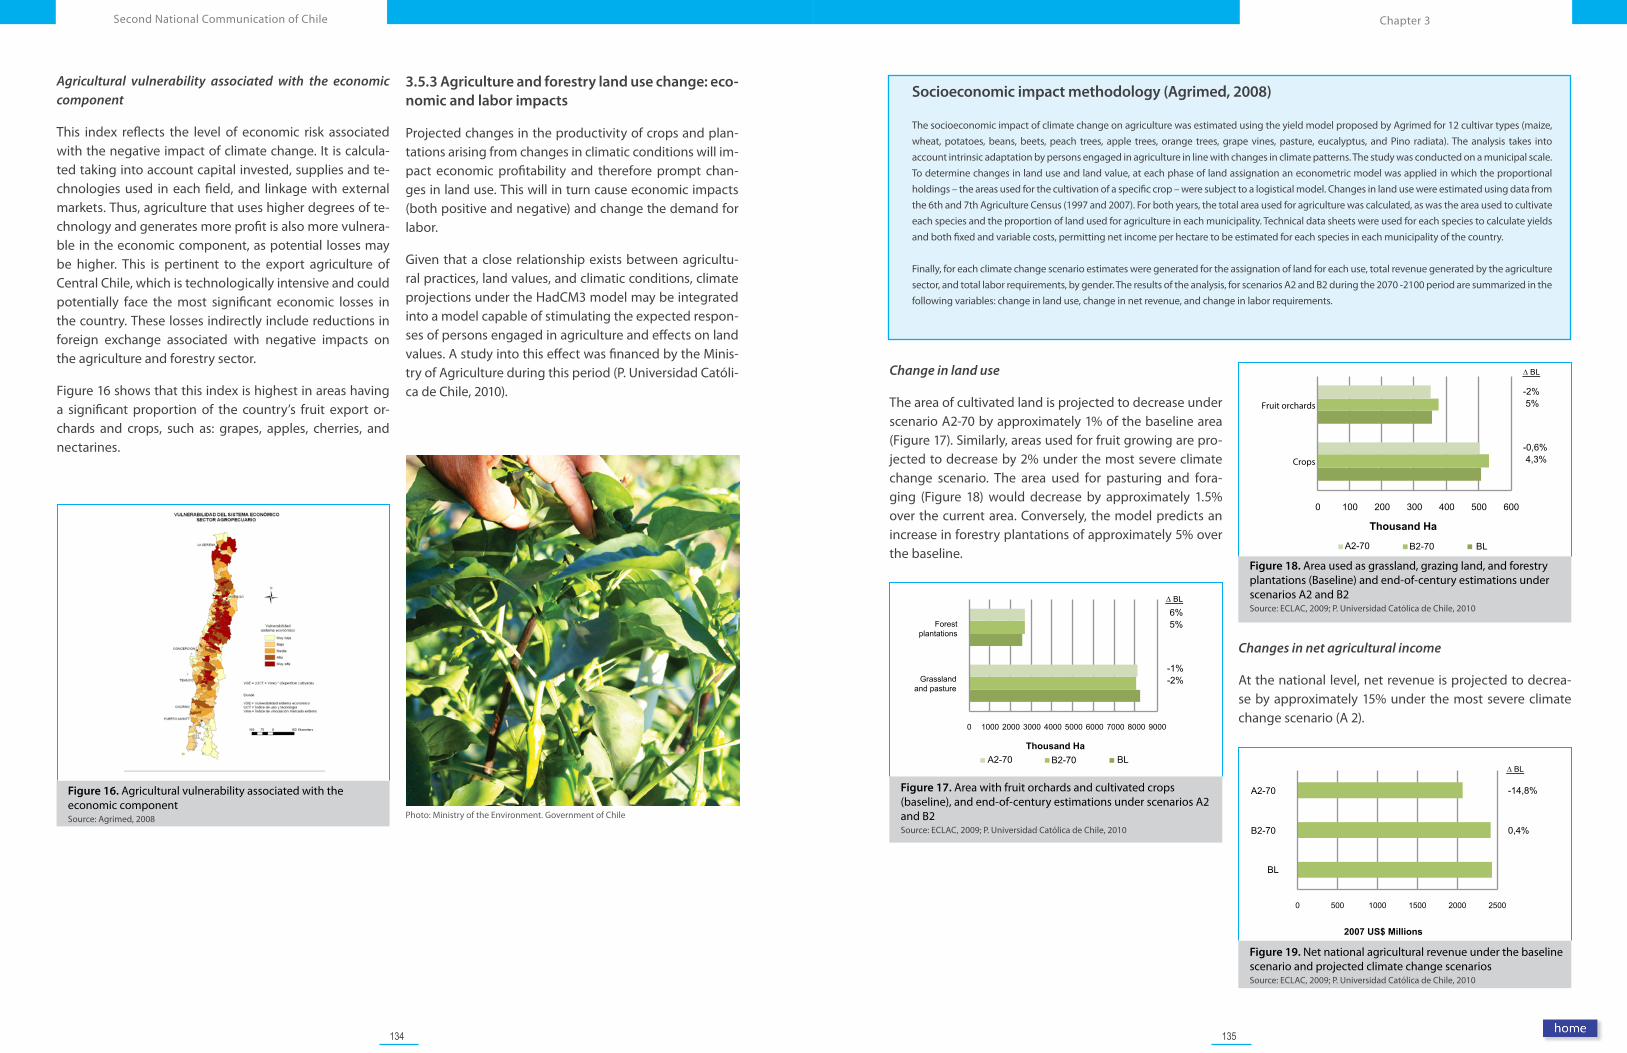
134 135
Chapter 3Second National Communication of Chile
Socioeconomic impact methodology (Agrimed, 2008)
The socioeconomic impact of climate change on agriculture was estimated using the yield model proposed by Agrimed for 12 cultivar types (maize, wheat, potatoes, beans, beets, peach trees, apple trees, orange trees, grape vines, pasture, eucalyptus, and Pino radiata). The analysis takes into account intrinsic adaptation by persons engaged in agriculture in line with changes in climate patterns. The study was conducted on a municipal scale. To determine changes in land use and land value, at each phase of land assignation an econometric model was applied in which the proportional holdings – the areas used for the cultivation of a specific crop – were subject to a logistical model. Changes in land use were estimated using data from the 6th and 7th Agriculture Census (1997 and 2007). For both years, the total area used for agriculture was calculated, as was the area used to cultivate each species and the proportion of land used for agriculture in each municipality. Technical data sheets were used for each species to calculate yields and both fixed and variable costs, permitting net income per hectare to be estimated for each species in each municipality of the country.
Finally, for each climate change scenario estimates were generated for the assignation of land for each use, total revenue generated by the agriculture sector, and total labor requirements, by gender. The results of the analysis, for scenarios A2 and B2 during the 2070 -2100 period are summarized in the following variables: change in land use, change in net revenue, and change in labor requirements.
Figure 16. Agricultural vulnerability associated with the economic componentSource: Agrimed, 2008 Photo: Ministry of the Environment. Government of Chile
Agricultural vulnerability associated with the economic component
This index reflects the level of economic risk associated with the negative impact of climate change. It is calcula-ted taking into account capital invested, supplies and te-chnologies used in each field, and linkage with external markets. Thus, agriculture that uses higher degrees of te-chnology and generates more profit is also more vulnera-ble in the economic component, as potential losses may be higher. This is pertinent to the export agriculture of Central Chile, which is technologically intensive and could potentially face the most significant economic losses in the country. These losses indirectly include reductions in foreign exchange associated with negative impacts on the agriculture and forestry sector.
Figure 16 shows that this index is highest in areas having a significant proportion of the country’s fruit export or-chards and crops, such as: grapes, apples, cherries, and nectarines.
3.5.3 Agriculture and forestry land use change: eco-nomic and labor impacts
Projected changes in the productivity of crops and plan-tations arising from changes in climatic conditions will im-pact economic profitability and therefore prompt chan-ges in land use. This will in turn cause economic impacts (both positive and negative) and change the demand for labor.
Given that a close relationship exists between agricultu-ral practices, land values, and climatic conditions, climate projections under the HadCM3 model may be integrated into a model capable of stimulating the expected respon-ses of persons engaged in agriculture and effects on land values. A study into this effect was financed by the Minis-try of Agriculture during this period (P. Universidad Católi-ca de Chile, 2010).
Change in land use
The area of cultivated land is projected to decrease under scenario A2-70 by approximately 1% of the baseline area (Figure 17). Similarly, areas used for fruit growing are pro-jected to decrease by 2% under the most severe climate change scenario. The area used for pasturing and fora-ging (Figure 18) would decrease by approximately 1.5% over the current area. Conversely, the model predicts an increase in forestry plantations of approximately 5% over the baseline.
Changes in net agricultural income
At the national level, net revenue is projected to decrea-se by approximately 15% under the most severe climate change scenario (A 2).
Figure 17. Area with fruit orchards and cultivated crops (baseline), and end-of-century estimations under scenarios A2 and B2Source: ECLAC, 2009; P. Universidad Católica de Chile, 2010
Figure 18. Area used as grassland, grazing land, and forestry plantations (Baseline) and end-of-century estimations under scenarios A2 and B2Source: ECLAC, 2009; P. Universidad Católica de Chile, 2010
Figure 19. Net national agricultural revenue under the baseline scenario and projected climate change scenariosSource: ECLAC, 2009; P. Universidad Católica de Chile, 2010
0 500 1000 1500 2000 2500
BL
B2-70
A2-70
2007 US$ Millions
-14,8%
0,4%
0 1000 2000 3000 4000 5000 6000 7000 8000 9000
Grassland and pasture
Forestplantations
Thousand Ha
6% 5%
-1% -2%
BLB2-70 A2-70
0 100 200 300 400 500 600
Fruit orchards
Crops
Thousand Ha
BLB2-70 A2-70
-2% 5%
-0,6% 4,3%
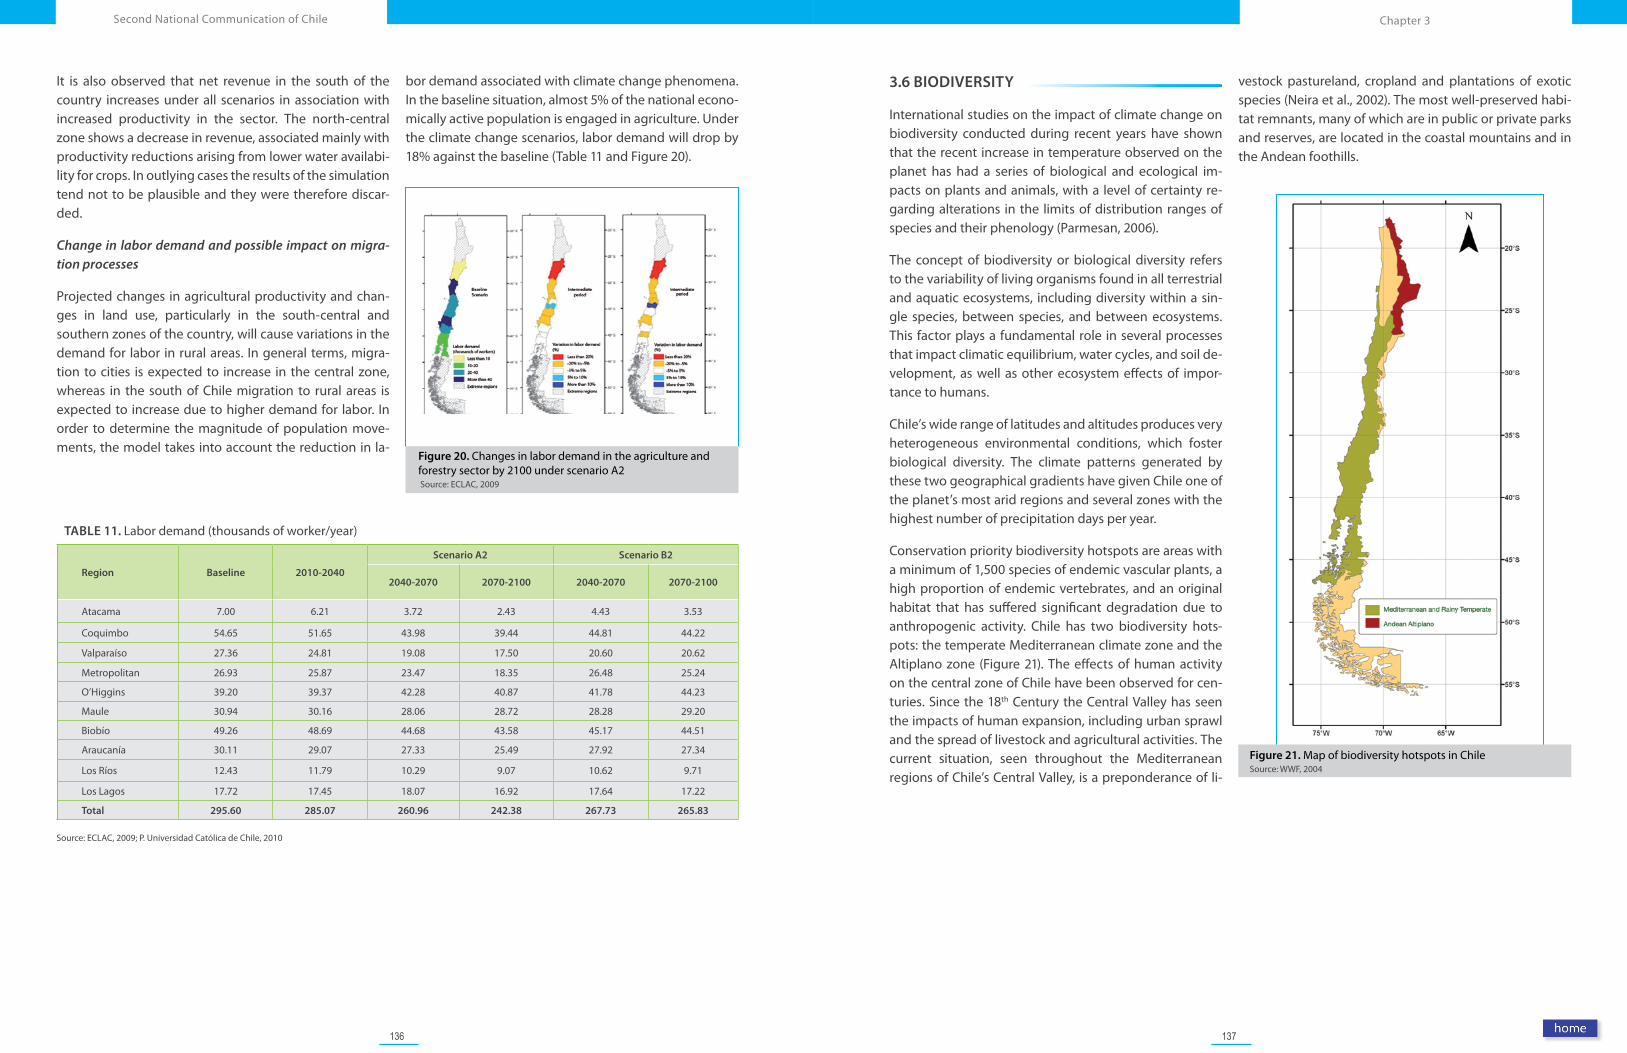
136 137
Chapter 3Second National Communication of Chile
Figure 21. Map of biodiversity hotspots in ChileSource: WWF, 2004
Figure 20. Changes in labor demand in the agriculture and forestry sector by 2100 under scenario A2 Source: ECLAC, 2009
It is also observed that net revenue in the south of the country increases under all scenarios in association with increased productivity in the sector. The north-central zone shows a decrease in revenue, associated mainly with productivity reductions arising from lower water availabi-lity for crops. In outlying cases the results of the simulation tend not to be plausible and they were therefore discar-ded.
Change in labor demand and possible impact on migra-tion processes
Projected changes in agricultural productivity and chan-ges in land use, particularly in the south-central and southern zones of the country, will cause variations in the demand for labor in rural areas. In general terms, migra-tion to cities is expected to increase in the central zone, whereas in the south of Chile migration to rural areas is expected to increase due to higher demand for labor. In order to determine the magnitude of population move-ments, the model takes into account the reduction in la-
bor demand associated with climate change phenomena. In the baseline situation, almost 5% of the national econo-mically active population is engaged in agriculture. Under the climate change scenarios, labor demand will drop by 18% against the baseline (Table 11 and Figure 20).
TABLE 11. Labor demand (thousands of worker/year)
Region Baseline 2010-2040
Scenario A2 Scenario B2
2040-2070 2070-2100 2040-2070 2070-2100
Atacama 7.00 6.21 3.72 2.43 4.43 3.53
Coquimbo 54.65 51.65 43.98 39.44 44.81 44.22
Valparaíso 27.36 24.81 19.08 17.50 20.60 20.62
Metropolitan 26.93 25.87 23.47 18.35 26.48 25.24
O’Higgins 39.20 39.37 42.28 40.87 41.78 44.23
Maule 30.94 30.16 28.06 28.72 28.28 29.20
Biobío 49.26 48.69 44.68 43.58 45.17 44.51
Araucanía 30.11 29.07 27.33 25.49 27.92 27.34
Los Ríos 12.43 11.79 10.29 9.07 10.62 9.71
Los Lagos 17.72 17.45 18.07 16.92 17.64 17.22
Total 295.60 285.07 260.96 242.38 267.73 265.83
Source: ECLAC, 2009; P. Universidad Católica de Chile, 2010
3.6 BIODIVERSITY
International studies on the impact of climate change on biodiversity conducted during recent years have shown that the recent increase in temperature observed on the planet has had a series of biological and ecological im-pacts on plants and animals, with a level of certainty re-garding alterations in the limits of distribution ranges of species and their phenology (Parmesan, 2006).
The concept of biodiversity or biological diversity refers to the variability of living organisms found in all terrestrial and aquatic ecosystems, including diversity within a sin-gle species, between species, and between ecosystems. This factor plays a fundamental role in several processes that impact climatic equilibrium, water cycles, and soil de-velopment, as well as other ecosystem effects of impor-tance to humans.
Chile’s wide range of latitudes and altitudes produces very heterogeneous environmental conditions, which foster biological diversity. The climate patterns generated by these two geographical gradients have given Chile one of the planet’s most arid regions and several zones with the highest number of precipitation days per year.
Conservation priority biodiversity hotspots are areas with a minimum of 1,500 species of endemic vascular plants, a high proportion of endemic vertebrates, and an original habitat that has suffered significant degradation due to anthropogenic activity. Chile has two biodiversity hots-pots: the temperate Mediterranean climate zone and the Altiplano zone (Figure 21). The effects of human activity on the central zone of Chile have been observed for cen-turies. Since the 18th Century the Central Valley has seen the impacts of human expansion, including urban sprawl and the spread of livestock and agricultural activities. The current situation, seen throughout the Mediterranean regions of Chile’s Central Valley, is a preponderance of li-
vestock pastureland, cropland and plantations of exotic species (Neira et al., 2002). The most well-preserved habi-tat remnants, many of which are in public or private parks and reserves, are located in the coastal mountains and in the Andean foothills.
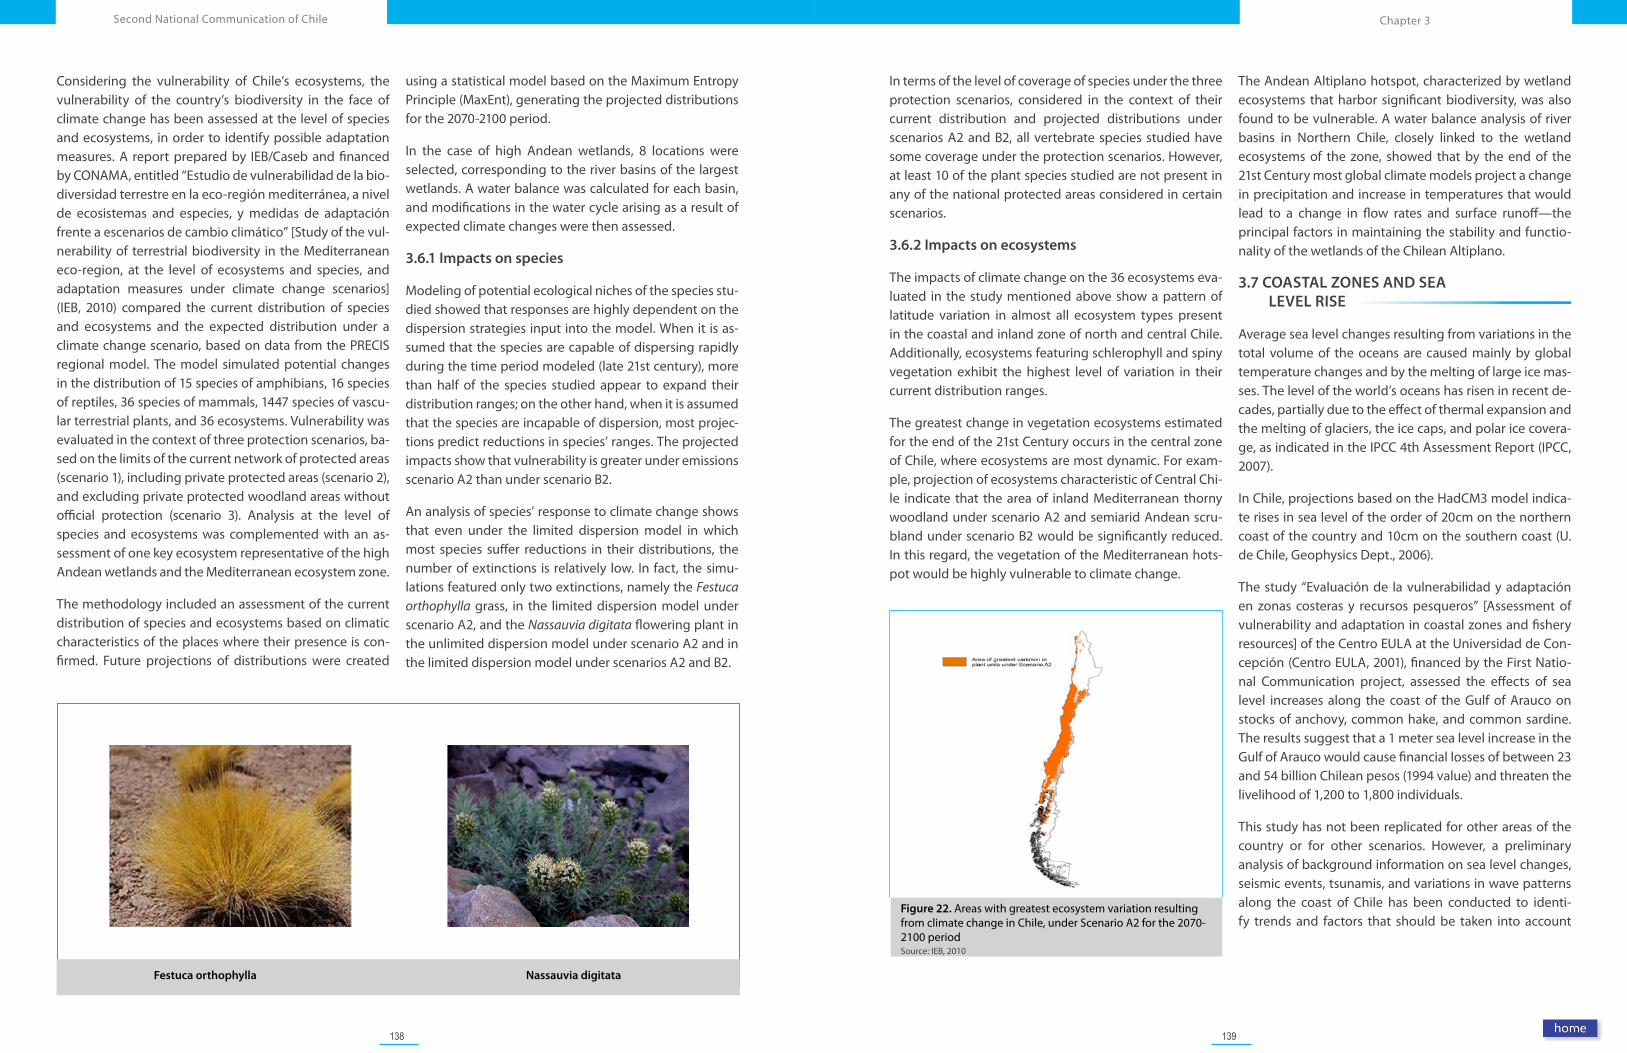
138 139
Chapter 3Second National Communication of Chile
Figure 22. Areas with greatest ecosystem variation resulting from climate change in Chile, under Scenario A2 for the 2070-2100 period Source: IEB, 2010
Festuca orthophylla Nassauvia digitata
Considering the vulnerability of Chile’s ecosystems, the vulnerability of the country’s biodiversity in the face of climate change has been assessed at the level of species and ecosystems, in order to identify possible adaptation measures. A report prepared by IEB/Caseb and financed by CONAMA, entitled “Estudio de vulnerabilidad de la bio-diversidad terrestre en la eco-región mediterránea, a nivel de ecosistemas and especies, y medidas de adaptación frente a escenarios de cambio climático” [Study of the vul-nerability of terrestrial biodiversity in the Mediterranean eco-region, at the level of ecosystems and species, and adaptation measures under climate change scenarios] (IEB, 2010) compared the current distribution of species and ecosystems and the expected distribution under a climate change scenario, based on data from the PRECIS regional model. The model simulated potential changes in the distribution of 15 species of amphibians, 16 species of reptiles, 36 species of mammals, 1447 species of vascu-lar terrestrial plants, and 36 ecosystems. Vulnerability was evaluated in the context of three protection scenarios, ba-sed on the limits of the current network of protected areas (scenario 1), including private protected areas (scenario 2), and excluding private protected woodland areas without official protection (scenario 3). Analysis at the level of species and ecosystems was complemented with an as-sessment of one key ecosystem representative of the high Andean wetlands and the Mediterranean ecosystem zone.
The methodology included an assessment of the current distribution of species and ecosystems based on climatic characteristics of the places where their presence is con-firmed. Future projections of distributions were created
using a statistical model based on the Maximum Entropy Principle (MaxEnt), generating the projected distributions for the 2070-2100 period.
In the case of high Andean wetlands, 8 locations were selected, corresponding to the river basins of the largest wetlands. A water balance was calculated for each basin, and modifications in the water cycle arising as a result of expected climate changes were then assessed.
3.6.1 Impacts on species
Modeling of potential ecological niches of the species stu-died showed that responses are highly dependent on the dispersion strategies input into the model. When it is as-sumed that the species are capable of dispersing rapidly during the time period modeled (late 21st century), more than half of the species studied appear to expand their distribution ranges; on the other hand, when it is assumed that the species are incapable of dispersion, most projec-tions predict reductions in species’ ranges. The projected impacts show that vulnerability is greater under emissions scenario A2 than under scenario B2.
An analysis of species’ response to climate change shows that even under the limited dispersion model in which most species suffer reductions in their distributions, the number of extinctions is relatively low. In fact, the simu-lations featured only two extinctions, namely the Festuca orthophylla grass, in the limited dispersion model under scenario A2, and the Nassauvia digitata flowering plant in the unlimited dispersion model under scenario A2 and in the limited dispersion model under scenarios A2 and B2.
In terms of the level of coverage of species under the three protection scenarios, considered in the context of their current distribution and projected distributions under scenarios A2 and B2, all vertebrate species studied have some coverage under the protection scenarios. However, at least 10 of the plant species studied are not present in any of the national protected areas considered in certain scenarios.
3.6.2 Impacts on ecosystems
The impacts of climate change on the 36 ecosystems eva-luated in the study mentioned above show a pattern of latitude variation in almost all ecosystem types present in the coastal and inland zone of north and central Chile. Additionally, ecosystems featuring schlerophyll and spiny vegetation exhibit the highest level of variation in their current distribution ranges.
The greatest change in vegetation ecosystems estimated for the end of the 21st Century occurs in the central zone of Chile, where ecosystems are most dynamic. For exam-ple, projection of ecosystems characteristic of Central Chi-le indicate that the area of inland Mediterranean thorny woodland under scenario A2 and semiarid Andean scru-bland under scenario B2 would be significantly reduced. In this regard, the vegetation of the Mediterranean hots-pot would be highly vulnerable to climate change.
The Andean Altiplano hotspot, characterized by wetland ecosystems that harbor significant biodiversity, was also found to be vulnerable. A water balance analysis of river basins in Northern Chile, closely linked to the wetland ecosystems of the zone, showed that by the end of the 21st Century most global climate models project a change in precipitation and increase in temperatures that would lead to a change in flow rates and surface runoff—the principal factors in maintaining the stability and functio-nality of the wetlands of the Chilean Altiplano.
3.7 COASTAL ZONES AND SEA LEVEL RISE
Average sea level changes resulting from variations in the total volume of the oceans are caused mainly by global temperature changes and by the melting of large ice mas-ses. The level of the world’s oceans has risen in recent de-cades, partially due to the effect of thermal expansion and the melting of glaciers, the ice caps, and polar ice covera-ge, as indicated in the IPCC 4th Assessment Report (IPCC, 2007).
In Chile, projections based on the HadCM3 model indica-te rises in sea level of the order of 20cm on the northern coast of the country and 10cm on the southern coast (U. de Chile, Geophysics Dept., 2006).
The study “Evaluación de la vulnerabilidad y adaptación en zonas costeras y recursos pesqueros” [Assessment of vulnerability and adaptation in coastal zones and fishery resources] of the Centro EULA at the Universidad de Con-cepción (Centro EULA, 2001), financed by the First Natio-nal Communication project, assessed the effects of sea level increases along the coast of the Gulf of Arauco on stocks of anchovy, common hake, and common sardine. The results suggest that a 1 meter sea level increase in the Gulf of Arauco would cause financial losses of between 23 and 54 billion Chilean pesos (1994 value) and threaten the livelihood of 1,200 to 1,800 individuals.
This study has not been replicated for other areas of the country or for other scenarios. However, a preliminary analysis of background information on sea level changes, seismic events, tsunamis, and variations in wave patterns along the coast of Chile has been conducted to identi-fy trends and factors that should be taken into account
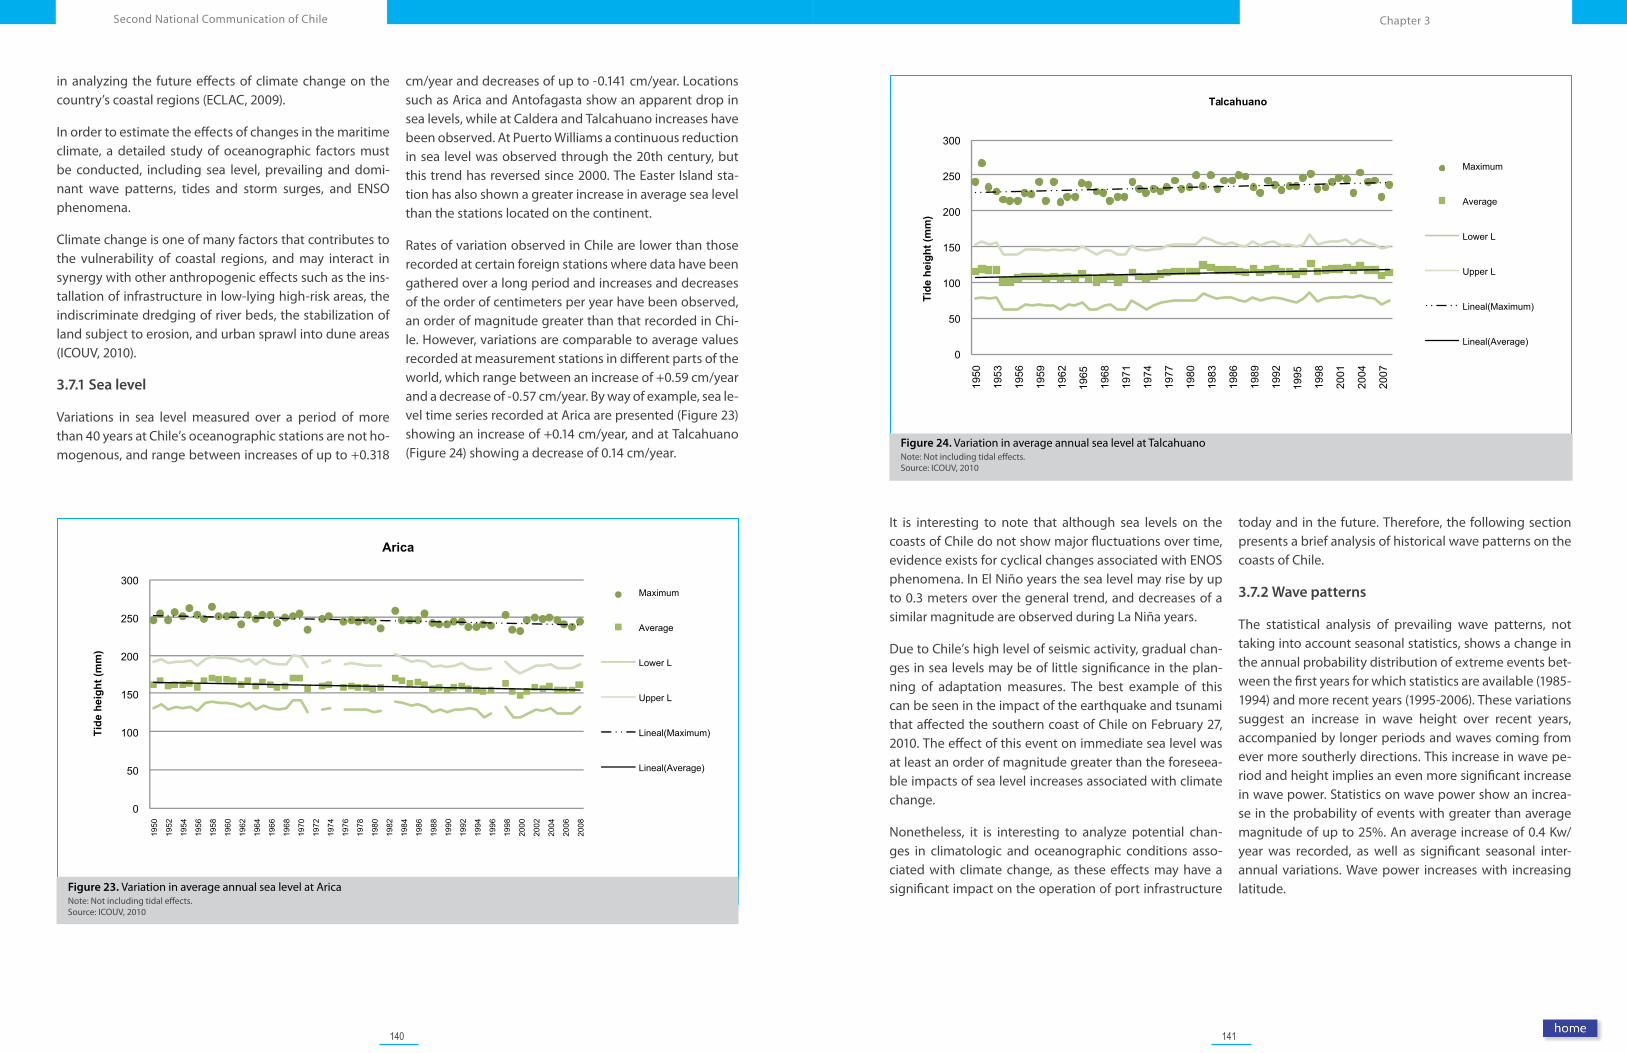
140 141
Chapter 3Second National Communication of Chile
in analyzing the future effects of climate change on the country’s coastal regions (ECLAC, 2009).
In order to estimate the effects of changes in the maritime climate, a detailed study of oceanographic factors must be conducted, including sea level, prevailing and domi-nant wave patterns, tides and storm surges, and ENSO phenomena.
Climate change is one of many factors that contributes to the vulnerability of coastal regions, and may interact in synergy with other anthropogenic effects such as the ins-tallation of infrastructure in low-lying high-risk areas, the indiscriminate dredging of river beds, the stabilization of land subject to erosion, and urban sprawl into dune areas (ICOUV, 2010).
3.7.1 Sea level
Variations in sea level measured over a period of more than 40 years at Chile’s oceanographic stations are not ho-mogenous, and range between increases of up to +0.318
cm/year and decreases of up to -0.141 cm/year. Locations such as Arica and Antofagasta show an apparent drop in sea levels, while at Caldera and Talcahuano increases have been observed. At Puerto Williams a continuous reduction in sea level was observed through the 20th century, but this trend has reversed since 2000. The Easter Island sta-tion has also shown a greater increase in average sea level than the stations located on the continent.
Rates of variation observed in Chile are lower than those recorded at certain foreign stations where data have been gathered over a long period and increases and decreases of the order of centimeters per year have been observed, an order of magnitude greater than that recorded in Chi-le. However, variations are comparable to average values recorded at measurement stations in different parts of the world, which range between an increase of +0.59 cm/year and a decrease of -0.57 cm/year. By way of example, sea le-vel time series recorded at Arica are presented (Figure 23) showing an increase of +0.14 cm/year, and at Talcahuano (Figure 24) showing a decrease of 0.14 cm/year.
It is interesting to note that although sea levels on the coasts of Chile do not show major fluctuations over time, evidence exists for cyclical changes associated with ENOS phenomena. In El Niño years the sea level may rise by up to 0.3 meters over the general trend, and decreases of a similar magnitude are observed during La Niña years.
Due to Chile’s high level of seismic activity, gradual chan-ges in sea levels may be of little significance in the plan-ning of adaptation measures. The best example of this can be seen in the impact of the earthquake and tsunami that affected the southern coast of Chile on February 27, 2010. The effect of this event on immediate sea level was at least an order of magnitude greater than the foreseea-ble impacts of sea level increases associated with climate change.
Nonetheless, it is interesting to analyze potential chan-ges in climatologic and oceanographic conditions asso-ciated with climate change, as these effects may have a significant impact on the operation of port infrastructure
today and in the future. Therefore, the following section presents a brief analysis of historical wave patterns on the coasts of Chile.
3.7.2 Wave patterns
The statistical analysis of prevailing wave patterns, not taking into account seasonal statistics, shows a change in the annual probability distribution of extreme events bet-ween the first years for which statistics are available (1985-1994) and more recent years (1995-2006). These variations suggest an increase in wave height over recent years, accompanied by longer periods and waves coming from ever more southerly directions. This increase in wave pe-riod and height implies an even more significant increase in wave power. Statistics on wave power show an increa-se in the probability of events with greater than average magnitude of up to 25%. An average increase of 0.4 Kw/year was recorded, as well as significant seasonal inter-annual variations. Wave power increases with increasing latitude.Figure 23. Variation in average annual sea level at Arica
Note: Not including tidal effects. Source: ICOUV, 2010
Figure 24. Variation in average annual sea level at TalcahuanoNote: Not including tidal effects. Source: ICOUV, 2010
0
50
100
150
200
250
300
1950
1953
1956
1959
1962
1965
1968
1971
1974
1977
1980
1983
1986
1989
1992
1995
1998
2001
2004
2007
Tide
hei
ght (
mm
)
Talcahuano
Maximum
Average
Lower L
Upper L
Lineal(Maximum)
Lineal(Average)
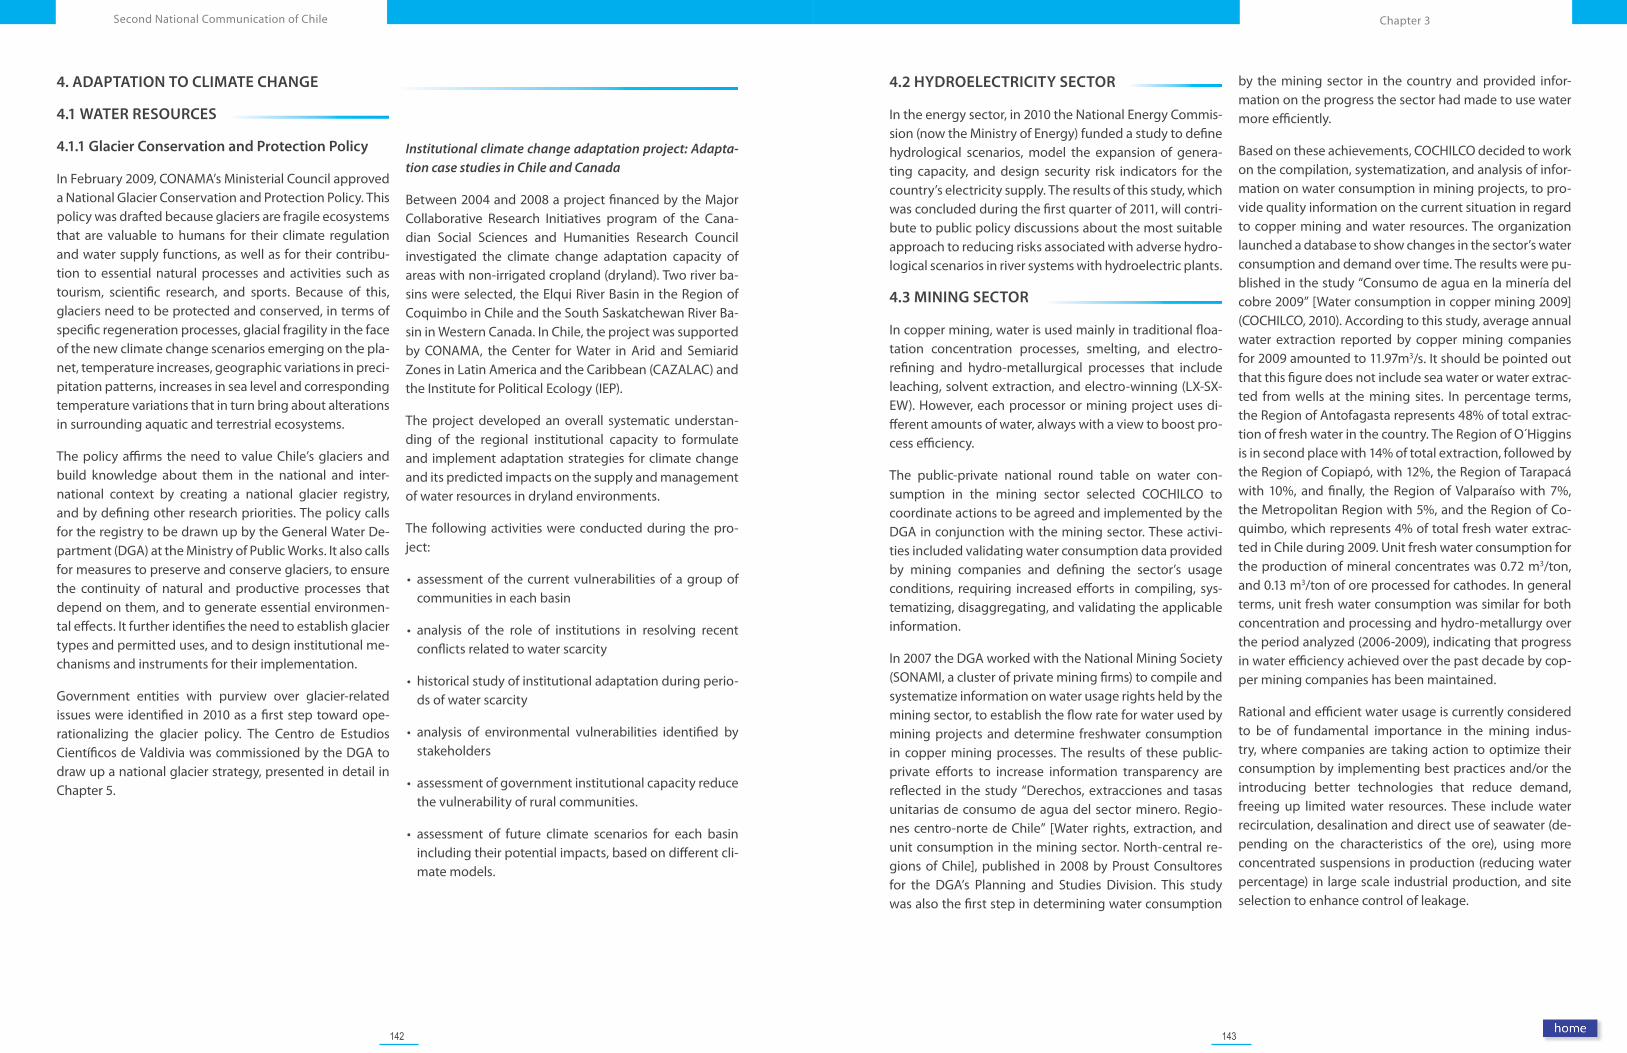
142 143
Chapter 3Second National Communication of Chile
4. ADAPTATION TO CLIMATE CHANGE
4.1 WATER RESOURCES
4.1.1 Glacier Conservation and Protection Policy
In February 2009, CONAMA’s Ministerial Council approved a National Glacier Conservation and Protection Policy. This policy was drafted because glaciers are fragile ecosystems that are valuable to humans for their climate regulation and water supply functions, as well as for their contribu-tion to essential natural processes and activities such as tourism, scientific research, and sports. Because of this, glaciers need to be protected and conserved, in terms of specific regeneration processes, glacial fragility in the face of the new climate change scenarios emerging on the pla-net, temperature increases, geographic variations in preci-pitation patterns, increases in sea level and corresponding temperature variations that in turn bring about alterations in surrounding aquatic and terrestrial ecosystems.
The policy affirms the need to value Chile’s glaciers and build knowledge about them in the national and inter-national context by creating a national glacier registry, and by defining other research priorities. The policy calls for the registry to be drawn up by the General Water De-partment (DGA) at the Ministry of Public Works. It also calls for measures to preserve and conserve glaciers, to ensure the continuity of natural and productive processes that depend on them, and to generate essential environmen-tal effects. It further identifies the need to establish glacier types and permitted uses, and to design institutional me-chanisms and instruments for their implementation.
Government entities with purview over glacier-related issues were identified in 2010 as a first step toward ope-rationalizing the glacier policy. The Centro de Estudios Científicos de Valdivia was commissioned by the DGA to draw up a national glacier strategy, presented in detail in Chapter 5.
Institutional climate change adaptation project: Adapta-tion case studies in Chile and Canada
Between 2004 and 2008 a project financed by the Major Collaborative Research Initiatives program of the Cana-dian Social Sciences and Humanities Research Council investigated the climate change adaptation capacity of areas with non-irrigated cropland (dryland). Two river ba-sins were selected, the Elqui River Basin in the Region of Coquimbo in Chile and the South Saskatchewan River Ba-sin in Western Canada. In Chile, the project was supported by CONAMA, the Center for Water in Arid and Semiarid Zones in Latin America and the Caribbean (CAZALAC) and the Institute for Political Ecology (IEP).
The project developed an overall systematic understan-ding of the regional institutional capacity to formulate and implement adaptation strategies for climate change and its predicted impacts on the supply and management of water resources in dryland environments.
The following activities were conducted during the pro-ject:
• assessment of the current vulnerabilities of a group of communities in each basin
• analysis of the role of institutions in resolving recent conflicts related to water scarcity
• historical study of institutional adaptation during perio-ds of water scarcity
• analysis of environmental vulnerabilities identified by stakeholders
• assessment of government institutional capacity reduce the vulnerability of rural communities.
• assessment of future climate scenarios for each basin including their potential impacts, based on different cli-mate models.
4.2 HYDROELECTRICITY SECTOR
In the energy sector, in 2010 the National Energy Commis-sion (now the Ministry of Energy) funded a study to define hydrological scenarios, model the expansion of genera-ting capacity, and design security risk indicators for the country’s electricity supply. The results of this study, which was concluded during the first quarter of 2011, will contri-bute to public policy discussions about the most suitable approach to reducing risks associated with adverse hydro-logical scenarios in river systems with hydroelectric plants.
4.3 MINING SECTOR
In copper mining, water is used mainly in traditional floa-tation concentration processes, smelting, and electro-refining and hydro-metallurgical processes that include leaching, solvent extraction, and electro-winning (LX-SX-EW). However, each processor or mining project uses di-fferent amounts of water, always with a view to boost pro-cess efficiency.
The public-private national round table on water con-sumption in the mining sector selected COCHILCO to coordinate actions to be agreed and implemented by the DGA in conjunction with the mining sector. These activi-ties included validating water consumption data provided by mining companies and defining the sector’s usage conditions, requiring increased efforts in compiling, sys-tematizing, disaggregating, and validating the applicable information.
In 2007 the DGA worked with the National Mining Society (SONAMI, a cluster of private mining firms) to compile and systematize information on water usage rights held by the mining sector, to establish the flow rate for water used by mining projects and determine freshwater consumption in copper mining processes. The results of these public-private efforts to increase information transparency are reflected in the study “Derechos, extracciones and tasas unitarias de consumo de agua del sector minero. Regio-nes centro-norte de Chile” [Water rights, extraction, and unit consumption in the mining sector. North-central re-gions of Chile], published in 2008 by Proust Consultores for the DGA’s Planning and Studies Division. This study was also the first step in determining water consumption
by the mining sector in the country and provided infor-mation on the progress the sector had made to use water more efficiently.
Based on these achievements, COCHILCO decided to work on the compilation, systematization, and analysis of infor-mation on water consumption in mining projects, to pro-vide quality information on the current situation in regard to copper mining and water resources. The organization launched a database to show changes in the sector’s water consumption and demand over time. The results were pu-blished in the study “Consumo de agua en la minería del cobre 2009” [Water consumption in copper mining 2009] (COCHILCO, 2010). According to this study, average annual water extraction reported by copper mining companies for 2009 amounted to 11.97m3/s. It should be pointed out that this figure does not include sea water or water extrac-ted from wells at the mining sites. In percentage terms, the Region of Antofagasta represents 48% of total extrac-tion of fresh water in the country. The Region of O´Higgins is in second place with 14% of total extraction, followed by the Region of Copiapó, with 12%, the Region of Tarapacá with 10%, and finally, the Region of Valparaíso with 7%, the Metropolitan Region with 5%, and the Region of Co-quimbo, which represents 4% of total fresh water extrac-ted in Chile during 2009. Unit fresh water consumption for the production of mineral concentrates was 0.72 m3/ton, and 0.13 m3/ton of ore processed for cathodes. In general terms, unit fresh water consumption was similar for both concentration and processing and hydro-metallurgy over the period analyzed (2006-2009), indicating that progress in water efficiency achieved over the past decade by cop-per mining companies has been maintained.
Rational and efficient water usage is currently considered to be of fundamental importance in the mining indus-try, where companies are taking action to optimize their consumption by implementing best practices and/or the introducing better technologies that reduce demand, freeing up limited water resources. These include water recirculation, desalination and direct use of seawater (de-pending on the characteristics of the ore), using more concentrated suspensions in production (reducing water percentage) in large scale industrial production, and site selection to enhance control of leakage.
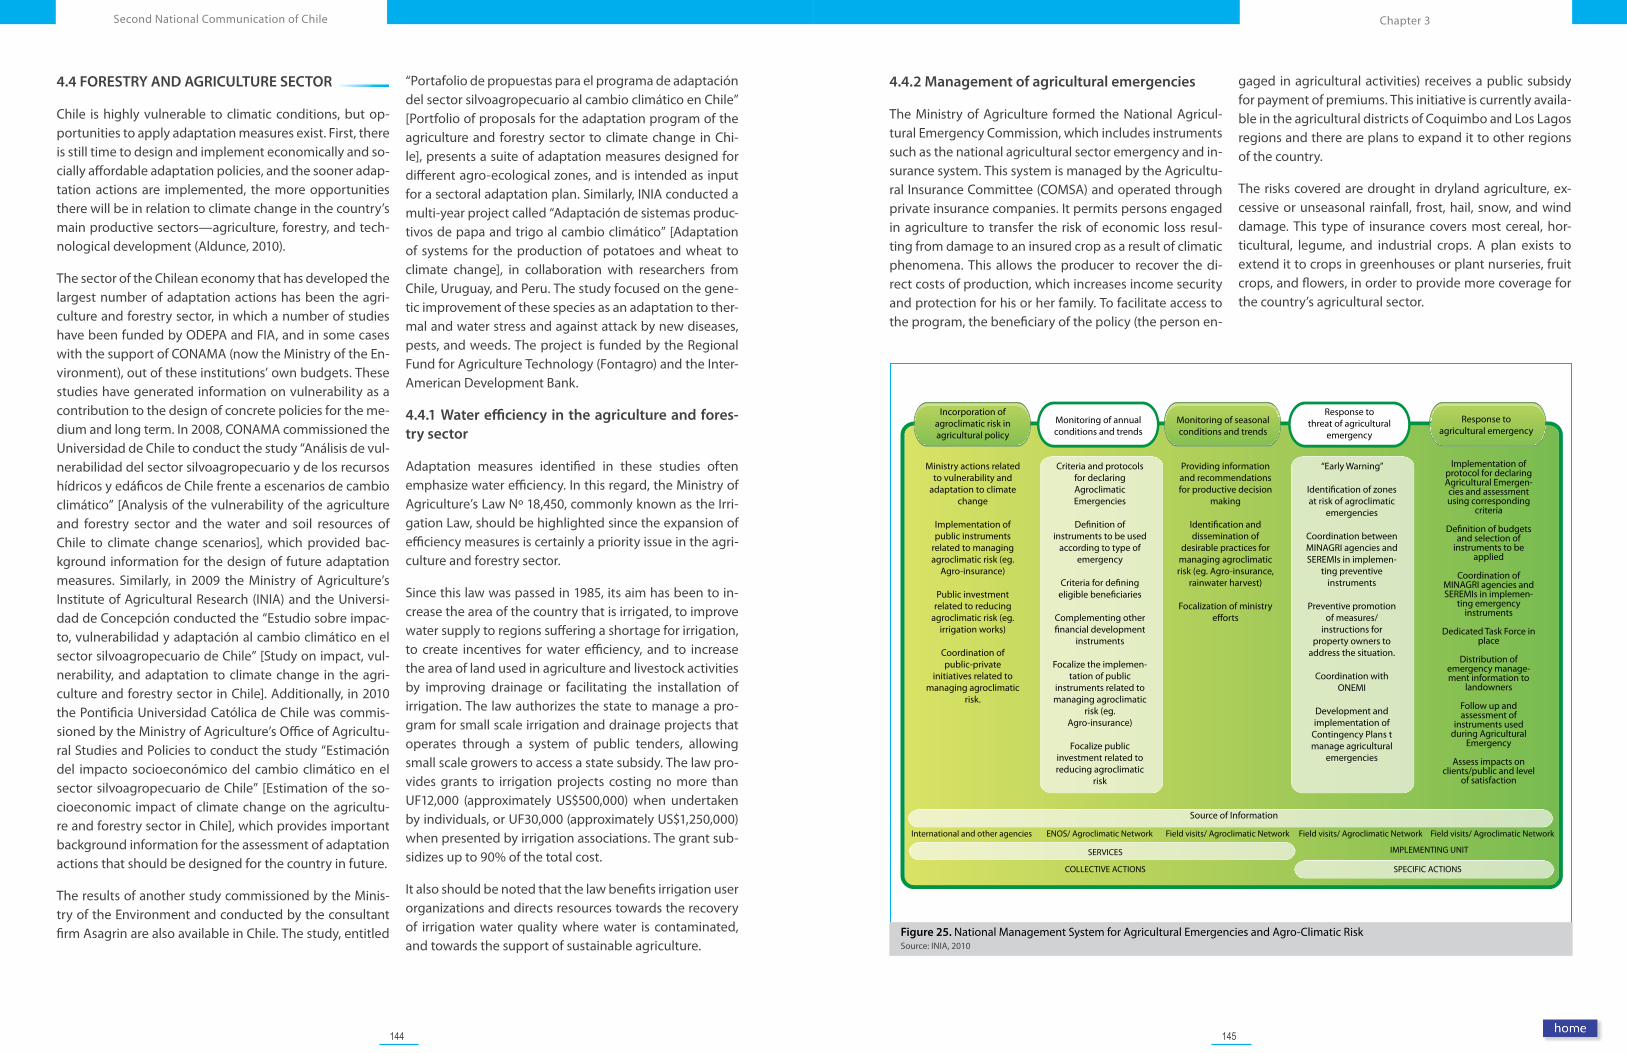
144 145
Chapter 3Second National Communication of Chile
4.4 FORESTRY AND AGRICULTURE SECTOR
Chile is highly vulnerable to climatic conditions, but op-portunities to apply adaptation measures exist. First, there is still time to design and implement economically and so-cially affordable adaptation policies, and the sooner adap-tation actions are implemented, the more opportunities there will be in relation to climate change in the country’s main productive sectors—agriculture, forestry, and tech-nological development (Aldunce, 2010).
The sector of the Chilean economy that has developed the largest number of adaptation actions has been the agri-culture and forestry sector, in which a number of studies have been funded by ODEPA and FIA, and in some cases with the support of CONAMA (now the Ministry of the En-vironment), out of these institutions’ own budgets. These studies have generated information on vulnerability as a contribution to the design of concrete policies for the me-dium and long term. In 2008, CONAMA commissioned the Universidad de Chile to conduct the study “Análisis de vul-nerabilidad del sector silvoagropecuario y de los recursos hídricos y edáficos de Chile frente a escenarios de cambio climático” [Analysis of the vulnerability of the agriculture and forestry sector and the water and soil resources of Chile to climate change scenarios], which provided bac-kground information for the design of future adaptation measures. Similarly, in 2009 the Ministry of Agriculture’s Institute of Agricultural Research (INIA) and the Universi-dad de Concepción conducted the “Estudio sobre impac-to, vulnerabilidad y adaptación al cambio climático en el sector silvoagropecuario de Chile” [Study on impact, vul-nerability, and adaptation to climate change in the agri-culture and forestry sector in Chile]. Additionally, in 2010 the Pontificia Universidad Católica de Chile was commis-sioned by the Ministry of Agriculture’s Office of Agricultu-ral Studies and Policies to conduct the study “Estimación del impacto socioeconómico del cambio climático en el sector silvoagropecuario de Chile” [Estimation of the so-cioeconomic impact of climate change on the agricultu-re and forestry sector in Chile], which provides important background information for the assessment of adaptation actions that should be designed for the country in future.
The results of another study commissioned by the Minis-try of the Environment and conducted by the consultant firm Asagrin are also available in Chile. The study, entitled
“Portafolio de propuestas para el programa de adaptación del sector silvoagropecuario al cambio climático en Chile” [Portfolio of proposals for the adaptation program of the agriculture and forestry sector to climate change in Chi-le], presents a suite of adaptation measures designed for different agro-ecological zones, and is intended as input for a sectoral adaptation plan. Similarly, INIA conducted a multi-year project called “Adaptación de sistemas produc-tivos de papa and trigo al cambio climático” [Adaptation of systems for the production of potatoes and wheat to climate change], in collaboration with researchers from Chile, Uruguay, and Peru. The study focused on the gene-tic improvement of these species as an adaptation to ther-mal and water stress and against attack by new diseases, pests, and weeds. The project is funded by the Regional Fund for Agriculture Technology (Fontagro) and the Inter-American Development Bank.
4.4.1 Water efficiency in the agriculture and fores-try sector
Adaptation measures identified in these studies often emphasize water efficiency. In this regard, the Ministry of Agriculture’s Law Nº 18,450, commonly known as the Irri-gation Law, should be highlighted since the expansion of efficiency measures is certainly a priority issue in the agri-culture and forestry sector.
Since this law was passed in 1985, its aim has been to in-crease the area of the country that is irrigated, to improve water supply to regions suffering a shortage for irrigation, to create incentives for water efficiency, and to increase the area of land used in agriculture and livestock activities by improving drainage or facilitating the installation of irrigation. The law authorizes the state to manage a pro-gram for small scale irrigation and drainage projects that operates through a system of public tenders, allowing small scale growers to access a state subsidy. The law pro-vides grants to irrigation projects costing no more than UF12,000 (approximately US$500,000) when undertaken by individuals, or UF30,000 (approximately US$1,250,000) when presented by irrigation associations. The grant sub-sidizes up to 90% of the total cost.
It also should be noted that the law benefits irrigation user organizations and directs resources towards the recovery of irrigation water quality where water is contaminated, and towards the support of sustainable agriculture.
4.4.2 Management of agricultural emergencies
The Ministry of Agriculture formed the National Agricul-tural Emergency Commission, which includes instruments such as the national agricultural sector emergency and in-surance system. This system is managed by the Agricultu-ral Insurance Committee (COMSA) and operated through private insurance companies. It permits persons engaged in agriculture to transfer the risk of economic loss resul-ting from damage to an insured crop as a result of climatic phenomena. This allows the producer to recover the di-rect costs of production, which increases income security and protection for his or her family. To facilitate access to the program, the beneficiary of the policy (the person en-
gaged in agricultural activities) receives a public subsidy for payment of premiums. This initiative is currently availa-ble in the agricultural districts of Coquimbo and Los Lagos regions and there are plans to expand it to other regions of the country.
The risks covered are drought in dryland agriculture, ex-cessive or unseasonal rainfall, frost, hail, snow, and wind damage. This type of insurance covers most cereal, hor-ticultural, legume, and industrial crops. A plan exists to extend it to crops in greenhouses or plant nurseries, fruit crops, and flowers, in order to provide more coverage for the country’s agricultural sector.
Figure 25. National Management System for Agricultural Emergencies and Agro-Climatic Risk Source: INIA, 2010
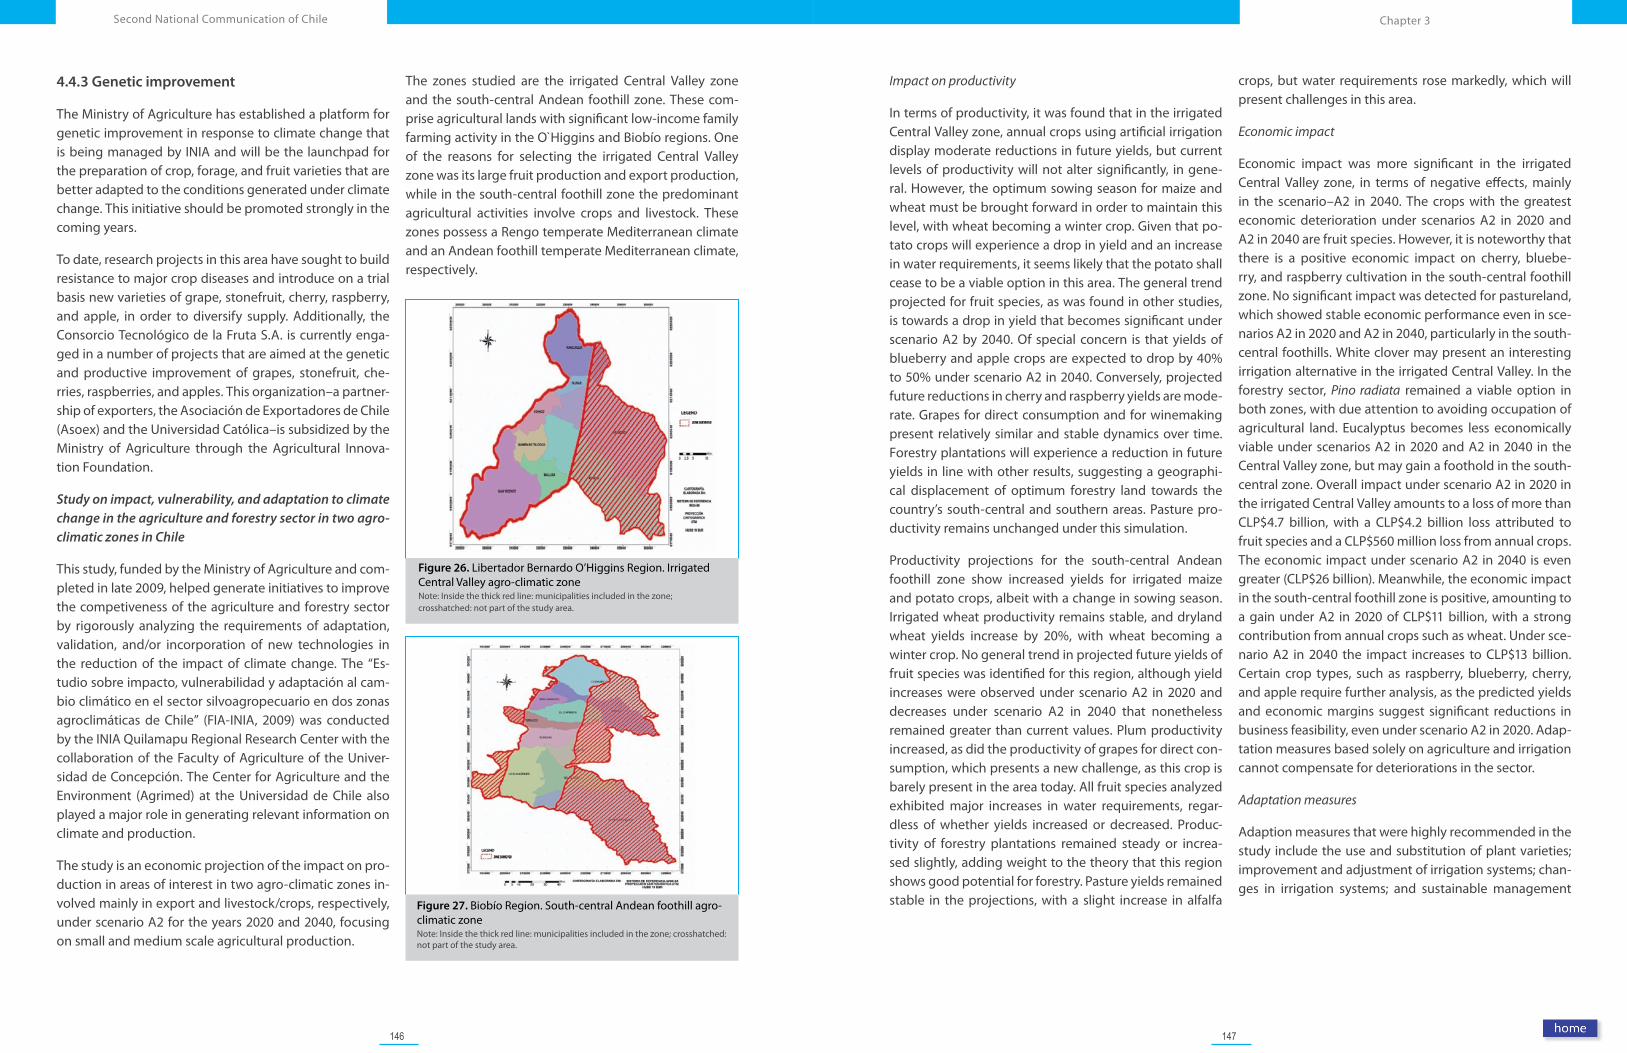
146 147
Chapter 3Second National Communication of Chile
Figure 26. Libertador Bernardo O’Higgins Region. Irrigated Central Valley agro-climatic zoneNote: Inside the thick red line: municipalities included in the zone; crosshatched: not part of the study area.
Figure 27. Biobío Region. South-central Andean foothill agro-climatic zoneNote: Inside the thick red line: municipalities included in the zone; crosshatched: not part of the study area.
4.4.3 Genetic improvement
The Ministry of Agriculture has established a platform for genetic improvement in response to climate change that is being managed by INIA and will be the launchpad for the preparation of crop, forage, and fruit varieties that are better adapted to the conditions generated under climate change. This initiative should be promoted strongly in the coming years.
To date, research projects in this area have sought to build resistance to major crop diseases and introduce on a trial basis new varieties of grape, stonefruit, cherry, raspberry, and apple, in order to diversify supply. Additionally, the Consorcio Tecnológico de la Fruta S.A. is currently enga-ged in a number of projects that are aimed at the genetic and productive improvement of grapes, stonefruit, che-rries, raspberries, and apples. This organization–a partner-ship of exporters, the Asociación de Exportadores de Chile (Asoex) and the Universidad Católica–is subsidized by the Ministry of Agriculture through the Agricultural Innova-tion Foundation.
Study on impact, vulnerability, and adaptation to climate change in the agriculture and forestry sector in two agro-climatic zones in Chile
This study, funded by the Ministry of Agriculture and com-pleted in late 2009, helped generate initiatives to improve the competiveness of the agriculture and forestry sector by rigorously analyzing the requirements of adaptation, validation, and/or incorporation of new technologies in the reduction of the impact of climate change. The “Es-tudio sobre impacto, vulnerabilidad y adaptación al cam-bio climático en el sector silvoagropecuario en dos zonas agroclimáticas de Chile” (FIA-INIA, 2009) was conducted by the INIA Quilamapu Regional Research Center with the collaboration of the Faculty of Agriculture of the Univer-sidad de Concepción. The Center for Agriculture and the Environment (Agrimed) at the Universidad de Chile also played a major role in generating relevant information on climate and production.
The study is an economic projection of the impact on pro-duction in areas of interest in two agro-climatic zones in-volved mainly in export and livestock/crops, respectively, under scenario A2 for the years 2020 and 2040, focusing on small and medium scale agricultural production.
The zones studied are the irrigated Central Valley zone and the south-central Andean foothill zone. These com-prise agricultural lands with significant low-income family farming activity in the O`Higgins and Biobío regions. One of the reasons for selecting the irrigated Central Valley zone was its large fruit production and export production, while in the south-central foothill zone the predominant agricultural activities involve crops and livestock. These zones possess a Rengo temperate Mediterranean climate and an Andean foothill temperate Mediterranean climate, respectively.
Impact on productivity
In terms of productivity, it was found that in the irrigated Central Valley zone, annual crops using artificial irrigation display moderate reductions in future yields, but current levels of productivity will not alter significantly, in gene-ral. However, the optimum sowing season for maize and wheat must be brought forward in order to maintain this level, with wheat becoming a winter crop. Given that po-tato crops will experience a drop in yield and an increase in water requirements, it seems likely that the potato shall cease to be a viable option in this area. The general trend projected for fruit species, as was found in other studies, is towards a drop in yield that becomes significant under scenario A2 by 2040. Of special concern is that yields of blueberry and apple crops are expected to drop by 40% to 50% under scenario A2 in 2040. Conversely, projected future reductions in cherry and raspberry yields are mode-rate. Grapes for direct consumption and for winemaking present relatively similar and stable dynamics over time. Forestry plantations will experience a reduction in future yields in line with other results, suggesting a geographi-cal displacement of optimum forestry land towards the country’s south-central and southern areas. Pasture pro-ductivity remains unchanged under this simulation.
Productivity projections for the south-central Andean foothill zone show increased yields for irrigated maize and potato crops, albeit with a change in sowing season. Irrigated wheat productivity remains stable, and dryland wheat yields increase by 20%, with wheat becoming a winter crop. No general trend in projected future yields of fruit species was identified for this region, although yield increases were observed under scenario A2 in 2020 and decreases under scenario A2 in 2040 that nonetheless remained greater than current values. Plum productivity increased, as did the productivity of grapes for direct con-sumption, which presents a new challenge, as this crop is barely present in the area today. All fruit species analyzed exhibited major increases in water requirements, regar-dless of whether yields increased or decreased. Produc-tivity of forestry plantations remained steady or increa-sed slightly, adding weight to the theory that this region shows good potential for forestry. Pasture yields remained stable in the projections, with a slight increase in alfalfa
crops, but water requirements rose markedly, which will present challenges in this area.
Economic impact
Economic impact was more significant in the irrigated Central Valley zone, in terms of negative effects, mainly in the scenario–A2 in 2040. The crops with the greatest economic deterioration under scenarios A2 in 2020 and A2 in 2040 are fruit species. However, it is noteworthy that there is a positive economic impact on cherry, bluebe-rry, and raspberry cultivation in the south-central foothill zone. No significant impact was detected for pastureland, which showed stable economic performance even in sce-narios A2 in 2020 and A2 in 2040, particularly in the south-central foothills. White clover may present an interesting irrigation alternative in the irrigated Central Valley. In the forestry sector, Pino radiata remained a viable option in both zones, with due attention to avoiding occupation of agricultural land. Eucalyptus becomes less economically viable under scenarios A2 in 2020 and A2 in 2040 in the Central Valley zone, but may gain a foothold in the south-central zone. Overall impact under scenario A2 in 2020 in the irrigated Central Valley amounts to a loss of more than CLP$4.7 billion, with a CLP$4.2 billion loss attributed to fruit species and a CLP$560 million loss from annual crops. The economic impact under scenario A2 in 2040 is even greater (CLP$26 billion). Meanwhile, the economic impact in the south-central foothill zone is positive, amounting to a gain under A2 in 2020 of CLP$11 billion, with a strong contribution from annual crops such as wheat. Under sce-nario A2 in 2040 the impact increases to CLP$13 billion. Certain crop types, such as raspberry, blueberry, cherry, and apple require further analysis, as the predicted yields and economic margins suggest significant reductions in business feasibility, even under scenario A2 in 2020. Adap-tation measures based solely on agriculture and irrigation cannot compensate for deteriorations in the sector.
Adaptation measures
Adaption measures that were highly recommended in the study include the use and substitution of plant varieties; improvement and adjustment of irrigation systems; chan-ges in irrigation systems; and sustainable management
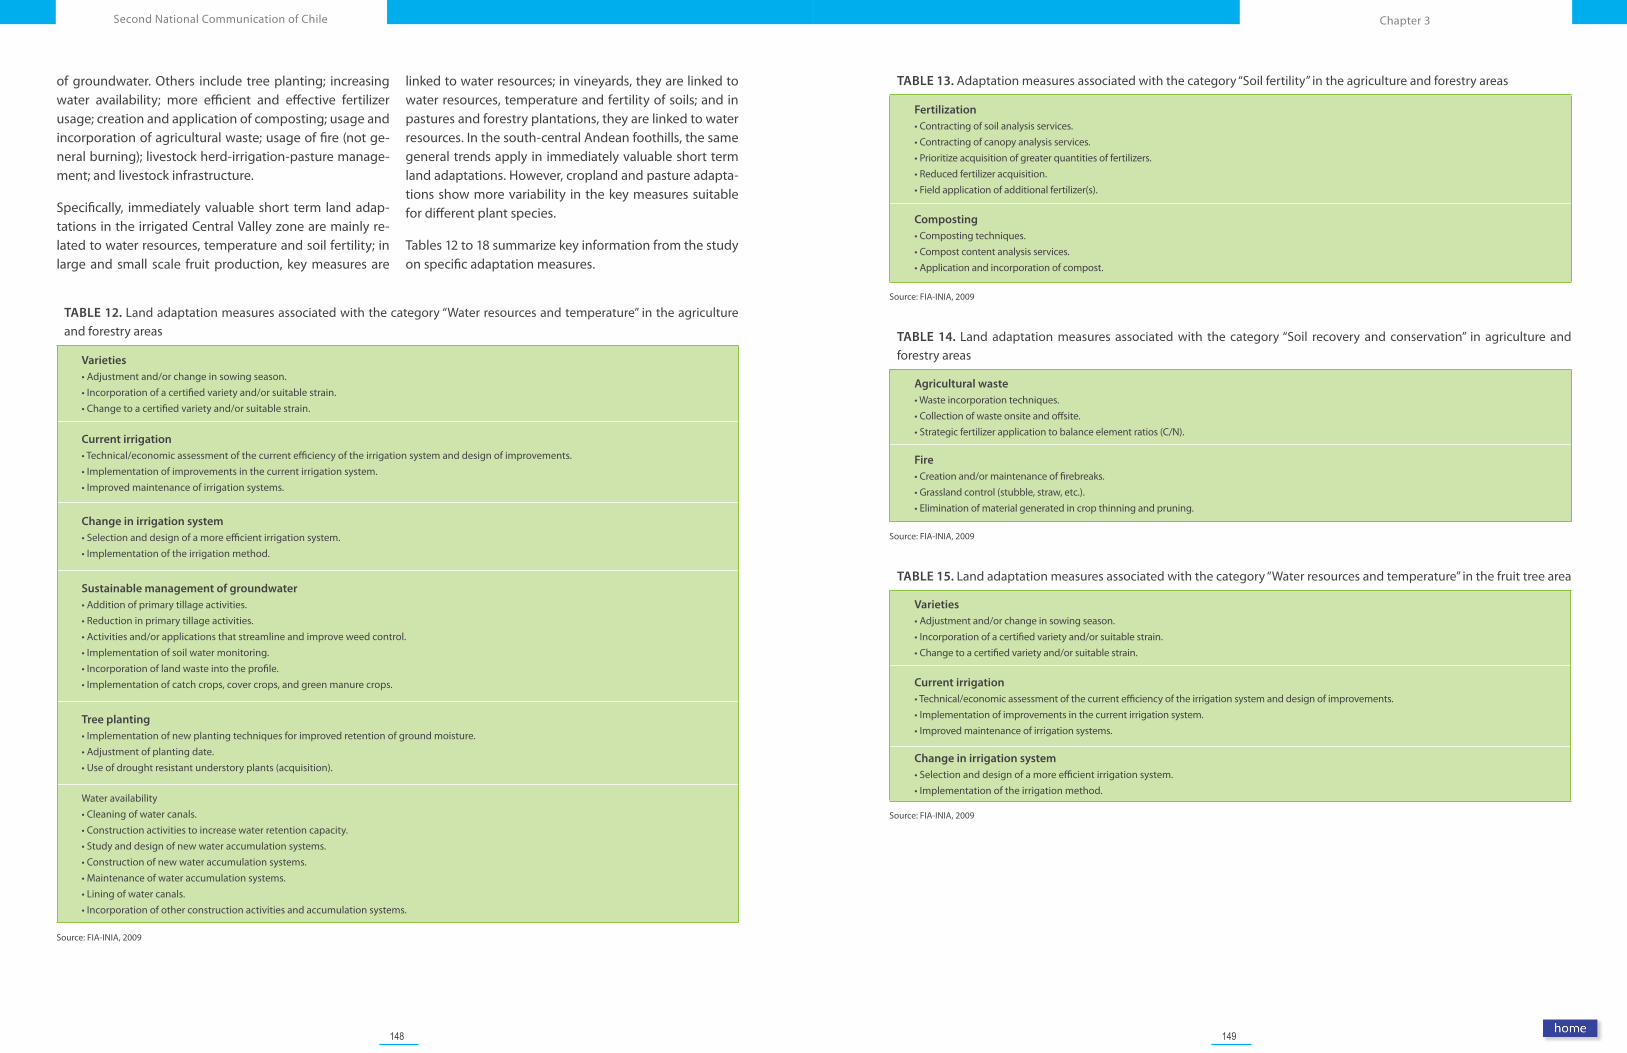
148 149
Chapter 3Second National Communication of Chile
of groundwater. Others include tree planting; increasing water availability; more efficient and effective fertilizer usage; creation and application of composting; usage and incorporation of agricultural waste; usage of fire (not ge-neral burning); livestock herd-irrigation-pasture manage-ment; and livestock infrastructure.
Specifically, immediately valuable short term land adap-tations in the irrigated Central Valley zone are mainly re-lated to water resources, temperature and soil fertility; in large and small scale fruit production, key measures are
linked to water resources; in vineyards, they are linked to water resources, temperature and fertility of soils; and in pastures and forestry plantations, they are linked to water resources. In the south-central Andean foothills, the same general trends apply in immediately valuable short term land adaptations. However, cropland and pasture adapta-tions show more variability in the key measures suitable for different plant species.
Tables 12 to 18 summarize key information from the study on specific adaptation measures.
TABLE 12. Land adaptation measures associated with the category “Water resources and temperature” in the agriculture and forestry areas
Varieties•Adjustmentand/orchangeinsowingseason.•Incorporationofacertifiedvarietyand/orsuitablestrain.•Changetoacertifiedvarietyand/orsuitablestrain.
Current irrigation•Technical/economicassessmentofthecurrentefficiencyoftheirrigationsystemanddesignofimprovements.•Implementationofimprovementsinthecurrentirrigationsystem.•Improvedmaintenanceofirrigationsystems.
Change in irrigation system•Selectionanddesignofamoreefficientirrigationsystem.•Implementationoftheirrigationmethod.
Sustainable management of groundwater•Additionofprimarytillageactivities.•Reductioninprimarytillageactivities.•Activitiesand/orapplicationsthatstreamlineandimproveweedcontrol.•Implementationofsoilwatermonitoring.•Incorporationoflandwasteintotheprofile.•Implementationofcatchcrops,covercrops,andgreenmanurecrops.
Tree planting•Implementationofnewplantingtechniquesforimprovedretentionofgroundmoisture.•Adjustmentofplantingdate.•Useofdroughtresistantunderstoryplants(acquisition).
Water availability•Cleaningofwatercanals.•Constructionactivitiestoincreasewaterretentioncapacity.•Studyanddesignofnewwateraccumulationsystems.•Constructionofnewwateraccumulationsystems.•Maintenanceofwateraccumulationsystems.•Liningofwatercanals.•Incorporationofotherconstructionactivitiesandaccumulationsystems.
Source: FIA-INIA, 2009
TABLE 13. Adaptation measures associated with the category “Soil fertility” in the agriculture and forestry areas
Fertilization•Contractingofsoilanalysisservices.•Contractingofcanopyanalysisservices.•Prioritizeacquisitionofgreaterquantitiesoffertilizers.•Reducedfertilizeracquisition.•Fieldapplicationofadditionalfertilizer(s).
Composting•Compostingtechniques.•Compostcontentanalysisservices.•Applicationandincorporationofcompost.
Source: FIA-INIA, 2009
TABLE 14. Land adaptation measures associated with the category “Soil recovery and conservation” in agriculture and forestry areas
Agricultural waste•Wasteincorporationtechniques.•Collectionofwasteonsiteandoffsite.•Strategicfertilizerapplicationtobalanceelementratios(C/N).
Fire•Creationand/ormaintenanceoffirebreaks.•Grasslandcontrol(stubble,straw,etc.).•Eliminationofmaterialgeneratedincropthinningandpruning.
Source: FIA-INIA, 2009
TABLE 15. Land adaptation measures associated with the category “Water resources and temperature” in the fruit tree area
Varieties•Adjustmentand/orchangeinsowingseason.•Incorporationofacertifiedvarietyand/orsuitablestrain.•Changetoacertifiedvarietyand/orsuitablestrain.
Current irrigation•Technical/economicassessmentofthecurrentefficiencyoftheirrigationsystemanddesignofimprovements.•Implementationofimprovementsinthecurrentirrigationsystem.•Improvedmaintenanceofirrigationsystems.
Change in irrigation system•Selectionanddesignofamoreefficientirrigationsystem.•Implementationoftheirrigationmethod.
Source: FIA-INIA, 2009
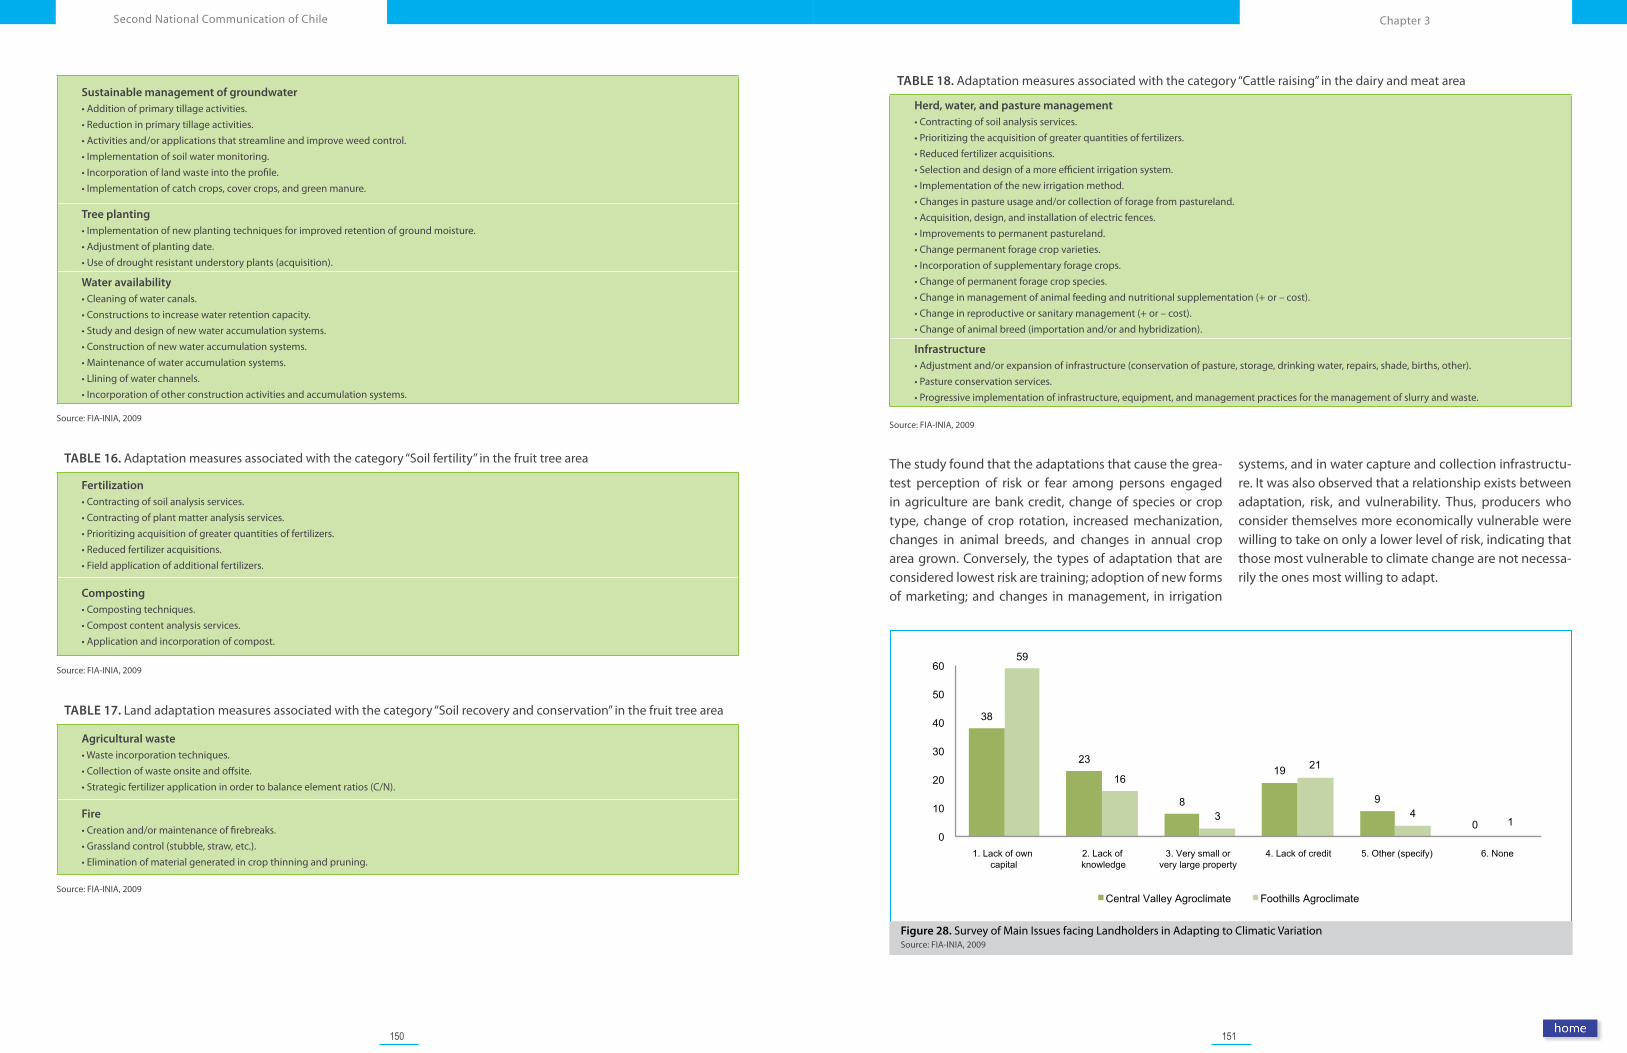
150 151
Chapter 3Second National Communication of Chile
Sustainable management of groundwater•Additionofprimarytillageactivities.•Reductioninprimarytillageactivities.•Activitiesand/orapplicationsthatstreamlineandimproveweedcontrol.•Implementationofsoilwatermonitoring.•Incorporationoflandwasteintotheprofile.•Implementationofcatchcrops,covercrops,andgreenmanure.
Tree planting•Implementationofnewplantingtechniquesforimprovedretentionofgroundmoisture.•Adjustmentofplantingdate.•Useofdroughtresistantunderstoryplants(acquisition).
Water availability•Cleaningofwatercanals.•Constructionstoincreasewaterretentioncapacity.•Studyanddesignofnewwateraccumulationsystems.•Constructionofnewwateraccumulationsystems.•Maintenanceofwateraccumulationsystems.•Lliningofwaterchannels.•Incorporationofotherconstructionactivitiesandaccumulationsystems.
Source: FIA-INIA, 2009
TABLE 16. Adaptation measures associated with the category “Soil fertility” in the fruit tree area
Fertilization•Contractingofsoilanalysisservices.•Contractingofplantmatteranalysisservices.•Prioritizingacquisitionofgreaterquantitiesoffertilizers.•Reducedfertilizeracquisitions.•Fieldapplicationofadditionalfertilizers.
Composting•Compostingtechniques.•Compostcontentanalysisservices.•Applicationandincorporationofcompost.
Source: FIA-INIA, 2009
TABLE 17. Land adaptation measures associated with the category “Soil recovery and conservation” in the fruit tree area
Agricultural waste•Wasteincorporationtechniques.•Collectionofwasteonsiteandoffsite.•Strategicfertilizerapplicationinordertobalanceelementratios(C/N).
Fire•Creationand/ormaintenanceoffirebreaks.•Grasslandcontrol(stubble,straw,etc.).•Eliminationofmaterialgeneratedincropthinningandpruning.
Source: FIA-INIA, 2009
TABLE 18. Adaptation measures associated with the category “Cattle raising” in the dairy and meat area
Herd, water, and pasture management•Contractingofsoilanalysisservices.•Prioritizingtheacquisitionofgreaterquantitiesoffertilizers.•Reducedfertilizeracquisitions.•Selectionanddesignofamoreefficientirrigationsystem.•Implementationofthenewirrigationmethod.•Changesinpastureusageand/orcollectionofforagefrompastureland.•Acquisition,design,andinstallationofelectricfences.•Improvementstopermanentpastureland.•Changepermanentforagecropvarieties.•Incorporationofsupplementaryforagecrops.•Changeofpermanentforagecropspecies.•Changeinmanagementofanimalfeedingandnutritionalsupplementation(+or–cost).•Changeinreproductiveorsanitarymanagement(+or–cost).•Changeofanimalbreed(importationand/orandhybridization).
Infrastructure•Adjustmentand/orexpansionofinfrastructure(conservationofpasture,storage,drinkingwater,repairs,shade,births,other).•Pastureconservationservices.•Progressiveimplementationofinfrastructure,equipment,andmanagementpracticesforthemanagementofslurryandwaste.
Source: FIA-INIA, 2009
The study found that the adaptations that cause the grea-test perception of risk or fear among persons engaged in agriculture are bank credit, change of species or crop type, change of crop rotation, increased mechanization, changes in animal breeds, and changes in annual crop area grown. Conversely, the types of adaptation that are considered lowest risk are training; adoption of new forms of marketing; and changes in management, in irrigation
systems, and in water capture and collection infrastructu-re. It was also observed that a relationship exists between adaptation, risk, and vulnerability. Thus, producers who consider themselves more economically vulnerable were willing to take on only a lower level of risk, indicating that those most vulnerable to climate change are not necessa-rily the ones most willing to adapt.
Figure 28. Survey of Main Issues facing Landholders in Adapting to Climatic Variation Source: FIA-INIA, 2009
152 153
Chapter 3Second National Communication of Chile
Adaptation costs
As mentioned, the study derived approximate figures for the impact of adaptations and generated proposals for their implementation. Some principal results are as fo-llows:
• Under scenario A2 in 2020, the impact of the principal adaptations is negative in both zones studied. Mean-while, under scenario A2 in 2040, the impact in the irri-gated Central Valley zone is positive and amounts to CLP$9.5 billion, mainly because fruit trees offer a higher margin for adaptation. In the south-central foothill zone the positive impact amounts to CLP$1.3 billion, again at-tributable to fruit species.
• As a general strategy, adaptation decisions should be made sooner rather than later, but with a view to future investment. However, not all measures are economica-lly viable, and certain sub-sectors fail to meet the ne-cessary conditions for some initiatives. In the irrigated Central Valley under scenario A2 2020, field crops will be less profitable if the adaptations are implemented, but the cultivation of apples, cherries, plums, blueberries, and raspberries will benefit from higher profit margins if adaptation measures are adopted. Pasture and forestry plantations also lack the economic conditions to sup-port adaptation. Similarly, in the south-central foothills under scenario A2 in 2040, fruit species improve with the implementation of adaptations, and yields and pro-fit margins fall dramatically without adaptation and res-pond better to adaptations for recovering yield. In the south-central foothills under scenario A2 in 2020, the profit margins of annual crops are also lower without adaptation than with it. The same situation applies to fruit species, although plums, raspberries, and grapes respond well to adaptations in terms of production, which may justify their implementation. Pastures and forestry plantations cannot support the cost of imple-menting adaptations. Under scenario A2 in 2040, adap-tations may be implemented for annual crops as long as the species concerned responds strongly. Apples, cherries, blueberries, and raspberries have a strong net favorable response to adaptation. Plums and grapes are neutral.
• For the irrigated Central Valley, the study proposes implementation of adaptation measures for apples, cherries, plums, blueberries, raspberries, and grapes for direct consumption, as the margin generated with
adaptations is greater than without adaptations. In wine vineyards, the advisability of adaptations depends on the probability of obtaining or recovering high yields, and on price variables. Such measures may allow these crops to remain economically attractive and help futu-re decisions related to the geographical displacement of horticulture towards the south. For alfalfa, white clo-ver, and natural pasture there is no need to incorporate explicit adaptations, and the same is recommended for forestry plantations. Meanwhile, in the south-central foothill zone the study proposes implementing adapta-tions for irrigated maize, potato, and wheat crops, de-pending on the likelihood of a high yield response and price. For dryland wheat, the only justifiable adaptation is a change in cultivar/strain. Among fruit species, the study proposes implementing adaptations for apples, cherries, blueberries, and raspberries. No climate chan-ge adaptation measures are proposed for pasture or fo-restry plantations, as adaptation promises no increase in margin for these land uses.
• As an orientation for policy and subsidy instruments, the average annual cost for economically justifiable land adaptations amounts to CLP$6.625 billion (US$12.5 million) in the irrigated Central Valley zone and CLP$3.5 billion (US$6.6 million) in the south-central foothill zone.
Proposed policies to support adaptation
Finally, the study offer more detailed proposals to impro-ve policies and incentives, analyzing them from the pers-pective of institutions and policies, research, training and education, and stimulus instruments.
In regard to institutions and policies, the main points are: to avoid focusing on conceptual redefinitions and existing advisory and technical activities, and instead to work toward more effective coordination of entities and activities; to foster coherence in decision making and ac-tions on climate change that target major sectors of the national economy; to specify institutional responsibilities and hierarchies; and to assess and measure funding di-mensions continually and adequately fund key activities through the passage of a legal decree. It should be borne in mind impacts will be local, and therefore strategies for applying current and future regulations and policies must be implemented with careful attention to the target agro-climatological zone, the predominant production system, and the type and characteristics of producers and produc-tion associations.
In terms of stimulus and support instruments, the study points out that while none of these systems were put in place specifically to address climate change, they still are useful for supporting measures for adaptation or reduc-tion of vulnerability. Furthermore, as with strategies and policies, stimulus instruments also must be implemented with careful attention to the target agro-climatological zone, the predominant production system, and the type and characteristics of each producer and production as-sociations.
With regard to the stimulus instruments currently being operated by the different public entities mentioned in the study, some of these are identified as being particularly relevant for climate change adaptations and could be ad-justed or made even more flexible.
4.5 BIODIVERSITY
In 2010 the Institute of Ecology and Biodiversity (IEB) con-ducted a study entitled “Vulnerabilidad de la biodiversi-dad terrestre en la eco-región mediterránea, a nivel de ecosistemas y especies, y medidas de adaptación frente a escenarios de cambio climático” [Vulnerability of terres-trial biodiversity in the Mediterranean eco-region at the level of ecosystems and species, and adaptation measures for climate change scenarios]. The study was funded by CONAMA and it analyzed the vulnerability of biodiversity in Chile in a climate change context by comparing the cu-rrent distribution of species and ecosystems against their expected distribution in climate change scenarios (see section 3.6 of this chapter).
The study also provides valuable information in outlining possible climate change adaptation measures from a bio-diversity perspective. Its recommendations include:
Strengthening the network of protected areas
Chile has made significant investments to safeguard the integrity of its national biodiversity resources. This ap-proach is reflected in the country’s extensive National System of State-Protected Wilderness Areas (SNASPE), which–together with private initiatives and conservation areas set aside under international agreements and land use restrictions–cover approximately 20% of continental Chile. Although percentage is high compared to many other countries, most of these areas are in the far north and south of the country in zones that are highly suscep-tible to climate change and have a high projected degree of species and ecosystem dynamism.
Monitoring program for species, habitats, and behavior of critical ecosystems
In addition to launching a national network for global monitoring, it is also necessary to monitor species and ha-bitats that are expected to experience major changes in distribution.
Ongoing assessment of the effects of climate change on bio-diversity
Effective assessment of the responses of critical species, ecosystems, and habitats is heavily dependent on the avai-lability of data and the methodological approach used. In this regard, assessments must be updated when new data come to light, including agreed projections for Chile.
Create or strengthen institutional mechanisms that respond to climate change challenges for biodiversity in the context of global changes caused by humans
The challenges of climate change are by nature interdis-ciplinary and require the participation of a wide range of scientific disciplines and pertinent public institutions. Such efforts must be coordinated by a decentralized body capable of making fast and informed decisions.
4.6 OTHER SECTORS
In 2011, a seminar was organized jointly by the Ministry of the Environment and the Under-secretariat of Fishing to promote the actions set forth in the National Climate Change Action Plan for the Fishing sector. These actions include disseminating and reviewing the latest knowled-ge about climate change and its impacts on the fishing and aquaculture sector and on marine biodiversity at the national and international level; identifying studies and re-search needs in order to generate the information needed to define the best adaptation mechanisms for the country; and to coordinate the efforts of different stakeholders.
In the health sector, an information-gathering project began in 2010 on the effects of climate change in public health in other countries and actions that have been taken to address these, for the purpose of drafting an initial pro-posal for a sectoral adaptation plan. Activities have also been implemented in partnership with civil society orga-nizations such as the Chilean Red Cross to support of the creation of such a plan.
154 155
Chapter 3Second National Communication of Chile
B I B L I O G R A P H Y
Aceituno, P. (1992). Anomalías de precipitación en Chile central relacionadas con la Oscila-ción del Sur: Mecanismos Asociados. Paleo ENSO Records, p. 1–5.
AGRIMED. (2008). “Impactos productivos en el sector silvoagropecuario de Chile frente a scenarios de cambio climático.” Santiago de Chile.
Aldunce, P. and González, P. (2009). Desastres Asociados al Clima en la Agricultura and Me-dio Rural en Chile, Santiago, Chile.
IDB-UN. (2007). “Information for Disaster Risk Management. Case Studies of Five Countries: Chile.”
Carrasco, J., Casassa, G. and Quintana, J. (2005). Changes of the 0ºC isotherm in central Chile during the last Quarter of the XXth century. Hydrological Science Journal, 50 (6) 933–948.
Carrasco, J., Osorio, R. and Casassa, G. (2008). Secular Trend of the Equilibrium Line Altitude in the Western Side of the Southern Andes Derived from Radiosonde and Surface Obser-vations, pp. 1–21, 54, 538–550.
Centro EULA de la U. de Concepción. (2001). Evaluación de la Vulnerabilidad and Adapta-ción en Zonas Costeras and Recursos Pesqueros.
ECLAC. (2009). La Economía del Cambio Climático en Chile. Síntesis. ECLAC, Colección Do-cumentos de Proyectos. Santiago, Chile.
COCHILCO. (2010). “Consumo de Agua en la Minería del Cobre 2009.” CONAMA. (2008). Plan de Acción Nacional de Cambio Climático, 2008-2012.
Conde, C. (2003). Cambio and Variabilidad Climática. Dos estudios de Caso en México. Doc-toral thesis. Centro de Ciencias de la Atmósfera, UNAM, Mexico City, pp. 1 – 23.
DGA Unidad de Glaciología and Nieves. (2009), Presentation by Gonzalo Barcaza at the seminar “Vulnerabilidad, Adaptación and Mitigación para el Cambio Climático en Chile.”
Ecosecurities and CCG-UC. (2010). Relación entre Agua, Energía and Cambio Climático: Es-tudio de alto nivel sobre el impacto económico del cambio climático en la industria minera de Argentina, Chile, Colombia and Perú.
Falvey, M., and Garreaud, R. (2009). “Regional cooling in a warming world: Recent tempera-ture trends in the southeast Pacific and along the west coast of subtropical South America (1979– 2006),” J. Geophysical Research, 114.
FIA-INIA. (2009). Estudio sobre impacto, vulnerabilidad and adaptación al cambio climáti-co en el sector silvoagropecuario en dos zonas agroclimáticas de Chile.
ICOUV. (2010). “Efectos del Cambio Climático en las costas de Chile.”
IEB, CASEB, CCG-UC – CONAMA. (2010). Estudio de vulnerabilidad de la biodiversidad te-
156 157
Chapter 3Second National Communication of Chile
rrestre en la eco-región mediterránea, a nivel de ecosistemas and especies, and medidas de adaptación frente a scenarios de cambio climático. Santiago, Chile.
INE. (1996). VI Censo Nacional Agropecuario and Forestal.
INE. (2007). VII Censo Nacional Agropecuario and Forestal.
INIA. (2010). Information from web portal: http://www.inia.cl/medios/quilamapu/pdf/bio-leche/bioleche22n4a2.pdf.
IPCC. (2000). Special Report on Emissions Scenarios. Cambridge University Press, Cambrid-ge.
IPCC. (2001). Climate Change 2001: Impacts, Adaptation and Vulnerability. Contribution of Working Group II to the Third Assessment Report, Cambridge University Press, Cambridge, p. 1032.
IPCC. (2007). Climate Change 2007: The Physical Science Basis. Contribution of Working Group I to the Fourth Assessment Report of the Integovernmental Panel on Climate Chan-ge [Solomon, S., D. Qin, M. Manning, Z. Chen, M. Marquis, K.B. Averyt, M. Tignor and H.L. Miller (eds.)]. Cambridge University Press, Cambridge. United Kingdom and New York, NY, USA, pp. 996.
Jones, R.G., Noguer,M., Hassell, D.C., Hudson, D., Wilson, S.S., Jenkis, G.K. and Mitchell, J.F.B. (2004). Generating high resolution climate change scenarios using PRECIS. Met Office Had-ley Center, Exeter, UK. p. 40.
Kane, R.P. (1999). Timings and rainfall extremes in India. International Journal of Climatolo-gy, pp. 672, 653–672.
Moy, C.M., Seltzer, G.O., Rodbell, D.T. and Anderson, D.M. (2002). Variability of El Niño/Southern Oscillation activity at millennial timescales during the Holocene epoch, Nature 420: 162–165.
Neira, E., Verscheure, H. and Revenga, C. (2002). Chile’s Frontier Forest: Conserving a Global Treasure. World Resources Institute, Comité Nacional Pro Defensa de la Fauna and Flora, Universidad Austral de Chile.
Ohmura, A. (2006). Changes in mountain glaciers and ice caps during the 20th century. Annals of Glaciology, 43(1), pp. 361–368.
Parmesan, C. (2006). Ecological and Evolutionary Responses to Recent Climate Change. Annual Review of Ecology, Evolution, and Systematics, 37(1),pp. 637–669.
Pittock, A. B. (1980). Patterns of climatic variation in Argentina and Chile. Part I: Precipita-tion, 1931 –1960. Mon. Wea. Rev., 108: 1347–1361.
P. Universidad Católica de Chile, Departamento de Economía Agraria. (2010). Estimación del impacto socioeconómico del cambio climático. Study commissioned by ODEPA, Minis-try of Agriculture, Santiago, Chile.
Quinn, W. and Neal, V. (1983). Long-term variations in the Southern Oscillation, El Niño and the Chilean subtropical rainfall. Fish. Bull., 81: 363–374.
Quintana, J. and Aceituno, P. (2006). “Trends and interdecadal variability of rainfall in Chile,” Proceedings of 8 ICSHMO, Foz do Iguacu, Brasil, 24–28 April, INPE.
Rivera, A., Casassa, G., Acuña, G. and Lange, H. (2000). Variaciones recientes de glaciares e Chile, Invest. Geogr., Chile, pp. 34, 29–60.
Rivera, A., Benham, T., Casassa, G., Bamber, J. and Dowdeswell, J. (2007). Ice elevation and areal changes of glaciers from the Northern Patagonia Icefield, Chile. Global and Planetary Change, 59(1–4), pp. 126–137.
Rosenblüth, B., Fuenzalida, H.A. and Aceituno, P. (1997). Recent Temperature Variations in Southern South America. International Journal of Climatology, 17(1), pp. 67–85.
Rubin, M. J. (1955). An analysis of pressure anomalies in the Southern Hemisphere. Notos, 4: 11–16.
Timmerman, A., Oberhuber, J., Bacher, A., Esch, M., Latif, M. and Roeckner, E. (1999). Increa-sed El Niño frequency in a climate model forced by future greenhouse warming. Natu-re398: 694–697.
Trenberth, K.E. and Hoar, T.J. (1997). El Niño and climate change, Geophysical Research Letters, 24 (23): 3057–3060.
U. de Chile/Depto.Ingeniería Civil. (2010). Análisis de vulnerabilidad de recursos hídricos frente a scenarios de cambio climático para las cuencas Cautín, Aconcagua, Teno e Illapel.
U. de Chile/Depto.Geofísica. (2006). Estudio de la variabilidad climática en Chile para el siglo XXI.
Vicuña, S., Garreaud, R. and McPhee, J. (2010). “Climate change impacts on the hydrology of a snowmelt driven basin in semiarid Chile,” Climatic Change.
PHOTO: XSTRATA COPPER
CHAPTER 4Mitigation of Greenhouse Gases
160 161
Chapter 4
1. INTRODUCTION
1.1 GREENHOUSE GAS MITIGATION IN CHILE
Chile recognizes the need to stabilize atmospheric emis-sions of greenhouse gases at a level that prevents hazar-dous anthropogenic interference in the global climate system, reduces total emissions, and protects and impro-ves carbon sinks and greenhouse gas deposits through appropriate mitigation measures. The country’s contri-bution to international efforts in this area is underpinned by the principle of “common but differentiated responsi-bility” and is intended to support the aim of the United Nations Framework Convention on Climate Change (UN-FCCC) while obtaining potential environmental and social cobenefits for Chile.
Box 13.7 of the 4th Assessment Report of the Intergovern-mental Panel on Climate Change (IPCC), which shows the extent of GHGs to be mitigated, offers important infor-mation for Convention signatories as they may determine how to apply the principle of common but differentiated responsibilities in their mitigation actions. In effect, achie-ving a stabilization scenario of 450 ppm CO2eq will involve differentiated commitments by the Parties, which transla-tes into absolute emission reductions for Annex-1 coun-tries and substantial reductions in emission growth rates for non-Annex 1 countries, including Chile, that must be achieved by 2020 and beyond.
Chile’s emissions are low on the global scale, accounting for just 0.2% of all GHGs released, and this level has re-
mained relatively stable according to statistics from the In-ternational Energy Agency (IEA) and the World Resources Institute (WRI). It is important to note, however, that emis-sions are on the rise, both in Chile and around the world.
This chapter presents initiatives that could be implemen-ted in Chile as part of the country’s commitment to slow its emissions, as well as early actions that are already un-derway to achieve this objective and foster the country’s sustainable development.
1.2 MITIGATION IN THE NATIONAL CLIMATE CHANGE ACTION PLAN
In December 2008, the Government of Chile approved the country’s National Climate Change Action Plan, establis-hing “Mitigation of Emissions” as one of its three strategic lines of action. The general objective associated with this line of action is to “work toward becoming a low-carbon economy as a means of promoting sustainable develop-ment in Chile as well as a means of contributing to global efforts to reduce GHG emissions.”
This line of action includes identification of the country’s GHG mitigation potential to help limit emissions growth and focused work on sectors with the highest emissions and/or removals, namely energy generation, transporta-tion, mining, and agriculture and forestry activities. De-tails of emissions and removals by these sectors are pre-sented in Chapter 2 of this National Communication, on the National Greenhouse Gas Inventory.
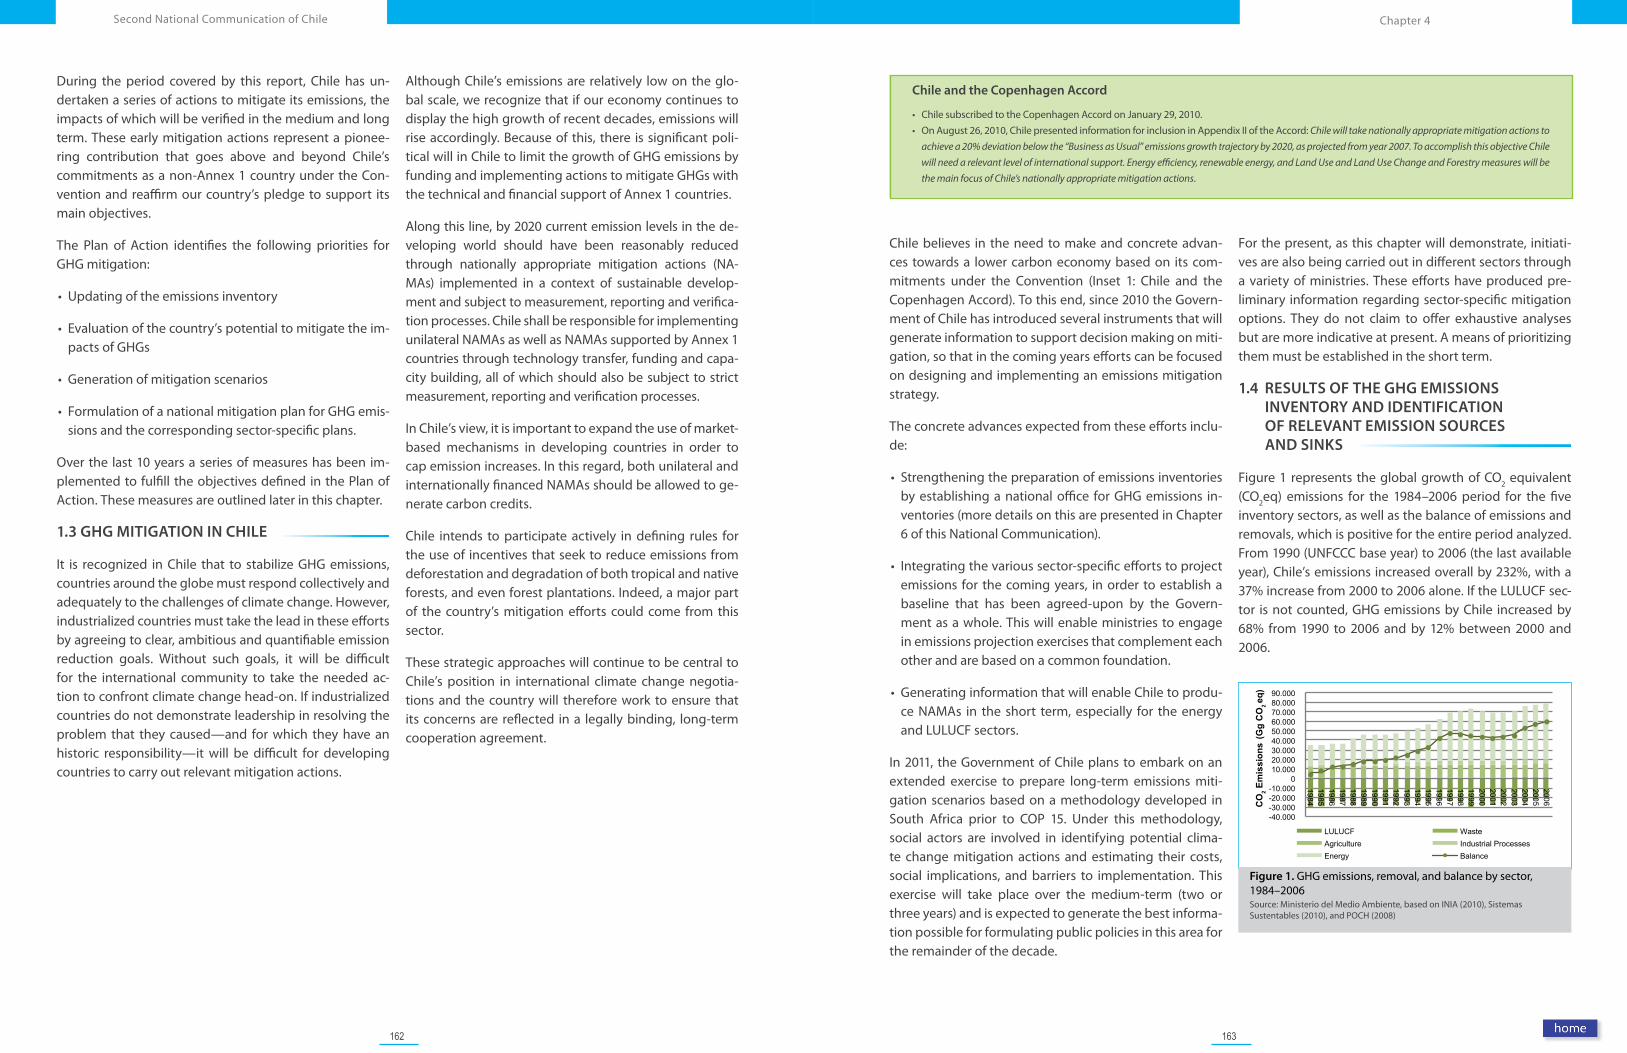
162 163
Chapter 4Second National Communication of Chile
Chile and the Copenhagen Accord
• ChilesubscribedtotheCopenhagenAccordonJanuary29,2010.• OnAugust26,2010,ChilepresentedinformationforinclusioninAppendixIIoftheAccord:Chile will take nationally appropriate mitigation actions to
achieve a 20% deviation below the “Business as Usual” emissions growth trajectory by 2020, as projected from year 2007. To accomplish this objective Chile
will need a relevant level of international support. Energy efficiency, renewable energy, and Land Use and Land Use Change and Forestry measures will be
the main focus of Chile’s nationally appropriate mitigation actions.
During the period covered by this report, Chile has un-dertaken a series of actions to mitigate its emissions, the impacts of which will be verified in the medium and long term. These early mitigation actions represent a pionee-ring contribution that goes above and beyond Chile’s commitments as a non-Annex 1 country under the Con-vention and reaffirm our country’s pledge to support its main objectives.
The Plan of Action identifies the following priorities for GHG mitigation:
• Updating of the emissions inventory
• Evaluation of the country’s potential to mitigate the im-pacts of GHGs
• Generation of mitigation scenarios
• Formulation of a national mitigation plan for GHG emis-sions and the corresponding sector-specific plans.
Over the last 10 years a series of measures has been im-plemented to fulfill the objectives defined in the Plan of Action. These measures are outlined later in this chapter.
1.3 GHG MITIGATION IN CHILE
It is recognized in Chile that to stabilize GHG emissions, countries around the globe must respond collectively and adequately to the challenges of climate change. However, industrialized countries must take the lead in these efforts by agreeing to clear, ambitious and quantifiable emission reduction goals. Without such goals, it will be difficult for the international community to take the needed ac-tion to confront climate change head-on. If industrialized countries do not demonstrate leadership in resolving the problem that they caused—and for which they have an historic responsibility—it will be difficult for developing countries to carry out relevant mitigation actions.
Although Chile’s emissions are relatively low on the glo-bal scale, we recognize that if our economy continues to display the high growth of recent decades, emissions will rise accordingly. Because of this, there is significant poli-tical will in Chile to limit the growth of GHG emissions by funding and implementing actions to mitigate GHGs with the technical and financial support of Annex 1 countries.
Along this line, by 2020 current emission levels in the de-veloping world should have been reasonably reduced through nationally appropriate mitigation actions (NA-MAs) implemented in a context of sustainable develop-ment and subject to measurement, reporting and verifica-tion processes. Chile shall be responsible for implementing unilateral NAMAs as well as NAMAs supported by Annex 1 countries through technology transfer, funding and capa-city building, all of which should also be subject to strict measurement, reporting and verification processes.
In Chile’s view, it is important to expand the use of market-based mechanisms in developing countries in order to cap emission increases. In this regard, both unilateral and internationally financed NAMAs should be allowed to ge-nerate carbon credits.
Chile intends to participate actively in defining rules for the use of incentives that seek to reduce emissions from deforestation and degradation of both tropical and native forests, and even forest plantations. Indeed, a major part of the country’s mitigation efforts could come from this sector.
These strategic approaches will continue to be central to Chile’s position in international climate change negotia-tions and the country will therefore work to ensure that its concerns are reflected in a legally binding, long-term cooperation agreement.
Chile believes in the need to make and concrete advan-ces towards a lower carbon economy based on its com-mitments under the Convention (Inset 1: Chile and the Copenhagen Accord). To this end, since 2010 the Govern-ment of Chile has introduced several instruments that will generate information to support decision making on miti-gation, so that in the coming years efforts can be focused on designing and implementing an emissions mitigation strategy.
The concrete advances expected from these efforts inclu-de:
• Strengthening the preparation of emissions inventories by establishing a national office for GHG emissions in-ventories (more details on this are presented in Chapter 6 of this National Communication).
• Integrating the various sector-specific efforts to project emissions for the coming years, in order to establish a baseline that has been agreed-upon by the Govern-ment as a whole. This will enable ministries to engage in emissions projection exercises that complement each other and are based on a common foundation.
• Generating information that will enable Chile to produ-ce NAMAs in the short term, especially for the energy and LULUCF sectors.
In 2011, the Government of Chile plans to embark on an extended exercise to prepare long-term emissions miti-gation scenarios based on a methodology developed in South Africa prior to COP 15. Under this methodology, social actors are involved in identifying potential clima-te change mitigation actions and estimating their costs, social implications, and barriers to implementation. This exercise will take place over the medium-term (two or three years) and is expected to generate the best informa-tion possible for formulating public policies in this area for the remainder of the decade.
For the present, as this chapter will demonstrate, initiati-ves are also being carried out in different sectors through a variety of ministries. These efforts have produced pre-liminary information regarding sector-specific mitigation options. They do not claim to offer exhaustive analyses but are more indicative at present. A means of prioritizing them must be established in the short term.
1.4 RESULTS OF THE GHG EMISSIONS INVENTORY AND IDENTIFICATION OF RELEVANT EMISSION SOURCES AND SINKS
Figure 1 represents the global growth of CO2 equivalent (CO2eq) emissions for the 1984–2006 period for the five inventory sectors, as well as the balance of emissions and removals, which is positive for the entire period analyzed. From 1990 (UNFCCC base year) to 2006 (the last available year), Chile’s emissions increased overall by 232%, with a 37% increase from 2000 to 2006 alone. If the LULUCF sec-tor is not counted, GHG emissions by Chile increased by 68% from 1990 to 2006 and by 12% between 2000 and 2006.
Figure 1. GHG emissions, removal, and balance by sector, 1984–2006Source: Ministerio del Medio Ambiente, based on INIA (2010), Sistemas Sustentables (2010), and POCH (2008)
-40.000 -30.000 -20.000 -10.000
0 10.000 20.000 30.000 40.000 50.000 60.000 70.000 80.000 90.000
1984 1985 1986 1987 1988 1989 1990 1991 1992 1993 1994 1995 1996 1997 1998 1999 2000 2001 2002 2003 2004 2005 2006 C
O2 E
mis
sion
s (G
g C
O2eq
)
LULUCF Waste Agriculture Industrial Processes Energy Balance

164 165
Chapter 4Second National Communication of Chile
Photo: Ministry of the Environment. Government of Chile
2. SECTOR SPECIFIC ANALYSES
2.1 ENERGY SECTOR
The energy sector includes the exploration, development, generation, transmission, transportation, storage, distri-bution, consumption, efficient use, import, and export of energy, as well as any other activities related to elec-tricity, gas, petroleum and its derivatives, nuclear energy, geothermal and solar energy, and other energy sources.
Chile’s energy policy is founded upon the legal and re-gulatory role played by the State through the Ministry of Energy and the institutions under its purview, while the private energy sector is responsible for investments in the sector. This arrangement means that Chile’s energy po-licies will have a major impact on limiting the growth of GHG emissions. Some central aspects of the energy policy of President Sebastian Piñera Echenique’s administration are as follows:
• Increase energy availability to satisfy demand, assuming an average economic growth rate of 6% annually up to 2020.
• Increase the security of the country’s short, medium and long term energy supply, encouraging energy genera-tion projects that reduce failure risks and strengthening fuel supply logistics to enable prompt and effective res-ponses to events and contingencies.
• Promote the development of competitive and sustaina-ble investments.
• Work towards the goal of having 20% of Chile’s insta-lled capacity for electricity generation come from non-conventional renewable energies by 2020. These energy sources are both locally and globally environmentally sustainable and are available within the country itself.
• Strengthen energy independence and the participation of private investors in hydrocarbon exploration and de-velopment.
• Enhance existing regulations for accessing energy re-sources in order to increase investment in renewable energies available in the country.
• Conduct studies and consolidate the institutional struc-ture to permit the development of any cost-efficient energy source in the future.
• Promote research programs in the area of energy and educate new generations of citizens on the importance of energy savings and efficiency.
• Improve the information available on the country’s ener-gy resources to support the formulation of a policy to promote energy efficiency and energy savings projects.
• Enhance existing energy efficiency standards and cer-tification programs for residential construction, house-hold appliances, lighting and transport vehicles.
2.1.1 Regulatory framework related to mitigation
Incentive for the Use of Non-Conventional Renewable Energies (NCREs)
In 1982, the enactment of the General Electrical Services Law (LGSE) laid the foundation for a competitive electrici-ty system and positioned Chile as an international pioneer in this area.
This legal framework was based on a “technology neutral” principle that makes no distinction between non-conven-tional renewable energies and other forms of energy. It is important to note that in Chile, Non-Conventional Re-newable Energies (NCREs) are defined as wind energy, small scale hydroelectric hydro power (plants up to 20 MW), biomass, biogas, geothermal energy, solar and tidal energy. To support the incorporation of NCREs, in March 2004 Law 19.940 reformed the LGSE, changing several as-pects of the energy generation market in Chile that affec-ted all forms of energy generation, but included special provisions for NCREs. The reform opened up the spot market and guaranteed the right to be connected to the country’s power grids to small generating plants, many of which fall into the NCRE category. This move increased commercial and generating opportunities for these small producers.
In addition, the reform exempted projects using NCREs from paying transmission fees, using a differentiated sca-le–one for plants generating up to 9 MW and another for those generating between 9 MW and 20 MW. In addition to benefitting those sources, this exemption serves to re-cognize a positive externality, given their low impact on transmission grids and on investments associated with their expansion.
At the sectoral level, the importance of the LULUCF sec-tor in CO2 removal in Chile is recognized, although the net capture by this sector decreased gradually between 1984 and 2006. In absolute terms, the Energy sector con-tributes a growing and significant proportion of national emissions; its emissions increased by 85% between 1990 and 2006. The Agriculture sector is the second largest net emitter, although its emissions have grown the least in recent years, just 10% from 1990 to 2006. In contrast, the Waste sector is responsible for the largest emissions increase in the period –142%– although in absolute terms this sector’s emissions are still quite low.
As Figure 2 shows, the Energy sector is responsible for most of the sharp rise in net national emission levels, with a 168% increase between 1984 and 2006.The remaining sectors also display increased emissions, but because of their lower absolute emission levels they do not have a
significant impact on the national GHG balance. Figure 2 also clearly shows how carbon capture by the LULUCF sec-tor has dropped steadily.
Figure 2. GHG Emissions and Removals, percentage contribution by sector of the Chilean GHG Inventory Source: Ministerio del Medio Ambiente, based on INIA (2010); Sistemas Sustentables (2010); POCH (2008)
-60%
-40%
-20%
0%
20 %
40 %
60 %
80 %
100%
1984 1994 2000 2006
Energy
Industrial processes
Agriculture
Waste
LULUCF
CO
2 Em
issi
ons
(Gg
CO
2eq)
166 167
Chapter 4Second National Communication of Chile
1 Estimated using US dollar exchange rate against the UF (Unidad de Fomento) in mid-2010.
Law of Non-Conventional Renewable Energies (Law 20.257)
On April 1, 2008 Law 20.257 entered into force, manda-ting that a certain percentage of power sold by electricity companies operating in systems with an installed capacity greater than 200 MW come from NCREs.
This law and its regulations have translated into price sig-nals and business models for decision makers in the elec-tricity market, manifested in the steady development of NCRE projects associated with energy grids in Chile. The main features of the Law, which is applicable only to new projects implemented by electricity companies that re-move energy from power grids by selling it to distributors or end users, include the following:
• From 2010 to 2014, all energy contracts signed on or af-ter 2007 shall be required to supply at least 5% of their energy from non-conventional renewable sources.
• As of 2015, this percentage will increase by 0.5% per year until reaching 10% in 2024.
• This gradual increase will be applied in the following way: 5.5% of all energy removed from the system shall be subject to this mandate in 2015, 6% in 2016, and so on, until reaching the goal of 10% by 2024.
Law of Geothermal Energy (Law 19.657)
The exploration and development of geothermal energy in Chile is governed by Law 19.657 on Geothermal Ener-gy Concessions, published in January 2000, and its regu-lation, published in October 2004. This law establishes a special system for granting concessions for the explora-tion and development of geothermal energy. In 2009, under this legal framework, an invitation to tender offers on 16 geothermal concession areas was issued, worth an estimated investment of US$ 85 Million.
Tax Exemption for solar thermal systems (Law 20.365)
The main objective of this instrument is to foster the de-velopment of solar hot water systems (solar thermal sys-tems, STS) by means of a fiscal policy instrument that encourages demand. The instrument addresses barriers such as the high startup costs for STS, the long capital re-
covery timeframe in the housing sector, and the low rela-tive demand, which hinders the emergence of associated services and the large-scale adoption of this technology.
The tax exemption established in Law 20.365 entered into force in August 2010 and targets construction companies that are willing to use solar systems in new housing de-velopments, allowing them to discount the cost of solar collectors they install from their taxes on a sliding scale indexed to the value of each home. This measure seeks to promote the use of solar technology and extend its bene-fits to houses and buildings across the country by offering up to 100% of the installed cost of these hot water systems for new houses eligible by the tax exemption. The exemp-tion covers 100% of the tax on solar thermal systems for houses priced at approximately US$87,0001 and up to 20% of the tax for houses worth approximately US$195,000.
The Law also includes a consumer protection provision that mandates a five-year guarantee against failures in the solar thermal system and a free inspection within the first year of home ownership.
2.1.2 Regulatory framework for energy efficiency
Energy efficiency labeling
Since 2008, Chile has been phasing in mandatory energy efficiency labeling for electrical appliances and electronic devices. The initiative began with incandescent and com-pact fluorescent bulbs, refrigerators and freezers, electric induction motors, and stand-by systems for ovens, mi-crowave ovens and air conditioners. Additional electrical and electronic devices will be added to these in the co-ming years.
This labeling scheme is being implemented under Chilean standards that comply with ISO 15502 and IEC 60000 stan-dards.
For street lighting, in the years leading up to 2010, in-formation was gathered and rules formulated for road lighting that include energy efficiency criteria. In this area, the Chilean Energy Efficiency Agency, in collaboration with the Inter-American Development Bank (IDB) and the United Nations Development Program (UNDP), has been conducting a pilot program in the south of Chile that runs from 2008 to 2012.
Thermal regulations for housing
These regulations were incorporated into the General Construction and Urbanism Bylaw (OGUC, Article 4.1.10) and have been in force and operating in Chile since 2000. The first stage, which began in March of that year, esta-blished minimum R-values for housing roof systems that improved resistance to heat flow significantly in that part of the building shell. This dramatically reduced heat loss, especially during winter, to the great benefit of occupants of public housing complexes.
The second stage came into force in early 2007 and com-plemented the first one. This stage set out requirements for limiting heat loss through walls, floors, and ventilated floors and windows, limiting size according to R-values.
Minimum energy performance standards (MEPS)
Chile is currently formulating a strategy to establish Mi-nimum Energy Performance Standards, based on the Mi-nistry of Energy’s newly granted authority to enact MEPS, which was established in the recently passed law that also created that institution. The first phase was implemented in 2010 and involved MEPS for lighting.
2.1.3 Institutional aspects of the energy sector rela-ted to mitigation
Center for Renewable Energies (CER)
In 2009 the Center for Renewable Energies was created under the purview of the Chilean Economic Development Agency (CORFO) and the direction of the Ministry of Ener-gy with the aim of creating a technology antenna for the development of renewable energies in Chile.
The Center was set up as a platform for capturing knowled-ge on renewable energies from around the world and analyzing potential applications in Chile, especially in the private sphere. CER’s work is focused in three main areas:
• Information Center: CER responds quickly and effecti-vely to inquiries from anyone involved in the renewable energy sector.
• Accompanying NCRE investment projects and pilot pro-jects: CER accompanies investment and pilot projects focused on NCREs during the development stage, fa-cilitating institutional relations to bring these projects
into being. In this line of action, CER supports official approval processes, offers venture fund “matchmaking,” guides investors in the use of development instruments, establishes networks of human capital and offers tech-nical guidance in general.
• Promoting and disseminating NCREs: CER promotes NCREs in different contexts at the national level through courses, workshops, seminars, training, encounters, ac-tivities and working groups.
National Energy Efficiency Program (PPEE)
In 2005, the Government of Chile, through the Ministry of Economy, set up the National Energy Efficiency Program, inviting a wide variety of stakeholders from the public and private sectors to participate. The Program was created in response to the Environmental Performance Review con-ducted by the Organization for Economic Cooperation and Development (OECD), which recommended, among other things, that Chile incorporate Energy Efficiency into its national development.
The PPEE, which became the responsibility of the National Energy Commission in January 2008, has contributed to the development of sustainable energy in Chile by pro-moting, along with other public and private institutions, advances in Energy Efficiency. Two such advances were reducing energy demand in the Central Interconnected System (SIC) energy grid by 2.6% between March 2008 and March 2009, in comparison with the previous year and establishing Energy Efficiency as a central pillar of Chile’s national energy policy.
The importance of Energy Efficiency to energy sector de-velopment is reflected in the significant increase in the budget allocated to the National Energy Efficiency Pro-gram by the National Energy Commission, which rose from US$ 1Million in 2006 to US$3.5 million in 2007, US$13 million in 2008 and close to US$40 million in 2009.
Chilean Energy Efficiency Agency (ACHEE)
The authority granted to the newly created Ministry of Energy under Law 20.402 led to the creation of the Chi-lean Energy Efficiency Agency in 2010. This entity was the successor to the PPEE and includes the participation of representatives of the ministries of Transportation and Telecommunications, Housing and Urbanism, and Energy,
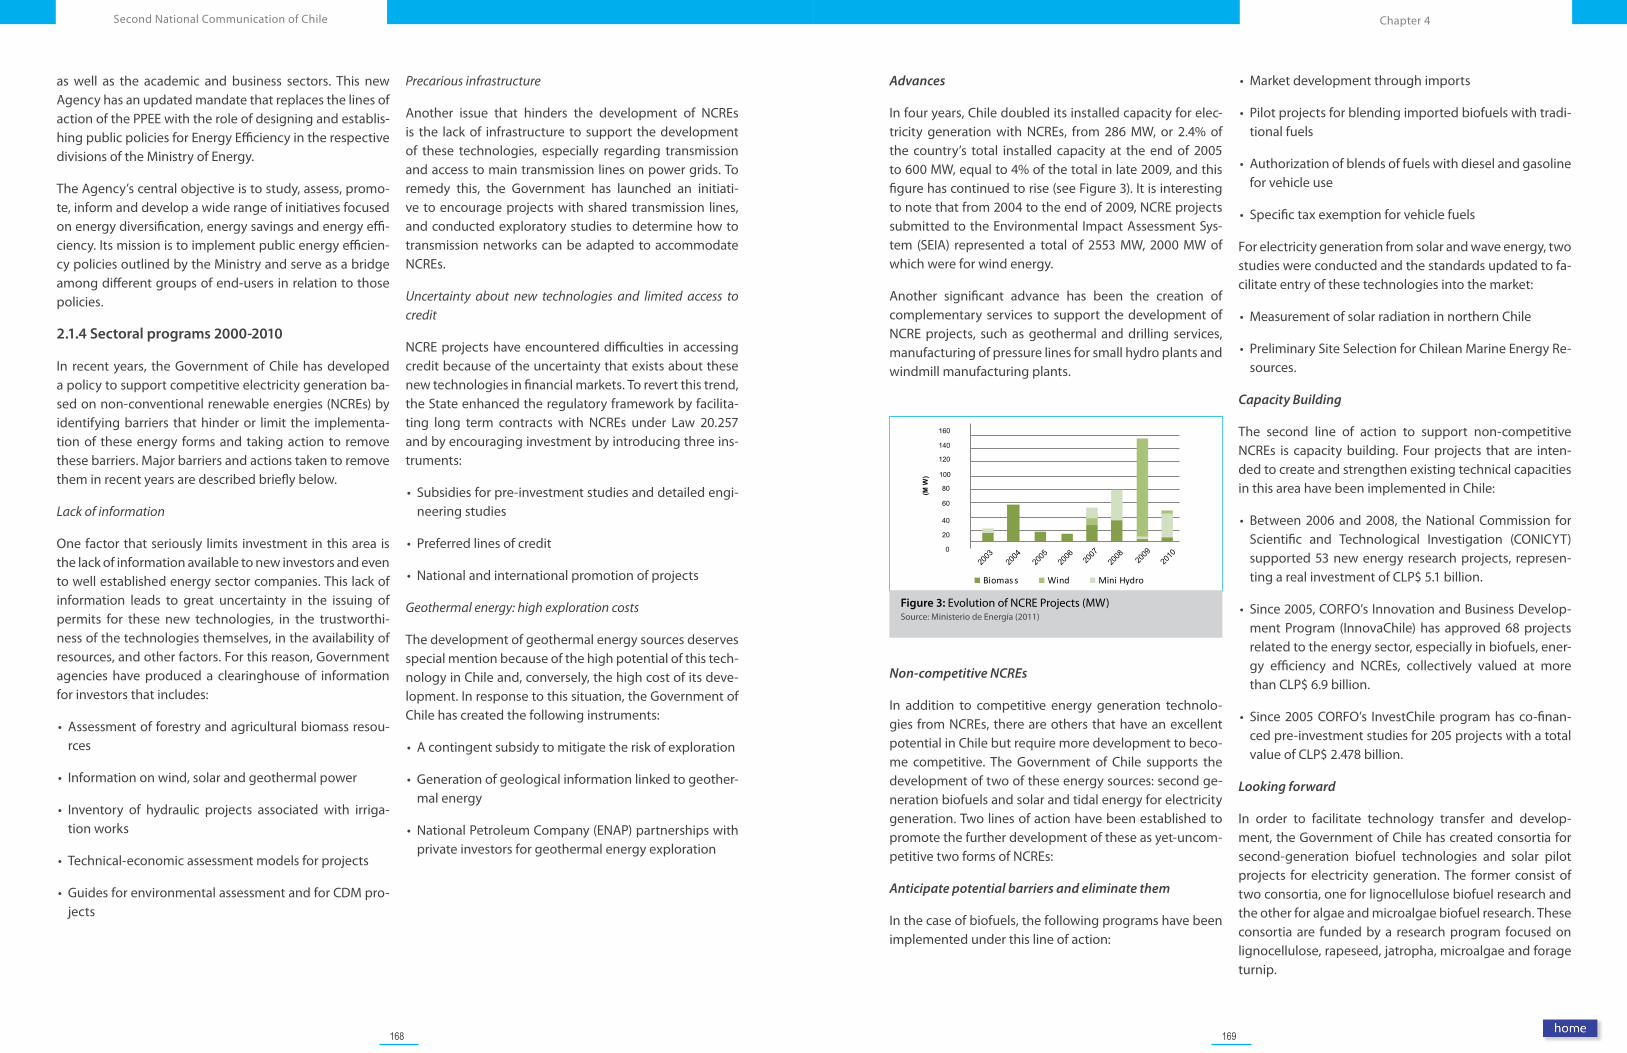
168 169
Chapter 4Second National Communication of Chile
as well as the academic and business sectors. This new Agency has an updated mandate that replaces the lines of action of the PPEE with the role of designing and establis-hing public policies for Energy Efficiency in the respective divisions of the Ministry of Energy.
The Agency’s central objective is to study, assess, promo-te, inform and develop a wide range of initiatives focused on energy diversification, energy savings and energy effi-ciency. Its mission is to implement public energy efficien-cy policies outlined by the Ministry and serve as a bridge among different groups of end-users in relation to those policies.
2.1.4 Sectoral programs 2000-2010
In recent years, the Government of Chile has developed a policy to support competitive electricity generation ba-sed on non-conventional renewable energies (NCREs) by identifying barriers that hinder or limit the implementa-tion of these energy forms and taking action to remove these barriers. Major barriers and actions taken to remove them in recent years are described briefly below.
Lack of information
One factor that seriously limits investment in this area is the lack of information available to new investors and even to well established energy sector companies. This lack of information leads to great uncertainty in the issuing of permits for these new technologies, in the trustworthi-ness of the technologies themselves, in the availability of resources, and other factors. For this reason, Government agencies have produced a clearinghouse of information for investors that includes:
• Assessment of forestry and agricultural biomass resou-rces
• Information on wind, solar and geothermal power
• Inventory of hydraulic projects associated with irriga-tion works
• Technical-economic assessment models for projects
• Guides for environmental assessment and for CDM pro-jects
Precarious infrastructure
Another issue that hinders the development of NCREs is the lack of infrastructure to support the development of these technologies, especially regarding transmission and access to main transmission lines on power grids. To remedy this, the Government has launched an initiati-ve to encourage projects with shared transmission lines, and conducted exploratory studies to determine how to transmission networks can be adapted to accommodate NCREs.
Uncertainty about new technologies and limited access to credit
NCRE projects have encountered difficulties in accessing credit because of the uncertainty that exists about these new technologies in financial markets. To revert this trend, the State enhanced the regulatory framework by facilita-ting long term contracts with NCREs under Law 20.257 and by encouraging investment by introducing three ins-truments:
• Subsidies for pre-investment studies and detailed engi-neering studies
• Preferred lines of credit
• National and international promotion of projects
Geothermal energy: high exploration costs
The development of geothermal energy sources deserves special mention because of the high potential of this tech-nology in Chile and, conversely, the high cost of its deve-lopment. In response to this situation, the Government of Chile has created the following instruments:
• A contingent subsidy to mitigate the risk of exploration
• Generation of geological information linked to geother-mal energy
• National Petroleum Company (ENAP) partnerships with private investors for geothermal energy exploration
Advances
In four years, Chile doubled its installed capacity for elec-tricity generation with NCREs, from 286 MW, or 2.4% of the country’s total installed capacity at the end of 2005 to 600 MW, equal to 4% of the total in late 2009, and this figure has continued to rise (see Figure 3). It is interesting to note that from 2004 to the end of 2009, NCRE projects submitted to the Environmental Impact Assessment Sys-tem (SEIA) represented a total of 2553 MW, 2000 MW of which were for wind energy.
Another significant advance has been the creation of complementary services to support the development of NCRE projects, such as geothermal and drilling services, manufacturing of pressure lines for small hydro plants and windmill manufacturing plants.
Non-competitive NCREs
In addition to competitive energy generation technolo-gies from NCREs, there are others that have an excellent potential in Chile but require more development to beco-me competitive. The Government of Chile supports the development of two of these energy sources: second ge-neration biofuels and solar and tidal energy for electricity generation. Two lines of action have been established to promote the further development of these as yet-uncom-petitive two forms of NCREs:
Anticipate potential barriers and eliminate them
In the case of biofuels, the following programs have been implemented under this line of action:
• Market development through imports
• Pilot projects for blending imported biofuels with tradi-tional fuels
• Authorization of blends of fuels with diesel and gasoline for vehicle use
• Specific tax exemption for vehicle fuels
For electricity generation from solar and wave energy, two studies were conducted and the standards updated to fa-cilitate entry of these technologies into the market:
• Measurement of solar radiation in northern Chile
• Preliminary Site Selection for Chilean Marine Energy Re-sources.
Capacity Building
The second line of action to support non-competitive NCREs is capacity building. Four projects that are inten-ded to create and strengthen existing technical capacities in this area have been implemented in Chile:
• Between 2006 and 2008, the National Commission for Scientific and Technological Investigation (CONICYT) supported 53 new energy research projects, represen-ting a real investment of CLP$ 5.1 billion.
• Since 2005, CORFO’s Innovation and Business Develop-ment Program (InnovaChile) has approved 68 projects related to the energy sector, especially in biofuels, ener-gy efficiency and NCREs, collectively valued at more than CLP$ 6.9 billion.
• Since 2005 CORFO’s InvestChile program has co-finan-ced pre-investment studies for 205 projects with a total value of CLP$ 2.478 billion.
Looking forward
In order to facilitate technology transfer and develop-ment, the Government of Chile has created consortia for second-generation biofuel technologies and solar pilot projects for electricity generation. The former consist of two consortia, one for lignocellulose biofuel research and the other for algae and microalgae biofuel research. These consortia are funded by a research program focused on lignocellulose, rapeseed, jatropha, microalgae and forage turnip.
Figure 3: Evolution of NCRE Projects (MW)Source: Ministerio de Energía (2011)
Biomas s Wind Mini Hydro
0 20
40
60 80
100
2003
20
04
2005
20
06
2007
2008
20
0920
10
120
140
160
(M W
)
170 171
Chapter 4Second National Communication of Chile
For the solar-generated electricity pilot projects, support will be provided to the country’s first projects, which con-sist of a 500 KW photovoltaic project for a small electricity grid and a thermoelectric solar plant of approximately 10 MW connected to one of the largest electricity grids in the country.
Energy efficiency
Chile has channeled its efforts to promote energy effi-ciency primarily through its National Energy Efficien-cy Program and the Chilean Energy Efficiency Agency, a public-private foundation charged with promoting, strengthening and consolidating the efficient use of energy by coordinating and implementing national and international public-private initiatives in different energy consumption sectors to foster the country’s sustainable development (for more details, see Chapter 1 of this Com-munication, on National Circumstances). This institutional arrangement has enabled the development, since 2009, of the following sectoral programs:
•EnergyEfficiencyPreinvestmentProgram
This program offers a subsidy to optimize energy con-sumption and reduce energy-related costs, enabling small and medium sized enterprises (SMEs) to identify inves-tment alternatives and assess them from a technical, eco-nomic and financial standpoint. The program subsidizes energy efficiency audits, implementation plans for energy efficiency measures, and the preparation of investment projects for presentation to potential funding sources. The subsidy covers up to 70% of the total cost of the pro-ject up to a maximum of around US$12,000.
•CORFOEnergyEfficiencyLoan
This is a long term loan or bank leasing scheme that allows companies to make the investments they need to imple-ment energy optimization projects and reduce the costs associated with energy use. The loan is intended to sup-port investment in machines and equipment, buildings and installations or engineering works, engineering and installation services, and similar goods and services that companies may require to operate an energy efficient bu-siness, including the working capital associated with tho-se investments.
•Advancesintheresidential,commercialandinstitutionalsector
A series of programs have been established in the recent years, most notably:
o A program to switch from incandescent to compact fluorescent lighting involving approximately 2.5 million bulbs for the 40% most vulnerable families in the coun-try.
o An incentive program for thermal retrofitting of existing housing that has benefited 9,000 households.
o A Pilot Program to Improve Standards for New Public Housing involving 400 residential units.
o An Energy Efficiency Improvement Program for Public Buildings, including 25 diagnostics and a comprehensi-ve energy efficiency program for La Moneda presiden-tial palace.
o Mass media campaigns for energy efficiency, to raise public awareness on good energy use and promote the use of practical energy efficiency measures.
o To complement this program, in the first half of 2010 the campaign “Levantemos Chile con buena energia” (Let’s Raise Chile Up with Good Energy) was implemented in the areas most affected by the earthquake that struck the country in February 27, 2010. The campaign inclu-ded visits to 32 localities and 61 schools to deliver the message.
•Advancesintheindustrialsector:
o An instrument was developed and implemented for pre-investment in energy efficiency measures jointly with CORFO. This instrument offers co-financing of up to 70% of the cost of energy audits.
o Preferred lines of credit for energy efficiency projects, launched in 2008 with CORFO with funding from the German Development Bank, KfW.
o Technical Assistance program for industrial motor sys-tems to boost energy savings by optimizing systems using energy efficient motors.
The National Energy Efficiency Program has also been in-volved in implementing energy efficiency programs in the transportation and mining sectors, including the techni-cal assistance program for energy efficiency for shipping companies and the truck replacement program. More de-tails of these activities are found in the transportation and copper mining sections of this chapter.
In November 2010, the first Energy Efficiency Expo in Latin America was held in Santiago, Chile. The event was held to promote energy efficiency technologies and mechanisms and to disseminate best practices. About 5,000 people at-tended the event, along with 120 institutions from Chile and abroad. Information about the event can be viewed online at: http://www.expoeficienciaenergetica.cl
2.1.5 Studies of sector-specific mitigation options and their main results
In the past ten years a series of studies have been conduc-ted that, directly or indirectly, indicate the most suitable and highest yielding options for mitigating GHG emis-sions in Chile’s energy sector. The Government of Chile, especially the Ministry of Energy and the National Energy Commission, have financed many of these studies; their results, however, have not been translated automatically into official domestic policies or positions for international negotiations and multilateral agreements. The most signi-ficant studies conducted in this area are listed below:
• Poch Ambiental for CNE (2009). Proyección de la evolu-ción de las emisiones de gases de efecto invernadero en el sector energía. Años 2000-2025 (Projected Evolu-tion of Greenhouse Gas Emissions in the Energy Sector, 2000-2025)
• POCH Ambiental for CORFO (2009). Estrategia y poten-ciales de transferencia tecnológica para el cambio cli-mático (Strategy and potential technology transfers for climate change).
• PROGEA (2009). Consumo de energía y emisiones de ga-ses de efecto invernadero en Chile 2007-2030 y opciones de mitigación (Energy consumption and greenhouse gas emissions in Chile 2007-2030 and mitigation options).
• PRIEN (2008). Estimación del potencial de ahorro de energía, mediante mejoramientos de la eficiencia ener-gética de los distintos sectores (Estimating the potential energy savings from improvements to energy efficiency in different sectors).
• PROGEA (2008). Diseño de un modelo de proyección de demanda energética global nacional de largo plazo (De-sign of a model for projecting long term national energy demand).
• PROGEA (2008). Emisiones de gases de efecto invernade-ro en Chile: antecedentes para el desarrollo de un marco regulatorio y evaluación de instrumentos de reducción (Greenhouse gas emissions in Chile: information for de-veloping a regulatory and assessment framework for instruments to reduce GHGs).
• De Miguel, C., O´Ryan, R., Pereira, M. and Carriquiri, B. Energy shocks fiscal policy and CO₂ emissions in Chile.
• PRIEN (2008b). Estimación preliminar del potencial de la eficiencia en el uso de la energía eléctrica al abasteci-miento del SIC (Preliminary estimation of the potential of efficient electricity use in the SIC grid).
• PRIEN / NEIM (2008). Aporte potencial de energías re-novables no convencionales y eficiencia energética a la matriz eléctrica, 2008-2025 (Potential contribution of non-conventional renewable energies and energy effi-ciency to the electricity grid, 2008-2025).
• PRIEN / NEIM (2008a). Estimación del aporte potencial de las energías renovables no convencionales y del uso eficiente de la energía eléctrica al sistema interconecta-do central (SIC) en el periodo 2008-2025 (Estimating the potential contribution of non-conventional renewable energies and the efficient use of electrical energy for the Central interconnected Grid (SIC) for the 2008-2025 period).
• Eficiencia Energética: Diseño de incentivos económicos a la compra de refrigeradores energéticamente Eficien-tes (Energy Efficiency: Design of economic incentives for energy efficient refrigerator purchases).
• GAMMA Ingenieros-CNE (2004). Evaluación del desem-peño operacional y comercial de centrales de cogene-ración y estudio del potencial de cogeneración en Chile (Evaluation of operational and commercial performance of cogenerating plants and study of the potential for co-generation in Chile).
• PRIEN / CONAMA (1999). Mitigación de gases de efecto invernadero. Chile 1994-2020 (Mitigation of greenhouse gases in Chile, 1994-2020).
172 173
Chapter 4Second National Communication of Chile
2.1.6 Strengthening sectoral mitigation capacities with international financing
The most significant internationally-funded initiative for mitigating GHG emissions in Chile is that carried out by GTZ, the German International Cooperation Agency, which implements projects that are funded by the agency itself and by other German government institutions such as the Federal Ministry for Economic Cooperation and Development (BMZ) and the Federal Ministry of the Envi-ronment, Environmental Protection and Nuclear Security (BMU). This cooperation initiative is focused on two spe-cific areas—non-conventional renewable energies and energy efficiency.
The United Nations Development Program (UNDP) has also contributed financing and implemented projects in Chile that are intended to promote a sustainable energy policy.
Non-conventional renewable energies: BMZ/GTZ project.Supporting the implementation of a sustainable energy policy for Chile: diagnostic and recommendations
Since 2004, GTZ has supported Chile with a technical coo-peration project in the NCRE area. The project promoted activities carried out by the Government of Chile in this area and included complementary activities co-financed by GTZ. The aim was to produce recommendations for the Government’s sustainable energy policy after a parti-cipatory analysis with representatives of civil society and the private, academic and public sectors. The process in-cluded work sessions and seminars in which recommen-dations were presented and reformulated. The aim was to achieve a set of agreed-upon policy instruments that would improve the sustainability of the country’s energy supply and were coherent with the objectives of econo-mic growth, social equity and environmental protection. The project involved universities, Chilean and internatio-nal organizations, and electricity market investors, com-panies and experts. The 7-year project began in August 2004 and has a total budget of €4,245,000.
Public lands for energy generating projects using re-newable energies: BMU/GTZ project
The objective of this project is to identify, appraise and promote the use of State owned land in Chile’s Norte Gran-
de region for energy generation projects using NCREs. This 3-year initiative began in November 2008 with a total budget of €1.2 million. The project involves studying the potential for wind and solar power at different localities of the Norte Grande, followed by pre-feasibility and other studies for wind farms generating 100 to 200 MW. The re-sults will be published and the concessions deemed most suitable for wind and solar power generation will be offe-red for public tender.
Strategy for expanding the use of renewable energies in Chile’s electricity grids: BMU/GTZ project
This project is intended to develop a strategy for the me-dium and long term to expand the use of NCREs in Chile’s electricity grids in a way that is compatible with Chile’s energy policy. The 4- year project, which also includes formulating regulatory proposals for implementing the strategy, began in October 2009 and has a budget of €3,000,000.
Other geothermal and NCRE refinancing projects: KfW and GTZ projects
German international cooperation, through the German Development Bank (KfW), contributed €80,000,000 to re-finance investments in NCREs in Chile. The KfW also contri-buted €5,100,000 to Chile’s National Geological and Mining Service (SERNAGEOMIN) to acquire laboratory equipment and support the exploration of geothermal sites. In addi-tion, approximately €400,000 was earmarked for technical assistance and training of SERNAGEOMIN staff. The imple-mentation of these activities was overseen by the Federal Institute of Geoscience and Natural Resources (BGR).
Energy Efficiency: BMZ/GTZ project
The German Federal Ministry of Economic Cooperation and Development (BMZ) commissioned GTZ to promote energy efficiency in Chile, working with the National Ener-gy Commission through the National Energy Efficiency Program. The 4-year project began in October 2006 and was intended to improve the technical and institutional capacities of public and private entities to implement energy efficiency measures in industry and buildings. At the same time some goals were set, such as reducing energy demand by 30% in five pilot projects involving new and renovated housing; organizing training pro-
grams for energy service companies (ESCOs) operating in the housing and industrial sectors, and formulating inter-nal energy efficiency policies in 3 kinds of industrial plants and implementing quantitative goals for reducing energy consumption in their internal processes.
Project for Energy Efficiency and Cogeneration in Public Hospitals: BMU-GTZ project
This initiative is financed by Germany’s Federal Ministry of the Environment, Environmental Protection and Nuclear Security and focuses on energy efficiency, cogeneration, sustainable innovation and the development of NAMAs in the context of Chilean-German bilateral cooperation. It consists of a pilot program to introduce and implement replicable energy efficiency measures and cogeneration in public hospitals. The project also seeks to introduce an ESCO energy management model as well as micro- and small-scale energy generating plants in public hospitals. The project is being implemented by GTZ under the Na-tional Energy efficiency Plan (PPEE) with a total budget of €1,050,000. The pilot project includes a cogenerating plant in the Cañete Hospital.
Other projects co-financed by the Global Environment Fa-cility
In September 2001 the UNDP signed agreement CHI/00/G32 with the CNE and the Ministry of Foreign Relations, under which GEF would co-finance the project “Removal of Barriers to Rural Electrification using Renewable Ener-gies,” with a total GEF contribution of US$ 6,067,300. Chile’s contribution was estimated at US$ 26.3 million, mainly from investments in rural electrification using renewable energies obtained from State subsidies, private sector contributions and beneficiaries themselves. In 2010, two additional GEF-financed projects were being implemen-ted under the PPEE for a non-refundable amount of US $ 5 million. The Inter-American Development Bank is the im-plementing agency for these projects, which are: Promo-tion and strengthening of the energy efficiency market in Chile’s industrial sector (GEF/SEC 3599) and Incentives for establishing and consolidating an energy services market in Chile (GEF/SEC 4176).
2.1.7 Private sector developments for mitigation
The country’s private energy sector has been especially active in recent years in identifying mitigation measures eligible to participate in the Kyoto Protocol’s Clean Deve-lopment Mechanism (CDM). Details of projects in this sec-tor and an associated analysis is included in this chapter, in the section “Cross-sector Actions” and in the section on “Technology Transfer” in Chapter 5, whose title is “Addi-tional Information related to the Convention’s Objectives.”
2.1.8 Potential sector-specific mitigation options for developing NAMAs
The country’s energy sector has great potential for miti-gating greenhouse gas emissions in both energy genera-tion and consumption. But there is also some uncertainty about the degree of penetration of mitigation technolo-gies and the technical capacity needed to take advantage of this potential. Some factors that contribute to this un-certainty are future prices of energy generating and con-sumption technologies, future international fossil fuel pri-ces, and national economic growth rates, among others.
Chile intends to introduce nationally appropriate mitiga-tion actions, or NAMAs, and to this end has been conduc-ting a series of studies in recent years to determine the precise potential for mitigating GHG emissions in the country and the costs associated with that potential.
Thus, based on the information obtained from previous studies, in 2011 the study “Co-beneficios de la Mitigacion de Gases de Efecto Invernadero” (Co-benefits of Green-house Gas Mitigation) was conducted by the Environ-mental Division (GreenLab UC) of the Scientific and Te-chnological Research Office of the Pontificia Universidad Catolica de Chile (DICTUC). This study assesses, among other things, the expected costs of GHG reductions that are estimated for a series of measures, in order to deter-mine the potential for GHG abatement at different levels per ton of CO2eq. The study also develops an abatement cost curve. The following section will discuss energy sec-tor measures derived from this curve.
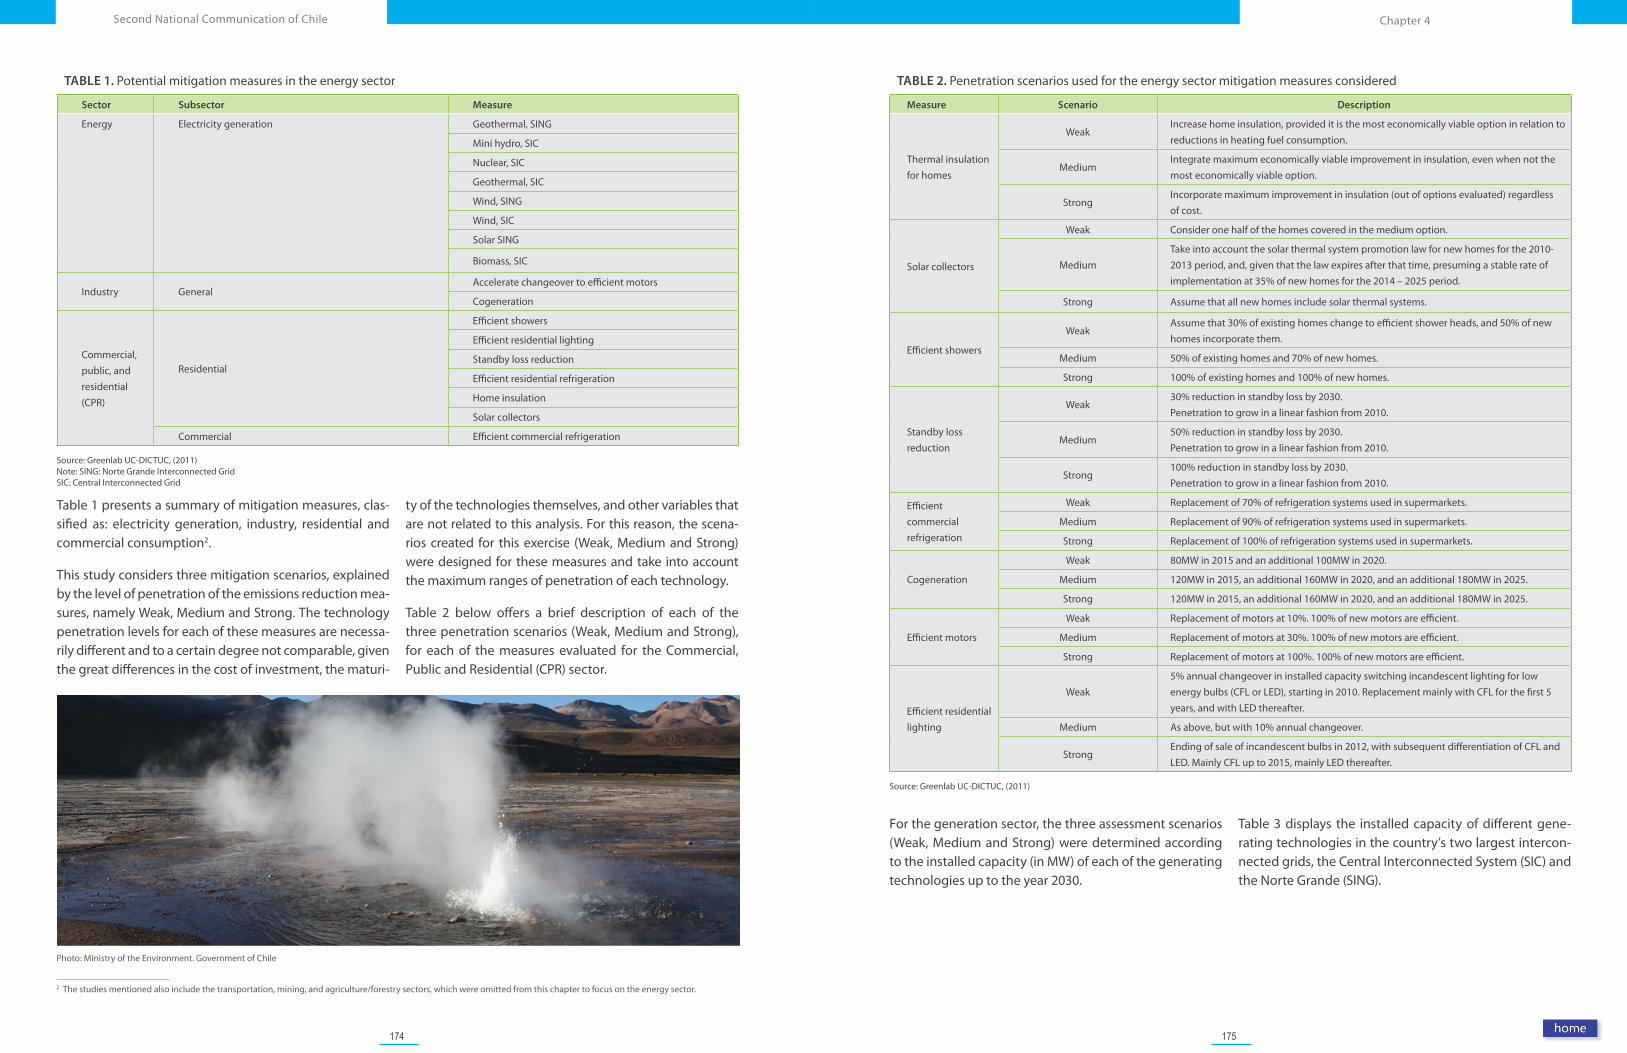
174 175
Chapter 4Second National Communication of Chile
2 The studies mentioned also include the transportation, mining, and agriculture/forestry sectors, which were omitted from this chapter to focus on the energy sector.
Photo: Ministry of the Environment. Government of Chile
TABLE 1. Potential mitigation measures in the energy sector
Sector Subsector Measure
Energy Electricity generation Geothermal, SING
Mini hydro, SIC
Nuclear, SIC
Geothermal, SIC
Wind, SING
Wind, SIC
Solar SING
Biomass, SIC
Industry GeneralAccelerate changeover to efficient motors
Cogeneration
Commercial, public, and residential (CPR)
Residential
Efficient showers
Efficient residential lighting
Standby loss reduction
Efficient residential refrigeration
Home insulation
Solar collectors
Commercial Efficient commercial refrigeration
Source: Greenlab UC-DICTUC, (2011) Note: SING: Norte Grande Interconnected Grid SIC: Central Interconnected Grid
Table 1 presents a summary of mitigation measures, clas-sified as: electricity generation, industry, residential and commercial consumption2.
This study considers three mitigation scenarios, explained by the level of penetration of the emissions reduction mea-sures, namely Weak, Medium and Strong. The technology penetration levels for each of these measures are necessa-rily different and to a certain degree not comparable, given the great differences in the cost of investment, the maturi-
ty of the technologies themselves, and other variables that are not related to this analysis. For this reason, the scena-rios created for this exercise (Weak, Medium and Strong) were designed for these measures and take into account the maximum ranges of penetration of each technology.
Table 2 below offers a brief description of each of the three penetration scenarios (Weak, Medium and Strong), for each of the measures evaluated for the Commercial, Public and Residential (CPR) sector.
TABLE 2. Penetration scenarios used for the energy sector mitigation measures considered
Measure Scenario Description
Thermal insulation for homes
WeakIncrease home insulation, provided it is the most economically viable option in relation to reductions in heating fuel consumption.
MediumIntegrate maximum economically viable improvement in insulation, even when not the most economically viable option.
StrongIncorporate maximum improvement in insulation (out of options evaluated) regardless of cost.
Solar collectors
Weak Consider one half of the homes covered in the medium option.
MediumTake into account the solar thermal system promotion law for new homes for the 2010-2013 period, and, given that the law expires after that time, presuming a stable rate of implementation at 35% of new homes for the 2014 – 2025 period.
Strong Assume that all new homes include solar thermal systems.
Efficient showers
WeakAssume that 30% of existing homes change to efficient shower heads, and 50% of new homes incorporate them.
Medium 50% of existing homes and 70% of new homes.
Strong 100% of existing homes and 100% of new homes.
Standby loss reduction
Weak30% reduction in standby loss by 2030. Penetration to grow in a linear fashion from 2010.
Medium50% reduction in standby loss by 2030. Penetration to grow in a linear fashion from 2010.
Strong100% reduction in standby loss by 2030. Penetration to grow in a linear fashion from 2010.
Efficient commercial refrigeration
Weak Replacement of 70% of refrigeration systems used in supermarkets.
Medium Replacement of 90% of refrigeration systems used in supermarkets.
Strong Replacement of 100% of refrigeration systems used in supermarkets.
Cogeneration
Weak 80MW in 2015 and an additional 100MW in 2020.
Medium 120MW in 2015, an additional 160MW in 2020, and an additional 180MW in 2025.
Strong 120MW in 2015, an additional 160MW in 2020, and an additional 180MW in 2025.
Efficient motors
Weak Replacement of motors at 10%. 100% of new motors are efficient.
Medium Replacement of motors at 30%. 100% of new motors are efficient.
Strong Replacement of motors at 100%. 100% of new motors are efficient.
Efficient residential lighting
Weak5% annual changeover in installed capacity switching incandescent lighting for low energy bulbs (CFL or LED), starting in 2010. Replacement mainly with CFL for the first 5 years, and with LED thereafter.
Medium As above, but with 10% annual changeover.
StrongEnding of sale of incandescent bulbs in 2012, with subsequent differentiation of CFL and LED. Mainly CFL up to 2015, mainly LED thereafter.
Source: Greenlab UC-DICTUC, (2011)
For the generation sector, the three assessment scenarios (Weak, Medium and Strong) were determined according to the installed capacity (in MW) of each of the generating technologies up to the year 2030.
Table 3 displays the installed capacity of different gene-rating technologies in the country’s two largest intercon-nected grids, the Central Interconnected System (SIC) and the Norte Grande (SING).
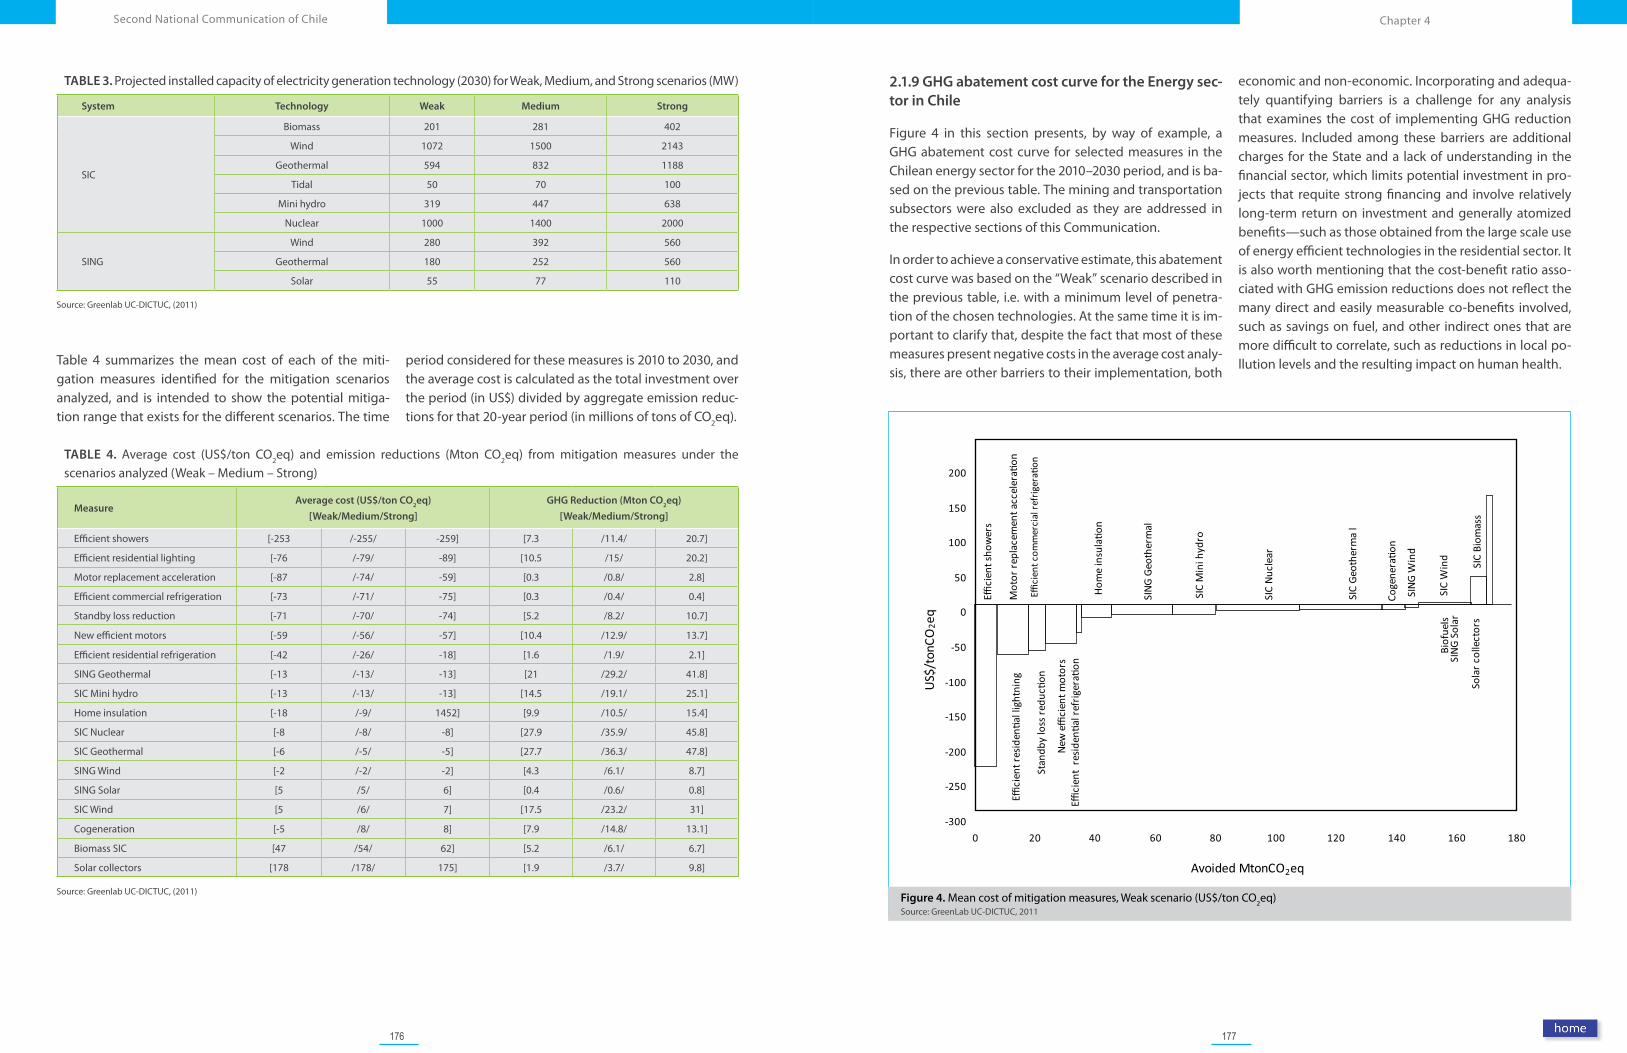
176 177
Chapter 4Second National Communication of Chile
TABLE 3. Projected installed capacity of electricity generation technology (2030) for Weak, Medium, and Strong scenarios (MW)
System Technology Weak Medium Strong
SIC
Biomass 201 281 402
Wind 1072 1500 2143
Geothermal 594 832 1188
Tidal 50 70 100
Mini hydro 319 447 638
Nuclear 1000 1400 2000
SING
Wind 280 392 560
Geothermal 180 252 560
Solar 55 77 110
Source: Greenlab UC-DICTUC, (2011)
TABLE 4. Average cost (US$/ton CO2eq) and emission reductions (Mton CO2eq) from mitigation measures under the scenarios analyzed (Weak – Medium – Strong)
MeasureAverage cost (US$/ton CO
2eq)
[Weak/Medium/Strong]
GHG Reduction (Mton CO2eq)
[Weak/Medium/Strong]
Efficient showers [-253 /-255/ -259] [7.3 /11.4/ 20.7]
Efficient residential lighting [-76 /-79/ -89] [10.5 /15/ 20.2]
Motor replacement acceleration [-87 /-74/ -59] [0.3 /0.8/ 2.8]
Efficient commercial refrigeration [-73 /-71/ -75] [0.3 /0.4/ 0.4]
Standby loss reduction [-71 /-70/ -74] [5.2 /8.2/ 10.7]
New efficient motors [-59 /-56/ -57] [10.4 /12.9/ 13.7]
Efficient residential refrigeration [-42 /-26/ -18] [1.6 /1.9/ 2.1]
SING Geothermal [-13 /-13/ -13] [21 /29.2/ 41.8]
SIC Mini hydro [-13 /-13/ -13] [14.5 /19.1/ 25.1]
Home insulation [-18 /-9/ 1452] [9.9 /10.5/ 15.4]
SIC Nuclear [-8 /-8/ -8] [27.9 /35.9/ 45.8]
SIC Geothermal [-6 /-5/ -5] [27.7 /36.3/ 47.8]
SING Wind [-2 /-2/ -2] [4.3 /6.1/ 8.7]
SING Solar [5 /5/ 6] [0.4 /0.6/ 0.8]
SIC Wind [5 /6/ 7] [17.5 /23.2/ 31]
Cogeneration [-5 /8/ 8] [7.9 /14.8/ 13.1]
Biomass SIC [47 /54/ 62] [5.2 /6.1/ 6.7]
Solar collectors [178 /178/ 175] [1.9 /3.7/ 9.8]
Source: Greenlab UC-DICTUC, (2011)
Table 4 summarizes the mean cost of each of the miti-gation measures identified for the mitigation scenarios analyzed, and is intended to show the potential mitiga-tion range that exists for the different scenarios. The time
period considered for these measures is 2010 to 2030, and the average cost is calculated as the total investment over the period (in US$) divided by aggregate emission reduc-tions for that 20-year period (in millions of tons of CO2eq).
2.1.9 GHG abatement cost curve for the Energy sec-tor in Chile
Figure 4 in this section presents, by way of example, a GHG abatement cost curve for selected measures in the Chilean energy sector for the 2010–2030 period, and is ba-sed on the previous table. The mining and transportation subsectors were also excluded as they are addressed in the respective sections of this Communication.
In order to achieve a conservative estimate, this abatement cost curve was based on the “Weak” scenario described in the previous table, i.e. with a minimum level of penetra-tion of the chosen technologies. At the same time it is im-portant to clarify that, despite the fact that most of these measures present negative costs in the average cost analy-sis, there are other barriers to their implementation, both
economic and non-economic. Incorporating and adequa-tely quantifying barriers is a challenge for any analysis that examines the cost of implementing GHG reduction measures. Included among these barriers are additional charges for the State and a lack of understanding in the financial sector, which limits potential investment in pro-jects that requite strong financing and involve relatively long-term return on investment and generally atomized benefits—such as those obtained from the large scale use of energy efficient technologies in the residential sector. It is also worth mentioning that the cost-benefit ratio asso-ciated with GHG emission reductions does not reflect the many direct and easily measurable co-benefits involved, such as savings on fuel, and other indirect ones that are more difficult to correlate, such as reductions in local po-llution levels and the resulting impact on human health.
Figure 4. Mean cost of mitigation measures, Weak scenario (US$/ton CO2eq)Source: GreenLab UC-DICTUC, 2011
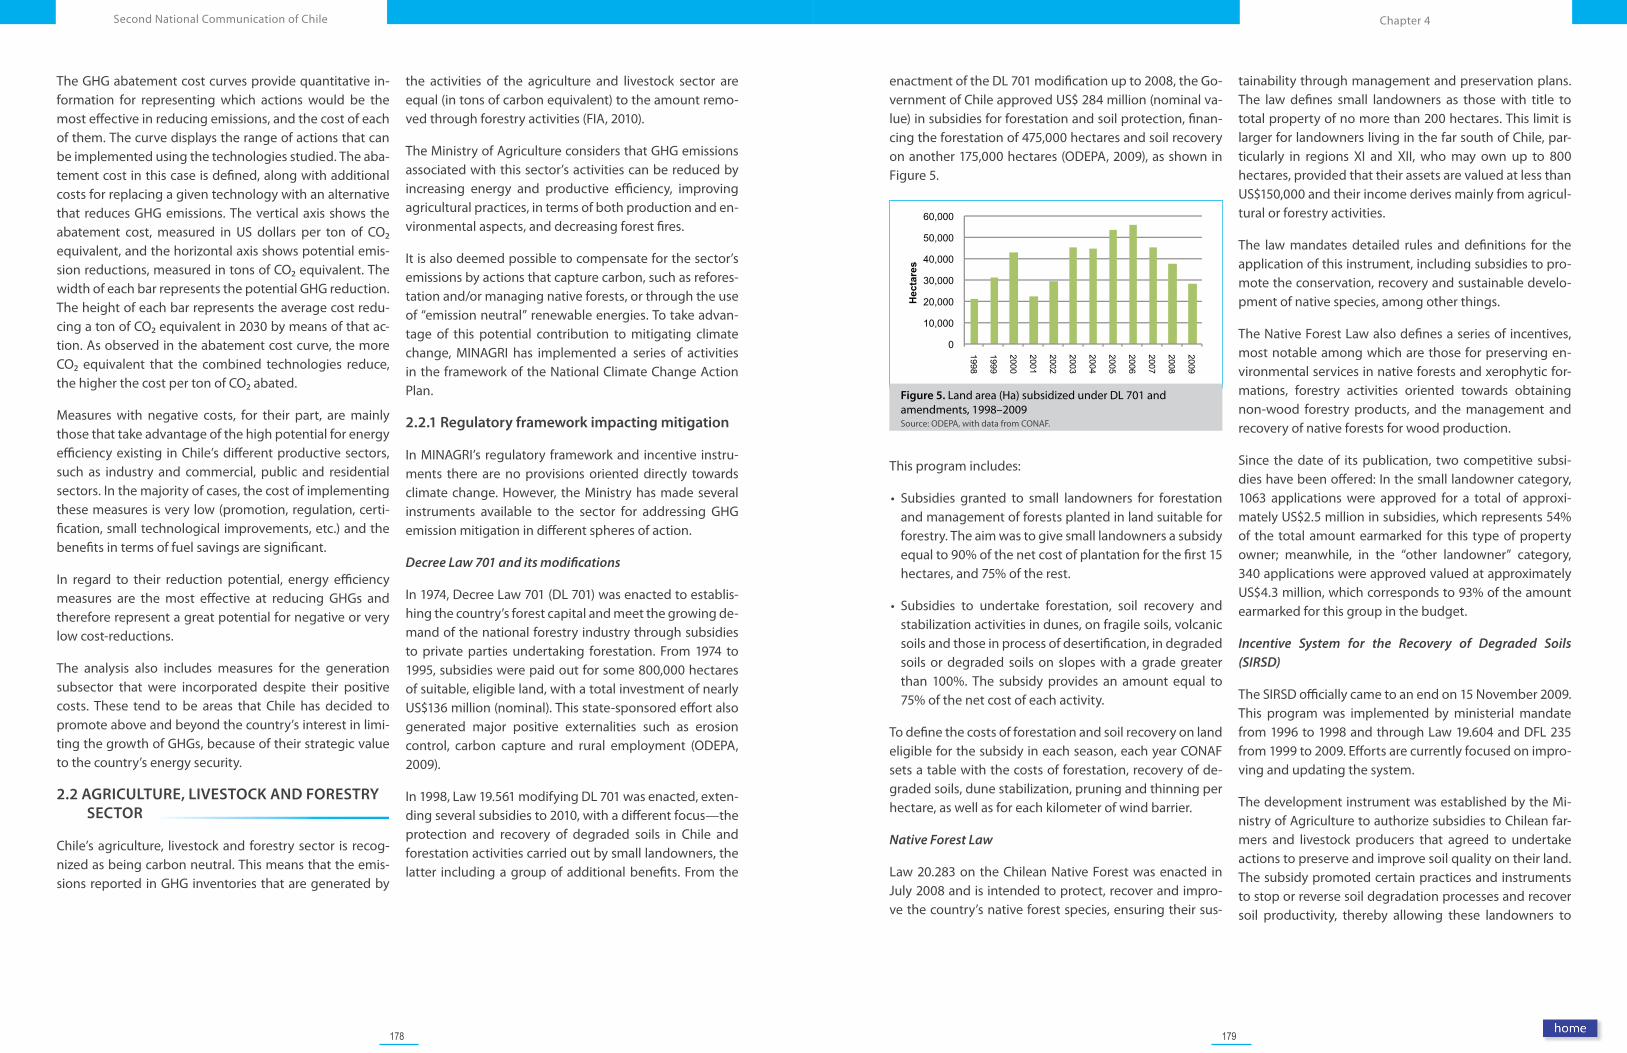
178 179
Chapter 4Second National Communication of Chile
The GHG abatement cost curves provide quantitative in-formation for representing which actions would be the most effective in reducing emissions, and the cost of each of them. The curve displays the range of actions that can be implemented using the technologies studied. The aba-tement cost in this case is defined, along with additional costs for replacing a given technology with an alternative that reduces GHG emissions. The vertical axis shows the abatement cost, measured in US dollars per ton of CO₂ equivalent, and the horizontal axis shows potential emis-sion reductions, measured in tons of CO₂ equivalent. The width of each bar represents the potential GHG reduction. The height of each bar represents the average cost redu-cing a ton of CO₂ equivalent in 2030 by means of that ac-tion. As observed in the abatement cost curve, the more CO₂ equivalent that the combined technologies reduce, the higher the cost per ton of CO₂ abated.
Measures with negative costs, for their part, are mainly those that take advantage of the high potential for energy efficiency existing in Chile’s different productive sectors, such as industry and commercial, public and residential sectors. In the majority of cases, the cost of implementing these measures is very low (promotion, regulation, certi-fication, small technological improvements, etc.) and the benefits in terms of fuel savings are significant.
In regard to their reduction potential, energy efficiency measures are the most effective at reducing GHGs and therefore represent a great potential for negative or very low cost-reductions.
The analysis also includes measures for the generation subsector that were incorporated despite their positive costs. These tend to be areas that Chile has decided to promote above and beyond the country’s interest in limi-ting the growth of GHGs, because of their strategic value to the country’s energy security.
2.2 AGRICULTURE, LIVESTOCK AND FORESTRY SECTOR
Chile’s agriculture, livestock and forestry sector is recog-nized as being carbon neutral. This means that the emis-sions reported in GHG inventories that are generated by
the activities of the agriculture and livestock sector are equal (in tons of carbon equivalent) to the amount remo-ved through forestry activities (FIA, 2010).
The Ministry of Agriculture considers that GHG emissions associated with this sector’s activities can be reduced by increasing energy and productive efficiency, improving agricultural practices, in terms of both production and en-vironmental aspects, and decreasing forest fires.
It is also deemed possible to compensate for the sector’s emissions by actions that capture carbon, such as refores-tation and/or managing native forests, or through the use of “emission neutral” renewable energies. To take advan-tage of this potential contribution to mitigating climate change, MINAGRI has implemented a series of activities in the framework of the National Climate Change Action Plan.
2.2.1 Regulatory framework impacting mitigation
In MINAGRI’s regulatory framework and incentive instru-ments there are no provisions oriented directly towards climate change. However, the Ministry has made several instruments available to the sector for addressing GHG emission mitigation in different spheres of action.
Decree Law 701 and its modifications
In 1974, Decree Law 701 (DL 701) was enacted to establis-hing the country’s forest capital and meet the growing de-mand of the national forestry industry through subsidies to private parties undertaking forestation. From 1974 to 1995, subsidies were paid out for some 800,000 hectares of suitable, eligible land, with a total investment of nearly US$136 million (nominal). This state-sponsored effort also generated major positive externalities such as erosion control, carbon capture and rural employment (ODEPA, 2009).
In 1998, Law 19.561 modifying DL 701 was enacted, exten-ding several subsidies to 2010, with a different focus—the protection and recovery of degraded soils in Chile and forestation activities carried out by small landowners, the latter including a group of additional benefits. From the
enactment of the DL 701 modification up to 2008, the Go-vernment of Chile approved US$ 284 million (nominal va-lue) in subsidies for forestation and soil protection, finan-cing the forestation of 475,000 hectares and soil recovery on another 175,000 hectares (ODEPA, 2009), as shown in Figure 5.
This program includes:
• Subsidies granted to small landowners for forestation and management of forests planted in land suitable for forestry. The aim was to give small landowners a subsidy equal to 90% of the net cost of plantation for the first 15 hectares, and 75% of the rest.
• Subsidies to undertake forestation, soil recovery and stabilization activities in dunes, on fragile soils, volcanic soils and those in process of desertification, in degraded soils or degraded soils on slopes with a grade greater than 100%. The subsidy provides an amount equal to 75% of the net cost of each activity.
To define the costs of forestation and soil recovery on land eligible for the subsidy in each season, each year CONAF sets a table with the costs of forestation, recovery of de-graded soils, dune stabilization, pruning and thinning per hectare, as well as for each kilometer of wind barrier.
Native Forest Law
Law 20.283 on the Chilean Native Forest was enacted in July 2008 and is intended to protect, recover and impro-ve the country’s native forest species, ensuring their sus-
tainability through management and preservation plans. The law defines small landowners as those with title to total property of no more than 200 hectares. This limit is larger for landowners living in the far south of Chile, par-ticularly in regions XI and XII, who may own up to 800 hectares, provided that their assets are valued at less than US$150,000 and their income derives mainly from agricul-tural or forestry activities.
The law mandates detailed rules and definitions for the application of this instrument, including subsidies to pro-mote the conservation, recovery and sustainable develo-pment of native species, among other things.
The Native Forest Law also defines a series of incentives, most notable among which are those for preserving en-vironmental services in native forests and xerophytic for-mations, forestry activities oriented towards obtaining non-wood forestry products, and the management and recovery of native forests for wood production.
Since the date of its publication, two competitive subsi-dies have been offered: In the small landowner category, 1063 applications were approved for a total of approxi-mately US$2.5 million in subsidies, which represents 54% of the total amount earmarked for this type of property owner; meanwhile, in the “other landowner” category, 340 applications were approved valued at approximately US$4.3 million, which corresponds to 93% of the amount earmarked for this group in the budget.
Incentive System for the Recovery of Degraded Soils (SIRSD)
The SIRSD officially came to an end on 15 November 2009. This program was implemented by ministerial mandate from 1996 to 1998 and through Law 19.604 and DFL 235 from 1999 to 2009. Efforts are currently focused on impro-ving and updating the system.
The development instrument was established by the Mi-nistry of Agriculture to authorize subsidies to Chilean far-mers and livestock producers that agreed to undertake actions to preserve and improve soil quality on their land. The subsidy promoted certain practices and instruments to stop or reverse soil degradation processes and recover soil productivity, thereby allowing these landowners to
Figure 5. Land area (Ha) subsidized under DL 701 and amendments, 1998–2009 Source: ODEPA, with data from CONAF.
0
10,000
20,000
30,000
40,000
50,000
60,000
1998
1999
2000
2001
2002
2003
2004
2005
2006
2007
2008
2009
Hec
tare
s
180 181
Chapter 4Second National Communication of Chile
better participate in productive processes. The subsidy originated with Chile’s participation in the Mercosur. In 1995, MINAGRI established a set of measures to support farmers in the south-central part of the country (Maule to Los Lagos regions) who had lost revenue because of foreign competition and the importation of foreign pro-ducts (mainly wheat, oilseed, meat and milk). One of these measures was the Program to Establish Grasslands, imple-mented in the regions of Biobio, Araucania and Los Lagos-Los Rios.
In 1997, sub-programs for phosphate fertilization and soil liming were added to combat the lack of phosphorus and excess acidity in the soils of these regions, under the Soil Productivity Recovery Plan. In 1999, with the creation of a legal framework, this Program was officially named the SIRSD, and two new sub-programs were added, for soil conservation and soil rehabilitation.
The Program’s incentives were available to all farmers in the country and were granted by the Institute for Agricul-tural Development (INDAP) to small farmers as they are defined in a Law, and by the Agriculture and Livestock Ser-vice (SAG) to all other growers and livestock producers, in-cluding private legal entities and private individuals who were not eligible under INDAP (small, medium and large producers).
All growers were required to present a management plan formulated by an accredited operator to SAG or INDAP for the respective agency’s approval. Each applicant could access a maximum subsidy of US$12,000 per year. Private sector participants in this Program were agricultural ope-rators, professionals, and technicians who designed ma-nagement plans and took soil samples, accredited labora-tories that analyzed the samples and farmers themselves, who were the direct beneficiaries. Other experts also par-ticipated in specific activities of the SIRSD. Public sector participants included the Office of the Undersecretary of Agriculture, ODEPA, SAG, INDAP, and regional representa-tives of the agricultural ministry.
Irrigation Law
Chile’s Irrigation Law 18.450 of 1985 allows the private sec-tor to obtain subsidies of up to 90% to install infrastruc-ture and technical irrigation systems to modernize their growing techniques and make them more competitive. There is consensus in the Chilean agriculture sector that irrigation is one of their main development instruments.
For this reason, the funds available under the Law of De-velopment (Ley de Fomento) have increased significantly in recent years, from CHL$11 billion to 29 billion.
In recent years, the distribution of these funds has been focused on small and medium sized growers. The law es-tablishes subsidies for individual irrigation projects that cost less than US$500,000, or US$ 1.25 million in the case of projects presented by irrigation associations. The maxi-mum amount of subsidy is between 70 and 90% of the total cost of the project, according to the new beneficiary classification system, which also extends the program to 2022.
In effect, this law allows the Government of Chile to fund minor irrigation and drainage works through a competi-tive, public subsidy program that gives growers access to state development funds to increase the efficiency of their water use.
2.2.2 Sector-specific programs, 2000-2009
Over the period indicated, MINAGRI has focused intensely on the management, conservation and sustainable use of natural resources and the protection of Chile’s natural heritage. In this context, climate change mitigation in the agriculture, livestock and forestry sector is founded upon the conviction that GHG emissions generated by this sec-tor can be reduced by the more efficient use of fossil fuels, increases in energy efficiency, the production of raw ma-terials for bioenergy generation in the form of biofuels, and the application of best agricultural, livestock and fo-restry practices.
Feasible opportunities for sectoral emission compensa-tions have also been identified and include carbon captu-re activities such as forestation, sustainable forestry mana-gement, and forest conservation.
Actions in this sector include:
• Development of the National Greenhouse Gas Inventory for Chile’s non-energy sector from 1984 to 2007. This analysis was conducted by the Institute of Agricultural Research for CONAMA in 2010.
• Promoting the application of good agriculture, livestock and forestry practices, with emphasis on more efficient use of irrigation water and nitrogenous fertilizers.
• Incorporation of good agricultural practices and promo-tion of agricultural and livestock exports to consolidate the country’s image in this market.
• Search for opportunities related to certified GHG emis-sion reductions under the Kyoto Protocol’s Clean Deve-lopment Mechanism. This is being pursued through a study of the bioenergetic potential of agricultural, lives-tock and forestry waste for individual landowners and by associations of producers in this sector.
• Program to develop hydroelectric plants associated with irrigation works, implemented by the National Irri-gation Commission in collaboration with the CNE, to de-liver electrical energy to the central interconnected grid (SIC).
• Launching of the subsidy program for sustainable fo-restry management and native forest conservation es-tablished under the Law for the Recovery of the Native Forest and Forestry Development.
• Broad-based, participatory discussion process involving the public and private sectors for the extension of De-cree Law 701 to promote forestation development, and the subsequent drafting of a new forestation law that includes promotion of forest plantations for energy uses. These forests act as carbon sinks while the trees are growing, and their harvest provides raw material to replace the use of fossil fuels, as they are burned directly to produce electricity or are transformed into biofuels such as ethanol and biodiesel.
• Formalizing the sale of fuelwood, to ensure that sellers obtain their supply from sustainably managed forests and that the wood offered has low moisture content. It is important in this regard that clean production agree-ments be negotiated and signed with fuelwood sellers.
• In recent years some studies have also been conducted that directly or indirectly point to options and potential opportunities available in Chile for mitigating GHG emis-sions in the forestry sector. Although the Government of Chile, specifically through the Ministry of Agriculture and the National Environmental Commission, has fun-ded some of these studies, their results have not ne-cessarily been translated into official positions in either international negotiations or multilateral agreements. Some of the most relevant studies and documents pre-pared by the Ministry in this area are mentioned below:
• Estimación del carbono capturado en las plantaciones de pino radiata y eucaliptos, relacionadas con el DL 701 (Estimations of carbon captured by plantations of Pinus Radiata and Eucalyptus related to DL 701). Department of Forestry Sciences. Universidad Catolica de Chile, 2007.
• Impacto socioeconómico del cambio climático en el sector silvoagropecuario (Socioeconomic impact of cli-mate change on the agriculture, livestock and forestry sector). Department of Agrarian Economics, Universidad Catolica de Chile, 2009.
• Estrategia comunicacional sobre la huella de carbono de los productos agropecuarios (Communications stra-tegy for the carbon footprint of agricultural, livestock and forestry producers). Prochile – ODEPA, 2009.
• Medidas sectoriales de mitigación del cambio climático (Sector-specific measures for mitigating climate chan-ge). Consejo de Cambio Climatico y Agricultura, 2009.
• Posición del Ministerio de Agricultura en REDD+ (Minis-try of Agriculture Position in REDD+), 2009.
• Negotiations in the Climate Change Convention, ODEPA, 2009.
• Respuesta Institucional de Chile al Cambio Climático (Chile’s Institutional Response to Climate Change), FIA, 2010.
• Estudio Determinación de la huella de carbono de los principales productos agropecuarios de exportacion (Study to Determine the Carbon Footprint of the Prin-cipal Agricultural and Livestock Export Products), lNlA, 2010.
• Diagnóstico del aporte de emisiones de carbono en manzanas rojas y verdes, asociadas a las etapas de produccion y transporte hasta el mercado de desti-no (Analysis of the carbon emissions of red and green apples associated with stages of production and trans-portation to destination market). Fundacion de Desarro-llo Fruticola –ASOEX– Prochile.
• Estado de situación de los compromisos del Minagri en el Plan Nacional de Accion de Cambio Climatico (Status Report on MINAGRI’s commitments under the National Climate Change Action Plan), Consejo de Cambio Clima-tico y Agricultura, 2010.
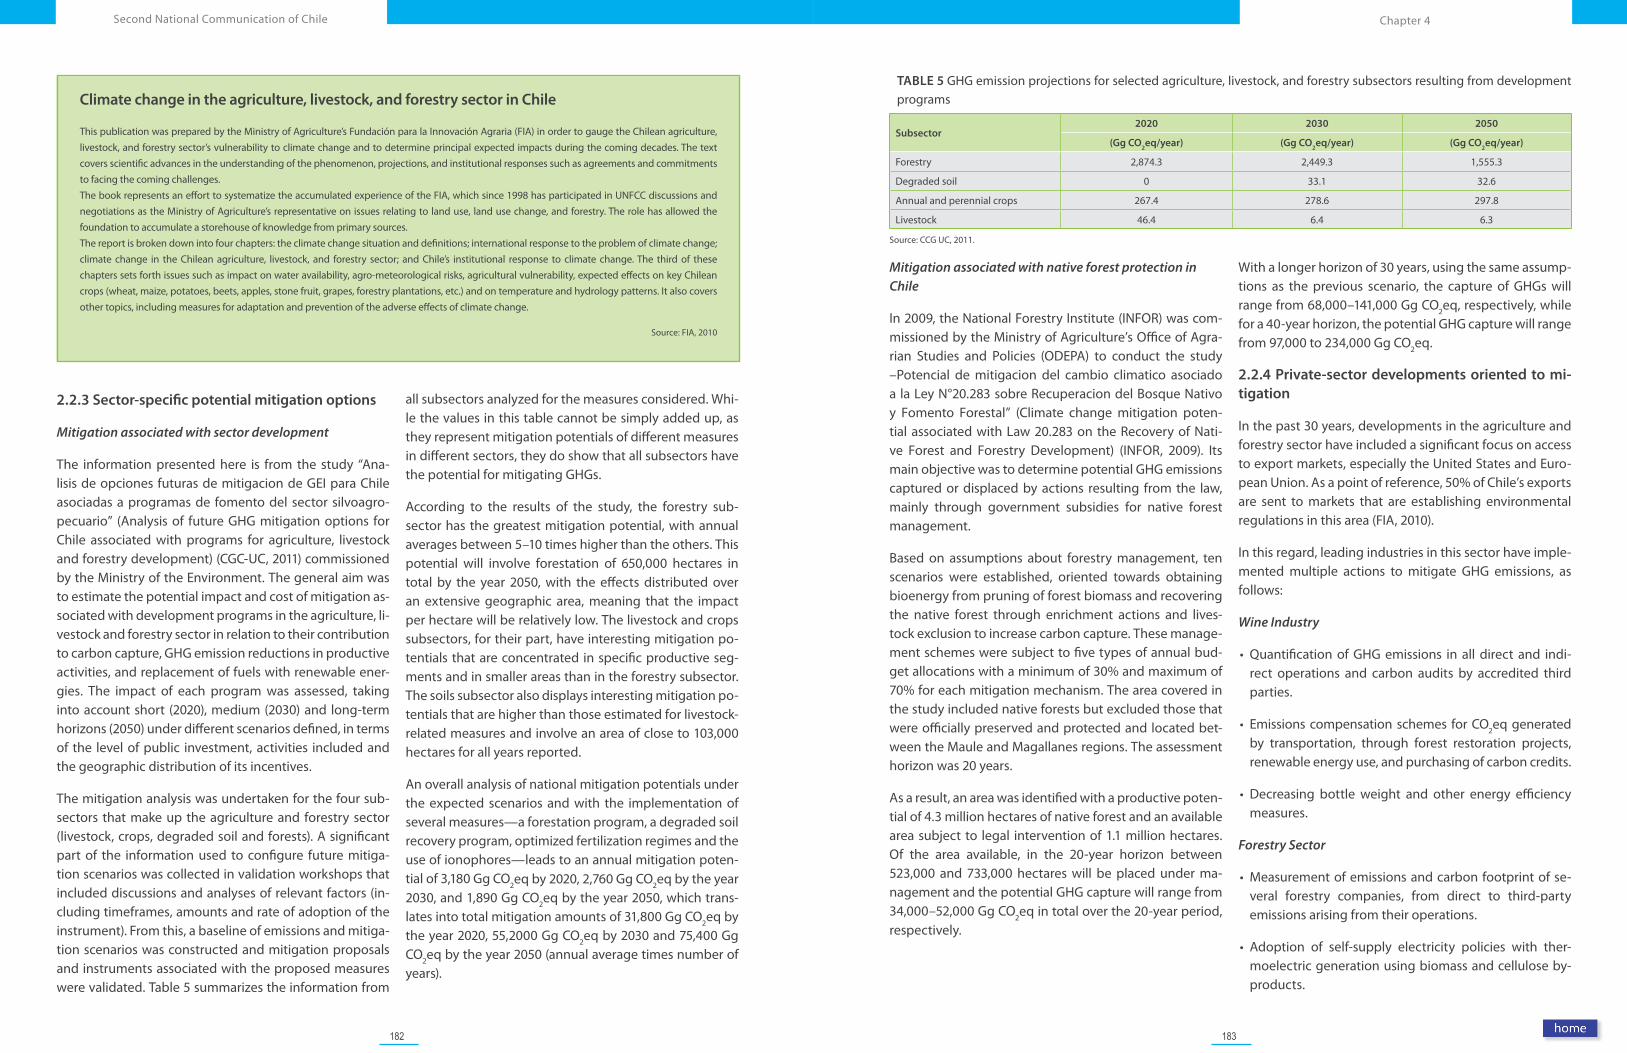
182 183
Chapter 4Second National Communication of Chile
Climate change in the agriculture, livestock, and forestry sector in Chile
This publication was prepared by the Ministry of Agriculture’s Fundación para la Innovación Agraria (FIA) in order to gauge the Chilean agriculture, livestock, and forestry sector’s vulnerability to climate change and to determine principal expected impacts during the coming decades. The text covers scientific advances in the understanding of the phenomenon, projections, and institutional responses such as agreements and commitments to facing the coming challenges.The book represents an effort to systematize the accumulated experience of the FIA, which since 1998 has participated in UNFCC discussions and negotiations as the Ministry of Agriculture’s representative on issues relating to land use, land use change, and forestry. The role has allowed the foundation to accumulate a storehouse of knowledge from primary sources.The report is broken down into four chapters: the climate change situation and definitions; international response to the problem of climate change; climate change in the Chilean agriculture, livestock, and forestry sector; and Chile’s institutional response to climate change. The third of these chapters sets forth issues such as impact on water availability, agro-meteorological risks, agricultural vulnerability, expected effects on key Chilean crops (wheat, maize, potatoes, beets, apples, stone fruit, grapes, forestry plantations, etc.) and on temperature and hydrology patterns. It also covers other topics, including measures for adaptation and prevention of the adverse effects of climate change.
Source: FIA, 2010
2.2.3 Sector-specific potential mitigation options
Mitigation associated with sector development
The information presented here is from the study “Ana-lisis de opciones futuras de mitigacion de GEI para Chile asociadas a programas de fomento del sector silvoagro-pecuario” (Analysis of future GHG mitigation options for Chile associated with programs for agriculture, livestock and forestry development) (CGC-UC, 2011) commissioned by the Ministry of the Environment. The general aim was to estimate the potential impact and cost of mitigation as-sociated with development programs in the agriculture, li-vestock and forestry sector in relation to their contribution to carbon capture, GHG emission reductions in productive activities, and replacement of fuels with renewable ener-gies. The impact of each program was assessed, taking into account short (2020), medium (2030) and long-term horizons (2050) under different scenarios defined, in terms of the level of public investment, activities included and the geographic distribution of its incentives.
The mitigation analysis was undertaken for the four sub-sectors that make up the agriculture and forestry sector (livestock, crops, degraded soil and forests). A significant part of the information used to configure future mitiga-tion scenarios was collected in validation workshops that included discussions and analyses of relevant factors (in-cluding timeframes, amounts and rate of adoption of the instrument). From this, a baseline of emissions and mitiga-tion scenarios was constructed and mitigation proposals and instruments associated with the proposed measures were validated. Table 5 summarizes the information from
all subsectors analyzed for the measures considered. Whi-le the values in this table cannot be simply added up, as they represent mitigation potentials of different measures in different sectors, they do show that all subsectors have the potential for mitigating GHGs.
According to the results of the study, the forestry sub-sector has the greatest mitigation potential, with annual averages between 5–10 times higher than the others. This potential will involve forestation of 650,000 hectares in total by the year 2050, with the effects distributed over an extensive geographic area, meaning that the impact per hectare will be relatively low. The livestock and crops subsectors, for their part, have interesting mitigation po-tentials that are concentrated in specific productive seg-ments and in smaller areas than in the forestry subsector. The soils subsector also displays interesting mitigation po-tentials that are higher than those estimated for livestock-related measures and involve an area of close to 103,000 hectares for all years reported.
An overall analysis of national mitigation potentials under the expected scenarios and with the implementation of several measures—a forestation program, a degraded soil recovery program, optimized fertilization regimes and the use of ionophores—leads to an annual mitigation poten-tial of 3,180 Gg CO
2eq by 2020, 2,760 Gg CO2eq by the year 2030, and 1,890 Gg CO2eq by the year 2050, which trans-lates into total mitigation amounts of 31,800 Gg CO2eq by the year 2020, 55,2000 Gg CO2eq by 2030 and 75,400 Gg CO2eq by the year 2050 (annual average times number of years).
TABLE 5 GHG emission projections for selected agriculture, livestock, and forestry subsectors resulting from development programs
Subsector2020 2030 2050
(Gg CO2eq/year) (Gg CO
2eq/year) (Gg CO
2eq/year)
Forestry 2,874.3 2,449.3 1,555.3
Degraded soil 0 33.1 32.6
Annual and perennial crops 267.4 278.6 297.8
Livestock 46.4 6.4 6.3
Source: CCG UC, 2011.
Mitigation associated with native forest protection in Chile
In 2009, the National Forestry Institute (INFOR) was com-missioned by the Ministry of Agriculture’s Office of Agra-rian Studies and Policies (ODEPA) to conduct the study –Potencial de mitigacion del cambio climatico asociado a la Ley N°20.283 sobre Recuperacion del Bosque Nativo y Fomento Forestal” (Climate change mitigation poten-tial associated with Law 20.283 on the Recovery of Nati-ve Forest and Forestry Development) (INFOR, 2009). Its main objective was to determine potential GHG emissions captured or displaced by actions resulting from the law, mainly through government subsidies for native forest management.
Based on assumptions about forestry management, ten scenarios were established, oriented towards obtaining bioenergy from pruning of forest biomass and recovering the native forest through enrichment actions and lives-tock exclusion to increase carbon capture. These manage-ment schemes were subject to five types of annual bud-get allocations with a minimum of 30% and maximum of 70% for each mitigation mechanism. The area covered in the study included native forests but excluded those that were officially preserved and protected and located bet-ween the Maule and Magallanes regions. The assessment horizon was 20 years.
As a result, an area was identified with a productive poten-tial of 4.3 million hectares of native forest and an available area subject to legal intervention of 1.1 million hectares. Of the area available, in the 20-year horizon between 523,000 and 733,000 hectares will be placed under ma-nagement and the potential GHG capture will range from 34,000–52,000 Gg CO2eq in total over the 20-year period, respectively.
With a longer horizon of 30 years, using the same assump-tions as the previous scenario, the capture of GHGs will range from 68,000–141,000 Gg CO2eq, respectively, while for a 40-year horizon, the potential GHG capture will range from 97,000 to 234,000 Gg CO2eq.
2.2.4 Private-sector developments oriented to mi-tigation
In the past 30 years, developments in the agriculture and forestry sector have included a significant focus on access to export markets, especially the United States and Euro-pean Union. As a point of reference, 50% of Chile’s exports are sent to markets that are establishing environmental regulations in this area (FIA, 2010).
In this regard, leading industries in this sector have imple-mented multiple actions to mitigate GHG emissions, as follows:
Wine Industry
• Quantification of GHG emissions in all direct and indi-rect operations and carbon audits by accredited third parties.
• Emissions compensation schemes for CO2eq generated by transportation, through forest restoration projects, renewable energy use, and purchasing of carbon credits.
• Decreasing bottle weight and other energy efficiency measures.
Forestry Sector
• Measurement of emissions and carbon footprint of se-veral forestry companies, from direct to third-party emissions arising from their operations.
• Adoption of self-supply electricity policies with ther-moelectric generation using biomass and cellulose by-products.
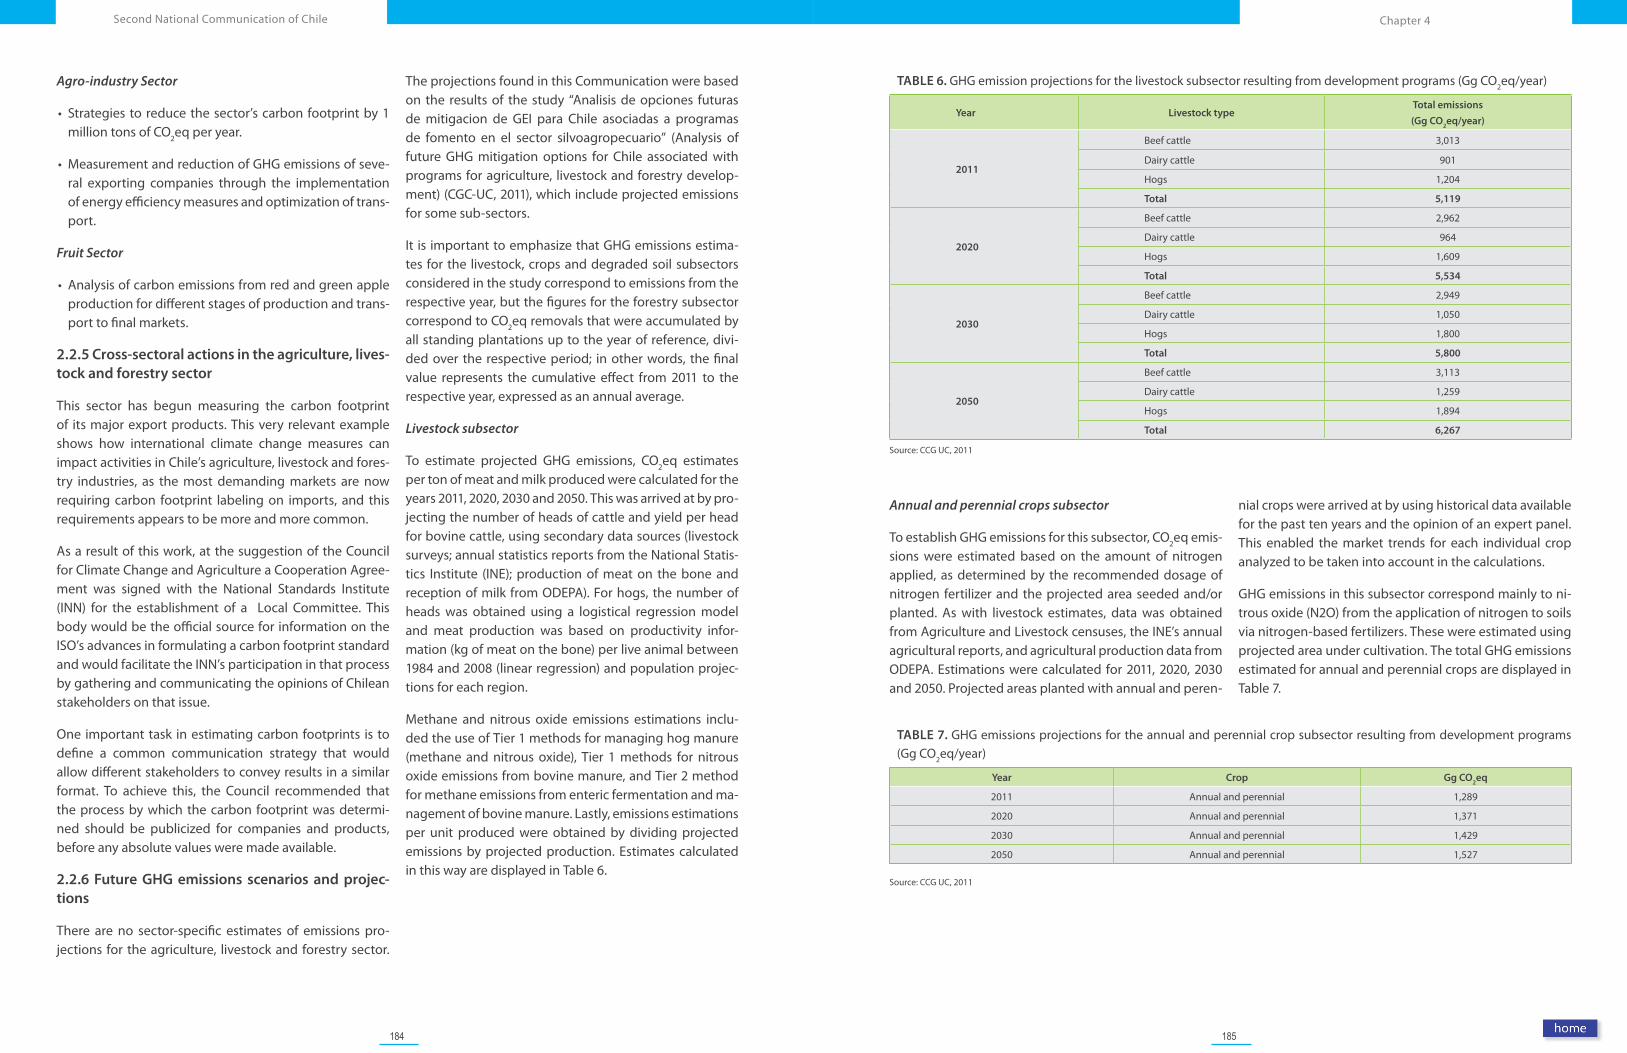
184 185
Chapter 4Second National Communication of Chile
Agro-industry Sector
• Strategies to reduce the sector’s carbon footprint by 1 million tons of CO2eq per year.
• Measurement and reduction of GHG emissions of seve-ral exporting companies through the implementation of energy efficiency measures and optimization of trans-port.
Fruit Sector
• Analysis of carbon emissions from red and green apple production for different stages of production and trans-port to final markets.
2.2.5 Cross-sectoral actions in the agriculture, lives-tock and forestry sector
This sector has begun measuring the carbon footprint of its major export products. This very relevant example shows how international climate change measures can impact activities in Chile’s agriculture, livestock and fores-try industries, as the most demanding markets are now requiring carbon footprint labeling on imports, and this requirements appears to be more and more common.
As a result of this work, at the suggestion of the Council for Climate Change and Agriculture a Cooperation Agree-ment was signed with the National Standards Institute (INN) for the establishment of a Local Committee. This body would be the official source for information on the ISO’s advances in formulating a carbon footprint standard and would facilitate the INN’s participation in that process by gathering and communicating the opinions of Chilean stakeholders on that issue.
One important task in estimating carbon footprints is to define a common communication strategy that would allow different stakeholders to convey results in a similar format. To achieve this, the Council recommended that the process by which the carbon footprint was determi-ned should be publicized for companies and products, before any absolute values were made available.
2.2.6 Future GHG emissions scenarios and projec-tions
There are no sector-specific estimates of emissions pro-jections for the agriculture, livestock and forestry sector.
The projections found in this Communication were based on the results of the study “Analisis de opciones futuras de mitigacion de GEI para Chile asociadas a programas de fomento en el sector silvoagropecuario” (Analysis of future GHG mitigation options for Chile associated with programs for agriculture, livestock and forestry develop-ment) (CGC-UC, 2011), which include projected emissions for some sub-sectors.
It is important to emphasize that GHG emissions estima-tes for the livestock, crops and degraded soil subsectors considered in the study correspond to emissions from the respective year, but the figures for the forestry subsector correspond to CO2eq removals that were accumulated by all standing plantations up to the year of reference, divi-ded over the respective period; in other words, the final value represents the cumulative effect from 2011 to the respective year, expressed as an annual average.
Livestock subsector
To estimate projected GHG emissions, CO2eq estimates per ton of meat and milk produced were calculated for the years 2011, 2020, 2030 and 2050. This was arrived at by pro-jecting the number of heads of cattle and yield per head for bovine cattle, using secondary data sources (livestock surveys; annual statistics reports from the National Statis-tics Institute (INE); production of meat on the bone and reception of milk from ODEPA). For hogs, the number of heads was obtained using a logistical regression model and meat production was based on productivity infor-mation (kg of meat on the bone) per live animal between 1984 and 2008 (linear regression) and population projec-tions for each region.
Methane and nitrous oxide emissions estimations inclu-ded the use of Tier 1 methods for managing hog manure (methane and nitrous oxide), Tier 1 methods for nitrous oxide emissions from bovine manure, and Tier 2 method for methane emissions from enteric fermentation and ma-nagement of bovine manure. Lastly, emissions estimations per unit produced were obtained by dividing projected emissions by projected production. Estimates calculated in this way are displayed in Table 6.
TABLE 6. GHG emission projections for the livestock subsector resulting from development programs (Gg CO2eq/year)
Year Livestock typeTotal emissions
(Gg CO2eq/year)
2011
Beef cattle 3,013
Dairy cattle 901
Hogs 1,204
Total 5,119
2020
Beef cattle 2,962
Dairy cattle 964
Hogs 1,609
Total 5,534
2030
Beef cattle 2,949
Dairy cattle 1,050
Hogs 1,800
Total 5,800
2050
Beef cattle 3,113
Dairy cattle 1,259
Hogs 1,894
Total 6,267
Source: CCG UC, 2011
Annual and perennial crops subsector
To establish GHG emissions for this subsector, CO2eq emis-sions were estimated based on the amount of nitrogen applied, as determined by the recommended dosage of nitrogen fertilizer and the projected area seeded and/or planted. As with livestock estimates, data was obtained from Agriculture and Livestock censuses, the INE’s annual agricultural reports, and agricultural production data from ODEPA. Estimations were calculated for 2011, 2020, 2030 and 2050. Projected areas planted with annual and peren-
nial crops were arrived at by using historical data available for the past ten years and the opinion of an expert panel. This enabled the market trends for each individual crop analyzed to be taken into account in the calculations.
GHG emissions in this subsector correspond mainly to ni-trous oxide (N2O) from the application of nitrogen to soils via nitrogen-based fertilizers. These were estimated using projected area under cultivation. The total GHG emissions estimated for annual and perennial crops are displayed in Table 7.
TABLE 7. GHG emissions projections for the annual and perennial crop subsector resulting from development programs (Gg CO2eq/year)
Year Crop Gg CO2eq
2011 Annual and perennial 1,289
2020 Annual and perennial 1,371
2030 Annual and perennial 1,429
2050 Annual and perennial 1,527
Source: CCG UC, 2011
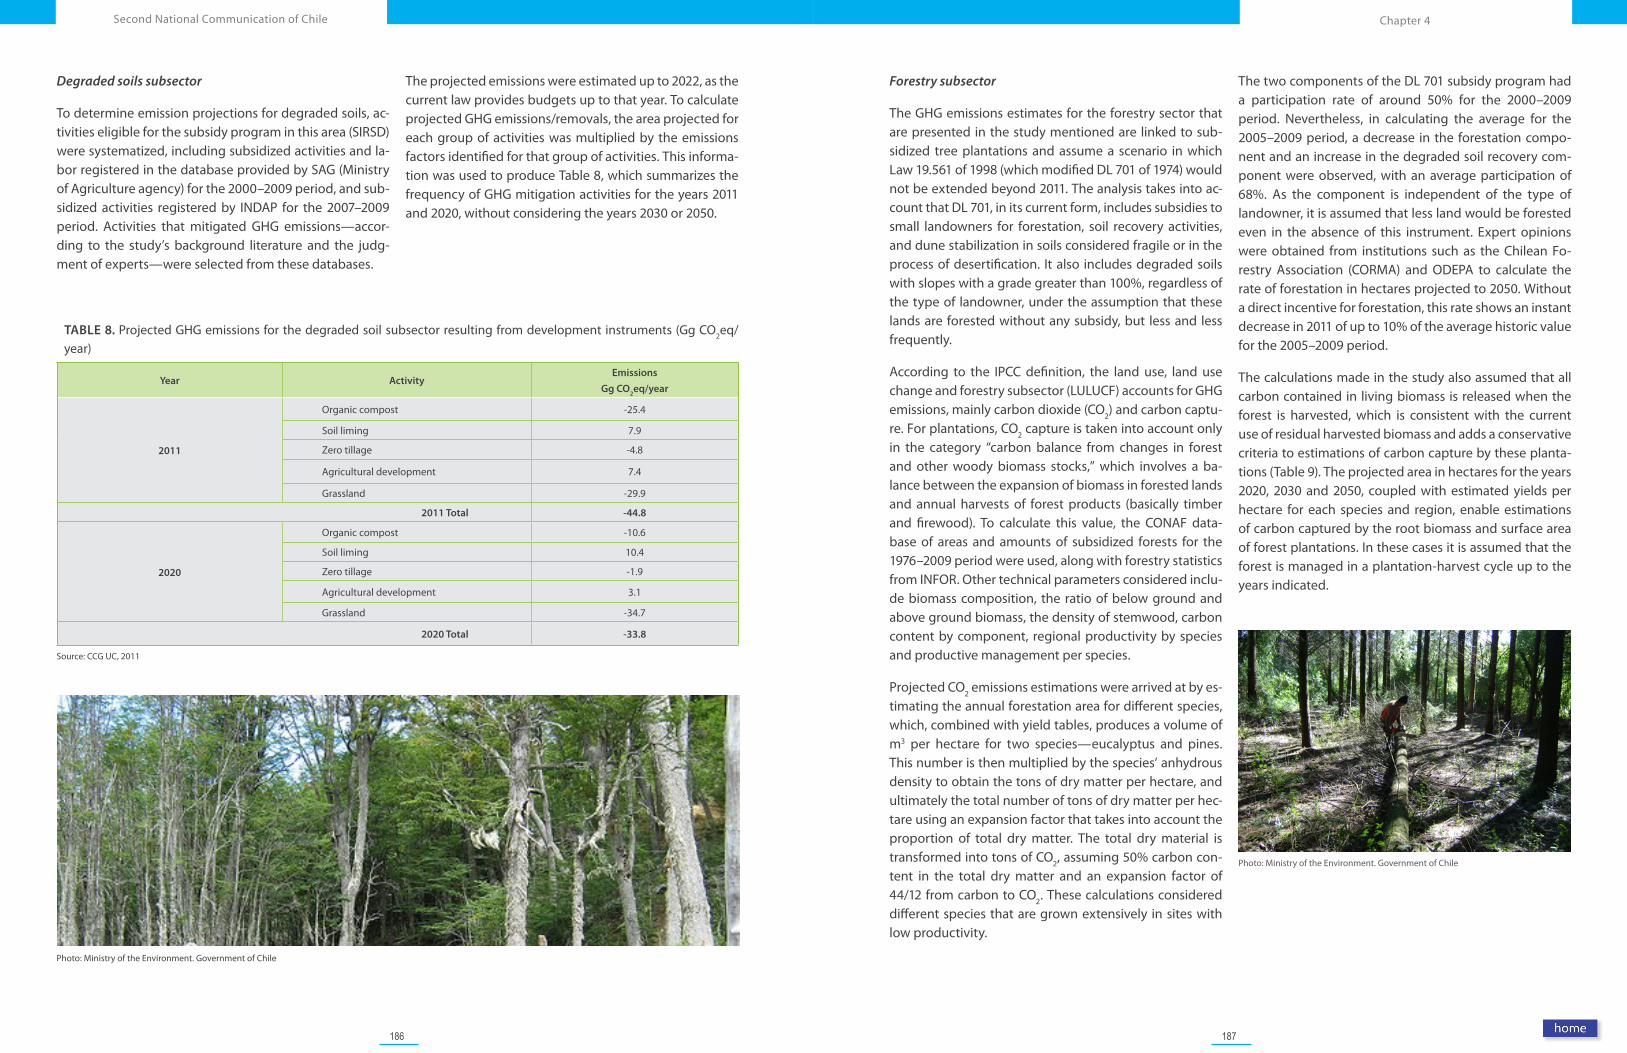
186 187
Chapter 4Second National Communication of Chile
Photo: Ministry of the Environment. Government of Chile
Degraded soils subsector
To determine emission projections for degraded soils, ac-tivities eligible for the subsidy program in this area (SIRSD) were systematized, including subsidized activities and la-bor registered in the database provided by SAG (Ministry of Agriculture agency) for the 2000–2009 period, and sub-sidized activities registered by INDAP for the 2007–2009 period. Activities that mitigated GHG emissions—accor-ding to the study’s background literature and the judg-ment of experts—were selected from these databases.
The projected emissions were estimated up to 2022, as the current law provides budgets up to that year. To calculate projected GHG emissions/removals, the area projected for each group of activities was multiplied by the emissions factors identified for that group of activities. This informa-tion was used to produce Table 8, which summarizes the frequency of GHG mitigation activities for the years 2011 and 2020, without considering the years 2030 or 2050.
TABLE 8. Projected GHG emissions for the degraded soil subsector resulting from development instruments (Gg CO2eq/year)
Year ActivityEmissions
Gg CO2eq/year
2011
Organic compost -25.4
Soil liming 7.9
Zero tillage -4.8
Agricultural development 7.4
Grassland -29.9
2011 Total -44.8
2020
Organic compost -10.6
Soil liming 10.4
Zero tillage -1.9
Agricultural development 3.1
Grassland -34.7
2020 Total -33.8
Source: CCG UC, 2011
Forestry subsector
The GHG emissions estimates for the forestry sector that are presented in the study mentioned are linked to sub-sidized tree plantations and assume a scenario in which Law 19.561 of 1998 (which modified DL 701 of 1974) would not be extended beyond 2011. The analysis takes into ac-count that DL 701, in its current form, includes subsidies to small landowners for forestation, soil recovery activities, and dune stabilization in soils considered fragile or in the process of desertification. It also includes degraded soils with slopes with a grade greater than 100%, regardless of the type of landowner, under the assumption that these lands are forested without any subsidy, but less and less frequently.
According to the IPCC definition, the land use, land use change and forestry subsector (LULUCF) accounts for GHG emissions, mainly carbon dioxide (CO2) and carbon captu-re. For plantations, CO2 capture is taken into account only in the category “carbon balance from changes in forest and other woody biomass stocks,” which involves a ba-lance between the expansion of biomass in forested lands and annual harvests of forest products (basically timber and firewood). To calculate this value, the CONAF data-base of areas and amounts of subsidized forests for the 1976–2009 period were used, along with forestry statistics from INFOR. Other technical parameters considered inclu-de biomass composition, the ratio of below ground and above ground biomass, the density of stemwood, carbon content by component, regional productivity by species and productive management per species.
Projected CO2 emissions estimations were arrived at by es-timating the annual forestation area for different species, which, combined with yield tables, produces a volume of m3 per hectare for two species—eucalyptus and pines. This number is then multiplied by the species’ anhydrous density to obtain the tons of dry matter per hectare, and ultimately the total number of tons of dry matter per hec-tare using an expansion factor that takes into account the proportion of total dry matter. The total dry material is transformed into tons of CO2, assuming 50% carbon con-tent in the total dry matter and an expansion factor of 44/12 from carbon to CO2. These calculations considered different species that are grown extensively in sites with low productivity.
The two components of the DL 701 subsidy program had a participation rate of around 50% for the 2000–2009 period. Nevertheless, in calculating the average for the 2005–2009 period, a decrease in the forestation compo-nent and an increase in the degraded soil recovery com-ponent were observed, with an average participation of 68%. As the component is independent of the type of landowner, it is assumed that less land would be forested even in the absence of this instrument. Expert opinions were obtained from institutions such as the Chilean Fo-restry Association (CORMA) and ODEPA to calculate the rate of forestation in hectares projected to 2050. Without a direct incentive for forestation, this rate shows an instant decrease in 2011 of up to 10% of the average historic value for the 2005–2009 period.
The calculations made in the study also assumed that all carbon contained in living biomass is released when the forest is harvested, which is consistent with the current use of residual harvested biomass and adds a conservative criteria to estimations of carbon capture by these planta-tions (Table 9). The projected area in hectares for the years 2020, 2030 and 2050, coupled with estimated yields per hectare for each species and region, enable estimations of carbon captured by the root biomass and surface area of forest plantations. In these cases it is assumed that the forest is managed in a plantation-harvest cycle up to the years indicated.
Photo: Ministry of the Environment. Government of Chile
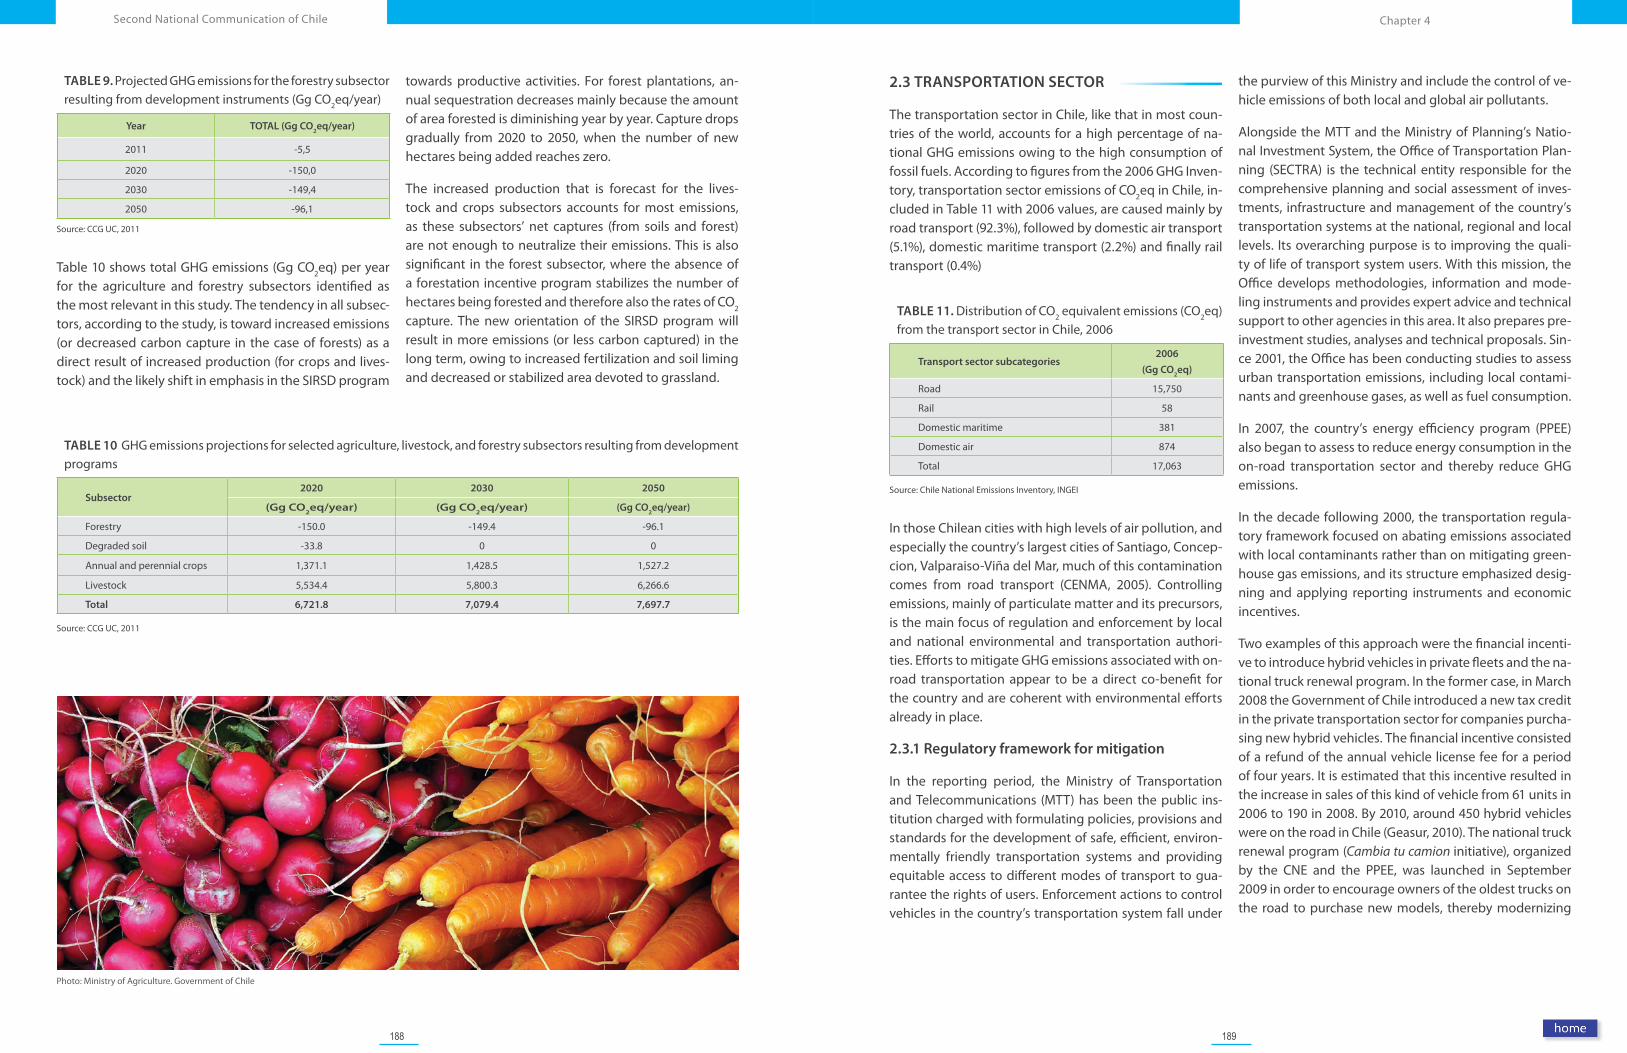
188 189
Chapter 4Second National Communication of Chile
Photo: Ministry of Agriculture. Government of Chile
TABLE 9. Projected GHG emissions for the forestry subsector resulting from development instruments (Gg CO2eq/year)
Year TOTAL (Gg CO2eq/year)
2011 -5,5
2020 -150,0
2030 -149,4
2050 -96,1
Source: CCG UC, 2011
Table 10 shows total GHG emissions (Gg CO2eq) per year for the agriculture and forestry subsectors identified as the most relevant in this study. The tendency in all subsec-tors, according to the study, is toward increased emissions (or decreased carbon capture in the case of forests) as a direct result of increased production (for crops and lives-tock) and the likely shift in emphasis in the SIRSD program
towards productive activities. For forest plantations, an-nual sequestration decreases mainly because the amount of area forested is diminishing year by year. Capture drops gradually from 2020 to 2050, when the number of new hectares being added reaches zero.
The increased production that is forecast for the lives-tock and crops subsectors accounts for most emissions, as these subsectors’ net captures (from soils and forest) are not enough to neutralize their emissions. This is also significant in the forest subsector, where the absence of a forestation incentive program stabilizes the number of hectares being forested and therefore also the rates of CO2 capture. The new orientation of the SIRSD program will result in more emissions (or less carbon captured) in the long term, owing to increased fertilization and soil liming and decreased or stabilized area devoted to grassland.
TABLE 10 GHG emissions projections for selected agriculture, livestock, and forestry subsectors resulting from development programs
Subsector2020 2030 2050
(Gg CO2eq/year) (Gg CO
2eq/year) (Gg CO
2eq/year)
Forestry -150.0 -149.4 -96.1
Degraded soil -33.8 0 0
Annual and perennial crops 1,371.1 1,428.5 1,527.2
Livestock 5,534.4 5,800.3 6,266.6
Total 6,721.8 7,079.4 7,697.7
Source: CCG UC, 2011
2.3 TRANSPORTATION SECTOR
The transportation sector in Chile, like that in most coun-tries of the world, accounts for a high percentage of na-tional GHG emissions owing to the high consumption of fossil fuels. According to figures from the 2006 GHG Inven-tory, transportation sector emissions of CO2eq in Chile, in-cluded in Table 11 with 2006 values, are caused mainly by road transport (92.3%), followed by domestic air transport (5.1%), domestic maritime transport (2.2%) and finally rail transport (0.4%)
TABLE 11. Distribution of CO2 equivalent emissions (CO2eq) from the transport sector in Chile, 2006
Transport sector subcategories2006
(Gg CO2eq)
Road 15,750
Rail 58
Domestic maritime 381
Domestic air 874
Total 17,063
Source: Chile National Emissions Inventory, INGEI
In those Chilean cities with high levels of air pollution, and especially the country’s largest cities of Santiago, Concep-cion, Valparaiso-Viña del Mar, much of this contamination comes from road transport (CENMA, 2005). Controlling emissions, mainly of particulate matter and its precursors, is the main focus of regulation and enforcement by local and national environmental and transportation authori-ties. Efforts to mitigate GHG emissions associated with on-road transportation appear to be a direct co-benefit for the country and are coherent with environmental efforts already in place.
2.3.1 Regulatory framework for mitigation
In the reporting period, the Ministry of Transportation and Telecommunications (MTT) has been the public ins-titution charged with formulating policies, provisions and standards for the development of safe, efficient, environ-mentally friendly transportation systems and providing equitable access to different modes of transport to gua-rantee the rights of users. Enforcement actions to control vehicles in the country’s transportation system fall under
the purview of this Ministry and include the control of ve-hicle emissions of both local and global air pollutants.
Alongside the MTT and the Ministry of Planning’s Natio-nal Investment System, the Office of Transportation Plan-ning (SECTRA) is the technical entity responsible for the comprehensive planning and social assessment of inves-tments, infrastructure and management of the country’s transportation systems at the national, regional and local levels. Its overarching purpose is to improving the quali-ty of life of transport system users. With this mission, the Office develops methodologies, information and mode-ling instruments and provides expert advice and technical support to other agencies in this area. It also prepares pre-investment studies, analyses and technical proposals. Sin-ce 2001, the Office has been conducting studies to assess urban transportation emissions, including local contami-nants and greenhouse gases, as well as fuel consumption.
In 2007, the country’s energy efficiency program (PPEE) also began to assess to reduce energy consumption in the on-road transportation sector and thereby reduce GHG emissions.
In the decade following 2000, the transportation regula-tory framework focused on abating emissions associated with local contaminants rather than on mitigating green-house gas emissions, and its structure emphasized desig-ning and applying reporting instruments and economic incentives.
Two examples of this approach were the financial incenti-ve to introduce hybrid vehicles in private fleets and the na-tional truck renewal program. In the former case, in March 2008 the Government of Chile introduced a new tax credit in the private transportation sector for companies purcha-sing new hybrid vehicles. The financial incentive consisted of a refund of the annual vehicle license fee for a period of four years. It is estimated that this incentive resulted in the increase in sales of this kind of vehicle from 61 units in 2006 to 190 in 2008. By 2010, around 450 hybrid vehicles were on the road in Chile (Geasur, 2010). The national truck renewal program (Cambia tu camion initiative), organized by the CNE and the PPEE, was launched in September 2009 in order to encourage owners of the oldest trucks on the road to purchase new models, thereby modernizing
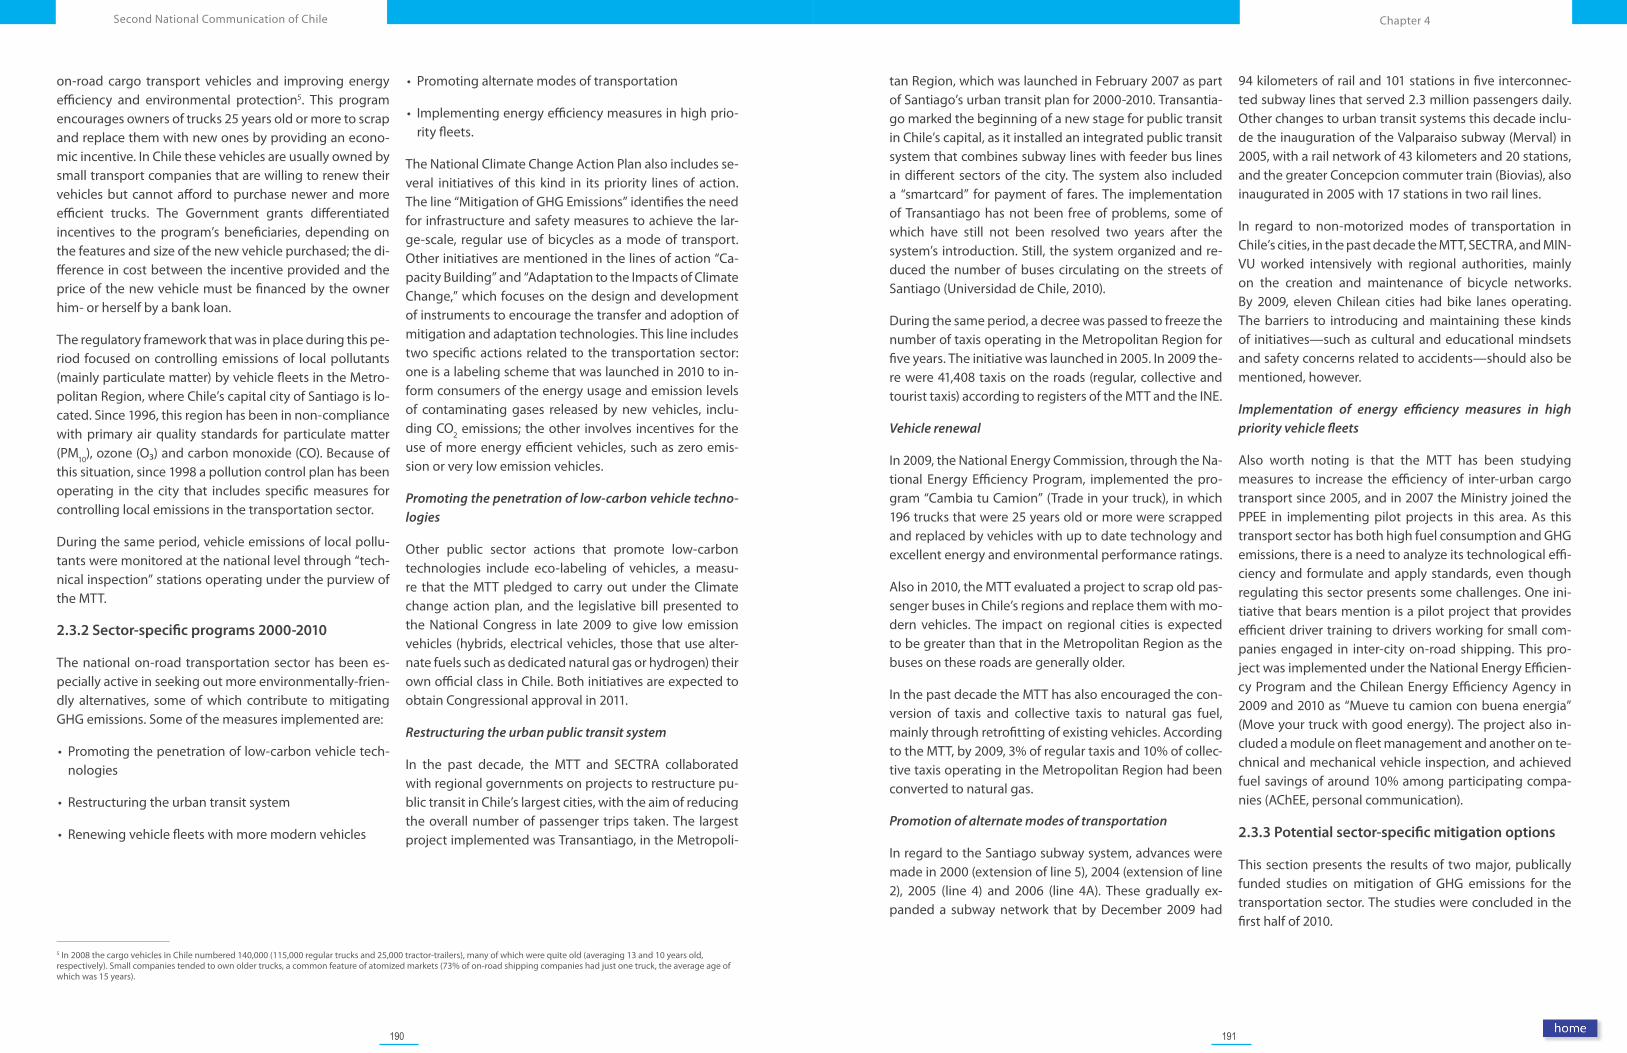
190 191
Chapter 4Second National Communication of Chile
5 In 2008 the cargo vehicles in Chile numbered 140,000 (115,000 regular trucks and 25,000 tractor-trailers), many of which were quite old (averaging 13 and 10 years old, respectively). Small companies tended to own older trucks, a common feature of atomized markets (73% of on-road shipping companies had just one truck, the average age of which was 15 years).
on-road cargo transport vehicles and improving energy efficiency and environmental protection5. This program encourages owners of trucks 25 years old or more to scrap and replace them with new ones by providing an econo-mic incentive. In Chile these vehicles are usually owned by small transport companies that are willing to renew their vehicles but cannot afford to purchase newer and more efficient trucks. The Government grants differentiated incentives to the program’s beneficiaries, depending on the features and size of the new vehicle purchased; the di-fference in cost between the incentive provided and the price of the new vehicle must be financed by the owner him- or herself by a bank loan.
The regulatory framework that was in place during this pe-riod focused on controlling emissions of local pollutants (mainly particulate matter) by vehicle fleets in the Metro-politan Region, where Chile’s capital city of Santiago is lo-cated. Since 1996, this region has been in non-compliance with primary air quality standards for particulate matter (PM10), ozone (O₃) and carbon monoxide (CO). Because of this situation, since 1998 a pollution control plan has been operating in the city that includes specific measures for controlling local emissions in the transportation sector.
During the same period, vehicle emissions of local pollu-tants were monitored at the national level through “tech-nical inspection” stations operating under the purview of the MTT.
2.3.2 Sector-specific programs 2000-2010
The national on-road transportation sector has been es-pecially active in seeking out more environmentally-frien-dly alternatives, some of which contribute to mitigating GHG emissions. Some of the measures implemented are:
• Promoting the penetration of low-carbon vehicle tech-nologies
• Restructuring the urban transit system
• Renewing vehicle fleets with more modern vehicles
• Promoting alternate modes of transportation
• Implementing energy efficiency measures in high prio-rity fleets.
The National Climate Change Action Plan also includes se-veral initiatives of this kind in its priority lines of action. The line “Mitigation of GHG Emissions” identifies the need for infrastructure and safety measures to achieve the lar-ge-scale, regular use of bicycles as a mode of transport. Other initiatives are mentioned in the lines of action “Ca-pacity Building” and “Adaptation to the Impacts of Climate Change,” which focuses on the design and development of instruments to encourage the transfer and adoption of mitigation and adaptation technologies. This line includes two specific actions related to the transportation sector: one is a labeling scheme that was launched in 2010 to in-form consumers of the energy usage and emission levels of contaminating gases released by new vehicles, inclu-ding CO2 emissions; the other involves incentives for the use of more energy efficient vehicles, such as zero emis-sion or very low emission vehicles.
Promoting the penetration of low-carbon vehicle techno-logies
Other public sector actions that promote low-carbon technologies include eco-labeling of vehicles, a measu-re that the MTT pledged to carry out under the Climate change action plan, and the legislative bill presented to the National Congress in late 2009 to give low emission vehicles (hybrids, electrical vehicles, those that use alter-nate fuels such as dedicated natural gas or hydrogen) their own official class in Chile. Both initiatives are expected to obtain Congressional approval in 2011.
Restructuring the urban public transit system
In the past decade, the MTT and SECTRA collaborated with regional governments on projects to restructure pu-blic transit in Chile’s largest cities, with the aim of reducing the overall number of passenger trips taken. The largest project implemented was Transantiago, in the Metropoli-
tan Region, which was launched in February 2007 as part of Santiago’s urban transit plan for 2000-2010. Transantia-go marked the beginning of a new stage for public transit in Chile’s capital, as it installed an integrated public transit system that combines subway lines with feeder bus lines in different sectors of the city. The system also included a “smartcard” for payment of fares. The implementation of Transantiago has not been free of problems, some of which have still not been resolved two years after the system’s introduction. Still, the system organized and re-duced the number of buses circulating on the streets of Santiago (Universidad de Chile, 2010).
During the same period, a decree was passed to freeze the number of taxis operating in the Metropolitan Region for five years. The initiative was launched in 2005. In 2009 the-re were 41,408 taxis on the roads (regular, collective and tourist taxis) according to registers of the MTT and the INE.
Vehicle renewal
In 2009, the National Energy Commission, through the Na-tional Energy Efficiency Program, implemented the pro-gram “Cambia tu Camion” (Trade in your truck), in which 196 trucks that were 25 years old or more were scrapped and replaced by vehicles with up to date technology and excellent energy and environmental performance ratings.
Also in 2010, the MTT evaluated a project to scrap old pas-senger buses in Chile’s regions and replace them with mo-dern vehicles. The impact on regional cities is expected to be greater than that in the Metropolitan Region as the buses on these roads are generally older.
In the past decade the MTT has also encouraged the con-version of taxis and collective taxis to natural gas fuel, mainly through retrofitting of existing vehicles. According to the MTT, by 2009, 3% of regular taxis and 10% of collec-tive taxis operating in the Metropolitan Region had been converted to natural gas.
Promotion of alternate modes of transportation
In regard to the Santiago subway system, advances were made in 2000 (extension of line 5), 2004 (extension of line 2), 2005 (line 4) and 2006 (line 4A). These gradually ex-panded a subway network that by December 2009 had
94 kilometers of rail and 101 stations in five interconnec-ted subway lines that served 2.3 million passengers daily. Other changes to urban transit systems this decade inclu-de the inauguration of the Valparaiso subway (Merval) in 2005, with a rail network of 43 kilometers and 20 stations, and the greater Concepcion commuter train (Biovias), also inaugurated in 2005 with 17 stations in two rail lines.
In regard to non-motorized modes of transportation in Chile’s cities, in the past decade the MTT, SECTRA, and MIN-VU worked intensively with regional authorities, mainly on the creation and maintenance of bicycle networks. By 2009, eleven Chilean cities had bike lanes operating. The barriers to introducing and maintaining these kinds of initiatives—such as cultural and educational mindsets and safety concerns related to accidents—should also be mentioned, however.
Implementation of energy efficiency measures in high priority vehicle fleets
Also worth noting is that the MTT has been studying measures to increase the efficiency of inter-urban cargo transport since 2005, and in 2007 the Ministry joined the PPEE in implementing pilot projects in this area. As this transport sector has both high fuel consumption and GHG emissions, there is a need to analyze its technological effi-ciency and formulate and apply standards, even though regulating this sector presents some challenges. One ini-tiative that bears mention is a pilot project that provides efficient driver training to drivers working for small com-panies engaged in inter-city on-road shipping. This pro-ject was implemented under the National Energy Efficien-cy Program and the Chilean Energy Efficiency Agency in 2009 and 2010 as “Mueve tu camion con buena energia” (Move your truck with good energy). The project also in-cluded a module on fleet management and another on te-chnical and mechanical vehicle inspection, and achieved fuel savings of around 10% among participating compa-nies (AChEE, personal communication).
2.3.3 Potential sector-specific mitigation options
This section presents the results of two major, publically funded studies on mitigation of GHG emissions for the transportation sector. The studies were concluded in the first half of 2010.
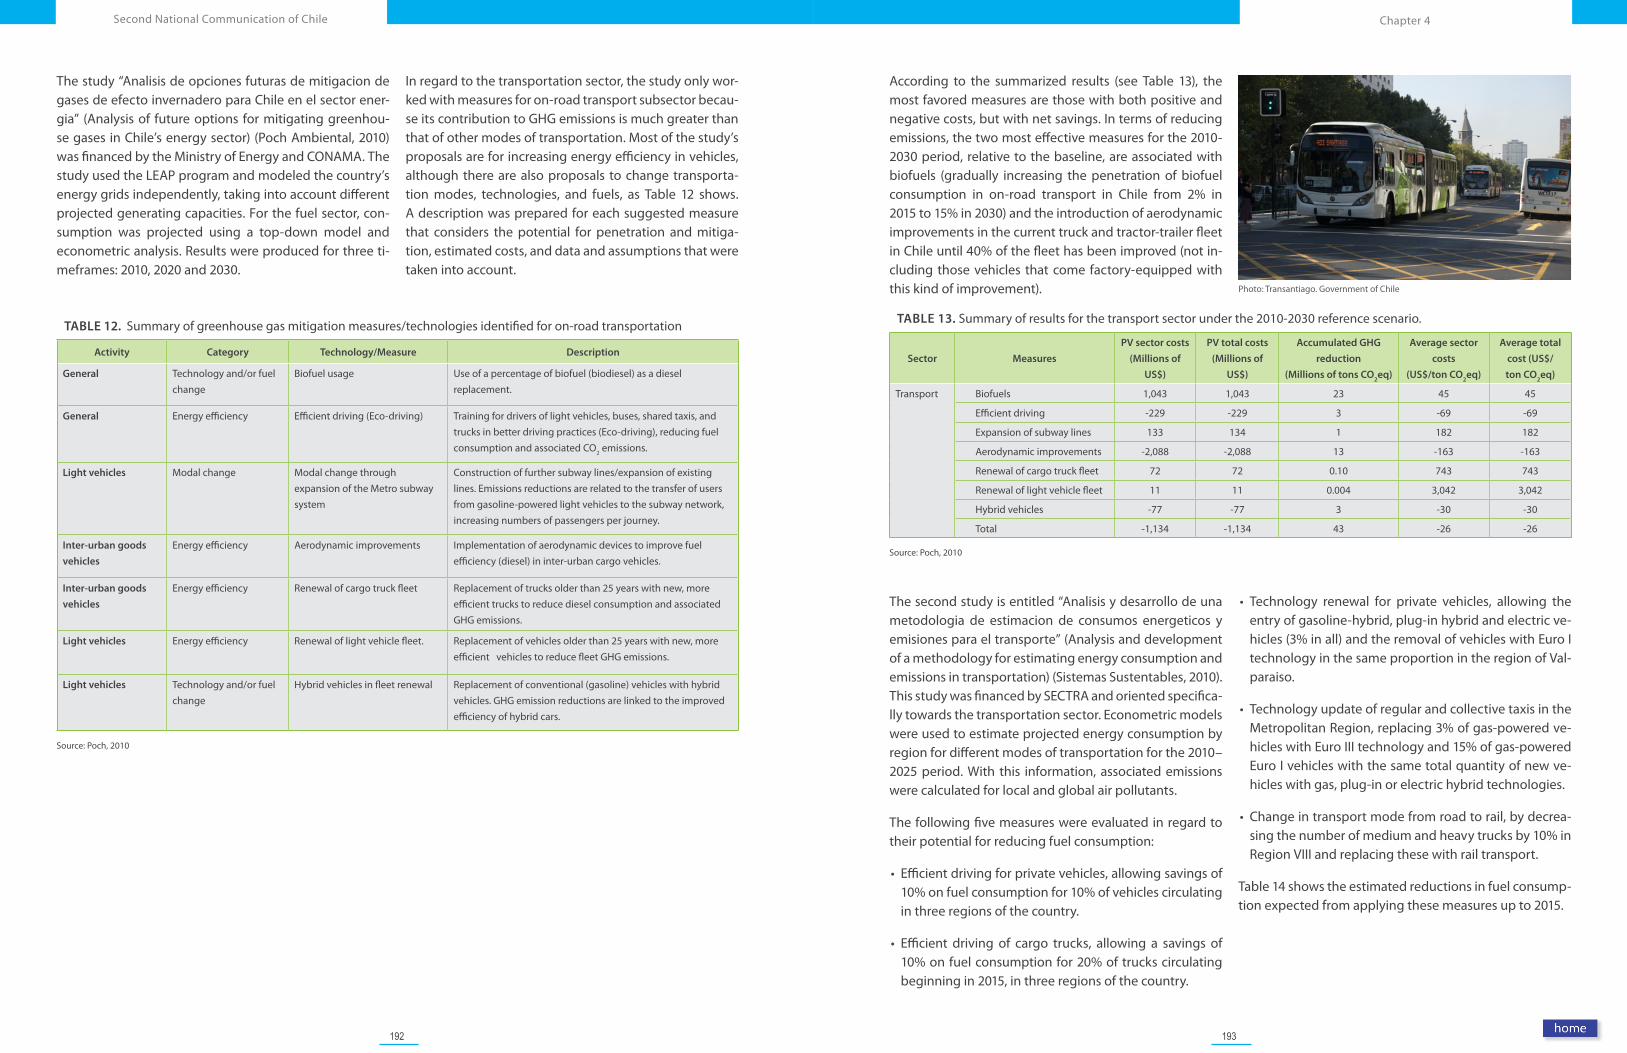
192 193
Chapter 4Second National Communication of Chile
Photo: Transantiago. Government of Chile
The study “Analisis de opciones futuras de mitigacion de gases de efecto invernadero para Chile en el sector ener-gia” (Analysis of future options for mitigating greenhou-se gases in Chile’s energy sector) (Poch Ambiental, 2010) was financed by the Ministry of Energy and CONAMA. The study used the LEAP program and modeled the country’s energy grids independently, taking into account different projected generating capacities. For the fuel sector, con-sumption was projected using a top-down model and econometric analysis. Results were produced for three ti-meframes: 2010, 2020 and 2030.
In regard to the transportation sector, the study only wor-ked with measures for on-road transport subsector becau-se its contribution to GHG emissions is much greater than that of other modes of transportation. Most of the study’s proposals are for increasing energy efficiency in vehicles, although there are also proposals to change transporta-tion modes, technologies, and fuels, as Table 12 shows. A description was prepared for each suggested measure that considers the potential for penetration and mitiga-tion, estimated costs, and data and assumptions that were taken into account.
TABLE 12. Summary of greenhouse gas mitigation measures/technologies identified for on-road transportation
Activity Category Technology/Measure Description
General Technology and/or fuel change
Biofuel usage Use of a percentage of biofuel (biodiesel) as a diesel replacement.
General Energy efficiency Efficient driving (Eco-driving) Training for drivers of light vehicles, buses, shared taxis, and trucks in better driving practices (Eco-driving), reducing fuel consumption and associated CO2 emissions.
Light vehicles Modal change Modal change through expansion of the Metro subway system
Construction of further subway lines/expansion of existing lines. Emissions reductions are related to the transfer of users from gasoline-powered light vehicles to the subway network, increasing numbers of passengers per journey.
Inter-urban goods
vehicles
Energy efficiency Aerodynamic improvements Implementation of aerodynamic devices to improve fuel efficiency (diesel) in inter-urban cargo vehicles.
Inter-urban goods
vehicles
Energy efficiency Renewal of cargo truck fleet Replacement of trucks older than 25 years with new, more efficient trucks to reduce diesel consumption and associated GHG emissions.
Light vehicles Energy efficiency Renewal of light vehicle fleet. Replacement of vehicles older than 25 years with new, more efficient vehicles to reduce fleet GHG emissions.
Light vehicles Technology and/or fuel change
Hybrid vehicles in fleet renewal Replacement of conventional (gasoline) vehicles with hybrid vehicles. GHG emission reductions are linked to the improved efficiency of hybrid cars.
Source: Poch, 2010
TABLE 13. Summary of results for the transport sector under the 2010-2030 reference scenario.
Sector Measures
PV sector costs
(Millions of
US$)
PV total costs
(Millions of
US$)
Accumulated GHG
reduction
(Millions of tons CO2eq)
Average sector
costs
(US$/ton CO2eq)
Average total
cost (US$/
ton CO2eq)
Transport Biofuels 1,043 1,043 23 45 45
Efficient driving -229 -229 3 -69 -69
Expansion of subway lines 133 134 1 182 182
Aerodynamic improvements -2,088 -2,088 13 -163 -163
Renewal of cargo truck fleet 72 72 0.10 743 743
Renewal of light vehicle fleet 11 11 0.004 3,042 3,042
Hybrid vehicles -77 -77 3 -30 -30
Total -1,134 -1,134 43 -26 -26
Source: Poch, 2010
According to the summarized results (see Table 13), the most favored measures are those with both positive and negative costs, but with net savings. In terms of reducing emissions, the two most effective measures for the 2010-2030 period, relative to the baseline, are associated with biofuels (gradually increasing the penetration of biofuel consumption in on-road transport in Chile from 2% in 2015 to 15% in 2030) and the introduction of aerodynamic improvements in the current truck and tractor-trailer fleet in Chile until 40% of the fleet has been improved (not in-cluding those vehicles that come factory-equipped with this kind of improvement).
The second study is entitled “Analisis y desarrollo de una metodologia de estimacion de consumos energeticos y emisiones para el transporte” (Analysis and development of a methodology for estimating energy consumption and emissions in transportation) (Sistemas Sustentables, 2010). This study was financed by SECTRA and oriented specifica-lly towards the transportation sector. Econometric models were used to estimate projected energy consumption by region for different modes of transportation for the 2010–2025 period. With this information, associated emissions were calculated for local and global air pollutants.
The following five measures were evaluated in regard to their potential for reducing fuel consumption:
• Efficient driving for private vehicles, allowing savings of 10% on fuel consumption for 10% of vehicles circulating in three regions of the country.
• Efficient driving of cargo trucks, allowing a savings of 10% on fuel consumption for 20% of trucks circulating beginning in 2015, in three regions of the country.
• Technology renewal for private vehicles, allowing the entry of gasoline-hybrid, plug-in hybrid and electric ve-hicles (3% in all) and the removal of vehicles with Euro I technology in the same proportion in the region of Val-paraiso.
• Technology update of regular and collective taxis in the Metropolitan Region, replacing 3% of gas-powered ve-hicles with Euro III technology and 15% of gas-powered Euro I vehicles with the same total quantity of new ve-hicles with gas, plug-in or electric hybrid technologies.
• Change in transport mode from road to rail, by decrea-sing the number of medium and heavy trucks by 10% in Region VIII and replacing these with rail transport.
Table 14 shows the estimated reductions in fuel consump-tion expected from applying these measures up to 2015.
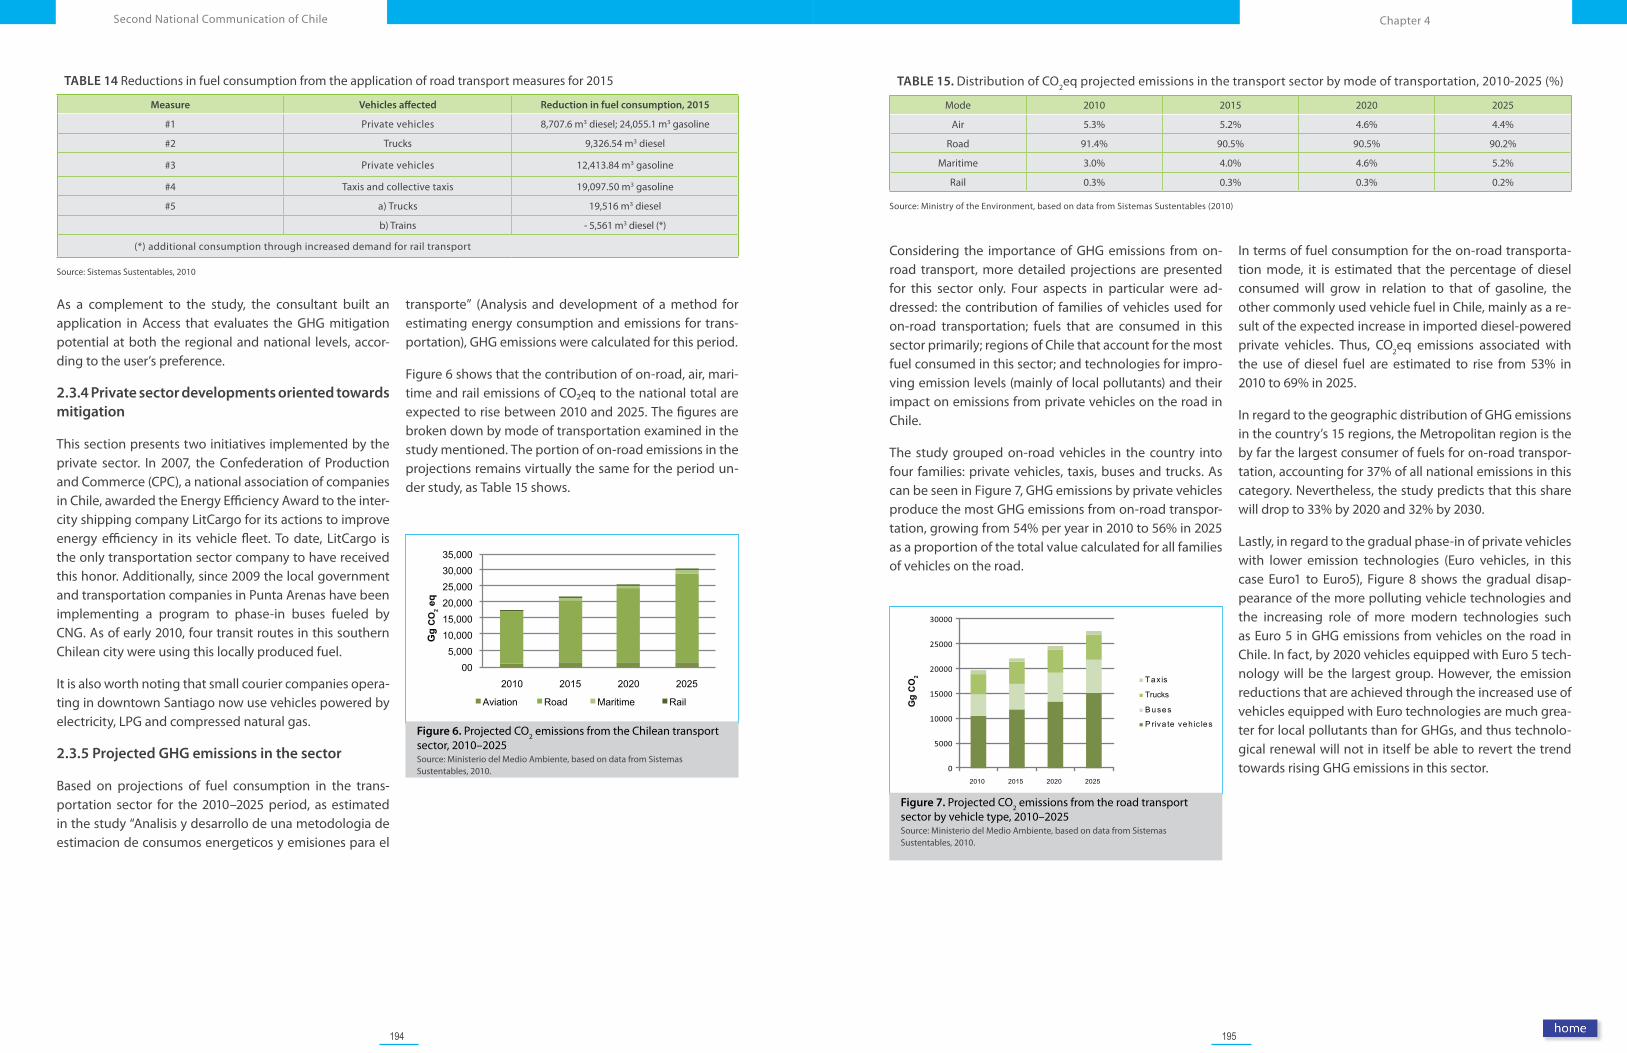
194 195
Chapter 4Second National Communication of Chile
00 5,000
10,000 15,000 20,000 25,000 30,000 35,000
2010 2015 2020 2025
Gg
CO
2eq
Aviation Road Maritime Rail
Figure 6. Projected CO2 emissions from the Chilean transport sector, 2010–2025Source: Ministerio del Medio Ambiente, based on data from Sistemas Sustentables, 2010.
TABLE 14 Reductions in fuel consumption from the application of road transport measures for 2015
Measure Vehicles affected Reduction in fuel consumption, 2015
#1 Private vehicles 8,707.6 m3 diesel; 24,055.1 m3 gasoline
#2 Trucks 9,326.54 m3 diesel
#3 Private vehicles 12,413.84 m3 gasoline
#4 Taxis and collective taxis 19,097.50 m3 gasoline
#5 a) Trucks 19,516 m3 diesel
b) Trains - 5,561 m3 diesel (*)
(*) additional consumption through increased demand for rail transport
Source: Sistemas Sustentables, 2010
As a complement to the study, the consultant built an application in Access that evaluates the GHG mitigation potential at both the regional and national levels, accor-ding to the user’s preference.
2.3.4 Private sector developments oriented towards mitigation
This section presents two initiatives implemented by the private sector. In 2007, the Confederation of Production and Commerce (CPC), a national association of companies in Chile, awarded the Energy Efficiency Award to the inter-city shipping company LitCargo for its actions to improve energy efficiency in its vehicle fleet. To date, LitCargo is the only transportation sector company to have received this honor. Additionally, since 2009 the local government and transportation companies in Punta Arenas have been implementing a program to phase-in buses fueled by CNG. As of early 2010, four transit routes in this southern Chilean city were using this locally produced fuel.
It is also worth noting that small courier companies opera-ting in downtown Santiago now use vehicles powered by electricity, LPG and compressed natural gas.
2.3.5 Projected GHG emissions in the sector
Based on projections of fuel consumption in the trans-portation sector for the 2010–2025 period, as estimated in the study “Analisis y desarrollo de una metodologia de estimacion de consumos energeticos y emisiones para el
transporte” (Analysis and development of a method for estimating energy consumption and emissions for trans-portation), GHG emissions were calculated for this period.
Figure 6 shows that the contribution of on-road, air, mari-time and rail emissions of CO₂eq to the national total are expected to rise between 2010 and 2025. The figures are broken down by mode of transportation examined in the study mentioned. The portion of on-road emissions in the projections remains virtually the same for the period un-der study, as Table 15 shows.
TABLE 15. Distribution of CO2eq projected emissions in the transport sector by mode of transportation, 2010-2025 (%)
Mode 2010 2015 2020 2025
Air 5.3% 5.2% 4.6% 4.4%
Road 91.4% 90.5% 90.5% 90.2%
Maritime 3.0% 4.0% 4.6% 5.2%
Rail 0.3% 0.3% 0.3% 0.2%
Source: Ministry of the Environment, based on data from Sistemas Sustentables (2010)
Considering the importance of GHG emissions from on-road transport, more detailed projections are presented for this sector only. Four aspects in particular were ad-dressed: the contribution of families of vehicles used for on-road transportation; fuels that are consumed in this sector primarily; regions of Chile that account for the most fuel consumed in this sector; and technologies for impro-ving emission levels (mainly of local pollutants) and their impact on emissions from private vehicles on the road in Chile.
The study grouped on-road vehicles in the country into four families: private vehicles, taxis, buses and trucks. As can be seen in Figure 7, GHG emissions by private vehicles produce the most GHG emissions from on-road transpor-tation, growing from 54% per year in 2010 to 56% in 2025 as a proportion of the total value calculated for all families of vehicles on the road.
In terms of fuel consumption for the on-road transporta-tion mode, it is estimated that the percentage of diesel consumed will grow in relation to that of gasoline, the other commonly used vehicle fuel in Chile, mainly as a re-sult of the expected increase in imported diesel-powered private vehicles. Thus, CO2eq emissions associated with the use of diesel fuel are estimated to rise from 53% in 2010 to 69% in 2025.
In regard to the geographic distribution of GHG emissions in the country’s 15 regions, the Metropolitan region is the by far the largest consumer of fuels for on-road transpor-tation, accounting for 37% of all national emissions in this category. Nevertheless, the study predicts that this share will drop to 33% by 2020 and 32% by 2030.
Lastly, in regard to the gradual phase-in of private vehicles with lower emission technologies (Euro vehicles, in this case Euro1 to Euro5), Figure 8 shows the gradual disap-pearance of the more polluting vehicle technologies and the increasing role of more modern technologies such as Euro 5 in GHG emissions from vehicles on the road in Chile. In fact, by 2020 vehicles equipped with Euro 5 tech-nology will be the largest group. However, the emission reductions that are achieved through the increased use of vehicles equipped with Euro technologies are much grea-ter for local pollutants than for GHGs, and thus technolo-gical renewal will not in itself be able to revert the trend towards rising GHG emissions in this sector.
Figure 7. Projected CO2 emissions from the road transport sector by vehicle type, 2010–2025 Source: Ministerio del Medio Ambiente, based on data from Sistemas Sustentables, 2010.
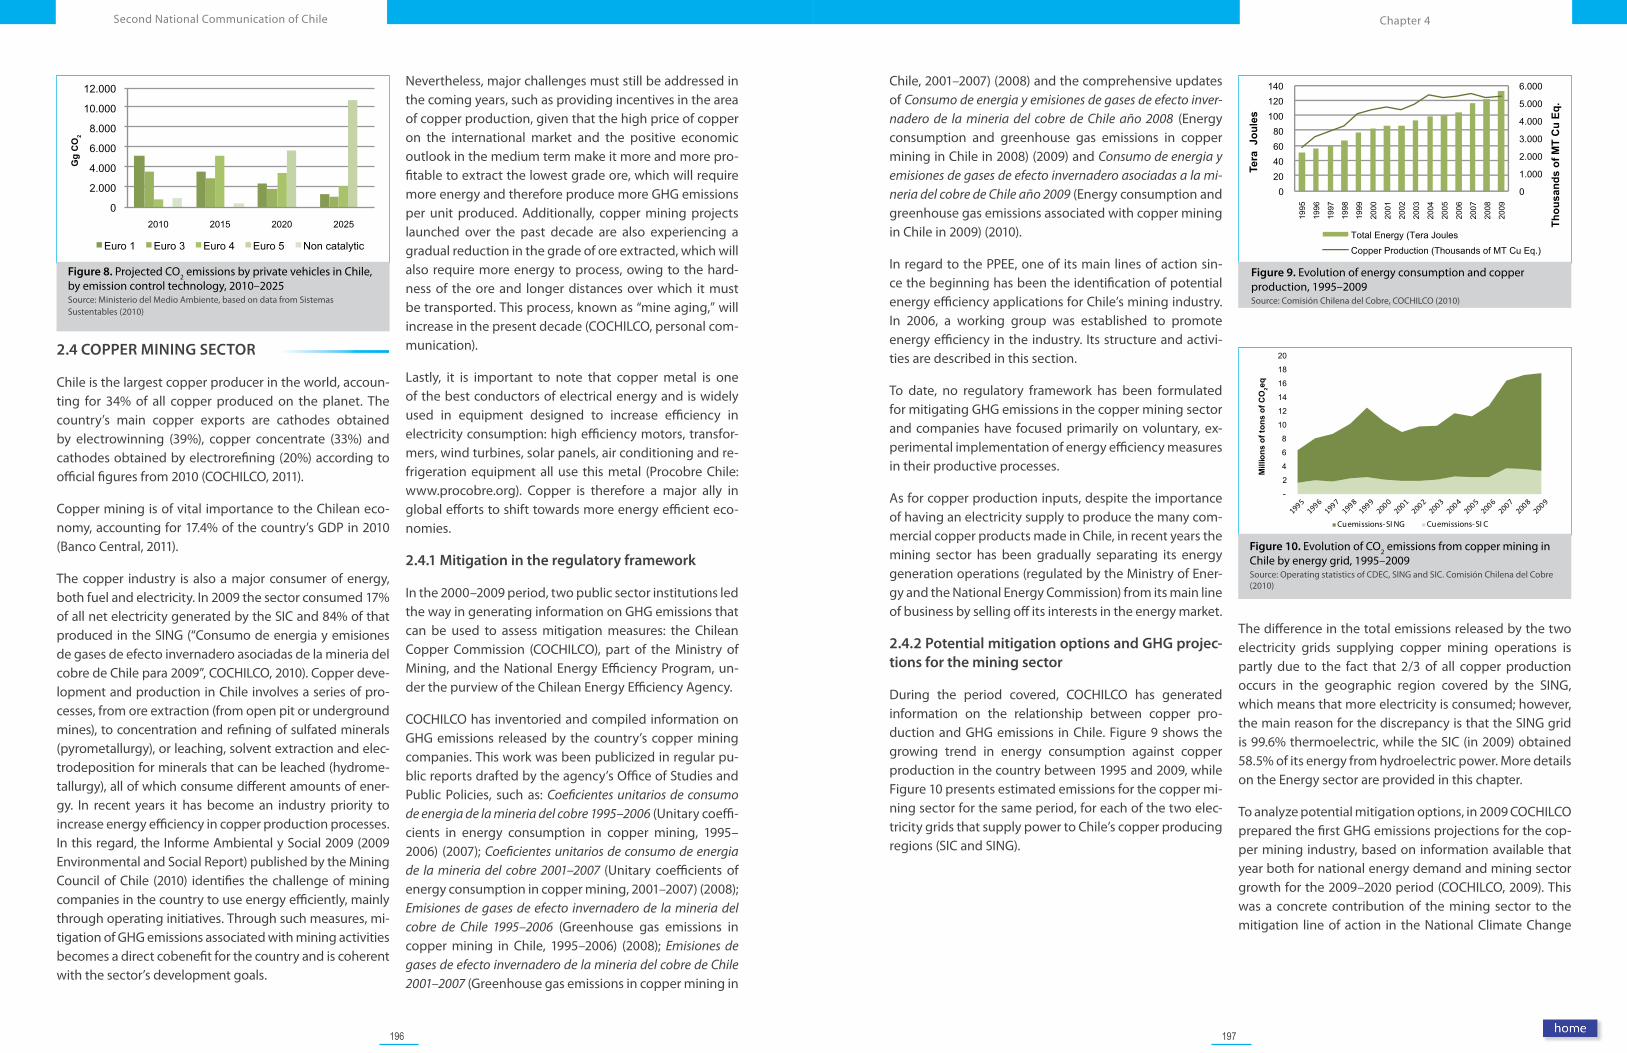
196 197
Chapter 4Second National Communication of Chile
Figure 9. Evolution of energy consumption and copper production, 1995–2009 Source: Comisión Chilena del Cobre, COCHILCO (2010)
2.4 COPPER MINING SECTOR
Chile is the largest copper producer in the world, accoun-ting for 34% of all copper produced on the planet. The country’s main copper exports are cathodes obtained by electrowinning (39%), copper concentrate (33%) and cathodes obtained by electrorefining (20%) according to official figures from 2010 (COCHILCO, 2011).
Copper mining is of vital importance to the Chilean eco-nomy, accounting for 17.4% of the country’s GDP in 2010 (Banco Central, 2011).
The copper industry is also a major consumer of energy, both fuel and electricity. In 2009 the sector consumed 17% of all net electricity generated by the SIC and 84% of that produced in the SING (“Consumo de energia y emisiones de gases de efecto invernadero asociadas de la mineria del cobre de Chile para 2009”, COCHILCO, 2010). Copper deve-lopment and production in Chile involves a series of pro-cesses, from ore extraction (from open pit or underground mines), to concentration and refining of sulfated minerals (pyrometallurgy), or leaching, solvent extraction and elec-trodeposition for minerals that can be leached (hydrome-tallurgy), all of which consume different amounts of ener-gy. In recent years it has become an industry priority to increase energy efficiency in copper production processes. In this regard, the Informe Ambiental y Social 2009 (2009 Environmental and Social Report) published by the Mining Council of Chile (2010) identifies the challenge of mining companies in the country to use energy efficiently, mainly through operating initiatives. Through such measures, mi-tigation of GHG emissions associated with mining activities becomes a direct cobenefit for the country and is coherent with the sector’s development goals.
Nevertheless, major challenges must still be addressed in the coming years, such as providing incentives in the area of copper production, given that the high price of copper on the international market and the positive economic outlook in the medium term make it more and more pro-fitable to extract the lowest grade ore, which will require more energy and therefore produce more GHG emissions per unit produced. Additionally, copper mining projects launched over the past decade are also experiencing a gradual reduction in the grade of ore extracted, which will also require more energy to process, owing to the hard-ness of the ore and longer distances over which it must be transported. This process, known as “mine aging,” will increase in the present decade (COCHILCO, personal com-munication).
Lastly, it is important to note that copper metal is one of the best conductors of electrical energy and is widely used in equipment designed to increase efficiency in electricity consumption: high efficiency motors, transfor-mers, wind turbines, solar panels, air conditioning and re-frigeration equipment all use this metal (Procobre Chile: www.procobre.org). Copper is therefore a major ally in global efforts to shift towards more energy efficient eco-nomies.
2.4.1 Mitigation in the regulatory framework
In the 2000–2009 period, two public sector institutions led the way in generating information on GHG emissions that can be used to assess mitigation measures: the Chilean Copper Commission (COCHILCO), part of the Ministry of Mining, and the National Energy Efficiency Program, un-der the purview of the Chilean Energy Efficiency Agency.
COCHILCO has inventoried and compiled information on GHG emissions released by the country’s copper mining companies. This work was been publicized in regular pu-blic reports drafted by the agency’s Office of Studies and Public Policies, such as: Coeficientes unitarios de consumo de energia de la mineria del cobre 1995–2006 (Unitary coeffi-cients in energy consumption in copper mining, 1995–2006) (2007); Coeficientes unitarios de consumo de energia de la mineria del cobre 2001–2007 (Unitary coefficients of energy consumption in copper mining, 2001–2007) (2008); Emisiones de gases de efecto invernadero de la mineria del cobre de Chile 1995–2006 (Greenhouse gas emissions in copper mining in Chile, 1995–2006) (2008); Emisiones de gases de efecto invernadero de la mineria del cobre de Chile 2001–2007 (Greenhouse gas emissions in copper mining in
Chile, 2001–2007) (2008) and the comprehensive updates of Consumo de energia y emisiones de gases de efecto inver-nadero de la mineria del cobre de Chile año 2008 (Energy consumption and greenhouse gas emissions in copper mining in Chile in 2008) (2009) and Consumo de energia y emisiones de gases de efecto invernadero asociadas a la mi-neria del cobre de Chile año 2009 (Energy consumption and greenhouse gas emissions associated with copper mining in Chile in 2009) (2010).
In regard to the PPEE, one of its main lines of action sin-ce the beginning has been the identification of potential energy efficiency applications for Chile’s mining industry. In 2006, a working group was established to promote energy efficiency in the industry. Its structure and activi-ties are described in this section.
To date, no regulatory framework has been formulated for mitigating GHG emissions in the copper mining sector and companies have focused primarily on voluntary, ex-perimental implementation of energy efficiency measures in their productive processes.
As for copper production inputs, despite the importance of having an electricity supply to produce the many com-mercial copper products made in Chile, in recent years the mining sector has been gradually separating its energy generation operations (regulated by the Ministry of Ener-gy and the National Energy Commission) from its main line of business by selling off its interests in the energy market.
2.4.2 Potential mitigation options and GHG projec-tions for the mining sector
During the period covered, COCHILCO has generated information on the relationship between copper pro-duction and GHG emissions in Chile. Figure 9 shows the growing trend in energy consumption against copper production in the country between 1995 and 2009, while Figure 10 presents estimated emissions for the copper mi-ning sector for the same period, for each of the two elec-tricity grids that supply power to Chile’s copper producing regions (SIC and SING).
The difference in the total emissions released by the two electricity grids supplying copper mining operations is partly due to the fact that 2/3 of all copper production occurs in the geographic region covered by the SING, which means that more electricity is consumed; however, the main reason for the discrepancy is that the SING grid is 99.6% thermoelectric, while the SIC (in 2009) obtained 58.5% of its energy from hydroelectric power. More details on the Energy sector are provided in this chapter.
To analyze potential mitigation options, in 2009 COCHILCO prepared the first GHG emissions projections for the cop-per mining industry, based on information available that year both for national energy demand and mining sector growth for the 2009–2020 period (COCHILCO, 2009). This was a concrete contribution of the mining sector to the mitigation line of action in the National Climate Change
Figure 8. Projected CO2 emissions by private vehicles in Chile, by emission control technology, 2010–2025Source: Ministerio del Medio Ambiente, based on data from Sistemas Sustentables (2010)
Gg
CO
2
Figure 10. Evolution of CO2 emissions from copper mining in Chile by energy grid, 1995–2009 Source: Operating statistics of CDEC, SING and SIC. Comisión Chilena del Cobre (2010)
19951996
19971998
19992000
20012002
20032004
20052006
20072008
2009
Mill
ions
of t
ons
of C
O2e
q
Cuemissions-SI NG Cuemissions- SI C
-
2
4
6
8
10
12
14
16
18
20
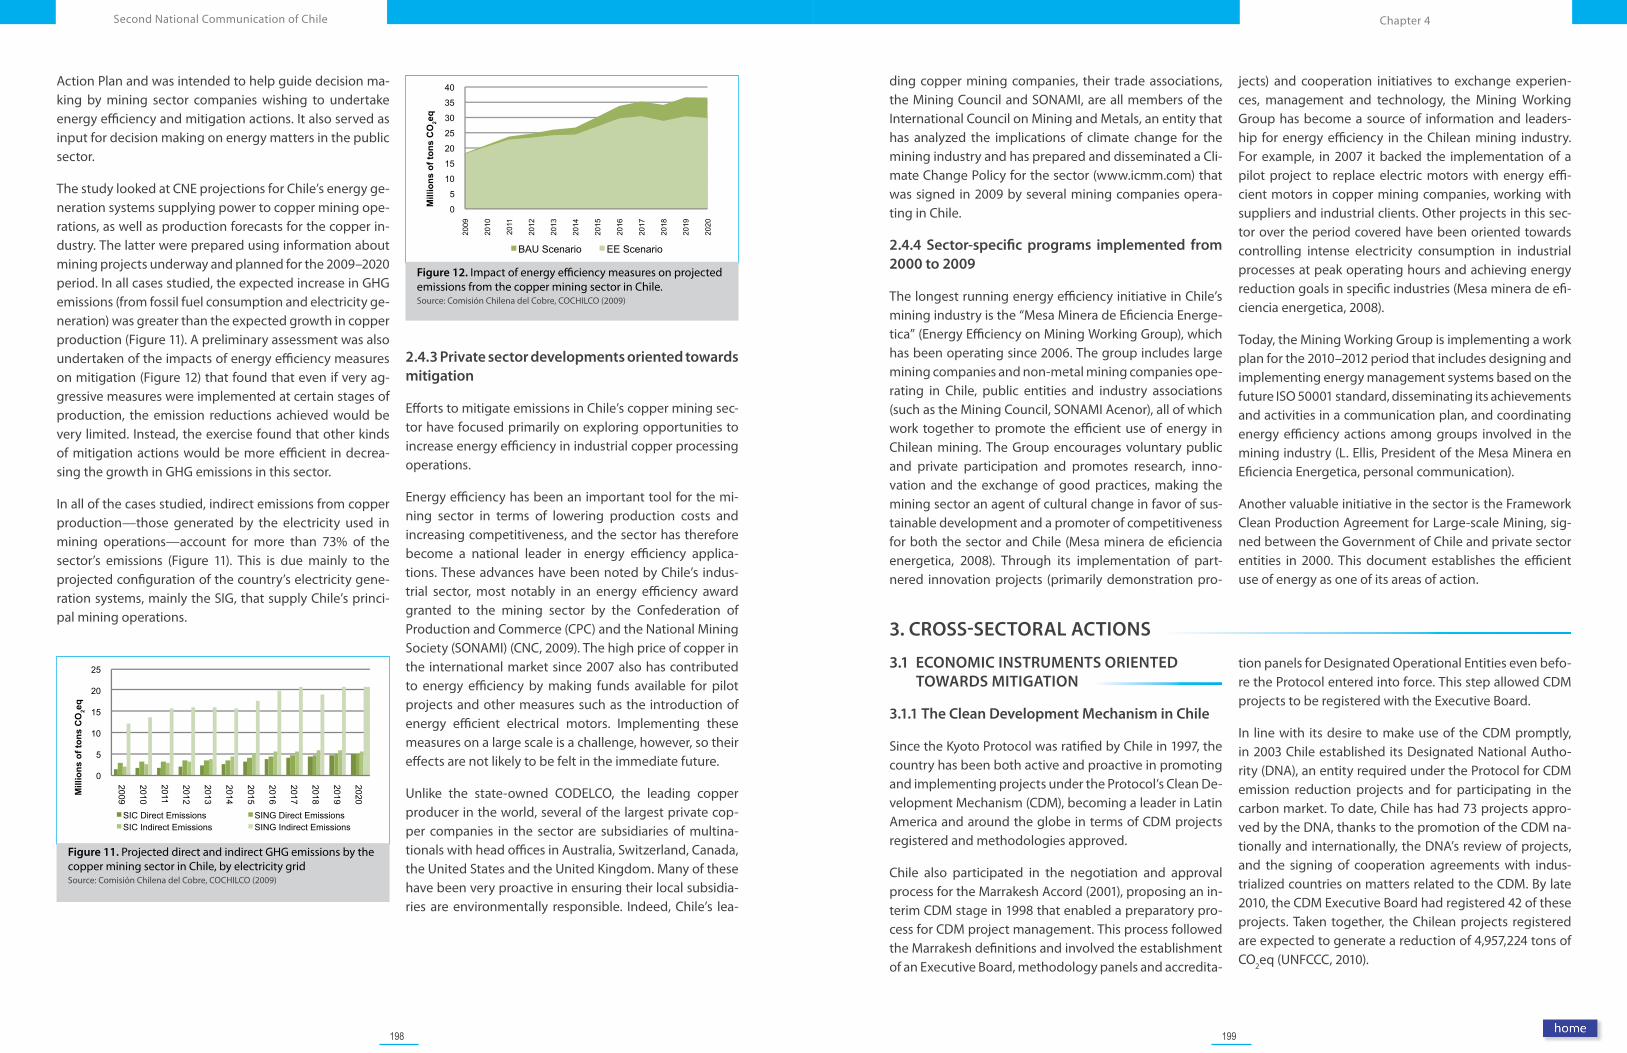
198 199
Chapter 4Second National Communication of Chile
Action Plan and was intended to help guide decision ma-king by mining sector companies wishing to undertake energy efficiency and mitigation actions. It also served as input for decision making on energy matters in the public sector.
The study looked at CNE projections for Chile’s energy ge-neration systems supplying power to copper mining ope-rations, as well as production forecasts for the copper in-dustry. The latter were prepared using information about mining projects underway and planned for the 2009–2020 period. In all cases studied, the expected increase in GHG emissions (from fossil fuel consumption and electricity ge-neration) was greater than the expected growth in copper production (Figure 11). A preliminary assessment was also undertaken of the impacts of energy efficiency measures on mitigation (Figure 12) that found that even if very ag-gressive measures were implemented at certain stages of production, the emission reductions achieved would be very limited. Instead, the exercise found that other kinds of mitigation actions would be more efficient in decrea-sing the growth in GHG emissions in this sector.
In all of the cases studied, indirect emissions from copper production—those generated by the electricity used in mining operations—account for more than 73% of the sector’s emissions (Figure 11). This is due mainly to the projected configuration of the country’s electricity gene-ration systems, mainly the SIG, that supply Chile’s princi-pal mining operations.
2.4.3 Private sector developments oriented towards mitigation
Efforts to mitigate emissions in Chile’s copper mining sec-tor have focused primarily on exploring opportunities to increase energy efficiency in industrial copper processing operations.
Energy efficiency has been an important tool for the mi-ning sector in terms of lowering production costs and increasing competitiveness, and the sector has therefore become a national leader in energy efficiency applica-tions. These advances have been noted by Chile’s indus-trial sector, most notably in an energy efficiency award granted to the mining sector by the Confederation of Production and Commerce (CPC) and the National Mining Society (SONAMI) (CNC, 2009). The high price of copper in the international market since 2007 also has contributed to energy efficiency by making funds available for pilot projects and other measures such as the introduction of energy efficient electrical motors. Implementing these measures on a large scale is a challenge, however, so their effects are not likely to be felt in the immediate future.
Unlike the state-owned CODELCO, the leading copper producer in the world, several of the largest private cop-per companies in the sector are subsidiaries of multina-tionals with head offices in Australia, Switzerland, Canada, the United States and the United Kingdom. Many of these have been very proactive in ensuring their local subsidia-ries are environmentally responsible. Indeed, Chile’s lea-
ding copper mining companies, their trade associations, the Mining Council and SONAMI, are all members of the International Council on Mining and Metals, an entity that has analyzed the implications of climate change for the mining industry and has prepared and disseminated a Cli-mate Change Policy for the sector (www.icmm.com) that was signed in 2009 by several mining companies opera-ting in Chile.
2.4.4 Sector-specific programs implemented from 2000 to 2009
The longest running energy efficiency initiative in Chile’s mining industry is the “Mesa Minera de Eficiencia Energe-tica” (Energy Efficiency on Mining Working Group), which has been operating since 2006. The group includes large mining companies and non-metal mining companies ope-rating in Chile, public entities and industry associations (such as the Mining Council, SONAMI Acenor), all of which work together to promote the efficient use of energy in Chilean mining. The Group encourages voluntary public and private participation and promotes research, inno-vation and the exchange of good practices, making the mining sector an agent of cultural change in favor of sus-tainable development and a promoter of competitiveness for both the sector and Chile (Mesa minera de eficiencia energetica, 2008). Through its implementation of part-nered innovation projects (primarily demonstration pro-
jects) and cooperation initiatives to exchange experien-ces, management and technology, the Mining Working Group has become a source of information and leaders-hip for energy efficiency in the Chilean mining industry. For example, in 2007 it backed the implementation of a pilot project to replace electric motors with energy effi-cient motors in copper mining companies, working with suppliers and industrial clients. Other projects in this sec-tor over the period covered have been oriented towards controlling intense electricity consumption in industrial processes at peak operating hours and achieving energy reduction goals in specific industries (Mesa minera de efi-ciencia energetica, 2008).
Today, the Mining Working Group is implementing a work plan for the 2010–2012 period that includes designing and implementing energy management systems based on the future ISO 50001 standard, disseminating its achievements and activities in a communication plan, and coordinating energy efficiency actions among groups involved in the mining industry (L. Ellis, President of the Mesa Minera en Eficiencia Energetica, personal communication).
Another valuable initiative in the sector is the Framework Clean Production Agreement for Large-scale Mining, sig-ned between the Government of Chile and private sector entities in 2000. This document establishes the efficient use of energy as one of its areas of action.
3. CROSS-SECTORAL ACTIONS
3.1 ECONOMIC INSTRUMENTS ORIENTED TOWARDS MITIGATION
3.1.1 The Clean Development Mechanism in Chile
Since the Kyoto Protocol was ratified by Chile in 1997, the country has been both active and proactive in promoting and implementing projects under the Protocol’s Clean De-velopment Mechanism (CDM), becoming a leader in Latin America and around the globe in terms of CDM projects registered and methodologies approved.
Chile also participated in the negotiation and approval process for the Marrakesh Accord (2001), proposing an in-terim CDM stage in 1998 that enabled a preparatory pro-cess for CDM project management. This process followed the Marrakesh definitions and involved the establishment of an Executive Board, methodology panels and accredita-
tion panels for Designated Operational Entities even befo-re the Protocol entered into force. This step allowed CDM projects to be registered with the Executive Board.
In line with its desire to make use of the CDM promptly, in 2003 Chile established its Designated National Autho-rity (DNA), an entity required under the Protocol for CDM emission reduction projects and for participating in the carbon market. To date, Chile has had 73 projects appro-ved by the DNA, thanks to the promotion of the CDM na-tionally and internationally, the DNA’s review of projects, and the signing of cooperation agreements with indus-trialized countries on matters related to the CDM. By late 2010, the CDM Executive Board had registered 42 of these projects. Taken together, the Chilean projects registered are expected to generate a reduction of 4,957,224 tons of CO2eq (UNFCCC, 2010).
Figure 11. Projected direct and indirect GHG emissions by the copper mining sector in Chile, by electricity grid Source: Comisión Chilena del Cobre, COCHILCO (2009)
0
5
10
15
20
25
2009
2010
2011
2012
2013
2014
2015
2016
2017
2018
2019
2020
Mill
ions
of t
ons
CO
2eq
SIC Direct Emissions SING Direct EmissionsSIC Indirect Emissions SING Indirect Emissions
Figure 12. Impact of energy efficiency measures on projected emissions from the copper mining sector in Chile.Source: Comisión Chilena del Cobre, COCHILCO (2009)
0
5
10
15
20
25
30
35
40
2009
2010
2011
2012
2013
2014
2015
2016
2017
2018
2019
2020
Mill
ions
of t
ons
CO
2eq
BAU Scenario EE Scenario
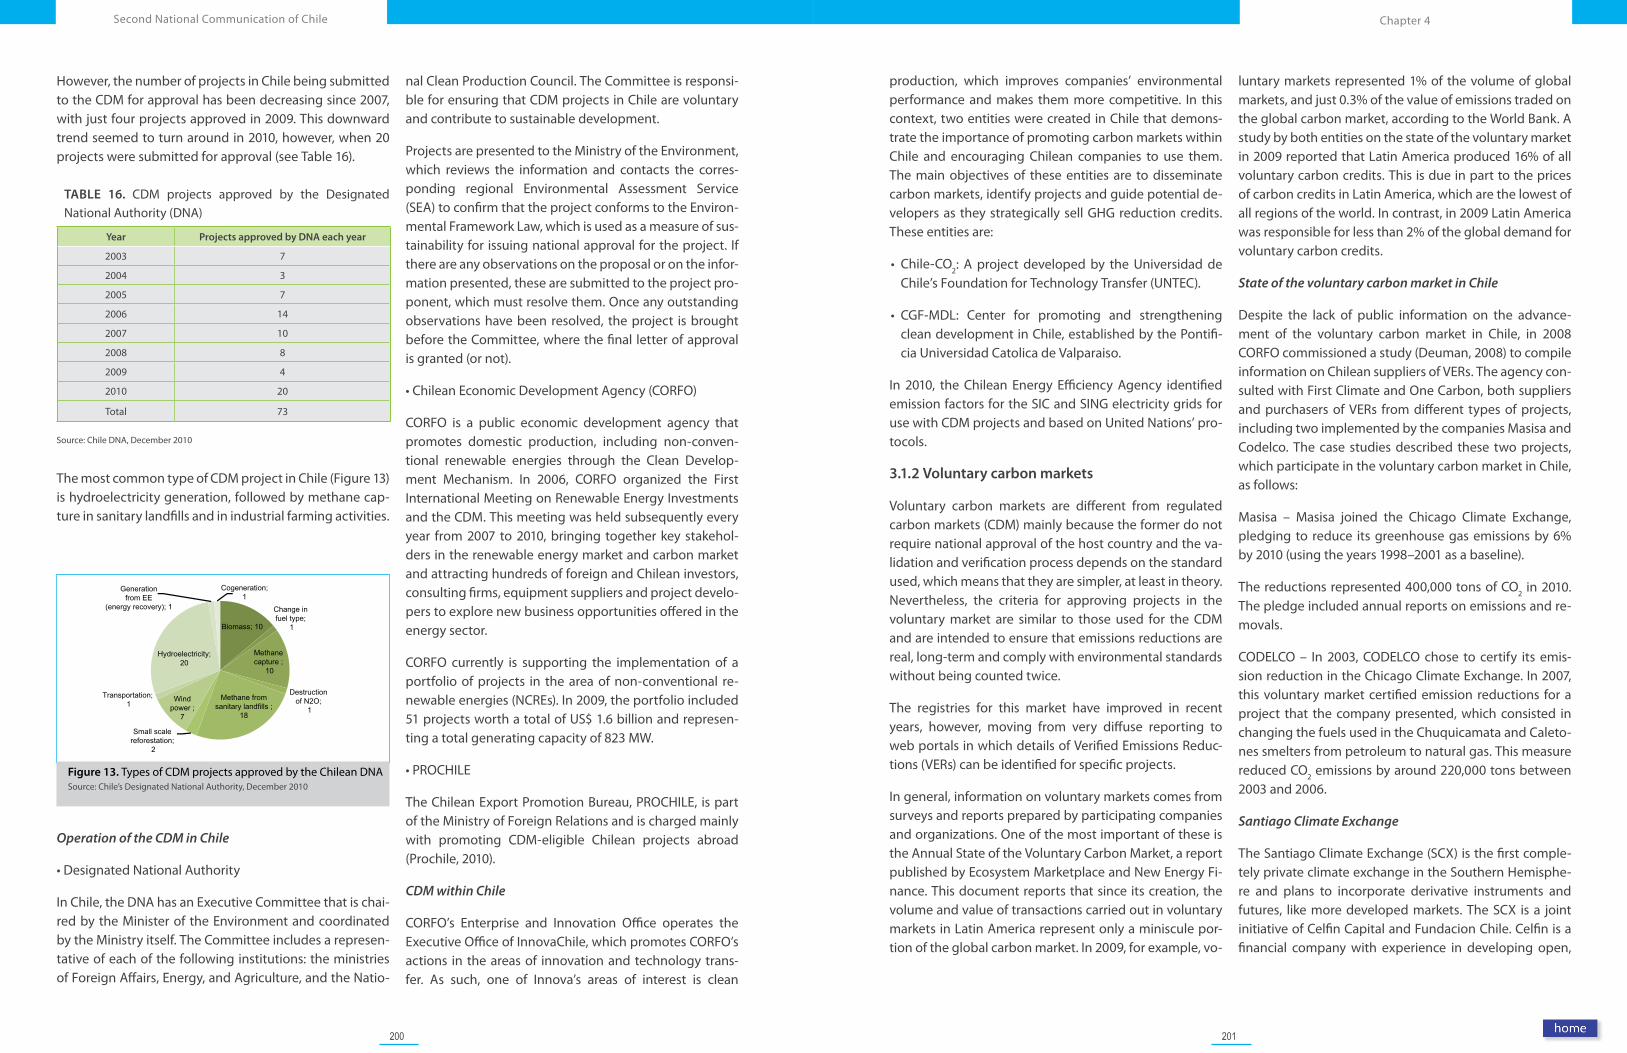
200 201
Chapter 4Second National Communication of Chile
However, the number of projects in Chile being submitted to the CDM for approval has been decreasing since 2007, with just four projects approved in 2009. This downward trend seemed to turn around in 2010, however, when 20 projects were submitted for approval (see Table 16).
TABLE 16. CDM projects approved by the Designated National Authority (DNA)
Year Projects approved by DNA each year
2003 7
2004 3
2005 7
2006 14
2007 10
2008 8
2009 4
2010 20
Total 73
Source: Chile DNA, December 2010
The most common type of CDM project in Chile (Figure 13) is hydroelectricity generation, followed by methane cap-ture in sanitary landfills and in industrial farming activities.
Operation of the CDM in Chile
•DesignatedNationalAuthority
In Chile, the DNA has an Executive Committee that is chai-red by the Minister of the Environment and coordinated by the Ministry itself. The Committee includes a represen-tative of each of the following institutions: the ministries of Foreign Affairs, Energy, and Agriculture, and the Natio-
nal Clean Production Council. The Committee is responsi-ble for ensuring that CDM projects in Chile are voluntary and contribute to sustainable development.
Projects are presented to the Ministry of the Environment, which reviews the information and contacts the corres-ponding regional Environmental Assessment Service (SEA) to confirm that the project conforms to the Environ-mental Framework Law, which is used as a measure of sus-tainability for issuing national approval for the project. If there are any observations on the proposal or on the infor-mation presented, these are submitted to the project pro-ponent, which must resolve them. Once any outstanding observations have been resolved, the project is brought before the Committee, where the final letter of approval is granted (or not).
•ChileanEconomicDevelopmentAgency(CORFO)
CORFO is a public economic development agency that promotes domestic production, including non-conven-tional renewable energies through the Clean Develop-ment Mechanism. In 2006, CORFO organized the First International Meeting on Renewable Energy Investments and the CDM. This meeting was held subsequently every year from 2007 to 2010, bringing together key stakehol-ders in the renewable energy market and carbon market and attracting hundreds of foreign and Chilean investors, consulting firms, equipment suppliers and project develo-pers to explore new business opportunities offered in the energy sector.
CORFO currently is supporting the implementation of a portfolio of projects in the area of non-conventional re-newable energies (NCREs). In 2009, the portfolio included 51 projects worth a total of US$ 1.6 billion and represen-ting a total generating capacity of 823 MW.
•PROCHILE
The Chilean Export Promotion Bureau, PROCHILE, is part of the Ministry of Foreign Relations and is charged mainly with promoting CDM-eligible Chilean projects abroad (Prochile, 2010).
CDM within Chile
CORFO’s Enterprise and Innovation Office operates the Executive Office of InnovaChile, which promotes CORFO’s actions in the areas of innovation and technology trans-fer. As such, one of Innova’s areas of interest is clean
production, which improves companies’ environmental performance and makes them more competitive. In this context, two entities were created in Chile that demons-trate the importance of promoting carbon markets within Chile and encouraging Chilean companies to use them. The main objectives of these entities are to disseminate carbon markets, identify projects and guide potential de-velopers as they strategically sell GHG reduction credits. These entities are:
• Chile-CO2: A project developed by the Universidad de
Chile’s Foundation for Technology Transfer (UNTEC).
• CGF-MDL: Center for promoting and strengthening clean development in Chile, established by the Pontifi-cia Universidad Catolica de Valparaiso.
In 2010, the Chilean Energy Efficiency Agency identified emission factors for the SIC and SING electricity grids for use with CDM projects and based on United Nations’ pro-tocols.
3.1.2 Voluntary carbon markets
Voluntary carbon markets are different from regulated carbon markets (CDM) mainly because the former do not require national approval of the host country and the va-lidation and verification process depends on the standard used, which means that they are simpler, at least in theory. Nevertheless, the criteria for approving projects in the voluntary market are similar to those used for the CDM and are intended to ensure that emissions reductions are real, long-term and comply with environmental standards without being counted twice.
The registries for this market have improved in recent years, however, moving from very diffuse reporting to web portals in which details of Verified Emissions Reduc-tions (VERs) can be identified for specific projects.
In general, information on voluntary markets comes from surveys and reports prepared by participating companies and organizations. One of the most important of these is the Annual State of the Voluntary Carbon Market, a report published by Ecosystem Marketplace and New Energy Fi-nance. This document reports that since its creation, the volume and value of transactions carried out in voluntary markets in Latin America represent only a miniscule por-tion of the global carbon market. In 2009, for example, vo-
luntary markets represented 1% of the volume of global markets, and just 0.3% of the value of emissions traded on the global carbon market, according to the World Bank. A study by both entities on the state of the voluntary market in 2009 reported that Latin America produced 16% of all voluntary carbon credits. This is due in part to the prices of carbon credits in Latin America, which are the lowest of all regions of the world. In contrast, in 2009 Latin America was responsible for less than 2% of the global demand for voluntary carbon credits.
State of the voluntary carbon market in Chile
Despite the lack of public information on the advance-ment of the voluntary carbon market in Chile, in 2008 CORFO commissioned a study (Deuman, 2008) to compile information on Chilean suppliers of VERs. The agency con-sulted with First Climate and One Carbon, both suppliers and purchasers of VERs from different types of projects, including two implemented by the companies Masisa and Codelco. The case studies described these two projects, which participate in the voluntary carbon market in Chile, as follows:
Masisa – Masisa joined the Chicago Climate Exchange, pledging to reduce its greenhouse gas emissions by 6% by 2010 (using the years 1998–2001 as a baseline).
The reductions represented 400,000 tons of CO2 in 2010. The pledge included annual reports on emissions and re-movals.
CODELCO – In 2003, CODELCO chose to certify its emis-sion reduction in the Chicago Climate Exchange. In 2007, this voluntary market certified emission reductions for a project that the company presented, which consisted in changing the fuels used in the Chuquicamata and Caleto-nes smelters from petroleum to natural gas. This measure reduced CO2 emissions by around 220,000 tons between 2003 and 2006.
Santiago Climate Exchange
The Santiago Climate Exchange (SCX) is the first comple-tely private climate exchange in the Southern Hemisphe-re and plans to incorporate derivative instruments and futures, like more developed markets. The SCX is a joint initiative of Celfin Capital and Fundacion Chile. Celfin is a financial company with experience in developing open,
Figure 13. Types of CDM projects approved by the Chilean DNASource: Chile’s Designated National Authority, December 2010
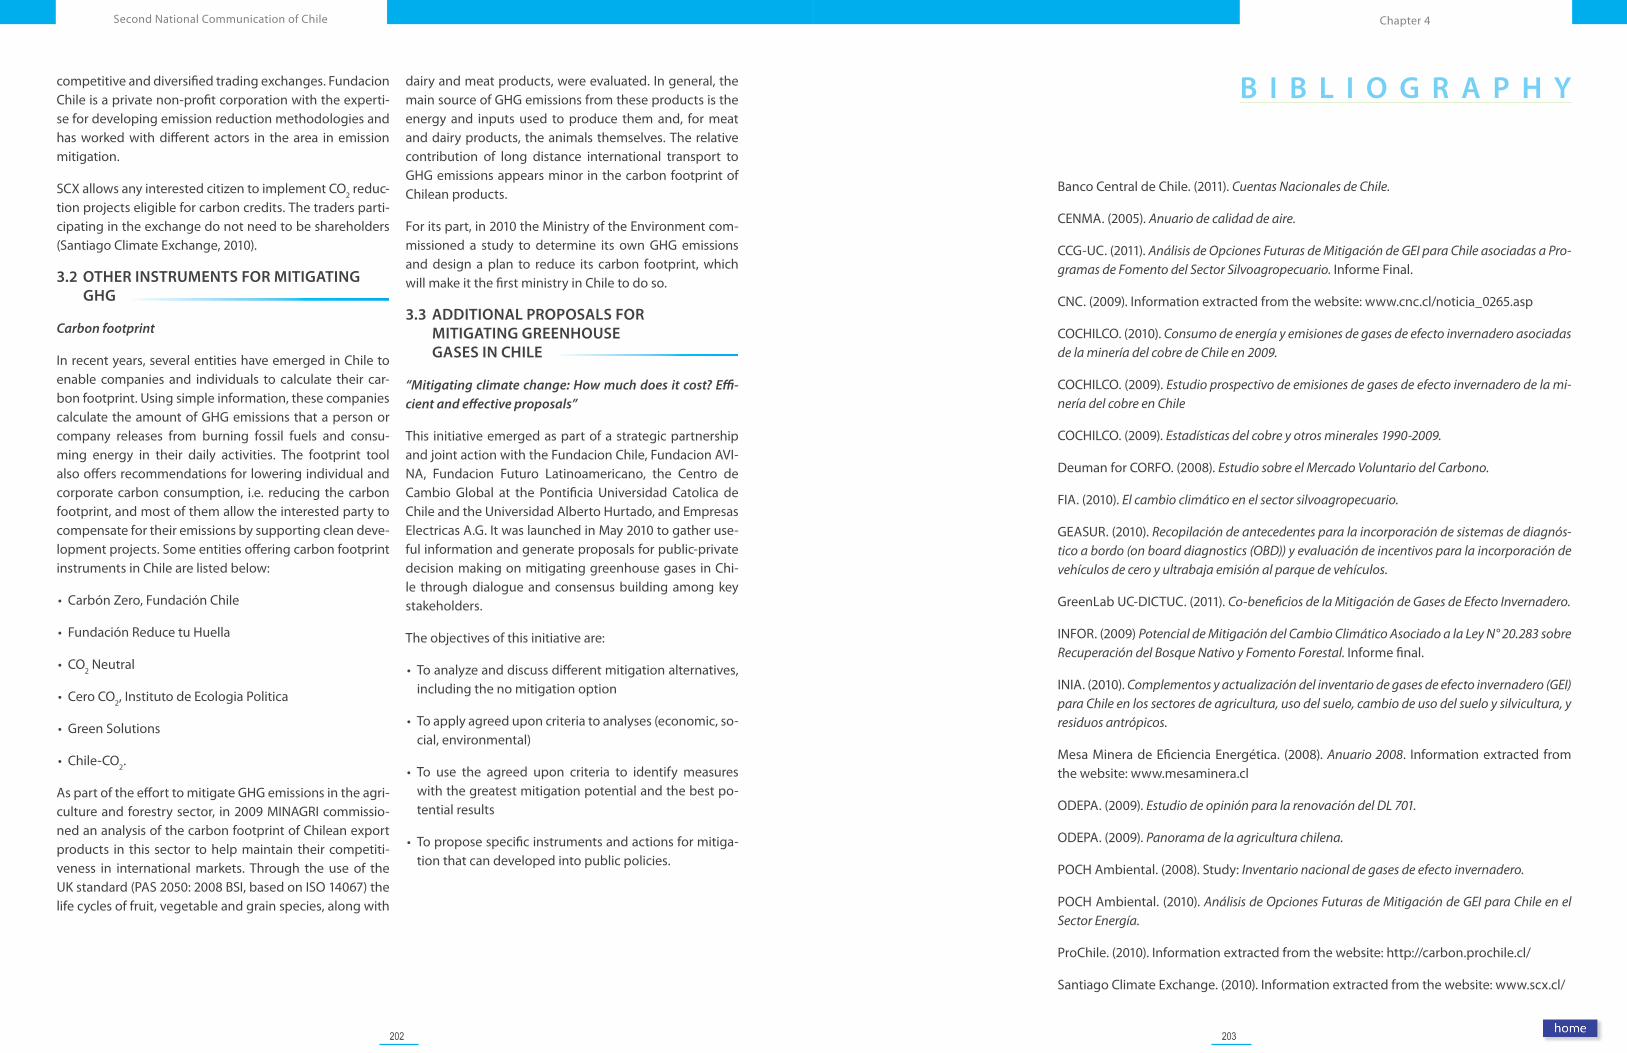
202 203
Chapter 4Second National Communication of Chile
B I B L I O G R A P H Ycompetitive and diversified trading exchanges. Fundacion Chile is a private non-profit corporation with the experti-se for developing emission reduction methodologies and has worked with different actors in the area in emission mitigation.
SCX allows any interested citizen to implement CO2 reduc-tion projects eligible for carbon credits. The traders parti-cipating in the exchange do not need to be shareholders (Santiago Climate Exchange, 2010).
3.2 OTHER INSTRUMENTS FOR MITIGATING GHG
Carbon footprint
In recent years, several entities have emerged in Chile to enable companies and individuals to calculate their car-bon footprint. Using simple information, these companies calculate the amount of GHG emissions that a person or company releases from burning fossil fuels and consu-ming energy in their daily activities. The footprint tool also offers recommendations for lowering individual and corporate carbon consumption, i.e. reducing the carbon footprint, and most of them allow the interested party to compensate for their emissions by supporting clean deve-lopment projects. Some entities offering carbon footprint instruments in Chile are listed below:
• Carbón Zero, Fundación Chile
• Fundación Reduce tu Huella
• CO2 Neutral
• Cero CO2, Instituto de Ecologia Politica
• Green Solutions
• Chile-CO2.
As part of the effort to mitigate GHG emissions in the agri-culture and forestry sector, in 2009 MINAGRI commissio-ned an analysis of the carbon footprint of Chilean export products in this sector to help maintain their competiti-veness in international markets. Through the use of the UK standard (PAS 2050: 2008 BSI, based on ISO 14067) the life cycles of fruit, vegetable and grain species, along with
dairy and meat products, were evaluated. In general, the main source of GHG emissions from these products is the energy and inputs used to produce them and, for meat and dairy products, the animals themselves. The relative contribution of long distance international transport to GHG emissions appears minor in the carbon footprint of Chilean products.
For its part, in 2010 the Ministry of the Environment com-missioned a study to determine its own GHG emissions and design a plan to reduce its carbon footprint, which will make it the first ministry in Chile to do so.
3.3 ADDITIONAL PROPOSALS FOR MITIGATING GREENHOUSE GASES IN CHILE
“Mitigating climate change: How much does it cost? Effi-cient and effective proposals”
This initiative emerged as part of a strategic partnership and joint action with the Fundacion Chile, Fundacion AVI-NA, Fundacion Futuro Latinoamericano, the Centro de Cambio Global at the Pontificia Universidad Catolica de Chile and the Universidad Alberto Hurtado, and Empresas Electricas A.G. It was launched in May 2010 to gather use-ful information and generate proposals for public-private decision making on mitigating greenhouse gases in Chi-le through dialogue and consensus building among key stakeholders.
The objectives of this initiative are:
• To analyze and discuss different mitigation alternatives, including the no mitigation option
• To apply agreed upon criteria to analyses (economic, so-cial, environmental)
• To use the agreed upon criteria to identify measures with the greatest mitigation potential and the best po-tential results
• To propose specific instruments and actions for mitiga-tion that can developed into public policies.
Banco Central de Chile. (2011). Cuentas Nacionales de Chile.
CENMA. (2005). Anuario de calidad de aire.
CCG-UC. (2011). Análisis de Opciones Futuras de Mitigación de GEI para Chile asociadas a Pro-gramas de Fomento del Sector Silvoagropecuario. Informe Final.
CNC. (2009). Information extracted from the website: www.cnc.cl/noticia_0265.asp
COCHILCO. (2010). Consumo de energía y emisiones de gases de efecto invernadero asociadas de la minería del cobre de Chile en 2009.
COCHILCO. (2009). Estudio prospectivo de emisiones de gases de efecto invernadero de la mi-nería del cobre en Chile
COCHILCO. (2009). Estadísticas del cobre y otros minerales 1990-2009.
Deuman for CORFO. (2008). Estudio sobre el Mercado Voluntario del Carbono.
FIA. (2010). El cambio climático en el sector silvoagropecuario.
GEASUR. (2010). Recopilación de antecedentes para la incorporación de sistemas de diagnós-tico a bordo (on board diagnostics (OBD)) y evaluación de incentivos para la incorporación de vehículos de cero y ultrabaja emisión al parque de vehículos.
GreenLab UC-DICTUC. (2011). Co-beneficios de la Mitigación de Gases de Efecto Invernadero.
INFOR. (2009) Potencial de Mitigación del Cambio Climático Asociado a la Ley N° 20.283 sobre Recuperación del Bosque Nativo y Fomento Forestal. Informe final.
INIA. (2010). Complementos y actualización del inventario de gases de efecto invernadero (GEI) para Chile en los sectores de agricultura, uso del suelo, cambio de uso del suelo y silvicultura, y residuos antrópicos.
Mesa Minera de Eficiencia Energética. (2008). Anuario 2008. Information extracted from the website: www.mesaminera.cl
ODEPA. (2009). Estudio de opinión para la renovación del DL 701.
ODEPA. (2009). Panorama de la agricultura chilena.
POCH Ambiental. (2008). Study: Inventario nacional de gases de efecto invernadero.
POCH Ambiental. (2010). Análisis de Opciones Futuras de Mitigación de GEI para Chile en el Sector Energía.
ProChile. (2010). Information extracted from the website: http://carbon.prochile.cl/
Santiago Climate Exchange. (2010). Information extracted from the website: www.scx.cl/
204
Second National Communication of Chile
Sistemas Sustentables. (2010) Análisis y Desarrollo de una Metodología de Estimaciones de Consumos Energéticos y Emisiones para el Transporte.
Universidad de Chile. (2010). Informe País: Estado del medioambiente en Chile 2008.
UNFCCC. (2010). CDM in Numbers. Information extracted from the website:
http://cdm.unfccc.int/Statistics/index.html
PHOTO: MINISTRY OF THE ENVIRONMENT
CHAPTER 5Other Information Relevant to the Achievement of the Convention’s Objective
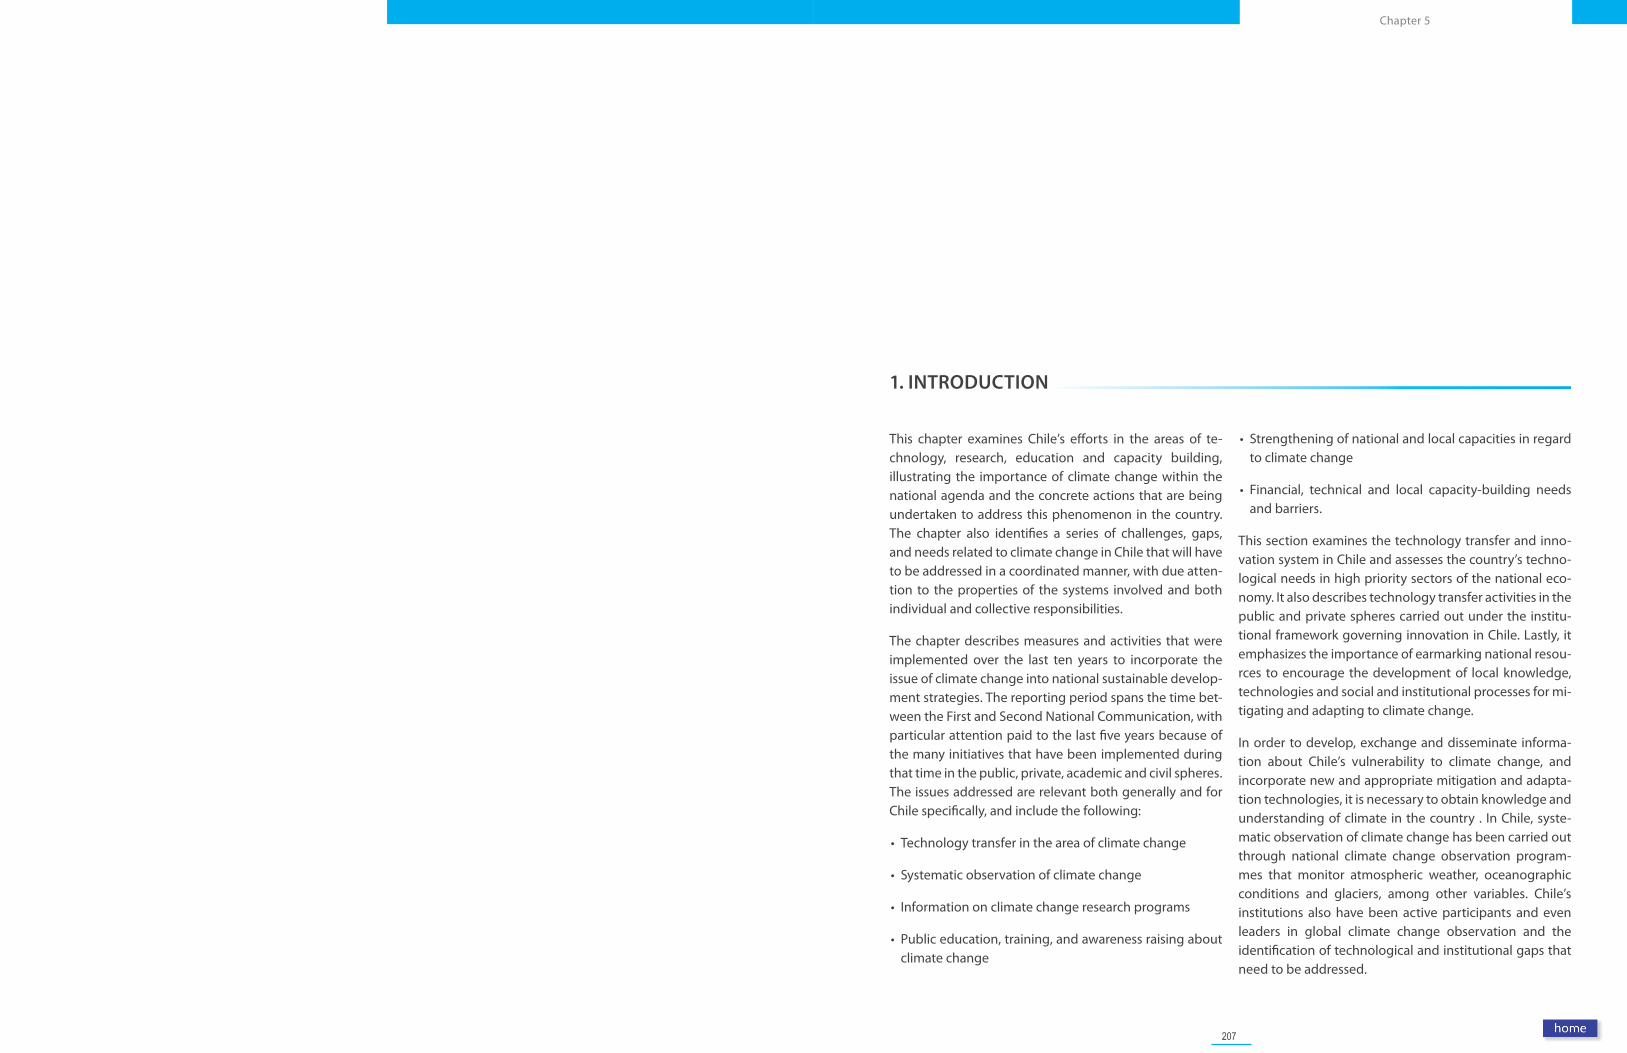
207
Chapter 5
1. INTRODUCTION
This chapter examines Chile’s efforts in the areas of te-chnology, research, education and capacity building, illustrating the importance of climate change within the national agenda and the concrete actions that are being undertaken to address this phenomenon in the country. The chapter also identifies a series of challenges, gaps, and needs related to climate change in Chile that will have to be addressed in a coordinated manner, with due atten-tion to the properties of the systems involved and both individual and collective responsibilities.
The chapter describes measures and activities that were implemented over the last ten years to incorporate the issue of climate change into national sustainable develop-ment strategies. The reporting period spans the time bet-ween the First and Second National Communication, with particular attention paid to the last five years because of the many initiatives that have been implemented during that time in the public, private, academic and civil spheres. The issues addressed are relevant both generally and for Chile specifically, and include the following:
• Technology transfer in the area of climate change
• Systematic observation of climate change
• Information on climate change research programs
• Public education, training, and awareness raising about climate change
• Strengthening of national and local capacities in regard to climate change
• Financial, technical and local capacity-building needs and barriers.
This section examines the technology transfer and inno-vation system in Chile and assesses the country’s techno-logical needs in high priority sectors of the national eco-nomy. It also describes technology transfer activities in the public and private spheres carried out under the institu-tional framework governing innovation in Chile. Lastly, it emphasizes the importance of earmarking national resou-rces to encourage the development of local knowledge, technologies and social and institutional processes for mi-tigating and adapting to climate change.
In order to develop, exchange and disseminate informa-tion about Chile’s vulnerability to climate change, and incorporate new and appropriate mitigation and adapta-tion technologies, it is necessary to obtain knowledge and understanding of climate in the country . In Chile, syste-matic observation of climate change has been carried out through national climate change observation program-mes that monitor atmospheric weather, oceanographic conditions and glaciers, among other variables. Chile’s institutions also have been active participants and even leaders in global climate change observation and the identification of technological and institutional gaps that need to be addressed.
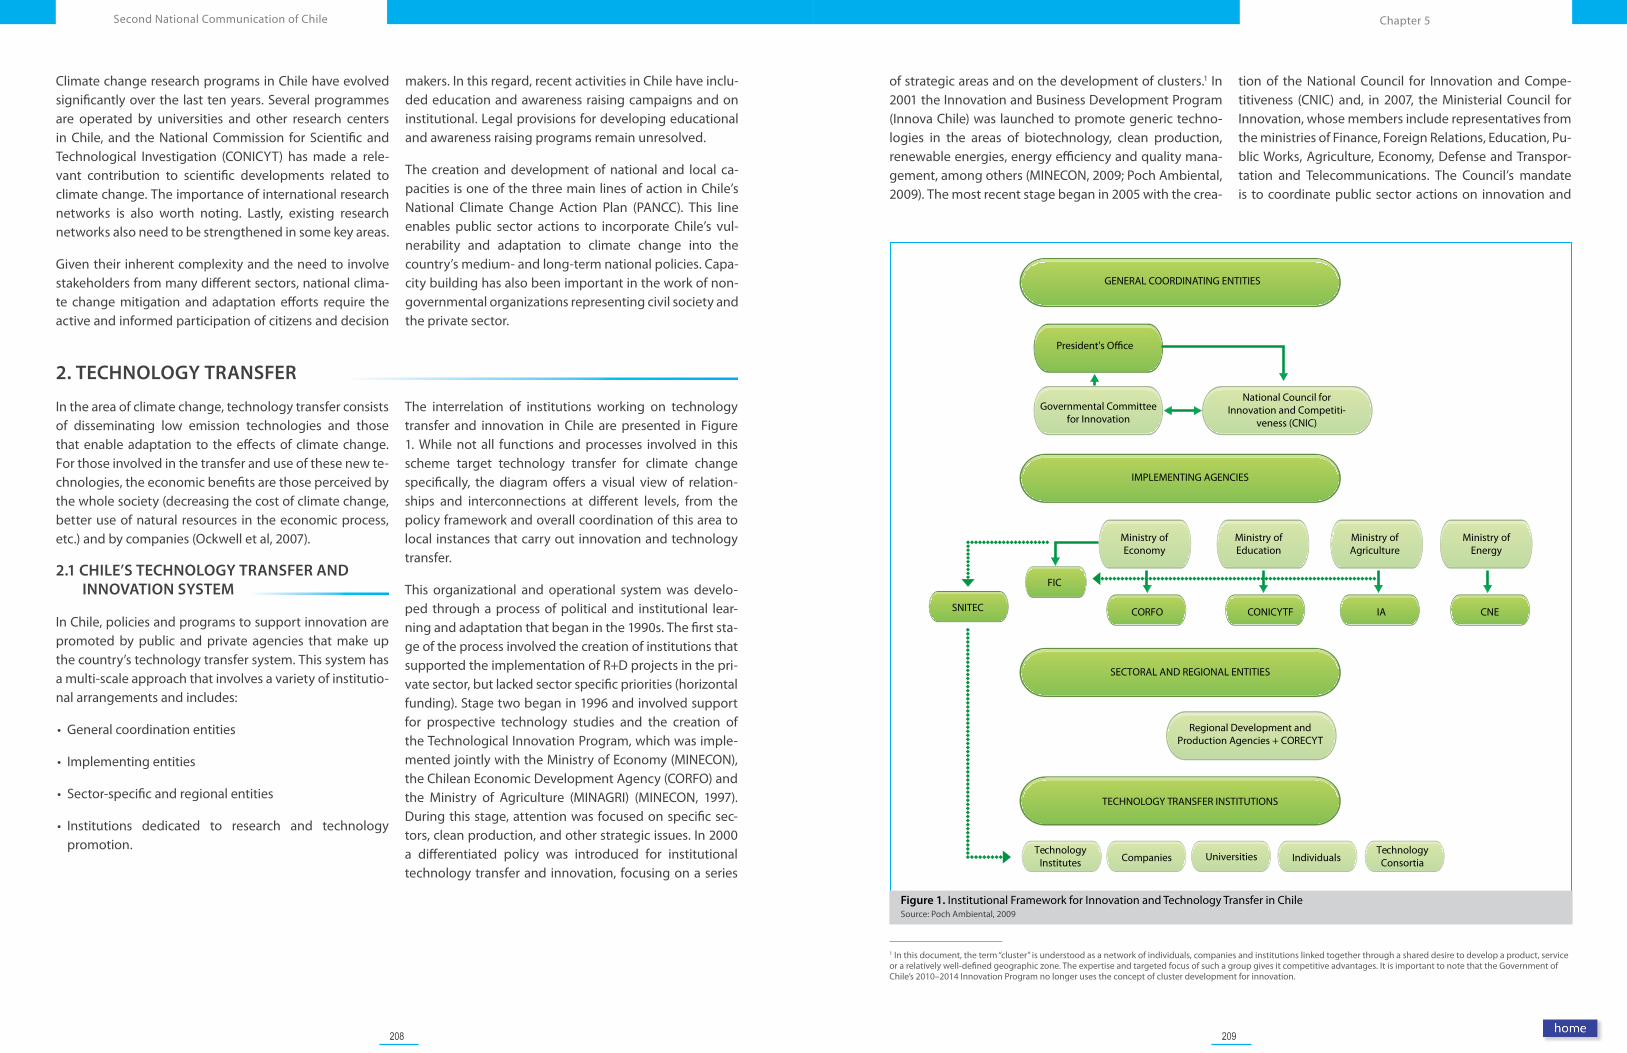
208 209
Chapter 5Second National Communication of Chile
1 In this document, the term “cluster” is understood as a network of individuals, companies and institutions linked together through a shared desire to develop a product, service or a relatively well-defined geographic zone. The expertise and targeted focus of such a group gives it competitive advantages. It is important to note that the Government of Chile’s 2010–2014 Innovation Program no longer uses the concept of cluster development for innovation.
Figure 1. Institutional Framework for Innovation and Technology Transfer in ChileSource: Poch Ambiental, 2009
of strategic areas and on the development of clusters.1 In 2001 the Innovation and Business Development Program (Innova Chile) was launched to promote generic techno-logies in the areas of biotechnology, clean production, renewable energies, energy efficiency and quality mana-gement, among others (MINECON, 2009; Poch Ambiental, 2009). The most recent stage began in 2005 with the crea-
tion of the National Council for Innovation and Compe-titiveness (CNIC) and, in 2007, the Ministerial Council for Innovation, whose members include representatives from the ministries of Finance, Foreign Relations, Education, Pu-blic Works, Agriculture, Economy, Defense and Transpor-tation and Telecommunications. The Council’s mandate is to coordinate public sector actions on innovation and
2. TECHNOLOGY TRANSFER
In the area of climate change, technology transfer consists of disseminating low emission technologies and those that enable adaptation to the effects of climate change. For those involved in the transfer and use of these new te-chnologies, the economic benefits are those perceived by the whole society (decreasing the cost of climate change, better use of natural resources in the economic process, etc.) and by companies (Ockwell et al, 2007).
2.1 CHILE’S TECHNOLOGY TRANSFER AND INNOVATION SYSTEM
In Chile, policies and programs to support innovation are promoted by public and private agencies that make up the country’s technology transfer system. This system has a multi-scale approach that involves a variety of institutio-nal arrangements and includes:
• General coordination entities
• Implementing entities
• Sector-specific and regional entities
• Institutions dedicated to research and technology promotion.
The interrelation of institutions working on technology transfer and innovation in Chile are presented in Figure 1. While not all functions and processes involved in this scheme target technology transfer for climate change specifically, the diagram offers a visual view of relation-ships and interconnections at different levels, from the policy framework and overall coordination of this area to local instances that carry out innovation and technology transfer.
This organizational and operational system was develo-ped through a process of political and institutional lear-ning and adaptation that began in the 1990s. The first sta-ge of the process involved the creation of institutions that supported the implementation of R+D projects in the pri-vate sector, but lacked sector specific priorities (horizontal funding). Stage two began in 1996 and involved support for prospective technology studies and the creation of the Technological Innovation Program, which was imple-mented jointly with the Ministry of Economy (MINECON), the Chilean Economic Development Agency (CORFO) and the Ministry of Agriculture (MINAGRI) (MINECON, 1997). During this stage, attention was focused on specific sec-tors, clean production, and other strategic issues. In 2000 a differentiated policy was introduced for institutional technology transfer and innovation, focusing on a series
Climate change research programs in Chile have evolved significantly over the last ten years. Several programmes are operated by universities and other research centers in Chile, and the National Commission for Scientific and Technological Investigation (CONICYT) has made a rele-vant contribution to scientific developments related to climate change. The importance of international research networks is also worth noting. Lastly, existing research networks also need to be strengthened in some key areas.
Given their inherent complexity and the need to involve stakeholders from many different sectors, national clima-te change mitigation and adaptation efforts require the active and informed participation of citizens and decision
makers. In this regard, recent activities in Chile have inclu-ded education and awareness raising campaigns and on institutional. Legal provisions for developing educational and awareness raising programs remain unresolved.
The creation and development of national and local ca-pacities is one of the three main lines of action in Chile’s National Climate Change Action Plan (PANCC). This line enables public sector actions to incorporate Chile’s vul-nerability and adaptation to climate change into the country’s medium- and long-term national policies. Capa-city building has also been important in the work of non-governmental organizations representing civil society and the private sector.
GENERAL COORDINATING ENTITIES
IMPLEMENTING AGENCIES
SECTORAL AND REGIONAL ENTITIES
TECHNOLOGY TRANSFER INSTITUTIONS
Governmental Committee for Innovation
Ministry of Economy
TechnologyInstitutes
Technology Consortia
Ministry of Education
Regional Development and Production Agencies + CORECYT
Ministry of Agriculture
Ministry of Energy
National Council for Innovation and Competiti-
veness (CNIC)
SNITEC CORFO
FIC
CONICYTF IA CNE
Companies Universities Individuals
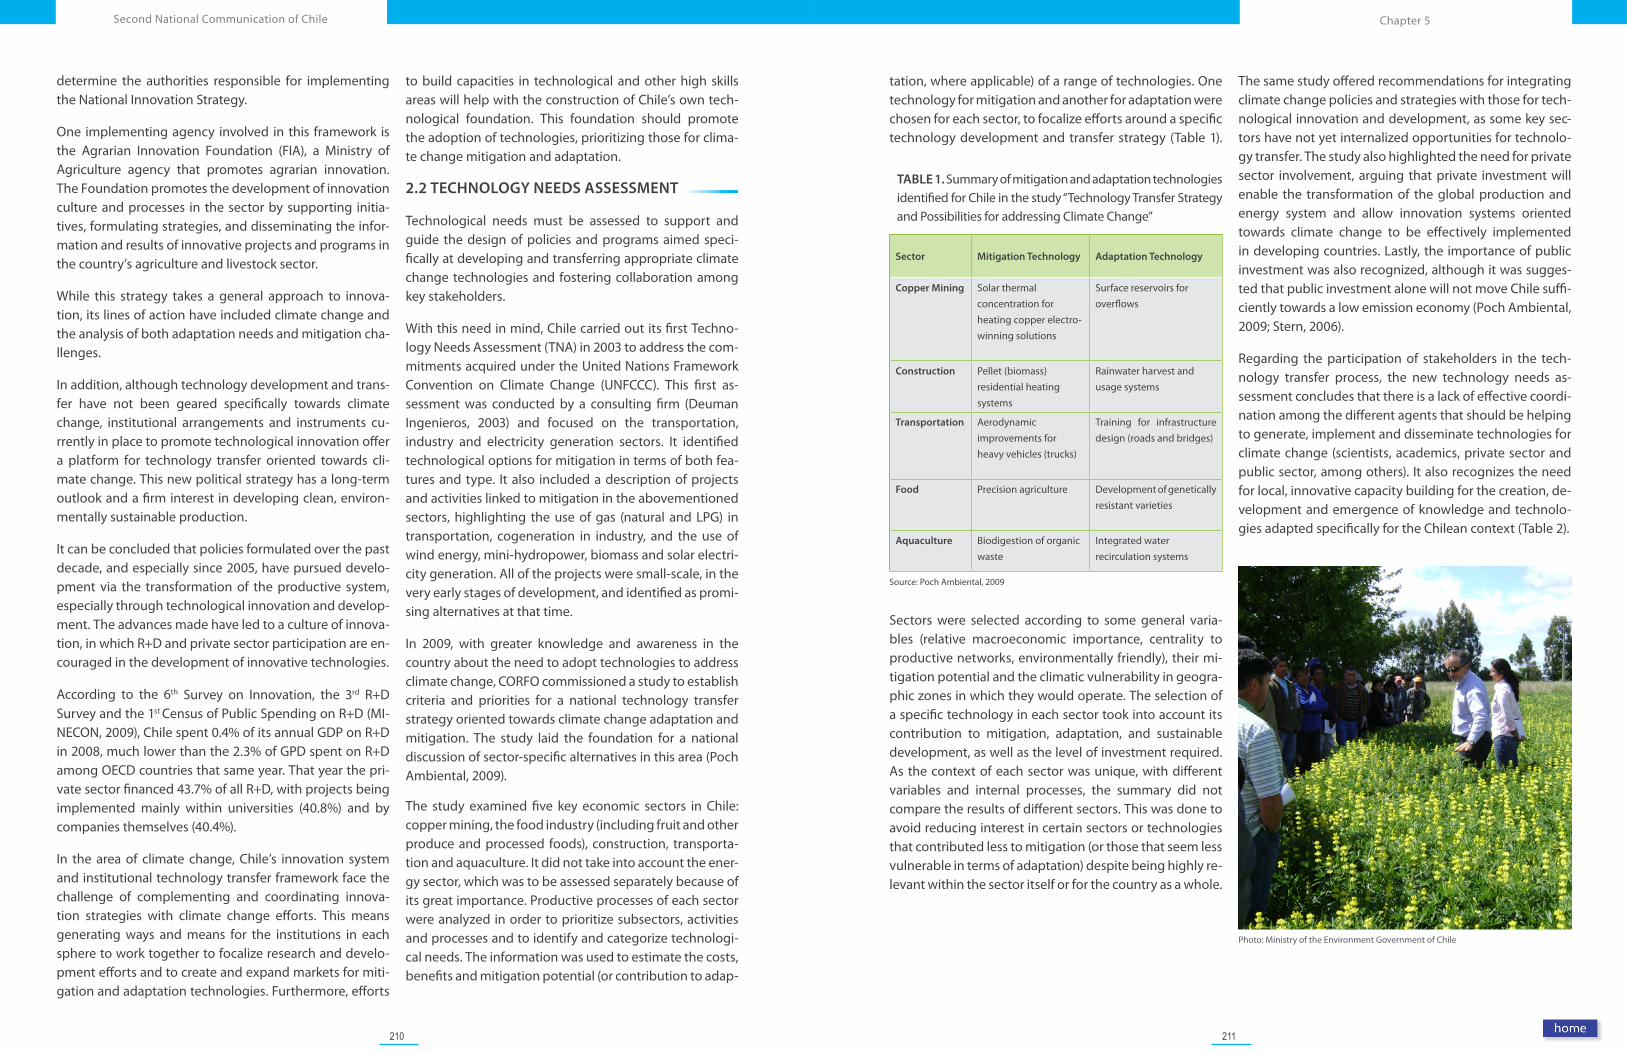
210 211
Chapter 5Second National Communication of Chile
Photo: Ministry of the Environment Government of Chile
tation, where applicable) of a range of technologies. One technology for mitigation and another for adaptation were chosen for each sector, to focalize efforts around a specific technology development and transfer strategy (Table 1).
TABLE 1. Summary of mitigation and adaptation technologies identified for Chile in the study “Technology Transfer Strategy and Possibilities for addressing Climate Change”
Sector Mitigation Technology Adaptation Technology
Copper Mining Solar thermal concentration for heating copper electro-winning solutions
Surface reservoirs for overflows
Construction Pellet (biomass) residential heating systems
Rainwater harvest and usage systems
Transportation Aerodynamic improvements for heavy vehicles (trucks)
Training for infrastructure design (roads and bridges)
Food Precision agriculture Development of genetically resistant varieties
Aquaculture Biodigestion of organic waste
Integrated water recirculation systems
Source: Poch Ambiental, 2009
Sectors were selected according to some general varia-bles (relative macroeconomic importance, centrality to productive networks, environmentally friendly), their mi-tigation potential and the climatic vulnerability in geogra-phic zones in which they would operate. The selection of a specific technology in each sector took into account its contribution to mitigation, adaptation, and sustainable development, as well as the level of investment required. As the context of each sector was unique, with different variables and internal processes, the summary did not compare the results of different sectors. This was done to avoid reducing interest in certain sectors or technologies that contributed less to mitigation (or those that seem less vulnerable in terms of adaptation) despite being highly re-levant within the sector itself or for the country as a whole.
The same study offered recommendations for integrating climate change policies and strategies with those for tech-nological innovation and development, as some key sec-tors have not yet internalized opportunities for technolo-gy transfer. The study also highlighted the need for private sector involvement, arguing that private investment will enable the transformation of the global production and energy system and allow innovation systems oriented towards climate change to be effectively implemented in developing countries. Lastly, the importance of public investment was also recognized, although it was sugges-ted that public investment alone will not move Chile suffi-ciently towards a low emission economy (Poch Ambiental, 2009; Stern, 2006).
Regarding the participation of stakeholders in the tech-nology transfer process, the new technology needs as-sessment concludes that there is a lack of effective coordi-nation among the different agents that should be helping to generate, implement and disseminate technologies for climate change (scientists, academics, private sector and public sector, among others). It also recognizes the need for local, innovative capacity building for the creation, de-velopment and emergence of knowledge and technolo-gies adapted specifically for the Chilean context (Table 2).
determine the authorities responsible for implementing the National Innovation Strategy.
One implementing agency involved in this framework is the Agrarian Innovation Foundation (FIA), a Ministry of Agriculture agency that promotes agrarian innovation. The Foundation promotes the development of innovation culture and processes in the sector by supporting initia-tives, formulating strategies, and disseminating the infor-mation and results of innovative projects and programs in the country’s agriculture and livestock sector.
While this strategy takes a general approach to innova-tion, its lines of action have included climate change and the analysis of both adaptation needs and mitigation cha-llenges.
In addition, although technology development and trans-fer have not been geared specifically towards climate change, institutional arrangements and instruments cu-rrently in place to promote technological innovation offer a platform for technology transfer oriented towards cli-mate change. This new political strategy has a long-term outlook and a firm interest in developing clean, environ-mentally sustainable production.
It can be concluded that policies formulated over the past decade, and especially since 2005, have pursued develo-pment via the transformation of the productive system, especially through technological innovation and develop-ment. The advances made have led to a culture of innova-tion, in which R+D and private sector participation are en-couraged in the development of innovative technologies.
According to the 6th Survey on Innovation, the 3rd R+D Survey and the 1st Census of Public Spending on R+D (MI-NECON, 2009), Chile spent 0.4% of its annual GDP on R+D in 2008, much lower than the 2.3% of GPD spent on R+D among OECD countries that same year. That year the pri-vate sector financed 43.7% of all R+D, with projects being implemented mainly within universities (40.8%) and by companies themselves (40.4%).
In the area of climate change, Chile’s innovation system and institutional technology transfer framework face the challenge of complementing and coordinating innova-tion strategies with climate change efforts. This means generating ways and means for the institutions in each sphere to work together to focalize research and develo-pment efforts and to create and expand markets for miti-gation and adaptation technologies. Furthermore, efforts
to build capacities in technological and other high skills areas will help with the construction of Chile’s own tech-nological foundation. This foundation should promote the adoption of technologies, prioritizing those for clima-te change mitigation and adaptation.
2.2 TECHNOLOGY NEEDS ASSESSMENT
Technological needs must be assessed to support and guide the design of policies and programs aimed speci-fically at developing and transferring appropriate climate change technologies and fostering collaboration among key stakeholders.
With this need in mind, Chile carried out its first Techno-logy Needs Assessment (TNA) in 2003 to address the com-mitments acquired under the United Nations Framework Convention on Climate Change (UNFCCC). This first as-sessment was conducted by a consulting firm (Deuman Ingenieros, 2003) and focused on the transportation, industry and electricity generation sectors. It identified technological options for mitigation in terms of both fea-tures and type. It also included a description of projects and activities linked to mitigation in the abovementioned sectors, highlighting the use of gas (natural and LPG) in transportation, cogeneration in industry, and the use of wind energy, mini-hydropower, biomass and solar electri-city generation. All of the projects were small-scale, in the very early stages of development, and identified as promi-sing alternatives at that time.
In 2009, with greater knowledge and awareness in the country about the need to adopt technologies to address climate change, CORFO commissioned a study to establish criteria and priorities for a national technology transfer strategy oriented towards climate change adaptation and mitigation. The study laid the foundation for a national discussion of sector-specific alternatives in this area (Poch Ambiental, 2009).
The study examined five key economic sectors in Chile: copper mining, the food industry (including fruit and other produce and processed foods), construction, transporta-tion and aquaculture. It did not take into account the ener-gy sector, which was to be assessed separately because of its great importance. Productive processes of each sector were analyzed in order to prioritize subsectors, activities and processes and to identify and categorize technologi-cal needs. The information was used to estimate the costs, benefits and mitigation potential (or contribution to adap-
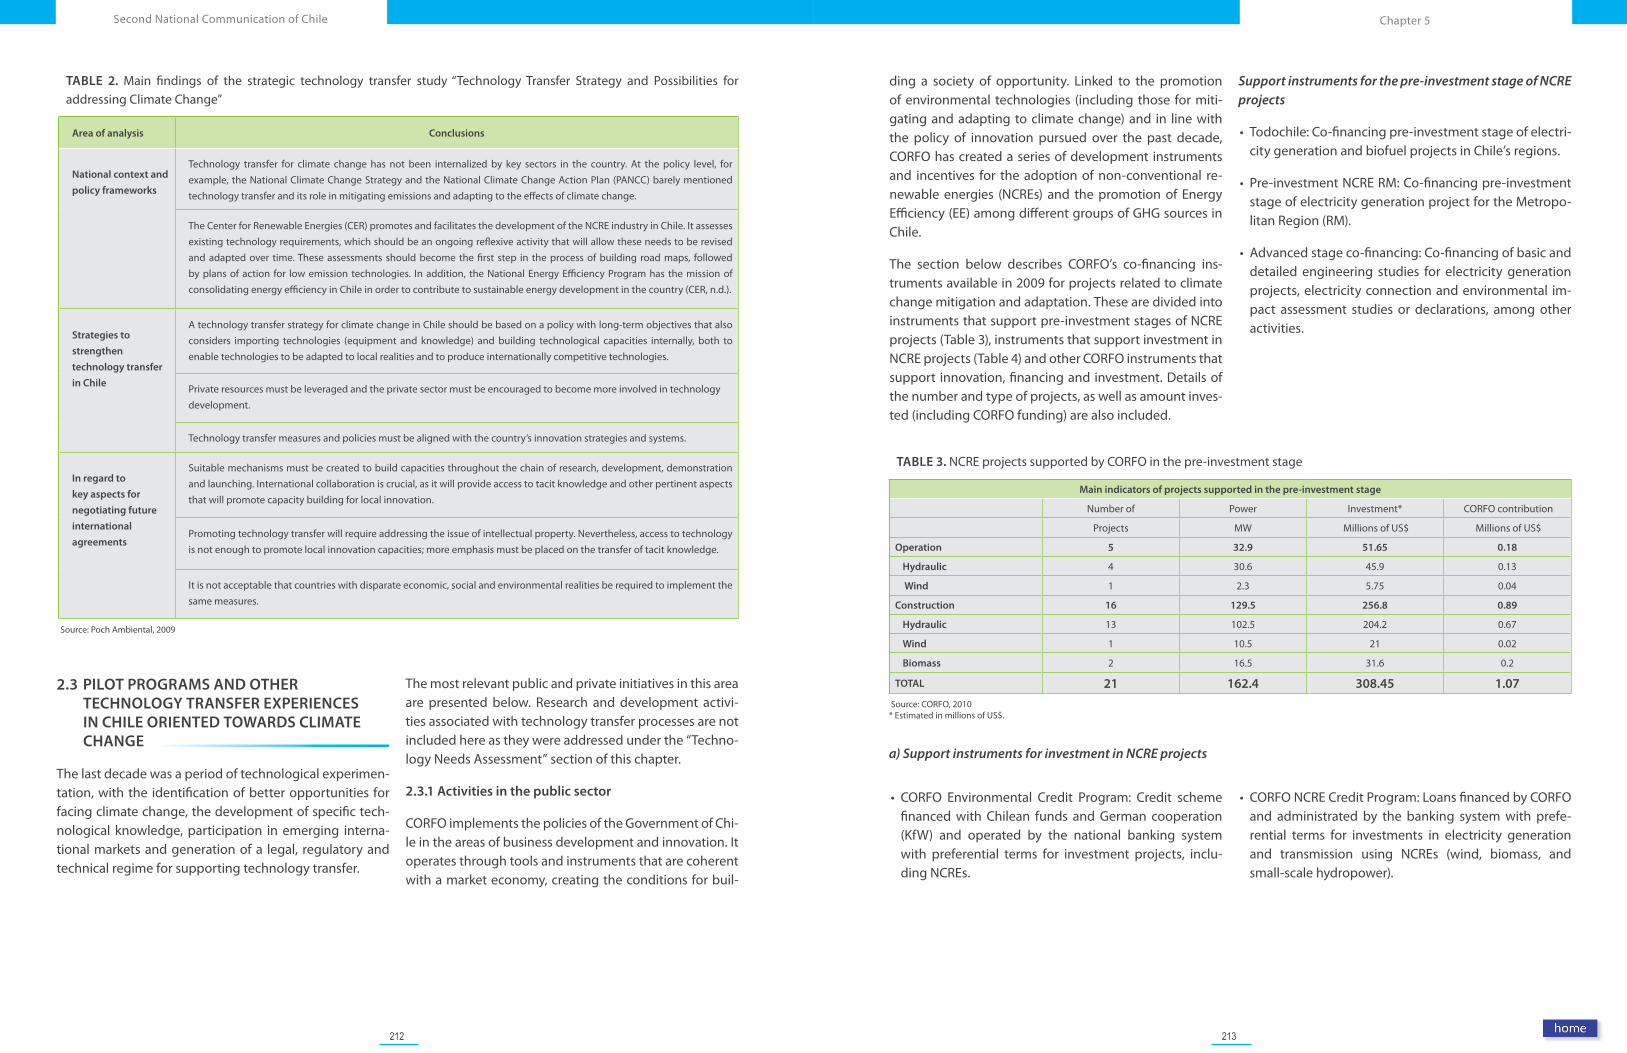
212 213
Chapter 5Second National Communication of Chile
ding a society of opportunity. Linked to the promotion of environmental technologies (including those for miti-gating and adapting to climate change) and in line with the policy of innovation pursued over the past decade, CORFO has created a series of development instruments and incentives for the adoption of non-conventional re-newable energies (NCREs) and the promotion of Energy Efficiency (EE) among different groups of GHG sources in Chile.
The section below describes CORFO’s co-financing ins-truments available in 2009 for projects related to climate change mitigation and adaptation. These are divided into instruments that support pre-investment stages of NCRE projects (Table 3), instruments that support investment in NCRE projects (Table 4) and other CORFO instruments that support innovation, financing and investment. Details of the number and type of projects, as well as amount inves-ted (including CORFO funding) are also included.
Support instruments for the pre-investment stage of NCRE projects
• Todochile: Co-financing pre-investment stage of electri-city generation and biofuel projects in Chile’s regions.
• Pre-investment NCRE RM: Co-financing pre-investment stage of electricity generation project for the Metropo-litan Region (RM).
• Advanced stage co-financing: Co-financing of basic and detailed engineering studies for electricity generation projects, electricity connection and environmental im-pact assessment studies or declarations, among other activities.
TABLE 3. NCRE projects supported by CORFO in the pre-investment stage
Main indicators of projects supported in the pre-investment stage
Number of Power Investment* CORFO contribution
Projects MW Millions of US$ Millions of US$
Operation 5 32.9 51.65 0.18
Hydraulic 4 30.6 45.9 0.13
Wind 1 2.3 5.75 0.04
Construction 16 129.5 256.8 0.89
Hydraulic 13 102.5 204.2 0.67
Wind 1 10.5 21 0.02
Biomass 2 16.5 31.6 0.2
TOTAL 21 162.4 308.45 1.07
Source: CORFO, 2010* Estimated in millions of US$.
a) Support instruments for investment in NCRE projects
• CORFO Environmental Credit Program: Credit scheme financed with Chilean funds and German cooperation (KfW) and operated by the national banking system with preferential terms for investment projects, inclu-ding NCREs.
• CORFO NCRE Credit Program: Loans financed by CORFO and administrated by the banking system with prefe-rential terms for investments in electricity generation and transmission using NCREs (wind, biomass, and small-scale hydropower).
2.3 PILOT PROGRAMS AND OTHER TECHNOLOGY TRANSFER EXPERIENCES IN CHILE ORIENTED TOWARDS CLIMATE CHANGE
The last decade was a period of technological experimen-tation, with the identification of better opportunities for facing climate change, the development of specific tech-nological knowledge, participation in emerging interna-tional markets and generation of a legal, regulatory and technical regime for supporting technology transfer.
The most relevant public and private initiatives in this area are presented below. Research and development activi-ties associated with technology transfer processes are not included here as they were addressed under the “Techno-logy Needs Assessment” section of this chapter.
2.3.1 Activities in the public sector
CORFO implements the policies of the Government of Chi-le in the areas of business development and innovation. It operates through tools and instruments that are coherent with a market economy, creating the conditions for buil-
TABLE 2. Main findings of the strategic technology transfer study “Technology Transfer Strategy and Possibilities for addressing Climate Change”
Area of analysis Conclusions
National context and
policy frameworks
Technology transfer for climate change has not been internalized by key sectors in the country. At the policy level, for example, the National Climate Change Strategy and the National Climate Change Action Plan (PANCC) barely mentioned technology transfer and its role in mitigating emissions and adapting to the effects of climate change.
The Center for Renewable Energies (CER) promotes and facilitates the development of the NCRE industry in Chile. It assesses existing technology requirements, which should be an ongoing reflexive activity that will allow these needs to be revised and adapted over time. These assessments should become the first step in the process of building road maps, followed by plans of action for low emission technologies. In addition, the National Energy Efficiency Program has the mission of consolidating energy efficiency in Chile in order to contribute to sustainable energy development in the country (CER, n.d.).
Strategies to
strengthen
technology transfer
in Chile
A technology transfer strategy for climate change in Chile should be based on a policy with long-term objectives that also considers importing technologies (equipment and knowledge) and building technological capacities internally, both to enable technologies to be adapted to local realities and to produce internationally competitive technologies.
Private resources must be leveraged and the private sector must be encouraged to become more involved in technology development.
Technology transfer measures and policies must be aligned with the country’s innovation strategies and systems.
In regard to
key aspects for
negotiating future
international
agreements
Suitable mechanisms must be created to build capacities throughout the chain of research, development, demonstration and launching. International collaboration is crucial, as it will provide access to tacit knowledge and other pertinent aspects that will promote capacity building for local innovation.
Promoting technology transfer will require addressing the issue of intellectual property. Nevertheless, access to technology is not enough to promote local innovation capacities; more emphasis must be placed on the transfer of tacit knowledge.
It is not acceptable that countries with disparate economic, social and environmental realities be required to implement the same measures.
Source: Poch Ambiental, 2009
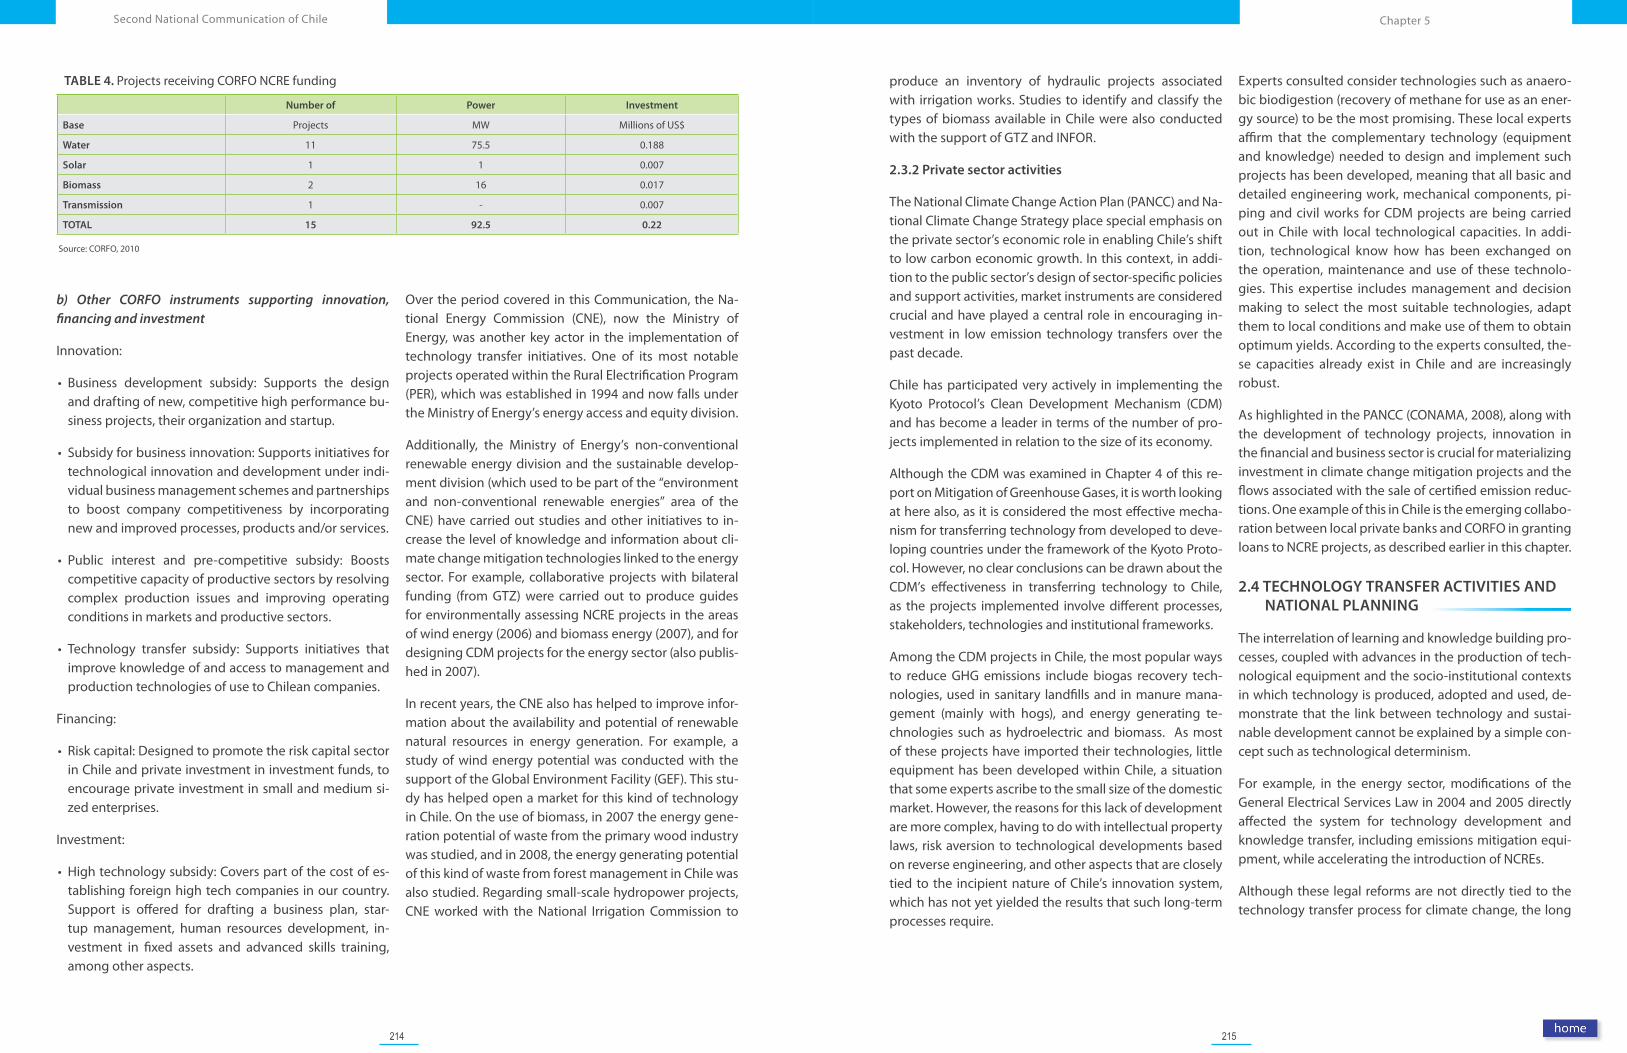
214 215
Chapter 5Second National Communication of Chile
produce an inventory of hydraulic projects associated with irrigation works. Studies to identify and classify the types of biomass available in Chile were also conducted with the support of GTZ and INFOR.
2.3.2 Private sector activities
The National Climate Change Action Plan (PANCC) and Na-tional Climate Change Strategy place special emphasis on the private sector’s economic role in enabling Chile’s shift to low carbon economic growth. In this context, in addi-tion to the public sector’s design of sector-specific policies and support activities, market instruments are considered crucial and have played a central role in encouraging in-vestment in low emission technology transfers over the past decade.
Chile has participated very actively in implementing the Kyoto Protocol’s Clean Development Mechanism (CDM) and has become a leader in terms of the number of pro-jects implemented in relation to the size of its economy.
Although the CDM was examined in Chapter 4 of this re-port on Mitigation of Greenhouse Gases, it is worth looking at here also, as it is considered the most effective mecha-nism for transferring technology from developed to deve-loping countries under the framework of the Kyoto Proto-col. However, no clear conclusions can be drawn about the CDM’s effectiveness in transferring technology to Chile, as the projects implemented involve different processes, stakeholders, technologies and institutional frameworks.
Among the CDM projects in Chile, the most popular ways to reduce GHG emissions include biogas recovery tech-nologies, used in sanitary landfills and in manure mana-gement (mainly with hogs), and energy generating te-chnologies such as hydroelectric and biomass. As most of these projects have imported their technologies, little equipment has been developed within Chile, a situation that some experts ascribe to the small size of the domestic market. However, the reasons for this lack of development are more complex, having to do with intellectual property laws, risk aversion to technological developments based on reverse engineering, and other aspects that are closely tied to the incipient nature of Chile’s innovation system, which has not yet yielded the results that such long-term processes require.
Experts consulted consider technologies such as anaero-bic biodigestion (recovery of methane for use as an ener-gy source) to be the most promising. These local experts affirm that the complementary technology (equipment and knowledge) needed to design and implement such projects has been developed, meaning that all basic and detailed engineering work, mechanical components, pi-ping and civil works for CDM projects are being carried out in Chile with local technological capacities. In addi-tion, technological know how has been exchanged on the operation, maintenance and use of these technolo-gies. This expertise includes management and decision making to select the most suitable technologies, adapt them to local conditions and make use of them to obtain optimum yields. According to the experts consulted, the-se capacities already exist in Chile and are increasingly robust.
As highlighted in the PANCC (CONAMA, 2008), along with the development of technology projects, innovation in the financial and business sector is crucial for materializing investment in climate change mitigation projects and the flows associated with the sale of certified emission reduc-tions. One example of this in Chile is the emerging collabo-ration between local private banks and CORFO in granting loans to NCRE projects, as described earlier in this chapter.
2.4 TECHNOLOGY TRANSFER ACTIVITIES AND NATIONAL PLANNING
The interrelation of learning and knowledge building pro-cesses, coupled with advances in the production of tech-nological equipment and the socio-institutional contexts in which technology is produced, adopted and used, de-monstrate that the link between technology and sustai-nable development cannot be explained by a simple con-cept such as technological determinism.
For example, in the energy sector, modifications of the General Electrical Services Law in 2004 and 2005 directly affected the system for technology development and knowledge transfer, including emissions mitigation equi-pment, while accelerating the introduction of NCREs.
Although these legal reforms are not directly tied to the technology transfer process for climate change, the long
TABLE 4. Projects receiving CORFO NCRE funding
Number of Power Investment
Base Projects MW Millions of US$
Water 11 75.5 0.188
Solar 1 1 0.007
Biomass 2 16 0.017
Transmission 1 - 0.007
TOTAL 15 92.5 0.22
Source: CORFO, 2010
b) Other CORFO instruments supporting innovation, financing and investment
Innovation:
• Business development subsidy: Supports the design and drafting of new, competitive high performance bu-siness projects, their organization and startup.
• Subsidy for business innovation: Supports initiatives for technological innovation and development under indi-vidual business management schemes and partnerships to boost company competitiveness by incorporating new and improved processes, products and/or services.
• Public interest and pre-competitive subsidy: Boosts competitive capacity of productive sectors by resolving complex production issues and improving operating conditions in markets and productive sectors.
• Technology transfer subsidy: Supports initiatives that improve knowledge of and access to management and production technologies of use to Chilean companies.
Financing:
• Risk capital: Designed to promote the risk capital sector in Chile and private investment in investment funds, to encourage private investment in small and medium si-zed enterprises.
Investment:
• High technology subsidy: Covers part of the cost of es-tablishing foreign high tech companies in our country. Support is offered for drafting a business plan, star-tup management, human resources development, in-vestment in fixed assets and advanced skills training, among other aspects.
Over the period covered in this Communication, the Na-tional Energy Commission (CNE), now the Ministry of Energy, was another key actor in the implementation of technology transfer initiatives. One of its most notable projects operated within the Rural Electrification Program (PER), which was established in 1994 and now falls under the Ministry of Energy’s energy access and equity division.
Additionally, the Ministry of Energy’s non-conventional renewable energy division and the sustainable develop-ment division (which used to be part of the “environment and non-conventional renewable energies” area of the CNE) have carried out studies and other initiatives to in-crease the level of knowledge and information about cli-mate change mitigation technologies linked to the energy sector. For example, collaborative projects with bilateral funding (from GTZ) were carried out to produce guides for environmentally assessing NCRE projects in the areas of wind energy (2006) and biomass energy (2007), and for designing CDM projects for the energy sector (also publis-hed in 2007).
In recent years, the CNE also has helped to improve infor-mation about the availability and potential of renewable natural resources in energy generation. For example, a study of wind energy potential was conducted with the support of the Global Environment Facility (GEF). This stu-dy has helped open a market for this kind of technology in Chile. On the use of biomass, in 2007 the energy gene-ration potential of waste from the primary wood industry was studied, and in 2008, the energy generating potential of this kind of waste from forest management in Chile was also studied. Regarding small-scale hydropower projects, CNE worked with the National Irrigation Commission to
216 217
Chapter 5Second National Communication of Chile
3.1.1 Monitoring of atmospheric weather and climate variables by the Chilean Meteorological Directorate
The Chilean Meteorological Directorate (DMC, www.me-teochile.cl) is a government institution under the purview of the General Civil Aviation Directorate. The entity obser-ves atmospheric weather and currently has a system of weather stations that monitors several key variables hourly through synoptic observation (atmospheric temperature and pressure, precipitation, wind direction and intensity, cloud cover and height, visibility and relative humidity). The DMC operates 25 weather stations according to inter-national standards, from Arica (in the North) to Base Frei in Chile’s Antarctic Territory. It also operates a network of five radiosondes that enable vertical atmospheric monitoring of variables such as temperature, pressure, humidity and wind. This network has been generating data since 1958, which makes it a pioneering example of systematic obser-vation among countries in the region. Thirty DMC stations are also part of the global atmospheric monitoring pro-gram operated by the World Meteorological Organization (WMO). The DMC also maintains an 18-station network for monitoring UV radiation in Chile.
The information generated has enabled the study and im-plementation of climate models in Chile, which has pro-duced important national information for climate change research. The DMC also records and interprets meteorolo-gical variables related to the El Niño/Southern Oscillation (ENSO) phenomenon.
3.1.2 Sea level monitoring, oceanographic observation and associated climate phenomena
The Chilean Navy’s Hydrographic and Oceanographic Ser-vice (SHOA) is another public institution that monitors va-riables linked to climate. SHOA’s main mission is to provide information and technical assistance to enable safe navi-gation in territorial waters, lakes, riverways, inland seas and on the high seas adjacent to Chile’s shoreline (www.shoa.cl). This service conducts regular monitoring of the sea level, water surface temperature, air temperature and atmospheric pressure through a series of coastal stations located throughout the Chilean mainland and offshore is-lands, as well as in the Chilean Antarctic Territory.
SHOA began collecting data around 1945, with automa-ted tide gauge. In 1999, with 17 stations operating in the country’s main ports and other strategic points, the agen-
cy began updating its instruments. Today it boasts a digi-tal instrument network that transmits real-time data via satellite from 24 localities and three self-contained digital stations (two in the Chilean Antarctic Territory and the third on Isla San Pedro in the Golfo de Penas). The tidal gauge network is currently being updated to improve the quantity and quality of monitoring provided, and by the end of 2011 the network was expected to include 33 ope-rative stations.
The data generated make it possible to conduct studies of climate variability. Currently, time series data is available on the order of decades for the port cities of Antofagasta, Valparaíso, Talcahuano, Puerto Montt and Punta Arenas. However, as the measurements of sea level were taken in port facilities, they provide values relative to tectonic pla-tes. Without geodesic measurements of the movements of these plates, it is impossible to uncouple these relative measurements to obtain conclusive results regarding sys-tematic variations in sea level (Shoa, 2010).
Since 1999, SHOA also has been monitoring the El Niño/Southern Oscillation (ENSO) phenomenon through ocea-nographic cruises. Initially, only the central coast adjacent to the port of Valparaíso was covered, but since 2002 the agency has conducted joint monitoring with Peru, and more recently, Ecuador, although in the latter case these measurement campaigns were not synchronized with those in Chile and Peru.
From 1999 to 2009, monitoring of ENSO was conducted twice per year in a research cruise in which data was co-llected on temperature, salinity and dissolved oxygen in the water column from 0 to 1,000 meters of depth, and up to 200 nautical miles offshore. The cruise covered the area from the far north of the country to the central Chilean coast.
3.1.3 Glacier monitoring
Chile’s General Water Directorate (DGA, www.dga.cl), part of the Ministry of Public Works, produced a National Glacier Strategy in 2009. The strategy envisions an imple-mentation horizon of 10 to 20 years and its lines of action seek to improve current knowledge about the condition of Chile’s glaciers, enable forecasts of glacial changes, and determine the potential impacts of those changes on Chi-lean society and the country’s natural heritage, especially in regard to the associated water resources.
term objectives they established have created an envi-ronment favorable to the development of technological knowledge and have enabled the transfer and adoption of low emission electricity generating technologies. The legislative changes alone reflect a learning process and a policy shift towards a more reflexive perspective, promo-ting greater socio-cultural and economic transformations that have enabled such advances as the rapid emergence of the wind energy industry in Chile.
In conclusion, while the integration of climate change—and technology transfer specifically—into Chile’s political arena has advanced in the past decade, there is still much to be done to install the issue at the top of the political agenda, to remove it from the strictly environmental
sphere and position it within the sphere of innovation and national social and economic development.
Knowledge transfer, the development of local abilities and technologies, and technology transfer from abroad all need to be strengthened. This can be accomplished by introducing new mechanisms and new roles for the indi-viduals and institutions involved in the process, by incor-porating new stakeholders, and by adapting legal, institu-tional and socioeconomic processes. Effective technology transfer depends on the success of other processes such as research, access to information, capacity building and public awareness, which are addressed in more detail in other sections of this Second National Communication.
3. SYSTEMATIC OBSERVATION OF CLIMATE VARIABILITY AND CLIMATE CHANGE
Systematic observation of the climate and its variability is carried out in Chile through monitoring of relevant me-teorological, atmospheric, oceanographic and terrestrial parameters. The process involves the use of modern equi-pment, automatic reporting mechanisms, and self-sustai-ning operating and processing systems for the informa-tion that is generated.
This section describes and analyzes programs operated in Chile for the systematic observation of climate variability and climate change, and the research activities associated with the decade-long study of climate variability in Chile, which was conducted from 2000 to 2010. Three major the-mes will be addressed:
• The status of national-level systematic climate obser-vation programs, with emphasis on the role of research organizations and associated government institutions.
• The participation and role of Chilean institutions in inter-national climate investigation and observation systems
• The gaps identified in the investigation and observa-tion of meteorological, atmospheric and oceanogra-phic phenomena, with special emphasis on areas that
require additional knowledge and information to in-crease understanding of the national and regional cli-mate system.
3.1 NATIONAL CLIMATE OBSERVATION PROGRAMS
Programs to systematically observe key climate varia-bles examine meteorological and oceanographic data of Chile’s different climate zones. These programs are usua-lly associated with agriculture, maritime and air transport and weather in general, rather than being focused on the systematic study of climate change itself.
Over the last decade these programs have provided the country with valuable information, statistical data obtai-ned from regular monitoring with modern technology and in time series that are useful for studying climate trends with horizons on the order of several decades.
These programs also make use of atmospheric weather monitoring conducted by the Chilean Meteorological Di-rectorate (DMC), oceanographic and glacier monitoring, and inter-institutional cooperation for establishing an agricultural weather network in Chile.
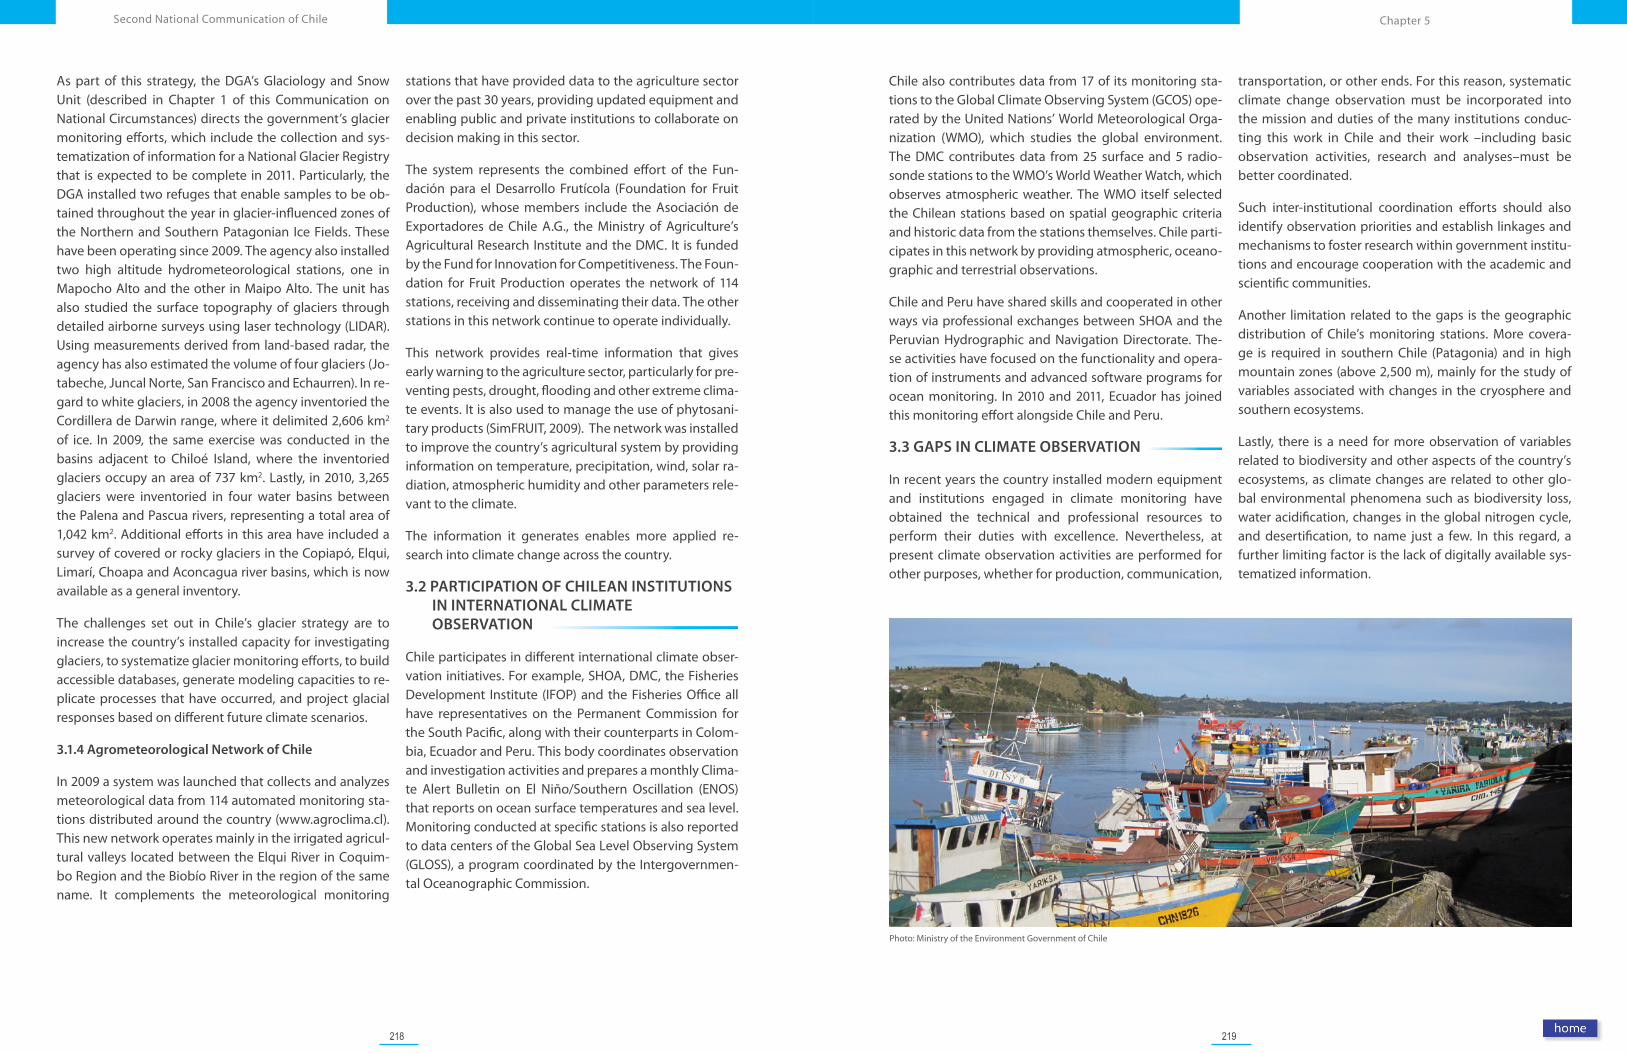
218 219
Chapter 5Second National Communication of Chile
Photo: Ministry of the Environment Government of Chile
Chile also contributes data from 17 of its monitoring sta-tions to the Global Climate Observing System (GCOS) ope-rated by the United Nations’ World Meteorological Orga-nization (WMO), which studies the global environment. The DMC contributes data from 25 surface and 5 radio-sonde stations to the WMO’s World Weather Watch, which observes atmospheric weather. The WMO itself selected the Chilean stations based on spatial geographic criteria and historic data from the stations themselves. Chile parti-cipates in this network by providing atmospheric, oceano-graphic and terrestrial observations.
Chile and Peru have shared skills and cooperated in other ways via professional exchanges between SHOA and the Peruvian Hydrographic and Navigation Directorate. The-se activities have focused on the functionality and opera-tion of instruments and advanced software programs for ocean monitoring. In 2010 and 2011, Ecuador has joined this monitoring effort alongside Chile and Peru.
3.3 GAPS IN CLIMATE OBSERVATION
In recent years the country installed modern equipment and institutions engaged in climate monitoring have obtained the technical and professional resources to perform their duties with excellence. Nevertheless, at present climate observation activities are performed for other purposes, whether for production, communication,
transportation, or other ends. For this reason, systematic climate change observation must be incorporated into the mission and duties of the many institutions conduc-ting this work in Chile and their work –including basic observation activities, research and analyses–must be better coordinated.
Such inter-institutional coordination efforts should also identify observation priorities and establish linkages and mechanisms to foster research within government institu-tions and encourage cooperation with the academic and scientific communities.
Another limitation related to the gaps is the geographic distribution of Chile’s monitoring stations. More covera-ge is required in southern Chile (Patagonia) and in high mountain zones (above 2,500 m), mainly for the study of variables associated with changes in the cryosphere and southern ecosystems.
Lastly, there is a need for more observation of variables related to biodiversity and other aspects of the country’s ecosystems, as climate changes are related to other glo-bal environmental phenomena such as biodiversity loss, water acidification, changes in the global nitrogen cycle, and desertification, to name just a few. In this regard, a further limiting factor is the lack of digitally available sys-tematized information.
As part of this strategy, the DGA’s Glaciology and Snow Unit (described in Chapter 1 of this Communication on National Circumstances) directs the government’s glacier monitoring efforts, which include the collection and sys-tematization of information for a National Glacier Registry that is expected to be complete in 2011. Particularly, the DGA installed two refuges that enable samples to be ob-tained throughout the year in glacier-influenced zones of the Northern and Southern Patagonian Ice Fields. These have been operating since 2009. The agency also installed two high altitude hydrometeorological stations, one in Mapocho Alto and the other in Maipo Alto. The unit has also studied the surface topography of glaciers through detailed airborne surveys using laser technology (LIDAR). Using measurements derived from land-based radar, the agency has also estimated the volume of four glaciers (Jo-tabeche, Juncal Norte, San Francisco and Echaurren). In re-gard to white glaciers, in 2008 the agency inventoried the Cordillera de Darwin range, where it delimited 2,606 km2 of ice. In 2009, the same exercise was conducted in the basins adjacent to Chiloé Island, where the inventoried glaciers occupy an area of 737 km2. Lastly, in 2010, 3,265 glaciers were inventoried in four water basins between the Palena and Pascua rivers, representing a total area of 1,042 km2. Additional efforts in this area have included a survey of covered or rocky glaciers in the Copiapó, Elqui, Limarí, Choapa and Aconcagua river basins, which is now available as a general inventory.
The challenges set out in Chile’s glacier strategy are to increase the country’s installed capacity for investigating glaciers, to systematize glacier monitoring efforts, to build accessible databases, generate modeling capacities to re-plicate processes that have occurred, and project glacial responses based on different future climate scenarios.
3.1.4 Agrometeorological Network of Chile
In 2009 a system was launched that collects and analyzes meteorological data from 114 automated monitoring sta-tions distributed around the country (www.agroclima.cl). This new network operates mainly in the irrigated agricul-tural valleys located between the Elqui River in Coquim-bo Region and the Biobío River in the region of the same name. It complements the meteorological monitoring
stations that have provided data to the agriculture sector over the past 30 years, providing updated equipment and enabling public and private institutions to collaborate on decision making in this sector.
The system represents the combined effort of the Fun-dación para el Desarrollo Frutícola (Foundation for Fruit Production), whose members include the Asociación de Exportadores de Chile A.G., the Ministry of Agriculture’s Agricultural Research Institute and the DMC. It is funded by the Fund for Innovation for Competitiveness. The Foun-dation for Fruit Production operates the network of 114 stations, receiving and disseminating their data. The other stations in this network continue to operate individually.
This network provides real-time information that gives early warning to the agriculture sector, particularly for pre-venting pests, drought, flooding and other extreme clima-te events. It is also used to manage the use of phytosani-tary products (SimFRUIT, 2009). The network was installed to improve the country’s agricultural system by providing information on temperature, precipitation, wind, solar ra-diation, atmospheric humidity and other parameters rele-vant to the climate.
The information it generates enables more applied re-search into climate change across the country.
3.2 PARTICIPATION OF CHILEAN INSTITUTIONS IN INTERNATIONAL CLIMATE OBSERVATION
Chile participates in different international climate obser-vation initiatives. For example, SHOA, DMC, the Fisheries Development Institute (IFOP) and the Fisheries Office all have representatives on the Permanent Commission for the South Pacific, along with their counterparts in Colom-bia, Ecuador and Peru. This body coordinates observation and investigation activities and prepares a monthly Clima-te Alert Bulletin on El Niño/Southern Oscillation (ENOS) that reports on ocean surface temperatures and sea level. Monitoring conducted at specific stations is also reported to data centers of the Global Sea Level Observing System (GLOSS), a program coordinated by the Intergovernmen-tal Oceanographic Commission.
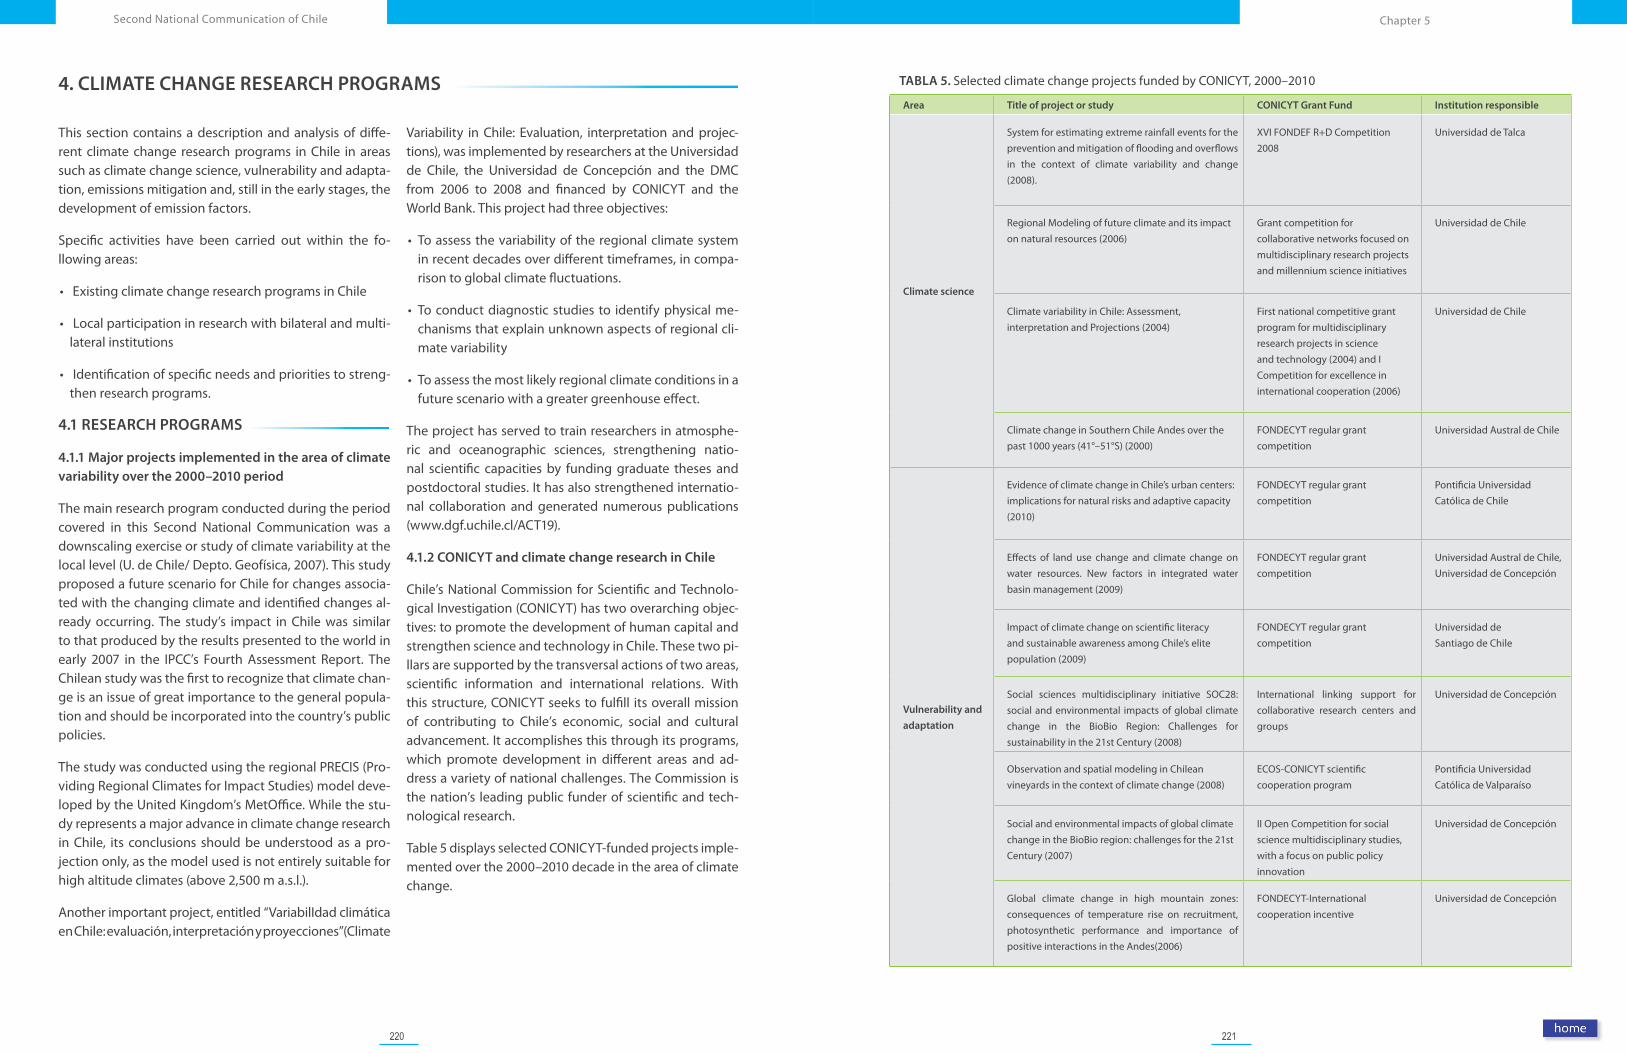
220 221
Chapter 5Second National Communication of Chile
TABLA 5. Selected climate change projects funded by CONICYT, 2000–2010
Area Title of project or study CONICYT Grant Fund Institution responsible
Climate science
System for estimating extreme rainfall events for the prevention and mitigation of flooding and overflows in the context of climate variability and change (2008).
XVI FONDEF R+D Competition2008
Universidad de Talca
Regional Modeling of future climate and its impact on natural resources (2006)
Grant competition for collaborative networks focused on multidisciplinary research projects and millennium science initiatives
Universidad de Chile
Climate variability in Chile: Assessment, interpretation and Projections (2004)
First national competitive grant program for multidisciplinary research projects in science and technology (2004) and I Competition for excellence in international cooperation (2006)
Universidad de Chile
Climate change in Southern Chile Andes over the past 1000 years (41°–51°S) (2000)
FONDECYT regular grant competition
Universidad Austral de Chile
Vulnerability and
adaptation
Evidence of climate change in Chile’s urban centers: implications for natural risks and adaptive capacity (2010)
FONDECYT regular grant competition
Pontificia Universidad Católica de Chile
Effects of land use change and climate change on water resources. New factors in integrated water basin management (2009)
FONDECYT regular grant competition
Universidad Austral de Chile,Universidad de Concepción
Impact of climate change on scientific literacy and sustainable awareness among Chile’s elite population (2009)
FONDECYT regular grant competition
Universidad deSantiago de Chile
Social sciences multidisciplinary initiative SOC28: social and environmental impacts of global climate change in the BioBio Region: Challenges for sustainability in the 21st Century (2008)
International linking support for collaborative research centers and groups
Universidad de Concepción
Observation and spatial modeling in Chilean vineyards in the context of climate change (2008)
ECOS-CONICYT scientific cooperation program
Pontificia Universidad Católica de Valparaíso
Social and environmental impacts of global climate change in the BioBio region: challenges for the 21st Century (2007)
II Open Competition for social science multidisciplinary studies, with a focus on public policy innovation
Universidad de Concepción
Global climate change in high mountain zones: consequences of temperature rise on recruitment, photosynthetic performance and importance of positive interactions in the Andes(2006)
FONDECYT-International cooperation incentive
Universidad de Concepción
4. CLIMATE CHANGE RESEARCH PROGRAMS
This section contains a description and analysis of diffe-rent climate change research programs in Chile in areas such as climate change science, vulnerability and adapta-tion, emissions mitigation and, still in the early stages, the development of emission factors.
Specific activities have been carried out within the fo-llowing areas:
• Existing climate change research programs in Chile
• Local participation in research with bilateral and multi-lateral institutions
• Identification of specific needs and priorities to streng-then research programs.
4.1 RESEARCH PROGRAMS
4.1.1 Major projects implemented in the area of climate variability over the 2000–2010 period
The main research program conducted during the period covered in this Second National Communication was a downscaling exercise or study of climate variability at the local level (U. de Chile/ Depto. Geofísica, 2007). This study proposed a future scenario for Chile for changes associa-ted with the changing climate and identified changes al-ready occurring. The study’s impact in Chile was similar to that produced by the results presented to the world in early 2007 in the IPCC’s Fourth Assessment Report. The Chilean study was the first to recognize that climate chan-ge is an issue of great importance to the general popula-tion and should be incorporated into the country’s public policies.
The study was conducted using the regional PRECIS (Pro-viding Regional Climates for Impact Studies) model deve-loped by the United Kingdom’s MetOffice. While the stu-dy represents a major advance in climate change research in Chile, its conclusions should be understood as a pro-jection only, as the model used is not entirely suitable for high altitude climates (above 2,500 m a.s.l.).
Another important project, entitled “VariabilIdad climática en Chile: evaluación, interpretación y proyecciones”(Climate
Variability in Chile: Evaluation, interpretation and projec-tions), was implemented by researchers at the Universidad de Chile, the Universidad de Concepción and the DMC from 2006 to 2008 and financed by CONICYT and the World Bank. This project had three objectives:
• To assess the variability of the regional climate system in recent decades over different timeframes, in compa-rison to global climate fluctuations.
• To conduct diagnostic studies to identify physical me-chanisms that explain unknown aspects of regional cli-mate variability
• To assess the most likely regional climate conditions in a future scenario with a greater greenhouse effect.
The project has served to train researchers in atmosphe-ric and oceanographic sciences, strengthening natio-nal scientific capacities by funding graduate theses and postdoctoral studies. It has also strengthened internatio-nal collaboration and generated numerous publications (www.dgf.uchile.cl/ACT19).
4.1.2 CONICYT and climate change research in Chile
Chile’s National Commission for Scientific and Technolo-gical Investigation (CONICYT) has two overarching objec-tives: to promote the development of human capital and strengthen science and technology in Chile. These two pi-llars are supported by the transversal actions of two areas, scientific information and international relations. With this structure, CONICYT seeks to fulfill its overall mission of contributing to Chile’s economic, social and cultural advancement. It accomplishes this through its programs, which promote development in different areas and ad-dress a variety of national challenges. The Commission is the nation’s leading public funder of scientific and tech-nological research.
Table 5 displays selected CONICYT-funded projects imple-mented over the 2000–2010 decade in the area of climate change.
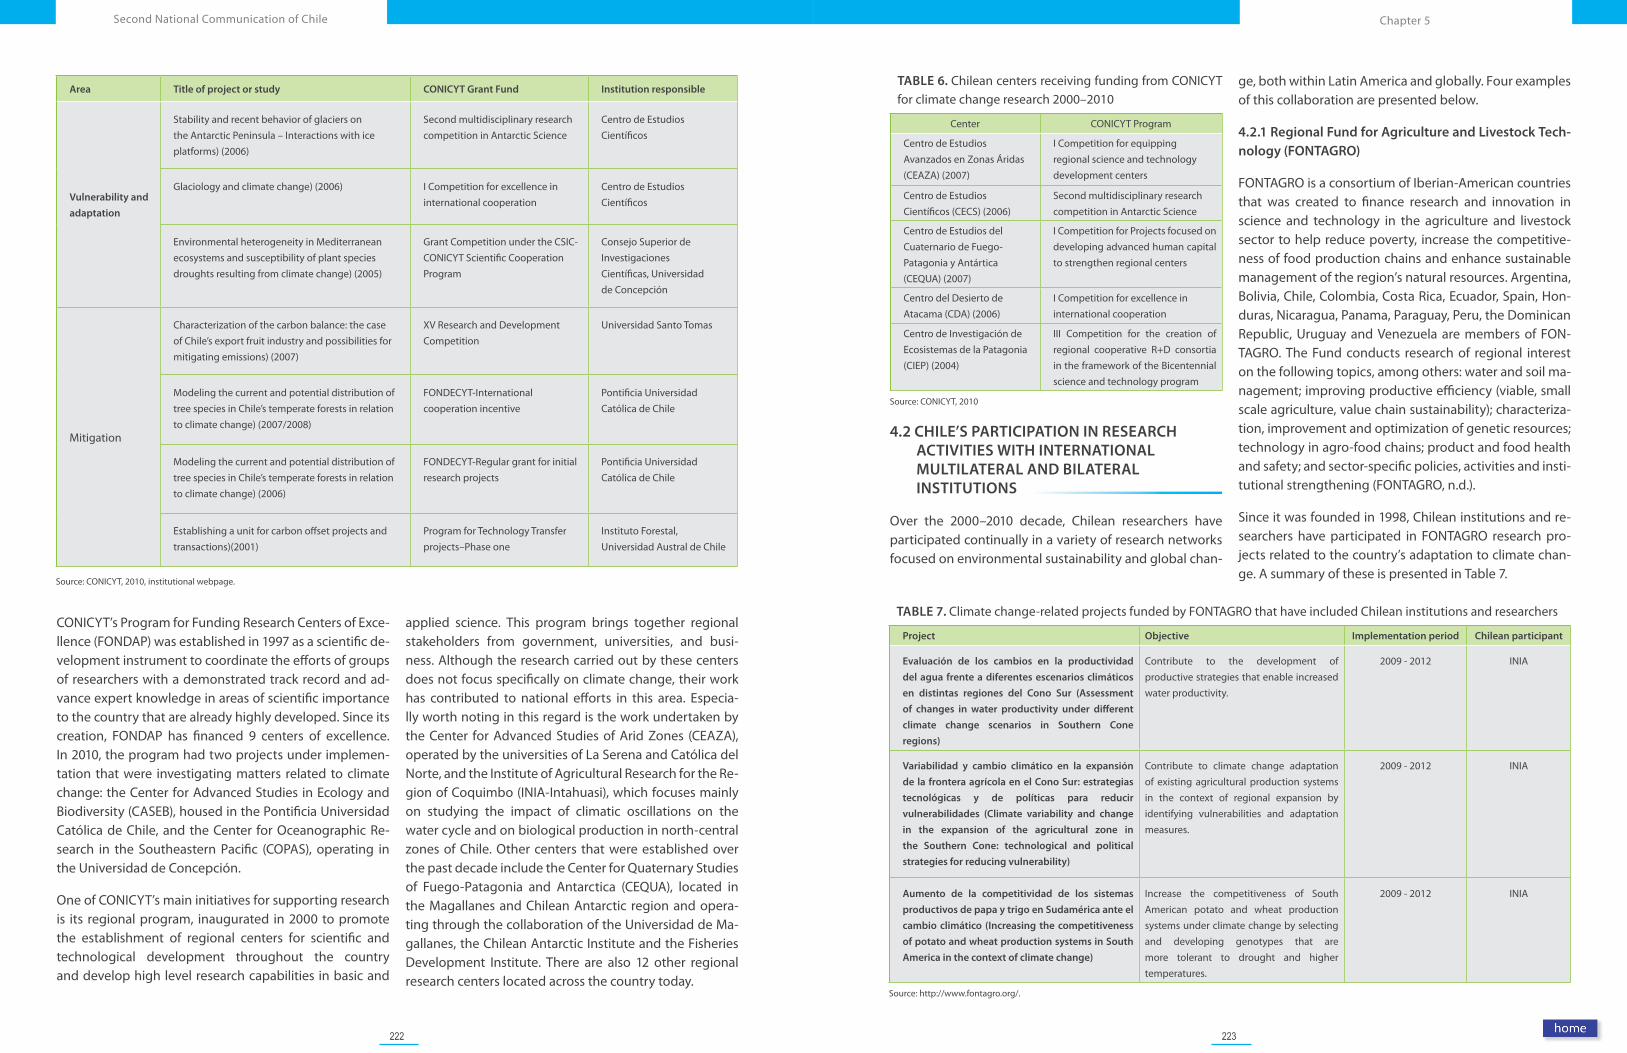
222 223
Chapter 5Second National Communication of Chile
TABLE 6. Chilean centers receiving funding from CONICYT for climate change research 2000–2010
Center CONICYT Program
Centro de Estudios Avanzados en Zonas Áridas (CEAZA) (2007)
I Competition for equipping regional science and technology development centers
Centro de Estudios Científicos (CECS) (2006)
Second multidisciplinary research competition in Antarctic Science
Centro de Estudios del Cuaternario de Fuego-Patagonia y Antártica (CEQUA) (2007)
I Competition for Projects focused on developing advanced human capital to strengthen regional centers
Centro del Desierto de Atacama (CDA) (2006)
I Competition for excellence in international cooperation
Centro de Investigación de Ecosistemas de la Patagonia (CIEP) (2004)
III Competition for the creation of regional cooperative R+D consortia in the framework of the Bicentennial science and technology program
Source: CONICYT, 2010
4.2 CHILE’S PARTICIPATION IN RESEARCH ACTIVITIES WITH INTERNATIONAL MULTILATERAL AND BILATERAL INSTITUTIONS
Over the 2000–2010 decade, Chilean researchers have participated continually in a variety of research networks focused on environmental sustainability and global chan-
ge, both within Latin America and globally. Four examples of this collaboration are presented below.
4.2.1 Regional Fund for Agriculture and Livestock Tech-nology (FONTAGRO)
FONTAGRO is a consortium of Iberian-American countries that was created to finance research and innovation in science and technology in the agriculture and livestock sector to help reduce poverty, increase the competitive-ness of food production chains and enhance sustainable management of the region’s natural resources. Argentina, Bolivia, Chile, Colombia, Costa Rica, Ecuador, Spain, Hon-duras, Nicaragua, Panama, Paraguay, Peru, the Dominican Republic, Uruguay and Venezuela are members of FON-TAGRO. The Fund conducts research of regional interest on the following topics, among others: water and soil ma-nagement; improving productive efficiency (viable, small scale agriculture, value chain sustainability); characteriza-tion, improvement and optimization of genetic resources; technology in agro-food chains; product and food health and safety; and sector-specific policies, activities and insti-tutional strengthening (FONTAGRO, n.d.).
Since it was founded in 1998, Chilean institutions and re-searchers have participated in FONTAGRO research pro-jects related to the country’s adaptation to climate chan-ge. A summary of these is presented in Table 7.
TABLE 7. Climate change-related projects funded by FONTAGRO that have included Chilean institutions and researchers
Project Objective Implementation period Chilean participant
Evaluación de los cambios en la productividad
del agua frente a diferentes escenarios climáticos
en distintas regiones del Cono Sur (Assessment
of changes in water productivity under different
climate change scenarios in Southern Cone
regions)
Contribute to the development of productive strategies that enable increased water productivity.
2009 - 2012 INIA
Variabilidad y cambio climático en la expansión
de la frontera agrícola en el Cono Sur: estrategias
tecnológicas y de políticas para reducir
vulnerabilidades (Climate variability and change
in the expansion of the agricultural zone in
the Southern Cone: technological and political
strategies for reducing vulnerability)
Contribute to climate change adaptation of existing agricultural production systems in the context of regional expansion by identifying vulnerabilities and adaptation measures.
2009 - 2012 INIA
Aumento de la competitividad de los sistemas
productivos de papa y trigo en Sudamérica ante el
cambio climático (Increasing the competitiveness
of potato and wheat production systems in South
America in the context of climate change)
Increase the competitiveness of South American potato and wheat production systems under climate change by selecting and developing genotypes that are more tolerant to drought and higher temperatures.
2009 - 2012 INIA
Source: http://www.fontagro.org/.
Area Title of project or study CONICYT Grant Fund Institution responsible
Vulnerability and
adaptation
Stability and recent behavior of glaciers on the Antarctic Peninsula – Interactions with ice platforms) (2006)
Second multidisciplinary research competition in Antarctic Science
Centro de Estudios Científicos
Glaciology and climate change) (2006) I Competition for excellence in international cooperation
Centro de Estudios Científicos
Environmental heterogeneity in Mediterranean ecosystems and susceptibility of plant species droughts resulting from climate change) (2005)
Grant Competition under the CSIC- CONICYT Scientific Cooperation Program
Consejo Superior de InvestigacionesCientíficas, Universidadde Concepción
Mitigation
Characterization of the carbon balance: the case of Chile’s export fruit industry and possibilities for mitigating emissions) (2007)
XV Research and Development Competition
Universidad Santo Tomas
Modeling the current and potential distribution of tree species in Chile’s temperate forests in relation to climate change) (2007/2008)
FONDECYT-International cooperation incentive
Pontificia Universidad Católica de Chile
Modeling the current and potential distribution of tree species in Chile’s temperate forests in relation to climate change) (2006)
FONDECYT-Regular grant for initial research projects
Pontificia Universidad Católica de Chile
Establishing a unit for carbon offset projects and transactions)(2001)
Program for Technology Transfer projects–Phase one
Instituto Forestal,Universidad Austral de Chile
Source: CONICYT, 2010, institutional webpage.
CONICYT’s Program for Funding Research Centers of Exce-llence (FONDAP) was established in 1997 as a scientific de-velopment instrument to coordinate the efforts of groups of researchers with a demonstrated track record and ad-vance expert knowledge in areas of scientific importance to the country that are already highly developed. Since its creation, FONDAP has financed 9 centers of excellence. In 2010, the program had two projects under implemen-tation that were investigating matters related to climate change: the Center for Advanced Studies in Ecology and Biodiversity (CASEB), housed in the Pontificia Universidad Católica de Chile, and the Center for Oceanographic Re-search in the Southeastern Pacific (COPAS), operating in the Universidad de Concepción.
One of CONICYT’s main initiatives for supporting research is its regional program, inaugurated in 2000 to promote the establishment of regional centers for scientific and technological development throughout the country and develop high level research capabilities in basic and
applied science. This program brings together regional stakeholders from government, universities, and busi-ness. Although the research carried out by these centers does not focus specifically on climate change, their work has contributed to national efforts in this area. Especia-lly worth noting in this regard is the work undertaken by the Center for Advanced Studies of Arid Zones (CEAZA), operated by the universities of La Serena and Católica del Norte, and the Institute of Agricultural Research for the Re-gion of Coquimbo (INIA-Intahuasi), which focuses mainly on studying the impact of climatic oscillations on the water cycle and on biological production in north-central zones of Chile. Other centers that were established over the past decade include the Center for Quaternary Studies of Fuego-Patagonia and Antarctica (CEQUA), located in the Magallanes and Chilean Antarctic region and opera-ting through the collaboration of the Universidad de Ma-gallanes, the Chilean Antarctic Institute and the Fisheries Development Institute. There are also 12 other regional research centers located across the country today.
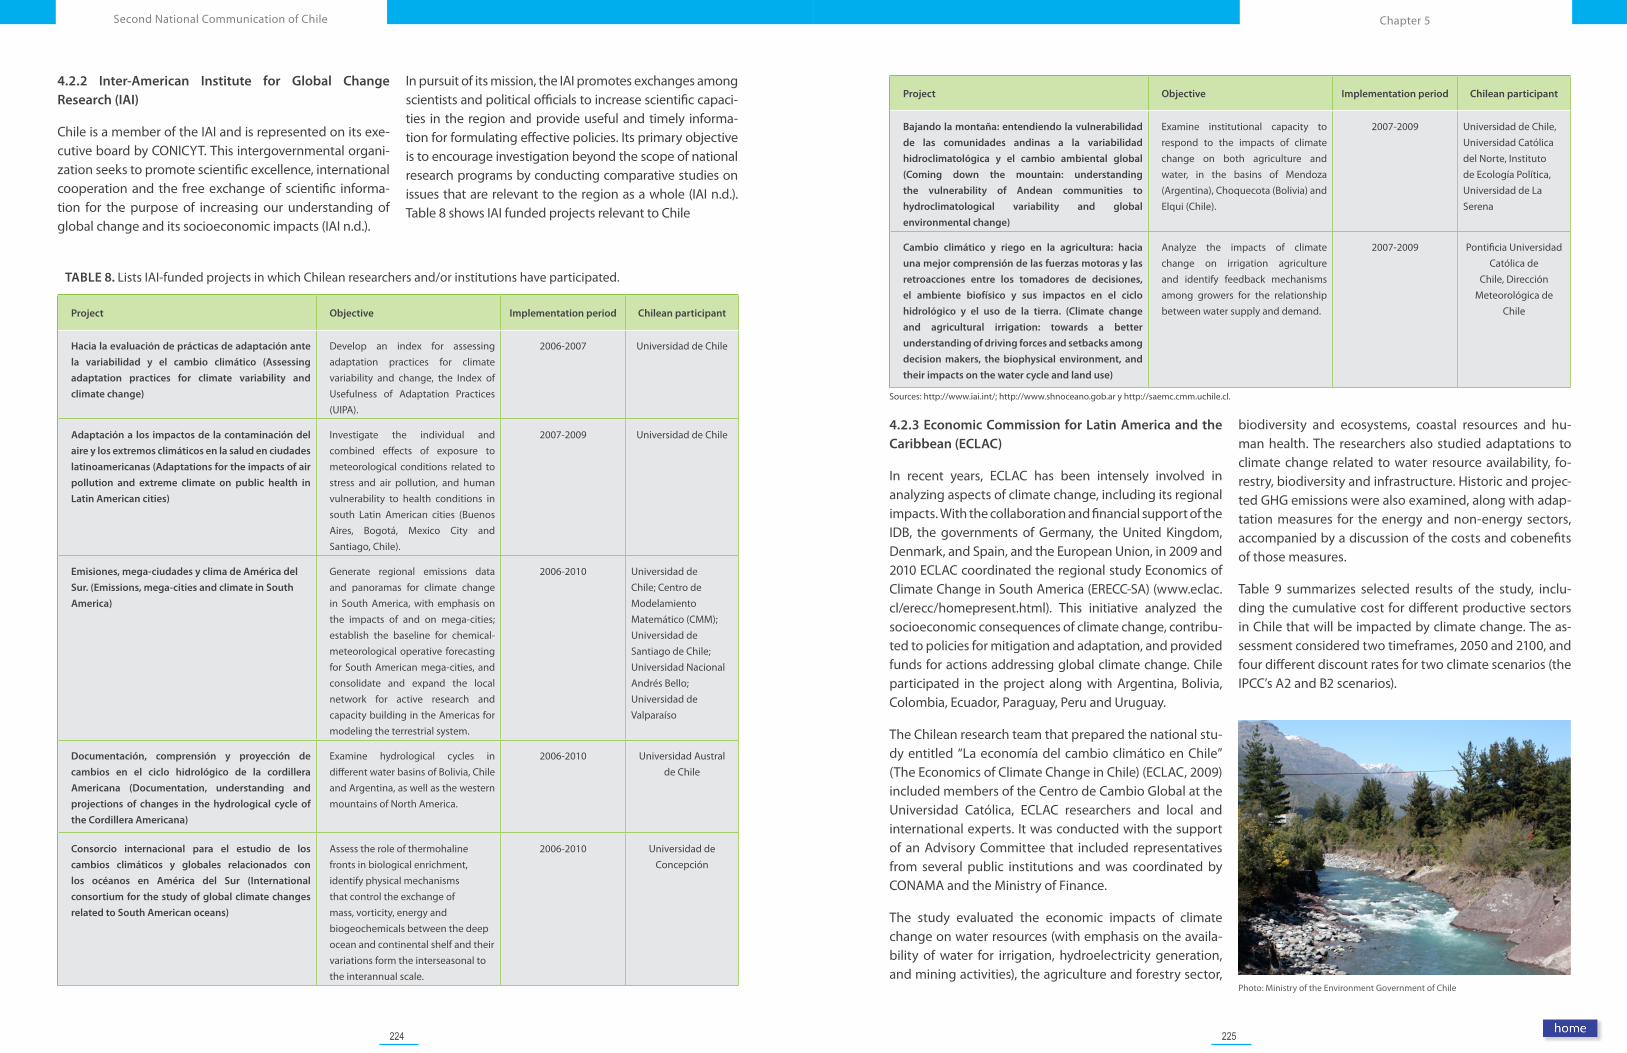
224 225
Chapter 5Second National Communication of Chile
4.2.3 Economic Commission for Latin America and the Caribbean (ECLAC)
In recent years, ECLAC has been intensely involved in analyzing aspects of climate change, including its regional impacts. With the collaboration and financial support of the IDB, the governments of Germany, the United Kingdom, Denmark, and Spain, and the European Union, in 2009 and 2010 ECLAC coordinated the regional study Economics of Climate Change in South America (ERECC-SA) (www.eclac.cl/erecc/homepresent.html). This initiative analyzed the socioeconomic consequences of climate change, contribu-ted to policies for mitigation and adaptation, and provided funds for actions addressing global climate change. Chile participated in the project along with Argentina, Bolivia, Colombia, Ecuador, Paraguay, Peru and Uruguay.
The Chilean research team that prepared the national stu-dy entitled “La economía del cambio climático en Chile” (The Economics of Climate Change in Chile) (ECLAC, 2009) included members of the Centro de Cambio Global at the Universidad Católica, ECLAC researchers and local and international experts. It was conducted with the support of an Advisory Committee that included representatives from several public institutions and was coordinated by CONAMA and the Ministry of Finance.
The study evaluated the economic impacts of climate change on water resources (with emphasis on the availa-bility of water for irrigation, hydroelectricity generation, and mining activities), the agriculture and forestry sector,
biodiversity and ecosystems, coastal resources and hu-man health. The researchers also studied adaptations to climate change related to water resource availability, fo-restry, biodiversity and infrastructure. Historic and projec-ted GHG emissions were also examined, along with adap-tation measures for the energy and non-energy sectors, accompanied by a discussion of the costs and cobenefits of those measures.
Table 9 summarizes selected results of the study, inclu-ding the cumulative cost for different productive sectors in Chile that will be impacted by climate change. The as-sessment considered two timeframes, 2050 and 2100, and four different discount rates for two climate scenarios (the IPCC’s A2 and B2 scenarios).
Photo: Ministry of the Environment Government of Chile
Project Objective Implementation period Chilean participant
Bajando la montaña: entendiendo la vulnerabilidad
de las comunidades andinas a la variabilidad
hidroclimatológica y el cambio ambiental global
(Coming down the mountain: understanding
the vulnerability of Andean communities to
hydroclimatological variability and global
environmental change)
Examine institutional capacity to respond to the impacts of climate change on both agriculture and water, in the basins of Mendoza (Argentina), Choquecota (Bolivia) and Elqui (Chile).
2007-2009 Universidad de Chile, Universidad Católica del Norte, Instituto de Ecología Política, Universidad de La Serena
Cambio climático y riego en la agricultura: hacia
una mejor comprensión de las fuerzas motoras y las
retroacciones entre los tomadores de decisiones,
el ambiente biofísico y sus impactos en el ciclo
hidrológico y el uso de la tierra. (Climate change
and agricultural irrigation: towards a better
understanding of driving forces and setbacks among
decision makers, the biophysical environment, and
their impacts on the water cycle and land use)
Analyze the impacts of climate change on irrigation agriculture and identify feedback mechanisms among growers for the relationship between water supply and demand.
2007-2009 Pontificia Universidad Católica de
Chile, Dirección Meteorológica de
Chile
Sources: http://www.iai.int/; http://www.shnoceano.gob.ar y http://saemc.cmm.uchile.cl.
4.2.2 Inter-American Institute for Global Change Research (IAI)
Chile is a member of the IAI and is represented on its exe-cutive board by CONICYT. This intergovernmental organi-zation seeks to promote scientific excellence, international cooperation and the free exchange of scientific informa-tion for the purpose of increasing our understanding of global change and its socioeconomic impacts (IAI n.d.).
In pursuit of its mission, the IAI promotes exchanges among scientists and political officials to increase scientific capaci-ties in the region and provide useful and timely informa-tion for formulating effective policies. Its primary objective is to encourage investigation beyond the scope of national research programs by conducting comparative studies on issues that are relevant to the region as a whole (IAI n.d.). Table 8 shows IAI funded projects relevant to Chile
TABLE 8. Lists IAI-funded projects in which Chilean researchers and/or institutions have participated.
Project Objective Implementation period Chilean participant
Hacia la evaluación de prácticas de adaptación ante
la variabilidad y el cambio climático (Assessing
adaptation practices for climate variability and
climate change)
Develop an index for assessing adaptation practices for climate variability and change, the Index of Usefulness of Adaptation Practices (UIPA).
2006-2007 Universidad de Chile
Adaptación a los impactos de la contaminación del
aire y los extremos climáticos en la salud en ciudades
latinoamericanas (Adaptations for the impacts of air
pollution and extreme climate on public health in
Latin American cities)
Investigate the individual and combined effects of exposure to meteorological conditions related to stress and air pollution, and human vulnerability to health conditions in south Latin American cities (Buenos Aires, Bogotá, Mexico City and Santiago, Chile).
2007-2009 Universidad de Chile
Emisiones, mega-ciudades y clima de América del
Sur. (Emissions, mega-cities and climate in South
America)
Generate regional emissions data and panoramas for climate change in South America, with emphasis on the impacts of and on mega-cities; establish the baseline for chemical-meteorological operative forecasting for South American mega-cities, and consolidate and expand the local network for active research and capacity building in the Americas for modeling the terrestrial system.
2006-2010 Universidad de Chile; Centro de Modelamiento Matemático (CMM); Universidad de Santiago de Chile; Universidad Nacional Andrés Bello; Universidad de Valparaíso
Documentación, comprensión y proyección de
cambios en el ciclo hidrológico de la cordillera
Americana (Documentation, understanding and
projections of changes in the hydrological cycle of
the Cordillera Americana)
Examine hydrological cycles in different water basins of Bolivia, Chile and Argentina, as well as the western mountains of North America.
2006-2010 Universidad Austral de Chile
Consorcio internacional para el estudio de los
cambios climáticos y globales relacionados con
los océanos en América del Sur (International
consortium for the study of global climate changes
related to South American oceans)
Assess the role of thermohaline fronts in biological enrichment, identify physical mechanisms that control the exchange of mass, vorticity, energy and biogeochemicals between the deep ocean and continental shelf and their variations form the interseasonal to the interannual scale.
2006-2010 Universidad de Concepción
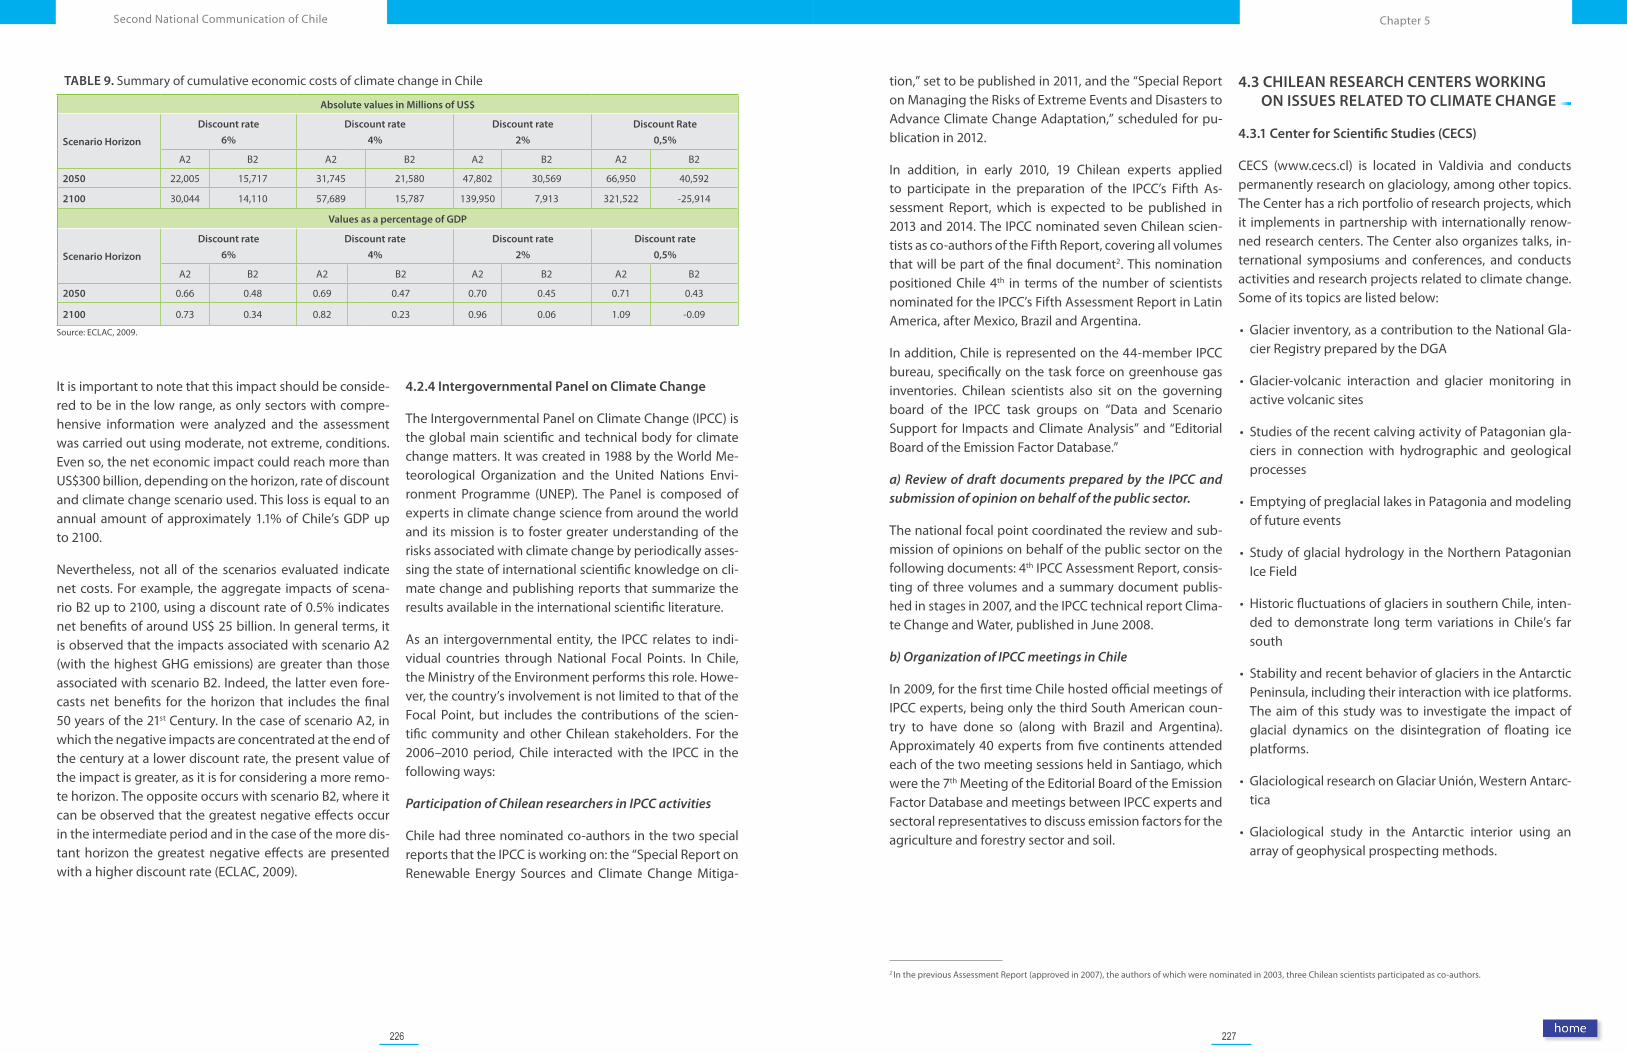
226 227
Chapter 5Second National Communication of Chile
tion,” set to be published in 2011, and the “Special Report on Managing the Risks of Extreme Events and Disasters to Advance Climate Change Adaptation,” scheduled for pu-blication in 2012.
In addition, in early 2010, 19 Chilean experts applied to participate in the preparation of the IPCC’s Fifth As-sessment Report, which is expected to be published in 2013 and 2014. The IPCC nominated seven Chilean scien-tists as co-authors of the Fifth Report, covering all volumes that will be part of the final document2. This nomination positioned Chile 4th in terms of the number of scientists nominated for the IPCC’s Fifth Assessment Report in Latin America, after Mexico, Brazil and Argentina.
In addition, Chile is represented on the 44-member IPCC bureau, specifically on the task force on greenhouse gas inventories. Chilean scientists also sit on the governing board of the IPCC task groups on “Data and Scenario Support for Impacts and Climate Analysis” and “Editorial Board of the Emission Factor Database.”
a) Review of draft documents prepared by the IPCC and submission of opinion on behalf of the public sector.
The national focal point coordinated the review and sub-mission of opinions on behalf of the public sector on the following documents: 4th IPCC Assessment Report, consis-ting of three volumes and a summary document publis-hed in stages in 2007, and the IPCC technical report Clima-te Change and Water, published in June 2008.
b) Organization of IPCC meetings in Chile
In 2009, for the first time Chile hosted official meetings of IPCC experts, being only the third South American coun-try to have done so (along with Brazil and Argentina). Approximately 40 experts from five continents attended each of the two meeting sessions held in Santiago, which were the 7th Meeting of the Editorial Board of the Emission Factor Database and meetings between IPCC experts and sectoral representatives to discuss emission factors for the agriculture and forestry sector and soil.
4.3 CHILEAN RESEARCH CENTERS WORKING ON ISSUES RELATED TO CLIMATE CHANGE
4.3.1 Center for Scientific Studies (CECS)
CECS (www.cecs.cl) is located in Valdivia and conducts permanently research on glaciology, among other topics. The Center has a rich portfolio of research projects, which it implements in partnership with internationally renow-ned research centers. The Center also organizes talks, in-ternational symposiums and conferences, and conducts activities and research projects related to climate change. Some of its topics are listed below:
• Glacier inventory, as a contribution to the National Gla-cier Registry prepared by the DGA
• Glacier-volcanic interaction and glacier monitoring in active volcanic sites
• Studies of the recent calving activity of Patagonian gla-ciers in connection with hydrographic and geological processes
• Emptying of preglacial lakes in Patagonia and modeling of future events
• Study of glacial hydrology in the Northern Patagonian Ice Field
• Historic fluctuations of glaciers in southern Chile, inten-ded to demonstrate long term variations in Chile’s far south
• Stability and recent behavior of glaciers in the Antarctic Peninsula, including their interaction with ice platforms. The aim of this study was to investigate the impact of glacial dynamics on the disintegration of floating ice platforms.
• Glaciological research on Glaciar Unión, Western Antarc-tica
• Glaciological study in the Antarctic interior using an array of geophysical prospecting methods.
2 In the previous Assessment Report (approved in 2007), the authors of which were nominated in 2003, three Chilean scientists participated as co-authors.
TABLE 9. Summary of cumulative economic costs of climate change in Chile
Absolute values in Millions of US$
Scenario Horizon
Discount rate
6%
Discount rate
4%
Discount rate
2%
Discount Rate
0,5%
A2 B2 A2 B2 A2 B2 A2 B2
2050 22,005 15,717 31,745 21,580 47,802 30,569 66,950 40,592
2100 30,044 14,110 57,689 15,787 139,950 7,913 321,522 -25,914
Values as a percentage of GDP
Scenario Horizon
Discount rate
6%
Discount rate
4%
Discount rate
2%
Discount rate
0,5%
A2 B2 A2 B2 A2 B2 A2 B2
2050 0.66 0.48 0.69 0.47 0.70 0.45 0.71 0.43
2100 0.73 0.34 0.82 0.23 0.96 0.06 1.09 -0.09
Source: ECLAC, 2009.
It is important to note that this impact should be conside-red to be in the low range, as only sectors with compre-hensive information were analyzed and the assessment was carried out using moderate, not extreme, conditions. Even so, the net economic impact could reach more than US$300 billion, depending on the horizon, rate of discount and climate change scenario used. This loss is equal to an annual amount of approximately 1.1% of Chile’s GDP up to 2100.
Nevertheless, not all of the scenarios evaluated indicate net costs. For example, the aggregate impacts of scena-rio B2 up to 2100, using a discount rate of 0.5% indicates net benefits of around US$ 25 billion. In general terms, it is observed that the impacts associated with scenario A2 (with the highest GHG emissions) are greater than those associated with scenario B2. Indeed, the latter even fore-casts net benefits for the horizon that includes the final 50 years of the 21st Century. In the case of scenario A2, in which the negative impacts are concentrated at the end of the century at a lower discount rate, the present value of the impact is greater, as it is for considering a more remo-te horizon. The opposite occurs with scenario B2, where it can be observed that the greatest negative effects occur in the intermediate period and in the case of the more dis-tant horizon the greatest negative effects are presented with a higher discount rate (ECLAC, 2009).
4.2.4 Intergovernmental Panel on Climate Change
The Intergovernmental Panel on Climate Change (IPCC) is the global main scientific and technical body for climate change matters. It was created in 1988 by the World Me-teorological Organization and the United Nations Envi-ronment Programme (UNEP). The Panel is composed of experts in climate change science from around the world and its mission is to foster greater understanding of the risks associated with climate change by periodically asses-sing the state of international scientific knowledge on cli-mate change and publishing reports that summarize the results available in the international scientific literature.
As an intergovernmental entity, the IPCC relates to indi-vidual countries through National Focal Points. In Chile, the Ministry of the Environment performs this role. Howe-ver, the country’s involvement is not limited to that of the Focal Point, but includes the contributions of the scien-tific community and other Chilean stakeholders. For the 2006–2010 period, Chile interacted with the IPCC in the following ways:
Participation of Chilean researchers in IPCC activities
Chile had three nominated co-authors in the two special reports that the IPCC is working on: the “Special Report on Renewable Energy Sources and Climate Change Mitiga-
228 229
Chapter 5Second National Communication of Chile
Chile in sectors such as agriculture and forestry and on the availability of water and energy. Although valuable, this new information is not itself sufficient for making comple-tely informed decisions; more knowledge in these areas and others such as biodiversity, biomass, and ecosystems most vulnerable to climate change is therefore needed.
It is also important to build adequate knowledge about climate forcing on arid ecosystems, the cryosphere and an array of representative ecosystems of major importance to global climate stabilization. Another key area of study is oceanographic studies, especially the stabilizing effect of the South Pacific on global environmental changes.
In the area of adaptation to climate change, special men-tion should be made of the role that water in all forms (lakes, rivers, snow and ice, groundwater, etc.) plays in sus-taining life and productive activities in 21st Century Chi-le (Reyes, 2010). In this regard, adaptation does not only refer to biophysical systems, but also to the interaction of the social and economic system with the surrounding environment. Particularly, adaptation to climate change related to water requires more in depth study. The short length and sharp drop in altitude (between the mountains and the sea) of many of Chile’s water basins makes them particularly vulnerable to climate change.
5. EDUCATION, TRAINING AND AWARENESS RAISING FOR CLIMATE CHANGE
This section describes and analyses recent advances in education, training and awareness raising focused on cli-mate change. It highlights changes over the past decade (2000–2010) in regard to public participation and public access to information on climate change, as well as the expected outcomes of public education and awareness raising programs. The following four specific issues are addressed:
• The institutional framework and initiatives designed to promote public education and awareness.
• Initiatives and programs implemented or planned for primary, secondary and higher education.
• Educational, training and awareness raising campaigns already carried out.
• A compilation of climate change activities undertaken from 2000 to 2009, obtained from the 1st National Sur-vey on Climate Change (CC&D, 2009).
5.1 LEGAL AND INSTITUTIONAL FRAMEWORK FOR PROMOTING CLIMATE CHANGE EDUCATION AND AWARENESS IN CHILE
Over the 2000 to 2010 period, CONAMA (now the Ministry of the Environment) was responsible for promoting and, in many cases, implementing environmental education pro-grams and fostering an environmentally aware culture in Chile. While these efforts were more broad-based and not exclusively focused on climate change education, they are worth mentioning as they constitute the cornerstones of public action in this area.
The National System for Environmental Certification of Educational Establishments (SNCAE) includes comple-mentary lines of action for strengthening environmental education and environmental protection and care for building networks for local environmental management. This program is coordinated by the Ministry of the Envi-ronment, the Ministry of Education, the National Forestry Corporation, the Chilean Association of Municipalities, the General Water Directorate, the Council for Sustainable De-velopment and the United Nations Educational, Scientific and Cultural Organization (UNESCO).
The SNCAE supports actions that promote a sustainable culture and foster environmental values and conservation among children and youth, with the aim of improving the quality of education in Chile. It also promotes education for sustainable development in Chile and contributes to cultural change by encouraging environmentally respon-sible behavior. The system also establishes environmental standards that measure the presence of environmental concerns in three areas of education: curricula, educatio-nal administration and relations with surroundings.
The second initiative in the institutional framework that is worth noting is the recently developed National Edu-cational Policy for Sustainable Development, which sets out principles, objectives and strategic lines of action to promote active citizenship and Chile’s sustainable develo-pment through education.
4.3.2 Chilean Antarctic Institute (INACH)
The INACH promotes high quality Antarctic research in Chile by coordinating different scientific and technologi-cal projects through competitive grants. One of these pro-jects is focused on global warming and climate evolution and the impact of global warming in Antarctica.
The Institute’s current projects can be classified according to their funding source:
• PBC & PIA programs: Study of glaciers on the Antarctic Peninsula and the effect of UV radiation on endemic species.
• INACH field projects: Investigation of fine aerosols; flora and warming; climate change biomarkers; colobanthus and global change.
• Special projects: Tephrochronology.
• INACH undergraduate and graduate theses on the effect of climate change on sea birds.
• International cooperation activities, including research on the Antarctic and South American climate and study with airborne sensors.
4.3.3 Center for Global Change, Pontificia Universidad Católica
The Center for Global Change (Centro de Cambio Global UC) is the first research center operating from within a Chi-lean educational establishment that focuses exclusively on analyzing global change issues in the country. It was crea-ted in 2008 through an alliance of four of the university’s faculties—agronomy and forestry engineering; biological sciences; engineering; and economic and administrati-ve sciences—and concentrates on basic and applied re-search on biophysical and human dimensions of global change. The Center has conducted studies on aspects of GHG emissions mitigation in the energy and non-energy sectors, climate change vulnerability and adaptation stu-dies on Chile and the region, and economic assessments of the impacts of climate change. The Center’s projects have been financed by Innova Chile and CONICYT, among other agencies.
4.3.4 Universidad de Concepción
Several groups within the Universidad de Concepción conduct research on issues related to climate change and its effects. These include the Center for Oceanographic Research in the South-East Pacific (Centro COPAS), hou-sed in the Faculty of Natural and Oceanographic Sciences; the Department of Geophysics in the Faculty of Physical and Mathematical Sciences; the Center for Environmental Science, EULA-Chile; the Faculty of Social Sciences; and the Research Center on Patagonian Ecosystems (CIEP). These different units conduct pure and applied scientific research that focuses on the national and local impacts on key resources that are associated with climate variability and climate change. The Universidad de Concepción has prepared a detailed report that also serves as a compen-dium of the institution’s collective efforts (U. de Concep-ción, 2011).
4.4 STRENGTHENING RESEARCH PROGRAMS: SPECIFIC NEEDS AND PRIORITIES
Chile faces the challenge of building permanent mecha-nisms with stable financing to conduct research and fa-cilitate technological developments pertinent to climate change. The role that CONICYT can play in leveraging additional sources of funding at the national level should also be highlighted.
In regard to mitigation, specific technologies must be studied and adapted to local conditions. A case in point is that of agricultural burning and the enormous poten-tial for using agricultural waste to generate energy and/or as fertilizer. To advance in this direction, it is necessary to inform local agricultural stakeholders about the scien-tific and technological research and build relationships between producers and technology research and deve-lopment centers. Another priority research area is plant species; specifically, this means developing suitable varie-ties and conducting greenhouse studies on adaptation to temperature changes, CO2 concentration, changes in pre-cipitation regimes, and other effects of climate change.
At the same time, there is a need for more prospective stu-dies on climate variability and the vulnerability of popula-tions and ecosystems. In recent years studies have been carried out on the expected impacts of climate change in
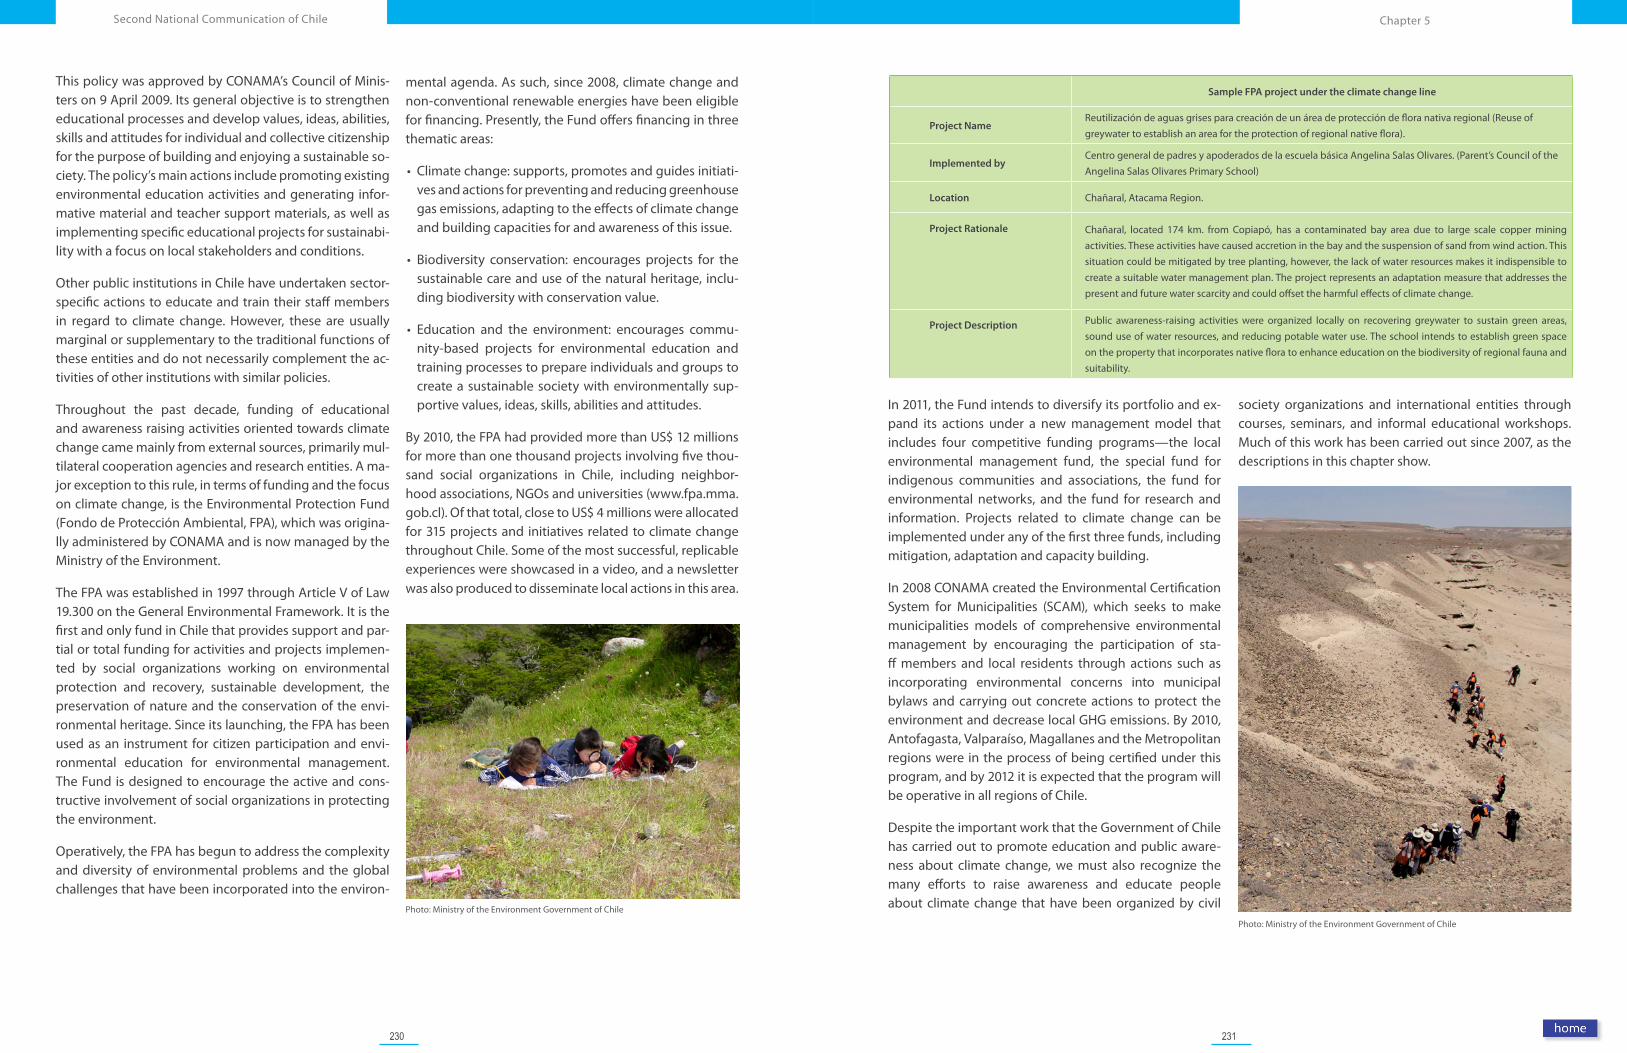
230 231
Chapter 5Second National Communication of Chile
Photo: Ministry of the Environment Government of Chile
Sample FPA project under the climate change line
Project Name Reutilización de aguas grises para creación de un área de protección de flora nativa regional (Reuse of greywater to establish an area for the protection of regional native flora).
Implemented byCentro general de padres y apoderados de la escuela básica Angelina Salas Olivares. (Parent’s Council of the Angelina Salas Olivares Primary School)
Location Chañaral, Atacama Region.
Project Rationale Chañaral, located 174 km. from Copiapó, has a contaminated bay area due to large scale copper mining activities. These activities have caused accretion in the bay and the suspension of sand from wind action. This situation could be mitigated by tree planting, however, the lack of water resources makes it indispensible to create a suitable water management plan. The project represents an adaptation measure that addresses the present and future water scarcity and could offset the harmful effects of climate change.
Project Description Public awareness-raising activities were organized locally on recovering greywater to sustain green areas, sound use of water resources, and reducing potable water use. The school intends to establish green space on the property that incorporates native flora to enhance education on the biodiversity of regional fauna and suitability.
In 2011, the Fund intends to diversify its portfolio and ex-pand its actions under a new management model that includes four competitive funding programs—the local environmental management fund, the special fund for indigenous communities and associations, the fund for environmental networks, and the fund for research and information. Projects related to climate change can be implemented under any of the first three funds, including mitigation, adaptation and capacity building.
In 2008 CONAMA created the Environmental Certification System for Municipalities (SCAM), which seeks to make municipalities models of comprehensive environmental management by encouraging the participation of sta-ff members and local residents through actions such as incorporating environmental concerns into municipal bylaws and carrying out concrete actions to protect the environment and decrease local GHG emissions. By 2010, Antofagasta, Valparaíso, Magallanes and the Metropolitan regions were in the process of being certified under this program, and by 2012 it is expected that the program will be operative in all regions of Chile.
Despite the important work that the Government of Chile has carried out to promote education and public aware-ness about climate change, we must also recognize the many efforts to raise awareness and educate people about climate change that have been organized by civil
society organizations and international entities through courses, seminars, and informal educational workshops. Much of this work has been carried out since 2007, as the descriptions in this chapter show.
Photo: Ministry of the Environment Government of Chile
This policy was approved by CONAMA’s Council of Minis-ters on 9 April 2009. Its general objective is to strengthen educational processes and develop values, ideas, abilities, skills and attitudes for individual and collective citizenship for the purpose of building and enjoying a sustainable so-ciety. The policy’s main actions include promoting existing environmental education activities and generating infor-mative material and teacher support materials, as well as implementing specific educational projects for sustainabi-lity with a focus on local stakeholders and conditions.
Other public institutions in Chile have undertaken sector-specific actions to educate and train their staff members in regard to climate change. However, these are usually marginal or supplementary to the traditional functions of these entities and do not necessarily complement the ac-tivities of other institutions with similar policies.
Throughout the past decade, funding of educational and awareness raising activities oriented towards climate change came mainly from external sources, primarily mul-tilateral cooperation agencies and research entities. A ma-jor exception to this rule, in terms of funding and the focus on climate change, is the Environmental Protection Fund (Fondo de Protección Ambiental, FPA), which was origina-lly administered by CONAMA and is now managed by the Ministry of the Environment.
The FPA was established in 1997 through Article V of Law 19.300 on the General Environmental Framework. It is the first and only fund in Chile that provides support and par-tial or total funding for activities and projects implemen-ted by social organizations working on environmental protection and recovery, sustainable development, the preservation of nature and the conservation of the envi-ronmental heritage. Since its launching, the FPA has been used as an instrument for citizen participation and envi-ronmental education for environmental management. The Fund is designed to encourage the active and cons-tructive involvement of social organizations in protecting the environment.
Operatively, the FPA has begun to address the complexity and diversity of environmental problems and the global challenges that have been incorporated into the environ-
mental agenda. As such, since 2008, climate change and non-conventional renewable energies have been eligible for financing. Presently, the Fund offers financing in three thematic areas:
• Climate change: supports, promotes and guides initiati-ves and actions for preventing and reducing greenhouse gas emissions, adapting to the effects of climate change and building capacities for and awareness of this issue.
• Biodiversity conservation: encourages projects for the sustainable care and use of the natural heritage, inclu-ding biodiversity with conservation value.
• Education and the environment: encourages commu-nity-based projects for environmental education and training processes to prepare individuals and groups to create a sustainable society with environmentally sup-portive values, ideas, skills, abilities and attitudes.
By 2010, the FPA had provided more than US$ 12 millions for more than one thousand projects involving five thou-sand social organizations in Chile, including neighbor-hood associations, NGOs and universities (www.fpa.mma.gob.cl). Of that total, close to US$ 4 millions were allocated for 315 projects and initiatives related to climate change throughout Chile. Some of the most successful, replicable experiences were showcased in a video, and a newsletter was also produced to disseminate local actions in this area.
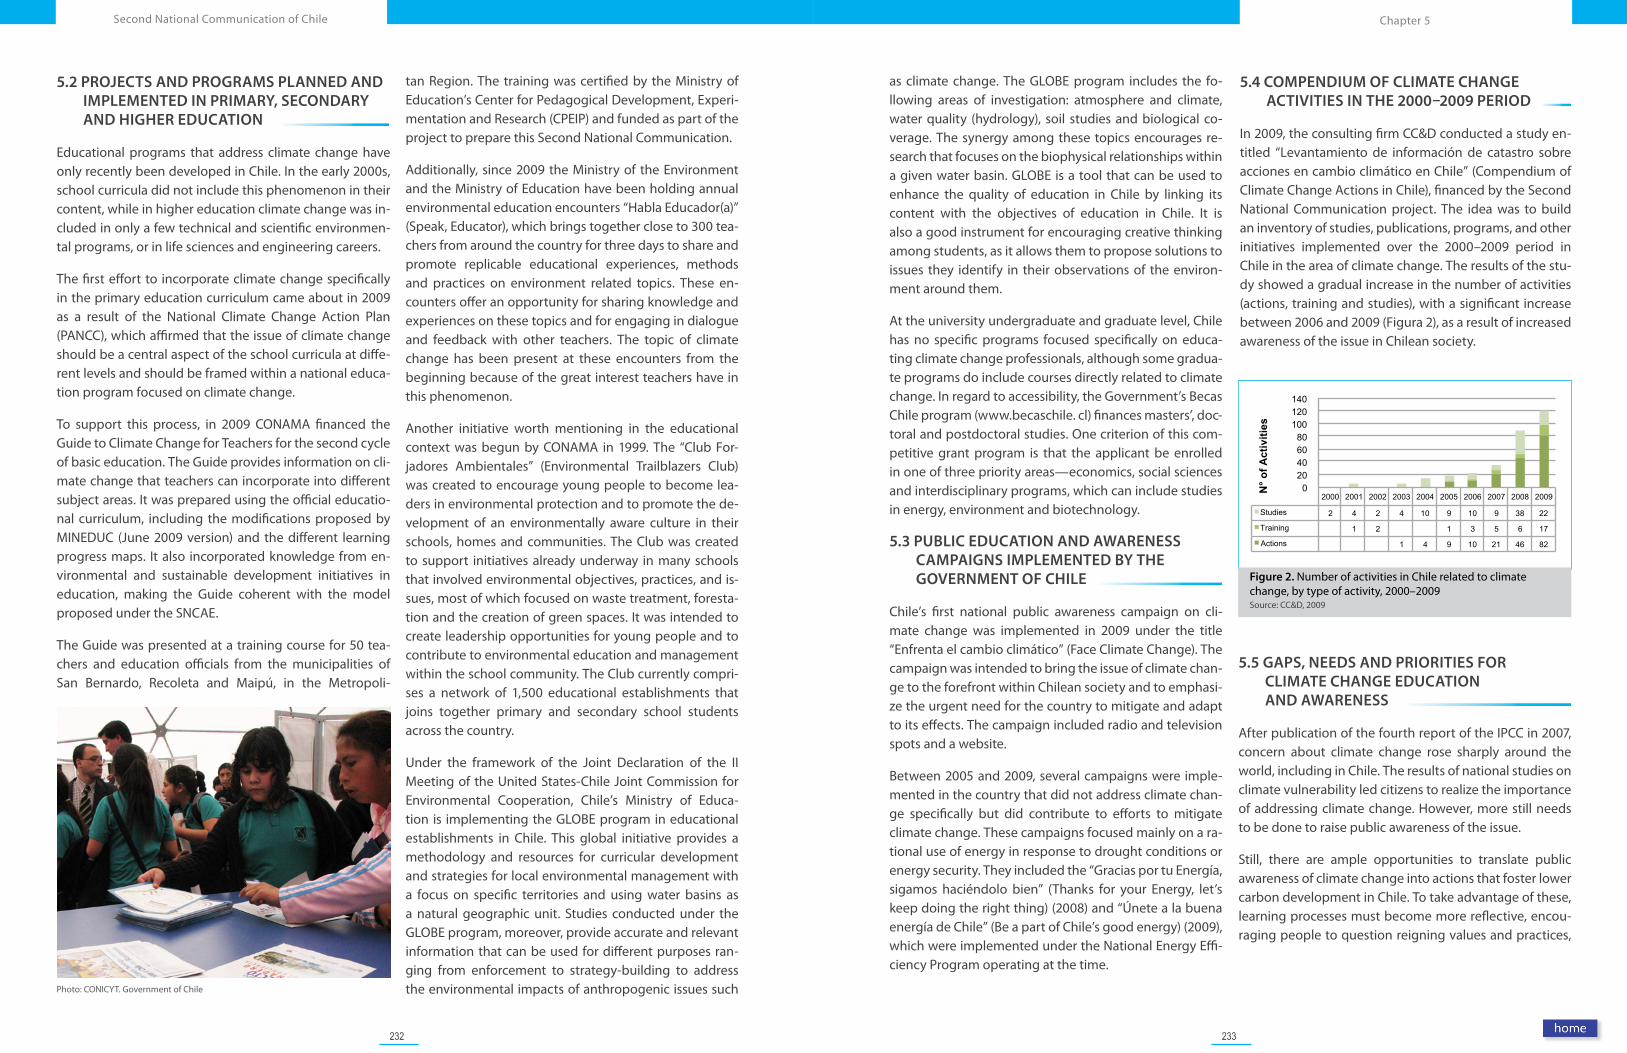
232 233
Chapter 5Second National Communication of Chile
as climate change. The GLOBE program includes the fo-llowing areas of investigation: atmosphere and climate, water quality (hydrology), soil studies and biological co-verage. The synergy among these topics encourages re-search that focuses on the biophysical relationships within a given water basin. GLOBE is a tool that can be used to enhance the quality of education in Chile by linking its content with the objectives of education in Chile. It is also a good instrument for encouraging creative thinking among students, as it allows them to propose solutions to issues they identify in their observations of the environ-ment around them.
At the university undergraduate and graduate level, Chile has no specific programs focused specifically on educa-ting climate change professionals, although some gradua-te programs do include courses directly related to climate change. In regard to accessibility, the Government’s Becas Chile program (www.becaschile. cl) finances masters’, doc-toral and postdoctoral studies. One criterion of this com-petitive grant program is that the applicant be enrolled in one of three priority areas—economics, social sciences and interdisciplinary programs, which can include studies in energy, environment and biotechnology.
5.3 PUBLIC EDUCATION AND AWARENESS CAMPAIGNS IMPLEMENTED BY THE GOVERNMENT OF CHILE
Chile’s first national public awareness campaign on cli-mate change was implemented in 2009 under the title “Enfrenta el cambio climático” (Face Climate Change). The campaign was intended to bring the issue of climate chan-ge to the forefront within Chilean society and to emphasi-ze the urgent need for the country to mitigate and adapt to its effects. The campaign included radio and television spots and a website.
Between 2005 and 2009, several campaigns were imple-mented in the country that did not address climate chan-ge specifically but did contribute to efforts to mitigate climate change. These campaigns focused mainly on a ra-tional use of energy in response to drought conditions or energy security. They included the “Gracias por tu Energía, sigamos haciéndolo bien” (Thanks for your Energy, let’s keep doing the right thing) (2008) and “Únete a la buena energía de Chile” (Be a part of Chile’s good energy) (2009), which were implemented under the National Energy Effi-ciency Program operating at the time.
5.5 GAPS, NEEDS AND PRIORITIES FOR CLIMATE CHANGE EDUCATION AND AWARENESS
After publication of the fourth report of the IPCC in 2007, concern about climate change rose sharply around the world, including in Chile. The results of national studies on climate vulnerability led citizens to realize the importance of addressing climate change. However, more still needs to be done to raise public awareness of the issue.
Still, there are ample opportunities to translate public awareness of climate change into actions that foster lower carbon development in Chile. To take advantage of these, learning processes must become more reflective, encou-raging people to question reigning values and practices,
5.4 COMPENDIUM OF CLIMATE CHANGE ACTIVITIES IN THE 2000–2009 PERIOD
In 2009, the consulting firm CC&D conducted a study en-titled “Levantamiento de información de catastro sobre acciones en cambio climático en Chile” (Compendium of Climate Change Actions in Chile), financed by the Second National Communication project. The idea was to build an inventory of studies, publications, programs, and other initiatives implemented over the 2000–2009 period in Chile in the area of climate change. The results of the stu-dy showed a gradual increase in the number of activities (actions, training and studies), with a significant increase between 2006 and 2009 (Figura 2), as a result of increased awareness of the issue in Chilean society.
Figure 2. Number of activities in Chile related to climate change, by type of activity, 2000–2009Source: CC&D, 2009
2000 2001 2002 2003 2004 2005 2006 2007 2008 2009
Studies 2 4 2 4 10 9 10 9 38 22
Training 1 2 1 3 5 6 17
Actions 1 4 9 10 21 46 82
0 20 40 60 80
100 120 140
N° o
f Act
iviti
es
5.2 PROJECTS AND PROGRAMS PLANNED AND IMPLEMENTED IN PRIMARY, SECONDARY AND HIGHER EDUCATION
Educational programs that address climate change have only recently been developed in Chile. In the early 2000s, school curricula did not include this phenomenon in their content, while in higher education climate change was in-cluded in only a few technical and scientific environmen-tal programs, or in life sciences and engineering careers.
The first effort to incorporate climate change specifically in the primary education curriculum came about in 2009 as a result of the National Climate Change Action Plan (PANCC), which affirmed that the issue of climate change should be a central aspect of the school curricula at diffe-rent levels and should be framed within a national educa-tion program focused on climate change.
To support this process, in 2009 CONAMA financed the Guide to Climate Change for Teachers for the second cycle of basic education. The Guide provides information on cli-mate change that teachers can incorporate into different subject areas. It was prepared using the official educatio-nal curriculum, including the modifications proposed by MINEDUC (June 2009 version) and the different learning progress maps. It also incorporated knowledge from en-vironmental and sustainable development initiatives in education, making the Guide coherent with the model proposed under the SNCAE.
The Guide was presented at a training course for 50 tea-chers and education officials from the municipalities of San Bernardo, Recoleta and Maipú, in the Metropoli-
Photo: CONICYT. Government of Chile
tan Region. The training was certified by the Ministry of Education’s Center for Pedagogical Development, Experi-mentation and Research (CPEIP) and funded as part of the project to prepare this Second National Communication.
Additionally, since 2009 the Ministry of the Environment and the Ministry of Education have been holding annual environmental education encounters “Habla Educador(a)” (Speak, Educator), which brings together close to 300 tea-chers from around the country for three days to share and promote replicable educational experiences, methods and practices on environment related topics. These en-counters offer an opportunity for sharing knowledge and experiences on these topics and for engaging in dialogue and feedback with other teachers. The topic of climate change has been present at these encounters from the beginning because of the great interest teachers have in this phenomenon.
Another initiative worth mentioning in the educational context was begun by CONAMA in 1999. The “Club For-jadores Ambientales” (Environmental Trailblazers Club) was created to encourage young people to become lea-ders in environmental protection and to promote the de-velopment of an environmentally aware culture in their schools, homes and communities. The Club was created to support initiatives already underway in many schools that involved environmental objectives, practices, and is-sues, most of which focused on waste treatment, foresta-tion and the creation of green spaces. It was intended to create leadership opportunities for young people and to contribute to environmental education and management within the school community. The Club currently compri-ses a network of 1,500 educational establishments that joins together primary and secondary school students across the country.
Under the framework of the Joint Declaration of the II Meeting of the United States-Chile Joint Commission for Environmental Cooperation, Chile’s Ministry of Educa-tion is implementing the GLOBE program in educational establishments in Chile. This global initiative provides a methodology and resources for curricular development and strategies for local environmental management with a focus on specific territories and using water basins as a natural geographic unit. Studies conducted under the GLOBE program, moreover, provide accurate and relevant information that can be used for different purposes ran-ging from enforcement to strategy-building to address the environmental impacts of anthropogenic issues such
234 235
Chapter 5Second National Communication of Chile
in forest lands and ecosystems and carbon footprint ma-nagement; and the relationships between large cities and global change.
The second initiative is funded primarily by Chile’s priva-te sector and involved the establishment of the Chilean chapter of the Corporate Leaders’ Group on Climate Chan-ge (CLG-Chile), based in the Faculty of Economics and Bu-siness at the Universidad de Chile. CLG-Chile, which works in collaboration with the British-Chilean Chamber of Com-merce, was established in 2009 on the occasion of the visit of His Royal Highness Prince Charles to Chile. The Group is part of a network of similar centers around the world that is coordinated by Cambridge University. More than ten Chilean companies are members of the Group, which aims to “foster the formulation of policies and actions to suc-cessfully address the challenge of climate change while enabling Chilean companies to take advantage of the bu-siness opportunities that emerge as a result of moving to a lower carbon economy” (www.clgchile.cl/conozca.html).
Lastly, in 2009 the Chilean Chamber of Production and Commerce financed a study that was commissioned to the Center for Innovation in Energy at the Universidad Adolfo Ibáñez. The study examined the potential impact on economic growth in the country resulting from mea-sures to reduce greenhouse gas emissions. The measures examined include the introduction of a carbon tax and the recognition of the market value of tradable emission permits (considering Chile as a price taker). The study found that reducing emissions would come at a conside-rable economic cost to the country and that this impact would be distributed unevenly across different sectors of the Chilean economy.
6.3 CAPACITY BUILDING IN NON-GOVERNMENTAL ORGANIZATIONS (NGOS)
Civil society organizations have been crucial for develo-ping a culture of environmental sustainability in Chile. Despite a lack of regular funding and formal, effective mechanisms for civil society participation in policyma-king for climate change, some Chilean NGOs have worked systematically on the issue and have become respected
sources of information, reflection and debate on climate change in the country.
Chilean NGOs have become more and more interested in climate change over the past decade as interest in the to-pic has risen both within the country and internationally. In 2010, a significant number of NGOs was participating in climate change activities in Chile, some of them offering major support for capacity building efforts. Some of their contributions are described below.
Since 2002, the Chile Sustentable Program (www.chilesus-tentable.net) has published many documents related to climate change, focused mainly on energy efficiency, non-conventional renewable energies, and analyses of Chilean policies related to water resources and their sustainability.
The NGO Fundación Terram (www.terram.cl) also has ex-perts working on issues of climate change and sustaina-bility and has produced several analytical and informative documents on the issue. In 2010, this NGO designed and published a citizen’s primer on climate change in order to inform and educate the public about the issue and en-courage public participation in discussions and problem-solving at different levels.
Fundación Chile (www.fundacionchile.cl) is a private, non-profit organization that works to improve research, inno-vation and technology in Chile. It is the first organization focused on technological innovation in Latin America to obtain a carbon neutral classification. Specifically, the foundation purchased certified emission reductions equal to 1600 annual tons of CO2 in the voluntary carbon market. The organization has also taken steps to reduce its own carbon footprint.
to analyze opportunities for changing their behavior, and to offer alternatives for addressing problems and taking responsibility. At present, formal structures for raising awareness and educating the public about climate chan-ge are few, with the issue limited to just a handful of public institutions and lacking systematic public dissemination.
Public awareness of climate change is crucial, as it allows citizens to incorporate the concept into their daily lives and achieve changes in their behavior. Such awareness can be raised, for example, through educational, informative and training activities implemented under the country’s sus-tainable development policy.
6. LOCAL AND NATIONAL CAPACITY BUILDING FOR CLIMATE CHANGE
This section contains a description of local and national capacity building activities related to climate change. It includes information on the creation of national priorities by the Government and advances in capacity building around climate change in the private sector and among non-governmental organizations and local organizations. The information here complements that presented in other sections of this chapter describing capacity building on climate change in Chile.
6.1 NATIONAL CAPACITY BUILDING PRIORITIES
Capacity building for climate change is one of the three priority areas (along with mitigation and adaptation) in Chile’s National Climate Change Strategy, published in 2006. Based on this priority, the National Climate Chan-ge Action Plan (PANCC) includes a general line of action for capacity building, the objective of which is “To inform the population about environmental problems and, in particular, to raise awareness about the effects of climate change and to encourage education, awareness and re-search on this subject in Chile.” (CONAMA, 2008). The Go-vernment expects that following this line of action will ge-nerate good quality, accessible information about climate change, which will in turn improve public and private de-cision making and contribute to building Chile’s official position in the international context.
Capacities can be seen as a response to the needs, options and priorities that have driven their creation and deve-lopment in the second half of the 2000–2010 decade. In general, efforts have focused on improving information, education and research on climate change, improving the quality of information available, and enhancing capacities
for climate observation. Other efforts have focused on de-veloping institutional capacities for facing the challenges of mitigation and adaptation, developing and transferring mitigation and adaptation technologies, reinforcing inter-national cooperation, and establishing synergies between actions oriented towards climate change and those rela-ted to other global environmental problems.
6.2 CAPACITY BUILDING IN THE PRIVATE SECTOR
Three initiatives involving private sector partnerships with the academic community and the public sector were laun-ched in 2009. These focused on studying and analyzing the implications of climate change in Chile.
The project “Fortalecimiento de capacidades del cambio global para enfrentar los desafíos del cambio climático en Chile” (Strengthening capacities for global change to address the challenges of climate change in Chile) takes an innovative approach that combines co-financing by public sector institutions (Innova-CORFO and the Minis-try of the Environment) and the private sector (the elec-tricity company Colbún S.A.). The three-year project was launched in 2009 with the UC Center for Global Change as the implementing agency and with support from the Stockholm Environment Institute. The project aims to “de-velop comprehensive analyses and support systems for decision making to manage the impacts of global change on productive sectors” (http://cambioglobal.uc.cl/fortale-cimiento). The project includes research into risk analysis, decision-making and uncertainty representation associa-ted with climate change. It also addresses hydrological-water resource modeling, soil-energy use; environmental monitoring and the use of satellite images; carbon capture
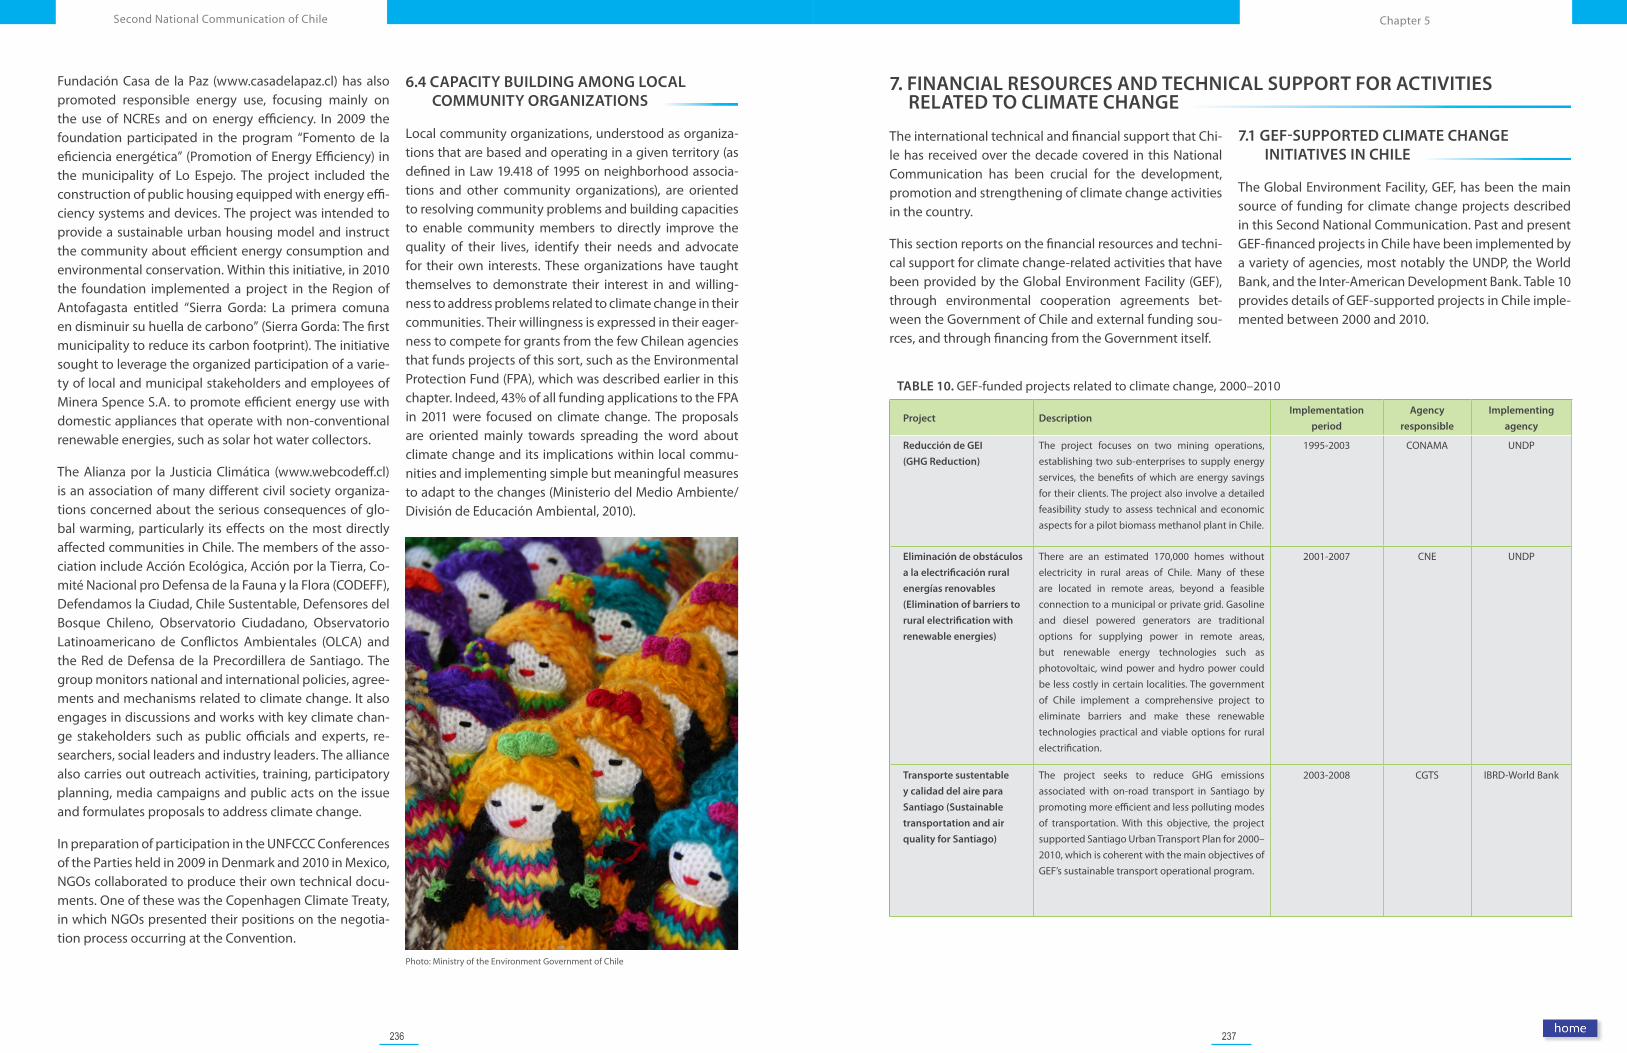
236 237
Chapter 5Second National Communication of Chile
7. FINANCIAL RESOURCES AND TECHNICAL SUPPORT FOR ACTIVITIES RELATED TO CLIMATE CHANGE
The international technical and financial support that Chi-le has received over the decade covered in this National Communication has been crucial for the development, promotion and strengthening of climate change activities in the country.
This section reports on the financial resources and techni-cal support for climate change-related activities that have been provided by the Global Environment Facility (GEF), through environmental cooperation agreements bet-ween the Government of Chile and external funding sou-rces, and through financing from the Government itself.
7.1 GEF-SUPPORTED CLIMATE CHANGE INITIATIVES IN CHILE
The Global Environment Facility, GEF, has been the main source of funding for climate change projects described in this Second National Communication. Past and present GEF-financed projects in Chile have been implemented by a variety of agencies, most notably the UNDP, the World Bank, and the Inter-American Development Bank. Table 10 provides details of GEF-supported projects in Chile imple-mented between 2000 and 2010.
TABLE 10. GEF-funded projects related to climate change, 2000–2010
Project Description Implementation
period
Agency
responsible
Implementing
agency
Reducción de GEI
(GHG Reduction)
The project focuses on two mining operations, establishing two sub-enterprises to supply energy services, the benefits of which are energy savings for their clients. The project also involve a detailed feasibility study to assess technical and economic aspects for a pilot biomass methanol plant in Chile.
1995-2003 CONAMA UNDP
Eliminación de obstáculos
a la electrificación rural
energías renovables
(Elimination of barriers to
rural electrification with
renewable energies)
There are an estimated 170,000 homes without electricity in rural areas of Chile. Many of these are located in remote areas, beyond a feasible connection to a municipal or private grid. Gasoline and diesel powered generators are traditional options for supplying power in remote areas, but renewable energy technologies such as photovoltaic, wind power and hydro power could be less costly in certain localities. The government of Chile implement a comprehensive project to eliminate barriers and make these renewable technologies practical and viable options for rural electrification.
2001-2007 CNE UNDP
Transporte sustentable
y calidad del aire para
Santiago (Sustainable
transportation and air
quality for Santiago)
The project seeks to reduce GHG emissions associated with on-road transport in Santiago by promoting more efficient and less polluting modes of transportation. With this objective, the project supported Santiago Urban Transport Plan for 2000–2010, which is coherent with the main objectives of GEF’s sustainable transport operational program.
2003-2008 CGTS IBRD-World Bank
6.4 CAPACITY BUILDING AMONG LOCAL COMMUNITY ORGANIZATIONS
Local community organizations, understood as organiza-tions that are based and operating in a given territory (as defined in Law 19.418 of 1995 on neighborhood associa-tions and other community organizations), are oriented to resolving community problems and building capacities to enable community members to directly improve the quality of their lives, identify their needs and advocate for their own interests. These organizations have taught themselves to demonstrate their interest in and willing-ness to address problems related to climate change in their communities. Their willingness is expressed in their eager-ness to compete for grants from the few Chilean agencies that funds projects of this sort, such as the Environmental Protection Fund (FPA), which was described earlier in this chapter. Indeed, 43% of all funding applications to the FPA in 2011 were focused on climate change. The proposals are oriented mainly towards spreading the word about climate change and its implications within local commu-nities and implementing simple but meaningful measures to adapt to the changes (Ministerio del Medio Ambiente/División de Educación Ambiental, 2010).
Photo: Ministry of the Environment Government of Chile
Fundación Casa de la Paz (www.casadelapaz.cl) has also promoted responsible energy use, focusing mainly on the use of NCREs and on energy efficiency. In 2009 the foundation participated in the program “Fomento de la eficiencia energética” (Promotion of Energy Efficiency) in the municipality of Lo Espejo. The project included the construction of public housing equipped with energy effi-ciency systems and devices. The project was intended to provide a sustainable urban housing model and instruct the community about efficient energy consumption and environmental conservation. Within this initiative, in 2010 the foundation implemented a project in the Region of Antofagasta entitled “Sierra Gorda: La primera comuna en disminuir su huella de carbono” (Sierra Gorda: The first municipality to reduce its carbon footprint). The initiative sought to leverage the organized participation of a varie-ty of local and municipal stakeholders and employees of Minera Spence S.A. to promote efficient energy use with domestic appliances that operate with non-conventional renewable energies, such as solar hot water collectors.
The Alianza por la Justicia Climática (www.webcodeff.cl) is an association of many different civil society organiza-tions concerned about the serious consequences of glo-bal warming, particularly its effects on the most directly affected communities in Chile. The members of the asso-ciation include Acción Ecológica, Acción por la Tierra, Co-mité Nacional pro Defensa de la Fauna y la Flora (CODEFF), Defendamos la Ciudad, Chile Sustentable, Defensores del Bosque Chileno, Observatorio Ciudadano, Observatorio Latinoamericano de Conflictos Ambientales (OLCA) and the Red de Defensa de la Precordillera de Santiago. The group monitors national and international policies, agree-ments and mechanisms related to climate change. It also engages in discussions and works with key climate chan-ge stakeholders such as public officials and experts, re-searchers, social leaders and industry leaders. The alliance also carries out outreach activities, training, participatory planning, media campaigns and public acts on the issue and formulates proposals to address climate change.
In preparation of participation in the UNFCCC Conferences of the Parties held in 2009 in Denmark and 2010 in Mexico, NGOs collaborated to produce their own technical docu-ments. One of these was the Copenhagen Climate Treaty, in which NGOs presented their positions on the negotia-tion process occurring at the Convention.
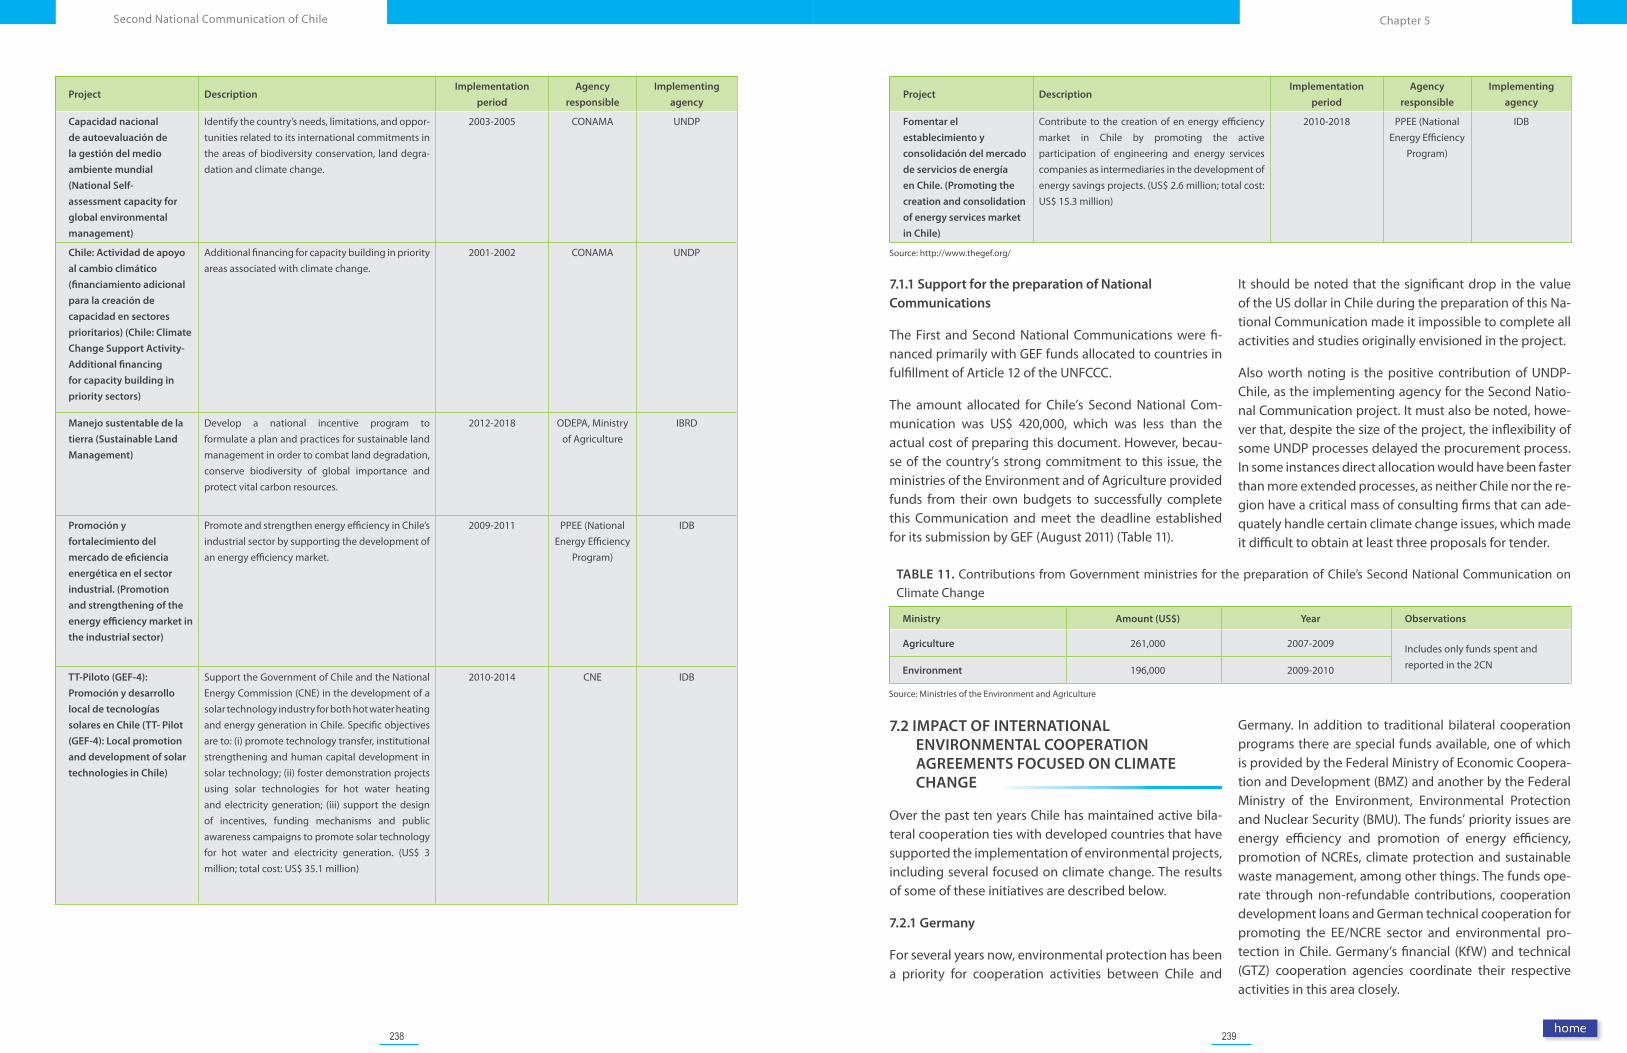
238 239
Chapter 5Second National Communication of Chile
7.2 IMPACT OF INTERNATIONAL ENVIRONMENTAL COOPERATION AGREEMENTS FOCUSED ON CLIMATE CHANGE
Over the past ten years Chile has maintained active bila-teral cooperation ties with developed countries that have supported the implementation of environmental projects, including several focused on climate change. The results of some of these initiatives are described below.
7.2.1 Germany
For several years now, environmental protection has been a priority for cooperation activities between Chile and
Germany. In addition to traditional bilateral cooperation programs there are special funds available, one of which is provided by the Federal Ministry of Economic Coopera-tion and Development (BMZ) and another by the Federal Ministry of the Environment, Environmental Protection and Nuclear Security (BMU). The funds’ priority issues are energy efficiency and promotion of energy efficiency, promotion of NCREs, climate protection and sustainable waste management, among other things. The funds ope-rate through non-refundable contributions, cooperation development loans and German technical cooperation for promoting the EE/NCRE sector and environmental pro-tection in Chile. Germany’s financial (KfW) and technical (GTZ) cooperation agencies coordinate their respective activities in this area closely.
Project Description Implementation
period
Agency
responsible
Implementing
agency
Fomentar el
establecimiento y
consolidación del mercado
de servicios de energía
en Chile. (Promoting the
creation and consolidation
of energy services market
in Chile)
Contribute to the creation of en energy efficiency market in Chile by promoting the active participation of engineering and energy services companies as intermediaries in the development of energy savings projects. (US$ 2.6 million; total cost: US$ 15.3 million)
2010-2018 PPEE (National Energy Efficiency
Program)
IDB
Source: http://www.thegef.org/
7.1.1 Support for the preparation of National Communications
The First and Second National Communications were fi-nanced primarily with GEF funds allocated to countries in fulfillment of Article 12 of the UNFCCC.
The amount allocated for Chile’s Second National Com-munication was US$ 420,000, which was less than the actual cost of preparing this document. However, becau-se of the country’s strong commitment to this issue, the ministries of the Environment and of Agriculture provided funds from their own budgets to successfully complete this Communication and meet the deadline established for its submission by GEF (August 2011) (Table 11).
It should be noted that the significant drop in the value of the US dollar in Chile during the preparation of this Na-tional Communication made it impossible to complete all activities and studies originally envisioned in the project.
Also worth noting is the positive contribution of UNDP-Chile, as the implementing agency for the Second Natio-nal Communication project. It must also be noted, howe-ver that, despite the size of the project, the inflexibility of some UNDP processes delayed the procurement process. In some instances direct allocation would have been faster than more extended processes, as neither Chile nor the re-gion have a critical mass of consulting firms that can ade-quately handle certain climate change issues, which made it difficult to obtain at least three proposals for tender.
TABLE 11. Contributions from Government ministries for the preparation of Chile’s Second National Communication on Climate Change
Ministry Amount (US$) Year Observations
Agriculture 261,000 2007-2009 Includes only funds spent and reported in the 2CNEnvironment 196,000 2009-2010
Source: Ministries of the Environment and Agriculture
Project Description Implementation
period
Agency
responsible
Implementing
agency
Capacidad nacional
de autoevaluación de
la gestión del medio
ambiente mundial
(National Self-
assessment capacity for
global environmental
management)
Identify the country’s needs, limitations, and oppor-tunities related to its international commitments in the areas of biodiversity conservation, land degra-dation and climate change.
2003-2005 CONAMA UNDP
Chile: Actividad de apoyo
al cambio climático
(financiamiento adicional
para la creación de
capacidad en sectores
prioritarios) (Chile: Climate
Change Support Activity-
Additional financing
for capacity building in
priority sectors)
Additional financing for capacity building in priority areas associated with climate change.
2001-2002 CONAMA UNDP
Manejo sustentable de la
tierra (Sustainable Land
Management)
Develop a national incentive program to formulate a plan and practices for sustainable land management in order to combat land degradation, conserve biodiversity of global importance and protect vital carbon resources.
2012-2018 ODEPA, Ministry of Agriculture
IBRD
Promoción y
fortalecimiento del
mercado de eficiencia
energética en el sector
industrial. (Promotion
and strengthening of the
energy efficiency market in
the industrial sector)
Promote and strengthen energy efficiency in Chile’s industrial sector by supporting the development of an energy efficiency market.
2009-2011 PPEE (National Energy Efficiency
Program)
IDB
TT-Piloto (GEF-4):
Promoción y desarrollo
local de tecnologías
solares en Chile (TT- Pilot
(GEF-4): Local promotion
and development of solar
technologies in Chile)
Support the Government of Chile and the National Energy Commission (CNE) in the development of a solar technology industry for both hot water heating and energy generation in Chile. Specific objectives are to: (i) promote technology transfer, institutional strengthening and human capital development in solar technology; (ii) foster demonstration projects using solar technologies for hot water heating and electricity generation; (iii) support the design of incentives, funding mechanisms and public awareness campaigns to promote solar technology for hot water and electricity generation. (US$ 3 million; total cost: US$ 35.1 million)
2010-2014 CNE IDB
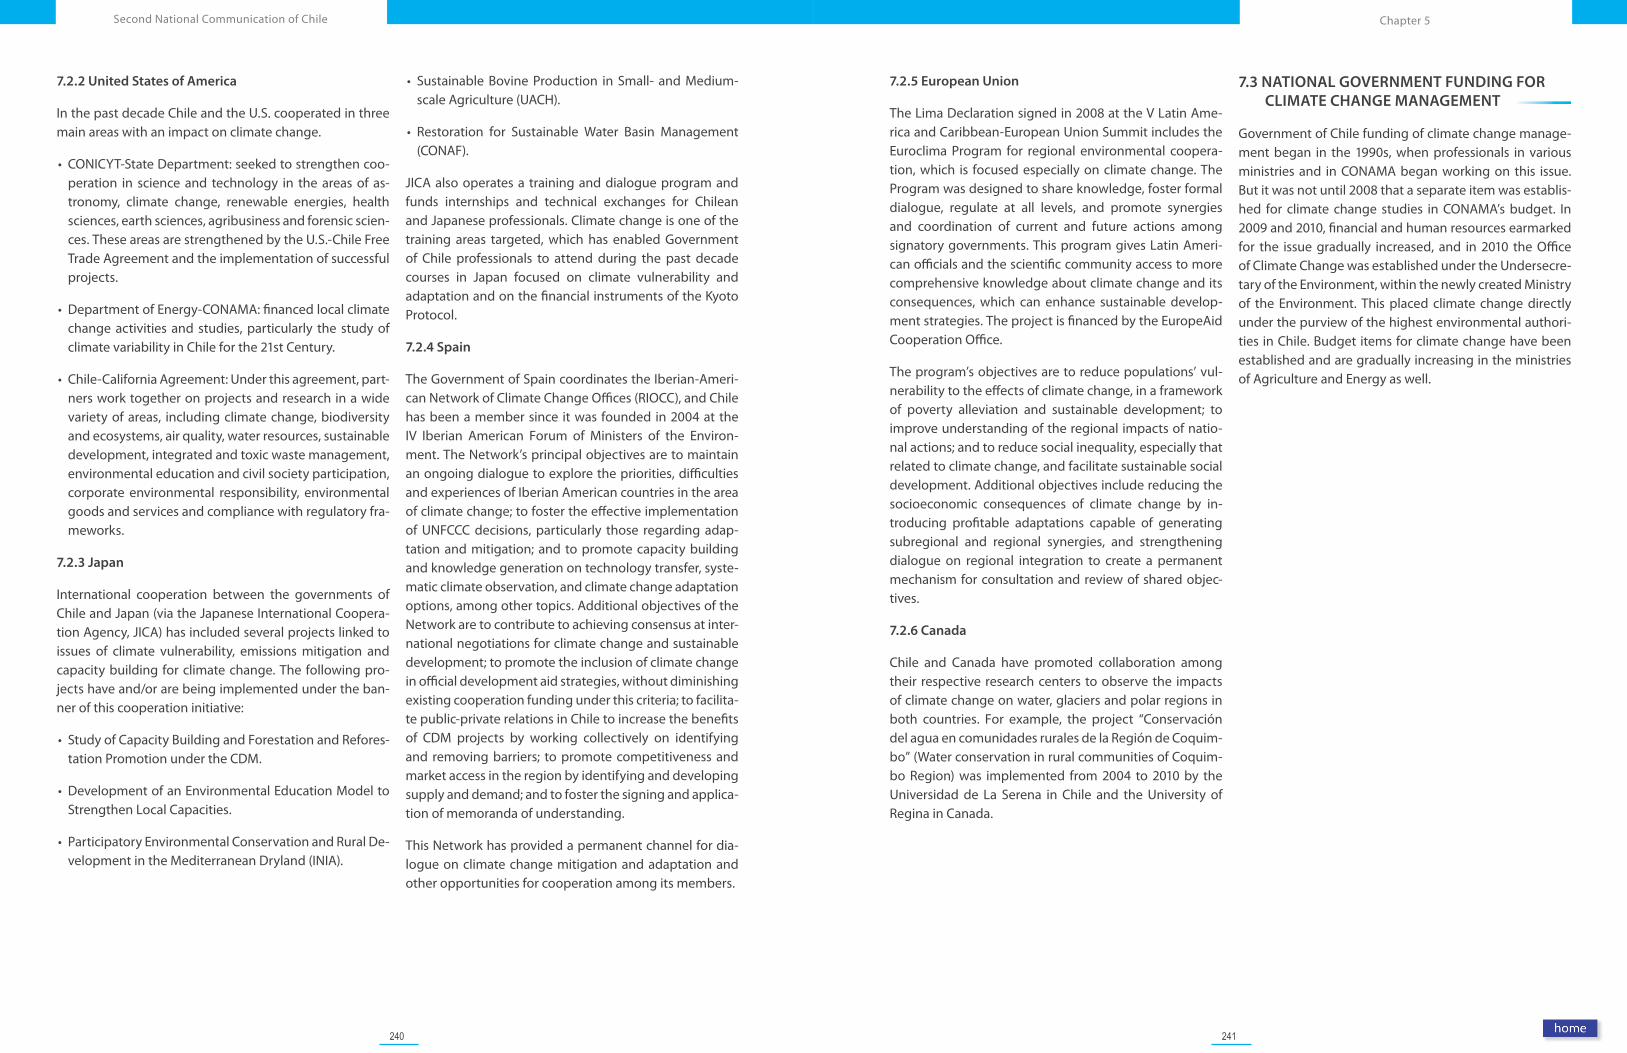
240 241
Chapter 5Second National Communication of Chile
7.2.5 European Union
The Lima Declaration signed in 2008 at the V Latin Ame-rica and Caribbean-European Union Summit includes the Euroclima Program for regional environmental coopera-tion, which is focused especially on climate change. The Program was designed to share knowledge, foster formal dialogue, regulate at all levels, and promote synergies and coordination of current and future actions among signatory governments. This program gives Latin Ameri-can officials and the scientific community access to more comprehensive knowledge about climate change and its consequences, which can enhance sustainable develop-ment strategies. The project is financed by the EuropeAid Cooperation Office.
The program’s objectives are to reduce populations’ vul-nerability to the effects of climate change, in a framework of poverty alleviation and sustainable development; to improve understanding of the regional impacts of natio-nal actions; and to reduce social inequality, especially that related to climate change, and facilitate sustainable social development. Additional objectives include reducing the socioeconomic consequences of climate change by in-troducing profitable adaptations capable of generating subregional and regional synergies, and strengthening dialogue on regional integration to create a permanent mechanism for consultation and review of shared objec-tives.
7.2.6 Canada
Chile and Canada have promoted collaboration among their respective research centers to observe the impacts of climate change on water, glaciers and polar regions in both countries. For example, the project “Conservación del agua en comunidades rurales de la Región de Coquim-bo” (Water conservation in rural communities of Coquim-bo Region) was implemented from 2004 to 2010 by the Universidad de La Serena in Chile and the University of Regina in Canada.
7.3 NATIONAL GOVERNMENT FUNDING FOR CLIMATE CHANGE MANAGEMENT
Government of Chile funding of climate change manage-ment began in the 1990s, when professionals in various ministries and in CONAMA began working on this issue. But it was not until 2008 that a separate item was establis-hed for climate change studies in CONAMA’s budget. In 2009 and 2010, financial and human resources earmarked for the issue gradually increased, and in 2010 the Office of Climate Change was established under the Undersecre-tary of the Environment, within the newly created Ministry of the Environment. This placed climate change directly under the purview of the highest environmental authori-ties in Chile. Budget items for climate change have been established and are gradually increasing in the ministries of Agriculture and Energy as well.
7.2.2 United States of America
In the past decade Chile and the U.S. cooperated in three main areas with an impact on climate change.
• CONICYT-State Department: seeked to strengthen coo-peration in science and technology in the areas of as-tronomy, climate change, renewable energies, health sciences, earth sciences, agribusiness and forensic scien-ces. These areas are strengthened by the U.S.-Chile Free Trade Agreement and the implementation of successful projects.
• Department of Energy-CONAMA: financed local climate change activities and studies, particularly the study of climate variability in Chile for the 21st Century.
• Chile-California Agreement: Under this agreement, part-ners work together on projects and research in a wide variety of areas, including climate change, biodiversity and ecosystems, air quality, water resources, sustainable development, integrated and toxic waste management, environmental education and civil society participation, corporate environmental responsibility, environmental goods and services and compliance with regulatory fra-meworks.
7.2.3 Japan
International cooperation between the governments of Chile and Japan (via the Japanese International Coopera-tion Agency, JICA) has included several projects linked to issues of climate vulnerability, emissions mitigation and capacity building for climate change. The following pro-jects have and/or are being implemented under the ban-ner of this cooperation initiative:
• Study of Capacity Building and Forestation and Refores-tation Promotion under the CDM.
• Development of an Environmental Education Model to Strengthen Local Capacities.
• Participatory Environmental Conservation and Rural De-velopment in the Mediterranean Dryland (INIA).
• Sustainable Bovine Production in Small- and Medium-scale Agriculture (UACH).
• Restoration for Sustainable Water Basin Management (CONAF).
JICA also operates a training and dialogue program and funds internships and technical exchanges for Chilean and Japanese professionals. Climate change is one of the training areas targeted, which has enabled Government of Chile professionals to attend during the past decade courses in Japan focused on climate vulnerability and adaptation and on the financial instruments of the Kyoto Protocol.
7.2.4 Spain
The Government of Spain coordinates the Iberian-Ameri-can Network of Climate Change Offices (RIOCC), and Chile has been a member since it was founded in 2004 at the IV Iberian American Forum of Ministers of the Environ-ment. The Network’s principal objectives are to maintain an ongoing dialogue to explore the priorities, difficulties and experiences of Iberian American countries in the area of climate change; to foster the effective implementation of UNFCCC decisions, particularly those regarding adap-tation and mitigation; and to promote capacity building and knowledge generation on technology transfer, syste-matic climate observation, and climate change adaptation options, among other topics. Additional objectives of the Network are to contribute to achieving consensus at inter-national negotiations for climate change and sustainable development; to promote the inclusion of climate change in official development aid strategies, without diminishing existing cooperation funding under this criteria; to facilita-te public-private relations in Chile to increase the benefits of CDM projects by working collectively on identifying and removing barriers; to promote competitiveness and market access in the region by identifying and developing supply and demand; and to foster the signing and applica-tion of memoranda of understanding.
This Network has provided a permanent channel for dia-logue on climate change mitigation and adaptation and other opportunities for cooperation among its members.
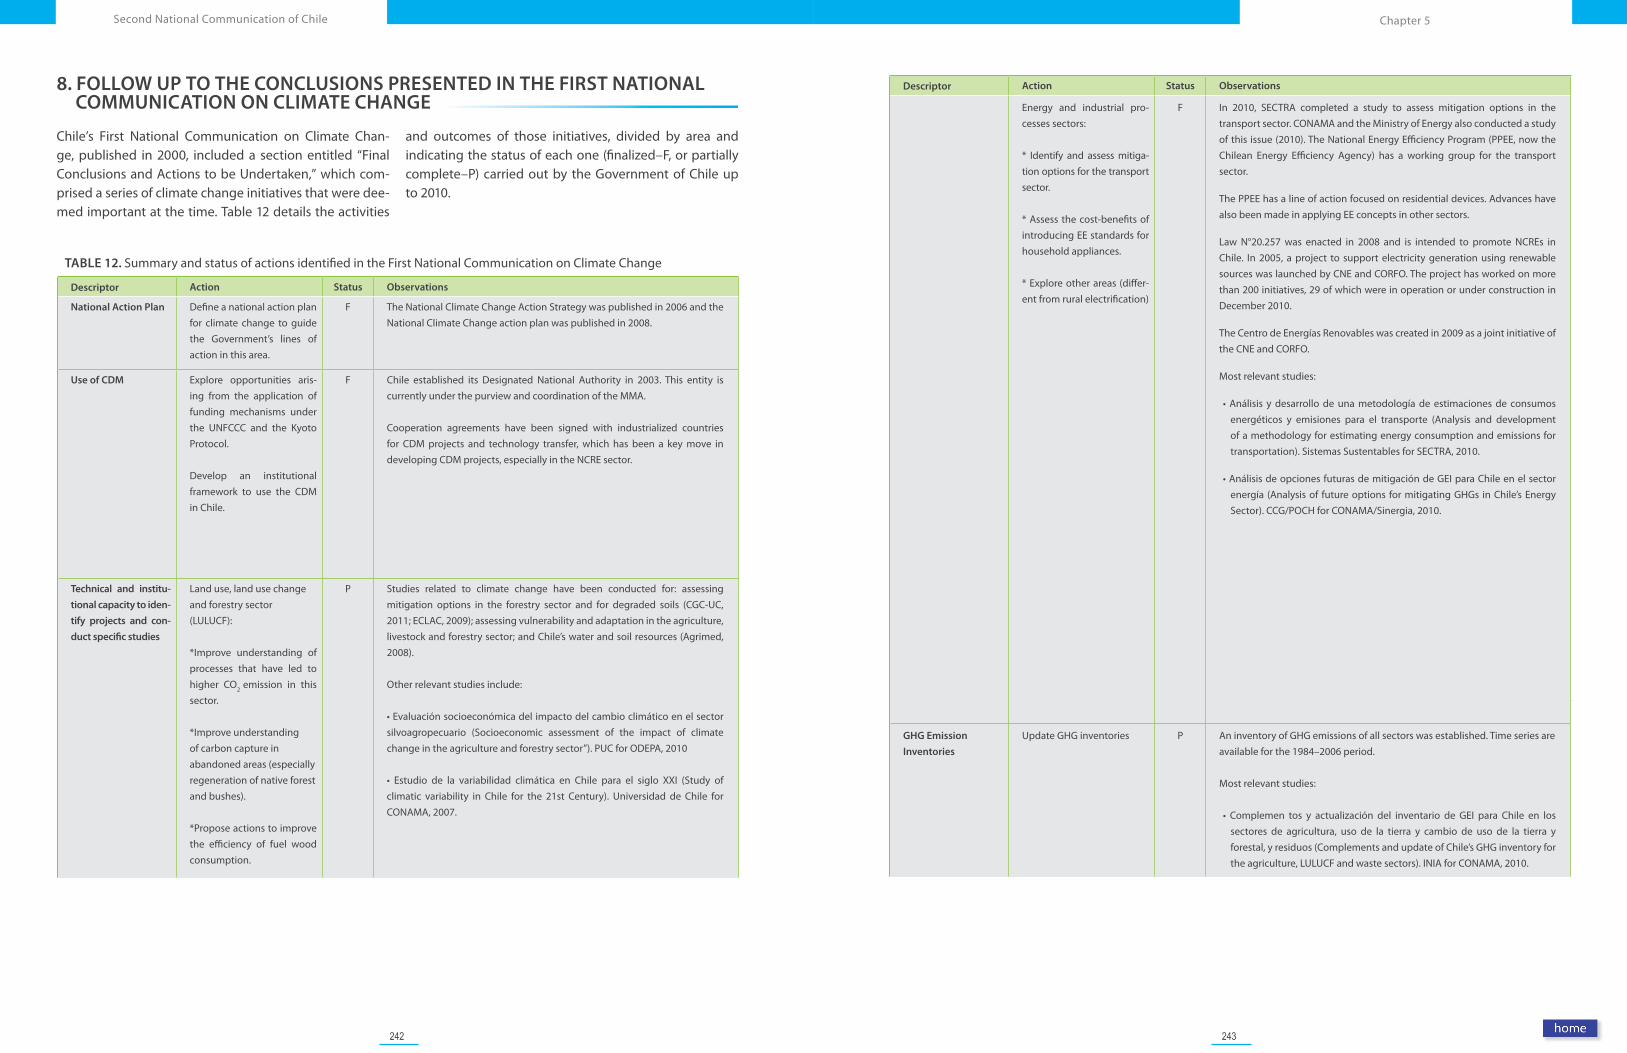
242 243
Chapter 5Second National Communication of Chile
Descriptor Action Status Observations
Energy and industrial pro-cesses sectors:
* Identify and assess mitiga-tion options for the transport sector.
* Assess the cost-benefits of introducing EE standards for household appliances.
* Explore other areas (differ-ent from rural electrification)
F In 2010, SECTRA completed a study to assess mitigation options in the transport sector. CONAMA and the Ministry of Energy also conducted a study of this issue (2010). The National Energy Efficiency Program (PPEE, now the Chilean Energy Efficiency Agency) has a working group for the transport sector.
The PPEE has a line of action focused on residential devices. Advances have also been made in applying EE concepts in other sectors.
Law N°20.257 was enacted in 2008 and is intended to promote NCREs in Chile. In 2005, a project to support electricity generation using renewable sources was launched by CNE and CORFO. The project has worked on more than 200 initiatives, 29 of which were in operation or under construction in December 2010.
The Centro de Energías Renovables was created in 2009 as a joint initiative of the CNE and CORFO.
Most relevant studies:
•Análisis ydesarrollodeunametodologíadeestimacionesde consumosenergéticos y emisiones para el transporte (Analysis and development of a methodology for estimating energy consumption and emissions for transportation). Sistemas Sustentables for SECTRA, 2010.
•AnálisisdeopcionesfuturasdemitigacióndeGEIparaChileenelsectorenergía (Analysis of future options for mitigating GHGs in Chile’s Energy Sector). CCG/POCH for CONAMA/Sinergia, 2010.
GHG Emission
Inventories
Update GHG inventories P An inventory of GHG emissions of all sectors was established. Time series are available for the 1984–2006 period.
Most relevant studies:
• Complemen tos y actualización del inventario de GEI para Chile en lossectores de agricultura, uso de la tierra y cambio de uso de la tierra y forestal, y residuos (Complements and update of Chile’s GHG inventory for the agriculture, LULUCF and waste sectors). INIA for CONAMA, 2010.
8. FOLLOW UP TO THE CONCLUSIONS PRESENTED IN THE FIRST NATIONAL COMMUNICATION ON CLIMATE CHANGE
Chile’s First National Communication on Climate Chan-ge, published in 2000, included a section entitled “Final Conclusions and Actions to be Undertaken,” which com-prised a series of climate change initiatives that were dee-med important at the time. Table 12 details the activities
and outcomes of those initiatives, divided by area and indicating the status of each one (finalized–F, or partially complete–P) carried out by the Government of Chile up to 2010.
TABLE 12. Summary and status of actions identified in the First National Communication on Climate Change
Descriptor Action Status Observations
National Action Plan Define a national action plan for climate change to guide the Government’s lines of action in this area.
F The National Climate Change Action Strategy was published in 2006 and the National Climate Change action plan was published in 2008.
Use of CDM Explore opportunities aris-ing from the application of funding mechanisms under the UNFCCC and the Kyoto Protocol.
Develop an institutional framework to use the CDM in Chile.
F Chile established its Designated National Authority in 2003. This entity is currently under the purview and coordination of the MMA.
Cooperation agreements have been signed with industrialized countries for CDM projects and technology transfer, which has been a key move in developing CDM projects, especially in the NCRE sector.
Technical and institu-
tional capacity to iden-
tify projects and con-
duct specific studies
Land use, land use change and forestry sector (LULUCF):
*Improve understanding of processes that have led to higher CO2 emission in this sector.
*Improve understanding of carbon capture in abandoned areas (especially regeneration of native forest and bushes).
*Propose actions to improve the efficiency of fuel wood consumption.
P Studies related to climate change have been conducted for: assessing mitigation options in the forestry sector and for degraded soils (CGC-UC, 2011; ECLAC, 2009); assessing vulnerability and adaptation in the agriculture, livestock and forestry sector; and Chile’s water and soil resources (Agrimed, 2008).
Other relevant studies include:
•Evaluaciónsocioeconómicadelimpactodelcambioclimáticoenelsectorsilvoagropecuario (Socioeconomic assessment of the impact of climate change in the agriculture and forestry sector”). PUC for ODEPA, 2010
• Estudio de la variabilidad climática en Chile para el siglo XXI (Study ofclimatic variability in Chile for the 21st Century). Universidad de Chile for CONAMA, 2007.
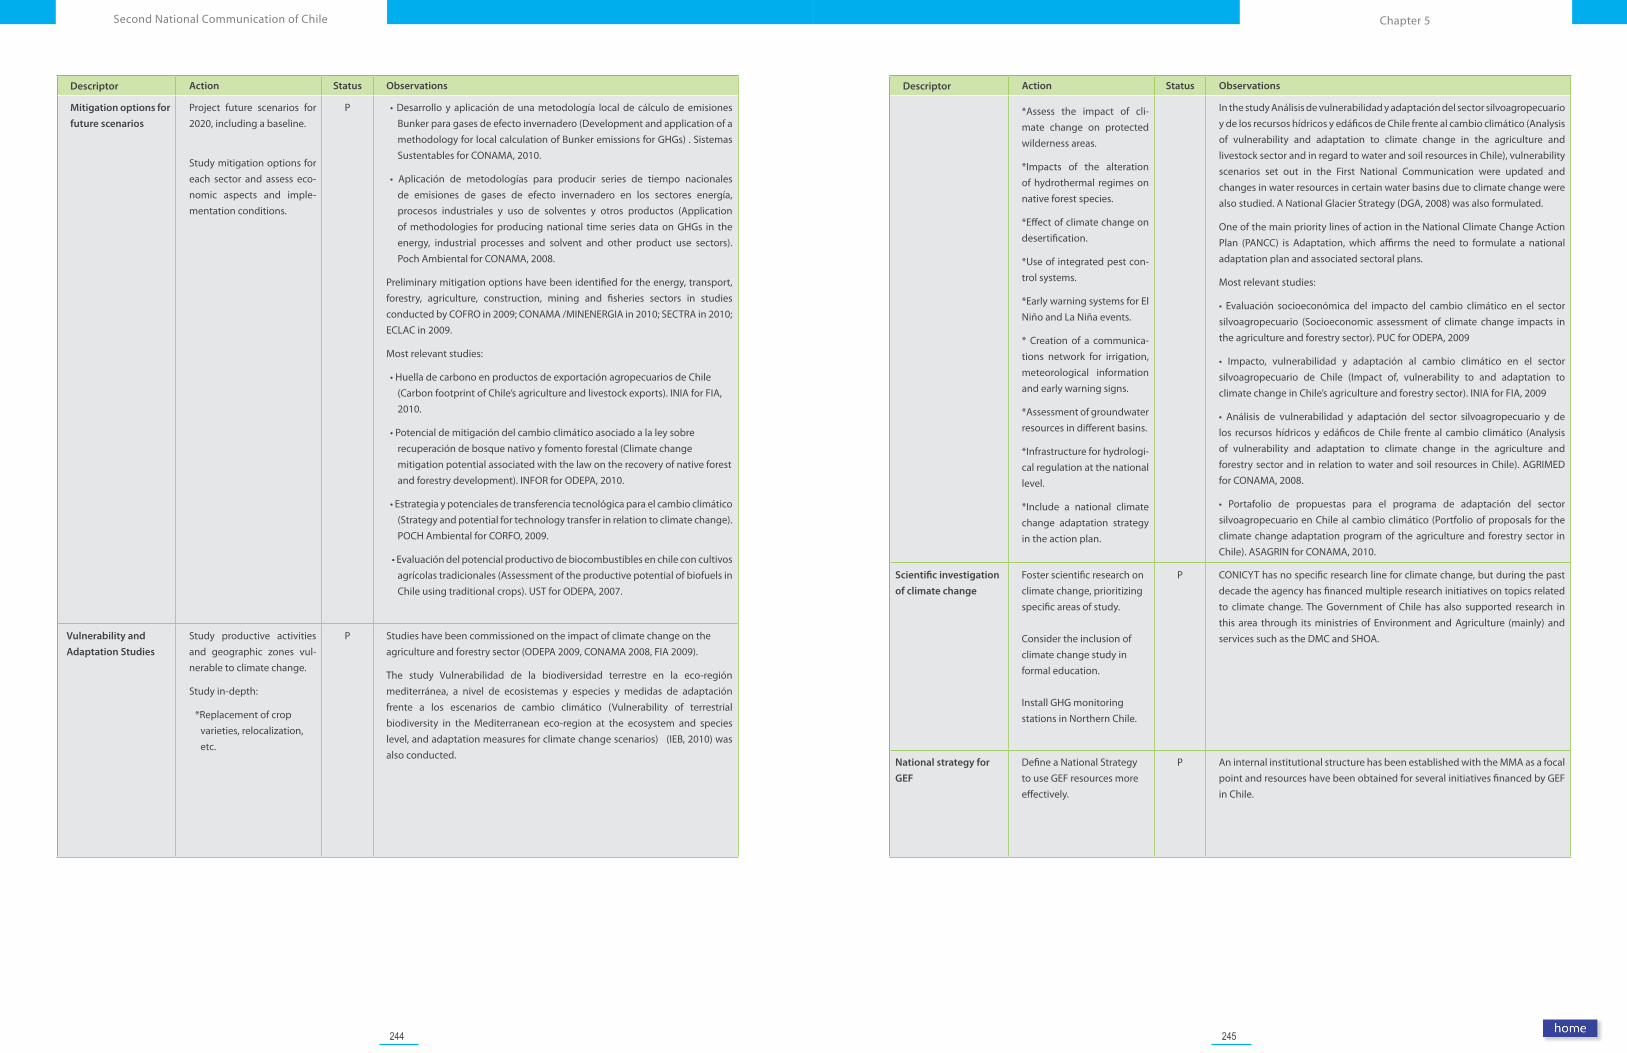
244 245
Chapter 5Second National Communication of Chile
Descriptor Action Status Observations
*Assess the impact of cli-mate change on protected wilderness areas.
*Impacts of the alteration of hydrothermal regimes on native forest species.
*Effect of climate change on desertification.
*Use of integrated pest con-trol systems.
*Early warning systems for El Niño and La Niña events.
* Creation of a communica-tions network for irrigation, meteorological information and early warning signs.
*Assessment of groundwater resources in different basins.
*Infrastructure for hydrologi-cal regulation at the national level.
*Include a national climate change adaptation strategy in the action plan.
In the study Análisis de vulnerabilidad y adaptación del sector silvoagropecuario y de los recursos hídricos y edáficos de Chile frente al cambio climático (Analysis of vulnerability and adaptation to climate change in the agriculture and livestock sector and in regard to water and soil resources in Chile), vulnerability scenarios set out in the First National Communication were updated and changes in water resources in certain water basins due to climate change were also studied. A National Glacier Strategy (DGA, 2008) was also formulated.
One of the main priority lines of action in the National Climate Change Action Plan (PANCC) is Adaptation, which affirms the need to formulate a national adaptation plan and associated sectoral plans.
Most relevant studies:
• Evaluación socioeconómica del impacto del cambio climático en el sectorsilvoagropecuario (Socioeconomic assessment of climate change impacts in the agriculture and forestry sector). PUC for ODEPA, 2009
• Impacto, vulnerabilidad y adaptación al cambio climático en el sectorsilvoagropecuario de Chile (Impact of, vulnerability to and adaptation to climate change in Chile’s agriculture and forestry sector). INIA for FIA, 2009
• Análisis de vulnerabilidad y adaptación del sector silvoagropecuario y delos recursos hídricos y edáficos de Chile frente al cambio climático (Analysis of vulnerability and adaptation to climate change in the agriculture and forestry sector and in relation to water and soil resources in Chile). AGRIMED for CONAMA, 2008.
• Portafolio de propuestas para el programa de adaptación del sectorsilvoagropecuario en Chile al cambio climático (Portfolio of proposals for the climate change adaptation program of the agriculture and forestry sector in Chile). ASAGRIN for CONAMA, 2010.
Scientific investigation
of climate change
Foster scientific research on climate change, prioritizing specific areas of study.
Consider the inclusion of climate change study in formal education.
Install GHG monitoring stations in Northern Chile.
P CONICYT has no specific research line for climate change, but during the past decade the agency has financed multiple research initiatives on topics related to climate change. The Government of Chile has also supported research in this area through its ministries of Environment and Agriculture (mainly) and services such as the DMC and SHOA.
National strategy for
GEF
Define a National Strategy to use GEF resources more effectively.
P An internal institutional structure has been established with the MMA as a focal point and resources have been obtained for several initiatives financed by GEF in Chile.
Descriptor Action Status Observations
Mitigation options for
future scenarios
Project future scenarios for 2020, including a baseline.
Study mitigation options for each sector and assess eco-nomic aspects and imple-mentation conditions.
P •Desarrollo y aplicacióndeunametodología localde cálculodeemisionesBunker para gases de efecto invernadero (Development and application of a methodology for local calculation of Bunker emissions for GHGs) . Sistemas Sustentables for CONAMA, 2010.
• Aplicación de metodologías para producir series de tiempo nacionalesde emisiones de gases de efecto invernadero en los sectores energía, procesos industriales y uso de solventes y otros productos (Application of methodologies for producing national time series data on GHGs in the energy, industrial processes and solvent and other product use sectors). Poch Ambiental for CONAMA, 2008.
Preliminary mitigation options have been identified for the energy, transport, forestry, agriculture, construction, mining and fisheries sectors in studies conducted by COFRO in 2009; CONAMA /MINENERGIA in 2010; SECTRA in 2010; ECLAC in 2009.
Most relevant studies:
•HuelladecarbonoenproductosdeexportaciónagropecuariosdeChile(Carbon footprint of Chile’s agriculture and livestock exports). INIA for FIA, 2010.
•Potencialdemitigacióndelcambioclimáticoasociadoalaleysobrerecuperación de bosque nativo y fomento forestal (Climate change mitigation potential associated with the law on the recovery of native forest and forestry development). INFOR for ODEPA, 2010.
•Estrategiaypotencialesdetransferenciatecnológicaparaelcambioclimático(Strategy and potential for technology transfer in relation to climate change). POCH Ambiental for CORFO, 2009.
•Evaluacióndelpotencialproductivodebiocombustiblesenchileconcultivosagrícolas tradicionales (Assessment of the productive potential of biofuels in Chile using traditional crops). UST for ODEPA, 2007.
Vulnerability and
Adaptation Studies
Study productive activities and geographic zones vul-nerable to climate change.
Study in-depth:
*Replacement of crop varieties, relocalization, etc.
P Studies have been commissioned on the impact of climate change on the agriculture and forestry sector (ODEPA 2009, CONAMA 2008, FIA 2009).
The study Vulnerabilidad de la biodiversidad terrestre en la eco-región mediterránea, a nivel de ecosistemas y especies y medidas de adaptación frente a los escenarios de cambio climático (Vulnerability of terrestrial biodiversity in the Mediterranean eco-region at the ecosystem and species level, and adaptation measures for climate change scenarios) (IEB, 2010) was also conducted.
246 247
Chapter 5Second National Communication of Chile
B I B L I O G R A P H Y
AGRIMED. (2008). “Impactos productivos en el sector silvoagropecuario de Chile frente a escenarios de cambio climático, Análisis de vulnerabilidad del sector silvoagropecuario, recursos hídricos y edáficos de Chile frente a escenarios de cambio climático.” Santiago de Chile.
CC&D. (2009). “Levantamiento de información de catastro sobre acciones en cambio climático en Chile.” Final Report, prepared by CONAMA.
CCG-UC. (2011). Análisis de Opciones Futuras de Mitigación de GEI para Chile asociadas a Programas de Fomento del Sector Silvoagropecuario.
CECS. (2009). Estrategia Nacional de Glaciares. Realizado para la DGA.
CEPAL. (2009). La Economía del Cambio Climático en Chile, Síntesis. CEPAL, Chile. Final report available online: www.eclac.cl/publicaciones/ xml/8/37858/W288.pdf. Viewed 24 September 2010.
CER (s.f). Institutional webpage. Available online: http://www.cer.gov.cl Viewed 15 September 2010.
CONAMA, (2006). National Climate Change Strategy. Comisión Nacional de Medio Ambiente, Chile.
CONAMA. (2008). National Climate Change Action Plan 2008-2012. Comisión Nacional de Medio Ambiente, Chile.
CONICYT (n.d.) Institutional webpage. Avaialble online: http://www.conicyt.cl/573/article•36420.htmlIncludesdetailsofallregionalcenterssupportedbyCONICYT.Viewed24 September 2010.
CONICYT (n.d.) Institutional web page. Available online: http://www.conicyt.cl/573/article•3963.htmlViewed05September2010.
CORFO (n.d.) Acerca de CORFO. Historia. Available online: http://www.corfo.cl/acerca_ de_corfo. Viewed 10 September 2010.
Deuman Ingenieros. (2003). Transferencia de tecnología para el cambio climático. Informe final. Availabel online: http://unfccc.int/ttclear/jsp/CountryReports.jsp Viewed 05 August 2010.
DGA. (2010). Personal interviews with professional staff at the Dirección General de Aguas (7 October 2010). Santiago, Chile.
DGA (n.d.) Institutional webpage. Available online: http://www.dga.cl Viewed 4 October 2010.
248 249
Chapter 5Second National Communication of Chile
SimFRUIT. (2009). Sistema de Inteligencia de Mercado de la Industria Frutícola Chilena. Noticias. Available online:
http://www.simfruit.cl/fruit/index.php?option=com_content&view=article&id=906: fdf inaugura-red-meteorologica- que - cubre - en-tiempo -real-a-todo -elpais&catid=44:actualidad-cientifica Viewed 15 September 2010.
Stern, N. (2006.) The Economics of Climate Change: The Stern Review. Cambridge, UK. Cambridge University Press. Available online: http://www.hm-treasury.gov.uk/independent_reviews/ stern_review_ economics_climate_change/sternreview_index.cfm Viewed 20 September 2010.
Terram. (2010). Personal interview with NGO staff (1 October 2010) Terram, Santiago, Chile.
Terram (n.d.) Institutional webpage. Available online: http://www.terram.cl Viewed 1 October 2010.
U. de Chile. (2010). Telephone interview with Paulina Aldunce (6 October 2010).
U.de Chile/Depto. Geofísica. (2007). Estudio de la Variabilidad Climática en Chile para el siglo XXI, Informe Final. Study commissioned by CONAMA and conducted by the Department of Geophysics, Faculty of Physical Sciences and Mathematics, Universidad de Chile, Santiago, Chile. Available online: http://www.conama.cl/portal/1301/article-39442.html Visitado el 24 Septiembre 2010.
U.de Concepción. (2011). “Aportes de la Universidad de Concepción a la investigación del cambio climático en Chile.” Concepción.
DMC. (2010). Personal interviews with professional staff at the Dirección Meteorológica de Chile (27 September 2010). Santiago, Chile.
DMC (n.d.) Institutional webpage. Available online: http://www.meteochile.cl Visited 28 September 2010.
González, S. (2010), Personal Interview with Sergio González (6 September 2010), INIA La Platina, Santiago, Chile.
IAI (n.d.) Available online: http://wwwsp.iai.int/index.php?option=com_content&view=article&id=13&Itemid=60 Viewed 24 September 2010.
Ministerio del Medio Ambiente/ División de Educación Ambiental. (2010). Personal communication.
MINECON. (1997). 1996-2000 Programa de Innovación Tecnológica. Ministerio de Economía, Chile. Available online: http://www.scribd.com/doc/7145297/Programa-InnovacionTecnologica-PIT. Viewed 05 September 2010.
MINECON. (2009). Política Nacional de Innovación para la competitividad, Orientaciones y Plan de Acción. División de Innovación del Ministerio de Economía, Chile.
Ockwell, D., Watson, J., MacKerron, G., Pal, P., Yamin, F., Vasudevan, N., & Mohanty, P. (2007). UK–India collaboration to identify the barriers to the transfer of low carbon energy technology. Final Report. SPRU University of Sussex, TERI and IDS.
Poch Ambiental. (2009). Estrategia y potenciales de transferencia tecnológica para el cambio climático. Commissioned by CORFO, Santiago, Chile.
Poch Ambiental. (2010). Personal communication with Ignacio Rebolledo, Carolina Urmeneta and Luis Costa, various dates, September 2010, Santiago, Chile.
PPEE (s.f.) Programa País de Eficiencia Energética. Institutional webpage. Available online: http://www.ppee.cl Viewed 15 September 2010.
Reyes, B. (2010). Personal Interview with Bernardo Reyes of the Instituto de Ecología Política (29 September 2010), Santiago, Chile.
Santibáñez, F. (2010). Personal Interview with Dr. Fernando Santibáñez (2 September 2010), Universidad de Chile, Santiago, Chile
SHOA. (2010). Personal Interview with professional staff at the Servicio Hidrográfico y Oceanográfico de la Armada de Chile, Valparaíso, Chile.
SHOA (s.f.) Institutional webpage. Available online: http://www.shoa.mil.cl/index.htm Viewed 13 September 2010.
PHOTO: MINISTRY OF THE AGRICULTURE
CHAPTER 6Barriers, Gaps and Needs For Financing, Technology and Capacity Building
253
Chapter 6
1. INTRODUCTION
For Chile, undertaking the great task of meeting its com-mitments under the United Nations Framework Conven-tion on Climate Change (UNFCCC) means overcoming ma-jor obstacles and gaps and covering needs for financing, technology and capacity building at the local level.
As a developing country, Chile has pledged to contribute to national and global efforts to mitigate and adapt to cli-mate change. The advances and achievements the coun-try has made to date are the result of both national efforts and international support. Collectively these contribu-tions have enabled the country to develop its environ-mental institutional structure, build technical capacities and develop new lines of work in this area, demonstrating the importance of support from developed countries to the achievement of the Convention’s ultimate objective.
Chile’s National Climate Change Action Plan (PANCC) was launched in 2008 and engaged several public institutions in efforts to address the issue of climate change. The Plan’s final goal for 2012 is to develop national and sector-spe-cific mitigation and adaptation plans, and to this end it mandates for the first time the allocation of funds and the development of technical capacities to address the issue of climate change in Chile.
In August 2010, the country voluntarily joined the global effort to mitigate greenhouse gases (GHGs) by presenting data for the Appendix II of the Copenhagen Accord to the
Convention Secretariat. In the document, Chile pledged to carry out mitigation actions that will allow the coun-try to reduce its emissions to 20 per cent below its ‘bu-siness as usual’ emissions growth trajectory in 2020, as projected from the year 2007. According to the document, most efforts will be focused in the energy efficiency, non-conventional renewable energies, and land use, land use change and forestry (LULUCF) sectors. The country will require both internal and external financing to meet this objective and will need to boost existing funding levels by incorporating new funding sources established by develo-ped countries for this purpose.
Beginning in 2011, the country will begin implementing actions mandated under the Cancun Accord, which inclu-de nationally appropriate mitigation actions (NAMAs) and the measurement, reporting and verification processes associated with these. In addition to this, the Accord man-dates that National Communications be prepared more frequently and that progress reports be issued every two years. The latter must include updated information on the national greenhouse gas inventory and on mitigation actions and financial support received. The Accord also encourages developing countries to draft low carbon de-velopment plans or strategies and invites all countries to increase their adaptation actions under the Cancun Adap-tation Framework. Chile is already taking action in virtually all of these areas with both internal and external support.
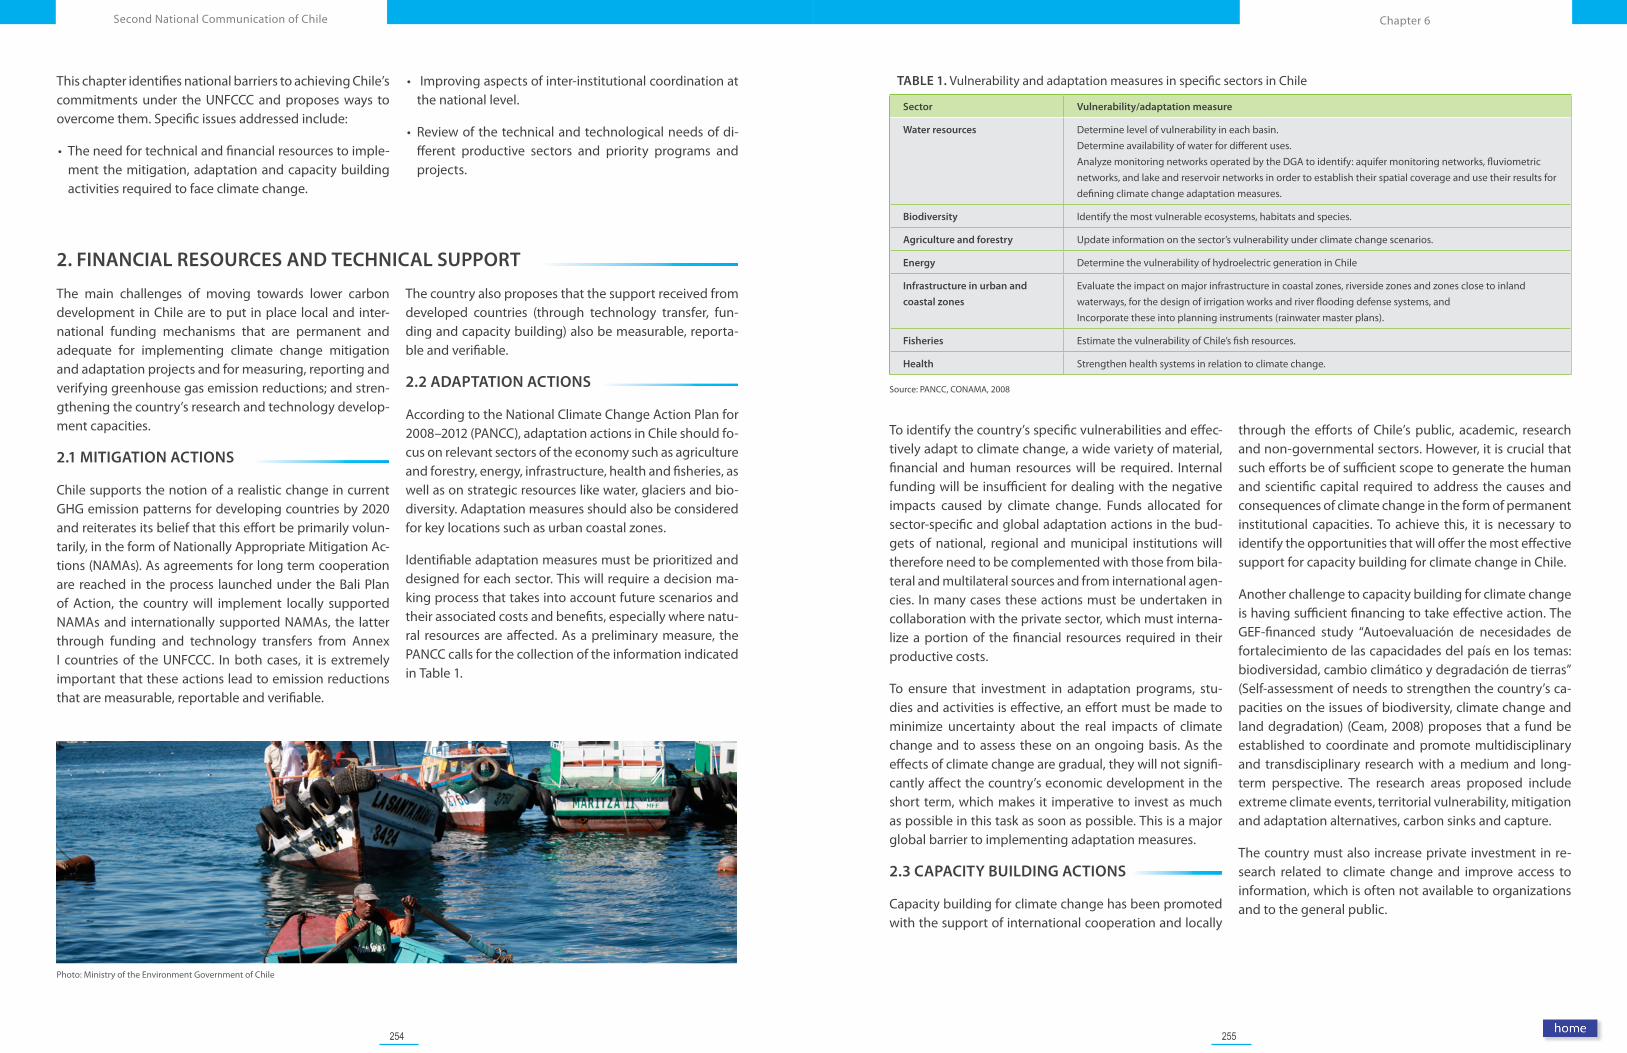
254 255
Chapter 6Second National Communication of Chile
TABLE 1. Vulnerability and adaptation measures in specific sectors in Chile
Sector Vulnerability/adaptation measure
Water resources Determine level of vulnerability in each basin.Determine availability of water for different uses.Analyze monitoring networks operated by the DGA to identify: aquifer monitoring networks, fluviometric networks, and lake and reservoir networks in order to establish their spatial coverage and use their results for defining climate change adaptation measures.
Biodiversity Identify the most vulnerable ecosystems, habitats and species.
Agriculture and forestry Update information on the sector’s vulnerability under climate change scenarios.
Energy Determine the vulnerability of hydroelectric generation in Chile
Infrastructure in urban and
coastal zones
Evaluate the impact on major infrastructure in coastal zones, riverside zones and zones close to inland waterways, for the design of irrigation works and river flooding defense systems, and Incorporate these into planning instruments (rainwater master plans).
Fisheries Estimate the vulnerability of Chile’s fish resources.
Health Strengthen health systems in relation to climate change.
Source: PANCC, CONAMA, 2008
To identify the country’s specific vulnerabilities and effec-tively adapt to climate change, a wide variety of material, financial and human resources will be required. Internal funding will be insufficient for dealing with the negative impacts caused by climate change. Funds allocated for sector-specific and global adaptation actions in the bud-gets of national, regional and municipal institutions will therefore need to be complemented with those from bila-teral and multilateral sources and from international agen-cies. In many cases these actions must be undertaken in collaboration with the private sector, which must interna-lize a portion of the financial resources required in their productive costs.
To ensure that investment in adaptation programs, stu-dies and activities is effective, an effort must be made to minimize uncertainty about the real impacts of climate change and to assess these on an ongoing basis. As the effects of climate change are gradual, they will not signifi-cantly affect the country’s economic development in the short term, which makes it imperative to invest as much as possible in this task as soon as possible. This is a major global barrier to implementing adaptation measures.
2.3 CAPACITY BUILDING ACTIONS
Capacity building for climate change has been promoted with the support of international cooperation and locally
through the efforts of Chile’s public, academic, research and non-governmental sectors. However, it is crucial that such efforts be of sufficient scope to generate the human and scientific capital required to address the causes and consequences of climate change in the form of permanent institutional capacities. To achieve this, it is necessary to identify the opportunities that will offer the most effective support for capacity building for climate change in Chile.
Another challenge to capacity building for climate change is having sufficient financing to take effective action. The GEF-financed study “Autoevaluación de necesidades de fortalecimiento de las capacidades del país en los temas: biodiversidad, cambio climático y degradación de tierras” (Self-assessment of needs to strengthen the country’s ca-pacities on the issues of biodiversity, climate change and land degradation) (Ceam, 2008) proposes that a fund be established to coordinate and promote multidisciplinary and transdisciplinary research with a medium and long-term perspective. The research areas proposed include extreme climate events, territorial vulnerability, mitigation and adaptation alternatives, carbon sinks and capture.
The country must also increase private investment in re-search related to climate change and improve access to information, which is often not available to organizations and to the general public.
Photo: Ministry of the Environment Government of Chile
This chapter identifies national barriers to achieving Chile’s commitments under the UNFCCC and proposes ways to overcome them. Specific issues addressed include:
• The need for technical and financial resources to imple-ment the mitigation, adaptation and capacity building activities required to face climate change.
• Improving aspects of inter-institutional coordination at the national level.
• Review of the technical and technological needs of di-fferent productive sectors and priority programs and projects.
2. FINANCIAL RESOURCES AND TECHNICAL SUPPORT
The main challenges of moving towards lower carbon development in Chile are to put in place local and inter-national funding mechanisms that are permanent and adequate for implementing climate change mitigation and adaptation projects and for measuring, reporting and verifying greenhouse gas emission reductions; and stren-gthening the country’s research and technology develop-ment capacities.
2.1 MITIGATION ACTIONS
Chile supports the notion of a realistic change in current GHG emission patterns for developing countries by 2020 and reiterates its belief that this effort be primarily volun-tarily, in the form of Nationally Appropriate Mitigation Ac-tions (NAMAs). As agreements for long term cooperation are reached in the process launched under the Bali Plan of Action, the country will implement locally supported NAMAs and internationally supported NAMAs, the latter through funding and technology transfers from Annex I countries of the UNFCCC. In both cases, it is extremely important that these actions lead to emission reductions that are measurable, reportable and verifiable.
The country also proposes that the support received from developed countries (through technology transfer, fun-ding and capacity building) also be measurable, reporta-ble and verifiable.
2.2 ADAPTATION ACTIONS
According to the National Climate Change Action Plan for 2008–2012 (PANCC), adaptation actions in Chile should fo-cus on relevant sectors of the economy such as agriculture and forestry, energy, infrastructure, health and fisheries, as well as on strategic resources like water, glaciers and bio-diversity. Adaptation measures should also be considered for key locations such as urban coastal zones.
Identifiable adaptation measures must be prioritized and designed for each sector. This will require a decision ma-king process that takes into account future scenarios and their associated costs and benefits, especially where natu-ral resources are affected. As a preliminary measure, the PANCC calls for the collection of the information indicated in Table 1.
256 257
Chapter 6Second National Communication of Chile
4.1 NATIONAL GREENHOUSE GAS EMISSIONS INVENTORY (INGEI)
The agreements made in Cancun under the UNFCCC sti-pulate that Non-Annex I countries should increase the fre-quency of their National Communications to once every four years, following the allocation of financial resources by Annex I countries. The agreement also proposes that developing nations, in accordance with their abilities and predetermined level of support, should submit a report every three years with updated greenhouse gas emissions, among other information. Chile is intending to launch an initiative to systematically improve the preparation of its greenhouse gas inventories, which is expected to signifi-cantly improve its ability to prepare these reports. To this end, the country is considering opening a National Gre-enhouse Gas Inventory Office to direct efforts to provide information on its emissions and removals. Before the initiative can be launched, however, some issues need to be defined, including the purview, technical and financial aspects, and organizational structure of this office.
Other aspects to be considered include improving those sectors defined as key categories in the INGEI in regard to the use of methods greater than the current level 1.
4.2 WATER RESOURCES IN CHILE EXPOSED TO CLIMATE CHANGE
The vulnerability of Chile’s water resources to local chan-ges occurring as a result of climate change is an issue of importance both strategically and in terms of sustaina-bility. A decrease in the availability of water will threaten productivity in the country and human development in general. The sections below present three areas in which work should be done in the short term to support water resource management in the context of climate change.
4.2.1 Collection and generation of information by water resource observation networks
While some progress has been made in collecting hydro-logical information at the national level, the level of cove-rage is sometimes low, or discontinuous, or only partially available owing to the lack of adequate mechanisms for collecting and storing that information in databases. In-deed, the national hydrological network needs to be mo-
dernized, expanded and updated and the different ways of measuring data must be integrated to prevent the pro-liferation of small local networks that are unsustainable in the long term and tend to be produced according to their own measurement criteria and are therefore difficult to standardize.
Another issue is that the information that is generated is not sufficiently disseminated or available. To be effective, the data obtained needs to be made publically available and published in a timely manner.
In regard to information use, the capacity for operating permanent models for water resource quality and quan-tity also needs to be improved. This will enable a more precise determination of the local and regional impacts of climate change and the establishment of adequate plans and programs to protect this resource.
Lastly, in terms of human resource development, the pro-fessional capacities associated with these tasks need to be strengthened and technical knowledge continually upda-ted.
4.2.2 Glaciers
According to the National Glacier Strategy (CECS, 2009) Chile has conducted studies on the variation, behavior and characteristics of its most emblematic glaciers. Howe-ver, the information is still too fragmented to draw con-clusions at the national level and there are gaps in some key areas that must be addressed, particularly in regard to assessing the water resources that derive from glaciers, their effect on the climate, and the risks associated with changes in Chile’s glaciers.
The main information needs in this area are to develop a system for collecting metadata and to update historic data sources, some of which are less precise and not di-rectly comparable with current information (CECS, 2009). The challenge in addressing these needs will be to increa-se the installed capacity for glacier research by developing an extensive national monitoring system. A system of this kind must overcome methodological limitations (stan-dardizing criteria and indicators) and logistical challenges while improving spatial and temporal representativeness at the same time.
Recently, the Ministry of Economy sent a legislative bill to Congress to expand the tax incentive for research and development (R+D). This bill, Law 20.241, seeks to increa-se private investment in R+D, including that associated
with climate change. The law provides tax incentives for promotional and other activities that foster private inves-tment in climate change related research.
3. IMPROVEMENTS NEEDED IN INTERINSTITUTIONAL COORDINATION
The governmental work undertaken in 2008 that conclu-ded with the formulation of the National Climate Change Action Plan generated consensus among different minis-tries regarding their responsibilities under the Plan. It also established strategic considerations for addressing clima-te change in Chile as well as priority lines of action for the implementation period. The process also highlighted the importance of coordinating efforts around the issue of climate change, which affects a multitude of sectors. One challenge Chile faces is to update, reorient and coordinate its sectoral policies in areas such as energy, public works, transportation, mining and agriculture to ensure that the-se contribute to climate change mitigation and adaptation efforts. The country must also take advantage of policies that, while not aimed specifically at climate change, pro-duce results related to that phenomenon.
In recent years, great strides have been made in Chile to improve interinstitutional coordination around the issue of climate change to include the governmental, academic, private, and organized civil society sectors, which have
displayed a growing commitment to the issue over the decade covered in this Communication.
In this initial stage the focus has been on sharing the infor-mation generated by these different sectors; but there is an urgent need to identify immediate priorities and the tech-nological, financial and capacity building needs of the sec-tors involved, as well as to coordinate the cross-sectoral po-licies that are currently being designed. In effect, the main challenge is to incorporate the climate variable into current development processes and into national, regional and sec-toral planning. The positions of Chile’s different productive sectors (industry, mining, agriculture, fisheries and forestry) on this issue are still heterogeneous and varied.
The country also needs to create suitable mechanisms for coordinating the work of different sectors and institutions involved in the implementation of Chile’s commitments under the UNFCCC. In this regard, it is important to better delineate institutional and sectoral roles, responsibilities and competencies, which will streamline and improve the effectiveness of actions undertaken.
4. SECTOR-SPECIFIC TECHNICAL AND TECHNOLOGICAL CAPACITY BUILDING NEEDS
To prepare to face the challenges of climate change, Chile must develop new capacities and enhance existing ones in a variety of arenas and sectors. The country must also integrate climate change concerns into its public policies, including those for economic growth and poverty eradi-cation. The development of a technological base and the transfer of technology that constitute responses to these concerns will play a special role in this regard. Care must be taken, however, that the resources needed to carry out such actions be made available; the contributions of in-
ternational cooperation agencies are highly important in this regard. Technology transfer in particular is crucial for accessing the innovations needed to face the many pro-blems associated with climate change.
In the coming years, individual sectors in Chile must also make an additional effort to build and strengthen capaci-ties related to climate change.
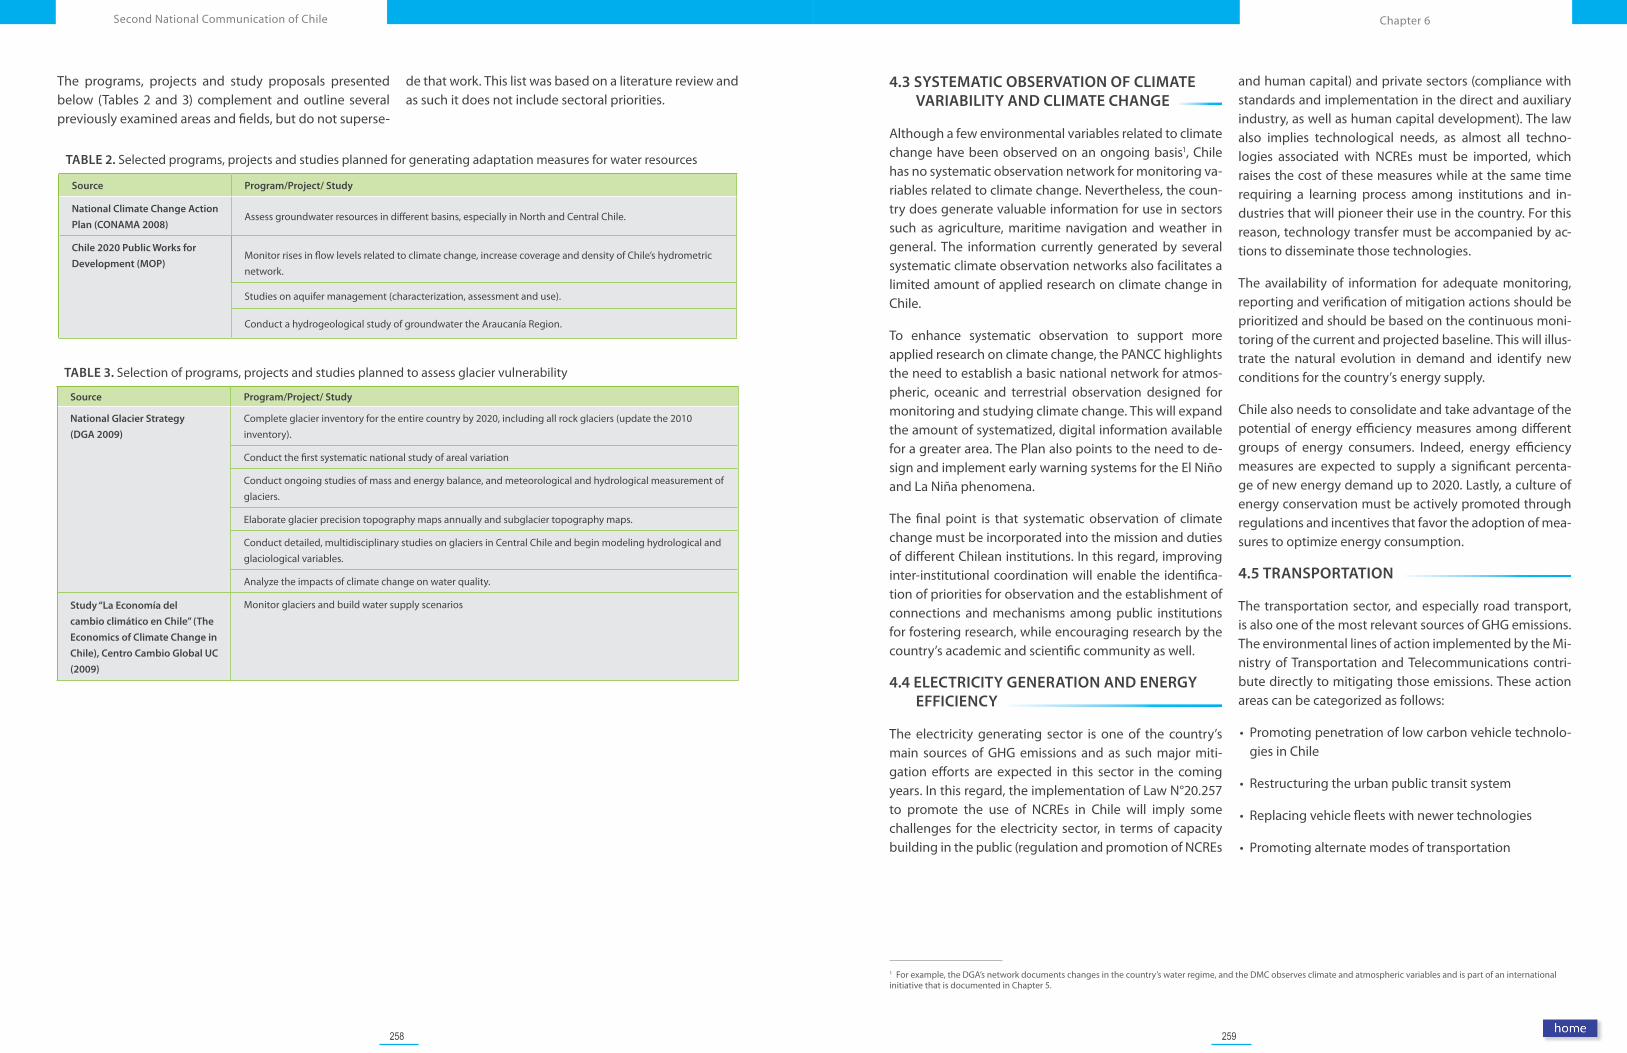
258 259
Chapter 6Second National Communication of Chile
4.3 SYSTEMATIC OBSERVATION OF CLIMATE VARIABILITY AND CLIMATE CHANGE
Although a few environmental variables related to climate change have been observed on an ongoing basis1, Chile has no systematic observation network for monitoring va-riables related to climate change. Nevertheless, the coun-try does generate valuable information for use in sectors such as agriculture, maritime navigation and weather in general. The information currently generated by several systematic climate observation networks also facilitates a limited amount of applied research on climate change in Chile.
To enhance systematic observation to support more applied research on climate change, the PANCC highlights the need to establish a basic national network for atmos-pheric, oceanic and terrestrial observation designed for monitoring and studying climate change. This will expand the amount of systematized, digital information available for a greater area. The Plan also points to the need to de-sign and implement early warning systems for the El Niño and La Niña phenomena.
The final point is that systematic observation of climate change must be incorporated into the mission and duties of different Chilean institutions. In this regard, improving inter-institutional coordination will enable the identifica-tion of priorities for observation and the establishment of connections and mechanisms among public institutions for fostering research, while encouraging research by the country’s academic and scientific community as well.
4.4 ELECTRICITY GENERATION AND ENERGY EFFICIENCY
The electricity generating sector is one of the country’s main sources of GHG emissions and as such major miti-gation efforts are expected in this sector in the coming years. In this regard, the implementation of Law N°20.257 to promote the use of NCREs in Chile will imply some challenges for the electricity sector, in terms of capacity building in the public (regulation and promotion of NCREs
and human capital) and private sectors (compliance with standards and implementation in the direct and auxiliary industry, as well as human capital development). The law also implies technological needs, as almost all techno-logies associated with NCREs must be imported, which raises the cost of these measures while at the same time requiring a learning process among institutions and in-dustries that will pioneer their use in the country. For this reason, technology transfer must be accompanied by ac-tions to disseminate those technologies.
The availability of information for adequate monitoring, reporting and verification of mitigation actions should be prioritized and should be based on the continuous moni-toring of the current and projected baseline. This will illus-trate the natural evolution in demand and identify new conditions for the country’s energy supply.
Chile also needs to consolidate and take advantage of the potential of energy efficiency measures among different groups of energy consumers. Indeed, energy efficiency measures are expected to supply a significant percenta-ge of new energy demand up to 2020. Lastly, a culture of energy conservation must be actively promoted through regulations and incentives that favor the adoption of mea-sures to optimize energy consumption.
4.5 TRANSPORTATION
The transportation sector, and especially road transport, is also one of the most relevant sources of GHG emissions. The environmental lines of action implemented by the Mi-nistry of Transportation and Telecommunications contri-bute directly to mitigating those emissions. These action areas can be categorized as follows:
• Promoting penetration of low carbon vehicle technolo-gies in Chile
• Restructuring the urban public transit system
• Replacing vehicle fleets with newer technologies
• Promoting alternate modes of transportation
1 For example, the DGA’s network documents changes in the country’s water regime, and the DMC observes climate and atmospheric variables and is part of an international initiative that is documented in Chapter 5.
The programs, projects and study proposals presented below (Tables 2 and 3) complement and outline several previously examined areas and fields, but do not superse-
de that work. This list was based on a literature review and as such it does not include sectoral priorities.
TABLE 2. Selected programs, projects and studies planned for generating adaptation measures for water resources
Source Program/Project/ Study
National Climate Change Action
Plan (CONAMA 2008)Assess groundwater resources in different basins, especially in North and Central Chile.
Chile 2020 Public Works for
Development (MOP)
Monitor rises in flow levels related to climate change, increase coverage and density of Chile’s hydrometric network.
Studies on aquifer management (characterization, assessment and use).
Conduct a hydrogeological study of groundwater the Araucanía Region.
TABLE 3. Selection of programs, projects and studies planned to assess glacier vulnerability
Source Program/Project/ Study
National Glacier Strategy
(DGA 2009)
Complete glacier inventory for the entire country by 2020, including all rock glaciers (update the 2010 inventory).
Conduct the first systematic national study of areal variation
Conduct ongoing studies of mass and energy balance, and meteorological and hydrological measurement of glaciers.
Elaborate glacier precision topography maps annually and subglacier topography maps.
Conduct detailed, multidisciplinary studies on glaciers in Central Chile and begin modeling hydrological and glaciological variables.
Analyze the impacts of climate change on water quality.
Study “La Economía del
cambio climático en Chile” (The
Economics of Climate Change in
Chile), Centro Cambio Global UC
(2009)
Monitor glaciers and build water supply scenarios
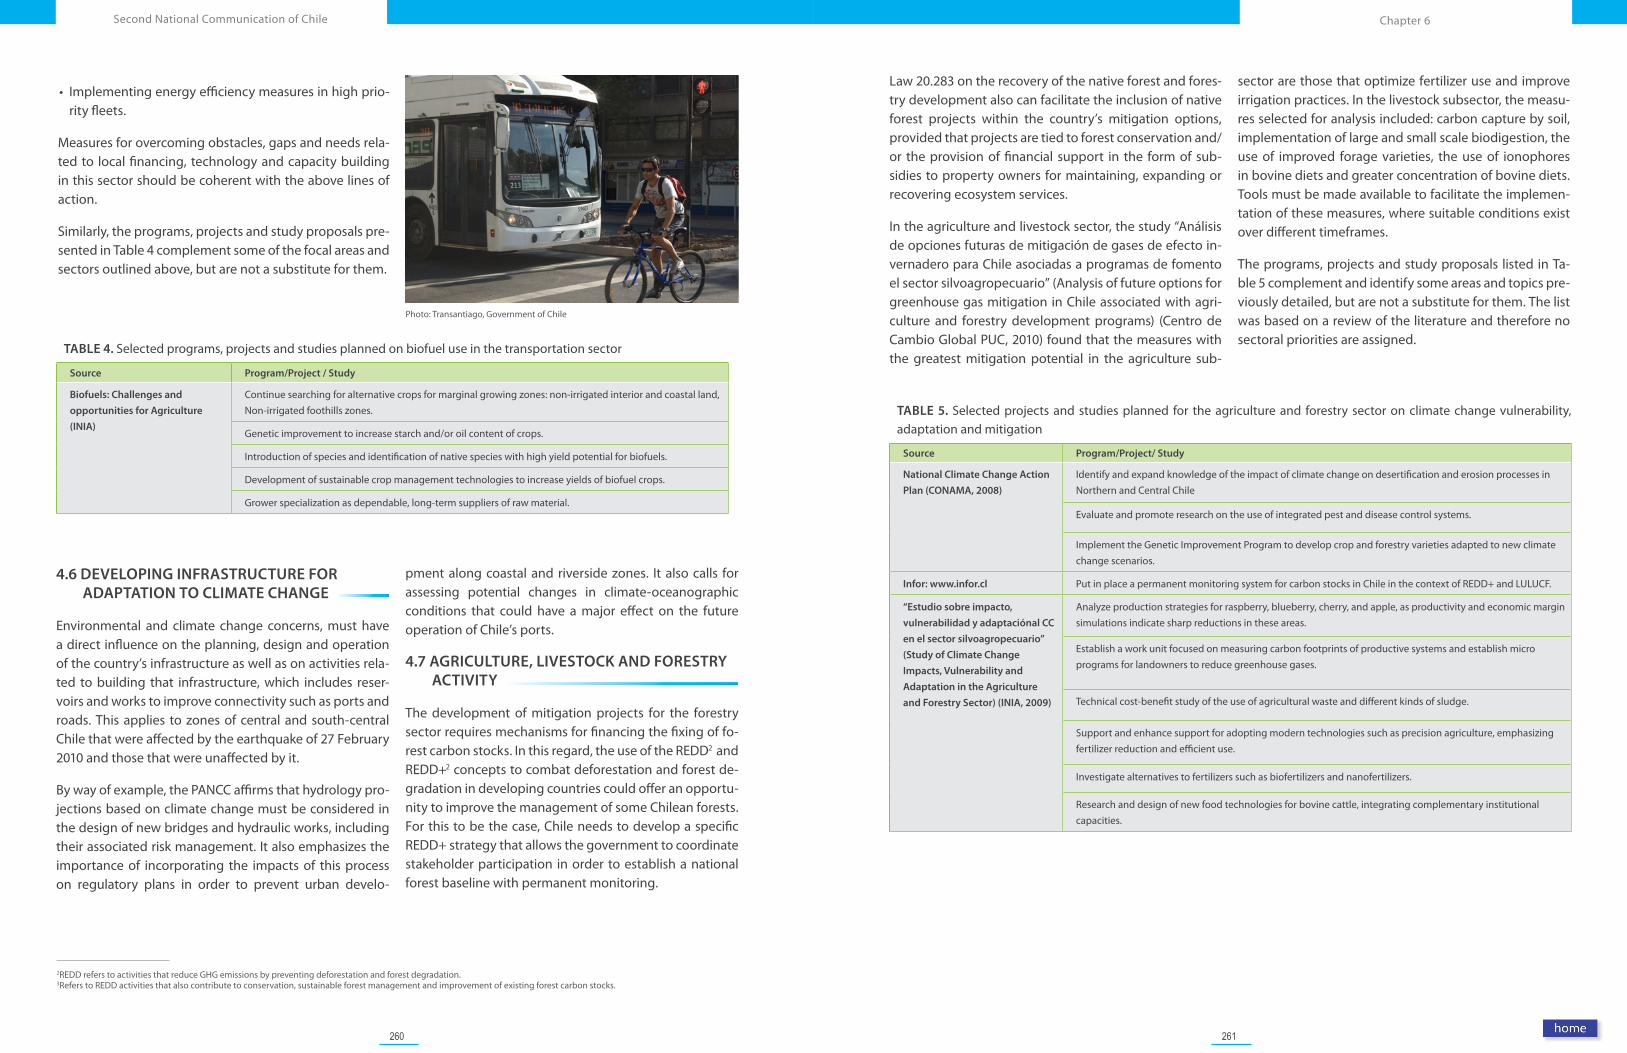
260 261
Chapter 6Second National Communication of Chile
Law 20.283 on the recovery of the native forest and fores-try development also can facilitate the inclusion of native forest projects within the country’s mitigation options, provided that projects are tied to forest conservation and/or the provision of financial support in the form of sub-sidies to property owners for maintaining, expanding or recovering ecosystem services.
In the agriculture and livestock sector, the study “Análisis de opciones futuras de mitigación de gases de efecto in-vernadero para Chile asociadas a programas de fomento el sector silvoagropecuario” (Analysis of future options for greenhouse gas mitigation in Chile associated with agri-culture and forestry development programs) (Centro de Cambio Global PUC, 2010) found that the measures with the greatest mitigation potential in the agriculture sub-
sector are those that optimize fertilizer use and improve irrigation practices. In the livestock subsector, the measu-res selected for analysis included: carbon capture by soil, implementation of large and small scale biodigestion, the use of improved forage varieties, the use of ionophores in bovine diets and greater concentration of bovine diets. Tools must be made available to facilitate the implemen-tation of these measures, where suitable conditions exist over different timeframes.
The programs, projects and study proposals listed in Ta-ble 5 complement and identify some areas and topics pre-viously detailed, but are not a substitute for them. The list was based on a review of the literature and therefore no sectoral priorities are assigned.
TABLE 5. Selected projects and studies planned for the agriculture and forestry sector on climate change vulnerability, adaptation and mitigation
Source Program/Project/ Study
National Climate Change Action
Plan (CONAMA, 2008)
Identify and expand knowledge of the impact of climate change on desertification and erosion processes in Northern and Central Chile
Evaluate and promote research on the use of integrated pest and disease control systems.
Implement the Genetic Improvement Program to develop crop and forestry varieties adapted to new climate change scenarios.
Infor: www.infor.cl Put in place a permanent monitoring system for carbon stocks in Chile in the context of REDD+ and LULUCF.
“Estudio sobre impacto,
vulnerabilidad y adaptaciónal CC
en el sector silvoagropecuario”
(Study of Climate Change
Impacts, Vulnerability and
Adaptation in the Agriculture
and Forestry Sector) (INIA, 2009)
Analyze production strategies for raspberry, blueberry, cherry, and apple, as productivity and economic margin simulations indicate sharp reductions in these areas.
Establish a work unit focused on measuring carbon footprints of productive systems and establish micro programs for landowners to reduce greenhouse gases.
Technical cost-benefit study of the use of agricultural waste and different kinds of sludge.
Support and enhance support for adopting modern technologies such as precision agriculture, emphasizing fertilizer reduction and efficient use.
Investigate alternatives to fertilizers such as biofertilizers and nanofertilizers.
Research and design of new food technologies for bovine cattle, integrating complementary institutional capacities.
4.6 DEVELOPING INFRASTRUCTURE FOR ADAPTATION TO CLIMATE CHANGE
Environmental and climate change concerns, must have a direct influence on the planning, design and operation of the country’s infrastructure as well as on activities rela-ted to building that infrastructure, which includes reser-voirs and works to improve connectivity such as ports and roads. This applies to zones of central and south-central Chile that were affected by the earthquake of 27 February 2010 and those that were unaffected by it.
By way of example, the PANCC affirms that hydrology pro-jections based on climate change must be considered in the design of new bridges and hydraulic works, including their associated risk management. It also emphasizes the importance of incorporating the impacts of this process on regulatory plans in order to prevent urban develo-
pment along coastal and riverside zones. It also calls for assessing potential changes in climate-oceanographic conditions that could have a major effect on the future operation of Chile’s ports.
4.7 AGRICULTURE, LIVESTOCK AND FORESTRY ACTIVITY
The development of mitigation projects for the forestry sector requires mechanisms for financing the fixing of fo-rest carbon stocks. In this regard, the use of the REDD2 and REDD+2 concepts to combat deforestation and forest de-gradation in developing countries could offer an opportu-nity to improve the management of some Chilean forests. For this to be the case, Chile needs to develop a specific REDD+ strategy that allows the government to coordinate stakeholder participation in order to establish a national forest baseline with permanent monitoring.
2REDD refers to activities that reduce GHG emissions by preventing deforestation and forest degradation.3Refers to REDD activities that also contribute to conservation, sustainable forest management and improvement of existing forest carbon stocks.
• Implementing energy efficiency measures in high prio-rity fleets.
Measures for overcoming obstacles, gaps and needs rela-ted to local financing, technology and capacity building in this sector should be coherent with the above lines of action.
Similarly, the programs, projects and study proposals pre-sented in Table 4 complement some of the focal areas and sectors outlined above, but are not a substitute for them.
TABLE 4. Selected programs, projects and studies planned on biofuel use in the transportation sector
Source Program/Project / Study
Biofuels: Challenges and
opportunities for Agriculture
(INIA)
Continue searching for alternative crops for marginal growing zones: non-irrigated interior and coastal land, Non-irrigated foothills zones.
Genetic improvement to increase starch and/or oil content of crops.
Introduction of species and identification of native species with high yield potential for biofuels.
Development of sustainable crop management technologies to increase yields of biofuel crops.
Grower specialization as dependable, long-term suppliers of raw material.
Photo: Transantiago, Government of Chile
262 263
Chapter 6Second National Communication of Chile
B I B L I O G R A P H Y
CEAM. (2008). Autoevaluación de Necesidades de Fortalecimiento de las Capacidades del País en los Temas: Biodiversidad, Cambio Climático y Degradación de Tierras. Information taken from the webpage: www.undp.org/mainstreaming/docs/ncsa/ncsareports/ finalreportsandplan/ncsa-chile-fr-ap-SP.pdf
CECS. (2009). Estrategia Nacional de Glaciares. Information taken from the webpage: http:// www.dga.cl/otros/documentos/ estrategiaGlaciares.pdf
Centro Cambio Global PUC. (2009) La Economía del cambio climático en Chile.
Centro de Cambio Global PUC. (2010). Análisis de opciones futuras de mitigación de gases de efecto invernadero para Chile asociadas a programas de fomento el sector silvoagropecuario.
Conama. (2008). Plan de acción nacional de cambio climático 2008-2012. Comisión Nacional de Medio Ambiente, Chile.
INIA. (2009). Biocombustibles: Desafíos y Oportunidades para la Agricultura. Information taken from the webpage: www.cnc.cl/pdfs/press/biocombustibles/INIA.pdf
Ministerio de Energía. (2010). Plan Nacional de Acción de Eficiencia Energética 2010-2020. Information taken from the webpage: www.ppee.cl/576/article-58632.html
MOP. (2010). Chile 2020 Obras Publicas para el Desarrollo. Information taken from the webpage: www.mop.cl/.../Chile_2020_Obras_Publicas_para_el_Desarrollo.pdf
4.8 BIODIVERSITY
To anticipate and mitigate the potential effects of climate change on Chile’s biological diversity, its impact on zones of high environmental value must be assessed, especially in regard to protected species. In addition, institutional mechanisms must be generated or strengthened to ade-quately address the challenges of global climate change to biodiversity.
Adequately assessing the responses of critical species, ecosystems and habitats depends heavily on the data available and the methodological approach used. In this regard, it is important to update and maintain as-sessments of climate change’s impact on biodiversity. This work should include agreed upon projections that have been estimated for Chile and particularly monitoring of species and habitats that could experience changes in
their distribution, with special attention paid to those that are protected.
It is also necessary to strengthen the current Protected Wilderness Area System by taking into account connec-tions that facilitate the migration of certain species. To accomplish this, it is essential to improve the represen-tativeness of the National System of State-protected Wil-derness Areas (SNASPE) in Central Chile, which will foster the protection of Mediterranean ecosystems and species that have been identified as the most vulnerable to clima-te change. This work must include projected changes in the distribution and density of those species. Coastal and marine areas must also be incorporated into the SNASPE. In regard to mitigation, it would be advisable to begin to evaluate the potential impact that the country’s protected wilderness areas could have on capturing emissions.
5. STRENGTHENING PARTICIPATION IN NATIONAL CLIMATE CHANGE ACTIONS
Including and reinforcing climate change issues in natio-nal priorities will require a renewed effort from a range of stakeholders. One challenge in this regard is to include more Chilean experts in the design and application of cli-mate change management instruments.
Additionally, a recent recurring demand in Chile has been to improve the participation of all of Chile’s regions in regional public policies and decisions related to climate change. In particular, considering that adaptation issues have a strong local component, ways must be found to incorporate local authorities, research centers with a re-
gional focus, regional trade associations, and regional civil society organizations, including local community groups. Depending on the origin of local GHG emissions, mitiga-tion measures may also have a regional component that could address the issue of emission reduction by applying measures on a different scale than that applied in national approaches.
The dissemination of information also has a special local component, which must be used and strengthened more proactively.
Related Documents