THIS REPORT CONTAINS ASSESSMENTS OF COMMODITY AND TRADE ISSUES MADE BY USDA STAFF AND NOT NECESSARILY STATEMENTS OF OFFICIAL U.S. GOVERNMENT POLICY - Date: GAIN Report Number: Post: Report Categories: Approved By: Prepared By: Report Highlights: Chile’s main supplier of dairy products is the United States, providing 25 percent of its supplies. The United States has more than quadrupled cheese exports (in value) to Chile from 2010 to 2016 in a wide variety of cheeses, including mozzarella, cheddar, and cream cheese. The Chilean dairy market continues to grow and evolve, providing new opportunities and niches for U.S. dairy products. Sergio Gonzalez, Agricultural Specialist Lazaro Sandoval, Agricultural Attaché Dairy and Products New Consumer Trends Create Opportunities for U.S. Dairy Products Santiago Chile CI1710 6/22/2017 Public Voluntary

Welcome message from author
This document is posted to help you gain knowledge. Please leave a comment to let me know what you think about it! Share it to your friends and learn new things together.
Transcript

THIS REPORT CONTAINS ASSESSMENTS OF COMMODITY AND TRADE ISSUES MADE BY
USDA STAFF AND NOT NECESSARILY STATEMENTS OF OFFICIAL U.S. GOVERNMENT
POLICY
-
Date:
GAIN Report Number:
Post:
Report Categories:
Approved By:
Prepared By:
Report Highlights:
Chile’s main supplier of dairy products is the United States, providing 25 percent of its supplies. The
United States has more than quadrupled cheese exports (in value) to Chile from 2010 to 2016 in a wide
variety of cheeses, including mozzarella, cheddar, and cream cheese. The Chilean dairy market
continues to grow and evolve, providing new opportunities and niches for U.S. dairy products.
Sergio Gonzalez, Agricultural Specialist
Lazaro Sandoval, Agricultural Attaché
Dairy and Products
New Consumer Trends Create Opportunities for U.S. Dairy
Products
Santiago
Chile
CI1710
6/22/2017
Public Voluntary
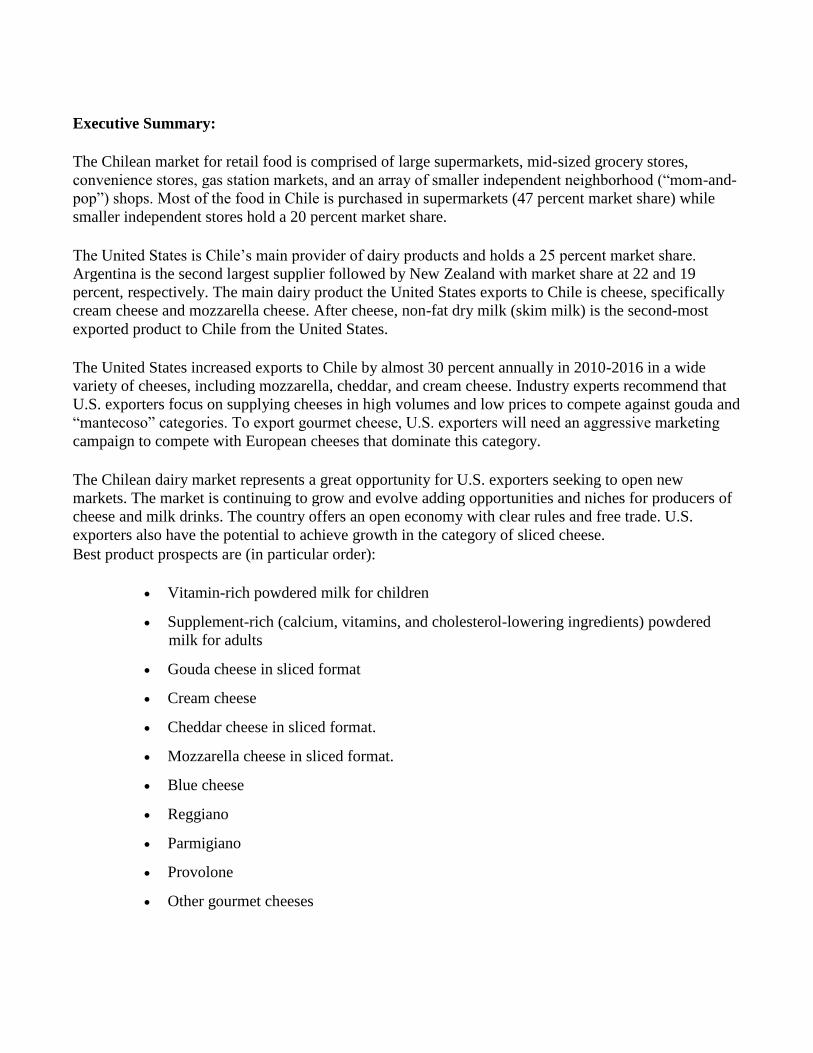
Executive Summary:
The Chilean market for retail food is comprised of large supermarkets, mid-sized grocery stores,
convenience stores, gas station markets, and an array of smaller independent neighborhood (“mom-and-
pop”) shops. Most of the food in Chile is purchased in supermarkets (47 percent market share) while
smaller independent stores hold a 20 percent market share.
The United States is Chile’s main provider of dairy products and holds a 25 percent market share.
Argentina is the second largest supplier followed by New Zealand with market share at 22 and 19
percent, respectively. The main dairy product the United States exports to Chile is cheese, specifically
cream cheese and mozzarella cheese. After cheese, non-fat dry milk (skim milk) is the second-most
exported product to Chile from the United States.
The United States increased exports to Chile by almost 30 percent annually in 2010-2016 in a wide
variety of cheeses, including mozzarella, cheddar, and cream cheese. Industry experts recommend that
U.S. exporters focus on supplying cheeses in high volumes and low prices to compete against gouda and
“mantecoso” categories. To export gourmet cheese, U.S. exporters will need an aggressive marketing
campaign to compete with European cheeses that dominate this category.
The Chilean dairy market represents a great opportunity for U.S. exporters seeking to open new
markets. The market is continuing to grow and evolve adding opportunities and niches for producers of
cheese and milk drinks. The country offers an open economy with clear rules and free trade. U.S.
exporters also have the potential to achieve growth in the category of sliced cheese.
Best product prospects are (in particular order):
Vitamin-rich powdered milk for children
Supplement-rich (calcium, vitamins, and cholesterol-lowering ingredients) powdered
milk for adults
Gouda cheese in sliced format
Cream cheese
Cheddar cheese in sliced format.
Mozzarella cheese in sliced format.
Blue cheese
Reggiano
Parmigiano
Provolone
Other gourmet cheeses

1. FOOD RETAIL MARKET
a. Overview
The Chilean market for retail food is composed of large supermarkets, mid-sized grocery stores,
convenience stores, gas station markets, and an array of smaller independent neighborhood (“mom-and-
pop”) shops. To get a sense of the size of the retail food market, the sub-sectors composed of
supermarket, grocery stores, convenience stores and gas-marts reported sales of US$14.0 billion and
US$14.8 billion in 2015 and 2016, respectively. These figures include other items sold in larger
supermarkets and hypermarkets such as clothing and kitchen appliances. Excluding those products,
sales of food products were US$9.5 billion in 2015.
Source: Based on information from the Instituto Nacional de Estadísticas (INE), 2017.
Note: Exchange rate 1 USD = 670 CPL
b. Market share by type of store
Over the years, consumer preferences for where they purchase their food have been evolving. In 2005,
supermarkets1 accounted for 61 percent of all food sold to consumers. By 2015, this number declined to
47 percent, due to diversification of the places where people purchased their food products (see graph
2). Nevertheless, supermarkets still have the largest market share. Mom and Pop stores also gained
market share during this time with their share increasing to 20 percent in 2015. Mid-sized supermarkets
more than doubled their market share from 6 percent in 2005 to 13 percent in 2015. Specialty stores
like butcher shops, fruit, and vegetable stores have a lower market share compared to the supermarkets,
but have also increased their market share since 2005.
1 Supermarkets in this report are stores that have average annual of US$ 1.6 million. Mid-size supermarkets have average
annual sales of US$ 135,000.

Source: Based on information from the Servicio de Impuestos Internos (SII), 2017.
Supermarket Chains:
There are eight major supermarket chains operating in Chile with varying presence in different cities
and different customer profiles. Although they all compete among each other, they follow different
strategies based on locations, depth, and scope of the product mix.
Unimarc, a medium-sized grocery store, has the largest number of stores across the country
operating in 294 locations.
Wal-Mart operates two brands: LIDER/LIDER EXPRESS and EKONO. LIDER, with 82
locations, represents the large hypermarkets and supermarkets, while EKONO, with 127
locations, is considered a small discount grocery store.
CENCOSUD also operates two distinct lines of supermarkets. SANTA ISABEL, a medium to
large grocery store with 128 locations, and JUMBO, the flagship hypermarket with 50 stores
nationwide.
Falabella, another large retailer, also operates a supermarket chain, TOTTUS, with 58 locations.
MONSERRAT and ERBI are two important chains with 34 and 33 locations, respectively.
Gas Marts or “mini-markets” are operated by three fuel companies: PETROBRAS, from Brazil, operates 89 marts called ESPACIO1.
COPEC, from Chile, operates 79 PRONTO locations.
SHELL, Anglo-Dutch, operates two lines of stores: SELECT, with 46 locations and UPA!, with
49 locations.

Wholesale markets have been on the rise totaling 146 locations: MAYORISTA 10 operates in eight regions with 64 locations.
ALVI operates in nine regions with 29 locations.
LA OFERTA has 12 locations, and Wal-Mart operates two different store brands.
CENTRAL MAYORISTA has 4 locations.
ACUENTA has 37 locations.
Mom and Pop stores, supermarkets, fruit and vegetables shops, and liquors stores are the most abundant
types of retail stores in Chile (graph 3). The most frequently found type of retail store is the independent
small neighborhood store with a total of 64,337 locations.
Source: Based on information from the Servicio de Impuestos Internos (SII), 2017.
Table 1 shows the advantages and challenges facing U.S. suppliers interested in exporting to Chile. The
table below shows the most important factors identified through this report based on the opinions of
industry experts.
Table 1: Advantages and Challenges for U.S. Exporters to Chile

Advantages Challenges Clear rules and transparent regulations
offered by the government allow for
fair competition.
Prices for U.S. products may still be higher than local products or
imports from nearby countries, even with the free trade agreement
(FTA). FOB prices for U.S. inputs tend to be at least 10% higher
than local prices for equivalent quality.
The purchasing power of Chile’s
middle and upper-middle income
consumers continues to rise.
Chile is a competitive market, which has free trade agreements that
cover 65 countries including the European Union, China, Central
America, and South American countries.
The U.S.-Chile Free Trade Agreement
resulted in 0% duties for all U.S.
agricultural products as of January 1,
2015.
There has been an increase in the market share of Chilean brands at
the expense of international ones.
Chile’s largest retailers have
operations in other Latin American
countries making it a gateway to other
regional markets.
Chile’s recent nutritional labeling law requires the labeling of
products if thresholds of sodium, saturated fat, sugar and calories
exceed certain levels set by the Ministry of Health.
American brands are well-regarded as
high quality with many well-known
brands already present in the market.
There is a lack of awareness about the different types and qualities
of U.S. products by Chilean consumers and importers e.g. premium
quality beef cuts, high quality cheeses and dairy products, health
food products. etc. that are not common. Thus, more marketing of
these products and their attributes will be necessary.
Equal playing field for imported and
local products.
Chile has one of the highest
percentages of non-traditional store
sales in Latin America, which allows
suppliers to target large retail chains
for larger volume sales.
U.S. food inputs are known for their
high quality and standards.
2. ENTRY STRATEGY INTO THE CHILEAN MARKET

The following steps highlight the main considerations that need to be taken when attempting to enter
into the Chilean retail food market.
Marketing Strategy
It is important to differentiate your product against other comparable products.
U.S. produced products have a very positive image and are viewed as high-quality and safe, but
U.S. dairy products are not as well-known as many of the European and local brands. An
aggressive and thoughtful marketing campaign will be necessary to exhibit the higher quality
and unique nature of U.S. products.
The appropriate marketing campaign would inform the consumer the origin of the brand. i.e.
American meat cuts are a good example of this strategy as they have an American flag on the
packaging that differentiates them from other available meats. Slogans and marketing materials
should be understood in Spanish. Be mindful of using slang. The word American coupled with a
flag can be favorably used in this market.
It is important that the product is well-displayed in supermarkets shelves with a strong restocking
partner, as not to lose space to other brands. To accomplish this requires a strong distribution
partner.
Other forms of product promotion proven useful in the Chilean market are consumer tastings,
promotional spokespersons, magazine ads, article placement, and ads in the supermarket´s own
product magazine.
Distribution Channels
Choose a distribution partner who has the coverage you are aiming for in Chile.
Dairy products are purchased using a combination of distribution channels. Smaller supermarket
chains and independent supermarkets can buy from a TRADER or IMPORTER or in some cases
directly from the SUPPLIER. Larger chains will still buy from a TRADER or IMPORTER, but
most will buy directly from the SUPPLIER. Finally, the smaller mom-and popshops will only
buy from a WHOLESALER.
Depending on the type of product being exported, suppliers should choose the distribution
channel that best fits their needs. It is recommended that the suppliers would be best helped if
they find a distribution partner with wide coverage and that specializes in their product.
Customer Preferences
Producers and exporters are encouraged to review customer preferences and consumption pattern
trends to see if the best product is being offered. As reviewed in this report, there are specific
tastes and preferences regarding dairy products that may differ from the U.S. consumer.
An example of this is the consumption of liquid milk. While U.S. consumers prefer fresh milk
which has a short shelf life; Chilean consumers buy milk in tetra packs that last for months if
unopened.
There is a wide variety of food products in Chile’s retail sector, due to the market openness.
Thus, the U.S. exporter must be clear as to what role their particular product will have in the
market and how will it be positioned in relation to other competitors.

3. MARKET STRUCTURE, SIZE AND TRENDS
a. Distribution Channel Flow from Producer to Final Consumer
The diagram below shows the different ways in which dairy products from the United States reach the
Chilean consumer. The most important flow is from the producer to the importer/distributor and onto
supermarkets chains. From supermarkets, the products reach the consumer directly, and via wholesalers,
they arrive to independent stores and into the hands of the final consumer.
There are several combinations of flow depending on the products, quantities and type of retailer. Gas
marts and convenience stores buy their products mainly from local distributers who may also buy from
a trader.
The producers are encouraged to define the markets they want to reach and find the proper pathway.
The main competitive threat for imported American dairy products is the availability of local production
as well as production from neighboring countries such as Argentina.
b. Dairy Market Size
Because obesity has become a significant concern in Chile, the Chilean government and NGOs have
been promoting healthier products for local customers. Dairy consumption in Chile was 146 liters per
capita in 2013. Per capita milk consumption has shown a yearly 1.6 percent increase from 2001. Cheese
consumption has grown 5.5 percent to 9.1 kg/per capita. Dairy consumption has been increasing steadily
as Chile’s per capita income increases. Population is expected to grow at a 0.97 percent per year in
2015-2020, reaching a total of 18,896,684 citizens in 2020 (INE, 2016).
c. Local Production

Milk production in Chile is concentrated in the southern regions of Los Lagos and Los Rios, which
account for 76 percent of total domestic milk production. Milk production also takes place in the regions
of Bio Bio, Araucaria, and Metropolitana.
Total milk received in 2016 decreased by 1.9 percent compared to 2015. Production of dairy products
increased in all categories in the same period, except for dry milk. Moreover, whole dry milk production
decreased by 17.1 percent in 2016 compared to 2015. According to Post contacts, the main reason for
the decrease in milk production, specifically dry milk, is due to low international prices of dry milk
which lowers domestic prices and impacts local producers directly.
Table 2: Dairy Production TABLE 1 - Dairy Production
Total
Receive
d by
Industr
y
(Millio
n liters)
Fluid
Milk
(Millio
n
Liters)
Whol
e Dry
Milk
(MT)
Non-
Fat
Dry
Milk
(MT)
Whe
y
(MT)
Butte
r
(MT)
Chees
e
(MT)
Farme
rs
Cheese
(MT)
Yogur
t
(Millio
n
Liters)
Condense
d Milk
(MT)
2002 1,605
296
58,52
4 9,186
10,04
1
11,55
1
53,07
5 7,480 127 24,190
2003 1,563
293
52,92
9 8,938
15,24
0
10,84
9
53,03
7 7,555 139 30,558
2004 1,676
289
53,45
9
10,17
5
17,03
7
13,08
4
58,84
9 8,296 160 38,698
2005 1,723
298
50,88
7
11,90
6
23,85
0
14,65
5
67,17
6 10,507 189 39,645
2006 1,818
319
53,72
5
15,76
6
24,30
3
17,15
7
62,07
2 9,088 158 43,426
2007 1,871
330
57,44
8
16,75
6
27,79
1
18,22
9
61,74
5 8,579 163 45,287
2008 1,972
323
85,37
0
17,58
5
24,84
9
16,76
5
57,36
9 7,960 178 41,501
2009 1,773
341
58,41
0
15,02
1
23,97
3
17,10
2
56,52
6 8,139 192 33,255
2010 1,896
367
63,15
4
19,16
8
29,23
2
21,08
6
64,55
8 8,349 199 36,829
2011 2,104
369
73,98
0
18,83
3
26,79
0
21,04
1
80,62
0 9,135 222 34,579
2012 2,119
389
73,94
4
19,25
2
26,72
1
22,20
5
82,30
7 9,049 230 39,828
2013 2,149
398
82,05
9
13,93
4
23,36
5
21,56
6
89,04
6 9,104 229 36,302
2014 2,149
423
75,41
9
28,09
1
21,48
0
21,87
4
81,57
4 9,133 227 36,751
2015 2,029
427
59,95
0
27,35
2
21,55
9
22,37
4
81,65
0 9,197 230 39,093
2016 1,991 429
50,38
6
26,51
4
24,71
6
22,59
1
81,23
4 9,856 244 40,604
Variation
(2016/201
5)
-1.9% 0.6%
-
16.0
%
-3.1% 14.6
% 1.0% -0.5% 7.2% 6.2% 3.9%
Source: Odepa, 2017.
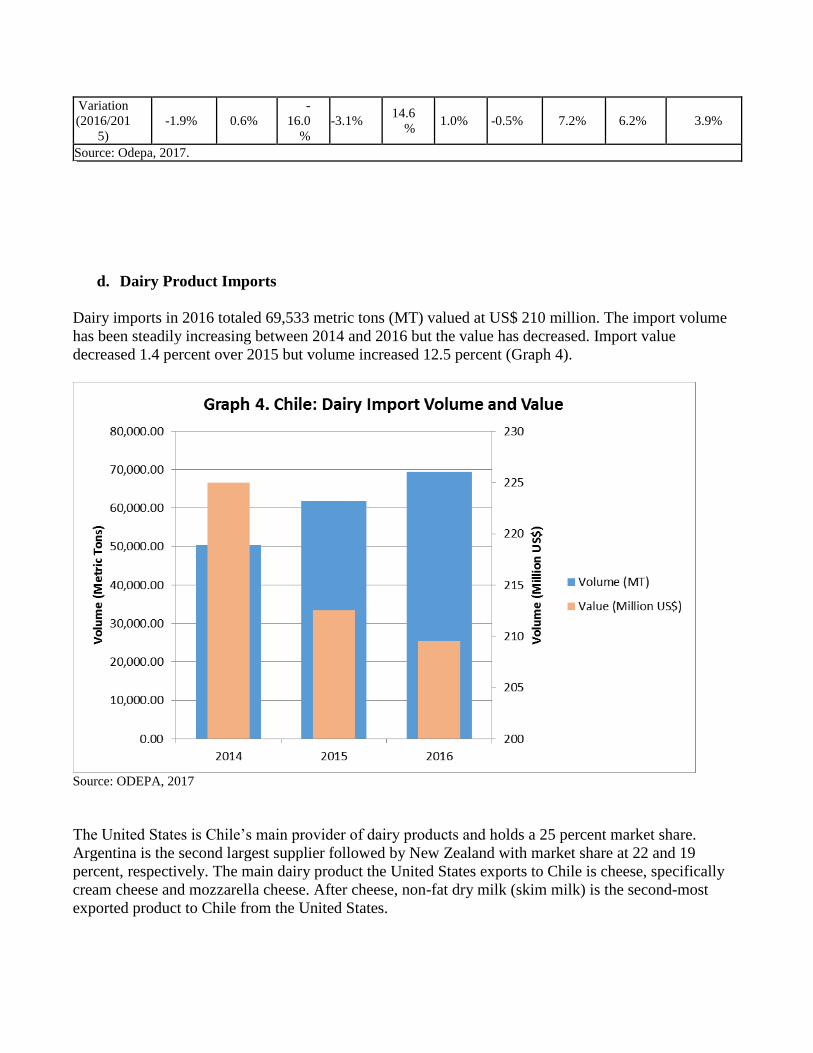
d. Dairy Product Imports
Dairy imports in 2016 totaled 69,533 metric tons (MT) valued at US$ 210 million. The import volume
has been steadily increasing between 2014 and 2016 but the value has decreased. Import value
decreased 1.4 percent over 2015 but volume increased 12.5 percent (Graph 4).
Source: ODEPA, 2017
The United States is Chile’s main provider of dairy products and holds a 25 percent market share.
Argentina is the second largest supplier followed by New Zealand with market share at 22 and 19
percent, respectively. The main dairy product the United States exports to Chile is cheese, specifically
cream cheese and mozzarella cheese. After cheese, non-fat dry milk (skim milk) is the second-most
exported product to Chile from the United States.

Table 3. Chile: Dairy Import Value by Country of Origin
Country of
Origin Value 2015 (million
US$) Value 2016 (million
US$) Variation
(%) Market Share
(%) United States 53 52 -1% 25%
Argentina 41 46 11% 22%
New Zealand 40 41 1% 19%
Germany 6 14 139% 7%
France 5 11 105% 5%
Mexico 14 8 -45% 4%
Uruguay 18 7 -59% 4%
Netherlands 5 6 20% 3%
Brazil 6 6 -2% 3%
Ireland 6 5 -27% 2%
Others 17 14 -20% 7%
Total 213 210 -1% 100% Source: ODEPA, 2017.
The two main products imported by Chile are dry milk and cheese. These products accounted for 77
percent of all dairy imports in 2016. Cheese accounted for 57 percent of imports followed by dry milk
(all types) at 20 percent, malted milk (8 percent) and butter (8 percent). Yogurt, considered a “non-
tradable” product, accounts for less than 1 percent of imports. Yogurt imports from Argentina ended in
2012 and Peru is now the main supplier of the product. There are new types of long-life yogurt being
imported from Spain, but not in a significant quantity. Dry milk is predominantly imported from three
countries: United States, Argentina, and New Zealand.

Source: ODEPA, 2017
Cheese is the imported dairy product category, representing 57 percent of dairy imports with 26 percent
annual growth rate. The top imported cheeses over the 2010-2015 period are gouda, cream cheese,
mozzarella, and cheddar. Industry sources believe that cheddar cheese has the most potential for import
growth from the United States.

Source: ODEPA, 2017
Dry milk imports make up 91 percent of total milk imports. US$ 25.3 million of non-fat dry milk and
US$ 16.8 million of whole dry milk were imported in 2016. In 2016, non-fat dry milk import value
increased by 1.2 percent while whole dry milk imports decreased by 19.8 percent.
It must be noted that unlike cheese the market for milk is much more complicated and dynamic. There is
a complex web of imports and exports fueled by price differences around the world. Local producers
can import powdered milk and rehydrate it for sell as liquid milk, if the product is cheaper abroad. Chile
is a net exporter of whole dried milk and an importer of skim dried milk. This is because international
prices for whole dry milk are higher than domestic prices. In addition, Chile exports whole dried milk to
Venezuela, Cuba, Colombia and China.

Source: ODEPA, 2017
4. KEY SECTOR TRENDS
Per capita milk liter-equivalent grew 11 percent in a five-year period from 2008 to 2013 (Odepa, 2014).
Industry analysts’ project 10 percent growth in the next five years and are expected to continue at this
rate over the next decade. This growth rate is the result of higher income that has transformed
consumption patterns resulting varying tastes and preferences for food products including dairy
products. This change in consumption patterns over the past decade are reflected in the ongoing
evolution of consumers and the sophistication of their tastes and preferences. This is resulting in greater
demand for products with higher standards in quality and variety. Consumers’ desire for better flavors
and healthier foods are also part of these changes. As middle-class purchasing power and income grows,
so does the taste for imported specialty cheese, value-added milk drinks, and yogurts. This section will
review some of the important trends being experienced in the milk and cheese categories.
a. Milk:

Milk consumption has been steady. Powdered milk consumption has shifted more towards
children. Around 78 percent of powdered milk sold is targeted to minors under 7 years old.
Consumption of supplement-rich milk for seniors is expected to increase as that segment of the
population grows.
Consumption of “milk-like products” such as soy milk, almond milk, and coconut milk are on
the rise. They are sold as in the same product of other traditional dairy products.
Another trend observed at supermarkets is the reversal to more natural products. Today,
virtually all milk is pasteurized and sold in Tetra pack, but sources say this trend may shift
towards fresh milk consumption in the future. Nonetheless, Chileans are traditionally used to
shelf-stable tetra pack milk that has a much longer shelf life compared to fresh milk.
Supermarkets, like Jumbo and Tottus, are beginning to sell fresh milk from Fundo Boyen, a
producer from the region of Chillan. This milk only lasts a few days compared to the months
that Tetra pack milk lasts, but is expected to have a better taste.
Value-added milk is also trending. This product incorporates vitamins, calcium and cholesterol
lowering ingredients. Reduced fat and skim milk are also increasing their market share, reaching
60 percent of all milk sales.
Butter has increased its share of consumption at the expense of margarine. Supermarkets are
also looking for value-added yogurt to introduce onto their shelves.
The dairy consumer is looking for products that are rich in taste, with low-caloric content. In this
segment, the new nutritional labeling law should be considered, since it requires labeling products that
have high contents of sugars, sodium, calories, or saturated fats (see Report) Many suppliers have
altered their product content to limit the number of labels shown on the product label. One of the
reasons for this is that if a product has the stop-sign label, the product cannot be targeted to children
with child-friendly images.
b. Cheese:
Gouda and “Mantecoso” in sliced form are by far the highest selling cheeses in the country. They are
also one of the less expensive types of cheese available in the market and are very mild in flavor
compared to imported cheeses. Overall cheese imports have increase rapidly over the last seven years.
The top imported cheese is Gouda whose imports have grown 54 percent in volume and 47.5 percent in
value during this period.
Although Gouda and “Montecoso” cheeses are still prominent in the market, there is growing
consumption of gourmet cheeses, such as, blue cheese, brie, camembert, which are mostly imported
from France at this time. Industry experts expect that consumption of these cheeses will keep growing
as tastes continue to evolve. The table below shows the growth rate over the period from 2010 to 2015
and the share of imports of some important cheese types.
Table 4. Chile: Cheese Imports by Type

Products Volume (MT)
Average
Growth Rate Value (Million
US$) Average
Growth Rate
2010 2016 % 2010 2016 %
Gouda 1,514.80 16,551.10 49.0% 6.11 45.38 39.7%
Cream Cheese 1,463.50 6,468.10 28.1% 5.41 25.48 29.5%
Mozzarella 1,840.20 3,229.40 9.8% 7.81 12.42 8.0%
Processed Cheese, Not Grated Or
Powdered Fromages 575.50 2,505.00 27.8% 2.48 10.65 27.5%
Other Types of Cheese 1,492.70 1,995.80 5.0% 7.68 10.50 5.3%
Cheddar 207.30 853.70 26.6% 0.94 3.02 21.6%
Grated/Powdered Cheese 179.20 1,358.90 40.2% 1.34 6.55 30.3%
Cheese, Blue-Veined 140.60 264.10 11.1% 1.06 1.94 10.5%
Fresh Cheese 155.40 596.70 25.1% 0.75 1.97 17.3%
Edam 54.30 37.70 -5.9% 0.28 0.27 -1.1%
Parmesan 106.40 138.70 4.5% 0.49 0.88 10.3%
Other Fresh Cheese 14.70 42.20 19.2% 0.13 0.22 9.0%
Total 7,744.50 34,041.40 28.0% 34.49 119.27 23.0%
Source; ODEPA, 2017
The United States has increased exports to Chile by almost 30 percent annually in 2010-2016 in a wide
variety of cheeses, which include mozzarella, cheddar, and cream cheese. Industry experts recommend
that U.S. producers export cheeses in high volumes at lower prices to compete in the Gouda and
“Mantecoso” categories. If they are to export gourmet cheeses, they will need an aggressive marketing
campaign as European cheese dominates that category.
Table 5: Opportunities and Challenges for U.S. Cheese Products. Store type Opportunity Challenge
Hypermarkets/Supermarkets Specialty cheese Attractive price. There is a need for more variety in gourmet
cheese but prices must be competitive.
Smaller grocery store Self-service. Small
format Product sells well in small format/packaging. Daily and massive
consumption.
Wholesaler Large bags (5 kilos)
and sliced Price discount system. Must be willing to sell in large volumes.
Independent mom-and-pop Large bags from
wholesaler New cheeses with a low price. These stores aspire to have some
variety other than Gouda and Mantecoso such as cheddar and
mozzarella.
Gas mart Self-service.
Packaging Very small format. Limited variety of dairy products.
5. MAIN PRODUCING COMPANIES

Dairy production in Chile is dominated by four large producers followed by a number of smaller ones.
Production records show about 16 total producers with some of the smaller ones exiting the market. The
four major producers account for more than 86 percent of the production, leaving fewer than 11 percent
to the next four producers and a remaining 2 percent for all other smaller producers. Colun, Soprole,
Watt´s, and Nestle Chile dominate the market, with very visible product preference in all supermarkets.
Colún and Soprole use their name as brands while Watt’s uses “Calo” and “Lonco Leche” as their main
brands. Nestle’s main milk brand is the ubiquitous “Leche Nido”. Of the four largest producers, only
Nestle has shown a decrease in production with a reduction of slightly over 3 percent per year over the
period of 2010-2015. Colun and Watt´s both enjoyed over 6 percent of annual growth during the same
period with Soprole growing only 2 percent per year. In contrast, mid-sized producers - Surlat, Valle
Verde, Quillayes, and Lacteos del Sur - have a combined growth rate of 2.6 percent over the period.
In contrast, smaller producers have been shrinking production and disappearing all together. The
combined production of this group has fallen by 80 percent since 2010 to just over 5,000 MT in 2015.
This is the result of the economies of scale that larger producers have taken advantage of and
competition from imports. Price negotiations with larger supermarket have also contributed to this
decline.
Table 6: Producer Profile Producer Name Ownership Business Model Brands
COLUN (Cooperativa
Agrícola y Lechera de la
Unión Limitada) Chile
All dairy family products. Strategy: Offers a
wide variety of products and distribution
network.
Colún, Rio Bueno,
Fundo Los Alerces,
Vilib
Soprole (Sociedad de
Productores de Leche) New Zealand
Dairy Board All dairy family products. Strategy: Healthy
and high quality products.
Soprole, Dos
Álamos, Quilque,
Next
Watts S.A. Chile All dairy family products. Strategy:
Distribution, high quality product.
Regimel, Calo, Las
Parcelas de Valdivia,
Lonco Leche
NESTLE Chile Switzerland
All dairy family products. Strategy: improve
life quality by providing specific products for
each family member.
Nestle, Savory, Nido,
Chamito, Chandelle,
Chiquitín.
SURLAT S.A. Chile / Spain
All dairy family products. Strategy: In
addition to high quality traditional products.
Surlat offers a lactose-free line of products and
probiotic products. Surlat
6. IMPORT/EXPORT COSTS
The cost of exporting to Chile and the complementary costs of importing from the U.S. will vary greatly
depending on different factors. Below there is a review to be used as a general guide and to give an idea

of the import export process and associated costs. The producer should consult with a shipping agent for
more detailed information regarding their merchandise.
a. Factors Affecting Import Costs
The following are factors affecting import costs:
Value of products
Port of exit
Port of entry
Type of freight (frozen, cold, room temperature)
Importers’ agreements with ships or air cargo carriers
Quantity shipped
All associated costs are added to and reflected in the final product for sale to the public.
The U.S.-Chile free trade agreement (FTA) allows duty free access to U.S. products as of
January 1, 2015. Products need to meet the relevant rules of origin to be eligible. All shipments
must be accompanied by a certificate of origin.
Importers can use three incoterms. FOB, CIF and Ex-works depending on the negotiations with
each supplier.
The import tariff for dairy products, as for all products coming from the U.S. to Chile is 0%
The governmental agency overseeing the import of dairy products is the Agricultural and
Livestock Service of the Ministry of Agriculture (SAG) http://www.sag.cl
Note:
FOB: Free on board. The producer pays freight and insurance up to exit port.
CIF: Cost, insurance and freight. The producer pays for associated cost up to the port of entry.
Ex-works: The importer covers the costs from the point of production.
b. Taxes
All dairy products imported to Chile, from any origin, are subject to pay taxes upon arrival to the port of
entry. Taxes must be payed at the customs office of the port of entry, the tax will be calculated
according to the CIF value of the shipment.
There are two taxes to be paid at customs, the first one is the value Added Tax (VAT) that corresponds
to the 19% of the CIF value and the second is the import tariff which is zero for products coming from
the United States.
Example:
For a CIF value of $ 1,000
Import tariff (0%) = 0
VAT (19%) (over the CIF plus the import tariff) ($1,000 + 0) = 190
Total tax = 1,190.
7. MARKET ACCESS
All dairy products from the United States are eligible to be exported to Chile; they just need to comply
with existing regulations. The plant from which the product is derived from needs to be included in the

FDA list of plants, additional guidance on FDA requirements can be found at the following link.
a. Certifications
There are two Chilean Ministries that will review dairy product imports, and both require a specific
certification for the product. The Ministry of Agriculture through its Servico Agricola y Ganadero
(SAG) needs to make sure that the product is safe in order to achieve certification. The sanitary
certification can be requested at the Agricultural and Marketing Service of the U.S. Department of
Agriculture (AMS/USDA) online at the following link. In addition, the Ministry of Health through its
Regional Office (SEREMI de Salud) will verify the safety of the product for human consumption and
will require a certificate of Free Sale that can be obtain at the state offices of the Department of
Commerce or Department of Agriculture of each state.
b. Importation Process
The importation process consists of the steps needed to be taken in order to get the final import approval
and be able to sell the product to the final consumer.
First, obtain the clearance from customs and pay the tax.
Second, obtain clearance from SAG.
SAG will clear the documentation and verify that all requirements of certification are in
order.
SAG will perform a physical review of the shipment and will match the information on the documents
and the one provided on the label of the cartons. If everything is in order, SAG will issue a Certificate of
Customs Destination (Certificado de Destinación Aduanera, CDA); this document authorizes the
movement of the goods from the customs office to a warehouse where it will remain until the Use and
Disposal certificate is issued. The document must contain the address of the warehouse, the transport
route, and conditions of the products. The deadline for approval is 12 hours.
Other information requested in this certificate is:
-Information on the importer
-Information on the customs office
-Information on the warehouse destination
-Information on the Transport Company and the route it will take.
Third, obtain clearance from SEREMI de Salud
SEREMI de Salud will review the documents, specifically the Certificate of Free Sale
and might take samples for laboratory testing. If everything is in order, they will issue a
Certificate of Use and Disposal, this document is the authorization given by the Ministry
of Health that permits to sale the product to the public.
Samples of the Spanish label must be submitted and approved by the Ministry of Health
in advance and must be placed in the product before putting it for public display.
c. Labeling
The labeling of the products must contain the following information before it reaches the final
consumer.
Production date and shelf-life expiration dates
Ingredients
Additives with code and original name (SAG and RSA regulations)
Storage and temperature
Technical data sheet to support information on the label
Must be in Spanish
Must include the Chilean-regulated “STOP” labels if applicable.
Must contain information with a reference to 100 grams and per portion.
Must contain the different types of fats present in the product.
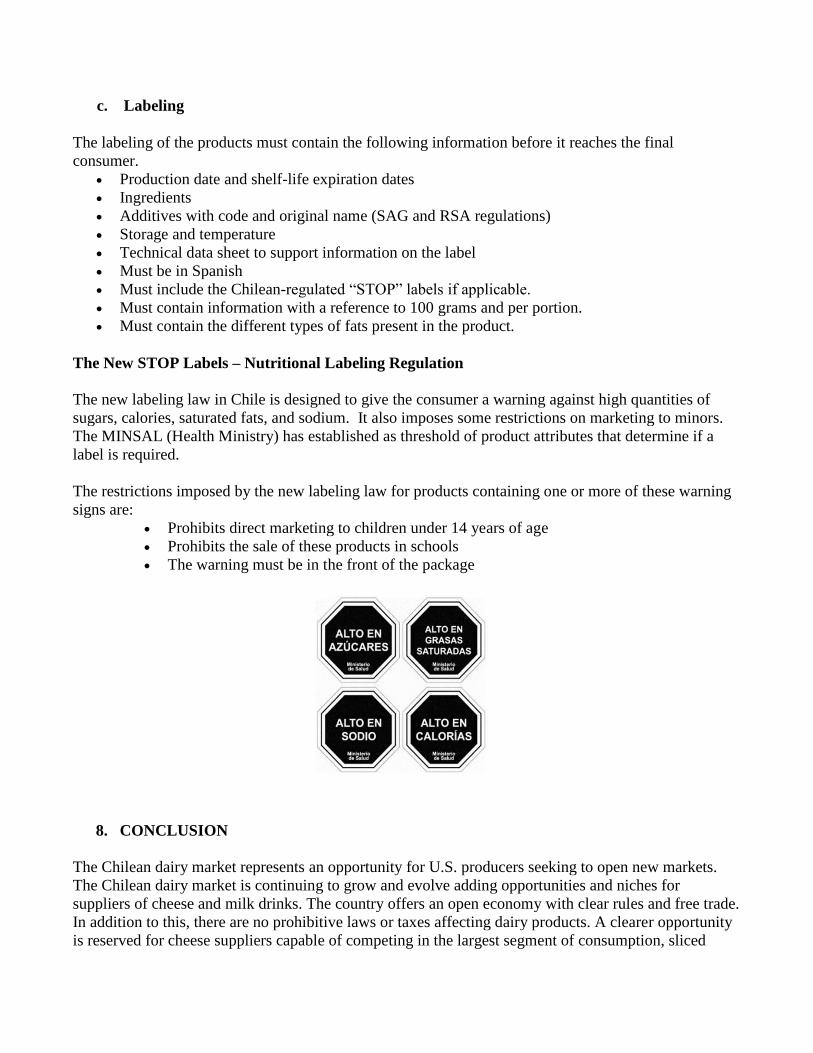
The New STOP Labels – Nutritional Labeling Regulation
The new labeling law in Chile is designed to give the consumer a warning against high quantities of
sugars, calories, saturated fats, and sodium. It also imposes some restrictions on marketing to minors.
The MINSAL (Health Ministry) has established as threshold of product attributes that determine if a
label is required.
The restrictions imposed by the new labeling law for products containing one or more of these warning
signs are:
Prohibits direct marketing to children under 14 years of age
Prohibits the sale of these products in schools
The warning must be in the front of the package
8. CONCLUSION
The Chilean dairy market represents an opportunity for U.S. producers seeking to open new markets.
The Chilean dairy market is continuing to grow and evolve adding opportunities and niches for
suppliers of cheese and milk drinks. The country offers an open economy with clear rules and free trade.
In addition to this, there are no prohibitive laws or taxes affecting dairy products. A clearer opportunity
is reserved for cheese suppliers capable of competing in the largest segment of consumption, sliced

cheese. Below are the best product prospects found for U.S. dairy and cheese products.
Best Product Prospects:
Best product prospects for the U.S. dairy producers are summarized below. Products have been divided
in three different categories:
Category A: Products Present in the Market That Have Good Sales Potential
As mentioned, most of the milk sold is targeted to children, and to some extent, the elderly consumer.
The main barrier for milk is that it is sold like a commodity, which means that the purchase decision is
price driven and it is a product that presents few differences between competitors. Producers who can
successfully compete with local suppliers of sliced cheese also have great potential.
Vitamin-rich powdered milk for Children
Supplement-rich (calcium, vitamins, cholesterol-lowering ingredients) powdered
milk for adults
Gouda cheese in sliced format
Cream cheese
Category B: Products not Present in Significant Volumes. Domestic Demand Exists but Few Suppliers
The main barrier for U.S. producers is the high price for cheddar and low awareness for mozzarella
cheese.
Cheddar cheese in sliced form is currently priced too high.
Mozzarella cheese in sliced form is not well-known by the Chilean consumer and
could be an opportunity for U.S. exporters.
Category C: U.S. Products not Present in the Market Because They Face Significant Barriers.
The main barrier faced by these U.S. producers is European competition and low brand awareness of
U.S. gourmet cheese products such as:
Blue cheese
Reggiano
Parmigiano
Provolone
Other gourmet cheeses
9. KEY CONTACTS AND FURTHER INFORMATION
Company - Institution Name Address Phone Website
ODEPA Teatinos 40, Piso 8, Santiago
de Chile (56 2 2397 3000) www.odepa.gob.cl
WALMART CHILE (Lider, Ekono,
Acuenta, Central mayorista)
Av. Presidente Eduardo Frei
Montalva 8301, Quilicura,
Santiago, Chile
(562 22005000) www.walmartchile.cl

CENCOSUD (Jumbo, Santa Isabel) Kennedy 9001 Las Condes,
Santiago, Chile. (600 400 6000) www.jumbo.cl
TOTTUS Nataniel Cox 620 Santiago.
Chile (600 390 8900) www.tottus.cl
SMU (Unimarc, Alvi, Mayorista 10, OK
Market, Telemercados.cl)
Cerro El Plomo 5680 piso
11, Las Condes,
Santiago de Chile.
(562 2 818 8000) www.smu.cl
PETROBRAS (Spacio 1)
Avda. Cerro Colorado 5240,
Torre 1, piso 12. Las
Condes, Santiago, Chile
(562 23283776) www.petrobras.com
SHELL (UPA!, Select)
Avenida Del Cóndor Sur
5250 Ciudad Empresarial,
Huechuraba, Santiago, Chile
(562 2444 4000) www.shell.com
COPEC (Pronto) Agustinas 1382, Santiago,
Chile (600 200 02 02) ww2.copec.cl
CASTAÑO
Avenida Providencia 2548,
Santiago, Región
Metropolitana, Chile
(562 24998830) www.castano.cl
BIG JOHN (562 2335 5582) www.femsa.com
Related Documents