CHILDREN’S MATHEMATICS ANXIETY AND ITS EFFECT ON THEIR CONCEPTUAL UNDERSTANDING OF ARITHMETIC AND THEIR ARITHMETIC FLUENCY A Thesis Submitted to the Faculty of Graduate Studies and Research In Partial Fulfillment of the Requirements For the Degree of Master of Arts in Experimental and Applied Psychology University of Regina By Jill Alexandra Beatrice Price Regina, Saskatchewan August, 2015 © Copyright 2015: J. A. B. Price

Welcome message from author
This document is posted to help you gain knowledge. Please leave a comment to let me know what you think about it! Share it to your friends and learn new things together.
Transcript

CHILDREN’S MATHEMATICS ANXIETY AND ITS EFFECT ON THEIR
CONCEPTUAL UNDERSTANDING OF ARITHMETIC AND THEIR ARITHMETIC
FLUENCY
A Thesis
Submitted to the Faculty of Graduate Studies and Research
In Partial Fulfillment of the Requirements
For the Degree of
Master of Arts
in
Experimental and Applied Psychology
University of Regina
By
Jill Alexandra Beatrice Price
Regina, Saskatchewan
August, 2015
© Copyright 2015: J. A. B. Price

UNIVERSITY OF REGINA
FACULTY OF GRADUATE STUDIES AND RESEARCH
SUPERVISORY AND EXAMINING COMMITTEE
Jill Alexandra Beatrice Price, candidate for the degree of Master of Arts in Experimental & Applied Psychology, has presented a thesis titled, Children’s Mathematics Anxiety and Its Effect on Their Conceptual Understanding of Arithmetic and Their Arithmetic Fluency, in an oral examination held on August 26, 2015. The following committee members have found the thesis acceptable in form and content, and that the candidate demonstrated satisfactory knowledge of the subject material. External Examiner: Dr. Kathleen T. Nolan, Faculty of Education
Supervisor: Dr. Katherine Arbuthnott, Deparment of Psychology
Committee Member: Dr. Jeff Loucks, Department of Psychology
Committee Member: Dr. Tom Phenix, Department of Psychology
Chair of Defense: Dr. Martin Beech, Department of Physics

i
Abstract
Research shows that children’s mathematics anxiety negatively impacts their
performance on mathematics tests (e.g., Chernoff & Stone, 2012). However, no research
to my knowledge has investigated how children’s mathematics anxiety impacts their
conceptual understanding of arithmetic. The current study investigated the characteristics
and development of Grades 4, 5, and 6 children’s mathematics anxiety and how it
impacts their conceptual understanding and application of arithmetic using arithmetic
concepts. For comparison, the current study also investigated how children’s
mathematics anxiety impacts their arithmetic fluency using timed mathematics tests. As
an exploratory and secondary component, the current study examined teachers’
mathematics anxiety and how it impacts their students’ mathematics anxiety, conceptual
understanding of arithmetic, and arithmetic fluency. Results showed that children with
higher mathematics anxiety had weaker conceptual understanding of arithmetic and
weaker arithmetic fluency compared to children with lower mathematics anxiety. In
particular, children’s mathematics anxiety had a greater impact on their arithmetic
fluency compared to their conceptual understanding of arithmetic. It also showed that
females had higher mathematics anxiety compared to males. However, there was no
significant effect of grade on children’s mathematics anxiety. The exploratory
component showed that teachers’ mathematics anxiety did not impact their students’
mathematics anxiety, conceptual understanding of arithmetic, or arithmetic fluency
compared to teachers with lower mathematics anxiety. Grade 4 teachers had higher
mathematics anxiety compared to Grade 5 teachers. However, there was no significant
difference between Grades 5 and 6 teachers’ mathematics anxiety. Female teachers also

ii
had higher mathematics anxiety compared to male teachers. Lastly, students were
unaware of their teachers’ level of mathematics anxiety. To help improve children’s
performance on mathematics tests, future research should focus on early identification
and corresponding interventions for children and teachers with mathematics anxiety.

iii
Acknowledgements
I would like to thank all organizations that made the completion of this thesis possible. I
would like to thank the Government of Saskatchewan and the University of Regina for
supporting me in the form of the Saskatchewan Innovation Scholarship in the Fall 2014
and Winter 2015 semesters, the Faculty of Graduate Studies and Research for supporting
me in the form of the Graduate Students’ Association Scholarship and the Graduate
Teaching Assistantship for the Fall 2014 semester as well as the Graduate Student Travel
Awards in the Spring/Summer 2014 semester, and the Psychology Association of
Saskatchewan for supporting me in the form of the Psychology Association of
Saskatchewan Student Scholarship in the Fall 2014 semester. Thank you for your
generous contributions!
iv
Dedication
I would like to express my sincere gratitude to everyone who contributed to the
completion of my master’s thesis. In particular, I would like to thank the mentorship of
my academic supervisor, Dr. Katherine Robinson. Thank you for all your guidance. I
would also like to acknowledge my grandmother, Mildred Price, who passed away one
year ago. She taught me patience, gratitude, and determination; all of which helped me
tremendously throughout the completion my thesis. Most importantly, she taught me the
value and privilege of education. I dedicate this body of work in honour of her.

v
Table of Contents
Abstract…………………………………………………………………………………….i
Acknowledgements………………………………………………………………………iii
Dedication………………………………………………………………………………...iv
Table of Contents………………………………………………………………………….v
List of Tables……………………………………………………………………………viii
List of Figures………………………………………………………………………..……x
List of Appendices………………………………………………………………………xiv
1. CHAPTER ONE: Introduction…………………………………………………………1
1.1 Overview…………………………………………………………………………...1
1.2 Mathematics Anxiety………………………………………………………………1
1.2.1 The onset of mathematics anxiety…………………………………………….1
1.2.2 Consequences of mathematics anxiety………………………………………..2
1.2.3 Causes of mathematics anxiety……………………………………………….3
1.3 Children’s Mathematics Anxiety and Performance on Mathematics Tests………..4
1.3.1 Children’s mathematics anxiety and conceptual understanding of arithmetic..6
1.3.2 Children’s mathematics anxiety and arithmetic fluency…………………….13
1.3.3 Grade differences in children’s mathematics anxiety ...…………………….15
1.3.4 Sex differences in children’s mathematics anxiety.…………………………16
1.4 Exploratory Analysis of Teachers’ Mathematics Anxiety………………………..17
2. CHAPTER TWO: Method…………………………………………………………….19
2.1 Participants………………………………………………………………………..19
2.2 Materials and Procedure…………………………………………………………..19

vi
3. CHAPTER THREE: Results…………………………………………………………..23
3.1 Children’s Performance on Mathematics Tests.………………………………….23
3.1.1 Children’s conceptual understanding of arithmetic………………………….23
3.1.1.1 Accuracy………………………………………………………………..23
3.1.1.2 Reaction time…………………………………………………………...29
3.1.1.3 Strategy use……………………………………………………………..34
3.1.2 Children’s arithmetic fluency………………………………………………..38
3.1.2.1 Number of problems attempted……………………………………...…38
3.1.2.2 Accuracy on the number of problems attempted……………………….41
3.2 Children’s Mathematics Anxiety…………………………………………………43
3.3 Children’s Mathematics Anxiety and its Effect on their Performance on
Mathematics Tests...…………………………………………………………………..45
3.3.1 Children’s mathematics anxiety and conceptual understanding of
arithmetic…………………………………………………………………………..45
3.3.2 Children’s mathematics anxiety and arithmetic fluency…………………….47
3.4 Exploratory Analysis of Teachers’ Mathematics Anxiety………………………..49
4. CHAPTER FOUR: Discussion………………………………………………………..55
4.1 Children’s Mathematics Anxiety and Performance on Mathematics Tests……....55
4.1.1 Characteristics and development of children’s mathematics anxiety………..55
4.1.1.1 Grade differences in children’s mathematics anxiety ………………….56
4.1.1.2 Sex differences in children’s mathematics anxiety …………………….58
4.1.2 Children’s performance on mathematics tests...……………………………..60
4.1.2.1 Children’s conceptual understanding of arithmetic…………………….60

vii
4.1.2.2 Children’s arithmetic fluency…………………………………………..63
4.1.3 Summary…………………………………………………………………….65
4.2 Exploratory Analysis of Teachers’ Mathematics Anxiety………………………..65
4.2.1 Teachers’ mathematics anxiety and its effect on their students’ mathematics
anxiety……………………………………………………………………………..65
4.2.2 Teachers’ mathematics anxiety and its effect on their students’ performance
on mathematics tests...……………………………………………………………..66
4.2.3 Grade differences in teachers’ mathematics anxiety..……………………….67
4.2.4 Sex differences in teachers’ mathematics anxiety.…..………………………67
4.3 Future Research…………………………………………………………….……..68
4.4 Limitations……………………………………...………………………………...69
4.5 Conclusion……………………………………………….………………………..69
5. References……………………………………………………………………………..71
6. Appendices………..…………………………………………………………………...85

viii
List of Tables
Table 1. Children’s Conceptual Understanding of Arithmetic on the Problem-Solving
Task by Problem Type (Identity, Negation, Commutativity, Inversion, Associativity, and
Equivalence) and Sex (Male and Female)……………………………..………………...24
Table 2. Children’s Conceptual Understanding of Arithmetic on the Problem-Solving
Task by Problem Type (Identity, Negation, Commutativity, Inversion, Associativity, and
Equivalence) and Operation Type (Additive and Multiplicative)………………………24
Table 3. Children’s Conceptually-based Strategy Use (%) on the Problem-Solving Task
by Problem Type (Identity, Negation, Commutativity, Inversion, Associativity, and
Equivalence), Operation Type (Additive and Multiplicative), and Grade (4, 5, and
6)………………………………………………………………………………..……......37
Table 4. Descriptive Statistics of Children’s Mathematics Anxiety on the MASC……...44
Table 5. Correlation Matrix Showing the Relationships Between Children’s Mathematics
Anxiety and their Mathematics Performance on the Problem-Solving Task and Timed
Mathematics Task………………………………………………………………………..46
Table 6. Descriptive Statistics of Teachers’ Mathematics Anxiety on the A-MARS……49
Table 7. Correlation Matrix Showing the Relationships Between Teachers’ Mathematics
Anxiety and their Students’ Mathematics Anxiety and their Students’ Mathematics
Performance on the Problem-Solving Task and Timed Mathematics Task……………..50

ix
List of Figures
Figure 1. Children’s Conceptual Understanding of Arithmetic on the Problem-Solving
Task by Operation Type (Additive and Multiplicative)…………………………………25
Figure 2. Children’s accuracy and strategy use on the problem-solving task for sex (male
and female)..……………………………………………………………………….……..26
Figure 3. Children’s accuracy on the problem-solving task for problem-type (identity,
negation, commutativity, inversion, associativity, and equivalence) and sex (male and
female).…..………………………………………………………………………………27
Figure 4. Children’s accuracy on the problem-solving task for operation type (additive
and multiplicative) and sex (male and female)..…………………………………………28
Figure 5. Children’s accuracy on the problem-solving task for problem type (identity,
negation, commutativity, inversion, associativity, and equivalence) and operation type
(additive and multiplicative).…………………………………………………………….29
Figure 6. Children’s reaction time on the problem-solving task for problem type (identity,
negation, commutativity, inversion, associativity, and equivalence) and operation type
(additive and multiplicative).……………………………………………………….……31
Figure 7. Grade 4 children’s reaction time on the problem-solving task for problem type
(identity, negation, commutativity, inversion, associativity, and equivalence) and sex
(male and female).…...…………………………………………………………………..32
Figure 8. Grade 5 children’s reaction time on the problem-solving task for problem type
(identity, negation, commutativity, inversion, associativity, and equivalence) and sex
(male and female).……………………………………………………………………….33

x
Figure 9. Grade 6 children’s reaction time on the problem-solving task for problem type
(identity, negation, commutativity, inversion, associativity, and equivalence) and sex
(male and female)………………………………………………………………………..34
Figure 10. Children’s strategy use on the problem-solving task for problem type (identity,
negation, commutativity, inversion, associativity, and equivalence) and operation type
(additive and multiplicative).…………………………………………………………….36
Figure 11. The number of problems children attempted on the timed mathematics task for
operation type (addition, subtraction, multiplication, and division) and sex (male and
female).…………………………………………………………………………………..39
Figure 12. The number of problems children attempted on the timed mathematics task for
operation type (addition, subtraction, multiplication, and division) and grade (4, 5, and
6)…………………………………………………………………………………………40
Figure 13. Children’s arithmetic fluency on the timed mathematics task for sex (male and
female)…………………………………………………………………………………...41
Figure 14. Children’s accuracy on the number of problems attempted on the timed
mathematics task for operation type (addition, subtraction, multiplication, and division)
and sex (male and female)……………………………………………………………….42
Figure 15. Children’s mathematics anxiety score on the MASC for sex (male and
female)…………………………………………………………………………………...45
Figure 16. Teachers’ mathematics anxiety score on the A-MARS for grade (4, 5, and
6)…………………………………………………………………………………………53
Figure 17. Teachers’ mathematics anxiety score on the A-MARS for sex (male and
female)…………………………………………………………………………………...54

xi
List of Appendices
Appendix A. University of Regina Research Ethics Board Certificate of Approval…….85
Appendix A. Addition Arithmetic Concept Problems…………………………………...86
Appendix B. Multiplicative Arithmetic Concept Problems…….…..………………..…..88
Appendix C. Addition Timed Mathematics Test……………………………………..….90
Appendix D. Subtraction Timed Mathematics Test...………………………………..….91
Appendix E. Multiplication Timed Mathematics Test………………………………..…92
Appendix F. Division Timed Mathematics Test…………………………….………..….93
Appendix G. Mathematics Anxiety Scale for Children (MASC) Questionnaire……..….94
Appendix H. Abbreviated Mathematics Anxiety Rating Scale (A-MARS)
Questionnaire………………………………………………………………………….....95

1
CHAPTER ONE
Introduction
1.1 Overview
Mathematics is fundamental in both academic and professional success (Chernoff
& Stone, 2012; Maloney, Waechter, Riskoc, & Fugelsang, 2012; Wu, Barth, Amin,
Mclarne, & Menon, 2012). Mathematics success depends not only on cognitive abilities
but also on positive attitudes (Dowker, Bennett, & Smith, 2012). Mathematics anxiety
inhibits cognitive abilities and creates negative attitudes about mathematics often
resulting in negative long-term academic and professional consequences (Beilock, 2008;
Geist, 2010; Hembree, 1990; Preston, 2008; Wu et al., 2012). Mathematics anxiety is
defined as “feelings of tension and anxiety that interfere with the manipulation of
numbers and the solving of mathematical problems in a wide variety of ordinary life and
academic situations” (Richardson & Suinn, 1972, p. 551). It can also create fear,
helplessness, shame, and mental disorganization in individuals when faced with
mathematical challenges (Gresham, 2007; Wood, 1988). It is thus important to
understand the characteristics and development of children’s mathematics anxiety for
early identification and corresponding interventions (Ramirez, Gunderson, Levine, &
Beilock, 2013; Scarpello, 2007; Wu et al., 2012).
1.2 Mathematics Anxiety
1.2.1 The onset of mathematics anxiety. Anxiety disorders are the most
common mental disorders in children (Beesdo, Knappe, & Pine, 2009). For instance,
generalized anxiety disorder, specific phobias, and social phobia can all be observed in
children (e.g., Harari, Vukovic, & Bailey, 2013). Mathematics anxiety can also be

2
observed in children (e.g., Gierl & Bisanz, 1995; Jackson & Leffingwell, 1999; Suinn,
Taylor, & Edwards, 1988; Zakaria & Nordin, 2008). However, the age of onset of
mathematics anxiety is unclear. Some research claims that mathematics anxiety emerges
in Grade 6, when children have encountered a complex mathematics curriculum, have
had sufficient opportunity to internalize negative feedback, and have the ability to
successfully report mathematics anxiety (Ashcraft, Krause, & Hopko, 2007). Yet,
Jackson and Leffingwell (1999) found that 16% of children report experiencing their first
traumatic mathematics experience between Grades 3 and 4. This may be because it is in
Grade 3 that children begin to learn complex mathematical operations and concepts (e.g.,
Wu et al., 2012). Most recently, research suggests that mathematics anxiety is detectable
as early as Grade 1 (Harari et al., 2013). Nevertheless, the majority of research claims
that the generally accepted age of onset of mathematics anxiety is Grade 3 (Ashcraft &
Moore, 2009; Jackson & Leffingwell, 1999; Wu et al., 2012).
The current study investigated mathematics anxiety in Grades 4, 5, and 6 children.
This age range was selected to ensure that children were within the generally accepted
age of onset of mathematics anxiety and that they were able to report their mathematics
anxiety. Research also shows that this is a critical stage for the development of children’s
attitudes about mathematics (Newstead, 1998). The aim of the current study, however,
was not to confirm the age of onset of mathematics anxiety but to examine the
characteristics and development of children’s mathematics anxiety and to explore its
effect on their performance on mathematics tests.
1.2.2 Consequences of mathematics anxiety. Individuals with mathematics
anxiety enjoy mathematics less, have lower perceptions of their mathematics abilities,

3
and participate less during mathematics class (Beilock, 2008; Harari et al., 2013). They
are also less likely to see the value of learning mathematics and avoid taking mathematics
courses (Harari et al., 2013). Most concerning, children with high mathematics anxiety
are significantly slower and less accurate on mathematics problems compared to children
with low mathematics anxiety (Ashcraft & Moore, 2009; Wu et al., 2012). Given the
consequences associated with mathematics anxiety, it is important to understand what
causes children’s mathematics anxiety and how it impacts their performance on
mathematics tests.
1.2.3 Causes of mathematics anxiety. Mathematics anxiety can be caused by
many factors. For instance, parents with mathematics anxiety can pass on a genetic
predisposition for mathematics anxiety to their children (e.g., Wang et al., 2014).
Children with parents or siblings with negative attitudes about mathematics are also often
at risk for developing mathematics anxiety (e.g., Dowker et al., 2012). The majority of
research, however, suggests that mathematics anxiety is created in the classroom (e.g.,
Ashcraft et al., 2007; Finlayson, 2014; Lerner & Friesema, 2013; Newstead, 1998; Wu et
al., 2012). In particular, research shows that mathematics tests have been shown to
contribute to the development and maintenance of mathematics anxiety in children (e.g.,
Lerner & Friesema, 2013). The current study, therefore, explored the relationship
between children’s mathematics anxiety and their performance on mathematics tests.
Research shows that mathematics anxiety could also be caused by teachers (e.g.,
Dowker et al., 2012; Finlayson, 2014; Gresham, 2007; Jackson & Leffingwell, 1999;
Newstead, 1990). For instance, Newstead (1998) explains that teachers’ use of
memorization techniques rather than understanding and reasoning can promote

4
mathematics anxiety in their students. Furthermore, Finlayson (2014) found that
children’s mathematics anxiety is highly influenced by teachers’ own mathematics
anxiety. Teachers with high mathematics anxiety can unintentionally encourage negative
attitudes about mathematics to their students (e.g., Jackson & Leffingwell, 1999).
However, little research has examined the impact of teachers’ mathematics anxiety on
their students. As part of an exploratory and secondary component, the current study,
therefore, investigated teachers’ mathematics anxiety and its impact on their students.
1.3 Children’s Mathematics Anxiety and Performance on Mathematics Tests
Mathematics problem solving relies on three types of knowledge: conceptual,
procedural, and factual knowledge (Voutsina, 2012). Conceptual knowledge allows
children to understand why a procedure works by forming a relationship between existing
and new information, procedural knowledge allows children to understand how to
perform a task by applying rules, algorithms, and procedures, and factual knowledge
allows children to recall answers directly from memory without performing any
calculations (Voutsina, 2012). Previous research, however, has only examined the impact
of mathematics anxiety on procedural (e.g., Ramirez et al., 2013) and factual knowledge
(e.g., Royer, Tronsky, Chan, Jackson, & Marchant III, 1999). For instance, Ramirez and
colleagues (2013) studied children’s procedural knowledge and found that Grades 1 and 2
children with higher mathematics anxiety were less accurate on mathematics tests
compared to children with lower mathematics anxiety. Similarly, Royer and colleagues
(1999) studied children’s factual knowledge and found that Grades 5 to 8 children with
higher mathematics anxiety were slower and less accurate compared to individuals with
lower mathematics anxiety. Overall, research typically shows a negative relationship
5
between mathematics anxiety and performance on mathematics tests (e.g., Beilock, 2008;
Chernoff & Stone, 2012; Devine, Fawcett, Szûcs, & Dowker, 2012).
The current study expands on previous research by investigating how children’s
mathematics anxiety impacts their conceptual understanding of arithmetic (i.e.,
conceptual knowledge) because no research to my knowledge has ever explored this
relationship. Studying the impact of children’s mathematics anxiety on their conceptual
understanding of arithmetic is important because conceptual understanding of arithmetic
allows children to learn complex mathematical skills and concepts (e.g., Allard, 2011).
Allard (2011) elaborates that the foundation of conceptual understanding of arithmetic is
arithmetic fluency. As a result, the current study also investigated children’s arithmetic
fluency (i.e., factual knowledge) and expands on previous research by investigating how
children’s mathematics anxiety impacts their arithmetic fluency as little research has
studied this relationship in elementary school. Studying the impact of children’s
mathematics anxiety on their arithmetic fluency is important because it facilitates the
development and understanding of advanced mathematical strategies and skill (Carr &
Alexeev, 2011). Overall, the current study contributes novel information about the
characteristics of children’s mathematics anxiety and how it impacts both their
conceptual understanding of arithmetic and arithmetic fluency.
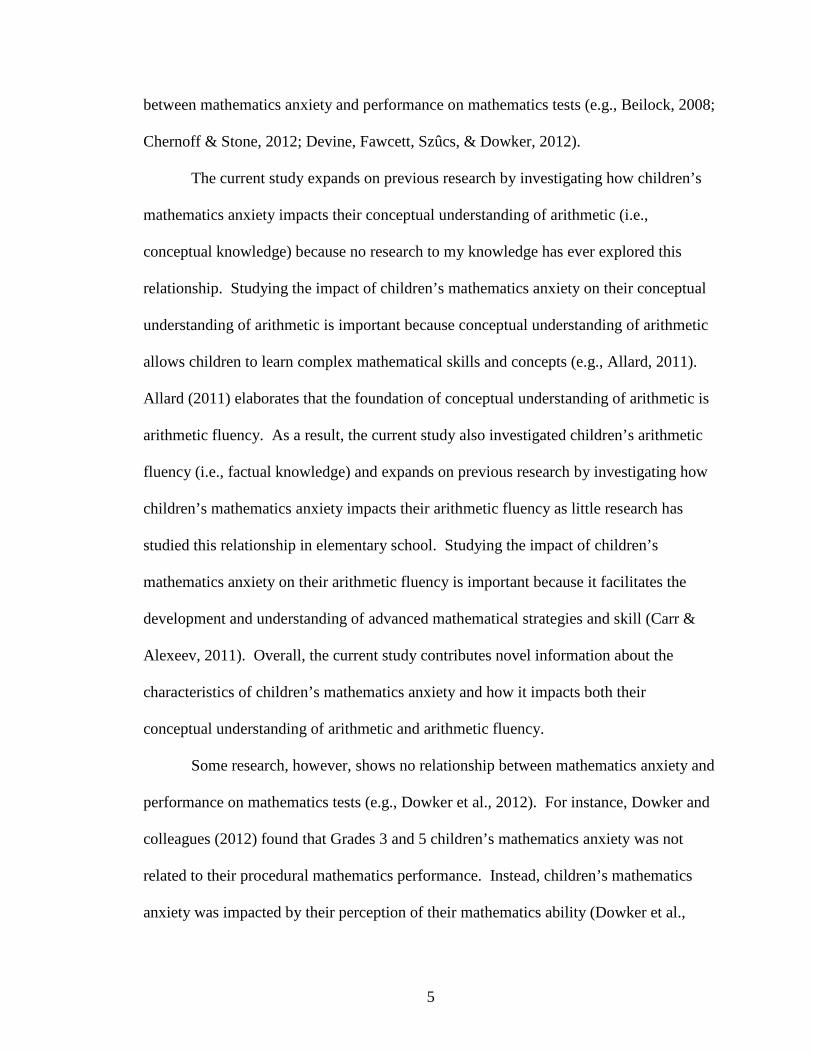
Some research, however, shows no relationship between mathematics anxiety and
performance on mathematics tests (e.g., Dowker et al., 2012). For instance, Dowker and
colleagues (2012) found that Grades 3 and 5 children’s mathematics anxiety was not
related to their procedural mathematics performance. Instead, children’s mathematics
anxiety was impacted by their perception of their mathematics ability (Dowker et al.,
6
2012). Similarly, Tsui and Mazzocco (2006) suggest that weaker performance on
mathematics tests is due to weaker mathematics competence rather than higher
mathematics anxiety. Mathematics perception and competence, however, cannot explain
all aspects of poor performance on mathematics tests that have been associated with
mathematics anxiety. For instance, individuals with higher mathematics anxiety have
more effortful processing on procedural mathematics problems compared to individuals
with lower mathematics anxiety (Ashcraft & Kirk, 2001). Overall, there is stronger
evidence that poor performance on mathematics tests is linked with mathematics anxiety.
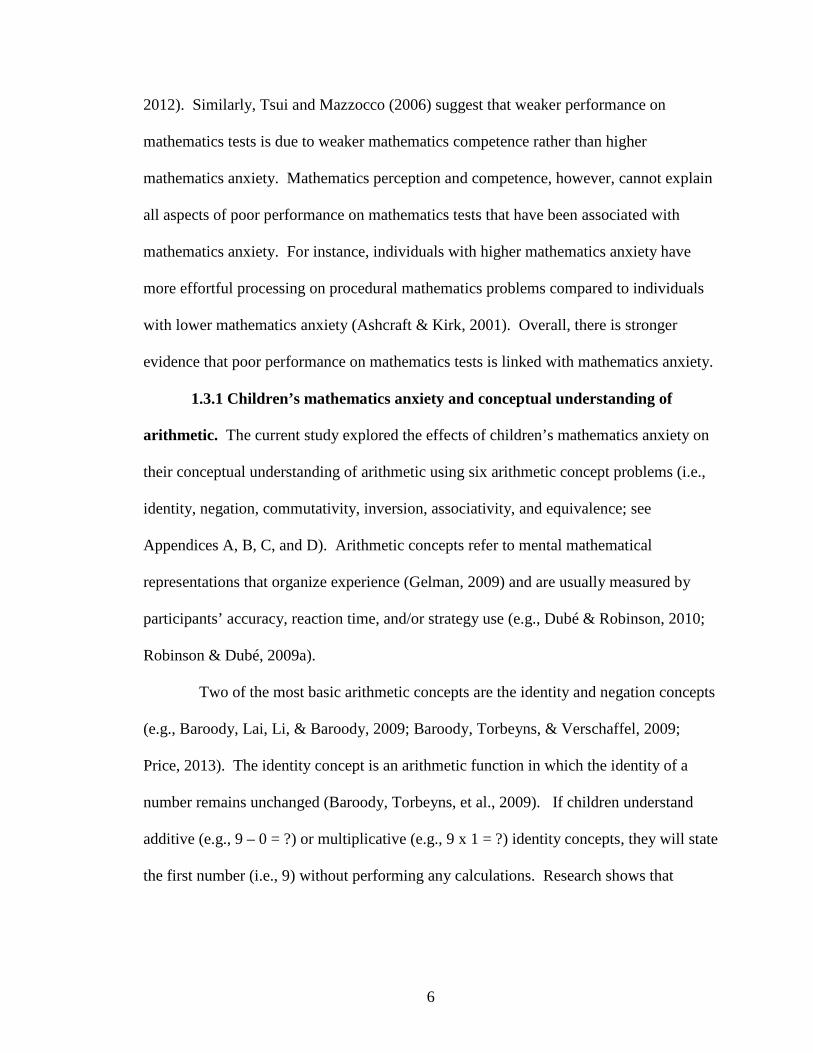
1.3.1 Children’s mathematics anxiety and conceptual understanding of
arithmetic. The current study explored the effects of children’s mathematics anxiety on
their conceptual understanding of arithmetic using six arithmetic concept problems (i.e.,
identity, negation, commutativity, inversion, associativity, and equivalence; see
Appendices A, B, C, and D). Arithmetic concepts refer to mental mathematical
representations that organize experience (Gelman, 2009) and are usually measured by
participants’ accuracy, reaction time, and/or strategy use (e.g., Dubé & Robinson, 2010;
Robinson & Dubé, 2009a).
Two of the most basic arithmetic concepts are the identity and negation concepts
(e.g., Baroody, Lai, Li, & Baroody, 2009; Baroody, Torbeyns, & Verschaffel, 2009;
Price, 2013). The identity concept is an arithmetic function in which the identity of a
number remains unchanged (Baroody, Torbeyns, et al., 2009). If children understand
additive (e.g., 9 – 0 = ?) or multiplicative (e.g., 9 x 1 = ?) identity concepts, they will state
the first number (i.e., 9) without performing any calculations. Research shows that

7
elementary school children typically have good conceptual understanding of the identity
concept (e.g., Price, 2013).
The negation concept is an arithmetic function in which the total identity of a
number is removed (Baroody, Torbeyns, et al., 2009). If children understand additive
negation concepts (e.g., 9 – 9 = ?), they will state ‘0’ without performing any
calculations. If children understand multiplicative negation concepts (e.g., 9 ÷ 9 = ?),
they will state ‘1’ without performing any calculations. Research shows that elementary
school children also typically have good conceptual understanding of the negation
concept (e.g., Price, 2013).
The commutativity concept is more difficult for children to understand compared
to the identity and negation concepts (Price, 2013; Squire, Davies, & Bryant, 2004). It is
an arithmetic function in which the group of quantities, connected by the same operation,
remains the same regardless of the order (Baroody & Dowker, 2009). If children
understand additive (e.g., 7 + 4 = 4 + ?) or multiplicative (e.g., 7 x 4 = 4 x ?)
commutativity concepts, they will simply state the first number (i.e., 7) without
performing any calculations. Research shows that Grades 5 and 6 children have greater
difficulties with multiplicative commutativity problems compared to the additive
commutativity problems (Squire et al., 2004). Nevertheless, elementary school children
typically have some conceptual understanding of the commutativity concept (e.g.,
Canobi, Reeve, & Pattison, 2002; Price, 2013; Squire et al., 2004; Wilkins, Baroody, &
Tiilikainen, 2001).
The inversion concept is also more difficult for children to understand compared
to the identity and negation concepts (Baroody & Lai, 2007; Baroody, Lai, et al., 2009;

8
Canobi & Bethune, 2008; Price, 2013) and even the commutativity concept (Canobi &
Bethune, 2008). The inversion concept is an arithmetic function in which the identity of
a number remains the same due to operations of inversion relationships (e.g., addition and
subtraction; Baroody, Torbeyns, et al., 2009; Dubé & Robinson, 2010).
There are three strategies to solving inversion problems (e.g., 2 + 8 – 8 = ?): the
left-to-right strategy, the negation strategy, and the inversion strategy (Dubé & Robinson,
2010; Robinson & Dubé, 2009a; 2009b; 2009c; Robinson, Ninowski, & Gray, 2006).
The left-to-right strategy is the preferred strategy by children on inversion problems, and
it involves calculating the problem without using any shortcuts. The use of this strategy
demonstrates no conceptual understanding of the inversion concept. The negation
strategy involves calculating the first part of the problem (i.e., 2 + 8) and then realizing
that no calculations are necessary to solve the problem. The use of this strategy
demonstrates partial conceptual understanding of the inversion concept (Robinson &
Dubé, 2009b). The inversion strategy involves stating the first number of the problem
(i.e., 2) without performing any calculations. The use of this strategy demonstrates good
conceptual understanding of the inversion concept (e.g., Robinson & Dubé, 2009a). The
inversion strategy is also the fastest and most accurate strategy for inversion problems
(Robinson & Dubé, 2009b; 2009c). Research shows that Grades 3 to 5 children have
greater difficulties understanding the multiplicative inversion problems compared to the
additive inversion problems (Robinson & Dubé, 2009a; 2012). Nevertheless, elementary
school children typically have some conceptual understanding of the inversion concept
(e.g., Price, 2013; Robinson & LeFevre, 2012).

9
The associativity concept is more difficult for children to understand compared to
the commutativity (e.g., Patel & Canobi, 2010) and inversion concepts (e.g., Robinson &
LeFevre, 2012). The associativity concept is an arithmetic function in which the order
that operations are performed is independent of the answer (Robinson, Ninowski, et al.,
2006). If children understand additive (e.g., 7 + 9 – 3 = ?) or multiplicative (e.g., 7 x 9 ÷
3 = ?) associativity concepts, they will begin with the second part of the associativity
problem (i.e., 9 – 3 or 9 ÷ 3) to simplify their work (e.g., Baroody, Lai, et al., 2009).
Research shows that Grade 6 children have greater difficulties understanding
multiplicative associativity problems compared to additive associativity problems
(Robinson & Dubé, 2009c). Overall, elementary school children typically have weak
conceptual understanding of the associativity concept (e.g., Robinson & Dubé, 2009a;
Robinson, Ninowski, et al., 2006).
The equivalence concept is generally difficult for children to understand (Alibali,
1999; McNeil, 2007; Price, 2013; Rittle-Johnson, Matthews, Taylor, & McEldon, 2011).
More specifically, Price (2013) shows that the equivalence concept is the most difficult
arithmetic concept for children to understand. The equivalence concept is an arithmetic
function in which both sides of the problem have the same total value (e.g., McNeil,
2007; Rittle-Johnson et al., 2011). If children understand additive (e.g., 2 + 6 + 4 = 2 + ?)
or multiplicative (e.g., 2 x 6 x 4 = 2 x ?) equivalence concepts, they will only perform the
second part of the problem (i.e., 6 + 4 or 6 x 4). Knuth, Alibali, McNeil, Weinberg, and
Stephens (2005) also found that children who have greater understanding of the equal
sign have greater understanding of additive equivalence problems. Still, children
10
typically have weak conceptual understanding of the equivalence concept (e.g., Alibali,
1999; McNeil, 2007; Robinson & Dubé, 2012).
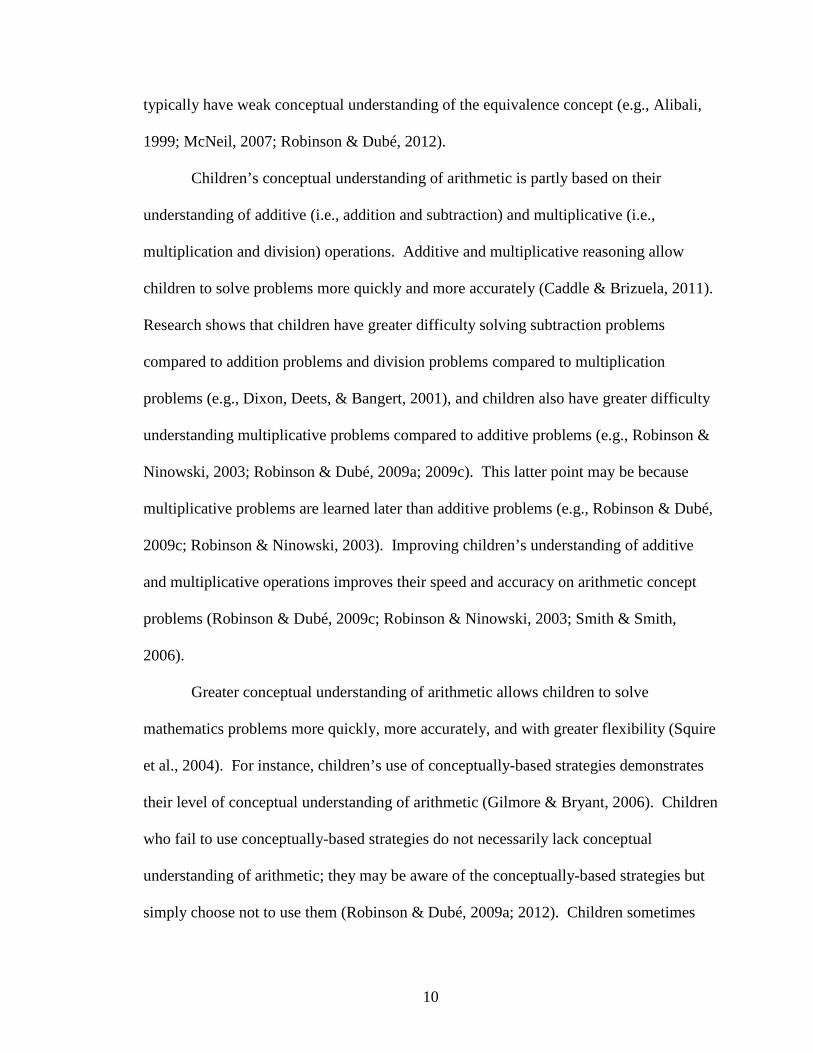
Children’s conceptual understanding of arithmetic is partly based on their
understanding of additive (i.e., addition and subtraction) and multiplicative (i.e.,
multiplication and division) operations. Additive and multiplicative reasoning allow
children to solve problems more quickly and more accurately (Caddle & Brizuela, 2011).
Research shows that children have greater difficulty solving subtraction problems
compared to addition problems and division problems compared to multiplication
problems (e.g., Dixon, Deets, & Bangert, 2001), and children also have greater difficulty
understanding multiplicative problems compared to additive problems (e.g., Robinson &
Ninowski, 2003; Robinson & Dubé, 2009a; 2009c). This latter point may be because
multiplicative problems are learned later than additive problems (e.g., Robinson & Dubé,
2009c; Robinson & Ninowski, 2003). Improving children’s understanding of additive
and multiplicative operations improves their speed and accuracy on arithmetic concept
problems (Robinson & Dubé, 2009c; Robinson & Ninowski, 2003; Smith & Smith,
2006).
Greater conceptual understanding of arithmetic allows children to solve
mathematics problems more quickly, more accurately, and with greater flexibility (Squire
et al., 2004). For instance, children’s use of conceptually-based strategies demonstrates
their level of conceptual understanding of arithmetic (Gilmore & Bryant, 2006). Children
who fail to use conceptually-based strategies do not necessarily lack conceptual
understanding of arithmetic; they may be aware of the conceptually-based strategies but
simply choose not to use them (Robinson & Dubé, 2009a; 2012). Children sometimes

11
even consider the use of conceptually-based strategies a form of cheating (Robinson &
Dubé, 2009b). Nevertheless, research primarily shows that children with greater
conceptual understanding of arithmetic have greater arithmetic concept problem-solving
skills compared to children with weaker conceptual understanding of arithmetic (Gilmore
& Bryant, 2006; Robinson & Dubé, 2012).
Older children typically have greater conceptual understanding of arithmetic
compared to younger children (e.g., Baroody, Lai, et al., 2009; Canobi et al., 2002;
Robinson, Ninowski, et al., 2006). For instance, Dubé (2014) showed that older children
had greater conceptual understanding of inversion and associativity concepts compared to
younger children. Gelman (1999) explains that arithmetic concepts are derived from
experience. In other words, older children likely have greater conceptual understanding
of arithmetic because they have had more practice solving arithmetic concepts compared
to younger children. Still, some research shows that conceptual understanding of
arithmetic is independent of age (e.g., Canobi, 2004; Robinson & Dubé, 2009a).
Robinson and Dubé (2009a) showed that grade did not improve Grades 2, 3, or 4
children’s conceptual understanding of additive inversion and associativity problems
suggesting that the development of their conceptual understanding of additive inversion
and associativity problems is slow across these grades. They elaborate that formal
schooling is not responsible for improvements in children’s conceptual understanding of
additive inversion and associativity problems and may actually interfere with its
development (Robinson & Dubé, 2009a). In other words, factors other than grade may
actually be responsible for improvements in children’s conceptual understanding of
arithmetic and arithmetic fluency. Nevertheless, further research is needed to clarify

12
these grade differences. The current study, therefore, investigated children’s conceptual
understanding of arithmetic to see how it changes over Grades 4, 5, and 6.
Research primarily shows no sex differences in children’s conceptual
understanding of arithmetic (e.g., Beck, Ghesquière, Lagae, & Smedt, 2014; Nunes,
Bryant, Hallett, Bell, & Evans, 2009; Robinson & Dubé, 2012). This suggests that males
and females are equally capable of understanding why a mathematical procedure works.
Other research, however, shows that males have greater conceptual understanding of
arithmetic compared to females (e.g., Carr, Steiner, Kyser, & Biddlecomb, 2008; Geary,
Saults, Lui, & Hoord, 2000; Royer et al., 1999). For instance, Carr and Davis (2001)
found that Grade 1 males had greater conceptual understanding of addition and
subtraction problems compared to Grade 1 females and attribute this male advantage to
their preference for retrieval of mathematical facts compared to females’ preference for
computation. These sex differences, though, declined on more difficult problems (Carr &
Davis, 2001). Similarly, Hyde, Fennema, and Lamon (1990) found that sex differences
were evident in early elementary school and disappeared around Grade 3. Overall, the
majority of research suggests that sex differences in children’s conceptual understanding
of arithmetic are minimal. Nevertheless, the current study investigated children’s
conceptual understanding of arithmetic to see if it differs between males and females in
Grades 4, 5, and 6.
The hypotheses for children’s conceptual understanding of arithmetic and how it is
impacted by their mathematics anxiety were based on previous research. Based on
previous research, it was expected that children would have good conceptual
understanding of identity and negation, some conceptual understanding of commutativity

13
and inversion, and weak conceptual understanding of associativity and equivalence (e.g.,
Price, 2013). Older children would have greater conceptual understanding of arithmetic
on the problem-solving task compared to younger children (e.g., Patel & Canobi, 2010).
No sex differences in children’s conceptual understanding of arithmetic on the problem-
solving task were expected (e.g., Alibali, 1999; Robinson, Arbuthnott, et al., 2006;
Robinson & Dubé, 2009a). Lastly, given that previous research shows a negative
relationship between children’s mathematics anxiety and their performance on
mathematics tests (e.g., Maloney et al., 2012), it was expected that children with higher
mathematics anxiety would also have weaker conceptual understanding of arithmetic
compared to children with lower mathematics anxiety.
1.3.2 Children’s mathematics anxiety and arithmetic fluency. The current
study explored the effects of children’s mathematics anxiety on their arithmetic fluency
using timed mathematics tests for the four arithmetic operations of addition, subtraction,
multiplication, and division (see Appendices E, F, G, and H). Arithmetic fluency allows
children to retrieve mathematical facts more quickly and more accurately and is measured
by participants’ speed and accuracy on timed mathematics tests (Lerner & Friesema,
2013). Timed mathematics tests are also important tools for improving mathematical
skill and arithmetic fluency (Geist, 2010). For instance, they promote retrieval of
mathematical facts (Lerner & Friesema, 2013). However, timed mathematics tests can
undermine children’s natural thinking process (Geist, 2010) and prevent an accurate
assessment of children’s mathematical skill (Walen & Williams, 2002). For instance,
Walen and Williams (2002) found that individuals focused on the passing of time rather
than on the mathematical tasks. Timed mathematics tests can also increase anxiety,

14
decrease accuracy, and create negative attitudes about mathematics (e.g., Ashcraft, 2002).
As a result, the relationship between mathematics anxiety and performance on
mathematics tests is much stronger in timed conditions compared to untimed conditions
(Royer et al., 1999; Tsui & Mazzocco, 2006; Walen & Williams, 2002).
Older children generally have greater arithmetic fluency compared to younger
children (e.g., Calhoon, Robert, Flores, & Houchins, 2007; Kamii, Lewis, & Kirkland,
2001; Robinson, Arbuthnott, et al., 2006). For instance, Robinson, Arbuthnott, and
colleagues (2006) found that Grades 4 through 7 children became faster and more
accurate on simple division problems as they aged. Alternatively, McNeil (2007)
explains that mathematics development can be U-shaped, with performance on
mathematics tests sometimes declining before it improves. Other research shows no
grade differences in children’s arithmetic fluency (e.g., Robinson & Dubé, 2009b).
Robinson and Dubé (2009b) found no grades differences in Grades 6, 7, and 8 children
on multiplicative inversion problems suggesting that factors other than grade are also
responsible for improvements in children’s arithmetic fluency on multiplicative
problems. Although research is unclear about how grade influences children’s arithmetic
fluency, the majority of research shows that arithmetic fluency typically increases with
age. The current study, therefore, investigated children’s arithmetic fluency using timed
mathematics tests to see how children’s arithmetic fluency changes over Grades 4, 5, and
6.
Males typically have greater arithmetic fluency compared to females (Carr et al.,
2008; Geary et al., 2000; Nunes et al., 2009; Royer et al., 1999). Research shows that
retrieval of mathematical facts allow children to solve problems faster and more

15
accurately compared to computation (Carr et al., 2008). Research also shows that males
prefer retrieval strategies whereas females prefer computation strategies (Carr & Jessup,
1997). This could explain why males are faster and more accurate compared to females.
However, males’ advantage on arithmetic fluency over females has been disputed. For
instance, other research shows no sex differences in children’s arithmetic fluency
suggesting that males and females are equally capable of retrieving mathematical facts
(Beck et al., 2014; Carr & Davis, 2001). Further research is needed to help clarify the
impact of sex on children’s arithmetic fluency. The current study, therefore, investigated
children’s arithmetic fluency using timed mathematics tests to see if and how children’s
arithmetic fluency differs between males and females in Grades 4, 5, and 6.
The hypotheses for children’s arithmetic fluency and how it is impacted by their
mathematics anxiety were based on previous research. Based on previous research, it
was expected that children would have greater arithmetic fluency on the addition and
subtraction tests compared to the multiplication and division tests (e.g., Calhoon et al.,
2007; Cates & Rhymer, 2003), older children would have greater arithmetic fluency
compared to younger children (e.g., Calhoon et al., 2007; Walen & Williams, 2002), and
males would have higher arithmetic fluency compared to females (e.g., Beilock, 2008).
Lastly, it was expected that children with higher mathematics anxiety would have weaker
arithmetic fluency compared to children with lower mathematics anxiety (e.g., Maloney
et al., 2012; Preston, 2008).
1.3.3 Grade differences in children’s mathematics anxiety. Research shows
that mathematics anxiety, if not resolved, becomes more pronounced over time (e.g.,
Furner & Berman, 2003; Gierl & Bisanz, 1995; Ma, 1999). This suggests that older

16
children have higher mathematics anxiety compared to younger children. This
relationship appears to increase across grade (Beesdo et al., 2009; Ma, 1999), peaking in
Grades 9 and 10 (Ashcraft & Moore, 2009; Beilock, 2008; Hembree, 1990). This
increase in mathematics anxiety is partly attributed to an increasingly difficult
mathematics curriculum (Ashcraft et al., 2007), and also to older children becoming
increasingly concerned about the consequences of their performance on mathematics tests
(Gierl & Bisanz, 1995). Other research, however, shows no grade differences in
mathematics anxiety (Dowker et al., 2012; Wigfield & Meece, 1988). For instance,
Wigfield and Meece (1998) found no impact of grade on Grade 5 through 12 children’s
mathematics anxiety. Dowker and colleagues (2012) and Wigfield and Meece (1998)
attribute changes in children’s mathematics anxiety over time to perceptions in their
mathematics ability rather than grade. Nevertheless, the majority of research suggests
that older children have higher mathematics anxiety compared to younger children. The
current study, therefore, examined the effect of grade on children’s mathematics anxiety.
1.3.4 Sex differences in children’s mathematics anxiety. Sex differences can
also influence the development of children’s mathematics anxiety. Anxiety disorders, as
a whole, occur more frequently in females compared to males (e.g., Beesdo et al., 2009).
In particular, research shows that females report higher mathematics anxiety compared to
males (e.g., Geist, 2010; Wang et al., 2014). Females tend to feel less confident about
their mathematics answers, enjoy mathematics less, and are more susceptible to the
negative effects of timed mathematics tests (Geist, 2010). They are also more willing to
report their anxiety compared to males (Hembree, 1990). Some research, however,
reports no sex differences in children’s mathematics anxiety (e.g., Cates & Rhymer,

17
2003; Jameson, 2014; Wigfield & Meece, 1988; Wood, 1988). For instance, Jameson
(2014) found no sex differences in Kindergarten through to Grade 6 children’s
mathematics anxiety. Hembree (1990) alternatively found that males reported higher
mathematics anxiety compared to females. Inconsistencies in sex differences in
children’s mathematics anxiety can be attributed to children’s willingness to admit that
they have mathematics anxiety. For instance, research shows that females are more likely
to admit that they experience mathematics anxiety compared to males (Hembree 1990).
Nevertheless, research primarily shows that sex differences are an important contributing
factor to children’s mathematics anxiety and that females typically have higher
mathematics anxiety compared to males. The current study, therefore, investigated the
impact of sex on children’s mathematics anxiety.
1.4 Exploratory Analysis of Teachers’ Mathematics Anxiety
Teachers with mathematics anxiety can reportedly influence the development of
children’s mathematics anxiety (e.g., Beilock & Willingham, 2014; Chernoff & Stone,
2012; Finlayson, 2014; Geist, 2015; Hadley & Dorward, 2011). Little research, however,
has explored the characteristics and development of teachers’ mathematics anxiety. In
addition, little research has explored the effects of teachers’ mathematics anxiety on their
students. Research shows that children internalize teachers’ interest and enthusiasm for
subjects (Finlayson, 2014; Furner & Berman, 2003; Gresham, 2007; Jackson &
Leffingwell, 1999). Teachers with mathematics anxiety, though, are often incapable of
generating interest and enthusiasm for mathematics (Wood, 1988) causing children to
internalize teachers’ negative attitudes about mathematics (Finlayson, 2014; Geist, 2015;
Jackson & Leffingwell, 1999). As an exploratory and secondary component, the current

18
study investigated teachers’ mathematics anxiety and its effect on their students’
mathematics anxiety, conceptual understanding of arithmetic, and arithmetic fluency.
This was considered exploratory due to the small sample size.
The hypotheses for teachers’ mathematics anxiety and how it impacts their
students were based on previous research. First, the current study explored the effects of
teacher’ mathematics anxiety on their students’ mathematics anxiety. Teachers with
higher mathematics anxiety were expected to have students with higher mathematics
anxiety compared to teachers with lower mathematics anxiety (e.g., Beilock, Gunderson,
Ramirez, & Levine, 2009; Beilock & Willingham, 2014; Chernoff & Stone, 2012; Furner
& Berman, 2003; Geist, 2015; Hadley & Dorward, 2011). Second, the current study
explored the effects of teachers’ mathematics anxiety on their students’ conceptual
understanding of arithmetic and on their arithmetic fluency. Teachers with higher
mathematics anxiety were expected to have students with lower conceptual understanding
of arithmetic and lower arithmetic fluency compared to teachers with lower mathematics
anxiety (e.g., Dowker et al., 2012; Furner & Berman, 2003; Newstead, 1998; Wu et al.,
2012). Third, the current study explored children’s awareness of their teacher’s level of
mathematics anxiety. Children were expected to be aware of their teacher’s level of
mathematics anxiety (e.g., Finlayson, 2014).

19
CHAPTER TWO
Method
2.1 Participants
Data was collected from 43 Grade 4 children (18 Male, 25 Female), 41 Grade 5
children (21 Male, 20 Female), and 36 Grade 6 children (15 Male, 21 Female) from five
schools. Grade 4 participants had a median age of 9 years, 10 months (range: 9 years, 3
months to 10 years, 3 months). Grade 5 participants had a median age of 10 years, 11
months (range: 10 years, 3 months to 11 years, 4 months). Grade 6 participants had a
median age of 11 years, 10 months (range: 11 years, 6 months to 13 years, 4 months). In
addition, data from 17 teachers (5 Male, 12 Female) from the participating classes were
collected. Consent was obtained from principals of the participating schools, teacher
participants, and parents. Assent was also obtained from child participants. Child
participants received a gel pen for their participation and teacher participants received a
box of chocolates. Ethical approval was obtained from the University of Regina Ethics
Board (see Appendix A) and the Regina Public School Board and data was obtained from
February to June 2014.
2.2 Materials and Procedure
Children participated in two sessions that lasted approximately 45 minutes in total.
In the first session, children completed a problem-solving task. In the second session,
children completed a timed mathematics task followed by a mathematics anxiety
questionnaire. On average, the timed mathematics task and mathematics anxiety
questionnaire were administered 5 days after problem-solving task. It is important that
the mathematics anxiety questionnaire was administered last to avoid any influence on

20
children’s scores on the mathematics tests. Alternatively, teachers only participated in
one session that lasted approximately 10 minutes. During this session, teacher
participants self-administered a mathematics anxiety questionnaire tailored for adults.
Children’s conceptual understanding of arithmetic was assessed on the problem-
solving task that lasted approximately 30 minutes. This assessment was administered
individually to each child participant. Half of the participants in each grade began with
the first condition (i.e., additive problems first; see Appendix B) and the other half of the
participants began with the second condition (i.e., multiplicative problems first; see
Appendix C). All participants completed both additive and multiplicative problems.
Each child viewed four problems of each arithmetic concept (i.e., identity, negative,
commutativity, inversion, associativity, and equivalence), for a total of 24 problems per
condition. Problems were presented on a computer using E-Prime software. Participants
were instructed to hit the space bar when they knew the answer to the problem (i.e.,
reaction time), state their answer (i.e., accuracy), and then describe how they got that
answer (i.e., strategy use). If they were unable to provide an explanation, they were
given cues (e.g., “where did you start this problem?”). Each problem disappeared after
30 seconds. This ensured that, on this task, children did not feel pressured for time.
Accuracy, reaction time, and strategy use were collected for each problem.
Children’s arithmetic fluency was assessed on a timed mathematics task that lasted
approximately 5 minutes. Four timed mathematics tests (i.e., addition, subtraction,
multiplication, and division; see Appendices D, E, F, and G) were administered to groups
of participants (ranging from 2 to 8 children) using pen and paper. After the instructions
were read to the participants, children had one minute each to answer as many problems

21
as possible on each test. Number of problems attempted and accuracy on the number of
problems attempted were calculated for each timed mathematics test.
Children’s mathematics anxiety was assessed using the Mathematics Anxiety Scale
for Children (MASC; Chiu & Henry, 1990; see Appendix H) that lasted approximately 10
minutes. The MASC is used to identify mathematics anxiety in children between Grades
4 to 8. It is an internally consistent and suitable measure for children (Chiu & Henry,
1990). This assessment was also administered to groups of participants (ranging from 2
to 8 children) using pen and paper. Instructions were read to the participants followed by
the 22-items (e.g., taking a quiz in math). Children rated their level of anxiety
considering each statement on a 4-point Likert-type scale ranging from 1 (not nervous) to
4 (very very nervous). When requested, participants were provided clarification of any
item. Each statement response was awarded 1 to 4 points, respectively, and then summed
for all 22-items. Based on Chiu and Henry (1990), possible scores ranged from 22 to 88
points. Scores 27 and lower represented low mathematics anxiety, scores 28 to 51
represented some mathematics anxiety, and scores 52 and above represented high
mathematics anxiety. In this study, an additional question was added to the end of the
original MASC instructing children to rate their teacher’s level of mathematics anxiety on
a 4-point Likert-type scale ranging from 1 (not nervous) to 4 (very very nervous). This
statement was also awarded 1 to 4 points. A score of 1 represented low teacher
mathematics anxiety, scores 2 and 3 represented some teacher mathematics anxiety, and a
score of 4 represented high teacher mathematics anxiety. This question assessed
children’s awareness of their teacher’s level of mathematics anxiety.

22
Teachers’ mathematics anxiety was assessed using the Abbreviated Mathematics
Anxiety Rating Scale (A-MARS; Alexander & Martray, 1989; see Appendix I) that lasted
approximately 10 minutes. The A-MARS is an internally consistent measure that is less
time consuming, easier to administer, and faster to score than the 98-item Mathematics
Anxiety Rating Scale (MARS; Alexander & Martray, 1989). Teachers self-administered
this assessment. They were given the questionnaire at the beginning of the data
collection at their school and were instructed to begin by reading the instructions
followed by the 25-items (e.g., taking a final in a math course). Teachers then rated their
level of anxiety considering each statement on a 5-point Likert-type scale ranging from 1
(not at all) to 5 (very much). Each statement response was awarded 0 to 4 points,
respectively, and then summed for all 25-items. Possible scores ranged from 0 to 100
points. Based on Ashcraft and Moore (2009), scores 20 and lower represented low
mathematics anxiety, scores 21 to 51 represented some mathematics anxiety, and scores
52 and above represented high mathematics anxiety. After completion of the
questionnaire, teachers were instructed to seal it in a provided envelope. Envelopes were
collected from the teachers at the end of the data collection at each school.

23
CHAPTER THREE
Results
Participant performance was assessed through mixed model analyses of variance
(ANOVA), one-way ANOVAs, multiple regression analyses, cluster analyses,
discriminant analyses, and correlation analyses. Significant results had an alpha level of
.05 or lower unless reported otherwise.
3.1 Children’s Performance on Mathematics Tests
3.1.1 Children’s conceptual understanding of arithmetic.
3.1.1.1 Accuracy. A 3 (Grade: 4, 5, 6) x 2 (Sex: Male, Female) x 2
(Operation type: additive, multiplicative) x 6 (Problem type: identity, negation,
commutativity, inversion, associativity, equivalence) mixed model ANOVA was
conducted to assess children’s accuracy on the problem-solving task. A main effect was
found for problem type, F(5, 570) = 105.49, p < .001, MSE = 99004.58, 𝜂p2 = .48. Mean
differences showed that children were more accurate on identity, negation, and inversion
problems compared to commutativity, associativity, and equivalence problems, HSD =
13.31 (see Table 1). A main effect was found for operation type, F(1, 114) = 154.41, p <
.001, MSE = 140330.98, 𝜂p2 = .58. Children were more accurate on additive problems
compared to multiplicative problems (see Table 2). A main effect was also found for
grade, F(2, 114), p = .024, MSE = 19929.15, 𝜂p2 = .063. Mean differences showed that
Grade 5 children were more accurate on the problem-solving task compared to Grade 4
children but no differences were found between Grades 5 and 6 children or Grades 4 and
6 children, HSD = 7.97. Lastly, a main effect was found for sex, F(1, 114) = 10.13, p =

24
.002, MSE = 52498.45, 𝜂p2 = .083 (Figure 1). Males were more accurate on the problem-
solving task compared to females.
Table 1: Children’s Conceptual Understanding of Arithmetic on the Problem-Solving Task by Problem Type (Identity, Negation, Commutativity, Inversion, Associativity, and Equivalence) and Sex (Male and Female)
Table 2. Children’s Conceptual Understanding of Arithmetic on the Problem-Solving Task by Operation Type (Additive and Multiplicative).

25
Figure 1. Children’s accuracy and strategy use on the problem-solving task for sex (male and female). There were four significant interactions. First, an interaction was found between
problem type and sex, F(5, 570) = 2.86, p = .015, MSE = 2684.11, 𝜂p2 = .024 (see Figure
2). Mean differences showed that the male advantage was largest on inversion and
associativity problems and smallest on identity problems, HSD = 22.51. Second, an
interaction was found between operation type and sex, F(1, 114) = 6.86, p = .010, MSE =
6230.38, 𝜂p2 = .057 (see Figure 3). Mean differences showed that the male advantage
was larger on multiplicative problems compared to additive problems, HSD = 26.66.
Third, an interaction was found between problem type and operation type, F(5, 570) =
14.58, p < .001, MSE = 7362.48, 𝜂p2 = .12 (see Figure 4). Mean differences showed that
children’s advantage on addition problems compared to multiplicative problems was

26
largest on associativity and negation problems and smallest on identity and
commutativity problems, HSD = 29.34.
Figure 2. Children’s accuracy on the problem-solving task for problem-type (identity, negation, commutativity, inversion, associativity, and equivalence) and sex (male and female).

27
Figure 3. Children’s accuracy on the problem-solving task for operation type (additive and multiplicative) and sex (male and female).

28
Figure 4. Children’s accuracy on the problem-solving task for problem type (identity, negation, commutativity, inversion, associativity, and equivalence) and operation type (additive and multiplicative). Fourth, a three-way interaction was found between problem type, operation type,
and grade, F(10, 570) = 3.81, p < .001, MSE = 1888.50, 𝜂p2 = .063 (see Figure 5). Mean
differences showed similar results as found in the interaction between problem type and
operation type, HSD = 18.88. However, it revealed that Grade 4 children were relatively
as competent on additive commutativity problems as multiplicative commutativity
problems. Results also showed that as children age, their advantage on additive problems
remains relatively consistent for basic arithmetic concepts (i.e., identity, negation,
commutativity, and inversion) but gradually faded for complex arithmetic concepts (i.e.,
associativity and equivalence). Therefore, children’s conceptual understanding of
associativity and equivalence improved over Grades 4, 5, and 6 suggesting that these are

29
critical ages for the development of associativity and equivalence problems. No
interactions were found between problem type and grade, F(10, 570) = 1.64, p = .092,
MSE = 1537.96, 𝜂p2 = .028, between problem type, grade, and sex, F(10, 570) = .30, p =
.980, MSE = 285.20, 𝜂p2 = .005, between operation type and grade, F(2, 114) = .42, p =
.657, MSE = 382.78, 𝜂p2 = .007, between operation type, grade, and sex, F(2, 114) = .043,
p = .958, MSE = 38.75, 𝜂p2 = .001, or between problem type, operation type, and sex,
F(5, 570) = 2.23, p = .050, MSE = 1107.12, 𝜂p2 = .019.
Figure 5. Grade 4 children’s accuracy on the problem-solving task for problem type (identity, negation, commutativity, inversion, associativity, and equivalence) and operation type (additive and multiplicative). 3.1.1.2 Reaction time. A 3 (Grade: 4, 5, 6) x 2 (Sex: Male, Female) x 2
(Operation type: additive, multiplicative) x 6 (Problem type: identity, negation,

30
commutativity, inversion, associativity, equivalence) mixed model ANOVA was
conducted to assess children’s reaction time on the problem-solving task. Results should
be interpreted with caution as children’s reaction time on the problem-solving task was
only included in the analyses if participants had at least one correct response for each
problem type (i.e., identity, negation, commutativity, inversion, associativity, and
equivalence). Consequently, less than half of the participants (n = 46) were included.
A main effect was found for problem type, F(5, 200) = 143.16, p < .001, MSE =
1036177933, 𝜂p2 = .78. Mean differences showed that children had fast reaction times on
identity and negation, moderate reaction times on inversion and commutativity, and slow
reaction times on associativity and equivalence problems, HSD = 1169.01 (see Table 1).
No main effects were found for operation type, F(1, 40) = .35, p = .558, MSE =
1651431.03, 𝜂p2 = .010, grade, F(2, 40) = 1.95, p = .155, MSE = 66094116.27, 𝜂p
2 = .089,
or sex, F(1, 40) = 2.17, p = .149, MSE = 73484402.72, 𝜂p2 = .051.
There were two significant interactions. First, an interaction was found between
problem type and operation type, F(5, 200) = 5.83, p < .001, MSE = 39215276.29, 𝜂p2 =
.13 (see Figure 6). Mean differences showed that children’s advantage on additive
problems compared to multiplicative problems was largest for associativity problems and
smallest for identity problems, HSD = 1127.28. Surprisingly, children had a large
advantage on multiplicative equivalence problems compared to additive equivalence
problems. Children also had a small advantage on multiplicative commutativity
problems compared to additive commutativity problems.

31
Figure 6. Children’s reaction time on the problem-solving task for problem type (identity, negation, commutativity, inversion, associativity, and equivalence) and operation type (additive and multiplicative). Second, a three-way interaction was found between problem type, grade, and sex,
F(10, 200) = 3.17, p = .001, MSE = 22931324.40, 𝜂p2 = .14 (see Figure 7). Mean
differences showed that Grade 4 males’ advantage was largest on commutativity
problems and smallest on inversion and associativity problems, HSD = 2080.80. Grade 4
females, surprisingly, had a large advantage over males on equivalence problems. Grades
5 and 6 males demonstrated a relatively consistent advantage over females on all
problems types (see Figures 8 and 9). In particular, Grade 5 males’ advantage was largest
on equivalence problems and smallest on commutativity problems. Grade 6 males’
advantage was largest on equivalence problems and smallest on identity and negation
problems. Overall, males generally had faster reaction times compared to females. No
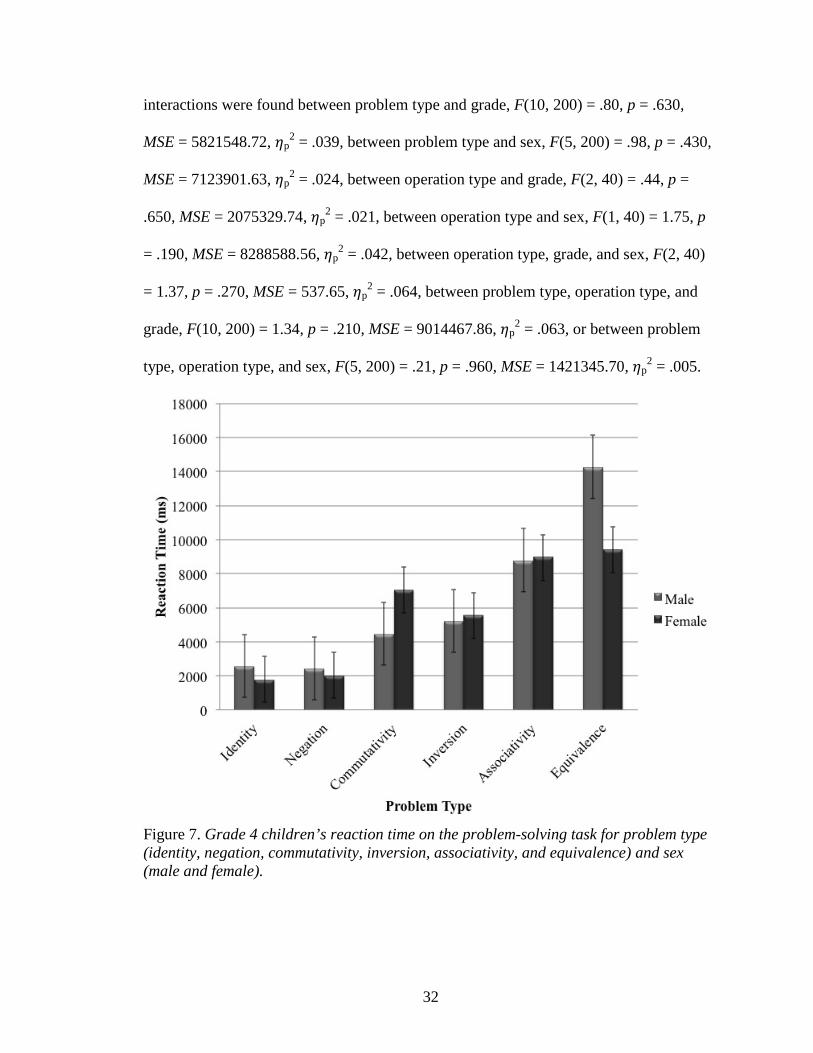
32
interactions were found between problem type and grade, F(10, 200) = .80, p = .630,
MSE = 5821548.72, 𝜂p2 = .039, between problem type and sex, F(5, 200) = .98, p = .430,
MSE = 7123901.63, 𝜂p2 = .024, between operation type and grade, F(2, 40) = .44, p =
.650, MSE = 2075329.74, 𝜂p2 = .021, between operation type and sex, F(1, 40) = 1.75, p
= .190, MSE = 8288588.56, 𝜂p2 = .042, between operation type, grade, and sex, F(2, 40)
= 1.37, p = .270, MSE = 537.65, 𝜂p2 = .064, between problem type, operation type, and
grade, F(10, 200) = 1.34, p = .210, MSE = 9014467.86, 𝜂p2 = .063, or between problem
type, operation type, and sex, F(5, 200) = .21, p = .960, MSE = 1421345.70, 𝜂p2 = .005.
Figure 7. Grade 4 children’s reaction time on the problem-solving task for problem type (identity, negation, commutativity, inversion, associativity, and equivalence) and sex (male and female).

33
Figure 8. Grade 5 children’s reaction time on the problem-solving task for problem type (identity, negation, commutativity, inversion, associativity, and equivalence) and sex (male and female).

34
Figure 9. Grade 6 children’s reaction time on the problem-solving task for problem type (identity, negation, commutativity, inversion, associativity, and equivalence) and sex (male and female). 3.1.1.3 Strategy use. A 3 (Grade: 4, 5, 6) x 2 (Sex: Male, Female) x 2
(Operation type: additive, multiplicative) x 6 (Problem type: identity, negation,
commutativity, inversion, associativity, equivalence) mixed model ANOVA was
conducted to assess children’s strategy use on the problem-solving task. There were
three main effects. A main effect was found for problem type, F(5, 570) = 201.31, p <
.001, MSE = 227192.44, 𝜂p2 = .64. Mean differences showed that children used
conceptually-based strategies more often on identity, negation, and commutativity
problems compared to inversion, associativity, and equivalence problems, HSD = 14.60
(see Table 1). A main effect was found for operation type, F(1, 114) = 80.65, p < .001,

35
MSE = 60527.12, 𝜂p2 = .41 (see Figure 1). Children used conceptually-based strategies
more often on additive problems compared to multiplicative problems. Lastly, a main
effect was found for sex, F(1, 114) = 5.59, p = .020, MSE = 19580.17, 𝜂p2 = .047 (see
Figure 2). Males used conceptually-based strategies more often compared to females.
No main effect was found for grade, F(2, 114) = 2.40, p = .095, MSE = 8425.39, 𝜂p2 =
.040.
There were two significant interactions. First, an interaction was found between
problem type and operation type, F(5, 570) = 43.70, p < .001, MSE = 26734.76, 𝜂p2 = .28
(see Figure 10). Mean differences showed that children’s advantage on additive
problems compared to multiplicative problems was largest on negation problems and
smallest on identity and associativity problems, HSD = 10.75. Again, children’s
advantage was larger on multiplicative commutativity problems compared to additive
commutativity problems. Second, a three-way interaction was found between problem
type, operation type, and grade, F(10, 570) = 2.71, p = .003, MSE = 1658.18, 𝜂p2 = .045.
Mean differences showed that the additive advantage was largest on negation problems
and smallest on identity, associativity, and equivalence problems for Grade 4 children,
largest on equivalence problems and smallest on identity and associativity problems for
Grade 5 children, and largest on negation problems and smallest on equivalence problems
for Grade 6 children, HSD = 17.69 (see Table 3). No interactions were found between
problem type and grade, F(10, 570) = 1.74, p = .069, MSE = 1963.50, 𝜂p2 = .030, between
problem type and sex, F(5, 570) = .43, p = .830, MSE = 481.98, 𝜂p2 = .004, between
problem type, grade, and sex, F(10, 570) = .36, p = .960, MSE = 407.66, 𝜂p2 = .006,
between operation type and grade, F(2, 114) = .60, p = .550, MSE = 452.75, 𝜂p2 = .010,

36
between operation and sex, F(1, 114) = 1.12, p = .290, MSE = 837.25, 𝜂p2 = .010,
between operation type, grade, and sex, F(2, 114) = .07, p = .940, MSE = 49.29, 𝜂p2 =
.001, between problem type, operation type, and sex, F(5, 570) = 1.74, p = .120, MSE =
1066.55, 𝜂p2 = .015, or between problem type, operation type, grade, and sex, F(10, 570)
= 1.63, p = .094, MSE = 998.22, 𝜂p2 = .028.
Figure 10. Children’s strategy use on the problem-solving task for problem type (identity, negation, commutativity, inversion, associativity, and equivalence) and operation type (additive and multiplicative).

37
Table 3: Children’s Conceptually-Based Strategy Use (%) on the Problem-Solving Task by Problem Type (Identity, Negation, Commutativity, Inversion, Associativity, and Equivalence), Operation Type (Additive and Multiplicative), and Grade (4, 5, and 6)
To summarize, children had good conceptual understanding of identity and
negation, some conceptual understanding of commutativity and inversion, and weak
conceptual understanding of associativity and equivalence problems. In particular, these
findings showed that Grades 4, 5, and 6 are critical ages for the development of
associativity and equivalence. Children also had greater conceptual understanding of
additive problems compared to multiplicative problems. Males had greater conceptual
understanding of arithmetic compared to females on the problem-solving task. Lastly,
inconsistent with expectation, grade did not have a significant effect on children’s overall
conceptual understanding of arithmetic on the problem-solving task.
38
3.1.2 Children’s arithmetic fluency.
3.1.2.1 Number of problems attempted. A 3 (Grade: 4, 5, 6) x 2 (Sex:
Male, Female) x 4 (Operation type: addition, subtraction, multiplication, division) mixed
model ANOVA was conducted to assess the number of problems children attempted on
the timed mathematics task. There were three main effects. A main effect was found for
operation type, F(3, 342) = 73.93, p < .001, MSE = 940.83, 𝜂p2 = .39 (see Figure 11).
Mean differences showed that children attempted more multiplication and division
problems compared to addition and subtraction problems, HSD = 1.43. A main effect
was also found for grade, F(2, 114) = 6.34, p = .002, MSE = 705.52, 𝜂p2 = .10 (see Figure
12). Mean differences showed that Grades 5 and 6 children attempted more problems
than Grade 4 children on the timed mathematics task but there was no significant
difference between Grades 5 and 6, HSD = 2.02. Lastly, a main effect was found for sex,
F(1, 114) = 15.72, p < .001, MSE = 1749.94, 𝜂p2 = .12 (see Figure 13). Males attempted
more problems compared to females.

39
Figure 11. The number of problems children attempted on the timed mathematics task for operation type (addition, subtraction, multiplication, and division) and sex (male and female).

40
Figure 12. The number of problems children attempted on the timed mathematics task for operation type (addition, subtraction, multiplication, and division) and grade (4, 5, and 6).
41
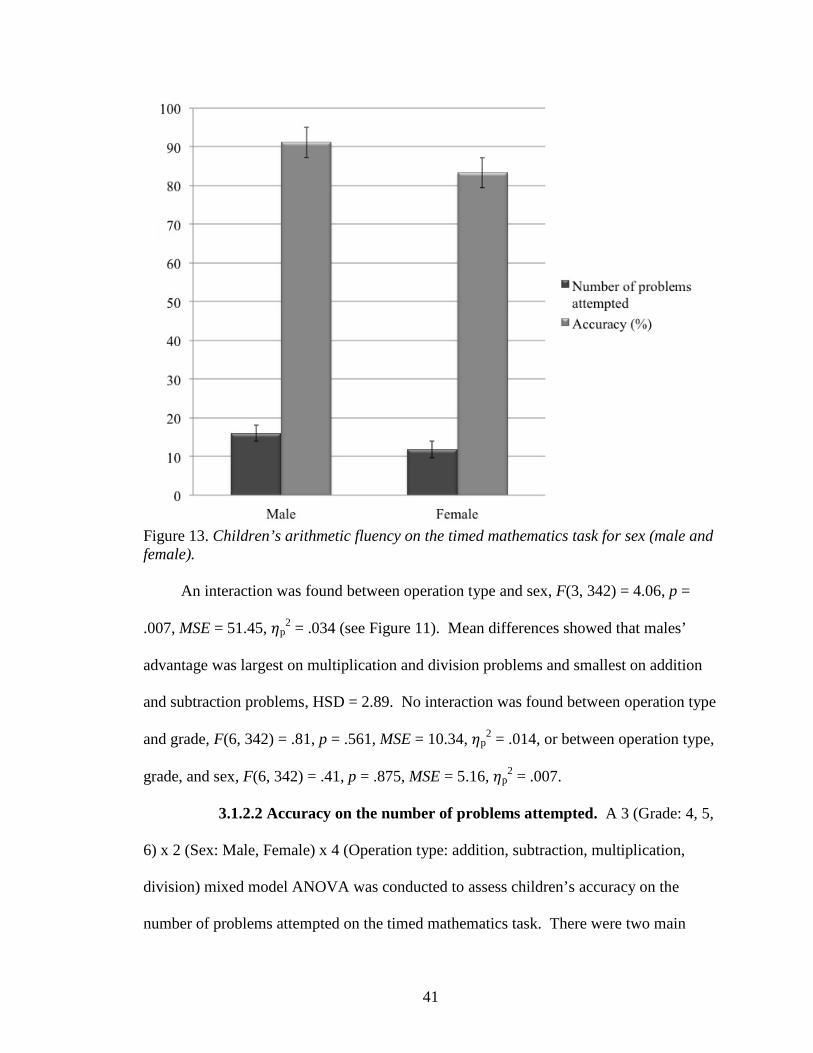
Figure 13. Children’s arithmetic fluency on the timed mathematics task for sex (male and female). An interaction was found between operation type and sex, F(3, 342) = 4.06, p =
.007, MSE = 51.45, 𝜂p2 = .034 (see Figure 11). Mean differences showed that males’
advantage was largest on multiplication and division problems and smallest on addition
and subtraction problems, HSD = 2.89. No interaction was found between operation type
and grade, F(6, 342) = .81, p = .561, MSE = 10.34, 𝜂p2 = .014, or between operation type,
grade, and sex, F(6, 342) = .41, p = .875, MSE = 5.16, 𝜂p2 = .007.
3.1.2.2 Accuracy on the number of problems attempted. A 3 (Grade: 4, 5,
6) x 2 (Sex: Male, Female) x 4 (Operation type: addition, subtraction, multiplication,
division) mixed model ANOVA was conducted to assess children’s accuracy on the
number of problems attempted on the timed mathematics task. There were two main

42
effects. A main effect was found for operation type, F(3, 342) = 23.45, p < .001, MSE =
8010.11, 𝜂p2 = .17 (see Figure 14). Mean differences showed that children were more
accurate on addition and multiplication problems compared to subtraction and division
problems, HSD = 7.42. A main effect was also found for sex, F(1, 114) = 6.08, p = .015,
MSE = 6517.06, 𝜂p2 = .051 (see Figure 13). This means that males were more accurate
on the number of problems they attempted compared to females. No main effect was
found for grade, F(2, 114) = 4261.31, p = .142, MSE = 2130.66, 𝜂p2 = .034.
Figure 14. Children’s accuracy on the number of problems attempted on the timed mathematics task for operation type (addition, subtraction, multiplication, and division) and sex (male and female). An interaction was found between operation type and sex, F(3, 342) = 5.05, p =
.002, MSE = 1724.96, 𝜂p2 = .042 (see Figure 14). Mean differences showed that males’
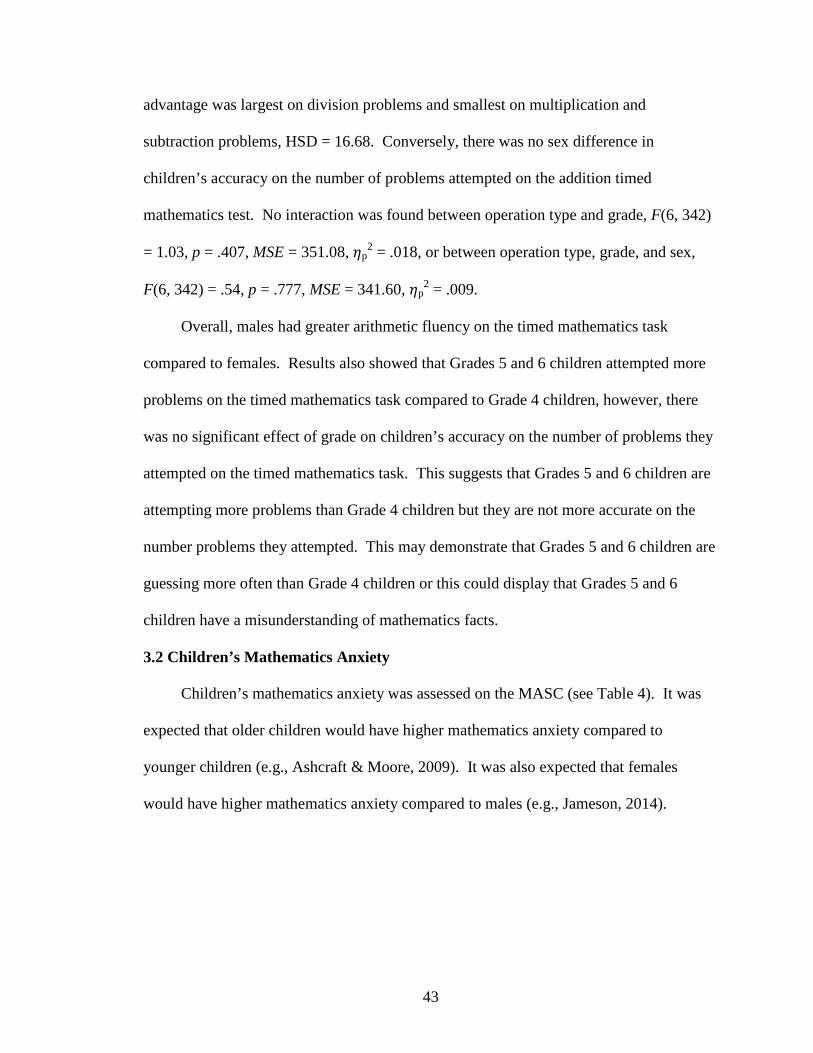
43
advantage was largest on division problems and smallest on multiplication and
subtraction problems, HSD = 16.68. Conversely, there was no sex difference in
children’s accuracy on the number of problems attempted on the addition timed
mathematics test. No interaction was found between operation type and grade, F(6, 342)
= 1.03, p = .407, MSE = 351.08, 𝜂p2 = .018, or between operation type, grade, and sex,
F(6, 342) = .54, p = .777, MSE = 341.60, 𝜂p2 = .009.
Overall, males had greater arithmetic fluency on the timed mathematics task
compared to females. Results also showed that Grades 5 and 6 children attempted more
problems on the timed mathematics task compared to Grade 4 children, however, there
was no significant effect of grade on children’s accuracy on the number of problems they
attempted on the timed mathematics task. This suggests that Grades 5 and 6 children are
attempting more problems than Grade 4 children but they are not more accurate on the
number problems they attempted. This may demonstrate that Grades 5 and 6 children are
guessing more often than Grade 4 children or this could display that Grades 5 and 6
children have a misunderstanding of mathematics facts.
3.2 Children’s Mathematics Anxiety
Children’s mathematics anxiety was assessed on the MASC (see Table 4). It was
expected that older children would have higher mathematics anxiety compared to
younger children (e.g., Ashcraft & Moore, 2009). It was also expected that females
would have higher mathematics anxiety compared to males (e.g., Jameson, 2014).

44
Table 4: Descriptive Statistics of Children’s Mathematics Anxiety on the MASC
Note. MA = mathematics anxiety A 3 (Grade: 4, 5, 6) x 2 (Sex: Male, Female) mixed model ANOVA was conducted
to assess the effects of grade and sex on children’s mathematics anxiety. There was a
main effect of sex, F(1, 119) = 10.05, p = .002, MSE = 1409.29, 𝜂p2 = .081 (see Figure
15). Females had higher mathematics anxiety compared to males, HSD = 4.54. No main
effect was found for grade, F(2, 119) = .79, p = .458, MSE = 110.40, 𝜂p2 = .014, and no
interaction was found between grade and sex, F(2, 119) = .94, p = .394, MSE = 131.74,
𝜂p2 = .016. Therefore, consistent with expectations, sex had a significant effect on
children mathematics anxiety but, inconsistent with expectations, grade did not.

45
Figure 15. Children’s mathematics anxiety score on the MASC for sex (male and female). 3.3 Children’s Mathematics Anxiety and its Effect on their Performance on
Mathematics Tests
3.3.1 Children’s mathematics anxiety and conceptual understanding of
arithmetic. Correlation analyses were conducted to assess the relationships between
children’s mathematics anxiety and their conceptual understanding of arithmetic on the
problem-solving task. Negative correlations were found between children’s mathematics
anxiety and their accuracy and strategy use on the problem-solving task (see Table 5).
Children with higher mathematics anxiety had lower accuracy and used conceptually-
based strategies less often on the problem-solving task compared to children with lower
mathematics anxiety. A positive correlation was also found between children’s
mathematics anxiety and their reaction time on the problem-solving task suggesting that

46
children with higher mathematics anxiety had slower reaction times on the problem-
solving task compared to children with lower mathematics anxiety. Overall, children
with higher mathematics anxiety had weaker conceptual understanding of arithmetic on
the problem-solving task compared to children with lower mathematics anxiety.
Table 5: Correlation Matrix Showing the Relationships Between Children’s Mathematics Anxiety and their Mathematics Performance on the Problem-Solving Task and Timed Mathematics Task
MA
Problem-Solving Task Timed Mathematics Task
Accuracy Reaction Time
Strategy Use
Number of Problems Attempted
Accuracy
MA 1 -.275** .192* -.179* -.392** -.446
Problem-Solving Task
Accuracy -.275** 1 -.172 .911** .443** 476**
Reaction Time .192* -.176 1 -.234* -.194* -.202*
Strategy Use -.179* .911** -.234* 1 .376** .343**
Timed Mathematics
Task
Number of Problems Attempted
-.392** .443** -.194* .376** 1 .380**
Accuracy -.446** .476** -.202* .343** .380** 1 **. Correlation is significant at the 0.01 level (2-tailed). *. Correlation is significant at the 0.05 level (2-tailed). Note. MA = mathematics anxiety. A direct-entry multiple regression analysis was also conducted to assess the effects
of children’s mathematics anxiety on their conceptual understanding of arithmetic on the
problem-solving task. Children’s conceptual understanding of arithmetic had a
significant effect on their mathematics anxiety, F(3, 119) = 6.25, p = .001, MSE = 824.27,
r = .373. More specifically, children’s accuracy, b = .70 [1.29, .33], p = .001, reaction
time, b = .19 [.000, .003], p = .036, and strategy use, b = .51 [.12, 1.28], p = .019, on the
problem-solving task had a significant effect on their mathematics anxiety. To check for

47
multicollinearity, the variance inflation factor (VIF) values were assessed. Results
showed that the VIF values for accuracy (i.e., 5.94), reaction time (i.e., 1.07), and
strategy use (i.e., 6.10) were less than 10. These findings suggest that multicollinearity
was not violated. However, the average VIF value of 4.37 was substantially greater than
1, which means that this regression model may be biased. These findings suggest that
children with higher mathematics anxiety had weaker conceptual understanding of
arithmetic on the problem-solving task compared to children with lower mathematics
anxiety. Overall, children’s mathematics anxiety had the largest impact on their accuracy
compared to their reaction time and strategy use on the problem-solving task.
3.3.2 Children’s mathematics anxiety and arithmetic fluency. Correlation
analyses were conducted to assess the relationships between children’s mathematics
anxiety and their arithmetic fluency on the timed mathematics task. Negative correlations
were found between children’s mathematics anxiety and the number of problems
attempted and their accuracy on the number of problems attempted on the timed
mathematics task suggesting that children with higher mathematics anxiety attempted
fewer problems and had lower accuracy on the number of problems they attempted on the
timed mathematics task compared to children with lower mathematics anxiety (see Table
5). Overall, children with higher mathematics anxiety had weaker arithmetic fluency on
the timed mathematics task compared to children with lower mathematics anxiety.
A direct-entry multiple regression analysis was also conducted to assess the effects
of children’s mathematics anxiety on their arithmetic fluency on the timed mathematics
task. Children’s arithmetic fluency had a significant effect on their mathematics anxiety,
F(2, 119) = 20.20, p < .001, MSE = 2282.12, r = .507. More specifically, the number of

48
problems children attempted, b = .26 [.628, .130], p = .003, and children’s accuracy on
the number of problems attempted, b = .35, [.377, .129], p < .001, on the timed
mathematics task had significant effects on children’s mathematics anxiety. To check for
multicollinearity, the VIF values were assessed. Results showed that the VIF value for
number of problems attempted (i.e., 1.17) and accuracy on the number of problems
attempted (i.e., 1.17) on the timed mathematics task were less than 10. These findings
suggest that multicollinearity was not violated. In addition, the average VIF value of 1.17
was not substantially greater than 1, which means that this regression model was likely
not biased. These findings suggest that children with higher mathematics anxiety had
weaker arithmetic fluency compared to children with lower mathematics anxiety.
Overall, children’s mathematics anxiety had the most significant effect on their accuracy
on the number of problems attempted compared to the number of problems they
attempted on the timed mathematics task. The current study showed that children’s
mathematics anxiety had a significant effect on their conceptual understanding of
arithmetic on the problem-solving task. Children with higher mathematics anxiety had
lower accuracy, slower reaction time, and used conceptually-based strategies less often
compared to children with lower mathematics anxiety. However, results should be
interpreted with caution as this regression model may be biased. Children’ mathematics
anxiety also had a significant effect on their arithmetic fluency on the timed mathematics.
Children with higher mathematics anxiety attempted fewer problems and had lower
accuracy on the number of problems attempted compared to children with lower
mathematics anxiety. Overall, the relationship was stronger between children’s
mathematics anxiety and their arithmetic fluency on the timed mathematics task

49
compared to the relationship between children’s mathematics anxiety and their
conceptual understanding of arithmetic on the problem-solving task.
3.4 Exploratory Analysis of Teachers’ Mathematics Anxiety
As part of an exploratory and secondary component, the current study explored
teachers’ mathematics anxiety and its effect on their students (see Table 6). A correlation
analysis was conducted to assess the relationship between teachers’ mathematics anxiety
and their students’ mathematics anxiety. However, no significant correlation was found
(see Table 7). This means that teachers’ mathematics anxiety did not impact their
students’ level of mathematics anxiety.
Table 6: Descriptive Statistics of Teachers’ Mathematics Anxiety on the A-MARS
Note. MA = mathematics anxiety.

50
Table 7: Correlation Matrix Showing the Relationships Between Teachers’ Mathematics Anxiety and their Students’ Mathematics Anxiety and their Students’ Mathematics Performance on the Problem-Solving Task and Timed Mathematics Task
Teachers’ MA
Students’ MA
Problem-Solving Task Timed Mathematics Task Students’
Awareness of their
Teachers’ MA
Accuracy
Reaction Time
Strategy Use
Number of
Problems Attempte
d
Accuracy
Teachers’ MA 1 .068 -.298** -.098 .244** -.015 -.149 -.001
Students’ MA .068 1 -.260** .236** -.246** -.370** -.399** .283**
Problem-Solving
Task
Accuracy -.298** -.260** 1 -.175 .916** .107 .535** .008
Reaction Time -.098 .236** -.175 1 -.225* -.268** -.254** .094
Strategy Use -.244** -.246** .916** -.225* 1 .081 .421** .002
Timed Mathematic
s Task
Number of
Problems Attempte
d
-.015 -.370** .107 -.268** .081 1 .353** -.107
Accuracy -.149 -.399** .535** -.254** .421** .353** 1 -.072
Students’ Predicted Level of their Teachers’
MA -.001 .283** .008 .094 .002 -.107 -.072 1
**. Correlation is significant at the 0.01 level (2-tailed). *. Correlation is significant at the 0.05 level (2-tailed). Note. MA = mathematics anxiety.
Correlation analyses were conducted to assess the relationships between teachers’
mathematics anxiety and their students’ conceptual understanding of arithmetic on the
problem-solving task. Negative correlations were found between teachers’ mathematics
anxiety and their students’ accuracy and strategy use on the problem-solving task
suggesting that teachers with higher mathematics anxiety had students with lower
accuracy and that used conceptually-based strategies less often on the problem-solving
task compared to teachers with lower mathematics anxiety (see Table 7). However, no
significant correlation was found between teachers’ mathematics anxiety and their
students’ reaction time on the problem-solving task. Overall, teachers with higher

51
mathematics anxiety had students with weaker conceptual understanding of arithmetic on
the problem-solving task compared to teachers with lower mathematics anxiety.
A direct-entry multiple regression analysis was also conducted to assess the effects
of teachers’ mathematics anxiety on their student’s conceptual understanding of
arithmetic on the problem-solving task. Results showed that teachers’ mathematics
anxiety had a significant effect on their students’ conceptual understanding of arithmetic
on the problem-solving task, F(3, 116) = 4.86, p = .003, MSE = 1563.08, r = .338.
However, when looked at more in depth, teachers’ mathematics anxiety impacts their
students’ accuracy, b = .44 [.647, .003], p = .052, but it does not impact their students’
reaction time, b = .15 [.004, .000], p = .110, or strategy use, b = .12, [.278, .489], p =
.587. Therefore, teachers’ mathematics anxiety did not impact their students’ overall
conceptual understanding of arithmetic on the problem-solving task.
Correlation analyses were conducted to assess the relationships between teachers’
mathematics anxiety and their students’ arithmetic fluency on the timed mathematics
task. No significant correlations were found between teachers’ mathematics anxiety and
the number of problem their students’ attempted or between teachers’ mathematics
anxiety and their students’ accuracy on the number of problems attempted on the timed
mathematics task (see Table 7). Therefore, teachers’ mathematics anxiety also did not
impact their students’ arithmetic fluency on the timed mathematics task.
Furthermore, a correlation analysis was conducted to assess students’ ability to
predict their teachers’ level of mathematics anxiety. No significant correlation was found
between teachers’ mathematics anxiety and their students’ predicted level of their
teachers’ mathematics anxiety suggesting that students were unaware of their teachers’

52
mathematics anxiety (see Table 7). Interestingly, a positive correlation was found
between children’s mathematics anxiety and their predicted level of their teachers’
mathematics anxiety. Mean differences showed that children with higher mathematics
anxiety were more likely to rate their teachers’ level of mathematics anxiety as higher
compared to children with lower mathematics anxiety. Overall, these findings prompt
many questions for future research.
Lastly, a 3 (Grade: 4, 5, 6) x 2 (Sex: Male, Female) mixed model ANOVA was
conducted to assess the effects of grade and sex on teachers’ mathematics anxiety. There
were two main effects. First, there was a main effect for grade, F(2, 116) = 3.85, p =
.024, MSE = 1133.14, 𝜂p2 = .065. Mean differences showed that Grade 4 teachers had
higher mathematics anxiety compared to Grade 5 teachers but there was no significant
difference between Grades 5 and 6 or between Grades 4 and 6, HSD = 7.43 (see Figure
16). A main effect was also found for sex, F(1,116) = 9.98, p = .002, MSE = 2941.29, 𝜂p2
= .082. Female teachers had higher mathematics anxiety compared to male teachers (see
Figure 17). No interaction was found between grade and sex, F(2, 116) = 2.28, p = .107,
MSE = 671.78, 𝜂p2 = .039. Overall, grade and sex each had a significant effect on
teachers’ mathematics anxiety.

53
Figure 16. Teachers’ mathematics anxiety score on the A-MARS for grade (4, 5, and 6).

54
Figure 17. Teachers’ mathematics anxiety score on the A-MARS for sex (male and female).

55
CHAPTER FOUR
Discussion
The current study primarily focused on children’s mathematics anxiety and its
effect on their conceptual understanding of arithmetic and arithmetic fluency. Results
showed that children’s mathematics anxiety not only impacts their arithmetic fluency
(e.g., Tsui & Mazzocco, 2006), it also impacts their conceptual understanding of
arithmetic. This finding is critical because conceptual understanding of arithmetic allows
children to learn complex mathematics skills and concepts (e.g., Allard, 2011).
Children’s mathematics anxiety, therefore, inhibits their performance on mathematics
tests more significantly than previously thought. Results also confirm that females have
higher mathematics anxiety compared to males (e.g., Geist, 2010). Sex differences were
also evident in children’s conceptual understanding of arithmetic and their arithmetic
fluency. Furthermore, no grade differences were found in children’s mathematics
anxiety, arithmetic fluency, or conceptual understanding of arithmetic. Results displayed
that teachers’ mathematics anxiety did not interfere with teaching their students retrieval
of mathematical facts or why a mathematical procedural works. Teachers’ level of
mathematics anxiety also did not influence their students’ level of mathematics anxiety
and students were unaware of their teachers’ level of mathematics anxiety. Lastly, Grade
4 and female teachers had higher mathematics anxiety compared to Grade 5 and male
teachers. These findings and implications are discussed further.
4.1 Children’s Mathematics Anxiety and Performance on Mathematics Tests
4.1.1 Characteristics and development of children’s mathematics anxiety.
Research readily emphasizes the importance of cognitive abilities in performance onn

56
mathematics tests (e.g., Dowker et al., 2012). However, cognitive abilities are not the
only characteristic that influences performance on mathematics tests. Mathematics
attitudes, such as mathematics anxiety, also critically impact performance on
mathematics tests (e.g., Beilock, 2008; Harari et al., 2013). The current study examined
children’s mathematics anxiety and its effect on their conceptual understanding of
arithmetic and arithmetic fluency. The majority of previous research suggests that
mathematics anxiety emerges in Grade 3 (e.g., Wu et al., 2012). Wu and colleagues
(2012) attribute this to the Grade 3 mathematics curriculum that begins to focus on
complex mathematics concepts and operations. Even though the aim of the current study
was not to confirm the age of onset of mathematics anxiety, it does verify that Grades 4,
5, and 6 children do experience mathematics anxiety.
4.1.1.1 Grade differences in children’s mathematics anxiety. The general
consensus has been that mathematics anxiety, if not resolved, becomes more pronounced
over time (e.g., Ashcraft & Moore, 2009, Dowker et al., 2012; Walen & Williams, 2002).
The current study, however, does not support these findings. Instead, it found that there
was no effect of grade on children’s mathematics anxiety suggesting that mathematics
anxiety is relatively stable throughout Grades 4, 5, and 6. Beilock (2008), however,
found that mathematics anxiety begins to increase in Grade 5, peaking in Grades 9 and
10. Research attributes children’s increasing mathematics anxiety to the progressively
difficult mathematics curriculum (Ashcraft et al., 2007) as well as children becoming
more concerned about the consequences of their performance on mathematics tests (Gierl
& Bisanz, 1995). These findings, however, suggest that these factors may not have such

57
a prominent influence on children’s mathematics anxiety as previously thought; at least,
not in Grades 4, 5, and 6.
Conceptual understanding of arithmetic (e.g., Geary, 1994; Robinson & Ninowski,
2003; Sears, 2008) and arithmetic fluency (e.g., Geary, 1994; Ramos-Christian et al.,
2008) also typically improve over time. The current study found that Grade 5 children
were more accurate on the problem-solving task compared to Grade 4 children and that
Grades 5 and 6 children attempted more problems on the timed mathematics task
compared to Grade 4 children. However, there was no effect of grade on children’s
overall conceptual understanding of arithmetic or overall arithmetic fluency. Some
research supports these findings. For instance, Vilette (2002) found that children as
young as preschool had some conceptual understanding of arithmetic suggesting that
formal schooling does not influence children’s conceptual understanding of arithmetic.
Robinson and Dubé (2009b) similarly found that Grades 6, 7, and 8 did not influence
children’s arithmetic fluency. These findings could suggest that factors other than grade
may be responsible for improvements in children’s conceptual understanding of
arithmetic and arithmetic fluency. For instance, LeFevre, Skwachuk, Smith-Chant, Fast,
and Kamawar (2009) found that preschool children’s early experience playing with board
games was associated with their arithmetic fluency in Kindergarten, Grade 1, and Grade
2. Wolfgang, Stannard, and Jones (2001) similarly found that preschool children’s early
experience playing with blocks was associated with their performance on standardized
mathematics tests in high school. In other words, early mathematics experiences could
have a more meaningful impact on children’s performance on mathematics tests than
grade. However, other research has found grade differences in children’s conceptual
58
understanding of arithmetic (e.g., Dubé & Robinson, 2010; Robinson & Dubé, 2009a)
and arithmetic fluency (e.g., Calhoon et al., 2007). For instance, Dubé and Robinson
(2010) found that Grade 8 children used conceptually-based strategies more often than
Grade 6 children. Calhoon and colleagues (2007) found that older children consistently
had greater arithmetic fluency compared to younger children between Grades 2 through
6. This discrepancy in grade differences in children’s performance on mathematics tests
suggests that factors such as teaching strategies may also have a greater impact than
grade. For instance, Robinson and Dubé (2009a) explain that teachers often promote
methodological approaches to solving mathematical problems (i.e., left-to-right strategy),
which can interfere with children’s appeal to use conceptually-based strategies. As a
result, older children may actually have greater conceptual understanding of arithmetic
compared to younger children but fail to demonstrate such on mathematics assessments
because they are adhering to the rigid left-to-right strategies that they have been taught
(Robinson & Dubé, 2009a). Overall, these findings suggest that, at least in this sample,
formal schooling did not improve Grades 4, 5, and 6 children’s conceptual understanding
of arithmetic or arithmetic fluency and that children’s conceptual understanding of
arithmetic and arithmetic fluency develops slowly across Grades 4, 5, and 6.
4.1.1.2 Sex differences in children’s mathematics anxiety. Independent
from grade, females had higher mathematics anxiety compared to males. This is
consistent with previous research (e.g., Beilock et al., 2009; Geist, 2010; Wang et al.,
2014). Females’ higher mathematics anxiety has been attributed to lower confidence in
their mathematics ability (Geist, 2010) or possible mediating variables (e.g., spatial
ability; Maloney et al., 2012). However, it is unclear when sex differences become
59
evident in children’s mathematics anxiety. Hembree (1990) claims that sex differences in
children’s mathematics anxiety are evident across all grades. Other research shows that
sex differences do not emerge until adulthood (e.g., Harari et al., 2013). Gierl and Bisanz
(1995), conversely, found no sex differences in Grades 3 to 6 children’s mathematics
anxiety. Nevertheless, the findings from this study suggest that females had higher
mathematics anxiety compared to males.
The current study found that males had greater conceptual understanding of
arithmetic compared to females. This is consistent with some research (e.g., Baroody,
Lai, et al., 2009; Geary et al., 2000). However, the majority of research shows no sex
differences in children’s conceptual understanding of arithmetic (e.g., Dubé, 2014;
Robinson, Arbuthnott, et al., 2006; Robinson & Dubé, 2009b; Robinson & Ninowski,
2003). This could be explained by the negative relationship between mathematics
anxiety and performance on mathematics tests, which shows that children with higher
mathematics anxiety have weaker performance on mathematics tests compared to
children with lower mathematics anxiety (e.g., Beilock & Willingham, 2014; Maloney et
al., 2012). This relationship, though, has never been investigated with children’s
conceptual understanding of arithmetic. Overall, the current study shows that females
had greater difficulty understanding why a mathematical procedure works compared to
males.
The current study also found that males had greater arithmetic fluency compared to
females. This suggests that males more easily retrieved mathematical facts compared to
females. These findings are consistent with some research (e.g., Carr & Alexeev, 2011;
Royer et al., 1999) but not all (e.g., Carr & Davis, 2001; Geary et al., 2000). Carr and

60
colleagues (2008) found that Grade 2 males had greater arithmetic fluency compared to
Grade 2 females. This sex difference is often associated with strategy preferences with
males relying on retrieval strategies and females relying on computational strategies (e.g.,
Carr & Jessup, 1997; Carr et al., 2008). Conversely, Carr and Davis (2001) found no sex
differences in Grade 1 children’s arithmetic fluency suggesting that sex differences do
not emerge until Grade 2. Overall, the findings from this study support previous research
showing that sex differences in children’s arithmetic fluency are evident in Grades, 4, 5,
and 6.
4.1.2 Children’s performance on mathematics tests.
4.1.2.1 Children’s conceptual understanding of arithmetic. Conceptual
understanding of arithmetic allows children to solve mathematics problems more quickly,
more accurately, and with greater flexibility (Squire et al., 2004). Studying children’s
conceptual understanding of arithmetic is important because it is the foundation for which
children learn complex mathematical skills and concepts (e.g., Allard, 2011). The current
study examined children’s conceptual understanding of arithmetic using six arithmetic
concept problems (i.e., identity, negation, commutativity, inversion, associativity, and
equivalence) for both additive (i.e., addition and subtraction) and multiplicative problems
(i.e., multiplication and division).
Research shows that children with good conceptual understanding of arithmetic
recognize the inverse relationship between additive operations and between multiplicative
operations (Robinson, Ninowski, et al., 2006). Consistent with previous research (e.g.,
LeFevre & Robinson, 2010; Robinson, Ninowski, et al., 2006), the current study found
that children had greater conceptual understanding of additive problems compared to

61
multiplicative problems. According to Gelman (2009), conceptual understanding of
arithmetic is derived from experience. Multiplicative problems are, therefore, more
difficult for children compared to additive problems because multiplication and division
are learn after addition and subtraction (e.g., Dixon et al., 2001). Children with good
conceptual understanding of additive problems are more likely to also have good
conceptual understanding of multiplicative problems (e.g., Robinson, Ninowski, et al.,
2006). However, good conceptual understanding of additive problems does not guarantee
good conceptual understanding of multiplicative problems (e.g., LeFevre & Robinson,
2010). For instance, the current study found that children had greater conceptual
understanding of additive problems compared to multiplicative problems. These
findings, therefore, demonstrate that Grades 4, 5, and 6 children still struggle to achieve
good conceptual understanding of arithmetic. In particular, they struggle the most with
conceptual understanding of multiplicative problems. Spending more time on
multiplication and division problems in the classroom could help improve children’s
understanding of these operations and their inverse relations, consequently, improving
their overall conceptual understanding of arithmetic.
Children’s conceptual understanding of identity, negation, commutativity,
inversion, associativity, and equivalence were also examined. Children had good
conceptual understanding of identity and negation, some conceptual understanding of
commutativity and inversion, and weak conceptual understanding of associativity and
equivalence problems. This is consistent with previous research (e.g., Price, 2013).
Robinson and LeFevre (2012) explain that children have greater conceptual
understanding of arithmetic concepts that develop earlier compared to ones that develop

62
later. Consequently, children have good conceptual understanding of identity and
negation because they are the easiest arithmetic concepts to understand (e.g., Price,
2013). Research also shows that identity and negation can develop before formal
schooling and often simultaneously explaining why children’s conceptual understanding
of these arithmetic concepts is so similar (e.g., Baroody, Lai, et al., 2009). Nevertheless,
these findings support previous research that children have greater conceptual
understanding of identity compared to negation (Baroody, Lai, et al., 2009; Price, 2013).
Children also demonstrated greater conceptual understanding of commutativity
compared to inversion. This finding is consistent with previous research (e.g., Canobi
and Bethune, 2008). Squire and colleagues (2004) explain that children’s conceptual
understanding of commutativity can develop without formal schooling. For instance,
preschool children demonstrate some conceptual understanding of commutativity (Patel
& Canobi, 2010). Siegler and Stern (1998), conversely, show that children’s conceptual
understanding of inversion is slow and often requires help of formal schooling. More
specifically, children begin to develop conceptual understanding of inversion around
kindergarten (e.g., Bryant, Christie, & Rendu, 1999). Overall, these findings support
previous research that children have greater conceptual understanding of commutativity
compared to inversion (e.g., Price, 2013).
The most difficult arithmetic concepts for children to understand are associativity
and equivalence. Associativity and equivalence are likely the hardest arithmetic concepts
children learn because, unlike the rest of the arithmetic concepts, they require some
calculations. The current study found that children had greater conceptual understanding
of equivalence compared to associativity. Alternatively, Price (2013) found that Grades
63
5, 6, and 7 children had greater conceptual understanding of associativity compared to
equivalence. This discrepancy is likely due to children’ inconsistent development of
conceptual understanding of associativity (Gilmore & Bryant, 2006). The current study
expands on this by suggesting that the development of children’s conceptual
understanding of equivalence is also inconsistent. These findings support McNeil (2007)
who states that, although mathematics development typically increases with age or
experience, occasionally it declines before further improving. Overall, early cognitive
skills can have long-term impacts on children’s mathematics competency (Carr &
Alexeev, 2011). Therefore, it is important for children to begin learning these six
arithmetic concepts as early as possible for optimal conceptual understanding of
arithmetic.
4.1.2.2 Children’s arithmetic fluency. Arithmetic fluency allows children
to retrieve mathematical facts more quickly and more accurately (Lerner & Friesema,
2013). Studying children’s arithmetic fluency is important for developing and
understanding more advanced mathematical strategies and skill (Carr & Alexeev, 2011).
In particular, arithmetic fluency provides the foundation for development of children’s
conceptual understanding of arithmetic (Allard, 2011). The current study examined
children’s arithmetic fluency for simple addition, subtraction, multiplication, and division
problems.
Recognizing the inverse relationship between additive and multiplicative operations
is not only important for children’s conceptual understanding of arithmetic, it is also
important for children’s arithmetic fluency as it allows children to simplify their
mathematical tasks (Gilmore & Bryant, 2006). The current study found that children had

64
greater arithmetic fluency of addition compared to subtraction and greater arithmetic
fluency of multiplication compared to division. This is consistent with previous research
(e.g., Dixon et al., 2001, Robinson & Dubé, 2009b). Robinson and Dubé (2009b) explain
that multiplication and division are more difficult for children to understand because they
are discovered later and more slowly than addition and subtraction. Subsequently, it was
expected that children would have greater arithmetic fluency of addition and subtraction
problems compared to multiplication and division problems (e.g., Robinson & Dubé,
2009a; 2009b). The current study, however, found that children actually had good
arithmetic fluency on multiplication problems, some arithmetic fluency on addition
problems, and weaker arithmetic fluency on subtraction and division problems. This
suggests that Grades 4, 5, and 6 children struggle the most with subtraction and division.
This may be because children are less experienced with subtraction (e.g., Robinson &
Dubé, 2009a) and division (e.g., Robinson & Dubé, 2009b). The current study elaborates
that children’s low number of subtraction problems attempted and low accuracy on the
number of subtraction problems attempted suggests that children lack understanding of
this operation. Furthermore, children’s high number of division problems attempted and
low accuracy on the number of division problems attempted suggests that children either
also lack understanding of this operation or they are guessing. Nevertheless, these
findings further suggest that Grades 4, 5, and 6 children do not fully understand the
inverse relationship between addition and subtraction and between multiplication and
division. Improving children’s understanding these inverse relationships will not only
improve their arithmetic fluency, it will also improve their conceptual understanding of
arithmetic (Ramos-Christian et al., 2008).

65
4.1.3 Summary. To conclude, children with higher mathematics anxiety had
weaker conceptual understanding of arithmetic and weaker arithmetic fluency compared
to children with lower mathematics anxiety. This relationship was stronger in timed
mathematics task compared to the problem-solving task suggesting that mathematics
anxiety has a greater negative impact when there is a greater time pressure. Mathematics
anxiety, therefore, does not impact all types of mathematics performance equally.
Overall, minimizing time pressure on mathematics tests could help alleviate some of
children’s mathematics anxiety and, consequently, improve their retrieval of
mathematical facts and their understanding for why a mathematical procedure works.
4.2 Exploratory Analysis of Teachers’ Mathematics Anxiety
As part of an exploratory and secondary component, the current study investigated
teachers’ mathematics anxiety and its impact on their students’ mathematics anxiety and
performance on mathematics tests. Although research on teachers’ mathematics anxiety
is limited, it does offer a valuable starting point for the current study. Interpretation of
these results should be done with caution due to the small sample size.
4.2.1 Teachers’ mathematics anxiety and its effect on their students’
mathematics anxiety. Teachers’ level of mathematics anxiety did not influence their
students’ level of mathematics anxiety. This is inconsistent with previous research (e.g.,
Hadley & Dorward, 2011). For instance, Hadley and Dorward (2011) demonstrate this
relationship between Grades 1 and 6 children. Finlayson (2014) explains that teachers
with higher mathematics anxiety report being less confident and less knowledgeable
about mathematics skills compared to teachers with higher mathematics anxiety, which
can impact students’ mathematics anxiety by not instilling confidence or knowledge in

66
their own performance on mathematics tests. This discrepancy could be due to the small
sample size. Alternatively, teachers’ mathematics anxiety may only impact their
students’ mathematics anxiety if they are aware of their teachers’ level of mathematics
anxiety. Finlayson (2014) found that students were aware of their teachers’ level of
mathematics anxiety and, consequently, teachers’ mathematics anxiety had an effect on
their students’ mathematics anxiety. Given that students in this sample were unaware of
their teachers’ level of mathematics anxiety, this could explain why teachers’
mathematics anxiety did not impact their students’ mathematics anxiety. Lastly, children
demonstrated biases in their predictions of their teachers’ level of mathematics anxiety,
associating it to a level of mathematics anxiety similar to their own. For instance,
children with higher mathematics anxiety were more likely to predict that their teacher
also had higher mathematics anxiety whereas children with lower mathematics anxiety
were more likely to predict that their teacher also had lower mathematics anxiety. This
relationship has never been addressed in previous research to my knowledge.
4.2.2 Teachers’ mathematics anxiety and its effect on their students’
performance on mathematics tests. Not only can teachers’ level of mathematics
anxiety impact their students’ level of mathematics anxiety, it can also impact their
students’ performance on mathematics tests (e.g., Dowker et al., 2012). The current
study uniquely examined the effects of teachers’ mathematics anxiety on their students’
conceptual understanding of arithmetic using arithmetic concept problems. For
comparison, it also examined the impact of teachers’ mathematics anxiety on their
students’ arithmetic fluency using timed mathematics tests. Results showed that
teachers’ mathematics anxiety did not impact their students’ conceptual understanding of

67
arithmetic or their arithmetic fluency. This suggests that teachers, despite their level of
mathematics anxiety, are capable of effectively teaching their students retrieval of
mathematical facts as well as why a mathematical procedure works. Interpretation of
these results, however, should be done with caution due to the small sample size.
4.2.3 Grade differences in teachers’ mathematics anxiety. The current study
found that Grade 4 teachers had higher mathematics anxiety compared to Grade 5
teachers. This is consistent with previous research, which shows that teachers in lower
grades have higher mathematics anxiety compared to teachers in higher grades (e.g.,
Finlayson, 2014). Ashcraft and Moore (2009) found that university students with higher
mathematics anxiety are most frequently enrolled in the faculty of education compared to
university students with lower mathematics anxiety because it is the undergraduate
degree with the least amount of mathematics requirements. However, Grade 6 teachers
did not have greater mathematics anxiety compared to Grades 4 and 5 teachers. This
discrepancy could be due to the small sample size. Nevertheless, these findings may
suggest that university students with higher mathematics anxiety are not only enrolling in
the faculty of education, they may also be choosing to teach grades with lower
mathematics expectations compared to university students with lower mathematics
anxiety.
4.2.4 Sex differences in teachers’ mathematics anxiety. Teachers’ mathematics
anxiety is also strongly impacted by sex. Consistent with previous research (e.g., Hadley
& Dorward, 2011), female teachers have higher mathematics anxiety compared to male
teachers. More specifically, the current study found that 25% of female teachers had high
mathematics anxiety whereas no male teachers had high mathematics anxiety. The lack

68
of male teachers with high mathematics anxiety is probably due to the small sample size
and potentially due to males being less willing to admit their mathematics anxiety
compared to females. Research elaborates that sex differences in mathematics anxiety
could also be due to family socialization (e.g., Finlayson, 2014). For instance, Finlayson
(2014) found that a mother’s attitude and encouragement towards mathematics was an
important predictor of children’s mathematics anxiety. Nevertheless, the current study
shows that females continue to report higher mathematics anxiety compared to males
well into adulthood.
4.3 Future Research
The current study encourages several directions for future research. Further
investigation into children’s conceptual understanding of associativity and equivalence
will help clarify their developmental trajectories and why these arithmetic concepts are
the most difficult for children to understand. Children’s mathematics anxiety should be
further examined. LeFevre and colleagues (2009) found that numeracy activities, such as
mathematics games, in preschool promote children’s arithmetic fluency in elementary
school. Given that children with higher performance on mathematics tests have lower
mathematics anxiety compared to children with lower performance on mathematics tests
(e.g., Maloney et al., 2012), early numeracy activities may also help alleviate children’s
mathematics anxiety. Therefore, research could explore the role of early mathematics
experience, rather than grade, on children’s mathematics anxiety. Replicating this study
could also prove to be beneficial. For instance, it could help clarify sex differences in
children’s conceptual understanding of arithmetic. Exploring the relationship between
children’s mathematics anxiety and their conceptual understanding of arithmetic prior to

69
Grade 4 and beyond Grade 6 could also explain how this relationship changes in
elementary school. Lastly, teachers’ mathematics anxiety and its effects on their students
should be further explored with a larger sample size for more meaningful results.
4.4 Limitations
Despite best efforts, there were a few possible limitations to the current study. No
grade differences were found in children’s conceptual understanding of arithmetic,
arithmetic fluency, or mathematics anxiety. This could be due to the portion of the Grade
6 sample (n = 9) that was recruited from an inner city community school whereas the rest
of the participants were recruited from residential public schools. These Grade 6 children
showed a considerable deficit in their mathematics skills compared to the rest of the
participants. Another possible limitation of the current study was assessing children’s
mathematics anxiety in groups of participants. This could be a limitation because a
couple children verbalized their answers during the assessment, which could have altered
other children’s answers on the MASC. The lack of participants (n = 46) included in the
analyses of children’s reaction time on the problem-solving task is also a possible
limitation as participants must have had at least one correct answer for each problem type
(i.e., identity, negation, commutativity, inversion, associativity, and equivalence). Lastly,
an obvious limitation of the current study was the small number of teacher participants in
the exploratory component of the current study.
4.5 Conclusion
In summary, there are two main findings. The current study extends previous
research by showing that children’s mathematics anxiety impacts not only their arithmetic
fluency (e.g., Tsui & Mazzocco, 2006) but also their conceptual understanding of

70
arithmetic. This is important because children’s conceptual understanding of arithmetic
is based on existing mathematical facts and relationships (e.g., Allard, 2011). As a result,
children who struggle to achieve conceptual understanding of arithmetic will likely not
develop understanding of higher, more complex mathematical concepts (e.g., Allard,
2011). Reducing children’s mathematics anxiety could, then, not only improve children’s
retrieval of mathematical facts, it could also improve their conceptual understanding of
why a mathematical procedure works. The current study also uniquely shows that the
relationship between mathematics anxiety and performance on mathematics tests is
stronger in conditions with a greater time pressure compared to conditions with less of a
time pressure. Results also showed that teachers, despite their level of mathematics
anxiety, are capable of effectively teaching their students retrieval of mathematical facts
and why a mathematical procedure works. Overall, the current study emphasizes the
impact of mathematics anxiety on children’s conceptual understanding of arithmetic. It
also highlights the significance of early identification of mathematics anxiety and
encourages further research on children and teachers’ mathematics anxiety as well as
corresponding interventions.

71
5. References
Alexander, L., & Martray, C. (1989). The development of an abbreviated version of the
Mathematics Anxiety Rating Scale. Measurement and Evaluation in Counseling
and Development, 22, 143-150. Retrieved from
https://www.researchgate.net/publication/232590588_The_development_of_an_abb
reviated_version_of_the_Mathematics_Anxiety_Rating_Scale
Alibali, M. W. (1999). How children change their minds: Strategy change can be gradual
or abrupt. Developmental Psychology, 35, 127-145. doi:10.1037/0012-
1649.35.1.127
Allard, E. (2011). Handbook of Latinos and Education: Theory, Research, and Practice.
doi:10.1111/j.1548-1492.2011.01133.x
Ashcraft, M. H. (2002). Math anxiety: Personal, educational, and cognitive consequences.
Current Directions in Psychology Science, 11, 181-185. doi:10.1111/1467-
8721.00196
Ashcraft, M. H., & Kirk, E. P. (2001). The relationship among working memory, math
anxiety, and performance. Journal of Experimental Psychology, 130, 224-237.
doi:10.1037/0096-3445.130.2.224
Ashcraft, M. H., Krause, J. A., & Hopko, D. R. (2007). Is math anxiety a mathematical
learning disability? In D. B. Berch & M. M. M. Mazzocco (Eds.), Why is math so
hard for some children? The nature and origins of mathematical learning
difficulties and disabilities (pp. 329-348). Baltimore, MD: Paul H. Brookes.

72
Ashcraft, M. H., & Moore, A. M. (2009). Mathematics anxiety and the affective drop in
performance. Journal of Psychoeducational Assessment, 27, 197-205.
doi:10.1177/0734282908330580
Baroody, A. J., & Dowker, A. (2009). The development of arithmetic concepts and skills:
Constructing adaptive expertise. Mahwah, NJ: Lawrence Erlbaum Associates, Inc.
Baroody, A. J., & Lai, M.-L. (2007). Preschoolers’ understanding of the addition-
subtraction inverse principle: A Taiwanese sample. Mathematics Thinking and
Learning, 9, 131-171. doi:10.1080/10986060709336813
Baroody, A. J., Lai, M.-L., Li, X., & Baroody, A. E. (2009). Preschoolers’ understanding
of subtraction-related principles. Mathematical Thinking and Learning, 11, 41-60.
doi:10.1080/10986060802583956
Baroody, A. J., Torbeyns, J., & Verschaffel, L. (2009). Young children’s understanding
and application of subtraction-related principles. Mathematical Thinking and
Learning, 11, 2-9. doi:10.1080/10986060802583873
Beck, L. V., Ghesquière, P., Lagae, L., & Smedt, B. D. (2014). Left fronto-parietal white
matter correlates with individual differences in children’s ability to solve additions
and multiplications: A tractography study. NeuroImage, 90, 117-127.
doi:10.1016/j.neuroimage.2013.12.030
Beesdo, K., Knappe, S., & Pine, D. S. (2009). Anxiety and anxiety disorders in children
and adolescents: Developmental issues and implications for DSM-V. Psychiatric
Clinics of North America, 32, 483-524. doi:10.1016/j.psc.2009.06.002
Beilock, S. L. (2008). Math performance in stressful situations. Current Directions in
Psychological Science, 17, 339-343. doi:10.1111/j.1467-8721.2008.00602.x

73
Beilock, S. L., Gunderson, E. A., Ramirez, G., & Levine, S. C. (2009). Female teachers’
math anxiety affects girls’ math achievement. Proceedings of the National
Academy of Sciences, 107, 1860-1863. doi:10.1073/pnas.0910967107
Beilock, S. L., & Willingham, D. T. (2014). Math anxiety: Can teachers help students
reduce it? American Educator, 38, 28-32. Retrieved from
http://hpl.uchicago.edu/sites/hpl.uchicago.edu/files/uploads/American%20Educator
,%202014.pdf
Bryant, P., Christie, C., & Rendu, A. (1999). Children’s understanding of the relation
between addition and subtraction: Inversion, identity, and decomposition. Journal
of Experimental Child Psychology, 74, 194-212.
doi:10.1016/j.cognition.2007.12.007
Caddle, M. C., & Brizuela, B. M. (2011). Fifth graders’ addition and multiplication
reasoning: Establishing connections across conceptual fields using a graph. The
Journal of Mathematical Behavior, 30, 224-234. doi:10.1016/j.jmathb.2011.04.002
Calhoon, M. B., Robert, W. E., Flores, M., & Houchins, D. E. (2007). Computational
fluency performance profile of high school students with mathematics disabilities.
Remedial and Special Education, 28, 292-303. doi:10.1177/0741932507028005041
Canobi, K. H. (2004). Individual differences in children’s addition and subtraction
knowledge. Cognitive Knowledge, 19, 81-93. doi:10.1016/j.cogdev.2003.10.001
Canobi, K. H., & Bethune, N. E. (2008). Number words in young children’s conceptual
and procedural knowledge of addition, subtraction and inversion. Cognition, 108,
675-682. doi:10.1016/j.cognition.2008.05.011
74
Canobi, K. H., Reeve, R. A., & Pattison, P. E. (2002). Young children’s understanding of
addition concepts. Educational Psychology, 22, 513-532.
doi:10.1080/0144341022000023608
Carr, M., & Alexeev, N. (2011). Fluency, accuracy, and gender predict developmental
trajectories of arithmetic strategies. Journal of Educational Psychology, 103, 617–
631. doi:10.1037/a0023864
Carr, M., & Davis, H. (2001). Gender differences in arithmetic strategy use: A function
of skill and preference. Contemporary Educational Psychology, 6, 330-347.
doi:10.1006/ceps.2000.1059
Carr, M., & Jessup, D. L. (1997). Gender differences in first-grade mathematics strategy
use: Social and metacognitive influences. Journal of Educational Psychology, 89,
318-328. doi:10.1037/0022-0663.89.2.318
Carr, M., Steiner, H. H., Kyser, B., & Biddlecomb, B. (2008). A comparison of predictors
of early emerging gender differences in mathematics competency. Learning and
Individual Differences, 18, 61-75. doi:10.1016/j.lindif.2007.04.005
Cates, G. L., & Rhymer, K. N. (2003). Examining the relationship between mathematics
anxiety and mathematics performance: An instructional hierarchy perspective.
Journal of Behavioral Education, 12, 23-34. doi:10.1023/A:1022318321416
Chernoff, E. J., & Stone, M. (2012). An examination of math anxiety research. Journal of
Educational Psychology, 52, 29-31. Retrieved from
http://search.proquest.com/docview/1563633518?accountid=13480
Chiu, L.-H., & Henry, L. L. (1990). Development and validation of the mathematics
anxiety scale for children. Measurement and Evaluation in Counseling and

75
Development, 23, 121. Retrieved from
https://www.academia.edu/11783024/The_development_and_validation_of_the_Ch
ildrens_Anxiety_in_Math_Scale
Devine, A., Fawcett, K., Szûcs, D., & Dowker, A. (2012). Gender differences in
mathematics anxiety and the relation to mathematics performance while controlling
for test anxiety. Behavioral and Brain Functions, 8, 33-41. doi:10.1186/1744-9081-
8-33
Dixon, J. A., Deets, J. K., & Bangert, A. (2001). The representations of the arithmetic
operations include functional relationships. Memory & Cognition, 29, 462-477.
doi:10.3758/BF03196397
Dowker, A., Bennett, K., & Smith, L. (2012). Attitudes to mathematics in primary school
children. Child Development Research, 2012, 1-8. doi:10.1155/2012/124939
Dubé, A. K. (2014). Adolescents’ understanding of inversion and associativity. Learning
and Individual Differences, 36, 49-59. doi:10.1016/j.lindif.2014.09.002
Dubé, A. K., & Robinson, K. M. (2010). The relationship between adults’ conceptual
understanding of inversion and associativity. Canadian Journal of Experimental
Psychology, 64, 60-66. doi:10.1037/a0017756
Finlayson, M. (2014). Addressing math anxiety in the classroom. Improving Schools, 17,
99-115. doi:10.1177/1365480214521457
Furner, J. M., & Berman, B. T. (2003). Math anxiety: Overcoming a major obstacle to the
improvement of student math performance. Childhood Education, 79, 170-174.
doi:10.1080/00094056.2003.10522220
76
Geary, D. C., Saults, S. J., Lui, F., & Hoord, M. K. (2000). Sex differences in spatial
cognition, computational fluency, and arithmetic reasoning. Journal of
Experimental Child Psychology, 77, 337-353. doi:10.1006/jecp.2000.2594
Geist, E. (2010). The anti-anxiety curriculum: Combating math anxiety in the classroom.
Journal of Instructional Psychology, 37, 24-31. Retrieved from
http://wendyharp73.wiki.westga.edu/file/view/MATH+anxiety+article.pdf
Geist, E. (2015). Math anxiety and the “mind gap”: How attitudes towards mathematics
disadvantages students as early as preschool. Education, 135, 328-336. Retrieved
from
http://go.galegroup.com.libproxy.uregina.ca:2048/ps/i.do?id=Gale%7CA40616256
5&v=2.1&v=uregina.lib&it=r&p=ITOF&sw=w&asid=39cb36c96d82ef4b66a0c38
63f1fb0fd
Gelman, S. A. (2009). Learning from others: Children’s construction of concepts. Annual
Review of Psychology, 60, 115-140. doi:10.1146/annurev.psych.59.103006.093659
Gierl, M. J., & Bisanz, J. (1995). Anxieties and attitudes related to mathematics in grade
3 and 6. Journal of Experimental Education, 63, 139-158.
doi:10.1080/00220973.1995.9943818
Gilmore, C. K., & Bryant, P. (2006). Individual differences in children’s understanding of
inversion and arithmetic skill. The British Psychological Society, 76, 309-331.
doi:10.1348/000709905X39125
Gresham, G. (2007). A study of mathematics anxiety in pre-service teachers. Early
Childhood Education Journal, 35, 181-188. doi:10.1007/s10643-007-0174-7

77
Hadley, K. M., & Dowker, J. (2011). Investigating the relationship between elementary
teacher mathematics anxiety, mathematics instructional practices, and student
mathematics achievement. Journal of Curriculum and Instruction, 5, 27-44.
doi:10.3776/joci.2011.v5n2p27-44
Harari, R. R., Vukovic, R. K., & Bailey, S. P. (2013). Mathematics anxiety in young
children: An exploratory study. The Journal of Experimental Education, 81, 538-
555. doi:10.1080/00220973.2012.727888
Hembree, R. (1990). The nature, effects, and relief of mathematics anxiety. Journal for
Research in Mathematics Education, 21, 33-46. Retrieved from
http://www.jstor.org.libproxy.uregina.ca:2048/stable/749455?pq-
origsite=summon&seq=1#page_scan_tab_contents
Hyde, J. S., Fennema, E., & Lamon, S. J. (1990). Gender differences in mathematics
performance: A meta-analysis. Psychological Bulletin, 107(2), 139-155.
doi:10.1037/0033-2909.107.2.139
Jackson, C. D., & Leffingwell, R. J. (1999). The role of instructors in creating math
anxiety in students from kindergarten through college. The Mathematics Teacher,
92, 583-586. Retrieved from
http://www.jstor.org.libproxy.uregina.ca:2048/stable/27971118?pq-
origsite=summon&seq=1#page_scan_tab_contents
Jameson, M. M. (2014). Contextual factors related to math anxiety in second-grade
children. The Journal of Experimental Education, 82, 518-536.
doi:10.1080.00220973.2013.813367
78
Kamii, C., Lewis, B. A., & Kirkland, L. D. (2001). Fluency in subtraction compared to
addition. The Journal of Mathematics Behavior, 20, 33-42. doi:10.1016/S0732-
3123(01)00060-8
Knuth, E. J., Alibali, M. W., McNeil, N. M., Weinberg, A., & Stephens, A. C. (2005).
Middle school students’ understanding of core algebraic concepts: Equivalence and
variable. Zentralblatt für Didaktik der Mathematik, 37, 68-76.
doi:10.1007/BF02655899
LeFevre, J., & Robinson, K. M. (2010). Use of conceptual knowledge among adults:
Experimental evidence. Unpublished manuscript.
LeFevre, J., Skwarchuk, S., Smith-Chant, B. L., Fast, L., & Kamawar, D. (2009). Home
numeracy experiences and children’s math performance in early school years.
Journal of Behavioural Sciences, 41, 55-66. doi:10.1037/a0014532
Lerner, J., & Friesema, A. (2013). Do timed tests hurt deep math learning? American
Teacher, 97, 3. Retrieved from http://sks.sirs.pnw.orc.scoolaid.net
Ma, X. (1999). A meta-analysis of the relationship between anxiety toward mathematics
and achievement in mathematics. Journal for Research in Mathematics Education,
30, 520-540. doi:10.2307/749772
Maloney, E. A., Waechter, S., Risko, E. F., & Fugelsang, J. A. (2012). Reducing the sex
differences in math anxiety: The role of spatial processing ability. Learning and
Individual Differences, 22, 380-384. doi:10.1016/j.lindif.2012.01.001
McNeil, N. M. (2007). U-shaped development in math: 7-year-olds outperform 9-year-
olds on equivalence problems. Developmental Psychology, 43, 687-695.
doi:10.1037/0012-1649.43.3.687

79
Newstead, K. (1998). Aspects of children’s mathematics anxiety. Educational Studies in
Mathematics, 36, 53-71. doi:10.1023/A:1003177809664
Nunes, T., Bryant, P., Hallett, D., Bell, D., & Evans, D. (2009). Teaching about the
inverse relation between addition and subtraction. Mathematical Thinking and
Learning, 11, 61-78. doi:10.1080/10986060802583980
Patel, P., & Canobi, K. H. (2010). The role of number words in preschoolers’ addition
concepts and problem-solving procedures. Educational Psychology, 30, 107-124.
doi:10.1080/01443410903473597
Prather, R. W., & Alibali, M. W. (2009). The development of arithmetic principle
knowledge: How do we know what learners know? Developmental Review, 29,
221-248. doi:10.1016/j.dr.2009.09.001
Preston, R. (2008). Mathematics anxiety: Research and implications for middle school
students and teachers. Conference Proceedings of the Masters in Teaching Program
2006-2008, Olympia, Washington.
Price, J. A. B. (2013). Children’s understanding of arithmetic concepts (Honour’s thesis).
University of Regina, Regina.
Ramirez, G., Gunderson, E. A., Levine, S. C., & Beilock, S. L. (2013). Math anxiety,
working memory, and math achievement in early elementary school. Journal of
Cognition and Development, 14, 187-202. doi:10.1080/1532-7647
Ramos-Christian, V., Schleser, R., & Varn, M. E. (2008). Math fluency: Accuracy versus
speed in preoperational and concrete operational first and second grade children.
Early Childhood Education Journal, 35, 543-549. doi:10.1007/s10643-008-0234-7

80
Richardson, F. C., & Suinn, R. M. (1972). The Mathematics Anxiety Rating Scale:
Psychometric data. Journal of Counseling Psychology, 19, 551-554.
doi:10.1037/h0033456
Rittle-Johnson, B., Matthews, P. G., Taylor, R. S., & McEldon, K. L. (2011). Assessing
knowledge of mathematical equivalence: A construct-model approach. Journal of
Educational Psychology, 103, 85-104. doi:10.1037/a0021334
Robinson, K. M., Arbuthnott, K. D., Rose, D., McCarron, M. C. Globa, C. A., &
Phonexay, S. D. (2006). Stability and change in children’s division strategies.
Journal of Experimental Child Psychology, 93, 224-238.
doi:10.1016/j.jecp.2005.09.002
Robinson, K. M., & Dubé, A. K. (2009a). Children’s understanding of addition and
subtraction concepts. Journal of Experimental Child Psychology, 103, 532-545.
doi:10.1016/j.jecp.2008.12.002
Robinson, K. M., & Dubé, A. K. (2009b). Children’s understanding of the inverse
relation between multiplication and division. Cognitive Development, 24, 310-321.
doi:10.1016/j.cogdev.2008.11.001
Robinson, K. M., & Dubé, A. K. (2009c). A microgenetic study of the multiplication and
division inversion concept. Canadian Journal of Experimental Psychology, 63,
193-200. doi:10.1037/a0013908
Robinson, K. M., & Dubé, A. K. (2012). Children’s addition concepts: Promoting
understanding and the role of inhibition. Learning and Individual Differences, 23,
101-107. doi:10.1016/j.lindif.2012.07.016

81
Robinson, K. M., & LeFevre, J. (2012). The inverse relation between multiplication and
division: Concepts, procedures, and a cognitive framework. Educational Studies in
Mathematics, 79, 409-428. doi:10.1007/s10649-011-9330-5
Robinson, K. M., & Ninowski, J. E. (2003). Adults’ understanding of inversion concepts:
How does performance on addition and subtraction inversion problems compare to
performance on multiplication and division inversion problems? Canadian Journal
of Experimental Psychology, 57, 321-330. doi:10.1037/h0087435
Robinson, K. M., Ninowski, J. E., & Gray, M. L. (2006). Children’s understanding of the
arithmetic concepts of inversion and associativity. Journal of Experimental Child
Psychology, 94, 349-362. doi:10.1016/j.jecp.2006.03.004
Royer, J. M., Tronsky, L. N., Chan, Y., Jackson, S. J., and Marchant III H. (1999). Math-
fact retrieval as the cognitive mechanism underlying gender differences in math test
performance. Contemporary Educational Psychology, 24, 181-266.
doi:10.1006/ceps.1999.1004
Scarpello, G. (2007). Helping students get past math anxiety. Techniques, 82, 34-35.
Retrieved from http://files.eric.ed.gov/fulltext/EJ775465.pdf
Sears, A. Y. (2008). An examination of the additive concepts of inversion and
associativity in children (Honour’s thesis). University of Regina, Regina.
Siegler, R. S., & Stern, E. (1998). Conscious and unconscious strategy discoveries: A
microgenetic analysis. Journal of Experimental Psychology, 127, 377-397.
doi:10.1037/0096-3445.127.4.377
82
Smith, S. Z., & Smith, M. E. (2006). Assessing elementary understanding of
multiplication concepts. School Science and Mathematics, 106, 140-149.
doi:10.1111/j.1949-8594.2006.tb18171.x
Squire, S., Davies, C., & Bryant, P. (2004). Does the cue help? Children’s understanding
of multiplication concepts in different problem contexts. British Journal of
Educational Psychology, 74, 515-532. doi:10.1348/0007099042376364
Suinn, R. M., Taylor, S., & Edwards, R. W. (1988). Suinn mathematics anxiety rating
scale for elementary school students (MARS-E): Psychometric and normative data.
Educational and Psychological Measurement, 48, 979-986.
doi:10.1177/0013164488484013
Tsui, J. M., & Mazzocco, M. M. M. (2006). Effects of math anxiety and perfectionism on
timed versus untimed math testing in mathematically gifted sixth graders. Roeper
Review, 29, 132-139. doi:10.1080/02783190709554397
Vilette, B. (2002). Do children grasp the inverse relationship between addition and
subtraction? Evidence against early arithmetic. Cognitive Development, 17, 1365-
1383. doi:10.1016/S0885-2014(02)00125-9
Voutsina, C. (2012). Procedural and conceptual changes in young children’s problem
solving. Educational Studies in Mathematics, 79, 193-214. doi:10.1007/s/10649-
011-9334-1
Walen, S. B., & Williams, S. R. (2002). A matter of time: Emotional responses to timed
mathematics tests. Educational Studies in Mathematics, 49, 361-378.
doi:10.1023/A:1020258815748

83
Wang, Z., Hart, S. A., Kovas, Y., Lukowski, S., Soden, B., Thompson, L. A., Plomin, R.,
McLoughlin, G., Bartlette, C. W., Lyons, I. M., & Petrill, S. A. (2014). Who is
afraid of math? Two sources of genetic variance for mathematical anxiety. Journal
of child Psychology and Psychiatry, 55, 1056-1064. doi:10.1111/jcpp.12224
Wigfield, A., & Meece, J. L. (1988). Math anxiety in elementary and secondary school
students. Journal of Educational Psychology, 80, 210-216. Retrieved from
http://www.rcgd.isr.umich.edu/garp/articles/wigfield88.pdf
Wilkins, J. L., Baroody, A. J., & Tiilikainen, S. (2001). Kindergarteners’ understanding
of additive commutativity within the context of word problems. Journal of
Experimental Child Psychology, 79, 23-36. doi:10.1006/jecp.2000.2580
Wolfgang, C. H., Stannard, L. L., & Jones, I. (2001). Block play performance among
preschoolers as a predictor of later school achievement in mathematics. Journal of
Research in Childhood Education, 15, 173-180. doi:10.1080/02568540109594958
Wood, E. F. (1988). Math anxiety and elementary teachers: What does research tell us?
For Learning of Mathematics, 8, 8-13. Retrieved from
http://www.jstor.org.libproxy.uregina.ca:2048/stable/pdf/40248135.pdf?acceptTC=
true
Wu, S. S., Barth, M., Amin, H., Mclarne, V., & Menon, V. (2012). Math anxiety in
second and third graders and its relation to mathematics achievement. Frontiers in
Psychology, 3, 1-11. doi:10.3389/fpsyg.2012.00162
Zakaria, E., & Nordin, N. M. (2008). The effects of mathematics anxiety on matriculation
students as related to motivation and achievement. Eurasia Journal of

84
Mathematics, 4, 27-30. Retrieved from
http://www.ejmste.com/v4n1/eurasia_v4n1_zakaria_nordin.pdf
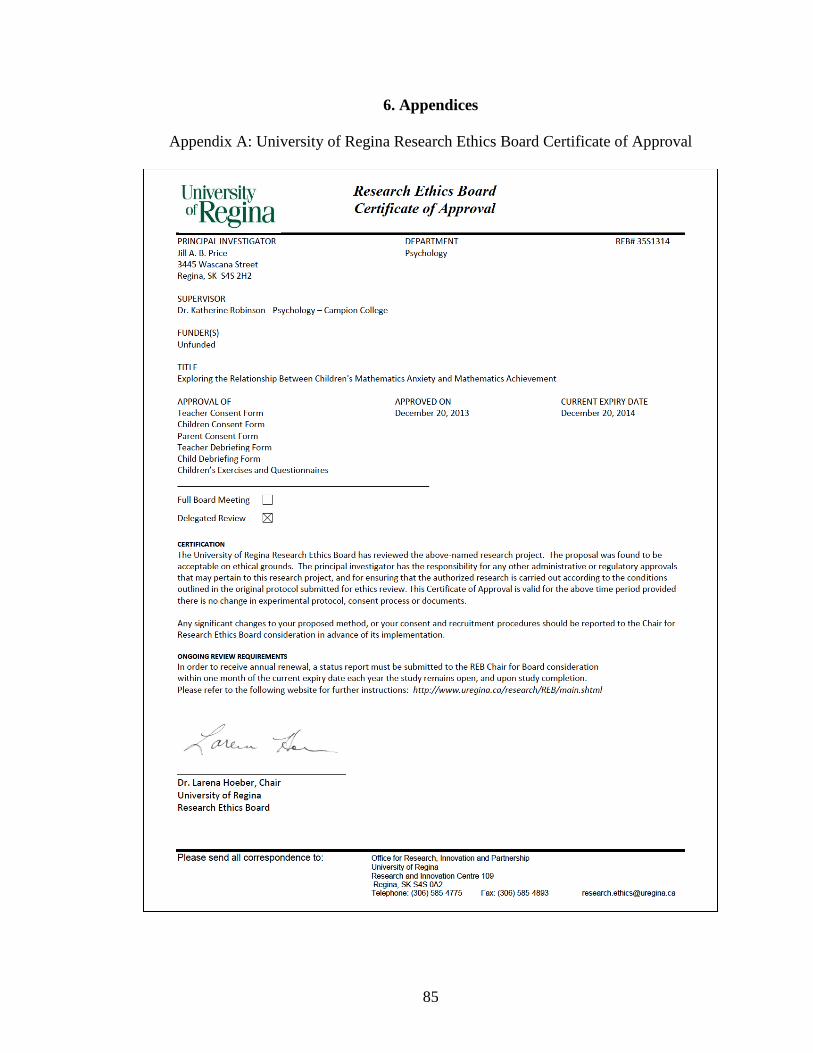
85
6. Appendices
Appendix A: University of Regina Research Ethics Board Certificate of Approval

86
Appendix B: Additive Arithmetic Concept Problems

87
Appendix B: Additive Arithmetic Concept Problems (Continued)

88
Appendix C: Multiplicative Arithmetic Concept Problems
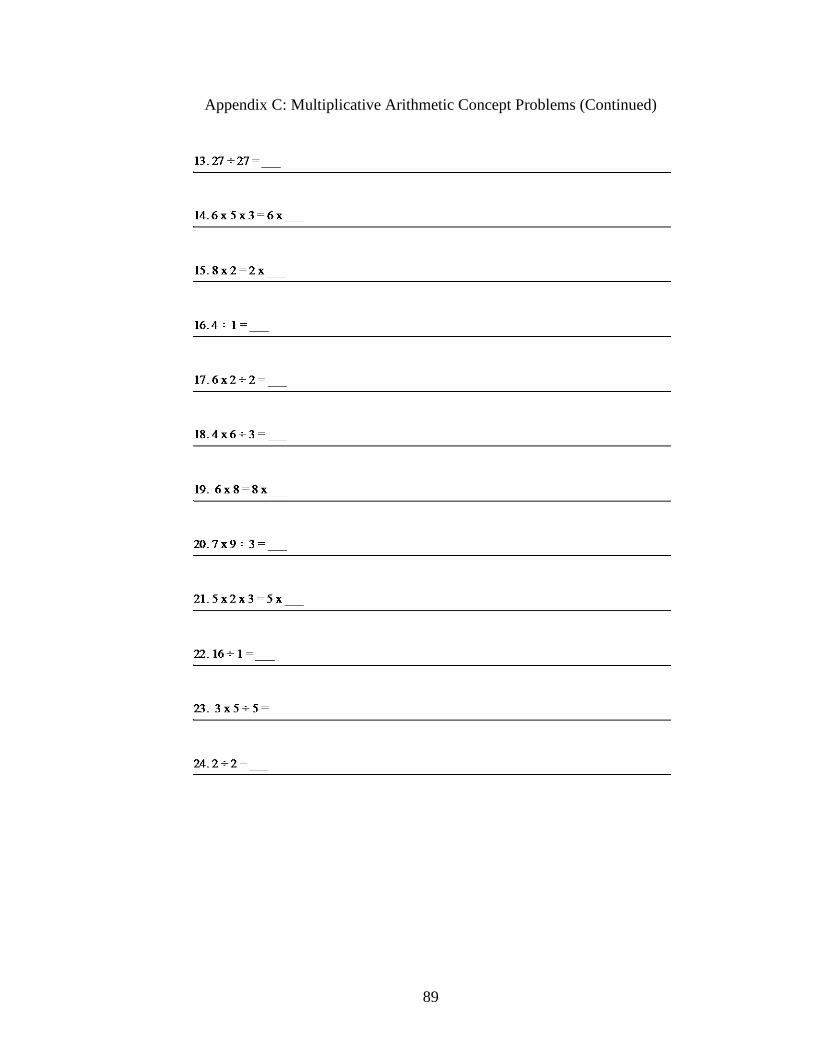
89
Appendix C: Multiplicative Arithmetic Concept Problems (Continued)

90
Appendix D: Addition Timed Mathematics Test

91
Appendix E: Subtraction Timed Mathematics Test

92
Appendix F: Multiplication Timed Mathematics Test
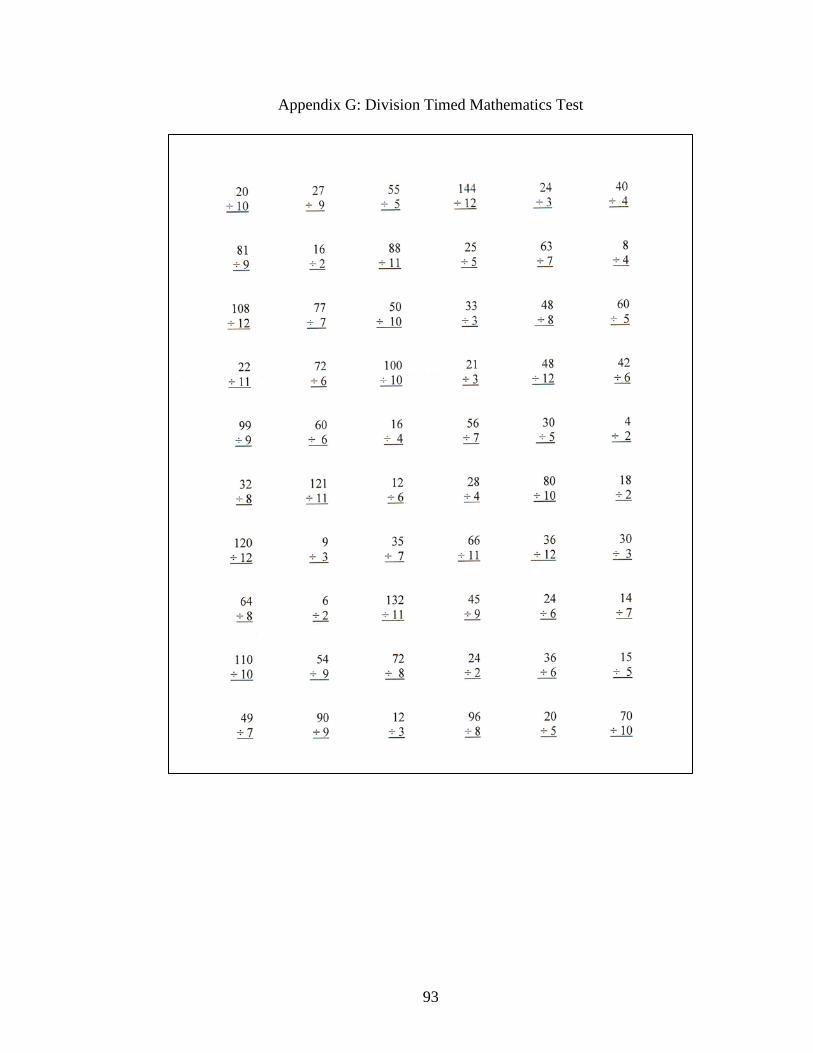
93
Appendix G: Division Timed Mathematics Test

94
Appendix H: Mathematics Anxiety Scale for Children (MASC) Questionnaire

95
Appendix I: Abbreviated Mathematics Anxiety Rating Scale (A-MARS) Questionnaire
Related Documents