Children and ‘Smart’ Technologies: Can Children’s Experiences be Interpreted and Coded? Diana Yifan Xu, Janet C Read Child Computer Interaction Group University of Central Lancashire Preston, PR1 2HE +44 (0)1772 895301{} yfxu{jcread}@uclan.ac.uk Gavin Sim, Barbara McManus School of CEPS University of Central Lancashire Preston, PR1 2HE +44 (0)1772 895162{3288} grsim{bmcmanus}@uclan.ac.uk Pam Qualter School of Psychology University of Central Lancashire Preston, PR1 2HE +44 (0)1772 893877 [email protected] ABSTRACT This paper has a focus on young children and their emerging new technologies. It examines children’s drawings as an evaluation tool for capturing their experiences of different novel interfaces. A recent evaluation study with children and two follow-up expert coding sessions were used to demonstrate how drawings could be used and coded and how the intercoder reliability could be improved. Usability and User Experience (UX) factors: Fun (F), Goal Fit (GF) and Tangible Magic (TM) were included in the coding scheme and they were the factors that have been looked at in the coding sessions. Our studies show the thoroughness and ease-of-use of the drawing method. The method was effective and reliable in conveying the user experience form the drawings. It also shows some of the limitation of the method: e.g. resource intensive and open to evaluator’s interpretation. From the result of the study, a number of the drawings conveyed information pertaining to user experiences: F, GF and TM, and the method was particularly reliable at capturing fun. The result also led to the correlation found on the GF and TM. Categories and Subject Descriptors D.5.2 [User Interfaces]: Evaluation / Methodology General Terms Human Factors Keywords Children, evaluation, user experience, drawing, fun, tangible magic, tangible technology, TUI. 1. INTRODUCTION Nowadays, children’s technologies are pervasive in their everyday life and increasingly built into their physical environment. Some recent researches have attempted to address children’s experience with the current technologies, in particular tangible technology (TUI) [1-5]. Our current approaches to evaluation deal with novel concepts of HCI, such as the third-wave/paradigm and experience- focused (rather than task focused) HCI. These require different ways of knowing and producing different kinds of knowledge. Because some of the interfaces are exploration/interpretation- oriented rather than the traditional task-orientated, they cannot be evaluated by looking under the traditional usability lamppost [6-8]. The evaluation study that is described here was intended to validate the use of drawings for the evaluation of user experience with children. Having already designed the method and tried it in a small study [9], the present study intended to test out the method with new situations and find out if the knowledge embodied in children’s drawings can be coded easily and reliably. As we were interested in the robustness of this new method and the feasibility of applying this method to different contexts we included a variety of interfaces and used coders with different backgrounds and expertise. The studies would inform us of the potential value of incorporating children’s drawings as a method of data generation for future studies. 2. CAPTURING EXPERIENCE User experience (UX) or the “new usability” is an emerging popular research area. It is often subjective as the experience of a user is highly situated and dynamic in nature; and is highly dependent on the pragmatic and hedonic factors leading to it. Capturing user’s experience can involve capturing physical, sensual, emotional, social and aesthetic experiences [10-14] Existing work of capturing and evaluating children experiences includes the measuring: of children’s fun [15], of the likeability [1], enjoyment [2] and sampling of general everyday life experience [16]. 2.1 Fun and Goal Fit Fun and goal fit are commonly discussed usability and UX factors. Research into the area of Fun has been revolving around games and entertainment focused interfaces in the past [4, 17], but is now a more wide topic these days [18]. Goal Fit is about knowing what you have to do with the interface/technology to achieve desired user goal and it is related to matching the technologies to the goal. Things related to Goal Fit can be the amount of user control on technology and the competition(s) for achieving the goal. © The Author 2009. Published by the British Computer Society 224 HCI 2009 – People and Computers XXIII – Celebrating people and technology

Welcome message from author
This document is posted to help you gain knowledge. Please leave a comment to let me know what you think about it! Share it to your friends and learn new things together.
Transcript

Children and ‘Smart’ Technologies: Can Children’s Experiences be Interpreted and Coded?
Diana Yifan Xu, Janet C Read Child Computer Interaction Group University of Central Lancashire
Preston, PR1 2HE +44 (0)1772 895301{}
yfxu{jcread}@uclan.ac.uk
Gavin Sim, Barbara McManus School of CEPS
University of Central Lancashire Preston, PR1 2HE
+44 (0)1772 895162{3288}
grsim{bmcmanus}@uclan.ac.uk
Pam Qualter School of Psychology
University of Central Lancashire Preston, PR1 2HE
+44 (0)1772 893877
ABSTRACT This paper has a focus on young children and their emerging new technologies. It examines children’s drawings as an evaluation tool for capturing their experiences of different novel interfaces.
A recent evaluation study with children and two follow-up expert coding sessions were used to demonstrate how drawings could be used and coded and how the intercoder reliability could be improved. Usability and User Experience (UX) factors: Fun (F), Goal Fit (GF) and Tangible Magic (TM) were included in the coding scheme and they were the factors that have been looked at in the coding sessions.
Our studies show the thoroughness and ease-of-use of the drawing method. The method was effective and reliable in conveying the user experience form the drawings. It also shows some of the limitation of the method: e.g. resource intensive and open to evaluator’s interpretation.
From the result of the study, a number of the drawings conveyed information pertaining to user experiences: F, GF and TM, and the method was particularly reliable at capturing fun. The result also led to the correlation found on the GF and TM.
Categories and Subject Descriptors D.5.2 [User Interfaces]: Evaluation / Methodology
General Terms Human Factors
Keywords Children, evaluation, user experience, drawing, fun, tangible magic, tangible technology, TUI.
1. INTRODUCTION Nowadays, children’s technologies are pervasive in their everyday life and increasingly built into their physical environment. Some recent researches have attempted to
address children’s experience with the current technologies, in particular tangible technology (TUI) [1-5].
Our current approaches to evaluation deal with novel concepts of HCI, such as the third-wave/paradigm and experience-focused (rather than task focused) HCI. These require different ways of knowing and producing different kinds of knowledge. Because some of the interfaces are exploration/interpretation-oriented rather than the traditional task-orientated, they cannot be evaluated by looking under the traditional usability lamppost [6-8].
The evaluation study that is described here was intended to validate the use of drawings for the evaluation of user experience with children. Having already designed the method and tried it in a small study [9], the present study intended to test out the method with new situations and find out if the knowledge embodied in children’s drawings can be coded easily and reliably.
As we were interested in the robustness of this new method and the feasibility of applying this method to different contexts we included a variety of interfaces and used coders with different backgrounds and expertise. The studies would inform us of the potential value of incorporating children’s drawings as a method of data generation for future studies.
2. CAPTURING EXPERIENCE User experience (UX) or the “new usability” is an emerging popular research area. It is often subjective as the experience of a user is highly situated and dynamic in nature; and is highly dependent on the pragmatic and hedonic factors leading to it. Capturing user’s experience can involve capturing physical, sensual, emotional, social and aesthetic experiences [10-14]
Existing work of capturing and evaluating children experiences includes the measuring: of children’s fun [15], of the likeability [1], enjoyment [2] and sampling of general everyday life experience [16].
2.1 Fun and Goal Fit Fun and goal fit are commonly discussed usability and UX factors. Research into the area of Fun has been revolving around games and entertainment focused interfaces in the past [4, 17], but is now a more wide topic these days [18]. Goal Fit is about knowing what you have to do with the interface/technology to achieve desired user goal and it is related to matching the technologies to the goal. Things related to Goal Fit can be the amount of user control on technology and the competition(s) for achieving the goal.
© The Author 2009. Published by the British Computer Society
224HCI 2009 – People and Computers XXIII – Celebrating people and technology

2.2 Tangible Magic In this paper tangible technology is an umbrella term for all Tangible User Interfaces (TUIs) and other related alternative computing environment. These interfaces and environments go beyond the traditional keyboard and mouse interface, are increasingly embedded into physical artefacts and are merged into children’s physical environments. They include, namely: physical interface, gesture interface, sensor interface, ambient media and etc.
The notion of tangible magic is new and was first introduced in ‘In search of tangible magic’ [9]. It is particularly concerned about how the tangibility of the interface affects the interaction and user experience. The advantages of tangible interfaces are centred on the extra sensations associated with physical objects; we bring our existing knowledge and emotional responses from the world we live in to the interface in a more direct way than to non-tangible interfaces. There is something special about a well designed tangible interface that is difficult to theorise and hard to imagine. This ‘specialness’ is referred to in our work as ‘tangible magic’ [9].
We consider there to be two components to this tangible magic. The first is simply the novelty of seeing objects that would normally be regarded as inanimate, doing unexpected things, such as controlling the behaviour of a program or responding intelligently. The second is the almost indefinable pleasure we receive in handling physical objects. The interaction of these two components comes together to produce the ‘magic’ [9]. In the later coding scheme these two components are referred to as the smartness of the interface and the feel of the interface.
2.3 Capturing Experiences with Drawings Personal drawings and experiences have the similar natures of being ‘subjective, highly situated and dynamic’. The use of drawings with children has been studied for several years in different disciplines; initially children’s drawings found great favour with psychologists who used them to interpret what children thought [19], more recently, drawings have been used to gather children’s views of computer programmers [20], of school curricula and of computer technology [21]. The drawing approach has been successfully applied in the field of pedagogy research to learn about student’s experiences of sport education [22]. Earlier studies comparing different evaluation methods of Tangible User Interfaces and capturing tangible magic, included the use of drawings [7] [9].
Among all the studies, drawings are generally interpreted in one or two ways. They can be used to discover children’s values and worth, typically by considering the size or position of objects in a drawing or by looking at the frequency of objects, or they can be used to find out what children know. In this context, the drawing is scrutinized for ‘things’ that convey understanding of a situation [9].
As a child-centred evaluation tool drawings can be advantageous as they are:
Fun and attractive universal activities.
Quick and efficient ways to elicit a large amount of accurate information as no training or practice is required. [22]
Easily produced by children who either may not be able to write proficiently (if at all) or may feel unsure of expressing themselves verbally to a researcher.
Drawing may also capture some of the experience of the user in a way which may not be so easily expressed in words.
3. STUDY WITH CHILDREN The study was carried out with a class of 27 pupils: 9 girls and 18 boys, aged 8-9. They came to the study voluntarily with consent obtained from their parents prior to the study taking place.
At our request, their teacher put the children into friendship pairs (12 pairs) and a trio, in which ideally they get on well. It happened to be that all the pairs were single-sex and the trio consisted of two boys and one girl.
3.1 Experimental Setup The study took place over the course of one day at a local primary school. On our arrival, a common play area (Fig. 1) was allocated for us for the day.
Figure 1: Test environment.
We carefully set our four interfaces/activities in the play area as shown in Figure 1. Arrows in the figure point out the interfaces: A, B, C and D.
Figure 2: Interfaces A (left) and B (right).
Interface A (Fig. 2) was a Nintendo Wii® console with Wii remote tennis racket controls. The interface provides gestural and full body interaction and it is a highly popular commercial product. A tennis game was used as the activity in the study.
B (Fig. 2) is called Bon appetite box game. It is a research prototype made with a RFID reader, sixteen RFID tagged wooden blocks and a tablet display [23]. The interaction is 3-D spatially based with location sensing. The game is competitive and the child has to beat the computer timer to find several food items by passing blocks over the RFID reader.
Figure 3: Interfaces C (left) and D (right).
A
B
C
D
225
D. Xu et al.
HCI 2009 – People and Computers XXIII – Celebrating people and technology

C (Soundz) was also a commercial product, but less commonly seen. It has an interaction that is based on a 2-D plane deck and several tangible manipulatives (Fig. 3). It plays like a music DJ deck and, by placing and replacing the tangible pieces on the three hot-spots on the deck, children can create different variations of music and colourful flashing lights.
To provide the contrast, interface D (Fig. 3) was a traditional Graphical User Interface (GUI) game which required children to make train tracks faster than the train moved so the train could get from one side to the other. It ran on a laptop PC with a mouse, and was downloaded from an online resource.
3.2 Procedure To prepare the children for the study, all three researchers involved in that day greeted the children in their classroom. One of the researchers explained to the children: “We would like you to try out four technologies and to do some drawings for us; this will take 20 minutes for each technology. You will have a chance to try all four things. You can stop at any point to use the bathroom, to take a break when you need.”
The children came to the play area in groups: two groups of eight (4 pairs) and one group of eleven (4 pairs and a trio). They played each interface in pre-arranged pairs and trios (Fig. 2 and 3). The last group of children had an unexpected larger number, so an additional backup activity was introduced to keep all of the eleven children occupied at the same time. While the children collaborated on the activities, the children’s conversation was recorded on an audio recorder and their gestures were observed and noted down on the observation sheet.
Figure 4: Drawing after the play
Each child completed a drawing immediately after they had played with each tangible interface. In each instance, we let the group of children sit around a table, providing them with paper and colour pencils, and we asked them to draw what they had been using (Fig. 4). The children could talk to each other while doing their tasks; the observer could chat with the children about their drawings, e.g. asking for clarification on what they were attempting to represent through the drawing and adding the annotation on the drawing. These were also recorded on an audio recorder for future references.
All the children also completed a short questionnaire of preferences at the end of all the activities and drawings.
After all the activities and drawings had been completed, the children were thanked and the researchers collated the drawings and questionnaire data.
4. EXPERT CODING SESSIONS The analysis of the collected drawings was done through two follow-up expert coding sessions: session one and two. They were arranged and carried out with duration of five to six-week time in between. The first coding session was coding only with
a brief discussion on the method itself. And the second one was a coding session with more details discussed at the end, including discussion on the rationale of each ‘coder rating’ with the aim of gaining agreements on the final scores for all drawings.
4.1 Evaluators A group of four evaluators participated in the coding of the drawings and they have different levels of expertise and experience (see Table 1). All of them were experts in the field of HCI and three of them have had direct experience in creating or testing tangible user interfaces (TUIs); two of the researchers (double-experts) had participated in the study at the school and had experience of children’s drawings research, the other two (single-experts) had never coded drawings before. Prior to the first coding session, the two double-experts worked on establishing the coding list in next section.
Expertise Experience of 4 Interfaces
HCI & TUI Coding Used them School study Expert 1 Expert 2 Expert 3 Expert 4
Table 1: The evaluator profile.
4.2 The Chosen Coding Scheme Before the pictures were looked at, aspects that might be expected to be found in drawings of the four interfaces were discussed by two of the evaluators and an agreed list was created (Table 2).
Element Evidence Score Fun (F) Smiling, words –
e.g. smiling face, ‘cool’ sun, heart, bright & balanced colour
Absent (0) Present (1)
Goal fit (GF)
Amount of the user control – e.g. flashing lights, music… Amount of competition – e.g. words, scores, happiness vs. sadness
Not evident (0) Possibly evident (1) Evident (2) Highly evident (3)
Tangible magic (TM)
Feel of the interface - e.g. size of the racket, connectedness to the board Smartness of the interface – e.g. music manipulatives on the board Table 2: The finalized coding list.
The list contained three usability and UX factors: Fun (F), Goal Fit (GF) and Tangible Magic (TM) - TM is not relevant to interface D, as it was a GUI game. The first, F, was rated present (1) or absent (0); but the other two, GF and TM were scored on a four point scale where 0 was ‘not evident’, 1 was ‘possibly evident’, 2 was ‘evident’ and 3 was ‘highly evident’.
F and GF elements were directly adopted from MacPhail and Kinchin [22], which were used in the context of student’s experiences of sport education; however TM was something new we introduced in the coding scheme.
4.3 Coding Session One Coding of the drawings followed the procedure outlined in [22]. Before the coders began, the lead researcher briefly explained the method and outlined how each of the four interfaces had worked. Coders were told to look for the evidence of fun in children’s smiling faces, speech bubbles that show enjoyment
226
Children and ‘Smart’ Technologies: Can Children’s Experiences be Interpreted and Coded?
HCI 2009 – People and Computers XXIII – Celebrating people and technology
and excitement in the drawings and bright and balanced colour scheme of the drawings and so on (as in Table 1).
After the briefing, all the 108 children’s drawings (27 for each interface) were brought together and divided into four sets randomly. Each set was assigned to one coder who filled in a coding sheet for each drawing (and kept this until all the drawings had been seen) and then each set was passed to the next coder and so on until all four coders had seen all the drawings. At the end of the session, the coders had spent about ten minutes quickly discussed about what they thought about the coding method and the coding session, which was recorded in the research notes. The first group coding session lasted two hours in total.
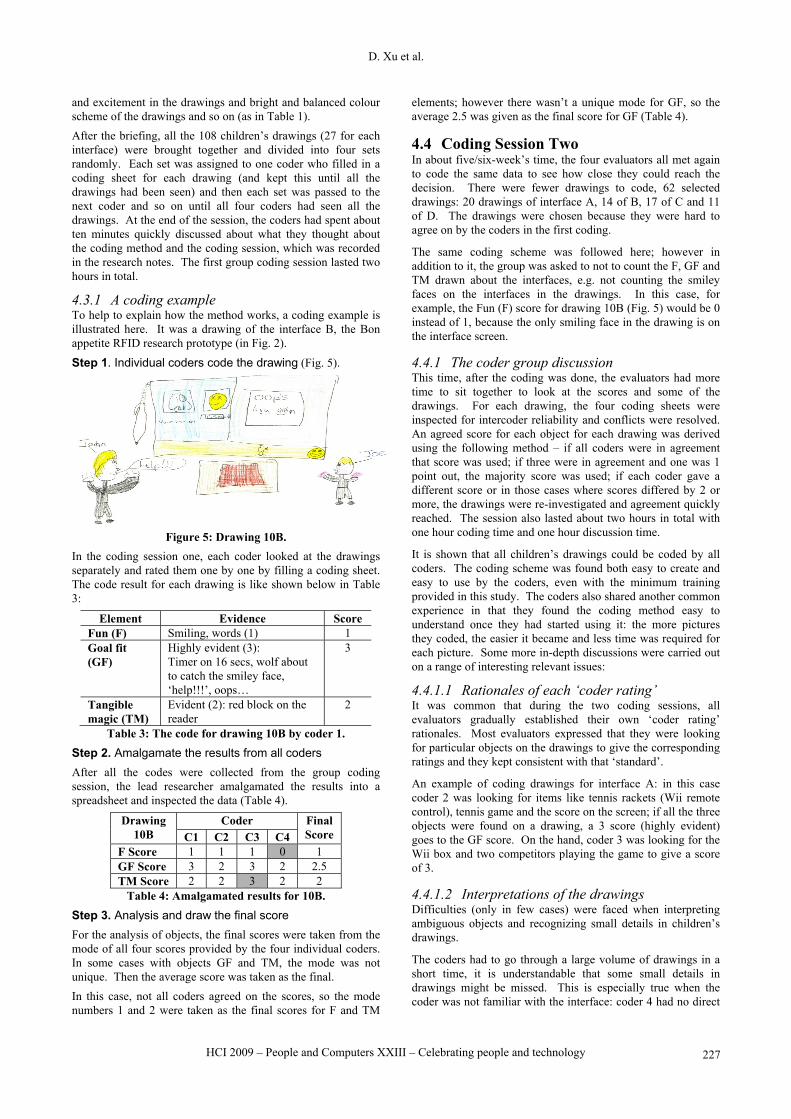
4.3.1 A coding example To help to explain how the method works, a coding example is illustrated here. It was a drawing of the interface B, the Bon appetite RFID research prototype (in Fig. 2).
Step 1. Individual coders code the drawing (Fig. 5).
Figure 5: Drawing 10B.
In the coding session one, each coder looked at the drawings separately and rated them one by one by filling a coding sheet. The code result for each drawing is like shown below in Table 3:
Element Evidence Score Fun (F) Smiling, words (1) 1 Goal fit (GF)
Highly evident (3): Timer on 16 secs, wolf about to catch the smiley face, ‘help!!!’, oops…
3
Tangible magic (TM)
Evident (2): red block on the reader
2
Table 3: The code for drawing 10B by coder 1.
Step 2. Amalgamate the results from all coders
After all the codes were collected from the group coding session, the lead researcher amalgamated the results into a spreadsheet and inspected the data (Table 4).
Drawing 10B
Coder Final Score C1 C2 C3 C4
F Score 1 1 1 0 1 GF Score 3 2 3 2 2.5 TM Score 2 2 3 2 2
Table 4: Amalgamated results for 10B.
Step 3. Analysis and draw the final score
For the analysis of objects, the final scores were taken from the mode of all four scores provided by the four individual coders. In some cases with objects GF and TM, the mode was not unique. Then the average score was taken as the final.
In this case, not all coders agreed on the scores, so the mode numbers 1 and 2 were taken as the final scores for F and TM
elements; however there wasn’t a unique mode for GF, so the average 2.5 was given as the final score for GF (Table 4).
4.4 Coding Session Two In about five/six-week’s time, the four evaluators all met again to code the same data to see how close they could reach the decision. There were fewer drawings to code, 62 selected drawings: 20 drawings of interface A, 14 of B, 17 of C and 11 of D. The drawings were chosen because they were hard to agree on by the coders in the first coding.
The same coding scheme was followed here; however in addition to it, the group was asked to not to count the F, GF and TM drawn about the interfaces, e.g. not counting the smiley faces on the interfaces in the drawings. In this case, for example, the Fun (F) score for drawing 10B (Fig. 5) would be 0 instead of 1, because the only smiling face in the drawing is on the interface screen.
4.4.1 The coder group discussion This time, after the coding was done, the evaluators had more time to sit together to look at the scores and some of the drawings. For each drawing, the four coding sheets were inspected for intercoder reliability and conflicts were resolved. An agreed score for each object for each drawing was derived using the following method – if all coders were in agreement that score was used; if three were in agreement and one was 1 point out, the majority score was used; if each coder gave a different score or in those cases where scores differed by 2 or more, the drawings were re-investigated and agreement quickly reached. The session also lasted about two hours in total with one hour coding time and one hour discussion time.
It is shown that all children’s drawings could be coded by all coders. The coding scheme was found both easy to create and easy to use by the coders, even with the minimum training provided in this study. The coders also shared another common experience in that they found the coding method easy to understand once they had started using it: the more pictures they coded, the easier it became and less time was required for each picture. Some more in-depth discussions were carried out on a range of interesting relevant issues:
4.4.1.1 Rationales of each ‘coder rating’ It was common that during the two coding sessions, all evaluators gradually established their own ‘coder rating’ rationales. Most evaluators expressed that they were looking for particular objects on the drawings to give the corresponding ratings and they kept consistent with that ‘standard’.
An example of coding drawings for interface A: in this case coder 2 was looking for items like tennis rackets (Wii remote control), tennis game and the score on the screen; if all the three objects were found on a drawing, a 3 score (highly evident) goes to the GF score. On the hand, coder 3 was looking for the Wii box and two competitors playing the game to give a score of 3.
4.4.1.2 Interpretations of the drawings Difficulties (only in few cases) were faced when interpreting ambiguous objects and recognizing small details in children’s drawings.
The coders had to go through a large volume of drawings in a short time, it is understandable that some small details in drawings might be missed. This is especially true when the coder was not familiar with the interface: coder 4 had no direct
227
D. Xu et al.
HCI 2009 – People and Computers XXIII – Celebrating people and technology

experience of the interfaces and she found it hard to pick up meaningful objects to contribute to the GF and TM scores.
Another difficulty experienced was some of the items on the drawings were ambiguous, and the group had to leave them open to interpretation. In the future work, these ambiguous items can be documented for discussion or to go back to the audio recording (or to do a post-interview with the children) to find out what they are and add more annotations to the pictures.
However in the coding session two, all these difficulties were overcome with the group coding and discussion. A number of coders coding the data together could help complementing each other’s findings.
4.4.1.3 Correlation of the usability and UX elements Some coders suspected that GF and TM scores could be correlated. They noticed tendency when coded the drawings. Later in the statistic analysis of the scores, the hypothesis is proved to be positive in all cases (interface A, B and C)
4.4.1.4 The immersiveness captured in the drawings. Interface A: Wii tennis game has an immersive nature. This is the special case compared to the other interfaces. As sometimes you could see children in the drawings facing the TV with their back heads facing the audience, the facial expression was not captured in these cases.
For the same interface, in a number of drawings, it was hard to distinguish the game on the screen and the play in the reality, because in both cases, there were people holding tennis rackets.
4.4.1.5 Tiredness and boredoms There also might be tiredness and boredoms affect coders’ rating. E.g. it was shown and discussed that some of the coders tended to give all high and all low scores towards the end of evaluation.
This might be overcome by reexamining the score at the end in the group discussion.
5. RESULTS AND DISCUSSION The drawing data and the variations (coder and coding scheme) of the drawing method are discussed here with the results included.
5.1 The Drawing Data All the children in the study were able to produce drawings of the technologies, though their drawing styles varied considerably. For example, some children carefully drew very detailed pictures from their experience; they tried to capture the real world: e.g. all buttons and icons on the interface and even the colour of their own school uniform. On the other hand, some children were a lot more abstract, using lines and shapes to represent complex elements. A small number of drawings were left incomplete, these happened only with the last two groups; and in general the pictures from the first group were more complete than the rest. The reason behind this might be: the first group was more motivated because the teacher may have selected them to play the games first as a reward for their good behaviour in the classroom; or it could be lacking of time at the end of day and there being one extra interface to go through in the last group.
Generally speaking, detailed and realistic drawing data are more precise, easier to understand and interpret, therefore better suited for evaluation. But on the other hand, the ‘subjective, highly situated and dynamic’ natures of UX would require some creativity and abstractness of drawing creation in order to capture it.
5.1.1 Capturing of F, TM and GF A number of the drawings conveyed information pertaining to user experiences: fun (65.74% of all drawings), goal fit (78.7% of all) and tangible magic (75.31% of all).
It appears that some of the magic of the tangible interface can be conveyed, examples found in the pictures included dotted ‘invisible’ lines linking the Wii control to the Wii deck (Fig. 6), which shows the ‘magic’ of the wireless technology understood by children and presented in their drawing.
Figure 6: Drawing 14A.
Expressions of movement can be found (Fig. 7): an extended arm stretching out for the control button. Dynamic sound and flashing light are also presented in static drawings, e.g. on the same picture.
Figure 7: Drawing 1C.
5.2 The Evaluator Effect Although in the study, all four coders gave scores to the UX objects collectively and contributed to the final scores, it is inevitable that the subjectiveness of each individual could have influenced the way they see and interpret the data. Hence our Hypothesis is: “each individual has his/her rating habit/tendency predefined by their personal experience and expertise.”
To test the hypothesis, the total of each individual’s scores were calculated and the results are shown in Figure 8. According to the results: coder 3 is the highest scorer with a total score of 305, coder 1 closely follows with a total score of 301, then it is
228
Children and ‘Smart’ Technologies: Can Children’s Experiences be Interpreted and Coded?
HCI 2009 – People and Computers XXIII – Celebrating people and technology

coder 2 with a score of 286 and, finally coder 3 with a total of 228. The diagram (Fig. 8) also suggests that Coder 1 and 3 tend to give high scores for all objects compared to the other two coders.
70 63 74 71
130114
135
89
101
109
96
68
0
50
100
150
200
250
300
350
Coders
To
tal s
core
s
TM
GF
F
TM 101 109 96 68
GF 130 114 135 89
F 70 63 74 71
1 2 3 4
Figure 8: Total scores by four coders.
By looking at the profiles of the four individuals: coder 1 and 2 were the double-experts who created and developed the drawing interpretation method, and had either directly or indirectly experienced the coding of drawings; coder 3 and 4 were the single-experts who had no experience of coding drawings, and coder 4 was the only non TUI expert.
The fact that coders 1, 2 and 3 were TUI experts and they all had similar high TM scores (101, 109 and 96) supports the hypothesis; the same applies to coder 4 with the low TM score of 68: Tangible magic ™ would be easily identifiable if the coder had a good knowledge of TUIs.
People may argue that coders 1 and 2, who have created the drawing method, could be somehow biased and give high scores for all objects. Indeed, they had some of the highest scores among the four coders, however none of the differences between the scores was significant; especially compared to the difference between coder 4 and the others.
5.3 The Coding Scheme In coding session one, all individual scores were kept and no conflicts were solved. The data mentioned in this section are all from coding session one.
The fun (F) score has high intercoder reliability; only in some rare cases (15.74% of all cases) did one coder not agree on the same score given by the other three.
The goal fit (GF) and tangible magic (TM) scores from the four individual coders were rarely completely identical, it only happened in 17.59% of all cases for GF and in 13.58% of all cases for TM. In some cases with objects GF (11.64% of all cases) and TM (8.47% of all cases), two coders could not agree with the other two on the score, therefore the mode was not unique; then the average score was taken as the final.
There are more intercoder variations for GF and TM scores, as these codes are more subjective and less easy to identify and measure. Especially in this study, when the four coders with
different experience and expertise tried to code drawings collectively.
5.4 Inter-rater Reliability Cronbach’s α-test were applied to examine the code reliability of the four coders (N = 4). Table 5 and Figure 9 shows the α-test results from the first and second coding, the value of α range from 0 to 1, α=1 indicates 100% reliable data from the four coders.
A B C D F 0.923 0.900 0.965 0.971
GF 0.531 0.750 0.791 0.760 TM 0.498 0.736 0.868 -
Table 5: The reliability score of the first coding
Data from the first coding shows that:
All ratings for all interfaces except interface A are generally reliable (α≥0.736).
F ratings for all interfaces are very reliable (α≥0.9). Most GF ratings (except interface A) are reliable (α≥0.75). Most TM ratings (except interface A) are generally reliable (α≥0.736).
Interface A is somehow behaving very differently from the others on the GF and TM reliability; therefore, it needs to be considered as a special case, discussed and recoded.
0
0.25
0.5
0.75
1
Interfaces
Rel
iab
ility
(α
)
F 0.956 0.856 0.957 0.977
GF 0.698 0.804 0.788 0.809
TM 0.819 0.71 0.801
A B C D
Figure 9: Coder reliability of the second coding, four coders
(N=4).
The data in Figure 9 shows:
All ratings for all interfaces are generally reliable (0.698≤α≤0.977). Being able to design a scheme that could be used across several different tangible interactions was considered a success.
F ratings for all interfaces are very reliable (α≥0.856).
Most GF and TM ratings are reliable (α≥0.75), except GF
for interface A ( AGF =0.698) and TM for interface B
( AGF = 0.710).
It can be seen that the recoding of the drawing leads to some improvement of coding reliability. It is possible that after going through the two coding sessions, the coders got familiar with the coding scheme and learnt about the interfaces.
Coding and recoding is a common practice in the field of the psychology to improve the rating reliability.
5.5 Other Results and Discussions 5.5.1 The drawing method The coding sessions could be more structured with certain steps followed for a completed coding procedure:
229
D. Xu et al.
HCI 2009 – People and Computers XXIII – Celebrating people and technology

Before the coding: Pre-evaluation training – give evaluators needed domain knowledge and information on the scenario
So ideally in the study presented in this paper, the four interfaces could have been shown to the evaluators. And a couple of coding examples could also have been introduced.
During the coding: Each individual coders code the drawings independently – examine the drawings, considering each of the coding elements in the drawings, decide and note down the score.
After the coding: Discuss and make agreements on the scores – amalgamate the results form all coders, analysis and draw the final score.
A report can be then generated from the results and the discussions.
5.5.2 This study The result from the study also shows that in all cases (interfaces A, B, C; note D does not have a TM score), there was a significant correlation (α=0.05) between GF and TM. This interesting result hinted that there is a hidden link between the elements of GF and TM in a tangible interface. And it is possible that in a TUI, the more Tangible Magic it has (embedded into physical artefacts and merged into physical environments with ‘smart’ technology), the more user control it provides to fulfill certain purpose(s). This phenomenon could be happened to be true for this study only, or it could be a generic one.
6. CONCLUSION This study has shown that children’s drawings can be used for evaluating children’s interfaces. Children’s drawings provide rich data; the drawing interpretation method could elicit both qualitative and quantitative data from them. This and the previous study [9] show that when a coding scheme of the drawing is carefully chosen, the method can cover multiple aspects of interface (thoroughness). The study found that the method is ease-of-use by evaluators with different background and knowledge and it gives reliable scores across different interfaces and coders.
The results showed that the data in most cases were reliable except for immersive interface A, despite the coder variance. The impact of individual coders was found on the coding results and our hypothesis on the evaluator effect was tested positive. And the method has been found particular reliable of capturing fun.
Drawing conveys information, a number of the drawings conveyed information pertaining to user experiences: fun, goal fit and tangible magic. Our drawing method approach can be used in the future for other similar studies.
To conclude, the new drawing interpretation method we proposed in this paper has been proven usable and reliable and it adds value to the traditional evaluation with children and design of new technologies for children. It will be used in the future extended studies.
6.1 Future Studies More work will be done to determine what makes the tangible magic and goal fit for any given interface; with more understanding of the elements we are looking for, the existing coding scheme could be then improved. And by incorporating other UX and usability elements into the coding schemes, the drawing method could be easily expanded for evaluating and coding of other aspects of children’s drawings… Future work
could be to look at, and explore, the potentials of the method. The development of the coding schemes will be a continuous and iterative process.
There is also the possibility to digitalize the coding process as the procedure is structured and standardisable. Digitalized coding can bring some advantages: evaluators could do the coding and coding discussion remotely offsite if they were familiar with the method and interfaces. Therefore inputting, processing and storing of the data could be all done automatically; and it will be a paper free coding environment. This will bring another dimension to the drawing evaluation, and of course the effect of this has to be compared with the normal situation to see if the mean would affect the coding result, e.g. would the coders prefer looking at the drawings and rate them on a computer screen or actually seeing them for real.
The interface variance would be another interesting area to look at: why is it that certain interfaces behave differently from the others on the reliability test and give different results on the UX object ratings? What is special? What, in terms of the interaction is hard to understand? Or was the interface difficult to illustrate in drawings?
Future work could be exploring the evaluator effect with different types of experts: experts of children verses not experts of children and experts who have experience on coding of qualitative data but not experts in HCI and/or TUI for instance.
More analysis can be done in the future with the rich data we have gathered. We could compare the questionnaire results with the coding results and identifying any correlations. The audio recording of the drawing sessions could be also looked at, because occasionally all coders had difficulty interpreting some elements in the pictures and it would probably be useful to go back to the audio recording (or to do a post-interview with the children) to find out what they are and add more annotations to the pictures.
7. ACKNOWLEDGMENTS A special thanks to the children and their teachers. Acknowledgements go to Matthew Horton at Child Computer Interaction (ChiCI) Group for volunteering help with the study with children.
8. REFERENCES [1] Zaman, B. and V.A. Vero, Towards a Likeability
Framework that meets Child-Computer Interaction & Communication Sciences, in IDC 2007. 2007, ACM Press: Aalborg, Denmark.
[2] Xie, L., A.N. Antle, and N. Motamedi, Are Tangibles More Fun? Comparing Children's Enjoyment and Engagement Using Physical, Graphical and Tangible User Interfaces, in The Second International Conference on Tangible and Embedded Interaction, TEI'08. 2008, ACM: Bonn, Germany.
[3] Sturm, J., et al., Key issues for the successful design of an intelligent, interactive playground, in 7th International Conference for Interaction Design and Children, IDC 08 2008, ACM: Chicago, IL, USA.
[4] Barendregt, W., Evaluating fun and usability in computer games with children, in Department of Industrial Design. 2006, Eindhoven University of Technology: Eindhoven.
[5] Ferris, K., et al. Shaping Experiences in the Hunt Museum: A Design Case Study. in Designing Interactive Systems 2004 (DIS 2004). 2004. Cambridge, Massachusetts, USA.: ACM.
230
Children and ‘Smart’ Technologies: Can Children’s Experiences be Interpreted and Coded?
HCI 2009 – People and Computers XXIII – Celebrating people and technology

[6] Kaye, J.J., et al. Evaluating Experience-focused HCI in CHI 2007. 2007. San Jose, California, USA.
[7] Xu, D., et al. Evaluation of Tangible User Interfaces (TUIs) for and with Children – Methods and Challenges. in HCI International 2007. 2007. Beijing, China: Springer Press.
[8] Sengers, P. and B. Gaver. Staying Open to Interpretation: Engaging Multiple Meanings in Design and Evaluation. in DIS 2006. 2006. Pennsylvania, USA.
[9] Xu, D., R. Janet, and R. Sheehan. In search of tangible magic. in The 22nd BCS British-HCI 2008. 2008. Liverpool, UK: ACM.
[10] Garzotto, F., Broadening children's involvement as design partners: from technology to "experience", in 7th International Conference for Interaction Design and Children, IDC 08 2008, ACM: Chicago, IL, USA.
[11] Alben, L., Quality of Experience, in Interactions. 1996, ACM Press. p. 12-15.
[12] Dalsgård, P. and K. Halskov. Real Life Experiences with Experience Design. . in NordiCHI 2006. 2006: ACM Press,.
[13] Forlizzi, J. and K. Battarbee. Understanding Experience in Interactive Systems. in DIS2004 2004. Cambridge, Ma, USA ACM Press.
[14] McClellan, I. User Experience’ Design - A new form of design practice takes shape. in CHI’05. 2005. Portland – Oregon: ACM Press.
[15] Read, J.C., S.J. MacFarlane, and C. Casey. Endurability, Engagement and Expectations: Measuring Children's
Fun. in Interaction Design and Children Workshop. 2002. Eindhoven, Netherland.
[16] Riekhoff, J. and P. Markopoulos, Sampling young children's experiences with culture probes, in 7th International Conference for Interaction Design and Children, IDC 08 2008, ACM: Chicago, USA.
[17] Wiberg, C., A measure of fun, extending the scope of web usability, in Department of Informatics. 2003, Umeå University: Umeå. p. 296.
[18] Marcus, A., Fun! fun! fun! in the user experience we just wanna have fun...don't we? , in Interactions 2007. p. 48- ff.
[19] Piaget, J., Piaget, J., Science of Education and the psychology of the child. 1970, New York: Orion Press.
[20] Sheenhan, R., Children's perception of computer programming as an aid to designing programming environments, in Interaction Design and Children Conference: IDC 2003. 2003, ACM Press: Preston, England.
[21] Denham, P., Nine to fourteen-year-old children's conception of computers using drawings. . Behaviour and Information Technology, 1993. 12(6): p. 346-358.
[22] MacPhail, A. and G. Kinchin, The use of drawings as an evluative tool: students' experiences of Sport Education. Physical Education and Social Scince, 2004. 9(1): p. 88 - 108.
[23] Xu, D., et al., Designing and Testing a Tangible Interface Prototype in 6th International Conference for Interaction Design and Children, IDC 07. 2007, ACM Press: Aalborg, Denmark.
231
D. Xu et al.
HCI 2009 – People and Computers XXIII – Celebrating people and technology
Related Documents