Child Welfare Administration and Its Influence on Child Outcomes Katie Mason This research study analyzes child welfare administrations’ influence on the amount of time a child spends as “legally free” for adoption. Data used for this study are from the Adoption and Foster Care Analysis and Reporting System (AFCARS). The sample of 1,604 youth came from the 2005 adoption data. The study finds that youth in state administered child welfare systems spend less time as “legally free” for adoption. When controlling for state fixed effects, youth in both state administered and mixed administration child welfare systems spend less time as “legally free” for adoption. Future research should focus on additional policy variables in order to explore further decentralized systems. Introduction Child welfare experts have done very little research addressing how child welfare administration influences child welfare outcomes. The existing research focuses on the influence of administration in relation to changes relevant to major federal child welfare legislative reforms (Mitchell 2005, Wells 2006). These studies use data from the Local Agency Survey (LAS) of the National Survey of Child and Adolescent Well-Being (NSCAW) (Mitchell 2005). NSCAW is a longitudinal, national probability study of children and families investigated for child maltreatment. It includes families that self-selected to receive treatment. In contrast, this study analyzes child welfare administration’s influence on child welfare outcomes using Adoption and Foster Care Analysis and Reporting System (AFCARS) data. AFCARS data are available for every child involved in the foster care system in the U.S. and children adopted from foster care during each year. This study focuses on the impact of child welfare administration centralization on the length of time a child spends as “legally free” for adoption. “Legally free” refers to a child whose parents’ rights have been terminated or relinquished. They are legally available for adoption. Many of these children become wards of the state. First, the policy landscape will be explained and will be followed by a description of the different administration types. Next, the design of the study, the findings, and their implications will be described. This study is based on the hypothesis that state supervised, county administered systems will be more effective in getting children into permanent placements than state administered and mixed administration systems. Localities share in the cost of maintaining foster care placements and will therefore try to move children into adoptive placements in order to reduce costs. In addition, county administrators are closer to the point of service and will therefore have a better grasp on how many children are available for adoption and the appropriate services necessary to move these children to permanent placements. Accordingly, the results should show that children in states that administer their child welfare systems at the county level should spend fewer months as “legally free” for adoption. Current Policy Issues and Explanation of Program Types As of September 30, 2007, approximately 496,000 children in the U.S. were in foster care (U.S. Children’s Bureau 2008). Of these children, 130,000 were available for adoption. Children in foster care face many negative outcomes. According to multiple studies, children in foster care face compromised developmental outcomes, psychosocial vulnerability, poor physical health, poor cognitive and academic functioning, and impacted social-emotional wellbeing (Jones 2004). Although these negative outcomes may reflect maltreatment and troubling early experiences, lack of a stable home and family contribute to the difficulties faced by foster children. In 1997, the federal government passed the Adoption and Safe Families Act (ASFA). The legislation necessitates that child welfare agencies develop and file a case plan 30 days after a child enters foster care. Most importantly, it required that the child welfare agency and court concentrate on identifying, recruiting, processing and approving qualified adoptive parents for children in foster care for 15 out of 22 months (Pub.L. 105-89). With this legislation, child welfare policy shifted from a strict focus on removing children to a focus on finding the best placements for children. Since 1999, the number of children in foster care has decreased (U.S. Children’s Bureau 2008).

Welcome message from author
This document is posted to help you gain knowledge. Please leave a comment to let me know what you think about it! Share it to your friends and learn new things together.
Transcript
Child Welfare Administration and Its
Influence on Child Outcomes
Katie Mason
This research study analyzes child welfare administrations’ influence on the amount of time a child spends as “legally free” for adoption. Data
used for this study are from the Adoption and Foster Care Analysis and Reporting System (AFCARS). The sample of 1,604 youth came
from the 2005 adoption data. The study finds that youth in state administered child welfare systems spend less time as “legally free” for
adoption. When controlling for state fixed effects, youth in both state administered and mixed administration child welfare systems spend less
time as “legally free” for adoption. Future research should focus on additional policy variables in order to explore further decentralized systems.
Introduction
Child welfare experts have done very little research addressing how child welfare administration influences child welfare outcomes. The
existing research focuses on the influence of administration in relation to changes relevant to major federal child welfare legislative reforms
(Mitchell 2005, Wells 2006). These studies use data from the Local Agency Survey (LAS) of the National Survey of Child and Adolescent
Well-Being (NSCAW) (Mitchell 2005). NSCAW is a longitudinal, national probability study of children and families investigated for child
maltreatment. It includes families that self-selected to receive treatment.
In contrast, this study analyzes child welfare administration’s influence on child welfare outcomes using Adoption and Foster Care Analysis
and Reporting System (AFCARS) data. AFCARS data are available for every child involved in the foster care system in the U.S. and
children adopted from foster care during each year. This study focuses on the impact of child welfare administration centralization on the
length of time a child spends as “legally free” for adoption. “Legally free” refers to a child whose parents’ rights have been terminated or
relinquished. They are legally available for adoption. Many of these children become wards of the state. First, the policy landscape will be
explained and will be followed by a description of the different administration types. Next, the design of the study, the findings, and their
implications will be described.
This study is based on the hypothesis that state supervised, county administered systems will be more effective in getting children into
permanent placements than state administered and mixed administration systems. Localities share in the cost of maintaining foster care
placements and will therefore try to move children into adoptive placements in order to reduce costs. In addition, county administrators are
closer to the point of service and will therefore have a better grasp on how many children are available for adoption and the appropriate
services necessary to move these children to permanent placements. Accordingly, the results should show that children in states that
administer their child welfare systems at the county level should spend fewer months as “legally free” for adoption.
Current Policy Issues and Explanation of Program Types
As of September 30, 2007, approximately 496,000 children in the U.S. were in foster care (U.S. Children’s Bureau 2008). Of these children,
130,000 were available for adoption. Children in foster care face many negative outcomes. According to multiple studies, children in foster
care face compromised developmental outcomes, psychosocial vulnerability, poor physical health, poor cognitive and academic
functioning, and impacted social-emotional wellbeing (Jones 2004). Although these negative outcomes may reflect maltreatment and
troubling early experiences, lack of a stable home and family contribute to the difficulties faced by foster children.
In 1997, the federal government passed the Adoption and Safe Families Act (ASFA). The legislation necessitates that child welfare agencies
develop and file a case plan 30 days after a child enters foster care. Most importantly, it required that the child welfare agency and court
concentrate on identifying, recruiting, processing and approving qualified adoptive parents for children in foster care for 15 out of 22
months (Pub.L. 105-89). With this legislation, child welfare policy shifted from a strict focus on removing children to a focus on finding
the best placements for children. Since 1999, the number of children in foster care has decreased (U.S. Children’s Bureau 2008).
Federal, state, and local governments have introduced new approaches to improve the system. A 1994 Social Security Act amendment
directed the Department of Health and Human Services (HHS) to promulgate regulations for the review of state child welfare programs
(42 U.S.C. §1320a-2a. Pub.L. 103-432 Title II n.d.). It was an attempt by Congress to create conformity at the state and local levels. The
legislation instructed that the reviews should determine whether states were in compliance with state plan requirements under Titles IV-E
and IV-B of the Social Security Act, federal regulations promulgated by HHS, and each state’s own approved plan (42 U.S.C. §1320a-2a.
Pub.L. 103-432 Title II n.d.). Accordingly, the federal government conducts Child and Family Service Reviews. “The reviews measure the
state’s achievement of outcomes for children and families in three areas—safety, permanency, and child and family well-being (45 CFR
1355.34 (c) (1)-(7) n.d., Grimm and Hurtubise 2003). Each state must achieve certain criteria that fall within each of the outcomes. If they
are not able to do so, the federal government will withhold child welfare related grants-in-aid. Additionally, the federal government may
require that states return grants-in-aid previously approved. Moving youth from foster care into adoptive placements falls within the
permanency outcome. When children are “legally free” for adoption, they must move from their foster care placement to a permanent
adoptive placement.
When child welfare systems do not move youths into adoptive placements, they face many negative outcomes. According to a study
conducted by the Chapin Hall Center for Children at the University of Chicago, youth that transition from the foster care system to
adulthood fare worse than their same-age peers. Namely, these youth enter adulthood with educational deficits and very few necessary life
skills. The lack of life skills and education translate to foster youth being less employable and facing lower earning power. Many of these
youth face economic hardships and poor physical and mental health. Additionally, they are more likely to need government assistance, to
have children, and to be involved with the criminal justice system. (Courtney & Dworsky, 2005).
Each state, under federal law, must designate a single agency to operate their child welfare program (42 U.S.C. §622(f)(1) n.d.). States may
choose in which way to administer their child welfare systems. State statutes indicate where the authority for provision of social service
programs resides. Statutes identify which “organizational units are responsible for social services” and include the “functions, powers, and
duties with regard to enforcing state laws” (Stein 1998, 24). Systems range from fully state administered systems to state supervised, county
administered systems. In state administered systems, the state agency has authority for program implementation and financing. In state
supervised, county administered systems, local and regional governmental entities hold decentralized administrative control. These local
units of government share in the cost of funding child welfare services. Counties must submit a service plan detailing how the county “will
meet the needs of [their] constituents” (Stein 1998). The counties have control over which services they will provide (under the parameters
set by state and federal laws). Often, the state provides block grant funds to counties with which the counties provide support for children
and families. This type of administration allows for county-by-county differences (Stein 1998). States may also use a mixed administration
type. With this type of administration, certain large counties run their own child welfare systems while the state administers the remaining
counties’ systems.
Data and Methods
Data
The data used for this project are from the Adoption and Foster Care Analysis and Reporting System (AFCARS) collected in 2005. The
Children’s Bureau of the U.S. Department of Health and Human Services collects data for this dataset. Since it is a federally mandated
system, states must collect data on “all adopted children who are placed by the state’s child welfare agency or by private agencies under
contract with the public child welfare agency” (National Data Archive on Child Abuse and Neglect 2002). The adoption data file, the file
used in this project, contains 37 elements specific to the adoptive child, the adoptive parents, and details specific to the child’s case
(National Data Archive on Child Abuse and Neglect 2002). Of the variables available in the dataset, 35 variables were used.
Sample
This study uses detailed data on the characteristics of U.S. children adopted during 2005 (one point in time). In this case, the reporting
period for the dataset is October 1, 2005 through September 30, 2006. This analysis uses a sample of the original dataset, which consisted
of 51,486 children. After removing cases for missing data, 50,252 cases remained. Using statistical software (STATA), a random sample was
taken without replacement. The resulting sample was 2,516 cases. Unfortunately, additional missing information resulted in the number of
cases dropping to 1,604 cases. Cases were removed if they lacked any of the variables.
Variables
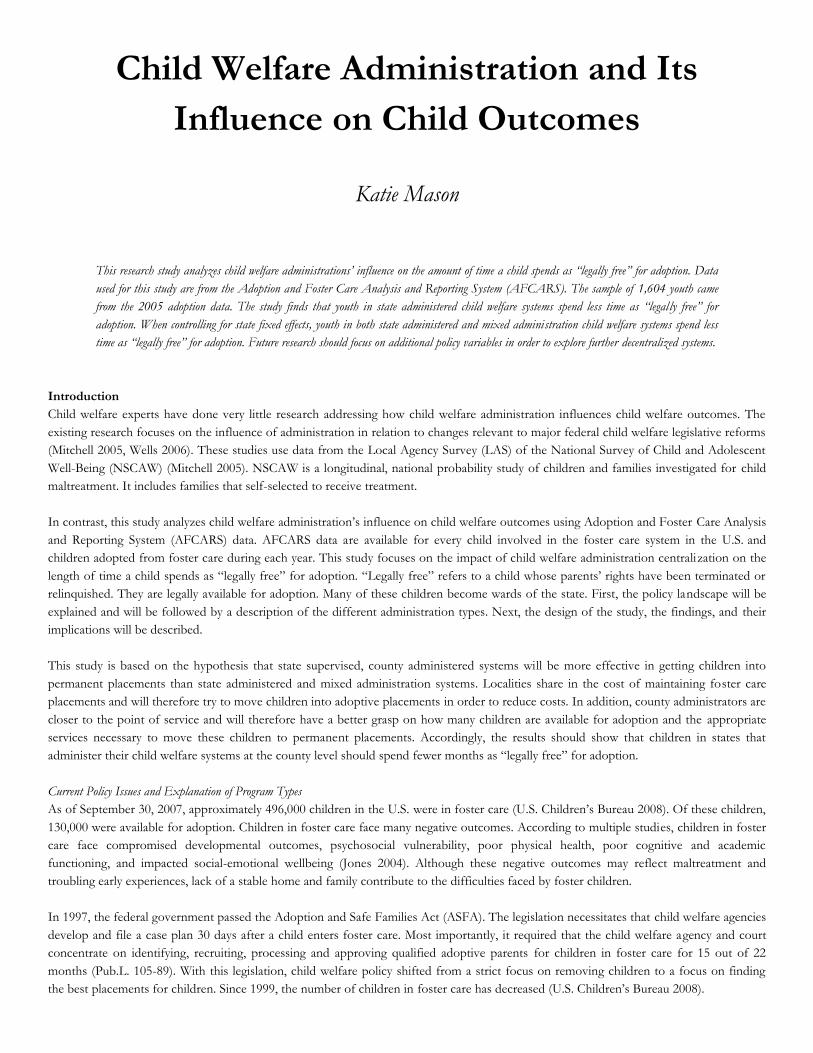
Length of time child is “legally free” for adoption. This study examines the impact of different types of administration on the number of months a
child is “legally free” for adoption. The length of time that a child is “legally free” for adoption is measured using the number of months
between the final termination of parental rights and the final adoption date.
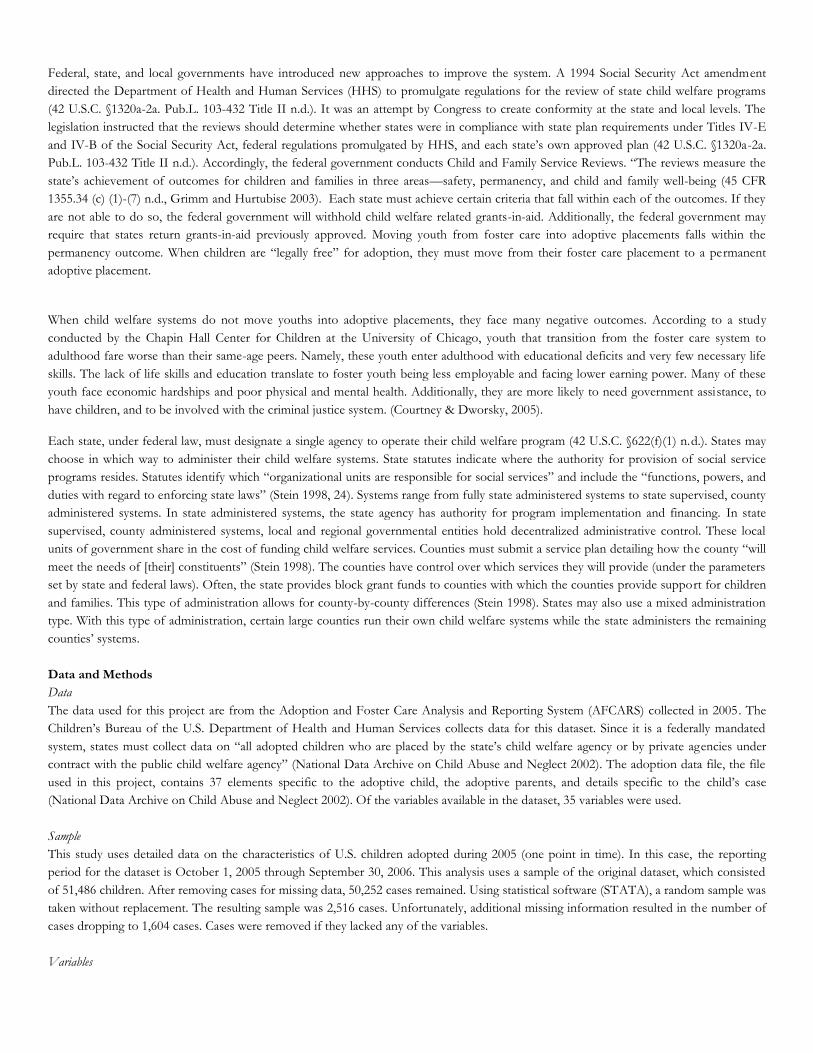
Child welfare administration. Child welfare administration is the primary independent variable of interest in these regression analyses. Each
state’s child welfare administration type was obtained through multiple sources, specifically administrative data provided by the
Administration for Children and Families. Cases were coded as state administered; state supervised, county administered; or mixed
administration. State supervised, county administered is used as the reference variable. See Table 1 for a comparison of descriptive statistics
by administration type.
TABLE 1
Descriptive Statistics Across Administration Types (N=1604)
State
Administered
County
Administered
Mixed
Administration
Total Number of
Observations
1965
(Number of Cases Used
After Missing Variables)
1309
(1049)
597
(368)
605
(548)
Variables
Length of Time “Legally
Free” for Adoption
14.43
(14.44)
16.29
(16.76)
14.82
(15.15)
Child Characteristics
Age
82.03
(51.9)
87.1
(55.36)
77.43
(51.53)
Sex 49% Male
50% Female
50% Male
49% Female
52% Male
47% Female
Race of Child
American Indian or
Alaskan Native
3%
2%
1%
Asian 2% <1% 1%
Black/African
American
33% 42% 28%
Hawaiian/Pacific
Islander
1% 0% <1%
White 64% 53% 75%
Unable to
Determine Race
3% 6% 0%
Hispanic Origin 9% 13% 42%
Special Needs
1.09
(0.87)
1.19
(0.86)
1.22
(0.65)
Adoptive Parent
Characteristics
Race of Adoptive
Mother
American Indian or
Alaskan Native
1%
<1%
1%
Asian 1% 0% 1%
Black/African
American
24% 24% 19%
Hawaiian/Pacific
Islander
1% <1% <1%
White 71% 47% 66%
Unable to
Determine Race
2% <1% 10%
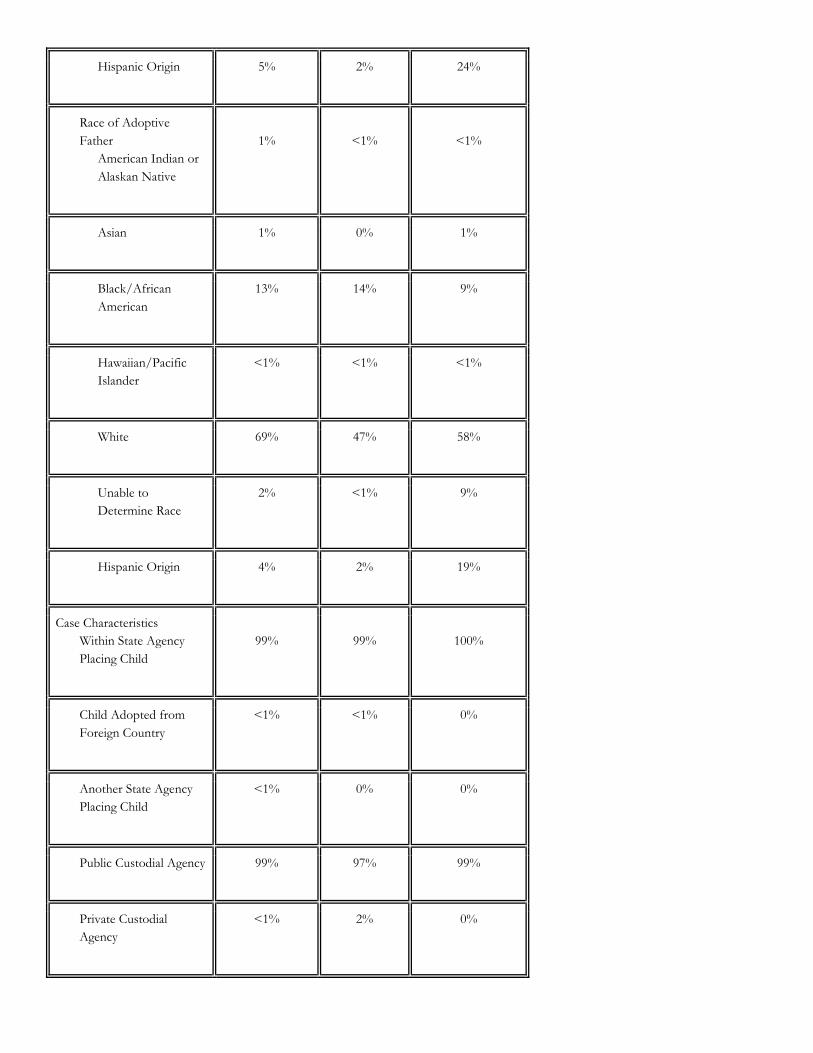
Hispanic Origin 5% 2% 24%
Race of Adoptive
Father
American Indian or
Alaskan Native
1%
<1%
<1%
Asian 1% 0% 1%
Black/African
American
13% 14% 9%
Hawaiian/Pacific
Islander
<1% <1% <1%
White 69% 47% 58%
Unable to
Determine Race
2% <1% 9%
Hispanic Origin 4% 2% 19%
Case Characteristics
Within State Agency
Placing Child
99%
99%
100%
Child Adopted from
Foreign Country
<1% <1% 0%
Another State Agency
Placing Child
<1% 0% 0%
Public Custodial Agency 99% 97% 99%
Private Custodial
Agency
<1% 2% 0%
Tribal Custodial Agency 0% <1% 0%
Custodial Individual 0% <1% <1%
Log Amount of
Adoption Subsidy
6.15
(0.53)
5.93
(1.18)
6.36
(0.51)
IV-E Assistance
Claimed
67% 69% 76%
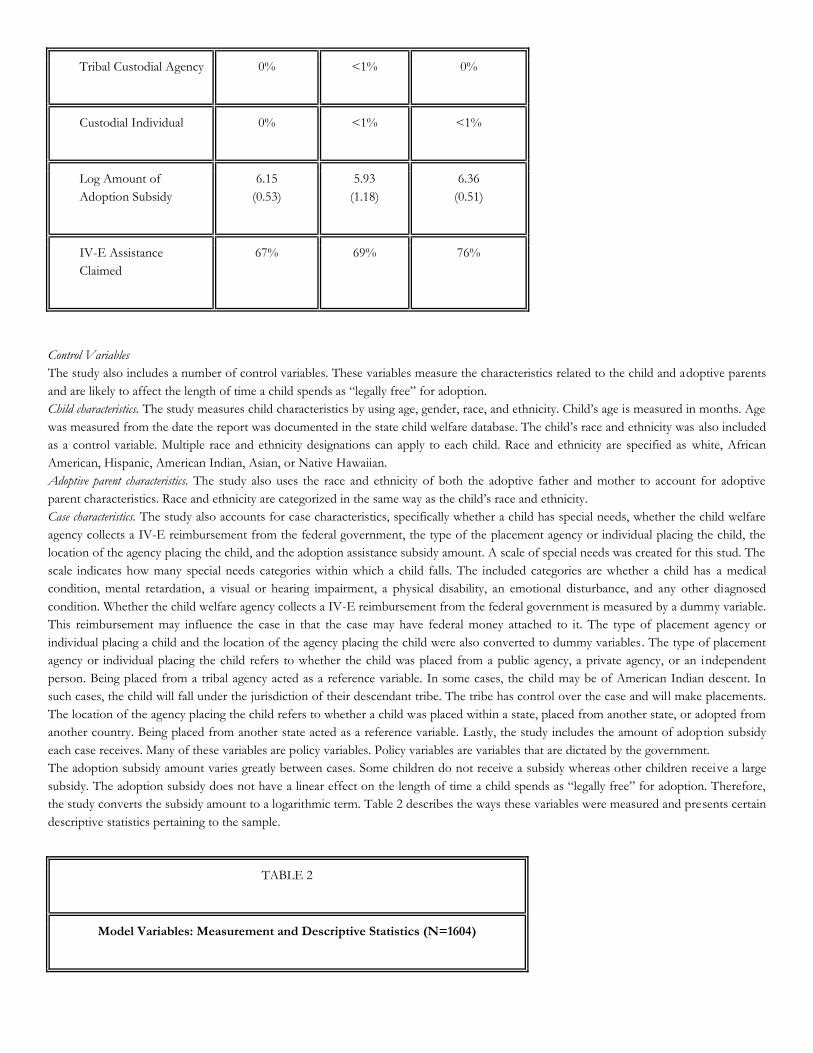
Control Variables
The study also includes a number of control variables. These variables measure the characteristics related to the child and adoptive parents
and are likely to affect the length of time a child spends as “legally free” for adoption.
Child characteristics. The study measures child characteristics by using age, gender, race, and ethnicity. Child’s age is measured in months. Age
was measured from the date the report was documented in the state child welfare database. The child’s race and ethnicity was also included
as a control variable. Multiple race and ethnicity designations can apply to each child. Race and ethnicity are specified as white, African
American, Hispanic, American Indian, Asian, or Native Hawaiian.
Adoptive parent characteristics. The study also uses the race and ethnicity of both the adoptive father and mother to account for adoptive
parent characteristics. Race and ethnicity are categorized in the same way as the child’s race and ethnicity.
Case characteristics. The study also accounts for case characteristics, specifically whether a child has special needs, whether the child welfare
agency collects a IV-E reimbursement from the federal government, the type of the placement agency or individual placing the child, the
location of the agency placing the child, and the adoption assistance subsidy amount. A scale of special needs was created for this stud. The
scale indicates how many special needs categories within which a child falls. The included categories are whether a child has a medical
condition, mental retardation, a visual or hearing impairment, a physical disability, an emotional disturbance, and any other diagnosed
condition. Whether the child welfare agency collects a IV-E reimbursement from the federal government is measured by a dummy variable.
This reimbursement may influence the case in that the case may have federal money attached to it. The type of placement agency or
individual placing a child and the location of the agency placing the child were also converted to dummy variables. The type of placement
agency or individual placing the child refers to whether the child was placed from a public agency, a private agency, or an independent
person. Being placed from a tribal agency acted as a reference variable. In some cases, the child may be of American Indian descent. In
such cases, the child will fall under the jurisdiction of their descendant tribe. The tribe has control over the case and will make placements.
The location of the agency placing the child refers to whether a child was placed within a state, placed from another state, or adopted from
another country. Being placed from another state acted as a reference variable. Lastly, the study includes the amount of adoption subsidy
each case receives. Many of these variables are policy variables. Policy variables are variables that are dictated by the government.
The adoption subsidy amount varies greatly between cases. Some children do not receive a subsidy whereas other children receive a large
subsidy. The adoption subsidy does not have a linear effect on the length of time a child spends as “legally free” for adoption. Therefore,
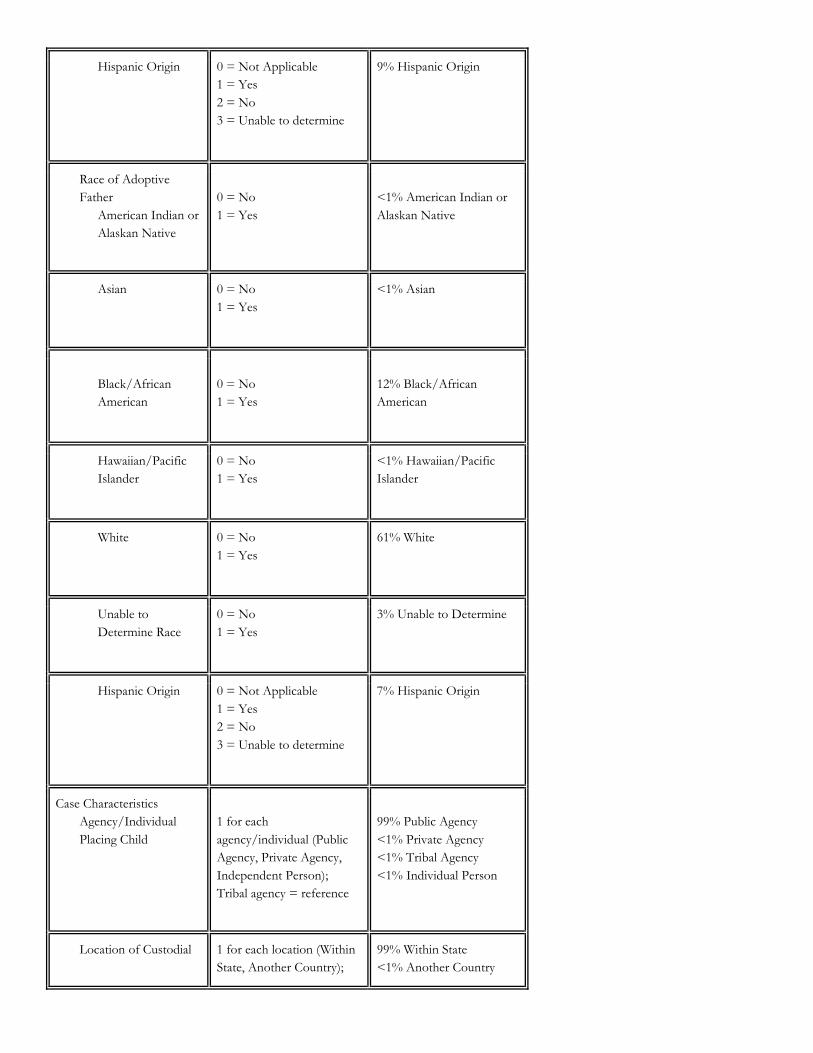
the study converts the subsidy amount to a logarithmic term. Table 2 describes the ways these variables were measured and presents certain
descriptive statistics pertaining to the sample.
TABLE 2
Model Variables: Measurement and Descriptive Statistics (N=1604)
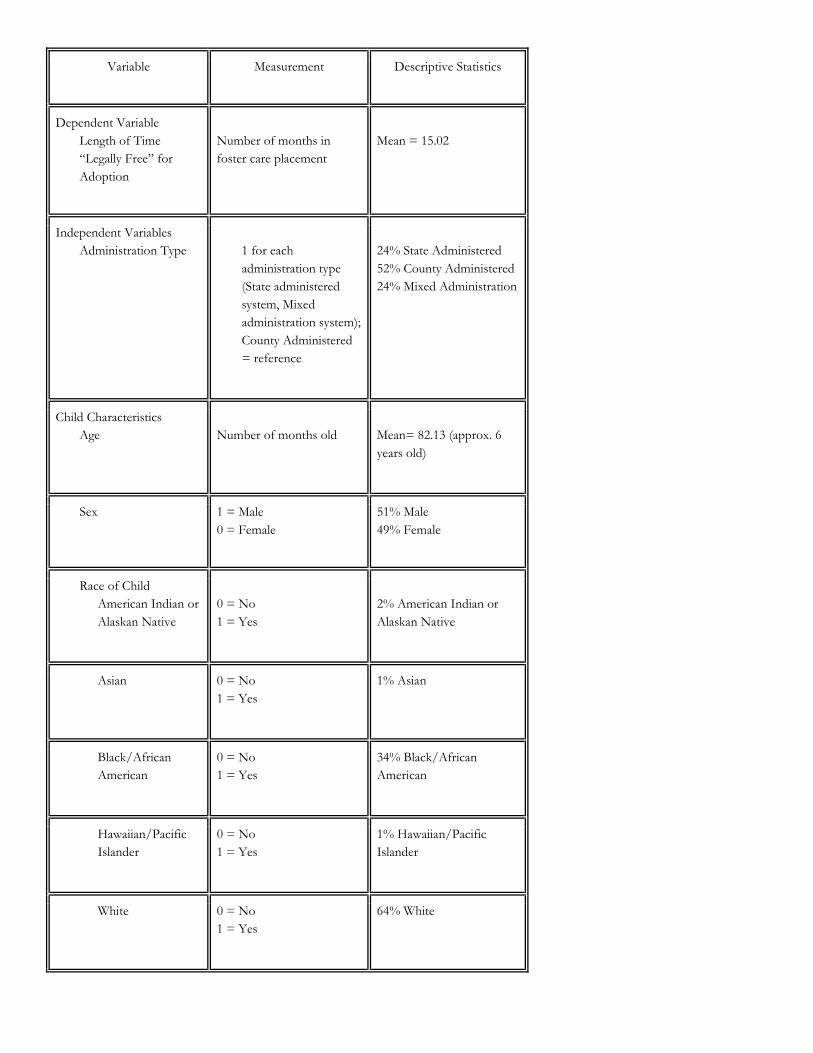
Variable Measurement Descriptive Statistics
Dependent Variable
Length of Time
“Legally Free” for
Adoption
Number of months in
foster care placement
Mean = 15.02
Independent Variables
Administration Type
1 for each
administration type
(State administered
system, Mixed
administration system);
County Administered
= reference
24% State Administered
52% County Administered
24% Mixed Administration
Child Characteristics
Age
Number of months old
Mean= 82.13 (approx. 6
years old)
Sex 1 = Male
0 = Female
51% Male
49% Female
Race of Child
American Indian or
Alaskan Native
0 = No
1 = Yes
2% American Indian or
Alaskan Native
Asian 0 = No
1 = Yes
1% Asian
Black/African
American
0 = No
1 = Yes
34% Black/African
American
Hawaiian/Pacific
Islander
0 = No
1 = Yes
1% Hawaiian/Pacific
Islander
White 0 = No
1 = Yes
64% White
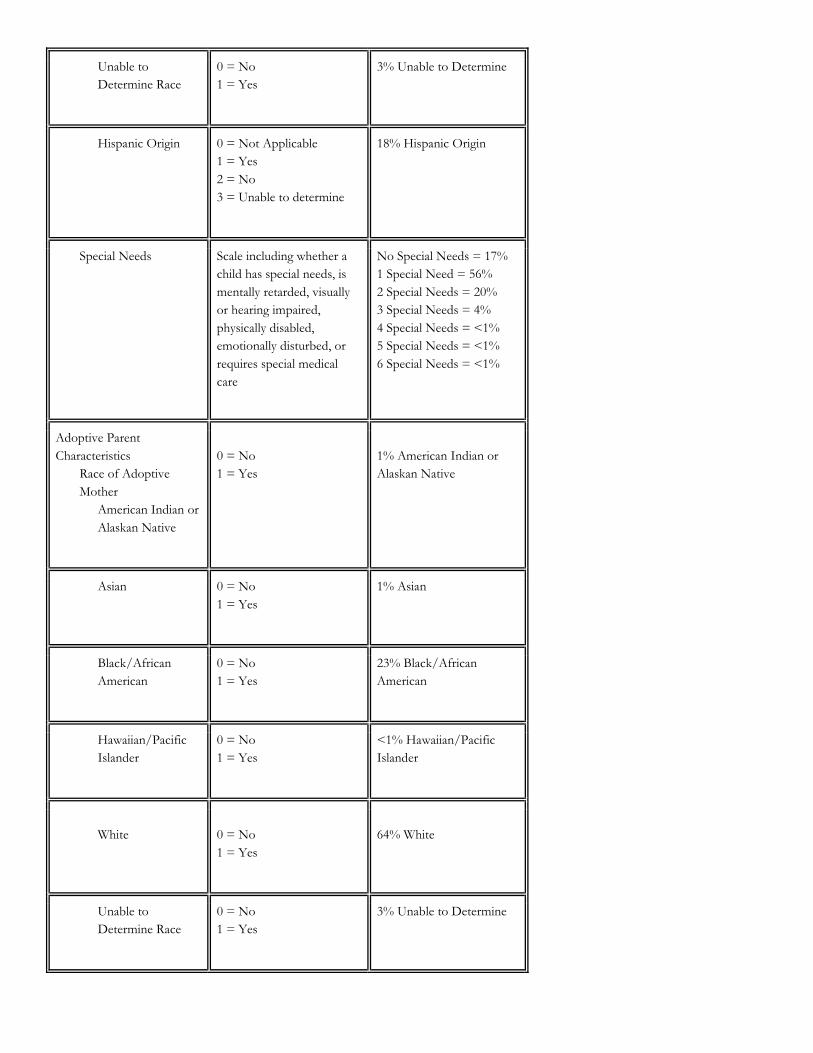
Unable to
Determine Race
0 = No
1 = Yes
3% Unable to Determine
Hispanic Origin 0 = Not Applicable
1 = Yes
2 = No
3 = Unable to determine
18% Hispanic Origin
Special Needs Scale including whether a
child has special needs, is
mentally retarded, visually
or hearing impaired,
physically disabled,
emotionally disturbed, or
requires special medical
care
No Special Needs = 17%
1 Special Need = 56%
2 Special Needs = 20%
3 Special Needs = 4%
4 Special Needs = <1%
5 Special Needs = <1%
6 Special Needs = <1%
Adoptive Parent
Characteristics
Race of Adoptive
Mother
American Indian or
Alaskan Native
0 = No
1 = Yes
1% American Indian or
Alaskan Native
Asian 0 = No
1 = Yes
1% Asian
Black/African
American
0 = No
1 = Yes
23% Black/African
American
Hawaiian/Pacific
Islander
0 = No
1 = Yes
<1% Hawaiian/Pacific
Islander
White
0 = No
1 = Yes
64% White
Unable to
Determine Race
0 = No
1 = Yes
3% Unable to Determine
Hispanic Origin 0 = Not Applicable
1 = Yes
2 = No
3 = Unable to determine
9% Hispanic Origin
Race of Adoptive
Father
American Indian or
Alaskan Native
0 = No
1 = Yes
<1% American Indian or
Alaskan Native
Asian 0 = No
1 = Yes
<1% Asian
Black/African
American
0 = No
1 = Yes
12% Black/African
American
Hawaiian/Pacific
Islander
0 = No
1 = Yes
<1% Hawaiian/Pacific
Islander
White 0 = No
1 = Yes
61% White
Unable to
Determine Race
0 = No
1 = Yes
3% Unable to Determine
Hispanic Origin 0 = Not Applicable
1 = Yes
2 = No
3 = Unable to determine
7% Hispanic Origin
Case Characteristics
Agency/Individual
Placing Child
1 for each
agency/individual (Public
Agency, Private Agency,
Independent Person);
Tribal agency = reference
99% Public Agency
<1% Private Agency
<1% Tribal Agency
<1% Individual Person
Location of Custodial 1 for each location (Within
State, Another Country);
99% Within State
<1% Another Country
Agency/Individual Another State = Reference
<1% Another State
Amount of Adoption
Subsidy*
Indicates the monthly
amount of the adoption
subsidy rounded to the
nearest dollar
Mean = $489
IV-E Assistance
Claimed
Indicates whether the state
claims IV-E reimbursement
0 = No
1 = Yes
30% Not Receiving
Reimbursement
70% Receiving
Reimbursement
* Used logarithm of
subsidy
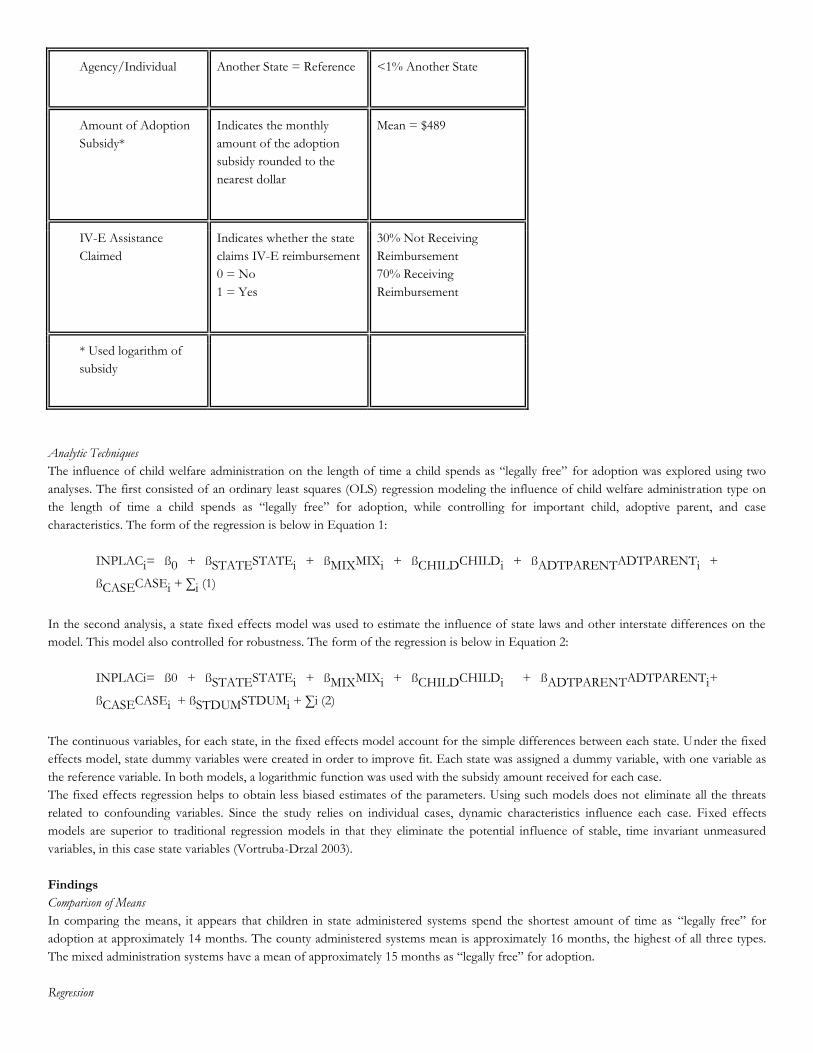
Analytic Techniques
The influence of child welfare administration on the length of time a child spends as “legally free” for adoption was explored using two
analyses. The first consisted of an ordinary least squares (OLS) regression modeling the influence of child welfare administration type on
the length of time a child spends as “legally free” for adoption, while controlling for important child, adoptive parent, and case
characteristics. The form of the regression is below in Equation 1:
INPLACi= ß0 + ßSTATESTATEi + ßMIXMIXi + ßCHILDCHILDi + ßADTPARENTADTPARENTi +
ßCASECASEi + ∑i (1)
In the second analysis, a state fixed effects model was used to estimate the influence of state laws and other interstate differences on the
model. This model also controlled for robustness. The form of the regression is below in Equation 2:
INPLACi= ß0 + ßSTATESTATEi + ßMIXMIXi + ßCHILDCHILDi + ßADTPARENTADTPARENTi+
ßCASECASEi + ßSTDUMSTDUMi + ∑i (2)
The continuous variables, for each state, in the fixed effects model account for the simple differences between each state. Under the fixed
effects model, state dummy variables were created in order to improve fit. Each state was assigned a dummy variable, with one variable as
the reference variable. In both models, a logarithmic function was used with the subsidy amount received for each case.
The fixed effects regression helps to obtain less biased estimates of the parameters. Using such models does not eliminate all the threats
related to confounding variables. Since the study relies on individual cases, dynamic characteristics influence each case. Fixed effects
models are superior to traditional regression models in that they eliminate the potential influence of stable, time invariant unmeasured
variables, in this case state variables (Vortruba-Drzal 2003).
Findings
Comparison of Means
In comparing the means, it appears that children in state administered systems spend the shortest amount of time as “legally free” for
adoption at approximately 14 months. The county administered systems mean is approximately 16 months, the highest of all three types.
The mixed administration systems have a mean of approximately 15 months as “legally free” for adoption.
Regression
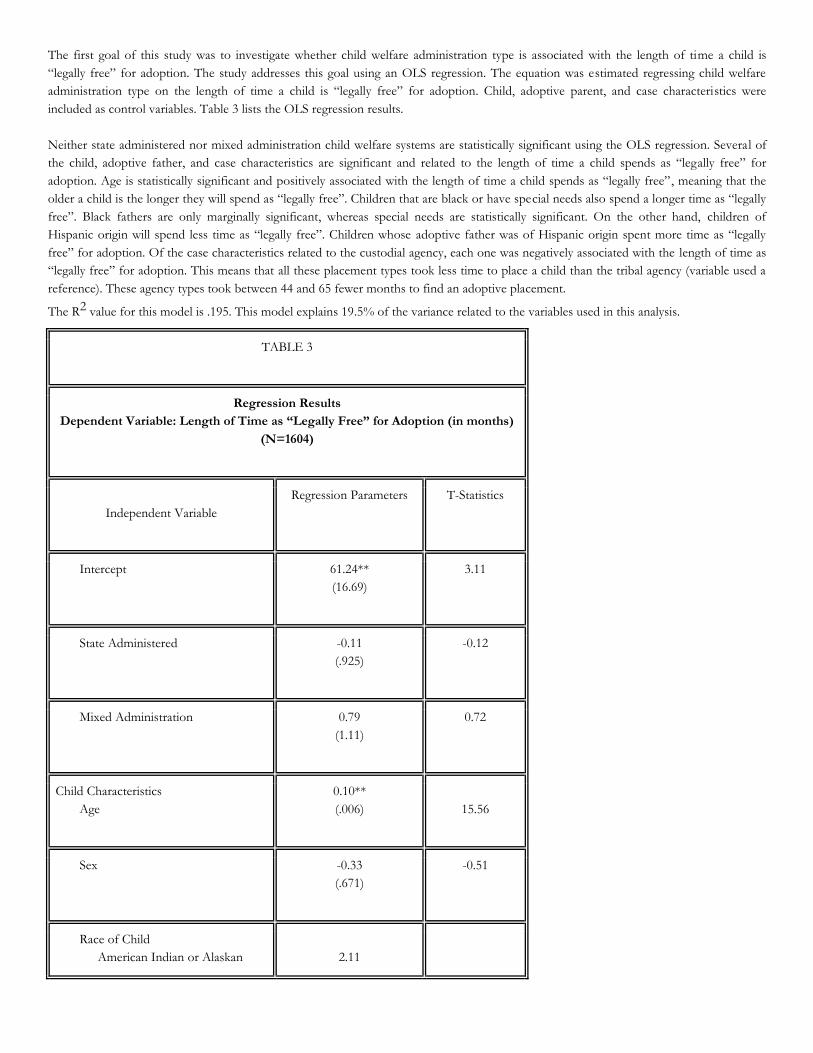
The first goal of this study was to investigate whether child welfare administration type is associated with the length of time a child is
“legally free” for adoption. The study addresses this goal using an OLS regression. The equation was estimated regressing child welfare
administration type on the length of time a child is “legally free” for adoption. Child, adoptive parent, and case characteristics were
included as control variables. Table 3 lists the OLS regression results.
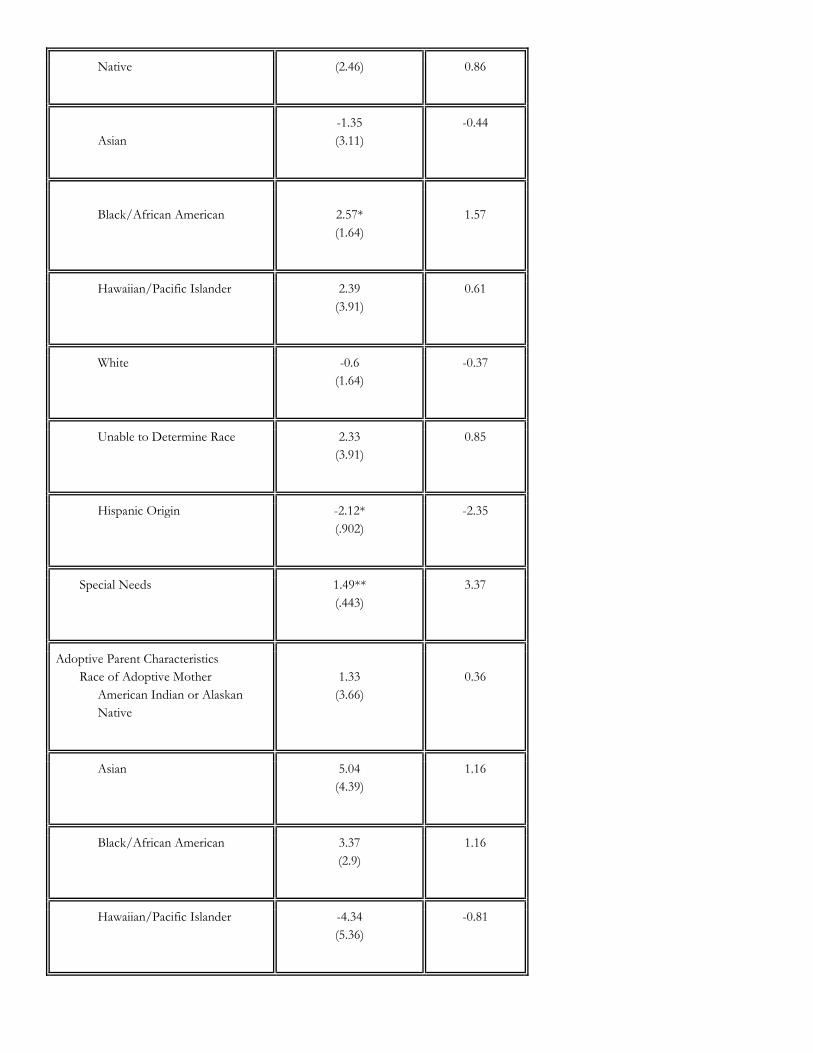
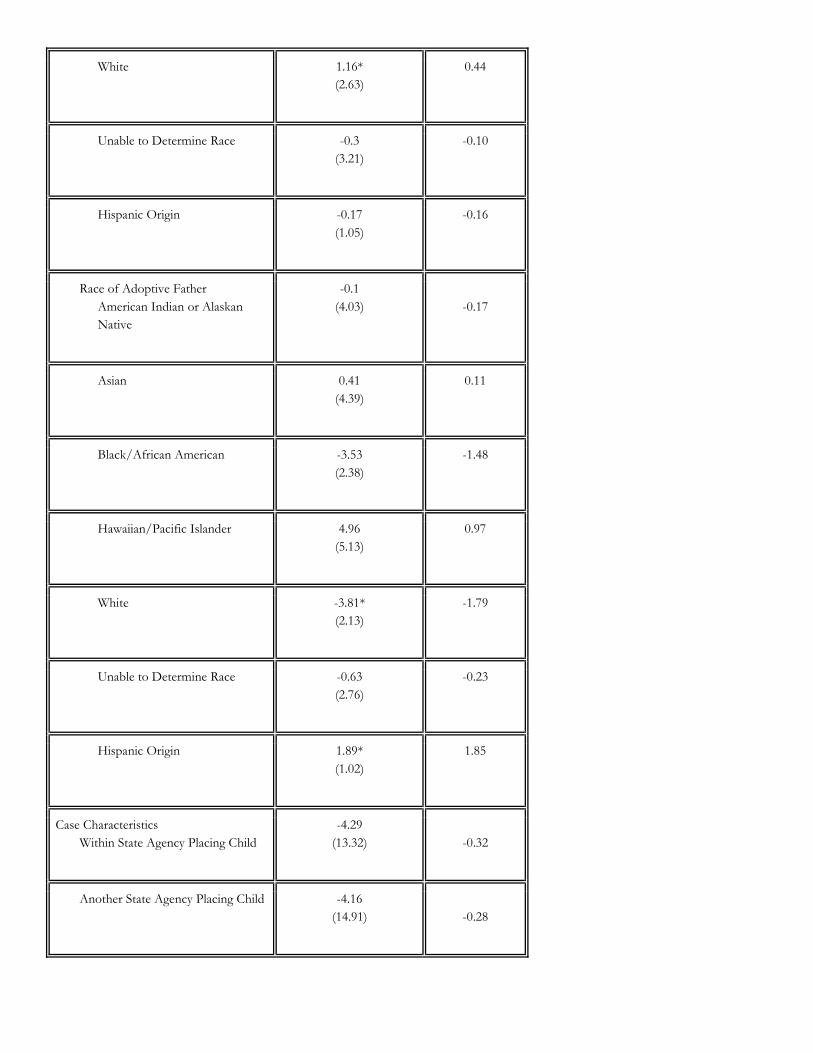
Neither state administered nor mixed administration child welfare systems are statistically significant using the OLS regression. Several of
the child, adoptive father, and case characteristics are significant and related to the length of time a child spends as “legally free” for
adoption. Age is statistically significant and positively associated with the length of time a child spends as “legally free”, meaning that the
older a child is the longer they will spend as “legally free”. Children that are black or have special needs also spend a longer time as “legally
free”. Black fathers are only marginally significant, whereas special needs are statistically significant. On the other hand, children of
Hispanic origin will spend less time as “legally free”. Children whose adoptive father was of Hispanic origin spent more time as “legally
free” for adoption. Of the case characteristics related to the custodial agency, each one was negatively associated with the length of time as
“legally free” for adoption. This means that all these placement types took less time to place a child than the tribal agency (variable used a
reference). These agency types took between 44 and 65 fewer months to find an adoptive placement.
The R2 value for this model is .195. This model explains 19.5% of the variance related to the variables used in this analysis.
TABLE 3
Regression Results
Dependent Variable: Length of Time as “Legally Free” for Adoption (in months)
(N=1604)
Independent Variable
Regression Parameters T-Statistics
Intercept 61.24**
(16.69)
3.11
State Administered -0.11
(.925)
-0.12
Mixed Administration 0.79
(1.11)
0.72
Child Characteristics
Age
0.10**
(.006)
15.56
Sex -0.33
(.671)
-0.51
Race of Child
American Indian or Alaskan
2.11
Native (2.46) 0.86
Asian
-1.35
(3.11)
-0.44
Black/African American
2.57*
(1.64)
1.57
Hawaiian/Pacific Islander 2.39
(3.91)
0.61
White -0.6
(1.64)
-0.37
Unable to Determine Race 2.33
(3.91)
0.85
Hispanic Origin -2.12*
(.902)
-2.35
Special Needs 1.49**
(.443)
3.37
Adoptive Parent Characteristics
Race of Adoptive Mother
American Indian or Alaskan
Native
1.33
(3.66)
0.36
Asian 5.04
(4.39)
1.16
Black/African American 3.37
(2.9)
1.16
Hawaiian/Pacific Islander -4.34
(5.36)
-0.81
White 1.16*
(2.63)
0.44
Unable to Determine Race -0.3
(3.21)
-0.10
Hispanic Origin -0.17
(1.05)
-0.16
Race of Adoptive Father
American Indian or Alaskan
Native
-0.1
(4.03)
-0.17
Asian 0.41
(4.39)
0.11
Black/African American -3.53
(2.38)
-1.48
Hawaiian/Pacific Islander 4.96
(5.13)
0.97
White -3.81*
(2.13)
-1.79
Unable to Determine Race -0.63
(2.76)
-0.23
Hispanic Origin 1.89*
(1.02)
1.85
Case Characteristics
Within State Agency Placing Child
-4.29
(13.32)
-0.32
Another State Agency Placing Child -4.16
(14.91)
-0.28
Public Custodial Agency -54.95**
(14.02)
-3.92
Private Custodial Agency
-44.90**
(14.35)
-3.13
Custodial Individual -67.74**
(19.35)
-3.50
Log Amount of Adoption Subsidy 0.68
(.486)
1.41
IV-E Assistance Claimed 0.17
(.846)
0.21
R2 .195
* p < .05. ** p < .01.
(Number in parentheses is the standard error)
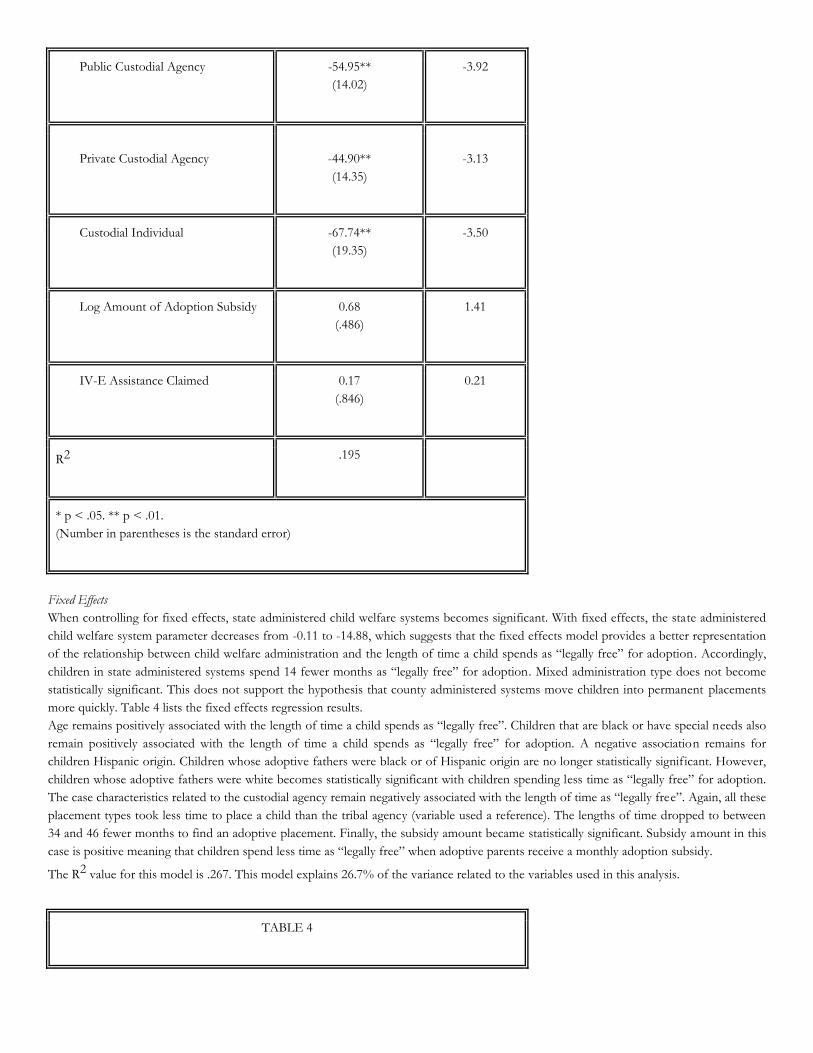
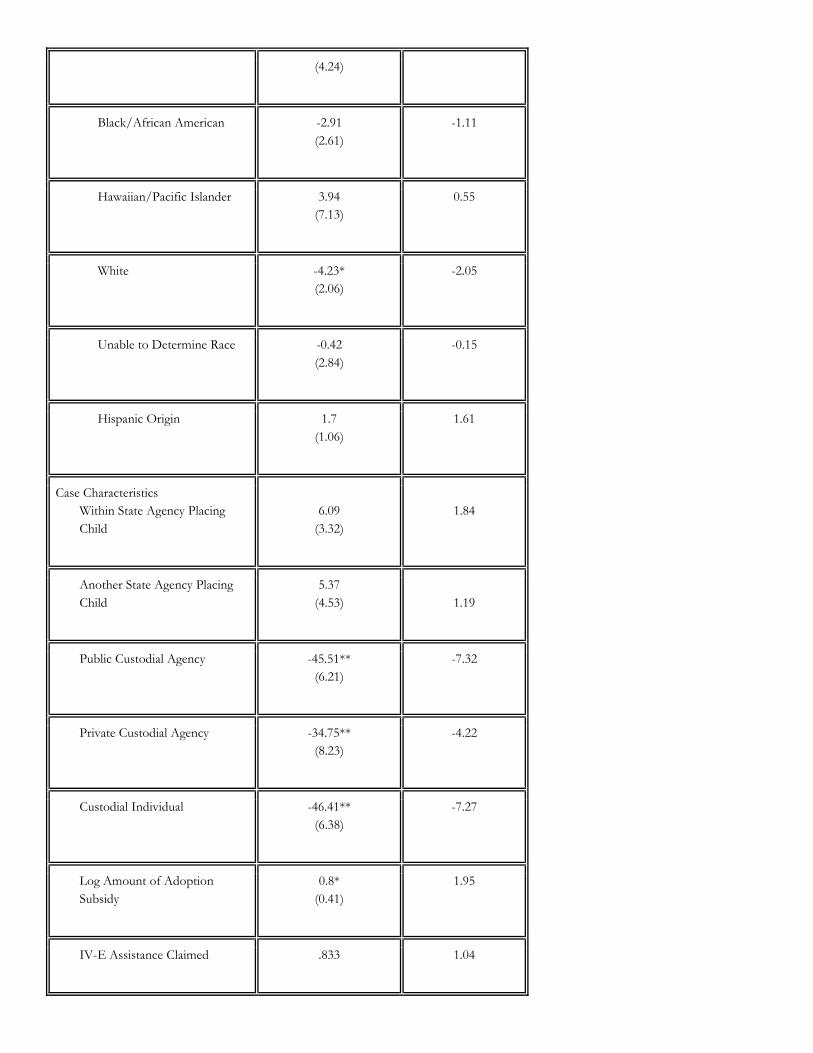
Fixed Effects
When controlling for fixed effects, state administered child welfare systems becomes significant. With fixed effects, the state administered
child welfare system parameter decreases from -0.11 to -14.88, which suggests that the fixed effects model provides a better representation
of the relationship between child welfare administration and the length of time a child spends as “legally free” for adoption . Accordingly,
children in state administered systems spend 14 fewer months as “legally free” for adoption. Mixed administration type does not become
statistically significant. This does not support the hypothesis that county administered systems move children into permanent placements
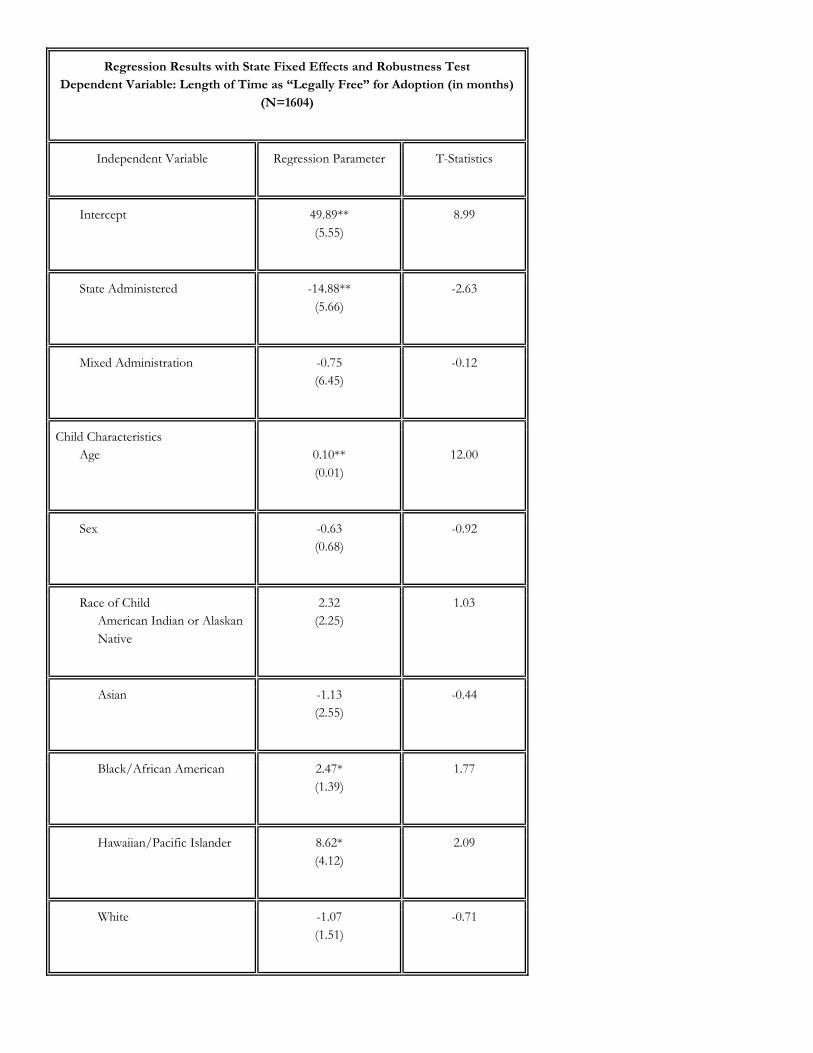
more quickly. Table 4 lists the fixed effects regression results.
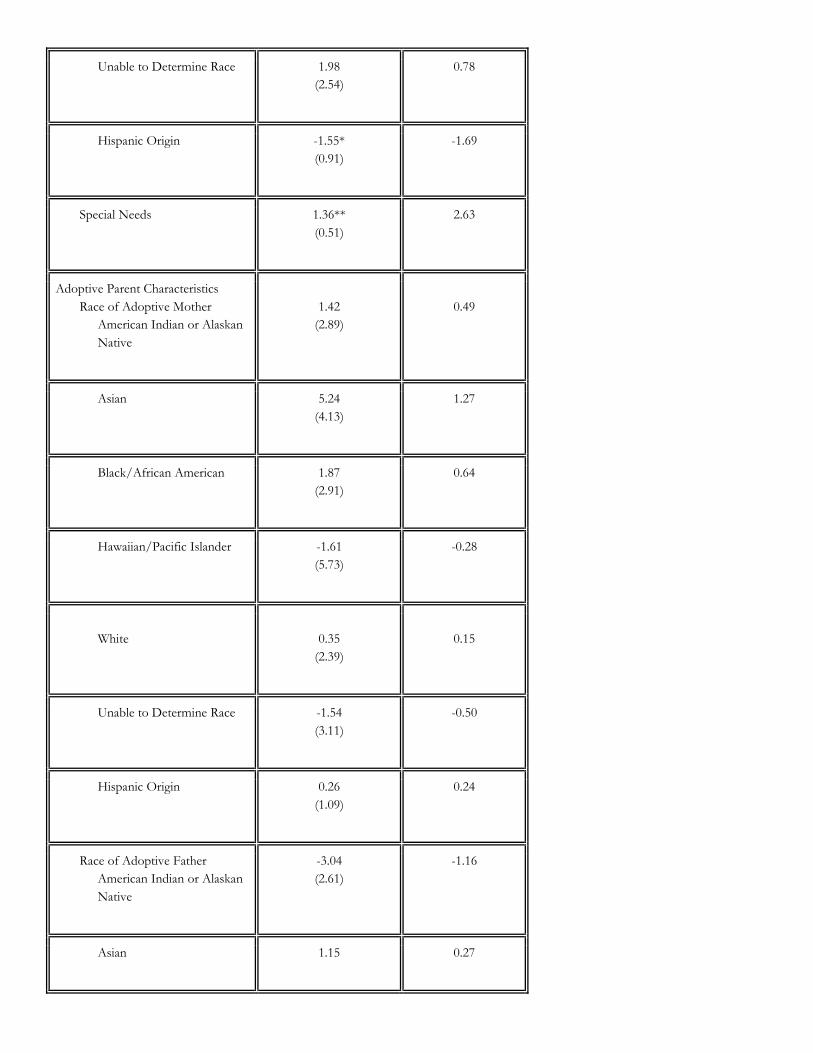
Age remains positively associated with the length of time a child spends as “legally free”. Children that are black or have special needs also
remain positively associated with the length of time a child spends as “legally free” for adoption. A negative association remains for
children Hispanic origin. Children whose adoptive fathers were black or of Hispanic origin are no longer statistically significant. However,
children whose adoptive fathers were white becomes statistically significant with children spending less time as “legally free” for adoption.
The case characteristics related to the custodial agency remain negatively associated with the length of time as “legally free”. Again, all these
placement types took less time to place a child than the tribal agency (variable used a reference). The lengths of time dropped to between
34 and 46 fewer months to find an adoptive placement. Finally, the subsidy amount became statistically significant. Subsidy amount in this
case is positive meaning that children spend less time as “legally free” when adoptive parents receive a monthly adoption subsidy.
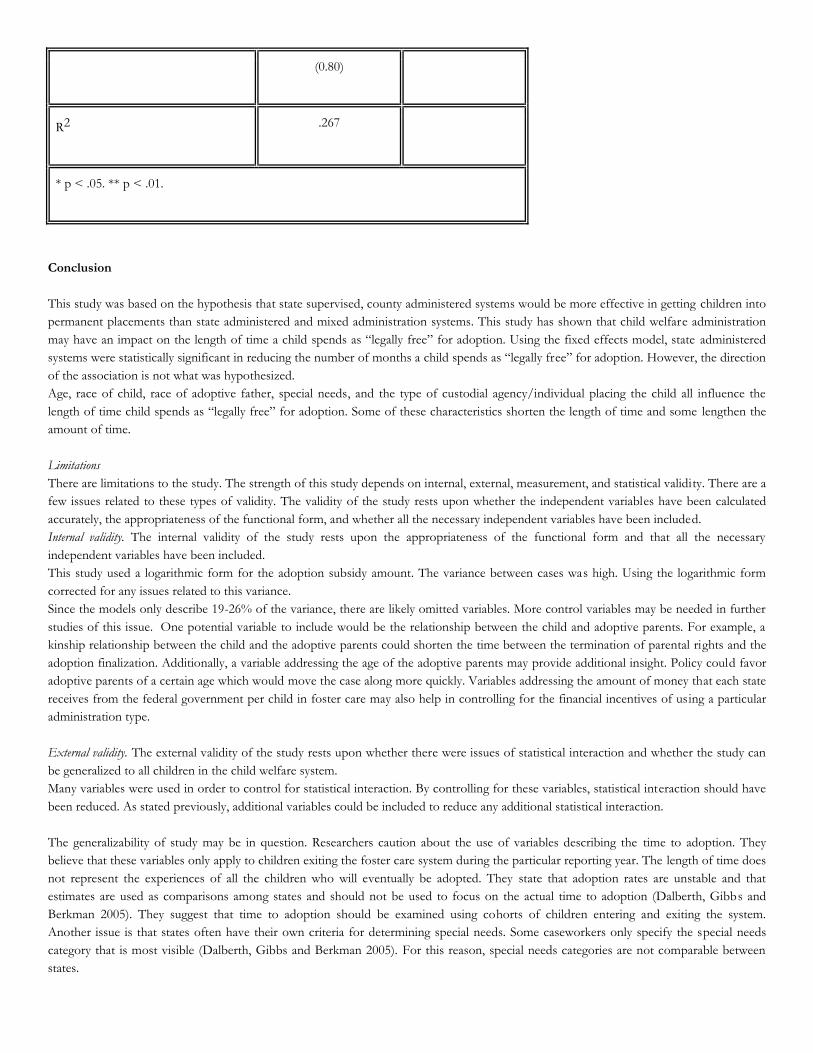
The R2 value for this model is .267. This model explains 26.7% of the variance related to the variables used in this analysis.
TABLE 4
Regression Results with State Fixed Effects and Robustness Test
Dependent Variable: Length of Time as “Legally Free” for Adoption (in months)
(N=1604)
Independent Variable Regression Parameter T-Statistics
Intercept 49.89**
(5.55)
8.99
State Administered -14.88**
(5.66)
-2.63
Mixed Administration -0.75
(6.45)
-0.12
Child Characteristics
Age
0.10**
(0.01)
12.00
Sex -0.63
(0.68)
-0.92
Race of Child
American Indian or Alaskan
Native
2.32
(2.25)
1.03
Asian -1.13
(2.55)
-0.44
Black/African American 2.47*
(1.39)
1.77
Hawaiian/Pacific Islander 8.62*
(4.12)
2.09
White -1.07
(1.51)
-0.71
Unable to Determine Race 1.98
(2.54)
0.78
Hispanic Origin -1.55*
(0.91)
-1.69
Special Needs 1.36**
(0.51)
2.63
Adoptive Parent Characteristics
Race of Adoptive Mother
American Indian or Alaskan
Native
1.42
(2.89)
0.49
Asian 5.24
(4.13)
1.27
Black/African American 1.87
(2.91)
0.64
Hawaiian/Pacific Islander -1.61
(5.73)
-0.28
White
0.35
(2.39)
0.15
Unable to Determine Race -1.54
(3.11)
-0.50
Hispanic Origin 0.26
(1.09)
0.24
Race of Adoptive Father
American Indian or Alaskan
Native
-3.04
(2.61)
-1.16
Asian 1.15 0.27
(4.24)
Black/African American -2.91
(2.61)
-1.11
Hawaiian/Pacific Islander 3.94
(7.13)
0.55
White -4.23*
(2.06)
-2.05
Unable to Determine Race -0.42
(2.84)
-0.15
Hispanic Origin 1.7
(1.06)
1.61
Case Characteristics
Within State Agency Placing
Child
6.09
(3.32)
1.84
Another State Agency Placing
Child
5.37
(4.53)
1.19
Public Custodial Agency -45.51**
(6.21)
-7.32
Private Custodial Agency -34.75**
(8.23)
-4.22
Custodial Individual -46.41**
(6.38)
-7.27
Log Amount of Adoption
Subsidy
0.8*
(0.41)
1.95
IV-E Assistance Claimed .833 1.04
(0.80)
R2 .267
* p < .05. ** p < .01.
Conclusion
This study was based on the hypothesis that state supervised, county administered systems would be more effective in getting children into
permanent placements than state administered and mixed administration systems. This study has shown that child welfare administration
may have an impact on the length of time a child spends as “legally free” for adoption. Using the fixed effects model, state administered
systems were statistically significant in reducing the number of months a child spends as “legally free” for adoption. However, the direction
of the association is not what was hypothesized.
Age, race of child, race of adoptive father, special needs, and the type of custodial agency/individual placing the child all influence the
length of time child spends as “legally free” for adoption. Some of these characteristics shorten the length of time and some lengthen the
amount of time.
Limitations
There are limitations to the study. The strength of this study depends on internal, external, measurement, and statistical validity. There are a
few issues related to these types of validity. The validity of the study rests upon whether the independent variables have been calculated
accurately, the appropriateness of the functional form, and whether all the necessary independent variables have been included.
Internal validity. The internal validity of the study rests upon the appropriateness of the functional form and that all the necessary
independent variables have been included.
This study used a logarithmic form for the adoption subsidy amount. The variance between cases was high. Using the logarithmic form
corrected for any issues related to this variance.
Since the models only describe 19-26% of the variance, there are likely omitted variables. More control variables may be needed in further
studies of this issue. One potential variable to include would be the relationship between the child and adoptive parents. For example, a
kinship relationship between the child and the adoptive parents could shorten the time between the termination of parental rights and the
adoption finalization. Additionally, a variable addressing the age of the adoptive parents may provide additional insight. Policy could favor
adoptive parents of a certain age which would move the case along more quickly. Variables addressing the amount of money that each state
receives from the federal government per child in foster care may also help in controlling for the financial incentives of using a particular
administration type.
External validity. The external validity of the study rests upon whether there were issues of statistical interaction and whether the study can
be generalized to all children in the child welfare system.
Many variables were used in order to control for statistical interaction. By controlling for these variables, statistical interaction should have
been reduced. As stated previously, additional variables could be included to reduce any additional statistical interaction.
The generalizability of study may be in question. Researchers caution about the use of variables describing the time to adoption. They
believe that these variables only apply to children exiting the foster care system during the particular reporting year. The length of time does
not represent the experiences of all the children who will eventually be adopted. They state that adoption rates are unstable and that
estimates are used as comparisons among states and should not be used to focus on the actual time to adoption (Dalberth, Gibbs and
Berkman 2005). They suggest that time to adoption should be examined using cohorts of children entering and exiting the system.
Another issue is that states often have their own criteria for determining special needs. Some caseworkers only specify the special needs
category that is most visible (Dalberth, Gibbs and Berkman 2005). For this reason, special needs categories are not comparable between
states.
Child welfare experts also question the comparability between states in terms of all the categories in AFCARS. State child welfare databases
are notoriously incomplete. Many states lack training in how to enter information and which field how to enter information and within
which field certain information should be entered. Through the years, this issue has been improved. However, much work still needs to be
done.
Further research could address many of these issues by following cohorts of children across multiple years through the foster care system.
This information is readily available from the AFCARS datasets.
Measurement validity and reliability. The measurement validity focuses on whether the independent variables have been calculated accurately.
The issues related to the time to adoption are also important from a measurement validity and reliability standpoint. Specifically, random
error may be related to the record keeping of states and providers and systematic errors may be related to potential underestimates related
to care. There is also a potential for measurement error related to the calculation of the length of time in placement and the ages of the
children.
This study also used the type of administration based upon more than one source. States change administration types occasionally. For
example if a state has trouble with a certain county, they may become a mixed administration system. This can fluctuate from year to year.
Accordingly, the validity of the administration type may be in question.
Statistical validity. The statistical validity of the study focuses on the accuracy with which the random effects can be separated from the
systematic effects. The size of the sample should also bolster the validity of the study. The number of cases, 1,604, is a large enough
number to control against random error.
Another source of randomness that would influence the statistical validity of the study is the randomness of human behavior. Choosing to
adopt a child is very specific to each human being. Additionally, the choice to adopt a specific child would be difficult to quantify. Human
behavior in this case could add to random error.
Significance
This study is significant in that federal, state, and local governments are tasked with improving outcomes for children in the child welfare
system. Child welfare policy practice is trending toward conducting more program evaluations; specifically, experts and analysts would like
to discover which programs produce the best outcomes for children. This study attempts to figure out which program administration type
keeps children “legally free” for the shortest time.
In addition to improving outcomes for children, federal, state, and local government are concerned by the amount of money needed to
support children in the child welfare system. The federal government spends a great deal of money on providing services related to foster
care and adoption. Estimates for 2006 total approximately $7.5 million, which includes only federal foster care and adoption assistance
funds (Carasso, Reynolds and Steuerle 2008). Legislation passed in fall 2008 which may increase the outlays required of the federal
government. In turn, states must fund those services not funded by the federal government. The outlays for states are enormous.
This study shows that using state administered child welfare systems may reduce the length of time that children spend as “legally free” for
adoption. In many other policy areas, education for example, decentralized systems seem to work better. This study does not reinforce that
hypothesis. Further research should examine child welfare decentralization in more detail. The current study may have lacked the policy
variables necessary to delve deeper into the issue. Finding the best administration type could potentially help children move into stable,
permanent placements that in turn would contribute to future positive outcomes. Additionally, when children spend less time in foster
care, a more expensive type of care, government spends less money on child welfare services. This money can be used for more
preventative services, which can potentially keep children out of the child welfare system and prevent parents from mistreating their
children.
Furthermore, the study shows that some of the control variables have policy implications. More must be done to address the barriers to
adoption, especially in cases where the child is older or has special needs. More research should also address why adoptive fathers of a
certain race have an effect on the length of time a child is “legally free” for adoption. Finally, the length of time that a tribal agency takes to
place children seems to be counter to the timelines set forth in ASFA. Children should not remain “legally free” for adoption for 45-64
months. These barriers are detrimental to the well-being of children. This vulnerable population deserves to have the best programs
available to support positive developmental outcomes and future success.
Removal of cases resulted from lack of gender, birth date, and date of parental rights termination.
AFCARS data used in this publication were made available by the National Data Archive on Child Abuse and Neglect, Cornell University,
Ithaca, NY, and have been used with permission. AFCARS data were originally collected by the Children’s Bureau. The Children’s Bureau,
Administration on Children, Youth and Families, Administration for Children and Families, U.S. Department of Health and Human
Services, support AFCARS. The collector of the original data, the funder, the Archive, Cornell University and their agents or employees
bear no responsibility for the analyses or interpretations presented here.
WORKS CITED
42 U.S.C. §1320a-2a. Pub.L. 103-432 Title II, §203(a).
http://www.youthlaw.org/fileadmin/ncyl/youthlaw/publications/yln/2003/issue_1/03_yln_1_grimm_cfs_reviews_1.pdf.
“42 U.S.C. §622(f)(1).”
“45 CFR 1355.34 (c) (1)-(7).”
Carasso, A., G. Reynolds, and C.E Steuerle (2008). How Much Does the Federal Government Spend to Promote Economic Mobility and For Whom.
Washington: Economic Mobility Project: Pew Charitable Trusts.
Dalberth, B, D Gibbs, and N. Berkman (2005). Understanding adoption subsidies: An analysis of AFCARS data. Washington: RTI International.
Grimm, B, and I. Hurtubise. (2003). “Child and family service reviews: An ongoing series. Part I: A background to the review process.”
Youth Law News 24, no. 4.
Jones Harden, Ph.D., B. (2004). “Safety and Stability for Foster Children: A Developmental Perspective.” The Future of Children 14, no. 1.
Mitchell, L. B., Barth, R. P., Green, R., Wall, A., Biemer, P., Berrick, J. D., et al. (2005). “Child welfare reform in the United States: Findings
from a local agency survey.” Child Welfare: 5-24.
National Data Archive on Child Abuse and Neglect. (2002). Adoption and Foster Care Analysis Reporting System (AFACRS) User Guide and
Codebook for Fiscal Years 2000 to Present. Ithaca, New York, October.
Stein, T.J. Child Welfare and the Law. (1998). Washington: Child Welfare League of America Press.
U.S. Children’s Bureau. (2008). Trends in Foster Care and Adoption- FY 2002- FY 2007.
http://www.acf.hhs.gov/programs/cb/stats_research/afcars/trends.htm).
Vortruba-Drzal, E. (2003). “Income changes and cognitive stimulation in young children’s home learning environments.” Journal of Marriage
and Family: 341-355.
Wells, R. (2006). “Managing child welfare agencies: What do we know about what works?” Children and Youth Services Review 28: 1186-1194.
Related Documents