2017 Child Maltreatment U.S. Department of Health & Human Services Administration for Children and Families Administration on Children, Youth and Families Y E A R O F R E P O R T I N G 25 th Y E A R O F R E P O R T I N G 28 th

Welcome message from author
This document is posted to help you gain knowledge. Please leave a comment to let me know what you think about it! Share it to your friends and learn new things together.
Transcript
2017Child Maltreatment
U.S. Department of Health & Human ServicesAdministration for Children and FamiliesAdministration on Children, Youth and Families
YEAR
OF REPORTING25th
YEAR
OF REPORTING28th
This report was prepared by the Children’s Bureau (Administration on Children, Youth and Families, Administration for Children and Families) of the U.S. Department of Health and Human Services.
Public Domain Notice Material contained in this publication is in the public domain and may be reproduced, fully or partially, without permission of the federal government.
Electronic Access This report is available on the Children’s Bureau website at https://www.acf.hhs.gov/cb/research-data-technology/statistics-research/child-maltreatment.
Questions and More InformationIf you have questions or require additional information about this report, please contact the Child Welfare Information Gateway at [email protected] or 1–800–394–3366. If you have questions about a specific state’s data or policies, contact information is provided for each state in Appendix D, State Commentary.
Data SetsRestricted use files of the NCANDS data are archived at the National Data Archive on Child Abuse and Neglect (NDACAN) at Cornell University. Researchers who are interested in these data for statistical analyses may contact NDACAN by phone at 607–255–7799, by email at [email protected], or on the Internet at https://www.ndacan.cornell.edu/. NDACAN serves as the repository for the NCANDS data sets, but is not the author of the Child Maltreatment report.
Recommended Citation U.S. Department of Health & Human Services, Administration for Children and Families, Administration on Children, Youth and Families, Children’s Bureau. (2019). Child Maltreatment 2017. Available from https://www.acf.hhs.gov/cb/research-data-technology/ statistics-research/child-maltreatment.
Federal ContactsElaine Voces Stedt, MSWDirectorOffice on Child Abuse and Neglect Children’s Bureau/ACYF/ACF/HHS Mary E. Switzer Building, 330 C Street SWWashington, DC 20201 [email protected]
2017Child Maltreatment
Letter iiChild Maltreatment 2017
Letter from the Associate Commissioner:
Child Maltreatment 2017 is the 28th edition of the annual Child Maltreatment report series. States provide the data for this report through the National Child Abuse and Neglect Data System (NCANDS). NCANDS was established in 1988 as a voluntary national data collection and analysis program to make available state child abuse and neglect information. Data have been collected every year since 1991, and are collected from child welfare agencies in the 50 states, the Commonwealth of Puerto Rico, and the District of Columbia. Key findings in this report include:
■ The national rounded number of children who received a child protective servicesinvestigation response or alternative response increased 10.0 percent from 2013(3,184,000) to 2017 (3,501,000).
■ The number and rate of victims have fluctuated during the past 5 years. Comparingthe national rounded number of victims from 2013 (656,000) to the national roundednumber of victims in 2017 (674,000) shows an increase of 2.7 percent.
■ The 2017 data show three-quarters (74.9%) of victims are neglected, 18.3 percent arephysically abused, and 8.6 percent are sexually abused. These victims may suffer asingle maltreatment type or a combination of two or more maltreatment types.
■ For 2017, an estimated 1,720 children died of abuse and neglect at a rate of 2.32 per100,000 children in the national population.1
The Child Maltreatment report series is an important resource relied upon by thousands of researchers, practitioners, and advocates throughout the world. The report is available from our website at https://www.acf.hhs.gov/cb/research-data-technology/statistics-research/ child-maltreatment.
NCANDS would not be possible without the time, effort, and dedication of state and local child welfare, information technology, and related agency personnel working together on behalf of children and families. We gratefully acknowledge the efforts of all involved to make resources like this report possible and will continue to do everything we can to promote the safety and well-being of our nation’s children.
Sincerely,/s/ Jerry Milner Associate Commissioner Children’s Bureau
ADMINISTRATION FOR CHILDREN AND FAMILIESAdministration on Children, Youth and Families330 C Street, SW, Washington, D.C. 20201
DEPARTMENT OF HEALTH & HUMAN SERVICES
1 If fewer than 52 states reported data, the national estimate of child fatalities is calculated by multiplying the national fatality rate by the child population of all 52 states and dividing by 100,000. The estimate is rounded to the nearest 10. For 2013-2014, 51 states reported data; for 2015-2016 49 states reported data; for 2017 50 states reported data.
Child Maltreatment 2017
Acknowledgements iii
Acknowledgements
The Administration on Children, Youth and Families (ACYF) strives to ensure the well-being of our Nation’s children through many programs and activities. One such activity is the National Child Abuse and Neglect Data System (NCANDS) of the Children’s Bureau.
National and state statistics about child maltreatment are derived from the data collected by child protective services agencies and reported to NCANDS. The data are analyzed, disseminated, and released in an annual report. Child Maltreatment 2017 marks the 28th edition of this report. The administration hopes that the report continues to serve as a valuable resource for policymakers, child welfare practitio-ners, researchers, and other concerned citizens.
The 2017 national statistics were based upon receiving case-level and aggregate data from the 50 states, the Commonwealth of Puerto Rico, and the District of Columbia.
ACYF wishes to thank the many people who made this publication possible. The Children’s Bureau has been fortunate to collaborate with informed and committed state personnel who work hard to provide comprehensive data, which reflect the work of their agencies.
ACYF gratefully acknowledges the priorities that were set by state and local agen-cies to submit these data to the Children’s Bureau, and thanks the caseworkers and supervisors who contribute to and use their state’s information system. The time and effort dedicated by these and other individuals are the foundation of this successful federal-state partnership.
Child Maltreatment 2017 Contents iv
Contents
Letter from the AssociAte commissioner ii
AcknowLedgements iii
summAry viii
chApter 1: Introduction 1 Background of NCANDS 1Future Reporting to NCANDS 2
2Annual Data Collection Process NCANDS as a Resource 3Structure of the Report 4
chApter 2: Reports 6Screening 6Report Sources 8CPS Response Time 9CPS Workforce and Caseload 9Exhibit and Table Notes 10
chApter 3: Children 16Alternative Response 17Unique and Duplicate Counts 18Children Who Received an Investigation or Alternative Response 18Children Who Received an Investigation or Alternative Response by Disposition 19Children by Age Group and Report Source 19 Number of Child Victims 20Child Victim Demographics 21Maltreatment Types 22Risk Factors 23Caregivers Risk Factors 23Special Focus on Victims With Alcohol and Drug Abuse Child Risk Factors 24Perpetrator Relationship 25Exhibit and Table Notes 26
chApter 4: Fatalities 55Number of Child Fatalities 55Child Fatality Demographics 56Maltreatment Types 58Risk Factors 58Perpetrator Relationship 58Prior CPS Contact 59Exhibit and Table Notes 59
Child Maltreatment 2017 Contents v
chApter 5: Perpetrators 66Number of Perpetrators 66 Perpetrator Demographics 66 Perpetrator Relationship 67 Exhibit and Table Notes 68
chApter 6: Services 78Prevention Services 78Postresponse Services 80History of Receiving Services 81 Part C of the Individuals With Disabilities Education Act (IDEA) 82 Exhibit and Table Notes 82
Appendix A: CAPTA Data Items 97
Appendix B: Glossary 99
Appendix c: State Characteristics 116
Appendix d: State Commentary 124
Child Maltreatment 2017
Contents vi
ExhibitsExhibit S–1 Summary of Child Maltreatment Rates per 1,000 Children, 2013–2017 xiExhibit S–2 Statistics at a Glance, 2017 xiiExhibit 2–A Screened-in Referral Rates, 2013–2017 7Exhibit 2–B Screened-out Referral Rates, 2013–2017 7Exhibit 2–C Total Referral Rates, 2013–2017 8Exhibit 2–D Report Sources, 2017 9Exhibit 3–A Child Disposition Rates, 2013–2017 18Exhibit 3–B Children by Number of Screened-in Referrals, 2017 19Exhibit 3–C Children Who Received an Investigation or Alternative Response by
Disposition, 2017 19Exhibit 3–D Children by Age Group and Selected Report Sources, 2017 20Exhibit 3–E Child Victimization Rates, 2013–2017 20Exhibit 3–F Nonfatal Victims by Prior CPS Contact, 2017 21Exhibit 3–G Victims by Age, 2017 22Exhibit 3–H Victims <1 by Selected Child Risk Factors and Report Source, 2017 25Exhibit 4–A Child Fatality Rates per 100,000 Children, 2013–2017 56Exhibit 4–B Child Fatalities by Age, 2017 57Exhibit 4–C Child Fatalities by Sex, 2017 57Exhibit 4–D Child Fatalities by Race and Ethnicity, 2017 57Exhibit 4–E Maltreatment Types of Child Fatalities, 2017 58Exhibit 4–F Child Fatalities With Selected Caregiver Risk Factors, 2017 58Exhibit 4–G Child Fatalities by Number of Prior CPS Contacts, 2017 59Exhibit 5–A Perpetrators by Number of Reports, 2017 66Exhibit 5–B Perpetrators by Number of Victims, 2017 66Exhibit 5–C Perpetrators by Age, 2017 67Exhibit 5–D Perpetrators by Race and Ethnicity, 2017 67
TablesTable 2–1 Screened-in and Screened-out Referrals, 2017 12Table 2–2 Average Response Time in Hours, 2013–2017 13Table 2–3 Child Protective Services Workforce, 2017 14Table 2–4 Child Protective Services Caseload, 2017 15Table 3–1 Children Who Received an Investigation or Alternative Response, 2013–2017 30Table 3–2 Children Who Received an Investigation or Alternative Response
by Disposition, 2017 32Table 3–3 Children of Known Ages by Age Group and Report Source, 2017 34Table 3–4 Child Victims, 2013–2017 35Table 3–5 First-Time Victims, 2013–2017 37Table 3–6 Victims by Age, 2017 39Table 3–7 Victims by Sex, 2017 43Table 3–8 Victims by Race and Ethnicity, 2017 44Table 3–9 Maltreatment Types of Victims, 2017 46Table 3–10 Maltreatment Type Combinations, 2017 48Table 3–11 Victims With Alcohol Abuse Caregiver Risk Factor, 2015–2017 49Table 3–12 Victims With Drug Abuse Caregiver Risk Factor, 2015–2017 50Table 3–13 Children With Financial Problem Caregiver Risk Factor, 2017 51Table 3–14 Children With Domestic Violence Caregiver Risk Factor, 2017 52
Contents viiChild Maltreatment 2017
Table 3–15 Victims <1 Year With Alcohol Abuse Child Risk Factor by Report Source, 2013–2017 53Table 3–16 Victims <1 Year With Drug Abuse Child Risk Factor by
Report Source, 2013–2017 53Table 3–17 Victims by Relationship to Their Perpetrators, 2017 54Table 4–1 Child Fatalities by Submission Type, 2017 61Table 4–2 Child Fatalities, 2013–2017 62Table 4–3 Child Fatalities by Age, 2017 63Table 4–4 Child Fatalities by Relationship to Their Perpetrators, 2017 63Table 4–5 Child Fatalities Who Received Family Preservation Services
Within the Previous 5 Years, 2017 64Table 4–6 Child Fatalities Who Were Reunited With Their Families
Within the Previous 5 Years, 2017 65Table 5–1 Perpetrators, 2013–2017 70Table 5–2 Perpetrators by Age, 2017 71Table 5–3 Perpetrators by Sex, 2017 73Table 5–4 Perpetrators by Race and Ethnicity, 2017 74Table 5–5 Perpetrators by Relationship to Their Victims, 2017 76Table 6–1 Children Who Received Prevention Services by Funding Source, 2017 85Table 6–2 Children Who Received Postresponse Services, 2017 88Table 6–3 Average Number of Days to Initiation of Services, 2017 89Table 6–4 Children Who Received Foster Care Postresponse Services and Who had
a Removal Date on or After the Report Date, 2017 90Table 6–5 Victims With Court Action, 2017 91Table 6–6 Victims With Court-Appointed Representatives, 2017 92Table 6–7 Victims Who Received Family Preservation Services Within the
Previous 5 Years, 2017 93Table 6–8 Victims Who Were Reunited With Their Families Within the Previous
5 Years, 2017 94Table 6–9 IDEA: Victims Who Were Eligible and Victims Who Were Referred
to Part C Agencies, 2017 95Table C–1 State Administrative Structure, Level of Evidence, and Data Files
Submitted, 2017 118Table C–2 Child Population, 2013–2017 119Table C–3 Child Population Demographics, 2017 120Table C–4 Adult Population by Age Group, 2017 123
Summary viiiChild Maltreatment 2017
Summary
Overview All 50 states, the District of Columbia, and the U.S. Territories have child abuse and neglect reporting laws that mandate certain professionals and institutions refer suspected maltreatment to a child protective services (CPS) agency.
Each state has its own definitions of child abuse and neglect that are based on standards set by federal law. Federal legislation provides a foundation for states by identifying a set of acts or behaviors that define child abuse and neglect. The Child Abuse Prevention and Treatment Act (CAPTA), (P.L. 100–294), as amended by the CAPTA Reauthorization Act of 2010 (P.L. 111–320), retained the existing definition of child abuse and neglect as, at a minimum:
Any recent act or failure to act on the part of a parent or caretaker which results in death, serious physical or emotional harm, sexual abuse or exploitation; or an act or failure to act, which presents an imminent risk of serious harm.
Most states recognize four major types of maltreatment: neglect, physical abuse, psychological maltreatment, and sexual abuse. Although any of the forms of child maltreatment may be found separately, they can occur in combination.
The following pages provide a summary of key information from this report. The information is provided in a question and answer format as the Children’s Bureau is anticipating the most common questions for each chapter of the report. Please refer to the individual chapters for detailed information about each topic and the relevant data. Definitions of terms also are provided in Appendix B, Glossary.
What is the National Child Abuse and Neglect Data System (NCANDS)? NCANDS is a federally sponsored effort that collects and analyzes annual data on child abuse and neglect. The 1988 CAPTA amendments directed the U.S. Department of Health and Human Services to establish a national data collection and analysis program. The data are collected and analyzed by the Children’s Bureau in the Administration on Children, Youth and Families, Administration for Children and Families, U.S. Department of Health and Human Services.
Summary ixChild Maltreatment 2017
The data are submitted voluntarily by the 50 states, the District of Columbia, and the Commonwealth of Puerto Rico. The first report from NCANDS was based on data for 1990. This report for federal fiscal year (FFY) 2017 data is the 28th issuance of this annual publication. (See chapter 1.)
How are the data used? NCANDS data are used for the Child Maltreatment report series. In addition, the data are a critical source of information for many publications, reports, and activities of the federal government and other groups. For example, NCANDS data are used in the annual publication, Child Welfare Outcomes: Report to Congress. More information about these reports and programs are available on the Children’s Bureau website at https://www.acf.hhs.gov/cb. (See chapter 1.)
What data are collected? Once an allegation (called a referral) of abuse and neglect is received by a CPS agency, it is either screened in for a response by CPS or it is screened out. A screened-in referral is called a report. CPS agencies respond to all reports. In most states, the majority of reports receive investigations, which determines if a child was maltreated or is at-risk of maltreatment and establishes whether an intervention is needed. Some reports receive alternative responses, which focus primarily upon the needs of the family and do not determine if a child was maltreated or is at risk of maltreatment.
NCANDS collects case-level data on all children who received a CPS agency response in the form of an investigation response or an alternative response. Case-level data (meaning individual child record data) include information about the characteristics of screened-in referrals (reports) of abuse and neglect that are made to CPS agencies, the children involved, the types of maltreatment they suffered, the dispositions of the CPS responses, the risk factors of the child and the caregivers, the services that are provided, and the perpetrators. (See chapter 1.)
Where are the data available? The Child Maltreatment reports are available on the Children’s Bureau website at https://www.acf.hhs.gov/cb/research-data-technology/statistics-research/child- maltreatment. If you have questions or require additional information about this report, please contact the Child Welfare Information Gateway at [email protected] or 1–800–394–3366. Restricted use files of NCANDS data are archived at the National Data Archive on Child Abuse and Neglect (NDACAN) at Cornell University. Researchers who are interested in using these data for statistical analyses may contact NDACAN by phone at 607–255–7799 or by email at [email protected]. (See chapter 1.)
How many allegations of maltreatment were reported and received an investigation response or alternative response?
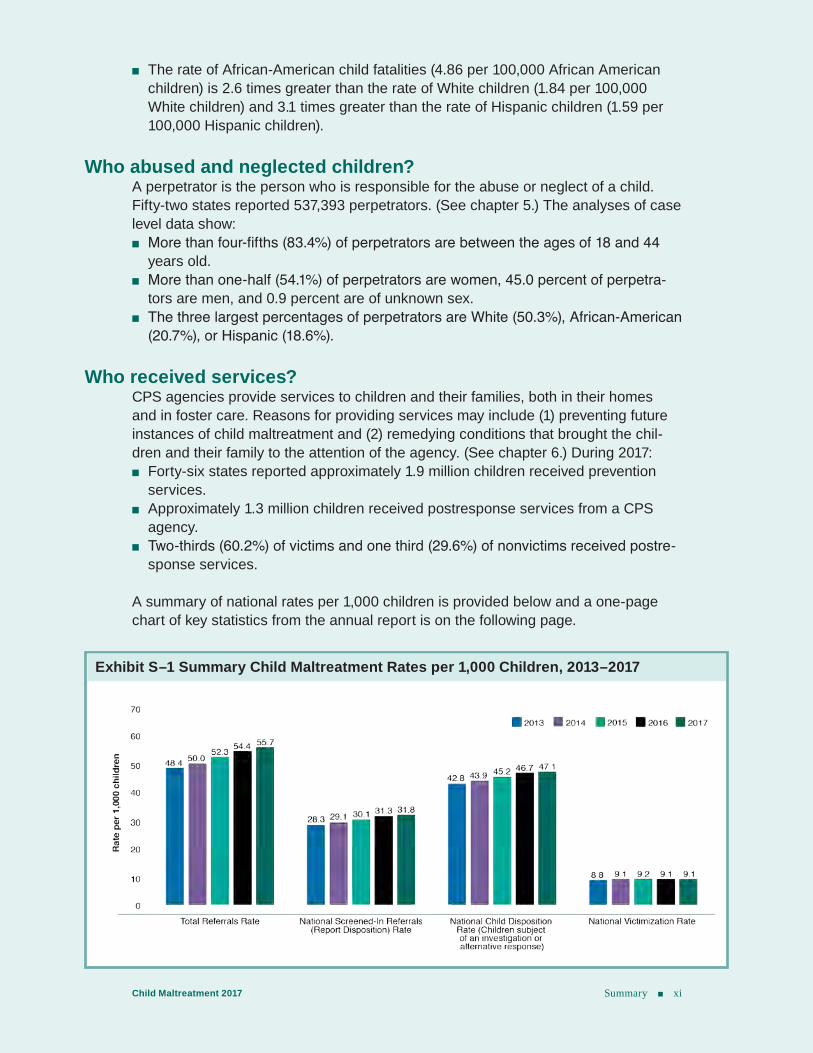
During FFY 2017, CPS agencies received a national estimate of 4.1 million referrals involving approximately 7.5 million children. Among the 45 states that report both screened in and screened out referrals, 57.6 percent of referrals are screened in and 42.4 percent are screened out. For FFY 2017, states screened in 2.4 million referrals for a CPS response. The national rate of screened-in referrals (reports) is 31.8 per 1,000 children in the national population. (See chapter 2.)
Summary xChild Maltreatment 2017
Who reported child maltreatment? For 2017, professionals submitted 65.7 percent of reports alleging child abuse and neglect. The term professional means that the person has contact with the alleged child maltreatment victim as part of his or her job. This term includes teachers, police officers, lawyers, and social services staff. The highest percentages of reports are from education personnel (19.4%), legal and law enforcement personnel (18.3%), and social services personnel (11.7%).
Nonprofessionals—including friends, neighbors, and relatives—submitted fewer than one-fifth of reports (17.3%). Unclassified sources submitted the remaining reports (17.0%). Unclassified includes anonymous, “other,” and unknown report sources. States use the code “other” for any report source that does not have an NCANDS designated code. See Appendix D, State Commentary, for additional information provided by the states as to what is included in “other.” (See chapter 2.)
Who were the child victims? For FFY 2017, the data show approximately 3.5 million children are the subjects of at least one report. A total of 17.0 percent of children are classified as victims with dispositions of substantiated (16.3%) and indicated (0.7%). The remaining children (83.0%) are not determined to be victims of maltreatment or received an alternative response. For FFY 2017, there are a nationally estimated 674,000 victims of child abuse and neglect. The victim rate is 9.1 victims per 1,000 children in the population. (See chapter 3.) Victim demographics include:
■ Children in their first year of life have the highest rate of victimization at 25.3 per1,000 children of the same age in the national population.
■ American Indian or Alaska Native children have the highest rate of victimization at14.3 per 1,000 children in the population of the same race or ethnicity; and AfricanAmerican children have the second highest rate at 13.9 per 1,000 children of thesame race or ethnicity.
■ For victims younger than 1 year old with the alcohol abuse child risk factor, medi-cal personnel report source account for 41.1 percent.
■ For victims younger than 1 year old with the drug abuse child risk factor, medicalpersonnel report source account for 52.7 percent.
What were the most common types of maltreatment? As in prior years, the greatest percentages of children suffered from neglect (74.9%) and physical abuse (18.3%). These victims could suffer a single maltreatment type or a combination of two or more maltreatment types. A victim who suffers more than one type of maltreatment is counted only once per type. (See chapter 3.)
How many children died from abuse or neglect? Child fatalities are the most tragic consequence of maltreatment. For FFY 2017, 50 states reported 1,688 fatalities. Based on these data, a national estimate of 1,720 children died from abuse and neglect. (See chapter 4.) The analyses of case level fatality data show:
■ The national rate of child fatalities was 2.32 deaths per 100,000 children. ■ Seventy-two (71.8%) percent of all child fatalities were younger than 3 years old. ■ Boys had a higher child fatality rate than girls at 2.68 boys per 100,000 boys in the
population. Girls had a child fatality rate of 2.02 per 100,000 girls in the population.
Summary xiChild Maltreatment 2017
■ The rate of African-American child fatalities (4.86 per 100,000 African Americanchildren) is 2.6 times greater than the rate of White children (1.84 per 100,000White children) and 3.1 times greater than the rate of Hispanic children (1.59 per100,000 Hispanic children).
Who abused and neglected children? A perpetrator is the person who is responsible for the abuse or neglect of a child. Fifty-two states reported 537,393 perpetrators. (See chapter 5.) The analyses of case level data show:
■ More than four-fifths (83.4%) of perpetrators are between the ages of 18 and 44years old.
■ More than one-half (54.1%) of perpetrators are women, 45.0 percent of perpetra-tors are men, and 0.9 percent are of unknown sex.
■ The three largest percentages of perpetrators are White (50.3%), African-American(20.7%), or Hispanic (18.6%).
Who received services? CPS agencies provide services to children and their families, both in their homes and in foster care. Reasons for providing services may include (1) preventing future instances of child maltreatment and (2) remedying conditions that brought the chil-dren and their family to the attention of the agency. (See chapter 6.) During 2017:
■ Forty-six states reported approximately 1.9 million children received preventionservices.
■ Approximately 1.3 million children received postresponse services from a CPSagency.
■ Two-thirds (60.2%) of victims and one third (29.6%) of nonvictims received postre-sponse services.
A summary of national rates per 1,000 children is provided below and a one-page chart of key statistics from the annual report is on the following page.
Exhibit S–1 Summary Child Maltreatment Rates per 1,000 Children, 2013–2017
Summary xiiChild Maltreatment 2017
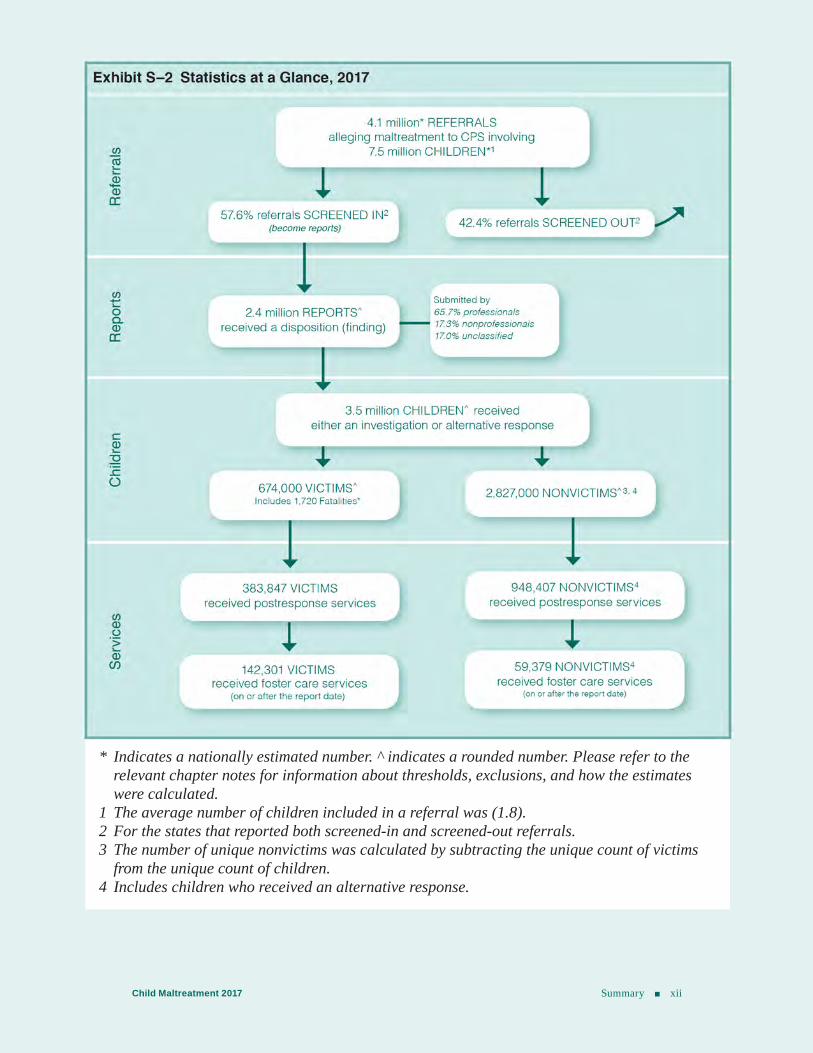
Exhibit S–2 Statistics at a Glance, 2017
Refe
rrals
Repo
rtsCh
ildre
nSe
rvic
es
2.4 million REPORTS^ received a disposition (finding)
Submitted by65.7% professionals17.3% nonprofessionals17.0% unclassified
674,000 VICTIMS^ Includes 1,720 Fatalities*
2,827,000 NONVICTIMS^ 3, 4
57.6% referrals SCREENED IN2
(become reports) 42.4% referrals SCREENED OUT2
383,847 VICTIMSreceived postresponse services
142,301 VICTIMS received foster care services
(on or after the report date)
948,407 NONVICTIMS4
received postresponse services
59,379 NONVICTIMS4
received foster care services(on or after the report date)
4.1 million* REFERRALS alleging maltreatment to CPS involving
7.5 million CHILDREN*1
3.5 million CHILDREN^ receivedeither an investigation or alternative response
* Indicates a nationally estimated number. ^ indicates a rounded number. Please refer to therelevant chapter notes for information about thresholds, exclusions, and how the estimateswere calculated.
1 The average number of children included in a referral was (1.8).2 For the states that reported both screened-in and screened-out referrals.3 The number of unique nonvictims was calculated by subtracting the unique count of victims
from the unique count of children.4 Includes children who received an alternative response.
chApter 1: Introduction 1Child Maltreatment 2017
Introduction
Child abuse and neglect is one of the Nation’s most serious concerns. This important issue is addressed in many ways by the Children’s Bureau in the Administration on Children, Youth and Families, the Administration for Children and Families (ACF) within the U.S. Department of Health and Human Services (HHS). The Children’s Bureau strives to ensure the safety, permanency, and well-being of all children by working with state, tribal, and local agencies to develop programs to prevent child abuse and neglect. To achieve our goals, we participate in a variety of projects, including:
■ Providing guidance on federal law, policy and program regulations ■ Funding essential services, helping states and tribes operate every aspect of their child
welfare systems ■ Supporting innovation through competitive, peer-reviewed grants for research and pro-
gram development ■ Offering training and technical assistance to improve child welfare service delivery ■ Monitoring child welfare services to help states and tribes achieve positive outcomes for
children and families ■ Sharing research to help child welfare professionals improve their services
Child Maltreatment 2017 presents national data about child abuse and neglect known to child protective services (CPS) agencies in the United States during federal fiscal year (FFY) 2017. The data are collected and analyzed through the National Child Abuse and Neglect Data System (NCANDS), which is an initiative of the Children’s Bureau. Because NCANDS contains all screened-in referrals to CPS agencies that receive a disposition and those that receive an alternative response, these data represent the universe of known child maltreat-ment cases for FFY 2017.
Background of NCANDSThe Child Abuse Prevention and Treatment Act (CAPTA) was amended in 1988 (P.L. 100–294) to direct the Secretary of HHS to establish a national data collection and analysis pro-gram, which would make available state child abuse and neglect reporting information. HHS responded by establishing NCANDS as a voluntary national reporting system. During 1992, HHS produced its first NCANDS report based on data from 1990. The Child Maltreatment report series evolved from that initial report and is now in its 28th edition. During 1996, CAPTA was amended to require all states that receive funds from the Basic State Grant program to work with the Secretary of HHS to provide specific data, to the maximum extent practicable, about children who had been maltreated. Subsequent CAPTA amendments added
CHAPTER 1
chApter 1: Introduction 2Child Maltreatment 2017
data elements and readers are encouraged to review Appendix A, CAPTA Data Items, most of which are reported by states to NCANDS.
A successful federal-state partnership is the core component of NCANDS. Each state desig-nates one person to be the NCANDS state contact. The state contacts from all 52 states (unless otherwise noted, the term “states” includes the District of Columbia and the Commonwealth of Puerto Rico) work with the Children’s Bureau and the NCANDS Technical Team to uphold the high-quality standards associated with NCANDS data. Webinars, technical bulletins, virtual meetings, email, listserv discussions, and phone conferences are used regularly to facilitate information sharing and provision of technical assistance.
NCANDS has the objective to collect nationally standardized case-level and aggregate data and to make these data useful for policy decision-makers, child welfare researchers, and practitioners. The NCANDS Technical Team developed a general data standardization (mapping) procedure whereby all states systematically define the rules for extracting the data from the states’ child welfare information system into the standard NCANDS data format. Team members provide one-on-one technical assistance to states to assist with data mapping, construction, extraction, and data submission and validation.
Future Reporting to NCANDSTwo enacted laws will affect the future reporting requirements of NCANDS. The Justice for Victims of Trafficking Act of 2015 (P.L. 114–22) includes a CAPTA amendment that requires each state to report, to the maximum extent practicable, the number of children determined to be victims of sex trafficking. The Comprehensive Addiction and Recovery Act of 2016 (P.L. 114–198) includes a CAPTA amendment that requires states to report, to the maximum extent practicable, the number of infants identified by healthcare providers as being affected by substance abuse or withdrawal symptoms resulting from prenatal drug exposure, or a Fetal Alcohol Spectrum Disorder; the number of substance exposed infants with safe care plans; and the number of infants for whom service referrals were made, including services for the affected parent or caregiver. These new requirements will be added to NCANDS, and the NCANDS Technical Team will disseminate guidance from the Children’s Bureau and work with the states to implement the new fields and codes. NCANDS is subject to the Office of Management and Budget approval process (Paperwork Reduction Act P.L. 96–511) to renew existing data elements and to add new ones. States will begin reporting data for both new laws with their FFY 2018 submissions.
Annual Data Collection ProcessThe NCANDS reporting year is based on the FFY calendar, which for Child Maltreatment 2017 is October 1, 2016 through September 30, 2017. States submit case-level data by con-structing an electronic file of child-specific records for each report of alleged child abuse and neglect that received a CPS response. Each state’s file only includes completed reports with a disposition (or finding) as an outcome of the CPS response during the reporting year. The data submission containing these case-level data is called the Child File.
The Child File is supplemented by agency-level aggregate statistics in a separate data submission called the Agency File. The Agency File contains data that are not reportable at the child-specific level and are often gathered from agencies external to CPS (e.g., vital statistics departments, child death review teams, law enforcement agencies, etc.). States are
Chapter 1: Introduction 3Child Maltreatment 2017
asked to submit both the Child File and the Agency File each year. For more information about the Child File and Agency File please go to the Children’s Bureau website at https://www.acf.hhs.gov/cb/research-data-technology/reporting-systems/ncands.
Upon receipt of data from each state, a technical validation review assesses the internal con-sistency of the data and identifies probable causes for missing data. If the reviews conclude that corrections are necessary, the state may be asked to resubmit its data. (See Appendix C, State Characteristics for additional information about submissions and Appendix D, State Commentary for information from states about their data.)
For FFY 2017, 52 states submitted both a Child File and an Agency File. The most recent data submissions or resubmissions from states are included in trend tables. This may account for some differences in the counts from previous reports. With each Child Maltreatment report, the most recent population data from the U.S. Census Bureau are used to update all data years in each trend table. Wherever possible, trend tables encompass 5 years of data.1 According to the U.S. Census Bureau, the population of the 52 states that submitted FFY 2017 data accounts for more than 74 million children. (See table C–2.)
As part of the NCANDS annual data collection process, states are asked to verify that their data are sufficiently encrypted. However, some states are not able to verify that the data meet encryption guidelines. To protect confidentiality and enable all states’ data are available to researchers, a double-encryption process occurs during the data collection to systematically de-identify the unique identifiers associated with the report, child, perpetrator, worker, and supervisor. This process ensures the data security and that researchers can conduct analyses across years.
NCANDS as a ResourceThe NCANDS data are a critical source of information for many publications, reports, and activities of the federal government, child welfare personnel, researchers, and others. Some examples of programs and reports that use NCANDS data are discussed below. More infor-mation about these reports and programs are available on the Children’s Bureau website at https://www.acf.hhs.gov/cb.
■ Child Welfare Outcomes: Report to Congress—This annual report presents information on state and national performance in seven outcome categories. Data for the original Child Welfare Outcomes measures and the majority of the context data in this report come from NCANDS and the Adoption and Foster Care Analysis and Reporting System (AFCARS). The reports are available on the Children’s Bureau’s website at https://www.acf.hhs.gov/cb/research-data-technology/statistics-research/cwo.
■ Child and Family Services Reviews (CFSRs)—The Children’s Bureau conducts periodic reviews of state child welfare systems to ensure conformity with federal requirements, determine what is happening with children and families who are engaged in child welfare
1 U.S. Census Bureau, Population division. (2018). SC-EST2017-ALLDATA6: Annual State Resident Population Estimates for 6 Race Groups (5 Race Alone Groups and Two or More Races) by Age, Sex, and Hispanic Origin: April 1, 2010 to July 1, 2017 [data file]. Retrieved from https://www.census.gov/data/datasets/2017/demo/popest/state-detail.html U.S. Census Bureau, Population Division. (2018). Annual Estimates of the Resident Population by Single Year of Age and Sex for the Puerto Rico Commonwealth: April 1, 2010 to July 1, 2017 [data file]. Retrieved from https://www.census.gov/data/ tables/2017/demo/popest/detail-puerto-rico.html
chApter 1: Introduction 4Child Maltreatment 2017
services, and assist states with helping children and families achieve positive outcomes. States develop Program Improvement Plans to address areas revealed by the CFSR as in need of improvement. For CFSR Round 3, NCANDS data are the basis for two of the CFSR national data indicators: Recurrence of Maltreatment and Maltreatment in Foster Care. NCANDS data also are used as data quality checks.
The NCANDS data also are used for several performance measures published annually as part of the ACF Annual Budget Request to Congress, which highlights certain key performance measures in compliance with the Government Performance and Results Modernization Act (P.L. 111–352). Specific measures on which ACF reports using NCANDS data include:
■ Decrease the rate of first-time victims per 1,000 children in the population. ■ Decrease the percentage of children with substantiated or indicated reports of maltreat-
ment who have a repeated substantiated or indicated report of maltreatment within six months.
■ Improve states’ average response time between maltreatment report and investigation, based on the median of states’ reported average response time in hours from screened-in reports to the initiation of the investigation.
The National Data Archive on Child Abuse and Neglect (NDACAN) was established by the Children’s Bureau to encourage scholars to use existing child maltreatment data in their research. NDACAN acquires data sets from national data collection efforts and from individual researchers, prepares the data and documentation for secondary analysis, and disseminates the data sets to qualified researchers who apply to use the data. NDACAN houses the NCANDS’s Child Files and Agency Files and licenses researchers to use the data sets. The NCANDS data files are double-encrypted prior to submission to NDACAN, which ensures that all submitted data are encrypted and will be available to researchers and other federal agencies. Please note that NDACAN serves as the repository for the data sets, but is not the author of the Child Maltreatment report series. More information is available at https://www.ndacan.cornell.edu.
In addition, NCANDS data are provided to other agencies as part of federal initiatives, including Healthy People 2020 https://www.healthypeople.gov and America’s Children: Key National Indicators of Well-Being https://www.childstats.gov/americaschildren.
Structure of the ReportMany tables include 5 years of data to facilitate trend analyses. To accommodate the space needed to display the child maltreatment data, population data (when applicable) may not appear with the table and are available in Appendix C, State Characteristics. Tables with multiple categories or years of data have numbers presented separately from percentages or rates to make it easier to compare numbers, percentages, or rates across columns or rows.
By making changes designed to improve the functionality and practicality of the report each year, the Children’s Bureau endeavors to increase readers’ comprehension and knowledge about child maltreatment. Feedback regarding changes, suggestions for potential future changes, or other comments related to the Child Maltreatment report are encouraged. Please provide feedback to the Children’s Bureau’s Child Welfare Information Gateway at [email protected]. The Child Maltreatment 2017 report contains the additional chapters
chApter 1: Introduction 5Child Maltreatment 2017
listed below. Most data tables and notes discussing methodology are at the end of each chapter:
■ Chapter 2, Reports—referrals and reports of child maltreatment. ■ Chapter 3, Children—characteristics of victims and nonvictims. ■ Chapter 4, Fatalities—fatalities that occurred as a result of maltreatment. ■ Chapter 5, Perpetrators—characteristics of perpetrators of maltreatment. ■ Chapter 6, Services—services to prevent maltreatment and to assist children and
families.
The report includes the following resources: ■ Appendix A, CAPTA Data Items—the list of data items from CAPTA, most of which
states submit to NCANDS. ■ Appendix B, Glossary—common terms and acronyms used in NCANDS and their
definitions. ■ Appendix C, State Characteristics—child and adult population data and information
about states administrative structures, levels of evidence, and data files submitted to NCANDS.
■ Appendix D, State Commentary—information about state policies, procedures, and legislation that may affect data.
Readers are urged to use state commentaries as a resource for additional context to the chapters’ text and data tables. States vary in the policies, legislation, requirements, and procedures. While the purpose of the NCANDS project is to collect nationally standardized aggregate and case-level child maltreatment data, readers should exercise caution in making state-to-state comparisons. Each state defines child abuse and neglect in its own statutes and policies and the child welfare agencies determine the appropriate response for the alleged maltreatment based on those statutes and policies. Appendix D, State Commentary also includes phone and email information for each NCANDS state contact person. Readers who would like additional information about specific policies or practices should contact the respective states.
Chapter 2: Reports 6Child Maltreatment 2017
Reports
This chapter presents statistics about referrals alleging child abuse and neglect and how CPS agencies respond to those allegations. Most CPS agencies use a two-step process to respond to allegations of child maltreatment: (1) screening and (2) investigation and alternative response. A CPS agency receives an initial notification—called a referral—alleging child maltreat-ment. A referral may involve more than one child. Agency hotline or intake units conduct the screening response to determine whether a referral is appropriate for further action.
Screening A referral may be either screened in or screened out. Referrals that meet CPS agency criteria are screened in (and called reports) and receive an investigation or alternative response from the agency. Referrals that do not meet agency criteria are screened out or diverted from CPS to other community agencies. Reasons for screening out a referral vary by state policy, but may include one or more of the following:
■ Does not concern child abuse and neglect. ■ Does not contain enough information for a CPS response to occur. ■ Response by another agency is deemed more appropriate. ■ Children in the referral are the responsibility of another agency or jurisdiction (e.g.,
military installation or tribe). ■ Children in the referral are older than 18 years.
The referral exhibit (exhibit 2–A Referral Rates) in prior editions of the Child Maltreatment report is broken out into three exhibits 2A, 2B, and 2C for Child Maltreatment 2017. This will provide readers with additional understanding of the screening data and the estimation process in this report.
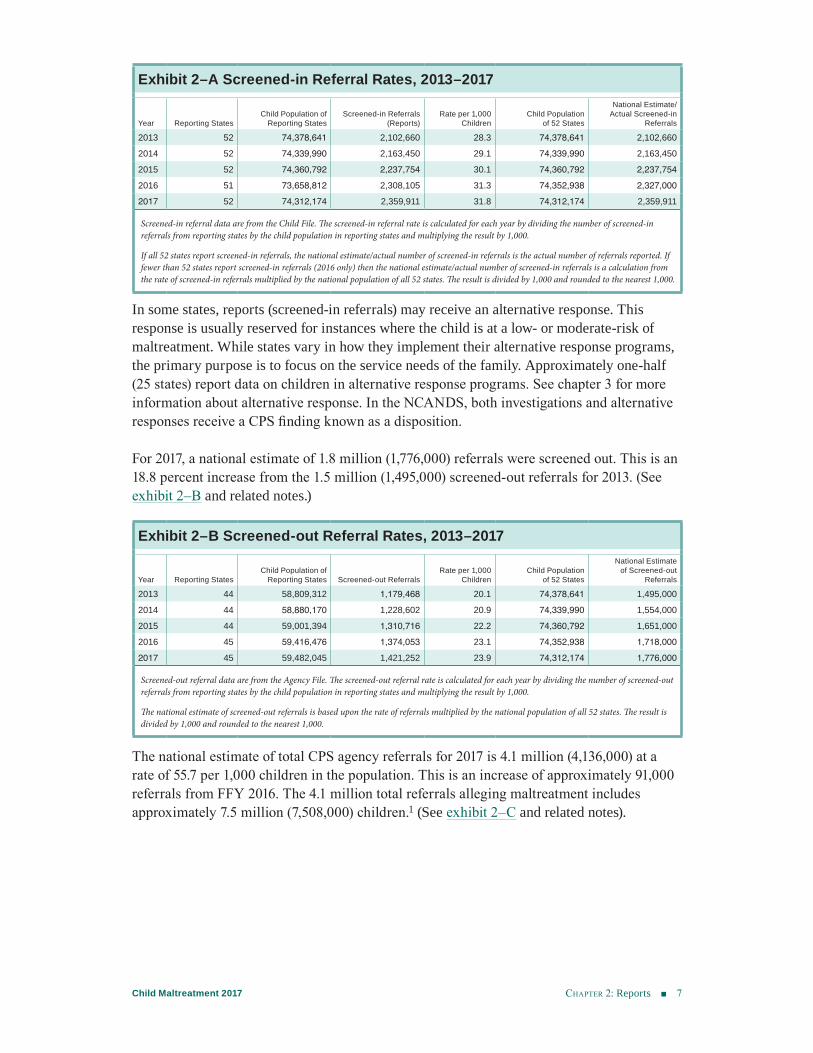
During FFY 2017, CPS agencies across the nation screened in 2.4 million (2,359,911) refer-rals in all 52 reporting states. This is a 12.2 percent increase from the 2.1 million (2,102,660) screened-in referrals during 2013. (See exhibit 2–A and related notes.)
Screened-in referrals are called reports and may include more than one child. In most states, the majority of reports receive an investigation. This response includes assessing the allegation of maltreatment according to state law and policy. The primary purpose of the investigation is twofold: (1) to determine whether the child was maltreated or is at-risk of maltreatment and (2) to determine if services are needed and which services to provide.
CHAPTER 2
chApter 2: Reports 7Child Maltreatment 2017
In some states, reports (screened-in referrals) may receive an alternative response. This response is usually reserved for instances where the child is at a low- or moderate-risk of maltreatment. While states vary in how they implement their alternative response programs, the primary purpose is to focus on the service needs of the family. Approximately one-half (25 states) report data on children in alternative response programs. See chapter 3 for more information about alternative response. In the NCANDS, both investigations and alternative responses receive a CPS finding known as a disposition.
For 2017, a national estimate of 1.8 million (1,776,000) referrals were screened out. This is an 18.8 percent increase from the 1.5 million (1,495,000) screened-out referrals for 2013. (See exhibit 2–B and related notes.)
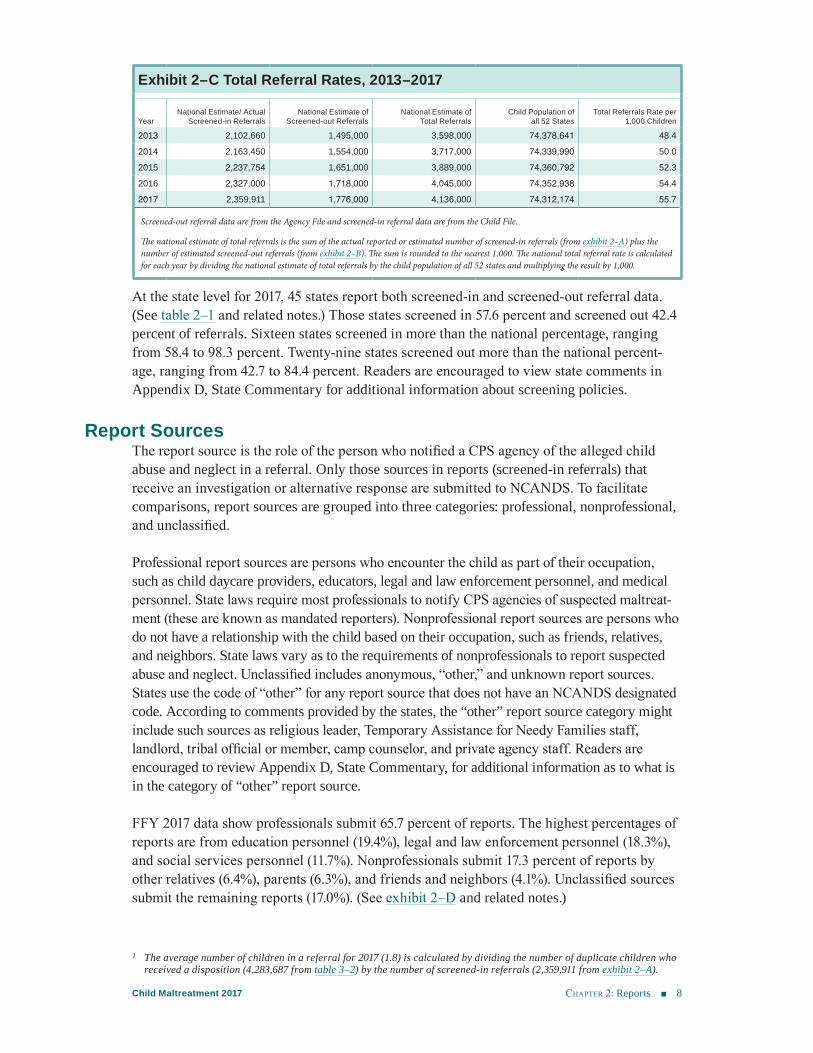
The national estimate of total CPS agency referrals for 2017 is 4.1 million (4,136,000) at a rate of 55.7 per 1,000 children in the population. This is an increase of approximately 91,000 referrals from FFY 2016. The 4.1 million total referrals alleging maltreatment includes approximately 7.5 million (7,508,000) children.1 (See exhibit 2–C and related notes).
Exhibit 2–A Screened-in Referral Rates, 2013–2017
Year Reporting StatesChild Population of
Reporting StatesScreened-in Referrals
(Reports)Rate per 1,000
ChildrenChild Population
of 52 States
National Estimate/ Actual Screened-in
Referrals
2013 52 74,378,641 2,102,660 28.3 74,378,641 2,102,6602014 52 74,339,990 2,163,450 29.1 74,339,990 2,163,4502015 52 74,360,792 2,237,754 30.1 74,360,792 2,237,7542016 51 73,658,812 2,308,105 31.3 74,352,938 2,327,0002017 52 74,312,174 2,359,911 31.8 74,312,174 2,359,911
Screened-in referral data are from the Child File. The screened-in referral rate is calculated for each year by dividing the number of screened-in referrals from reporting states by the child population in reporting states and multiplying the result by 1,000.
If all 52 states report screened-in referrals, the national estimate/actual number of screened-in referrals is the actual number of referrals reported. If fewer than 52 states report screened-in referrals (2016 only) then the national estimate/actual number of screened-in referrals is a calculation from the rate of screened-in referrals multiplied by the national population of all 52 states. The result is divided by 1,000 and rounded to the nearest 1,000.
Exhibit 2–B Screened-out Referral Rates, 2013–2017
Year Reporting StatesChild Population of
Reporting States Screened-out ReferralsRate per 1,000
ChildrenChild Population
of 52 States
National Estimateof Screened-out
Referrals
2013 44 58,809,312 1,179,468 20.1 74,378,641 1,495,0002014 44 58,880,170 1,228,602 20.9 74,339,990 1,554,0002015 44 59,001,394 1,310,716 22.2 74,360,792 1,651,0002016 45 59,416,476 1,374,053 23.1 74,352,938 1,718,0002017 45 59,482,045 1,421,252 23.9 74,312,174 1,776,000
Screened-out referral data are from the Agency File. The screened-out referral rate is calculated for each year by dividing the number of screened-out referrals from reporting states by the child population in reporting states and multiplying the result by 1,000.
The national estimate of screened-out referrals is based upon the rate of referrals multiplied by the national population of all 52 states. The result is divided by 1,000 and rounded to the nearest 1,000.
chApter 2: Reports 8Child Maltreatment 2017
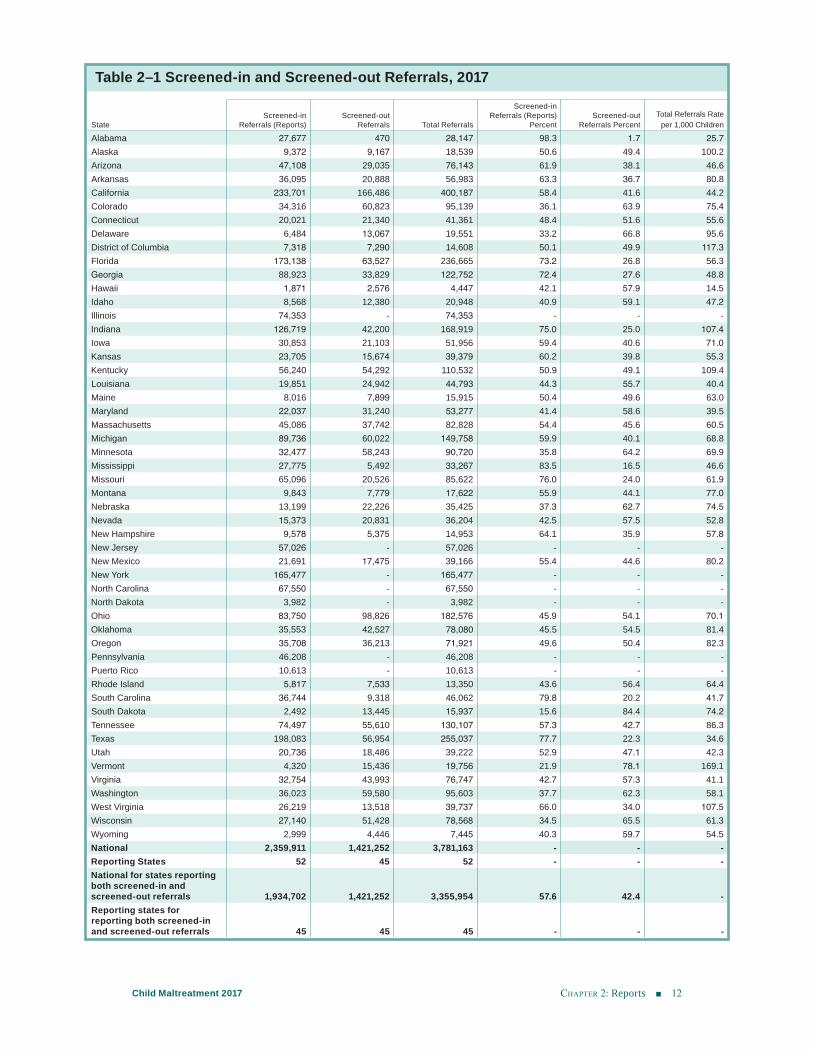
At the state level for 2017, 45 states report both screened-in and screened-out referral data. (See table 2–1 and related notes.) Those states screened in 57.6 percent and screened out 42.4 percent of referrals. Sixteen states screened in more than the national percentage, ranging from 58.4 to 98.3 percent. Twenty-nine states screened out more than the national percent-age, ranging from 42.7 to 84.4 percent. Readers are encouraged to view state comments in Appendix D, State Commentary for additional information about screening policies.
Report SourcesThe report source is the role of the person who notified a CPS agency of the alleged child abuse and neglect in a referral. Only those sources in reports (screened-in referrals) that receive an investigation or alternative response are submitted to NCANDS. To facilitate comparisons, report sources are grouped into three categories: professional, nonprofessional, and unclassified.
Professional report sources are persons who encounter the child as part of their occupation, such as child daycare providers, educators, legal and law enforcement personnel, and medical personnel. State laws require most professionals to notify CPS agencies of suspected maltreat-ment (these are known as mandated reporters). Nonprofessional report sources are persons who do not have a relationship with the child based on their occupation, such as friends, relatives, and neighbors. State laws vary as to the requirements of nonprofessionals to report suspected abuse and neglect. Unclassified includes anonymous, “other,” and unknown report sources. States use the code of “other” for any report source that does not have an NCANDS designated code. According to comments provided by the states, the “other” report source category might include such sources as religious leader, Temporary Assistance for Needy Families staff, landlord, tribal official or member, camp counselor, and private agency staff. Readers are encouraged to review Appendix D, State Commentary, for additional information as to what is in the category of “other” report source.
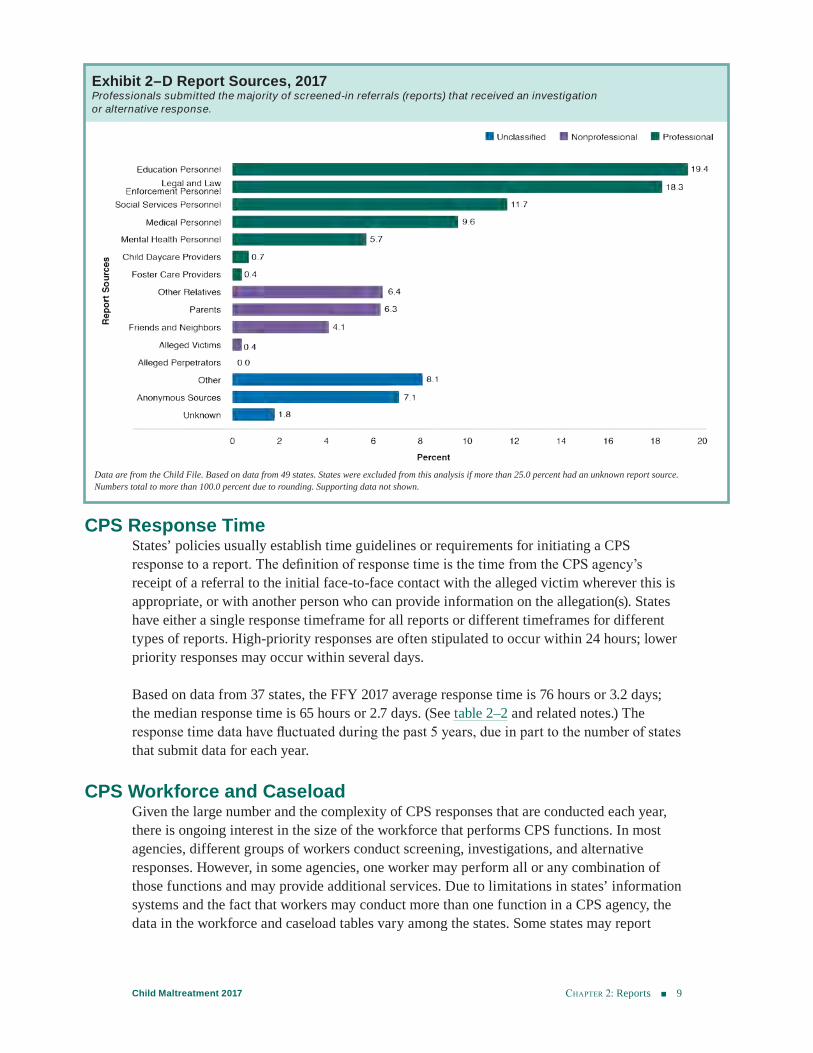
FFY 2017 data show professionals submit 65.7 percent of reports. The highest percentages of reports are from education personnel (19.4%), legal and law enforcement personnel (18.3%), and social services personnel (11.7%). Nonprofessionals submit 17.3 percent of reports by other relatives (6.4%), parents (6.3%), and friends and neighbors (4.1%). Unclassified sources submit the remaining reports (17.0%). (See exhibit 2–D and related notes.)
Exhibit 2–C Total Referral Rates, 2013–2017
YearNational Estimate/ Actual
Screened-in ReferralsNational Estimate of
Screened-out ReferralsNational Estimate of
Total ReferralsChild Population of
all 52 StatesTotal Referrals Rate per
1,000 Children
2013 2,102,660 1,495,000 3,598,000 74,378,641 48.42014 2,163,450 1,554,000 3,717,000 74,339,990 50.02015 2,237,754 1,651,000 3,889,000 74,360,792 52.32016 2,327,000 1,718,000 4,045,000 74,352,938 54.42017 2,359,911 1,776,000 4,136,000 74,312,174 55.7
Screened-out referral data are from the Agency File and screened-in referral data are from the Child File.
The national estimate of total referrals is the sum of the actual reported or estimated number of screened-in referrals (from exhibit 2–A) plus the number of estimated screened-out referrals (from exhibit 2–B). The sum is rounded to the nearest 1,000. The national total referral rate is calculated for each year by dividing the national estimate of total referrals by the child population of all 52 states and multiplying the result by 1,000.
1 The average number of children in a referral for 2017 (1.8) is calculated by dividing the number of duplicate children who received a disposition (4,283,687 from table 3–2) by the number of screened-in referrals (2,359,911 from exhibit 2–A).
Chapter 2: Reports 9Child Maltreatment 2017
CPS Response TimeStates’ policies usually establish time guidelines or requirements for initiating a CPS response to a report. The definition of response time is the time from the CPS agency’s receipt of a referral to the initial face-to-face contact with the alleged victim wherever this is appropriate, or with another person who can provide information on the allegation(s). States have either a single response timeframe for all reports or different timeframes for different types of reports. High-priority responses are often stipulated to occur within 24 hours; lower priority responses may occur within several days.
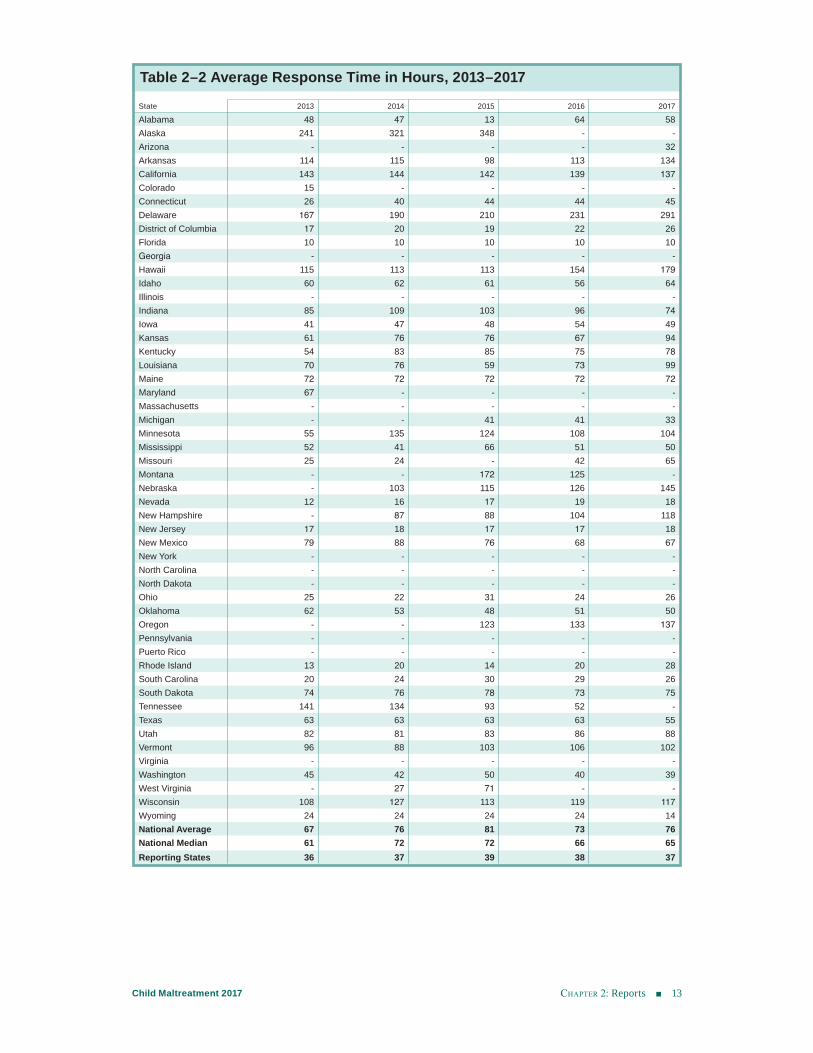
Based on data from 37 states, the FFY 2017 average response time is 76 hours or 3.2 days; the median response time is 65 hours or 2.7 days. (See table 2–2 and related notes.) The response time data have fluctuated during the past 5 years, due in part to the number of states that submit data for each year.
CPS Workforce and CaseloadGiven the large number and the complexity of CPS responses that are conducted each year, there is ongoing interest in the size of the workforce that performs CPS functions. In most agencies, different groups of workers conduct screening, investigations, and alternative responses. However, in some agencies, one worker may perform all or any combination of those functions and may provide additional services. Due to limitations in states’ information systems and the fact that workers may conduct more than one function in a CPS agency, the data in the workforce and caseload tables vary among the states. Some states may report
Exhibit 2–D Report Sources, 2017 Professionals submitted the majority of screened-in referrals (reports) that received an investigation or alternative response.
Data are from the Child File. Based on data from 49 states. States were excluded from this analysis if more than 25.0 percent had an unknown report source. Numbers total to more than 100.0 percent due to rounding. Supporting data not shown.
chApter 2: Reports 10Child Maltreatment 2017
authorized positions while other states may report a “snapshot” (the actual number of work-ers on a given day). The Children’s Bureau asks states to submit data for workers as full-time equivalents when possible.
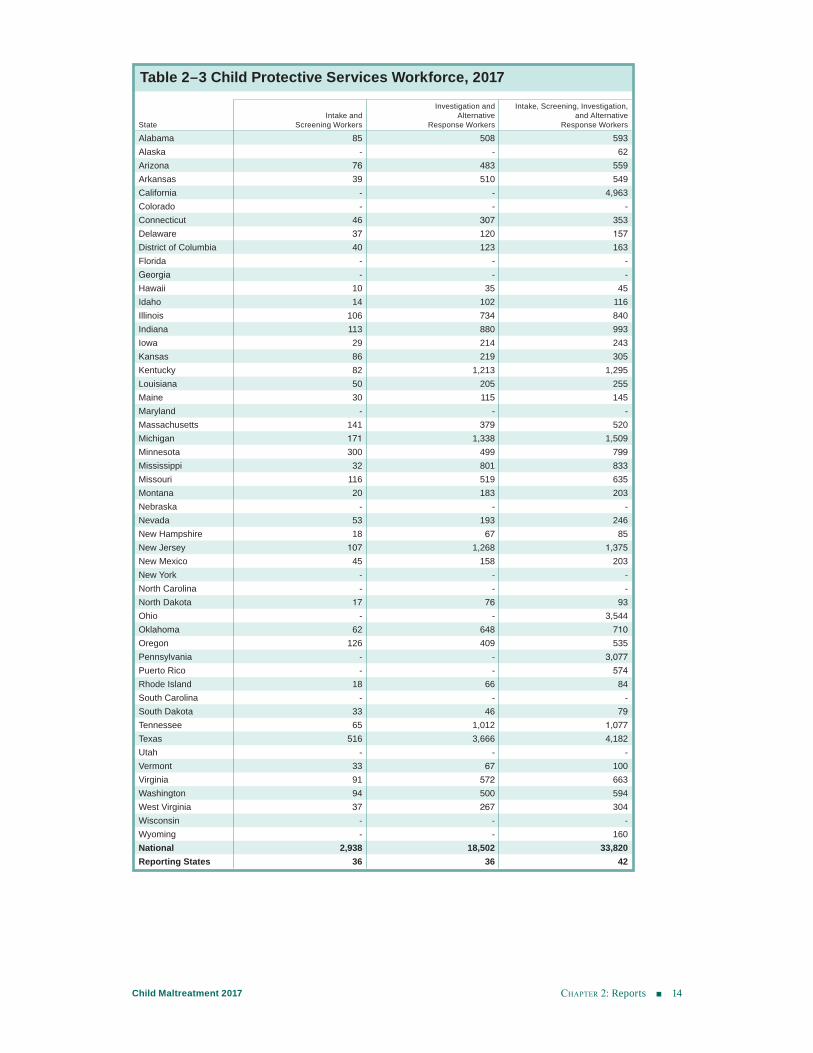
For FFY 2017, 42 states report a total workforce of 33,820. Thirty-six states report 2,938 spe-cialized intake and screening workers. The number of investigation and alternative response workers—18,502—is computed by subtracting the reported number of intake and screening workers from the total workforce number. (See table 2–3 and related notes.)
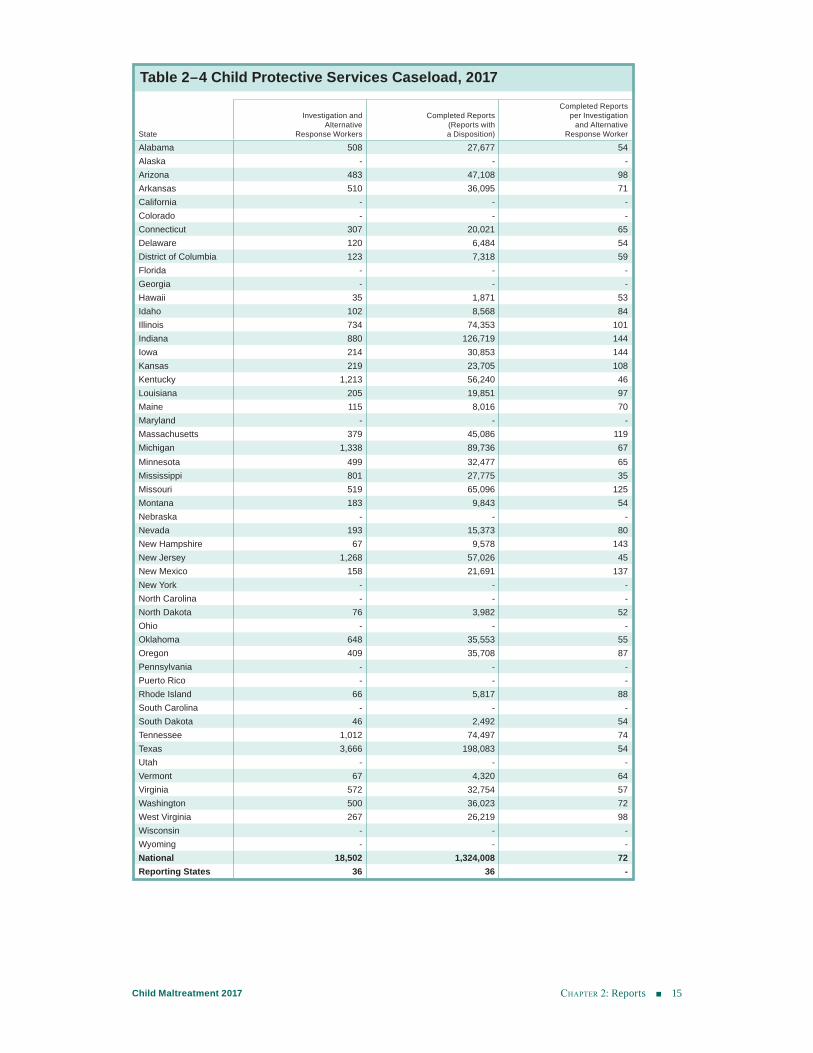
Using the data from the same 36 states that report on workers with specialized functions, investigation and alternative response workers complete an average of 72 CPS responses per worker for FFY 2017. As CPS agencies realign their workforce to improve the multiple types of CPS responses they provide, the methodologies for estimating caseloads may become more complex. (See table 2–4 and related notes.)
Exhibit and Table NotesThe following pages contain the data tables referenced in chapter 2. Specific information about state submissions can be found in Appendix D, State Commentary. Additional infor-mation regarding the exhibits and tables is provided below.
General ■ During data analyses, thresholds are set to ensure data quality is balanced with the need to
report data from as many states as possible. States may be excluded from an analysis for data quality issues. Exclusion rules are in the table notes below.
■ Rates are per 1,000 children in the population. ■ Rates are calculated by dividing the relevant reported count (screened-in referrals, total
referrals, etc.) by the relevant child population count (children) and multiplying by 1,000. ■ NCANDS uses the child population estimates that are released annually by the U.S. Census
Bureau. These population estimates are provided in Appendix C, State Characteristics. ■ National totals and calculations appear in a single row labeled National instead of separate
rows labeled total, rate, or percent. ■ The row labeled Reporting States displays the count of states that provided data for that
analysis.
Table 2–1 Screened-In and Screened-Out Referrals, 2017 ■ Screened-out referral data are from the Agency File and screened-in referral data are from
the Child File. ■ This table includes screened-in referral data from all states and screened-out referral data
from 45 reporting states. ■ The state total referral rate is based on the number of total referrals divided by the child
population (see table C–2) of states reporting both screened-in and screened-out referrals and multiplying the result by 1,000.
Table 2–2 Average Response Time in Hours, 2013–2017 ■ Data are from the Agency File. ■ The national average response time is calculated by summing the response times from the
states and dividing the total by the number of states reporting. The result is rounded to the nearest whole number.
■ The national median is calculated by sorting the values and finding the middle point.
chApter 2: Reports 11Child Maltreatment 2017
■ States are excluded from this analysis if more than 95.0 percent of reports have the same investigation date/time and report date/time.
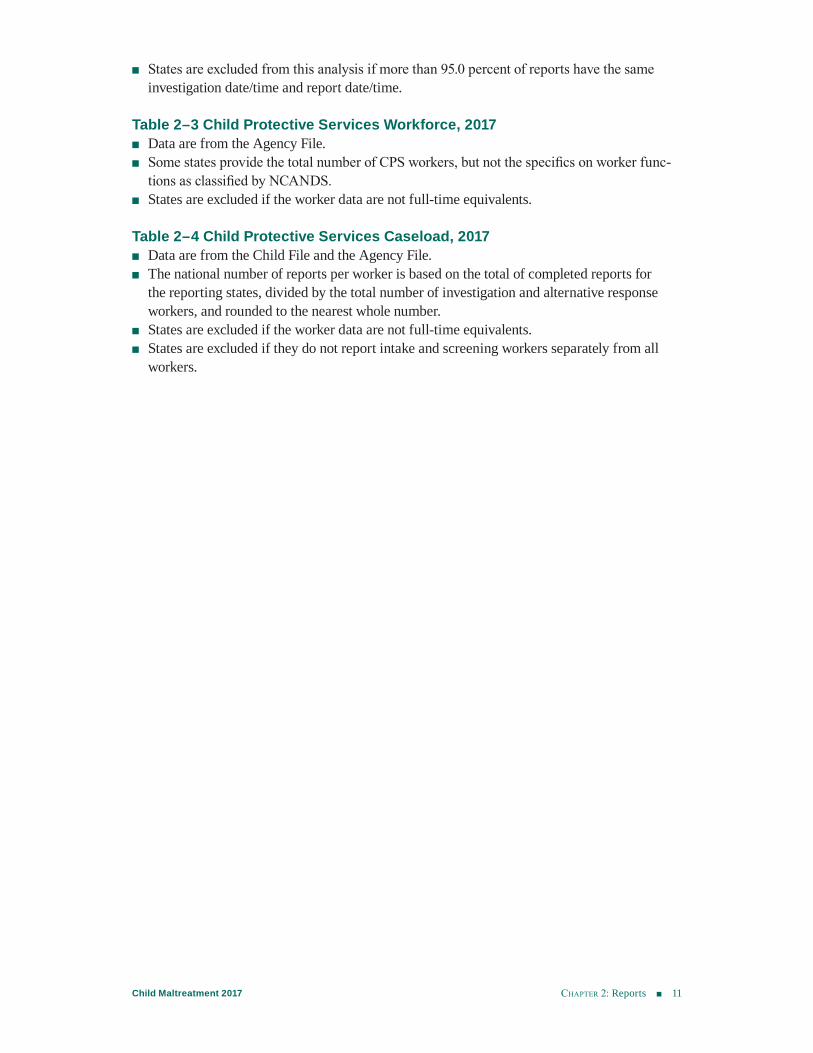
Table 2–3 Child Protective Services Workforce, 2017 ■ Data are from the Agency File. ■ Some states provide the total number of CPS workers, but not the specifics on worker func-
tions as classified by NCANDS. ■ States are excluded if the worker data are not full-time equivalents.
Table 2–4 Child Protective Services Caseload, 2017 ■ Data are from the Child File and the Agency File. ■ The national number of reports per worker is based on the total of completed reports for
the reporting states, divided by the total number of investigation and alternative response workers, and rounded to the nearest whole number.
■ States are excluded if the worker data are not full-time equivalents. ■ States are excluded if they do not report intake and screening workers separately from all
workers.
chApter 2: Reports 12Child Maltreatment 2017
Table 2–1 Screened-in and Screened-out Referrals, 2017
StateScreened-in
Referrals (Reports) Screened-out
Referrals Total Referrals
Screened-in Referrals (Reports)
PercentScreened-out
Referrals PercentTotal Referrals Rate
per 1,000 Children
Alabama 27,677 470 28,147 98.3 1.7 25.7Alaska 9,372 9,167 18,539 50.6 49.4 100.2Arizona 47,108 29,035 76,143 61.9 38.1 46.6Arkansas 36,095 20,888 56,983 63.3 36.7 80.8California 233,701 166,486 400,187 58.4 41.6 44.2Colorado 34,316 60,823 95,139 36.1 63.9 75.4Connecticut 20,021 21,340 41,361 48.4 51.6 55.6Delaware 6,484 13,067 19,551 33.2 66.8 95.6District of Columbia 7,318 7,290 14,608 50.1 49.9 117.3Florida 173,138 63,527 236,665 73.2 26.8 56.3Georgia 88,923 33,829 122,752 72.4 27.6 48.8Hawaii 1,871 2,576 4,447 42.1 57.9 14.5Idaho 8,568 12,380 20,948 40.9 59.1 47.2Illinois 74,353 - 74,353 - - -Indiana 126,719 42,200 168,919 75.0 25.0 107.4Iowa 30,853 21,103 51,956 59.4 40.6 71.0Kansas 23,705 15,674 39,379 60.2 39.8 55.3Kentucky 56,240 54,292 110,532 50.9 49.1 109.4Louisiana 19,851 24,942 44,793 44.3 55.7 40.4Maine 8,016 7,899 15,915 50.4 49.6 63.0Maryland 22,037 31,240 53,277 41.4 58.6 39.5Massachusetts 45,086 37,742 82,828 54.4 45.6 60.5Michigan 89,736 60,022 149,758 59.9 40.1 68.8Minnesota 32,477 58,243 90,720 35.8 64.2 69.9Mississippi 27,775 5,492 33,267 83.5 16.5 46.6Missouri 65,096 20,526 85,622 76.0 24.0 61.9Montana 9,843 7,779 17,622 55.9 44.1 77.0Nebraska 13,199 22,226 35,425 37.3 62.7 74.5Nevada 15,373 20,831 36,204 42.5 57.5 52.8New Hampshire 9,578 5,375 14,953 64.1 35.9 57.8New Jersey 57,026 - 57,026 - - -New Mexico 21,691 17,475 39,166 55.4 44.6 80.2New York 165,477 - 165,477 - - -North Carolina 67,550 - 67,550 - - -North Dakota 3,982 - 3,982 - - -Ohio 83,750 98,826 182,576 45.9 54.1 70.1Oklahoma 35,553 42,527 78,080 45.5 54.5 81.4Oregon 35,708 36,213 71,921 49.6 50.4 82.3Pennsylvania 46,208 - 46,208 - - -Puerto Rico 10,613 - 10,613 - - -Rhode Island 5,817 7,533 13,350 43.6 56.4 64.4South Carolina 36,744 9,318 46,062 79.8 20.2 41.7South Dakota 2,492 13,445 15,937 15.6 84.4 74.2Tennessee 74,497 55,610 130,107 57.3 42.7 86.3Texas 198,083 56,954 255,037 77.7 22.3 34.6Utah 20,736 18,486 39,222 52.9 47.1 42.3Vermont 4,320 15,436 19,756 21.9 78.1 169.1Virginia 32,754 43,993 76,747 42.7 57.3 41.1Washington 36,023 59,580 95,603 37.7 62.3 58.1West Virginia 26,219 13,518 39,737 66.0 34.0 107.5Wisconsin 27,140 51,428 78,568 34.5 65.5 61.3Wyoming 2,999 4,446 7,445 40.3 59.7 54.5National 2,359,911 1,421,252 3,781,163 - - -Reporting States 52 45 52 - - -National for states reporting both screened-in and screened-out referrals 1,934,702 1,421,252 3,355,954 57.6 42.4 -Reporting states for reporting both screened-in and screened-out referrals 45 45 45 - - -
chApter 2: Reports 13Child Maltreatment 2017
Table 2–2 Average Response Time in Hours, 2013–2017
State 2013 2014 2015 2016 2017
Alabama 48 47 13 64 58Alaska 241 321 348 - -Arizona - - - - 32Arkansas 114 115 98 113 134California 143 144 142 139 137Colorado 15 - - - -Connecticut 26 40 44 44 45Delaware 167 190 210 231 291District of Columbia 17 20 19 22 26Florida 10 10 10 10 10Georgia - - - - -Hawaii 115 113 113 154 179Idaho 60 62 61 56 64Illinois - - - - -Indiana 85 109 103 96 74Iowa 41 47 48 54 49Kansas 61 76 76 67 94Kentucky 54 83 85 75 78Louisiana 70 76 59 73 99Maine 72 72 72 72 72Maryland 67 - - - -Massachusetts - - - - -Michigan - - 41 41 33Minnesota 55 135 124 108 104Mississippi 52 41 66 51 50Missouri 25 24 - 42 65Montana - - 172 125 -Nebraska - 103 115 126 145Nevada 12 16 17 19 18New Hampshire - 87 88 104 118New Jersey 17 18 17 17 18New Mexico 79 88 76 68 67New York - - - - -North Carolina - - - - -North Dakota - - - - -Ohio 25 22 31 24 26Oklahoma 62 53 48 51 50Oregon - - 123 133 137Pennsylvania - - - - -Puerto Rico - - - - -Rhode Island 13 20 14 20 28South Carolina 20 24 30 29 26South Dakota 74 76 78 73 75Tennessee 141 134 93 52 -Texas 63 63 63 63 55Utah 82 81 83 86 88Vermont 96 88 103 106 102Virginia - - - - -Washington 45 42 50 40 39West Virginia - 27 71 - -Wisconsin 108 127 113 119 117Wyoming 24 24 24 24 14National Average 67 76 81 73 76National Median 61 72 72 66 65Reporting States 36 37 39 38 37
chApter 2: Reports 14Child Maltreatment 2017
Table 2–3 Child Protective Services Workforce, 2017
StateIntake and
Screening Workers
Investigation and Alternative
Response Workers
Intake, Screening, Investigation, and Alternative
Response Workers
Alabama 85 508 593Alaska - - 62Arizona 76 483 559Arkansas 39 510 549California - - 4,963Colorado - - -Connecticut 46 307 353Delaware 37 120 157District of Columbia 40 123 163Florida - - -Georgia - - -Hawaii 10 35 45Idaho 14 102 116Illinois 106 734 840Indiana 113 880 993Iowa 29 214 243Kansas 86 219 305Kentucky 82 1,213 1,295Louisiana 50 205 255Maine 30 115 145Maryland - - -Massachusetts 141 379 520Michigan 171 1,338 1,509Minnesota 300 499 799Mississippi 32 801 833Missouri 116 519 635Montana 20 183 203Nebraska - - -Nevada 53 193 246New Hampshire 18 67 85New Jersey 107 1,268 1,375New Mexico 45 158 203New York - - -North Carolina - - -North Dakota 17 76 93Ohio - - 3,544Oklahoma 62 648 710Oregon 126 409 535Pennsylvania - - 3,077Puerto Rico - - 574Rhode Island 18 66 84South Carolina - - -South Dakota 33 46 79Tennessee 65 1,012 1,077Texas 516 3,666 4,182Utah - - -Vermont 33 67 100Virginia 91 572 663Washington 94 500 594West Virginia 37 267 304Wisconsin - - -Wyoming - - 160National 2,938 18,502 33,820Reporting States 36 36 42
Chapter 2: Reports 15Child Maltreatment 2017
Table 2–4 Child Protective Services Caseload, 2017
State
Investigation and Alternative
Response Workers
Completed Reports (Reports with a Disposition)
Completed Reports per Investigation
and Alternative Response Worker
Alabama 508 27,677 54Alaska - - -Arizona 483 47,108 98Arkansas 510 36,095 71California - - -Colorado - - -Connecticut 307 20,021 65Delaware 120 6,484 54District of Columbia 123 7,318 59Florida - - -Georgia - - -Hawaii 35 1,871 53Idaho 102 8,568 84Illinois 734 74,353 101Indiana 880 126,719 144Iowa 214 30,853 144Kansas 219 23,705 108Kentucky 1,213 56,240 46Louisiana 205 19,851 97Maine 115 8,016 70Maryland - - -Massachusetts 379 45,086 119Michigan 1,338 89,736 67Minnesota 499 32,477 65Mississippi 801 27,775 35Missouri 519 65,096 125Montana 183 9,843 54Nebraska - - -Nevada 193 15,373 80New Hampshire 67 9,578 143New Jersey 1,268 57,026 45New Mexico 158 21,691 137New York - - -North Carolina - - -North Dakota 76 3,982 52Ohio - - -Oklahoma 648 35,553 55Oregon 409 35,708 87Pennsylvania - - -Puerto Rico - - -Rhode Island 66 5,817 88South Carolina - - -South Dakota 46 2,492 54Tennessee 1,012 74,497 74Texas 3,666 198,083 54Utah - - -Vermont 67 4,320 64Virginia 572 32,754 57Washington 500 36,023 72West Virginia 267 26,219 98Wisconsin - - -Wyoming - - -National 18,502 1,324,008 72Reporting States 36 36 -
chApter 3: Children 16Child Maltreatment 2017
Children
This chapter discusses the children who are the subjects of reports (screened-in referrals) and the characteristics of those who are determined to be victims of abuse and neglect. The Child Abuse Prevention and Treatment Act (CAPTA), (P.L. 100–294) defines child abuse and neglect as, at a minimum:
Any recent act or failure to act on the part of a parent or caretaker which results in death, serious physical or emotional harm, sexual abuse or exploitation; or an act or failure to act, which presents an imminent risk of serious harm.
CAPTA legislation recognizes individual state authority by providing this minimum federal definition of child abuse and neglect. Each state defines child abuse and neglect in its own statutes and policies and the child welfare agencies determine the appropriate response for the alleged maltreatment based on those statutes and policies. States map their own codes to the NCANDS codes (see chapter 1).
In most states, the majority of reports receive an investigation. An investigation response results in a determination (also known as a disposition) about the alleged child maltreatment. The two most prevalent NCANDS dispositions are:
■ Substantiated: An investigation disposition that concludes the allegation of maltreatment or risk of maltreatment is supported or founded by state law or policy.
■ Unsubstantiated: An investigation disposition that concludes there is not sufficient evidence under state law to conclude or suspect that the child was maltreated or is at-risk of being maltreated.
Less commonly used NCANDS dispositions for investigation responses include: ■ Indicated: A disposition that concludes maltreatment could not be substantiated under
state law or policy, but there is a reason to suspect that at least one child may have been maltreated or is at-risk of maltreatment. This disposition is applicable only to states that distinguish between substantiated and indicated dispositions.
■ Intentionally false: A disposition that concludes the person who made the allegation of maltreatment knew that the allegation was not true.
■ Closed with no finding: A disposition that does not conclude with a specific finding because the CPS response could not be completed. This disposition is often assigned when CPS is unable to locate the alleged victim.
■ No alleged maltreatment: A disposition for a child who receives a CPS response, but is not the subject of an allegation or any finding of maltreatment. Some states have laws
CHAPTER 3
chApter 3: Children 17Child Maltreatment 2017
requiring all children in a household receive a CPS response if any child in the household is the subject of a CPS response.
■ Other: States may use the category of “other” if none of the above is applicable.
State statutes also establish the level of evidence needed to determine a disposition of substantiated or indicated. (See Appendix C, State Characteristics for each state’s level of evidence.) These statutes influence how CPS agencies respond to the safety needs of the children who are the subjects of child maltreatment reports.
Alternative ResponseIn some states, reports of maltreatment may not be investigated, but are instead assigned to an alternative track, called alternative response, family assessment response, or differential response. Cases receiving this response often include early determinations that the children have a low or moderate risk of maltreatment. According to states, alternative responses usually include the voluntary acceptance of CPS services and the agreement of family needs. These cases do not result in a formal determination regarding the maltreatment allegation or alleged perpetrator. The term disposition is used when referring to both investigation response and alternative response. In NCANDS, alternative response is defined as:
■ Alternative response: The provision of a response other than an investigation that determines if a child or family needs services. A determination of maltreatment is not made and a perpetrator is not determined.
Prior to the Child Maltreatment 2015 report, children who received an alternative response were presented separately as alternative response victims and alternative response nonvictims. Beginning with the Child Maltreatment 2015 report, children with dispositions of either alternative response victim or alternative response nonvictim are presented in a single category without reference to the victim status. This is done to better align NCANDS’ use of the alterna-tive response data to child welfare practice, which does not determine if the child is a victim.
Variations in how states define and implement alternative response programs continue. For example, several states mention that they have an alternative response program that is not reported to NCANDS. For some of these states, the alternative response programs provide services for families regardless of whether there were any allegations of child maltreat-ment. Some states restrict who can receive an alternative response by the type of abuse. For example, several states mention that children who are alleged victims of sexual abuse must receive an investigation response and are not eligible for an alternative response. Another variation in reporting or reason why alternative response program data may not be reported to NCANDS is that the program may not be implemented statewide. To test implementation feasibility, states often first pilot or rollout programs in select counties. Full implementation may depend on the results of the initial pilot or rollout. Some states, or counties within states, implemented an alternative response program and terminated the program a few years later. Readers are encouraged to review Appendix D, State Commentary, for more information about these programs.
In addition, the Child Welfare Information Gateway compiled alternative response research documents, reports from the National Quality Improvement Center on Differential Response, and examples of state alternative response programs on its website at https://www.childwelfare.gov/topics/responding/alternative.
chApter 3: Children 18Child Maltreatment 2017
Unique and Duplicate CountsAll NCANDS reporting states have the ability to assign a unique identifier, within the state, to each child who receives a CPS response. These unique identifiers enable two ways to count children:
■ Duplicate count of children: Counting a child each time he or she is the subject of a report. This count also is called a report-child pair. For example, a duplicate count of children who received an investigation response or alternative response counts each child for each CPS response.
■ Unique count of children: Counting a child once, regardless of the number of times he or she is the subject of a report. For example, a unique count of victims by age counts the child’s age in the first report where the child has a victim disposition.
For FFY 2017, 52 states submitted unique counts of children. Unique counts are used for most analyses in this chapter. Please refer to the table notes for specifics on counts.
Children Who Received an Investigation or Alternative Response (unique count of children)
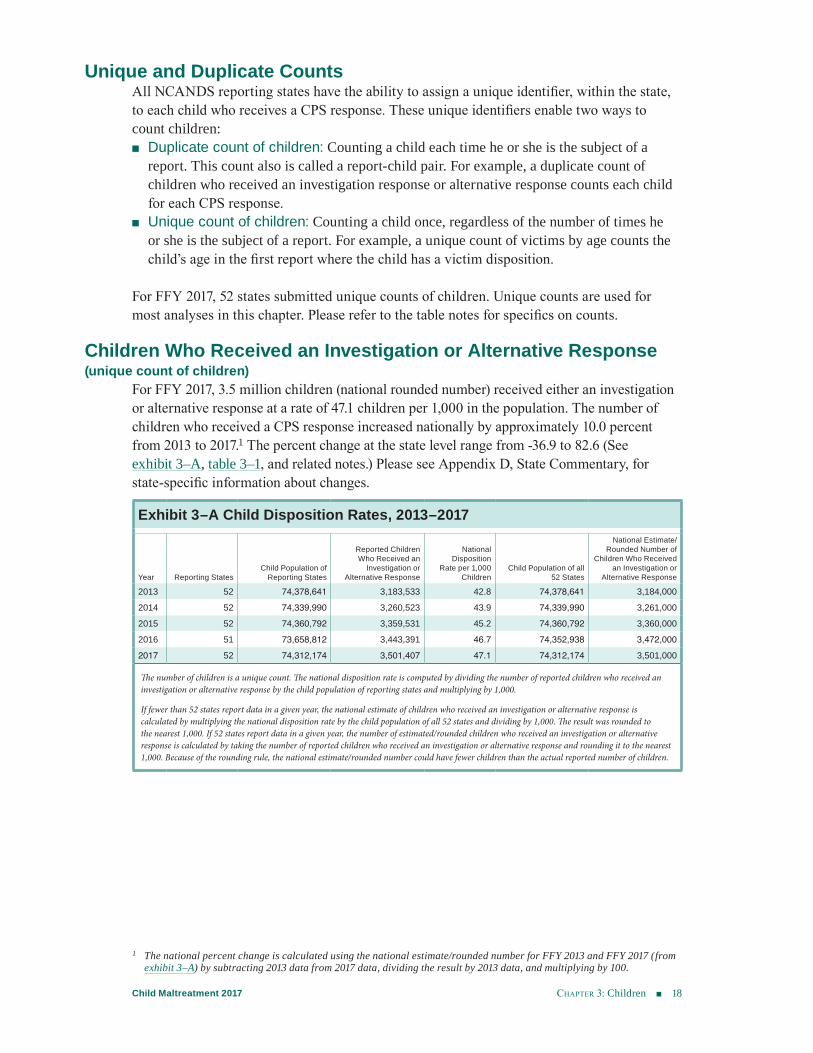
For FFY 2017, 3.5 million children (national rounded number) received either an investigation or alternative response at a rate of 47.1 children per 1,000 in the population. The number of children who received a CPS response increased nationally by approximately 10.0 percent from 2013 to 2017.1 The percent change at the state level range from -36.9 to 82.6 (See exhibit 3–A, table 3–1, and related notes.) Please see Appendix D, State Commentary, for state-specific information about changes.
1 The national percent change is calculated using the national estimate/rounded number for FFY 2013 and FFY 2017 (from exhibit 3–A) by subtracting 2013 data from 2017 data, dividing the result by 2013 data, and multiplying by 100.
Exhibit 3–A Child Disposition Rates, 2013–2017
Year Reporting StatesChild Population of
Reporting States
Reported Children Who Received an
Investigation or Alternative Response
National Disposition
Rate per 1,000 Children
Child Population of all 52 States
National Estimate/ Rounded Number of
Children Who Received an Investigation or
Alternative Response
2013 52 74,378,641 3,183,533 42.8 74,378,641 3,184,0002014 52 74,339,990 3,260,523 43.9 74,339,990 3,261,0002015 52 74,360,792 3,359,531 45.2 74,360,792 3,360,0002016 51 73,658,812 3,443,391 46.7 74,352,938 3,472,0002017 52 74,312,174 3,501,407 47.1 74,312,174 3,501,000
The number of children is a unique count. The national disposition rate is computed by dividing the number of reported children who received an investigation or alternative response by the child population of reporting states and multiplying by 1,000.
If fewer than 52 states report data in a given year, the national estimate of children who received an investigation or alternative response is calculated by multiplying the national disposition rate by the child population of all 52 states and dividing by 1,000. The result was rounded to the nearest 1,000. If 52 states report data in a given year, the number of estimated/rounded children who received an investigation or alternative response is calculated by taking the number of reported children who received an investigation or alternative response and rounding it to the nearest 1,000. Because of the rounding rule, the national estimate/rounded number could have fewer children than the actual reported number of children.
Chapter 3: Children 19Child Maltreatment 2017
A common question when looking at child maltreatment data is how often the same child is included in a report (screened-in referral) within the same FFY. Eighty-three (83.2%) percent, or approximately 2.9 million children, are included in a single report and 12.8 percent (447,967) of children are in two reports. Four percent (4.0%) are in three or more reports within FFY 2017. (See exhibit 3–B and related notes.)
Children Who Received an Investigation or Alternative Response by Disposition (duplicate count of children)
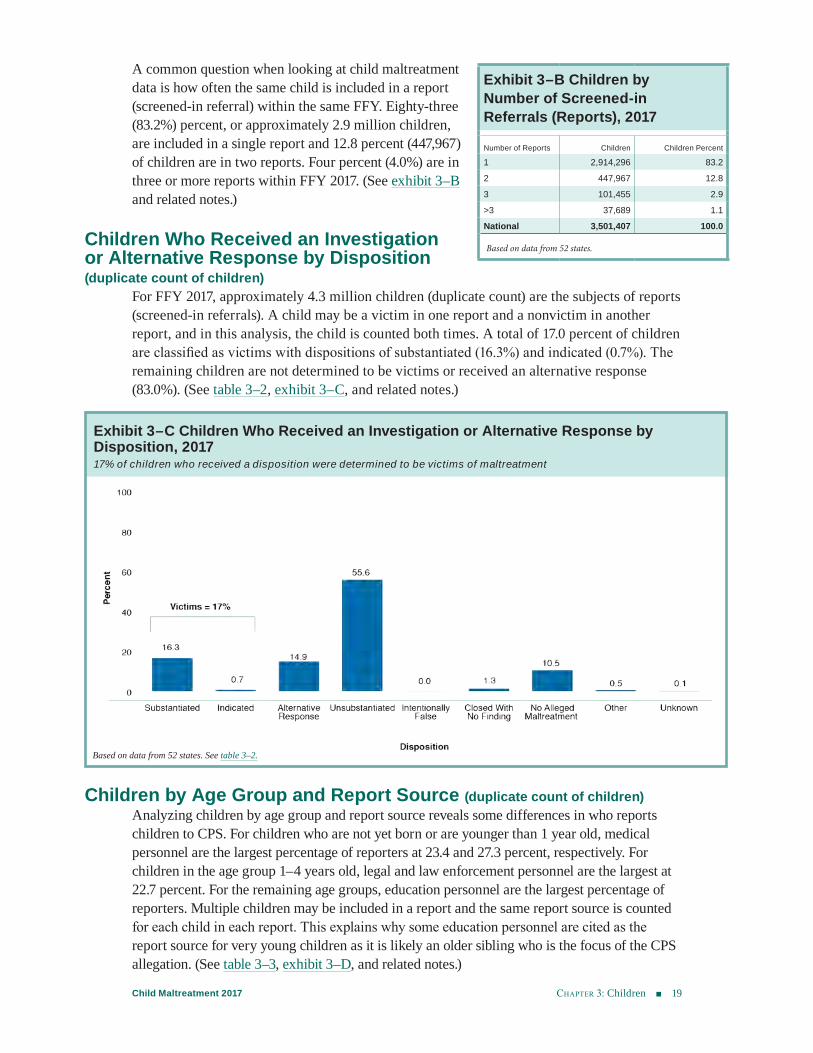
For FFY 2017, approximately 4.3 million children (duplicate count) are the subjects of reports (screened-in referrals). A child may be a victim in one report and a nonvictim in another report, and in this analysis, the child is counted both times. A total of 17.0 percent of children are classified as victims with dispositions of substantiated (16.3%) and indicated (0.7%). The remaining children are not determined to be victims or received an alternative response (83.0%). (See table 3–2, exhibit 3–C, and related notes.)
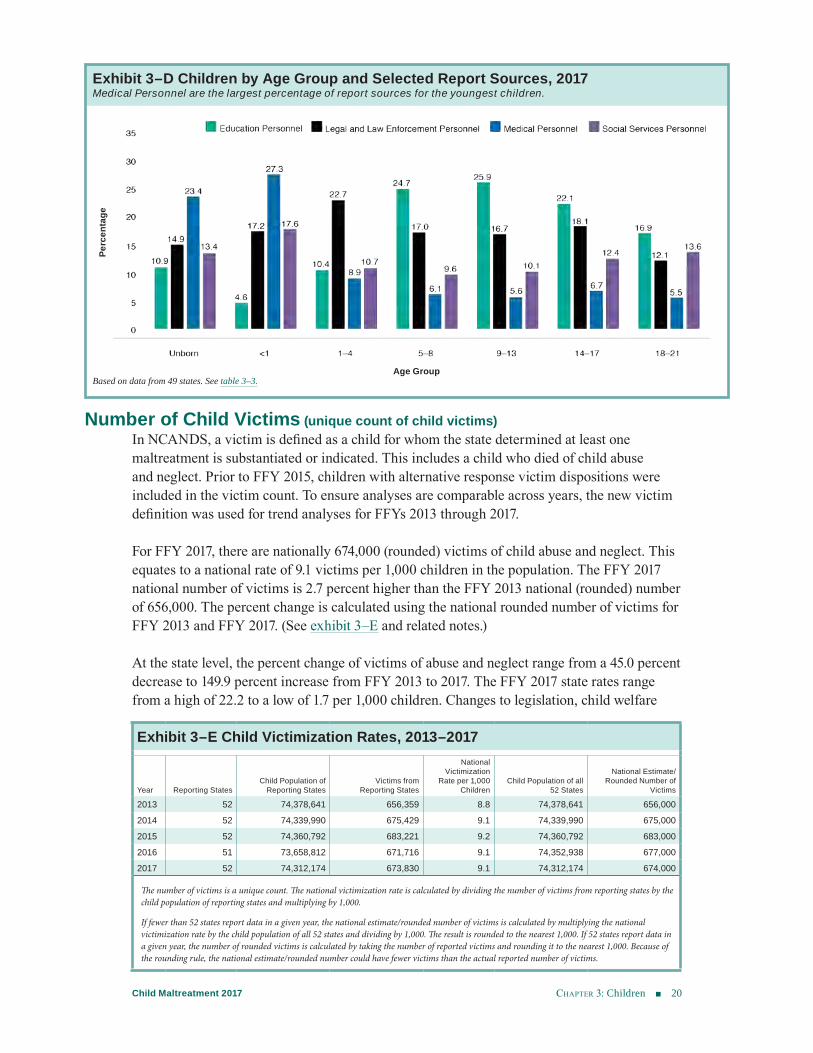
Children by Age Group and Report Source (duplicate count of children)Analyzing children by age group and report source reveals some differences in who reports children to CPS. For children who are not yet born or are younger than 1 year old, medical personnel are the largest percentage of reporters at 23.4 and 27.3 percent, respectively. For children in the age group 1–4 years old, legal and law enforcement personnel are the largest at 22.7 percent. For the remaining age groups, education personnel are the largest percentage of reporters. Multiple children may be included in a report and the same report source is counted for each child in each report. This explains why some education personnel are cited as the report source for very young children as it is likely an older sibling who is the focus of the CPS allegation. (See table 3–3, exhibit 3–D, and related notes.)
Exhibit 3–C Children Who Received an Investigation or Alternative Response by Disposition, 2017 17% of children who received a disposition were determined to be victims of maltreatment
Based on data from 52 states. See table 3–2.
Exhibit 3–B Children by Number of Screened-in Referrals (Reports), 2017
Number of Reports Children Children Percent
1 2,914,296 83.22 447,967 12.83 101,455 2.9>3 37,689 1.1National 3,501,407 100.0
Based on data from 52 states.
Chapter 3: Children 20Child Maltreatment 2017
Number of Child Victims (unique count of child victims)In NCANDS, a victim is defined as a child for whom the state determined at least one maltreatment is substantiated or indicated. This includes a child who died of child abuse and neglect. Prior to FFY 2015, children with alternative response victim dispositions were included in the victim count. To ensure analyses are comparable across years, the new victim definition was used for trend analyses for FFYs 2013 through 2017.
For FFY 2017, there are nationally 674,000 (rounded) victims of child abuse and neglect. This equates to a national rate of 9.1 victims per 1,000 children in the population. The FFY 2017 national number of victims is 2.7 percent higher than the FFY 2013 national (rounded) number of 656,000. The percent change is calculated using the national rounded number of victims for FFY 2013 and FFY 2017. (See exhibit 3–E and related notes.)
At the state level, the percent change of victims of abuse and neglect range from a 45.0 percent decrease to 149.9 percent increase from FFY 2013 to 2017. The FFY 2017 state rates range from a high of 22.2 to a low of 1.7 per 1,000 children. Changes to legislation, child welfare
Exhibit 3–D Children by Age Group and Selected Report Sources, 2017Medical Personnel are the largest percentage of report sources for the youngest children.
Based on data from 49 states. See table 3–3.
Exhibit 3–E Child Victimization Rates, 2013–2017
Year Reporting StatesChild Population of
Reporting StatesVictims from
Reporting States
National Victimization
Rate per 1,000 Children
Child Population of all 52 States
National Estimate/Rounded Number of
Victims
2013 52 74,378,641 656,359 8.8 74,378,641 656,0002014 52 74,339,990 675,429 9.1 74,339,990 675,0002015 52 74,360,792 683,221 9.2 74,360,792 683,0002016 51 73,658,812 671,716 9.1 74,352,938 677,0002017 52 74,312,174 673,830 9.1 74,312,174 674,000
The number of victims is a unique count. The national victimization rate is calculated by dividing the number of victims from reporting states by the child population of reporting states and multiplying by 1,000.
If fewer than 52 states report data in a given year, the national estimate/rounded number of victims is calculated by multiplying the national victimization rate by the child population of all 52 states and dividing by 1,000. The result is rounded to the nearest 1,000. If 52 states report data in a given year, the number of rounded victims is calculated by taking the number of reported victims and rounding it to the nearest 1,000. Because of the rounding rule, the national estimate/rounded number could have fewer victims than the actual reported number of victims.
Age Group
Perc
enta
ge
chApter 3: Children 21Child Maltreatment 2017
policy, and practice that may contribute to an increase or decrease in the number of victims are provided by states in Appendix D, State Commentary. For example, one state changed its level of evidence to substantiate maltreatment from clear and convincing to preponder-ance. As the new level does not require as much evidence to substantiate as the previous level, one would expect to see an increase in the number of victims. See Appendix C, State Characteristics, for more information on level of evidence. (See table 3–4 and related notes.)
During FFY 2013–2017, the national rates remained relatively stable for victims who did not have a prior history of victimization (known as first-time victims). During the 5 years, the national rates fluctuated from a low of 6.5 to a high of 6.7 per 1,000 children in the population. States use the disposition date of prior substantiated or indicated maltreatments to determine whether the victim was a first-time victim. (See table 3–5 and related notes.)
To better understand prior victimization, a new 3-year retrospective analysis uses the com-bination of report date and unique child identifiers to determine the number and disposition type of victims’ prior CPS contacts. A prior CPS contact is defined as any investigation or assessment that results in a disposition prior to the current disposition. This analysis examines nonfatal victims in states’ FFY 2017 submissions, with report dates of up to 3 years prior to the date of the most recent victim report. (See chapter 4 for a similar analysis of fatal victims.) Five percent (5.0%) of victims have prior victim contacts, and 13.0 percent have prior nonvictim contacts. Some victims (1.8%) have both victim and nonvictim prior contacts. (See exhibit 3–F and related notes.)
Child Victim Demographics (unique count of child victims)The youngest children are the most vulnerable to maltreatment. Nationally, states report that more than one-quarter (28.5%) of victims are younger than 3 years old. The victimization rate is highest for children younger than 1 year old at 25.3 per 1,000 children in the popula-tion of the same age. This is more than double the rate of victims who are 1 year old (11.7 per 1,000 children). Victims who are 2 or 3 years old have victimization rates of 11.0 and 10.4 victims per 1,000 children of those respective ages in the population. Readers may notice some states have lower rates across age groups than other states. The states with lower rates may assign low-risk cases to alternative response or have other state policies or programs in place for maltreatment allegations. In general, the rate of victimization decreases with the child’s age. (See table 3–6, exhibit 3–G, and related notes.)
The percentages of child victims are similar for both boys (48.6%) and girls (51.0%). The sex is unknown for 0.4 percent of victims. The FFY 2017 victimization rate for girls is 9.5 per
Exhibit 3–F Nonfatal Victims by Prior CPS Contact, 2017
Number of Prior CPS Contacts Victims
Victims With Prior Victim Contact
Victims With Prior Victim Contact
PercentageVictims With Prior Nonvictim Contact
Victims With Prior Nonvictim Contact
Percentage
Victims With Prior Victim and
Nonvictim Contact
Victims With Prior Victim
and Nonvictim Contact
Percentage
1 - 29,782 4.5 68,735 10.4 - -2 - 2,888 0.4 13,409 2.0 7,856 1.2
3 - 377 0.1 2,949 0.4 2,810 0.4
>3 - 70 0.0 1,033 0.2 1,429 0.2
National 662,150 33,117 5.0 86,126 13.0 12,095 1.8
Based on data from 50 states. Percent is calculated against the number of total unique victims. Reports occurring on the same day as the prior report are excluded. Prior CPS contacts with a report date of up to 3 years prior to the date of the most recent victim report are counted. States are excluded from this analysis if victim child IDs are not unique across years.
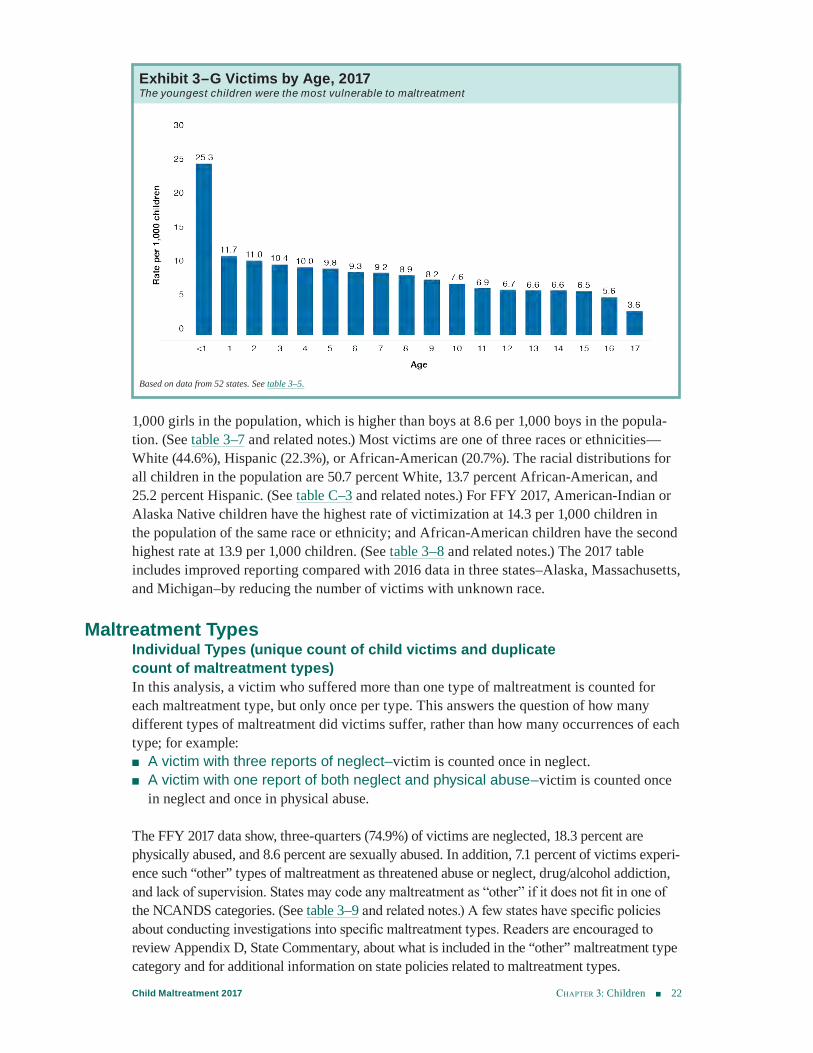
Chapter 3: Children 22Child Maltreatment 2017
1,000 girls in the population, which is higher than boys at 8.6 per 1,000 boys in the popula-tion. (See table 3–7 and related notes.) Most victims are one of three races or ethnicities—White (44.6%), Hispanic (22.3%), or African-American (20.7%). The racial distributions for all children in the population are 50.7 percent White, 13.7 percent African-American, and 25.2 percent Hispanic. (See table C–3 and related notes.) For FFY 2017, American-Indian or Alaska Native children have the highest rate of victimization at 14.3 per 1,000 children in the population of the same race or ethnicity; and African-American children have the second highest rate at 13.9 per 1,000 children. (See table 3–8 and related notes.) The 2017 table includes improved reporting compared with 2016 data in three states–Alaska, Massachusetts, and Michigan–by reducing the number of victims with unknown race.
Maltreatment TypesIndividual Types (unique count of child victims and duplicate count of maltreatment types)In this analysis, a victim who suffered more than one type of maltreatment is counted for each maltreatment type, but only once per type. This answers the question of how many different types of maltreatment did victims suffer, rather than how many occurrences of each type; for example:
■ A victim with three reports of neglect–victim is counted once in neglect. ■ A victim with one report of both neglect and physical abuse–victim is counted once
in neglect and once in physical abuse.
The FFY 2017 data show, three-quarters (74.9%) of victims are neglected, 18.3 percent are physically abused, and 8.6 percent are sexually abused. In addition, 7.1 percent of victims experi-ence such “other” types of maltreatment as threatened abuse or neglect, drug/alcohol addiction, and lack of supervision. States may code any maltreatment as “other” if it does not fit in one of the NCANDS categories. (See table 3–9 and related notes.) A few states have specific policies about conducting investigations into specific maltreatment types. Readers are encouraged to review Appendix D, State Commentary, about what is included in the “other” maltreatment type category and for additional information on state policies related to maltreatment types.
Exhibit 3–G Victims by Age, 2017 The youngest children were the most vulnerable to maltreatment
Based on data from 52 states. See table 3–5.
chApter 3: Children 23Child Maltreatment 2017
Combination of Types (unique count of child victims and unique count of maltreatment types)Polyvictimization in child welfare refers to children who experience multiple types of maltreatment. The FFY 2017 data show, 85.6 percent of victims suffered a single type of maltreatment, although they could suffer a single type multiple times. For example, 62.7 percent of victims are neglected only and did not suffer additional maltreatment types. The remaining victims (14.4%) experience a combination of maltreatments. A child is considered to have suffered a combination of maltreatments if:
■ The child has two different types of maltreatment in a single report (e.g., neglect and physical abuse in the same report).
■ The child suffers different maltreatment types in several reports (e.g., neglect in one report and physical abuse in a second report).
The most common combination is neglect and physical abuse (5.2%). The other common combinations include neglect and “other”/unknown at 3.7 percent, neglect and psychological maltreatment at 1.9 percent, and neglect and sexual abuse at 1.4 percent. (See table 3–10 and related notes.)
Risk Factors Risk factors are characteristics of a child or caregiver that may increase the likelihood of child maltreatment.2 NCANDS collects data for nine child risk factors and 12 caregiver risk factors. Risk factors can be difficult to accurately assess and measure, and therefore may go undetected among many children and caregivers. In addition, some risk factors must be clini-cally diagnosed, which may not occur during the investigation or alternative response. If the case is closed prior to the diagnosis, the CPS agency may not be notified and the information will not be reported to NCANDS.
Caregiver Risk Factors (unique count of children)Caregivers with these risk factors who are included in each analysis may or may not be the perpetrators responsible for the maltreatment. For FFY 2017, data are analyzed for four caregiver risk factors with the following NCANDS definitions:
■ Alcohol abuse (caregiver)–The compulsive use of alcohol that is not of a temporary nature.
■ Drug abuse (caregiver)–The compulsive use of drugs that is not of a temporary nature. ■ Financial problem (caregiver)–A risk factor related to the family’s inability to provide
sufficient financial resources to meet minimum needs. ■ Domestic violence (caregiver)–Any abusive, violent, coercive, forceful, or threatening
act or word inflicted by one member of a family or household on another. In NCANDS, the caregiver may be the perpetrator or the victim of the domestic violence.
An analysis reviewed 3 years of data for victims with the alcohol abuse caregiver risk factor. From 2015 to 2017, there is an overall increase in the number of victims reported with the alcohol abuse caregiver risk factor, which may be partly due to better reporting. From 2015 to 2017, the percentages of victims with the alcohol abuse caregiver risk factor increased from 10.6 to 12.1. Across the years, the percentages range from a low of 2.0 to a high of 49.3. (See table 3–11 and related notes.) Three years of data also are analyzed for victims
2 IOM (Institute of Medicine) and NRC (National Research Council). 2014. New directions in child abuse and neglect research. Washington, DC: The National Academies Press.
chApter 3: Children 24Child Maltreatment 2017
with the drug abuse caregiver risk factor. The number and percentage of victims reported with the drug abuse caregiver risk factor increased from 27.1 to 30.8 percent from 2015 to 2017. Across the years, the state percentages ranged from a low of 2.3 to a high of 66.7. (See table 3–12, and related notes.)
Researchers have linked financial insecurity and housing insecurity to increased child welfare agency involvement. The association between income and child maltreatment also is supported by research.3 Thirty states report 14.9 percent of victims with the financial prob-lem caregiver risk factor. Twenty states report 12.2 percent of nonvictims with the caregiver risk factor. (See table 3–13 and related notes.) For children with the caregiver risk factor of domestic violence, the caregiver could be either the perpetrator of, the victim of, or a witness to domestic violence. More than one-quarter 27.2 percent of victims have a domestic violence caregiver risk factor and 9.1 percent of nonvictims have a domestic violence caregiver risk factor. (See table 3–14 and related notes.)
Special Focus on Victims With Alcohol and Drug Abuse Child Risk Factors (duplicate count of victims)This section includes targeted analyses on child maltreatment victims younger than 1 year old with drug and alcohol abuse child risk factors. Over the years, amendments to CAPTA have changed and added to the state requirements related substance use. As noted in the program instruction released by the Children’s Bureau:4
Since 2003, CAPTA has included a state plan requirement that the Governor of each state provide an assurance that the state has policies and procedures to address the needs of substance-exposed infants, including requirements to make appropriate referrals to CPS and other appropriate services, and a requirement to develop a plan of safe care for the affected infants. As originally incorporated in CAPTA, the provisions required states to have policies and procedures relating to “infants born and identified as being affected by illegal substance abuse or withdrawal symptoms resulting from prenatal drug exposure.” In 2010, the provision was amended by Congress to also include infants affected by Fetal Alcohol Spectrum Disorder.
In 2016, the Comprehensive Addiction and Recovery Act (CARA) was enacted which, among other provisions, amended CAPTA to remove the term “illegal” as applied to substance abuse affecting infants and to specifically require that plans of safe care address the needs of both infants and their families or caretakers. CARA also added requirements relating to data col-lection and monitoring. States will now need to report, to the maximum extent practicable:
■ The number of infants identified under subsection 106(b)(2)(B)(ii). ■ The number of such infants for whom a plan of safe care was developed. ■ The number of such infants for whom a referral was made for appropriate services, includ-
ing services for the affected family or caregiver.
The Children’s Bureau intends to collect this information through NCANDS beginning with the submission of FFY 2018 data.
3 Sedlak, A.J., Mettenburg, J., Basena, M., Petta, I., McPherson, K., Greene, A., and Li, S. (2010). Fourth National Incidence Study of Child Abuse and Neglect (NIS–4): Report to Congress. Washington, DC: U.S. Department of Health and Human Services, Administration for Children and Families.
4 U.S. Department of Health & Human Services, Administration for Children and Families, Administration on Children, Youth and Families, Children’s Bureau. (2017). Guidance on amendments made to the Child Abuse Prevention and Treatment Act (CAPTA) by Public Law 114-198, the Comprehensive Addiction and Recovery Act of 2016. Program Instruction, ACYF-CB-PI-17-02. retrieved from https://www.acf.hhs.gov/cb/resource/pi1702
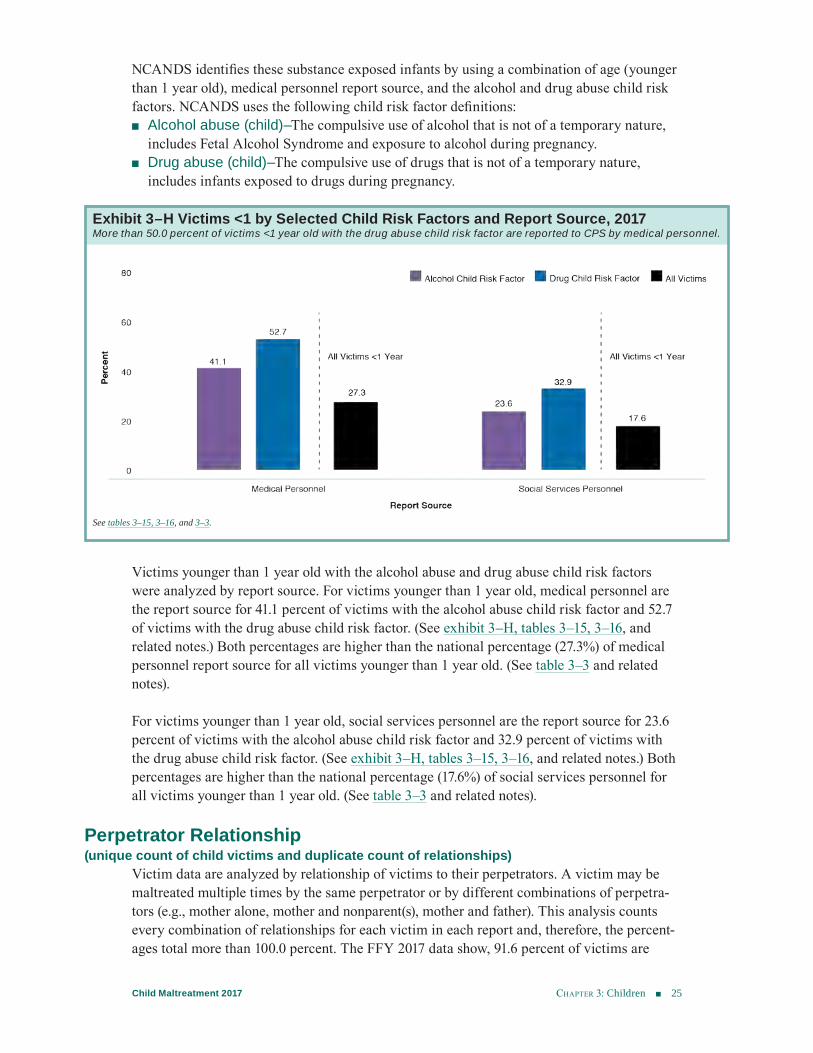
Chapter 3: Children 25Child Maltreatment 2017
NCANDS identifies these substance exposed infants by using a combination of age (younger than 1 year old), medical personnel report source, and the alcohol and drug abuse child risk factors. NCANDS uses the following child risk factor definitions:
■ Alcohol abuse (child)–The compulsive use of alcohol that is not of a temporary nature, includes Fetal Alcohol Syndrome and exposure to alcohol during pregnancy.
■ Drug abuse (child)–The compulsive use of drugs that is not of a temporary nature, includes infants exposed to drugs during pregnancy.
Victims younger than 1 year old with the alcohol abuse and drug abuse child risk factors were analyzed by report source. For victims younger than 1 year old, medical personnel are the report source for 41.1 percent of victims with the alcohol abuse child risk factor and 52.7 of victims with the drug abuse child risk factor. (See exhibit 3–H, tables 3–15, 3–16, and related notes.) Both percentages are higher than the national percentage (27.3%) of medical personnel report source for all victims younger than 1 year old. (See table 3–3 and related notes).
For victims younger than 1 year old, social services personnel are the report source for 23.6 percent of victims with the alcohol abuse child risk factor and 32.9 percent of victims with the drug abuse child risk factor. (See exhibit 3–H, tables 3–15, 3–16, and related notes.) Both percentages are higher than the national percentage (17.6%) of social services personnel for all victims younger than 1 year old. (See table 3–3 and related notes).
Perpetrator Relationship (unique count of child victims and duplicate count of relationships)
Victim data are analyzed by relationship of victims to their perpetrators. A victim may be maltreated multiple times by the same perpetrator or by different combinations of perpetra-tors (e.g., mother alone, mother and nonparent(s), mother and father). This analysis counts every combination of relationships for each victim in each report and, therefore, the percent-ages total more than 100.0 percent. The FFY 2017 data show, 91.6 percent of victims are
Exhibit 3–H Victims <1 by Selected Child Risk Factors and Report Source, 2017More than 50.0 percent of victims <1 year old with the drug abuse child risk factor are reported to CPS by medical personnel.
See tables 3–15, 3–16, and 3–3.
chApter 3: Children 26Child Maltreatment 2017
maltreated by one or both parents. The parent(s) could have acted together, acted alone, or acted with up to two other people to maltreat the child.
Sixty-nine percent of victims are maltreated by a mother, either acting alone (40.8%) or with a father and/or nonparent (28.2%). More than 13.0 percent (13.5%) of victims are maltreated by a perpetrator who was not the child’s parent. The largest categories in the nonparent group are relative (4.7%), partner of parent (2.9%), and “other” (2.7%). (See table 3–17 and related notes.) The NCANDS category of “other” perpetrator relationship includes any relationship that does not map to one of the NCANDS relationship categories. According to states’ com-mentary, this category includes nonrelated adult, nonrelated child, foster sibling, babysitter, household staff, clergy, and school personnel.
Exhibit and Table NotesThe following pages contain the data tables referenced in chapter 3. Specific information about state submissions can be found in Appendix D, State Commentary. Additional infor-mation regarding the exhibits and tables is provided below.
General ■ During data analyses, thresholds are set to ensure data quality is balanced with the need to
report data from as many states as possible. States may be excluded from an analysis for data quality issues. Exclusion rules are listed in the individual table notes below. Not every table has exclusion rules.
■ The data for all tables are from the Child File unless otherwise noted. Rates are per 1,000 children in the population.
■ Rates are calculated by dividing the relevant reported count (child, victim, first-time victim, etc.) by the child population count (children, by age, etc.) and multiplying by 1,000.
■ The count of victims includes children with dispositions of substantiated or indicated. Children with dispositions of alternative response victims are not included in the victim count.
■ NCANDS uses the child population estimates that are released annually by the U.S. Census Bureau. These population estimates are provided in Appendix C, State Characteristics.
■ The row labeled Reporting States displays the count of states that provided data for that analysis.
■ National totals and calculations appear in a single row labeled National instead of separate rows labeled total, rate, or percent.
Table 3–1 Children Who Received an Investigation or Alternative Response, 2013–2017
■ The number of children is a unique count. ■ The percent change was calculated by subtracting 2013 data from 2017 data, dividing the
result by 2013 data, and multiplying by 100.
Table 3–2 Children Who Received an Investigation or Alternative Response by Disposition, 2017
■ The number of children is a duplicate count. ■ Many states conduct investigations for all children in a family when any child is the subject
of an investigation. In these states, a disposition of “no alleged maltreatment” is assigned to siblings who are not the subjects of an allegation and are not found to be victims. These children may receive an alternative response, an investigation, or both.
chApter 3: Children 27Child Maltreatment 2017
Table 3–3 Children by Age Group and Report Source, 2017
■ The number of children is a duplicate count. ■ States are excluded from this analysis if more than 25.0 percent of report sources are submit-
ted as unknown. Children reported with unknown ages are excluded from this analysis.
Table 3–4 Child Victims, 2013–2017 ■ The number of victims is a unique count. ■ The percent change is calculated by subtracting 2013 data from 2017 data, dividing the result
by 2013 data, and multiplying by 100.
Table 3–5 First-Time Victims, 2013–2017 ■ The number of first-time victims is a unique count. ■ States with 95.0 percent or more first-time victims are excluded from this analysis. ■ States are instructed to check whether there was a disposition date of substantiated or
indicated associated with the same child prior to the disposition date of the current victim report. States may have different abilities and criteria for how far back they check for first-time victims.
Table 3–6 Victims by Age, 2017
■ The number of victims is a unique count. ■ There are no population data for unknown age and, therefore, no rates.
Table 3–7 Victims by Sex, 2017
■ The number of victims is a unique count. ■ There are no population data for children with unknown sex and, therefore, no rates.
Table 3–8 Victims by Race and Ethnicity, 2017
■ The number of victims is a unique count. ■ Counts associated with each racial group are exclusive and do not include Hispanic ethnicity. ■ Only those states that report both race and ethnicity are included in this analysis. ■ States are excluded from this analysis if more than 25.0 percent of victims are reported
without a race or ethnicity (reported as blank). Table 3–9 Maltreatment Types of Victims, 2017
■ A child may be the victim of more than one type of maltreatment, therefore, the maltreat-ment type count is a duplicate count.
■ A child is counted in each maltreatment type category only once, regardless of the number of times the child is reported as a victim of the maltreatment type.
Table 3–10 Maltreatment Type Combinations, 2017
■ Combinations are for unique children within and across unique records. This means a child with a report that includes neglect only and a separate report that includes physical abuse only is counted once in the combined Neglect and Physical Abuse category.
■ Categories are based on up to four maltreatment type combinations. ■ Neglect includes medical neglect. ■ The categories are mutually exclusive.
chApter 3: Children 28Child Maltreatment 2017
Table 3–11 Victims With Alcohol Abuse Caregiver Risk Factor, 2015–2017
■ The number of victims is a unique count. ■ A victim is counted only once if there is more than one report in which this victim has this
caregiver risk factor. ■ The counts on this table are exclusive and follow a hierarchy rule. If a victim is reported both
with and without the caregiver risk factor, the victim is counted once with the caregiver risk factor.
■ States are excluded from this analysis if fewer than 2.0 percent of victims are reported with this caregiver risk factor.
■ States are excluded from this analysis if they are not able to differentiate between alcohol abuse and drug abuse caregiver risk factors and reported both risk factors for the same children in both caregiver risk factor categories.
Table 3–12 Victims With Drug Abuse Caregiver Risk Factor, 2015–2017
■ The number of victims is a unique count. ■ A victim is counted only once if there is more than one report in which this victim has this
caregiver risk factor. ■ The counts on this table are exclusive and follow a hierarchy rule. If a victim is reported both
with and without the caregiver risk factor, the victim is counted once with the caregiver risk factor.
■ States were excluded from this analysis if fewer than 2.0 percent of the victims or nonvictims has this caregiver risk factor.
■ States are excluded from this analysis if they are not able to differentiate between alcohol abuse and drug abuse caregiver risk factors and report both risk factors for the same children in both caregiver risk factor categories.
Table 3–13 Children With Financial Problem Caregiver Risk Factor, 2017
■ The number of victims and nonvictims is a unique count. ■ The counts on this table are exclusive and follow a hierarchy rule. If a child is reported both
as a victim and a nonvictim, the child is counted once as a victim. If a child is reported both with and without the caregiver risk factor, the child is counted once with the caregiver risk factor.
■ States are excluded from this analysis if fewer than 2.0 percent of the victims or nonvictims are reported with this caregiver risk factor.
Table 3–14 Children With Domestic Violence Caregiver Risk Factor 2017
■ The number of victims and nonvictims is a unique count. ■ The counts on this table are exclusive and follow a hierarchy rule. If a child is reported both
as a victim and a nonvictim, the child is counted once as a victim. If a child is reported both with and without the caregiver risk factor, the child is counted once with the caregiver risk factor.
■ States are excluded from this analysis if fewer than 2.0 percent of the victims or nonvictims are reported with this caregiver risk factor.
Table 3–15 Victims <1 Year With Alcohol Abuse Child Risk Factor by Report Source, 2017
■ The number of victims with the alcohol abuse child risk factor is a duplicate count. ■ A victim is counted only once if there is more than one report in which this victim had
this child risk factor. The counts on this table are exclusive and follow a hierarchy rule. If a
chApter 3: Children 29Child Maltreatment 2017
victim is reported both with and without the child risk factor, the victim is counted once with the child risk factor.
■ States are excluded from this analysis if fewer than 0.2 percent of victims are submitted with this risk factor.
■ States are excluded from this analysis if more than 25.0 percent of victims are submitted with unknown report sources.
■ States are excluded from this analysis if more than 40.0 percent of victims younger than 1 year old are submitted with the “other” report source.
■ States are excluded from this analysis if they were not able to differentiate between alcohol abuse and drug abuse child risk factors and report both risk factors for the same children in both child risk factor categories.
■ Victims in the category of unborn are not included in this analysis.
Table 3–16 Victims <1 Year With Drug Abuse Child Risk Factor by Report Source, 2017
■ The number of victims with the drug abuse child risk factor is a duplicate count. ■ A victim is counted only once if there is more than one report in which this victim has this
child risk factor. The counts on this table are exclusive and follow a hierarchy rule. If a victim is reported both with and without the child risk factor, the victim is counted once with the child risk factor.
■ States are excluded from this analysis if fewer than 0.2 percent of victims are submitted with this risk factor.
■ States are excluded from this analysis if more than 25.0 percent of report sources are submit-ted as unknown.
■ States are excluded from this analysis if more than 40.0 percent of victims younger than 1 year old are submitted with the “other” report source.
■ States are excluded from this analysis if they are not able to differentiate between alcohol abuse and drug abuse child risk factors and report both risk factors for the same children in both child risk factor categories.
■ Victims in the category of unborn are not included in this analysis.
Table 3–17 Victims by Relationship to Their Perpetrators, 2017 ■ States are excluded from this analysis if more than 50.0 percent of perpetrators are reported
with an “other” or unknown relationship. ■ The number of relationships is a duplicate count, and the number of victims is a unique
count. Percentages are calculated against the unique count of victims and total to more than 100.0 percent.
■ In NCANDS, a child victim may have up to three perpetrators. ■ Nonparent perpetrators counted in combination with parents (i.e., Mother and Nonparent(s);
Father and Nonparent(s); or Mother, Father, and Nonparent) are not also counted in the individual categories listed under Nonparent.
■ The relationship categories listed under Nonparent perpetrator include any perpetrator relationship that was not identified as an adoptive parent, a biological parent, or a stepparent.
■ The Unknown relationship category includes victims with an unknown perpetrator. ■ Some states may be not able to collect and report on Group Home and Residential Facility
Staff perpetrators due to system limitations or jurisdictional issues.
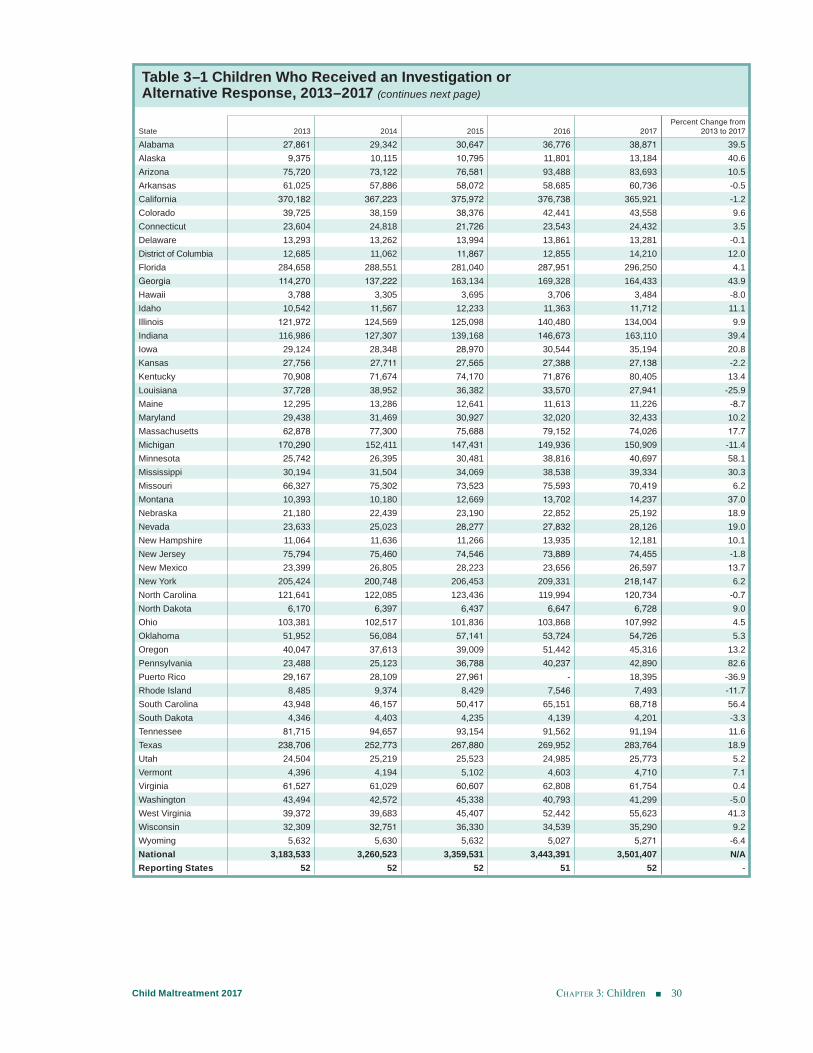
chApter 3: Children 30Child Maltreatment 2017
Table 3–1 Children Who Received an Investigation or Alternative Response, 2013–2017 (continues next page)
State 2013 2014 2015 2016 2017Percent Change from
2013 to 2017
Alabama 27,861 29,342 30,647 36,776 38,871 39.5Alaska 9,375 10,115 10,795 11,801 13,184 40.6Arizona 75,720 73,122 76,581 93,488 83,693 10.5Arkansas 61,025 57,886 58,072 58,685 60,736 -0.5California 370,182 367,223 375,972 376,738 365,921 -1.2Colorado 39,725 38,159 38,376 42,441 43,558 9.6Connecticut 23,604 24,818 21,726 23,543 24,432 3.5Delaware 13,293 13,262 13,994 13,861 13,281 -0.1District of Columbia 12,685 11,062 11,867 12,855 14,210 12.0Florida 284,658 288,551 281,040 287,951 296,250 4.1Georgia 114,270 137,222 163,134 169,328 164,433 43.9Hawaii 3,788 3,305 3,695 3,706 3,484 -8.0Idaho 10,542 11,567 12,233 11,363 11,712 11.1Illinois 121,972 124,569 125,098 140,480 134,004 9.9Indiana 116,986 127,307 139,168 146,673 163,110 39.4Iowa 29,124 28,348 28,970 30,544 35,194 20.8Kansas 27,756 27,711 27,565 27,388 27,138 -2.2Kentucky 70,908 71,674 74,170 71,876 80,405 13.4Louisiana 37,728 38,952 36,382 33,570 27,941 -25.9Maine 12,295 13,286 12,641 11,613 11,226 -8.7Maryland 29,438 31,469 30,927 32,020 32,433 10.2Massachusetts 62,878 77,300 75,688 79,152 74,026 17.7Michigan 170,290 152,411 147,431 149,936 150,909 -11.4Minnesota 25,742 26,395 30,481 38,816 40,697 58.1Mississippi 30,194 31,504 34,069 38,538 39,334 30.3Missouri 66,327 75,302 73,523 75,593 70,419 6.2Montana 10,393 10,180 12,669 13,702 14,237 37.0Nebraska 21,180 22,439 23,190 22,852 25,192 18.9Nevada 23,633 25,023 28,277 27,832 28,126 19.0New Hampshire 11,064 11,636 11,266 13,935 12,181 10.1New Jersey 75,794 75,460 74,546 73,889 74,455 -1.8New Mexico 23,399 26,805 28,223 23,656 26,597 13.7New York 205,424 200,748 206,453 209,331 218,147 6.2North Carolina 121,641 122,085 123,436 119,994 120,734 -0.7North Dakota 6,170 6,397 6,437 6,647 6,728 9.0Ohio 103,381 102,517 101,836 103,868 107,992 4.5Oklahoma 51,952 56,084 57,141 53,724 54,726 5.3Oregon 40,047 37,613 39,009 51,442 45,316 13.2Pennsylvania 23,488 25,123 36,788 40,237 42,890 82.6Puerto Rico 29,167 28,109 27,961 - 18,395 -36.9Rhode Island 8,485 9,374 8,429 7,546 7,493 -11.7South Carolina 43,948 46,157 50,417 65,151 68,718 56.4South Dakota 4,346 4,403 4,235 4,139 4,201 -3.3Tennessee 81,715 94,657 93,154 91,562 91,194 11.6Texas 238,706 252,773 267,880 269,952 283,764 18.9Utah 24,504 25,219 25,523 24,985 25,773 5.2Vermont 4,396 4,194 5,102 4,603 4,710 7.1Virginia 61,527 61,029 60,607 62,808 61,754 0.4Washington 43,494 42,572 45,338 40,793 41,299 -5.0West Virginia 39,372 39,683 45,407 52,442 55,623 41.3Wisconsin 32,309 32,751 36,330 34,539 35,290 9.2Wyoming 5,632 5,630 5,632 5,027 5,271 -6.4National 3,183,533 3,260,523 3,359,531 3,443,391 3,501,407 N/AReporting States 52 52 52 51 52 -
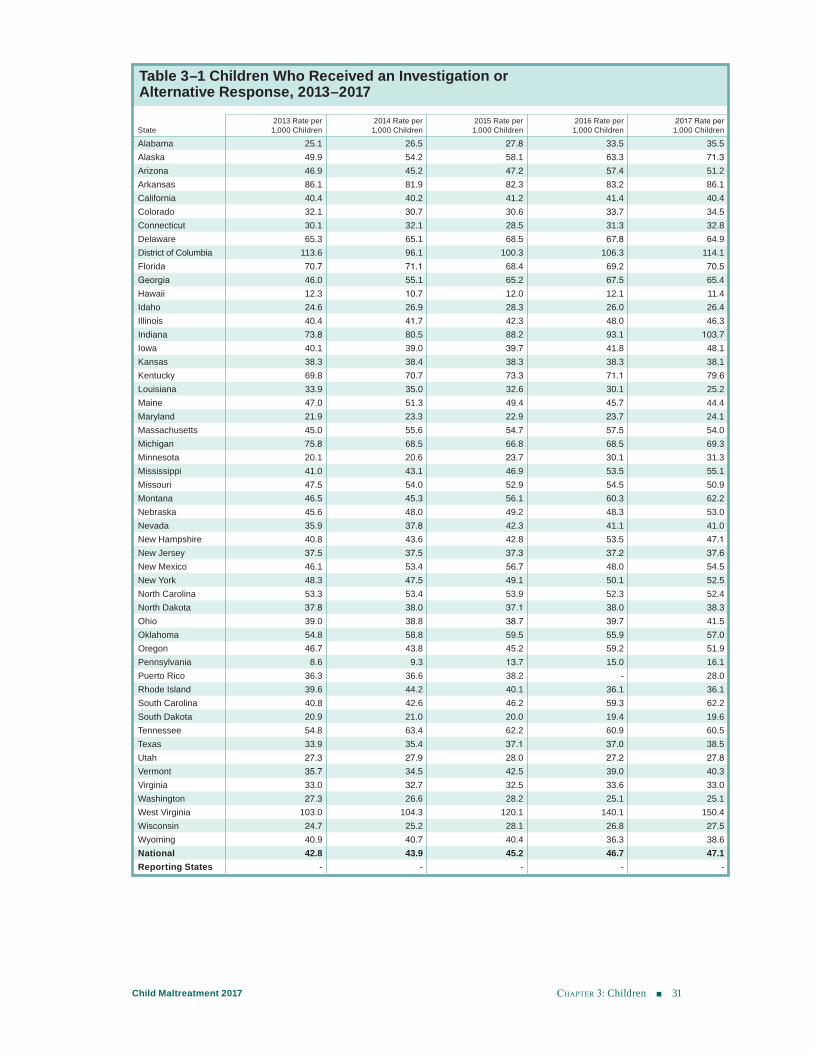
chApter 3: Children 31Child Maltreatment 2017
Table 3–1 Children Who Received an Investigation or Alternative Response, 2013–2017
State2013 Rate per
1,000 Children2014 Rate per
1,000 Children2015 Rate per
1,000 Children2016 Rate per
1,000 Children2017 Rate per
1,000 Children
Alabama 25.1 26.5 27.8 33.5 35.5Alaska 49.9 54.2 58.1 63.3 71.3Arizona 46.9 45.2 47.2 57.4 51.2Arkansas 86.1 81.9 82.3 83.2 86.1California 40.4 40.2 41.2 41.4 40.4Colorado 32.1 30.7 30.6 33.7 34.5Connecticut 30.1 32.1 28.5 31.3 32.8Delaware 65.3 65.1 68.5 67.8 64.9District of Columbia 113.6 96.1 100.3 106.3 114.1Florida 70.7 71.1 68.4 69.2 70.5Georgia 46.0 55.1 65.2 67.5 65.4Hawaii 12.3 10.7 12.0 12.1 11.4Idaho 24.6 26.9 28.3 26.0 26.4Illinois 40.4 41.7 42.3 48.0 46.3Indiana 73.8 80.5 88.2 93.1 103.7Iowa 40.1 39.0 39.7 41.8 48.1Kansas 38.3 38.4 38.3 38.3 38.1Kentucky 69.8 70.7 73.3 71.1 79.6Louisiana 33.9 35.0 32.6 30.1 25.2Maine 47.0 51.3 49.4 45.7 44.4Maryland 21.9 23.3 22.9 23.7 24.1Massachusetts 45.0 55.6 54.7 57.5 54.0Michigan 75.8 68.5 66.8 68.5 69.3Minnesota 20.1 20.6 23.7 30.1 31.3Mississippi 41.0 43.1 46.9 53.5 55.1Missouri 47.5 54.0 52.9 54.5 50.9Montana 46.5 45.3 56.1 60.3 62.2Nebraska 45.6 48.0 49.2 48.3 53.0Nevada 35.9 37.8 42.3 41.1 41.0New Hampshire 40.8 43.6 42.8 53.5 47.1New Jersey 37.5 37.5 37.3 37.2 37.6New Mexico 46.1 53.4 56.7 48.0 54.5New York 48.3 47.5 49.1 50.1 52.5North Carolina 53.3 53.4 53.9 52.3 52.4North Dakota 37.8 38.0 37.1 38.0 38.3Ohio 39.0 38.8 38.7 39.7 41.5Oklahoma 54.8 58.8 59.5 55.9 57.0Oregon 46.7 43.8 45.2 59.2 51.9Pennsylvania 8.6 9.3 13.7 15.0 16.1Puerto Rico 36.3 36.6 38.2 - 28.0Rhode Island 39.6 44.2 40.1 36.1 36.1South Carolina 40.8 42.6 46.2 59.3 62.2South Dakota 20.9 21.0 20.0 19.4 19.6Tennessee 54.8 63.4 62.2 60.9 60.5Texas 33.9 35.4 37.1 37.0 38.5Utah 27.3 27.9 28.0 27.2 27.8Vermont 35.7 34.5 42.5 39.0 40.3Virginia 33.0 32.7 32.5 33.6 33.0Washington 27.3 26.6 28.2 25.1 25.1West Virginia 103.0 104.3 120.1 140.1 150.4Wisconsin 24.7 25.2 28.1 26.8 27.5Wyoming 40.9 40.7 40.4 36.3 38.6National 42.8 43.9 45.2 46.7 47.1Reporting States - - - - -
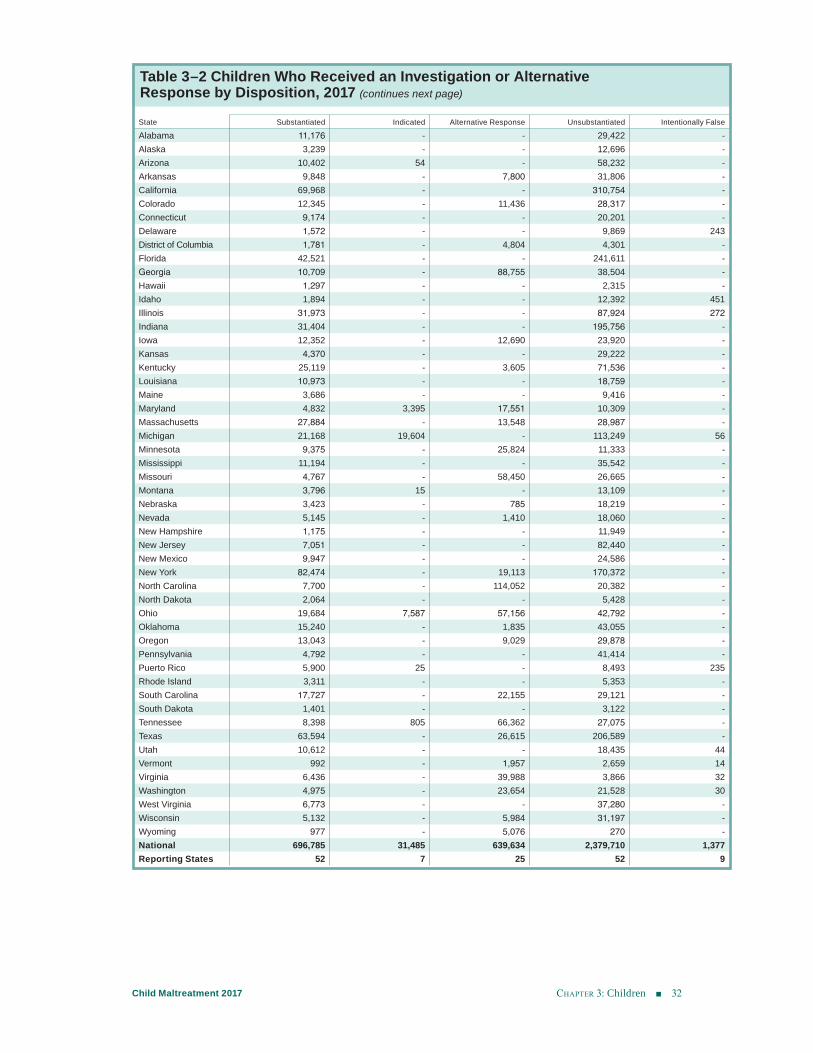
chApter 3: Children 32Child Maltreatment 2017
Table 3–2 Children Who Received an Investigation or Alternative Response by Disposition, 2017 (continues next page)
State Substantiated Indicated Alternative Response Unsubstantiated Intentionally False
Alabama 11,176 - - 29,422 -Alaska 3,239 - - 12,696 -Arizona 10,402 54 - 58,232 -Arkansas 9,848 - 7,800 31,806 -California 69,968 - - 310,754 -Colorado 12,345 - 11,436 28,317 -Connecticut 9,174 - - 20,201 -Delaware 1,572 - - 9,869 243 District of Columbia 1,781 - 4,804 4,301 -Florida 42,521 - - 241,611 -Georgia 10,709 - 88,755 38,504 -Hawaii 1,297 - - 2,315 -Idaho 1,894 - - 12,392 451 Illinois 31,973 - - 87,924 272 Indiana 31,404 - - 195,756 -Iowa 12,352 - 12,690 23,920 -Kansas 4,370 - - 29,222 -Kentucky 25,119 - 3,605 71,536 -Louisiana 10,973 - - 18,759 -Maine 3,686 - - 9,416 -Maryland 4,832 3,395 17,551 10,309 -Massachusetts 27,884 - 13,548 28,987 -Michigan 21,168 19,604 - 113,249 56 Minnesota 9,375 - 25,824 11,333 -Mississippi 11,194 - - 35,542 -Missouri 4,767 - 58,450 26,665 -Montana 3,796 15 - 13,109 -Nebraska 3,423 - 785 18,219 -Nevada 5,145 - 1,410 18,060 -New Hampshire 1,175 - - 11,949 -New Jersey 7,051 - - 82,440 -New Mexico 9,947 - - 24,586 -New York 82,474 - 19,113 170,372 -North Carolina 7,700 - 114,052 20,382 -North Dakota 2,064 - - 5,428 -Ohio 19,684 7,587 57,156 42,792 -Oklahoma 15,240 - 1,835 43,055 -Oregon 13,043 - 9,029 29,878 -Pennsylvania 4,792 - - 41,414 -Puerto Rico 5,900 25 - 8,493 235 Rhode Island 3,311 - - 5,353 -South Carolina 17,727 - 22,155 29,121 -South Dakota 1,401 - - 3,122 -Tennessee 8,398 805 66,362 27,075 -Texas 63,594 - 26,615 206,589 -Utah 10,612 - - 18,435 44 Vermont 992 - 1,957 2,659 14 Virginia 6,436 - 39,988 3,866 32 Washington 4,975 - 23,654 21,528 30 West Virginia 6,773 - - 37,280 -Wisconsin 5,132 - 5,984 31,197 -Wyoming 977 - 5,076 270 -National 696,785 31,485 639,634 2,379,710 1,377 Reporting States 52 7 25 52 9
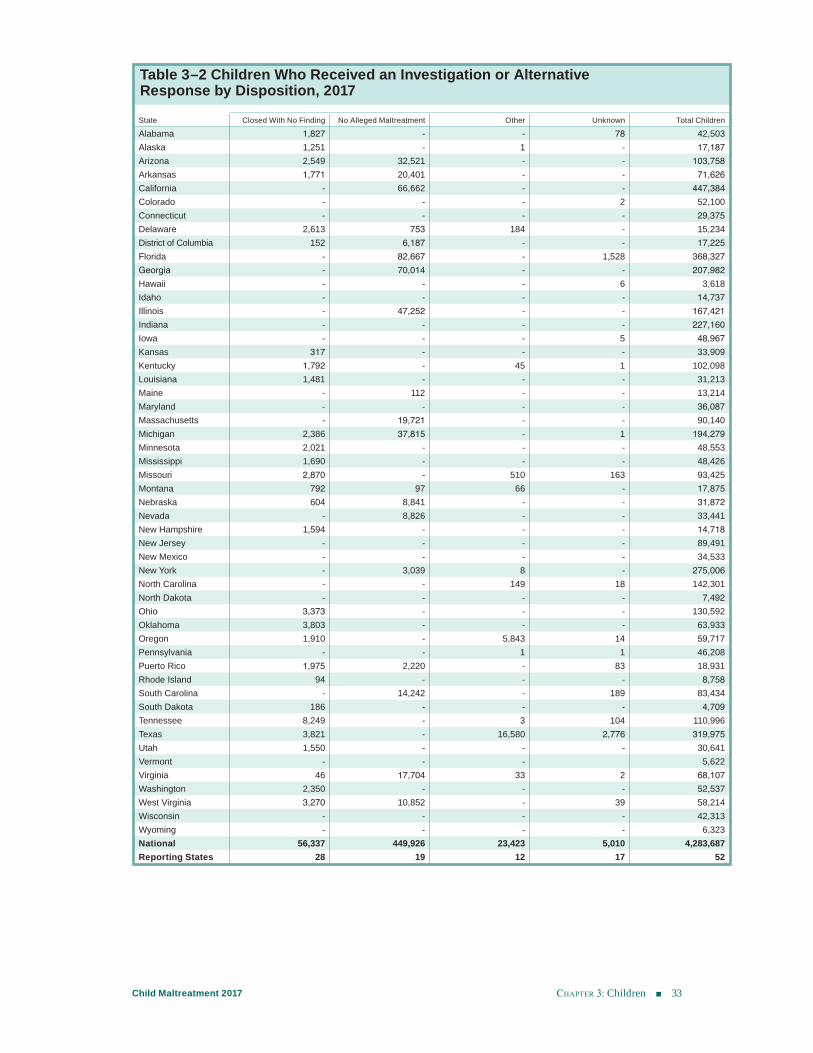
chApter 3: Children 33Child Maltreatment 2017
Table 3–2 Children Who Received an Investigation or Alternative Response by Disposition, 2017
State Closed With No Finding No Alleged Maltreatment Other Unknown Total Children
Alabama 1,827 - - 78 42,503 Alaska 1,251 - 1 - 17,187 Arizona 2,549 32,521 - - 103,758 Arkansas 1,771 20,401 - - 71,626 California - 66,662 - - 447,384 Colorado - - - 2 52,100 Connecticut - - - - 29,375 Delaware 2,613 753 184 - 15,234 District of Columbia 152 6,187 - - 17,225 Florida - 82,667 - 1,528 368,327 Georgia - 70,014 - - 207,982 Hawaii - - - 6 3,618 Idaho - - - - 14,737 Illinois - 47,252 - - 167,421 Indiana - - - - 227,160 Iowa - - - 5 48,967 Kansas 317 - - - 33,909 Kentucky 1,792 - 45 1 102,098 Louisiana 1,481 - - - 31,213 Maine - 112 - - 13,214 Maryland - - - - 36,087 Massachusetts - 19,721 - - 90,140 Michigan 2,386 37,815 - 1 194,279 Minnesota 2,021 - - - 48,553 Mississippi 1,690 - - - 48,426 Missouri 2,870 - 510 163 93,425 Montana 792 97 66 - 17,875 Nebraska 604 8,841 - - 31,872 Nevada - 8,826 - - 33,441 New Hampshire 1,594 - - - 14,718 New Jersey - - - - 89,491 New Mexico - - - - 34,533 New York - 3,039 8 - 275,006 North Carolina - - 149 18 142,301 North Dakota - - - - 7,492 Ohio 3,373 - - - 130,592 Oklahoma 3,803 - - - 63,933 Oregon 1,910 - 5,843 14 59,717 Pennsylvania - - 1 1 46,208 Puerto Rico 1,975 2,220 - 83 18,931 Rhode Island 94 - - - 8,758 South Carolina - 14,242 - 189 83,434 South Dakota 186 - - - 4,709 Tennessee 8,249 - 3 104 110,996 Texas 3,821 - 16,580 2,776 319,975 Utah 1,550 - - - 30,641 Vermont - - - 5,622 Virginia 46 17,704 33 2 68,107 Washington 2,350 - - - 52,537 West Virginia 3,270 10,852 - 39 58,214 Wisconsin - - - - 42,313 Wyoming - - - - 6,323 National 56,337 449,926 23,423 5,010 4,283,687 Reporting States 28 19 12 17 52
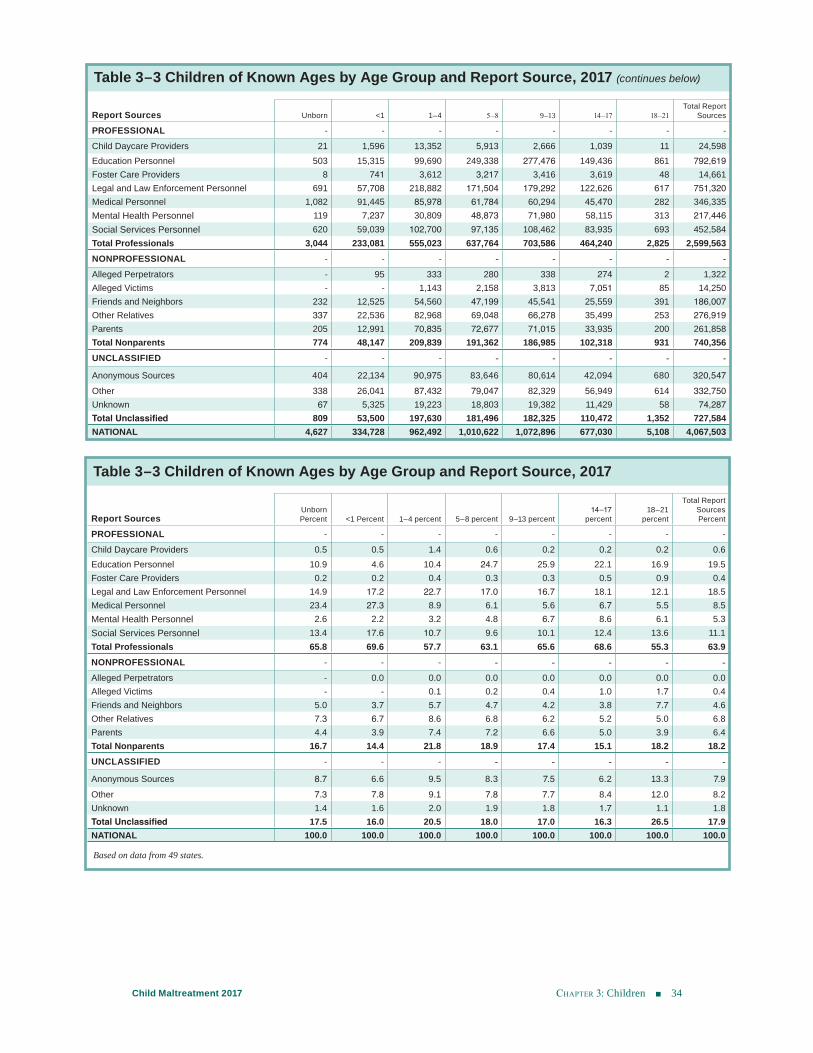
chApter 3: Children 34Child Maltreatment 2017
Table 3–3 Children of Known Ages by Age Group and Report Source, 2017 (continues below)
Report Sources Unborn <1 1–4 5–8 9–13 14–17 18–21Total Report
Sources
PROFESSIONAL - - - - - - - -Child Daycare Providers 21 1,596 13,352 5,913 2,666 1,039 11 24,598Education Personnel 503 15,315 99,690 249,338 277,476 149,436 861 792,619Foster Care Providers 8 741 3,612 3,217 3,416 3,619 48 14,661Legal and Law Enforcement Personnel 691 57,708 218,882 171,504 179,292 122,626 617 751,320Medical Personnel 1,082 91,445 85,978 61,784 60,294 45,470 282 346,335Mental Health Personnel 119 7,237 30,809 48,873 71,980 58,115 313 217,446Social Services Personnel 620 59,039 102,700 97,135 108,462 83,935 693 452,584Total Professionals 3,044 233,081 555,023 637,764 703,586 464,240 2,825 2,599,563NONPROFESSIONAL - - - - - - - -
Alleged Perpetrators - 95 333 280 338 274 2 1,322Alleged Victims - - 1,143 2,158 3,813 7,051 85 14,250Friends and Neighbors 232 12,525 54,560 47,199 45,541 25,559 391 186,007Other Relatives 337 22,536 82,968 69,048 66,278 35,499 253 276,919Parents 205 12,991 70,835 72,677 71,015 33,935 200 261,858Total Nonparents 774 48,147 209,839 191,362 186,985 102,318 931 740,356UNCLASSIFIED - - - - - - - -
Anonymous Sources 404 22,134 90,975 83,646 80,614 42,094 680 320,547Other 338 26,041 87,432 79,047 82,329 56,949 614 332,750Unknown 67 5,325 19,223 18,803 19,382 11,429 58 74,287Total Unclassified 809 53,500 197,630 181,496 182,325 110,472 1,352 727,584NATIONAL 4,627 334,728 962,492 1,010,622 1,072,896 677,030 5,108 4,067,503
Table 3–3 Children of Known Ages by Age Group and Report Source, 2017
Report SourcesUnborn Percent <1 Percent 1–4 percent 5–8 percent 9–13 percent
14–17 percent
18–21 percent
Total Report Sources Percent
PROFESSIONAL - - - - - - - -Child Daycare Providers 0.5 0.5 1.4 0.6 0.2 0.2 0.2 0.6Education Personnel 10.9 4.6 10.4 24.7 25.9 22.1 16.9 19.5Foster Care Providers 0.2 0.2 0.4 0.3 0.3 0.5 0.9 0.4Legal and Law Enforcement Personnel 14.9 17.2 22.7 17.0 16.7 18.1 12.1 18.5Medical Personnel 23.4 27.3 8.9 6.1 5.6 6.7 5.5 8.5Mental Health Personnel 2.6 2.2 3.2 4.8 6.7 8.6 6.1 5.3Social Services Personnel 13.4 17.6 10.7 9.6 10.1 12.4 13.6 11.1Total Professionals 65.8 69.6 57.7 63.1 65.6 68.6 55.3 63.9NONPROFESSIONAL - - - - - - - -
Alleged Perpetrators - 0.0 0.0 0.0 0.0 0.0 0.0 0.0Alleged Victims - - 0.1 0.2 0.4 1.0 1.7 0.4Friends and Neighbors 5.0 3.7 5.7 4.7 4.2 3.8 7.7 4.6Other Relatives 7.3 6.7 8.6 6.8 6.2 5.2 5.0 6.8Parents 4.4 3.9 7.4 7.2 6.6 5.0 3.9 6.4Total Nonparents 16.7 14.4 21.8 18.9 17.4 15.1 18.2 18.2UNCLASSIFIED - - - - - - - -
Anonymous Sources 8.7 6.6 9.5 8.3 7.5 6.2 13.3 7.9Other 7.3 7.8 9.1 7.8 7.7 8.4 12.0 8.2Unknown 1.4 1.6 2.0 1.9 1.8 1.7 1.1 1.8Total Unclassified 17.5 16.0 20.5 18.0 17.0 16.3 26.5 17.9NATIONAL 100.0 100.0 100.0 100.0 100.0 100.0 100.0 100.0
Based on data from 49 states.
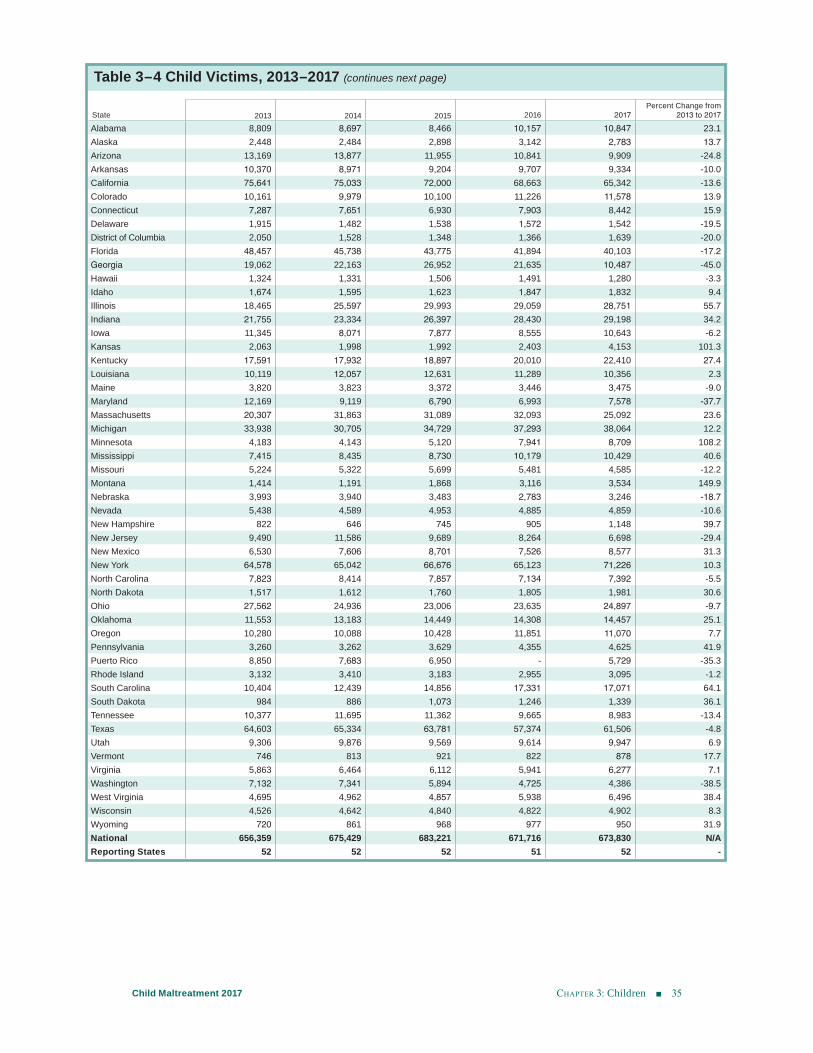
chApter 3: Children 35Child Maltreatment 2017
Table 3–4 Child Victims, 2013–2017 (continues next page)
State 2013 2014 2015 2016 2017Percent Change from
2013 to 2017
Alabama 8,809 8,697 8,466 10,157 10,847 23.1Alaska 2,448 2,484 2,898 3,142 2,783 13.7Arizona 13,169 13,877 11,955 10,841 9,909 -24.8Arkansas 10,370 8,971 9,204 9,707 9,334 -10.0California 75,641 75,033 72,000 68,663 65,342 -13.6Colorado 10,161 9,979 10,100 11,226 11,578 13.9Connecticut 7,287 7,651 6,930 7,903 8,442 15.9Delaware 1,915 1,482 1,538 1,572 1,542 -19.5District of Columbia 2,050 1,528 1,348 1,366 1,639 -20.0Florida 48,457 45,738 43,775 41,894 40,103 -17.2Georgia 19,062 22,163 26,952 21,635 10,487 -45.0Hawaii 1,324 1,331 1,506 1,491 1,280 -3.3Idaho 1,674 1,595 1,623 1,847 1,832 9.4Illinois 18,465 25,597 29,993 29,059 28,751 55.7Indiana 21,755 23,334 26,397 28,430 29,198 34.2Iowa 11,345 8,071 7,877 8,555 10,643 -6.2Kansas 2,063 1,998 1,992 2,403 4,153 101.3Kentucky 17,591 17,932 18,897 20,010 22,410 27.4Louisiana 10,119 12,057 12,631 11,289 10,356 2.3Maine 3,820 3,823 3,372 3,446 3,475 -9.0Maryland 12,169 9,119 6,790 6,993 7,578 -37.7Massachusetts 20,307 31,863 31,089 32,093 25,092 23.6Michigan 33,938 30,705 34,729 37,293 38,064 12.2Minnesota 4,183 4,143 5,120 7,941 8,709 108.2Mississippi 7,415 8,435 8,730 10,179 10,429 40.6Missouri 5,224 5,322 5,699 5,481 4,585 -12.2Montana 1,414 1,191 1,868 3,116 3,534 149.9Nebraska 3,993 3,940 3,483 2,783 3,246 -18.7Nevada 5,438 4,589 4,953 4,885 4,859 -10.6New Hampshire 822 646 745 905 1,148 39.7New Jersey 9,490 11,586 9,689 8,264 6,698 -29.4New Mexico 6,530 7,606 8,701 7,526 8,577 31.3New York 64,578 65,042 66,676 65,123 71,226 10.3North Carolina 7,823 8,414 7,857 7,134 7,392 -5.5North Dakota 1,517 1,612 1,760 1,805 1,981 30.6Ohio 27,562 24,936 23,006 23,635 24,897 -9.7Oklahoma 11,553 13,183 14,449 14,308 14,457 25.1Oregon 10,280 10,088 10,428 11,851 11,070 7.7Pennsylvania 3,260 3,262 3,629 4,355 4,625 41.9Puerto Rico 8,850 7,683 6,950 - 5,729 -35.3Rhode Island 3,132 3,410 3,183 2,955 3,095 -1.2South Carolina 10,404 12,439 14,856 17,331 17,071 64.1South Dakota 984 886 1,073 1,246 1,339 36.1Tennessee 10,377 11,695 11,362 9,665 8,983 -13.4Texas 64,603 65,334 63,781 57,374 61,506 -4.8Utah 9,306 9,876 9,569 9,614 9,947 6.9Vermont 746 813 921 822 878 17.7Virginia 5,863 6,464 6,112 5,941 6,277 7.1Washington 7,132 7,341 5,894 4,725 4,386 -38.5West Virginia 4,695 4,962 4,857 5,938 6,496 38.4Wisconsin 4,526 4,642 4,840 4,822 4,902 8.3Wyoming 720 861 968 977 950 31.9National 656,359 675,429 683,221 671,716 673,830 N/AReporting States 52 52 52 51 52 -
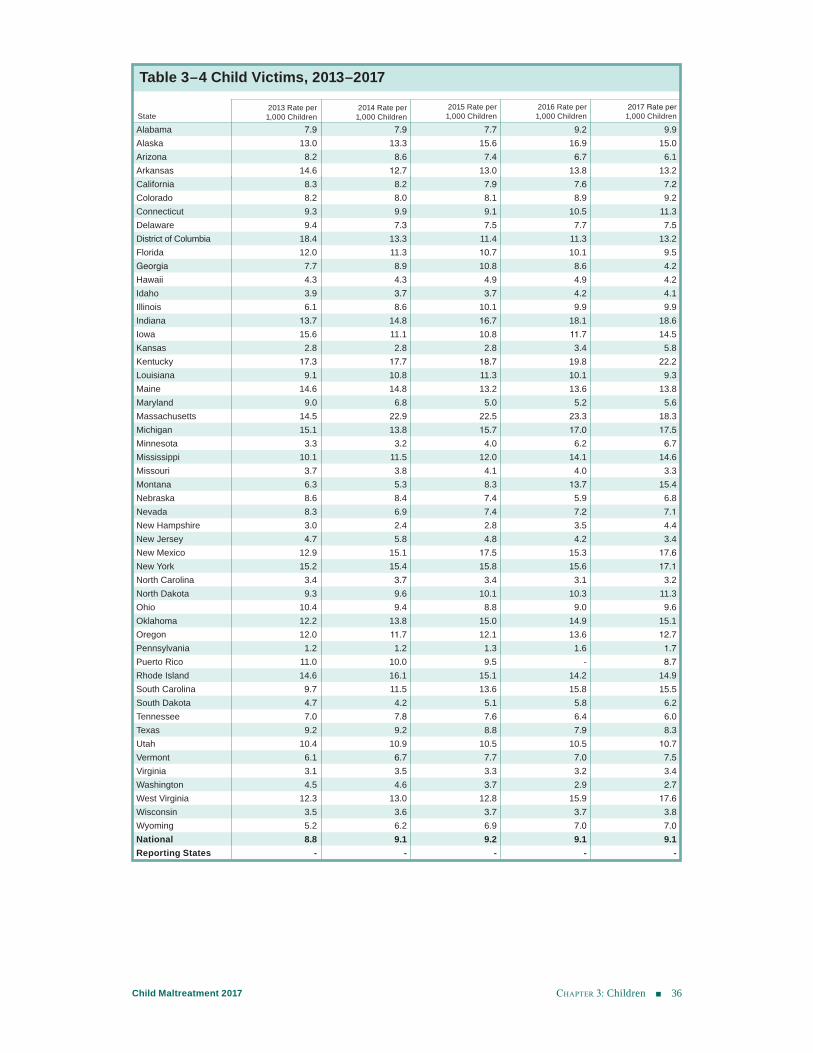
chApter 3: Children 36Child Maltreatment 2017
Table 3–4 Child Victims, 2013–2017
State 2013 Rate per 1,000 Children
2014 Rate per 1,000 Children
2015 Rate per 1,000 Children
2016 Rate per 1,000 Children
2017 Rate per 1,000 Children
Alabama 7.9 7.9 7.7 9.2 9.9Alaska 13.0 13.3 15.6 16.9 15.0Arizona 8.2 8.6 7.4 6.7 6.1Arkansas 14.6 12.7 13.0 13.8 13.2California 8.3 8.2 7.9 7.6 7.2Colorado 8.2 8.0 8.1 8.9 9.2Connecticut 9.3 9.9 9.1 10.5 11.3Delaware 9.4 7.3 7.5 7.7 7.5District of Columbia 18.4 13.3 11.4 11.3 13.2Florida 12.0 11.3 10.7 10.1 9.5Georgia 7.7 8.9 10.8 8.6 4.2Hawaii 4.3 4.3 4.9 4.9 4.2Idaho 3.9 3.7 3.7 4.2 4.1Illinois 6.1 8.6 10.1 9.9 9.9Indiana 13.7 14.8 16.7 18.1 18.6Iowa 15.6 11.1 10.8 11.7 14.5Kansas 2.8 2.8 2.8 3.4 5.8Kentucky 17.3 17.7 18.7 19.8 22.2Louisiana 9.1 10.8 11.3 10.1 9.3Maine 14.6 14.8 13.2 13.6 13.8Maryland 9.0 6.8 5.0 5.2 5.6Massachusetts 14.5 22.9 22.5 23.3 18.3Michigan 15.1 13.8 15.7 17.0 17.5Minnesota 3.3 3.2 4.0 6.2 6.7Mississippi 10.1 11.5 12.0 14.1 14.6Missouri 3.7 3.8 4.1 4.0 3.3Montana 6.3 5.3 8.3 13.7 15.4Nebraska 8.6 8.4 7.4 5.9 6.8Nevada 8.3 6.9 7.4 7.2 7.1New Hampshire 3.0 2.4 2.8 3.5 4.4New Jersey 4.7 5.8 4.8 4.2 3.4New Mexico 12.9 15.1 17.5 15.3 17.6New York 15.2 15.4 15.8 15.6 17.1North Carolina 3.4 3.7 3.4 3.1 3.2North Dakota 9.3 9.6 10.1 10.3 11.3Ohio 10.4 9.4 8.8 9.0 9.6Oklahoma 12.2 13.8 15.0 14.9 15.1Oregon 12.0 11.7 12.1 13.6 12.7Pennsylvania 1.2 1.2 1.3 1.6 1.7Puerto Rico 11.0 10.0 9.5 - 8.7Rhode Island 14.6 16.1 15.1 14.2 14.9South Carolina 9.7 11.5 13.6 15.8 15.5South Dakota 4.7 4.2 5.1 5.8 6.2Tennessee 7.0 7.8 7.6 6.4 6.0Texas 9.2 9.2 8.8 7.9 8.3Utah 10.4 10.9 10.5 10.5 10.7Vermont 6.1 6.7 7.7 7.0 7.5Virginia 3.1 3.5 3.3 3.2 3.4Washington 4.5 4.6 3.7 2.9 2.7West Virginia 12.3 13.0 12.8 15.9 17.6Wisconsin 3.5 3.6 3.7 3.7 3.8Wyoming 5.2 6.2 6.9 7.0 7.0National 8.8 9.1 9.2 9.1 9.1Reporting States - - - - -
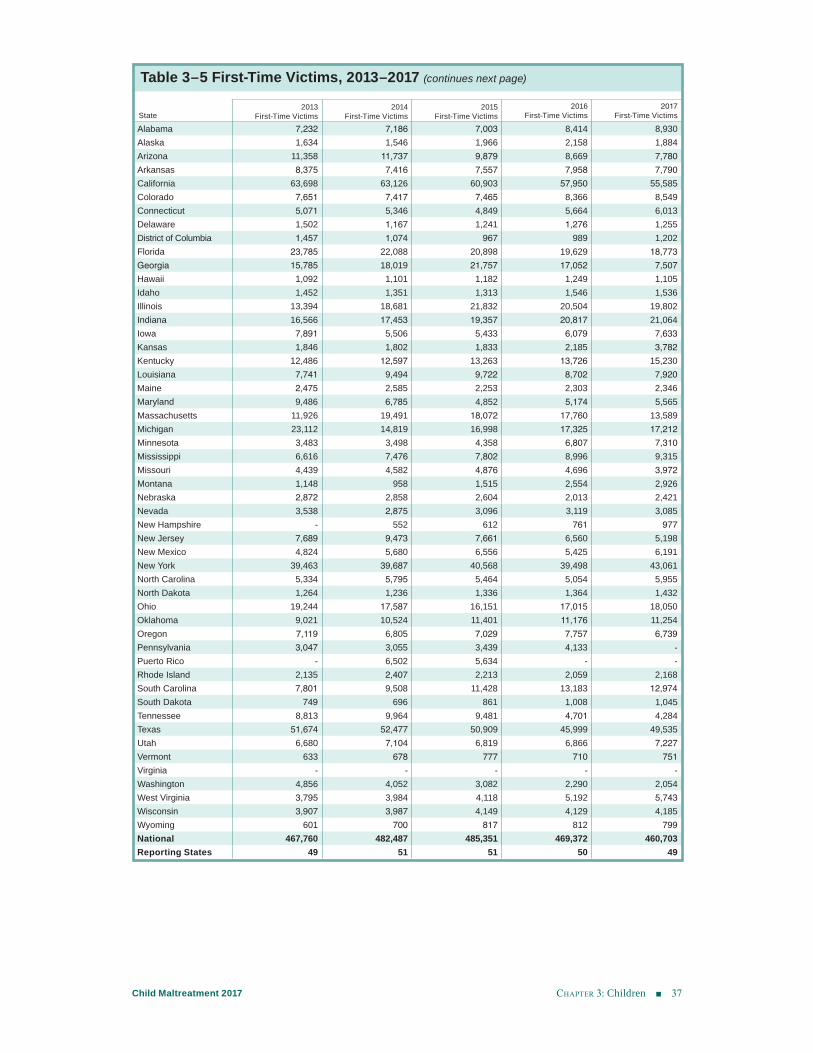
chApter 3: Children 37Child Maltreatment 2017
Table 3–5 First-Time Victims, 2013–2017 (continues next page)
State2013
First-Time Victims 2014
First-Time Victims 2015
First-Time Victims 2016
First-Time Victims 2017
First-Time Victims
Alabama 7,232 7,186 7,003 8,414 8,930Alaska 1,634 1,546 1,966 2,158 1,884Arizona 11,358 11,737 9,879 8,669 7,780Arkansas 8,375 7,416 7,557 7,958 7,790California 63,698 63,126 60,903 57,950 55,585Colorado 7,651 7,417 7,465 8,366 8,549Connecticut 5,071 5,346 4,849 5,664 6,013Delaware 1,502 1,167 1,241 1,276 1,255District of Columbia 1,457 1,074 967 989 1,202Florida 23,785 22,088 20,898 19,629 18,773Georgia 15,785 18,019 21,757 17,052 7,507Hawaii 1,092 1,101 1,182 1,249 1,105Idaho 1,452 1,351 1,313 1,546 1,536Illinois 13,394 18,681 21,832 20,504 19,802Indiana 16,566 17,453 19,357 20,817 21,064Iowa 7,891 5,506 5,433 6,079 7,633Kansas 1,846 1,802 1,833 2,185 3,782Kentucky 12,486 12,597 13,263 13,726 15,230Louisiana 7,741 9,494 9,722 8,702 7,920Maine 2,475 2,585 2,253 2,303 2,346Maryland 9,486 6,785 4,852 5,174 5,565Massachusetts 11,926 19,491 18,072 17,760 13,589Michigan 23,112 14,819 16,998 17,325 17,212Minnesota 3,483 3,498 4,358 6,807 7,310Mississippi 6,616 7,476 7,802 8,996 9,315Missouri 4,439 4,582 4,876 4,696 3,972Montana 1,148 958 1,515 2,554 2,926Nebraska 2,872 2,858 2,604 2,013 2,421Nevada 3,538 2,875 3,096 3,119 3,085New Hampshire - 552 612 761 977New Jersey 7,689 9,473 7,661 6,560 5,198New Mexico 4,824 5,680 6,556 5,425 6,191New York 39,463 39,687 40,568 39,498 43,061North Carolina 5,334 5,795 5,464 5,054 5,955North Dakota 1,264 1,236 1,336 1,364 1,432Ohio 19,244 17,587 16,151 17,015 18,050Oklahoma 9,021 10,524 11,401 11,176 11,254Oregon 7,119 6,805 7,029 7,757 6,739Pennsylvania 3,047 3,055 3,439 4,133 -Puerto Rico - 6,502 5,634 - -Rhode Island 2,135 2,407 2,213 2,059 2,168South Carolina 7,801 9,508 11,428 13,183 12,974South Dakota 749 696 861 1,008 1,045Tennessee 8,813 9,964 9,481 4,701 4,284Texas 51,674 52,477 50,909 45,999 49,535Utah 6,680 7,104 6,819 6,866 7,227Vermont 633 678 777 710 751Virginia - - - - -Washington 4,856 4,052 3,082 2,290 2,054West Virginia 3,795 3,984 4,118 5,192 5,743Wisconsin 3,907 3,987 4,149 4,129 4,185Wyoming 601 700 817 812 799National 467,760 482,487 485,351 469,372 460,703Reporting States 49 51 51 50 49
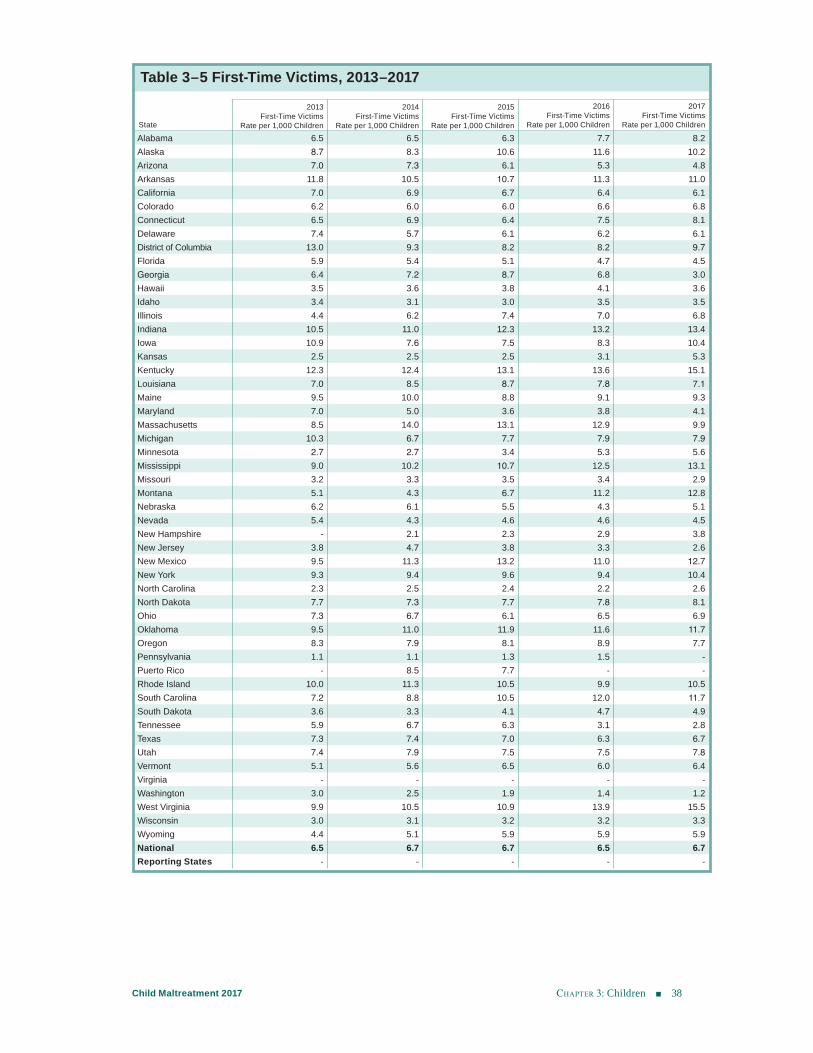
chApter 3: Children 38Child Maltreatment 2017
Table 3–5 First-Time Victims, 2013–2017
State
2013 First-Time Victims
Rate per 1,000 Children
2014 First-Time Victims
Rate per 1,000 Children
2015 First-Time Victims
Rate per 1,000 Children
2016 First-Time Victims
Rate per 1,000 Children
2017 First-Time Victims
Rate per 1,000 Children
Alabama 6.5 6.5 6.3 7.7 8.2Alaska 8.7 8.3 10.6 11.6 10.2Arizona 7.0 7.3 6.1 5.3 4.8Arkansas 11.8 10.5 10.7 11.3 11.0California 7.0 6.9 6.7 6.4 6.1Colorado 6.2 6.0 6.0 6.6 6.8Connecticut 6.5 6.9 6.4 7.5 8.1Delaware 7.4 5.7 6.1 6.2 6.1District of Columbia 13.0 9.3 8.2 8.2 9.7Florida 5.9 5.4 5.1 4.7 4.5Georgia 6.4 7.2 8.7 6.8 3.0Hawaii 3.5 3.6 3.8 4.1 3.6Idaho 3.4 3.1 3.0 3.5 3.5Illinois 4.4 6.2 7.4 7.0 6.8Indiana 10.5 11.0 12.3 13.2 13.4Iowa 10.9 7.6 7.5 8.3 10.4Kansas 2.5 2.5 2.5 3.1 5.3Kentucky 12.3 12.4 13.1 13.6 15.1Louisiana 7.0 8.5 8.7 7.8 7.1Maine 9.5 10.0 8.8 9.1 9.3Maryland 7.0 5.0 3.6 3.8 4.1Massachusetts 8.5 14.0 13.1 12.9 9.9Michigan 10.3 6.7 7.7 7.9 7.9Minnesota 2.7 2.7 3.4 5.3 5.6Mississippi 9.0 10.2 10.7 12.5 13.1Missouri 3.2 3.3 3.5 3.4 2.9Montana 5.1 4.3 6.7 11.2 12.8Nebraska 6.2 6.1 5.5 4.3 5.1Nevada 5.4 4.3 4.6 4.6 4.5New Hampshire - 2.1 2.3 2.9 3.8New Jersey 3.8 4.7 3.8 3.3 2.6New Mexico 9.5 11.3 13.2 11.0 12.7New York 9.3 9.4 9.6 9.4 10.4North Carolina 2.3 2.5 2.4 2.2 2.6North Dakota 7.7 7.3 7.7 7.8 8.1Ohio 7.3 6.7 6.1 6.5 6.9Oklahoma 9.5 11.0 11.9 11.6 11.7Oregon 8.3 7.9 8.1 8.9 7.7Pennsylvania 1.1 1.1 1.3 1.5 -Puerto Rico - 8.5 7.7 - -Rhode Island 10.0 11.3 10.5 9.9 10.5South Carolina 7.2 8.8 10.5 12.0 11.7South Dakota 3.6 3.3 4.1 4.7 4.9Tennessee 5.9 6.7 6.3 3.1 2.8Texas 7.3 7.4 7.0 6.3 6.7Utah 7.4 7.9 7.5 7.5 7.8Vermont 5.1 5.6 6.5 6.0 6.4Virginia - - - - -Washington 3.0 2.5 1.9 1.4 1.2West Virginia 9.9 10.5 10.9 13.9 15.5Wisconsin 3.0 3.1 3.2 3.2 3.3Wyoming 4.4 5.1 5.9 5.9 5.9National 6.5 6.7 6.7 6.5 6.7Reporting States - - - - -
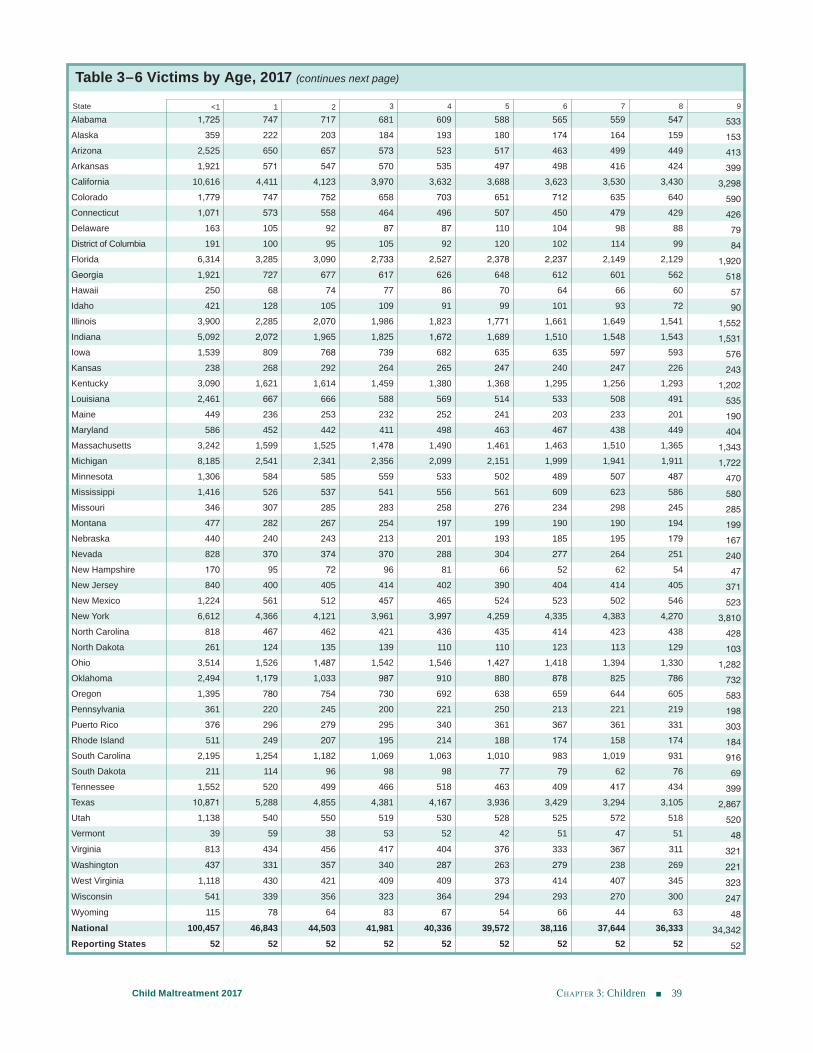
chApter 3: Children 39Child Maltreatment 2017
Table 3–6 Victims by Age, 2017 (continues next page)
State <1 1 2 3 4 5 6 7 8 9
Alabama 1,725 747 717 681 609 588 565 559 547 533Alaska 359 222 203 184 193 180 174 164 159 153Arizona 2,525 650 657 573 523 517 463 499 449 413Arkansas 1,921 571 547 570 535 497 498 416 424 399California 10,616 4,411 4,123 3,970 3,632 3,688 3,623 3,530 3,430 3,298Colorado 1,779 747 752 658 703 651 712 635 640 590Connecticut 1,071 573 558 464 496 507 450 479 429 426Delaware 163 105 92 87 87 110 104 98 88 79District of Columbia 191 100 95 105 92 120 102 114 99 84Florida 6,314 3,285 3,090 2,733 2,527 2,378 2,237 2,149 2,129 1,920Georgia 1,921 727 677 617 626 648 612 601 562 518Hawaii 250 68 74 77 86 70 64 66 60 57Idaho 421 128 105 109 91 99 101 93 72 90Illinois 3,900 2,285 2,070 1,986 1,823 1,771 1,661 1,649 1,541 1,552Indiana 5,092 2,072 1,965 1,825 1,672 1,689 1,510 1,548 1,543 1,531Iowa 1,539 809 768 739 682 635 635 597 593 576Kansas 238 268 292 264 265 247 240 247 226 243Kentucky 3,090 1,621 1,614 1,459 1,380 1,368 1,295 1,256 1,293 1,202Louisiana 2,461 667 666 588 569 514 533 508 491 535Maine 449 236 253 232 252 241 203 233 201 190Maryland 586 452 442 411 498 463 467 438 449 404Massachusetts 3,242 1,599 1,525 1,478 1,490 1,461 1,463 1,510 1,365 1,343Michigan 8,185 2,541 2,341 2,356 2,099 2,151 1,999 1,941 1,911 1,722Minnesota 1,306 584 585 559 533 502 489 507 487 470Mississippi 1,416 526 537 541 556 561 609 623 586 580Missouri 346 307 285 283 258 276 234 298 245 285Montana 477 282 267 254 197 199 190 190 194 199Nebraska 440 240 243 213 201 193 185 195 179 167Nevada 828 370 374 370 288 304 277 264 251 240New Hampshire 170 95 72 96 81 66 52 62 54 47New Jersey 840 400 405 414 402 390 404 414 405 371New Mexico 1,224 561 512 457 465 524 523 502 546 523New York 6,612 4,366 4,121 3,961 3,997 4,259 4,335 4,383 4,270 3,810North Carolina 818 467 462 421 436 435 414 423 438 428North Dakota 261 124 135 139 110 110 123 113 129 103Ohio 3,514 1,526 1,487 1,542 1,546 1,427 1,418 1,394 1,330 1,282Oklahoma 2,494 1,179 1,033 987 910 880 878 825 786 732Oregon 1,395 780 754 730 692 638 659 644 605 583Pennsylvania 361 220 245 200 221 250 213 221 219 198Puerto Rico 376 296 279 295 340 361 367 361 331 303Rhode Island 511 249 207 195 214 188 174 158 174 184South Carolina 2,195 1,254 1,182 1,069 1,063 1,010 983 1,019 931 916South Dakota 211 114 96 98 98 77 79 62 76 69Tennessee 1,552 520 499 466 518 463 409 417 434 399Texas 10,871 5,288 4,855 4,381 4,167 3,936 3,429 3,294 3,105 2,867Utah 1,138 540 550 519 530 528 525 572 518 520Vermont 39 59 38 53 52 42 51 47 51 48Virginia 813 434 456 417 404 376 333 367 311 321Washington 437 331 357 340 287 263 279 238 269 221West Virginia 1,118 430 421 409 409 373 414 407 345 323Wisconsin 541 339 356 323 364 294 293 270 300 247Wyoming 115 78 64 83 67 54 66 44 63 48National 100,457 46,843 44,503 41,981 40,336 39,572 38,116 37,644 36,333 34,342Reporting States 52 52 52 52 52 52 52 52 52 52
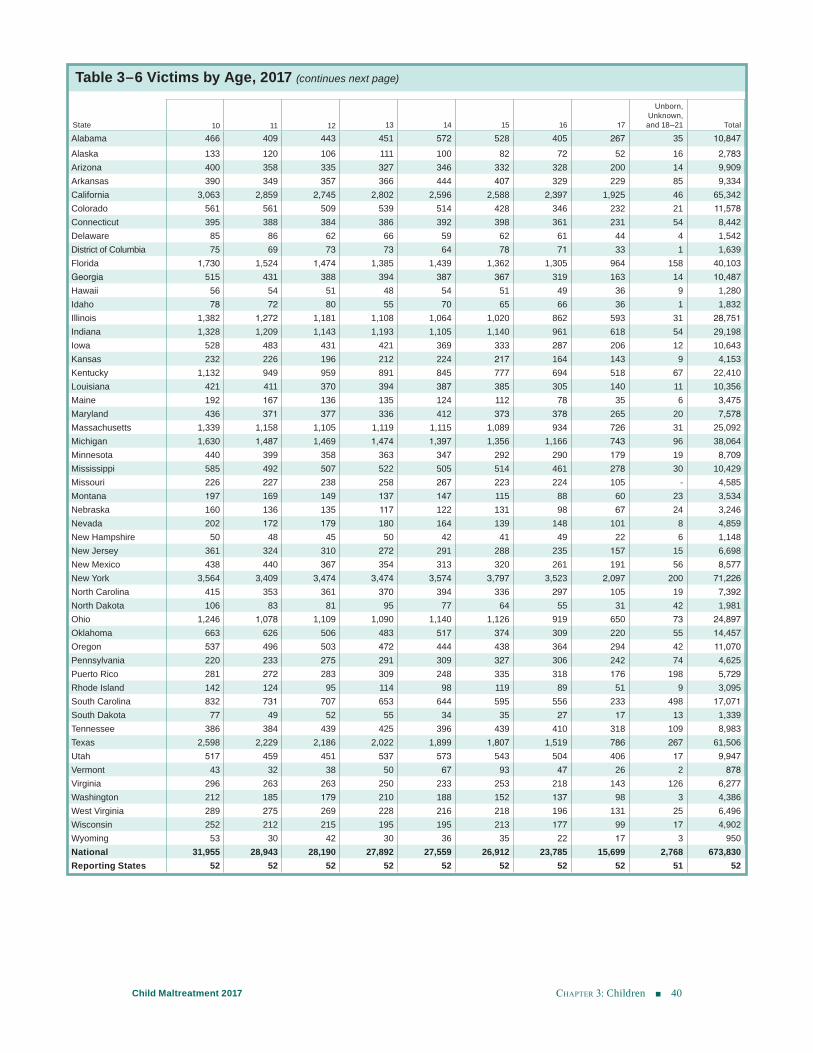
chApter 3: Children 40Child Maltreatment 2017
Table 3–6 Victims by Age, 2017 (continues next page)
State 10 11 12 13 14 15 16 17
Unborn, Unknown, and 18–21 Total
Alabama 466 409 443 451 572 528 405 267 35 10,847Alaska 133 120 106 111 100 82 72 52 16 2,783Arizona 400 358 335 327 346 332 328 200 14 9,909Arkansas 390 349 357 366 444 407 329 229 85 9,334California 3,063 2,859 2,745 2,802 2,596 2,588 2,397 1,925 46 65,342Colorado 561 561 509 539 514 428 346 232 21 11,578Connecticut 395 388 384 386 392 398 361 231 54 8,442Delaware 85 86 62 66 59 62 61 44 4 1,542District of Columbia 75 69 73 73 64 78 71 33 1 1,639Florida 1,730 1,524 1,474 1,385 1,439 1,362 1,305 964 158 40,103Georgia 515 431 388 394 387 367 319 163 14 10,487Hawaii 56 54 51 48 54 51 49 36 9 1,280Idaho 78 72 80 55 70 65 66 36 1 1,832Illinois 1,382 1,272 1,181 1,108 1,064 1,020 862 593 31 28,751Indiana 1,328 1,209 1,143 1,193 1,105 1,140 961 618 54 29,198Iowa 528 483 431 421 369 333 287 206 12 10,643Kansas 232 226 196 212 224 217 164 143 9 4,153Kentucky 1,132 949 959 891 845 777 694 518 67 22,410Louisiana 421 411 370 394 387 385 305 140 11 10,356Maine 192 167 136 135 124 112 78 35 6 3,475Maryland 436 371 377 336 412 373 378 265 20 7,578Massachusetts 1,339 1,158 1,105 1,119 1,115 1,089 934 726 31 25,092Michigan 1,630 1,487 1,469 1,474 1,397 1,356 1,166 743 96 38,064Minnesota 440 399 358 363 347 292 290 179 19 8,709Mississippi 585 492 507 522 505 514 461 278 30 10,429Missouri 226 227 238 258 267 223 224 105 - 4,585Montana 197 169 149 137 147 115 88 60 23 3,534Nebraska 160 136 135 117 122 131 98 67 24 3,246Nevada 202 172 179 180 164 139 148 101 8 4,859New Hampshire 50 48 45 50 42 41 49 22 6 1,148New Jersey 361 324 310 272 291 288 235 157 15 6,698New Mexico 438 440 367 354 313 320 261 191 56 8,577New York 3,564 3,409 3,474 3,474 3,574 3,797 3,523 2,097 200 71,226North Carolina 415 353 361 370 394 336 297 105 19 7,392North Dakota 106 83 81 95 77 64 55 31 42 1,981Ohio 1,246 1,078 1,109 1,090 1,140 1,126 919 650 73 24,897Oklahoma 663 626 506 483 517 374 309 220 55 14,457Oregon 537 496 503 472 444 438 364 294 42 11,070Pennsylvania 220 233 275 291 309 327 306 242 74 4,625Puerto Rico 281 272 283 309 248 335 318 176 198 5,729Rhode Island 142 124 95 114 98 119 89 51 9 3,095South Carolina 832 731 707 653 644 595 556 233 498 17,071South Dakota 77 49 52 55 34 35 27 17 13 1,339Tennessee 386 384 439 425 396 439 410 318 109 8,983Texas 2,598 2,229 2,186 2,022 1,899 1,807 1,519 786 267 61,506Utah 517 459 451 537 573 543 504 406 17 9,947Vermont 43 32 38 50 67 93 47 26 2 878Virginia 296 263 263 250 233 253 218 143 126 6,277Washington 212 185 179 210 188 152 137 98 3 4,386West Virginia 289 275 269 228 216 218 196 131 25 6,496Wisconsin 252 212 215 195 195 213 177 99 17 4,902Wyoming 53 30 42 30 36 35 22 17 3 950National 31,955 28,943 28,190 27,892 27,559 26,912 23,785 15,699 2,768 673,830Reporting States 52 52 52 52 52 52 52 52 51 52
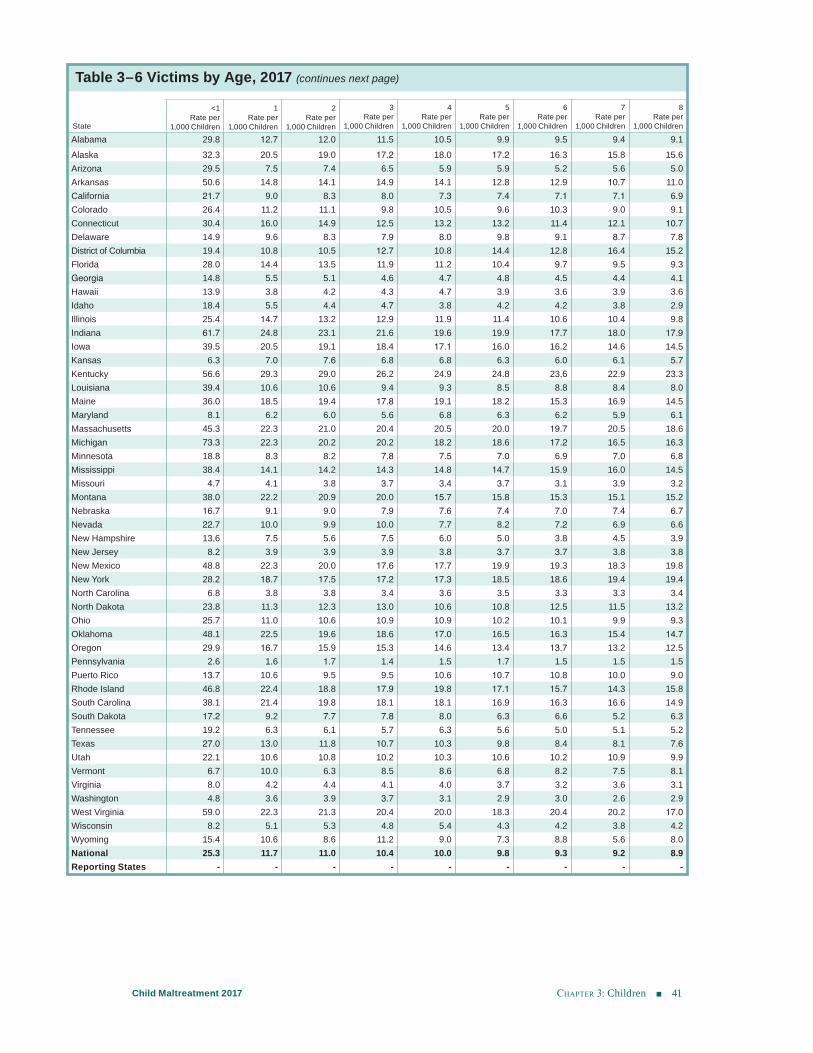
chApter 3: Children 41Child Maltreatment 2017
Table 3–6 Victims by Age, 2017 (continues next page)
State
<1 Rate per
1,000 Children
1 Rate per
1,000 Children
2 Rate per
1,000 Children
3 Rate per
1,000 Children
4 Rate per
1,000 Children
5 Rate per
1,000 Children
6Rate per
1,000 Children
7Rate per
1,000 Children
8 Rate per
1,000 Children
Alabama 29.8 12.7 12.0 11.5 10.5 9.9 9.5 9.4 9.1Alaska 32.3 20.5 19.0 17.2 18.0 17.2 16.3 15.8 15.6Arizona 29.5 7.5 7.4 6.5 5.9 5.9 5.2 5.6 5.0Arkansas 50.6 14.8 14.1 14.9 14.1 12.8 12.9 10.7 11.0California 21.7 9.0 8.3 8.0 7.3 7.4 7.1 7.1 6.9Colorado 26.4 11.2 11.1 9.8 10.5 9.6 10.3 9.0 9.1Connecticut 30.4 16.0 14.9 12.5 13.2 13.2 11.4 12.1 10.7Delaware 14.9 9.6 8.3 7.9 8.0 9.8 9.1 8.7 7.8District of Columbia 19.4 10.8 10.5 12.7 10.8 14.4 12.8 16.4 15.2Florida 28.0 14.4 13.5 11.9 11.2 10.4 9.7 9.5 9.3Georgia 14.8 5.5 5.1 4.6 4.7 4.8 4.5 4.4 4.1Hawaii 13.9 3.8 4.2 4.3 4.7 3.9 3.6 3.9 3.6Idaho 18.4 5.5 4.4 4.7 3.8 4.2 4.2 3.8 2.9Illinois 25.4 14.7 13.2 12.9 11.9 11.4 10.6 10.4 9.8Indiana 61.7 24.8 23.1 21.6 19.6 19.9 17.7 18.0 17.9Iowa 39.5 20.5 19.1 18.4 17.1 16.0 16.2 14.6 14.5Kansas 6.3 7.0 7.6 6.8 6.8 6.3 6.0 6.1 5.7Kentucky 56.6 29.3 29.0 26.2 24.9 24.8 23.6 22.9 23.3Louisiana 39.4 10.6 10.6 9.4 9.3 8.5 8.8 8.4 8.0Maine 36.0 18.5 19.4 17.8 19.1 18.2 15.3 16.9 14.5Maryland 8.1 6.2 6.0 5.6 6.8 6.3 6.2 5.9 6.1Massachusetts 45.3 22.3 21.0 20.4 20.5 20.0 19.7 20.5 18.6Michigan 73.3 22.3 20.2 20.2 18.2 18.6 17.2 16.5 16.3Minnesota 18.8 8.3 8.2 7.8 7.5 7.0 6.9 7.0 6.8Mississippi 38.4 14.1 14.2 14.3 14.8 14.7 15.9 16.0 14.5Missouri 4.7 4.1 3.8 3.7 3.4 3.7 3.1 3.9 3.2Montana 38.0 22.2 20.9 20.0 15.7 15.8 15.3 15.1 15.2Nebraska 16.7 9.1 9.0 7.9 7.6 7.4 7.0 7.4 6.7Nevada 22.7 10.0 9.9 10.0 7.7 8.2 7.2 6.9 6.6New Hampshire 13.6 7.5 5.6 7.5 6.0 5.0 3.8 4.5 3.9New Jersey 8.2 3.9 3.9 3.9 3.8 3.7 3.7 3.8 3.8New Mexico 48.8 22.3 20.0 17.6 17.7 19.9 19.3 18.3 19.8New York 28.2 18.7 17.5 17.2 17.3 18.5 18.6 19.4 19.4North Carolina 6.8 3.8 3.8 3.4 3.6 3.5 3.3 3.3 3.4North Dakota 23.8 11.3 12.3 13.0 10.6 10.8 12.5 11.5 13.2Ohio 25.7 11.0 10.6 10.9 10.9 10.2 10.1 9.9 9.3Oklahoma 48.1 22.5 19.6 18.6 17.0 16.5 16.3 15.4 14.7Oregon 29.9 16.7 15.9 15.3 14.6 13.4 13.7 13.2 12.5Pennsylvania 2.6 1.6 1.7 1.4 1.5 1.7 1.5 1.5 1.5Puerto Rico 13.7 10.6 9.5 9.5 10.6 10.7 10.8 10.0 9.0Rhode Island 46.8 22.4 18.8 17.9 19.8 17.1 15.7 14.3 15.8South Carolina 38.1 21.4 19.8 18.1 18.1 16.9 16.3 16.6 14.9South Dakota 17.2 9.2 7.7 7.8 8.0 6.3 6.6 5.2 6.3Tennessee 19.2 6.3 6.1 5.7 6.3 5.6 5.0 5.1 5.2Texas 27.0 13.0 11.8 10.7 10.3 9.8 8.4 8.1 7.6Utah 22.1 10.6 10.8 10.2 10.3 10.6 10.2 10.9 9.9Vermont 6.7 10.0 6.3 8.5 8.6 6.8 8.2 7.5 8.1Virginia 8.0 4.2 4.4 4.1 4.0 3.7 3.2 3.6 3.1Washington 4.8 3.6 3.9 3.7 3.1 2.9 3.0 2.6 2.9West Virginia 59.0 22.3 21.3 20.4 20.0 18.3 20.4 20.2 17.0Wisconsin 8.2 5.1 5.3 4.8 5.4 4.3 4.2 3.8 4.2Wyoming 15.4 10.6 8.6 11.2 9.0 7.3 8.8 5.6 8.0National 25.3 11.7 11.0 10.4 10.0 9.8 9.3 9.2 8.9Reporting States - - - - - - - - -
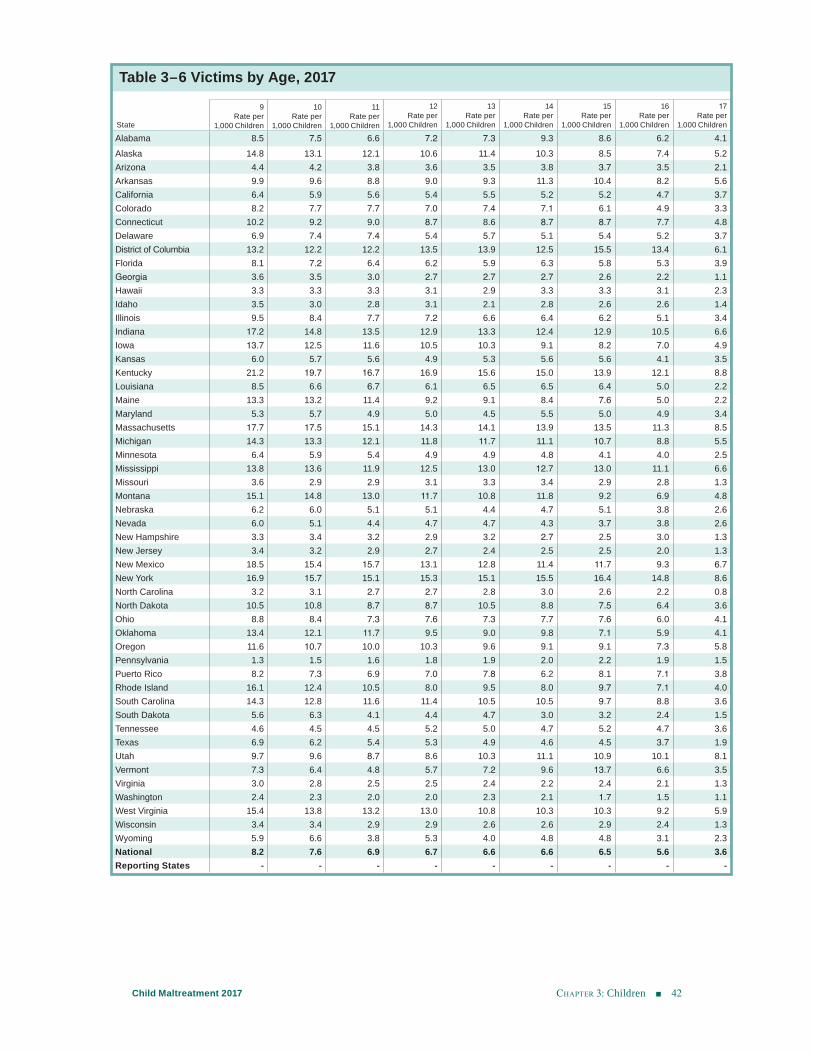
chApter 3: Children 42Child Maltreatment 2017
Table 3–6 Victims by Age, 2017
State
9 Rate per
1,000 Children
10 Rate per
1,000 Children
11 Rate per
1,000 Children
12Rate per
1,000 Children
13 Rate per
1,000 Children
14Rate per
1,000 Children
15Rate per
1,000 Children
16Rate per
1,000 Children
17 Rate per
1,000 Children
Alabama 8.5 7.5 6.6 7.2 7.3 9.3 8.6 6.2 4.1Alaska 14.8 13.1 12.1 10.6 11.4 10.3 8.5 7.4 5.2Arizona 4.4 4.2 3.8 3.6 3.5 3.8 3.7 3.5 2.1Arkansas 9.9 9.6 8.8 9.0 9.3 11.3 10.4 8.2 5.6California 6.4 5.9 5.6 5.4 5.5 5.2 5.2 4.7 3.7Colorado 8.2 7.7 7.7 7.0 7.4 7.1 6.1 4.9 3.3Connecticut 10.2 9.2 9.0 8.7 8.6 8.7 8.7 7.7 4.8Delaware 6.9 7.4 7.4 5.4 5.7 5.1 5.4 5.2 3.7District of Columbia 13.2 12.2 12.2 13.5 13.9 12.5 15.5 13.4 6.1Florida 8.1 7.2 6.4 6.2 5.9 6.3 5.8 5.3 3.9Georgia 3.6 3.5 3.0 2.7 2.7 2.7 2.6 2.2 1.1Hawaii 3.3 3.3 3.3 3.1 2.9 3.3 3.3 3.1 2.3Idaho 3.5 3.0 2.8 3.1 2.1 2.8 2.6 2.6 1.4Illinois 9.5 8.4 7.7 7.2 6.6 6.4 6.2 5.1 3.4Indiana 17.2 14.8 13.5 12.9 13.3 12.4 12.9 10.5 6.6Iowa 13.7 12.5 11.6 10.5 10.3 9.1 8.2 7.0 4.9Kansas 6.0 5.7 5.6 4.9 5.3 5.6 5.6 4.1 3.5Kentucky 21.2 19.7 16.7 16.9 15.6 15.0 13.9 12.1 8.8Louisiana 8.5 6.6 6.7 6.1 6.5 6.5 6.4 5.0 2.2Maine 13.3 13.2 11.4 9.2 9.1 8.4 7.6 5.0 2.2Maryland 5.3 5.7 4.9 5.0 4.5 5.5 5.0 4.9 3.4Massachusetts 17.7 17.5 15.1 14.3 14.1 13.9 13.5 11.3 8.5Michigan 14.3 13.3 12.1 11.8 11.7 11.1 10.7 8.8 5.5Minnesota 6.4 5.9 5.4 4.9 4.9 4.8 4.1 4.0 2.5Mississippi 13.8 13.6 11.9 12.5 13.0 12.7 13.0 11.1 6.6Missouri 3.6 2.9 2.9 3.1 3.3 3.4 2.9 2.8 1.3Montana 15.1 14.8 13.0 11.7 10.8 11.8 9.2 6.9 4.8Nebraska 6.2 6.0 5.1 5.1 4.4 4.7 5.1 3.8 2.6Nevada 6.0 5.1 4.4 4.7 4.7 4.3 3.7 3.8 2.6New Hampshire 3.3 3.4 3.2 2.9 3.2 2.7 2.5 3.0 1.3New Jersey 3.4 3.2 2.9 2.7 2.4 2.5 2.5 2.0 1.3New Mexico 18.5 15.4 15.7 13.1 12.8 11.4 11.7 9.3 6.7New York 16.9 15.7 15.1 15.3 15.1 15.5 16.4 14.8 8.6North Carolina 3.2 3.1 2.7 2.7 2.8 3.0 2.6 2.2 0.8North Dakota 10.5 10.8 8.7 8.7 10.5 8.8 7.5 6.4 3.6Ohio 8.8 8.4 7.3 7.6 7.3 7.7 7.6 6.0 4.1Oklahoma 13.4 12.1 11.7 9.5 9.0 9.8 7.1 5.9 4.1Oregon 11.6 10.7 10.0 10.3 9.6 9.1 9.1 7.3 5.8Pennsylvania 1.3 1.5 1.6 1.8 1.9 2.0 2.2 1.9 1.5Puerto Rico 8.2 7.3 6.9 7.0 7.8 6.2 8.1 7.1 3.8Rhode Island 16.1 12.4 10.5 8.0 9.5 8.0 9.7 7.1 4.0South Carolina 14.3 12.8 11.6 11.4 10.5 10.5 9.7 8.8 3.6South Dakota 5.6 6.3 4.1 4.4 4.7 3.0 3.2 2.4 1.5Tennessee 4.6 4.5 4.5 5.2 5.0 4.7 5.2 4.7 3.6Texas 6.9 6.2 5.4 5.3 4.9 4.6 4.5 3.7 1.9Utah 9.7 9.6 8.7 8.6 10.3 11.1 10.9 10.1 8.1Vermont 7.3 6.4 4.8 5.7 7.2 9.6 13.7 6.6 3.5Virginia 3.0 2.8 2.5 2.5 2.4 2.2 2.4 2.1 1.3Washington 2.4 2.3 2.0 2.0 2.3 2.1 1.7 1.5 1.1West Virginia 15.4 13.8 13.2 13.0 10.8 10.3 10.3 9.2 5.9Wisconsin 3.4 3.4 2.9 2.9 2.6 2.6 2.9 2.4 1.3Wyoming 5.9 6.6 3.8 5.3 4.0 4.8 4.8 3.1 2.3National 8.2 7.6 6.9 6.7 6.6 6.6 6.5 5.6 3.6Reporting States - - - - - - - - -
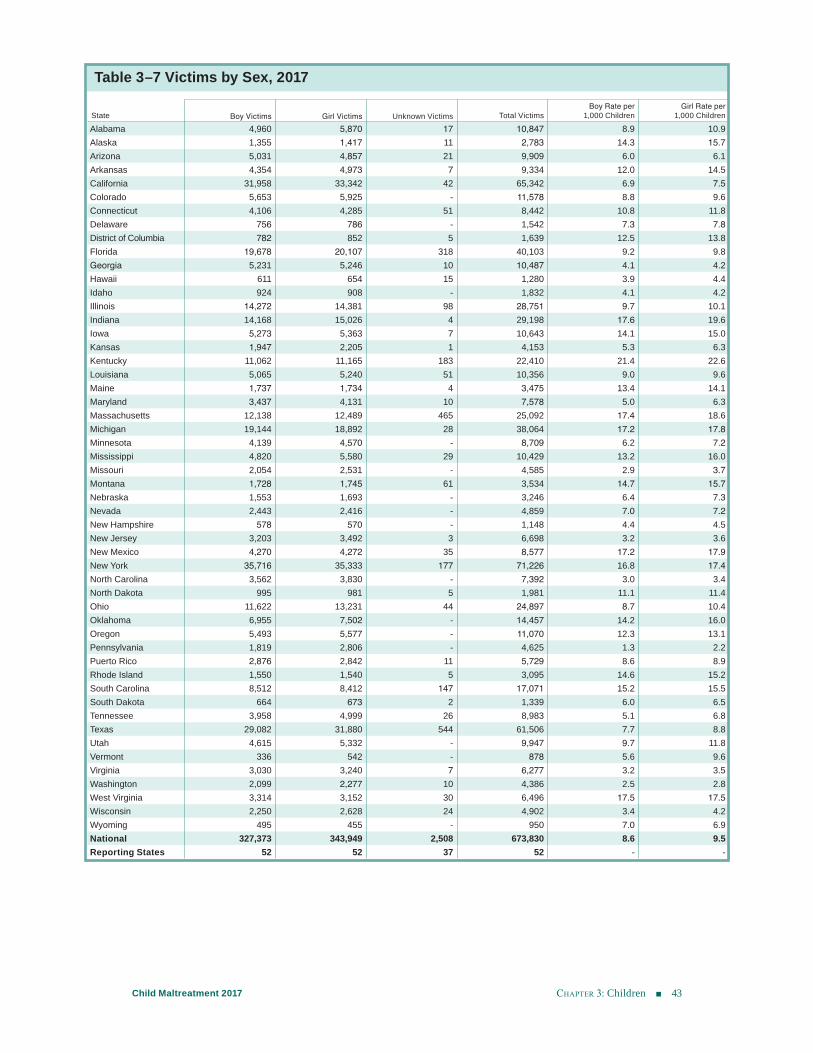
chApter 3: Children 43Child Maltreatment 2017
Table 3–7 Victims by Sex, 2017
State Boy Victims Girl Victims Unknown Victims Total Victims Boy Rate per
1,000 Children Girl Rate per
1,000 Children
Alabama 4,960 5,870 17 10,847 8.9 10.9Alaska 1,355 1,417 11 2,783 14.3 15.7Arizona 5,031 4,857 21 9,909 6.0 6.1Arkansas 4,354 4,973 7 9,334 12.0 14.5California 31,958 33,342 42 65,342 6.9 7.5Colorado 5,653 5,925 - 11,578 8.8 9.6Connecticut 4,106 4,285 51 8,442 10.8 11.8Delaware 756 786 - 1,542 7.3 7.8District of Columbia 782 852 5 1,639 12.5 13.8Florida 19,678 20,107 318 40,103 9.2 9.8Georgia 5,231 5,246 10 10,487 4.1 4.2Hawaii 611 654 15 1,280 3.9 4.4Idaho 924 908 - 1,832 4.1 4.2Illinois 14,272 14,381 98 28,751 9.7 10.1Indiana 14,168 15,026 4 29,198 17.6 19.6Iowa 5,273 5,363 7 10,643 14.1 15.0Kansas 1,947 2,205 1 4,153 5.3 6.3Kentucky 11,062 11,165 183 22,410 21.4 22.6Louisiana 5,065 5,240 51 10,356 9.0 9.6Maine 1,737 1,734 4 3,475 13.4 14.1Maryland 3,437 4,131 10 7,578 5.0 6.3Massachusetts 12,138 12,489 465 25,092 17.4 18.6Michigan 19,144 18,892 28 38,064 17.2 17.8Minnesota 4,139 4,570 - 8,709 6.2 7.2Mississippi 4,820 5,580 29 10,429 13.2 16.0Missouri 2,054 2,531 - 4,585 2.9 3.7Montana 1,728 1,745 61 3,534 14.7 15.7Nebraska 1,553 1,693 - 3,246 6.4 7.3Nevada 2,443 2,416 - 4,859 7.0 7.2New Hampshire 578 570 - 1,148 4.4 4.5New Jersey 3,203 3,492 3 6,698 3.2 3.6New Mexico 4,270 4,272 35 8,577 17.2 17.9New York 35,716 35,333 177 71,226 16.8 17.4North Carolina 3,562 3,830 - 7,392 3.0 3.4North Dakota 995 981 5 1,981 11.1 11.4Ohio 11,622 13,231 44 24,897 8.7 10.4Oklahoma 6,955 7,502 - 14,457 14.2 16.0Oregon 5,493 5,577 - 11,070 12.3 13.1Pennsylvania 1,819 2,806 - 4,625 1.3 2.2Puerto Rico 2,876 2,842 11 5,729 8.6 8.9Rhode Island 1,550 1,540 5 3,095 14.6 15.2South Carolina 8,512 8,412 147 17,071 15.2 15.5South Dakota 664 673 2 1,339 6.0 6.5Tennessee 3,958 4,999 26 8,983 5.1 6.8Texas 29,082 31,880 544 61,506 7.7 8.8Utah 4,615 5,332 - 9,947 9.7 11.8Vermont 336 542 - 878 5.6 9.6Virginia 3,030 3,240 7 6,277 3.2 3.5Washington 2,099 2,277 10 4,386 2.5 2.8West Virginia 3,314 3,152 30 6,496 17.5 17.5Wisconsin 2,250 2,628 24 4,902 3.4 4.2Wyoming 495 455 - 950 7.0 6.9National 327,373 343,949 2,508 673,830 8.6 9.5Reporting States 52 52 37 52 - -
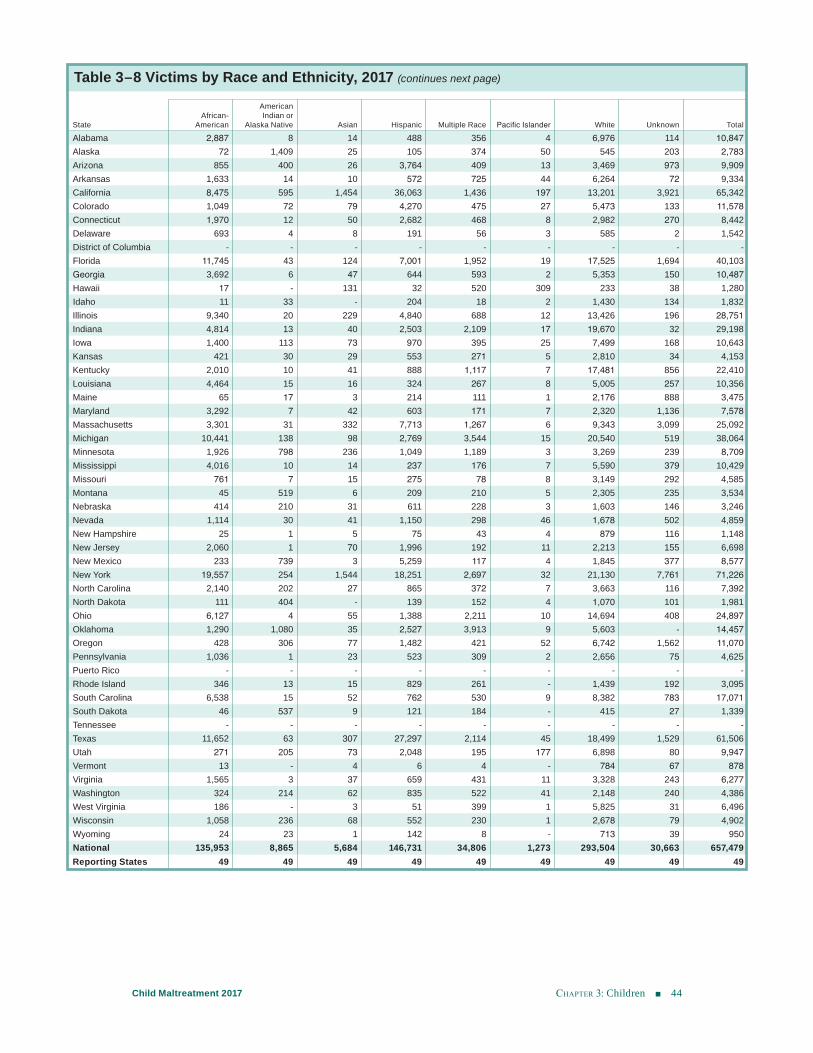
chApter 3: Children 44Child Maltreatment 2017
Table 3–8 Victims by Race and Ethnicity, 2017 (continues next page)
StateAfrican-
American
American Indian or
Alaska Native Asian Hispanic Multiple Race Pacific Islander White Unknown Total Alabama 2,887 8 14 488 356 4 6,976 114 10,847Alaska 72 1,409 25 105 374 50 545 203 2,783Arizona 855 400 26 3,764 409 13 3,469 973 9,909Arkansas 1,633 14 10 572 725 44 6,264 72 9,334California 8,475 595 1,454 36,063 1,436 197 13,201 3,921 65,342Colorado 1,049 72 79 4,270 475 27 5,473 133 11,578Connecticut 1,970 12 50 2,682 468 8 2,982 270 8,442Delaware 693 4 8 191 56 3 585 2 1,542District of Columbia - - - - - - - - -Florida 11,745 43 124 7,001 1,952 19 17,525 1,694 40,103Georgia 3,692 6 47 644 593 2 5,353 150 10,487Hawaii 17 - 131 32 520 309 233 38 1,280Idaho 11 33 - 204 18 2 1,430 134 1,832Illinois 9,340 20 229 4,840 688 12 13,426 196 28,751Indiana 4,814 13 40 2,503 2,109 17 19,670 32 29,198Iowa 1,400 113 73 970 395 25 7,499 168 10,643Kansas 421 30 29 553 271 5 2,810 34 4,153Kentucky 2,010 10 41 888 1,117 7 17,481 856 22,410Louisiana 4,464 15 16 324 267 8 5,005 257 10,356Maine 65 17 3 214 111 1 2,176 888 3,475Maryland 3,292 7 42 603 171 7 2,320 1,136 7,578Massachusetts 3,301 31 332 7,713 1,267 6 9,343 3,099 25,092Michigan 10,441 138 98 2,769 3,544 15 20,540 519 38,064Minnesota 1,926 798 236 1,049 1,189 3 3,269 239 8,709Mississippi 4,016 10 14 237 176 7 5,590 379 10,429Missouri 761 7 15 275 78 8 3,149 292 4,585Montana 45 519 6 209 210 5 2,305 235 3,534Nebraska 414 210 31 611 228 3 1,603 146 3,246Nevada 1,114 30 41 1,150 298 46 1,678 502 4,859New Hampshire 25 1 5 75 43 4 879 116 1,148New Jersey 2,060 1 70 1,996 192 11 2,213 155 6,698New Mexico 233 739 3 5,259 117 4 1,845 377 8,577New York 19,557 254 1,544 18,251 2,697 32 21,130 7,761 71,226North Carolina 2,140 202 27 865 372 7 3,663 116 7,392North Dakota 111 404 - 139 152 4 1,070 101 1,981Ohio 6,127 4 55 1,388 2,211 10 14,694 408 24,897Oklahoma 1,290 1,080 35 2,527 3,913 9 5,603 - 14,457Oregon 428 306 77 1,482 421 52 6,742 1,562 11,070Pennsylvania 1,036 1 23 523 309 2 2,656 75 4,625Puerto Rico - - - - - - - - -Rhode Island 346 13 15 829 261 - 1,439 192 3,095South Carolina 6,538 15 52 762 530 9 8,382 783 17,071South Dakota 46 537 9 121 184 - 415 27 1,339Tennessee - - - - - - - - -Texas 11,652 63 307 27,297 2,114 45 18,499 1,529 61,506Utah 271 205 73 2,048 195 177 6,898 80 9,947Vermont 13 - 4 6 4 - 784 67 878Virginia 1,565 3 37 659 431 11 3,328 243 6,277Washington 324 214 62 835 522 41 2,148 240 4,386West Virginia 186 - 3 51 399 1 5,825 31 6,496Wisconsin 1,058 236 68 552 230 1 2,678 79 4,902Wyoming 24 23 1 142 8 - 713 39 950National 135,953 8,865 5,684 146,731 34,806 1,273 293,504 30,663 657,479Reporting States 49 49 49 49 49 49 49 49 49
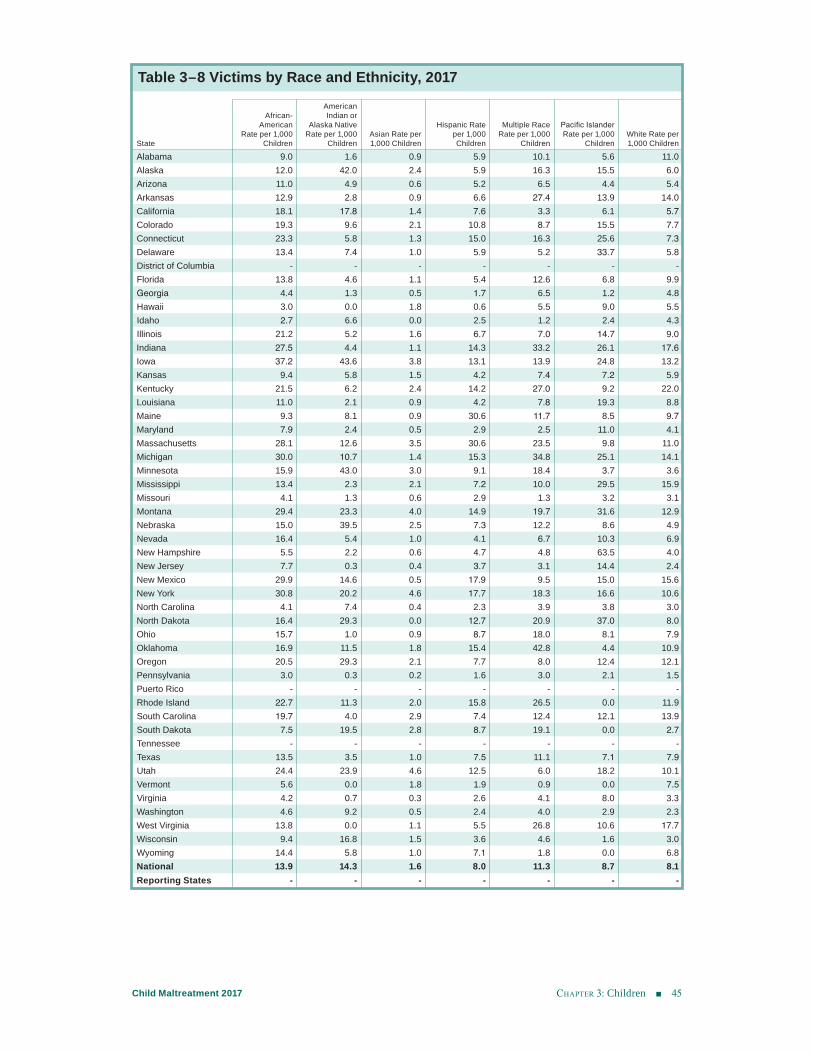
chApter 3: Children 45Child Maltreatment 2017
Table 3–8 Victims by Race and Ethnicity, 2017
State
African-American
Rate per 1,000 Children
American Indian or
Alaska Native Rate per 1,000
ChildrenAsian Rate per 1,000 Children
Hispanic Rate per 1,000 Children
Multiple Race Rate per 1,000
Children
Pacific Islander Rate per 1,000
ChildrenWhite Rate per 1,000 Children
Alabama 9.0 1.6 0.9 5.9 10.1 5.6 11.0Alaska 12.0 42.0 2.4 5.9 16.3 15.5 6.0Arizona 11.0 4.9 0.6 5.2 6.5 4.4 5.4Arkansas 12.9 2.8 0.9 6.6 27.4 13.9 14.0California 18.1 17.8 1.4 7.6 3.3 6.1 5.7Colorado 19.3 9.6 2.1 10.8 8.7 15.5 7.7Connecticut 23.3 5.8 1.3 15.0 16.3 25.6 7.3Delaware 13.4 7.4 1.0 5.9 5.2 33.7 5.8District of Columbia - - - - - - -Florida 13.8 4.6 1.1 5.4 12.6 6.8 9.9Georgia 4.4 1.3 0.5 1.7 6.5 1.2 4.8Hawaii 3.0 0.0 1.8 0.6 5.5 9.0 5.5Idaho 2.7 6.6 0.0 2.5 1.2 2.4 4.3Illinois 21.2 5.2 1.6 6.7 7.0 14.7 9.0Indiana 27.5 4.4 1.1 14.3 33.2 26.1 17.6Iowa 37.2 43.6 3.8 13.1 13.9 24.8 13.2Kansas 9.4 5.8 1.5 4.2 7.4 7.2 5.9Kentucky 21.5 6.2 2.4 14.2 27.0 9.2 22.0Louisiana 11.0 2.1 0.9 4.2 7.8 19.3 8.8Maine 9.3 8.1 0.9 30.6 11.7 8.5 9.7Maryland 7.9 2.4 0.5 2.9 2.5 11.0 4.1Massachusetts 28.1 12.6 3.5 30.6 23.5 9.8 11.0Michigan 30.0 10.7 1.4 15.3 34.8 25.1 14.1Minnesota 15.9 43.0 3.0 9.1 18.4 3.7 3.6Mississippi 13.4 2.3 2.1 7.2 10.0 29.5 15.9Missouri 4.1 1.3 0.6 2.9 1.3 3.2 3.1Montana 29.4 23.3 4.0 14.9 19.7 31.6 12.9Nebraska 15.0 39.5 2.5 7.3 12.2 8.6 4.9Nevada 16.4 5.4 1.0 4.1 6.7 10.3 6.9New Hampshire 5.5 2.2 0.6 4.7 4.8 63.5 4.0New Jersey 7.7 0.3 0.4 3.7 3.1 14.4 2.4New Mexico 29.9 14.6 0.5 17.9 9.5 15.0 15.6New York 30.8 20.2 4.6 17.7 18.3 16.6 10.6North Carolina 4.1 7.4 0.4 2.3 3.9 3.8 3.0North Dakota 16.4 29.3 0.0 12.7 20.9 37.0 8.0Ohio 15.7 1.0 0.9 8.7 18.0 8.1 7.9Oklahoma 16.9 11.5 1.8 15.4 42.8 4.4 10.9Oregon 20.5 29.3 2.1 7.7 8.0 12.4 12.1Pennsylvania 3.0 0.3 0.2 1.6 3.0 2.1 1.5Puerto Rico - - - - - - -Rhode Island 22.7 11.3 2.0 15.8 26.5 0.0 11.9South Carolina 19.7 4.0 2.9 7.4 12.4 12.1 13.9South Dakota 7.5 19.5 2.8 8.7 19.1 0.0 2.7Tennessee - - - - - - -Texas 13.5 3.5 1.0 7.5 11.1 7.1 7.9Utah 24.4 23.9 4.6 12.5 6.0 18.2 10.1Vermont 5.6 0.0 1.8 1.9 0.9 0.0 7.5Virginia 4.2 0.7 0.3 2.6 4.1 8.0 3.3Washington 4.6 9.2 0.5 2.4 4.0 2.9 2.3West Virginia 13.8 0.0 1.1 5.5 26.8 10.6 17.7Wisconsin 9.4 16.8 1.5 3.6 4.6 1.6 3.0Wyoming 14.4 5.8 1.0 7.1 1.8 0.0 6.8National 13.9 14.3 1.6 8.0 11.3 8.7 8.1Reporting States - - - - - - -
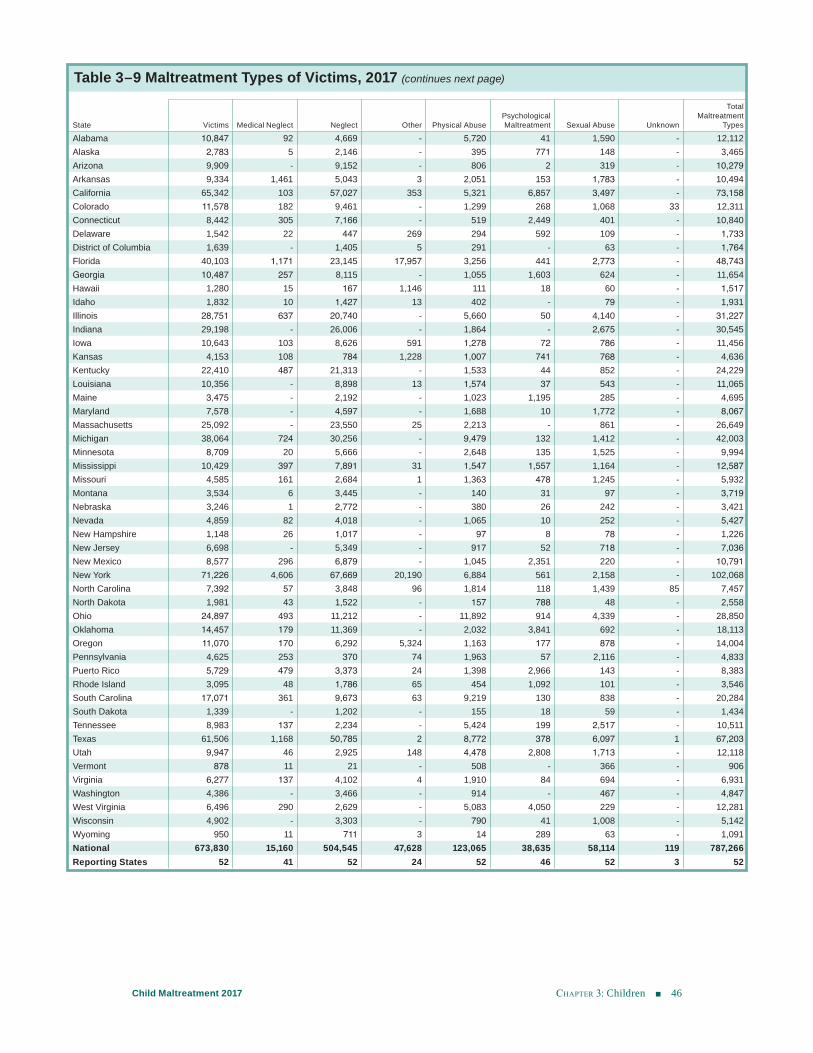
chApter 3: Children 46Child Maltreatment 2017
Table 3–9 Maltreatment Types of Victims, 2017 (continues next page)
State Victims Medical Neglect Neglect Other Physical Abuse Psychological Maltreatment Sexual Abuse Unknown
Total Maltreatment
Types Alabama 10,847 92 4,669 - 5,720 41 1,590 - 12,112Alaska 2,783 5 2,146 - 395 771 148 - 3,465Arizona 9,909 - 9,152 - 806 2 319 - 10,279Arkansas 9,334 1,461 5,043 3 2,051 153 1,783 - 10,494California 65,342 103 57,027 353 5,321 6,857 3,497 - 73,158Colorado 11,578 182 9,461 - 1,299 268 1,068 33 12,311Connecticut 8,442 305 7,166 - 519 2,449 401 - 10,840Delaware 1,542 22 447 269 294 592 109 - 1,733District of Columbia 1,639 - 1,405 5 291 - 63 - 1,764Florida 40,103 1,171 23,145 17,957 3,256 441 2,773 - 48,743Georgia 10,487 257 8,115 - 1,055 1,603 624 - 11,654Hawaii 1,280 15 167 1,146 111 18 60 - 1,517Idaho 1,832 10 1,427 13 402 - 79 - 1,931Illinois 28,751 637 20,740 - 5,660 50 4,140 - 31,227Indiana 29,198 - 26,006 - 1,864 - 2,675 - 30,545Iowa 10,643 103 8,626 591 1,278 72 786 - 11,456Kansas 4,153 108 784 1,228 1,007 741 768 - 4,636Kentucky 22,410 487 21,313 - 1,533 44 852 - 24,229Louisiana 10,356 - 8,898 13 1,574 37 543 - 11,065Maine 3,475 - 2,192 - 1,023 1,195 285 - 4,695Maryland 7,578 - 4,597 - 1,688 10 1,772 - 8,067Massachusetts 25,092 - 23,550 25 2,213 - 861 - 26,649Michigan 38,064 724 30,256 - 9,479 132 1,412 - 42,003Minnesota 8,709 20 5,666 - 2,648 135 1,525 - 9,994Mississippi 10,429 397 7,891 31 1,547 1,557 1,164 - 12,587Missouri 4,585 161 2,684 1 1,363 478 1,245 - 5,932Montana 3,534 6 3,445 - 140 31 97 - 3,719Nebraska 3,246 1 2,772 - 380 26 242 - 3,421Nevada 4,859 82 4,018 - 1,065 10 252 - 5,427New Hampshire 1,148 26 1,017 - 97 8 78 - 1,226New Jersey 6,698 - 5,349 - 917 52 718 - 7,036New Mexico 8,577 296 6,879 - 1,045 2,351 220 - 10,791New York 71,226 4,606 67,669 20,190 6,884 561 2,158 - 102,068North Carolina 7,392 57 3,848 96 1,814 118 1,439 85 7,457North Dakota 1,981 43 1,522 - 157 788 48 - 2,558Ohio 24,897 493 11,212 - 11,892 914 4,339 - 28,850Oklahoma 14,457 179 11,369 - 2,032 3,841 692 - 18,113Oregon 11,070 170 6,292 5,324 1,163 177 878 - 14,004Pennsylvania 4,625 253 370 74 1,963 57 2,116 - 4,833Puerto Rico 5,729 479 3,373 24 1,398 2,966 143 - 8,383Rhode Island 3,095 48 1,786 65 454 1,092 101 - 3,546South Carolina 17,071 361 9,673 63 9,219 130 838 - 20,284South Dakota 1,339 - 1,202 - 155 18 59 - 1,434Tennessee 8,983 137 2,234 - 5,424 199 2,517 - 10,511Texas 61,506 1,168 50,785 2 8,772 378 6,097 1 67,203Utah 9,947 46 2,925 148 4,478 2,808 1,713 - 12,118Vermont 878 11 21 - 508 - 366 - 906Virginia 6,277 137 4,102 4 1,910 84 694 - 6,931Washington 4,386 - 3,466 - 914 - 467 - 4,847West Virginia 6,496 290 2,629 - 5,083 4,050 229 - 12,281Wisconsin 4,902 - 3,303 - 790 41 1,008 - 5,142Wyoming 950 11 711 3 14 289 63 - 1,091National 673,830 15,160 504,545 47,628 123,065 38,635 58,114 119 787,266Reporting States 52 41 52 24 52 46 52 3 52
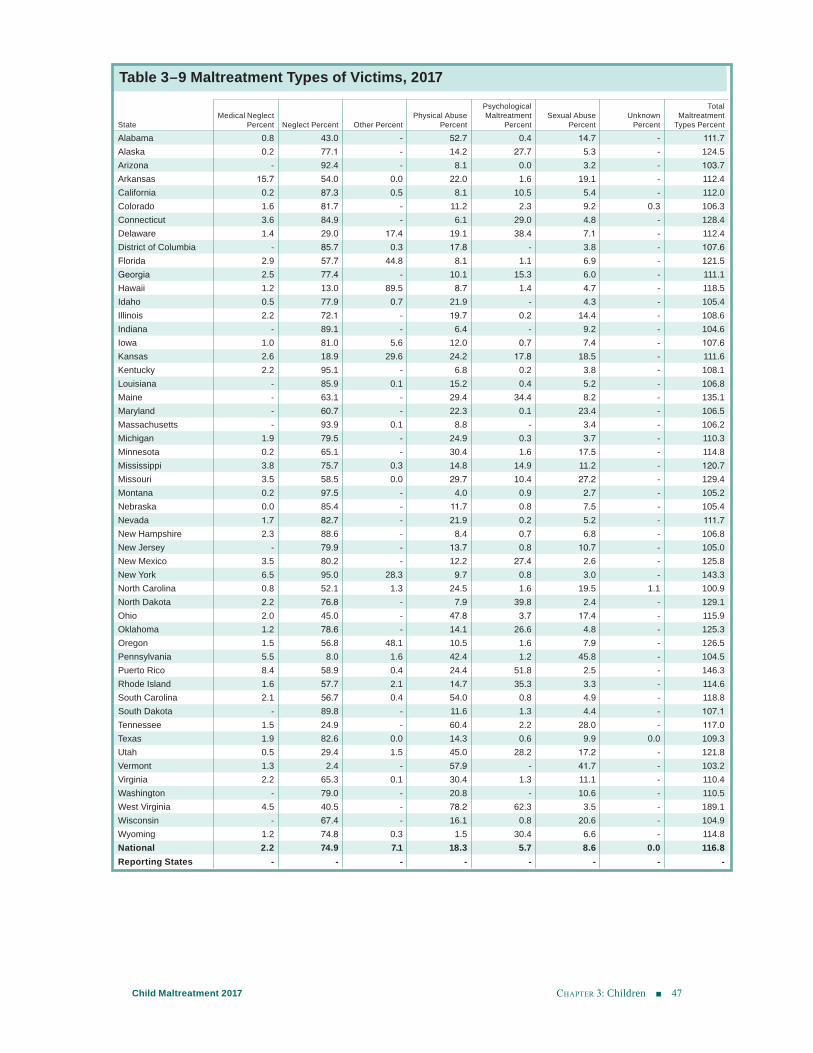
chApter 3: Children 47Child Maltreatment 2017
Table 3–9 Maltreatment Types of Victims, 2017
StateMedical Neglect
Percent Neglect Percent Other PercentPhysical Abuse
Percent
Psychological Maltreatment
PercentSexual Abuse
PercentUnknown
Percent
Total Maltreatment
Types PercentAlabama 0.8 43.0 - 52.7 0.4 14.7 - 111.7Alaska 0.2 77.1 - 14.2 27.7 5.3 - 124.5Arizona - 92.4 - 8.1 0.0 3.2 - 103.7Arkansas 15.7 54.0 0.0 22.0 1.6 19.1 - 112.4California 0.2 87.3 0.5 8.1 10.5 5.4 - 112.0Colorado 1.6 81.7 - 11.2 2.3 9.2 0.3 106.3Connecticut 3.6 84.9 - 6.1 29.0 4.8 - 128.4Delaware 1.4 29.0 17.4 19.1 38.4 7.1 - 112.4District of Columbia - 85.7 0.3 17.8 - 3.8 - 107.6Florida 2.9 57.7 44.8 8.1 1.1 6.9 - 121.5Georgia 2.5 77.4 - 10.1 15.3 6.0 - 111.1Hawaii 1.2 13.0 89.5 8.7 1.4 4.7 - 118.5Idaho 0.5 77.9 0.7 21.9 - 4.3 - 105.4Illinois 2.2 72.1 - 19.7 0.2 14.4 - 108.6Indiana - 89.1 - 6.4 - 9.2 - 104.6Iowa 1.0 81.0 5.6 12.0 0.7 7.4 - 107.6Kansas 2.6 18.9 29.6 24.2 17.8 18.5 - 111.6Kentucky 2.2 95.1 - 6.8 0.2 3.8 - 108.1Louisiana - 85.9 0.1 15.2 0.4 5.2 - 106.8Maine - 63.1 - 29.4 34.4 8.2 - 135.1Maryland - 60.7 - 22.3 0.1 23.4 - 106.5Massachusetts - 93.9 0.1 8.8 - 3.4 - 106.2Michigan 1.9 79.5 - 24.9 0.3 3.7 - 110.3Minnesota 0.2 65.1 - 30.4 1.6 17.5 - 114.8Mississippi 3.8 75.7 0.3 14.8 14.9 11.2 - 120.7Missouri 3.5 58.5 0.0 29.7 10.4 27.2 - 129.4Montana 0.2 97.5 - 4.0 0.9 2.7 - 105.2Nebraska 0.0 85.4 - 11.7 0.8 7.5 - 105.4Nevada 1.7 82.7 - 21.9 0.2 5.2 - 111.7New Hampshire 2.3 88.6 - 8.4 0.7 6.8 - 106.8New Jersey - 79.9 - 13.7 0.8 10.7 - 105.0New Mexico 3.5 80.2 - 12.2 27.4 2.6 - 125.8New York 6.5 95.0 28.3 9.7 0.8 3.0 - 143.3North Carolina 0.8 52.1 1.3 24.5 1.6 19.5 1.1 100.9North Dakota 2.2 76.8 - 7.9 39.8 2.4 - 129.1Ohio 2.0 45.0 - 47.8 3.7 17.4 - 115.9Oklahoma 1.2 78.6 - 14.1 26.6 4.8 - 125.3Oregon 1.5 56.8 48.1 10.5 1.6 7.9 - 126.5Pennsylvania 5.5 8.0 1.6 42.4 1.2 45.8 - 104.5Puerto Rico 8.4 58.9 0.4 24.4 51.8 2.5 - 146.3Rhode Island 1.6 57.7 2.1 14.7 35.3 3.3 - 114.6South Carolina 2.1 56.7 0.4 54.0 0.8 4.9 - 118.8South Dakota - 89.8 - 11.6 1.3 4.4 - 107.1Tennessee 1.5 24.9 - 60.4 2.2 28.0 - 117.0Texas 1.9 82.6 0.0 14.3 0.6 9.9 0.0 109.3Utah 0.5 29.4 1.5 45.0 28.2 17.2 - 121.8Vermont 1.3 2.4 - 57.9 - 41.7 - 103.2Virginia 2.2 65.3 0.1 30.4 1.3 11.1 - 110.4Washington - 79.0 - 20.8 - 10.6 - 110.5West Virginia 4.5 40.5 - 78.2 62.3 3.5 - 189.1Wisconsin - 67.4 - 16.1 0.8 20.6 - 104.9Wyoming 1.2 74.8 0.3 1.5 30.4 6.6 - 114.8National 2.2 74.9 7.1 18.3 5.7 8.6 0.0 116.8Reporting States - - - - - - - -
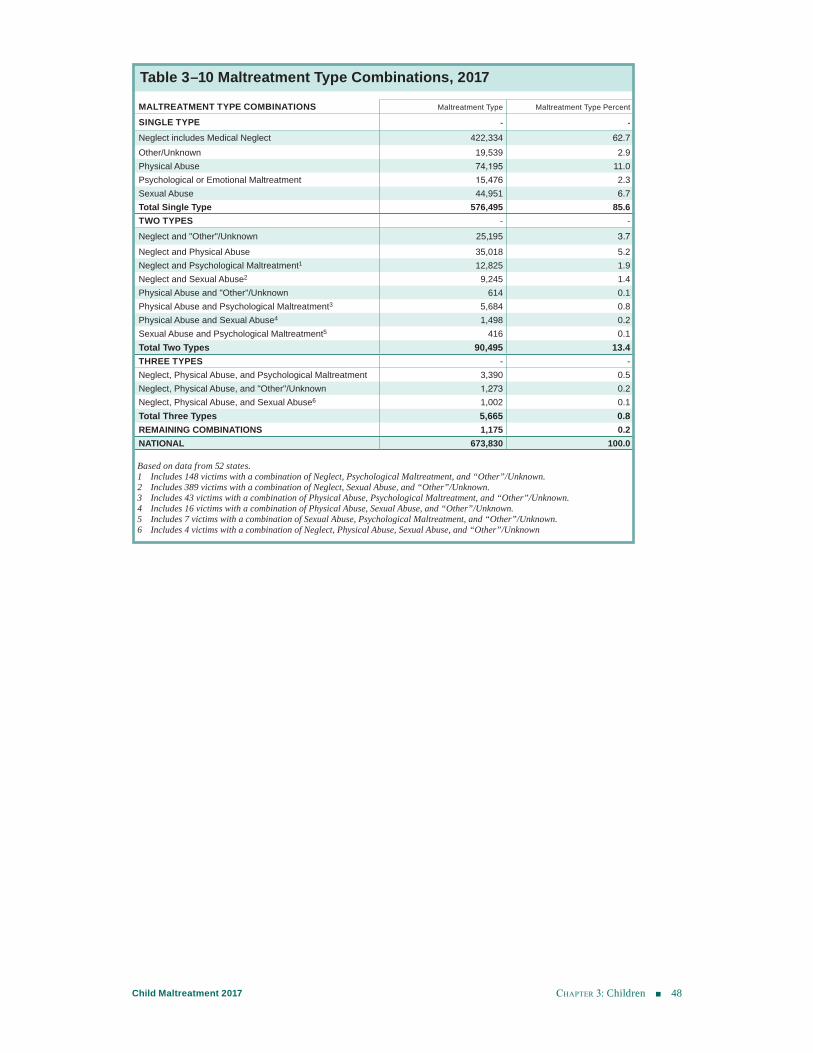
chApter 3: Children 48Child Maltreatment 2017
Table 3–10 Maltreatment Type Combinations, 2017
MALTREATMENT TYPE COMBINATIONS Maltreatment Type Maltreatment Type Percent
SINGLE TYPE - -
Neglect includes Medical Neglect 422,334 62.7Other/Unknown 19,539 2.9Physical Abuse 74,195 11.0Psychological or Emotional Maltreatment 15,476 2.3Sexual Abuse 44,951 6.7Total Single Type 576,495 85.6TWO TYPES - -Neglect and "Other"/Unknown 25,195 3.7 Neglect and Physical Abuse 35,018 5.2 Neglect and Psychological Maltreatment1 12,825 1.9 Neglect and Sexual Abuse2 9,245 1.4 Physical Abuse and "Other"/Unknown 614 0.1 Physical Abuse and Psychological Maltreatment3 5,684 0.8 Physical Abuse and Sexual Abuse4 1,498 0.2 Sexual Abuse and Psychological Maltreatment5 416 0.1 Total Two Types 90,495 13.4 THREE TYPES - -Neglect, Physical Abuse, and Psychological Maltreatment 3,390 0.5 Neglect, Physical Abuse, and "Other"/Unknown 1,273 0.2 Neglect, Physical Abuse, and Sexual Abuse6 1,002 0.1 Total Three Types 5,665 0.8 REMAINING COMBINATIONS 1,175 0.2NATIONAL 673,830 100.0
Based on data from 52 states.
1 Includes 148 victims with a combination of Neglect, Psychological Maltreatment, and “Other”/Unknown. 2 Includes 389 victims with a combination of Neglect, Sexual Abuse, and “Other”/Unknown. 3 Includes 43 victims with a combination of Physical Abuse, Psychological Maltreatment, and “Other”/Unknown. 4 Includes 16 victims with a combination of Physical Abuse, Sexual Abuse, and “Other”/Unknown. 5 Includes 7 victims with a combination of Sexual Abuse, Psychological Maltreatment, and “Other”/Unknown. 6 Includes 4 victims with a combination of Neglect, Physical Abuse, Sexual Abuse, and “Other”/Unknown
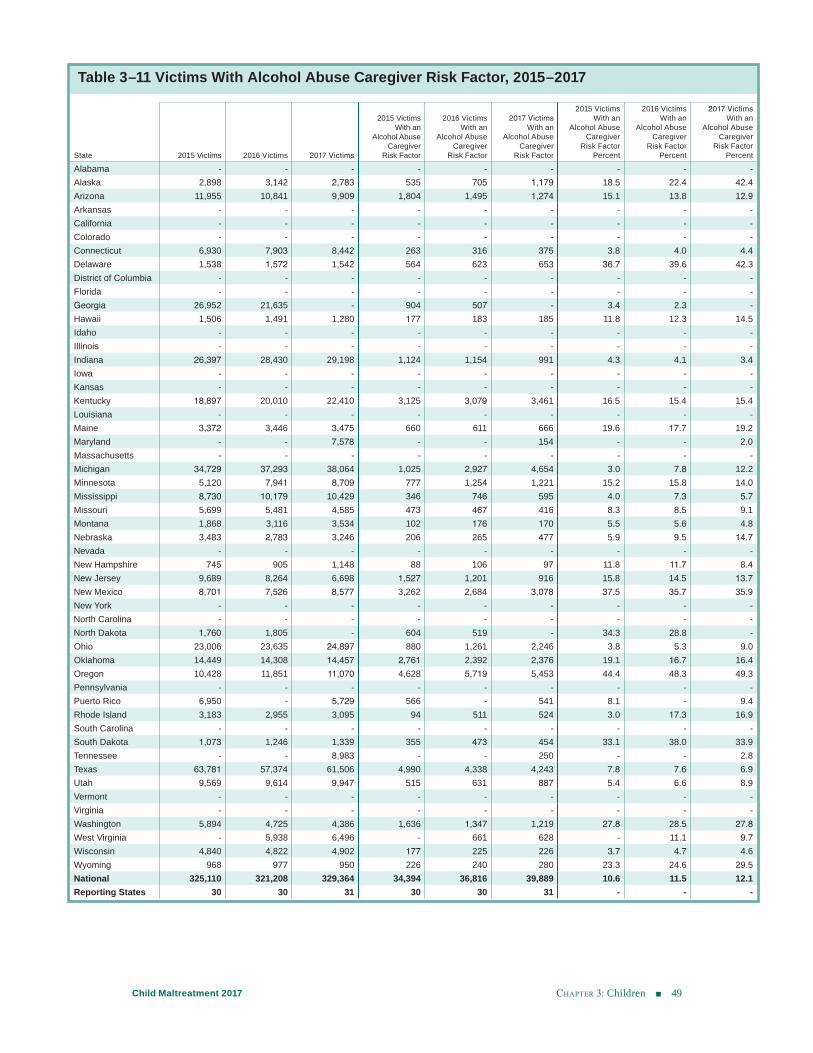
chApter 3: Children 49Child Maltreatment 2017
Table 3–11 Victims With Alcohol Abuse Caregiver Risk Factor, 2015–2017
State 2015 Victims 2016 Victims 2017 Victims
2015 Victims With an
Alcohol Abuse Caregiver
Risk Factor
2016 Victims With an
Alcohol Abuse Caregiver
Risk Factor
2017 Victims With an
Alcohol Abuse Caregiver
Risk Factor
2015 Victims With an
Alcohol Abuse Caregiver
Risk Factor Percent
2016 Victims With an
Alcohol Abuse Caregiver
Risk Factor Percent
2017 Victims With an
Alcohol Abuse Caregiver
Risk Factor Percent
Alabama - - - - - - - - -Alaska 2,898 3,142 2,783 535 705 1,179 18.5 22.4 42.4Arizona 11,955 10,841 9,909 1,804 1,495 1,274 15.1 13.8 12.9Arkansas - - - - - - - - -California - - - - - - - - -Colorado - - - - - - - - -Connecticut 6,930 7,903 8,442 263 316 375 3.8 4.0 4.4Delaware 1,538 1,572 1,542 564 623 653 36.7 39.6 42.3District of Columbia - - - - - - - - -Florida - - - - - - - - -Georgia 26,952 21,635 - 904 507 - 3.4 2.3 -Hawaii 1,506 1,491 1,280 177 183 185 11.8 12.3 14.5Idaho - - - - - - - - -Illinois - - - - - - - - -Indiana 26,397 28,430 29,198 1,124 1,154 991 4.3 4.1 3.4Iowa - - - - - - - - -Kansas - - - - - - - - -Kentucky 18,897 20,010 22,410 3,125 3,079 3,461 16.5 15.4 15.4Louisiana - - - - - - - - -Maine 3,372 3,446 3,475 660 611 666 19.6 17.7 19.2Maryland - - 7,578 - - 154 - - 2.0Massachusetts - - - - - - - - -Michigan 34,729 37,293 38,064 1,025 2,927 4,654 3.0 7.8 12.2Minnesota 5,120 7,941 8,709 777 1,254 1,221 15.2 15.8 14.0Mississippi 8,730 10,179 10,429 346 746 595 4.0 7.3 5.7Missouri 5,699 5,481 4,585 473 467 416 8.3 8.5 9.1Montana 1,868 3,116 3,534 102 176 170 5.5 5.6 4.8Nebraska 3,483 2,783 3,246 206 265 477 5.9 9.5 14.7Nevada - - - - - - - - -New Hampshire 745 905 1,148 88 106 97 11.8 11.7 8.4New Jersey 9,689 8,264 6,698 1,527 1,201 916 15.8 14.5 13.7New Mexico 8,701 7,526 8,577 3,262 2,684 3,078 37.5 35.7 35.9New York - - - - - - - - -North Carolina - - - - - - - - -North Dakota 1,760 1,805 - 604 519 - 34.3 28.8 -Ohio 23,006 23,635 24,897 880 1,261 2,246 3.8 5.3 9.0Oklahoma 14,449 14,308 14,457 2,761 2,392 2,376 19.1 16.7 16.4Oregon 10,428 11,851 11,070 4,628 5,719 5,453 44.4 48.3 49.3Pennsylvania - - - - - - - - -Puerto Rico 6,950 - 5,729 566 - 541 8.1 - 9.4Rhode Island 3,183 2,955 3,095 94 511 524 3.0 17.3 16.9South Carolina - - - - - - - - -South Dakota 1,073 1,246 1,339 355 473 454 33.1 38.0 33.9Tennessee - - 8,983 - - 250 - - 2.8Texas 63,781 57,374 61,506 4,990 4,338 4,243 7.8 7.6 6.9Utah 9,569 9,614 9,947 515 631 887 5.4 6.6 8.9Vermont - - - - - - - - -Virginia - - - - - - - - -Washington 5,894 4,725 4,386 1,636 1,347 1,219 27.8 28.5 27.8West Virginia - 5,938 6,496 - 661 628 - 11.1 9.7Wisconsin 4,840 4,822 4,902 177 225 226 3.7 4.7 4.6Wyoming 968 977 950 226 240 280 23.3 24.6 29.5National 325,110 321,208 329,364 34,394 36,816 39,889 10.6 11.5 12.1Reporting States 30 30 31 30 30 31 - - -
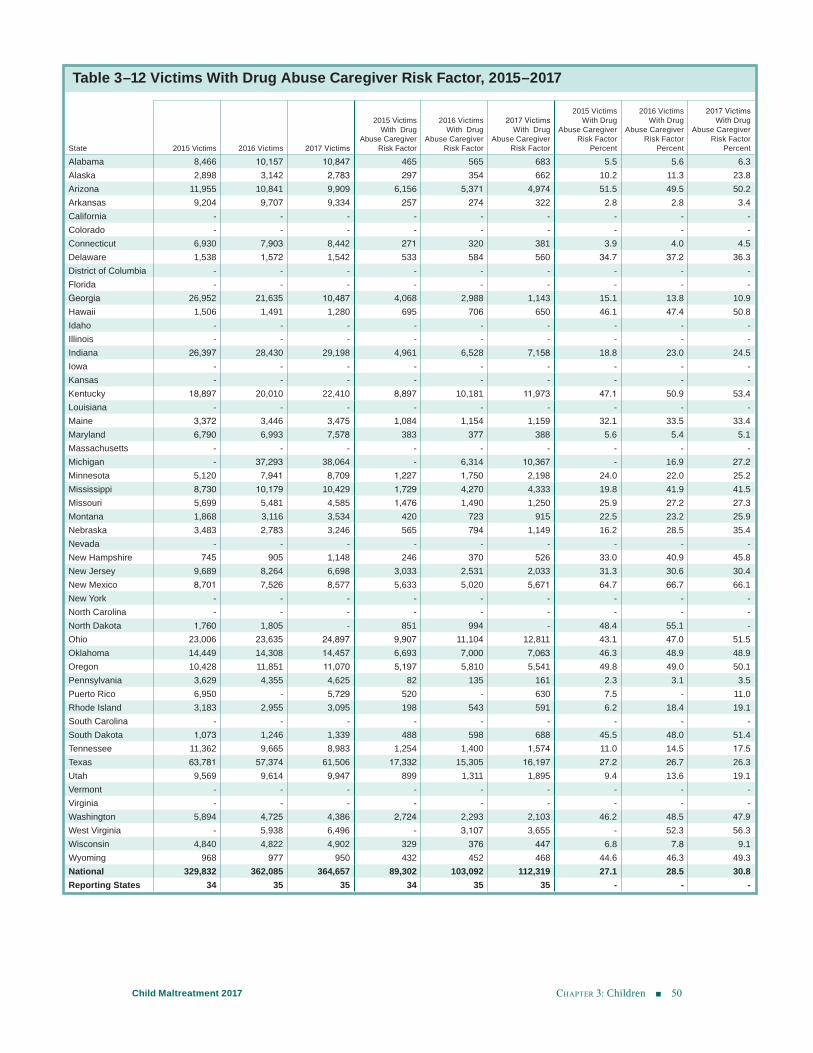
chApter 3: Children 50Child Maltreatment 2017
Table 3–12 Victims With Drug Abuse Caregiver Risk Factor, 2015–2017
State 2015 Victims 2016 Victims 2017 Victims
2015 Victims With Drug
Abuse Caregiver Risk Factor
2016 Victims With Drug
Abuse Caregiver Risk Factor
2017 Victims With Drug
Abuse Caregiver Risk Factor
2015 Victims With Drug
Abuse Caregiver Risk Factor
Percent
2016 Victims With Drug
Abuse Caregiver Risk Factor
Percent
2017 Victims With Drug
Abuse Caregiver Risk Factor
Percent
Alabama 8,466 10,157 10,847 465 565 683 5.5 5.6 6.3Alaska 2,898 3,142 2,783 297 354 662 10.2 11.3 23.8Arizona 11,955 10,841 9,909 6,156 5,371 4,974 51.5 49.5 50.2Arkansas 9,204 9,707 9,334 257 274 322 2.8 2.8 3.4California - - - - - - - - -Colorado - - - - - - - - -Connecticut 6,930 7,903 8,442 271 320 381 3.9 4.0 4.5Delaware 1,538 1,572 1,542 533 584 560 34.7 37.2 36.3District of Columbia - - - - - - - - -Florida - - - - - - - - -Georgia 26,952 21,635 10,487 4,068 2,988 1,143 15.1 13.8 10.9Hawaii 1,506 1,491 1,280 695 706 650 46.1 47.4 50.8Idaho - - - - - - - - -Illinois - - - - - - - - -Indiana 26,397 28,430 29,198 4,961 6,528 7,158 18.8 23.0 24.5Iowa - - - - - - - - -Kansas - - - - - - - - -Kentucky 18,897 20,010 22,410 8,897 10,181 11,973 47.1 50.9 53.4Louisiana - - - - - - - - -Maine 3,372 3,446 3,475 1,084 1,154 1,159 32.1 33.5 33.4Maryland 6,790 6,993 7,578 383 377 388 5.6 5.4 5.1Massachusetts - - - - - - - - -Michigan - 37,293 38,064 - 6,314 10,367 - 16.9 27.2Minnesota 5,120 7,941 8,709 1,227 1,750 2,198 24.0 22.0 25.2Mississippi 8,730 10,179 10,429 1,729 4,270 4,333 19.8 41.9 41.5Missouri 5,699 5,481 4,585 1,476 1,490 1,250 25.9 27.2 27.3Montana 1,868 3,116 3,534 420 723 915 22.5 23.2 25.9Nebraska 3,483 2,783 3,246 565 794 1,149 16.2 28.5 35.4Nevada - - - - - - - - -New Hampshire 745 905 1,148 246 370 526 33.0 40.9 45.8New Jersey 9,689 8,264 6,698 3,033 2,531 2,033 31.3 30.6 30.4New Mexico 8,701 7,526 8,577 5,633 5,020 5,671 64.7 66.7 66.1New York - - - - - - - - -North Carolina - - - - - - - - -North Dakota 1,760 1,805 - 851 994 - 48.4 55.1 -Ohio 23,006 23,635 24,897 9,907 11,104 12,811 43.1 47.0 51.5Oklahoma 14,449 14,308 14,457 6,693 7,000 7,063 46.3 48.9 48.9Oregon 10,428 11,851 11,070 5,197 5,810 5,541 49.8 49.0 50.1Pennsylvania 3,629 4,355 4,625 82 135 161 2.3 3.1 3.5Puerto Rico 6,950 - 5,729 520 - 630 7.5 - 11.0Rhode Island 3,183 2,955 3,095 198 543 591 6.2 18.4 19.1South Carolina - - - - - - - - -South Dakota 1,073 1,246 1,339 488 598 688 45.5 48.0 51.4Tennessee 11,362 9,665 8,983 1,254 1,400 1,574 11.0 14.5 17.5Texas 63,781 57,374 61,506 17,332 15,305 16,197 27.2 26.7 26.3Utah 9,569 9,614 9,947 899 1,311 1,895 9.4 13.6 19.1Vermont - - - - - - - - -Virginia - - - - - - - - -Washington 5,894 4,725 4,386 2,724 2,293 2,103 46.2 48.5 47.9West Virginia - 5,938 6,496 - 3,107 3,655 - 52.3 56.3Wisconsin 4,840 4,822 4,902 329 376 447 6.8 7.8 9.1Wyoming 968 977 950 432 452 468 44.6 46.3 49.3National 329,832 362,085 364,657 89,302 103,092 112,319 27.1 28.5 30.8Reporting States 34 35 35 34 35 35 - - -
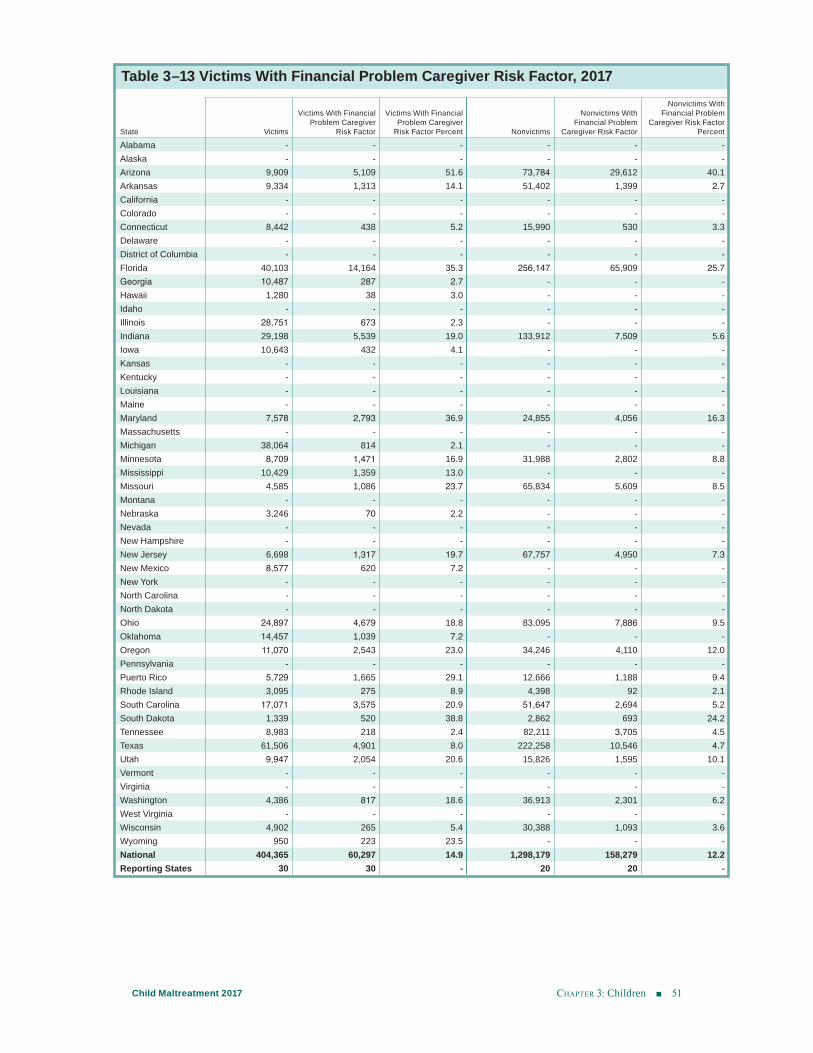
chApter 3: Children 51Child Maltreatment 2017
Table 3–13 Victims With Financial Problem Caregiver Risk Factor, 2017
State Victims
Victims With Financial Problem Caregiver
Risk Factor
Victims With Financial Problem Caregiver
Risk Factor Percent Nonvictims
Nonvictims With Financial Problem
Caregiver Risk Factor
Nonvictims With Financial Problem
Caregiver Risk Factor Percent
Alabama - - - - - -Alaska - - - - - -Arizona 9,909 5,109 51.6 73,784 29,612 40.1Arkansas 9,334 1,313 14.1 51,402 1,399 2.7California - - - - - -Colorado - - - - - -Connecticut 8,442 438 5.2 15,990 530 3.3Delaware - - - - - -District of Columbia - - - - - -Florida 40,103 14,164 35.3 256,147 65,909 25.7Georgia 10,487 287 2.7 - - -Hawaii 1,280 38 3.0 - - -Idaho - - - - - -Illinois 28,751 673 2.3 - - -Indiana 29,198 5,539 19.0 133,912 7,509 5.6Iowa 10,643 432 4.1 - - -Kansas - - - - - -Kentucky - - - - - -Louisiana - - - - - -Maine - - - - - -Maryland 7,578 2,793 36.9 24,855 4,056 16.3Massachusetts - - - - - -Michigan 38,064 814 2.1 - - -Minnesota 8,709 1,471 16.9 31,988 2,802 8.8Mississippi 10,429 1,359 13.0 - - -Missouri 4,585 1,086 23.7 65,834 5,609 8.5Montana - - - - - -Nebraska 3,246 70 2.2 - - -Nevada - - - - - -New Hampshire - - - - - -New Jersey 6,698 1,317 19.7 67,757 4,950 7.3New Mexico 8,577 620 7.2 - - -New York - - - - - -North Carolina - - - - - -North Dakota - - - - - -Ohio 24,897 4,679 18.8 83,095 7,886 9.5Oklahoma 14,457 1,039 7.2 - - -Oregon 11,070 2,543 23.0 34,246 4,110 12.0Pennsylvania - - - - - -Puerto Rico 5,729 1,665 29.1 12,666 1,188 9.4Rhode Island 3,095 275 8.9 4,398 92 2.1South Carolina 17,071 3,575 20.9 51,647 2,694 5.2South Dakota 1,339 520 38.8 2,862 693 24.2Tennessee 8,983 218 2.4 82,211 3,705 4.5Texas 61,506 4,901 8.0 222,258 10,546 4.7Utah 9,947 2,054 20.6 15,826 1,595 10.1Vermont - - - - - -Virginia - - - - - -Washington 4,386 817 18.6 36,913 2,301 6.2West Virginia - - - - - -Wisconsin 4,902 265 5.4 30,388 1,093 3.6Wyoming 950 223 23.5 - - -National 404,365 60,297 14.9 1,298,179 158,279 12.2Reporting States 30 30 - 20 20 -
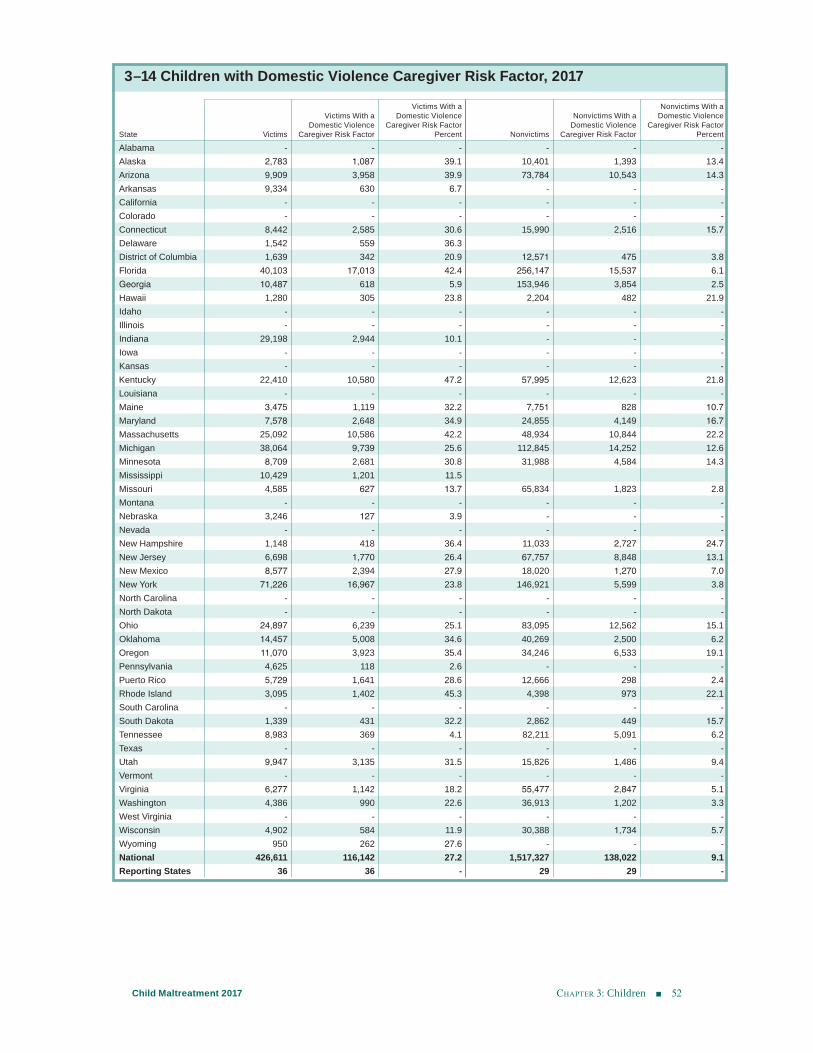
chApter 3: Children 52Child Maltreatment 2017
3–14 Children with Domestic Violence Caregiver Risk Factor, 2017
State Victims
Victims With a Domestic Violence
Caregiver Risk Factor
Victims With a Domestic Violence
Caregiver Risk Factor Percent Nonvictims
Nonvictims With a Domestic Violence
Caregiver Risk Factor
Nonvictims With a Domestic Violence
Caregiver Risk Factor Percent
Alabama - - - - - - Alaska 2,783 1,087 39.1 10,401 1,393 13.4Arizona 9,909 3,958 39.9 73,784 10,543 14.3Arkansas 9,334 630 6.7 - - - California - - - - - - Colorado - - - - - - Connecticut 8,442 2,585 30.6 15,990 2,516 15.7Delaware 1,542 559 36.3District of Columbia 1,639 342 20.9 12,571 475 3.8Florida 40,103 17,013 42.4 256,147 15,537 6.1Georgia 10,487 618 5.9 153,946 3,854 2.5Hawaii 1,280 305 23.8 2,204 482 21.9Idaho - - - - - - Illinois - - - - - - Indiana 29,198 2,944 10.1 - - - Iowa - - - - - - Kansas - - - - - - Kentucky 22,410 10,580 47.2 57,995 12,623 21.8Louisiana - - - - - - Maine 3,475 1,119 32.2 7,751 828 10.7Maryland 7,578 2,648 34.9 24,855 4,149 16.7Massachusetts 25,092 10,586 42.2 48,934 10,844 22.2Michigan 38,064 9,739 25.6 112,845 14,252 12.6Minnesota 8,709 2,681 30.8 31,988 4,584 14.3Mississippi 10,429 1,201 11.5Missouri 4,585 627 13.7 65,834 1,823 2.8Montana - - - - - - Nebraska 3,246 127 3.9 - - - Nevada - - - - - - New Hampshire 1,148 418 36.4 11,033 2,727 24.7New Jersey 6,698 1,770 26.4 67,757 8,848 13.1New Mexico 8,577 2,394 27.9 18,020 1,270 7.0New York 71,226 16,967 23.8 146,921 5,599 3.8North Carolina - - - - - - North Dakota - - - - - - Ohio 24,897 6,239 25.1 83,095 12,562 15.1Oklahoma 14,457 5,008 34.6 40,269 2,500 6.2Oregon 11,070 3,923 35.4 34,246 6,533 19.1Pennsylvania 4,625 118 2.6 - - - Puerto Rico 5,729 1,641 28.6 12,666 298 2.4Rhode Island 3,095 1,402 45.3 4,398 973 22.1South Carolina - - - - - - South Dakota 1,339 431 32.2 2,862 449 15.7Tennessee 8,983 369 4.1 82,211 5,091 6.2Texas - - - - - - Utah 9,947 3,135 31.5 15,826 1,486 9.4Vermont - - - - - - Virginia 6,277 1,142 18.2 55,477 2,847 5.1Washington 4,386 990 22.6 36,913 1,202 3.3West Virginia - - - - - - Wisconsin 4,902 584 11.9 30,388 1,734 5.7Wyoming 950 262 27.6 - - - National 426,611 116,142 27.2 1,517,327 138,022 9.1Reporting States 36 36 - 29 29 -
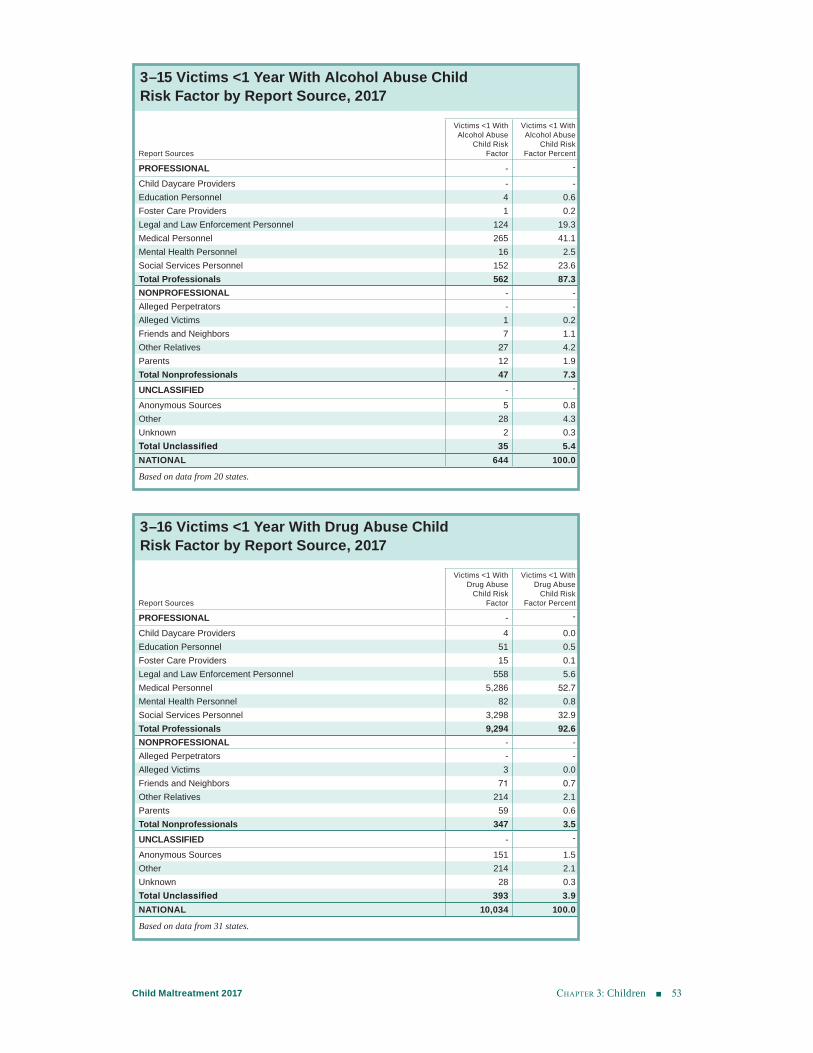
chApter 3: Children 53Child Maltreatment 2017
3–15 Victims <1 Year With Alcohol Abuse Child Risk Factor by Report Source, 2017
Report Sources
Victims <1 With Alcohol Abuse
Child Risk Factor
Victims <1 With Alcohol Abuse
Child Risk Factor Percent
PROFESSIONAL - -
Child Daycare Providers - -Education Personnel 4 0.6Foster Care Providers 1 0.2Legal and Law Enforcement Personnel 124 19.3Medical Personnel 265 41.1Mental Health Personnel 16 2.5Social Services Personnel 152 23.6Total Professionals 562 87.3NONPROFESSIONAL - -Alleged Perpetrators - -Alleged Victims 1 0.2Friends and Neighbors 7 1.1Other Relatives 27 4.2Parents 12 1.9Total Nonprofessionals 47 7.3UNCLASSIFIED - -
Anonymous Sources 5 0.8Other 28 4.3Unknown 2 0.3Total Unclassified 35 5.4NATIONAL 644 100.0
Based on data from 20 states.
3–16 Victims <1 Year With Drug Abuse Child Risk Factor by Report Source, 2017
Report Sources
Victims <1 With Drug Abuse
Child Risk Factor
Victims <1 With Drug Abuse
Child Risk Factor Percent
PROFESSIONAL - -
Child Daycare Providers 4 0.0Education Personnel 51 0.5Foster Care Providers 15 0.1Legal and Law Enforcement Personnel 558 5.6Medical Personnel 5,286 52.7Mental Health Personnel 82 0.8Social Services Personnel 3,298 32.9Total Professionals 9,294 92.6NONPROFESSIONAL - -Alleged Perpetrators - -Alleged Victims 3 0.0Friends and Neighbors 71 0.7Other Relatives 214 2.1Parents 59 0.6Total Nonprofessionals 347 3.5UNCLASSIFIED - -
Anonymous Sources 151 1.5Other 214 2.1Unknown 28 0.3Total Unclassified 393 3.9NATIONAL 10,034 100.0
Based on data from 31 states.
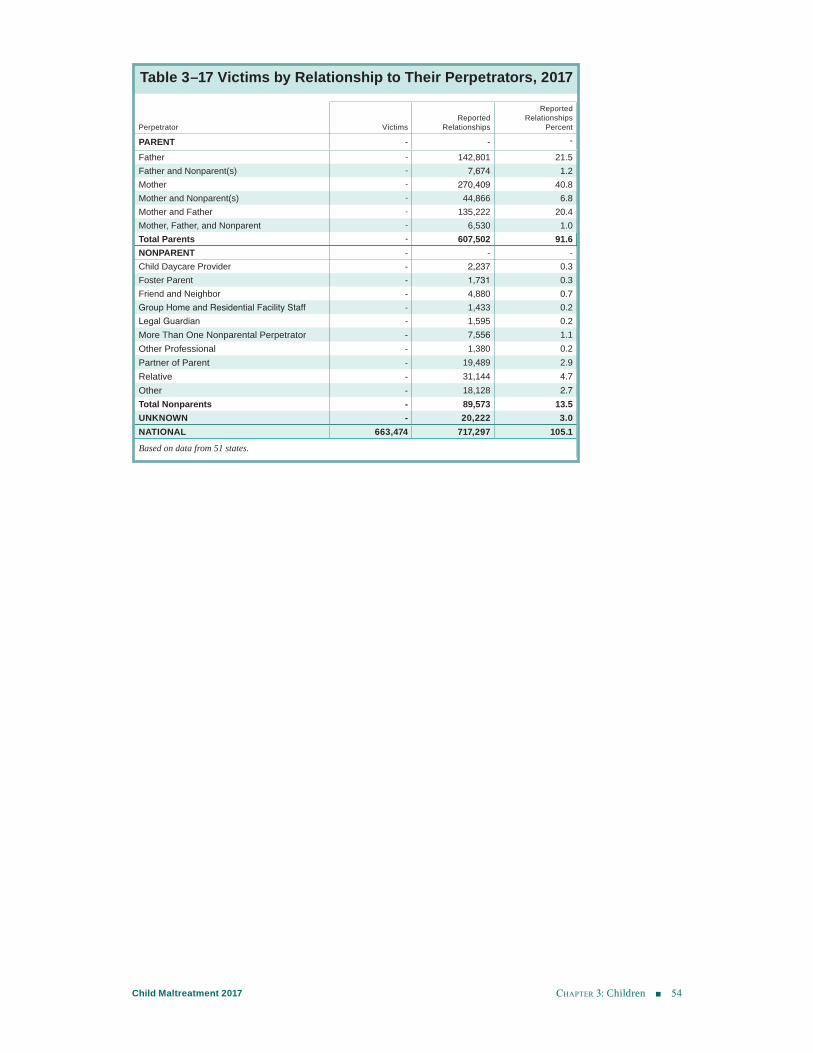
chApter 3: Children 54Child Maltreatment 2017
Table 3–17 Victims by Relationship to Their Perpetrators, 2017
Perpetrator VictimsReported
Relationships
Reported Relationships
Percent
PARENT - - -
Father - 142,801 21.5Father and Nonparent(s) - 7,674 1.2Mother - 270,409 40.8Mother and Nonparent(s) - 44,866 6.8Mother and Father - 135,222 20.4Mother, Father, and Nonparent - 6,530 1.0Total Parents - 607,502 91.6NONPARENT - - -Child Daycare Provider - 2,237 0.3Foster Parent - 1,731 0.3Friend and Neighbor - 4,880 0.7Group Home and Residential Facility Staff - 1,433 0.2Legal Guardian - 1,595 0.2More Than One Nonparental Perpetrator - 7,556 1.1Other Professional - 1,380 0.2Partner of Parent - 19,489 2.9Relative - 31,144 4.7Other - 18,128 2.7Total Nonparents - 89,573 13.5UNKNOWN - 20,222 3.0NATIONAL 663,474 717,297 105.1
Based on data from 51 states.
chApter 4: Fatalities 55Child Maltreatment 2017
Fatalities
The effects of child abuse and neglect are serious, and a child fatality is the most tragic consequence. NCANDS collects case-level data in the Child File on child deaths from maltreatment. Additional counts of child fatalities, for which case-level data are not known, are reported in the Agency File.
Some child maltreatment deaths may not come to the attention of CPS agencies. Reasons for this include if there were no surviving siblings in the family, or if the child had not (prior to his or her death) received child welfare services. To improve the counts of child fatalities, states consult data sources outside of CPS for deaths attributed to child maltreatment. The Child and Family Services Improvement and Innovation Act (P.L. 112–34) lists the follow-ing additional data sources, which states must include a description of in their state plan or explain why they are not used to report child deaths due to maltreatment: state vital statistics departments, child death review teams, law enforcement agencies, and offices of medical examiners or coroners. In addition to the sources mentioned in the law, some states also collect child fatality data from hospitals, health departments, juvenile justice departments, and prosecutor and attorney general offices. States that can provide these additional data do so as aggregate data via the Agency File. After the passage of P.L. 112–34, several states mentioned that they implemented new child death reviews or expanded the scope of existing reviews. Some states began investigating all unexplained infant deaths regardless of whether there was an allegation of maltreatment.
Number of Child FatalitiesFor FFY 2017, a national estimate of 1,720 children died from abuse and neglect at a rate of 2.32 per 100,000 children in the population. The 2017 national estimate is an 11.0 percent increase from the 2013 national estimate of 1,550.1 (See exhibit 4–A and related notes.) Due to the relatively low frequency of child fatalities, the national rate and national estimate are sensi-tive to which states report data and changes in the child population estimates produced by the U.S. Census Bureau. Detailed explanations for data fluctuations may be found in Appendix D, State Commentary. An explanation for a change may be in an earlier edition of the Child Maltreatment report. Previous editions of the report are located on the Children’s Bureau website at https://www.acf.hhs.gov/cb/research-data-technology/statistics-research/ child-maltreatment.
CHAPTER 4
1 The percent change is calculated using the national estimates for FFY 2013 and FFY 2017.
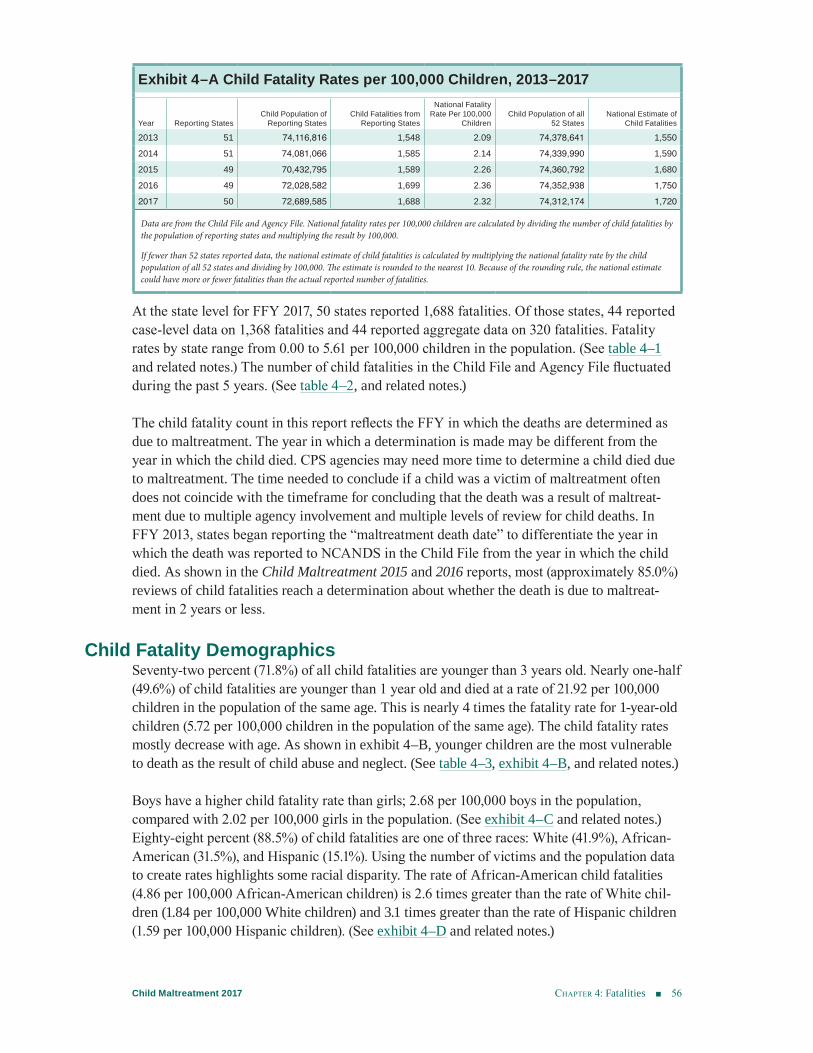
chApter 4: Fatalities 56Child Maltreatment 2017
At the state level for FFY 2017, 50 states reported 1,688 fatalities. Of those states, 44 reported case-level data on 1,368 fatalities and 44 reported aggregate data on 320 fatalities. Fatality rates by state range from 0.00 to 5.61 per 100,000 children in the population. (See table 4–1 and related notes.) The number of child fatalities in the Child File and Agency File fluctuated during the past 5 years. (See table 4–2, and related notes.)
The child fatality count in this report reflects the FFY in which the deaths are determined as due to maltreatment. The year in which a determination is made may be different from the year in which the child died. CPS agencies may need more time to determine a child died due to maltreatment. The time needed to conclude if a child was a victim of maltreatment often does not coincide with the timeframe for concluding that the death was a result of maltreat-ment due to multiple agency involvement and multiple levels of review for child deaths. In FFY 2013, states began reporting the “maltreatment death date” to differentiate the year in which the death was reported to NCANDS in the Child File from the year in which the child died. As shown in the Child Maltreatment 2015 and 2016 reports, most (approximately 85.0%) reviews of child fatalities reach a determination about whether the death is due to maltreat-ment in 2 years or less.
Child Fatality DemographicsSeventy-two percent (71.8%) of all child fatalities are younger than 3 years old. Nearly one-half (49.6%) of child fatalities are younger than 1 year old and died at a rate of 21.92 per 100,000 children in the population of the same age. This is nearly 4 times the fatality rate for 1-year-old children (5.72 per 100,000 children in the population of the same age). The child fatality rates mostly decrease with age. As shown in exhibit 4–B, younger children are the most vulnerable to death as the result of child abuse and neglect. (See table 4–3, exhibit 4–B, and related notes.)
Boys have a higher child fatality rate than girls; 2.68 per 100,000 boys in the population, compared with 2.02 per 100,000 girls in the population. (See exhibit 4–C and related notes.) Eighty-eight percent (88.5%) of child fatalities are one of three races: White (41.9%), African-American (31.5%), and Hispanic (15.1%). Using the number of victims and the population data to create rates highlights some racial disparity. The rate of African-American child fatalities (4.86 per 100,000 African-American children) is 2.6 times greater than the rate of White chil-dren (1.84 per 100,000 White children) and 3.1 times greater than the rate of Hispanic children (1.59 per 100,000 Hispanic children). (See exhibit 4–D and related notes.)
Exhibit 4–A Child Fatality Rates per 100,000 Children, 2013–2017
Year Reporting StatesChild Population of
Reporting States Child Fatalities from
Reporting States
National Fatality Rate Per 100,000
ChildrenChild Population of all
52 StatesNational Estimate of
Child Fatalities
2013 51 74,116,816 1,548 2.09 74,378,641 1,5502014 51 74,081,066 1,585 2.14 74,339,990 1,5902015 49 70,432,795 1,589 2.26 74,360,792 1,6802016 49 72,028,582 1,699 2.36 74,352,938 1,7502017 50 72,689,585 1,688 2.32 74,312,174 1,720
Data are from the Child File and Agency File. National fatality rates per 100,000 children are calculated by dividing the number of child fatalities by the population of reporting states and multiplying the result by 100,000.
If fewer than 52 states reported data, the national estimate of child fatalities is calculated by multiplying the national fatality rate by the child population of all 52 states and dividing by 100,000. The estimate is rounded to the nearest 10. Because of the rounding rule, the national estimate could have more or fewer fatalities than the actual reported number of fatalities.
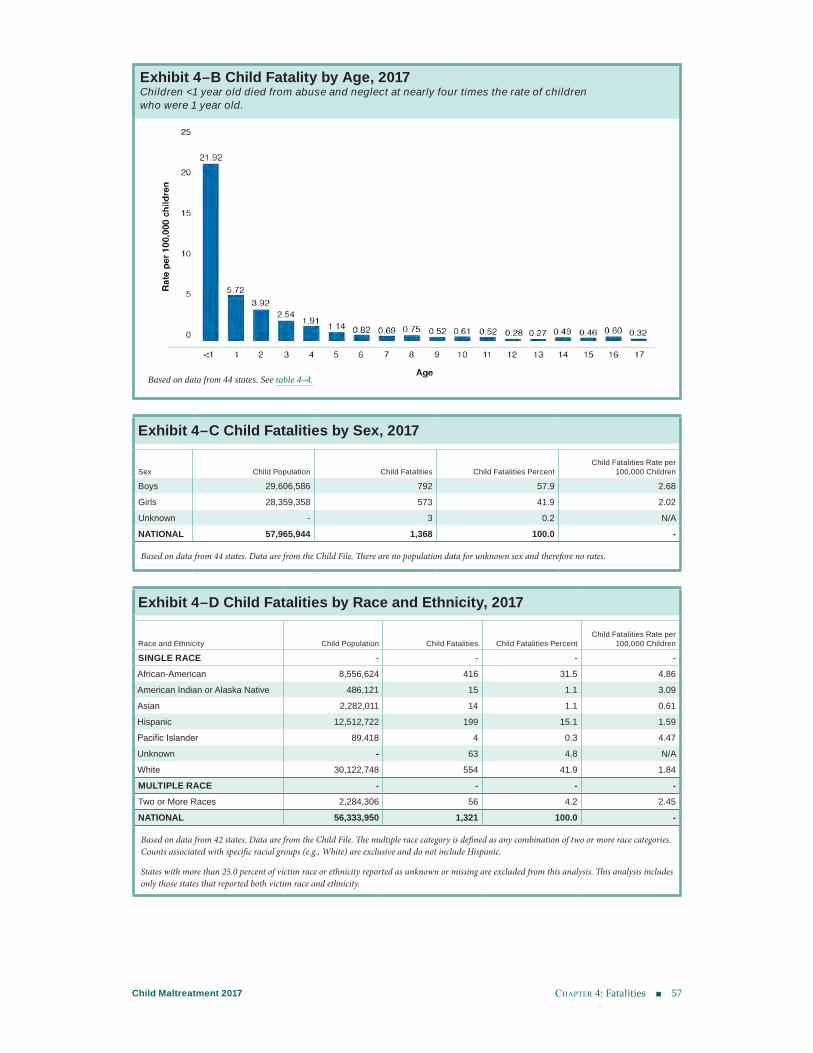
Chapter 4: Fatalities 57Child Maltreatment 2017
Exhibit 4–B Child Fatality by Age, 2017Children <1 year old died from abuse and neglect at nearly four times the rate of children who were 1 year old.
Based on data from 44 states. See table 4–4.
Exhibit 4–C Child Fatalities by Sex, 2017
Sex Child Population Child Fatalities Child Fatalities PercentChild Fatalities Rate per
100,000 Children
Boys 29,606,586 792 57.9 2.68Girls 28,359,358 573 41.9 2.02Unknown - 3 0.2 N/ANATIONAL 57,965,944 1,368 100.0 -
Based on data from 44 states. Data are from the Child File. There are no population data for unknown sex and therefore no rates.
Exhibit 4–D Child Fatalities by Race and Ethnicity, 2017
Race and Ethnicity Child Population Child Fatalities Child Fatalities PercentChild Fatalities Rate per
100,000 Children
SINGLE RACE - - - -African-American 8,556,624 416 31.5 4.86American Indian or Alaska Native 486,121 15 1.1 3.09Asian 2,282,011 14 1.1 0.61Hispanic 12,512,722 199 15.1 1.59Pacific Islander 89,418 4 0.3 4.47Unknown - 63 4.8 N/AWhite 30,122,748 554 41.9 1.84MULTIPLE RACE - - - -Two or More Races 2,284,306 56 4.2 2.45NATIONAL 56,333,950 1,321 100.0 -
Based on data from 42 states. Data are from the Child File. The multiple race category is defined as any combination of two or more race categories. Counts associated with specific racial groups (e.g., White) are exclusive and do not include Hispanic.
States with more than 25.0 percent of victim race or ethnicity reported as unknown or missing are excluded from this analysis. This analysis includes only those states that reported both victim race and ethnicity.
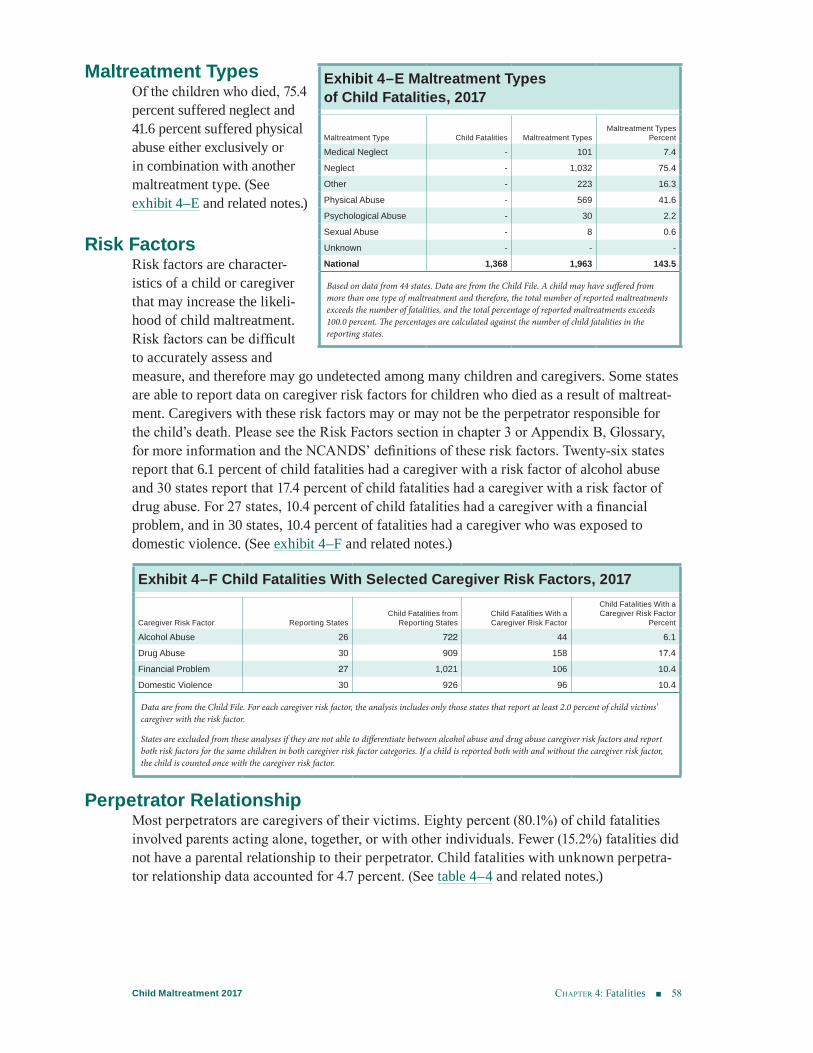
chApter 4: Fatalities 58Child Maltreatment 2017
Maltreatment TypesOf the children who died, 75.4 percent suffered neglect and 41.6 percent suffered physical abuse either exclusively or in combination with another maltreatment type. (See exhibit 4–E and related notes.)
Risk FactorsRisk factors are character-istics of a child or caregiver that may increase the likeli-hood of child maltreatment. Risk factors can be difficult to accurately assess and measure, and therefore may go undetected among many children and caregivers. Some states are able to report data on caregiver risk factors for children who died as a result of maltreat-ment. Caregivers with these risk factors may or may not be the perpetrator responsible for the child’s death. Please see the Risk Factors section in chapter 3 or Appendix B, Glossary, for more information and the NCANDS’ definitions of these risk factors. Twenty-six states report that 6.1 percent of child fatalities had a caregiver with a risk factor of alcohol abuse and 30 states report that 17.4 percent of child fatalities had a caregiver with a risk factor of drug abuse. For 27 states, 10.4 percent of child fatalities had a caregiver with a financial problem, and in 30 states, 10.4 percent of fatalities had a caregiver who was exposed to domestic violence. (See exhibit 4–F and related notes.)
Perpetrator RelationshipMost perpetrators are caregivers of their victims. Eighty percent (80.1%) of child fatalities involved parents acting alone, together, or with other individuals. Fewer (15.2%) fatalities did not have a parental relationship to their perpetrator. Child fatalities with unknown perpetra-tor relationship data accounted for 4.7 percent. (See table 4–4 and related notes.)
Exhibit 4–E Maltreatment Types of Child Fatalities, 2017
Maltreatment Type Child Fatalities Maltreatment TypesMaltreatment Types
Percent
Medical Neglect - 101 7.4Neglect - 1,032 75.4Other - 223 16.3Physical Abuse - 569 41.6Psychological Abuse - 30 2.2Sexual Abuse - 8 0.6Unknown - - -National 1,368 1,963 143.5
Based on data from 44 states. Data are from the Child File. A child may have suffered from more than one type of maltreatment and therefore, the total number of reported maltreatments exceeds the number of fatalities, and the total percentage of reported maltreatments exceeds 100.0 percent. The percentages are calculated against the number of child fatalities in the reporting states.
Exhibit 4–F Child Fatalities With Selected Caregiver Risk Factors, 2017
Caregiver Risk Factor Reporting StatesChild Fatalities from
Reporting StatesChild Fatalities With a Caregiver Risk Factor
Child Fatalities With a Caregiver Risk Factor
Percent
Alcohol Abuse 26 722 44 6.1Drug Abuse 30 909 158 17.4Financial Problem 27 1,021 106 10.4Domestic Violence 30 926 96 10.4
Data are from the Child File. For each caregiver risk factor, the analysis includes only those states that report at least 2.0 percent of child victims’ caregiver with the risk factor.
States are excluded from these analyses if they are not able to differentiate between alcohol abuse and drug abuse caregiver risk factors and report both risk factors for the same children in both caregiver risk factor categories. If a child is reported both with and without the caregiver risk factor, the child is counted once with the caregiver risk factor.
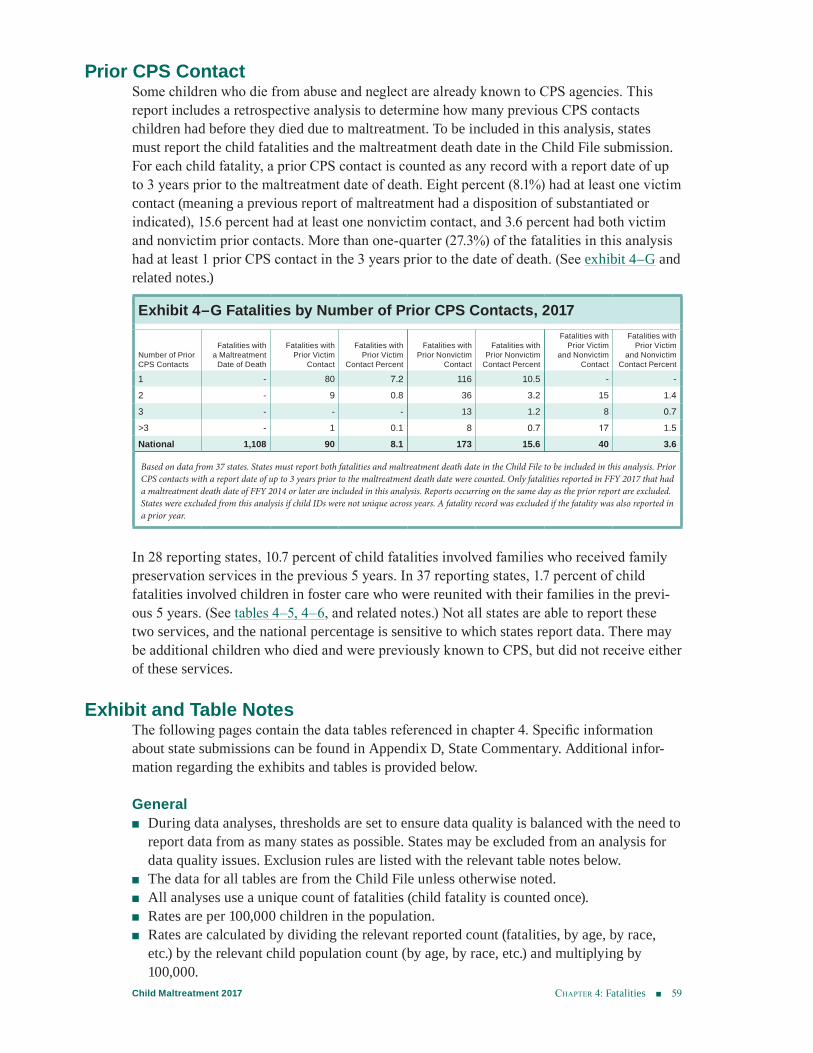
chApter 4: Fatalities 59Child Maltreatment 2017
Prior CPS Contact Some children who die from abuse and neglect are already known to CPS agencies. This report includes a retrospective analysis to determine how many previous CPS contacts children had before they died due to maltreatment. To be included in this analysis, states must report the child fatalities and the maltreatment death date in the Child File submission. For each child fatality, a prior CPS contact is counted as any record with a report date of up to 3 years prior to the maltreatment date of death. Eight percent (8.1%) had at least one victim contact (meaning a previous report of maltreatment had a disposition of substantiated or indicated), 15.6 percent had at least one nonvictim contact, and 3.6 percent had both victim and nonvictim prior contacts. More than one-quarter (27.3%) of the fatalities in this analysis had at least 1 prior CPS contact in the 3 years prior to the date of death. (See exhibit 4–G and related notes.)
In 28 reporting states, 10.7 percent of child fatalities involved families who received family preservation services in the previous 5 years. In 37 reporting states, 1.7 percent of child fatalities involved children in foster care who were reunited with their families in the previ-ous 5 years. (See tables 4–5, 4–6, and related notes.) Not all states are able to report these two services, and the national percentage is sensitive to which states report data. There may be additional children who died and were previously known to CPS, but did not receive either of these services.
Exhibit and Table NotesThe following pages contain the data tables referenced in chapter 4. Specific information about state submissions can be found in Appendix D, State Commentary. Additional infor-mation regarding the exhibits and tables is provided below.
General ■ During data analyses, thresholds are set to ensure data quality is balanced with the need to
report data from as many states as possible. States may be excluded from an analysis for data quality issues. Exclusion rules are listed with the relevant table notes below.
■ The data for all tables are from the Child File unless otherwise noted. ■ All analyses use a unique count of fatalities (child fatality is counted once). ■ Rates are per 100,000 children in the population. ■ Rates are calculated by dividing the relevant reported count (fatalities, by age, by race,
etc.) by the relevant child population count (by age, by race, etc.) and multiplying by 100,000.
Exhibit 4–G Fatalities by Number of Prior CPS Contacts, 2017
Number of Prior CPS Contacts
Fatalities with a Maltreatment
Date of Death
Fatalities with Prior Victim
Contact
Fatalities with Prior Victim
Contact Percent
Fatalities with Prior Nonvictim
Contact
Fatalities with Prior Nonvictim
Contact Percent
Fatalities with Prior Victim
and Nonvictim Contact
Fatalities with Prior Victim
and Nonvictim Contact Percent
1 - 80 7.2 116 10.5 - -2 - 9 0.8 36 3.2 15 1.43 - - - 13 1.2 8 0.7>3 - 1 0.1 8 0.7 17 1.5National 1,108 90 8.1 173 15.6 40 3.6
Based on data from 37 states. States must report both fatalities and maltreatment death date in the Child File to be included in this analysis. Prior CPS contacts with a report date of up to 3 years prior to the maltreatment death date were counted. Only fatalities reported in FFY 2017 that had a maltreatment death date of FFY 2014 or later are included in this analysis. Reports occurring on the same day as the prior report are excluded. States were excluded from this analysis if child IDs were not unique across years. A fatality record was excluded if the fatality was also reported in a prior year.
chApter 4: Fatalities 60Child Maltreatment 2017
■ NCANDS uses the child population estimates that are released annually by the U.S. Census Bureau. These estimates are in Appendix C, State Characteristics.
■ The row labeled Reporting States displays the count of states that provide data for that analysis. States that do not have a child maltreatment related death and report a zero are included in the count of reporting states.
■ Child fatalities are reported during the FFY in which the death was determined as due to maltreatment. This may not be the same year in which the child died.
■ National totals and calculations appear in a single row labeled National instead of separate rows labeled total, rate, or percent.
Table 4–1 Child Fatalities by Submission Type, 2017 ■ Data are from the Child File and Agency File.
Table 4–2 Child Fatalities, 2013–2017 ■ Data are from the Child File and Agency File.
Table 4–3 Child Fatalities by Age, 2017 ■ There are no population data for unknown age and therefore, no rates.
Table 4–4 Child Fatalities by Relationship to Their Perpetrators, 2017 ■ States are excluded from this analysis if they do not report fatalities, only report fatali-
ties in the Agency File, or if more than 50.0 percent of perpetrators are reported with an unknown relationship.
■ In NCANDS, a child fatality may have up to three perpetrators. A few states’ systems do not have the capability of collecting and reporting data for all three perpetrator fields.
■ Nonparent perpetrators counted in combination with parents (i.e., Mother and Nonparent(s); Father and Nonparent(s); or Mother, Father, and Nonparent) are not also counted in the individual relationship categories listed under Nonparent.
■ The relationship categories listed under Nonparent perpetrator include any perpetrator relationship that is not identified as an adoptive parent, biological parent, or stepparent.
■ The Unknown relationship category includes victims with an unknown perpetrator. ■ Some states are not able to collect and report on Group Home or Residential Facility Staff
perpetrators due to system limitations or jurisdictional issues.
Table 4–5 Child Fatalities Who Received Family Preservation Services Within the Previous 5 Years, 2017
■ Data are from the Child File and Agency File.
Table 4–6 Child Fatalities Who Were Reunited With Their Families Within the Previous 5 Years, 2017
■ Data are from the Child File and Agency File.
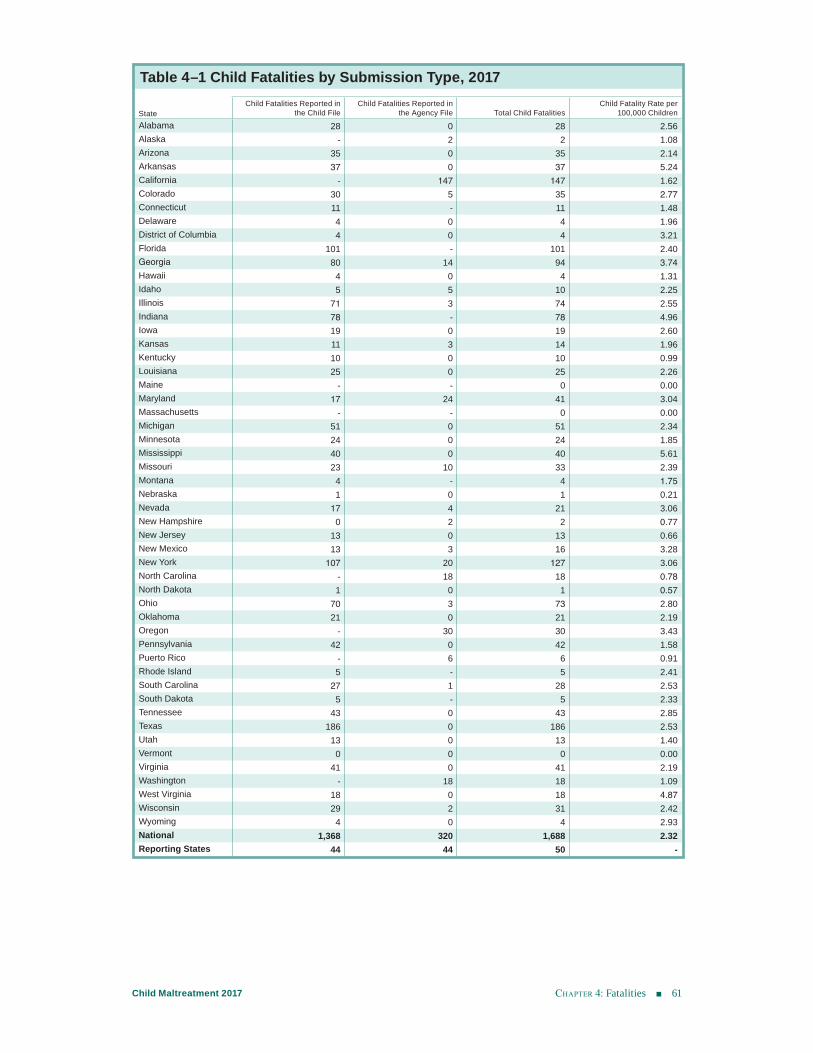
chApter 4: Fatalities 61Child Maltreatment 2017
Table 4–1 Child Fatalities by Submission Type, 2017
StateChild Fatalities Reported in
the Child FileChild Fatalities Reported in
the Agency File Total Child Fatalities Child Fatality Rate per
100,000 ChildrenAlabama 28 0 28 2.56Alaska - 2 2 1.08Arizona 35 0 35 2.14Arkansas 37 0 37 5.24California - 147 147 1.62Colorado 30 5 35 2.77Connecticut 11 - 11 1.48Delaware 4 0 4 1.96District of Columbia 4 0 4 3.21Florida 101 - 101 2.40Georgia 80 14 94 3.74Hawaii 4 0 4 1.31Idaho 5 5 10 2.25Illinois 71 3 74 2.55Indiana 78 - 78 4.96Iowa 19 0 19 2.60Kansas 11 3 14 1.96Kentucky 10 0 10 0.99Louisiana 25 0 25 2.26Maine - - 0 0.00Maryland 17 24 41 3.04Massachusetts - - 0 0.00Michigan 51 0 51 2.34Minnesota 24 0 24 1.85Mississippi 40 0 40 5.61Missouri 23 10 33 2.39Montana 4 - 4 1.75Nebraska 1 0 1 0.21Nevada 17 4 21 3.06New Hampshire 0 2 2 0.77New Jersey 13 0 13 0.66New Mexico 13 3 16 3.28New York 107 20 127 3.06North Carolina - 18 18 0.78North Dakota 1 0 1 0.57Ohio 70 3 73 2.80Oklahoma 21 0 21 2.19Oregon - 30 30 3.43Pennsylvania 42 0 42 1.58Puerto Rico - 6 6 0.91Rhode Island 5 - 5 2.41South Carolina 27 1 28 2.53South Dakota 5 - 5 2.33Tennessee 43 0 43 2.85Texas 186 0 186 2.53Utah 13 0 13 1.40Vermont 0 0 0 0.00Virginia 41 0 41 2.19Washington - 18 18 1.09West Virginia 18 0 18 4.87Wisconsin 29 2 31 2.42Wyoming 4 0 4 2.93National 1,368 320 1,688 2.32Reporting States 44 44 50 -
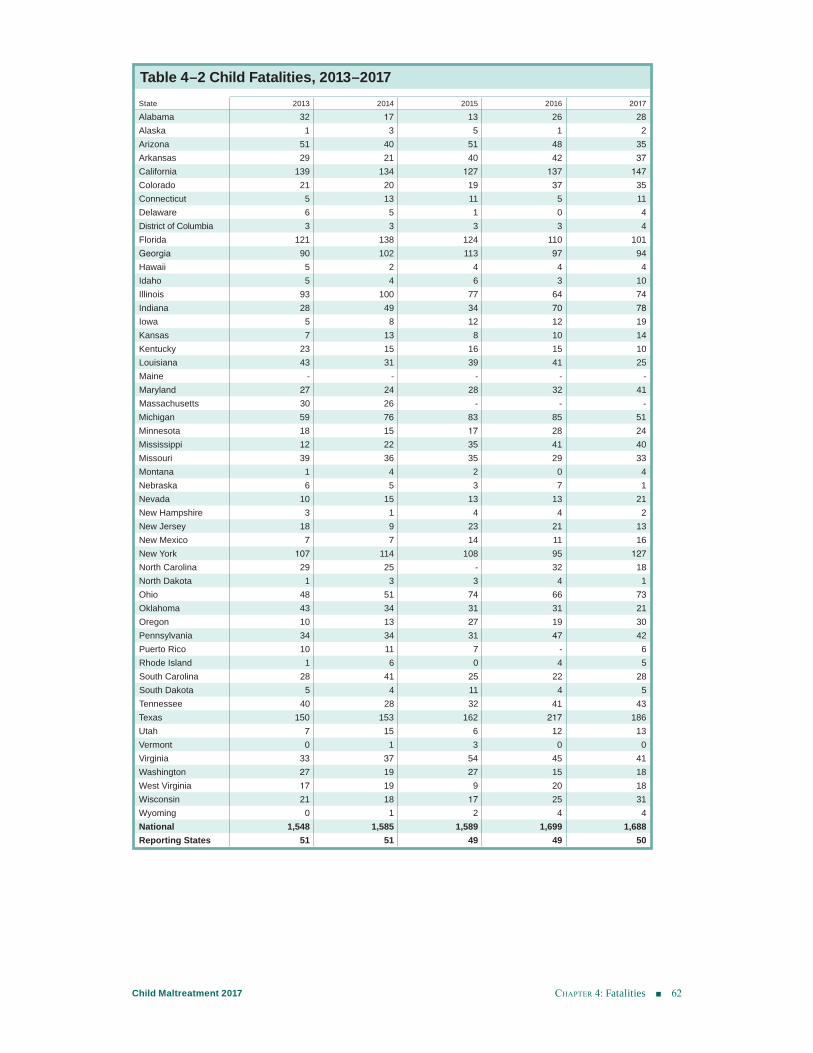
chApter 4: Fatalities 62Child Maltreatment 2017
Table 4–2 Child Fatalities, 2013–2017 State 2013 2014 2015 2016 2017
Alabama 32 17 13 26 28Alaska 1 3 5 1 2Arizona 51 40 51 48 35Arkansas 29 21 40 42 37California 139 134 127 137 147Colorado 21 20 19 37 35Connecticut 5 13 11 5 11Delaware 6 5 1 0 4District of Columbia 3 3 3 3 4Florida 121 138 124 110 101Georgia 90 102 113 97 94Hawaii 5 2 4 4 4Idaho 5 4 6 3 10Illinois 93 100 77 64 74Indiana 28 49 34 70 78Iowa 5 8 12 12 19Kansas 7 13 8 10 14Kentucky 23 15 16 15 10Louisiana 43 31 39 41 25Maine - - - - -Maryland 27 24 28 32 41Massachusetts 30 26 - - -Michigan 59 76 83 85 51Minnesota 18 15 17 28 24Mississippi 12 22 35 41 40Missouri 39 36 35 29 33Montana 1 4 2 0 4Nebraska 6 5 3 7 1Nevada 10 15 13 13 21New Hampshire 3 1 4 4 2New Jersey 18 9 23 21 13New Mexico 7 7 14 11 16New York 107 114 108 95 127North Carolina 29 25 - 32 18North Dakota 1 3 3 4 1Ohio 48 51 74 66 73Oklahoma 43 34 31 31 21Oregon 10 13 27 19 30Pennsylvania 34 34 31 47 42Puerto Rico 10 11 7 - 6Rhode Island 1 6 0 4 5South Carolina 28 41 25 22 28South Dakota 5 4 11 4 5Tennessee 40 28 32 41 43Texas 150 153 162 217 186Utah 7 15 6 12 13Vermont 0 1 3 0 0Virginia 33 37 54 45 41Washington 27 19 27 15 18West Virginia 17 19 9 20 18Wisconsin 21 18 17 25 31Wyoming 0 1 2 4 4National 1,548 1,585 1,589 1,699 1,688Reporting States 51 51 49 49 50
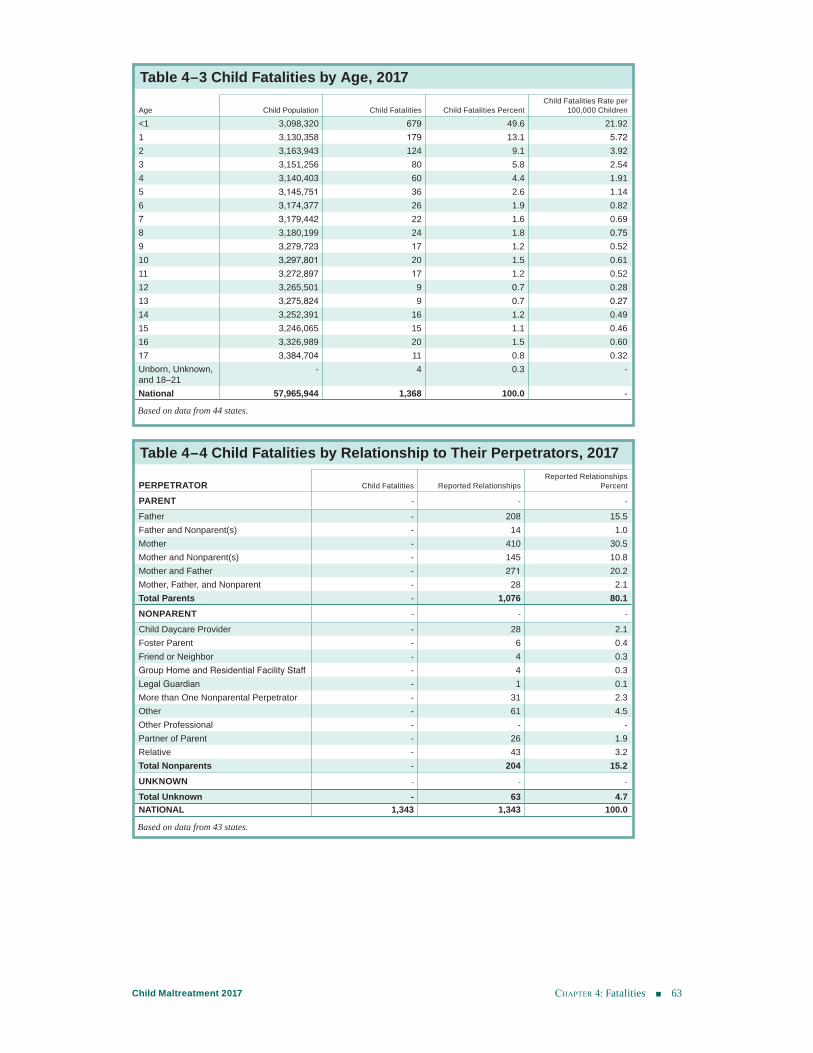
chApter 4: Fatalities 63Child Maltreatment 2017
Table 4–4 Child Fatalities by Relationship to Their Perpetrators, 2017
Table 4–3 Child Fatalities by Age, 2017
Age Child Population Child Fatalities Child Fatalities PercentChild Fatalities Rate per
100,000 Children
<1 3,098,320 679 49.6 21.921 3,130,358 179 13.1 5.722 3,163,943 124 9.1 3.923 3,151,256 80 5.8 2.544 3,140,403 60 4.4 1.915 3,145,751 36 2.6 1.146 3,174,377 26 1.9 0.827 3,179,442 22 1.6 0.698 3,180,199 24 1.8 0.759 3,279,723 17 1.2 0.5210 3,297,801 20 1.5 0.6111 3,272,897 17 1.2 0.5212 3,265,501 9 0.7 0.2813 3,275,824 9 0.7 0.2714 3,252,391 16 1.2 0.4915 3,246,065 15 1.1 0.4616 3,326,989 20 1.5 0.6017 3,384,704 11 0.8 0.32Unborn, Unknown, and 18–21
- 4 0.3 -
National 57,965,944 1,368 100.0 -
Based on data from 44 states.
PERPETRATOR Child Fatalities Reported Relationships Reported Relationships
Percent
PARENT - - -
Father - 208 15.5Father and Nonparent(s) - 14 1.0Mother - 410 30.5Mother and Nonparent(s) - 145 10.8Mother and Father - 271 20.2Mother, Father, and Nonparent - 28 2.1Total Parents - 1,076 80.1NONPARENT - - -
Child Daycare Provider - 28 2.1Foster Parent - 6 0.4Friend or Neighbor - 4 0.3Group Home and Residential Facility Staff - 4 0.3Legal Guardian - 1 0.1More than One Nonparental Perpetrator - 31 2.3Other - 61 4.5Other Professional - - -Partner of Parent - 26 1.9Relative - 43 3.2Total Nonparents - 204 15.2UNKNOWN - - -
Total Unknown - 63 4.7NATIONAL 1,343 1,343 100.0
Based on data from 43 states.
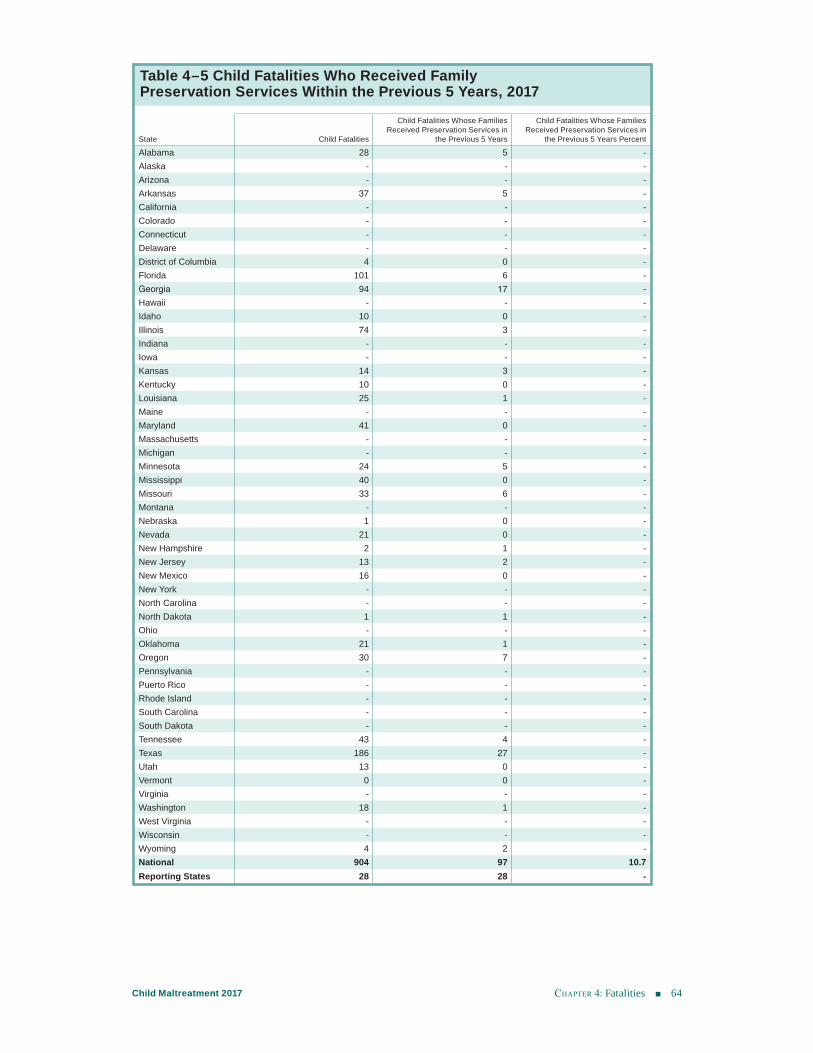
chApter 4: Fatalities 64Child Maltreatment 2017
Table 4–5 Child Fatalities Who Received Family Preservation Services Within the Previous 5 Years, 2017
State Child Fatalities
Child Fatalities Whose Families Received Preservation Services in
the Previous 5 Years
Child Fatalities Whose Families Received Preservation Services in
the Previous 5 Years Percent
Alabama 28 5 -Alaska - - -Arizona - - -Arkansas 37 5 -California - - -Colorado - - -Connecticut - - -Delaware - - -District of Columbia 4 0 -Florida 101 6 -Georgia 94 17 -Hawaii - - -Idaho 10 0 -Illinois 74 3 -Indiana - - -Iowa - - -Kansas 14 3 -Kentucky 10 0 -Louisiana 25 1 -Maine - - -Maryland 41 0 -Massachusetts - - -Michigan - - -Minnesota 24 5 -Mississippi 40 0 -Missouri 33 6 -Montana - - -Nebraska 1 0 -Nevada 21 0 -New Hampshire 2 1 -New Jersey 13 2 -New Mexico 16 0 -New York - - -North Carolina - - -North Dakota 1 1 -Ohio - - -Oklahoma 21 1 -Oregon 30 7 -Pennsylvania - - -Puerto Rico - - -Rhode Island - - -South Carolina - - -South Dakota - - -Tennessee 43 4 -Texas 186 27 -Utah 13 0 -Vermont 0 0 -Virginia - - -Washington 18 1 -West Virginia - - -Wisconsin - - -Wyoming 4 2 -National 904 97 10.7Reporting States 28 28 -
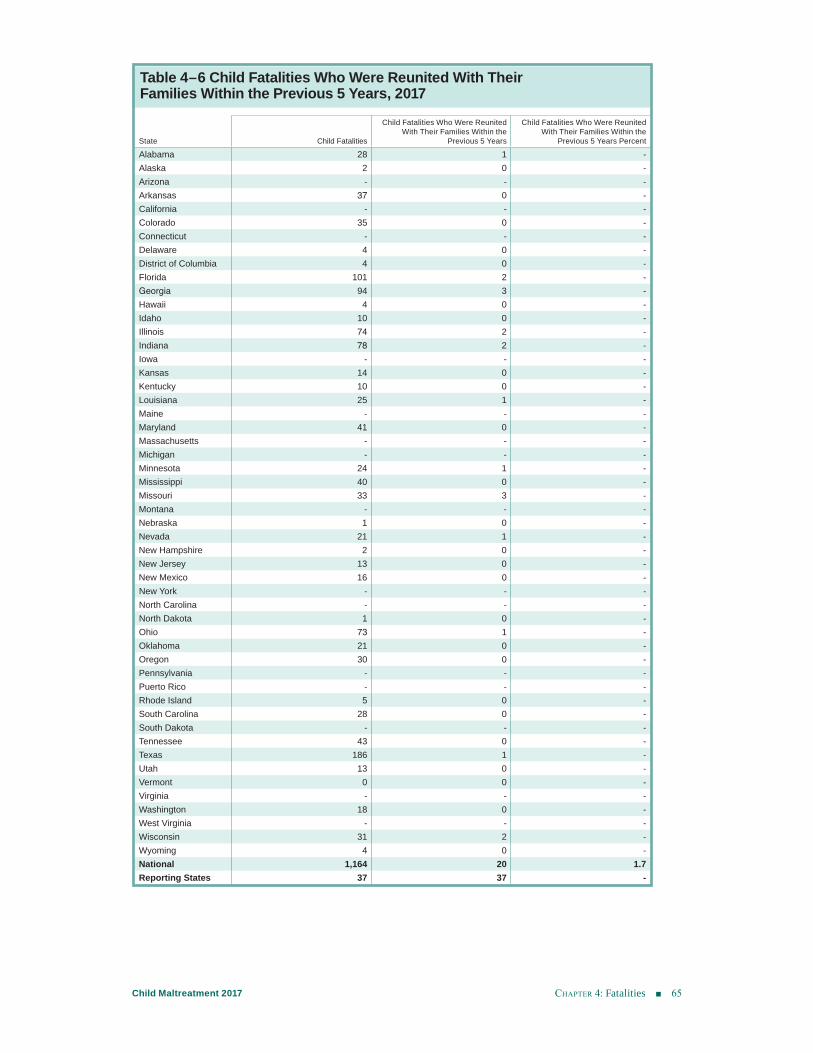
chApter 4: Fatalities 65Child Maltreatment 2017
Table 4–6 Child Fatalities Who Were Reunited With Their Families Within the Previous 5 Years, 2017
State Child Fatalities
Child Fatalities Who Were Reunited With Their Families Within the
Previous 5 Years
Child Fatalities Who Were Reunited With Their Families Within the
Previous 5 Years Percent
Alabama 28 1 -Alaska 2 0 -Arizona - - -Arkansas 37 0 -California - - -Colorado 35 0 -Connecticut - - -Delaware 4 0 -District of Columbia 4 0 -Florida 101 2 -Georgia 94 3 -Hawaii 4 0 -Idaho 10 0 -Illinois 74 2 -Indiana 78 2 -Iowa - - -Kansas 14 0 -Kentucky 10 0 -Louisiana 25 1 -Maine - - -Maryland 41 0 -Massachusetts - - -Michigan - - -Minnesota 24 1 -Mississippi 40 0 -Missouri 33 3 -Montana - - -Nebraska 1 0 -Nevada 21 1 -New Hampshire 2 0 -New Jersey 13 0 -New Mexico 16 0 -New York - - -North Carolina - - -North Dakota 1 0 -Ohio 73 1 -Oklahoma 21 0 -Oregon 30 0 -Pennsylvania - - -Puerto Rico - - -Rhode Island 5 0 -South Carolina 28 0 -South Dakota - - -Tennessee 43 0 -Texas 186 1 -Utah 13 0 -Vermont 0 0 -Virginia - - -Washington 18 0 -West Virginia - - -Wisconsin 31 2 -Wyoming 4 0 -National 1,164 20 1.7Reporting States 37 37 -
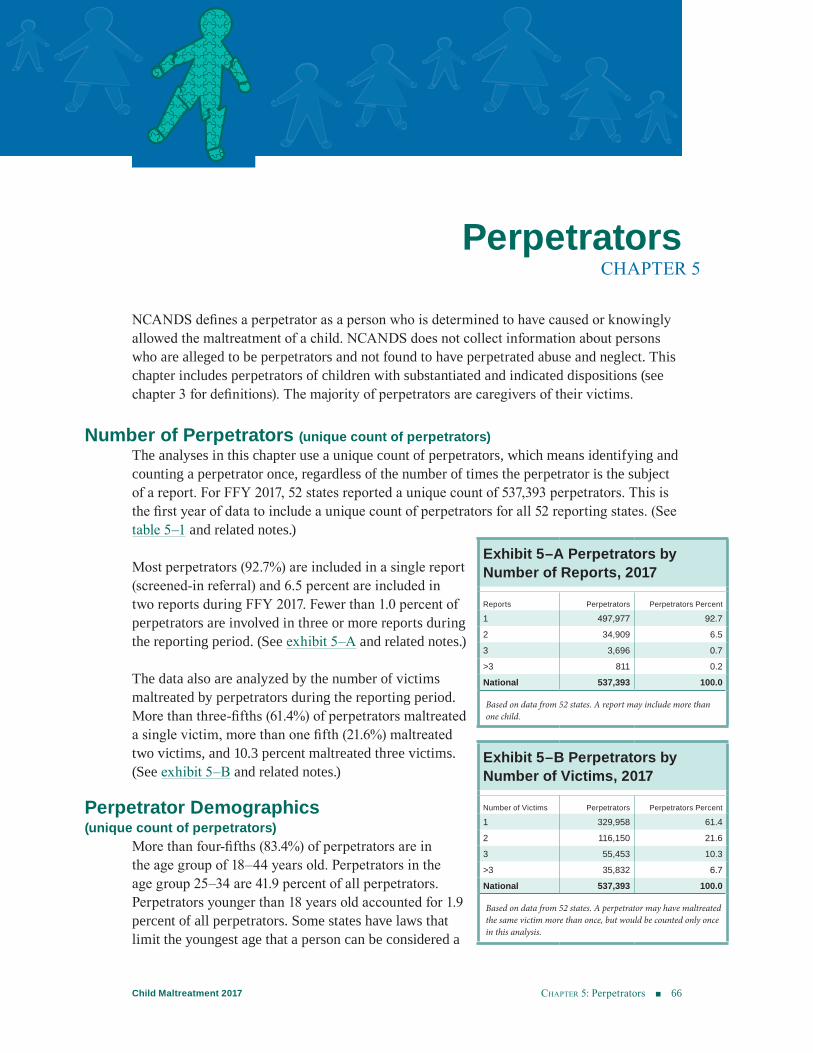
chApter 5: Perpetrators 66Child Maltreatment 2017
Perpetrators
NCANDS defines a perpetrator as a person who is determined to have caused or knowingly allowed the maltreatment of a child. NCANDS does not collect information about persons who are alleged to be perpetrators and not found to have perpetrated abuse and neglect. This chapter includes perpetrators of children with substantiated and indicated dispositions (see chapter 3 for definitions). The majority of perpetrators are caregivers of their victims.
Number of Perpetrators (unique count of perpetrators)The analyses in this chapter use a unique count of perpetrators, which means identifying and counting a perpetrator once, regardless of the number of times the perpetrator is the subject of a report. For FFY 2017, 52 states reported a unique count of 537,393 perpetrators. This is the first year of data to include a unique count of perpetrators for all 52 reporting states. (See table 5–1 and related notes.)
Most perpetrators (92.7%) are included in a single report (screened-in referral) and 6.5 percent are included in two reports during FFY 2017. Fewer than 1.0 percent of perpetrators are involved in three or more reports during the reporting period. (See exhibit 5–A and related notes.)
The data also are analyzed by the number of victims maltreated by perpetrators during the reporting period. More than three-fifths (61.4%) of perpetrators maltreated a single victim, more than one fifth (21.6%) maltreated two victims, and 10.3 percent maltreated three victims. (See exhibit 5–B and related notes.)
Perpetrator Demographics (unique count of perpetrators)
More than four-fifths (83.4%) of perpetrators are in the age group of 18–44 years old. Perpetrators in the age group 25–34 are 41.9 percent of all perpetrators. Perpetrators younger than 18 years old accounted for 1.9 percent of all perpetrators. Some states have laws that limit the youngest age that a person can be considered a
CHAPTER 5
Exhibit 5–A Perpetrators by Number of Reports, 2017
Reports Perpetrators Perpetrators Percent
1 497,977 92.72 34,909 6.53 3,696 0.7>3 811 0.2National 537,393 100.0
Based on data from 52 states. A report may include more than one child.
Exhibit 5–B Perpetrators by Number of Victims, 2017
Number of Victims Perpetrators Perpetrators Percent
1 329,958 61.42 116,150 21.63 55,453 10.3>3 35,832 6.7National 537,393 100.0
Based on data from 52 states. A perpetrator may have maltreated the same victim more than once, but would be counted only once in this analysis.
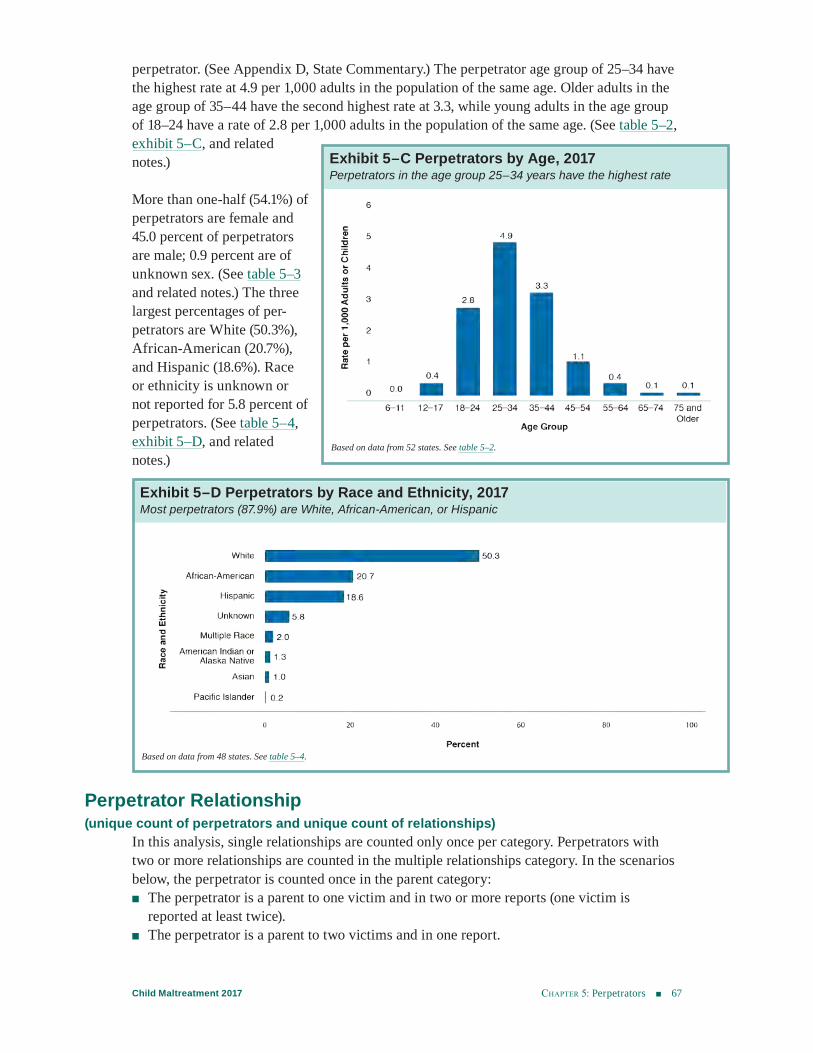
Chapter 5: Perpetrators 67Child Maltreatment 2017
perpetrator. (See Appendix D, State Commentary.) The perpetrator age group of 25–34 have the highest rate at 4.9 per 1,000 adults in the population of the same age. Older adults in the age group of 35–44 have the second highest rate at 3.3, while young adults in the age group of 18–24 have a rate of 2.8 per 1,000 adults in the population of the same age. (See table 5–2, exhibit 5–C, and related notes.)
More than one-half (54.1%) of perpetrators are female and 45.0 percent of perpetrators are male; 0.9 percent are of unknown sex. (See table 5–3 and related notes.) The three largest percentages of per-petrators are White (50.3%), African-American (20.7%), and Hispanic (18.6%). Race or ethnicity is unknown or not reported for 5.8 percent of perpetrators. (See table 5–4, exhibit 5–D, and related notes.)
Perpetrator Relationship (unique count of perpetrators and unique count of relationships)
In this analysis, single relationships are counted only once per category. Perpetrators with two or more relationships are counted in the multiple relationships category. In the scenarios below, the perpetrator is counted once in the parent category:
■ The perpetrator is a parent to one victim and in two or more reports (one victim is reported at least twice).
■ The perpetrator is a parent to two victims and in one report.
Exhibit 5–D Perpetrators by Race and Ethnicity, 2017 Most perpetrators (87.9%) are White, African-American, or Hispanic
Based on data from 48 states. See table 5–4.
Exhibit 5–C Perpetrators by Age, 2017Perpetrators in the age group 25–34 years have the highest rate
Based on data from 52 states. See table 5–2.
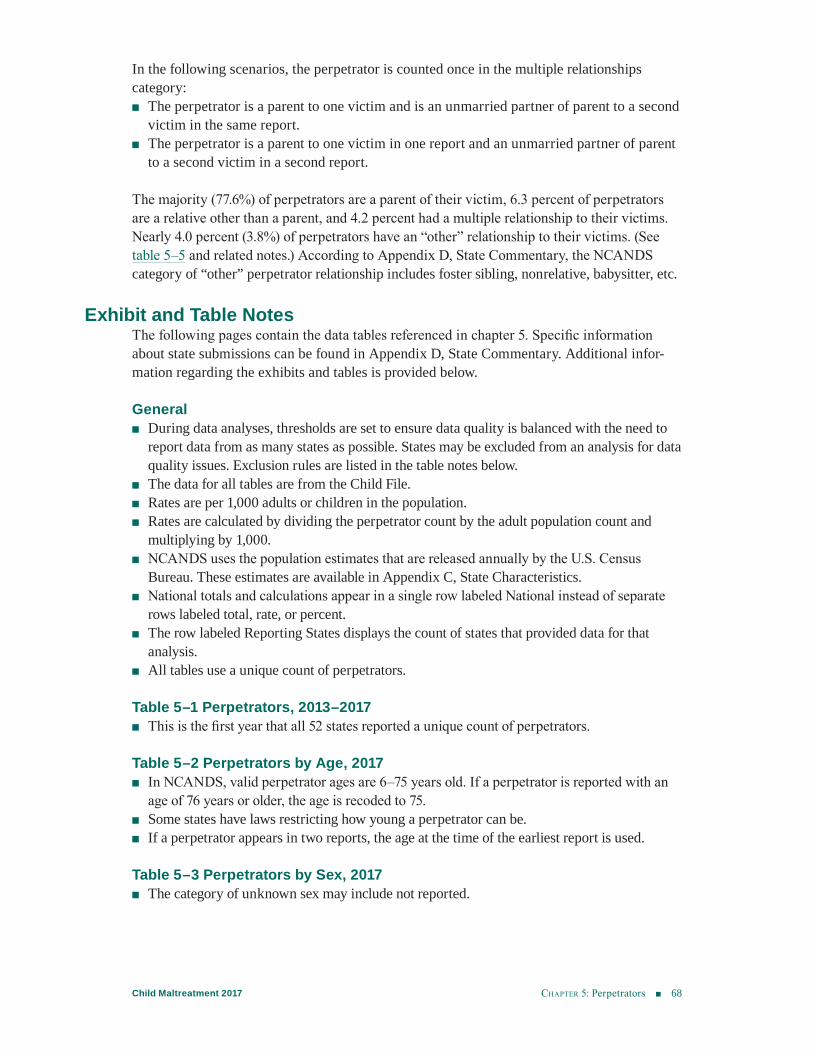
chApter 5: Perpetrators 68Child Maltreatment 2017
In the following scenarios, the perpetrator is counted once in the multiple relationships category:
■ The perpetrator is a parent to one victim and is an unmarried partner of parent to a second victim in the same report.
■ The perpetrator is a parent to one victim in one report and an unmarried partner of parent to a second victim in a second report.
The majority (77.6%) of perpetrators are a parent of their victim, 6.3 percent of perpetrators are a relative other than a parent, and 4.2 percent had a multiple relationship to their victims. Nearly 4.0 percent (3.8%) of perpetrators have an “other” relationship to their victims. (See table 5–5 and related notes.) According to Appendix D, State Commentary, the NCANDS category of “other” perpetrator relationship includes foster sibling, nonrelative, babysitter, etc.
Exhibit and Table NotesThe following pages contain the data tables referenced in chapter 5. Specific information about state submissions can be found in Appendix D, State Commentary. Additional infor-mation regarding the exhibits and tables is provided below.
General ■ During data analyses, thresholds are set to ensure data quality is balanced with the need to
report data from as many states as possible. States may be excluded from an analysis for data quality issues. Exclusion rules are listed in the table notes below.
■ The data for all tables are from the Child File. ■ Rates are per 1,000 adults or children in the population. ■ Rates are calculated by dividing the perpetrator count by the adult population count and
multiplying by 1,000. ■ NCANDS uses the population estimates that are released annually by the U.S. Census
Bureau. These estimates are available in Appendix C, State Characteristics. ■ National totals and calculations appear in a single row labeled National instead of separate
rows labeled total, rate, or percent. ■ The row labeled Reporting States displays the count of states that provided data for that
analysis. ■ All tables use a unique count of perpetrators.
Table 5–1 Perpetrators, 2013–2017 ■ This is the first year that all 52 states reported a unique count of perpetrators.
Table 5–2 Perpetrators by Age, 2017 ■ In NCANDS, valid perpetrator ages are 6–75 years old. If a perpetrator is reported with an
age of 76 years or older, the age is recoded to 75. ■ Some states have laws restricting how young a perpetrator can be. ■ If a perpetrator appears in two reports, the age at the time of the earliest report is used.
Table 5–3 Perpetrators by Sex, 2017 ■ The category of unknown sex may include not reported.
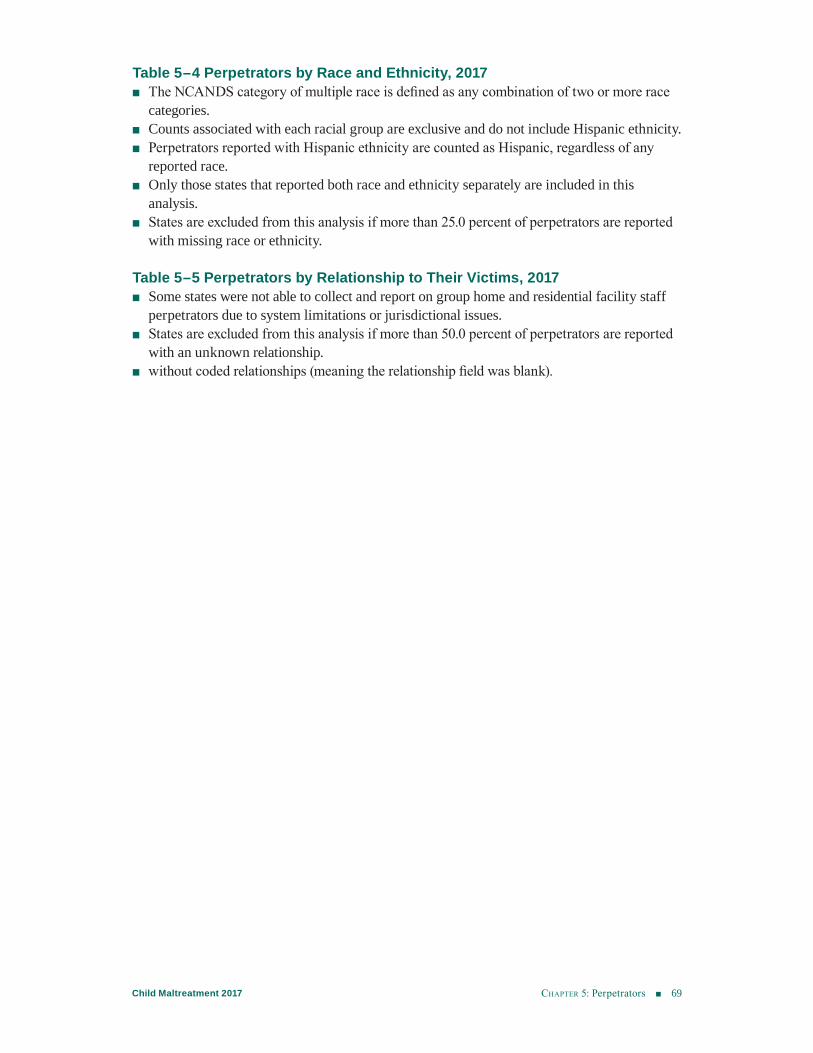
chApter 5: Perpetrators 69Child Maltreatment 2017
Table 5–4 Perpetrators by Race and Ethnicity, 2017 ■ The NCANDS category of multiple race is defined as any combination of two or more race
categories. ■ Counts associated with each racial group are exclusive and do not include Hispanic ethnicity. ■ Perpetrators reported with Hispanic ethnicity are counted as Hispanic, regardless of any
reported race. ■ Only those states that reported both race and ethnicity separately are included in this
analysis. ■ States are excluded from this analysis if more than 25.0 percent of perpetrators are reported
with missing race or ethnicity.
Table 5–5 Perpetrators by Relationship to Their Victims, 2017 ■ Some states were not able to collect and report on group home and residential facility staff
perpetrators due to system limitations or jurisdictional issues. ■ States are excluded from this analysis if more than 50.0 percent of perpetrators are reported
with an unknown relationship. ■ without coded relationships (meaning the relationship field was blank).
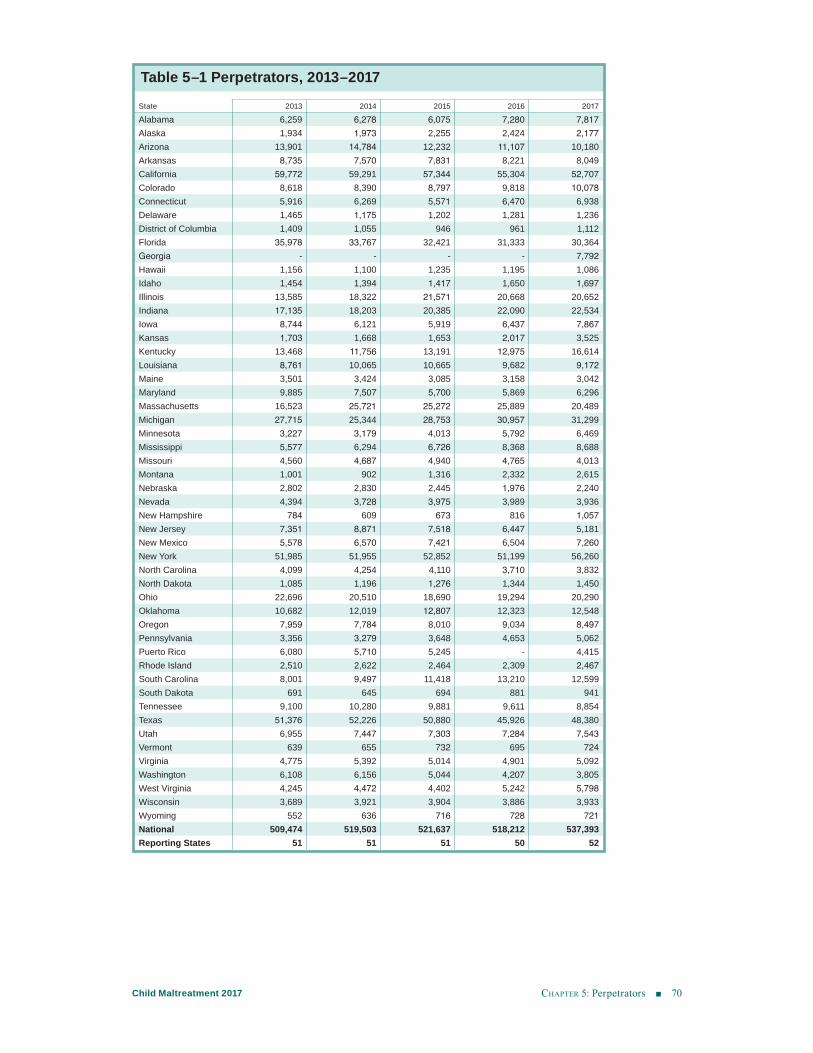
chApter 5: Perpetrators 70Child Maltreatment 2017
Table 5–1 Perpetrators, 2013–2017
State 2013 2014 2015 2016 2017
Alabama 6,259 6,278 6,075 7,280 7,817 Alaska 1,934 1,973 2,255 2,424 2,177 Arizona 13,901 14,784 12,232 11,107 10,180 Arkansas 8,735 7,570 7,831 8,221 8,049 California 59,772 59,291 57,344 55,304 52,707 Colorado 8,618 8,390 8,797 9,818 10,078 Connecticut 5,916 6,269 5,571 6,470 6,938 Delaware 1,465 1,175 1,202 1,281 1,236 District of Columbia 1,409 1,055 946 961 1,112 Florida 35,978 33,767 32,421 31,333 30,364 Georgia - - - - 7,792 Hawaii 1,156 1,100 1,235 1,195 1,086 Idaho 1,454 1,394 1,417 1,650 1,697 Illinois 13,585 18,322 21,571 20,668 20,652 Indiana 17,135 18,203 20,385 22,090 22,534 Iowa 8,744 6,121 5,919 6,437 7,867 Kansas 1,703 1,668 1,653 2,017 3,525 Kentucky 13,468 11,756 13,191 12,975 16,614 Louisiana 8,761 10,065 10,665 9,682 9,172 Maine 3,501 3,424 3,085 3,158 3,042 Maryland 9,885 7,507 5,700 5,869 6,296 Massachusetts 16,523 25,721 25,272 25,889 20,489 Michigan 27,715 25,344 28,753 30,957 31,299 Minnesota 3,227 3,179 4,013 5,792 6,469 Mississippi 5,577 6,294 6,726 8,368 8,688 Missouri 4,560 4,687 4,940 4,765 4,013 Montana 1,001 902 1,316 2,332 2,615 Nebraska 2,802 2,830 2,445 1,976 2,240 Nevada 4,394 3,728 3,975 3,989 3,936 New Hampshire 784 609 673 816 1,057 New Jersey 7,351 8,871 7,518 6,447 5,181 New Mexico 5,578 6,570 7,421 6,504 7,260 New York 51,985 51,955 52,852 51,199 56,260 North Carolina 4,099 4,254 4,110 3,710 3,832 North Dakota 1,085 1,196 1,276 1,344 1,450 Ohio 22,696 20,510 18,690 19,294 20,290 Oklahoma 10,682 12,019 12,807 12,323 12,548 Oregon 7,959 7,784 8,010 9,034 8,497 Pennsylvania 3,356 3,279 3,648 4,653 5,062 Puerto Rico 6,080 5,710 5,245 - 4,415 Rhode Island 2,510 2,622 2,464 2,309 2,467 South Carolina 8,001 9,497 11,418 13,210 12,599 South Dakota 691 645 694 881 941 Tennessee 9,100 10,280 9,881 9,611 8,854 Texas 51,376 52,226 50,880 45,926 48,380 Utah 6,955 7,447 7,303 7,284 7,543 Vermont 639 655 732 695 724 Virginia 4,775 5,392 5,014 4,901 5,092 Washington 6,108 6,156 5,044 4,207 3,805 West Virginia 4,245 4,472 4,402 5,242 5,798 Wisconsin 3,689 3,921 3,904 3,886 3,933 Wyoming 552 636 716 728 721 National 509,474 519,503 521,637 518,212 537,393 Reporting States 51 51 51 50 52
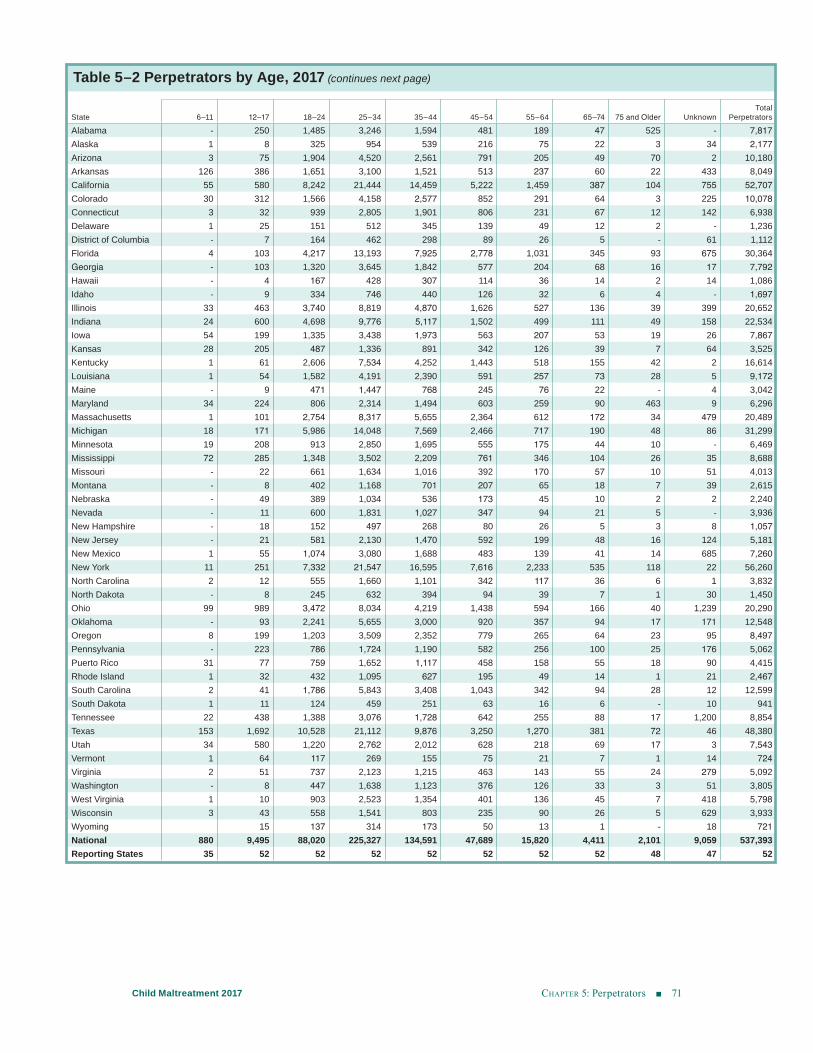
chApter 5: Perpetrators 71Child Maltreatment 2017
Table 5–2 Perpetrators by Age, 2017 (continues next page)
State 6–11 12–17 18–24 25–34 35–44 45–54 55–64 65–74 75 and Older UnknownTotal
Perpetrators
Alabama - 250 1,485 3,246 1,594 481 189 47 525 - 7,817Alaska 1 8 325 954 539 216 75 22 3 34 2,177Arizona 3 75 1,904 4,520 2,561 791 205 49 70 2 10,180Arkansas 126 386 1,651 3,100 1,521 513 237 60 22 433 8,049California 55 580 8,242 21,444 14,459 5,222 1,459 387 104 755 52,707Colorado 30 312 1,566 4,158 2,577 852 291 64 3 225 10,078Connecticut 3 32 939 2,805 1,901 806 231 67 12 142 6,938Delaware 1 25 151 512 345 139 49 12 2 - 1,236District of Columbia - 7 164 462 298 89 26 5 - 61 1,112Florida 4 103 4,217 13,193 7,925 2,778 1,031 345 93 675 30,364Georgia - 103 1,320 3,645 1,842 577 204 68 16 17 7,792Hawaii - 4 167 428 307 114 36 14 2 14 1,086Idaho - 9 334 746 440 126 32 6 4 - 1,697Illinois 33 463 3,740 8,819 4,870 1,626 527 136 39 399 20,652Indiana 24 600 4,698 9,776 5,117 1,502 499 111 49 158 22,534Iowa 54 199 1,335 3,438 1,973 563 207 53 19 26 7,867Kansas 28 205 487 1,336 891 342 126 39 7 64 3,525Kentucky 1 61 2,606 7,534 4,252 1,443 518 155 42 2 16,614Louisiana 1 54 1,582 4,191 2,390 591 257 73 28 5 9,172Maine - 9 471 1,447 768 245 76 22 - 4 3,042Maryland 34 224 806 2,314 1,494 603 259 90 463 9 6,296Massachusetts 1 101 2,754 8,317 5,655 2,364 612 172 34 479 20,489Michigan 18 171 5,986 14,048 7,569 2,466 717 190 48 86 31,299Minnesota 19 208 913 2,850 1,695 555 175 44 10 - 6,469Mississippi 72 285 1,348 3,502 2,209 761 346 104 26 35 8,688Missouri - 22 661 1,634 1,016 392 170 57 10 51 4,013Montana - 8 402 1,168 701 207 65 18 7 39 2,615Nebraska - 49 389 1,034 536 173 45 10 2 2 2,240Nevada - 11 600 1,831 1,027 347 94 21 5 - 3,936New Hampshire - 18 152 497 268 80 26 5 3 8 1,057New Jersey - 21 581 2,130 1,470 592 199 48 16 124 5,181New Mexico 1 55 1,074 3,080 1,688 483 139 41 14 685 7,260New York 11 251 7,332 21,547 16,595 7,616 2,233 535 118 22 56,260North Carolina 2 12 555 1,660 1,101 342 117 36 6 1 3,832North Dakota - 8 245 632 394 94 39 7 1 30 1,450Ohio 99 989 3,472 8,034 4,219 1,438 594 166 40 1,239 20,290Oklahoma - 93 2,241 5,655 3,000 920 357 94 17 171 12,548Oregon 8 199 1,203 3,509 2,352 779 265 64 23 95 8,497Pennsylvania - 223 786 1,724 1,190 582 256 100 25 176 5,062Puerto Rico 31 77 759 1,652 1,117 458 158 55 18 90 4,415Rhode Island 1 32 432 1,095 627 195 49 14 1 21 2,467South Carolina 2 41 1,786 5,843 3,408 1,043 342 94 28 12 12,599South Dakota 1 11 124 459 251 63 16 6 - 10 941Tennessee 22 438 1,388 3,076 1,728 642 255 88 17 1,200 8,854Texas 153 1,692 10,528 21,112 9,876 3,250 1,270 381 72 46 48,380Utah 34 580 1,220 2,762 2,012 628 218 69 17 3 7,543Vermont 1 64 117 269 155 75 21 7 1 14 724Virginia 2 51 737 2,123 1,215 463 143 55 24 279 5,092Washington - 8 447 1,638 1,123 376 126 33 3 51 3,805West Virginia 1 10 903 2,523 1,354 401 136 45 7 418 5,798Wisconsin 3 43 558 1,541 803 235 90 26 5 629 3,933Wyoming 15 137 314 173 50 13 1 - 18 721National 880 9,495 88,020 225,327 134,591 47,689 15,820 4,411 2,101 9,059 537,393Reporting States 35 52 52 52 52 52 52 52 48 47 52
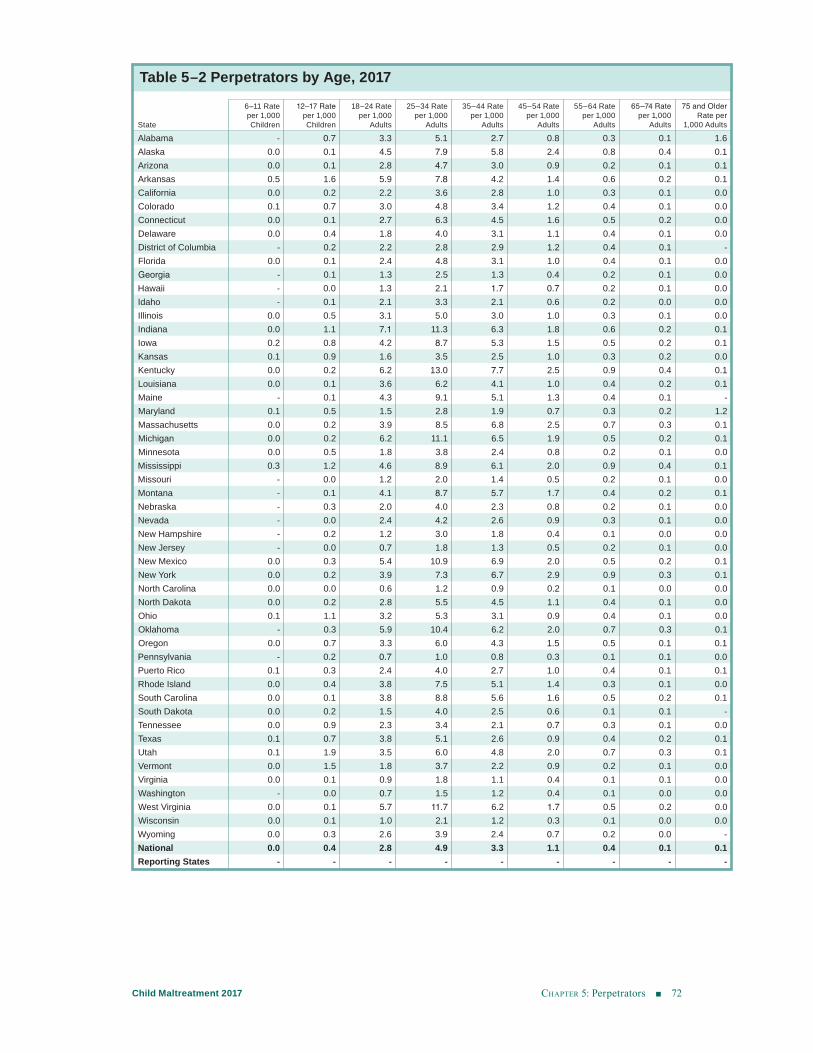
chApter 5: Perpetrators 72Child Maltreatment 2017
Table 5–2 Perpetrators by Age, 2017
State
6–11 Rate per 1,000 Children
12–17 Rate per 1,000 Children
18–24 Rate per 1,000
Adults
25–34 Rate per 1,000
Adults
35–44 Rate per 1,000
Adults
45–54 Rate per 1,000
Adults
55–64 Rate per 1,000
Adults
65–74 Rate per 1,000
Adults
75 and Older Rate per
1,000 Adults
Alabama - 0.7 3.3 5.1 2.7 0.8 0.3 0.1 1.6Alaska 0.0 0.1 4.5 7.9 5.8 2.4 0.8 0.4 0.1Arizona 0.0 0.1 2.8 4.7 3.0 0.9 0.2 0.1 0.1Arkansas 0.5 1.6 5.9 7.8 4.2 1.4 0.6 0.2 0.1California 0.0 0.2 2.2 3.6 2.8 1.0 0.3 0.1 0.0Colorado 0.1 0.7 3.0 4.8 3.4 1.2 0.4 0.1 0.0Connecticut 0.0 0.1 2.7 6.3 4.5 1.6 0.5 0.2 0.0Delaware 0.0 0.4 1.8 4.0 3.1 1.1 0.4 0.1 0.0District of Columbia - 0.2 2.2 2.8 2.9 1.2 0.4 0.1 -Florida 0.0 0.1 2.4 4.8 3.1 1.0 0.4 0.1 0.0Georgia - 0.1 1.3 2.5 1.3 0.4 0.2 0.1 0.0Hawaii - 0.0 1.3 2.1 1.7 0.7 0.2 0.1 0.0Idaho - 0.1 2.1 3.3 2.1 0.6 0.2 0.0 0.0Illinois 0.0 0.5 3.1 5.0 3.0 1.0 0.3 0.1 0.0Indiana 0.0 1.1 7.1 11.3 6.3 1.8 0.6 0.2 0.1Iowa 0.2 0.8 4.2 8.7 5.3 1.5 0.5 0.2 0.1Kansas 0.1 0.9 1.6 3.5 2.5 1.0 0.3 0.2 0.0Kentucky 0.0 0.2 6.2 13.0 7.7 2.5 0.9 0.4 0.1Louisiana 0.0 0.1 3.6 6.2 4.1 1.0 0.4 0.2 0.1Maine - 0.1 4.3 9.1 5.1 1.3 0.4 0.1 -Maryland 0.1 0.5 1.5 2.8 1.9 0.7 0.3 0.2 1.2Massachusetts 0.0 0.2 3.9 8.5 6.8 2.5 0.7 0.3 0.1Michigan 0.0 0.2 6.2 11.1 6.5 1.9 0.5 0.2 0.1Minnesota 0.0 0.5 1.8 3.8 2.4 0.8 0.2 0.1 0.0Mississippi 0.3 1.2 4.6 8.9 6.1 2.0 0.9 0.4 0.1Missouri - 0.0 1.2 2.0 1.4 0.5 0.2 0.1 0.0Montana - 0.1 4.1 8.7 5.7 1.7 0.4 0.2 0.1Nebraska - 0.3 2.0 4.0 2.3 0.8 0.2 0.1 0.0Nevada - 0.0 2.4 4.2 2.6 0.9 0.3 0.1 0.0New Hampshire - 0.2 1.2 3.0 1.8 0.4 0.1 0.0 0.0New Jersey - 0.0 0.7 1.8 1.3 0.5 0.2 0.1 0.0New Mexico 0.0 0.3 5.4 10.9 6.9 2.0 0.5 0.2 0.1New York 0.0 0.2 3.9 7.3 6.7 2.9 0.9 0.3 0.1North Carolina 0.0 0.0 0.6 1.2 0.9 0.2 0.1 0.0 0.0North Dakota 0.0 0.2 2.8 5.5 4.5 1.1 0.4 0.1 0.0Ohio 0.1 1.1 3.2 5.3 3.1 0.9 0.4 0.1 0.0Oklahoma - 0.3 5.9 10.4 6.2 2.0 0.7 0.3 0.1Oregon 0.0 0.7 3.3 6.0 4.3 1.5 0.5 0.1 0.1Pennsylvania - 0.2 0.7 1.0 0.8 0.3 0.1 0.1 0.0Puerto Rico 0.1 0.3 2.4 4.0 2.7 1.0 0.4 0.1 0.1Rhode Island 0.0 0.4 3.8 7.5 5.1 1.4 0.3 0.1 0.0South Carolina 0.0 0.1 3.8 8.8 5.6 1.6 0.5 0.2 0.1South Dakota 0.0 0.2 1.5 4.0 2.5 0.6 0.1 0.1 -Tennessee 0.0 0.9 2.3 3.4 2.1 0.7 0.3 0.1 0.0Texas 0.1 0.7 3.8 5.1 2.6 0.9 0.4 0.2 0.1Utah 0.1 1.9 3.5 6.0 4.8 2.0 0.7 0.3 0.1Vermont 0.0 1.5 1.8 3.7 2.2 0.9 0.2 0.1 0.0Virginia 0.0 0.1 0.9 1.8 1.1 0.4 0.1 0.1 0.0Washington - 0.0 0.7 1.5 1.2 0.4 0.1 0.0 0.0West Virginia 0.0 0.1 5.7 11.7 6.2 1.7 0.5 0.2 0.0Wisconsin 0.0 0.1 1.0 2.1 1.2 0.3 0.1 0.0 0.0Wyoming 0.0 0.3 2.6 3.9 2.4 0.7 0.2 0.0 -National 0.0 0.4 2.8 4.9 3.3 1.1 0.4 0.1 0.1Reporting States - - - - - - - - -
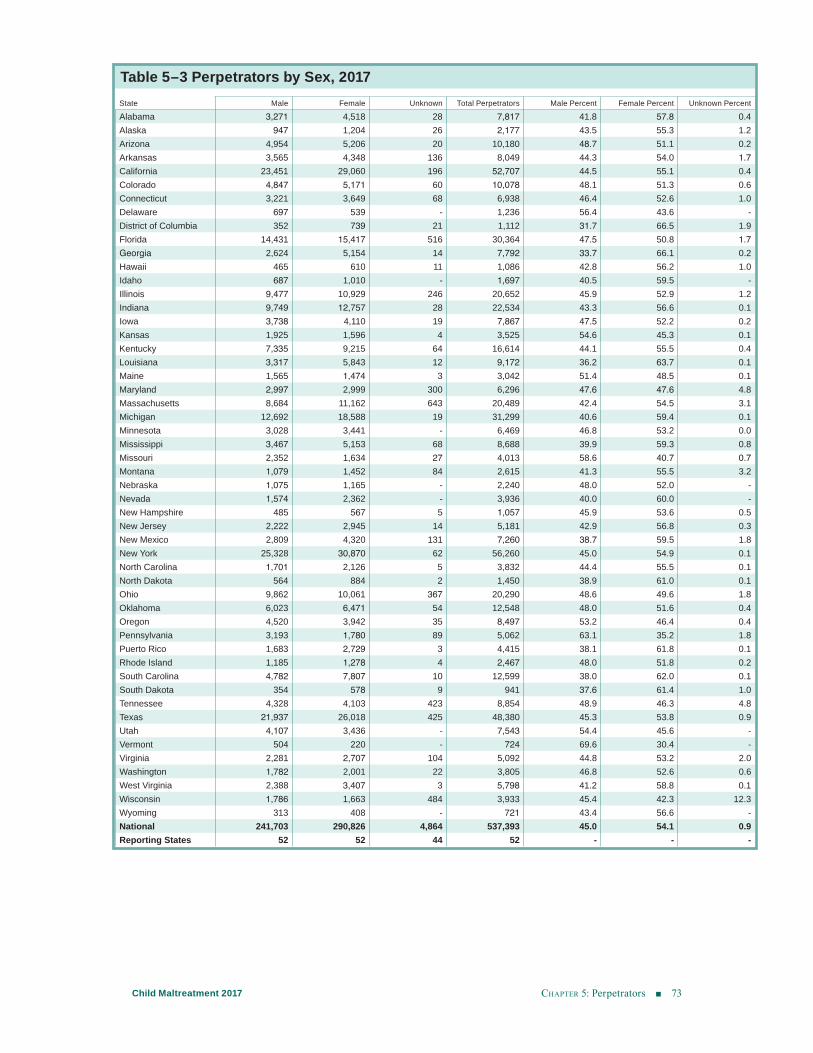
chApter 5: Perpetrators 73Child Maltreatment 2017
Table 5–3 Perpetrators by Sex, 2017 State Male Female Unknown Total Perpetrators Male Percent Female Percent Unknown Percent
Alabama 3,271 4,518 28 7,817 41.8 57.8 0.4Alaska 947 1,204 26 2,177 43.5 55.3 1.2Arizona 4,954 5,206 20 10,180 48.7 51.1 0.2Arkansas 3,565 4,348 136 8,049 44.3 54.0 1.7California 23,451 29,060 196 52,707 44.5 55.1 0.4Colorado 4,847 5,171 60 10,078 48.1 51.3 0.6Connecticut 3,221 3,649 68 6,938 46.4 52.6 1.0Delaware 697 539 - 1,236 56.4 43.6 -District of Columbia 352 739 21 1,112 31.7 66.5 1.9Florida 14,431 15,417 516 30,364 47.5 50.8 1.7Georgia 2,624 5,154 14 7,792 33.7 66.1 0.2Hawaii 465 610 11 1,086 42.8 56.2 1.0Idaho 687 1,010 - 1,697 40.5 59.5 -Illinois 9,477 10,929 246 20,652 45.9 52.9 1.2Indiana 9,749 12,757 28 22,534 43.3 56.6 0.1Iowa 3,738 4,110 19 7,867 47.5 52.2 0.2Kansas 1,925 1,596 4 3,525 54.6 45.3 0.1Kentucky 7,335 9,215 64 16,614 44.1 55.5 0.4Louisiana 3,317 5,843 12 9,172 36.2 63.7 0.1Maine 1,565 1,474 3 3,042 51.4 48.5 0.1Maryland 2,997 2,999 300 6,296 47.6 47.6 4.8Massachusetts 8,684 11,162 643 20,489 42.4 54.5 3.1Michigan 12,692 18,588 19 31,299 40.6 59.4 0.1Minnesota 3,028 3,441 - 6,469 46.8 53.2 0.0Mississippi 3,467 5,153 68 8,688 39.9 59.3 0.8Missouri 2,352 1,634 27 4,013 58.6 40.7 0.7Montana 1,079 1,452 84 2,615 41.3 55.5 3.2Nebraska 1,075 1,165 - 2,240 48.0 52.0 -Nevada 1,574 2,362 - 3,936 40.0 60.0 -New Hampshire 485 567 5 1,057 45.9 53.6 0.5New Jersey 2,222 2,945 14 5,181 42.9 56.8 0.3New Mexico 2,809 4,320 131 7,260 38.7 59.5 1.8New York 25,328 30,870 62 56,260 45.0 54.9 0.1North Carolina 1,701 2,126 5 3,832 44.4 55.5 0.1North Dakota 564 884 2 1,450 38.9 61.0 0.1Ohio 9,862 10,061 367 20,290 48.6 49.6 1.8Oklahoma 6,023 6,471 54 12,548 48.0 51.6 0.4Oregon 4,520 3,942 35 8,497 53.2 46.4 0.4Pennsylvania 3,193 1,780 89 5,062 63.1 35.2 1.8Puerto Rico 1,683 2,729 3 4,415 38.1 61.8 0.1Rhode Island 1,185 1,278 4 2,467 48.0 51.8 0.2South Carolina 4,782 7,807 10 12,599 38.0 62.0 0.1South Dakota 354 578 9 941 37.6 61.4 1.0Tennessee 4,328 4,103 423 8,854 48.9 46.3 4.8Texas 21,937 26,018 425 48,380 45.3 53.8 0.9Utah 4,107 3,436 - 7,543 54.4 45.6 -Vermont 504 220 - 724 69.6 30.4 -Virginia 2,281 2,707 104 5,092 44.8 53.2 2.0Washington 1,782 2,001 22 3,805 46.8 52.6 0.6West Virginia 2,388 3,407 3 5,798 41.2 58.8 0.1Wisconsin 1,786 1,663 484 3,933 45.4 42.3 12.3Wyoming 313 408 - 721 43.4 56.6 -National 241,703 290,826 4,864 537,393 45.0 54.1 0.9Reporting States 52 52 44 52 - - -
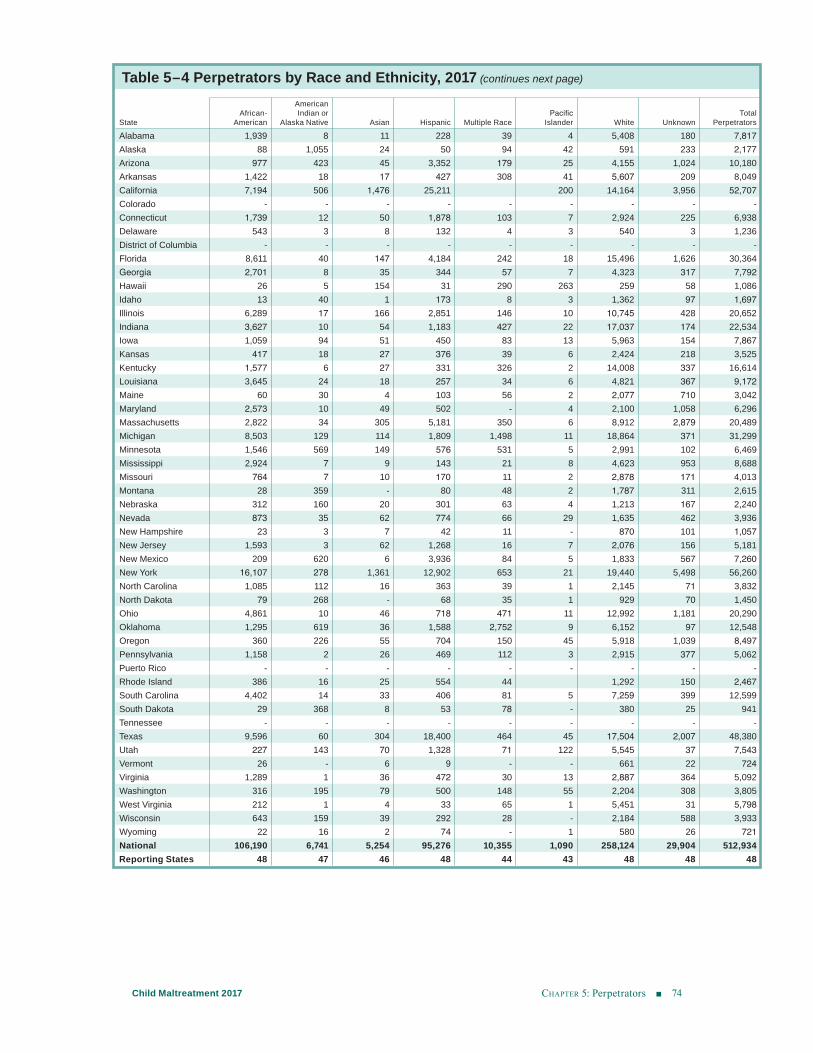
chApter 5: Perpetrators 74Child Maltreatment 2017
Table 5–4 Perpetrators by Race and Ethnicity, 2017 (continues next page)
StateAfrican-
American
American Indian or
Alaska Native Asian Hispanic Multiple RacePacific
Islander White UnknownTotal
Perpetrators
Alabama 1,939 8 11 228 39 4 5,408 180 7,817Alaska 88 1,055 24 50 94 42 591 233 2,177Arizona 977 423 45 3,352 179 25 4,155 1,024 10,180Arkansas 1,422 18 17 427 308 41 5,607 209 8,049California 7,194 506 1,476 25,211 200 14,164 3,956 52,707Colorado - - - - - - - - -Connecticut 1,739 12 50 1,878 103 7 2,924 225 6,938Delaware 543 3 8 132 4 3 540 3 1,236District of Columbia - - - - - - - - -Florida 8,611 40 147 4,184 242 18 15,496 1,626 30,364Georgia 2,701 8 35 344 57 7 4,323 317 7,792Hawaii 26 5 154 31 290 263 259 58 1,086Idaho 13 40 1 173 8 3 1,362 97 1,697Illinois 6,289 17 166 2,851 146 10 10,745 428 20,652Indiana 3,627 10 54 1,183 427 22 17,037 174 22,534Iowa 1,059 94 51 450 83 13 5,963 154 7,867Kansas 417 18 27 376 39 6 2,424 218 3,525Kentucky 1,577 6 27 331 326 2 14,008 337 16,614Louisiana 3,645 24 18 257 34 6 4,821 367 9,172Maine 60 30 4 103 56 2 2,077 710 3,042Maryland 2,573 10 49 502 - 4 2,100 1,058 6,296Massachusetts 2,822 34 305 5,181 350 6 8,912 2,879 20,489Michigan 8,503 129 114 1,809 1,498 11 18,864 371 31,299Minnesota 1,546 569 149 576 531 5 2,991 102 6,469Mississippi 2,924 7 9 143 21 8 4,623 953 8,688Missouri 764 7 10 170 11 2 2,878 171 4,013Montana 28 359 - 80 48 2 1,787 311 2,615Nebraska 312 160 20 301 63 4 1,213 167 2,240Nevada 873 35 62 774 66 29 1,635 462 3,936New Hampshire 23 3 7 42 11 - 870 101 1,057New Jersey 1,593 3 62 1,268 16 7 2,076 156 5,181New Mexico 209 620 6 3,936 84 5 1,833 567 7,260New York 16,107 278 1,361 12,902 653 21 19,440 5,498 56,260North Carolina 1,085 112 16 363 39 1 2,145 71 3,832North Dakota 79 268 - 68 35 1 929 70 1,450Ohio 4,861 10 46 718 471 11 12,992 1,181 20,290Oklahoma 1,295 619 36 1,588 2,752 9 6,152 97 12,548Oregon 360 226 55 704 150 45 5,918 1,039 8,497Pennsylvania 1,158 2 26 469 112 3 2,915 377 5,062Puerto Rico - - - - - - - - -Rhode Island 386 16 25 554 44 1,292 150 2,467South Carolina 4,402 14 33 406 81 5 7,259 399 12,599South Dakota 29 368 8 53 78 - 380 25 941Tennessee - - - - - - - - -Texas 9,596 60 304 18,400 464 45 17,504 2,007 48,380Utah 227 143 70 1,328 71 122 5,545 37 7,543Vermont 26 - 6 9 - - 661 22 724Virginia 1,289 1 36 472 30 13 2,887 364 5,092Washington 316 195 79 500 148 55 2,204 308 3,805West Virginia 212 1 4 33 65 1 5,451 31 5,798Wisconsin 643 159 39 292 28 - 2,184 588 3,933Wyoming 22 16 2 74 - 1 580 26 721National 106,190 6,741 5,254 95,276 10,355 1,090 258,124 29,904 512,934Reporting States 48 47 46 48 44 43 48 48 48
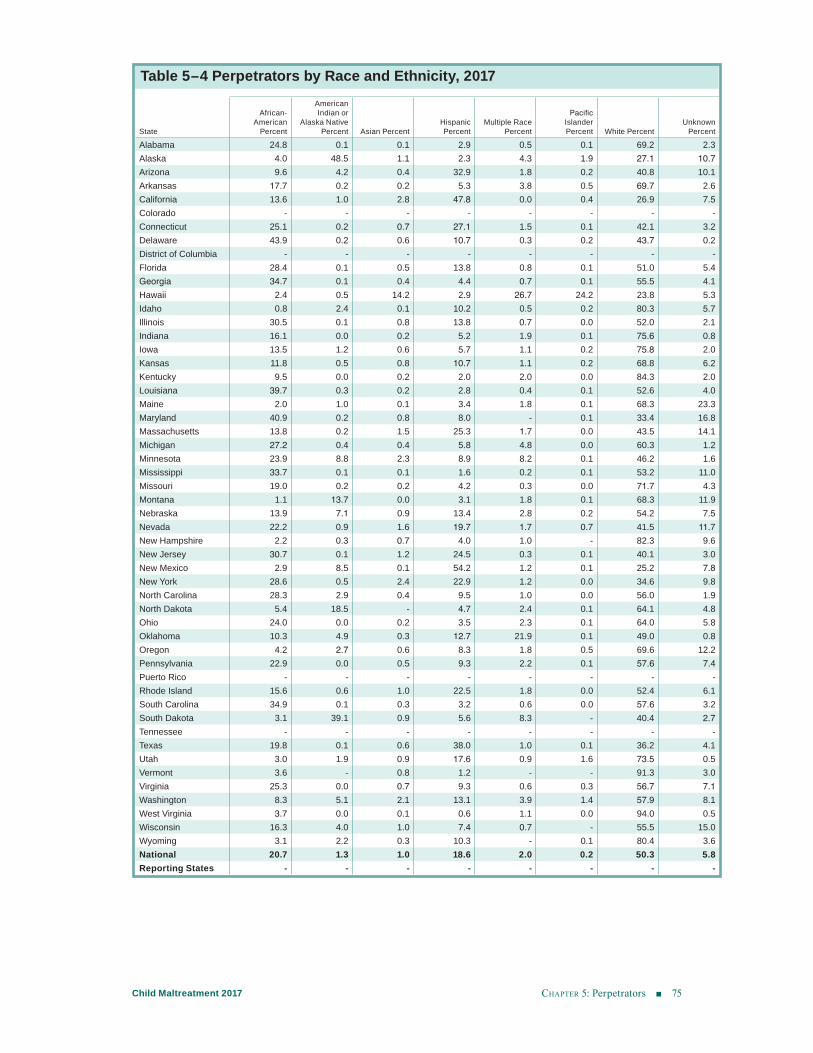
chApter 5: Perpetrators 75Child Maltreatment 2017
Table 5–4 Perpetrators by Race and Ethnicity, 2017
State
African-American
Percent
American Indian or
Alaska Native Percent Asian Percent
Hispanic Percent
Multiple Race Percent
Pacific Islander Percent White Percent
Unknown Percent
Alabama 24.8 0.1 0.1 2.9 0.5 0.1 69.2 2.3Alaska 4.0 48.5 1.1 2.3 4.3 1.9 27.1 10.7Arizona 9.6 4.2 0.4 32.9 1.8 0.2 40.8 10.1Arkansas 17.7 0.2 0.2 5.3 3.8 0.5 69.7 2.6California 13.6 1.0 2.8 47.8 0.0 0.4 26.9 7.5Colorado - - - - - - - -Connecticut 25.1 0.2 0.7 27.1 1.5 0.1 42.1 3.2Delaware 43.9 0.2 0.6 10.7 0.3 0.2 43.7 0.2District of Columbia - - - - - - - -Florida 28.4 0.1 0.5 13.8 0.8 0.1 51.0 5.4Georgia 34.7 0.1 0.4 4.4 0.7 0.1 55.5 4.1Hawaii 2.4 0.5 14.2 2.9 26.7 24.2 23.8 5.3Idaho 0.8 2.4 0.1 10.2 0.5 0.2 80.3 5.7Illinois 30.5 0.1 0.8 13.8 0.7 0.0 52.0 2.1Indiana 16.1 0.0 0.2 5.2 1.9 0.1 75.6 0.8Iowa 13.5 1.2 0.6 5.7 1.1 0.2 75.8 2.0Kansas 11.8 0.5 0.8 10.7 1.1 0.2 68.8 6.2Kentucky 9.5 0.0 0.2 2.0 2.0 0.0 84.3 2.0Louisiana 39.7 0.3 0.2 2.8 0.4 0.1 52.6 4.0Maine 2.0 1.0 0.1 3.4 1.8 0.1 68.3 23.3Maryland 40.9 0.2 0.8 8.0 - 0.1 33.4 16.8Massachusetts 13.8 0.2 1.5 25.3 1.7 0.0 43.5 14.1Michigan 27.2 0.4 0.4 5.8 4.8 0.0 60.3 1.2Minnesota 23.9 8.8 2.3 8.9 8.2 0.1 46.2 1.6Mississippi 33.7 0.1 0.1 1.6 0.2 0.1 53.2 11.0Missouri 19.0 0.2 0.2 4.2 0.3 0.0 71.7 4.3Montana 1.1 13.7 0.0 3.1 1.8 0.1 68.3 11.9Nebraska 13.9 7.1 0.9 13.4 2.8 0.2 54.2 7.5Nevada 22.2 0.9 1.6 19.7 1.7 0.7 41.5 11.7New Hampshire 2.2 0.3 0.7 4.0 1.0 - 82.3 9.6New Jersey 30.7 0.1 1.2 24.5 0.3 0.1 40.1 3.0New Mexico 2.9 8.5 0.1 54.2 1.2 0.1 25.2 7.8New York 28.6 0.5 2.4 22.9 1.2 0.0 34.6 9.8North Carolina 28.3 2.9 0.4 9.5 1.0 0.0 56.0 1.9North Dakota 5.4 18.5 - 4.7 2.4 0.1 64.1 4.8Ohio 24.0 0.0 0.2 3.5 2.3 0.1 64.0 5.8Oklahoma 10.3 4.9 0.3 12.7 21.9 0.1 49.0 0.8Oregon 4.2 2.7 0.6 8.3 1.8 0.5 69.6 12.2Pennsylvania 22.9 0.0 0.5 9.3 2.2 0.1 57.6 7.4Puerto Rico - - - - - - - -Rhode Island 15.6 0.6 1.0 22.5 1.8 0.0 52.4 6.1South Carolina 34.9 0.1 0.3 3.2 0.6 0.0 57.6 3.2South Dakota 3.1 39.1 0.9 5.6 8.3 - 40.4 2.7Tennessee - - - - - - - -Texas 19.8 0.1 0.6 38.0 1.0 0.1 36.2 4.1Utah 3.0 1.9 0.9 17.6 0.9 1.6 73.5 0.5Vermont 3.6 - 0.8 1.2 - - 91.3 3.0Virginia 25.3 0.0 0.7 9.3 0.6 0.3 56.7 7.1Washington 8.3 5.1 2.1 13.1 3.9 1.4 57.9 8.1West Virginia 3.7 0.0 0.1 0.6 1.1 0.0 94.0 0.5Wisconsin 16.3 4.0 1.0 7.4 0.7 - 55.5 15.0Wyoming 3.1 2.2 0.3 10.3 - 0.1 80.4 3.6National 20.7 1.3 1.0 18.6 2.0 0.2 50.3 5.8Reporting States - - - - - - - -
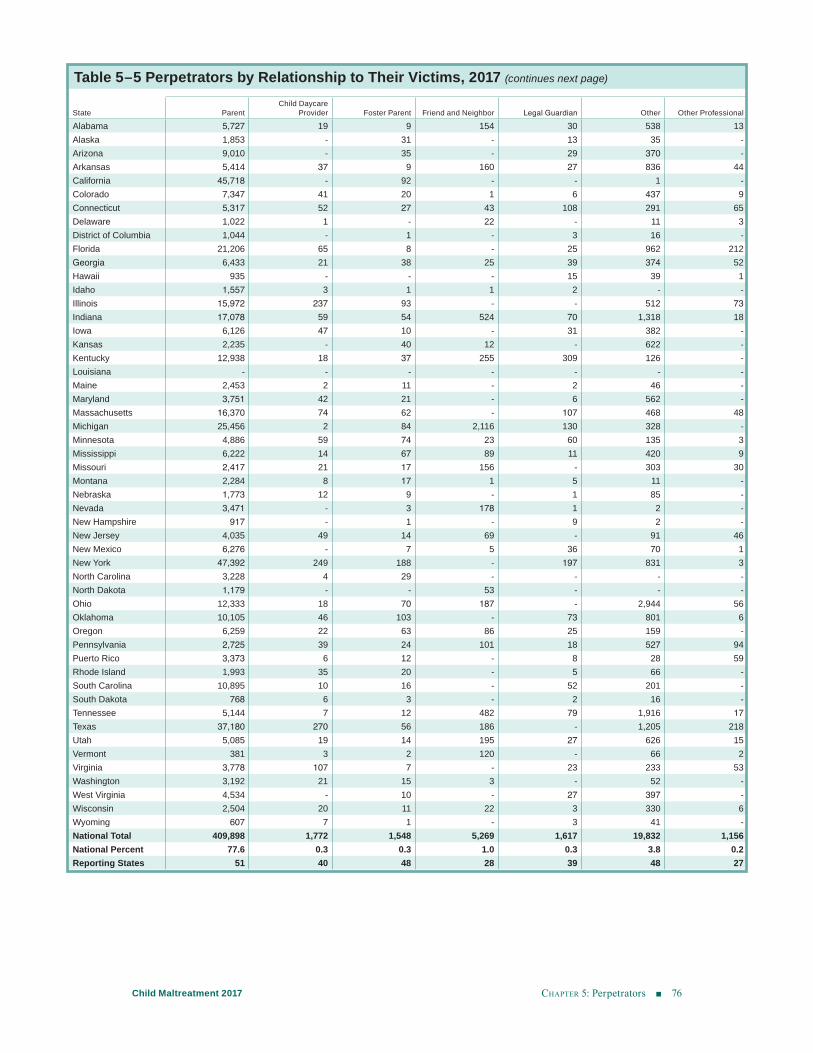
chApter 5: Perpetrators 76Child Maltreatment 2017
Table 5–5 Perpetrators by Relationship to Their Victims, 2017 (continues next page)
State ParentChild Daycare
Provider Foster Parent Friend and Neighbor Legal Guardian Other Other ProfessionalAlabama 5,727 19 9 154 30 538 13Alaska 1,853 - 31 - 13 35 -Arizona 9,010 - 35 - 29 370 -Arkansas 5,414 37 9 160 27 836 44California 45,718 - 92 - - 1 -Colorado 7,347 41 20 1 6 437 9Connecticut 5,317 52 27 43 108 291 65Delaware 1,022 1 - 22 - 11 3District of Columbia 1,044 - 1 - 3 16 -Florida 21,206 65 8 - 25 962 212Georgia 6,433 21 38 25 39 374 52Hawaii 935 - - - 15 39 1Idaho 1,557 3 1 1 2 - -Illinois 15,972 237 93 - - 512 73Indiana 17,078 59 54 524 70 1,318 18Iowa 6,126 47 10 - 31 382 -Kansas 2,235 - 40 12 - 622 -Kentucky 12,938 18 37 255 309 126 -Louisiana - - - - - - -Maine 2,453 2 11 - 2 46 -Maryland 3,751 42 21 - 6 562 -Massachusetts 16,370 74 62 - 107 468 48Michigan 25,456 2 84 2,116 130 328 -Minnesota 4,886 59 74 23 60 135 3Mississippi 6,222 14 67 89 11 420 9Missouri 2,417 21 17 156 - 303 30Montana 2,284 8 17 1 5 11 -Nebraska 1,773 12 9 - 1 85 -Nevada 3,471 - 3 178 1 2 -New Hampshire 917 - 1 - 9 2 -New Jersey 4,035 49 14 69 - 91 46New Mexico 6,276 - 7 5 36 70 1New York 47,392 249 188 - 197 831 3North Carolina 3,228 4 29 - - - -North Dakota 1,179 - - 53 - - -Ohio 12,333 18 70 187 - 2,944 56Oklahoma 10,105 46 103 - 73 801 6Oregon 6,259 22 63 86 25 159 -Pennsylvania 2,725 39 24 101 18 527 94Puerto Rico 3,373 6 12 - 8 28 59Rhode Island 1,993 35 20 - 5 66 -South Carolina 10,895 10 16 - 52 201 -South Dakota 768 6 3 - 2 16 -Tennessee 5,144 7 12 482 79 1,916 17Texas 37,180 270 56 186 - 1,205 218Utah 5,085 19 14 195 27 626 15Vermont 381 3 2 120 - 66 2Virginia 3,778 107 7 - 23 233 53Washington 3,192 21 15 3 - 52 -West Virginia 4,534 - 10 - 27 397 -Wisconsin 2,504 20 11 22 3 330 6Wyoming 607 7 1 - 3 41 -National Total 409,898 1,772 1,548 5,269 1,617 19,832 1,156National Percent 77.6 0.3 0.3 1.0 0.3 3.8 0.2Reporting States 51 40 48 28 39 48 27
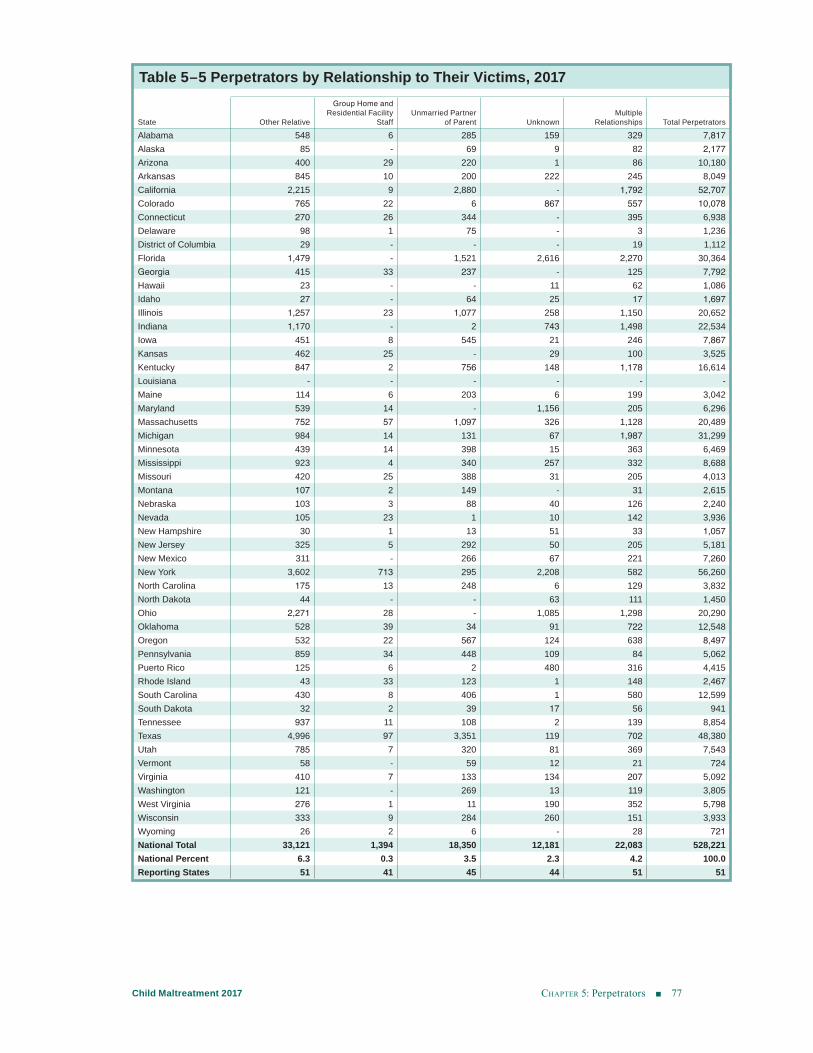
chApter 5: Perpetrators 77Child Maltreatment 2017
Table 5–5 Perpetrators by Relationship to Their Victims, 2017
State Other Relative
Group Home and Residential Facility
Staff Unmarried Partner
of Parent Unknown Multiple
Relationships Total Perpetrators Alabama 548 6 285 159 329 7,817Alaska 85 - 69 9 82 2,177Arizona 400 29 220 1 86 10,180Arkansas 845 10 200 222 245 8,049California 2,215 9 2,880 - 1,792 52,707Colorado 765 22 6 867 557 10,078Connecticut 270 26 344 - 395 6,938Delaware 98 1 75 - 3 1,236District of Columbia 29 - - - 19 1,112Florida 1,479 - 1,521 2,616 2,270 30,364Georgia 415 33 237 - 125 7,792Hawaii 23 - - 11 62 1,086Idaho 27 - 64 25 17 1,697Illinois 1,257 23 1,077 258 1,150 20,652Indiana 1,170 - 2 743 1,498 22,534Iowa 451 8 545 21 246 7,867Kansas 462 25 - 29 100 3,525Kentucky 847 2 756 148 1,178 16,614Louisiana - - - - - -Maine 114 6 203 6 199 3,042Maryland 539 14 - 1,156 205 6,296Massachusetts 752 57 1,097 326 1,128 20,489Michigan 984 14 131 67 1,987 31,299Minnesota 439 14 398 15 363 6,469Mississippi 923 4 340 257 332 8,688Missouri 420 25 388 31 205 4,013Montana 107 2 149 - 31 2,615Nebraska 103 3 88 40 126 2,240Nevada 105 23 1 10 142 3,936New Hampshire 30 1 13 51 33 1,057New Jersey 325 5 292 50 205 5,181New Mexico 311 - 266 67 221 7,260New York 3,602 713 295 2,208 582 56,260North Carolina 175 13 248 6 129 3,832North Dakota 44 - - 63 111 1,450Ohio 2,271 28 - 1,085 1,298 20,290Oklahoma 528 39 34 91 722 12,548Oregon 532 22 567 124 638 8,497Pennsylvania 859 34 448 109 84 5,062Puerto Rico 125 6 2 480 316 4,415Rhode Island 43 33 123 1 148 2,467South Carolina 430 8 406 1 580 12,599South Dakota 32 2 39 17 56 941Tennessee 937 11 108 2 139 8,854Texas 4,996 97 3,351 119 702 48,380Utah 785 7 320 81 369 7,543Vermont 58 - 59 12 21 724Virginia 410 7 133 134 207 5,092Washington 121 - 269 13 119 3,805West Virginia 276 1 11 190 352 5,798Wisconsin 333 9 284 260 151 3,933Wyoming 26 2 6 - 28 721National Total 33,121 1,394 18,350 12,181 22,083 528,221National Percent 6.3 0.3 3.5 2.3 4.2 100.0Reporting States 51 41 45 44 51 51
chApter 6: Services 78Child Maltreatment 2017
Services
The mandate of child protection is not only to investigate or assess maltreatment allega-tions, but also to provide services. CPS agencies promote children’s safety and well-being with a broad range of prevention activities and by providing services to children who were maltreated or are at-risk of maltreatment. CPS agencies may use several options for provid-ing services: agency staff may provide services directly to children and their families, the agency may hire a service provider, or CPS may work with other agencies (e.g., public health agencies).
NCANDS collects data for 26 types of services including adoption, employment, mental health, and substance abuse. States have their own typologies of services, which they map to the NCANDS services categories. (See chapter 1.) In this chapter, services are examined from two perspectives:
(1) Prevention services–consists of aggregated data from states about the use of various funding streams for prevention services, which are provided to parents whose children are at-risk of abuse and neglect. These services are designed to improve child-rearing competencies of the parents and other caregivers via education on the developmental stages of childhood and provision of other types of assistance.
(2) Postresponse services–consists of case-level data about children who receive services as a result of an investigation response or alternative response. Postresponse services address the safety of the child and usually are based on an assessment of the family’s situation, including service needs and family strengths.
Prevention Services (duplicate count of children)States and local agencies determine who will receive prevention services, which services will be offered, and how the services will be provided. Prevention services may be funded by the state or the following federal programs:
■ Title I of the Child Abuse Prevention and Treatment Act (CAPTA), as amended [P.L. 100–294]— The Grants to States for Child Abuse or Neglect Prevention and Treatment Programs (State Grant) provides funds to states to improve CPS systems. The grant serves as a catalyst to assist states with screening and investigating child abuse and neglect reports, creating and improving the use of multidisciplinary teams to enhance investiga-tions, improving risk and safety assessment protocols, training CPS workers and mandated reporters, and improving services to infants with life-threatening conditions.
CHAPTER 6
chApter 6: Services 79Child Maltreatment 2017
■ Title II of CAPTA, as amended [P.L. 100–294]—The Community-Based Grants for the Prevention of Child Abuse and Neglect program (formerly the Community-Based Family Resource and Support program) provides funding to a lead state agency (designated by the governor) to develop, operate, expand, and enhance community-based, prevention-focused programs and activities designed to strengthen and support families to prevent child abuse and neglect. This program is administratively known as the Community-Based Child Abuse Prevention (CBCAP) Program.
■ Title IV–B, Subpart 2, as amended [P.L. 107–133] Promoting Safe and Stable Families—The goal of this legislation is to keep families together by funding such services as preven-tion intervention so that children do not have to be removed from their homes, services to develop alternative placements if children cannot remain safely in the home, and family reunification services to enable children to return to their homes, if appropriate.
■ Title XX of the Social Security Act, [P.L. 93–647], Social Services Block Grant (SSBG)—Under this grant, states may use funds for such prevention services as child daycare, child protective services, information and referral, counseling, and foster care, as well as other services that meet the goal of preventing or remedying neglect, abuse, or exploitation of children.
The prevention table (table 6–1, Children Who Received Prevention Services by Funding Source) is presented differently in the Child Maltreatment 2017 report to provide readers with additional understanding of how states report these data and the estimation process used in this report. For each funding source, states are asked to provide to NCANDS a count of child recipients. Some states are not able to report all child recipients and may report a count of family recipients either instead of or in combination with a count of child recipients. A calculation is performed on the count of family recipients to derive a child count.
The estimated total child recipient count by funding source is a sum of the reported child count and the calculated child count. The calculated child count is computed by multiplying the family count by the average number of child in a family.1 States are asked to provide unique and mutually exclusive counts (e.g., if reporting a child in the child count, the child is not also included in the family count) within each source. However, because a child or family may receive multiple services, there may be duplication across sources.
For FFY 2017, 46 states report approximately 1.9 million (1,858,947) children received prevention services. Funding sources with the largest number of states reporting data are the Promoting Safe and Stable Families with 38 states and the largest estimated child recipients with 556,800. The second largest is the Community-Based Child Abuse Prevention Grants also with 38 states and estimated total child recipients of 467,311. Twenty-four states reported recipients in the “Other” funding source. (See table 6–1 and related notes.) Information about increases and decreases in recipients and funding may be found in Appendix D, State Commentary. States continue to work on improving the ability to measure prevention services. The NCANDS Technical Team is continuing to work with states on improving reporting in this area. Some of the difficulties with collecting and reporting these data are listed below:
■ CPS agencies may contract out some or all prevention services to local community-based agencies, and they may not report on the number of clients they serve.
1 For 2017, the average number of own children under 18 in families is 1.90. Source: U.S. Census Bureau, Current Population Survey. (2018). Annual Social and Economic Supplement AVG3. Average Number of People per Family Household With Own Children Under 18, by Race and Hispanic Origin, Marital Status, Age, and Education of House-holder: 2017 [data file]. Retrieved May 2018 from https://www.census.gov/data/tables/2017/demo/families/cps-2017.html.
chApter 6: Services 80Child Maltreatment 2017
■ Agencies that receive funding through different streams also may report to different agencies. CPS agencies may have difficulty collecting data from all funders or all funded agencies.
■ The prevention program may be on a different fiscal schedule (e.g., state fiscal year) and it may be difficult to provide accurate data on an FFY schedule.
Postresponse Services (duplicate count of children)All children and families who are involved with a child welfare agency receive services to some degree. NCANDS and the Child Maltreatment report focus on only those services that were initiated or continued as a result of the investigation response or alternative response. NCANDS collects data for 26 services categories, states have their own service categories which they crosswalk (map) to the NCANDS categories. (See chapter 1.) Not every state reports data for every service. Readers should see Appendix B, Glossary, for definitions of service categories and Appendix D, State Commentary, for state-specific information on services reporting. States continue to work on improving the ability to report postresponse services data. Some states say they are only able to report on those services that the CPS agency provides and are not able to report on those services provided by an external agency or vendors.
The analyses include those services that were provided between the report date (date the maltreatment report is received) and up to 90 days after the disposition date (date of determi-nation about whether the maltreatment occurred). For services that began prior to the report date, if they continue past the report disposition date, this would imply that the investigation or alternative response reaffirmed the need and continuation of the services, and they should be reported to NCANDS as postresponse services. Services that do not meet the definition of postresponse services are those that (1) began prior to the report date, but did not continue past the disposition date or (2) began more than 90 days after the disposition date.
Approximately 1.3 million children received postresponse services from a CPS agency. Fifty states report more than three-fifths (60.2%) of duplicate victims received postresponse services and 48 states report one-third (29.6%) of duplicate nonvictims received postresponse services. (See table 6–2 and related notes.) Children who received postresponse services are counted per response by CPS and may be counted more than once. States provide data on the start of postresponse services. For those children who were not already receiving services at the start of the report, the average number of days from receipt of a report to initiation of services is 43 days. (See table 6–3 and related notes.)
Table 6–4 displays the children who received foster care services and are removed from home. The method of this analysis was changed in 2015. Only the children who are removed from their home after the report date are counted. Previously, a child was counted if the service was initiated prior to the report date, but continued after the report disposition date. The method was changed because some children were already in foster care when the allega-tion of maltreatment was made, and readers and researchers wanted to know the number of children who were removed as a result of the investigation or alternative response. Readers interested in more complete adoption and foster care statistics should refer to the Adoption and Foster Care Analysis and Reporting System (AFCARS) data. AFCARS collects case-level information on all children in foster care and those who are adopted with title IV-E agency involvement. The data are available on the Children’s Bureau website https://www.acf.hhs.gov/cb/research-data-technology/statistics-research/afcars.
Chapter 6: Services 81Child Maltreatment 2017
More than one-fifth (23.7%) of victims and fewer than 2.0 percent (1.9%) of nonvictims are removed from their homes. Some states report low percentages of victims and nonvictims who received foster care services. The data suggest that those states may use non-CPS providers for services delivery and those providers have difficulty collecting and reporting data in an NCANDS format. (See table 6–4 and related notes.)
There may be several explanations as to why nonvictims are placed in foster care. For example, if one child in a household is deemed to be in danger or at-risk of maltreatment, the state may remove all of the children in the household to ensure their safety. (E.g., if a CPS worker finds a drug lab in a house or finds a severely intoxicated caregiver, the worker may remove all children, even if there is only a maltreatment allegation for one child in the household.) Another reason for a nonvictim to be removed has to do with voluntary place-ments. This is when a parent voluntarily agrees to place a child in foster care even if the child was not determined to be a victim of maltreatment.
States also report on the number of victims for whom some court action occurred. Court action may include any legal action taken by the CPS agency or the courts on behalf of the child, including authorization to place a child in foster care and applying for temporary custody, protective custody, dependency, or termination of parental rights. In other words, these include children who are removed, as well as other children who may have a court action while remaining at home. Based on 41 reporting states, 29.0 percent of victims had court actions. (See table 6–5 and related notes.)
Twenty-six states report 21.6 percent of victims received court-appointed representatives. The representatives act on behalf of a child in court proceedings and make recommendations to the court in the best interests of the child. According to states, Guardians ad litem, children’s attorneys, and Court Appointed Special Advocates (CASAs) are included in these counts to NCANDS. These numbers are likely to be an undercount given the statutory requirement in CAPTA that says, “in every case involving an abused or neglected child, which results in a judicial proceeding, a Guardian ad Litem...who may be an attorney or a court-appointed special advocate... shall be appointed to represent the child in such proceedings...” States provide the following possible reasons for not reporting these data: the data are provided by contracted vendors and are not available at the child level, the court system is not able to interface with the child welfare system, and the court system does not record information at the child-level. (See table 6–6 and related notes.) The NCANDS Technical Team is continu-ing to work with states on improving reporting in this area.
History of Receiving Services (unique count of children)Two data elements in the Agency File collect information on histories of victims with prior CPS involvement. Based on data from 28 states, 15.1 percent of victims received family pres-ervation services within the previous 5 years. (See table 6–7 and related notes.) Data from 36 states shows 5.1 percent of victims were reunited with their families within the previous 5 years. Several states subcontract family preservation services to outside vendors and are not able to report these data to NCANDS. (See table 6–8 and related notes.)
Chapter 6: Services 82Child Maltreatment 2017
Part C of the Individuals With Disabilities Education Act (IDEA)(unique count of children)
The CAPTA Reauthorization Act of 2010 added new data collection requirements to NCANDS:
16)The number of children determined to be eligible for referral, and the number of children referred, under subsection (b)(2)(B)(xxi), to agencies providing early intervention services under part C of the Individuals with Disabilities Education Act (20 U.S.C. 1431 et seq.)
Subsection(b)(2)(B)(xxi) requires states to include in their state plans documentation of their:
provisions and procedures for referral of a child under the age of 3 who is involved in a substantiated case of child abuse or neglect to early intervention services funded under part C of the Individuals with Disabilities Education Act (20 U.S.C. 1431 et seq.)
Based on the new CAPTA requirements, in 2012 NCANDS added the following fields to theAgency File:
■ Number of Children Eligible for Referral to Agencies Providing Early Intervention Services Under Part C of the Individuals With Disabilities Education Act: a unique count of the number of victims eligible for referral to agencies providing early intervention services under Part C of the Individuals with Disabilities Act.
■ Number of Children Referred to Agencies Providing Early Intervention Services Under Part C of the Individuals With Disabilities Education Act: a unique count of the number of victims actually referred to agencies providing early intervention services under Part C of the Individuals with Disabilities Education Act.
Federal guidance asks for states to report the number of victims who are younger than 3 years who are eligible for and referred to these agencies; however, some states have policies in place to allow older children to be considered eligible for referral and receipt of these services and these states may report victims who are older than 3 years. Thirty-two states report 92,364 victims who are eligible for referral to agencies providing early intervention services and 27 states report 29,984 victims were referred. Of the states that are able to report both the victims who were eligible and referred (26 states), 68.4 of victims who are eligible were referred to the agencies. (See table 6–9 and related notes). States are continuing to improve their reporting in these fields. The 2017 analysis includes data from three additional states that were not able to submit or pass data quality checks for FFY 2016.
Exhibit and Table NotesThe following pages contain the data tables referenced in chapter 6. Specific information about state submissions can be found in Appendix D, State Commentary. Additional infor-mation regarding the exhibits and tables is provided below.
General ■ During data analyses, thresholds are set to ensure data quality is balanced with the need to
report data from as many states as possible. States may be excluded from an analysis for data quality issues. Exclusion rules are listed in the table notes below.
chApter 6: Services 83Child Maltreatment 2017
■ The data for all tables are from the Child File unless otherwise noted. ■ Due to the large number of categories, most services are defined in Appendix B, Glossary.
The Child File Codebook, which includes the services fields, is located on the Children’s Bureau website at https://www.acf.hhs.gov/cb/research-data-technology/reporting-systems/ ncands
■ National totals and calculations appear in a single row labeled National instead of separate rows labeled total, rate, or percent.
■ The row labeled Reporting States displays the count of states that provide data for that analysis.
Table 6–1 Children Who Received Prevention Services by Funding Source, 2017
■ Data are from the Agency File. ■ The number of total recipients is a duplicate count. ■ The estimated total child recipient count by funding source is a sum of the reported child
count and the calculated child count. ■ States are excluded if public service announcement recipients are included in their counts.
One state is excluded for including open CPS cases in its counts.
Table 6–2 Children Who Received Postresponse Services, 2017 ■ The numbers of victims and nonvictims are duplicate counts. ■ A child is counted each time that a CPS response is completed and services are provided. ■ This analysis includes only those services that continue past or are initiated after the
completion of the CPS response. ■ States are excluded from this analysis if they report fewer than 1.0 percent of victims or
fewer than 1.0 percent of nonvictims with postresponse services.
Table 6–3 Average Number of Days to Initiation of Services, 2017 ■ The number of children is a duplicate count. ■ This analysis uses subset of children whose service date is the same day or later than the
report date. The subset is created by excluding any report with a service date prior to the report date.
■ A zero represents a state average of less than 1 day. ■ The average days to initiation of services is calculated by subtracting the report date from
the initiation of services date for each report and calculating the average for each state. The state average is rounded to a whole day.
■ The national average is calculated by summing the average number of days from the states and dividing the total by the number of states reporting. The result is rounded to the nearest whole day.
■ States are excluded from this analysis if they report fewer than 1.0 percent of victims or fewer than 1.0 percent of nonvictims with postresponse services.
■ States are excluded from this analysis if fewer than 75.0 percent of records with a service are reported with a service date.
■ States are excluded from this analysis for having more than 20.0 percent of records with a service that have a service date before the report date.
■ States are excluded from this analysis if more than 40.0 percent of records have the same report date and service date.
chApter 6: Services 84Child Maltreatment 2017
Table 6–4 Children Who Received Foster Care Postresponse Services and Who Had a Removal Date on or After the Report Date, 2017
■ The numbers of victims and nonvictims are a duplicate count. ■ A child is counted each time that a CPS response is completed and services are provided. ■ Only the children who are removed from their home on or after the report date are counted. ■ States are excluded from this analysis if fewer than 2.0 percent of victims received foster
care services. ■ States are excluded from this analysis if more than 35.0 percent of victims with foster care
services or more than 35.0 percent of nonvictims with foster care services do not have a removal date.
Table 6–5 Victims With Court Action, 2017 ■ The number of victims is a duplicate count. ■ States are excluded from this analysis if fewer than 5.0 percent of victims have a court
action.
Table 6–6 Victims With Court-Appointed Representatives, 2017 ■ The number of victims is a duplicate count. ■ States are excluded from this analysis if fewer than 5.0 percent of victims have a court-
appointed representative.
Table 6–7 Victims Who Received Family Preservation Services Within the Previous 5 Years, 2017
■ Data are from the Child File and Agency File. ■ The number of victims is a unique count.
Table 6–8 Victims Who Were Reunited With Their Families Within the Previous 5 Years, 2017
■ Data are from the Child File and the Agency File. ■ The number of victims is a unique count.
Table 6–9 IDEA: Victims Who Were Eligible and Victims Who Were Referred to Part C Agencies, 2017
■ Data are from the Agency File.
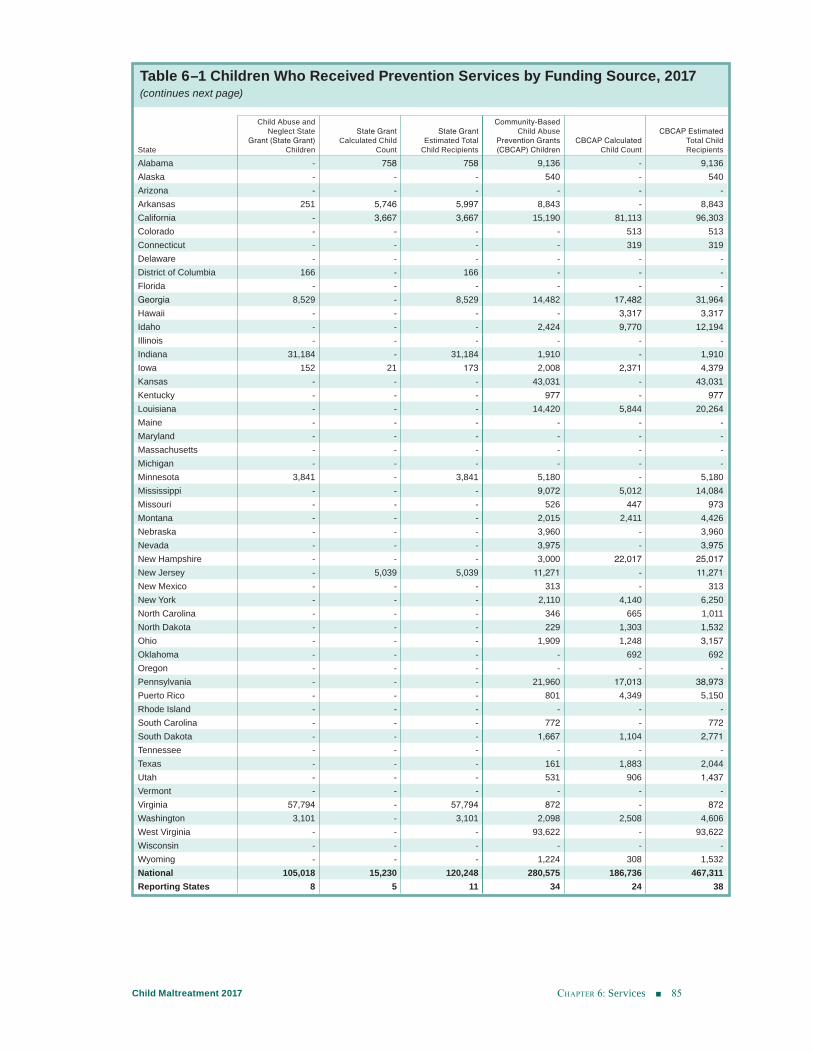
chApter 6: Services 85Child Maltreatment 2017
Table 6–1 Children Who Received Prevention Services by Funding Source, 2017(continues next page)
State
Child Abuse and Neglect State
Grant (State Grant) Children
State Grant Calculated Child
Count
State Grant Estimated Total
Child Recipients
Community-Based Child Abuse
Prevention Grants (CBCAP) Children
CBCAP Calculated Child Count
CBCAP Estimated Total Child Recipients
Alabama - 758 758 9,136 - 9,136Alaska - - - 540 - 540Arizona - - - - - -Arkansas 251 5,746 5,997 8,843 - 8,843California - 3,667 3,667 15,190 81,113 96,303Colorado - - - - 513 513Connecticut - - - - 319 319Delaware - - - - - -District of Columbia 166 - 166 - - -Florida - - - - - -Georgia 8,529 - 8,529 14,482 17,482 31,964Hawaii - - - - 3,317 3,317Idaho - - - 2,424 9,770 12,194Illinois - - - - - -Indiana 31,184 - 31,184 1,910 - 1,910Iowa 152 21 173 2,008 2,371 4,379Kansas - - - 43,031 - 43,031Kentucky - - - 977 - 977Louisiana - - - 14,420 5,844 20,264Maine - - - - - -Maryland - - - - - -Massachusetts - - - - - -Michigan - - - - - -Minnesota 3,841 - 3,841 5,180 - 5,180Mississippi - - - 9,072 5,012 14,084Missouri - - - 526 447 973Montana - - - 2,015 2,411 4,426Nebraska - - - 3,960 - 3,960Nevada - - - 3,975 - 3,975New Hampshire - - - 3,000 22,017 25,017New Jersey - 5,039 5,039 11,271 - 11,271New Mexico - - - 313 - 313New York - - - 2,110 4,140 6,250North Carolina - - - 346 665 1,011North Dakota - - - 229 1,303 1,532Ohio - - - 1,909 1,248 3,157Oklahoma - - - - 692 692Oregon - - - - - -Pennsylvania - - - 21,960 17,013 38,973Puerto Rico - - - 801 4,349 5,150Rhode Island - - - - - -South Carolina - - - 772 - 772South Dakota - - - 1,667 1,104 2,771Tennessee - - - - - -Texas - - - 161 1,883 2,044Utah - - - 531 906 1,437Vermont - - - - - -Virginia 57,794 - 57,794 872 - 872Washington 3,101 - 3,101 2,098 2,508 4,606West Virginia - - - 93,622 - 93,622Wisconsin - - - - - -Wyoming - - - 1,224 308 1,532National 105,018 15,230 120,248 280,575 186,736 467,311Reporting States 8 5 11 34 24 38
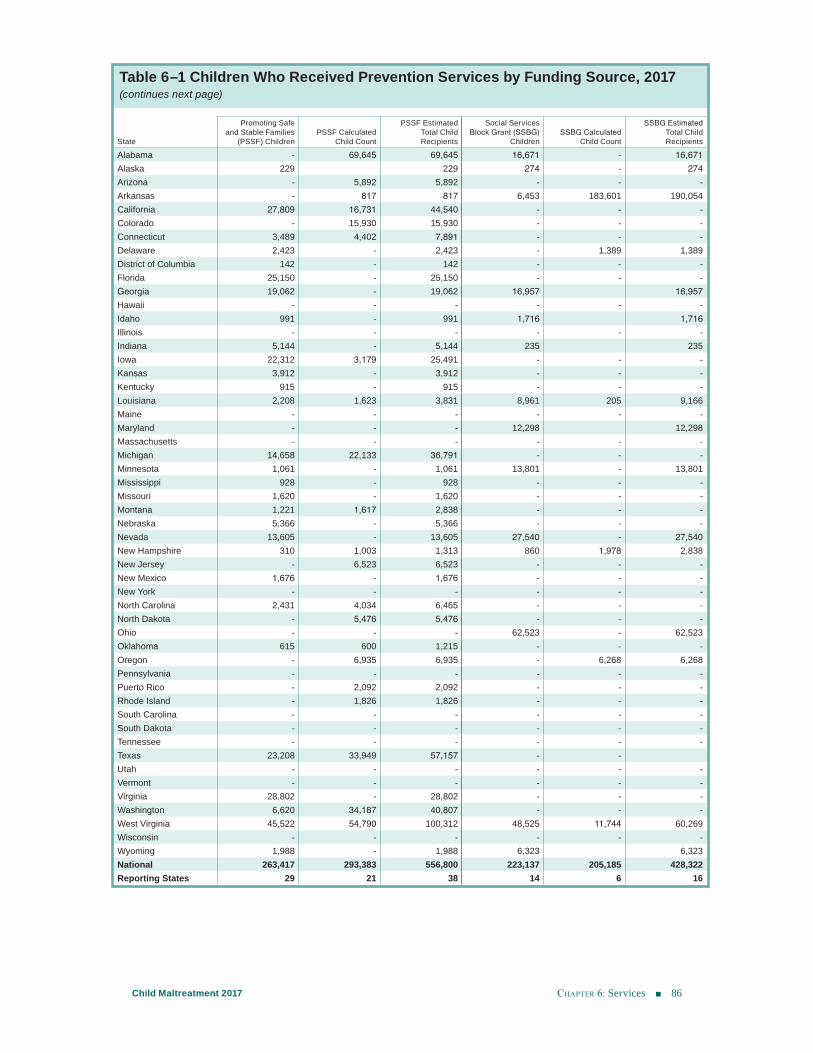
chApter 6: Services 86Child Maltreatment 2017
Table 6–1 Children Who Received Prevention Services by Funding Source, 2017(continues next page)
State
Promoting Safe and Stable Families
(PSSF) Children PSSF Calculated
Child Count
PSSF Estimated Total Child Recipients
Social Services Block Grant (SSBG)
Children SSBG Calculated
Child Count
SSBG Estimated Total Child Recipients
Alabama - 69,645 69,645 16,671 - 16,671Alaska 229 229 274 - 274Arizona - 5,892 5,892 - - -Arkansas - 817 817 6,453 183,601 190,054California 27,809 16,731 44,540 - - -Colorado - 15,930 15,930 - - -Connecticut 3,489 4,402 7,891 - - -Delaware 2,423 - 2,423 - 1,389 1,389District of Columbia 142 - 142 - - -Florida 25,150 - 25,150 - - -Georgia 19,062 - 19,062 16,957 16,957Hawaii - - - - - -Idaho 991 - 991 1,716 1,716Illinois - - - - - -Indiana 5,144 - 5,144 235 235Iowa 22,312 3,179 25,491 - - -Kansas 3,912 - 3,912 - - -Kentucky 915 - 915 - - -Louisiana 2,208 1,623 3,831 8,961 205 9,166Maine - - - - - -Maryland - - - 12,298 12,298Massachusetts - - - - - -Michigan 14,658 22,133 36,791 - - -Minnesota 1,061 - 1,061 13,801 - 13,801Mississippi 928 - 928 - - -Missouri 1,620 - 1,620 - - -Montana 1,221 1,617 2,838 - - -Nebraska 5,366 - 5,366 - - -Nevada 13,605 - 13,605 27,540 - 27,540New Hampshire 310 1,003 1,313 860 1,978 2,838New Jersey - 6,523 6,523 - - -New Mexico 1,676 - 1,676 - - -New York - - - - - -North Carolina 2,431 4,034 6,465 - - -North Dakota - 5,476 5,476 - - -Ohio - - - 62,523 - 62,523Oklahoma 615 600 1,215 - - -Oregon - 6,935 6,935 - 6,268 6,268Pennsylvania - - - - - -Puerto Rico - 2,092 2,092 - - -Rhode Island - 1,826 1,826 - - -South Carolina - - - - - -South Dakota - - - - - -Tennessee - - - - - -Texas 23,208 33,949 57,157 - -Utah - - - - - -Vermont - - - - - -Virginia 28,802 - 28,802 - - -Washington 6,620 34,187 40,807 - - -West Virginia 45,522 54,790 100,312 48,525 11,744 60,269Wisconsin - - - - - -Wyoming 1,988 - 1,988 6,323 6,323National 263,417 293,383 556,800 223,137 205,185 428,322Reporting States 29 21 38 14 6 16
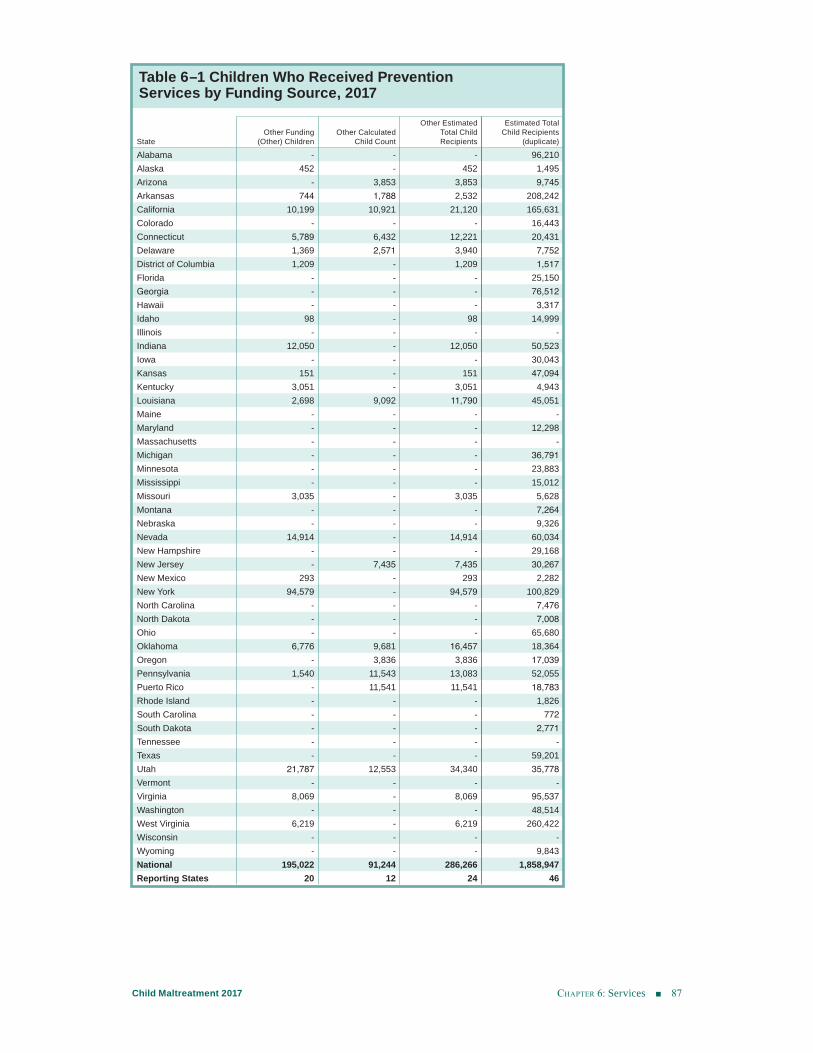
chApter 6: Services 87Child Maltreatment 2017
Table 6–1 Children Who Received Prevention Services by Funding Source, 2017
State Other Funding
(Other) Children Other Calculated
Child Count
Other Estimated Total Child Recipients
Estimated Total Child Recipients
(duplicate)
Alabama - - - 96,210Alaska 452 - 452 1,495Arizona - 3,853 3,853 9,745Arkansas 744 1,788 2,532 208,242California 10,199 10,921 21,120 165,631Colorado - - - 16,443Connecticut 5,789 6,432 12,221 20,431Delaware 1,369 2,571 3,940 7,752District of Columbia 1,209 - 1,209 1,517Florida - - - 25,150Georgia - - - 76,512Hawaii - - - 3,317Idaho 98 - 98 14,999Illinois - - - -Indiana 12,050 - 12,050 50,523Iowa - - - 30,043Kansas 151 - 151 47,094Kentucky 3,051 - 3,051 4,943Louisiana 2,698 9,092 11,790 45,051Maine - - - -Maryland - - - 12,298Massachusetts - - - -Michigan - - - 36,791Minnesota - - - 23,883Mississippi - - - 15,012Missouri 3,035 - 3,035 5,628Montana - - - 7,264Nebraska - - - 9,326Nevada 14,914 - 14,914 60,034New Hampshire - - - 29,168New Jersey - 7,435 7,435 30,267New Mexico 293 - 293 2,282New York 94,579 - 94,579 100,829North Carolina - - - 7,476North Dakota - - - 7,008Ohio - - - 65,680Oklahoma 6,776 9,681 16,457 18,364Oregon - 3,836 3,836 17,039Pennsylvania 1,540 11,543 13,083 52,055Puerto Rico - 11,541 11,541 18,783Rhode Island - - - 1,826South Carolina - - - 772South Dakota - - - 2,771Tennessee - - - -Texas - - - 59,201Utah 21,787 12,553 34,340 35,778Vermont - - - -Virginia 8,069 - 8,069 95,537Washington - - - 48,514West Virginia 6,219 - 6,219 260,422Wisconsin - - - -Wyoming - - - 9,843National 195,022 91,244 286,266 1,858,947Reporting States 20 12 24 46
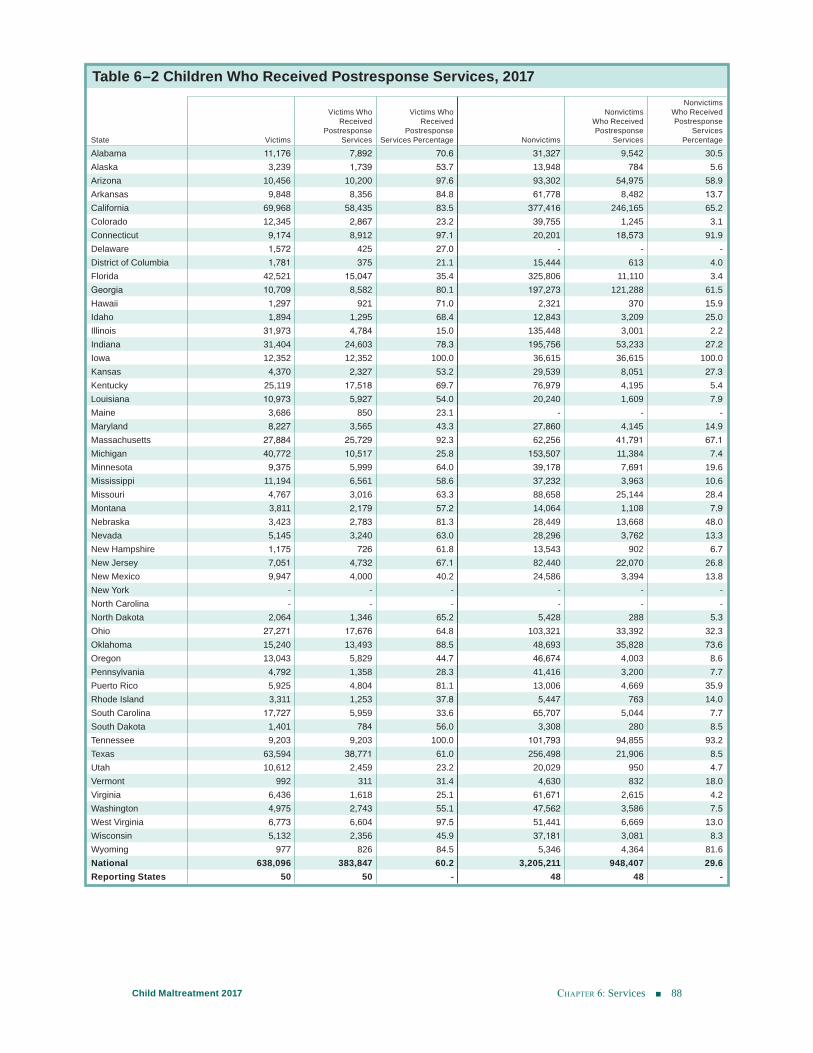
chApter 6: Services 88Child Maltreatment 2017
Table 6–2 Children Who Received Postresponse Services, 2017
State Victims
Victims Who Received
Postresponse Services
Victims Who Received
Postresponse Services Percentage Nonvictims
Nonvictims Who Received Postresponse
Services
Nonvictims Who Received Postresponse
Services Percentage
Alabama 11,176 7,892 70.6 31,327 9,542 30.5Alaska 3,239 1,739 53.7 13,948 784 5.6Arizona 10,456 10,200 97.6 93,302 54,975 58.9Arkansas 9,848 8,356 84.8 61,778 8,482 13.7California 69,968 58,435 83.5 377,416 246,165 65.2Colorado 12,345 2,867 23.2 39,755 1,245 3.1Connecticut 9,174 8,912 97.1 20,201 18,573 91.9Delaware 1,572 425 27.0 - - -District of Columbia 1,781 375 21.1 15,444 613 4.0Florida 42,521 15,047 35.4 325,806 11,110 3.4Georgia 10,709 8,582 80.1 197,273 121,288 61.5Hawaii 1,297 921 71.0 2,321 370 15.9Idaho 1,894 1,295 68.4 12,843 3,209 25.0Illinois 31,973 4,784 15.0 135,448 3,001 2.2Indiana 31,404 24,603 78.3 195,756 53,233 27.2Iowa 12,352 12,352 100.0 36,615 36,615 100.0Kansas 4,370 2,327 53.2 29,539 8,051 27.3Kentucky 25,119 17,518 69.7 76,979 4,195 5.4Louisiana 10,973 5,927 54.0 20,240 1,609 7.9Maine 3,686 850 23.1 - - -Maryland 8,227 3,565 43.3 27,860 4,145 14.9Massachusetts 27,884 25,729 92.3 62,256 41,791 67.1Michigan 40,772 10,517 25.8 153,507 11,384 7.4Minnesota 9,375 5,999 64.0 39,178 7,691 19.6Mississippi 11,194 6,561 58.6 37,232 3,963 10.6Missouri 4,767 3,016 63.3 88,658 25,144 28.4Montana 3,811 2,179 57.2 14,064 1,108 7.9Nebraska 3,423 2,783 81.3 28,449 13,668 48.0Nevada 5,145 3,240 63.0 28,296 3,762 13.3New Hampshire 1,175 726 61.8 13,543 902 6.7New Jersey 7,051 4,732 67.1 82,440 22,070 26.8New Mexico 9,947 4,000 40.2 24,586 3,394 13.8New York - - - - - -North Carolina - - - - - -North Dakota 2,064 1,346 65.2 5,428 288 5.3Ohio 27,271 17,676 64.8 103,321 33,392 32.3Oklahoma 15,240 13,493 88.5 48,693 35,828 73.6Oregon 13,043 5,829 44.7 46,674 4,003 8.6Pennsylvania 4,792 1,358 28.3 41,416 3,200 7.7Puerto Rico 5,925 4,804 81.1 13,006 4,669 35.9Rhode Island 3,311 1,253 37.8 5,447 763 14.0South Carolina 17,727 5,959 33.6 65,707 5,044 7.7South Dakota 1,401 784 56.0 3,308 280 8.5Tennessee 9,203 9,203 100.0 101,793 94,855 93.2Texas 63,594 38,771 61.0 256,498 21,906 8.5Utah 10,612 2,459 23.2 20,029 950 4.7Vermont 992 311 31.4 4,630 832 18.0Virginia 6,436 1,618 25.1 61,671 2,615 4.2Washington 4,975 2,743 55.1 47,562 3,586 7.5West Virginia 6,773 6,604 97.5 51,441 6,669 13.0Wisconsin 5,132 2,356 45.9 37,181 3,081 8.3Wyoming 977 826 84.5 5,346 4,364 81.6National 638,096 383,847 60.2 3,205,211 948,407 29.6Reporting States 50 50 - 48 48 -
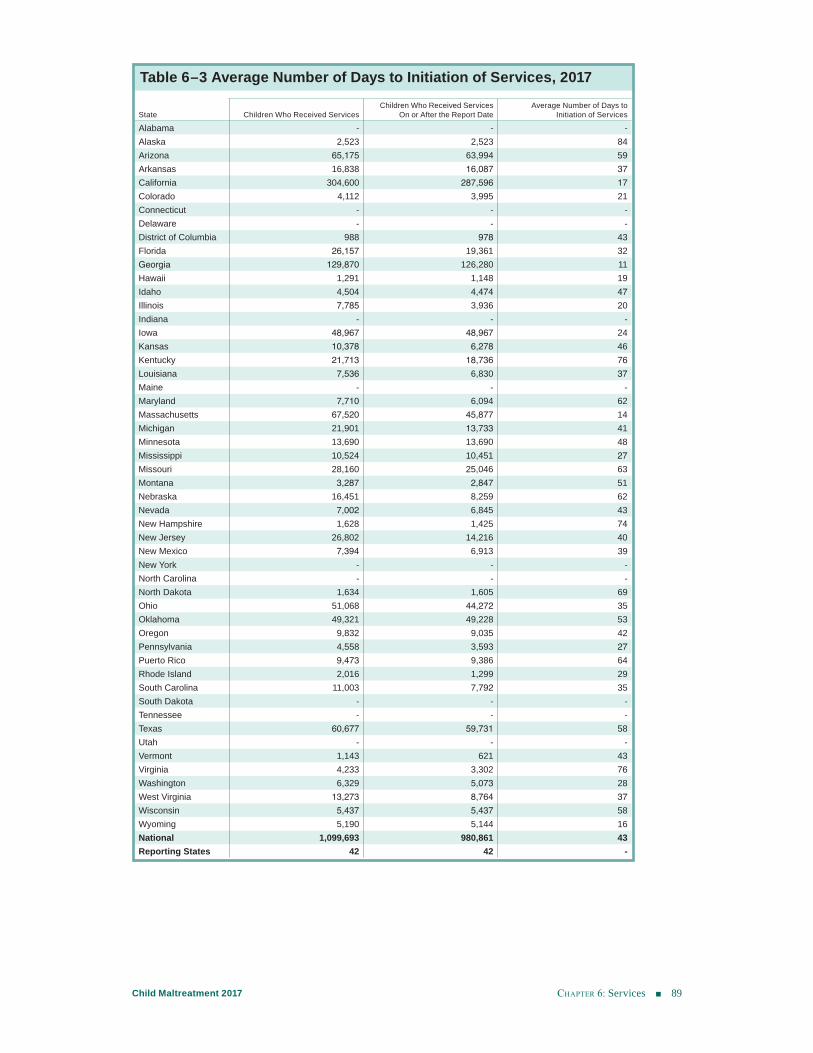
chApter 6: Services 89Child Maltreatment 2017
Table 6–3 Average Number of Days to Initiation of Services, 2017
State Children Who Received ServicesChildren Who Received Services
On or After the Report DateAverage Number of Days to
Initiation of Services
Alabama - - -Alaska 2,523 2,523 84Arizona 65,175 63,994 59Arkansas 16,838 16,087 37California 304,600 287,596 17Colorado 4,112 3,995 21Connecticut - - -Delaware - - -District of Columbia 988 978 43Florida 26,157 19,361 32Georgia 129,870 126,280 11Hawaii 1,291 1,148 19Idaho 4,504 4,474 47Illinois 7,785 3,936 20Indiana - - -Iowa 48,967 48,967 24Kansas 10,378 6,278 46Kentucky 21,713 18,736 76Louisiana 7,536 6,830 37Maine - - -Maryland 7,710 6,094 62Massachusetts 67,520 45,877 14Michigan 21,901 13,733 41Minnesota 13,690 13,690 48Mississippi 10,524 10,451 27Missouri 28,160 25,046 63Montana 3,287 2,847 51Nebraska 16,451 8,259 62Nevada 7,002 6,845 43New Hampshire 1,628 1,425 74New Jersey 26,802 14,216 40New Mexico 7,394 6,913 39New York - - -North Carolina - - -North Dakota 1,634 1,605 69Ohio 51,068 44,272 35Oklahoma 49,321 49,228 53Oregon 9,832 9,035 42Pennsylvania 4,558 3,593 27Puerto Rico 9,473 9,386 64Rhode Island 2,016 1,299 29South Carolina 11,003 7,792 35South Dakota - - -Tennessee - - -Texas 60,677 59,731 58Utah - - -Vermont 1,143 621 43Virginia 4,233 3,302 76Washington 6,329 5,073 28West Virginia 13,273 8,764 37Wisconsin 5,437 5,437 58Wyoming 5,190 5,144 16National 1,099,693 980,861 43Reporting States 42 42 -
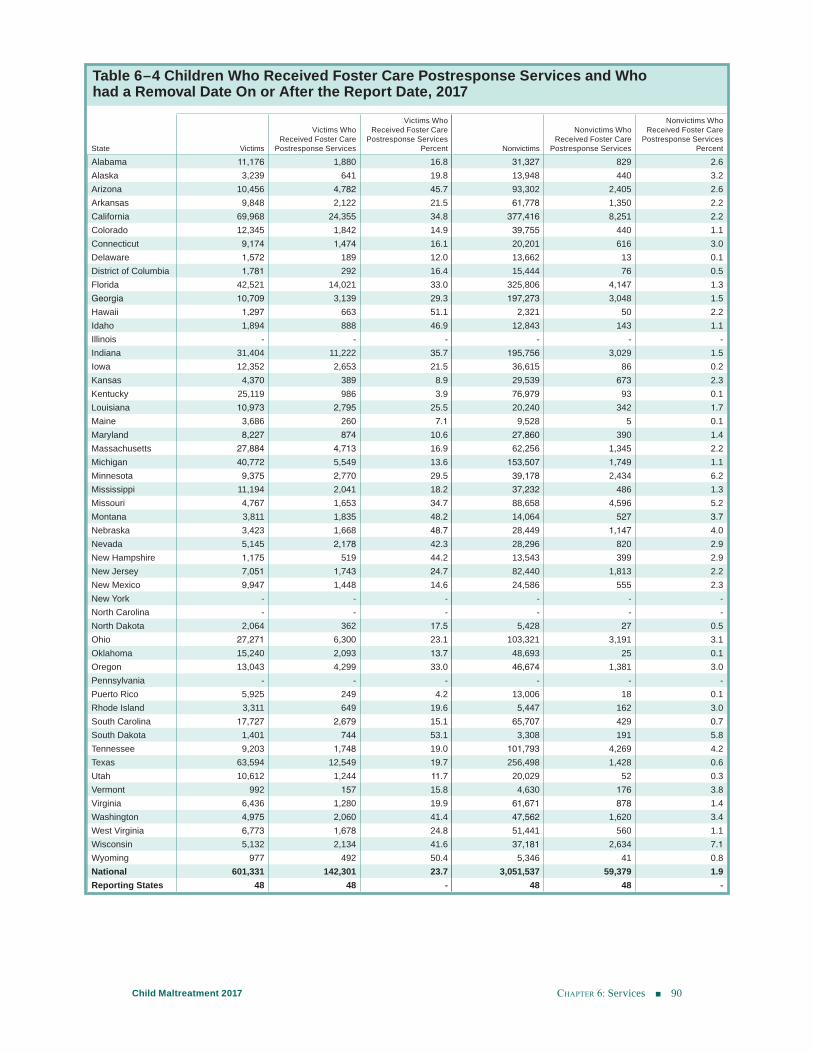
chApter 6: Services 90Child Maltreatment 2017
Table 6–4 Children Who Received Foster Care Postresponse Services and Who had a Removal Date On or After the Report Date, 2017
State Victims
Victims Who Received Foster Care
Postresponse Services
Victims Who Received Foster Care
Postresponse Services Percent Nonvictims
Nonvictims Who Received Foster Care
Postresponse Services
Nonvictims Who Received Foster Care
Postresponse Services Percent
Alabama 11,176 1,880 16.8 31,327 829 2.6Alaska 3,239 641 19.8 13,948 440 3.2Arizona 10,456 4,782 45.7 93,302 2,405 2.6Arkansas 9,848 2,122 21.5 61,778 1,350 2.2California 69,968 24,355 34.8 377,416 8,251 2.2Colorado 12,345 1,842 14.9 39,755 440 1.1Connecticut 9,174 1,474 16.1 20,201 616 3.0Delaware 1,572 189 12.0 13,662 13 0.1District of Columbia 1,781 292 16.4 15,444 76 0.5Florida 42,521 14,021 33.0 325,806 4,147 1.3Georgia 10,709 3,139 29.3 197,273 3,048 1.5Hawaii 1,297 663 51.1 2,321 50 2.2Idaho 1,894 888 46.9 12,843 143 1.1Illinois - - - - - -Indiana 31,404 11,222 35.7 195,756 3,029 1.5Iowa 12,352 2,653 21.5 36,615 86 0.2Kansas 4,370 389 8.9 29,539 673 2.3Kentucky 25,119 986 3.9 76,979 93 0.1Louisiana 10,973 2,795 25.5 20,240 342 1.7Maine 3,686 260 7.1 9,528 5 0.1Maryland 8,227 874 10.6 27,860 390 1.4Massachusetts 27,884 4,713 16.9 62,256 1,345 2.2Michigan 40,772 5,549 13.6 153,507 1,749 1.1Minnesota 9,375 2,770 29.5 39,178 2,434 6.2Mississippi 11,194 2,041 18.2 37,232 486 1.3Missouri 4,767 1,653 34.7 88,658 4,596 5.2Montana 3,811 1,835 48.2 14,064 527 3.7Nebraska 3,423 1,668 48.7 28,449 1,147 4.0Nevada 5,145 2,178 42.3 28,296 820 2.9New Hampshire 1,175 519 44.2 13,543 399 2.9New Jersey 7,051 1,743 24.7 82,440 1,813 2.2New Mexico 9,947 1,448 14.6 24,586 555 2.3New York - - - - - -North Carolina - - - - - -North Dakota 2,064 362 17.5 5,428 27 0.5Ohio 27,271 6,300 23.1 103,321 3,191 3.1Oklahoma 15,240 2,093 13.7 48,693 25 0.1Oregon 13,043 4,299 33.0 46,674 1,381 3.0Pennsylvania - - - - - -Puerto Rico 5,925 249 4.2 13,006 18 0.1Rhode Island 3,311 649 19.6 5,447 162 3.0South Carolina 17,727 2,679 15.1 65,707 429 0.7South Dakota 1,401 744 53.1 3,308 191 5.8Tennessee 9,203 1,748 19.0 101,793 4,269 4.2Texas 63,594 12,549 19.7 256,498 1,428 0.6Utah 10,612 1,244 11.7 20,029 52 0.3Vermont 992 157 15.8 4,630 176 3.8Virginia 6,436 1,280 19.9 61,671 878 1.4Washington 4,975 2,060 41.4 47,562 1,620 3.4West Virginia 6,773 1,678 24.8 51,441 560 1.1Wisconsin 5,132 2,134 41.6 37,181 2,634 7.1Wyoming 977 492 50.4 5,346 41 0.8National 601,331 142,301 23.7 3,051,537 59,379 1.9Reporting States 48 48 - 48 48 -
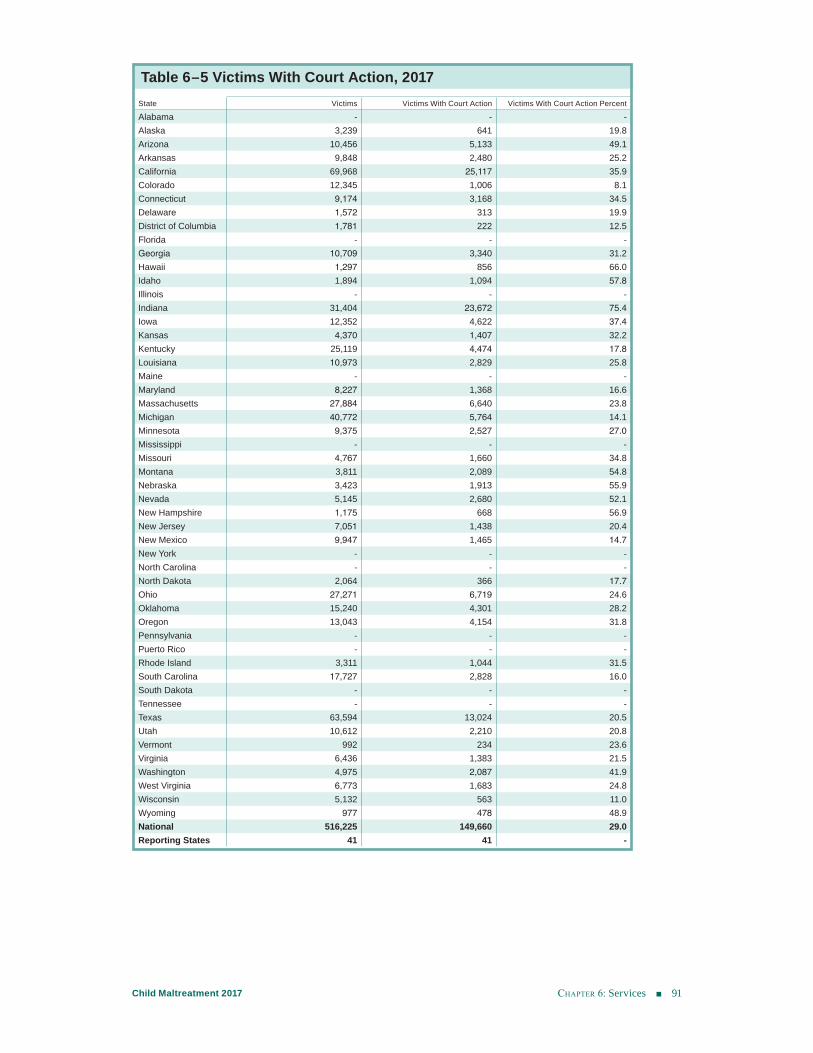
chApter 6: Services 91Child Maltreatment 2017
Table 6–5 Victims With Court Action, 2017 State Victims Victims With Court Action Victims With Court Action Percent
Alabama - - -Alaska 3,239 641 19.8Arizona 10,456 5,133 49.1Arkansas 9,848 2,480 25.2California 69,968 25,117 35.9Colorado 12,345 1,006 8.1Connecticut 9,174 3,168 34.5Delaware 1,572 313 19.9District of Columbia 1,781 222 12.5Florida - - -Georgia 10,709 3,340 31.2Hawaii 1,297 856 66.0Idaho 1,894 1,094 57.8Illinois - - -Indiana 31,404 23,672 75.4Iowa 12,352 4,622 37.4Kansas 4,370 1,407 32.2Kentucky 25,119 4,474 17.8Louisiana 10,973 2,829 25.8Maine - - -Maryland 8,227 1,368 16.6Massachusetts 27,884 6,640 23.8Michigan 40,772 5,764 14.1Minnesota 9,375 2,527 27.0Mississippi - - -Missouri 4,767 1,660 34.8Montana 3,811 2,089 54.8Nebraska 3,423 1,913 55.9Nevada 5,145 2,680 52.1New Hampshire 1,175 668 56.9New Jersey 7,051 1,438 20.4New Mexico 9,947 1,465 14.7New York - - -North Carolina - - -North Dakota 2,064 366 17.7Ohio 27,271 6,719 24.6Oklahoma 15,240 4,301 28.2Oregon 13,043 4,154 31.8Pennsylvania - - -Puerto Rico - - -Rhode Island 3,311 1,044 31.5South Carolina 17,727 2,828 16.0South Dakota - - -Tennessee - - -Texas 63,594 13,024 20.5Utah 10,612 2,210 20.8Vermont 992 234 23.6Virginia 6,436 1,383 21.5Washington 4,975 2,087 41.9West Virginia 6,773 1,683 24.8Wisconsin 5,132 563 11.0Wyoming 977 478 48.9National 516,225 149,660 29.0Reporting States 41 41 -
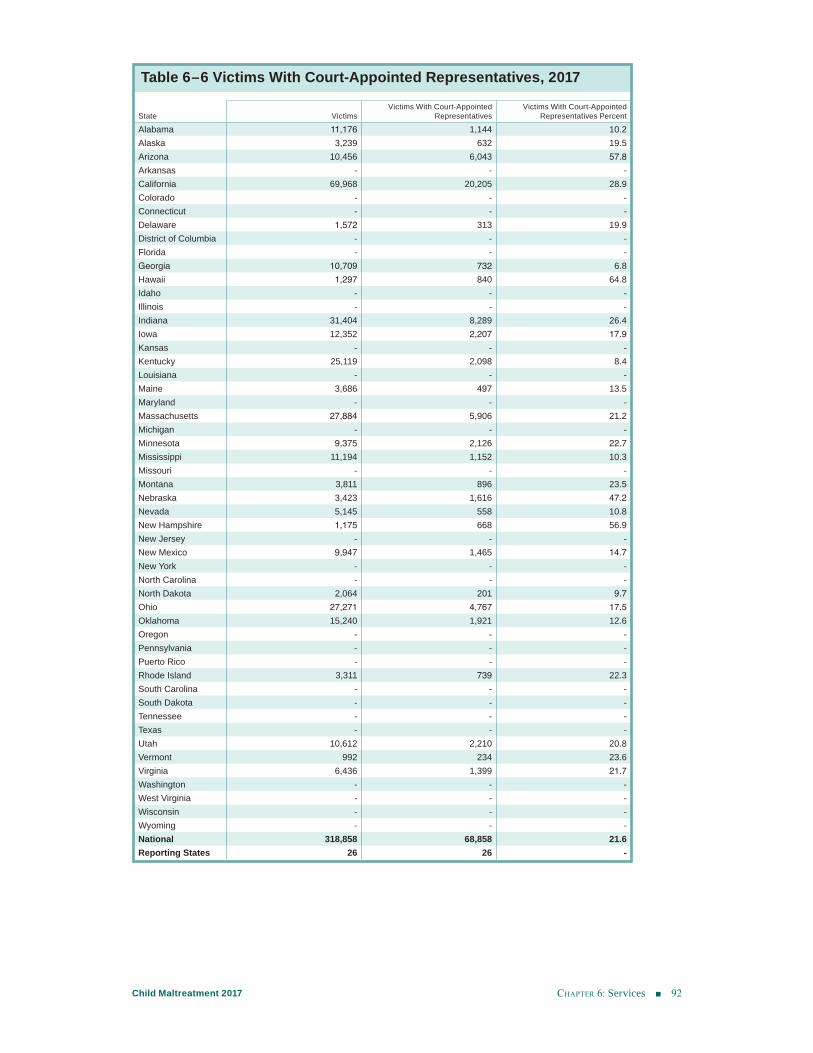
chApter 6: Services 92Child Maltreatment 2017
Table 6–6 Victims With Court-Appointed Representatives, 2017
State Victims Victims With Court-Appointed
RepresentativesVictims With Court-Appointed
Representatives Percent
Alabama 11,176 1,144 10.2Alaska 3,239 632 19.5Arizona 10,456 6,043 57.8Arkansas - - -California 69,968 20,205 28.9Colorado - - -Connecticut - - -Delaware 1,572 313 19.9District of Columbia - - -Florida - - -Georgia 10,709 732 6.8Hawaii 1,297 840 64.8Idaho - - -Illinois - - -Indiana 31,404 8,289 26.4Iowa 12,352 2,207 17.9Kansas - - -Kentucky 25,119 2,098 8.4Louisiana - - -Maine 3,686 497 13.5Maryland - - -Massachusetts 27,884 5,906 21.2Michigan - - -Minnesota 9,375 2,126 22.7Mississippi 11,194 1,152 10.3Missouri - - -Montana 3,811 896 23.5Nebraska 3,423 1,616 47.2Nevada 5,145 558 10.8New Hampshire 1,175 668 56.9New Jersey - - -New Mexico 9,947 1,465 14.7New York - - -North Carolina - - -North Dakota 2,064 201 9.7Ohio 27,271 4,767 17.5Oklahoma 15,240 1,921 12.6Oregon - - -Pennsylvania - - -Puerto Rico - - -Rhode Island 3,311 739 22.3South Carolina - - -South Dakota - - -Tennessee - - -Texas - - -Utah 10,612 2,210 20.8Vermont 992 234 23.6Virginia 6,436 1,399 21.7Washington - - -West Virginia - - -Wisconsin - - -Wyoming - - -National 318,858 68,858 21.6Reporting States 26 26 -
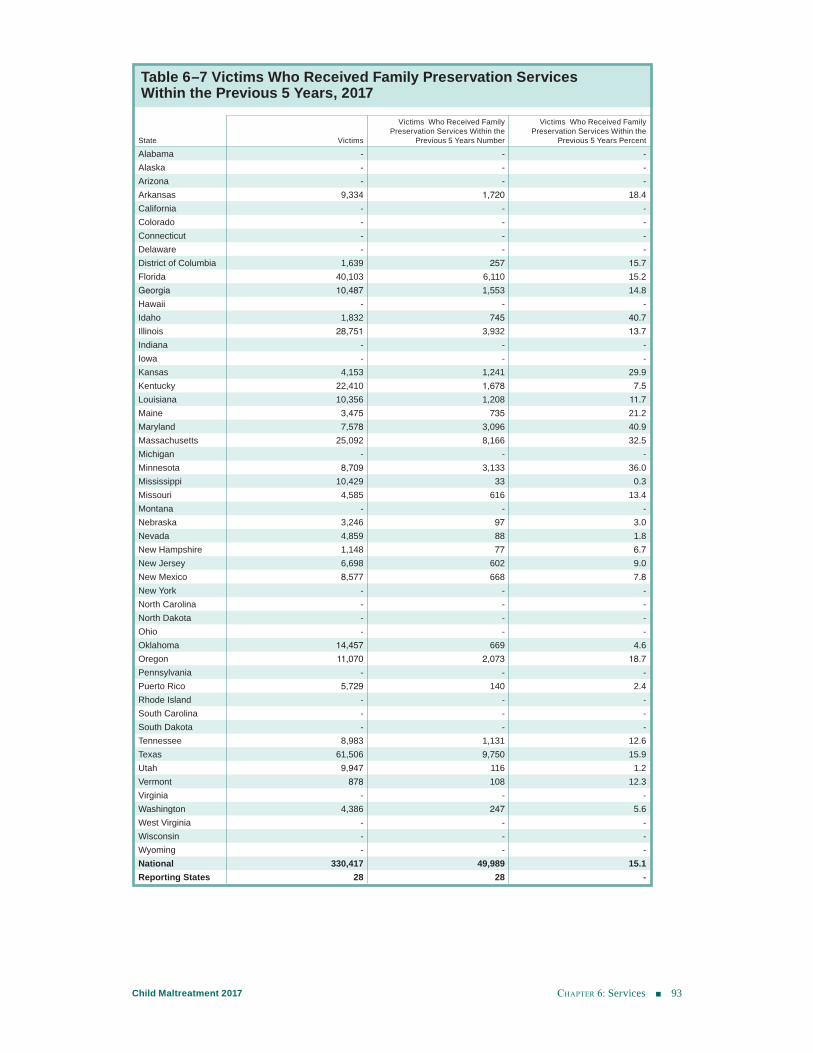
chApter 6: Services 93Child Maltreatment 2017
Table 6–7 Victims Who Received Family Preservation Services Within the Previous 5 Years, 2017
State Victims
Victims Who Received Family Preservation Services Within the
Previous 5 Years Number
Victims Who Received Family Preservation Services Within the
Previous 5 Years Percent
Alabama - - -Alaska - - -Arizona - - -Arkansas 9,334 1,720 18.4California - - -Colorado - - -Connecticut - - -Delaware - - -District of Columbia 1,639 257 15.7Florida 40,103 6,110 15.2Georgia 10,487 1,553 14.8Hawaii - - -Idaho 1,832 745 40.7Illinois 28,751 3,932 13.7Indiana - - -Iowa - - -Kansas 4,153 1,241 29.9Kentucky 22,410 1,678 7.5Louisiana 10,356 1,208 11.7Maine 3,475 735 21.2Maryland 7,578 3,096 40.9Massachusetts 25,092 8,166 32.5Michigan - - -Minnesota 8,709 3,133 36.0Mississippi 10,429 33 0.3Missouri 4,585 616 13.4Montana - - -Nebraska 3,246 97 3.0Nevada 4,859 88 1.8New Hampshire 1,148 77 6.7New Jersey 6,698 602 9.0New Mexico 8,577 668 7.8New York - - -North Carolina - - -North Dakota - - -Ohio - - -Oklahoma 14,457 669 4.6Oregon 11,070 2,073 18.7Pennsylvania - - -Puerto Rico 5,729 140 2.4Rhode Island - - -South Carolina - - -South Dakota - - -Tennessee 8,983 1,131 12.6Texas 61,506 9,750 15.9Utah 9,947 116 1.2Vermont 878 108 12.3Virginia - - -Washington 4,386 247 5.6West Virginia - - -Wisconsin - - -Wyoming - - -National 330,417 49,989 15.1Reporting States 28 28 -
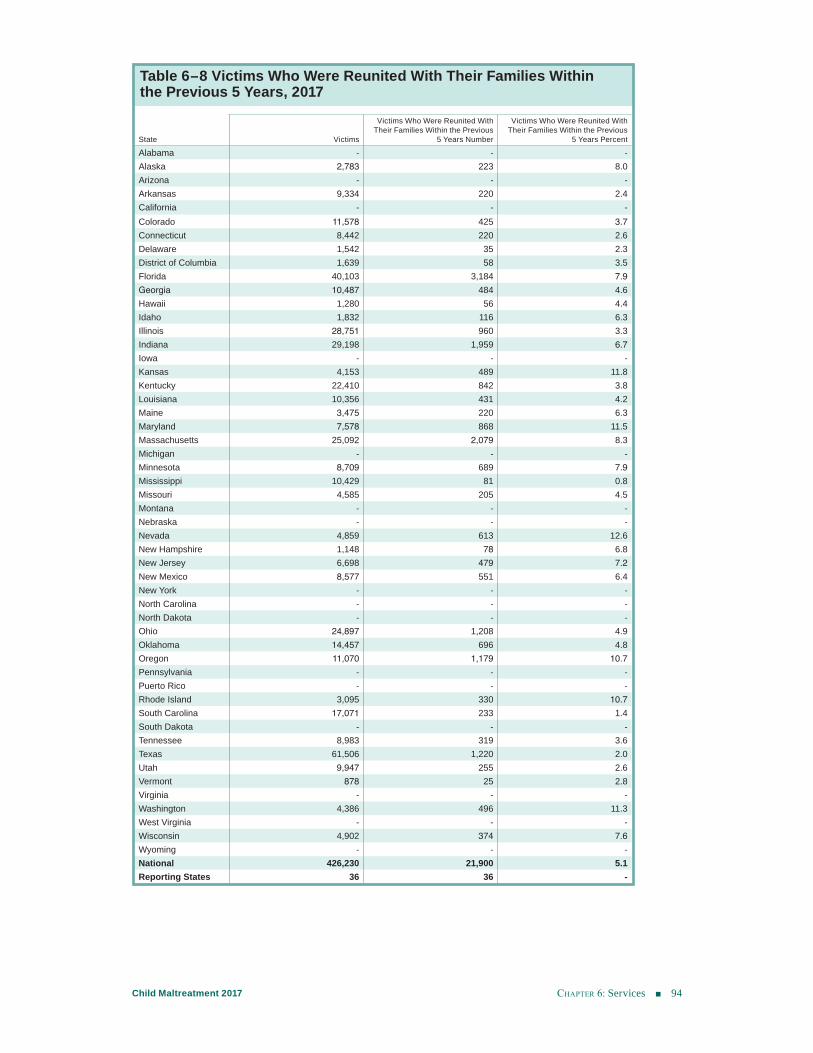
chApter 6: Services 94Child Maltreatment 2017
Table 6–8 Victims Who Were Reunited With Their Families Withinthe Previous 5 Years, 2017
State Victims
Victims Who Were Reunited With Their Families Within the Previous
5 Years Number
Victims Who Were Reunited With Their Families Within the Previous
5 Years Percent
Alabama - - -Alaska 2,783 223 8.0Arizona - - -Arkansas 9,334 220 2.4California - - -Colorado 11,578 425 3.7Connecticut 8,442 220 2.6Delaware 1,542 35 2.3District of Columbia 1,639 58 3.5Florida 40,103 3,184 7.9Georgia 10,487 484 4.6Hawaii 1,280 56 4.4Idaho 1,832 116 6.3Illinois 28,751 960 3.3Indiana 29,198 1,959 6.7Iowa - - -Kansas 4,153 489 11.8Kentucky 22,410 842 3.8Louisiana 10,356 431 4.2Maine 3,475 220 6.3Maryland 7,578 868 11.5Massachusetts 25,092 2,079 8.3Michigan - - -Minnesota 8,709 689 7.9Mississippi 10,429 81 0.8Missouri 4,585 205 4.5Montana - - -Nebraska - - -Nevada 4,859 613 12.6New Hampshire 1,148 78 6.8New Jersey 6,698 479 7.2New Mexico 8,577 551 6.4New York - - -North Carolina - - -North Dakota - - -Ohio 24,897 1,208 4.9Oklahoma 14,457 696 4.8Oregon 11,070 1,179 10.7Pennsylvania - - -Puerto Rico - - -Rhode Island 3,095 330 10.7South Carolina 17,071 233 1.4South Dakota - - -Tennessee 8,983 319 3.6Texas 61,506 1,220 2.0Utah 9,947 255 2.6Vermont 878 25 2.8Virginia - - -Washington 4,386 496 11.3West Virginia - - -Wisconsin 4,902 374 7.6Wyoming - - -National 426,230 21,900 5.1Reporting States 36 36 -
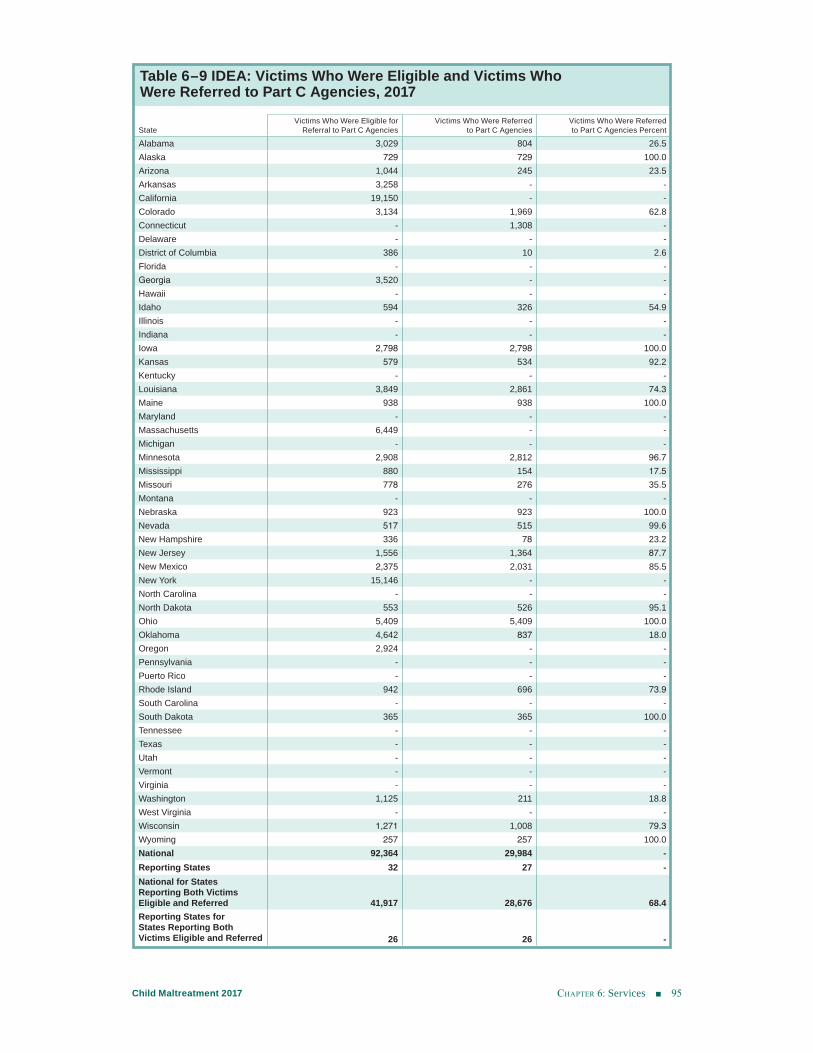
chApter 6: Services 95Child Maltreatment 2017
Table 6–9 IDEA: Victims Who Were Eligible and Victims Who Were Referred to Part C Agencies, 2017
StateVictims Who Were Eligible for
Referral to Part C AgenciesVictims Who Were Referred
to Part C Agencies Victims Who Were Referred to Part C Agencies Percent
Alabama 3,029 804 26.5Alaska 729 729 100.0Arizona 1,044 245 23.5Arkansas 3,258 - -California 19,150 - -Colorado 3,134 1,969 62.8Connecticut - 1,308 -Delaware - - -District of Columbia 386 10 2.6Florida - - -Georgia 3,520 - -Hawaii - - -Idaho 594 326 54.9Illinois - - -Indiana - - -Iowa 2,798 2,798 100.0Kansas 579 534 92.2Kentucky - - -Louisiana 3,849 2,861 74.3Maine 938 938 100.0Maryland - - -Massachusetts 6,449 - -Michigan - - -Minnesota 2,908 2,812 96.7Mississippi 880 154 17.5Missouri 778 276 35.5Montana - - -Nebraska 923 923 100.0Nevada 517 515 99.6New Hampshire 336 78 23.2New Jersey 1,556 1,364 87.7New Mexico 2,375 2,031 85.5New York 15,146 - -North Carolina - - -North Dakota 553 526 95.1Ohio 5,409 5,409 100.0Oklahoma 4,642 837 18.0Oregon 2,924 - -Pennsylvania - - -Puerto Rico - - -Rhode Island 942 696 73.9South Carolina - - -South Dakota 365 365 100.0Tennessee - - -Texas - - -Utah - - -Vermont - - -Virginia - - -Washington 1,125 211 18.8West Virginia - - -Wisconsin 1,271 1,008 79.3Wyoming 257 257 100.0National 92,364 29,984 -Reporting States 32 27 -National for States Reporting Both Victims Eligible and Referred 41,917 28,676 68.4Reporting States for States Reporting Both Victims Eligible and Referred 26 26 -
Appendixes
96Child Maltreatment 2017
Appendixes
CAPTA Data Items
The Child Abuse Prevention and Treatment Act (CAPTA), as amended by P.L. 111–320, the CAPTA Reauthorization Act of 2010, affirms, “Each State to which a grant is made under this section shall annually work with the Secretary to provide, to the maximum extent practicable, a report that includes the following:” 1) The number of children who were reported to the state during the year as victims
of child abuse or neglect. 2) Of the number of children described in paragraph (1), the number with respect to
whom such reports were— a) substantiated; b) unsubstantiated; or c) determined to be false.
3) Of the number of children described in paragraph (2)— a) the number that did not receive services during the year under the state
program funded under this section or an equivalent state program; b) the number that received services during the year under the state program
funded under this section or an equivalent state program; and c) the number that were removed from their families during the year by disposi-
tion of the case. 4) The number of families that received preventive services, including use of dif-
ferential response, from the state during the year. 5) The number of deaths in the state during the year resulting from child abuse or
neglect. 6) Of the number of children described in paragraph (5), the number of such
children who were in foster care. 7)
a) The number of child protective service personnel responsible for the— i.) intake of reports filed in the previous year; ii.) screening of such reports; iii.) assessment of such reports; and iv.) investigation of such reports.
b) The average caseload for the workers described in subparagraph (A). 8) The agency response time with respect to each such report with respect to initial
investigation of reports of child abuse or neglect.
APPENDIX A
Appendix A: CAPTA Data Items 97Child Maltreatment 2017
9) The response time with respect to the provision of services to families and children where an allegation of child abuse or neglect has been made.
10) For child protective service personnel responsible for intake, screening, assess-ment, and investigation of child abuse and neglect reports in the state— a) information on the education, qualifications, and training requirements
established by the state for child protective service professionals, including for entry and advancement in the profession, including advancement to supervisory positions;
b) data of the education, qualifications, and training of such personnel; c) demographic information of the child protective service personnel; and d) information on caseload or workload requirements for such personnel,
including requirements for average number and maximum number of cases per child protective service worker and supervisor.
11) The number of children reunited with their families or receiving family preserva-tion services that, within five years, result in subsequent substantiated reports of child abuse or neglect, including the death of the child.
12) The number of children for whom individuals were appointed by the court to represent the best interests of such children and the average number of out of court contacts between such individuals and children.
13) The annual report containing the summary of activities of the citizen review panels of the state required by subsection (c)(6).
14) The number of children under the care of the state child protection system who are transferred into the custody of the state juvenile justice system.
15) The number of children referred to a child protective services system under subsection (b)(2)(B)(ii).
16) The number of children determined to be eligible for referral, and the number of children referred, under subsection (b)(2)(B)(xxi), to agencies providing early intervention services under part C of the Individuals with Disabilities Education Act (20 U.S.C. 1431 et seq.).
17) The number of children determined to be victims described in subsection (b)(2)(B)(xxiv).
18) The number of infants— a) identified under subsection (b)(2)(B)(ii); b) for whom a plan of safe care was developed under subsection (b)(2)(B)
(iii); and c) for whom a referral was made for appropriate services, including
services for the affected family or caregiver, under subsection (b)(2)(B)(iii).
* The items listed under number (10), (13), and (14) are not collected by NCANDS. Items (17) and (18) in bold were enacted with the Justice for Victims of Trafficking Act of 2015 (P.L. 114–22) and The Comprehensive Addiction and Recovery Act (CARA) of 2016 (P.L. 114-198). It is anticipated that states will begin reporting these new items with FFY 2018 data.
Appendix A: CAPTA Data Items 98Child Maltreatment 2017
Glossary
AcronymsAFCARS: Adoption and Foster Care Analysis and Reporting SystemCAPTA: Child Abuse Prevention and Treatment ActCASA: Court-appointed special advocateCBCAP: Community-Based Child Abuse Prevention ProgramCFSR: Child and Family Services ReviewsCHILD ID: Child identifierCPS: Child protective servicesFFY: Federal fiscal yearFIPS: Federal information processing standardsFTE: Full-time equivalentGAL: Guardian ad litemIDEA: Individuals with Disabilities Education Act NCANDS: National Child Abuse and Neglect Data SystemNYTD: National Youth in Transition DatabaseMIECHV: Maternal, Infant, and Early Childhood Home Visiting ProgramOMB: Office of Management and Budget PERPETRATOR ID: Perpetrator identifier PSSF: Promoting Safe and Stable Families REPORT ID: Report identifierSACWIS: Statewide Automated Child Welfare Information SystemSDC: Summary data componentSSBG: Social Services Block GrantTANF: Temporary Assistance for Needy Families
APPENDIX B
Appendix B: Glossary 99Child Maltreatment 2017
Definitions
ADOPTION AND FOSTER CARE ANALYSIS AND REPORTING SYSTEM (AFCARS): The federal collection of case-level information on all children in foster care for whom state child welfare agencies have responsibility for placement, care, or supervision and on children who are adopted under the auspices of the state’s public child welfare agency. AFCARS also includes information on foster and adoptive parents.
ADOPTION SERVICES: Activities to assist with bringing about the adoption of a child.
ADOPTIVE PARENT: A person with the legal relation of parent to a child not related by birth, with the same mutual rights and obligations that exist between children and their birth parents. The legal relationship has been finalized.
AFCARS ID: The record number used in the AFCARS data submission or the value that would be assigned.
AGE: A number representing the years that the child or perpetrator had been alive at the time of the alleged maltreatment.
AGENCY FILE: A data file submitted by a state to NCANDS on an annual basis. The file contains supplemental aggregated child abuse and neglect data from such agencies as medi-cal examiners’ offices and non-CPS services providers.
ALCOHOL ABUSE: Compulsive use of alcohol that is not of a temporary nature. This term can be applied to a caregiver or a child. If applied to a child, it can include Fetal Alcohol Syndrome and exposure to alcohol during pregnancy.
ALLEGED PERPETRATOR: An individual who is named in a referral to have caused or knowingly allowed the maltreatment of a child.
ALLEGED MALTREATMENT: Suspected child abuse and neglect. In NCANDS, such suspicions are included in a referral to a CPS agency.
ALLEGED VICTIM: Child about whom a referral regarding maltreatment was made to a CPS agency.
ALLEGED VICTIM REPORT SOURCE: A child who alleges to have been a victim of child maltreatment and who makes a report of the allegation.
ALTERNATIVE RESPONSE: The provision of a response other than an investigation that determines a child or family is in need of services. A determination of maltreatment is not made and a perpetrator is not determined. States may report the disposition as alternative response victim or alternative response nonvictim, however, in this report the categories are combined.
Appendix B: Glossary 100Child Maltreatment 2017
AMERICAN INDIAN or ALASKA NATIVE: A person having origins in any of the origi-nal peoples of North and South America (including Central America), and who maintains tribal affiliation or com-munity attachment.
ANONYMOUS REPORT SOURCE: An individual who notifies a CPS agency of sus-pected child maltreatment without identifying himself or herself.
ASIAN: A person having origins in any of the original peoples of the Far East, Southeast Asia, or the Indian subcontinent, including, for example, Cambodia, China, India, Japan, Korea, Malaysia, Pakistan, the Philippine Islands, Thailand, and Vietnam.
ASSESSMENT: A process by which the CPS agency determines whether the child or other persons involved in the report of alleged maltreatment is in need of services. When used as an alternative to an investigation, it is a process designed to gain a greater understanding about family strengths, needs, and resources.
BEHAVIOR PROBLEM, CHILD: A child’s behavior in the school or community that adversely affects socialization, learning, growth, and moral development. May include adjudicated or nonadjudicated behavior problems such as running away from home or a placement.
BIOLOGICAL PARENT: The birth mother or father of the child.
BLACK or AFRICAN-AMERICAN: A person having origins in any of the black racial groups of Africa.
BOY: A male child younger than 18 years.
CAREGIVER: A person responsible for the care and supervision of a child.
CAREGIVER RISK FACTOR: A primary caregiver’s characteristic, disability, problem, or environment, which would tend to decrease the ability to provide adequate care for the child.
CASE-LEVEL DATA: States submit case-level data by constructing an electronic file of child-specific records for each report of alleged child abuse and neglect that received a CPS response. Only completed reports that resulted in a disposition (or finding) as an outcome of the CPS response during the reporting year, are submitted in each state’s data file. The data submission containing these case-level data is called the Child File.
CASELOAD: The number of CPS responses (cases) handled by workers.
CASE MANAGEMENT SERVICES: Activities for the arrangement, coordination, and monitoring of services to meet the needs of children and their families.
CHILD: A person who has not attained the lesser of (a) the age of 18 or (b) except in the case of sexual abuse, the age specified by the child protection law of the state in which the child resides.
Appendix B: Glossary 101Child Maltreatment 2017
CHILD ABUSE AND NEGLECT STATE GRANT: Funding to the states for programs serving abused and neglected children, awarded under the Child Abuse Prevention and Treatment Act (CAPTA). May be used to assist states with intake and assessment, screening and investigation of child abuse and neglect reports, improving risk and safety assessment protocols, training child protective service workers and mandated reporters, and improving services to disabled infants with life-threatening conditions.
CHILD ABUSE PREVENTION AND TREATMENT ACT (CAPTA) (42 U.S.C. 5101 et seq): The key federal legislation addressing child abuse and neglect, which was origi-nally enacted on January 31, 1974 (P.L. 93–247). CAPTA has been reauthorized and amended several times, most recently on December 20, 2010, by the CAPTA Reauthorization Act of 2010 (P.L. 111–320). CAPTA provides federal funding to states in support of prevention, assessment, investigation, prosecution, and treatment activities for child abuse and neglect. It also provides grants to public agencies and nonprofit organizations, including Tribes, for demonstration programs and projects; and the federal support for research, evaluation, technical assistance, and data collection activities.
CHILD AND FAMILY SERVICES REVIEWS: The 1994 Amendments to the Social Security Act (SSA) authorized the U.S. Department of Health and Human Services (HHS) to review state child and family service programs to ensure conformity with the requirements in titles IV–B and IV–E of the SSA. Under a final rule, which became effective March 25, 2000, states are assessed for substantial conformity with certain federal requirements for child protective, foster care, adoption, family preservation and family support, and indepen-dent living services.
CHILD DAYCARE PROVIDER: A person with a temporary caregiver responsibility, but who is not related to the child, such as a daycare center staff member, family provider, or babysitter. Does not include persons with legal custody or guardianship of the child.
CHILD DISPOSITION: A determination made by a social service agency that evidence is or is not sufficient under state law to conclude that maltreatment occurred. A disposition is applied to each child within a report.
CHILD DEATH REVIEW TEAM: A state or local team of professionals who review all or a sample of cases of children who are alleged to have died due to maltreatment or other causes.
CHILD FILE: A data file submitted by a state to NCANDS on the periodic basis. The file contains child-specific records for each report of alleged child abuse and neglect that received a CPS response. Only completed reports that resulted in a disposition (or finding) as an outcome of the CPS response during the reporting year, are submitted in each state’s data file.
CHILD IDENTIFIER (Child ID): A unique identification assigned to each child. This identification is not the state’s child identification but is an encrypted identification assigned by the state for the purposes of the NCANDS data collection.
CHILD MALTREATMENT: The Child Abuse Prevention and Treatment Act (CAPTA) definition of child abuse and neglect is, at a minimum: Any recent act or failure to act on the part of a parent or caretaker which results in death, serious physical or emotional harm,
Appendix B: Glossary 102Child Maltreatment 2017
sexual abuse or exploitation; or an act or failure to act, which presents an imminent risk of serious harm.
CHILD PROTECTIVE SERVICES AGENCY (CPS): An official agency of a state having the responsibility to receive and respond to allegations of suspected child abuse and neglect, determine the validity of the allegations, and provide services to protect and serve children and their families.
CHILD PROTECTIVE SERVICES (CPS) RESPONSE: CPS agencies conduct a response for all reports of child maltreatment. The response may be an investigation, which determines whether a child was maltreated or is at-risk of maltreatment and establishes if an intervention is needed. The majority of reports receive investigations. A small, but growing, number of reports receive an alternative response, which focuses primarily upon the needs of the family and usually does not include a determination regarding the alleged maltreatment(s).
CHILD PROTECTIVE SERVICES (CPS) SUPERVISOR: The manager of the case-worker assigned to a report of child maltreatment at the time of the report disposition.
CHILD PROTECTIVE SERVICES (CPS) WORKER: The person assigned to a report of child maltreatment at the time of the report disposition.
CHILD RECORD: A case-level record in the Child File containing the data associated with one child.
CHILD RISK FACTOR: A child’s characteristic, disability, problem, or environment that may affect the child’s safety.
CHILD VICTIM: A child for whom the state determined at least one maltreatment was substantiated or indicated. This includes a child who died of child abuse and neglect. This is a change from prior years when children with dispositions of alternative response victim were included as victims. It is important to note that a child may be a victim in one report and a nonvictim in another report.
CHILDREN’S BUREAU: The Children’s Bureau partners with federal, state, tribal, and local agencies to improve the overall health and well-being of our nation’s children and families. It is the federal agency responsible for the collection and analysis of NCANDS data.
CLOSED WITH NO FINDING: A disposition that does not conclude with a specific finding because the CPS response could not be completed.
COMMUNITY-BASED CHILD ABUSE PREVENTION PROGRAM (CBCAP): This program provides funding to states to develop, operate, expand, and enhance commu-nity-based, prevention-focused programs and activities designed to strengthen and support families to prevent child abuse and neglect. The program was reauthorized, amended, and renamed as part of the CAPTA amendments in 2010. To receive these funds, the Governor must designate a lead agency to receive the funds and implement the program.
Appendix B: Glossary 103Child Maltreatment 2017
COUNSELING SERVICES: Activities that apply the therapeutic processes to personal, family, situational, or occupational problems to bring about a positive resolution of the problem or improved individual or family functioning or circumstances.
COUNTY OF REPORT: The jurisdiction to which the report of alleged child maltreatment was assigned for a CPS response.
COUNTY OF RESIDENCE: The jurisdiction in which the child was residing at the time of the report of maltreatment.
COURT APPOINTED REPRESENTATIVE: A person appointed by the court to represent a child in an abuse and neglect proceeding and is often referred to as a guardian ad litem (GAL). The representative makes recommendations to the court concerning the best interests of the child.
COURT-APPOINTED SPECIAL ADVOCATE (CASA): Adult volunteers trained to advocate for abused and neglected children who are involved in the juvenile court.
COURT ACTION: Legal action initiated by a representative of the CPS agency on behalf of the child. This includes authorization to place the child in foster care, filing for temporary custody, dependency, or termination of parental rights. It does not include criminal proceed-ings against a perpetrator.
DAYCARE SERVICES: Activities provided to a child or children in a setting that meets applicable standards of state and local law, in a center or home, for a portion of a 24-hour day.
DISABILITY: A child is considered to have a disability if one of more of the following risk factors has been identified: child has a/an intellectual disability, emotional disturbance, visual or hearing impairment, learning disability, physical disability, behavior problem, or some other medical condition. In general, children with such conditions are undercounted as not every child receives a clinical diagnostic assessment.
DISPOSITION: A determination made by a social service agency that evidence is or is not sufficient under state law to conclude that maltreatment occurred. A disposition is applied to each alleged maltreatment in a report and to the report itself.
DOMESTIC VIOLENCE, CAREGIVER RISK FACTOR: Any abusive, violent, coercive, forceful, or threatening act or word inflicted by one member of a family or household on another. In NCANDS, the caregiver may be the perpetrator or the victim of the domestic violence.
DRUG ABUSE: The compulsive use of drugs that is not of a temporary nature. This term can be applied to a caregiver or a child. If applied to a child, it can include infants exposed to drugs during pregnancy.
DUPLICATE COUNT OF CHILDREN: Counting a child each time he or she was the subject of a report. This count also is called a report-child pair.
Appendix B: Glossary 104Child Maltreatment 2017
DUPLICATED COUNT OF PERPETRATORS: Counting a perpetrator each time the perpetrator is associated with maltreating a child. This also is known as a report-child-perpe-trator triad. For example, a perpetrator would be counted twice in all the following situations: (1) one child in two separate reports, (2) two children in a single report, and (3) two children in two separate reports.
EDUCATION AND TRAINING SERVICES: Services provided to improve knowledge or capacity of a given skill set, in a particular subject matter, or in personal or human develop-ment. Services may include instruction or training in, but are not limited to, such issues as consumer education, health education, community protection and safety education, literacy education, English as a second language, and General Educational Development (G.E.D.). Component services or activities may include screening, assessment, and testing; individual or group instruction; tutoring; provision of books, supplies and instructional material; counseling; transportation; and referral to community resources.
EDUCATION PERSONNEL: Employees of a public or private educational institution or program; includes teachers, teacher assistants, administrators, and others directly associated with the delivery of educational services.
EMOTIONAL DISTURBANCE: A clinically diagnosed condition exhibiting one or more of the following characteristics over a long period of time and to a marked degree: an inability to build or maintain satisfactory interpersonal relationships; inappropriate types of behavior or feelings under normal circumstances; a general pervasive mood of unhappiness or depression; or a tendency to develop physical symptoms or fears associated with personal problems. The diagnosis is based on the Diagnostic and Statistical Manual of Mental Disorders. This term includes schizophrenia and autism and can be applied to a child or a caregiver.
EMPLOYMENT SERVICES: Activities provided to assist individuals in securing employ-ment or the acquiring of skills that promote opportunities for employment.
FAMILY: A group of two or more persons related by birth, marriage, adoption, or emotional ties.
FAMILY PRESERVATION SERVICES: Activities designed to help families alleviate crises that might lead to out-of-home placement of children, maintain the safety of children in their own homes, support families to reunify or adopt, and assist families to obtain ser-vices and other supports in a culturally sensitive manner.
FAMILY SUPPORT SERVICES: Community-based services that assist and support parents in their role as caregivers. These services are designed to improve parental compe-tency and healthy child development by helping parents enhance their strengths and resolve problems that may lead to child maltreatment, developmental delays, and family disruption.
FATALITY: Death of a child as a result of abuse and neglect, because either an injury result-ing from the abuse and neglect was the cause of death, or abuse and neglect were contribut-ing factors to the cause of death.
Appendix B: Glossary 105Child Maltreatment 2017
FEDERAL FISCAL YEAR (FFY): The 12-month period from October 1 through September 30 used by the federal government. The fiscal year is designated by the calendar year in which it ends.
FEDERAL INFORMATION PROCESSING STANDARDS (FIPS): The federally defined set of county codes for all states.
FINDING: See DISPOSITION.
FETAL ALCOHOL SPECTRUM DISORDERS: Scientists define a broad range of effects and symptoms caused by prenatal alcohol exposure under the umbrella term Fetal Alcohol Spectrum Disorders (FASD). The medical disorders collectively labeled FASD include the Institute of Medicine of the National Academies (IOM) diagnostic categories of Fetal Alcohol Syndrome, Partial Fetal Alcohol Syndrome, Alcohol-Related Neurodevelopmental Disorder, and Alcohol-Related Birth Defects. The Diagnostic and Statistical Manual of Mental Disorders (DSM–5) also includes Neurobehavioral Disorder Associated with Prenatal Alcohol Exposure. https://www.niaaa.nih.gov/alcohol-health/fetal-alcohol-exposure
FINANCIAL PROBLEM: A risk factor related to the family’s inability to provide sufficient financial resources to meet minimum needs.
FOSTER CARE: Twenty-four-hour substitute care for children placed away from their parents or guardians and for whom the state agency has placement and care responsibility. This includes family foster homes, group homes, emergency shelters, residential facilities, childcare institutions, etc. The NCANDS category applies regardless of whether the facil-ity is licensed and whether payments are made by the state or local agency for the care of the child, or whether there is federal matching of any payments made. Foster care may be provided by those related or not related to the child. All children in care for more than 24 hours are counted.
FOSTER PARENT: Individual who provides a home for orphaned, abused, neglected, delinquent, or disabled children under the placement, care, or supervision of the state. The person may be a relative or nonrelative and need not be licensed by the state agency to be considered a foster parent.
FRIEND: A nonrelative acquainted with the child, the parent, or caregiver.
FULL-TIME EQUIVALENT: A computed statistic representing the number of full-time employees if the number of hours worked by part-time employees had been worked by full-time employees.
GIRL: A female child younger than 18 years.
GROUP HOME OR RESIDENTIAL CARE: A nonfamilial 24-hour care facility that may be supervised by the state agency or governed privately.
GROUP HOME STAFF: Employee of a nonfamilial 24-hour care facility.
GUARDIAN AD LITEM: See COURT-APPOINTED REPRESENTATIVE.
Appendix B: Glossary 106Child Maltreatment 2017
HEALTH-RELATED AND HOME HEALTH SERVICES: Activities provided to attain and maintain a favorable condition of health.
HISPANIC ETHNICITY: A person of Cuban, Mexican, Puerto Rican, South or Central American, or other Spanish culture or origin, regardless of race. See RACE.
HOME-BASED SERVICES: In-home activities provided to individuals or families to assist with household or personal care that improve or maintain family well-being. Includes homemaker, chore, home maintenance, and household management services.
HOUSING SERVICES: Activities designed to assist individuals or families to locate, obtain, or retain suitable housing.
IDEA: See Individuals with Disabilities Education Improvement Act.
INADEQUATE HOUSING: A risk factor related to substandard, overcrowded, or unsafe housing conditions, including homelessness.
INCIDENT DATE: The month, day, and year of the most recent, known incident of alleged child maltreatment.
INDEPENDENT AND TRANSITIONAL LIVING SERVICES: Activities designed to help older youth in foster care or homeless youth make the transition to independent living.
INDIVIDUALS WITH DISABILITIES EDUCATION IMPROVEMENT ACT: A law ensuring services to children with disabilities throughout the nation.
INFORMATION AND REFERRAL SERVICES: Resources or activities that provide facts about services that are available from public and private providers. The facts are provided after an assessment (not a clinical diagnosis or evaluation) of client needs.
INDICATED OR REASON TO SUSPECT: A disposition that concludes that maltreatment could not be substantiated under state law or policy, but there was a reason to suspect that at least one child may have been maltreated or was at-risk of maltreatment. This is applicable only to states that distinguish between substantiated and indicated dispositions.
IN-HOME SERVICES: Any service provided to the family while the child remains in the home. Services may be provided directly in the child’s home or a professional setting.
INTAKE: The activities associated with the receipt of a referral and the decision of whether to accept it for a CPS response.
INTELLECTUAL DISABILITY: A clinically diagnosed condition of reduced general cognitive and motor functioning existing concurrently with deficits in adaptive behavior that adversely affect socialization and learning. This term can be applied to a caregiver or a child.
INTENTIONALLY FALSE: The unsubstantiated disposition that indicates a conclusion that the person who made the allegation of maltreatment knew that the allegation was not true.
Appendix B: Glossary 107Child Maltreatment 2017
INVESTIGATION: A type of CPS response that involves the gathering of objective informa-tion to determine whether a child was maltreated or is at-risk of maltreatment and establishes if an intervention is needed. Generally, includes face-to-face contact with the alleged victim and results in a disposition as to whether the alleged maltreatment occurred.
INVESTIGATION START DATE: The date when CPS initially had face-to-face contact with the alleged victim. If this face-to-face contact is not possible, the date would be when CPS initially contacted any party who could provide information essential to the investiga-tion or assessment.
INVESTIGATION WORKER: A CPS agency person who performs either an investigation response or alternative response to determine whether the alleged victim(s) in the screened-in referral (report) was maltreated or is at-risk of maltreatment.
JUVENILE COURT PETITION: A legal document requesting that the court take action regarding the child’s status as a result of the CPS response; usually a petition requesting the child be declared a dependent and placed in an out-of-home setting.
LEARNING DISABILITY: A clinically diagnosed disorder in basic psychological processes involved with understanding or using language, spoken or written, that may manifest itself in an imperfect ability to listen, think, speak, read, write, spell or use mathematical calcula-tions. The term includes conditions such as perceptual disability, brain injury, minimal brain dysfunction, dyslexia, and developmental aphasia. This term can be applied to a caregiver or a child.
LEGAL GUARDIAN: Adult person who has been given legal custody and guardianship of a minor.
LEGAL AND LAW ENFORCEMENT PERSONNEL: People employed by a local, state, tribal, or federal justice agency. This includes police, courts, district attorney’s office, proba-tion or other community corrections agency, and correctional facilities.
LEGAL SERVICES: Activities provided by a lawyer, or other person(s) under the supervi-sion of a lawyer, to assist individuals in seeking or obtaining legal help in civil matters such as housing, divorce, child support, guardianship, paternity, and legal separation.
LEVEL OF EVIDENCE: The type of proof required by state statute to make a specific finding or disposition regarding an allegation of child abuse and neglect.
LIVING ARRANGEMENT: The environment in which a child was residing at the time of the alleged incident of maltreatment.
MALTREATMENT TYPE: A particular form of child maltreatment that received a CPS response. Types include medical neglect, neglect or deprivation of necessities, physical abuse, psychological or emotional maltreatment, sexual abuse, and other forms included in state law. NCANDS conducts analyses on maltreatments that received a disposition of substantiated or indicated.
Appendix B: Glossary 108Child Maltreatment 2017
MATERNAL, INFANT, AND EARLY CHILDHOOD HOME VISITING PROGRAM: The Patient Protection and Affordable Care Act of 2010 (P.L. 111–148) authorized the cre-ation of the Maternal, Infant, and Early Childhood Home Visiting program (MIECHV). The program facilitates collaboration and partnership at the federal, state, and community levels to improve health and development outcomes for at-risk children through evidence-based home visiting programs.
MEDICAL NEGLECT: A type of maltreatment caused by failure of the caregiver to provide for the appropriate health care of the child although financially able to do so, or offered financial or other resources to do so.
MEDICAL PERSONNEL: People employed by a medical facility or practice. This includes physicians, physician assistants, nurses, emergency medical technicians, dentists, chiroprac-tors, coroners, and dental assistants and technicians.
MENTAL HEALTH PERSONNEL: People employed by a mental health facility or prac-tice, including psychologists, psychiatrists, and therapists.
MENTAL HEALTH SERVICES: Activities that aim to overcome issues involving emo-tional disturbance or maladaptive behavior adversely affecting socialization, learning, or development. Usually provided by public or private mental health agencies and includes both residential and nonresidential activities.
MILITARY FAMILY MEMBER: A legal dependent of a person on active duty in the Armed Services of the United States such as the Army, Navy, Air Force, Marine Corps, or Coast Guard.
MILITARY MEMBER: A person on active duty in the Armed Services of the United States such as the Army, Navy, Air Force, Marine Corps, or Coast Guard.
NATIONAL CHILD ABUSE AND NEGLECT DATA SYSTEM (NCANDS): A national data collection system of child abuse and neglect data from CPS agencies. Contains case-level and aggregate data.
NATIONAL YOUTH IN TRANSITION DATABASE (NYTD): Public Law 106–169 estab-lished the John H. Chafee Foster Care Independence Program (CFCIP), which provides states with flexible funding to assist youth with transitioning from foster care to self-sufficiency. The law required a data collection system to track the independent living services states provide to youth and outcome measures to assess states’ performance in operating their inde-pendent living programs. The National Youth in Transition Database (NYTD) requires states engage in two data collection activities: (1) to collect information on each youth who receives independent living services paid for or provided by the state agency that administers the CFCIP; and (2) to collect demographic and outcome information on certain youth in foster care whom the state will follow over time to collect additional outcome information. States begin collecting data for NYTD on October 1, 2010 and report data to ACF semiannually.
NEGLECT OR DEPRIVATION OF NECESSITIES: A type of maltreatment that refers to the failure by the caregiver to provide needed, age-appropriate care although financially able to do so or offered financial or other means to do so.
Appendix B: Glossary 109Child Maltreatment 2017
NEIGHBOR: A person living in close geographical proximity to the child or family.
NO ALLEGED MALTREATMENT: A child who received a CPS response, but was not the subject of an allegation or any finding of maltreatment. Some states have laws requiring all children in a household receive a CPS response, if any child in the household is the subject of a CPS response.
NONCAREGIVER: A person who is not responsible for the care and supervision of the child, including school personnel, friends, and neighbors.
NONPARENT: A person in a caregiver role other than an adoptive parent, biological parent, or stepparent.
NONVICTIM: A child with a maltreatment disposition of alternative response nonvictim, alternative response victim, unsubstantiated, closed with no finding, no alleged maltreatment, other, and unknown.
NONPROFESSIONAL REPORT SOURCE: Persons who did not have a relationship with the child based on their occupation, such as friends, relatives, and neighbors. State laws vary as to whether nonprofessionals are required to report suspected abuse and neglect.
OFFICE OF MANAGEMENT AND BUDGET (OMB): The office assists the President of the United States with overseeing the preparation of the federal budget and supervising its administration in Executive Branch agencies. It evaluates the effectiveness of agency programs, policies, and procedures, assesses competing funding demands among agencies, and sets funding priorities.
OTHER: The state coding for this field is not one of the codes in the NCANDS record layout.
OTHER RELATIVE: A nonparental family member.
OTHER MEDICAL CONDITION: A type of disability other than one of those defined in NCANDS (behavior problem, emotional disturbance, learning disability, intellectual disability, physically disabled, and visually or hearing impaired). The not otherwise classi-fied disability must affect functioning or development or require special medical care (e.g., chronic illnesses). This term may be applied to a caregiver or a child.
OUT-OF-COURT CONTACT: A meeting, which is not part of the actual judicial hearing, between the court-appointed representative and the child victim. Such contacts enable the court-appointed representative to obtain a first-hand understanding of the situation and needs of the child victim and to make recommendations to the court concerning the best interests of the child.
PACIFIC ISLANDER: A person having origins in any of the original peoples of Hawaii, Guam, Samoa, or other Pacific Islands.
PARENT: The birth mother or father, adoptive mother or father, or stepmother or stepfather of the child victim.
Appendix B: Glossary 110Child Maltreatment 2017
PART C: A section in the Individuals with Disabilities Education Improvement Act of 2004 (IDEA) for infants and toddlers younger than 3 years with disabilities.
PERPETRATOR: The person who has been determined to have caused or knowingly allowed the maltreatment of a child.
PERPETRATOR AGE: Age of an individual determined to have caused or knowingly allowed the maltreatment of a child. Age is calculated in years at the time of the report of child maltreatment.
PERPETRATOR AS CAREGIVER: Circumstances whereby the person who caused or knowingly allowed child maltreatment to occur was also responsible for care and supervision of the victim when the maltreatment occurred.
PERPETRATOR IDENTIFIER (Perpetrator ID): A unique, encrypted identification assigned to each perpetrator by the state for the purposes of the NCANDS data collection.
PERPETRATOR RELATIONSHIP: Primary role of the perpetrator to a child victim.
PETITION DATE: The month, day, and year that a juvenile court petition was filed.
PHYSICAL ABUSE: Type of maltreatment that refers to physical acts that caused or could have caused physical injury to a child.
PHYSICAL DISABILITY: A clinically diagnosed physical condition that adversely affects day-to-day motor functioning, such as cerebral palsy, spina bifida, multiple sclerosis, ortho-pedic impairments, and other physical disabilities. This term can be applied to a caregiver or a child.
POSTRESPONSE SERVICES (also known as Postinvestigation Services): Activities provided or arranged by the child protective services agency, social services agency, or the child welfare agency for the child or family as a result of needs discovered during an investigation. Includes such services as family preservation, family support, and foster care. Postresponse services are delivered within the first 90 days after the disposition of the report.
PREVENTION SERVICES: Activities aimed at preventing child abuse and neglect. Such activities may be directed at specific populations identified as being at increased risk of becoming abusive and maybe designed to increase the strength and stability of families, to increase parents’ confidence and competence in their parenting abilities, and to afford children a stable and supportive environment. They include child abuse and neglect preven-tive services provided through federal, state, and local funds. These prevention activities do not include public awareness campaigns.
PRIOR CHILD VICTIM: A child victim with previous substantiated or indicated reports of maltreatment.
Appendix B: Glossary 111Child Maltreatment 2017
PRIOR PERPETRATOR: A perpetrator with a previous determination in the state’s information system that he or she had caused or knowingly allowed child maltreatment to occur. “Previous” is defined as a determination that took place prior to the disposition date of the report being included in the dataset.
PROFESSIONAL REPORT SOURCE: Persons who encountered the child as part of their occupation, such as child daycare providers, educators, legal law enforcement personnel, and medical personnel. State laws require most professionals to notify CPS agencies of suspected maltreatment.
PROMOTING SAFE AND STABLE FAMILIES PROGRAM: Program that provides grants to the states under Section 430, title IV–B, subpart 2 of the Social Security Act, as amended, to develop and expand four types of services—community-based family support services; innovative child welfare services, including family preservation services; time-limited reunification services; and adoption promotion and support services.
PSYCHOLOGICAL OR EMOTIONAL MALTREATMENT: Acts or omissions—other than physical abuse or sexual abuse—that caused or could have caused—conduct, cognitive, affective, or other behavioral or mental disorders. Frequently occurs as verbal abuse or exces-sive demands on a child’s performance.
PUBLIC ASSISTANCE: A risk factor related the family’s participation in social services programs, including Temporary Assistance for Needy Families; General Assistance; Medicaid; Social Security Income; Special Supplemental Nutrition Program for Women, Infants, and Children (WIC); etc.
RACE: The primary taxonomic category of which the individual identifies himself or herself as a member, or of which the parent identifies the child as a member. See AMERICAN INDIAN OR ALASKA NATIVE, ASIAN, BLACK OR AFRICAN-AMERICAN, PACIFIC ISLANDER, WHITE, and UNKNOWN. Also, see HISPANIC.
RECEIPT OF REPORT: The log-in of a referral to the agency alleging child maltreatment.
REFERRAL: Notification to the CPS agency of suspected child maltreatment. This can include more than one child.
RELATIVE: A person connected to the child by adoption, blood, or marriage.
REMOVAL DATE: The month, day, and year that the child was removed from his or her normal place of residence to a substitute care setting by a CPS agency during or as a result of the CPS response. If a child has been removed more than once, the removal date is the first removal resulting from the CPS response.
REMOVED FROM HOME: The CPS removal of the child from his or her normal place of residence to a foster care setting.
REPORT: A screened-in referral alleging child maltreatment. A report receives a CPS response in the form of an investigation response or an alternative response.
Appendix B: Glossary 112Child Maltreatment 2017
REPORT-CHILD PAIR: Refers to the concatenation of the Report ID and the Child ID, which together form a new unique ID that represents a single unique record in the case-level Child File.
REPORT DATE: The day, month, and year that the responsible agency was notified of the suspected child maltreatment.
REPORT DISPOSITION: The point in time at the end of the investigation or assessment when a CPS worker makes a final determination (disposition) about whether the alleged maltreatment occurred.
REPORT DISPOSITION DATE: The day, month, and year that the report disposition was made.
REPORT IDENTIFIER (Report ID): A unique identification assigned to each report of child maltreatment for the purposes of the NCANDS data collection.
REPORT SOURCE: The category or role of the person who notifies a CPS agency of alleged child maltreatment.
REPORTING PERIOD: The 12-month period for which data are submitted to the NCANDS.
RESIDENTIAL FACILITY STAFF: Employees of a public or private group residential facility, including emergency shelters, group homes, and institutions.
RESPONSE TIME FROM REFERRAL TO INVESTIGATION OR ALTERNATIVE RESPONSE: The response time is defined as the time between the receipt of a call to the state or local agency alleging maltreatment and face-to-face contact with the alleged victim, wherever this is appropriate, or with another person who can provide information on the allegation(s).
RESPONSE TIME FROM REFERRAL TO THE PROVISION OF SERVICES: The time from the receipt of a referral to the state or local agency alleging child maltreatment to the provision of post response services, often requiring the opening of a case for ongoing services.
RISK FACTOR: See CAREGIVER RISK FACTOR and CHILD RISK FACTOR.
SACWIS: See STATEWIDE AUTOMATED CHILD WELFARE INFORMATION SYSTEM (SACWIS).
SCREENED-IN REFERRAL: An allegation of child maltreatment that met the state’s standards for acceptance and became a report.
SCREENED-OUT REFERRAL: An allegation of child maltreatment that did not meet the state’s standards for acceptance as a report.
Appendix B: Glossary 113Child Maltreatment 2017
SCREENING: Agency hotline or intake units conduct the screening process to determine whether a referral is appropriate for further action. Referrals that do not meet agency criteria are screened out or diverted from CPS to other community agencies. In most states, a referral may include more than one child.
SERVICE DATE: The date activities began as a result of needs discovered during the CPS response.
SERVICES: See POSTRESPONSE SERVICES and PREVENTION SERVICES.
SEXUAL ABUSE: A type of maltreatment that refers to the involvement of the child in sexual activity to provide sexual gratification or financial benefit to the perpetrator, including contacts for sexual purposes, molestation, statutory rape, prostitution, pornography, expo-sure, incest, or other sexually exploitative activities.
SOCIAL SERVICES BLOCK GRANT (SSBG): Funds provided by title XX of the Social Security Act that are used for services to the states that may include child protection, child and foster care services, and daycare.
SOCIAL SERVICES PERSONNEL: Employees of a public or private social services or social welfare agency, or other social worker or counselor who provides similar services.
STATE: In NCANDS, the primary unit from which child maltreatment data are collected. This includes all 50 states, the Commonwealth of Puerto Rico, and the District of Columbia.
STATE ADVISORY GROUP: NCANDS state contact persons, comprised of state CPS pro-gram administrators and information systems managers, who assist with the identification and resolution of issues related to CPS data. The group suggests strategies for improving the quality of data submitted by states to NCANDS and reviews proposed NCANDS modifications.
STATE CONTACT PERSON: The state person with the responsibility to provide informa-tion to the NCANDS.
STATEWIDE AUTOMATED CHILD WELFARE INFORMATION SYSTEM (SACWIS): Any of a variety of automated systems designed to process child welfare information.
STEPPARENT: The husband or wife, by a subsequent marriage, of the child’s mother or father.
SUBSTANCE ABUSE SERVICES: Activities designed to deter, reduce, or eliminate substance abuse or chemical dependency.
SUBSTANTIATED: An investigation disposition that concludes that the allegation of maltreatment or risk of maltreatment was supported or founded by state law or policy.
SUMMARY DATA COMPONENT (SDC): The aggregate data collection form submitted by states that do not submit the Child File. This form was discontinued for the FFY 2012 data collection.
Appendix B: Glossary 114Child Maltreatment 2017
TEMPORARY ASSISTANCE FOR NEEDY FAMILIES (TANF): A block grant that is administered by state, territorial, and tribal agencies. Citizens can apply for TANF at the respective agency administering the program in their community.
UNIQUE COUNT OF CHILDREN: Counting a child once, regardless of the number of reports concerning that child, who received a CPS response in the FFY.
UNIQUE COUNT OF PERPETRATORS: Counting a perpetrator once, regardless of the number of children the perpetrator is associated with maltreating or the number of records associated with a perpetrator.
UNKNOWN: The state may collect data on this variable, but the data for this particular report or child were not captured or are missing.
UNMARRIED PARTNER OF PARENT: Someone who has an intimate relationship with the parent and lives in the household with the parent of the maltreated child.
UNSUBSTANTIATED: An investigation disposition that determines that there was not sufficient evidence under state law to conclude or suspect that the child was maltreated or at-risk of being maltreated.
VISUAL OR HEARING IMPAIRMENT: A clinically diagnosed condition related to a visual impairment or permanent or fluctuating hearing or speech impairment that may affect functioning or development. This term can be applied to a caregiver or a child.
VICTIM: A child for whom the state determined at least one maltreatment was substantiated or indicated; and a disposition of substantiated or indicated was assigned for a child in a specific report. This includes a child who died and the death was confirmed to be the result of child abuse and neglect. A child may be a victim in one report and a nonvictim in another report.
WHITE: A person having origins in any of the original peoples of Europe, the Middle East, or North Africa.
WORKER IDENTIFIER: A unique identification of the worker who is assigned to the child at the time of the report disposition.
WORKFORCE: Total number of workers in a CPS agency.
Appendix B: Glossary 115Child Maltreatment 2017
State Characteristics
Administrative StructureStates vary in how they administer and deliver child welfare services. Forty states (including the District of Columbia and the Commonwealth of Puerto Rico) have a centralized system classified as state administered. Ten states are classified as state supervised, county admin-istered; and two states are classified as “hybrid” meaning they are partially administered by the state and partially administered by counties. Each state’s administrative structure (as submitted by the state as part of commentary in change to Appendix D, State Commentary) is provided in table C–1.
Level of EvidenceStates use a certain level of evidence to determine whether maltreatment occurred or the child is at-risk of maltreatment. Level of evidence is defined as the proof required to make a specific finding or disposition regarding an allegation of child abuse and neglect. Each state’s level of evidence (as submitted by each state as part of commentary in appendix D) is provided in table C–1.
Data SubmissionsStates submit case-level data by constructing an electronic file of child-specific records for each report of alleged child abuse and neglect that received a CPS response. Each state’s submission includes only completed reports that resulted in a disposition (or finding) as an outcome of the CPS response during the reporting year. The data submission containing these case-level data is called the Child File.
The Child File is supplemented by agency-level aggregate statistics in a separate data submis-sion called the Agency File. The Agency File contains data that are not reportable at the child-specific level and often gathered from agencies external to CPS. States are asked to submit both the Child File and the Agency File each year. For FFY 2017, 52 states submitted both a Child File and an Agency File.
Once validated, the Child Files and Agency Files are loaded into the multiyear, multistate NCANDS Data warehouse, the NCANDS DW. The FFY 2017 flat file dataset is available to researchers from the National Data Archive on Child Abuse and neglect (NDACAN).
APPENDIX C
Appendix C: State Characteristics 116Child Maltreatment 2017
Child Population DataThe child population data for years 2013–2017 are displayed by state in table C–2. The 2017 child population data for the demographics of age, sex, and race and ethnicity are displayed by state in table C–3. The adult population is displayed in table C–4.
Appendix C: State Characteristics 117Child Maltreatment 2017
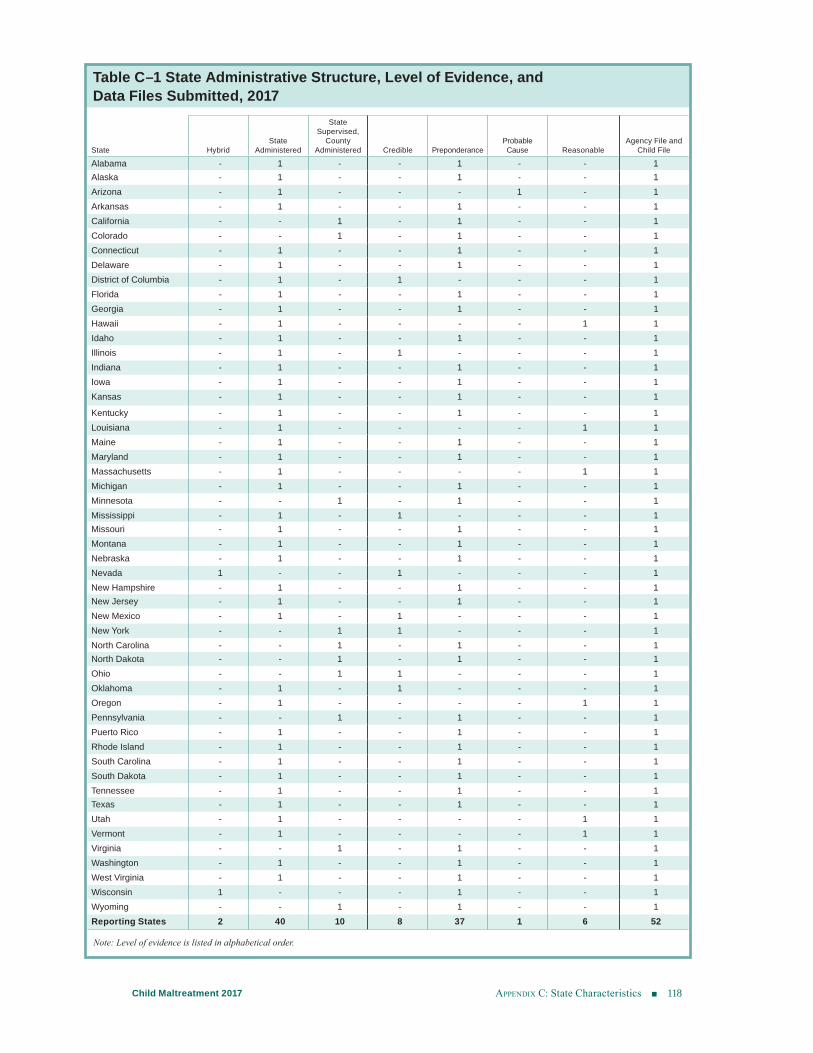
Table C–1 State Administrative Structure, Level of Evidence, and Data Files Submitted, 2017
State HybridState
Administered
State Supervised,
County Administered Credible Preponderance
Probable Cause Reasonable
Agency File and Child File
Alabama - 1 - - 1 - - 1Alaska - 1 - - 1 - - 1Arizona - 1 - - - 1 - 1Arkansas - 1 - - 1 - - 1California - - 1 - 1 - - 1Colorado - - 1 - 1 - - 1Connecticut - 1 - - 1 - - 1Delaware - 1 - - 1 - - 1District of Columbia - 1 - 1 - - - 1Florida - 1 - - 1 - - 1Georgia - 1 - - 1 - - 1Hawaii - 1 - - - - 1 1Idaho - 1 - - 1 - - 1Illinois - 1 - 1 - - - 1Indiana - 1 - - 1 - - 1Iowa - 1 - - 1 - - 1Kansas - 1 - - 1 - - 1
Kentucky - 1 - - 1 - - 1Louisiana - 1 - - - - 1 1Maine - 1 - - 1 - - 1Maryland - 1 - - 1 - - 1Massachusetts - 1 - - - - 1 1Michigan - 1 - - 1 - - 1Minnesota - - 1 - 1 - - 1Mississippi - 1 - 1 - - - 1Missouri - 1 - - 1 - - 1Montana - 1 - - 1 - - 1Nebraska - 1 - - 1 - - 1Nevada 1 - - 1 - - - 1New Hampshire - 1 - - 1 - - 1New Jersey - 1 - - 1 - - 1New Mexico - 1 - 1 - - - 1New York - - 1 1 - - - 1North Carolina - - 1 - 1 - - 1North Dakota - - 1 - 1 - - 1Ohio - - 1 1 - - - 1Oklahoma - 1 - 1 - - - 1Oregon - 1 - - - - 1 1Pennsylvania - - 1 - 1 - - 1Puerto Rico - 1 - - 1 - - 1Rhode Island - 1 - - 1 - - 1South Carolina - 1 - - 1 - - 1South Dakota - 1 - - 1 - - 1Tennessee - 1 - - 1 - - 1Texas - 1 - - 1 - - 1Utah - 1 - - - - 1 1Vermont - 1 - - - - 1 1Virginia - - 1 - 1 - - 1Washington - 1 - - 1 - - 1West Virginia - 1 - - 1 - - 1Wisconsin 1 - - - 1 - - 1Wyoming - - 1 - 1 - - 1Reporting States 2 40 10 8 37 1 6 52
Note: Level of evidence is listed in alphabetical order.
Appendix C: State Characteristics 118Child Maltreatment 2017
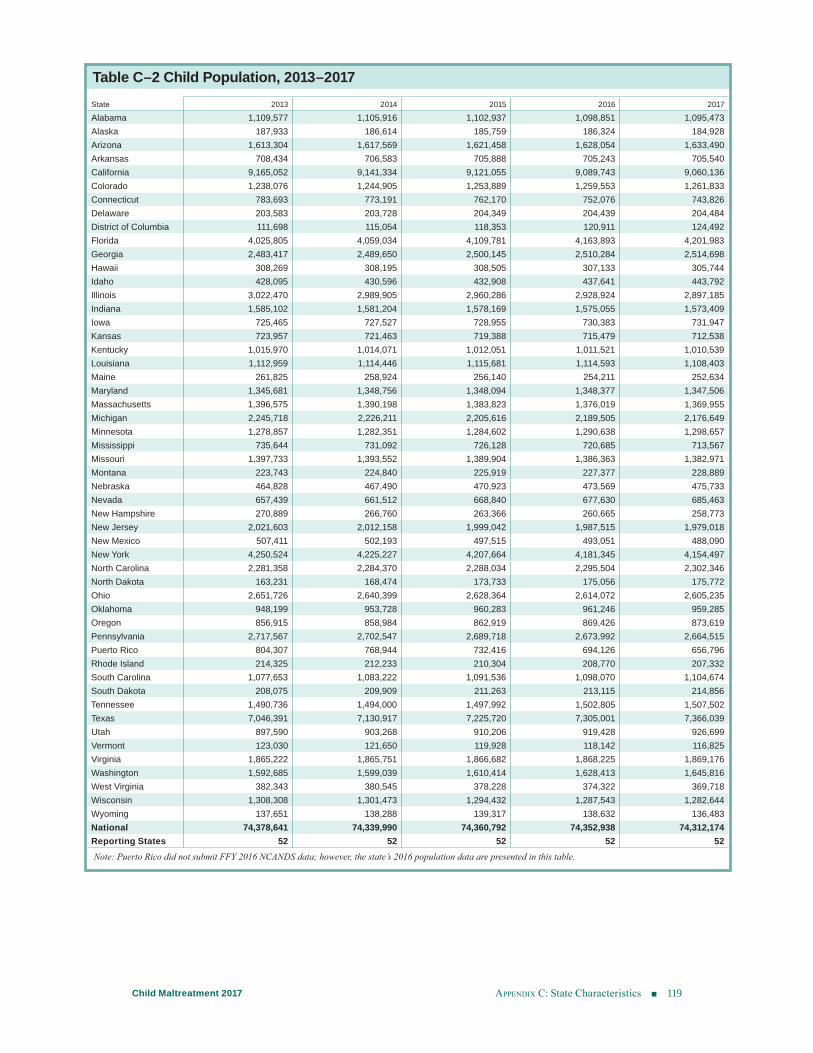
Table C–2 Child Population, 2013–2017 State 2013 2014 2015 2016 2017
Alabama 1,109,577 1,105,916 1,102,937 1,098,851 1,095,473Alaska 187,933 186,614 185,759 186,324 184,928Arizona 1,613,304 1,617,569 1,621,458 1,628,054 1,633,490Arkansas 708,434 706,583 705,888 705,243 705,540California 9,165,052 9,141,334 9,121,055 9,089,743 9,060,136Colorado 1,238,076 1,244,905 1,253,889 1,259,553 1,261,833Connecticut 783,693 773,191 762,170 752,076 743,826Delaware 203,583 203,728 204,349 204,439 204,484District of Columbia 111,698 115,054 118,353 120,911 124,492Florida 4,025,805 4,059,034 4,109,781 4,163,893 4,201,983Georgia 2,483,417 2,489,650 2,500,145 2,510,284 2,514,698Hawaii 308,269 308,195 308,505 307,133 305,744Idaho 428,095 430,596 432,908 437,641 443,792Illinois 3,022,470 2,989,905 2,960,286 2,928,924 2,897,185Indiana 1,585,102 1,581,204 1,578,169 1,575,055 1,573,409Iowa 725,465 727,527 728,955 730,383 731,947Kansas 723,957 721,463 719,388 715,479 712,538Kentucky 1,015,970 1,014,071 1,012,051 1,011,521 1,010,539Louisiana 1,112,959 1,114,446 1,115,681 1,114,593 1,108,403Maine 261,825 258,924 256,140 254,211 252,634Maryland 1,345,681 1,348,756 1,348,094 1,348,377 1,347,506Massachusetts 1,396,575 1,390,198 1,383,823 1,376,019 1,369,955Michigan 2,245,718 2,226,211 2,205,616 2,189,505 2,176,649Minnesota 1,278,857 1,282,351 1,284,602 1,290,638 1,298,657Mississippi 735,644 731,092 726,128 720,685 713,567Missouri 1,397,733 1,393,552 1,389,904 1,386,363 1,382,971Montana 223,743 224,840 225,919 227,377 228,889Nebraska 464,828 467,490 470,923 473,569 475,733Nevada 657,439 661,512 668,840 677,630 685,463New Hampshire 270,889 266,760 263,366 260,665 258,773New Jersey 2,021,603 2,012,158 1,999,042 1,987,515 1,979,018New Mexico 507,411 502,193 497,515 493,051 488,090New York 4,250,524 4,225,227 4,207,664 4,181,345 4,154,497North Carolina 2,281,358 2,284,370 2,288,034 2,295,504 2,302,346North Dakota 163,231 168,474 173,733 175,056 175,772Ohio 2,651,726 2,640,399 2,628,364 2,614,072 2,605,235Oklahoma 948,199 953,728 960,283 961,246 959,285Oregon 856,915 858,984 862,919 869,426 873,619Pennsylvania 2,717,567 2,702,547 2,689,718 2,673,992 2,664,515Puerto Rico 804,307 768,944 732,416 694,126 656,796Rhode Island 214,325 212,233 210,304 208,770 207,332South Carolina 1,077,653 1,083,222 1,091,536 1,098,070 1,104,674South Dakota 208,075 209,909 211,263 213,115 214,856Tennessee 1,490,736 1,494,000 1,497,992 1,502,805 1,507,502Texas 7,046,391 7,130,917 7,225,720 7,305,001 7,366,039Utah 897,590 903,268 910,206 919,428 926,699Vermont 123,030 121,650 119,928 118,142 116,825Virginia 1,865,222 1,865,751 1,866,682 1,868,225 1,869,176Washington 1,592,685 1,599,039 1,610,414 1,628,413 1,645,816West Virginia 382,343 380,545 378,228 374,322 369,718Wisconsin 1,308,308 1,301,473 1,294,432 1,287,543 1,282,644Wyoming 137,651 138,288 139,317 138,632 136,483National 74,378,641 74,339,990 74,360,792 74,352,938 74,312,174Reporting States 52 52 52 52 52Note: Puerto Rico did not submit FFY 2016 NCANDS data; however, the state’s 2016 population data are presented in this table.
Appendix C: State Characteristics 119Child Maltreatment 2017
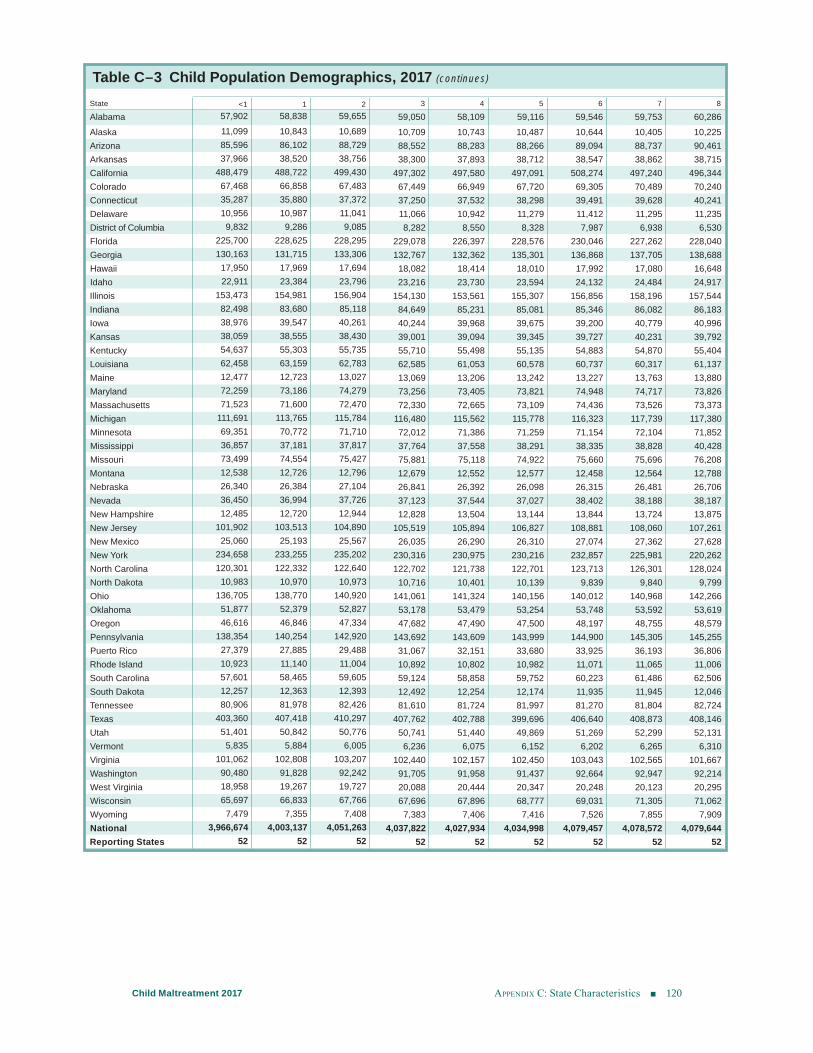
Table C–3 Child Population Demographics, 2017 (continues)
State <1 1 2 3 4 5 6 7 8
Alabama 57,902 58,838 59,655 59,050 58,109 59,116 59,546 59,753 60,286Alaska 11,099 10,843 10,689 10,709 10,743 10,487 10,644 10,405 10,225Arizona 85,596 86,102 88,729 88,552 88,283 88,266 89,094 88,737 90,461Arkansas 37,966 38,520 38,756 38,300 37,893 38,712 38,547 38,862 38,715California 488,479 488,722 499,430 497,302 497,580 497,091 508,274 497,240 496,344Colorado 67,468 66,858 67,483 67,449 66,949 67,720 69,305 70,489 70,240Connecticut 35,287 35,880 37,372 37,250 37,532 38,298 39,491 39,628 40,241Delaware 10,956 10,987 11,041 11,066 10,942 11,279 11,412 11,295 11,235District of Columbia 9,832 9,286 9,085 8,282 8,550 8,328 7,987 6,938 6,530Florida 225,700 228,625 228,295 229,078 226,397 228,576 230,046 227,262 228,040Georgia 130,163 131,715 133,306 132,767 132,362 135,301 136,868 137,705 138,688Hawaii 17,950 17,969 17,694 18,082 18,414 18,010 17,992 17,080 16,648Idaho 22,911 23,384 23,796 23,216 23,730 23,594 24,132 24,484 24,917Illinois 153,473 154,981 156,904 154,130 153,561 155,307 156,856 158,196 157,544Indiana 82,498 83,680 85,118 84,649 85,231 85,081 85,346 86,082 86,183Iowa 38,976 39,547 40,261 40,244 39,968 39,675 39,200 40,779 40,996Kansas 38,059 38,555 38,430 39,001 39,094 39,345 39,727 40,231 39,792Kentucky 54,637 55,303 55,735 55,710 55,498 55,135 54,883 54,870 55,404Louisiana 62,458 63,159 62,783 62,585 61,053 60,578 60,737 60,317 61,137Maine 12,477 12,723 13,027 13,069 13,206 13,242 13,227 13,763 13,880Maryland 72,259 73,186 74,279 73,256 73,405 73,821 74,948 74,717 73,826Massachusetts 71,523 71,600 72,470 72,330 72,665 73,109 74,436 73,526 73,373Michigan 111,691 113,765 115,784 116,480 115,562 115,778 116,323 117,739 117,380Minnesota 69,351 70,772 71,710 72,012 71,386 71,259 71,154 72,104 71,852Mississippi 36,857 37,181 37,817 37,764 37,558 38,291 38,335 38,828 40,428Missouri 73,499 74,554 75,427 75,881 75,118 74,922 75,660 75,696 76,208Montana 12,538 12,726 12,796 12,679 12,552 12,577 12,458 12,564 12,788Nebraska 26,340 26,384 27,104 26,841 26,392 26,098 26,315 26,481 26,706Nevada 36,450 36,994 37,726 37,123 37,544 37,027 38,402 38,188 38,187New Hampshire 12,485 12,720 12,944 12,828 13,504 13,144 13,844 13,724 13,875New Jersey 101,902 103,513 104,890 105,519 105,894 106,827 108,881 108,060 107,261New Mexico 25,060 25,193 25,567 26,035 26,290 26,310 27,074 27,362 27,628New York 234,658 233,255 235,202 230,316 230,975 230,216 232,857 225,981 220,262North Carolina 120,301 122,332 122,640 122,702 121,738 122,701 123,713 126,301 128,024North Dakota 10,983 10,970 10,973 10,716 10,401 10,139 9,839 9,840 9,799Ohio 136,705 138,770 140,920 141,061 141,324 140,156 140,012 140,968 142,266Oklahoma 51,877 52,379 52,827 53,178 53,479 53,254 53,748 53,592 53,619Oregon 46,616 46,846 47,334 47,682 47,490 47,500 48,197 48,755 48,579Pennsylvania 138,354 140,254 142,920 143,692 143,609 143,999 144,900 145,305 145,255Puerto Rico 27,379 27,885 29,488 31,067 32,151 33,680 33,925 36,193 36,806Rhode Island 10,923 11,140 11,004 10,892 10,802 10,982 11,071 11,065 11,006South Carolina 57,601 58,465 59,605 59,124 58,858 59,752 60,223 61,486 62,506South Dakota 12,257 12,363 12,393 12,492 12,254 12,174 11,935 11,945 12,046Tennessee 80,906 81,978 82,426 81,610 81,724 81,997 81,270 81,804 82,724Texas 403,360 407,418 410,297 407,762 402,788 399,696 406,640 408,873 408,146Utah 51,401 50,842 50,776 50,741 51,440 49,869 51,269 52,299 52,131Vermont 5,835 5,884 6,005 6,236 6,075 6,152 6,202 6,265 6,310Virginia 101,062 102,808 103,207 102,440 102,157 102,450 103,043 102,565 101,667Washington 90,480 91,828 92,242 91,705 91,958 91,437 92,664 92,947 92,214West Virginia 18,958 19,267 19,727 20,088 20,444 20,347 20,248 20,123 20,295Wisconsin 65,697 66,833 67,766 67,696 67,896 68,777 69,031 71,305 71,062Wyoming 7,479 7,355 7,408 7,383 7,406 7,416 7,526 7,855 7,909National 3,966,674 4,003,137 4,051,263 4,037,822 4,027,934 4,034,998 4,079,457 4,078,572 4,079,644Reporting States 52 52 52 52 52 52 52 52 52
Appendix C: State Characteristics 120Child Maltreatment 2017
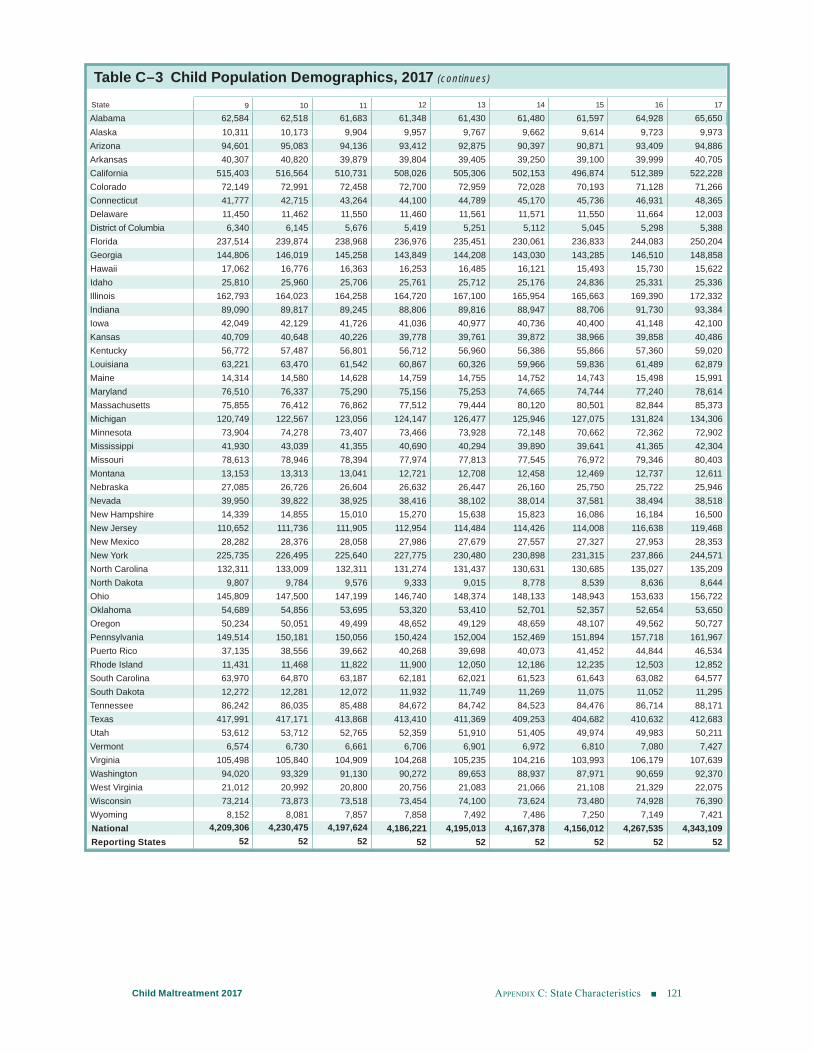
Table C–3 Child Population Demographics, 2017 (continues)
State 9 10 11 12 13 14 15 16 17
Alabama 62,584 62,518 61,683 61,348 61,430 61,480 61,597 64,928 65,650Alaska 10,311 10,173 9,904 9,957 9,767 9,662 9,614 9,723 9,973Arizona 94,601 95,083 94,136 93,412 92,875 90,397 90,871 93,409 94,886Arkansas 40,307 40,820 39,879 39,804 39,405 39,250 39,100 39,999 40,705California 515,403 516,564 510,731 508,026 505,306 502,153 496,874 512,389 522,228Colorado 72,149 72,991 72,458 72,700 72,959 72,028 70,193 71,128 71,266Connecticut 41,777 42,715 43,264 44,100 44,789 45,170 45,736 46,931 48,365Delaware 11,450 11,462 11,550 11,460 11,561 11,571 11,550 11,664 12,003District of Columbia 6,340 6,145 5,676 5,419 5,251 5,112 5,045 5,298 5,388Florida 237,514 239,874 238,968 236,976 235,451 230,061 236,833 244,083 250,204Georgia 144,806 146,019 145,258 143,849 144,208 143,030 143,285 146,510 148,858Hawaii 17,062 16,776 16,363 16,253 16,485 16,121 15,493 15,730 15,622Idaho 25,810 25,960 25,706 25,761 25,712 25,176 24,836 25,331 25,336Illinois 162,793 164,023 164,258 164,720 167,100 165,954 165,663 169,390 172,332Indiana 89,090 89,817 89,245 88,806 89,816 88,947 88,706 91,730 93,384Iowa 42,049 42,129 41,726 41,036 40,977 40,736 40,400 41,148 42,100Kansas 40,709 40,648 40,226 39,778 39,761 39,872 38,966 39,858 40,486Kentucky 56,772 57,487 56,801 56,712 56,960 56,386 55,866 57,360 59,020Louisiana 63,221 63,470 61,542 60,867 60,326 59,966 59,836 61,489 62,879Maine 14,314 14,580 14,628 14,759 14,755 14,752 14,743 15,498 15,991Maryland 76,510 76,337 75,290 75,156 75,253 74,665 74,744 77,240 78,614Massachusetts 75,855 76,412 76,862 77,512 79,444 80,120 80,501 82,844 85,373Michigan 120,749 122,567 123,056 124,147 126,477 125,946 127,075 131,824 134,306Minnesota 73,904 74,278 73,407 73,466 73,928 72,148 70,662 72,362 72,902Mississippi 41,930 43,039 41,355 40,690 40,294 39,890 39,641 41,365 42,304Missouri 78,613 78,946 78,394 77,974 77,813 77,545 76,972 79,346 80,403Montana 13,153 13,313 13,041 12,721 12,708 12,458 12,469 12,737 12,611Nebraska 27,085 26,726 26,604 26,632 26,447 26,160 25,750 25,722 25,946Nevada 39,950 39,822 38,925 38,416 38,102 38,014 37,581 38,494 38,518New Hampshire 14,339 14,855 15,010 15,270 15,638 15,823 16,086 16,184 16,500New Jersey 110,652 111,736 111,905 112,954 114,484 114,426 114,008 116,638 119,468New Mexico 28,282 28,376 28,058 27,986 27,679 27,557 27,327 27,953 28,353New York 225,735 226,495 225,640 227,775 230,480 230,898 231,315 237,866 244,571North Carolina 132,311 133,009 132,311 131,274 131,437 130,631 130,685 135,027 135,209North Dakota 9,807 9,784 9,576 9,333 9,015 8,778 8,539 8,636 8,644Ohio 145,809 147,500 147,199 146,740 148,374 148,133 148,943 153,633 156,722Oklahoma 54,689 54,856 53,695 53,320 53,410 52,701 52,357 52,654 53,650Oregon 50,234 50,051 49,499 48,652 49,129 48,659 48,107 49,562 50,727Pennsylvania 149,514 150,181 150,056 150,424 152,004 152,469 151,894 157,718 161,967Puerto Rico 37,135 38,556 39,662 40,268 39,698 40,073 41,452 44,844 46,534Rhode Island 11,431 11,468 11,822 11,900 12,050 12,186 12,235 12,503 12,852South Carolina 63,970 64,870 63,187 62,181 62,021 61,523 61,643 63,082 64,577South Dakota 12,272 12,281 12,072 11,932 11,749 11,269 11,075 11,052 11,295Tennessee 86,242 86,035 85,488 84,672 84,742 84,523 84,476 86,714 88,171Texas 417,991 417,171 413,868 413,410 411,369 409,253 404,682 410,632 412,683Utah 53,612 53,712 52,765 52,359 51,910 51,405 49,974 49,983 50,211Vermont 6,574 6,730 6,661 6,706 6,901 6,972 6,810 7,080 7,427Virginia 105,498 105,840 104,909 104,268 105,235 104,216 103,993 106,179 107,639Washington 94,020 93,329 91,130 90,272 89,653 88,937 87,971 90,659 92,370West Virginia 21,012 20,992 20,800 20,756 21,083 21,066 21,108 21,329 22,075Wisconsin 73,214 73,873 73,518 73,454 74,100 73,624 73,480 74,928 76,390Wyoming 8,152 8,081 7,857 7,858 7,492 7,486 7,250 7,149 7,421National 4,209,306 4,230,475 4,197,624 4,186,221 4,195,013 4,167,378 4,156,012 4,267,535 4,343,109Reporting States 52 52 52 52 52 52 52 52 52
Appendix C: State Characteristics 121Child Maltreatment 2017
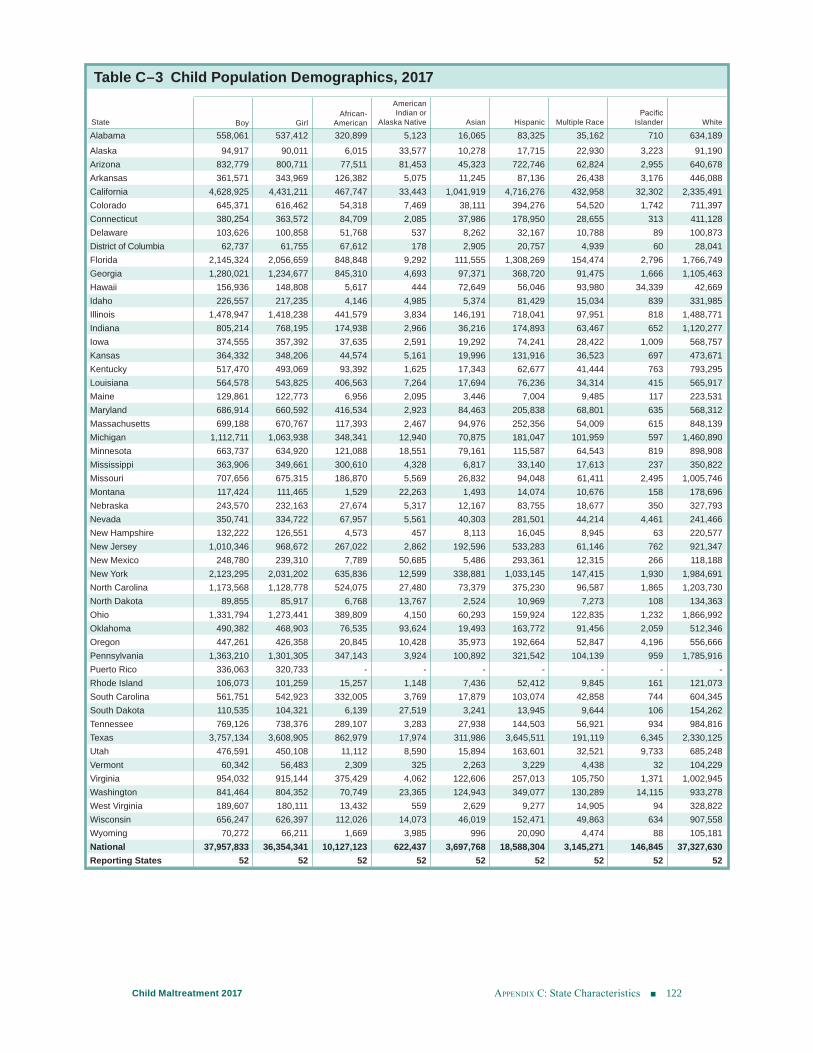
Table C–3 Child Population Demographics, 2017
State Boy GirlAfrican-
American
American Indian or
Alaska Native Asian Hispanic Multiple RacePacific
Islander White
Alabama 558,061 537,412 320,899 5,123 16,065 83,325 35,162 710 634,189Alaska 94,917 90,011 6,015 33,577 10,278 17,715 22,930 3,223 91,190Arizona 832,779 800,711 77,511 81,453 45,323 722,746 62,824 2,955 640,678Arkansas 361,571 343,969 126,382 5,075 11,245 87,136 26,438 3,176 446,088California 4,628,925 4,431,211 467,747 33,443 1,041,919 4,716,276 432,958 32,302 2,335,491Colorado 645,371 616,462 54,318 7,469 38,111 394,276 54,520 1,742 711,397Connecticut 380,254 363,572 84,709 2,085 37,986 178,950 28,655 313 411,128Delaware 103,626 100,858 51,768 537 8,262 32,167 10,788 89 100,873District of Columbia 62,737 61,755 67,612 178 2,905 20,757 4,939 60 28,041Florida 2,145,324 2,056,659 848,848 9,292 111,555 1,308,269 154,474 2,796 1,766,749Georgia 1,280,021 1,234,677 845,310 4,693 97,371 368,720 91,475 1,666 1,105,463Hawaii 156,936 148,808 5,617 444 72,649 56,046 93,980 34,339 42,669Idaho 226,557 217,235 4,146 4,985 5,374 81,429 15,034 839 331,985Illinois 1,478,947 1,418,238 441,579 3,834 146,191 718,041 97,951 818 1,488,771Indiana 805,214 768,195 174,938 2,966 36,216 174,893 63,467 652 1,120,277Iowa 374,555 357,392 37,635 2,591 19,292 74,241 28,422 1,009 568,757Kansas 364,332 348,206 44,574 5,161 19,996 131,916 36,523 697 473,671Kentucky 517,470 493,069 93,392 1,625 17,343 62,677 41,444 763 793,295Louisiana 564,578 543,825 406,563 7,264 17,694 76,236 34,314 415 565,917Maine 129,861 122,773 6,956 2,095 3,446 7,004 9,485 117 223,531Maryland 686,914 660,592 416,534 2,923 84,463 205,838 68,801 635 568,312Massachusetts 699,188 670,767 117,393 2,467 94,976 252,356 54,009 615 848,139Michigan 1,112,711 1,063,938 348,341 12,940 70,875 181,047 101,959 597 1,460,890Minnesota 663,737 634,920 121,088 18,551 79,161 115,587 64,543 819 898,908Mississippi 363,906 349,661 300,610 4,328 6,817 33,140 17,613 237 350,822Missouri 707,656 675,315 186,870 5,569 26,832 94,048 61,411 2,495 1,005,746Montana 117,424 111,465 1,529 22,263 1,493 14,074 10,676 158 178,696Nebraska 243,570 232,163 27,674 5,317 12,167 83,755 18,677 350 327,793Nevada 350,741 334,722 67,957 5,561 40,303 281,501 44,214 4,461 241,466New Hampshire 132,222 126,551 4,573 457 8,113 16,045 8,945 63 220,577New Jersey 1,010,346 968,672 267,022 2,862 192,596 533,283 61,146 762 921,347New Mexico 248,780 239,310 7,789 50,685 5,486 293,361 12,315 266 118,188New York 2,123,295 2,031,202 635,836 12,599 338,881 1,033,145 147,415 1,930 1,984,691North Carolina 1,173,568 1,128,778 524,075 27,480 73,379 375,230 96,587 1,865 1,203,730North Dakota 89,855 85,917 6,768 13,767 2,524 10,969 7,273 108 134,363Ohio 1,331,794 1,273,441 389,809 4,150 60,293 159,924 122,835 1,232 1,866,992Oklahoma 490,382 468,903 76,535 93,624 19,493 163,772 91,456 2,059 512,346Oregon 447,261 426,358 20,845 10,428 35,973 192,664 52,847 4,196 556,666Pennsylvania 1,363,210 1,301,305 347,143 3,924 100,892 321,542 104,139 959 1,785,916Puerto Rico 336,063 320,733 - - - - - - -Rhode Island 106,073 101,259 15,257 1,148 7,436 52,412 9,845 161 121,073South Carolina 561,751 542,923 332,005 3,769 17,879 103,074 42,858 744 604,345South Dakota 110,535 104,321 6,139 27,519 3,241 13,945 9,644 106 154,262Tennessee 769,126 738,376 289,107 3,283 27,938 144,503 56,921 934 984,816Texas 3,757,134 3,608,905 862,979 17,974 311,986 3,645,511 191,119 6,345 2,330,125Utah 476,591 450,108 11,112 8,590 15,894 163,601 32,521 9,733 685,248Vermont 60,342 56,483 2,309 325 2,263 3,229 4,438 32 104,229Virginia 954,032 915,144 375,429 4,062 122,606 257,013 105,750 1,371 1,002,945Washington 841,464 804,352 70,749 23,365 124,943 349,077 130,289 14,115 933,278West Virginia 189,607 180,111 13,432 559 2,629 9,277 14,905 94 328,822Wisconsin 656,247 626,397 112,026 14,073 46,019 152,471 49,863 634 907,558Wyoming 70,272 66,211 1,669 3,985 996 20,090 4,474 88 105,181National 37,957,833 36,354,341 10,127,123 622,437 3,697,768 18,588,304 3,145,271 146,845 37,327,630Reporting States 52 52 52 52 52 52 52 52 52
Appendix C: State Characteristics 122Child Maltreatment 2017
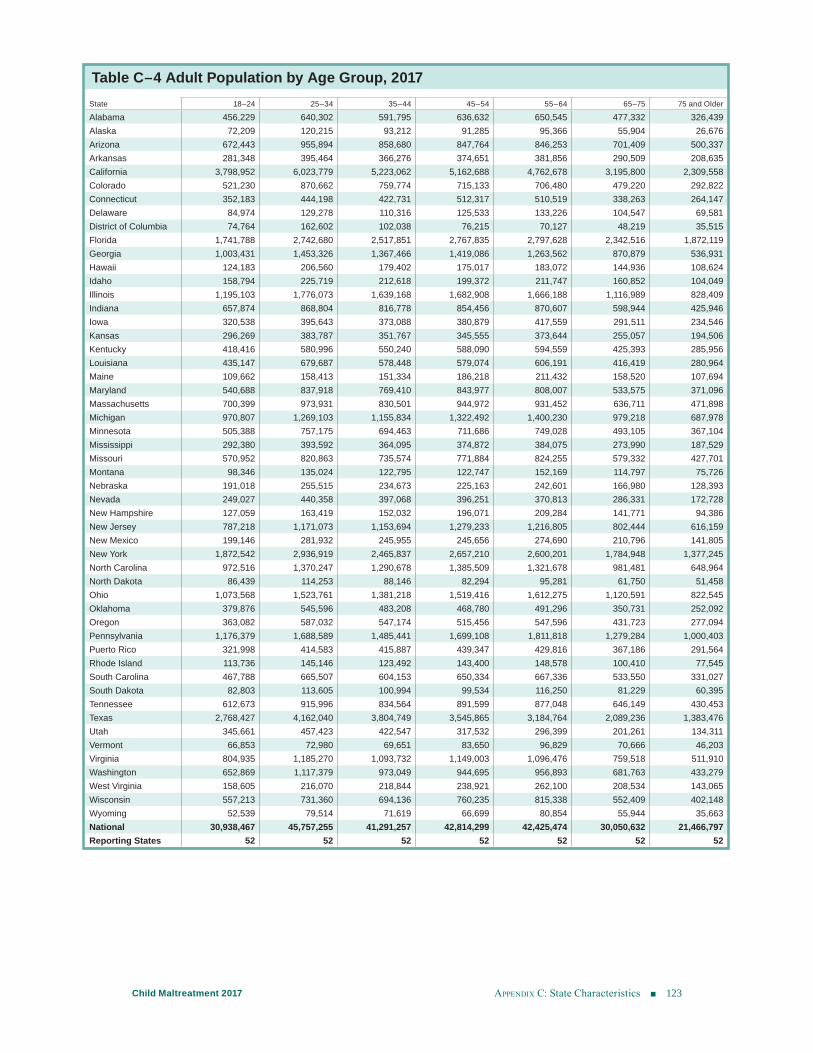
Table C–4 Adult Population by Age Group, 2017State 18–24 25–34 35–44 45–54 55–64 65–75 75 and Older
Alabama 456,229 640,302 591,795 636,632 650,545 477,332 326,439Alaska 72,209 120,215 93,212 91,285 95,366 55,904 26,676Arizona 672,443 955,894 858,680 847,764 846,253 701,409 500,337Arkansas 281,348 395,464 366,276 374,651 381,856 290,509 208,635California 3,798,952 6,023,779 5,223,062 5,162,688 4,762,678 3,195,800 2,309,558Colorado 521,230 870,662 759,774 715,133 706,480 479,220 292,822Connecticut 352,183 444,198 422,731 512,317 510,519 338,263 264,147Delaware 84,974 129,278 110,316 125,533 133,226 104,547 69,581District of Columbia 74,764 162,602 102,038 76,215 70,127 48,219 35,515Florida 1,741,788 2,742,680 2,517,851 2,767,835 2,797,628 2,342,516 1,872,119Georgia 1,003,431 1,453,326 1,367,466 1,419,086 1,263,562 870,879 536,931Hawaii 124,183 206,560 179,402 175,017 183,072 144,936 108,624Idaho 158,794 225,719 212,618 199,372 211,747 160,852 104,049Illinois 1,195,103 1,776,073 1,639,168 1,682,908 1,666,188 1,116,989 828,409Indiana 657,874 868,804 816,778 854,456 870,607 598,944 425,946Iowa 320,538 395,643 373,088 380,879 417,559 291,511 234,546Kansas 296,269 383,787 351,767 345,555 373,644 255,057 194,506Kentucky 418,416 580,996 550,240 588,090 594,559 425,393 285,956Louisiana 435,147 679,687 578,448 579,074 606,191 416,419 280,964Maine 109,662 158,413 151,334 186,218 211,432 158,520 107,694Maryland 540,688 837,918 769,410 843,977 808,007 533,575 371,096Massachusetts 700,399 973,931 830,501 944,972 931,452 636,711 471,898Michigan 970,807 1,269,103 1,155,834 1,322,492 1,400,230 979,218 687,978Minnesota 505,388 757,175 694,463 711,686 749,028 493,105 367,104Mississippi 292,380 393,592 364,095 374,872 384,075 273,990 187,529Missouri 570,952 820,863 735,574 771,884 824,255 579,332 427,701Montana 98,346 135,024 122,795 122,747 152,169 114,797 75,726Nebraska 191,018 255,515 234,673 225,163 242,601 166,980 128,393Nevada 249,027 440,358 397,068 396,251 370,813 286,331 172,728New Hampshire 127,059 163,419 152,032 196,071 209,284 141,771 94,386New Jersey 787,218 1,171,073 1,153,694 1,279,233 1,216,805 802,444 616,159New Mexico 199,146 281,932 245,955 245,656 274,690 210,796 141,805New York 1,872,542 2,936,919 2,465,837 2,657,210 2,600,201 1,784,948 1,377,245North Carolina 972,516 1,370,247 1,290,678 1,385,509 1,321,678 981,481 648,964North Dakota 86,439 114,253 88,146 82,294 95,281 61,750 51,458Ohio 1,073,568 1,523,761 1,381,218 1,519,416 1,612,275 1,120,591 822,545Oklahoma 379,876 545,596 483,208 468,780 491,296 350,731 252,092Oregon 363,082 587,032 547,174 515,456 547,596 431,723 277,094Pennsylvania 1,176,379 1,688,589 1,485,441 1,699,108 1,811,818 1,279,284 1,000,403Puerto Rico 321,998 414,583 415,887 439,347 429,816 367,186 291,564Rhode Island 113,736 145,146 123,492 143,400 148,578 100,410 77,545South Carolina 467,788 665,507 604,153 650,334 667,336 533,550 331,027South Dakota 82,803 113,605 100,994 99,534 116,250 81,229 60,395Tennessee 612,673 915,996 834,564 891,599 877,048 646,149 430,453Texas 2,768,427 4,162,040 3,804,749 3,545,865 3,184,764 2,089,236 1,383,476Utah 345,661 457,423 422,547 317,532 296,399 201,261 134,311Vermont 66,853 72,980 69,651 83,650 96,829 70,666 46,203Virginia 804,935 1,185,270 1,093,732 1,149,003 1,096,476 759,518 511,910Washington 652,869 1,117,379 973,049 944,695 956,893 681,763 433,279West Virginia 158,605 216,070 218,844 238,921 262,100 208,534 143,065Wisconsin 557,213 731,360 694,136 760,235 815,338 552,409 402,148Wyoming 52,539 79,514 71,619 66,699 80,854 55,944 35,663National 30,938,467 45,757,255 41,291,257 42,814,299 42,425,474 30,050,632 21,466,797Reporting States 52 52 52 52 52 52 52
Appendix C: State Characteristics 123Child Maltreatment 2017
AlabamaContact Holly Christian Phone 334–353–4898
Title Program Manager, Office of Data Analysis Email [email protected]
Address Alabama Department of Human Resources 50 Ripley StreetMontgomery, AL 36130–4000
GeneralVariances in data compared to previous years may occur as we have continued work to strengthen the data collection processes in the system. Enhancements are planned to improve reporting of services to children and families, perpetrator data and mapping of NCANDS elements.
Alabama has two types of screened-in responses: child abuse and neglect investigations (CA/Ns) and prevention assessments (alternative response). For federal fiscal year (FFY) 2017, the Child File included only CA/Ns, which have allegations of abuse or neglect. Prevention assessments are reports that do not include allegations of abuse/neglect, but the potential risk for abuse may exist. Prevention Assessments are screened-in assessments. A prevention assessment may be changed to a CA/N report if an allegation is added to the system. At that time, policy for CA/N Investigations are in effect. The FFY 2017 submission does not include prevention assessment data as prevention assessments are not reported to NCANDS.
ReportsFor FFY 2017, the number of screened in reports increased over the prior reporting year while the number of completed or disposed reports increased over the prior reporting year. A policy change was implemented in FFY 2017 that decreased the timeframe permitted to complete CA/N investigations from 90 days to 60 days.
State CommentaryAPPENDIX D
This section provides insights into policies and conditions that may affect state data. Readers are encouraged to use this appendix as a resource for providing additional context to the report’s text and data tables. Wherever possible, information was provided by each NCANDS state contact and uses state terminology.
Appendix d: State Commentary 124Child Maltreatment 2017
During FFY 2014, the department initiated an online mandatory reporter training for report-ing of child abuse and neglect. The Governor, State Department of Education, Community-Based Child Abuse Prevention Program (CBCAP) as well as other partner agencies sup-ported the rollout of this training and continued public awareness. Education and Agency staff statewide were required to complete the training. FFY 2017 screened-out reports include only reports that did not meet the definition of a CA/N report and did not include prevention assessments, Alabama’s alternative response.
Alabama determines staff needs based on a 6- or 12-month average of different case types. Intake is one worker per county and more than one for larger counties, based on population. CA/N reports are counted at a 1:8 ratio for sexual abuse, 1:10 for children who enter foster care, and 1:12 ratio for all other maltreatment types. Prevention assessments are counted on a ratio of 1:12 and child protective services ongoing cases are staffed at a ratio of 1:18 cases.
Response time as reported in the Agency File is taken from the calculated average response time reported in the Child File. Data shows a decrease in average response time for FFY 2017 from the previous year.
ChildrenFFY 2012 was the first submission to report a maltreatment type of medical neglect. In prior submissions, this maltreatment type was captured under the broad category of neglect. For FFY 2013, a coding error occurred, and medical neglect was reported under the broad category of neglect. Medical neglect was reported separately for FFY 2014–FFY 2017.
Fatalities For FFY 2017, all state child fatalities are reported in the Child File. The child death review process determined no additional data to report in the Agency File. The majority of child fatality investigations reported with indicated dispositions are suspended for due process or criminal prosecution. This extends the length of the investigation, which can take several months or years to complete. For these fatalities, the dates of death occurred in a four-year range, from FFY 2014–2017.
Perpetrators An enhancement to Alabama’s SACWIS system requiring the perpetrator relationship to be established to the child went into production mid-FFY 2014. Subsequent submissions have shown improvement in data quality.
Alabama state statutes do not allow a person under the age of 14 years to be identified as a perpetrator. These reports are addressed in an alternate response. Ongoing services are provided as needed to the child victim and the child identified as the person allegedly responsible.
Policy and the Statewide Automated Child Welfare Information System (SACWIS) allows for children to be indicated as victims and the corresponding person allegedly responsible to be not indicated as the perpetrator.
Alabama (continued)
Appendix d: State Commentary 125Child Maltreatment 2017
Services Beginning in FFY 2010 and continuing for FFY 2012, Alabama only reported service data obtained from the state Community-Based Child Abuse and Neglect (CBCAP) grants lead agency for prevention services in the Agency File. Therefore, it is not advised to compare data to previous years. FFY 2013 and FFY 2014 Agency Files include prevention service data for two additional service providers; Family Outcome-Centered Unification Services and Parenting Assistance Line. Enhancements to the SACWIS and mapping are planned to allow more complete reporting of services in future submissions. For FFY 2015 and FFY 2016, additional service data was provided in the Agency File. The total number of children impacted by CBCAP funded programs increased significantly since the last reporting period due to the beginning of school-based programs that work with larger numbers of children at a time. For instance, one school where funds are utilized has over 1,500 participating students.
For foster care services, Alabama SACWIS does not require the documentation of the peti-tion or identity of the court-appointed representative. Petitions are prepared and filed accord-ing to the procedure of each court district. The court appoints all children entering foster care a guardian ad litem who represents their interests in all court proceedings. The state’s SACWIS does not require the tracking of out of court contacts between the court-appointed representative and the child victims. Improvement in data quality will require staff training in this area.
The number of children eligible for referral to agencies providing early intervention services under Part C of the Individuals with Disabilities Education Act (IDEA) reported in the Agency File is the number of children who had indicated dispositions during FFY 2017 and were younger than 3 years. The number of children referred to agencies providing early intervention services under Part C of the IDEA reported in the Agency File is the number of referrals received by the agency providing services during FFY 2017.
Alabama (continued)
Appendix d: State Commentary 126Child Maltreatment 2017
AlaskaContact Susan Cable Phone 907–465–2203
Title Research Analyst Email [email protected]
Address Alaska Office of Children’s ServicesP.O. Box 110630Juneau, Alaska 99811–0630
GeneralAlaska’s NCANDS submissions are based on extraction code developed in 2013 after performing a complete review and revision of the methodology used to extract Child and Agency File data from Alaska’s information system. Major methodology changes are sum-marized in the appropriate sections below. In general, data for 2013 and after may not be comparable to data reported in prior years, and over-the-year changes should be interpreted with caution.
Over-the-year comparisons are also impacted by the entry during 2012 of a backlog of com-pleted assessment (investigation) data. Since assessments are reported to NCANDS for the year in which they are entered, this catch-up effort resulted in over reporting of assessments for 2012 and underreporting for prior years in relation to when the reports were received, and assessment field work completed.
ReportsAlaska’s intake was centralized in mid-2016, which increased consistency in screening deci-sions. A year later, a centralized toll-free number was added, making it easier for reporters to call in without having to locate a phone number for a specific region.
Protective Service Reports received for cases opened after January 2015, are subject to new maltreatment finding policy, which includes revised definitions of “substantiated finding”, “not substantiated finding”, and “closed without finding”, plus requires completion of a formalized Maltreatment Assessment Protocol to determine the finding.
Beginning July 2017, a streamlined documentation process for closing Initial Assessments was implemented. Improvements included standardization of closing method, revision or reduced requirements of forms, Statewide Automated Child Welfare Information System (SACWIS) tab revisions, emphasis on voice dictation to help meet deadlines, documentation of all contacts, and documentation of the case worker’s critical analysis.
ChildrenBeginning with 2013, the determination of prior victim status is based on a child-specific disposition. In prior years this determination was based on the report disposition. Since a report may cover more than one child, the new method improves accuracy and results in a decrease in the number of prior victims reported.
Alaska has stepped up identification of children with Native American race, which may decrease children with unknown race while increasing counts for identified races.
In October 2017, Alaska Tribes and the state signed a groundbreaking document on tribal child welfare, which establishes a framework for Tribes to provide child welfare services to Tribal children and families and recognizes Tribes’ inherent sovereign authority. Under
Appendix d: State Commentary 127Child Maltreatment 2017
the compact, Alaska Tribes and Tribal Organizations will provide identified child welfare services that would be otherwise provided by the Alaska Office of Children’s Services. This includes, but is not limited to, intake, screening, and investigations of abuse and neglect; relative searches; developing and managing safety and case plans; foster care licensing and support; supervised visitation and transportation; and adoption and guardianship home stud-ies. As a significant proportion of children served by Alaska’s welfare system are Native, the long-term impact of these anticipated changes is likely to be significant.
Fatalities In Alaska, the authority for child fatality determinations resides with the Medical Examiner’s Office, not the child welfare agency. The Medical Examiner’s Office assists the state’s Child Fatality Review Team in determining if a child’s death was due to maltreatment. A child fatality is reported only if the Medical Examiner’s Office concludes that the fatality was due to maltreatment. For NCANDS reporting, fatality counts are obtained from a member of the Child Fatality Review Team and reported in the Agency File.
Perpetrators Alaska believes that caregiver risk factors of alcohol and drug abuse have been under-reported in the past. Toward the end of federal fiscal year (FFY) 2016 Alaska instituted an improved system for tracking family characteristics in investigations. For FFY 2017, NCANDS syntax was revised to harvest the benefits of these SACWIS upgrades. This resulted in increased reporting on caregiver alcohol abuse and domestic violence.
Services Methodology changes in 2013 improved the accuracy of services data: for juvenile court peti-tion and court-appointed representative, data are more complete; for family support services and home-based services, data are now reported as not collected rather than as missing. Many services are provided through contracting providers and may not be well-documented in Alaska’s SACWIS; therefore, analysis of the services array with the state’s NCANDS Child File is not advised. In 2017, NCANDS services reporting methodology was again enhanced to ensure that all qualifying services are within the scope of mapping timelines are reported.
Agency File data on the numbers of children by funding source is reported for state fiscal year (July 1–June 30). The NCANDS category of “other” funding source includes state general funds and matching funds from contracting agencies.
Alaska (continued)
Appendix d: State Commentary 128Child Maltreatment 2017
ArizonaContact Andy Egge Phone 602–255–2744
Title Information Technology Manager Email [email protected]
Address Arizona Department of Child Safety PO Box 6030, Site Code C010-14 Phoenix, AZ 85003–6030
GeneralFor NCANDS reporting purposes, Arizona does not have a differential response program.
During the current reporting year, Arizona was able to complete the investigation and closure of backlogged reports. For the last several years, NCANDS data has included inflated numbers because reports received in prior years were being investigated and closed. This year, the number reported by NCANDS and the number actually received by the state are very close. The completion of the backlog reduction-process accounts for the decrease in the number of reports for the current submission year.
ChildrenThe decrease in the number of child victims is attributable to a decrease in the number of reports as explained in the preceding paragraph.
Fatalities Child fatalities reported to NCANDS come through the Child Abuse Hotline call center and are recorded in the Arizona SACWIS. Arizona uses information received from the state’s Department of Vital Statistics, Child Fatality Review Team, law enforcement agencies and the Medical Examiners’ offices when reporting child maltreatment fatality data to NCANDS.
Upon the determination that a significant number of child deaths were caused by unsafe sleeping conditions, the Department developed a Safe Sleep campaign that involves edu-cating families about safe sleep practices and providing them with resources for cribs if needed. The Department’s Baby Box program also helps to spread the word about safe sleep practices.
PerpetratorsArizona allows more than one perpetrator per victim.
Appendix d: State Commentary 129Child Maltreatment 2017
ArkansasContact Nellena Garrison Phone 501–320–6503
Title CHRIS Information Systems Manager Email [email protected]
Address Arkansas Department of Human Services108 E. 7th Street, Donaghey Plaza North, 1st FloorLittle Rock, AR 72201
GeneralThe following options are available when accepting a referral:
Refer to DCFS for Fetal Alcohol Spectrum Disorder (R/A-FASD): The following change was made to Arkansas legislation effective July 2011—Act 1143 requires health care providers involved in the delivery or care of infants to report infants born and affected by Fetal Alcohol Spectrum Disorder. The Department of Human Services shall accept referrals, calls, and other communication from health care providers involved in the delivery or care of infants born and affected with FASD. The Department of Human Services shall develop a plan of safe care of infants born with FASD. The Arkansas State Police hotline staff will use the regular request for DCFS assessment for FASD. These will automatically be assigned to the DCFS Central Office FASD Project Unit to complete the assessment and closure. There were no R/A-FASD reports received in federal fiscal year (FFY) 2016.
Refer to CACD for Death Assessment (R/A-DA): Arkansas FFY 2015 legislation mandated per Act 1211, the Department of Human Services and Arkansas State Police Crimes Against Children Division (CACD) will conduct an investigation or death assessment upon receiving initial notification of suspected child maltreatment or notification of a child death. This was effective in the Children’s Reporting and Information System (CHRIS) as of August 2015. The Child Abuse Hotline will accept a report for a child death if a child has died suddenly and unexpectedly not caused by a known disease or illness for which the child was under a physician’s care at the time of death, including without limitation child deaths as a result of the following:
■ Sudden infant death syndrome ■ Sudden unexplained infant death ■ An accident ■ A suicide ■ A homicide ■ Other undetermined circumstance
All sudden and unexpected child deaths will be reported to the Child Abuse Hotline. Death Assessment (DA) reports are accepted by the Hotline and do not have allegations of maltreat-ment at the time of the referral. The data for R/A-DA reports are not submitted to NCANDS. If the incident does rise to the level of a child maltreatment investigation, then the referral will be elevated to be investigated. Child Death Investigation reports are accepted by the Hotline and will have maltreatment allegations at the time of the referral.
Accept for Investigation: Reports of child maltreatment allegations will be assigned for child maltreatment investigation pursuant to Arkansas Code Annotated 12-18-601. Arkansas uses an established protocol when a DCFS family service worker or the Arkansas State Police Crimes Against Children Division investigator conducts a child maltreatment assessment. The protocol was developed under the authority of the state legislator, (ACA 12-18-15). It
Appendix d: State Commentary 130Child Maltreatment 2017
identifies various types of child maltreatment a DCFS family service worker or an Arkansas State Police Crimes Against Children Division investigator may encounter during an assess-ment. The protocol also identifies when and from whom an allegation of child maltreatment may be taken. The worker or investigator must show that a preponderance of the evidence supports the allegation of child maltreatment. The data for these reports are submitted to NCANDS.
Accept for Differential Response: Differential response (DR) is another way of responding to allegations of child neglect. DR is different from DCFS’ traditional investigation process. It allows allegations that meet the criteria of neglect to be diverted from the investigative pathway and serviced through the DR track. DR is designed to engage low- to moderate-risk families in the services needed to keep children from becoming involved with the child welfare system. Counties have a differential response team to assess for safety, identify service needs, and arrange for the services to be put in place. DR began with five pilot counties in October 2012 and was implemented statewide for all 75 counties by mid-August 2013 through a periodic schedule. FFY 2013 was the first year the state submitted differential response data to NCANDS.
Fatalities Arkansas saw a decrease in the number of accepted substantiated child fatalities during FFY 2017. The substantiated fatalities in FFY 2017. This decrease in substantiated fatalities can be attributed to the decreased number of reported child fatalities as a result of severe physical abuse and unsafe sleep environments. This decrease is also a result of the decreased number of child maltreatment reports in the state due to poverty, substance abuse and the violence experienced in many Arkansas communities.
Arkansas FFY 2015 legislation mandated per Act 1211, the Department of Human Services and Arkansas State Police Crimes Against Children Division (CACD) will conduct an investigation or death assessment upon receiving initial notification of suspected child maltreatment or notification of a child death. All sudden and unexpected child deaths are reported to the Child Abuse Hotline. Death Assessment (DA) reports are accepted by the Hotline and do not have allegations of maltreatment at the time of the referral. If the incident does rise to the level of a child maltreatment investigation, then the referral will be elevated to be investigated. A decrease in child fatalities investigated may be attributed to the number of fatalities determined during assessment to be due to causes other than child maltreatment.
The Arkansas Division of Children and Family Services receives notice of child fatalities through the Arkansas Child Abuse Hotline. The reports include referrals from mandated reporters such as, physicians, medical examiners, law enforcement officers, therapists, and teachers, etc. A report alleging a child fatality can also be accepted from a non-mandated reporter. Non-mandated reporters include neighbors, family members, friends or members of the community. The guidelines for reporting is mandated and non-mandated persons are asked to contact the child abuse hotline if they have reasonable cause to believe that a child has died as a result of child maltreatment.
Arkansas (continued)
Appendix d: State Commentary 131Child Maltreatment 2017
The Arkansas Division of Children and Family Services continues to receive child fatal-ity data from the Arkansas Infant and Child Death Review Panel. The statewide fatality statistics are compiled by the Arkansas Department of Health’s vital records division. The information is submitted to the Arkansas Infant and Child Death Review Panel.
Services The investigators frequently do not document services provided to the families during the investigation process. This documentation is often left to the caseworker to enter when the case is opened.
For FFY 2017, the Division of Children and Family Services conducted a review of how various prevention services are financed. As a result, this more accurately aligned with programs. This new process subsequently led to significant changes in the reporting of some categories.
Arkansas (continued)
Appendix d: State Commentary 132Child Maltreatment 2017
CaliforniaContact Alicia Sandoval Phone 916–653–1812
Title Chief Email [email protected]
Address California Department of Social Services744 P Street, MS 9–13–84Sacramento, CA 95814
GeneralCalifornia’s differential response approach is comprised of three pathways:
■ Path 1 community response—family problems as indicated by the referral to the child welfare system do not meet statutory definitions of abuse and neglect, and the referral is evaluated out by child welfare with no investigation. But based on the information given at the hotline, the family may be referred by child welfare to community services.
■ Path 2 child welfare services with community response—family problems meet statutory definitions of abuse and neglect, but the child is safe, and the family has strengths that can meet challenges. The referral of suspected abuse and neglect is accepted for investigation by the child welfare agency, and a community partner goes with the investigator to help engage the family in services. A case may or may not be opened by child welfare, depend-ing on the results of the investigation.
■ Path 3 child welfare services response—the child is not safe and at moderate to high risk for continuing abuse or neglect. This referral appears to have some rather serious allega-tions at the hotline, and it is investigated, and a child welfare services case is opened. Once an assessment is completed, these families may still be referred to an outside agency for some services, depending on their needs.
In June 2015, California implemented a policy to track commercially sexually exploited (CSE) youth referrals using an allegation of exploitation. In May 2016, California imple-mented a new policy to track CSE youth referrals using an allegation of exploitation with a sub-allegation of commercial sexual exploitation. The sub-allegation of CSE could be used to separate CSE from other exploitation referrals; however, the entry of a sub-allegation is optional, and the California Department of Social Services (CDSS) is still working towards uniform entry of this sub-allegation type for CSE referrals to improve data quality.
ReportsThe report count includes both the number of child abuse and neglect reports that require, and then receive, an in-person investigation within the time frame specified by the report response type. Reports are classified as either immediate response or 10-day response. For a report that was coded as requiring an immediate response to be counted in the immediate response measure, the actual visit (or attempted visit) must have occurred within 24 hours of the report receipt date. For a report that was coded as requiring a 10-day response to be counted in the 10-day response measure, the actual visit (or attempted visit) must have occurred within 10-days of the report receipt date. For the quarter ending September 2017, the immediate response compliance rate was 95.9 percent and the 10-day response compli-ance rate was 90.2 percent.
The number of staff budgeted for screening, intake and investigation (emergency response and emergency response assessment) is based on 58 counties for state fiscal year (SFY) 2016– 2017.
Appendix d: State Commentary 133Child Maltreatment 2017
Fatalities Fatality data submitted to NCANDS is derived from notifications (SOC 826 forms) submitted to the CDSS from County Child Welfare Services (CWS) agencies when it has been deter-mined that a child has died as the result of abuse and neglect, as required by SB 39, Chapter 468, Statutes of 2007. The abuse and neglect determinations reported by CWS agencies can be and are made by local coroner/medical examiner offices, law enforcement agencies, and/ or county CWS/probation agencies. As such, the data collected and reported via SB 39 and used for NCANDS reporting purposes does reflect child death information derived from multiple sources. It does not, however, represent information directly received from either the state’s vital statistics agency or local child death review teams.
The data is used to meet the reporting mandates of the federal Child Abuse Prevention and Treatment Act (CAPTA) and for the Title IV-B, Annual Progress and Services Report (APSR). Calendar year (CY) 2016 is the most recent validated annual data and is therefore reported for federal fiscal year (FFY) 2017. It is recognized that counties will continue to determine causes of fatalities to be the result of abuse and/or neglect that occurred in prior years. Therefore, the number reflected in this report is a point-in-time number for CY 2016 as of January 2018 and may change if additional fatalities that occurred in CY 2016 are later substantiated to be the result of abuse and/or neglect. Any changes to this number will be reflected in subsequent year’s APSR reports.
Beginning with the FFY 2010 NCANDS data submission in CY 2011, the CDSS changed the data source to the SB 39 data. It is important to note that while SB 39 data were used in the FFY 2017 NCANDS submission, the data were derived from CY 2016. Additionally, begin-ning in CY 2012, CDSS began to receive reports of fatalities determined to be the result of abuse and neglect and caused by an unknown third party. NCANDS submission of FFY 2013 (CY 2012) forward includes such fatalities.
CDSS will continue to look at how it might use other information sources to enrich the data gathered from the SOC 826 reporting process and reported to NCANDS. In September 2012, the CDSS issued a best practices all county information notice to counties encouraging annual reconciliation of CWS child death information with other entities that review child deaths such as local child death review teams, and attendance at local child death review team meetings to participate in discussions regarding deaths which may have been the result of abuse and or neglect. As part of the technical assistance provided to counties regarding SB 39, the CDSS has also recently begun collecting information regarding county child welfare agencies’ roles on local child death review teams and how their participation may lead to further identification and reporting of deaths that are a result of abuse or neglect. Additionally, the CDSS is partnering with the CDPH and the California Department of Justice to reestablish lapsed data sharing agreements, for purposes of the reconciliation audit of child death cases in California. We are hopeful that once the reconciliation audit data are for a more current period, the CDSS will be able to compare that data, which includes state vital statistics data, with the SOC 826 fatality statistics to compare actual numbers reported to help inform the state’s NCANDS submission.
California (continued)
Appendix d: State Commentary 134Child Maltreatment 2017
Services Prevention services in California are implemented through a state-supervised, county admin-istered system. This system has the advantage of allowing the 58 counties in California flex-ibility to address child abuse prevention efforts through a local lens. This approach, however, results in 58 sets of challenges in program implementation, evaluation, data collection, and reporting. The CDSS funded direct prevention services for children and families through the allocation of federal Community Based Child Abuse Prevention (CBCAP), Promoting Safe and Stable Families (PSSF), Child Abuse Prevention and Treatment Act (CAPTA) funds, and state Child Abuse Prevention, Intervention and Treatment (CAPIT) funds to California coun-ties. Services are reported and verified according to the SFY 2016–2017, and consequently, reported as FFY 2017.
This is the Office of Child Abuse Prevention’s (OCAP’s) third year of utilizing the Efforts to Outcomes (ETO) software as the primary data collection and reporting tool. The OCAP is creating tools to assist counties with the appropriate way to count each service activity. Additionally, counties are working with direct service providers to ensure accurate data collection. In this reporting period, 26 counties reported a decrease in the total number of children served with PSSF funding, and 19 counties reported a decrease in the total number of children served with CBCAP funding. There was a decrease in the total number of chil-dren served by PSSF and CBCAP due to several factors including:
■ A decrease in demand and less participation in services ■ Staffing issues ■ Counties corrected inaccuracies in reporting from the prior fiscal year
Alameda and Monterey counties reported decreases in the number of children served for public education with CBCAP funds. Alameda County cited not counting the number served because the funded program was a public awareness campaign. The OCAP county consultant will provide technical assistance on the importance of counting the numbers served for public education programs. In SFY 2015–2016 Monterey County reported a decrease in the children served because funding only went toward parent training in SFY 2016–2017.
Stanislaus County reported the largest decrease in the number of children served with PSSF funds. In SFY 2015–2016, Stanislaus County discovered family resource centers and domes-tic violence services were counting children and parents monthly and duplicating counts. In SFY 2016–2017 the county worked with direct service providers to resolve this issue.
Moreover, 20 counties reported a decrease in the number of families served with PSSF fund-ing. There was a decrease in the number of families served by PSSF due to several factors including:
■ Missing data ■ Funding directed to other services ■ Increased accuracy of data collection
San Joaquin, Santa Barbara, Santa Clara, and Stanislaus counties reported decreases in the number of families served with PSSF funds. San Joaquin County did not provide numbers served for differential response services, whereas these numbers have been provided in the past. S. Santa Barbara County reported decreases for the number of families served due
California (continued)
Appendix d: State Commentary 135Child Maltreatment 2017
to using other funding sources for informational and referral services. Santa Clara County reported a decrease in families that received differential response services due to implement-ing the Structured Decision Making (SDM) tool. The SDM tool is a suite of assessment tools used by child welfare workers to assess the risk, safety, and wellbeing of child abuse and neglect referrals received through hotline calls. The SDM tool is used to accurately and consistently classify families according to future risk of maltreatment and assists in the targeting of services. Stanislaus County reported a decrease for the number of families served because adoptive parent recruitment and case management services were counted as individuals instead of families as in SFY 2015–2016.
Additionally, 18 counties reported an increase in the number of families served with CAPIT funding. An increase in the total number of families served by CAPIT funds occurred due to a variety of factors including:
■ Expansion of program capacity to reach more families ■ Increased community outreach and recruitment efforts ■ Increased education to child welfare workers of community resources leading to an
increase in referrals ■ Counties corrected inaccuracies in reporting from the prior fiscal year
Placer and Calaveras counties reported the largest increase in the number of families served with CAPIT funds. This increase is due in part because in SFY 2015–2016, Calaveras and Placer counties counted individuals for public education instead of families. In SFY 2016–2017, Placer County reported an increase in the number of families served due to increased atten-dance at community events.
With CAPTA funding, the OCAP funded the Family Hui program delivered by Lead4Tomorrow, which engages parents and provides them with opportunities to participate in state and local policymaking. Family Hui participants have attended leadership training seminars and child welfare policymaking meetings. Also, the OCAP is funding a predictive analytics research project with the University of Southern California. The predictive analytics project includes researching, developing, and evaluating the potential benefit of utilizing risk modeling as a strategy for preventing child maltreatment. With CAPTA funding, the OCAP also issued a Request for Approval to revise the current online mandated reporter training module. Mandated Reporter training is essen-tial in identifying the early signs of abuse and neglect to prevent further escalation of abuse and neglect issues. Not all families reported to Child Welfare Services have a case opened, but families referred are given access to services that they may not have accessed otherwise. In SFY 2016–2017 professionals from varying disciplines including social workers, teach-ers, child care providers, mental health professionals, and law enforcement, completed the training.
California (continued)
Appendix d: State Commentary 136Child Maltreatment 2017
ColoradoContact Ann Dueñas Phone 303–866–5174
Title Federal Analyst Email [email protected]
Address Colorado Department of Human Services 1575 Sherman StreetDenver, CO 80203–1714
GeneralColorado continues its work to improve the quality of NCANDS data by assessing areas in which reporting can either be created or improved upon for upcoming data submissions. The Institutional Abuse Review Team (IART) reviews all reports of child abuse and neglect which occur within institutions and facilities that provide 24-hour care to children and are under the oversight of the Office of Children, Youth, and Families. Part of IART’s ongoing review includes technical assistance for counties to achieve consistent and accurate victim and perpetrator reporting.
The state provides the following differential response assessment options for reports of child abuse and neglect:
■ High Risk Assessment• Children are interviewed separately from the person responsible for the abuse and
neglect.• A formal determination of whether or not abuse and neglect occurred is documented.• Post-assessment services may be provided via transfer to either voluntary (non-court-
involved) or court-involved traditional services case. ■ Family Assessment Response (FAR)
• Caseworkers have the option to meet with the entire family during the initial contact.• No official determination of whether or not abuse and neglect occurred is documented.• Families understand the assessment is not voluntary, but that post-assessment services
are available and voluntary.
As of FFY 2017, FAR was implemented in 25 counties. Each year, more counties implement FAR which increases the number of reports with an alternative response disposition.
ReportsIn January 2015, the Colorado Department of Human Services (CDHS) launched a statewide child abuse and neglect hotline: 1–844–CO–4–KIDS. This serves as another option for individuals to report suspected child abuse and neglect, in addition to the local numbers all 64 counties have available to the public. All callers speak with a live person 24 hours-a-day, 365 days-a-year and critical information is captured to ensure calls across the state are handled timely.
Fatalities Colorado’s Child Fatality Review Team (CFRT) has statutory authority to review incidents of egregious abuse or neglect, near fatalities, or fatalities of children resulting from abuse or neglect in which there has been previous child welfare involvement with the child, family, and/or alleged perpetrator within 3 years of the incident. The reviews are intended to gain a better understanding of the causes, trends, and system responses to child maltreatment and develop recommendations in policy, practice, and systemic changes which improve the overall health, safety, and well-being of children in Colorado and mitigate future incidents from occurring.
Appendix d: State Commentary 137Child Maltreatment 2017
In addition to currently required child fatality reporting, at the beginning of August 2012, Colorado county human service agencies began reporting all egregious and near fatal incidents that were suspicious for abuse and neglect to the State Department within 24 hours of becoming aware of the incident.
The CFRT is housed in Colorado Department of Human Services’ Administrative Review Division (ARD). Together, ARD and county human services agencies work closely to ensure these egregious incidents of abuse or neglect, near fatalities, or fatalities are documented correctly and timely into the Statewide Automated Child Welfare Information System.
Colorado (continued)
Appendix d: State Commentary 138Child Maltreatment 2017
ConnecticutContact Edward Meeker Phone 860–550–6470
Title Federal Reporting Technical Lead: Information Systems
Email [email protected]
Address Connecticut Department of Children and Families 505 Hudson Street Hartford, CT 06106
GeneralThe state of Connecticut (CT) Department of Children and Families (DCF/Department) has continued to pay particular attention to the quality of the Differential Response System (DRS) case practice. CT’s DRS is a two-track system of response to reports of abuse or neglect, comprised of traditional CPS Investigation for high risk cases, and Family Assessment Response (FAR) for low or moderate risk cases. CT does not currently report FAR responses in the state’s NCANDS data.
Connecticut’s 2016 Child and Family Service Review (CFSR) results were released in 2017, and several items re-emphasized known areas needing improvement within the DRS prac-tice. Policy enhancements and a well-defined quality improvement methodology were applied to DRS work during 2016 in collaboration with the DCF Court Monitor’s Office. The review instrument was largely based on relevant items contained in the CFSR On-Site Review Instrument (OSRI).
During 2017, the instrument was utilized statewide, and results were discussed on a regular basis between Regional managers and the Senior Administrative Management team. During 2018, we expect to begin conducting ongoing reviews using a DCF-developed web-based version of the OSRI for Program Improvement Plan (PIP) monitoring purposes. To ensure the quality of the FAR practice, DCF developed a Best Practice Guide and contracted with the University of Connecticut School of Social Work (UCONN) to serve as the Performance Improvement Center (PIC). UCONN has conducted in-depth analyses of the Department’s practice data, as well as providing expert technical assistance to community partner agencies.
These analyses show that the rate of subsequent reports for families first referred to CT DCF’s FAR has been decreasing. Further, these data revealed that families served by the Community Supports for Families (CSF) program demonstrated improvement in outcomes measured by the Protective Factors and North Carolina Family Assessment Scales. Families who responded to the CSF satisfaction survey indicated that they were satisfied with the services provided to them by this program. Statewide, 61.9 percent of families with a FAR have not had any subsequent reports, and 88.9 percent of all families with a FAR did not have a subsequent substantiated report. For those who had a subsequent report, it typically occurred within the first 6 months of the initial report approval date.
Changes also were made to DCF investigations policy during 2017, which include notification to Probate Court of any legal guardian who has a substantiated report, allowing supervisors discretion to utilize consultation with the Regional Resource Group staff (experts in behav-ioral health, physical health, intimate partner violence and substance abuse), and reducing the required minimum number of supervisory case conferences from three to two.
Appendix d: State Commentary 139Child Maltreatment 2017
In addition, changes made to the FAR response process included that any child living in the home will now be required to be observed and interviewed during the first home visit. If this is not able to be accomplished at that time, then daily attempts to do so are to be made. If such contact has not occurred within 5 days, a legal and clinical consult must occur. A case cannot be closed until such time that the child(ren) are seen and interviewed, unless an exception is made by Area Office Director.
During federal fiscal year (FFY) 2017, in collaboration with the National Council on Crime and Delinquency, DCF also continued to work toward updating its Structured Decision Making (SDM) process. To date, DCF has updated the Careline Response Priority Assessment and has begun planning and analyses to support revision to both the Safety and Risk Assessment tools.
CT DCF continues to strengthen our response to victims of human trafficking. In FFY 2017, there were 121 reports of children/youth trafficked in CT made to the Department. There are six Human Anti-Trafficking Response Teams (HART), one in each DCF region. These are inter-disciplinary teams led by experienced HART Liaisons including; the child’s treatment team, specialized providers and legal representation if indicated. The HART Liaison works with the local Multi-Disciplinary Team (MDT) ensuring the cases are afforded resources to maximize prosecutions, while ensuring the child and families are provided appropriate medical and mental health services.
CT Public Act (PA) 16-71 was enacted on October 1, 2016, establishing a Trafficking in Persons (TIP) Council, consisting of representatives from 15 different state and municipal agencies, and 9 members of the public. The council was established to identify criteria for providing services to child and adult trafficking victims, to coordinate the collection, analysis and dissemination of data regarding human trafficking, and consult with governmental and non-governmental organizations in developing recommendations to strengthen state and local efforts to prevent trafficking, protect and assist victims of trafficking and prosecute traffickers. Other provisions of the statute include required training for hotel or similar lodging staff in recognizing potential victims and/or trafficking activities, amends statutes regarding prosecution for prostitution and trafficking.
PA 17-32 went into effect in October 2017, which included but is not limited to changes such as requiring that the Commissioner of the Department of Education (SDE) and a survivor of human trafficking be a part of the Trafficking in Persons (TIP) Council. Further, it required that the council develop a standardized training curriculum for medical and education professionals, and law enforcement to identify and support victims. The TIP Council was also charged with training DCF and DPH staff on current methods to identify youth in foster care who may be or at risk of becoming victims of human trafficking and to develop a plan to support their mental health once they are identified. New charges also were added to statute for anyone identified as “purchasing” a child for the intent of sexual abuse. A Class B felony charge of this type applies to those involving children age 15–17 years, and a Class A felony for any child under the age of 15.
Connecticut (continued)
Appendix d: State Commentary 140Child Maltreatment 2017
CT DCF compiled data in the first quarter of 2017, which identified an ongoing increase in referrals of youth residing in a parent or guardian’s home. This will be addressed by a newly created Domestic Minor Sex Trafficking (DMST) Youth Awareness curriculum. The 2017 legislative session resulted in modifications to state statute regarding Multidisciplinary Team and Children’s Advocacy Centers, expanding their established criteria for screening to include trafficking victims in addition to alleged victims of sexual and/or physical abuse.
ReportsCT is not reporting to NCANDS data from reports handled through alternate response. Therefore, the decline in the total volume of reports documented in NCANDs since DRS was implemented in March 2012 is not indicative of the actual trend in abuse/neglect reporting for CT. During FFY 2017, the centralized DCF Careline accepted 32,602 reports for a response, 12,581 (38.6 percent) of which were handled through the alternative response. There was an increase in unique reports handled through the investigation response compared to FFY 2016.
DCF continued its tradition of focusing on comprehensive staff training. We continued the CT version of the Leadership Academy for Middle Managers (LAMM), through which an additional 15 managers were trained this year. Also, the first classes of the Leadership Academy for Supervisors (LAS) were completed this year. The LAS is a web-based leader-ship training for experienced child welfare supervisors. The curriculum consists of six online modules each based on the NCWWI Leadership Model. The LAS provides 21 contact hours of self-directed online learning, with two tracks to enhance learning transfer: a personal learning plan to develop leadership skills and a change initiative project to contribute to a system changes within the agency. There were 19 supervisors that finished their LAS group, and an additional 13 who started a new group this year.
In 2017, the Department also implemented the Striving Towards Excellence in Programs (STEP) initiative. STEP was a 6 months exposure for DCF staff to enhance their quality assurance competencies through development of Change Initiatives.
ChildrenThere was a slight increase in unique children who were alleged victims handled through the Investigation response in FFY 2017 compared to FFY 2016. Details concerning CT DCF statute and policy relating to investigation of abuse/neglect can be found on the DCF website.
Fatalities CT has a Child Fatality Review Panel to review unexplained or unexpected circumstances of the death of any child who has received services from a state department or agency addressing child welfare, social or human services, or juvenile justice. Representative from the Department participate on the Child Fatality Review Panel. CT DCF has continued its focus on enhanc-ing agency practices to prevent child fatalities through implementation of the Eckerd Rapid Safety Feedback (ERSF) approach. ERSF utilizes predictive analytics to determine the most significant correlates to specified child welfare events using data contained in the SACWIS. CT ERSF has been modeled to identify cases at high risk of serious maltreatment or fatality. Customer Analytics for Recognition and Exploration (ICARE) is the Predictive Analytics module being used. ICARE is a deterministic approach to identify the probability of a specific
Connecticut (continued)
Appendix d: State Commentary 141Child Maltreatment 2017
outcome at the child level. The objective is to provide DCF Area Office staff with early vis-ibility of these children who may require increased oversight. These cases are then targeted for an intensive quality assurance review and staffing process. Since ERSF was started in October 2016, there have been 731 cases reviewed by the team, with 162 of those being staffed with a teleconference.
The Special Quality Review (SQR) reviews critical incidents and child fatalities. The SQR is an extensive and comprehensive process involving reviews of electronic and paper case records, broad staff, collateral and stakeholder interviews, and consultation with multidisciplinary experts. Perpetrators Details concerning CT DCF statute and policy relating to investigation of abuse/neglect can be found on the DCF website.
ServicesDCF has continued to make strides in its family teaming model of case planning and deci-sion making, which is anchored in the expansion of its Strengthening Families Practice Model to foster families and families on the Department’s caseloads. We have reformed CT’s foster care system by greatly increasing the use of relatives and kin if a child needs to be removed for his or her own protection. Considered Removal Child and Family Team Meetings (CR-CFTM) have continued to be an effective method to divert children from care. Eighty-seven percent of the children who were the subject of a CR-CFTM during 2016 were either not removed or placed with kin. The Department has continued efforts to limit the use of Other Planned Permanent Living Arrangement (OPPLA) as a permanency goal for children age 16 and over.
Other effects of the model can be seen in the following data from January 1, 2011 to January 1, 2018:
■ Reduction in DCF caseload ■ Reduction in the number of children in placement ■ Increase in the number of children placed with relatives and kin ■ Reduction in the number of children placed in out-of-state congregate care settings ■ Increase in percentage of children in placement are living with a foster family from 2011
Several years ago, DCF created a standing Statewide Racial Justice During 2017, Racial Justice workgroups continued to develop and implement specific strategies to decrease disparities and improve equitable outcomes.
CT DCF is also currently involved in the Connecticut Community Supervision Implementation (CCSI) project, which is funded by a grant secured by the CT Office for Policy and Management in partnership with DCF and the Judicial Branch Court Support Services Division. The intent of this project is to demonstrate that with the use of wrap around and pro social services with a strong focus on family and youth directed planning for youth identified as high risk, there could be a reduction in recidivism. In June 2017, the Community Connector Organization (CCO) began working with youth who were committed delinquent to CT-DCF, using a University of Cincinnati model called Effective Practices in
Connecticut (continued)
Appendix d: State Commentary 142Child Maltreatment 2017
Community Supervision for Influencers (EPICS-I). It was identified that from that cohort, youth of color were disproportionality represented.
During 2016, DCF implemented a Tier Classification System for evaluating and monitoring contracted service providers. The Contract Management Unit embarked on a comprehensive process, in partnership with other Department units, to develop a contracted program clas-sification tool designed to enhance the Department’s ability to evaluate contracted programs and create opportunities for ongoing Quality Improvement at a program and system level.
The overarching goal of the Tier Classification System is to ensure the quality and account-ability of contracted direct services programs. This process is intended to enhance the Department’s ability to support decision making toward the improvement of client outcomes, while providing support to the contracted provider network. This year, DCF also completed work on ensuring that all its directed services contracts contain performance measures.
October 2017, marked the third progress update of the CT Children’s Behavioral Health Plan following its initial submission in October 2014. The plan is developed and updated by the Children’s Behavioral Health Implementation Advisory Board, that is organized into 3 main workgroups and an additional 5 workgroups of the CONNECT federal System of Care grant.
Connecticut (continued)
Appendix d: State Commentary 143Child Maltreatment 2017
DelawareContact Colleen Woodall Phone 302–633–2663
Title Family Services Program Manager Email [email protected]
Address Delaware Department of Services for Children, Youth and their Families
1825 Faulkland RoadWilmington, DE 19805
General For the past 9 years, Delaware has received historical numbers of reports of child abuse, neglect and dependency. Due to the steadily increasing amounts of hotline reports and inves-tigation cases over the past few years, Delaware put into practice two strategies; Structured Decision Making (SDM) at the report line and tier 1 at investigation in FFY 2012. These initiatives have been in place for five full federal fiscal years, and Delaware has seen signifi-cant results. In federal fiscal year (FFY) 2017, Delaware’s Division of Family Services (DFS) saw a decrease in reports from FFY 2016. In FFY 2017, statistics indicate that although Delaware’s hotline reports received decreased, the percentage of reports screened-out compared to the prior federal fiscal year increased. Specifically, the screen out rate between federal fiscal years increased while the screen-in rate for investigation decreased. Overall, the implementation of both strategies has helped DFS to use resources and expertise more efficiently. Delaware is better able to determine which cases require full investigations from those needing referrals for services unrelated to child abuse and neglect.
In FFY 2013, Delaware implemented two additional initiatives, (SDM) at investigation and the Family Assessment Intervention Response (FAIR). The SDM tool implemented at investigation helps workers to consistently determine safety threats and to make decisions using the same set of standards. Research from other states has shown that using assess-ments to inform service decisions reduces future child maltreatment. This coincides with DFS’ transformation initiatives under the name Outcomes Matter. The second policy change Delaware put into operation was FAIR at the report line. FAIR is the state’s version of a differential response (DR) that allows us to divert low-risk families to services in the com-munity. In a qualitative study conducted, a high percentage of Delaware teens enter foster care due to parent/child conflict. Currently, Delaware is piloting the program for teen popula-tions because we felt FAIR presented an opportunity for intervention of these youth and their families outside of the formal child welfare system. Since the implementation of FAIR, the percentage of youth who have engaged in FAIR services and who have subsequently entered DFS placement is extremely low. For the current NCANDS reporting period, Delaware did not provide FAIR data in the Child File because the program has not been fully implemented across the state.
ReportsThe state’s intake unit uses the SDM tool to collect sufficient information to access and determine the urgency to investigate child maltreatment reports. In May 2012, Delaware implemented SDM at the report line and consequently changed response time requirements for familial abuse investigations. Currently, all screened-in reports are assessed in a three-tiered priority process to determine the urgency of the workers first contact; priority 1–within 24 hours, priority 2–within 3 days and priority 3–within 10 days. The calculation of our average response time for FFY 2017 is made up of both family abuse and institutional abuse
Appendix d: State Commentary 144Child Maltreatment 2017
investigations. In FFY 2017, accepted referrals for family abuse cases were identified as 60 percent routine/Priority 3, 15 percent Priority 2, and 25 percent urgent/Priority 1 in response.
From FFY 2016 to FFY 2017, there was a decrease in the total number of referrals received by the agency. Delaware also found that the number of referrals accepted for investigation over the 12-month period decreased from the previous federal fiscal year. In FFY 2017, there was an increase in the number of referrals screened-out from the prior federal fiscal year. Although the number of hotline referrals continues to rise each year, Delaware’s acceptance rate dropped for the first time in four years.
Management cites that the increasing number of referrals received have resulted from the public’s awareness of child maltreatment and professionals mandatory reporting. Subsequent public service campaigns for reporting child abuse and neglect may also have had an impact in the number of reports received. Considering the vast increase in the number referrals coming in, Delaware has continued to increase the number of staff responsible for hotline and investigation functions.
ChildrenThe state uses 50 statutory types of child abuse, neglect and dependency to substantiate an investigation. The state code defines the following terms: Abuse is any physical injury to a child by those responsible for the care, custody and control of the child, through unjustified force as defined in the Delaware Code Title 11 §468, including emotional abuse, torture, sexual abuse, exploitation, and maltreatment or mistreatment. Neglect is defined as the failure to provide, by those responsible for the care, custody, and control of the child, the proper or necessary: education as required by law; nutrition; supervision; or medical, surgi-cal; or any other care necessary for the child’s safety and general well-being. Dependent child is defined as a child under the age of 18 who does not have parental care because of the death, hospitalization, incarceration, residential treatment of the parent or because of the parent’s inability to care for the child through no fault of the parent.
Under the Department of Services for Children, Youth and Their Families, children may be placed in residential care from the child welfare program, the juvenile justice program or the child mental health program. In calculating child victims reunited with their families in the previous 5 years, the state did not include placements from Prevention and Behavioral Health and Juvenile Justice as a previous placement in which the child was reunited with their family if there was no placement involvement with the child welfare agency. This is because the Juvenile Justice and Prevention and Behavioral Health placements alone are not the direct result of the caregiver’s substantiation of abuse, neglect, or dependency.
In FFY 2017, there was an increase in substantiated victims of child maltreatment from FFY 2016.
Fatalities The state does not report any child fatalities in the Agency File that are not reported in the Child File. For FFY 2017, all reported child fatalities involved children under the age of three, and three of the four children were under the age of one. Two of the four reported
Delaware (continued)
Appendix d: State Commentary 145Child Maltreatment 2017
child fatalities involved death because of co-sleeping, and three out of the four reported child fatalities involved substance abuse and/or mental health.
PerpetratorsDelaware maintains a confidential Child Protection Registry for individuals who have been substantiated for incidents of abuse and neglect since August 1, 1994. The primary purpose of the Child Protection Registry is to protect children and to ensure the safety of children in childcare, health care, and public educational facilities. The Child Protection Registry in Delaware does not include the names of individuals who were substantiated for dependency; parent and child conflict, adolescent problems, or cases opened for risk of child abuse and neglect. An adult whom the state intends to substantiate will receive a written notice of intent to substantiate at the end of the investigation. The notification includes a hearing request form that must be returned within thirty days of the postmarked date of the notification. The hearing request form enables the individual to receive a substantiation hearing in Family Court. When the hearing request form is not returned within the specified timeframe, the individual will automatically be entered on the Child Protection Registry. A minor will receive a substantiation hearing without submitting a hearing request form. This registry is not available through the internet and is not the same as the Sex Offender Registry main-tained by the Delaware State Police State Bureau of Identification.
Services During FFY 2016, Delaware’s Children’s Department saw a decline in the number of children who received prevention services through the year provided by the Promoting Safe and Stable Families (PSSF) funding source and children and families who received services through the year funded by the NCANDS category of other funding source. This decline was attributed several factors including the number of vacancies in the K-5 Early Intervention program, the reduction of service sites and the amendment of contracted services in the Promoting Safe and Stable Families program, and a reported greater ownership and empow-erment within the community among the faith based and grass root organizations. Delaware has, however, seen a slight increase, in the number of families who received services through the year funded by Social Services Block Grants (SSBG). This source funds services to children and families who are at risk and/or in crisis and can increase the strength and stabil-ity of parenting skills.
In FFY 2014, Delaware’s Division of Family Services implemented several initiatives to improve outcomes with families. One of the programs is Team Decision Making, which engages the family, informal supports and formal supports in planning for children who are at risk of coming into care. This process has remained steady in diverting youth into kinship placements instead of Foster Care.
The state is currently re-evaluating the data for children eligible for referral and referred under Part C of the Individuals with Disabilities Education Act (IDEA) and working on ways to report more accurate information. This data has been suspended until further notice.
Delaware (continued)
Appendix d: State Commentary 146Child Maltreatment 2017
District of ColumbiaContact Lori Peterson Phone 202–434–0055
Title Supervisory IT Specialist Email [email protected]
Address District of Columbia Child and Family Services Agency200 I Street, SEWashington, DC 20003
GeneralThe District continues to operate under a differential response (DR) protocol. All screened in reports are directed to one of the following pathways.
■ Investigation: This traditional pathway is for families who have a report of suspected severe child abuse and/or neglect, such as physical or sexual abuse. The District will conduct an investigation in accordance with District law and determine whether maltreat-ment occurred or if the child is at risk of maltreatment.
■ Family Assessment: This pathway provides services for families with moderate- to low-risk reports. On a voluntary basis, families engaged with social workers to identify issues and needs and to connect them to community services, so the families get help without entering the child welfare system.
The reports that are accepted as family assessments are identified as alternative response for NCANDS.
Due to the data requirements for the Comprehensive Addiction and Recovery Act of 2016 and other District mandated initiatives related to substance-exposed newborns and parental substance use, the District changed its practice in June 2017 to screen in all reports with an allegation of one of the following:
■ Positive toxicology of a newborn ■ Controlled substance in the system of a child ■ Exposure to illegal drug activity in the home ■ Substance abuse by parent, caregiver, or guardian ■ Fetal Alcohol Spectrum Disorder
ReportsAs expected, the alternative response reports continue to increase. The NCANDS disposition of alternative response nonvictim represents the children of families reported from the family assessment reports.
ChildrenThe District’s system does not capture data for NCANDS child risk factors. However, the system does capture data on NCANDS caregiver risk factors.
Fatalities The Child and Family Services Agency (CFSA) participates on the District-wide Child Fatality Review committee and uses information from the Metropolitan Police Department and the District Office of the Chief Medical Examiner (CME) when reporting child maltreatment fatali-ties to NCANDS. The District reports fatalities in the Child File when neglect and abuse was a contributing factor that led to the death of the child.
Appendix d: State Commentary 147Child Maltreatment 2017
Currently, there is no NCANDS maltreatment type for the District’s maltreatment type suspicious child death. The District will continue to map this maltreatment type to NCANDS category of “other”. The District defines suspicious child death as a report of child death that either is unexplained, or concern exists that abuse or neglect by caregiver contributed to or caused the child’s death.
District of Columbia (continued)
Appendix d: State Commentary 148Child Maltreatment 2017
FloridaContact Keith Perlman Phone 850–717–4675
Title Manager, Data and Reporting Email [email protected]
Address Florida Department of Children and Families1317 Winewood Boulevard Tallahassee, FL 32399
GeneralApproximately 25 percent of Florida Child Protective Investigations are provided by local county sheriffs under a grant with the Department of Children and Families.
In federal fiscal year (FFY) 2017 Florida initiated a new maltreatment of substance exposed newborn. The definition is as follows: Substance-exposed newborn as a maltreatment occurs when a child is exposed to a controlled substance or alcohol prenatally. Exposure to a con-trolled substance or alcohol prenatally is established by:
■ A test, administered at birth, which indicates that the child’s blood, urine or meconium contained any amount of alcohol or a controlled substance or metabolites of such sub-stances, the presence of which was not the result of medical treatment administered to the mother or the newborn infant;
■ A diagnosis of Neonatal Abstinence Syndrome or Fetal Alcohol Spectrum Disorder as a result of maternal use of a controlled substance or alcohol; or
■ Knowledge or suspicion by medical personnel or hospital staff that an infant was exposed to a controlled substance or alcohol prenatally based on physiological or neurobehavioral abnormalities (e.g., seizures, muscle tightness, rapid breathing), and/or the mother’s reported use of controlled substances or alcohol prenatally when such use would likely result in neonatal toxicology or withdrawal.
A controlled substance is defined as prescription drugs not prescribed for the parent or not administered as prescribed, and controlled substances as outlined in Schedule I or Schedule II as defined in Section 893.03, F.S.
Florida does not have alternative pathways.
ReportsThe criteria to accept a report are that an alleged victim:
■ Is younger than 18 years of age ■ Is a resident of Florida or can be located in the state at the time of the report ■ Has not been emancipated by marriage or other order of a competent court ■ Is a victim of known or suspected maltreatment by a parent, legal custodian, caregiver, or
other person responsible for the child’s welfare (including a babysitter or teacher) ■ Needs supervision and care and has no parent, legal custodian, or responsible adult relative
immediately known and available to provide supervision and care ■ Is suspected to be a victim of human trafficking by either a caregiver or noncaregiver.
The response commences when the assigned child protective investigator attempts the initial face-to face contact with the alleged victim. The system calculates the number of minutes from the received date and time of the report to the commencement date and time. The min-utes for all cases are averaged and converted to hours. An initial onsite response is conducted immediately in situations in which any one of the following allegations are is made: (1) a
Appendix d: State Commentary 149Child Maltreatment 2017
child’s immediate safety or well-being is endangered, (2) the family may flee or the child will be unavailable within 24 hours, (3) institutional abuse or neglect is alleged, (4) an employee of the department has allegedly committed an act of child abuse or neglect directly related to the job duties of the employee, (5) a special condition referral (e.g., no maltreatment is alleged but the child’s circumstances require an immediate response such as emergency hospitaliza-tion of a parent, etc.) for services, or (6) the facts of the report otherwise so warrant. All other initial responses must be conducted with an attempted onsite visit with the child victim within 24 hours.
Florida maps all reports with a disposition of not substantiated to the NCANDS category of unsubstantiated.
ChildrenThe Child File includes both children alleged to be victims and other children in the house-hold. The Adoption and Foster Care Analysis and Reporting System (AFCARS) identifica-tion number field is populated with the number that would be created for the child, regardless of whether that child has actually been removed and/or reported to AFCARS.
Fatalities Fatality counts include any report closed during the year, even those victims whose dates of death may have been in a prior year. Only verified abuse or neglect deaths are counted. The findings are verified when a preponderance of the credible evidence results in a determina-tion that death is the result of abuse or neglect. All suspected child maltreatment fatalities must be reported for investigation and are included in the Child File. The death maltreatment is an actual code that is reported as the NCANDS category of “other” maltreatment type.
PerpetratorsBy Florida statute, perpetrators only are identified as responsible for maltreatment in cases with verified findings.
Services All child welfare services are provided by Community-Based Care lead agencies under contracts with the Department of Children and Families.
Florida uses client eligibility statistics to allocate costs among federal and state funding sources. This is due to the implementation of the IV-E waiver and a cost pool structure based on common activities performed that are funded by various federal and state awards. As such, Florida does not link individuals receiving specific services to specific funding sources (such as prevention).
Florida (continued)
Appendix d: State Commentary 150Child Maltreatment 2017
GeorgiaContact Michael Fost Phone 404–463–0845
Title Operations Analyst Email [email protected]
Address Georgia Department of Human Services2 Peachtree StreetAtlanta, GA 30303
GeneralThe Statewide Automated Child Welfare Information System, SHINES captures nearly all the data in the NCANDS files. Each year, enhancements are made to improve accuracy and completeness. Comparing data from different years may lead to inaccurate conclusions. In addition to enhancements in the SHINES database, changes in policy and practice also necessitate caution when comparing data from one year to another.
Screened-in referrals in Georgia are directed to either an investigation or alternative response, called Family Support. Cases with allegations that are considered more dangerous (sexual abuse, physical abuse, maltreatment in care) are directed immediately to the inves-tigation pathway. Cases with other allegations undergo an Initial Safety Assessment (ISA). A case worker interviews the alleged victim(s) and the alleged perpetrator(s) in person at the home. Risk is assessed, and the case is then directed either to an investigation or, if risk appears low, to the alternative response pathway. Investigations end with a determination of either substantiated or unsubstantiated, indicating whether a preponderance of evidence supports the allegation(s) or not. Alternative response cases receive no such determination. A decision to remove children into state custody does not depend on the investigation disposi-tion, but on the safety of the home. Both investigations and alternative response are included in the NCANDS Child File.
Two significant changes occurred in Georgia during federal fiscal year (FFY) 2016. The first was the creation of a Child Abuse Registry on July 1, 2016. Prior to the Registry, Georgia did not keep records of perpetrators. The FFY 2017 submission is the first that includes Georgia perpetrator data. The creation of the registry has been accompanied by a significant decrease in the number of substantiated incidents.
The second important change in Georgia in 2016 was a new practice called the Initial Safety Assessment (ISA). Prior to the ISA, intake workers who received a report of child maltreat-ment made the decision to screen the call out or assign it to a case worker as an investigation or alternative response. The new policy allows the intake worker to screen out non-qualifying calls (as before), assign a case as an investigation if it meets certain criteria (serious injury, maltreatment in care, etc.), or assign the case as an ISA with a priority of immediate, 24-hour, or 72-hour response times. ISA workers visit the home and determine whether the investigation track or alternative response is appropriate. This change in policy has been accompanied by a large shift in the number of cases assigned as alternative response instead of investigations.
ReportsThe components of a CPS report are: (1) a child younger than 18 years; (2) a referral of condi-tions indicating child maltreatment; and (3) a known or unknown individual alleged to be a perpetrator. Referrals that do not contain all three components of a CPS report are screened out. Screened out referrals may include historical incidents, custody issues, poverty issues,
Appendix d: State Commentary 151Child Maltreatment 2017
truancy issues, situations involving an unborn child, and/or juvenile delinquency issues. For many of these, referrals are made to other resources, such as early intervention or prevention programs.
In the FFY 2017 NCANDS Child File, the following Georgia reporters were grouped into NCANDS category of social services personnel for the report source field:
■ Therapist ■ Community Agency ■ Clergy ■ Family Viol. Shelter ■ Mental Health Prof. ■ Other Shelter ■ Service Provider ■ Psychologist/Psychiatrist ■ DHR Staff ■ Case Manager ■ Counselor/Social Worker ■ DHS Staff (Non-TANF) ■ Child Counseling Personnel ■ Child Service Organization Personnel ■ Child Service Organization Volunteer ■ Hospital or Medical Personnel/Volunteer ■ Pregnancy Resource Center Personnel ■ Pregnancy Resource Center Volunteer ■ Reproductive Health Care facility ■ Reproductive Health Care Volunteer ■ Volunteer to Psychologist
A new methodology for inferring living arrangements for the report was implemented resulting in significant reductions of children living with two married parents, those living in a single parent household with mother only, and children with unknown living arrangements. The numbers of children living in a married two parent household with two biological/adoptive parents and those living in an unmarried two parent household with one biological/adoptive parent increased.
Children The number of unique child victims in FFY 2017, decreased 2016 submission. The agency has adopted a more thorough screening process for reports and adopted a new casework model that requires intensive supervision of cases assigned to the alternative response track. This has resulted in a large proportion of cases that would have been assigned to the investi-gation track assigned as alternative response.
Fatalities Georgia relies upon partners in the medical field, law enforcement, Office of the Child Advocate, and other agencies in identifying and evaluating child fatalities.
Georgia (continued)
Appendix d: State Commentary 152Child Maltreatment 2017
PerpetratorsPrior to July 1, 2016, a ruling of the Georgia Supreme Court prohibited the Division of Family and Children Services from reporting perpetrator data. GA Senate Bill 138 Section 11, codified as Official Code of Georgia Annotated statute 49-5-182, effective July 1, 2016 established a Child Abuse Registry and now allows for the reporting of perpetrator data.
If the perpetrator of the abuse is identified as a parent of the child and as the primary care-giver in the family, then we can assume that the parent perpetrator is a caregiver. However, if the perpetrator is identified as a parent but is not the primary caregiver, the system offers no method of determining if the parent has a caregiver role.
ServicesThe agency does not provide the following services to clients and therefore does not report these items to NCANDS: educational and training, family planning, daycare, information and referral, or pregnancy planning services. These services would be provided by referrals to other agencies or community resources. SHINES only tracks those services paid for by agency funds. Most services are provided through referrals to other agencies or community resources.
Georgia (continued)
Appendix d: State Commentary 153Child Maltreatment 2017
HawaiiContact Ricky Higashide Phone 808–586–5109
Title Research Supervisor Email [email protected]
Address Hawaii Department of Human Services1390 Miller Street, Room 211Honolulu, HI 96813
GeneralReports to Child Welfare Services (CWS) are handled in one of three ways through the differential response system:
■ Reports assessed with low risk and no safety issues identified are referred to Family Strengthening Services (FSS).
■ Moderate risk reports with no safety issues identified are diverted to Voluntary Case Management (VCM).
■ The reports assessed with severe/high risk and safety issues identified are assigned to a CWS unit for investigation.
There are no identified alleged victims of maltreatment in reports assigned to Family Strengthening Services (FSS) and Voluntary Case Management (VCM). While VCM cases are documented in the Child Welfare data base, they are non-Protective Services cases. FSS reports/cases are not documented in the state Child Protection System. In FSS and VCM assessments, if maltreatment or a safety concern is indicated, the case will be returned to CWS for investigation.
ReportsThe NCANDS category of “other” maltreatment type includes the state categories of threatened abuse and threatened neglect. Threatened harm does not meet the level of evidence for psycholog-ical abuse or physical abuse. “Threatened Harm means any reasonably foreseeable substantial risk of harm to a child,” HRS §587a-4. Threatened Harm is recognized in Hawaii Revised Statutes.
Hawaii uses three disposition categories: confirmed, unconfirmed and unsubstantiated. A child is categorized in NCANDS as substantiated if one or more of the alleged maltreat-ments is confirmed with more than 50 percent certainty and as unsubstantiated if the alleged maltreatment is not confirmed with more than 50 percent certainty or is unsubstantiated.
Fatalities We report all child fatalities as a result of maltreatment in the state Child Protection System. The Medical Examiner’s office, local law enforcement and Kapiolani Child Protection Center–Multidisciplinary Team conducts reviews on death or near-death cases of maltreatment.
PerpetratorsThe state CPS system designates up to two perpetrators per child. The perpetrator maltreat-ment fields are currently blank. The information was in writing, not coded for data collection.
ServicesThe state is not able to report some children and families receiving prevention services under the Child Abuse and Neglect State Grant, the Social Services Block Grant, and the NCANDS Category of “other” funding sources because funds are mixed. Funds are allocated into a single budget classification and multiple sources of state and Federal funding are combined to pay for most services. All active cases receive services.
Appendix d: State Commentary 154Child Maltreatment 2017
IdahoContact Robbin Thomas Phone 208–334–5798
Title Business Analyst Email [email protected]
Address Idaho Department of Health and Welfare450 West State Street, 5th FloorBoise, ID 83720
GeneralIdaho does not have an alternative response to screened-in referrals.
ReportsIdaho has a centralized intake unit which includes a 24-hour telephone line for child welfare referrals. The intake unit maintains a specially trained staff to answer, document, and pri-oritize calls, and documentation systems that enable a quicker response and effective quality assurance. Allegations are screened out and not assessed when:
■ The alleged perpetrator is not a parent or caregiver for a child, the alleged perpetrator no longer has access to the child, the child’s parent or caregiver is able to be protective of the child to prevent the child from further maltreatment, and all allegations that a criminal act may have taken place have been forwarded to law enforcement.
■ The alleged victim is under 18 years of age and is married. ■ The alleged victim is unborn. ■ The alleged victim is 18 years of age or older at the time of the report, even if the alleged
abuse occurred when the individual was under 18 years of age. If the individual is over 18 years of age, but is vulnerable (physically or mentally disabled), all pertinent information should be forwarded to Adult Protective Services and law enforcement.
■ There is no current evidence of physical abuse or neglect and/or the alleged abuse, neglect, or abandonment occurred in the past and there is no evidence to support the allegations.
■ Although Child and Family Safety (CFS) recognizes the emotional impact of domestic violence on children, due to capacity of intake, we only can respond to referrals of domestic violence that involve a child’s safety. Please see the priority response guidelines for more information regarding child safety in domestic violence situations. Referrals alleging that a child is witnessing their parent/caregiver being hurt will be forwarded to law enforcement for their consideration. Additionally, referents will be given referrals to community resources.
■ Allegations are that the child’s parents or caregiver use drugs, but there is no reported connection between drug usage and specific maltreatment of the child. All allegations that a criminal act may have taken place must be forwarded to law enforcement.
■ Parental lifestyle concerns exist, but don’t result in specific maltreatment of the child. ■ Allegations are that children are neglected as the result of poverty. These referrals should
be assessed as potential service need cases. ■ Allegations are that children have untreated head lice without other medical concerns. ■ Child custody issues exist, but don’t allege abuse or neglect or don’t meet agency defini-
tions of abuse or neglect. ■ More than one referral describes the identical issues or concerns as described in a previous
referral. Multiple duplicate referrals made by the same referent should be staffed with the local county multi-disciplinary team for recommendations in planning a response.
More information regarding intake, screening, and priority guideline standards can be found on the Idaho Health and Welfare website.
Appendix d: State Commentary 155Child Maltreatment 2017
The investigation start date is defined as the date and time the child is seen by a Child Protective Services (CPS) social worker. The date and time are compared against the report date and time when CPS was notified about the alleged abuse. Idaho only reports substanti-ated, unsubstantiated: insufficient evidence, and unsubstantiated: erroneous report disposi-tions. Most regions are not large enough to dedicate staff separately into screening, intake, and assessment workers.
ChildrenAt this time, the Statewide Automated Child Welfare Information System (SACWIS) can-not provide living arrangement information to the degree of detail requested. The state’s SACWIS counts children by region rather than by county. There are seven regions in Idaho. The NCANDS category of “other” maltreatment types includes the state categories of abandonment, adolescent conflict, exploitation, alcohol addiction, drug addiction, and finding of aggravated circumstances.
For caregiver risk factors, Idaho’s safety assessment model was implemented in early federal fiscal year (FFY) 2015 and does not list domestic violence or financial issues as separate risk issues. These risk issues are captured under broader risk issue of dangerous living environ-ment/child fearful of home situation/caregiver with uncontrolled or violent behavior and the risk issue of unused or unavailable resources.
Fatalities Idaho compares fatality data from the Division of Family and Community Services with the Division of Vital Statistics for all children younger than 18. The Division of Vital Statistics confirms all fatalities reported by child welfare via the state’s SACWIS and provides the number of fatalities for all children for whom the cause of death is homicide.
Services Currently, Idaho is unable to report public assistance data due to constraints between Idaho’s Welfare Information System and SACWIS.
Idaho (continued)
Appendix d: State Commentary 156Child Maltreatment 2017
IllinoisContact David Nika Phone 217–558–5060
Title Supervisor – Legacy Mars Team Email [email protected]
Address Illinois Department of Children and Family Services 1 North Old State Capitol Plaza Springfield, IL 62701
The state did not provide commentary in time for the release of the Child Maltreatment 2017 report.
Appendix d: State Commentary 157Child Maltreatment 2017
Indiana Contact Latricia Denning Phone 317–719–7826
Title Operations Analyst I Email [email protected]
Address Indiana Department of Child Services 302 W. Washington Street, E306Indianapolis, IN 46204
GeneralIn July 2012, Indiana instituted a new child welfare information system: The Management Gateway for Indiana’s Kids (MaGIK). Coinciding with the implementation of MaGIK, the department also developed a new extraction code and mapping documents to effectively col-lect and organize data for NCANDS. Indiana has engaged in continuous improvement efforts to refine the data collection and mapping process through system modifications and overall enhancements, including a new intake system that launched in February 2016. To facilitate these efforts, Indiana sought out technical assistance through the National Resource Center for Child Welfare Data and Technology (NRC-CWDT). MaGIK is an ever-evolving umbrella system which has further incorporated services, billing, case management, and the overall data management, organization, and extraction components.
ReportsThe Indiana Department of Child Services (DCS) does not assign for assessment a referral of alleged child abuse or neglect that does not:
■ Meet the statutory definition of child abuse and neglect; and/or ■ Contain sufficient information to either identify or locate the child and/or family and
initiate an assessment (Indiana Policy Manual 3.6). Based on findings from the Commission to Eliminate Child Abuse and Neglect Fatalities, the Indiana Department of Child Services does not screen out reports that allege abuse or neglect against a child that is under the age of 3 as of July 2016.
The following four types of referrals do not receive an assessment: ■ Screen out: These referrals meet one or both conditions listed above. No further action
is taken within or outside of the department due to insufficient information by the report source or the information given to the hotline does not meet requirements for diversion to voluntary services or information and referral.
■ Refer to Licensing: These referrals meet the first condition above and meet requirements for a response from the departments licensing unit. (E.g., reporter has concerns about a foster home that do not meet statutory definition of child abuse and neglect, but complaint does cause licensing concern/s such as too many children living in a foster home).
■ Service Request: These referrals meet the first condition above and meet action require-ments for the family to be contacted for voluntary services coordinated or provided by the department. These referrals would include service requests through the DCS Children’s Mental Health Initiative and the Collaborative Care Program.
■ Information and Referral: Referral meets the first condition listed above and the report source is given information by hotline staff and verbally referred to outside agencies as appropriate. (E.g. Reporter is concerned about developmental issues with their child. The hotline would give the report source information about and contact information for Indiana’s early intervention program).
Appendix d: State Commentary 158Child Maltreatment 2017
Indiana has also instituted daily Safety Staffings between field workers and supervisors, which emphasizes ensuring the safety of children as quickly as possible. This has resulted in a significant reduction in reported time to investigation.
Children Beginning July 2016, the Indiana Department of Child Services does not screen out reports that allege abuse or neglect against a child that is under the age of 3. A large decrease in screened out reports was seen in federal fiscal year (FFY) 2016, and FFY 2017 represents a full FFY of this policy. This also resulted in increases for records, unique reports, unique children, and duplicate nonvictims.
Indiana continues to work with its field staff responsible for entering reports and completing assessments and emphasizing the importance of entering all applicable data, including child risk factors.
Fatalities All data regarding child fatalities are submitted exclusively in the Child File.
PerpetratorsIndiana launched a new intake system in February 2016 that better aligns with the system used for completing assessments and case management cases. This has allowed for more accurate perpetrator data entry.
ServicesImprovements in data collection allowed Indiana to report prevention data by child. Therefore, to not duplicate counts, Indiana does not provide prevention data on a family level.
Indiana increased the total expenditures for Community Partners and expended more federal funds and less state funds this year. More children were reported as receiving services this year, fewer with state funds and more with federal funds. Title IVB–Promoting Safe and Stable Families also increased by a substantial amount, which allowed Indiana to serve more children.
Indiana (continued)
Appendix d: State Commentary 159Child Maltreatment 2017
IowaContact Dr. Jesse Renny-Byfield Phone 515–281–6379
Title Management Analyst II Email [email protected]
Address Iowa Department of Human ServicesHoover State Office Building 1305 East WalnutDes Moines, IA 50319
GeneralThis last federal fiscal year (FFY), Iowa experienced across the board increases in caseloads, and number of children going through the system. This resulted from two high-profile abuse cases. In the wake of this, accepted intakes increased from about half to nearly three-quarters of allegations made. Simultaneously, the state government restructured contracts for state workers, resulting in additional personnel challenges in the face of an increased caseload. Consequently, Iowa’s child-protection workforce must meet the challenges of increased pres-sure on slim resources. State workforce remains dedicated to child safety first and foremost, and to preserving resources for vulnerable families. The state continuously strives to improve service delivery by scrutinizing data and implementing practice changes to address needs. Iowa strives to eliminate biases and to maintain consistency across services and outcomes.
ReportsIn FFY 2017, the number of abuse and neglect reports increased, likely reflecting both an increase in Iowa’s youth population, and due to two high-profile cases that turned attention to Iowa’s Child Welfare system and spurred an increased caseload. All abuse categories rose in counts, again likely owing to an increase caseload for the state. Additionally, a practice change in the last year mandates that any additional allegations form the basis on an addi-tional and separate assessment, rather than additional allegations on an existing case.
ChildrenIn FFY 2017, the number of children involved in an abuse assessment increased from FFY2016. In addition to the reasons enumerated above, the state also worked to improve training for mandatory reporters. Each of these things increased awareness and therefore reporting on suspected child abuse.
Fatalities The number of child fatalities rose from FFY 2016 to FFY 2017. This is likely due to Iowa’s rapidly growing under-18 population. Additionally, Iowa is facing increased pressure on its system due to increased parental substance abuse and decreased funding for services. Starting in FFY 2015, child fatalities where abuse was a contributing factor also were reported. The state works collaboratively with a multidisciplinary child death review team for all child deaths, not only those related to abuse and neglect.
PerpetratorsStarting with the FFY 2014 NCANDS submission, Iowa reported information in the per-petrator fields in the Child File. To be considered a perpetrator in Iowa, an individual must have had caregiver responsibilities at the time of the alleged abuse, and the assessment must conclude that the individual was responsible for the abuse.
Appendix d: State Commentary 160Child Maltreatment 2017
Services Iowa has both prevention and postresponse services. Postresponse services are under the state’s pay-for-results model of child welfare and are closely coordinated and linked with Child Protection Workers to enable a smooth transition
Iowa (continued)
Appendix d: State Commentary 161Child Maltreatment 2017
KansasContact Jill Loebel Phone 785–368–8172
Title Data, Continuous Performance Improvement & Systems Management Unit
Email [email protected]
Address Kansas Department for Children and Families555 S. Kansas AvenueTopeka, KS 66603
GeneralIn July 2016, Kansas’s level of evidence changed from clear and convincing to preponder-ance. In addition to the finding category of substantiated, another finding category of affirmed was added as of July 2016. Affirmed is defined as a reasonable person weighing the facts and circumstances would conclude it is more than likely than not (preponderance of the evidence) the alleged perpetrator’s actions or inactions meet the abuse/neglect definition per Kansas Statutes Annotated (K.S.A.) and Kansas Administrative Regulations (K.A.R.). Furthermore, the state finding, unable to locate was also added as a finding category back in January 2014 and is mapped to closed no finding in NCANDS.
ReportsReasons for screening out allegations of child abuse and neglect include:
■ Initial assessment of reported information does not meet the statutory definition: Report does not contain information that indicates abuse and neglect allegations according to Kansas law or agency policy.
■ Report fails to provide the information necessary to locate child: Report doesn’t provide an address, adequate identifying information to search for a family, a school where a child might be attending, or any other available means to locate a child.
■ Report is known to be fictitious or malicious: Report received from a source with a demonstrated history of making reports that prove to be fictitious or malicious, and the current report contains no new or credible allegations of abuse or neglect
■ The Department of Children and Families (DCF) does not have authority to proceed or has a conflict of interest if: Incidents occur on a Native American reservation or military installation; alleged perpetrator is a DCF employee; alleged incident took place in an institution operated by DCF or Kansas Department of Corrections–Juvenile Services (KDOC-JS); or alleged victim is age 18 or older.
■ Incident has been or is being assessed by DCF or law enforcement: Previous report with the same allegations, same victims, and same perpetrators has been assessed or is cur-rently being assessed by DCF or law enforcement.
The NCANDS category of “other” report source includes the state categories of self, private agencies, religious leaders, guardian, Job Corp, landlord, Indian tribe or court, other person, out-of-state agency, citizen review board member, collateral witness, public official, volun-teer and Crippled Children’s services.
ChildrenThe NCANDS category of “other” maltreatment type includes the state category of lack of supervision.
Appendix d: State Commentary 162Child Maltreatment 2017
Fatalities Kansas uses data from the Family and Child Tracking System (FACTS) to report fatalities to NCANDS. Maltreatment findings recorded in FACTS on child fatalities are made from joint investigations with law enforcement. The investigation from law enforcement and any report from medical examiner’s office would be used to determine if the child’s fatality was caused by maltreatment. The Kansas Child Death Review Board reviews all child deaths in the state of Kansas. Child fatalities reported to NCANDS are child deaths as a result of maltreatment. Reviews completed by the state child death review are completed after all the investigations, medical examiner’s results, and any other information related to the death is made available. The review by this board does not take place at the time of death or during the investigation of death. The state’s vital statistics reports on aggregate data are not information specific to an individual child’s death. Kansas is using all information sources currently made available when child fatalities are reviewed by the state child death review board.
PerpetratorsThe NCANDS category of “other” perpetrator relationship includes the state category of not related.
Services Kansas does not capture information on court-appointed representatives. However, Kansas statute (K.S.A. 38-2205) requires the child to have a court-appointed attorney (GAL).
Kansas (continued)
Appendix d: State Commentary 163Child Maltreatment 2017
KentuckyContact Tracy DeSimone Phone 502–564–7635
Title Branch Manager, Quality Assurance and Policy Development
Email [email protected]
Address Kentucky Department for Community Based Services275 East Main Street, 3E-A, Frankfort, KY 40621
GeneralKentucky does not have an alternative or differential response. In 2014, the state began utilizing a new approach to the investigation response (IR) and the alternative response (AR). Before the change in the business process, the intake worker made the decision regarding IR/AR at intake. With the new approach, the assessment worker makes the IR/AR determination at the completion of the assessment. In other words, IR/AR is now a finding, rather than an assessment path. Kentucky’s name for the IR is investigation and for AR is family in need of services. Kentucky’s business practice does allow multiple maltreatment levels to be present in a single report. For example, one report could have a disposition/finding of unsubstanti-ated and services needed if it was determined that maltreatment did not occur, but the family needed services from the agency.
In federal fiscal year (FFY) 2016, Kentucky removed the dispositional finding of services not needed from the standards of practice (SOP) and from the Statewide Automated Child Welfare Information System (SACWIS). Mapping has been reviewed and updated as appro-priate. Kentucky currently has the following dispositional findings for investigations/assess-ments: death/near death substantiated, found/substantiated, substantiated, unsubstantiated, and services needed. Kentucky no longer maps a dispositional finding to AR-nonvictim.
Family structure/living arrangement values have been changed in Kentucky’s SACWIS to improve NCANDS reporting. Kentucky now collects data for the following values: single mother household; single father household; single mother household with one other adult; single father household with one other adult; married couple; unmarried two parent household with two biological/adoptive parents; unmarried two parent household with one biological/adoptive parent and one cohabitating partner; two parent household, marital status unknown; nonparent relative caregiver household (includes relative foster care); and nonrela-tive caregiver household (includes nonrelative foster care). The option of unknown living arrangement has been removed from the SACWIS.
Modifications were made to populations identified as reunited with families. In past submis-sions, this included youth exiting to relatives. The current methodology only considers the population with an exit reason of reunification with the parent/primary caregiver. Kentucky also changed the matching dataset of child victims from the referral dataset to the NCANDS management report to closer align with NCANDS Child File submission data.
Program and IT staff have worked since the prior submission and will continue to work to make improvements regarding data extraction and reporting, as well as verifying that the data mapping is correct based on the modifications made to SACWIS.
Appendix d: State Commentary 164Child Maltreatment 2017
ReportsThe state does not collect in-depth information regarding the number of children who are screened out for referrals that do not meet criteria for abuse or neglect. There have been no changes in data collection or the extraction process that would result in an increase in reports. The state will continue to monitor.
ChildrenChild alcohol use/abuse risk factor, along with drug use/abuse and other child behavioral issues, are optional selections when completing assessments in the SACWIS. Workers also may choose the option no risk factors. The state will continue to monitor reporting of this risk factor and will make modifications as necessary.
There have been no changes in data collection or the extraction process that would result in an increase in victims. The state will continue to monitor.
Fatalities Kentucky has confirmed the fatality count for the FFY 2017 submission.
PerpetratorsIn the FFY 2015 and FFY 2016 submissions, if there were multiple perpetrators named in an incident, only one was reported per program/subprogram. This has been corrected and has led to an increase in total number of unique perpetrators reported. Since the last submission, the state made an extraction/mapping change to report perpetrator as a prior abuser more accurately.
ServicesThe state began collecting information regarding court-appointed representatives within the last FFY. The state will continue to monitor these data and will work toward improving this for future submissions.
Kentucky reported service data for victims and nonvictims. In 2017, Kentucky used SSBG funds for protective services and did not contribute to prevention services for families or children.
The state has entered into a data exchange with the Kentucky Department of Education in efforts to collect data regarding referrals to agencies providing early intervention services under Part C of the Individuals with Disabilities Education Act. However, the data requested in the NCANDS Agency File is not included within that data exchange. The state will continue to work toward providing these data in future submissions.
Kentucky (continued)
Appendix d: State Commentary 165Child Maltreatment 2017
LouisianaContact Kristen Brown Phone 225–342–6703
Title Child Welfare Consultant Email [email protected]
Address Louisiana Department of Children and Family ServicesPO Box 3318Baton Rouge, LA 70821
GeneralThe Louisiana Department of Children and Family Services (DCFS) continues to review and revise the extraction methodology used to extract the Child File. These changes often reflect system enhancements that have been completed since the previous submission, requiring updates to how DCFS data is mapped. Further, the Department revises the extraction process to address identified gaps in reporting, as well possible corrections to errors identified during the extraction process in an attempt to improve overall data quality.
Louisiana employs only one type of screened-in response called Child Protection Assessment and Services (CPS). The CPS program uses the same safety and risk assessment instruments and documentation protocols for all screened-in reports.
ReportsIn Louisiana, referrals of child abuse and neglect are received through a centralized intake center that operates on a 24-hour basis. The centralized intake worker and supervisor review the information using a structured, advanced safety model tool to determine whether the case meets the legal criteria for intervention. Referrals are screened in if they meet three primary criteria for case acceptance:
■ A child victim younger than 18 years ■ An allegation of child abuse or neglect as defined by the Louisiana Children’s Code ■ The alleged perpetrator meets the legal definition of a caregiver of the alleged victim
The primary reason for screened-out referrals is that either the allegation or the alleged perpetrator does not meet the legal criteria. Some intake reports are neither screened-out nor accepted. Generally, if a second report is received within 30 days of receipt of an initial report that is still under investigation, the second report is classified as an additional informa-tion report. These additional information reports are often related to active investigations, in-home services cases, or out-of-home services cases. Beginning in federal fiscal year (FFY) 2016, more specialized training was provided to centralized intake managers to aid in determining what cases should be accepted in accordance with the Louisiana Children’s Code definition of child abuse and neglect.
After the discontinuation of alternative response family assessments (ARFA) in 2014, a priority system change was implemented. In the past, Louisiana had 5 separate response priorities: Immediate (contact within 24 hours), high priority (contact within 3 days), non-emergency (Contact within 5 days), ARFA 3-day and ARFA 5-day. The new priority system was implemented with four separate priorities: Priority 1 (contact within 24 hours), priority 2 (contact within 48 hours), priority 3 (contact within calendar 3 days), and priority 4 (contact within 5 calendar days).
Over the past several years, Louisiana has seen increased worker turnover. As a result, veteran caseworkers see an increased caseload as new staff are required to carry a reduced
Appendix d: State Commentary 166Child Maltreatment 2017
caseload during their first 6 months of service with the Department. Higher caseloads can also impact increased response time overall.
The state disposition of valid is coded to the NCANDS disposition of substantiated. When determining a final finding of valid child abuse or neglect, the worker and supervisor review the information gathered during the investigation, and if any of the following answers are “yes,” then the allegation is valid:
■ An act or a physical or mental injury which seriously endangered a child’s physical, mental or emotional health and safety; or
■ A refusal or unreasonable failure to provide necessary food, clothing, shelter, care, treat-ment or counseling which substantially threatened or impaired a child’s physical, mental, or emotional health and safety; or a newborn identified as affected by the illegal use of a controlled dangerous substance or withdrawal symptoms as a result of prenatal illegal drug exposure; and
■ The direct or indirect cause of the alleged or other injury, harm or extreme risk of harm is a parent; a caregiver as defined in the Louisiana Children’s Code; an adult occupant of the household in which the child victim normally resides; or, a person who maintains an interpersonal dating or engagement relationship with the parent or caregiver or legal custodian who does not reside with the parent or caregiver or legal custodian.
The NCANDS disposition of unsubstantiated investigation case is coded in the state as having a disposition of invalid. This disposition is defined as a case with no injury or harm, no extreme risk of harm, insufficient evidence to meet validity standard, or a noncaregiver perpetrator. If there is insufficient evidence to meet the agencies standard of abuse or neglect by a parent, caregiver, adult household occupant, or person who is dating or engaged to a parent or caregiver, the allegation shall be found invalid. If there is evidence that any person other than the parent, caregiver, or adult household occupant has injured a child with no culpability by a parent, caregiver, adult household occupant, or a person dating/ engaged to one of the aforementioned, the case will be determined invalid.
It is expected that the worker and supervisor will determine a finding of invalid or valid whenever possible. For cases in which the investigation findings do not meet the standard for invalid or valid, additional contacts or investigative activities should be conducted to deter-mine a finding. When a finding cannot be determined following such efforts, an inconclusive finding is considered. It is appropriate when there is some evidence to support a finding that abuse or neglect occurred but there is not enough credible evidence to meet the standard for a valid finding. The inconclusive finding is only appropriate for cases in which there are particular facts or dynamics that give the worker or supervisor a reason to suspect child abuse or neglect occurred.
Fatalities For FFY 2017, there was a significant decrease in the number of validated (substantiated) child abuse/neglect related fatalities reported over FFY 2016. The incidence of fatalities varies from year to year; therefore, there is no clear explanation as to the observed variation from FFY 2016 to 2017.
Louisiana (continued)
Appendix d: State Commentary 167Child Maltreatment 2017
PerpetratorsThe current method of extracting NCANDS data captures perpetrator involvement in family investigation cases but does not capture perpetrator relationship to child victims. Therefore, perpetrator relationship is reported as unknown for the majority of cases.
Services The Child Welfare agency provides such post-investigation services as foster care, adoption, in-home family services, protective daycare and family-in-need of services. Many services are provided through contracted providers and are not reportable in the Child File. To the extent possible, the number of families and children receiving services through Title IV-B funded activities are reported in the Agency File.
Louisiana (continued)
Appendix d: State Commentary 168Child Maltreatment 2017
MaineContact Lori Geiger Phone 207–624–7911
Title Information Systems Manager Email [email protected]
Address Office of Child and Family ServicesMaine Department of Health and Human Services2 Anthony Avenue, 11 State House StationAugusta, ME 04333–0011
GeneralAs of May 2017, Maine utilizes The SDM Intake Screening and Response Priority Tool. It ensures that all reports received are assessed for meeting the statutory threshold for an in-person Office of Child and Family Services (OCFS) response. It identifies how quickly to respond, the path of response, and whether a Community Intervention Program (CIP) or prevention service referral is appropriate. Prevention services may return a report to the State Child Welfare Intake if further determination is required after an assignment.
ReportsThe number of alleged abuse and neglect reports received by Maine’s Intake Unit decreased in FFY 2017 from FFY 2016. All reports, including reports that are not appropriate, and are referred to as screened out, are documented in the SACWIS. The screening decision is performed at the Intake Unit using the SDM Tool. Reports that do not meet the statutory definition of child abuse and/or neglect and which the criteria for appropriateness of child abuse /neglect report for response is not met, are preliminarily screened out. The Maine statutory definition of child abuse and/or neglect is a threat to a child’s health or welfare by physical, mental or emotional injury or impairment, sexual abuse or exploitation, depriva-tion of essential needs or lack of protection from these or failure to ensure compliance with school attendance requirements under Title 20–A, section 3272, subsection 2, paragraph B or section 5051–A, subsection 1, paragraph C, by a person responsible for the child.
Maine’s report investigation start date is defined as the date and time (in hours and minutes) of the first face-to-face contact with an alleged victim. Maine Child Welfare Policy requires an immediate response to occur within 24 hours of the approval of a report as appropriate for child protective services.
ChildrenThe total number of victims associated with completed assessments in FFY 2017 increased slightly by from FFY 2016. The state documents all household members and other individu-als involved in a report. Some children in the household do not have specific allegations associated with them, and so are not designated as alleged victims. These children are not included in the NCANDS Child File.
For the NCANDS category of victims in a substantiated report, Maine combines children with the state dispositions of indicated and substantiated. The term indicated is used when maltreatment found is low to moderate severity. The term substantiated is used when the maltreatment found is high severity.
Fatalities In 2017, Maine deployed into the Statewide Automated Child Welfare Information System (SACWIS) the ability to track child deaths at time of report, during assessment or while in
Appendix d: State Commentary 169Child Maltreatment 2017
care. Various state offices, along with the multi-disciplinary child death and serious injury review board, continue to share and compile child fatality data.
PerpetratorsRelationships of perpetrators to victims are designated in the SACWIS. Perpetrators receive notice of their rights to appeal any maltreatment finding. Low- to moderate-severity findings that are appealed result in only a desk review. High-severity findings that are appealed can result in an administrative hearing with due process.
Services Only services that are paid for by Maine Care through a Child Welfare approved service authorization are included in the Child File. In the coming year, Maine, will identify preven-tion services provided to children/families that may be included in a future NCANDS Child File.
Maine (continued)
Appendix d: State Commentary 170Child Maltreatment 2017
MarylandContact David Ayer Phone 410–767–8946
Title Deputy Executive Director of Operations Email [email protected]
Address Maryland Department of Human Resources311 West Saratoga Street, 5th FloorBaltimore, MD 21201
GeneralMaryland had made several improvements to its NCANDS submission. The state is undertaking a new information technology development process to replacing its Statewide Automated Child Welfare Information System (SACWIS) with the Comprehensive Child Welfare Information System (CCWIS), and additional updates to the NCANDS file will not be made until that work is completed.
Maryland continues to implement alternative response. The state completed the phased-in implementation of its alternative response program in July 2014. The final evaluation report was published September 2015 and can be accessed online.
Maryland also implemented its IV-E Waiver Demonstration, known as Families Blossom, and began implementation during the summer of 2015. The IV-E Waiver enables Maryland to extend its vision to prevent and divert children and families from foster care, reduce the need for foster care, and have timely and lasting permanency for the children and families the state serves. Families Blossom is focused on extending Maryland’s success with family centered services by using trauma-informed assessment and evidence-based practices, increasing data analytics capabilities to monitor trends and progress, and applying implementation science to create an organization that will inculcate collaboration and partnership on all levels and hold us all accountable as we serve children and families.
ReportsMaryland’s current CPS response follows the same rules for both alternative or investigative responses:
■ Alleged perpetrators and alleged victims are noted in the record ■ Alleged child victims must be seen within 24 hours when abuse is alleged, and within 5
days when neglect is alleged ■ Child safety and risk of maltreatment must be assessed ■ The CPS response must be completed within 60 days ■ Additional services may be offered including in-home or out-of-home services
Alternative response targets low risk reports of child neglect and abuse, and although the alleged victims and alleged perpetrators are noted in the record, the case does not establish findings concerning maltreatment, nor are the children receiving Alternative response coded as victims. Instead, alternative response allows local departments of social services to help Maryland families to access services, supports, and other assistance that will address their concerns. Families screened in for CPS who are eligible but refuse to participate in Alternative Response are reassigned to Investigative Response. Investigative response differs from alternative response by targeting moderate to high risk reports of child neglect and abuse which results in a finding concerning maltreatment. This is Maryland’s traditional CPS investigation.
Appendix d: State Commentary 171Child Maltreatment 2017
Once assigned to alternative response or investigative response, the CPS caseworker begins to meet the family and children. If circumstances on the ground are found to be quite differ-ent than reported, the CPS caseworker, with supervisor approval, may reassign the CPS case from alternative response to investigative response, or vice versa.
ChildrenThe population of children in foster care has been decreasing during the past several years. The NCANDS category of neglect includes medical neglect as state statute and policy do not define them separately.
Fatalities Child fatalities where child maltreatment is a factor are usually reported by the local depart-ments of social services. In addition, the Department of Human Resources (DHR) and local departments also get information about these fatalities from local interagency fatality review teams and from the Department of Health and Mental Hygiene’s Child Fatality Review Team, and the Office of the Chief Medical Examiner.
PerpetratorsMaryland does not meet the standard for percent of records containing perpetrator relation-ship, but reporting has improved. Relationship information is not saved for records that are expunged. Making changes to expungement is complex, and because Maryland is now devoting resources to replacing the current system, it may not be possible to resolve this issue until the new child welfare replacement system is implemented.
Services Maryland continues, as part of its family-centered practice, to use family involvement meet-ings which are expected to have positive impacts on the safety, permanency, and well-being of children receiving child welfare services, at various trigger points:
■ removal/considered removal ■ placement change ■ recommendation for permanency plan change ■ youth transition plan ■ voluntary placement
As part of its Families Blossom IV–E Waiver, Maryland is focusing on safely reducing entries and reentries into foster care through a combination of targeted family support funds, evidence-based practices and promising practices based on local needs assessment, and increasing family preservation services, all geared to supporting and strengthening families.
Maryland (continued)
Appendix d: State Commentary 172Child Maltreatment 2017
MassachusettsContact Nicholas Campolettano Phone 617–748–2214
Title Management Analyst Email [email protected]
Address Massachusetts Department of Children and Families600 Washington StreetBoston, MA 02211
GeneralIn March 2016, the Massachusetts Department of Children and Families (DCF) implemented major changes to policies and practices focused on ensuring the safety of children in the Commonwealth’s child welfare system. The new Protective Intake Policy substantially updated and clarified protocols for DCF’s screening and investigation of reports of abuse or neglect. The changes also included a first ever Supervision Policy designed to support DCF front-line workers in decision-making and to identify circumstances where cases need to be elevated for collaborative higher-level review.
ReportsThe Protective Intake Policy created a comprehensive set of procedures to guide the Department’s review and investigation of reports of abuse or neglect. Details of the new policy include: Screening
■ Requires non-emergency reports of abuse and neglect to be reviewed and screened in or out in one business day—reduced from three days previously. Emergency reports continue to require an immediate screening decision and an investigatory response within 2 hours.
■ Introduces screening teams comprised of social workers, supervisors, and managers in all 29 DCF area offices charged with reviewing new reports of abuse or neglect in open cases, reports associated to cases with three or more separate incidents of alleged abuse/neglect in the past 12 months, and other reports indicating reasons for elevated concern.
■ Mandates review of all information about the child and caregiver’s prior DCF involvement and review of any comparable information available from child welfare agencies in other states, including cases in which a parent has previously lost custody of a child.
■ Requires CORI (Criminal Offender Record Information), SORI (Sexual Offender Record Information), and national criminal history database checks of parents/caregivers and all household members over 15 years old.
■ Requires requests from law enforcement for information on 911 calls and police responses to the residence of any child or family involved in a report of abuse or neglect.
Investigative Response ■ Creates a single child protection response to all screened in reports that eliminates the
practice of tiered or “differential response” at screening. All reports that are screened in will now be assigned for a response by an Investigation Trained Response Worker. The revised policy places decision-making regarding the appropriate level of department intervention after the response–the point at which the Department has interviewed the child and caregiver involved and substantially investigated the report of abuse or neglect.
■ Emergency responses must be completed in 5 working days; non-emergency responses must be completed in 15 workings days.
■ As with the prior policy, requires response workers to interview parents, caregivers and other children in the home as well as the person allegedly responsible for the abuse or neglect.
Appendix d: State Commentary 173Child Maltreatment 2017
■ Enables response workers, for the first time, to search online sources for information relevant to assessing child safety.
■ Includes an assessment of parental capacity by evaluating whether the parent understands how to keep the child safe, uses appropriate discipline methods and provides for the fam-ily’s basic needs, among other criteria.
■ Mandates use of the Department’s Risk Assessment Tool to assess potential future risks to the child’s safety.
■ Response outcomes are mapped to NCANDS outcomes as follows:• Supported is mapped to substantiated• Substantiated Concern is mapped to alternative response victim• Unsupported is mapped to Unsubstantiated at the report level and to Unsubstantiated
at the allegation level if the report decision is either Supported or Unsupported. If the report decision is Substantiated Concern, an allegation decision of Unsupported is mapped to alternative response nonvictim.
The number of screening and initial assessment/investigation workers listed is the estimated full-time equivalents (FTE) based on the number of screenings and initial assessments/inves-tigations completed during the federal fiscal year (FFY), divided by the monthly workload standard for the activity, divided by 12. The workload standards are 55 screenings per month and 10 initial assessments/investigations per month. The number includes both state staff and staff working for the Judge Baker Guidance Center, Massachusetts’ Hotline contractor. The hotline handles child protective service functions during night and weekend hours when state offices are closed. The number of workers completing assessments was not reported because assessments are case-management activities rather than screening, intake, and investigation activities. In FFY 2017, DCF social workers also performed screening, and investigation/initial assessment functions in addition to ongoing casework.
The investigation or initial AR start date is defined as the date the intake is screened-in for response and has not been reported. Massachusetts plans to start reporting response start dates in FFY 2018.
ChildrenChanges in the number of victims in comparison to the prior years are the result of the aforementioned policy changes implemented in March 2016. FFY 2017 is the first full federal fiscal year that the policy changes have been in effect for the entirety of.
The NCANDS category of neglect includes medical neglect; Massachusetts does not have a separate allegation type for medical neglect. Living arrangement data are not collected dur-ing investigations or initial assessments with enough specificity to report except for children who are in placement. Data on child health and behavior are collected, but it is not mandatory to enter the data during an investigation. Data on caregiver health and behavior conditions are not usually collected.
Fatalities Massachusetts reports child fatalities attributed to maltreatment only after information is received from the Registry of Vital Records and Statistics (RVRS). RVRS records for cases where child maltreatment is a suspected factor are not available until the medical
Massachusetts (continued)
Appendix d: State Commentary 174Child Maltreatment 2017
examiner’s office determines that child abuse or neglect was a contributing factor in a child’s death or certifies that it is unable to determine the manner of death. Information used to determine if the fatality was due to abuse or neglect also include data compiled by DCF’s Case Investigation Unit and reports of alleged child abuse and neglect filed by the state and regional child fatality review teams convened pursuant to Massachusetts law and law enforcement. As these data are not available until after the NCANDS Child File must be transmitted, the state reports a count of child fatalities due to maltreatment in the NCANDS Agency File. Massachusetts only reports fatalities due to abuse or neglect if an allegation related to the child’s death is supported.
Services Data are collected only for those services provided by DCF. DCF may be granted custody of a child who is never removed from home and placed in substitute care. In most cases when DCF is granted custody of a child, the child has an appointed representative. Representative data are not always recorded in FamilyNet.
Massachusetts (continued)
Appendix d: State Commentary 175Child Maltreatment 2017
MichiganContact Theresa Keyes Phone 517–574–2257
Title Division of Continuous Quality Improvement Manager
Email [email protected]
Address Michigan Department of Health and Human Services235 South Grand Avenue Suite 505 Lansing, Michigan 48933
Contact Cynthia Eberhard Phone 517–896–6213
Title Child Welfare Data Manager Email [email protected]
Address Michigan Department of Health and Human ServicesOne Michigan Avenue Building120 N. Washington Square, 8th FloorLansing, Michigan 48933
GeneralThe Michigan Department of Health and Human Services (MDHHS) continues its commit-ment to improving the state’s performance in outcomes related to child safety. Michigan does not have a differential response or alternative response program.
ChildrenMichigan’s Statewide Automated Child Welfare Information System (MiSACWIS) allows for reporting on individual children. Michigan is exploring ways to improve reporting specific child risk factors.
Fatalities In federal fiscal year (FFY) 2017, Michigan reported all child fatality data within the Child File.
Michigan receives reports on child fatalities from several sources including law enforcement agencies, medical examiners/coroners, and child death review teams. Fatality reports are not included in the NCANDS submission unless a link between the child fatality and maltreat-ment is established. This link occasionally is established after the completion of a Child Protective Services (CPS) investigation, as it is not uncommon for additional evidence to be obtained after the CPS investigation has been closed. In those situations, the MDHHS would take steps to accurately reflect the subsequent findings of the child death and ensure that it is documented using the most up to date evidence/details.
The MDHHS vital records office provides child fatalities information to the Children’s Services Agency. The determination of whether maltreatment occurred is dependent upon completion of a CPS investigation that confirmed abuse or neglect. The data on child fatali-ties are used by local review teams to provide recommendations to raise awareness and encourage initiatives to decrease child fatalities.
PerpetratorsPerpetrators are defined as persons responsible for a child’s health or welfare who have abused or neglected a child.
Services Michigan does not currently have the capability to accurately report on all prevention services in the Agency File. Michigan was able to report services from Promoting Safe and
Appendix d: State Commentary 176Child Maltreatment 2017
Stable Families through programing by Families First of Michigan, Family Reunification Program, Families Together Building Solutions–Pathways of Hope, and Protect the MiFamily IV–E Waiver.
Michigan does not refer children to the programs under the Individuals with Disabilities Education Act, and therefore does not provide Agency File data on these items.
Michigan (continued)
Appendix d: State Commentary 177Child Maltreatment 2017
MinnesotaContact Jean Swanson-Broberg Phone 651–431–4746
Title Business/ Systems Analysis Supervisor Email [email protected]
Address Minnesota Department of Human ServicesPO Box 64239St Paul, MN 55164–0239
GeneralCurrently, the two response paths are referred to as family assessment response and family investigative response. The 2015 Legislature removed the statutory preference for family assessment. Reports alleging substantial child endangerment or sexual abuse, as defined by Minnesota statute, require a family investigative response. Child protection workers must document the reason(s) for providing a family investigative response and may include: statutorily required due to allegations of substantial child endangerment or sexual abuse, or discretionary use for reasons such as the frequency, similarity, or recentness of reports about the same family.
In September 2014, Governor Dayton issued an executive order creating a task force to review the child protection system and recommend improvements to place the protection of children as a top priority in Minnesota. Creation of the task force was prompted by the case of a Minnesota child who died after several reports were made to Child Protective Services (CPS). The Governor’s Task Force on Protection of Children submitted final recommenda-tions to the Governor and Minnesota Legislature about possible changes to Minnesota’s child protection response continuum in March 2015. Several recommendations resulted in legisla-tion changes during the 2015 and 2016 legislative sessions. The increase in number of reports of maltreatment for federal fiscal year (FFY) 2017 may be due, in part, to the increased attention that the public gave to child maltreatment issues during these past years.
Acceptance into either response path means that a report has been screened in as meeting Minnesota’s statutory definition of alleged child maltreatment, so allegations accepted for either response are reported through NCANDS. Family assessment response deals with the family system in a strengths-based approach and does not substantiate or make determina-tions of whether maltreatment occurred; however, a determination is made as to whether child protective services are needed to reduce the risk of any future maltreatment of the children.
Significant changes to the information system to make recording of child maltreatment reports an easier task for workers, while allowing for more detail, were implemented in late 2017.
ReportsData on CPS staff represent the full-time equivalent (FTE) of staff as reported by the local agencies (counties, combined agencies, and two tribal agencies). In Minnesota, CPS staff are employees of the local agencies rather than the state. Increased staffing levels are likely due, in part, to additional funding made available to local agencies late in FFY 2015.
During FFY 2017, the number of reports rose. This is likely in part a result of heightened scrutiny of child protective services over the past three years, as well as the increased reports received due to opioid abuse.
Appendix d: State Commentary 178Child Maltreatment 2017
Both responses (investigative and family assessment) apply to screened-in reports of alleged child maltreatment in Minnesota. A separate program, Parent Support Outreach Program (PSOP), offers early intervention supports and services to families when reports alleging child maltreatment are screened out or a family is voluntarily referred into the program. The number of children served under this program is reported under prevention services in the Agency File and is noted below in the services section.
Approximately 80 percent of screened-out referrals are because the stated concerns do not meet the definitions of child abuse or neglect under Minnesota law. Other reasons to screen out a referral include: reported children are not in the county’s jurisdiction, allegations have already been assessed or investigated, not enough identifying information was provided, or the incident did not occur within the family unit or a licensed facility. There is little variation in the proportion of screened-out referrals for each of the reasons across years.
Reports alleging substantial child endangerment or sexual abuse must be responded to within 24 hours. Other reports must be responded to within 5 days or 120 hours under Minnesota statutes. Large changes in average response time are due to a small number of extremely tardy investigation start times (time to first contact with alleged victims.) There are several reasons for delayed investigation start times, including coordination with other agencies, such as law enforcement, and inability to locate families.
Reports with either a substantiated determination of maltreatment or a determination of need for child protective services are retained for 10 years. Reports with neither determina-tion (including all family assessment response reports) are kept for 5 years. Screened-out child maltreatment reports now also are kept for 5 years. Timelines for record retention and destruction are set in Minnesota statutes.
The NCANDS category of “other” report sources include the state categories of clergy, Department of Human Services (DHS) birth match, other mandated reporter, and other nonmandated reporter.
ChildrenThe NCANDS category of “other” living arrangement includes state categories of indepen-dent living and other.
Fatalities For FFY 2017, there was a decline in the number of fatalities compared to FFY 2016. Minnesota’s Child Mortality Review Panel is a multidisciplinary team including representa-tives from state, local, and private agencies. Disciplines represented include social work, law enforcement, medical, legal, and university-level educators. The primary source of informa-tion on child deaths resulting from child maltreatment is the local agency child protective services staff; however, some reports originate with law enforcement or coroners/medical examiners. Local agencies also submit results of the required local child mortality review to the Minnesota DHS Child Mortality Review Team. The Minnesota DHS Child Mortality Review Team also regularly reviews death certificates filed with the Minnesota Department of Health (MDH) to ensure that all child deaths are reviewed. The Child Mortality Review Team directs the local agency to enter child deaths resulting from child maltreatment, but
Minnesota (continued)
Appendix d: State Commentary 179Child Maltreatment 2017
not previously recorded by child protective services, into Minnesota’s Statewide Automated Child Welfare Information System (SACWIS), in the order that complete data are available.
Occasionally, a child who was a resident of Minnesota is killed in a child abuse incident out of state. When the Child Mortality Review Team becomes aware of such a situation, information such as a police report is requested from law enforcement in the other state. The local agency in the Minnesota county of residence is asked to record the data in Minnesota’s SACWIS. The fatality data in this instance is delayed from the time of death, but eventually appears in Minnesota’s NCANDS mortality counts.
PerpetratorsThe NCANDS category of “other” perpetrator relationships includes the state category other nonrelative.
Services Primary prevention services are often provided without reference to individually identified recipients or their precise ages, so reporting by age is not possible. Clients with age unknown selected in the system are not included as specifically children or adults.
Data reported in prevention services funded by Community-Based Child Abuse Prevention (CBCAP) and Promoting Safe and Stable Families (Title IV-B) represents the unduplicated number of children who received Parent Support Outreach Program supports and services. Services in this program are provided to children and families who were reported as having an allegation of child maltreatment, but the reported allegation was screened out and did not receive a child protective response. Community agency referrals and self-referrals are also eligible for the Parent Support Outreach Program. This program is completely voluntary.
Services offered by local agencies vary greatly in availability between rural and metropolitan areas of the state. Although all agencies use a statewide service listing, resource development without a large customer base can be difficult. Cost effectiveness is an issue for providers who must serve large geographic areas that are sparsely populated.
In Minnesota, the court-appointed representatives report to the courts rather than to the local social services agencies. The state guardian ad litem (GAL) program implemented an auto-mated reporting system in July 2015. For the first time, reporting on an average number of contacts was possible. The out-of-court contacts reported are based on an annual count. The number of contacts is averaged across all reporting GALs statewide. It is anticipated that, as the guardians ad litem gain experience in using the new reporting system, that contact reporting will become more timely, complete and accurate.
There was an increase in the number of children referred to a community early intervention agency largely because there was an increase in the number of reports and the number of substantiated reports received during FFY 2017.
Minnesota (continued)
Appendix d: State Commentary 180Child Maltreatment 2017
MississippiContact Shirley Johnson Phone 601–359–4679
Title Continuous Quality Improvement/Data Reporting Unit (CQI/DRU)
Email [email protected]
Address Mississippi Department of Child Protection Services700 North StreetJackson, MS 39202
GeneralIn July 2016, the Division of Family and Children’s Services was transitioned to a free-stand-ing agency no longer under the purview of the Mississippi Department of Human Services (MDHS). The title of the new agency was established as the Mississippi Department of Child Protection Services (MDCPS). This department carries on the responsibilities of the Division of Family and Children’s Services. MDHS contracted with Social Work p.r.n. to provide services for the MDHS Mississippi Centralized Intake (MCI), 24-Hour Hotline (1–800–222–8000) as well as the Disaster Preparedness Plan. These services have transferred to MDCPS.
MCI service consists of receiving, entering, and screening to the appropriate county all incoming reports of maltreatment of children and vulnerable adults. The service operates 24-hours-a-day, seven-days-a week. Intake types are as follows:
■ Abuse, Neglect and Exploitation (ANE) ■ Information and Referral (I&R) ■ Case Management ■ Children in Need of Supervision (CHINS)/Unaccompanied Refugee Minors/Voluntary
Placement/Prevention Services ■ Resource Inquires
The state utilizes a system of assigning screening levels, which is a form of alternative response:
■ Level I includes reports that may not be appropriate for MDCPS investigation but may require referrals for information or services.
■ Level II requires a response from a MDCPS worker within 72 hours. ■ Level III requires a response from a MDCPS worker within 24 hours. Felonies and reports
of children in custody are assigned a Level III response.
In the event of a disaster, calls are received, and information is gathered for MDCPS con-cerning the location and contact information for resource families and staff. This information is provided to the MDCPS designated office periodically throughout the duration of the disaster and five (5) days immediately following. Alternate plans of communication with county staff are also provided in the event of office closure.
ReportsThe number of investigations has increased due to consistency in the screening process and availability of MCI. MCI documents every report alleging neglect and abuse on the front end and provides the information to the counties for the appropriate response.
A data report tracks the time elapsed between the date an intake was received by MCI and the date the investigation was both assigned to and initiated by the worker. In June 2013, the data report was modified to show only the date the intake was received by MCI and the date
Appendix d: State Commentary 181Child Maltreatment 2017
the investigation was initiated. When MDCPS receives a report that a child has been abused by a person responsible for the care and/or support of the child, a determination must be made that the abuse was not committed or contributed to by a parent, legal guardian, primary caregiver, or relative. This determination plays a role in whether the child is removed from the home.
Reports which may be screened out as Level I at intake: ■ Dirty houses or dirty children but no indication of life or health endangering situation. If
school/day care officials report dirty children, they should be requested to talk to parents first. If their attempts to meet with parents or to correct situation fail, then MDCPS accepts the report.
■ Children inappropriately dressed but no indication of neglect of a life or health endanger-ing situation.
■ Allegations that speak more to the parent’s behaviors rather than the child’s condition: (e.g., parent drinks beer or takes drugs; mother has boyfriend) but there is no indication of neglect or life or health endangering situation. All reports of mother/child testing positive for drugs are screened in.
■ Reports of crowded conditions or too many people living in a home but no indication of neglect or life or health endangering situation.
■ Allegations that parent is not spending Temporary Assistance for Needy Families (TANF), Food Stamps, child support or other income on children, but there is no indication of neglect of basic necessities, or of a life or health endangering situation. Reporters should be referred to local Economic Assistance office.
■ Reports which suggest a need to be addressed by another agency but there is no indication of a life or health endangering situation. (i.e., lack of school attendance, presence of lice, delinquency, lead/asbestos poisoning). These reports should be referred to the appropriate agency for handling (i.e., school attendance officer, health department).
■ Reports on teen pregnancy where there is no suspicion of abuse/neglect. ■ Reports that provide insufficient information to enable the Agency to locate the family,
and this information cannot be secured through other sources after all reasonable efforts have been made.
■ Reports of incidents that occurred when a person 18 or older was a child. When adults report that abuse/neglect was perpetrated on them as children, they must have some other information or reason to believe that children presently cared for by perpetrator are being abused/neglected.
■ Reports on an unborn child and there are no other children at risk. ■ Reports of sexual relations involving victims age 16 and older that meet all the cri-
teria below. If any one criterion does not apply, the report should be considered for investigation.• Alleged victim was age 16 or over at the time incident occurred, and• Alleged victim is a normally functioning child, and• Alleged victim, age 16 or older, willfully consented, and• Alleged perpetrator is not a parent, guardian, relative, custodian or person responsible
for the child’s care or support and resides in the child’s home, or an employee of a residential child care facility licensed by MDCPS, and or a person in a position of trust or authority.
• No parental or caregiver neglect is suspected.
Mississippi (continued)
Appendix d: State Commentary 182Child Maltreatment 2017
■ If a report is considered outside the jurisdiction of the MDCPS, the report shall be documented and be referred to law enforcement of proper jurisdiction for investigation, unless the report alleges human trafficking. In cases of any human trafficking, MDCPS is required to report the intake to law enforcement and to continue to investigate. Other services of the agency may be provided.
■ Reports of rape, sexual molestation, or exploitation of any age child that meet all the criteria below. If either (a) or (b) does not apply, the report should be considered for investigation.• Alleged perpetrator is not a caregiver, friend of caregiver, relative, other person living
in the home, or employee of a child care facility where the child attends or lives.• No parental or caregiver neglect is suspected.• Law enforcement has been informed of the report.
■ If law enforcement has not been contacted, County MDCPS will immediately make the report to them. Other services of County MDCPS will be offered to law enforcement (i.e., interviewing children) and the family (i.e., mental health referrals, counseling) as needed.
■ Reports of children who have not had their immunizations. Reporter should be referred to the County Health Department to contact a public health social worker or to the school attendance officer as appropriate.
■ Threats or attempts of suicide by children if there is no suspicion of parental/caregiver abuse or neglect. • If the nature of the report suggests that the child is in immediate danger of self-harm, a
referral should be made immediately to mental health and/or law enforcement. • If the reporter is a professional, they should be requested to refer the family to counsel-
ing. If the family does not follow through, then the case can be referred to MDCPS for neglect.
• If the reporter is a nonprofessional, the MDCPS should determine if family is seeking counseling. If not, MDCPS should investigate for neglect.
• If the reporter feels suspicion that abuse or neglect exists solely because suicide attempt was made, MDCPS will investigate.
■ Physical injury committed by one child on another that meet all the following criteria:• Child is not in a caretaking role over the other child.• No parental or caregiver neglect is suspected.• Child victim and perpetrator are not in a residential child caring facility or a home
licensed or approved by MDCPS. Fatalities Mississippi reports child fatalities for which the medical examiner or coroner ruled the manner of death was a homicide and fatalities determined to be the result of abuse or neglect if there was a finding of maltreatment by a MDCPS worker. Other sources that compile and report child fatalities due to abuse and neglect are Serious Incident Reports (SIRs) and the Child Death Review Panel (CDRP) facilitated by the Mississippi Department of Health.
Typically, all fatalities are reported in the Child File. Those fatalities not reported in the Child File are reported in the Agency File. The number of fatalities reported in FFY 2014 is significantly higher than the previous years. In FFY 2014, the Agency developed a Special Investigations Unit (SIU) that is responsible for investigating all reports of child fatalities that meet criteria for agency investigation. Previously, investigations were conducted by
Mississippi (continued)
Appendix d: State Commentary 183Child Maltreatment 2017
nonspecialized workers in the field. The development of the SIU has standardized screening and decision-making processes in fatality investigations. In addition, the investigators that make up the unit are required to have an advanced level of licensure and experience. Having the dedicated, specialized investigators has contributed to the increase in the number of fatalities reported with substantiated findings of abuse or neglect.
In addition, the Agency has collaborated with other agencies to continue public awareness campaigns aimed at death from heat stroke from leaving children in hot cars and death from unsafe sleeping conditions. From July 2016 to September 2016, the Agency ran public service announcements via television concerning the dangers of leaving your child in a hot car. The Agency has seen an increase in the number of reports from law enforcement and medical personnel when a fatality occurs. This increase is believed to have been contributed to by these campaigns. Child fatalities previously labeled by law enforcement or medical profes-sionals as accidental are now more frequently being reported as abuse or neglect, contribut-ing to the Agency’s higher reported numbers.
In addition, the agency has collaborated with other agencies to continue public awareness campaigns aimed at death from heat stroke from leaving children in hot cars and death from unsafe sleeping conditions. From July 2016 to September 2016, the agency ran public service announcements via television concerning the dangers of leaving your child in a hot car. Although currently anecdotal, the agency has seen an increase in the number of reports from law enforcement and medical personnel when a fatality occurs and it is believed to have been caused, or contributed to by either of these events. Child fatalities previously labeled by law enforcement or medical professionals as “accidental” are now more frequently being reported as abuse or neglect, contributing to the agency’s higher reported numbers.
PerpetratorsFor a child to be considered a perpetrator, the child must be in a caregiver role. The MCI staff must assess the possibility of parental neglect having contributed to one child harming another.
Services In previous years, the Families First Resource Centers utilized Promoting Safe and Stable Families Program (PSSF) funding to provide prevention services to children. Families First Resource Centers now receive funding from Economic Assistance (EA). PSSF funds the Comprehensive Family Support Services Program (CFFSP), also known as Family Preservation/Family Reunification/Family Support Services. These services are provided currently through a sub-grantee, Mississippi Children’s Home Services. The goals of the CFSSP are:
■ provide services that will protect children and allow them to safely remain in their own homes, avoiding out-of-home placement
■ provide services to safely and expeditiously reunite children, who are in out-of-home placement, back with their families
■ provide the family support needed to stabilize families
The state is currently unable to report counts of children or families who received preven-tion services funding by the following sources due to agency reorganization: Temporary
Mississippi (continued)
Appendix d: State Commentary 184Child Maltreatment 2017
Assistance for Needy Families (TANF), Children’s Trust Fund of Mississippi, and the Community Based Child Abuse Prevent Grant (CBCAP). Prevention services and support are provided via parenting programs, therapy, and other support services through sub-grantees by means of the Children’s Trust Fund and CBCAP monies. The state anticipates the ability to collect and report this data in future submissions. There has been an increase in public advertising of reporting methods, supported by Community Based Child Abuse Prevention (CBCAP) and the Children’s Trust Fund. This public advertising has been utilized to promote knowledge and understanding to diverse populations in efforts to prevent child abuse and neglect.
Many substantiated investigations result in services being provided such as family preserva-tion, protection, prevention, or placement. However, a case is not opened on all substantiated investigations. Services to child victims outside of a service case are provided through the Family Reunification Program within the In-Home Services Unit of the Agency.
Mississippi(continued)
Appendix d: State Commentary 185Child Maltreatment 2017
MissouriContact Joni Ralph MSW Phone 816–387–2092
Title Management Analysis Specialist II Email [email protected]
Address Missouri Department of Social Services525 Jules Street Room 127St. Joseph, MO 64501
GeneralThe Children’s Division, under the Department of Social Services umbrella, is designated to direct and supervise the administration of child welfare services. The Children’s Division works in partnership with families, communities, the courts and other governmental entities toward ensuring the safety, permanency, and well-being of Missouri children. Missouri has 114 counties and the City of St. Louis which are grouped together using pre-established judi-cial circuit boundaries. Each circuit has oversight by a Circuit Manager. The state is divided into five regions with each governed by a Regional Director. In the Jackson County urban area, the Regional Director and the Circuit Manager position are held by the same person. The St. Louis Region includes the county and the city of St. Louis. Missouri’s four regions are: St. Louis, Jackson County, Southeast, Southwest and Northern Region (East and West).
Missouri operates under a differential response program in which each referral of child abuse and neglect is screened by the centralized hotline system and assigned to either investigation or family assessment. Both types are reported to NCANDS. Investigations are conducted when the acts of the alleged perpetrator, if confirmed, are criminal violations, or where the action or inaction of the alleged perpetrator may not be criminal but would lead to the removal of the child or the alleged perpetrator from the home if continued. Investigations include, but are not limited to child fatalities, serious physical, medical, or emotional abuse, serious neglect in which criminal investigations are warranted and, and sexual abuse. Law enforcement is notified of reports classified as investigations to allow for co-investigation.
Family assessment responses (alternative responses) are screened-in reports of suspected maltreatment. Family assessment reports include mild, moderate, or first-time noncriminal reports of physical abuse or neglect, mild or moderate reports of emotional maltreatment, and educational neglect reports. These include reports where a law enforcement co-investigation does not appear necessary to ensure the safety of the child. When a referral is classified as a family assessment, it is assigned to staff who conducts a thorough family assessment. The main purpose of a family assessment is to determine the child’s safety and the family’s needs for services. Taking a non-punitive assessment approach has created an environment which assists the family and the children’s service worker in developing a rapport with the family and building on existing family strengths to create a mutually agreed-upon plan. Law enforcement is generally not involved in family assessments unless a specific need exists.
In December 2016, Missouri introduced a new online reporting option for mandated reporters for non-emergency situations and online mandated reporter training. The Online System for CA/N Reporting (OSCR) provides mandated reporters the option to make reports of suspected child abuse and neglect online using OSCR for non-emergency situations. Mandated reporters are asked to respond to questions designed to determine if their concern can be considered a non-emergency and, if so, the mandated reporter may submit their concerns using OSCR. The Task Force on the Prevention of Sexual Abuse of Children has developed online training for Missouri’s mandated reporters. The purpose of this course is
Appendix d: State Commentary 186Child Maltreatment 2017
to provide access to training on mandated reporting requirements and issues to all mandated reporters with a consistent message. The training consists of four lessons designed to provide information and guidance regarding such topics and legal requirements, indicators of child abuse and neglect, planning to respond to suspicion, discovery and disclosure of child abuse and neglect, and effectively reporting child abuse and neglect.
ReportsThe state records the date of the first actual face-to-face contact with an alleged victim as the start date of the investigation. Therefore, response time is based on the time the call was logged to the time of the first actual face-to-face contact with the victim for all report and response types, recorded in hours. State policy enables, in addition to CPS staff, mul-tidisciplinary team members to make the initial face-to-face contact for safety assurance. The multidisciplinary teams include law enforcement, local public-school liaisons, juvenile officers, juvenile court officials, or other service agencies. Child protective services (CPS) staff will contact the multidisciplinary person to help with assuring safety. Once safety is assured, the multidisciplinary person will contact the assigned worker. The workers are then required to follow-up with the family and see all household children within 72 hours. Data provided for 2017 does not include initial contact with multidisciplinary team members.
Missouri uses structured decision-making protocols to classify hotline calls and to determine whether a call should be screened out or assigned. If a call is screened out, all concerns are documented by the division, and the caller is provided with referral contact information when available.
Senate Bill 160 changes the language for Re-Opening Reports (Previously Known as SB54 Reviews). Senate Bill 160 eliminates many of the restrictions that previous legislation placed on the Children’s Division’s ability to re-open an investigation. Missouri Revised Statute 210.152(3) now states, “the Children’s Division may re-open a case for review if new, specific, and credible evidence is obtained.” This will allow parties other than the alleged perpetrator, the alleged victim, or the office of the child advocate, to request a report be re-opened, including but not limited to, Children’s Division staff and law enforcement.
ChildrenThe state counts a child as a victim of abuse or neglect based on a preponderance of evidence standard or court-adjudicated determination. Children who received an alternative response are not considered to be victims of abuse or neglect as defined by state statute. Therefore, the rate of prior victimization, for example, is not comparable to states that define victimization in a different manner and may result in a lower rate of victimization than such states. For example, the state measures its rate of prior victimization by calculating the total number of 2017 substantiated records and dividing it by the total number of prior substantiated records, not including unsubstantiated or alternate response records.
The state does not retain the maltreatment type for unsubstantiated investigations or alternate response reports as they are classified as alternative response nonvictims. These children are reported to NCANDS with the maltreatment type of “other,” and the maltreatment disposi-tion is assigned the value of the report disposition.
Missouri (continued)
Appendix d: State Commentary 187Child Maltreatment 2017
Fatalities Missouri statute requires medical examiners or coroners to report all child deaths to the Children’s Division Central Hotline Unit. Deaths due to alleged abuse or those which are suspicious are accepted for investigation, and deaths which are nonsuspicious, accidental, natural, or congenital are screened out as referrals. Missouri determines substantiated find-ings when a death is due to neglect as defined in statute. Therefore, Missouri can thoroughly track and report fatalities. Through Missouri statute, legislation created the Missouri State Technical Assistance Team (STAT) to review and assist law enforcement and the Children’s Division with severe abuse of children.
While there is not currently an interface between the state’s electronic case management system and the Bureau of Vital Records statistical database, the STAT has collaborative processes with the Bureau of Vital Records to routinely compare fatality information. STAT also has the capacity to make additional reports of deaths to the hotline to ensure all deaths are captured in Missouri’s electronic case management system (FACES). The standard of proof for determining if child abuse and neglect was a contributing factor in the child’s death is based on the preponderance of evidence.
Because Missouri’s CPS hotline is the central recipient for fatality reporting, and state statute requires coroners and medical examiners to report all fatalities, Missouri could appear to have a higher number of fatalities when compared to other states where the CPS agency is not the central recipient of fatality data. Other states may have to obtain fatality information from other agencies and thus, have more difficulty with fully reporting fatalities.
PerpetratorsThe state retains individual findings for perpetrators associated with individual children. For NCANDS, the value of the report disposition is equal to the most severe determination of any perpetrator associated with the report.
On August 28, 2017, Missouri legislature passed Senate Bill 160, parts of which went into effect on June 22, 2017. This bill determined that Missouri Children’s Division does not have the authority to substantiate a report that an unknown perpetrator committed child abuse or neglect. In addition, an unknown perpetrator cannot be placed on Missouri’s Family Care Safety registry. Due to this, a new investigative conclusion option, child abuse/neglect pres-ent, perpetrator unidentified, is being developed for Missouri’s information system.
Senate Bill 160 also revised the definition of those responsible for the care, custody, and control of the child which includes, but is not limited to: the parents or legal guardians of the child; other members of the child’s household; those exercising supervision over a child for any part of a twenty-four hour day; any person who has access to the child based on relation-ship to the parents of the child or members of the child’s household or the family; or any person who takes control of the child by deception, force, or coercion.
Services Children younger than three years of age are required to be referred to the First Steps pro-gram if the child has been determined abused or neglected by a preponderance of evidence in a child abuse and neglect investigation. Referrals are made electronically on the First Steps
Missouri (continued)
Appendix d: State Commentary 188Child Maltreatment 2017
website or by submitting a paper referral via mail, fax, or email. First Steps reviews the paper or electronic referral and notifies the primary contact to initiate the intake and evaluation process.
Post-investigation services are reported for a client who had intensive in-home services or alternative care opening between the report date and 90 days post disposition date or an active family-centered services case at the time of the report. Data for child contacts with court-appointed special advocates (CASA) were provided by Missouri CASA. Data regarding guardians’ ad litem were not available for federal fiscal year (FFY) 2017. The Children’s Trust Fund provided supplemental data regarding prevention services.
On July 22, 2016 President Obama signed into law, the Comprehensive Addiction and Recovery Act (CARA). CARA amended sections of Child Abuse Prevention Treatment Act (CAPTA) to remove the term “illegal” as applied to substance abuse affecting the identified infant and to specifically require that Plans of Safe Care address the needs of both infants and their families/caregivers. It also added requirements relating to data collection and monitor-ing. Additions to the Children’s Division’s policy manual include guidance on recognizing infants affected by substance abuse, withdrawal symptoms, Neonatal Abstinence Syndrome, and Fetal Alcohol Syndrome Disorder (FASD). New manual additions also include things to consider when assessing a family that has been identified as having a child with substance abuse exposure.
A Plan of Safe Care should address the health and substance use treatment needs of the infant and affected family or caregiver. The plan should be developed with input from the parents or other caregivers as well as any collaborating professional partners and agencies involved in caring for the infant and family. A Plan of Safe Care should be inclusive of the following: parents’ or infant’s treatment needs; other identified needs that are not determined to be immediate safety concerns; involvement of systems outside of child welfare; plan that is able to continue beyond the child welfare assessment if a case is not opened for further services.
Missouri (continued)
Appendix d: State Commentary 189Child Maltreatment 2017
MontanaContact Janice Basso Phone 406–841–2414
Title IT and Data Systems Manager Email [email protected]
Address Montana Department of Public Health and Human Services301 S. Park Avenue, 5th FloorPO Box 8005 Helena, MT 59604–8005
GeneralMontana does not have a differential response track for investigations. A new computer system is being developed and should provide enhanced data elements starting in 2019.
ReportsThe Child and Family Services Division’s Centralized Intake Bureau screens each referral of child abuse or neglect to determine if it requires investigation, assistance, or referral to another entity. Referrals requiring immediate assessment or investigation are immediately telephoned to the field office. By policy, these Priority 1 reports receive an assessment or investigation within 24 hours. All other Child Protective Services (CPS) reports that require assessment or investigation are sent to the field within 24 hours. In general, this has resulted in improved response time. The state does not track the time from receiving the referral until the beginning of the investigation in hours. Montana state law requires purging of unfounded cases. In the past, these purged cases have been reported under the NCANDS disposition of “other.” In federal fiscal year (FFY) 2015, these cases were reported under the NCANDS disposition of closed-no finding.
ChildrenThe number of children in care has shown an ongoing increase in Montana. There was a large increase in victims in FFY 2016 that may be attributable to the increase in reports and the increase in parental drug use. Montana statute does not allow social workers to collect information on the financial status of a child’s family, so the NCANDS risk factor of finan-cial problem is not reported. Additionally, the NCANDS risk factor of domestic violence is included within Montana’s definition of psychological abuse or neglect and physical neglect.
Fatalities Due to the lack of legal jurisdiction, information in the State Automated Child Welfare Information System (SACWIS) does not include child deaths that occurred in cases investi-gated by the Bureau of Indian Affairs, Tribal Social Services, or Tribal Law Enforcement.
PerpetratorsUnknown perpetrators are assigned a common identifier within the state.
Services Data for prevention services are collected by state fiscal year (SFY).
Appendix d: State Commentary 190Child Maltreatment 2017
NebraskaContact Katie Watchorn Phone 402–471–9112
Title IT Business Systems Analyst Email [email protected]
Address Nebraska Department of Health and Human Services1033 O Street, Suite 400Lincoln, NE 68508
GeneralDuring federal fiscal year (FFY) 2017, the state of Nebraska continued to use the Structured Decision Making (SDM) model, an Evidence Based Practice (EBP) to assess reports of child maltreatment. This is the fifth year for which SDM was implemented throughout the entire state. With the implementation of the SDM intake tool, the state believes consistency will continue to improve and screening decisions will be better supported.
The state of Nebraska uses two types of responses to screened-in reports of maltreatment; traditional, or investigation response, and alterative response. In FFY 2015, Nebraska began a pilot project to implement an alternative response to reports accepted for assessment. This pilot initially consisted of 5 counties in the state but expanded to include 74 counties by the end of FFY 2017. Alternative response is an approach to keep children safe through respond-ing to allegations of maltreatment in a different way. Services are provided through non-court involvement, and services are voluntary. In the alternative response approach, there are allegations of maltreatment, but those allegations are not serious or imminent. Nebraska has a list of criteria they must follow when the intake is received by the hotline to determine if the family qualifies for alternative response. Data from both traditional response and alterna-tive response cases were reported to NCANDS.
ReportsAll reports of child maltreatment are received at a toll-free, 24-hour, centralized hotline. The intake workers at the hotline along with their supervisors use SDM to determine whether the report meets criteria for intervention and the response time for intervention. If the report meets the criteria for intervention, it is screened in and assigned to a worker to conduct an initial assessment, which includes using SDM safety assessments, safety plans (when needed) and risk or prevention assessments. At the end of the initial assessment, the workers use the SDM results to determine if the case should remain open and if ongoing services are needed.
Nebraska experienced a higher than average number of calls made to the hotline reporting child maltreatment in FFY 2017. This contributed to an increase in accepted intakes, investi-gations, substantiations, child victims and perpetrators.
Nebraska also experienced a high turnover rate during FFY 2017. This is resulted in an increase in response times of initial assessment workers to reports of child maltreatment. Nebraska does not utilize the full-time equivalents (FTE) formula to calculate the number of positions for intake/investigation/assessment.
ChildrenIn FFY 2017, Nebraska saw an increase in the number of unique child victims. There were several factors that influenced the increase in child victims. Nebraska experienced a high number of calls made to the hotline reporting child maltreatment. This resulted in an increase of investigations and naturally an increase in child victims.
Appendix d: State Commentary 191Child Maltreatment 2017
Fatalities Nebraska reports child fatalities in both the Child File and the Agency File. The FFY 2017 Child File included one child who died as a result of maltreatment with no children reported in the Agency File. Child fatalities awaiting final disposition in Nebraska’s child welfare information system who are not reported in this year’s Child or Agency Files will be included in a future Child File that corresponds with the annual report submission when the disposi-tion is completed.
Nebraska continues to work closely with the state’s Child and Maternal Death Review Team (CMDRT) to identify child fatalities that are the result of maltreatment but are not included in the child welfare system. When a child fatality is not included in the Child File, the state determines if the child fatality should be included in the Agency File. The official report from CMDRT with final results are usually made available two to three years after the submissions of the NCANDS Child and Agency Files. Nebraska will resubmit the Agency File for previous years when there is a difference in the count than was originally reported as a result of the CMDRT final report.
PerpetratorsNebraska collects information on the perpetrators and enters it into the child welfare information system. Information includes the relationship of the perpetrator to the child and demographic information. Nebraska also has state statute that prohibits a perpetrator under 12 years of age from being listed as a substantiated perpetrator on the child welfare informa-tion system. The maltreatment will be listed but there is no finding entered indicating if the maltreatment was substantiated or unfounded.
In FFY 2017, Nebraska saw an increase in the number of perpetrators. There were several factors that influenced the increase in perpetrators, including an increase in reports of child maltreatment for the year. There was an increase in the number of child maltreatment reports, naturally resulting in an increase in perpetrators.
Services Nebraska refers all children who are young than three years of age and a substantiated victim of maltreatment to the Early Childhood Development Network. Nebraska automated its refer-ral system to its Early Childhood Development Network to automatically notify the network of children younger than three who are victims of maltreatment.
The state believes that most of the services provided to families can be accomplished during the assessment phase, which is between the report date and final disposition. In many cases, these are the only services required to keep the child or victim safe. These services are not included in the NCANDS Child File; only the services that extend beyond the disposition are included.
Nebraska (continued)
Appendix d: State Commentary 192Child Maltreatment 2017
NevadaContact Alexia Benshoof Phone 775–687–9013
Title Management Analyst Email [email protected]
Address Nevada Department of Health and Human Services4126 Technology Way, 3rd FloorCarson City, NV 89706
GeneralWithin the state, Child Protective Services (CPS) functions in three regional service regions: Clark County, Washoe County, and Rural counties. All three service regions use a single data system under the Statewide Automated Child Welfare Information System (SACWIS)—also known as Unified Nevada Information Technology for Youth (UNITY).
Nevada’s alternative response program is designated Differential Response (DR) and is implemented throughout all regions. Families referred under this policy are the subject of reports of child abuse and/or neglect which have been determined by the agency as likely to benefit from voluntary early intervention through assessment of their unique strengths, risks, and individual needs, rather than the more intrusive approach of investigation.
All three child welfare service regions in Nevada are in the process of implementing the Safety Assessment and Family Evaluation (SAFE) model. While the primary focus in all three agencies has been on intake and assessment, or front-end services, the plan is to continue the rollout of the model to expand back-end services such as implementing condi-tions for return and the protective capacity of family assessment. This model has changed the state’s way of assessing child abuse and neglect. It has enhanced the state’s ability to identify appropriate services to reduce safety issues in the children’s home of origin. Additionally, this model has unified the state’s CPS process and standards regarding investigation of maltreatment.
The SAFE model supports the transfer of learning and ongoing assessment of safety throughout the life of the case. The model emphasizes the differences between identification of present and impending danger, assessment of how deficient caregiver protective capaci-ties contribute to the existence of safety threats and safety planning/management services, assessment of motivational readiness, and utilization of the Stages of Change theory as a way of understanding and intervening with families.
ReportsFor federal fiscal year (FFY) 2017, there was an overall decrease in reports of abuse or neglect as compared to the previous year. Nevada has varying priority response time frames for investigation of a report of child abuse or neglect, according to the age of the child and the severity of the allegations. Other reports are defined as follows: (1) information only, when there is insufficient information about the family or maltreatment of the child, or there are no allegations of child abuse/neglect; (2) information and referral, when an individual asks about services and there are no allegations of child abuse or neglect; and (3) differential response (DR), when a report is made, and the allegations do not indicate that safety factors are present but risk factors indicate the family could benefit from community services.
Appendix d: State Commentary 193Child Maltreatment 2017
ChildrenFor FFY 2017, there was increase in the number of children reported as possible abuse or neglect victims as compared to the previous year. Further, the number of substantiated victims decreased compared to the previous year.
Fatalities Fatalities identified in the SACWIS as maltreatment deaths are reported in the Child File. Deaths not included in the Child File, for which substantiated maltreatment was a contribut-ing factor, are included in the Agency File as an unduplicated count. Reported fatalities can include deaths that occurred in prior periods, for which the determination was completed in the next reporting period. The total number of NCANDS reported fatalities has increased since the last reporting period. However, four fatalities reported in FFY 2017 actually occurred in FFY 2016, but the determination was not completed until FFY 2017.
Nevada utilizes a variety of sources when compiling reports and data about child fatalities resulting from maltreatment. Any instance of a child suffering a fatality or near-fatality, who previously had contact with, or was in the custody of, a child welfare agency, is subject to an internal case review. Data are extracted from the case review reports and used for local, state, and federal reporting, as well as to support prevention messaging. Additionally, Nevada has both state and local child death review (CDR) teams which review deaths of children (17 years or younger). The purpose of the Nevada CDR process is public awareness and preven-tion, enabling many agencies and jurisdictions to work together to gain a better understand-ing of child deaths.
PerpetratorsAll perpetrator data are reported in accordance with instructions outlined in the NCANDS Child File mapping forms (fields 88–144).
Services Many of the services provided are handled through outside providers. Information on services received by families is reported through various programs. Services provided in conjunction with the new will safety model are documented in the system, but these data are not readily reportable. The Child File contains some of the services from the SACWIS sys-tem, and the state is investigating steps to bring more of that information into the NCANDS report.
Nevada follows its statewide policy (#0502 CAPTA-IDEA Part C), which states: “Child wel-fare agencies refer children under the age of three who are involved in a substantiated case of child abuse or neglect, or who have a positive drug screen at birth, to Early Intervention Services within two working days of identifying the child(ren) pursuant to CAPTA Section 106 (b)(2)(A)(xxi) and IDEA Part C of 2004.” The policy further defines “involved” to include children that are identified as having been abused or neglected, having a positive drug screen at birth, or found in need of services.
Nevada (continued)
Appendix d: State Commentary 194Child Maltreatment 2017
New HampshireContact Lorraine Ellis Phone 603–271–0837
Title Business Systems Analyst Email [email protected]
Address New Hampshire Division for Children, Youth and Families129 Pleasant StreetConcord, NH 03301
GeneralNew Hampshire’s child protection system does not include differential response.
ReportsNew Hampshire uses a tiered system of required response time, ranging from 24 to 72 hours, depending on level of risk at the time of the referral.
The state continues to experience the effect of an increase in substance abuse by parents, particularly opioid drugs. The total number of reports received increased in 2017. However, the number of assessments closed and reported to NCANDS has decreased compared to last year. There are two factors to consider:
■ The larger number of assessments closed in 2016 reflected an emphasis on closing a backlog of overdue assessments that year.
■ Inadequate staff to finalize the closing of federal fiscal year (FFY) 2017 assessments where the children were determined to be safe.
The New Hampshire Legislature approved an additional 20 assessment staff positions during 2017. However, the agency continues to experience significant staff turnover and the need to ensure newly hired staff are fully trained before being assigned as primary workers to conduct protective assessments. Nevertheless, progress has been made. At the end of the FFY, each worker certified to carry a caseload had an average of 60 open assessments on their workloads, compared to 70 at the beginning of the FFY.
Insufficient staff resources continues to increase the agency’s average face-to-face response time. To assure child safety when timely face-to-face response cannot occur, staff are in direct contact with collaterals (i.e. school, physician, reporter) to ascertain the immediate safety of the child and face-to- face interviews then follow when it is determined the child is conditionally safe. Although this increases the official response time, investigators have taken timely action on assessments.
During FFY 2017, New Hampshire established an after-hours intake unit, with 8.5 new full-time-equivalent staff. New Hampshire is now able to receive and process reports 24/7. The state also established a State-wide Assessment Team of Child Protective Service Workers (CPSWs) who work from noon to 8:00 pm on weekdays, and a system of on-call CPSWs who can immediately respond to emergencies between 8:00 pm and 8:00 am. The “number of staff Responsible for CPS Functions” includes assessment workers and workers who specialize in investigation of allegations of abuse and neglect in out-of-home placements. The number of screening and intake workers includes intake workers. The numbers are not duplicated.
Children While the number of assessments closed decreased, the number of victims increased. We have recently established a greater focus on safety and risk in assessments as a result of ongoing internal practice reviews. At the same time, the state’s substantiation rate has
Appendix d: State Commentary 195Child Maltreatment 2017
increased, resulting in more victims in the file, and a corresponding decrease in nonvictims. This is a trend we are monitoring.
Fatalities Data for the Agency File were obtained from the New Hampshire Department of Justice, as well as the Statewide Automated Child Welfare Information System (SACWIS). Historically, including throughout FFY 2017, DCYF defers investigation of child fatalities to law enforce-ment, but does investigate the safety of siblings in the family. This is a practice which is being changed in calendar year (CY) 2018.
New Hampshire has a Child Fatality Committee consisting of 31 members representing govern-ment agencies (Attorney General; Judicial Branch; Board of Pharmacy; Division for Children, Youth and Families; Department of Safety; State Medical Examiner; Fire Marshall; Behavioral Health; Public Health; Drug and Alcohol Services); Law Enforcement (State and Local); Community Mental Health Services; Granite State Children’s Alliance; New Hampshire Coalition Against Domestic and Sexual Violence; and Dartmouth Hitchcock Medical Center.
Services The NCANDS category of “other” services includes ISO in-home, an individual service option that provides comprehensive services for children/youth with significant challenges, which may be medical, physical, behavioral or psychological. The service, therefore, fits into several different service categories, but not precisely into any one category.
New Hampshire only is able to report those services that were paid for directly by the child protection agency. Any services that were paid for by Medicaid or the family’s own health insurance are not reported the following service categories: counseling services, health-related and home health services, and substance abuse services. New Hampshire does not provide or collect data on the following services, as defined by NCANDS: case management services, employment services, family planning services, home based services, information and referral services, housing services, legal services and respite care services.
Although not directly served, the New Hampshire Children’s Trust estimates that hospital staff delivered the “Period of PURPLE Crying” to parents of 11,588 infants, reaching more than 95 percent of families of children born in the state in 2016. The Agency File children and families who received prevention services from the state during the year under the Promoting Safe and Stable Families (PSSF) Program and Social Services Block Grant are funded from the Child Abuse State Grant, PSSF Program, and Social Services Block grant and are combined to fund agencies that provide prevention services in New Hampshire. The numbers of children and families are unduplicated and represent the number of children and families served as a percentage of the total funding.
The New Hampshire SACWIS does not currently record referrals made to the Individuals with Disabilities Education Act (IDEA) agencies in a way that can be queried. We must, therefore, rely on a report from another state agency which aggregates activities of the area agencies that complete the evaluations. Those agencies only maintain records for the children who completed an intake and/or evaluation. The report does not include any referrals for children whose parents did not respond to an invitation to have their child evaluated.
New Hampshire (continued)
Appendix d: State Commentary 196Child Maltreatment 2017
New JerseyContact Nicole Ruiz Phone 609–888–7336
Title Program Specialist Email [email protected]
Address Office of Research, Evaluation and ReportingNew Jersey Department of Children and Families50 East State StreetTrenton, NJ 08625
GeneralSince the implementation of the Statewide Automated Child Welfare Information System (SACWIS), each NCANDS Child File data element is reported from the system. The state has been making continuous enhancements toward improving the quality of NCANDS data.
ReportsThe State Department of Children and Families (DCF) under the Division of Child Protection and Permanency (CP&P), formerly the Division of Youth and Family Services (DYFS), investigates all reports of child abuse and neglect. The state system allows for linking multiple Child Protective Services (CPS) Reports to a single investigation. The state has the capability to record the time and date of the initial face-to-face contact made to begin the investigation.
Structured Decision-Making assessment tools, including safety and risk assessments, are incorporated within the investigation screens in the SACWIS. These tools are required to be completed in the system prior to documenting and approving the investigation disposition.
As of April 2013, new regulations took effect modifying the Department of Children and Families’ dispositions following child abuse and neglect investigations. Previously, DCF had two disposition categories; unfounded and substantiated.
The Four-Tier Finding Determination Model: ■ Substantiated–A preponderance of the evidence establishes that a child is an abused or
neglected child as defined by statute; and either the investigation indicates the existence of any of the absolute conditions; or substantiation is warranted based on consideration of the aggravating and mitigating factors.
■ Established–A preponderance of the evidence establishes that a child is an abused or neglected child as defined by statute; but the act or acts committed or omitted do not war-rant a finding of substantiation upon consideration of aggravating and mitigating factors.
■ Not Established–There is not a preponderance of the evidence that the child is an abused or neglected child as defined by statute, but evidence indicates that the child was harmed or placed at risk of harm.
■ Unfounded–There is not a preponderance of the evidence indicating that a child is an abused or neglected child as defined by statute, and the evidence indicates that a child was not harmed or placed at risk of harm.
This revised system allows for more specific investigation disposition categories to more appropriately reflect the particular circumstances present in each investigation, allowing for better partnership with families and better outcomes for children. This change also provides fairness in the operation of the Child Abuse Record Information system and allows DCF to better protect children by requiring the maintenance of all records in which children were
Appendix d: State Commentary 197Child Maltreatment 2017
harmed or exposed to risk of harm, even when the statutory definition of child abuse or neglect could not be met.
The implementation of these regulations has led to increased case practice discussions, improved staff analysis, and created stronger documentation. Since these new regulations went into effect, along with ongoing staff training and the courts’ adaptation to the new regulations, there has been a marked decrease in the number of child victims. As indicated by definition, the finding of established is based on a preponderance of evidence establishing that the child is a victim of maltreatment. Therefore, reports with an established finding are coded to the NCANDS disposition substantiated.
The number of reports increased, and the number of substantiated victims decreased result-ing in a decreased percentage of substantiated reports in federal fiscal year (FFY) 2017 compared to FFY 2016. New Jersey continues to attribute this decrease to the implementa-tion of the Four-Tier Finding Determination Model.
ChildrenChildren with allegations of maltreatment are designated as alleged victims in the CPS report and are included in the Child File. The state SACWIS allows for reporting more than one race for a child. Race, Hispanic/Latino origin, and ethnicity are each collected in separate fields.
Fatalities Child fatalities are reported to the New Jersey Department of Children and Families Fatality and Executive Review Unit by many different sources including law enforcement agencies, medical personnel, family members, schools, offices of medical examiners and occasionally child death review teams. The CP&P Assistant Commissioner makes a determination as to whether the child fatality was a result of child maltreatment.
The NCANDS state contact consults with the Fatality and Executive Review Unit Coordinator and the Child Protection and Permanency (CP&P) Assistant Commissioner to ensure that all child maltreatment fatalities are reported in the state NCANDS files. The state SACWIS is the primary source of reporting child fatalities in the NCANDS Child File. Specifically, child maltreatment deaths reported in the Child File are from data collected and recorded by investigators in the investigation and person management screens in the SACWIS.
Other child maltreatment fatalities not reported in the Child File due to data anomalies, but which are designated child maltreatment fatalities by the Fatality and Executive Review Unit under the Child Abuse Prevention and Treatment Act (CAPTA), are reported in the NCANDS Agency File. New Jersey has maintained a stable annual child fatality rate for the last nine years. Fluctuations in the number of fatalities from year to year are likely due to random case-level variation and are monitored closely.
PerpetratorsNew Jersey DCF’s Institutional Abuse Investigation Unit continues with the case practice initiative implemented in 2012 to conference investigations with a representative from the
New Jersey (continued)
Appendix d: State Commentary 198Child Maltreatment 2017
Office of the Deputy Attorney General prior to rendering a finding. This practice strengthens the investigation assessment.
Services The state SACWIS reports those services specifically designated as family preservation services, family support services, and foster care services as postinvestigation services in the Child File.
The Child Abuse and Neglect State Grant is one funding source for the Child Protection and Substance Abuse Initiative (CPSAI). The Social Service Block Grant served children with case management services. Reported children are unduplicated and include children who may have had a CPS report during the fiscal year. New Jersey’s Community-Based Prevention of Child Abuse and Neglect Grant funded six Family Success Centers, the New Jersey Child Assault Prevention Program, the Prevent Child Abuse New Jersey Program, and the Strengthening Families Child Care Initiative.
The state is able to report the number of children eligible for a referral to Early Intervention Services and the number of children referred in FFY 2017. Compliance with this federal requirement is closely monitored by CP&P.
New Jersey (continued)
Appendix d: State Commentary 199Child Maltreatment 2017
New MexicoContact Doreen Chavez Phone 505–412–9868
Title SACWIS/AFCARS/NCANDS/FACTS Program Manager
Email [email protected]
Address New Mexico Children, Youth & Families Department300 San Mateo Blvd NE Suite 500Albuquerque, NM 87108
GeneralThere have been no recent changes in the state policies, programs, or procedures that would affect New Mexico’s federal fiscal year (FFY) 2017 NCANDS submission. New Mexico does not have two types of responses to screened-in referrals. All screened-in reports are investigated.
ReportsThe New Mexico definition for investigation initiation differs from the NCANDS definition in requiring face-to-face contact with all alleged victims included in a report, rather than with individual alleged victim for whom the referral was made. New Mexico also measures investigation initiation from the point at which the report is accepted by Statewide Central Intake, rather than the point at which the report is received.
New Mexico does not currently report incident date. The alleged date of maltreatment (inci-dent date) is complicated by the fact that the reporter may know only a general maltreatment timeframe, or the alleged maltreatment reported may be chronic in nature. Because of the known inherent inaccuracies in the reporting of chronic maltreatment and potential inaccura-cies in the reporting of a general maltreatment timeframe for a specific maltreatment event, New Mexico does not plan to modify the state’s data collection system to capture incident information and will continue to use the current reporting approach.
ChildrenThe number of substantiated victims increased in FFY 2017 from the previous year. Unique children in the Child File are those for which an investigation was completed during the submission period, and inclusion is not based on the report date. Our state continues to make efforts to address backlogs of pending investigations. During the latter part of FFY 2017, special attention was given to those counties with high numbers of overdue investigations, and the push to close these cases resulted in about 500 more cases than usual closed in both March and April 2017, and again in June, July, and August 2017. New Mexico is aware that staff are substantiating at a higher rate and theorizes that this increase may be due to more child maltreatment occurring and/or to inconsistencies in substantiation practice. New Mexico has begun to train supervisors and staff using a Safety Organized Practice approach which results in increased assessment skills, increased family engagement, and increased supervisory oversight.
The state is not able to report on the following child data fields that are not captured in the Statewide Automated Child Welfare Information System (SACWIS): child living arrange-ment, intellectual disability–caregiver, learning disability–caregiver, and visually or hearing impaired–caregiver.
Appendix d: State Commentary 200Child Maltreatment 2017
Fatalities The number of child fatalities increased from FFY 2016 to FFY 2017. New Mexico obtains a list of child deaths from the Office of the Medical Investigator (OMI) to compare to Children Youth and Families Department (CYFD) data in the category of homicides. A follow-up, in-person review of OMI files is also conducted for any child not known to the state agency who is identified as a victim of homicide to determine the identity and relationship of the alleged perpetrator, if known. Only children known to have died from maltreatment by a parent or primary caregiver who are not included in the Child File are included in the Agency File. In addition, Fatality counts in the state are highly susceptible to broad fluctuation due to the overall low numbers of fatalities that occur in the population. Because these records are included in the submission that corresponds with investigation closure date, the length of time that some of these cases must remain open for thorough investigation can create addi-tional year-over-year variation.
PerpetratorsNew Mexico attributes its low numbers of maltreatment in foster care to an improved training model implemented in 2012 that is described as a more realistic portrayal of the foster parent role. Placement staff are also available around the clock to respond to foster care incident reports which can address foster parent issues before situations escalate to the report level. Placement staff are all trained to use the National SAFE Homestudy Evaluation when licens-ing potential foster parents. The training in New Mexico is taught by SAFE certified trainers, The Consortium for Children. This allows for increased consistency in licensure throughout the state. New Mexico has increased the Annual Recertification Hours for foster parents to 12 hours and mandates that the twelve hours be training specifically regarding safety and parent-ing children in foster care. New Mexico has launched a blended learning foster and adoptive parents’ pre-services training which included classroom and on-line lessons. Additionally, New Mexico has implemented a statewide Foster Parent Recruitment and Retention Plan which will expand the number of foster and adoptive resources and minimize the barriers to licensure. Family support services for foster parents and foster parent support groups also are available statewide.
The state does not report information on residential staff perpetrators, as any report of alleged abuse and neglect that occurs at a residential facility is screened out. CPS does not have jurisdiction via state law to investigate allegations of abuse and neglect in facilities; however, the following is done with the screened-out reports of child maltreatment in facilities:
■ Any screened-out report is cross-reported to law enforcement having jurisdiction over the incident; such reports are cross-reported to licensing and certification, the entity in New Mexico with administrative oversight of residential facilities.
■ Upon request from law enforcement, an investigation worker may act in consultation with law enforcement in conducting investigations of child abuse and neglect in schools and facilities and may assist in the interview process.
■ If an alleged maltreatment incident involves a child in the child welfare agency’s custody, then a safety assessment is conducted for that child to ensure that the placement is safe.
New Mexico (continued)
Appendix d: State Commentary 201Child Maltreatment 2017
The NCANDS category of “other” perpetrator relationship includes: ■ sibling’s guardian ■ nonrelative ■ foster sibling ■ reference person ■ conservator ■ surrogate parent ■ perpetrator is a foster parent and the child is not under the care, placement, or supervision
of the child welfare agency
Services Post investigation services are reported for any child or family involved in a child welfare agency report that has an identified service documented in the SACWIS as: 1) a service delivered, 2) a payment for service delivered, or 3) a component of a service plan. Services must fall within the NCANDS date parameters to be reported. The state is not able to report on the following services data fields:
■ home-based services ■ information and referral services ■ respite care services ■ other services ■ special services-juvenile delinquent
Whenever there is a child younger than 3 years in a family involved in a substantiated investigation, policy states that the investigation worker refers that child to the Family Infant Toddler (FIT) Program for a diagnostic assessment. The referral occurs within 2 days of the substantiation. The date of this referral is documented in the state SACWIS prior to approval of the investigation results. The worker also notifies the family of the referral and provides them with a copy of the FIT fact sheet.
New Mexico no longer offers family preservation services per the Family Preservation Model. New Mexico offers In Home Services, which is a clinical intervention aimed at reducing safety threats and enhancing parental protective capacities. In Home Services is a 4- to 6-month intervention, specifically geared toward families who are at risk of child removal.
New Mexico (continued)
Appendix d: State Commentary 202Child Maltreatment 2017
New YorkContact Vajeera Dorabawila, Ph.D. Phone 518–402–7386
Title Assistant Director Email [email protected]
Address New York State Office of Children and Family Services52 Washington Street, Room 323 NorthRensselaer, NY 12144
GeneralThe state has continued to expand the number of local districts of social services using the alternative response, known as family assessment response. New York’s AR program has been implemented by a total of 32 local districts of social services. Ten of the local districts have since suspended implementation and several are in the planning stages to start or re-start.
ReportsNew York state does not collect information about calls not registered as reports.
ChildrenMost reporting to the NCANDS maltreatment type of “other” is accounted for by the state maltreatment type parent’s drug/alcohol use. The state is not able to report the NCANDS child risk factor fields at this time. However, changes are being made to the system to capture elements related to Comprehensive Addiction Recovery Act (CARA).
Not all children reported in the Child File have Adoption and Foster Care Analysis and Reporting System (AFCARS) IDs because the state uses different data systems with differ-ent child identifiers for child protective services and child welfare. The AFCARS ID is only assigned if the child is receiving child welfare services and is inconsistently updated in the child protective system, which is the source of the NCANDS submission. State statute and policy allow acceptance and investigation/assessment of child protective reports concerning certain youth over the age of 21.
Fatalities State practice allows for multiple reports of child fatalities for the same child and deaths that occurred in previous years. NCANDS validation software considers multiple reports of the same child as duplicates and removes them from the Child File. All these fatalities are reported in the Agency File.
By state statute, all child fatalities due to suspected abuse and neglect must be reported to the Statewide Central Register of Child Abuse and Maltreatment by mandated reporters, includ-ing, but not limited to, law enforcement, medical examiners, coroners, medical professionals, and hospital staff. No other sources or agencies are used to compile and report child fatalities due to suspected child abuse or maltreatment.
PerpetratorsWith the exception of the domestic violence risk factor, the state is not able to report the NCANDS caregiver risk factors at this time.
Services The state is not able to report the NCANDS services fields at this time. Title XX funds are not used for providing child prevention services in this state.
Child Maltreatment 2017 Appendix d: State Commentary 203
North CarolinaContact Heather Bohanan Phone 919–527–6264
Title Supervisor Email [email protected]
Address North Carolina Department of Health and Human Services820 S. Boylan AvenueRaleigh, NC 27603
GeneralNorth Carolina maintains a statewide differential response to allegations of child maltreat-ment. Note that the state is in the process of rolling out a new data collection system, and data collected during federal fiscal year (FFY) 2017 are compiled from the existing legacy system and the new data collection system. This process may result in data inconsistencies and reporting challenges for the state.
ReportsFollowing the receipt of the reports of alleged child maltreatment, these allegations are screened by the local child welfare agency against North Carolina general statute using a structured intake rubric to determine if the allegations meet the statutory definition of abuse, neglect, or dependency. Once reports are accepted by the local child welfare agency they assigned to one of the two tracks: either investigative assessment or a family assessment. Accepted reports of child abuse (and certain types of special neglect cases such as conflicts of interest, abandonment, or alleged neglect of a foster child) are mandatorily assigned as investigative assessments, while accepted reports of child neglect or dependency may be assigned as either family or investigative assessment at the county’s discretion. North Carolina defines a dependent child as one who has no parent or caregiver, or a child whose parent or caregiver is unable to provide for the care or supervision of the child.
Family assessments place an emphasis on globally assessing the underlying issues of mal-treatment rather than focusing solely on determining whether the incident of maltreatment occurred. In a family assessment, the family is engaged using family-centered principles of partnership throughout the entire process. Case decision findings at the conclusion of a family assessment do not indicate whether a report was substantiated or not, rather a determination of the level of services a family may need is made. A perpetrator is not listed in the state’s Central Registry for family assessments. The staffing numbers were provided by an annual survey of the local child welfare agencies within the state.
ChildrenNorth Carolina reports one type of maltreatment per child. The NCANDS category of “other” maltreatment type includes:1) dependency and 2) encouraging, directing, or approv-ing delinquent acts involving moral turpitude committed by a juvenile. Legislation requires that for all allegations of abuse, neglect, or dependency, all minors living in the home must be treated as alleged victims.
Fatalities Data about child fatalities only are reported via the Chief Medical Examiner’s Office. During FFY 2017 there were 18 deaths classified as homicide by parent or caregiver.
PerpetratorsNorth Carolina associates one perpetrator per victim.
Child Maltreatment 2017 Appendix d: State Commentary 204
North DakotaContact Marlys Baker Phone 701–328–1853
Title Child Protection Services Administrator Email [email protected]
Address North Dakota Department of Human Services600 East Boulevard AvenueBismarck, ND 58505
GeneralNorth Dakota implemented an alternative response option exclusive to substance exposed newborns (defined in state law as infants age 28 days or less) in November 2017 in response to the Comprehensive Addiction and Recovery Act (CARA) amendments to the Child Abuse Prevention and Treatment Act (CAPTA). This alternative response option includes development and monitoring of a Plan of Safe Care for each newborn and each caregiver for the newborn, needs assessment and the absence of a finding of child abuse or neglect. The alternative response is voluntary, and prenatal substance exposure remains in state law as a form of child neglect. Caregivers who decline participation in alternative response receive a standard Child Protective Services (CPS) assessment response. Data elements for alternative response have been included in the state’s data system but are not yet mapped to NCANDS. It is anticipated that data from the alternative response assessments will be reported to NCANDS for part of FFY 2018.
ReportsNorth Dakota encompasses four Native American reservations. These reservations are sover-eign nations, each of whom maintains the reservation’s own child welfare system. Because of this, North Dakota’s NCANDS data does not include child abuse and neglect data, or data on child deaths from abuse or neglect or near deaths from abuse or neglect which occurred in a tribal jurisdiction.
North Dakota does not report a number of screened out reports. Under North Dakota law, all reports of suspected child abuse and neglect must be accepted. North Dakota has adopted an administrative assessment process to correctly triage reports received. The number of children included in reports that are administratively assessed is not collected. An adminis-trative assessment is defined as the process of documenting reports of suspected child abuse or neglect that do not meet the criteria for a CPS assessment. Under this definition, reports can be administratively assessed when the concerns in the report clearly fall outside of the state child protection law. Such circumstances include:
■ The report does not contain a credible reason for suspecting the child has been abused or neglected.
■ The report does not contain sufficient information to identify or locate the child. ■ There is reason to believe the reporter is willfully making a false report (these reports are
referred to the county prosecutor). ■ The concern in the report has been addressed in a prior assessment. ■ The concerns are being addressed through county case management or a Department of
Human Services therapist. ■ Reports of pregnant women using controlled substances or abusing alcohol (when there
are no other children reported as abused or neglected) are also included in the category of administrative assessments, as state law doesn’t allow for a decision of services required (substantiation) in the absence of a live birth.
Child Maltreatment 2017 Appendix d: State Commentary 205
Assessments that are in progress when information indicates the report falls outside of the child abuse and neglect law may be terminated in progress. Reports may also be referred to another jurisdiction when the children of the report are not physically present in the county receiving the report (these reports are referred to another jurisdiction (county, tribal, or state), where the children are present or believed to be present). Reports involving a Native American child living on a reservation are referred to tribal child welfare systems or to the Bureau of Indian Affairs child welfare office. Reports concerning sexual abuse or physical abuse by someone who is not a person responsible for the child’s welfare (noncaregiver) are referred to law enforcement.
Data mapping and calculating the response time, both in the Agency File and in the Child File, has proved to be quite challenging as there is a significant divergence between the state’s administrative rule and policies and the definitions required for NCANDS reporting. In the North Dakota data system, there is only a single code allowed to indicate initiation of an assessment. State administrative rule allows initiation of an assessment to be done by completing a check for records of past involvement, by contact with the subject of a report, or with a collateral contact. In contradiction to the federal definition, the administrative rule does not list contact with a victim as an initiation activity. When a subsequent contact is made with a victim, there is not a separate code within the data system to indicate this action as initiation. Therefore, many assessments initiated under the state administrative rule do not meet the initiation definition in the Child File or Agency File.
Because North Dakota is a county administered system, the state only can determine the numbers of Full-Time Equivalents (FTEs) employed by a county for certain job titles, such as Social Worker or Family Service Specialist. These FTEs may be employed in various county programs for varying portions of their FTE. For Example: A county employee may be a full FTE, but a quarter of their time is spent on CPS functions, a quarter of their time may be in foster care, a quarter of their time may be in adult services, and a quarter of their time may be in-in home case management. The state has no independent way to determine what portions of the FTE are dedicated to CPS functions. Additionally, intake and report analysis functions are the responsibility of each county office. North Dakota does not have a central-ized intake hotline. Finally, counties may assign non-child welfare staff, such as clerical staff or economic assistance staff, to conduct CPS intake functions. These personnel are not included in staff counts. To glean the required information for NCANDS reporting, the state has initiated a survey of the counties in which the counties are asked to report the number of FTEs in their agency dedicated to CPS functions.
ChildrenThe number of victims increased from FFY 2016 to FFY 2017. This increase is consistent with the amount of increase between FFY 2015 and FFY 2016 and is believed to be related to an increase in the overall child population combined with increased caregiver drug and alcohol abuse, based on the numbers of children entering foster care due to caregiver sub-stance abuse.
Child and caregiver risk factor data recording has been strengthened during this reporting period through data system changes; however, due to mapping requirements and limited data resources, NCANDS mapping for risk factor data elements are limited for this reporting
North Dakota (continued)
Child Maltreatment 2017 Appendix d: State Commentary 206
period. The data reporting is expected to improve when the revised risk factor changes are mapped for NCANDS reporting.
Fatalities All fatalities were reported in the Child File. The North Dakota Department of Human Services, Children and Family Services Division is the agency responsible for coordination of the statewide Child Fatality Review Panel as well as serving as the state’s child welfare agency. The Administrator of Child Protection Services serves as the Presiding Officer of the Child Fatality Review Panel. This dual role provides for close coordination between these two processes and aides in the identification of child fatalities due to child abuse and neglect as a sub-category of child fatalities from all causes. The North Dakota Child Fatality Review Panel coordinates with the North Dakota Department of Health Vital Records Division to receive death certificates for all children, ages 0–18 years, who receive a death certificate issued in the state. These death certificates are screened against the child welfare database.
The following children are selected for an in-depth review by the Child Fatality Review Panel: any child who has current or prior CPS involvement; any child who it can be deter-mined is in the custody of the Department of Human Services, county social services, or the Division of Juvenile Services at the time of the death; any child whose manner of death as listed on the death certificate as accident, homicide, suicide or undetermined; and any child for whom the manner of death is listed on the death certificate as natural, but whose death is identified as sudden, unexpected or unexplained. As part of these in-depth reviews, records are requested from any agency identified in the record as being involved with the child in the recent period prior to death, including law enforcement, medical facilities, Child Protection Services, the County Coroner and the State Medical Examiner’s Office for each death. Additionally, the State Medical Examiner’s Office forensic pathologists participate in conducting the reviews. Data from each review is collected and maintained in a separate database. It is this database that is correlated with data extracted from the child welfare database for NCANDS reporting. Even though the NCANDS data does not contain child welfare data concerning children in tribal jurisdiction, the state is confident that all deaths in the state from all causes are identified, reviewed and reported.
As part of these in-depth reviews, records are requested from any agency identified in the record as having involvement with the child in the recent period prior to death, including law enforcement, medical facilities, CPS, the County Coroner and the State Medical Examiner’s Office for each death. Additionally, the State Medical Examiner’s Office forensic pathologists participate in conducting the reviews. Data from each review are collected and maintained in a separate database. It is this database that is correlated with data extracted from the child welfare database for NCANDS reporting. Even though NCANDS data do not contain child welfare data concerning children in tribal jurisdiction, the state is confident that all deaths in the state from all causes are identified, reviewed and reported.
PerpetratorsNorth Dakota reports unknown perpetrators to the relationship category of unknown within the state’s data system (FRAME). Perpetrator IDs for unknown perpetrators are unique to each assessment.
North Dakota (continued)
Child Maltreatment 2017 Appendix d: State Commentary 207
Institutional Child Protection Services are addressed in a separate section of the state statute. Under state statute, institutional child abuse or neglect is defined as situations of known or suspected child abuse or neglect when the institution responsible for the child’s welfare is a residential child care facility, a treatment or care center for individuals with intellectual disabilities, a public or private residential educational facility, a maternity home, or any residential facility owned or managed by the state or a political subdivision of the state. An individual working as facility staff is not held culpable within Institutional Child Protection Services, rather, the facility itself is considered to be a subject (perpetrator) of the report. Assessments of institutional child abuse or neglect are assessed at the state level by regional staff rather than at the county level, as are CPS reports that are non-institutional. All reports of institutional child abuse and neglect are reviewed by a multi-disciplinary state Child Protection Team on a quarterly basis. Determinations of institutional child abuse and neglect are made by team consensus. A determination of indicated means that a child was abused or neglected by the facility. A decision of not indicated means that a child was not abused or neglected by the facility.
There was an increase in reports of institutional child abuse and neglect this FFY. Each year the number of reports continues to increase. Possible explanations for this increase include an increase in the number of youth placed in facilities and increased training efforts for educa-tion and training for facility staff.
Training opportunities for facility staff include online mandated reporter training and state and regional trainings on how to recognize and report child abuse and neglect in a residential setting. Despite the increased number of reports, however, the number of full assessments completed has remained consistent.
Services In the Agency File, the number of children eligible and referred to Individuals with Disabilities Education Act (IDEA) services include only children less than 3 years of age. Of the children eligible and not referred, three children had been previously referred and were receiving IDEA services, three children had left the state and whereabouts were unknown for 1 of the three, 1 child turned age 3 prior to the case determination and was no longer eligible and 1 child was deceased. The reason for non-referral for the remaining children was not available.
The state has limitations when reporting reunification services. Case management services provided by county agencies are dependent upon correct data entry connecting the service with the CPS assessment. Additionally, services provided through referral to service provid-ers outside the county agency may only be documented in narrative form, which prohibits data extraction.
North Dakota (continued)
Child Maltreatment 2017 Appendix d: State Commentary 208
Ohio Contact Denielle Ell-Rittinger Phone 614–752–1143
Title Program Administrator Email [email protected]
Address Office of Families and ChildrenOhio Department of Job and Family ServicesPO Box 183204Columbus, OH 43218–3204
GeneralOhio implements a differential response (DR) system for screened in reports of alleged child abuse and/or neglect. The DR system is comprised of a traditional response (TR) pathway and an alternative response (AR) pathway. Children who are subjects of reports assigned to the AR pathway are mapped to NCANDS as AR nonvictim and have a disposition of AR. Children who are alleged child victims of reports assigned to the TR pathway receive a disposition:
■ Unsubstantiated: the assessment/ investigation determined no occurrence of child abuse or neglect.
■ Substantiated: there is an admission of child abuse or neglect by the person(s) responsible, an adjudication of child abuse or neglect, or other forms of confirmation deemed valid by the public children services agency (PCSA).
■ Indicated: there is circumstantial or other isolated indicators of child abuse or neglect lacking confirmation or a determination by the caseworker that the child may have been abused or neglected based upon completion of an assessment/investigation.
Ohio implemented improved Statewide Automated Child Welfare Information System (SACWIS) functionality during federal fiscal year (FFY) 2017 to better capture child fatality data. Public children services agencies (PCSA) are required to record information on all child fatalities received. All child fatalities alleged to have occurred as a result of possible maltreatment recorded outside of an abuse and/or neglect report have system prompts for the user to record the allegations onto an abuse and/or neglect report. Additionally, all screened-out reports alleging a child fatality may have occurred a result of abuse or neglect are reviewed.
ReportsIn FFY 2017, Ohio experienced an increase in the number of screened-in reports from FFY 2016. Additionally, in FFY 2017 there was an increase of alternative response nonvictim disposition from FFY 2016.
ChildrenRequirements to record the race/ethnicity of children in SACWIS effectuated in FFY 2015 and remain. Child victims as reported by Ohio are children who have received a disposition of substantiated or indicated in the TR pathway.
Fatalities Child maltreatment deaths reported in Ohio’s NCANDS submission are compiled from the data maintained in the SACWIS. The SACWIS data contain information only on those children whose deaths were reported to and investigated by a PCSA or children involved in a child protective services (CPS) report who died during the assessment or investiga-tion period. As a county administered CPS system, Ohio PCSAs have discretion in which referrals are accepted for assessment or investigation. In some cases, the PCSA will not
Child Maltreatment 2017 Appendix d: State Commentary 209
investigate a child fatality report unless there are other children in the home who may be at risk of harm or require services. Referrals of child deaths due to suspected maltreatment not accepted by the PCSA are investigated by law enforcement.
There were multiple child fatalities not included in the FFY 2017 reporting year. This was a result of multiple reports screened in and substantiated addressing a single fatality incident. During FFY 2017, three children were not included in the Child File. The children are reported in the Agency File for the FFY 2017 reporting period.
PerpetratorsThe NCANDS category of “other” perpetrator relationship includes nonrelated (NR) child and NR adult. These are catch-all categories that can be used for any individual who is not a family member. Guidance continues to be provided to agencies to select the most appropriate relationship code (e.g., neighbor) instead of using the nonrelated categories.
Services Ohio is continually working to improve the recording of services data in the SACWIS. Federal grant funds are used for state level program development and support to county agencies providing direct services to children and families.
Ohio policy requires all children ages 0–3 with a substantiated report to be referred to Help Me Grow/Early Intervention. Ohio has established a referral form that is used exclusively by child protective services agencies to refer families and children to Help Me Grow. Ohio’s Help Me Grow/Early Intervention program is supervised by the Ohio Department of Health and is administered through county agencies. This is the number of unique children ages 0–3 with a substantiated report disposition. Although the state does not report AR victims, the data include children and siblings served through both the AR pathway and the TR pathway. All children determined eligible were referred to Help Me Grow. Ohio’s SACWIS generates the Help Me Grow referral form.
Ohio (continued)
Child Maltreatment 2017 Appendix d: State Commentary 210
OklahomaContact Elizabeth Roberts Phone 405–522–3715
Title Programs Manager II Email [email protected]
Address Oklahoma Department of Human ServicesPO Box 25352Oklahoma City, OK 73125
GeneralThe Pinnacle Plan details a five-year plan, beginning with state fiscal year (SFY) 2013, to address 15 performance areas identified in the agreement with plaintiffs in the class action litigation DG vs. Yarbrough, Case No. 08-CV-074. In June 2017, the Statewide Maltreatment in Care (MIC) Dashboard was released. The MIC dashboard was developed to provide a focus on the safety of children in out-of-home care
Oklahoma has continued with the commitment and emphasis on trauma-informed care as a priority in the state. As a result of leadership buy-in and through the Oklahoma Trauma Assessment and Service Center Collaborative (OK-TASCC) grant and other initiatives, Oklahoma is a leader in trauma-informed efforts in terms of knowledge, training, policy, and practice changes. A trauma-informed/focused approach has been essential to enhancing system-wide capacity and sustaining the implementation activities required to address the multiple domains associated with well-being.
As of June 2016, the implementation of the Child Behavioral Health Screener (CBHS) with child welfare (CW) staff was statewide and expanded to include family centered services, adoptions and post-adoptions programs. The CBHS, tailored to different developmental levels, is a brief measure designed to screen monthly for presence of behavioral and trauma-related symptoms that may be negatively impacting child functioning in youth ages birth through 17 years old.
Oklahoma is currently participating in a pilot project involving Eckerd’s Rapid Safety Feedback process. The process uses a combination of predictive analytics in combination with Continuous Quality Improvement (CQI) to provide support and monitoring of cases/intakes where a child has been evaluated by the predictive model to be high risk of death or near death. The pilot is currently implemented and ongoing in Oklahoma County. The project involves a partnership between Eckerd, Oklahoma Child Welfare, Mindshare, and Casey Family Programs. The technology is a means of sorting the data, highlighting correlations, and identifying heightened probability. This identification engages a review process for safety analysis and staffing which is inclusive of frontline field staff, supervisory staff, and CQI staff. A total of 255 families have been engaged through this review process between December 2015 and September 30, 2017.
Oklahoma is also participating in a Title IV-E Waiver Demonstration Project. While DHS historically has serviced children in the home utilizing the evidence-based Safe Care model through a program entitled Comprehensive Home-Based Services (CHBS), it is only appropriate for families where children are at moderate risk of removal. The DHS waiver demonstration project targets those families where the removal risk is higher and therefore not appropriate for CHBS. The flexible use of IV-E funds permits DHS to shift funding to services which safely prevent removals, allowing more children to remain in the home. This demonstration project has implemented the provision of Intensive Safety Services (ISS).
Child Maltreatment 2017 Appendix d: State Commentary 211
ISS is an intensive family preservation program that provides services in the home three to five times a week, eight to 10 hours per week for duration of four to six weeks for families with children ages 0–12. These services are provided by a master’s level licensed behavioral health professional, or one under supervision for licensure, who is trained in Motivational Interviewing (MI) and Cognitive Behavioral Therapy (CBT). The ISS contracted worker connects the family to appropriate community resources based on their needs during the 4- to 6-week period for continued treatment.
ReportsThe Oklahoma Department of Human Services has a statewide, centralized hotline to receive child abuse and neglect reports. An allegation of child abuse or neglect reported in any man-ner to a DHS county office is immediately referred to the hotline. Each report received at the Hotline is screened to determine whether the allegations meet the definition of child abuse or neglect and are within the scope of Child Protective Services (CPS).
DHS responds to an accepted report of child abuse or neglect by initiating an assessment of the family or an investigation of the report in accordance with priority guidelines. The primary purpose of the assessment or investigation is the protection of the child. For assess-ments or investigations, DHS gives special consideration to the risks of any minor child, including a child with a disability, who is vulnerable due to his or her inability to communi-cate effectively about abuse, neglect, or any safety threat.
A priority I report indicates the child is in present danger at risk of serious harm or injury. Allegations of abuse and neglect may be severe and conditions extreme. The situation is responded to immediately, the same day the report is received. Priority II is assigned to all other reports. The response time is established based on the vulnerability and risk of harm to the child. Priority II assessments or investigations are initiated within two – to 10-calendar days from the date the report is accepted for assessment or investigation.
An assessment is conducted when a report meets the abuse or neglect guidelines but does not allege a serious and immediate safety threat to a child. Assessments do not have findings. When a child is determined unsafe in the initial stages of the assessment and the family’s circumstances or the person responsible for the child (PRFC)’s behavior poses a risk to the child, an investigation is immediately initiated by the Child Welfare specialist.
Reports that are appropriate for screening out and are not accepted for assessment or investi-gation are reports:
■ that clearly fall outside the definitions of abuse and neglect per OAC 340:75-3-120, includ-ing minor injury to a child 10 years of age and older who has no significant child abuse and neglect history or history of neglect that would be harmful to a young or disabled child, but poses less of a threat to a child 10 years of age and older;
■ concerning a victim 18 years of age or older, unless the victim is in voluntary placement with DHS;
■ where there is insufficient information to locate the family and child; ■ where there is an indication that the family needs assistance from a social service agency
but there is no indication of child abuse or neglect;
Oklahoma (continued)
Child Maltreatment 2017 Appendix d: State Commentary 212
■ that indicate a child 6 years of age or older is spanked on the buttocks by a foster or trial adoptive parent with no unreasonable force used or injuries observed per OAC 340:75-3-410; and
■ that indicate the alleged perpetrator of child abuse or neglect is not a PRFC, there is no indication the PRFC failed to protect the child, and the report is referred to local law enforcement.
ChildrenLegislation passed in federal fiscal year (FFY) 2013 directed that an investigation, rather than an assessment, be completed whenever the department determines that a child is drug-endangered which is defined as a child who is at risk of suffering physical, psychological or sexual harm as a result of the use, possession, distribution, manufacture or cultivation of controlled substances. The term also includes newborns that test positive for a controlled dangerous substance, except for those substances administered under the care of a physician. The number of investigations in which a newborn tested positive at birth for a substance increased from SFY 2015 to SFY 2016. In SFY 2017, this number decreased slightly DHS will begin tracking these numbers in greater detail in SFY 2018.
Legislation effective in November of 2015 added sexual exploitation to the types of referrals received by the child abuse and neglect hotline, modified the definition of sexual exploita-tion in and added a definition of trafficking in persons to Oklahoma Title 10A, the Children and Juvenile Code. New law also went into effect requiring that DHS, in consultation with state and local law enforcement, juvenile justice systems, health care providers, education agencies, and organizations with experience in dealing with at-risk children and youth, establish policies and procedures, including relevant training for caseworkers, for identifying, documenting in agency records, and determining appropriate services for children and youth at risk of sex trafficking. Child Welfare policy has been updated to include a specialized protocol for child abuse and neglect reports involving child victims of human trafficking.
In the last year, CPS programs have worked with domestic violence partners to ensure consistent training was provided to all child welfare staff. CPS Programs have updated the training curriculum to match current policy and protocols related to domestic violence, educational neglect, substance exposed newborns, and the overall safety decision making process.
Fatalities Oklahoma investigates all reports of child death and near death that are alleged to be the result of abuse or neglect. A final determination of death due or near death due to abuse or neglect is not made until a report is received from the office of the medical examiner which may extend beyond a 12-month period. Fatalities are not reported to NCANDS until the investigation and State Office program review are completed.
The Oklahoma Child Death Review Board conducts a review of every child death and near death in Oklahoma (both attended and unattended). State Office Child Protective Services staff work closely with the Child Death Review Board and is a participating member. Legislation was introduced in FFY 2014 to allow any city or county Fetal Infant Mortality
Oklahoma (continued)
Child Maltreatment 2017 Appendix d: State Commentary 213
Review board of the Health Department to have limited information concerning investiga-tions of fetal and infant mortalities.
All child fatalities and near fatalities with findings in the State Automated Child Welfare System are reported in the Child File. Increased communication with the Office of the Medical Examiner and the addition to the OKDHS staff responsible for final determination and documentation on all child deaths and near deaths has resulted in more timely documen-tation of child deaths.
PerpetratorsOklahoma began reporting perpetrator relationships of group home or residential facility staff in the FFY 2013 Child File. A prior perpetrator is defined as a perpetrator of a substanti-ated maltreatment within the reporting year who has also been a perpetrator in a substanti-ated maltreatment anytime back to 1995, the year of implementation of the State Automated Child Welfare Information System (SACWIS). Oklahoma reports all unknown perpetrators.
Services Post investigation services are services that are provided during the investigation and con-tinue after the investigation, or services that begin within 90 days of closure of the investiga-tion. In cases where the family would benefit from services and the child can be maintained safely in the home, DHS can refer to community services or refer the case to Comprehensive Home-Based Services through a DHS contracted provider. If referred to community services, the DHS investigation can be closed, and DHS will determine within 60 days whether the family has accessed the recommended services and if the child remains safe. If the family is referred to Comprehensive Home-Based Services, DHS will open a Family Centered Services case and follow the family for up to six months.
Oklahoma (continued)
Child Maltreatment 2017 Appendix d: State Commentary 214
OregonContact Eloise Rasmussen Phone 503–945–6093
Title Data Collection and Reporting Research Analyst Email [email protected]
Address Oregon Department of Human Services500 Summer Street NE, E72Salem, OR 97301
GeneralOR-Kids, Oregon’s Statewide Automated Child Welfare Information Systems (SACWIS), allows Oregon to collect data at the child level on nonvictims. Federal fiscal year (FFY) 2017 is Oregon’s fifth Child File that shows child-level data for all children associated with screened-in referrals.
Oregon began a phased implementation of a two-track response system called differential response (DR) in May 2014. This began with Lane, Klamath, and Lake counties. By April 2017, when DR was ended through legislative action, it had expanded to include Benton, Lincoln, Linn, Coos, Curry, Jackson, Josephine, Clackamas, and Washington counties. The two types of response tracks within the DR system are traditional response (TR) and alternative response (AR). Data is reported in the NCANDS Child File for all screened-in Child Protective Services (CPS) reports, regardless of differential response track. Alternative response track CPS reports have report and maltreatment dispositions of alternative response nonvictim. Oregon will continue to work on improving the extraction procedures, as needed, to accurately report all NCANDS data.
ReportsThe investigation start date is the date of actual child or parental contact.
In Oregon, a report is screened out when: ■ No report of child abuse/neglect has been made but the information indicates there is risk
present in the family, but no safety threat. ■ A report of child abuse/neglect is determined to be third party child abuse, but the alleged
perpetrator does not have access to the child, and the parent or caregiver is willing and able to protect the child.
■ An expectant mother reports that conditions or circumstances would endanger the child when born.
■ The child protection screener is unable to identify the family. ChildrenFFY 2017 is Oregon’s fifth Child File that shows child-level data for all children associated with screened-in referrals, rather than just for children with substantiated maltreatment. The NCANDS category “other” maltreatment type includes the state category threat of harm.
Fatalities There is no systemic cause for the increase in the number of fatalities between FFY 2016 and FFY 2017. The state reports fatalities in the Agency File. These cases are dependent upon medical examiner report findings, law enforcement findings, and completed CPS assess-ments, and the fatality cannot be reported as being due to child abuse/neglect until these find-ings are final. Reported fatalities due to child abuse/neglect for FFY 2017 represent deaths due to child abuse/neglect for cases in which the findings were final as of January 25, 2018.
Child Maltreatment 2017 Appendix d: State Commentary 215
PerpetratorsUnique perpetrators between reports are assigned unique identification numbers.
Services The state’s SACWIS does not collect data on prevention services; therefore, it does not currently report these data to NCANDS. Further, the NCANDS Child File information on services is not complete at this time.
Oregon (continued)
Child Maltreatment 2017 Appendix d: State Commentary 216
PennsylvaniaContact Belinda Eigen Phone 717–772–7124
Title Business Analyst Email [email protected]
Address Pennsylvania Department of Human Services1006 Hemlock DriveHarrisburg, PA 17105
GeneralUpon receipt of a report of suspected child abuse, the department shall immediately transmit an oral notice or a notice by electronic technologies to the appropriate county agency that a report of suspected child abuse has been received and the substance of the report. If the report received does not suggest suspected child abuse but does suggest a need for social services or other services or assessment, the department shall transmit the information to the county agency for appropriate action. These allegations or concerns are referred to as General Protective Services (GPS) and are not classified as child abuse in Pennsylvania. The information shall not be considered a child abuse report unless the agency to which the infor-mation was referred has reasonable cause to suspect after assessment that abuse occurred. If the agency has reasonable cause to suspect that abuse occurred, the agency shall notify the department and the initial report shall be upgraded to a child abuse report.
In 2014, Pennsylvania enacted a comprehensive package of child welfare legislative reforms which enhanced the state’s ability to better protect children. The legislation amended the definitions of child abuse and perpetrator and provided for the establishment of a statewide database for tracking child abuse and neglect data. To address these changes, Pennsylvania implemented a new Child Welfare Information Solution (CWIS) on December 2014, and the amended definitions of child abuse and perpetrator took effect December 2014. The changes require Pennsylvania to collect data on GPS reports, Pennsylvania’s alternative response, and Pennsylvania plans on reporting these data in the future.
Pennsylvania defines child abuse as intentionally, knowingly, or recklessly doing any of the following:
■ Causing bodily injury to a child through any recent act or failure to act. ■ Fabricating, feigning, or intentionally exaggerating or inducing a medical symptom or
disease, which results in a potentially harmful medical evaluation or treatment to the child through any recent act.
■ Causing or substantially contributing to serious mental injury to a child through any act or failure to act or a series of such acts or failures to act.
■ Causing sexual abuse or exploitation of a child through any act or failure to act. ■ Creating a reasonable likelihood of bodily injury to a child through any recent act or
failure to act. ■ Creating a likelihood of sexual abuse or exploitation of a child through any recent act or
failure to act. ■ Causing serious physical neglect of a child. ■ Engaging in any of the following recent acts:
• Kicking, biting, throwing, burning, stabbing, or cutting a child in a manner that endan-gers the child.
• Unreasonably restraining or confining a child, based on consideration of the method, location, or the duration of the restraint or confinement.
• Forcefully shaking a child under one year of age.
Child Maltreatment 2017 Appendix d: State Commentary 217
• Forcefully slapping or otherwise striking a child under one year of age.• Interfering with the breathing of a child.• Causing a child to be present at a location while a violation of 18 Pa.C.S. §7508.2
(relating to operation of methamphetamine laboratory) is occurring, provided that the violation is being investigated by law enforcement.
• Leaving a child unsupervised with an individual, other than the child’s parent, who the actor knows or reasonably should have known: • Is required to register as a tier II or tier III sexual offender under 42 Pa.C.S. Ch. 97
Subch. H (relating to registration of sexual offenders), where the victim of the sexual offense was under 18 years of age when the crime was committed.
• Has been determined to be a sexually violent predator under 42 Pa.C.S. §9799.24 (relating to assessments) or any of its predecessors.
• Has been determined to be a sexually violent delinquent child as defined in 42 Pa.C.S. §9799.12 (relating to definitions).
■ Causing the death of the child through any act or failure to act. ■ Engaging a child in a severe form of trafficking in persons or sex trafficking, as those
terms are defined under Section 103 of the Trafficking Victims Protection Act of 2000 (114 Stat. 1466, 22 U.S.C. §7102).
ReportsIn federal fiscal year (FFY) 2017, the number of reports for suspected child abuse increased from FFY 2016. In recent years, Pennsylvania has seen a continuous increase in reports received largely due to legislative changes enacted in late 2014 which expanded the defini-tions of child abuse and perpetrator, streamlined and clarified mandatory child abuse report-ing processes, increased penalties for failure to report suspected child abuse, and protected persons who report child abuse. The law now requires a mandated reporter to make a direct report to the child abuse hotline rather than reporting up a chain of command within his/her organization. The amendments to the definition of child abuse, specifically the inclusion of additional categories of abuse and the lower threshold for substantiating a report of child abuse, have led to an increase in the number of reports being made, as well as the substantia-tion of these reports. Along with the amendments to the definition of child abuse, the defini-tion of perpetrator also has been expanded to capture additional categories of individuals as perpetrators when they abuse a child.
ChildrenIn FFY 2017 the number of victims increased from FFY 2016. This increase is likely due to the amendments to the law as described above.
FatalitiesPennsylvania does not use data from sources and agencies other than child protective services to compile and report child fatalities. Pennsylvania law requires that every child fatality and near fatality resulting from substantiated abuse, or in cases in which no status determination has been made within 30 days, be reviewed at the county level. A state level review is con-ducted on all fatalities and near fatalities where abuse is suspected regardless of status determi-nation. The information and data collected from both levels of review are analyzed for trends and risk factors across Pennsylvania. These reviews and analyses provide the foundation used
Pennsylvania (continued)
Child Maltreatment 2017 Appendix d: State Commentary 218
for determining the root causes of severe child abuse and neglect; they also are used to better understand what responses or services can be used in the future to prevent similar occurrences.
In FFY 2017 the number of unique Child Fatalities decreased from FFY 2016. The state contin-ues to focus attention on training review teams to improve the process, improve data collection, and enhanced analysis to identify prevention efforts that will further reduce the number of child abuse fatalities and near fatalities.
PerpetratorsPennsylvania defines a perpetrator as a person who has committed child abuse and is any of the following:
■ A parent of the child. ■ A spouse or former spouse of the child’s parent. ■ A paramour or former paramour of the child’s parent. ■ A person 14 years of age or older and responsible for the child’s welfare or having direct
contact with children as an employee of child-care services, a school or through a pro-gram, activity or service.
■ An individual 14 years of age or older who resides in the same home as the child. ■ An individual 18 years of age or older who does not reside in the same home as the child
but is related within the third degree of consanguinity or affinity by birth or adoption to the child.
■ An individual 18 years of age or older who engages in severe forms of trafficking in persons or sex trafficking, as those terms are defined under section 103 of the Trafficking Victims Protections Act of 2000 (114 Stat. 1466, 22 U.S.C. § 7102).
Additionally, only the following may be considered a perpetrator for failing to act:
■ A parent of the child. ■ A spouse or former spouse of the child’s parent. ■ A paramour or former paramour of the child’s parent. ■ A person 18 years of age or older and responsible for the child’s welfare. ■ A person 18 years of age or older who resides in the same home as the child.
Services Pennsylvania reports limited data on services and plans to provide more complete services data in the future.
Pennsylvania (continued)
Child Maltreatment 2017 Appendix d: State Commentary 219
Puerto RicoContact Lisa M. Agosto Carrasquillo Phone 787–625–4900
Title Director Central Registry Email [email protected]
Address Puerto Rico Department of the Family––Administration for Families and Children (ADFAN)PO Box 194090San Juan, PR 00919–4090
Contact Carlos A. Rivera Otero Phone -
Title Deputy Administrator Email [email protected]
Address Puerto Rico Department of the Family––Administration for Families and Children (ADFAN)PO Box 194090San Juan, PR 00919–4090
GeneralThe Puerto Rico Department of the Family (DF) is the agency of the Government of Puerto Rico responsible for the provision of the diversity and /or a variety of social welfare ser-vices. As an umbrella agency, four Administrations operate with fiscal and administrative autonomy.
The Assistant Administration for Child Protective Services, under the Administration for Children and Families–ACF (ADFAN, Spanish acronym), is responsible for the investigation of intra-familial and institutional child abuse and neglect (CA/N) referrals. As one of its primary components, the State Center for the Protection of Children is responsible for the operation of the Child Abuse and Neglect Hotline and the Orientation and Family Support Hotline. Both lines are responsible for providing an expedited system of communication to receive family and/or institutional referrals and to provide orientation and crisis interven-tion in different areas of family life. It also operates the Central Registry, which maintains updated statistical and programmatic information about the movement of CA/N referrals and cases receiving services by ADFAN.
Puerto Rico’s procedure is established through the “Manual Of Rules, Procedures And Standards of Execution on the Model Of Security in the Investigation Of Reports Of Maltreatment to Minors” April 2013, where amendments were established aimed at including the security areas for data collection in a referral of abuse and thus improve the screening and establish the priorities of appropriate responses according to the information received in a call.
The implementation of the SIMCa mechanized system began April 2016, and not all data were able to be migrated to the new system. Therefore, federal fiscal year (FFY) 2017 is the first full year of data reported to NCANDS using the new system.
Hurricanes occurring during the month of September affected child protection services, limiting the investigations and directing efforts to aid assistance to affected families.
ReportsThe Assistant Administration for Child Protective Services is responsible for the investiga-tion of intra-familial and institutional CA/N referrals. As one of its primary components, the State Center for the Protection of Children is responsible for the operation of the Child Abuse and Neglect Hotline and the Orientation and Family Support Hotline. Both lines are Child Maltreatment 2017 Appendix d: State Commentary 220
responsible for providing an expedited system of communication to receive family and/or institutional referrals and to provide orientation and crisis intervention in different areas of family life. It also operates the Central Registry, which maintains updated statistical and programmatic information about the movement of CA/N referrals and cases receiving services by ADFAN.
The increase in the number of referrals compared to last year is attributed to the form of selection of the victims; the previous year the form of selection produced an error that elimi-nated reports. This year, there was a change in the method of selection of the victims in the area of allegations, so the number of errors was reduced, and more referrals were accepted.
ChildrenFFY 2017 is the first submission using the maltreatment type and disposition of no alleged maltreatment. As part of Puerto Rico’s cultural background, people are generally not clas-sified by race. This is the main reason that there are as many records with races recorded as unknown or missing.
FatalitiesThe primary source of information for the child fatality data is the Sistema Integrado de Manejo de Casos (SIMCa), the Information System for the Registration of Investigations and Handling Cases of Child Abuse.
The death of minors was not reflected in the Child File this year. In order for the system to recognize a fatality, deceased children must be deactivated, and required fields (a date and cause of death) must be entered. If this process is done incorrectly or incompletely, the system does not recognize the child fatality. The state attributes this as user error related to a lack of familiarity with the new system. These fatalities are included in the Agency File for FFY 2017. In some cases, an investigation into the death of a minor requires validation by the Forensic Science Office of the state to conclude the death was a result of maltreatment.
PerpetratorsThe system has no validation between the relationship of the combination of all victims and perpetrators. This causes errors that reflect increases in the unknown relationship between the victims and perpetrators.
ServicesIn June 2017, a collaborative agreement was signed with the pharmaceutical company Abbott Laboratories for a campaign aimed at reporting the harmful effects of shaking a baby, thus preventing the deaths of infants.
A collaborative agreement was signed with the Department of Agriculture (DA), which established that the Head Start Centers, Early Head Start Centers and Multiple Activities Centers for the Elderly (Campea), acquire fresh products from farmers. The purpose will be for the elderly and minors to obtain a balanced diet and the products of daily consumption directly through the DA, acquiring fresh fruits and vegetables from the country harvested by local farmers.
Puerto Rico (continued)
Child Maltreatment 2017 Appendix d: State Commentary 221
Another initiative is the Mutual Assistance Between homes and Refugees (AMOR) Project, which began with a collaborative agreement between the Department, Rabitos Kontentos, Corp., and the College of Veterinary Doctors of Puerto Rico. The agreement was signed in March 2017. The AMOR Project (seeks to address the existing need to impact the most vulnerable populations, namely abused children, elderly, and disabled persons, who are located in care institutions 24-hours-a-day. The nonprofit entity Rabitos Kontentos, Corp specializes in the use of therapeutic dogs with children and the elderly to provide experience with interaction, providing love and at the same time raising awareness of the importance of good treatment toward living beings.
Puerto Rico (continued)
Child Maltreatment 2017 Appendix d: State Commentary 222
Rhode IslandContact David Allenson Phone 401–528–3858
Title Agency IT Manager Email [email protected]
Address Rhode Island Department of Children, Youth and Families101 Friendship Street Providence, RI
GeneralIn 2016, Rhode Island began the process of implementing Structured Decision Making within the Child Protective Services Division. The Department has identified key decision points that significantly affect families: receipt of initial information, investigative determi-nation, response priority and removal of a child. Consultations with industry professionals have confirmed the consistent use of structured assessments at each decision point would enhance safety, permanency and well-being of children and families, better support staff, and allow resources to be more effectively utilized.
ReportsThe Department of Children, Youth and Families (DCYF) is required to investigate reports of child abuse and neglect. DCYF promulgated Policy 500.0010 to identify the five criteria for child protective services (CPS) investigations/alerts. The CPS criteria are as follows:
■ Investigation Criteria 1: Child Abuse/Neglect (CA/N) Report-RIGL 40–11–3 requires DCYF to immediately investigate reports of child abuse and neglect. The circumstances reported, if true, must constitute child abuse/neglect as defined by RIGL 40–11–2.
■ Investigation Criteria 2: Nonrelative Caregiver-RIGL 42–72.1–4 requires that no parent assigns or otherwise transfers to another, not related to him or her by blood or marriage, his or her rights or duties with respect to the permanent care and custody of his or her child under eighteen years of age unless duly authorized by an order or decree of the court.
■ Investigation Criteria 3: Sexual Abuse of a Child by Another Child-RIGL 40–11–3 requires DCYF to immediately investigate sexual abuse of a child by another child.
■ Investigation Criteria 4: Duty to Warn-RIGL 42–72–8 allows DCYF to release informa-tion if it is determined that there is a risk of physical injury by a person to himself/herself or others and that disclosure of the records is necessary to reduce that risk. If the hotline receives a report that a perpetrator of sexual abuse or serious physical abuse has access to another child in a family dwelling, that report is classified as an investigation and assigned for investigation.
■ Investigation Criteria 5: Alert to Area Hospitals —Safety of Unborn Child —RIGL 42–72–8 allows DCYF to release information if it is determined that there is a risk of physical injury by a person to himself/herself or others and that disclosure of the records is necessary to reduce that risk. The department issues an alert to area hospitals when a parent has a history of substantiated child abuse/neglect or a child abuse/neglect convic-tion and there is concern about the safety of a child.
Those cases that do not meet the criteria for investigation and there is concern for the well-being of a child may be classified as an information and referral (I/R). This classification is a derivative of a previous protocol that DCYF had relating to classifying reports to the child abuse hotline as early warnings. The I/R process is not reflected in RIGL. Rather, DCYF has promulgated a policy and published a protocol that codifies the informational and referral process. Pursuant to the department’s I/R policy, when an I/R report is received by the child abuse hotline relating to a case that is not active with DCYF and it appears that there is a
Child Maltreatment 2017 Appendix d: State Commentary 223
service need, a referral for service is made to CPS intake. When an I/R report is received on a case active to DCYF, a notification is made to the primary caseworker and supervisor.
While the Statewide Automated Child Welfare Information System (RICHIST) can link more than one report source per report, only one person can be identified as the person who actually makes the report. If more than one report is linked to an investigation, the person identified as the reporter in the first report is used in the Child File.
The total number of CPS workers is based upon currently occupied full-time equivalents (FTEs) for child protective investigators, child protective supervisors, intake social case-workers II, and intake casework supervisors II. Supervisors accept, screen, and investigate reports meeting criteria for child abuse and child neglect. Intake and case monitoring social caseworkers II and intake casework supervisors II are responsible for screening all new cases entering the department via CPS investigations, intake service self-referrals, and family court referrals. Upon screening those cases, intake determines whether cases can be closed to the department upon referral to community-based services, or if the family warrants legal status or a higher level of DCYF oversight and permanency planning, which results in transfer to DCYF Family Service Units.
The investigation start date is defined as the date when CPS first had face-to-face contact with the alleged victim of the child maltreatment or attempted to have face-to-face contact. The data are recorded as a date/timestamp which includes the date and the time of the contact or attempted contact.
ChildrenThe NCANDS category of “other” maltreatment type includes the state categories of institutional allegations such as corporal punishment, other institutional abuse, and other institutional neglect. The current policy is that only the named victim has an allegation, and the facility or home is referred to the licensing unit to look at licensing violations rather than child abuse or neglect.
Fatalities The fatalities reported for child abuse and neglect in the Child and Agency Files only come from those reported to the department and recorded in RICHIST. By state law, all child maltreatment is required to be reported to DCYF, regardless of whether it results in a death. There are no other sources except RICHIST that collect fatality information.
Rhode Island (continued)
Child Maltreatment 2017 Appendix d: State Commentary 224
South CarolinaContact Lynn Horne Phone 803–724–5933
Title CAPSS Project Administrator Email [email protected]
Address South Carolina Department of Social ServicesPO Box 1520Columbia, SC 29201
GeneralSouth Carolina has continued with Community Based Prevention Services (CBPS), which began in January 2012. This program serves as the South Carolina Department of Social Services’ (DSS) alternative response program. The Department of Social Services (DSS) uses the Safety and Risk Matrix to assess intakes made to the Abuse and Neglect Hotline. Accepted intakes are assigned to investigation if safety or high-risk issues are present. Referral to CBPS is only for those cases in which the intake and resulting matrix assessment indicate low to moderate risk. These cases are not accepted by the Agency for investiga-tion. CBPS is a contracted service with private providers and an interface for assessments and dictation which is populated in the Comprehensive Child Welfare Information System (CCWIS, also known as CAPSS in South Carolina).
ReportsReferrals and screened-in referrals continued to slightly increase in federal fiscal year (FFY) 2017 as South Carolina operationalizes regionalized intake centers in a multi-year project. The implementation of regionalized intake staff and centralized intake practice and leader-ship is designed to increase the efficiency and consistency across the state related to evalua-tion and assignment of CPS complaints.
ChildrenThe children in families referred for CBPS are reported in FFY 2017 NCANDS data submis-sion with a disposition of alternative response nonvictim and the NCANDS category of “other” maltreatment type. The number of children increased as there were more referrals made to CBPS in FFY 2017 than in FFY 2016. All demographic information is reported on these children.
Fatalities There was a slight increase in child fatalities investigated by SCDSS from FFY 2016 to FFY 2017. There were three incidents which included two deceased siblings. No policy or legisla-tive changes impacted child fatalities.
Law enforcement, the coroner, the medical examiner, and the Department of Health and Environmental Control (Bureau of Vital Statistics Division) report all child deaths that were not the result of natural causes, to the State Law Enforcement Division (SLED) for an investigation. SLED refers their findings to the State Child Fatality Committee for a review. The children whose deaths appear to have been a result of child maltreatment by a “person responsible for a child’s welfare,” including, but not limited to a parent, guardian, or foster parent are reported to DSS by SLED during their investigation. This list is compared to the agency SACWIS system by name, date of birth, date of death, and parents’ names to ensure there is no duplication in reporting the fatalities in the NCANDS Child and Agency Files. The Agency File includes all fatalities that occurred in FFY 2017 that were not included in the Child File and were reported to SCDSS by the State Child Fatality Committee.
Child Maltreatment 2017 Appendix d: State Commentary 225
South DakotaContact JoLynn Bostrom Phone 605–347–2588 ext. 203
Title Program Specialist Email [email protected]
Address South Dakota Department of Social Services2200 W. Main StreetSturgis, SD 57785
GeneralChild Protection Services (CPS) does not utilize the differential response model. CPS either screens in reports, which are assigned as initial family assessments, or the reports are screened out. However, the initial family assessment allows CPS to open a case for services based on safety threats without substantiation of an incident of abuse or neglect. South Dakota does refer reports to other agencies if the report does not meet the requirements for assignment, and it appears the family could benefit from the assistance of another agency.
ReportsCPS child abuse and neglect screening and response processes are based on allegations that indicate the presence of safety threats, which includes the concern for child maltreatment. CPS makes screening decisions through the use of the Screening Guideline and Response Decision Tool. Assignment is based on child safety and vulnerability. The response decision is related to whether the information reported indicates present danger, impending danger, or any other safety threat. A report is screened out if it does not meet the criteria in the Screening Guideline and Response Decision Tool as described above.
The NCANDS category of “other” report source includes the state codes of clergy, commu-nity person, coroner, domestic violence shelter employee or volunteer, funeral director, other state agency, public official, and tribal official. Reports of abuse and neglect are categorized into four types–neglect, physical abuse, sexual abuse, and/or emotional maltreatment. Medical neglect is included in the neglect category.
ChildrenThe data reported in the Child File includes children who were victims of substantiated reports of child abuse and neglect where the perpetrator is the parent, guardian or custodian.
Fatalities Children who died due to substantiated child abuse and neglect by their parent, guardian or custodian are reported as child fatalities. The number reported each year are those victims involved in a report disposed during the report period, even if their date of death may have actually been in the previous year. The state of South Dakota reports child fatalities in the Child File and the Agency File.
South Dakota Codified Law 26-8A-3 mandates which entities are required to report child abuse and neglect.
“26-8A-3. Persons required to report child abuse or neglected child–Intentional failure as misdemeanor. Any physician, dentist, doctor of osteopathy, chiropractor, optometrist, emergency medical technician, paramedic, mental health professional or counselor, podiatrist, psychologist, religious healing practitioner, social worker, hospital intern or resident, parole or court services officer, law enforcement officer,
Child Maltreatment 2017 Appendix d: State Commentary 226
teacher, school counselor, school official, nurse, licensed or registered child welfare provider, employee or volunteer of a domestic abuse shelter, employee or volunteer of a child advocacy organization or child welfare service provider, chemical dependency counselor, coroner, or any safety-sensitive position as defined in § 3-6C-1, who has reasonable cause to suspect that a child under the age of eighteen has been abused or neglected as defined in § 26-8A-2 shall report that information in accordance with §§ 26-8A-6, 26-8A-7, and 26-8A-8. Any person who intentionally fails to make the required report is guilty of a Class 1 misdemeanor. Any person who knows or has reason to suspect that a child has been abused or neglected as defined in § 26-8A-2 may report that information as provided in § 26-8A-8.”
South Dakota Codified Law 26-8A-4 mandates that anyone who has reasonable cause to suspect that a child has died as a result of child abuse or neglect must report. The reporting process required by SDCL 26-8A-4 stipulates that the report must be made to the medical examiner or coroner and in turn the medical examiner or coroner must report to the South Dakota Department of Social Services.
“26-8A-4. Additional persons to report death resulting from abuse or neglect--Inten-tional failure as misdemeanor. In addition to the report required under § 26-8A-3, any person who has reasonable cause to suspect that a child has died as a result of child abuse or neglect as defined in § 26-8A-2 shall report that information to the medical examiner or coroner. Upon receipt of the report, the medical examiner or coroner shall cause an investigation to be made and submit written findings to the state’s attorney and the Department of Social Services. Any person required to report under this section who knowingly and intentionally fails to make a report is guilty of a Class 1 misdemeanor.”
When CPS receives reports of child maltreatment deaths as required under SDCL 26-8A-4 from any source, CPS documents the report in the Statewide Child Welfare Information System (SACWIS). Reports that meet the NCANDS data definition are reported to NCANDS. The Justice for Children’s Committee (Children’s Justice Act Task Force) is also updated annually on the handling of suspected child abuse and neglect related fatalities.
PerpetratorsPerpetrators are defined as individuals who abused or neglected a child and are the child’s parent, guardian or custodian. The state information system designates one perpetrator per child per allegation.
Services The Agency File data includes services provided to children and families where funds were used for primary prevention from the Community Based Family Resource and Support Grant. This primarily involves individuals who received benefit from parenting education classes or parent aide services.
The state of South Dakota, Division of Child Protection Services with the consent of the parent, refers every child under the age of 3 involved in a substantiated case of child abuse or neglect to the Department of Education’s Birth to Three Connections program. This program
South Dakota (continued)
Child Maltreatment 2017 Appendix d: State Commentary 227
is responsible for the Individuals with Disabilities Education Act (IDEA) services. The parent or guardian is advised by the Division of Child Protection Services that with their permis-sion, a referral to Birth to Three Connections will be made for a developmental screening of their child. The parent or guardian needs to sign a DSS Information Authorization Form before the referral is made. The parent or guardian is also given a Birth to Three Connections brochure and provided the name of the service coordinator that will be contacting them to schedule the screening. The Birth to Three Connections intake form is then completed and faxed with the Information Authorization to the Birth to Three Connections coordinators to determine eligibility and write an Individual Family Service Plan for eligible children within 45 days of the receipt of the referral. Not all children referred by the Division of Child Protection Services to the Birth to Three program are eligible for services.
South Dakota (continued)
Child Maltreatment 2017 Appendix d: State Commentary 228
TennesseeContact Brian Gracia Phone 615–741–7338
Title Programmer Analyst Supervisor Email [email protected]
Address Tennessee Department of Children ServicesDany Crocket Tower 2nd Floor500 James Robertson ParkwayNashville, TN 37247
General Beginning with federal fiscal year (FFY) 2016, the allegations of drug exposed child and drug exposed infant are mapped to the NCANDS maltreatment type of physical abuse. Previously, these two allegations were mapped to neglect.
ReportsDuring FFY 2017, the Agency had a change in both Child Protective Services (CPS) screen-ing policy and the safety assessment tool used to screen in/out referrals. The effects of these changes on the reported Child File data are unknown at this time.
The state definition of the start of the investigation differs from the NCANDS definition. Consequently, response time with respect to the initial investigation or assessment is not reported in the Agency File.
ChildrenThe NCANDS report source category of “other” includes referrals made by licensed persons from a social services agency.
Fatalities All child maltreatment fatalities are extracted from the Statewide Automated Child Welfare Information System (SACWIS) and are reported in the Child File. There has been no change in the Agency’s practices or policies during FFY 2017 in regard to reporting child fatalities.
PerpetratorsThe following perpetrators fields are captured by the SACWIS in the case recording narra-tive and cannot be extracted for reporting purposes. When possible, perpetrator as caregiver is indicated in the Child File, but should be deemed as unreliable.
■ perpetrator–1 as caregiver ■ perpetrator–2 as caregiver ■ perpetrator–3 as caregiver ■ incident date
Services The following services fields are captured by the SACWIS in the case recording narrative and cannot be extracted for reporting purposes:
■ family preservation services ■ family planning services ■ housing services ■ information and referral services
Child Maltreatment 2017 Appendix d: State Commentary 229
The following services fields are not collected and cannot be reported: ■ number of out-of-court contacts between the court appointed representatives and the child
victims they represent ■ unique child victims eligible for referral to agencies providing early intervention services ■ unique child victims referred to agencies providing early intervention services under Part
C of the Individuals with Disabilities Education Act
Tennessee (continued)
Child Maltreatment 2017 Appendix d: State Commentary 230
TexasContact Mark Prindle Phone 512–929–6753
Title System Analyst Email [email protected]
Address Texas Department of Family and Protective Services2323 Ridgepoint DriveAustin, TX 78754
GeneralAlternative Response (AR) is a new approach that responds differently than traditional inves-tigations to reports of abuse/neglect. It allows for a more flexible, family engaging approach while still focusing on the safety of the children as much as in a traditional investigation. AR allows screened-in reports of low to moderate risk to be diverted from a traditional investiga-tion and serviced through an alternative family centered assessment track. There is no change in the number or type of clients served, but some alternative response clients are served in a different manner. Generally, the alternative response track serves accepted child abuse and neglect cases that do not allege serious harm. AR cases differ from traditional investigations cases in that there is no substantiation of allegations related roles, dispositions are not used, names of perpetrators are not be entered into the Central Registry (a repository for confirmed reports of child abuse and neglect), and there is a heightened focus on guiding the family to plan for safety in a way that works for them and therefore sustains the safety.
Beginning in November 2014, alternative response was initially implemented in portions of Regions 1, 3, and 11 to begin practicing AR and to develop experience and expertise. Implementation was staggered to allow for planning and training. Five of 12 regions were implemented between May 2015 and May 2016. State-wide implementation is expected to be completed by June of 2019.
ReportsAll reports of maltreatment within the jurisdiction of the Texas Department of Family and Protective Services (DFPS) are investigated, excluding those which during the screening pro-cess are determined not to warrant an investigation based on reliable collateral information.
The state considers the start of the investigation to be the point at which the first actual or attempted contact is made with a principal in the investigation. In some instances, the worker will get a report about a new incident of abuse or neglect involving a family who is already being investigated or receiving services in an open CPS case. There also are instances in which workers begin their investigation when families and children are brought to or walk-in an office or 24-hour shelter. In both situations, the worker would then report the maltreat-ment incident after the first face-to-face contact initializing the investigation has been made. Because the report date is recorded as the date the suspected maltreatment is reported to the agency, these situations would result in the report date being after the investigation start date.
The state’s CPS schema regarding disposition hierarchy differs from NCANDS hierarchy. The state has other and closed-no finding codes as superseding unsubstantiated at the report level. The state’s hierarchy for overall disposition is, from highest to lowest, Reason to Believe (RTB), Unable to Determine (UTD), Ruled Out (R/O), and Unable to Complete (UTC). Mapping for NCANDS reporting is: RTB is coded to substantiated; UTD is coded to other; UTC is coded to closed no finding; and R/O is coded to unsubstantiated. An inconsistency in the hierarchies for the state and for NCANDS occurs in investigations where
Child Maltreatment 2017 Appendix d: State Commentary 231
an alleged victim has multiple maltreatment allegations and one has a disposition of UTD while the other has a maltreatment disposition of R/O. According to the state’s hierarchy, the overall disposition for these investigations is UTD. Mapping the report disposition to the NCANDS category of unsubstantiated as indicated in the NCANDS’s report disposition hierarchy report would be inconsistent with state policy.
There is no CPS program requirement or state requirement to capture incident date, so there is no data field in the Statewide Automated Child Welfare Information System (SACWIS) system for this information. This is a historical issue; abuse and neglect often is ongoing, and therefore identifying one date would be inaccurate.
The Structure Decision Making (SDM) system includes a series of evidenced-based assess-ments used at key points in child protection casework to support staff in making consistent, accurate, and equitable decisions throughout the course of their work with families. In Texas, select SDM assessments are being implemented across the state in two phases. Phase 1 began in January 2015 with the goal of implementing the SDM safety assessment and risk assessment in investigations by September 2015. The safety assessment provides structured information concerning the danger of immediate harm/maltreatment to a child. This assess-ment guides and supports decisions about whether a child may remain in the home with no intervention, may remain in the home with a safety plan in place, or must be protectively placed. The second SDM assessment tool implemented by Texas was the family risk assess-ment. The risk assessment is a research-based assessment that estimates the likelihood that a family will again become involved with CPS due to a subsequent maltreatment incident. The risk assessment incorporates a range of family characteristics (e.g., number of prior referrals, children’s ages, and caregiver behaviors) that all demonstrate a strong correlation with subsequent child abuse/neglect referrals. In September 2016, a third SDM tool, the Family Strengths and Needs Assessment, rolled out statewide and is used in Family Based Safety Services (FBSS) and conservatorship cases to assess family strengths and needs and to help inform the Family Plan of Service. Phase II may include the roll out of two additional SDM tools, the risk reassessment and the family reunification assessment, which may occur in FFY 2018. Also, in FFY 2018, the SDM safety assessment and risk assessment will be implemented in alternative response.
ChildrenThe state does not make a distinction between substantiated and indicated victims. Texas has implemented the breakout of sex trafficking from the sexual abuse maltreatment type to comply with the Justice for Victims of Sex Trafficking Act of 2015. During federal fiscal year (FFY) 2017, Texas received 394 unique reports of sex trafficking resulting in 513 unique victims. Texas confirmed 24 victims of sex trafficking.
The following rules apply in Texas: ■ A child has the role of designated victim when he or she is named as a victim in an allega-
tion that has a disposition of reason to believe. ■ A child age 10 or older has the role of designated both (i.e., designated victim and desig-
nated perpetrator in the same case) when he or she is named as a victim in an allegation that has a disposition of reason to believe and as a perpetrator in an allegation that has a disposition of reason to believe.
Texas (continued)
Child Maltreatment 2017 Appendix d: State Commentary 232
■ A person (child or adult) has the role of unknown (unable to determine) when he or she is named in an allegation that has a disposition of unable to determine but is not named in another allegation that has a disposition of reason to believe.
■ A person (child or adult) has the role of unknown (unable to complete) when he or she is named in an allegation that has a disposition of unable to complete but is not named in another allegation that has a disposition of reason to believe or unable to determine.
■ A person (child or adult) has the role of not involved when: all the allegations in which the person is named have a disposition of ruled out, the overall disposition for the investiga-tion is administrative closure, or the person was not named in an allegation as a perpetra-tor or victim.
The state can provide data for living arrangement at the time of the alleged incident of maltreatment only for children investigated while in a substitute care living situation. All others are reported as unknown.
Fatalities The source of information used for reporting child maltreatment fatalities is the reason for death field contained in the DFPS Information Management Protecting Adults and Children in Texas (IMPACT) system.
DFPS uses information from the state’s vital statistics department, child death review teams, law enforcement agencies, and medical examiners’ offices when reporting fatalities. DFPS is the agency required by law to investigate and report on child maltreatment fatalities in Texas when the perpetrator is a person responsible for the care of the child. Information from the other agencies/entities is often used to make reports to DFPS that initiate an investigation into suspected abuse or neglect that may have led to a child fatality. Also, DFPS uses infor-mation gathered by law enforcement and medical examiners’ offices to reach dispositions in the child fatalities investigated by DFPS. Other agencies, however, have different criteria for assessing and evaluating causes of death that may not be consistent with the child abuse/neglect definitions in the Texas Family Code and/or may not be interpreted or applied in the same manner as within DFPS.
Over the past 5 years, DFPS has strengthened collaborations with external stakeholders to more effectively target prevention efforts toward preventable deaths such as drownings and co-sleeping. Utilizing a public health approach, DFPS is committed to sustaining prevention, education, and outreach campaigns with internal and external stakeholders to address child fatalities, with the goal of decreasing child maltreatment overall.
While fiscal year (FY) 2017 fatalities are not all completed, the tentative data shows the following decreases:
■ Decreases in unsafe sleep/co-sleeping fatalities ■ Decreases in drownings after significant high in FY2016 ■ Decreases in homicides/physical abuse ■ Decreases in vehicle related fatalities
Texas (continued)
Child Maltreatment 2017 Appendix d: State Commentary 233
PerpetratorsA child age 10 or older has the role of designated perpetrator when he or she is named as a perpetrator in an allegation that has a disposition of reason to believe. A child age 10 or older has the role of designated both (i.e., designated victim and designated perpetrator in the same case) when he or she is named as a victim in an allegation that has a disposition of reason to believe and as a perpetrator in an allegation that has a disposition of reason to believe.
Relationships reported for individuals are based on the person’s relationship to the oldest alleged victim in the investigation. The state is unable to report the perpetrator’s relationship to each individual alleged victim, but rather reports data as the perpetrator relates to the oldest alleged victim.
Currently the state’s relationship code for foster parent does not distinguish between relative/nonrelative.
ServicesThe Prevention and Early Intervention Reporting System (PEIRs) was launched in June 2017. It is being upgraded to include the Texas Home Visiting program and is expected to go live in FFY 2020. This system is designed to use significant business rules to support quality data entry that allows the system to produce outputs, outcomes, and efficiencies at the individual, family, and programmatic level. While being flexible for any new data collection require-ments, the system is designed to allow Prevention and Early Intervention (PEI) programs to have access to real-time data to monitor, provide technical assistance to providers, as well as meet all state and federal reporting requirements.
Texas (continued)
Child Maltreatment 2017 Appendix d: State Commentary 234
UtahContact Dustin Steinacker Phone 801–538– 4018
Title Senior Business Analyst Email [email protected]
Address Utah Division of Child and Family Services 195 N. 1950 W.Salt Lake City, UT 84116
GeneralNo significant changes have occurred in the state of Utah’s policies, programs, or procedures affecting interpretation of NCANDS data for federal fiscal year (FFY) 2017.
ReportsThe investigation start date is defined as the date a child is first seen by CPS. The data is captured in date, hours, and minutes. A referral is screened out in situations including, but not limited to:
■ The minimum required information for accepting a referral is not available. ■ As a result of research, the information is found not credible or reliable. ■ The specific incidence or allegation has been previously investigated and no new informa-
tion is gathered. ■ If all the information provided by the referent were found to be true, the case finding
would still be unsupported. ■ The specific allegation is under investigation and no new information is gathered.
The state uses the following findings: ■ Supported: a finding, based on the information available to the worker at the end of the
investigation, that there is a reasonable basis to conclude that abuse, neglect, or depen-dency occurred, and that the identified perpetrator is responsible.
■ Unsupported: a finding based on the information available to the worker at the end of the investigation that there was insufficient information to conclude that abuse, neglect, or dependency occurred. A finding of unsupported means that the worker was unable to make a positive determination that the allegation was actually without merit.
■ Without merit: an affirmative finding at the completion of the investigation that the alleged abuse, neglect, or dependency did not occur, or that the alleged perpetrator was not responsible.
■ Unable to locate–a category indicating that even though the child and family services child protective services worker has followed the steps outlined in child and family services practice guideline and has made reasonable efforts, the child and family services child protective services worker has been unable to make face-to-face contact with the alleged victims to investigate an allegation of abuse, neglect, or dependency and to make a determination of whether the allegation should be classified as supported, non-supported, or without merit.
FatalitiesConcerns related to child abuse and neglect, including fatalities, are required to be reported to the Utah Division of Child and Family Services (DCFS). Fatalities where the child pro-tective services (CPS) investigation determined the abuse was due to abuse or neglect are reported in the NCANDS Child File.
Child Maltreatment 2017 Appendix d: State Commentary 235
Services As of April 2015, Utah’s CPS workers no longer screen for developmental delays. DCFS now directly refers children to the Utah early intervention agency to better meet the requirements outlined in the Child Abuse Prevention and Treatment Act (CAPTA) regarding the “refer-ral of a child under the age of 3 who is involved in a substantiated case of child abuse or neglect to early intervention services funded under part C of the Individuals with Disabilities Education Act”. Since April, a list of every child 34.5 months or younger, with a supported finding of abuse or neglect is sent to the Utah Department of Health’s Baby Watch Early Intervention Program (BWEIP), which then contacts the family to offer their screening services. In addition, DCFS sends a letter to each family to inform them of this mandatory referral and encourage them to accept the screening.
In previous submission years, prevention services in the Agency File were only reported in terms of children served and not families served in order to avoid duplication, and because of different interpretations of the word “family” across service providers. However, for FFY 2017, the state has defined a reliable measure of families served and have begun reporting a count of families who receive prevention services. Note that both children and families may be counted twice if they received services from different agencies receiving money from the same funding source.
Utah (continued)
Child Maltreatment 2017 Appendix d: State Commentary 236
VermontContact Melissa Burt Phone 802–241–0879
Title Quality Assurance Coordinator Email [email protected]
Address Vermont Department for Children and Families 280 State Drive, HC1 NorthWaterbury, VT 05671
GeneralVermont has a differential response program with an assessment track and an investigation track. About 40 percent of cases are assigned to the assessment pathway. In the assessment pathway, the disposition options are services needed and no services needed. Cases assigned to the assessment pathway may be switched to the investigation pathway, but not vice versa. Data from both pathways are reported to NCANDS. The Family Services Division is respon-sible for responding to allegations of child abuse or risk of harm by caregivers and sexual abuse by any person (not just caregivers). In addition to conducting statutory child abuse investigations and assessments, we also have an option to conduct family assessments. These family assessments do not meet statutory requirements for abuse and neglect but provide an option to engage with families where there are concerns. Because these family assess-ments are not part of the state’s abuse and neglect statute, they are not reflected in the data. However, it is important to acknowledge that on an annual basis we conduct approximately 1,000–1,200 family assessments.
ReportsVermont operates a statewide child protection hotline, available 24/7. All intakes are handled by social workers and screening decisions are handled by hotline supervisors. These same supervisors make the initial track assignment decision. All calls to the child abuse hotline are counted as referrals, resulting in a very high rate of referrals per 1,000 children, and mak-ing it appear that Vermont has a very low screen-in rate. Reasons for screening a report out include: (1) duplicate report (2) report does not concern child maltreatment as defined in state statute.
ChildrenThe Family Services Division is responsible for investigating allegations of child abuse or neglect by caregivers and sexual abuse by any person. The department investigates risk of physical harm and risk of sexual abuse.
FatalitiesThe department is an active participant in Vermont’s Child Fatality Review Committee.
PerpetratorsFor sexual abuse, perpetrators include noncaregiver perpetrators of any age.
ServicesFollowing an investigation or assessment, a validated risk assessment tool is applied. If the family is classified as at high- or very high-risk for future child maltreatment, the family is offered in-home services, and may be referred to other community services designed to address risk factors and build protective capacities.
Child Maltreatment 2017 Appendix d: State Commentary 237
VirginiaContact Christopher Spain Phone 804–726–7554
Title Program Manager Child Protective Services Email [email protected]
Address Virginia Department of Social Services801 East Main Street, 15h floorRichmond, VA 23219
Contact David Bringman Phone 804–726–7553
Title Policy Analyst Email [email protected]
Address Virginia Department of Social Services801 East Main Street, 15h floorRichmond, VA 23219
GeneralIn accordance with Virginia Administrative Code 22VAC40-705-130(A)(4), the record of the unfounded case shall be purged one year after the date of the complaint or report if there are no subsequent founded or unfounded complaints and/or reports regarding the individual against whom allegations of abuse and/or neglect were made or regarding the same child in that one year. Therefore, with each subsequent data resubmission, there is a decrease in the number of unsubstantiated reports submitted.
The Virginia Administrative Code 22VAC40-705-10 defines family assessment as the collec-tion of information necessary to determine:
■ The immediate safety needs of the child ■ The protective and rehabilitative services needs of the child and family that will deter
abuse or neglect ■ Risk of future harm to the child ■ Alternative plans for the child’s safety if protective and rehabilitative services are indi-
cated and the family is unable or unwilling to participate in services. These arrangements may be made in consultation with the caregiver(s) of the child.
ReportsReports placed in the investigation track receive a disposition of founded, substantiated in NCANDS, or unfounded, unsubstantiated in NCANDS, for each maltreatment allegation. Reports placed in the family assessment track receive a family assessment; no determination is made as to whether or not maltreatment actually occurred. Virginia reports these family assessment cases to NCANDS as alternative response nonvictim.
A large number of family assessment cases were not reported to NCANDS because of unknown maltreatment type. An edit was applied in the case management system during federal fiscal year (FFY) 2014 to address the issue resulting in fewer errors.
The response time is determined by the priority assigned to the valid report based on the infor-mation collected at intake. It is measured from the date of the report. The department continues to seek improvements to the automated data system and to provide technical assistance to local departments of social services to improve documentation of the initial response to the investi-gation or family assessment.
ChildrenVirginia reports family assessment cases as alternative response nonvictim.
Child Maltreatment 2017 Appendix d: State Commentary 238
WashingtonContact Lisa Barber Phone 360–902–8031
Title Data and Reporting Email [email protected]
Address Washington Department of Social and Health Services1115 Washington Street SE PO Box 45710 Olympia, WA 98504
GeneralA Structured Decision-Making intake screening tool (SDM) was implemented in late 2013, which supported the development of a two-pathway response when there were allegations of child abuse and neglect (CA/N) and clear definitions for CPS risk-only intakes.
CPS risk-only intakes involve a child whose circumstances places him or her at imminent risk of serious harm without any specific allegations of abuse or neglect. When CPS risk-only intakes are screened in, the children must be seen by a CPS investigator within 24 hours, and a complete investigation is required. If child abuse or neglect is found during the response to a CPS risk-only intake, a new CPS intake is created regarding the allegation, the case worker records the findings, and the record is included in the NCANDS Child File. CPS risk-only intakes are not currently submitted to NCANDS because there is not a substantiation of maltreatment. It should be noted that since CPS risk-only intakes do receive a full investiga-tion, it has been requested that they be included in the future reporting to provide an accurate reflection of the number of CPS cases being investigated and assessed. Adding CPS risk-only intakes would have increased the total number of reports by 5,473. CPS risk-only intakes were not included in the federal fiscal year (FFY) 2017 report.
During 2012, Washington’s Children’s Administration (CA) actively prepared for the start of a new CPS differential response pathway called family assessment response (FAR) as the demonstration project for Washington’s IVE Waiver. This preparation included eliminating the alternative response (10-day response intakes) and developing a two-pathway response for CPS intakes: investigation which requires a 24- or 72-hour response time, and FAR, requiring a 72-hour response. Intakes screened to FAR predominately contain allegations for physical abuse and neglect that are considered low risk, not requiring an immediate response. The SDM provides consistency in screening, and it guides intakes with neglect allegations considered low risk to the FAR pathway. Intakes involving cases that have had three or more screened in CPS intakes within the last 12 months or allegations of moderate to severe physical abuse and all sexual abuse allegations are screened to the investigation pathway. Intakes with any allegations of physical abuse for children under age four with a dependency within the last 12 months or an active dependency are screened to investigation. This two-pathway response began in January 2014 in three offices and has been phased-in across the state as of June 2017. Up until FFYs 2013–2014, alternative response (10-day response) was assigned to intakes containing low-risk allegations. Services were offered to families with children through community-based contracted providers.
ReportsTo be screened-in for CPS intervention, intakes must meet sufficiency. Washington’s suf-ficiency screening consists of three criteria:
■ Allegations must meet the Washington Administrative Code (WAC) for child abuse and neglect.
Child Maltreatment 2017 Appendix d: State Commentary 239
■ The alleged victim of child abuse and neglect must be younger than 18 years. ■ The alleged subject of child abuse or neglect has a role of parent, acting in loco parentis, or
unknown.Intakes that do not meet one of the above criteria do not screen in for a CPS response, unless there is imminent risk of harm (CPS risk-only) to the child. Intakes that allege a crime has been committed but do not meet Washington’s screening criteria are referred to the law enforcement jurisdiction where the alleged crime occurred. CPS risk only intakes receive an Investigation with a 24 or 72-hour response.
Intakes screened to the FAR pathway do not receive a CPS finding. Additionally, FAR intakes are mapped as alternative response nonvictim in NCANDS and don’t receive findings on allegations, so the maltreatment types are currently mapped to the NCANDS category of “other” maltreatment type. In FFY 2015, there was a significant increase in intakes screened to the FAR pathway from FFY 2014, thus eliminating a large pool of victims receiving a finding. The increase in the number of intakes screened to the FAR pathway in FFY 2015 is a result of the staggered implementation of the FAR pathway across the state. In FFY 2016, there was a similar increase in intakes screened to the FAR pathway from FFY 2015 as a result of addi-tional offices implementing FAR and due to additional training and consultation on the SDM intake screening tool and FAR pathway. Prior to full implementation of FAR, offices that had not launched screened intakes to FAR through the use of the SDM intake tool but then diverted those intakes back to an investigation pathway, which was allowed under Washington state statute. Since the full implementation of FAR statewide, the number of intakes screened to the FAR pathway have continued to increase which resulted in a reduction of cases that involved a victim and subject.
During FFYs 2014–2016 there was a significant increase noted for 24-hour emergent intakes, both with allegations of CA/N and CPS risk only. Also, during FFYs 2014–2015, there was an enhanced focus on child safety related to children age 0–3. A new intake policy was implemented requiring that screened-in physical abuse intakes regarding children 0–3 would be investigated, and children would be seen within 24 hours. In FFY 2017, there was again an increase in CPS Risk Only and 24-hour emergent intakes.
The Department of Licensed Resources (DLR), CPS, and DLR-CPS risk-only intakes alleg-ing, abuse or neglect of 18–21 year olds in facilities licensed or certified to care for children require a complete investigation. If, during the course of the investigation, it is determined that a child younger than 18 was also allegedly abused by the same perpetrator, the investigation would then meet the criteria for a CPS investigation rather than a CPS risk-only investigation. A victim and findings will be recorded, and the record will be included in the NCANDS Child File. For intakes containing child abuse and neglect allegations, response times are determined based on the sufficiency screen and intake screening tool. Response times of 24 hours or 72 hours are determined based on the imminent risk assessed by the intake worker.
ChildrenAn alleged victim is reported as substantiated if any of the alleged child abuse or neglect was founded. The alleged victim is reported as unsubstantiated if all alleged child abuse or neglect identified was unfounded. The NCANDS category of “other” disposition previously included
Washington (continued)
Child Maltreatment 2017 Appendix d: State Commentary 240
the number of children in inconclusive investigations. Legislative changes resulted in inconclu-sive no longer being a findings category. The NCANDS category of neglect includes medical neglect.
An analysis of common risk factors found that Washington state families involved in CPS since 2009 have shown an increase in negative outcomes over time. The risk factors are parent criminality, parent mental illness, parent substance abuse, family economic stress, domestic violence, and family homelessness. In addition to the increase in negative outcomes, the fami-lies have more risk factors per individual family than in previous years. Negative outcomes are recurrence, 90-day placement rate, founded rate and families with a new founded or child(ren) placed within 365 days of investigation completion. This may assist in explaining the increased number of CPS intakes overall and a substantial increase in the number of 24-hour response times for CPS investigations.
Fatalities The state includes child fatalities that were determined to be the result of abuse or neglect by a medical examiner or coroner or if there was a CPS finding of abuse or neglect. The state previously counted only those child fatalities where the medical examiner or coroner ruled the manner of death was a homicide. Washington only reports fatalities in the Agency File.
PerpetratorsThe perpetrator relationship value of residential facility provider/staff is mapped to the NCANDS value of group home or residential facility staff based on whether or not the child was in an open placement. When residential facility provider/staff is selected and the child is in foster care, then it is mapped to group home or residential facility staff. If the child was abused by residential facility provider/staff and the child was not in an open placement, the perpetra-tor relationship is mapped to the NCANDS category of “other” perpetrator relationship. The NCANDS category of “other” perpetrator relationship includes the state categories of other and babysitter.
The parental type relationship is a combined parent birth/adoptive value. Because the NCANDS field separates biological and adoptive parent and Washington’s system does not distinguish between the two, parent birth/adoptive is mapped to the NCANDS category of unknown parent relationship.
ServicesFamilies receive prevention and remedial services from the following sources: community-based services such as Public Health Nurses, Infant Mental Health, Head Start and the Parent-Child Assistance Program, contracted services, including several evidence-based practices such as Homebuilders, Incredible Years, Safe Care, Triple P, Parent-Child Interaction Therapy, and Promoting First Relationships. Families also can receive CPS childcare, family reconcili-ation services, family preservation, and intensive family preservation services. The number of recipients of the community-based family resource and support grant is obtained from Community-Based Child Abuse Prevention (CBCAP).
Washington (continued)
Child Maltreatment 2017 Appendix d: State Commentary 241
West VirginiaContact Stephanie Lindley Phone 304–558–5864
Title Functional Manager Email [email protected]
Address West Virginia Department of Health and Human ResourcesOne Davis Square, Suite 200Charleston, WV 25301–1785
GeneralWest Virginia does not have a differential response program.
ReportsThe increase in the number of hours for responding to the initial assessment during the cur-rent reporting period in comparison to last year was influenced by multiple contributing fac-tors. These factors include an increase in the number of reports alleging abuse and neglect, staffing issues including turnover, backlogged assessments, difficulty locating the family, documentation entered into the system late, as well as both data entry and system errors.
Fatalities The Agency File only includes data from child welfare through the Families and Children Tracking System (FACTS). The Child Fatality Team operated through Public Health by the Medical Examiner’s office no longer provides the Bureau with this data to report. However, the medical examiner’s office is a mandated reporter and reports all cases to Bureau for Children and Families (BCF) that they feel are due to abuse and/or neglect.
Not all child or infant deaths are investigated by BCF and included in the FACTS data. BCF only investigates child deaths if there is reason to believe the death is a result of abuse and/or neglect. The Child Fatality Team operated by Public Heath through the Medical Examiner’s Office reviews all child deaths. Investigations of child deaths are completed by local law enforcement.
West Virginia has a child death review team called the Child Fatality Review Team. This team is operated under the Bureau for Public Health through the Medical Examiner’s Office. BCF has an internal review team that reviews cases that are known to the agency for quality assurance purposes.
Services The Community Based Child Abuse Prevention (CBCAP) grant was transitioned from the Division of Children and Families to the Division of Early Care and Education, which identi-fied several areas for improvements in oversight and administration resulting in a higher number of children served this reporting period in 2016. This increased oversight has had similar results for 2017. Grantees are asked to provide an unduplicated count of recipients at the end of the fourth quarter of the state fiscal year.
Appendix d: State Commentary 242Child Maltreatment 2017
WisconsinContact Fredi-Ellen Bove Phone 608–422–6891
Title Administrator: Division of Safety and Permanence Email [email protected]
Address Wisconsin Department of Children and Families201 East Washington Avenue, Rm. E200PO Box 8916Madison, WI 53708–8916
GeneralThere were no significant state policy changes that affect the data submission. However, some revisions to the Statewide Automated Child Welfare Information System (SACWIS) were made to prevent some errors from occurring in the future.
ReportsThe state data are child-based where each report is associated with a single child. The report date refers to the date when the agency was notified of the alleged maltreatment and the investigation start date refers to the date when the agency made initial contact with the child or other family member. In Wisconsin’s child protective services (CPS) system, several maltreatment reports for a single child may be assessed in a single investigation.
There are a variety of reasons why a report might be screened out. In most cases screened-out reports are those reports where the information provided does not constitute maltreat-ment of a child or risk of maltreatment of a child. Additionally, when multiple reports are made about the same maltreatment, the subsequent reports may be screened out. With the exception of cases of alleged sex trafficking, Child Protective Services (CPS) agencies in Wisconsin are currently not required to investigate instances of abuse by noncaregivers, so those reports may be screened out. In rare instances cases may be screened out because there is not enough identifiable information to do an assessment. Finally, cases may be screened out because jurisdiction more properly rests with another state.
Certain counties in Wisconsin have implemented alternative response (AR). Maltreatment disposition for AR assessments result in identifying whether services are needed and will appear in NCANDS as alternative response nonvictim dispositions.
ChildrenA child is considered to be a victim when an allegation is substantiated. The NCANDS unsubstantiated maltreatment disposition includes instances where the allegation was unsub-stantiated for that child, or when critical sources of information cannot be found or accessed to determine whether or not maltreatment as alleged did occurred. Wisconsin continues to use the unborn child abuse allegation type for allegations of substance abuse while a child is in utero. As of mid-2015, Wisconsin only assigns services needed or services not needed findings to these allegations.
FatalitiesThe count of fatalities includes only those children who were subjects of reports of abuse or neglect in which the maltreatment allegation was substantiated. No agency other than Wisconsin Department of Children and Families is involved in compiling child maltreatment fatality information. All fatalities except two are reported in the Child File. This is due to
Appendix d: State Commentary 243Child Maltreatment 2017
the Child File not accepting the reporting structure of these two children; therefore, they are reported in the Agency File.
Perpetrators Perpetrators and perpetrator detail is included for allegations where the child was substanti-ated. The NCANDS category “other” perpetrator relationship includes perpetrators who are not primary or secondary caregivers to the child (i.e., noncaregivers) such as another child or peer to the child victim or a stranger. As described above, there are no substantiations in AR cases, so the alleged perpetrators in AR cases will not show up as substantiated perpetrators. Services, if needed, are established through an assessment determination, not a determina-tion about a specific perpetrator.
Services The state continues to support data quality related to service documentation and ultimately to modify the NCANDS file to incorporate services reporting for future data submissions.
Wisconsin (continued)
Appendix d: State Commentary 244Child Maltreatment 2017
WyomingContact Brian DeTavernier Phone 307–777–6348
Title Special Investigation Analyst Email [email protected]
Address Wyoming Department of Family Services2300 Capital Avenue, Hathaway Building, 3rd FloorCheyenne, WY 82002
General The DFS organizational structure includes four (4) Divisions under the Director’s office: Economic Security Division, Social Services Division, Support Services Division, and Financial Services Division. Under the Social Services Division, social services is estab-lished to administer and supervise all child welfare, juvenile probation, and adult protection services, with the functions of policy development, training, strategic planning, and continu-ing quality improvement centralized at the state level. Policy and practice standards are uniform across the state, and the state utilizes a centralized State Automated Child Welfare Information System (SACWIS) known as Wyoming Children’s Assistance and Protection System (WYCAPS) for the purposes of case management and documentation.
The state is comprised of 23 counties and the Wind River Reservation. Through contract, DFS provides technical assistance and funding for the two Tribal programs which administer their own programs. At least one Department of Family Services (DFS) county field office is located in each county. DFS divides Wyoming into nine social service districts to coincide with the nine judicial districts. The Services Division Administrator oversees eight District Managers. These District Managers are in turn responsible for the direct supervision of staff with their district.
Although the Social Services Division programs are state administered, the services and case management functions are managed and provided at the county field office level. Services for children and families are provided directly through DFS or can be purchased on behalf of eligible clients under the supervision of the state office. These services are administered through county field offices or through the Wyoming Boys School and Wyoming Girls School. DFS does not contract for any primary casework functions and is responsible for conducting and managing intakes, assessments, investigations, and ongoing family based and foster care services.
An investigation is assigned when a referral meets the definition of abuse and/or neglect and meets the following criteria: Criminal charges could be filed, child(ren)/youth appear to be in imminent danger (includes threatened harm and means a statement, overt act, condition or status which represents an immediate and substantial risk of sexual abuse or physical or mental injury even when there are no signs of injury), the child(ren)/youth will likely need to be removed from his/her home, a child/youth fatality, major injury and/or sexual abuse.
Abuse is defined as inflicting or causing physical or mental injury, harm or imminent danger to the physical or mental health or welfare of a child(ren)/youth other than by accidental means, including abandonment, excessive or unreasonable corporal punishment, malnutrition or substantial risk thereof by reason of intentional or unintentional neglect, and the commis-sion or allowing the commission of a sexual offense against a child(ren)/youth.
Appendix d: State Commentary 245Child Maltreatment 2017
Wyoming has three types of responses to referrals. There is an investigation track, assess-ment track, and a prevention track. The investigation track is implemented if the referral alleges abuse and/or neglect and includes any of the following criteria that includes incidents where criminal charges could be filed, if the child(ren)/youth appear to be in imminent danger, or the child(ren)/youth are in immediate and substantial risk of sexual abuse, physical or mental injury even when there are no signs of injury; the child(ren)/youth will need to be removed from his/her home; a child(ren)/youth fatality; a major injury; and/or sexual abuse. A secondary response is the assessment track that gets assigned if the referral alleges abuse and/or neglect but does not meet the criteria for the investigation track. The final response is the prevention track for which there are no allegations of abuse and/or neglect, but there are identified risk factors that indicate the need for services to prevent abuse and/or neglect.
ReportsWyoming is unable to determine the cause for an increase in the number of referrals for abuse/neglect as the SACWIS is an incident-based program.
ChildrenThe state of Wyoming is unable to determine whether there was an increase or decrease in the number of victims as the SACWIS does not collect specific information regarding the victims.
Neglect is defined as a failure or refusal by those responsible for the child(ren)/youth’s welfare to provide adequate care, food, clothing, safe shelter, maintenance, supervision, edu-cation or medical, surgical or any other care necessary for the child(ren)/youth’s wellbeing. Treatment given in good faith by spiritual means alone, through prayer, by a duly accredited practitioner in accordance with the tenets and practices of a recognized church or religious denomination is not child neglect for that reason alone.
Perpetrators Wyoming is unable to determine whether there was an increase or decrease in the number of perpetrators as the SACWIS does not collect specific information regarding incidents.
Services Wyoming utilizes a SACWIS that is incident based and does not have the ability to catego-rize incidents to see trends.
Wyoming (continued)
Appendix d: State Commentary 246Child Maltreatment 2017
Related Documents