Child-friendly urban structures: Bullerby revisited Anna Broberg a, * , Marketta Kyttä a,1 , Nora Fagerholm b, 2 a Department of Surveying and Planning, Aalto University, P.O. Box 12200, 00076 Aalto, Finland b Section of Geography, Department of Geography and Geology, University of Turku, 20014 Turku, Finland article info Article history: Available online 20 June 2013 Keywords: Child friendliness Built environment Affordance Independent mobility GIS abstract Definitions of environmental child friendliness offer broad criteria that are not easy to study or assess. We suggest that due to this broadness, these definitions have produced surprisingly few attempts to evaluate how child-friendly various types of physical environments are. The purpose of this study is to analyse how the structure of the built environment contributes to environmental child friendliness. We define child friendliness by two central criteria: children’s possibilities for independent mobility and their opportunities to actualize environmental affordances. We study how built environment qualities condition environmental child friendliness in place-based ways by asking children and youth in Turku, Finland, to tell about their meaningful places and their mobility to these. The data consists of over 12,000 affordances, localized by the respondents. This experiential and behavioural place-based knowledge is combined with objectively measured data on residential and building density, and quantity of green structures. Moderate urban density seems to have child-friendly characteristics such as an ability to promote independent access to meaningful places and the diversity of affordances. We find that affordances situated on residential areas are likely to be reached alone, whereas access to affordances situated in densely built urban cores is less independent. The proportion of green structures is not associated with independent access. The diversity of affordances is highest in areas that are densely populated and not very green. Green areas are important settings for doing things, and green structures around emotional affordances increase the likelihood of liking the place significantly. Combining children’s place-based experiences with information derived from objective measurable qualities of the physical environment provides a valuable methodological contribution to studies on environmental child friendliness, and the two proposed criteria of child friendliness are supported by this study. There is no one environment that is child-friendly, but different environments have different uses and meanings. Ó 2013 Elsevier Ltd. All rights reserved. 1. Introduction The research literature offers an abundance of definitions con- cerning environmental child friendliness, where the criteria for child friendliness are often relatively broad and not easy to study and assess (see Chatterjee, 2005; Horelli, 2007; Schulze & Moneti, 2007). These different definitions of environmental child friendli- ness have produced surprisingly few attempts to evaluate the child friendliness of various types of physical environments or to study the structural variables of the urban fabric that contribute to this matter. We argue that it may e at least partly e be due to the abstractness, broadness and vagueness of these definitions. To deepen the understanding of urban characteristics promot- ing environmental child friendliness, a more focused and oper- ationalizable definition of environmental child friendliness is needed. The Bullerby model by Kyttä (2008) is one candidate for such an approach. According to this assessment model, environ- mental child friendliness can be defined by two central criteria: children’s possibilities for independent mobility and their oppor- tunities to actualize diverse environmental affordances. The Bullerby model is a theoretical tool for assessing the child friendliness of various settings. In this article, we propose an approach where the model is used to study how specific, built environment qualities condition environmental child friendliness in place-based ways. Our target in this paper is to combine both children’s experiential and behavioural place-based knowledge * Corresponding author. Tel.: þ358 505124554; fax: þ358 947024071. E-mail addresses: anna.broberg@aalto.fi (A. Broberg), marketta.kytta@aalto.fi (M. Kyttä), ncfage@utu.fi (N. Fagerholm). 1 Tel.: þ358 505124554; fax: þ358 947024071. 2 Tel.: þ358 2 333 5596; fax: þ358 2 333 5896. Contents lists available at SciVerse ScienceDirect Journal of Environmental Psychology journal homepage: www.elsevier.com/locate/jep 0272-4944/$ e see front matter Ó 2013 Elsevier Ltd. All rights reserved. http://dx.doi.org/10.1016/j.jenvp.2013.06.001 Journal of Environmental Psychology 35 (2013) 110e120

Welcome message from author
This document is posted to help you gain knowledge. Please leave a comment to let me know what you think about it! Share it to your friends and learn new things together.
Transcript

at SciVerse ScienceDirect
Journal of Environmental Psychology 35 (2013) 110e120
Contents lists available
Journal of Environmental Psychology
journal homepage: www.elsevier .com/locate/ jep
Child-friendly urban structures: Bullerby revisited
Anna Broberg a,*, Marketta Kyttä a,1, Nora Fagerholm b,2
aDepartment of Surveying and Planning, Aalto University, P.O. Box 12200, 00076 Aalto, Finlandb Section of Geography, Department of Geography and Geology, University of Turku, 20014 Turku, Finland
a r t i c l e i n f o
Article history:Available online 20 June 2013
Keywords:Child friendlinessBuilt environmentAffordanceIndependent mobilityGIS
* Corresponding author. Tel.: þ358 505124554; faxE-mail addresses: [email protected] (A. Brob
(M. Kyttä), [email protected] (N. Fagerholm).1 Tel.: þ358 505124554; fax: þ358 947024071.2 Tel.: þ358 2 333 5596; fax: þ358 2 333 5896.
0272-4944/$ e see front matter � 2013 Elsevier Ltd.http://dx.doi.org/10.1016/j.jenvp.2013.06.001
a b s t r a c t
Definitions of environmental child friendliness offer broad criteria that are not easy to study or assess.We suggest that due to this broadness, these definitions have produced surprisingly few attempts toevaluate how child-friendly various types of physical environments are. The purpose of this study is toanalyse how the structure of the built environment contributes to environmental child friendliness. Wedefine child friendliness by two central criteria: children’s possibilities for independent mobility andtheir opportunities to actualize environmental affordances.
We study how built environment qualities condition environmental child friendliness in place-basedways by asking children and youth in Turku, Finland, to tell about their meaningful places and theirmobility to these. The data consists of over 12,000 affordances, localized by the respondents. Thisexperiential and behavioural place-based knowledge is combined with objectively measured data onresidential and building density, and quantity of green structures.
Moderate urban density seems to have child-friendly characteristics such as an ability to promoteindependent access to meaningful places and the diversity of affordances. We find that affordancessituated on residential areas are likely to be reached alone, whereas access to affordances situated indensely built urban cores is less independent. The proportion of green structures is not associated withindependent access. The diversity of affordances is highest in areas that are densely populated and notvery green. Green areas are important settings for doing things, and green structures around emotionalaffordances increase the likelihood of liking the place significantly.
Combining children’s place-based experiences with information derived from objective measurablequalities of the physical environment provides a valuable methodological contribution to studies onenvironmental child friendliness, and the two proposed criteria of child friendliness are supported bythis study. There is no one environment that is child-friendly, but different environments have differentuses and meanings.
� 2013 Elsevier Ltd. All rights reserved.
1. Introduction
The research literature offers an abundance of definitions con-cerning environmental child friendliness, where the criteria forchild friendliness are often relatively broad and not easy to studyand assess (see Chatterjee, 2005; Horelli, 2007; Schulze & Moneti,2007). These different definitions of environmental child friendli-ness have produced surprisingly few attempts to evaluate the childfriendliness of various types of physical environments or to studythe structural variables of the urban fabric that contribute to this
: þ358 947024071.erg), [email protected]
All rights reserved.
matter. We argue that it may e at least partly e be due to theabstractness, broadness and vagueness of these definitions.
To deepen the understanding of urban characteristics promot-ing environmental child friendliness, a more focused and oper-ationalizable definition of environmental child friendliness isneeded. The Bullerby model by Kyttä (2008) is one candidate forsuch an approach. According to this assessment model, environ-mental child friendliness can be defined by two central criteria:children’s possibilities for independent mobility and their oppor-tunities to actualize diverse environmental affordances.
The Bullerby model is a theoretical tool for assessing the childfriendliness of various settings. In this article, we propose anapproach where the model is used to study how specific, builtenvironment qualities condition environmental child friendlinessin place-based ways. Our target in this paper is to combine bothchildren’s experiential and behavioural place-based knowledge

A. Broberg et al. / Journal of Environmental Psychology 35 (2013) 110e120 111
with objectively measurable, place-based characteristics of specificsettings.
1.1. Definitions of child-friendly environments
The research literature offers an abundance of definitions con-cerning environmental child friendliness. Themes like safety, avail-able green space, variety of activity settings, independent mobilitypossibilities, active socialization or “neighbourliness”, and integra-tion of children into decision-making processes are often includedas essential criteria of environmental child friendliness (Freeman &Tranter, 2011; Haider, 2007; McAllister, 2009). These kinds of broad,extensive criteria are also the basis of the work of the internationalnetwork of Child Friendly Cities promoted by UNICEF. The ChildFriendly City Initiative (CFCI) encourages local governments to makedecisions that are in the best interests of children and promotechildren’s rights to a healthy, caring, protective, educative, stimu-lating, non-discriminatory, inclusive and culturally rich environ-ment (Malone, 2001; Riggio, 2002; Schulze & Moneti, 2007).
An example of a more systematic definition of environmentalchild friendliness embedded in both substantive and proceduraltheories of a good environment is produced by Horelli (2007). Theresulting definition includes 10 normative dimensions: (1) Housingand dwelling, (2) Basic services, (3) Participation, (4) Safety andsecurity, (5) Family, peers and community, (6) Urban and envi-ronmental qualities, (7) Provision and distribution of resources andpoverty reduction, (8) Ecology, (9) Sense of belonging and conti-nuity, and (10) Good governance. When children in differentcountries were questioned about their thoughts on the dimensionsin the definition of environmental child friendliness by Horelli(2007), only a few of these themes were brought up by the chil-dren themselves. Safety and security, urban and environmentalqualities, and basic services were among the sets of criteria relevantto children in Finland (Haikkola, Pacilli, Horelli, & Prezza, 2007) andin Sweden (Nordström, 2010). When queried about these samedimensions, Italian children mentioned urban and environmentalqualities and basic services in accordance with the Finnish andSwedish children, but they did not mention environmental safety(Haikkola et al., 2007). These findings resonate interestingly withthe earlier results of the Growing Up In Cities project (Chawla, 2002),where the provision of basic services, the variety of activity set-tings, and the freedom from physical dangers were also among thefactors that children from six continents and eight different coun-tries indicated as primary indicators for a child-friendly environ-ment. In addition to these three themes, green areas, freedom ofmovement, and peer gathering places were also important positivephysical qualities of a child-friendly environment.
Chatterjee (2005, 2006) also finds the definitions of childfriendliness to be too broad and suggests that a child-friendly citycan only be studied as a disaggregation, made up of a number ofchild-friendly places that children have a friendly relationshipwith.She proposes a new theoretical concept of place-friendship that shebases on a review of the literature on childhood friendship. Basedon the six dimensions of place-friendship, Chatterjee offers aworking definition of child-friendly places in a child’s everydayenvironment, where these places:
1. provide opportunities for children to develop an attitude ofcare for places that children love and respect;
2. promote a meaningful exchange between child and placethrough affordance actualization in places;
3. offer opportunities for environmental learning and developingenvironmental competence through direct experience in places;
4. allow children to create and control territories and protectthese territories from harm;
5. provide privacy experiences and nurture childhood secrets;and
6. allow children to express themselves freely in place.
While we find Chatterjee’s conceptualization interesting, it stillseems to be relatively difficult to operationalize. In her dissertation,Chatterjee (2006) questioned children in New Delhi about theirimportant places. Based on the data acquired from children, sheconcludes that rather than having three separate dimensions con-cerning activities of children in relatively constraint-free places,dimensions number four and six (‘creating and controlling terri-tories’ and ‘freedom of expression in place’) could be includedunder the higher level construct of ‘meaningful exchange withplaces’, which introduces children to the affordances outdoors. Shethus proposes limiting the dimensions to four. Similarly, in theirrecent study on Iranian children, Ramezani & Said (2012) inter-viewed children about their important places using the place-friendship framework and investigated whether the dimensionscan be reduced in number based on the data obtained on children’srelations to different places. Their finding was that the six di-mensions of place friendship could be reduced to the followingthree: meaningful exchange with place, learning and gainingcompetence through place experience, and having a secret place.Meaningful exchange with place was seen as in parallel with theactualization of affordances in place (Ramezani & Said, 2012) andalso represented the dimensions concerning the freedom ofexpression, care and respect for the place, and creating territories.What we find interesting in these two projects using Chatterjee’sdefinition of child-friendly places is that the actualization of variousaffordances seems to be central criteria for children’s friendlyrelationship with a place when defined by children themselves.
Another critical view towards the abstractness of definitions ofchild-friendliness has been aired by Whitzman, Worthington, andMizrachi (2010). They analysed how different Child-Friendly City(CFC) initiatives in Australia have supported physical and socialtransformations towards the institutionalization of children’s rightto the city. They see children’s independent mobility (in otherwords, children’s possibility to autonomously explore the publicspace) as children’s right to the city. In seven governments, theyreviewed plans on a general level and on lower level policies thatdeal with young people. They revised these plans and policies inregard to six elements: whether the plan (1) recognized children asan interest group; (2) recognized children’s right to all public space,not only those designed for children; (3) provided achievable tar-gets, strategies and implementation mechanisms; (4) was inte-grated into health and land-use planning; (5) included training foradministrators in child rights; and (6) had planners trained ininteracting with children. Interestingly, their policy scan showedthe narrow extent to which land-use planning policies were inte-grated with CFC initiatives. The language or concepts of CFC werenot in use in the high-level plans governing land use and devel-opment. Children were not mentioned as a specific group, butrather in many implicit examples, they were assumed to belong inspecific places designed for children. Whitzman et al. (2010)concluded that even if Child-Friendly Cities are a promising prac-tice in its focus on the children’s right to independently roam thepublic space, there are still difficulties in moving from the socialand health planning perspective that has informed these initiativestowards impacts on land-use planning policies and practices.
1.2. Bringing the physical environment into the discussion
There are a few studies that evaluate environmental childfriendliness empirically, either on the neighbourhood, communityor city level. Among them are comparative studies by Kyttä (2002,

Fig. 1. The Bullerby model for describing four hypothetical types and levels of child-friendly environments (Kyttä, 2008).
A. Broberg et al. / Journal of Environmental Psychology 35 (2013) 110e120112
2004) in Finland and Belarus, and work analysing the degree ofindependent mobility of children in various settings (Fyhri &Hjorthol, 2009; Fyhri, Hjorthol, Mackett, Fotel, & Kyttä, 2011;Hillman, Adams, & Whitelegg, 1990; Tranter & Pawson, 2001). In-terviews with families living in the city centre of Auckland, NewZealand, revealed that the central location was seen as convenientand less dependent on cars, while play spaces were insufficient,apartments were not designed for family use, and fears for chil-dren’s safety were prominent (Carroll, Witten, & Kearns, 2011).These neighbourhood- or city-level studies do not offer a detailedenough analysis of the physical characteristics contributing to achild-friendly environment.
More information should be gathered on the environment’sfeatures that motivate everyday activity that are defined by chil-dren themselves. This kind of information has so far been mostlyfrom small, qualitative studies (Veitch, Salmon, & Ball, 2007).Among the few previous studies simultaneously studying chil-dren’s own perceptions of their neighbourhood and the actualpotential for activity in specific physical settings is Wridt’s (2010)research utilizing a qualitative GIS approach. She found signifi-cant gender differences in patterns of use of the physical environ-ment among U.S. children, and interesting differences between theperceived places of danger and actual reported crime. Thisintriguing study was, however, a small-scale project in one neigh-bourhood with a very limited number of participants.
This is not to say that only perceived information provided bychildren themselves is valid when the child friendliness of differentenvironments is studied. In fact, an interesting study from London,Ontario, examined whether publicly provided recreational oppor-tunities for children and youth are distributed unequally in thespatial continuum (Gilliland, Holmes, Irwin, & Tucker, 2006). Thisstudy looked at the spatial distribution of possibilities for recrea-tion in relation to neighbourhood characteristics solely fromregister-based data. In contrast, the structural qualities of theenvironment are often approached solely from a subjectiveperspective. For example, in a UK study, children told about theirperceptions of different elements of their physical environment inconnection with their independent mobility and participation inplay (Page, Cooper, Griew, & Jago, 2010). Studies of environmentalchild friendliness that would look at more objectively measuredcharacteristics of the physical environment are still rare, andstudies that would combine children’s subjective experiences withobjective characteristics are almost non-existent. This is a gap thecurrent study hopes to fill.
In contrast to the few empirical studies concerning environ-mental child friendliness as a whole, research about the mobility-promoting qualities of the urban structure has yielded a largeempirical base on connections between an active, healthy lifestylefor children and characteristics of the physical environment. (For arecent review, see van Loon & Frank, 2011.) Residential density, theproportion of green structure, a traffic environment that favourspedestrian and light traffic, as well as accessibility to recreationareas and versatile services are among the structural features of acommunity that seem to support children’s active lifestyle andindependent mobility (Carver, Timperio, & Crawford, 2008; DeVries, Bakker, Van Mechelen, & Hopman-Rock, 2007; Frank, Kerr,Chapman, & Sallis, 2007).
On a more detailed level, features that promote traffic on foot orby bike include sidewalks and bikeways, traffic light-controlledjunctions, cul-de-sacs and well-functioning public transportation.Children’s free and active movement is impeded by heavy traffic,difficult junctions and a long distance to school (Bringolf-Isler et al.,2008). In addition to structural features of the community, severalsocial, cultural and experiential features have been recognized thatare related to children’s activity possibilities in different kinds of
communities. For example, a large number of children and a strongsense of community in the neighbourhood promote children’sactive mobility (Carver et al., 2005; Timperio et al., 2006).
Also in these studies concerning the mobility-promoting qual-ities of the urban structure, the analysis of the environment’s fea-tures has often been based on subjective observations made byexperts or children’s parents, whereaswe suggest that the objectivefeatures of the physical environment should rather be analysed byusing Geographic Information Systems (GIS). We agree withMcMillan (2005) andWoolcock, Gleeson, and Randolph (2010) thatquestions concerning children’s active lifestyle and urban formcannot be fully answered without a more thorough analysis ofmicro-scale data on urban form and the social and ecologicalvariation that occur throughout cities. Nevertheless, more detailedinformation is also needed on individual and household lifestylesand place-based environmental experiences and perceptions.There is also little debate about the relationship between morebroad definitions of child-friendly environments and more focusedaspects of the environment that motivate children to create aninspired and individual relationship to their surroundings. The nextchapter offers one possible approach to this problem.
1.3. Environmental child friendliness in the light of the Bullerbymodel
To deepen an understanding of characteristics of the urbanstructure that promote environmental child friendliness, a morefocused and operational definition of environmental child friend-liness is needed. The Bullerby model by Kyttä (2008) is onecandidate for such an approach. According to the assessmentmodelby Kyttä (2008), environmental child friendliness can be defined bytwo central criteria: children’s possibilities for independentmobility and their opportunities to actualize environmental affor-dances. According to Moore (1986), “Access to and diversity [ofresources] emerge as the most important themes in child-environment policy” (p 234).
The Bullerby model is built on the idea that the covariation ofindependent mobility and the actualization of environmentalaffordances (Gibson, 1986; Heft, 2001) define four qualitativelydifferent types of children’s environments (see Fig. 1). A child-
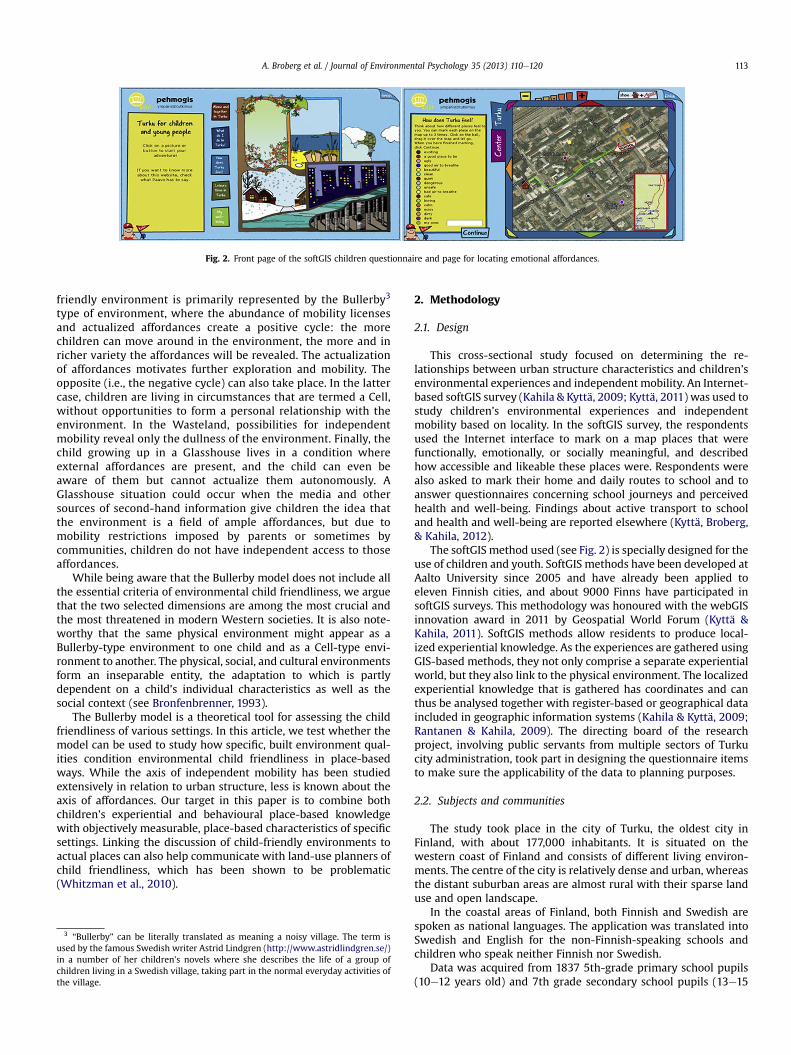
Fig. 2. Front page of the softGIS children questionnaire and page for locating emotional affordances.
A. Broberg et al. / Journal of Environmental Psychology 35 (2013) 110e120 113
friendly environment is primarily represented by the Bullerby3
type of environment, where the abundance of mobility licensesand actualized affordances create a positive cycle: the morechildren can move around in the environment, the more and inricher variety the affordances will be revealed. The actualizationof affordances motivates further exploration and mobility. Theopposite (i.e., the negative cycle) can also take place. In the lattercase, children are living in circumstances that are termed a Cell,without opportunities to form a personal relationship with theenvironment. In the Wasteland, possibilities for independentmobility reveal only the dullness of the environment. Finally, thechild growing up in a Glasshouse lives in a condition whereexternal affordances are present, and the child can even beaware of them but cannot actualize them autonomously. AGlasshouse situation could occur when the media and othersources of second-hand information give children the idea thatthe environment is a field of ample affordances, but due tomobility restrictions imposed by parents or sometimes bycommunities, children do not have independent access to thoseaffordances.
While being aware that the Bullerby model does not include allthe essential criteria of environmental child friendliness, we arguethat the two selected dimensions are among the most crucial andthe most threatened in modern Western societies. It is also note-worthy that the same physical environment might appear as aBullerby-type environment to one child and as a Cell-type envi-ronment to another. The physical, social, and cultural environmentsform an inseparable entity, the adaptation to which is partlydependent on a child’s individual characteristics as well as thesocial context (see Bronfenbrenner, 1993).
The Bullerby model is a theoretical tool for assessing the childfriendliness of various settings. In this article, we test whether themodel can be used to study how specific, built environment qual-ities condition environmental child friendliness in place-basedways. While the axis of independent mobility has been studiedextensively in relation to urban structure, less is known about theaxis of affordances. Our target in this paper is to combine bothchildren’s experiential and behavioural place-based knowledgewith objectively measurable, place-based characteristics of specificsettings. Linking the discussion of child-friendly environments toactual places can also help communicate with land-use planners ofchild friendliness, which has been shown to be problematic(Whitzman et al., 2010).
3 “Bullerby” can be literally translated as meaning a noisy village. The term isused by the famous Swedish writer Astrid Lindgren (http://www.astridlindgren.se/)in a number of her children’s novels where she describes the life of a group ofchildren living in a Swedish village, taking part in the normal everyday activities ofthe village.
2. Methodology
2.1. Design
This cross-sectional study focused on determining the re-lationships between urban structure characteristics and children’senvironmental experiences and independent mobility. An Internet-based softGIS survey (Kahila & Kyttä, 2009; Kyttä, 2011) was used tostudy children’s environmental experiences and independentmobility based on locality. In the softGIS survey, the respondentsused the Internet interface to mark on a map places that werefunctionally, emotionally, or socially meaningful, and describedhow accessible and likeable these places were. Respondents werealso asked to mark their home and daily routes to school and toanswer questionnaires concerning school journeys and perceivedhealth and well-being. Findings about active transport to schooland health and well-being are reported elsewhere (Kyttä, Broberg,& Kahila, 2012).
The softGIS method used (see Fig. 2) is specially designed for theuse of children and youth. SoftGIS methods have been developed atAalto University since 2005 and have already been applied toeleven Finnish cities, and about 9000 Finns have participated insoftGIS surveys. This methodology was honoured with the webGISinnovation award in 2011 by Geospatial World Forum (Kyttä &Kahila, 2011). SoftGIS methods allow residents to produce local-ized experiential knowledge. As the experiences are gathered usingGIS-based methods, they not only comprise a separate experientialworld, but they also link to the physical environment. The localizedexperiential knowledge that is gathered has coordinates and canthus be analysed together with register-based or geographical dataincluded in geographic information systems (Kahila & Kyttä, 2009;Rantanen & Kahila, 2009). The directing board of the researchproject, involving public servants from multiple sectors of Turkucity administration, took part in designing the questionnaire itemsto make sure the applicability of the data to planning purposes.
2.2. Subjects and communities
The study took place in the city of Turku, the oldest city inFinland, with about 177,000 inhabitants. It is situated on thewestern coast of Finland and consists of different living environ-ments. The centre of the city is relatively dense and urban, whereasthe distant suburban areas are almost rural with their sparse landuse and open landscape.
In the coastal areas of Finland, both Finnish and Swedish arespoken as national languages. The application was translated intoSwedish and English for the non-Finnish-speaking schools andchildren who speak neither Finnish nor Swedish.
Data was acquired from 1837 5th-grade primary school pupils(10e12 years old) and 7th grade secondary school pupils (13e15

Table 1Number of locations in the four affordance categories made by children in thesoftGIS application.
Category, affordance No. of locations
Alone and together in TurkuI meet my friends 1108I am in peace and quiet 651I can be myself 412Allowed place 317I spend time with animals 309I’m on my own 273I meet new people 211I am with grown-ups 200Nobody is watching me 193Forbidden place 158Scary people 87Place of bullying 78I am lonely 56Total 4053
What do I do in Turku?I ride my bicycle 414I play ball games 381I run 324Own category 321I go swimming 292I skate/ski 253I go on the swings 192I go sledding 127I hide 99I hang/dangle 95I climb 91I jump 79I ride a skateboard 72I play water games 70I dig holes in the ground 54I build things 49Total 2913
Leisure time in TurkuI’m at my computer 469I go shopping 301I do sports 300I just hang out 256I have hobbies 234I go to the library 179I have fun 140I go on adventures 133I go to the cinema 130I play 112I eat out 112I have nothing to do 97Own category 67I go to sports events 54I go to a concert 18I visit a museum 14I go to see a show 11Total 2627
How does Turku feel?Safe 323A good place to be 256Peaceful, calm 224Beautiful 208Good air to breathe 207Noisy 204Boring 199Dirty 188Clean 160Dangerous 125Bad air to breathe 120Ugly 106Rowdy, rough 97Quiet 88Exciting 86Own category 83Dark 76Total 2750
A. Broberg et al. / Journal of Environmental Psychology 35 (2013) 110e120114
years old). Respondents represent 54 schools from varyinggeographical locations in the city of Turku. A little over half of therespondents were boys, and 52% belonged to the younger agegroup. Of the children’s families, 37% lived in single-family houses,33% in apartment blocks, and 30% in semi-detached or terracedhouses. Most children answered to the Finnish version of thequestionnaire (92%), while 8% answered the questionnaire inSwedish and only 0.3% in English.
2.3. Sample and procedure
We conducted the study in two phases. In the first phase, allelementary and secondary schools of the city of Turku were invitedto participate in the study. During 4months, only about 1000 pupilshad participated from the total of about 14,000 school children inTurku. To gather more representative data, the data were collectedin an organizedmanner andwere restricted to two age groups: fifthgraders (10e12 years old) and seventh graders (13e15 years old).Between January and March 2008, two research assistants visited54 schools willing to participate in the study again. Six schoolsrefused to participate. These schools were mainly schools withspecial curricula (Steiner school, special schools).
Before organized data collection at schools, written consent wasobtained from children’s parents. The data collectionwas organizedin computer-equipped classrooms in the course of a normal schoollesson (45e60 min, depending on school policies) and was led by aresearch assistant e the teacher supervising the lesson. The chil-dren responded independently but could ask for assistance fromeither the research assistant or the teacher. The number of childrenresponding simultaneously varied between schools, depending onthe class sizes in different schools, but was generally around 20pupils. The quality of Internet connections varied among schools,and some schools faced technical problems.
A total of 3341 children participated during the second phase.After exclusion from the database of children not in the chosen agegroups and responses received outside school hours (possiblemultiple and/or unorganized answering), the sample size wasnarrowed down to 1655 subjects. To gather as representative asample as possible, we included data from relevant age groupsgathered in the first phase from the six schools that did notparticipate in the second phase (n ¼ 182).
The final sample size was 1837 participants (1655 þ 182). Therespondent rate of the second phase of data collection was 73%(1655/2280). Of the 625 children that were not reached, 23% wereaway from school during data collection, 24% did not obtain con-sent from parents, and the answers of the rest (53%) were losteither because of technical problems or because the child wasunable to finish the survey.
2.4. Measures
The degree of environmental child friendliness was studied ontwo levels: children’s environmental experiences and independentmobility, as suggested by Kyttä (2004). Children’s environmentalexperienceswere operationalized as localized affordances and theirlikeability and diversity, and independent mobility as whether theaffordance is reached alone or in company of a friend or an adult.We use both terms, independent mobility and independent access,while discussing the independence of reaching the affordances.
2.4.1. Localized affordancesAs potentially meaningful places for children, functional, social,
and emotional affordances were studied. The taxonomies usedwere based on previous studies (see Table 1). The emotionalaffordance category, “How does Turku feel?”, was based on Finnish

4 The Shannon index does not have a specific range but is dependent on therichness and occurrence of the themes and the affordance points representingthem. Thus, a high diversity value indicates there are several of the 64 themes witha large number of affordances marked in different themes present in the specificgrid cell.
A. Broberg et al. / Journal of Environmental Psychology 35 (2013) 110e120 115
qualitative research on children’s emotionally meaningful places(Miettinen, 2006). Some examples of the 17 different emotionalaffordances questioned were peaceful or dangerous places. For thesocial affordance category, an empirical study in Britain among thesame age groups (Clark & Uzzell, 2002) was applied. In total, 14social affordances were queried under the heading “Alone andtogether in Turku”, and included, for instance, places to be withfriends or forbidden places. The functional affordances were stud-ied on a more general (activity) level, “Leisure time in Turku”, andon a more specific level (action, operation), “What do I do inTurku?” (Leontjev, 1978). The taxonomy for functional affordancesby Heft (1988), as interpreted by Kyttä (2002), was applied to studythe action-level functional affordances. Examples of activity-levelaffordances included visiting the library and playing sports. Theaction-level affordances were, for example, bicycling or climbing.The former items represented the interests of the multisectorialpartners of our project from the city of Turku. In each category, theorder of the appearance of individual affordances in the surveyapplication was randomized. However, the order of the main cat-egories on the front page of the application was stable. The surveyapplication allowed the respondent tomap up to three localizationsfor each affordance. This limitation was due to complexities theprogrammers faced in storing variable amounts of data for eachrespondent back in the year 2007.
2.4.2. Independent mobilityWith each affordancemarked on themap, the respondents were
asked how they reached the place. The options were alone, withfriends, and accompanied by an adult. Due to a mistake in theapplication, this information was missing in all the localizations ofemotional affordances (22.3% of localizations). And because re-spondents were not forced to answer the question, this data ismissing from further a 24% of other affordance localizations, in allfrom 41% of the places.
2.4.3. Likeability indexEnvironmental likeability was addressed after the localization of
each meaningful place. The children responded on a sliding scalefrom unpleasant to pleasant. The middle of the scale was marked.The responses were stored as 0e100, with 50 representing neutral.Unfortunately, the default value in the program was 50, andgenuine neutral responses were indistinguishable from themissingresponses. Therefore any responses of exactly 50 were discarded. Infurther analysis, we used a dichotomous variable, where the value‘1’ represented positive likeability (over 50) and the value ‘0’ rep-resented negative likeability (below 50).
2.4.4. Bullerby gridTo test Kyttä’s (2004) Bullerby model of child friendliness on the
landscape scale, the original point data of the affordances set wasaggregated into a grid format using a 250-m cell size. The points fellinto a total of 1427 cells, but to obtain a valid result, cells having lessthan three affordances were removed from further analysis(N ¼ 779). In each grid cell, the percentage of affordances reachedalone was calculated. (Emotional affordances were excluded fromthis calculation because of the missing data on independentmobility.) The overall diversity and the relative occurrence of thedifferent affordances were analysed with the Shannon diversity in-dex, which is a popular measure of species diversity in ecology buthas also been used to study social data (Krebs, 1989; Reed & Brown,2003). Shannon’s index is based on information theory. It is a mea-sure of uncertainty (disorder in a system) in predicting what speciesa random individual from a collection of species S and individuals Nbelongs to (Ludwig & Reynolds, 1988). The Shannon diversity indexwas calculated for every grid cell based on the relative number of
affordance points of each of the 64 themes in the grid cell.4 A two-base logarithm was used in the analysis (Krebs, 1989).
The grid cells were categorized into four environment types ofthe Bullerby model according to the percentage of the affordancesreached alone (mean ¼ 35, SD ¼ 28) and to the Shannon diversityindex (mean ¼ 2.8, SD ¼ 0.9). The means were used to divide thegrid cells into the four categories. Thus, the axis of independentmobility was
1. 35% or more of affordances within a cell reached alone, and2. less than 35% of affordances reached alone;
and the axis of actualized affordances was
1. Shannon diversity index 2.8 or more, and2. less than 2.8.
Using the share of affordances reached alone, rather thanwithout adult supervision, is a debatable choice. Children’smobility is predominantly social and, as has been noted amongDanish children (Mikkelsen & Christensen, 2009), independence ofmobility is not necessarily moving alone, but moving withoutadults, among peers. Nevertheless, we’ve found that independentmobility is a problematic variable in the Finnish context, wherechildren report very few restrictions on their mobility. To be able toget some variation in the axis of independent mobility in the Bul-lerby model, we use the narrow definition of reaching the afford-ance alone as a measure of independence.
2.4.5. Mapping and GIS-based measuresThe analysis of the structural characteristics of children’s
meaningful places was based on the geographical localizations thatchildren themselves gave while using the softGIS application. Toincrease the reliability of the localizations, the softGIS applicationhelped children to orient themselves on the map. After the name ofa child’s school was given, the map automatically centred on it.
GIS-based measures of the urban structure were calculatedwithin a 50-m buffer of each affordance marked on the map andinto the 250-m grid cells of the Bullerby model. The urban structuremeasures were:
� Proportion of green structure: the proportion of fields, forests,parks, and water of the total buffer or grid cell area. These werecalculated from the citywide cartographic data obtained fromthe surveying department of Turku.
� Residential density: housing units per hectare (hu/ha) withinthe buffer or grid cell. The centroids for each building in Turku,containing the information on housing units, floor areas andpopulation demographics for the building, were obtained fromthe city.
� Floor area ratio (FAR): calculated as the combined floor area ofthe buildings within the buffer or grid cell divided by the areanot classified as green. In the buffer data, ratios over 10 weredismissed as outliers (1.3% of buffers). These outliers weresupposedly due to incongruence in the geographical datasetsgathered on different scales.
� Number of population within buffer or grid cell, calculatedfrom the above-mentioned building centroid data.
A. Broberg et al. / Journal of Environmental Psychology 35 (2013) 110e120116
2.5. Analysis
The research data were saved in a database from which thechildren’s responses were written out in a table format, either sothat each respondent created one record or so that the record wascreated by a single location (i.e., an affordance located by arespondent). When a single respondent was the basic unit ofanalysis, the respondent-based material was provided withlocality-based summaries from the data, such as the number ofdifferent locations, information about the respondent’s homeenvironment, or the average distance to meaningful places. Thisarticle covers the affordance-based material. The person-basedmaterial has been reported upon separately (Kyttä et al., 2012).
The data were statistically analysed with PASW Statistics 18software. The significances in the differences of means betweengenders and the two age groups were studied using t-tests or theManneWhitney U test, and the differences in frequencies using thec2 test. Analysis of variance (ANOVA) was used to study the sig-nificances in difference between different categories of affordancesand the grid cells in the Bullerby model. The ANOVA results werefurther analysed using Tukey’s test. The connections between theurban structure characteristics and children’s environmental ex-periences were studied with logistic regression analyses, as few ofthe variables followed the normal distribution.
The GIS analyses were carried out with ArcGIS 9.3 and 10 soft-ware and with MapInfo 8.3 software. Among the most central GISanalyses were creating buffers around children’s homes andcalculating the residential density and the portions of greenstructure and of children within these areas.
3. Results
3.1. Experientially meaningful environmental affordances edescriptive results
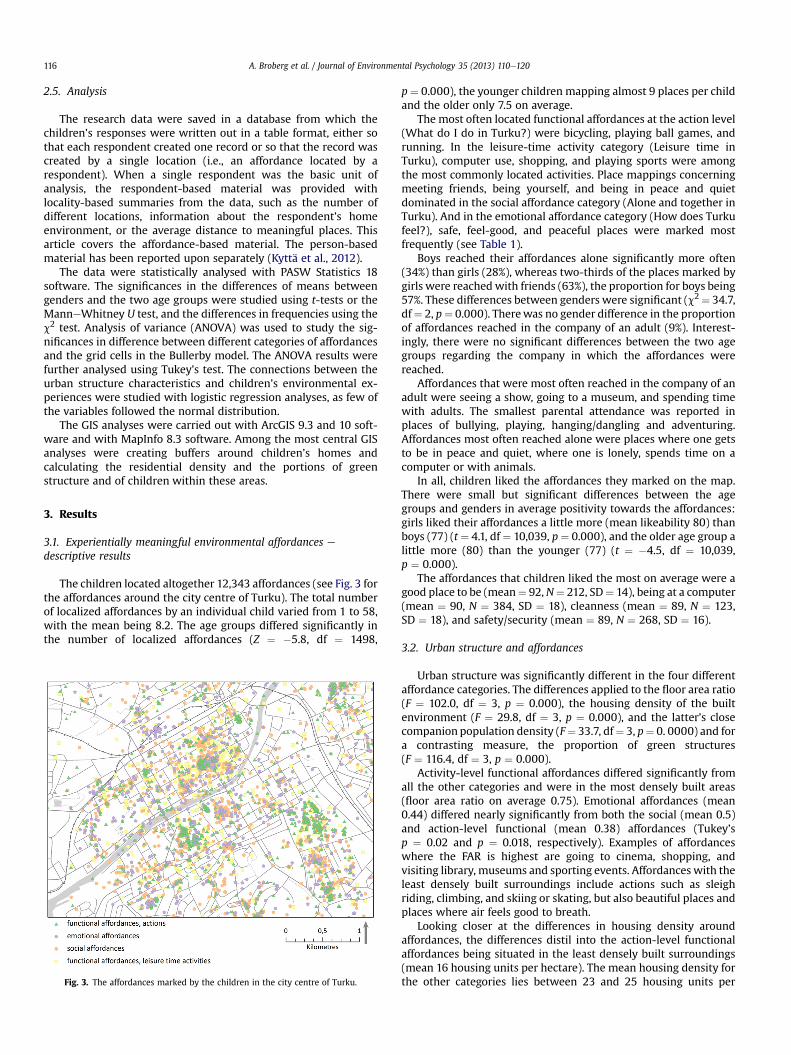
The children located altogether 12,343 affordances (see Fig. 3 forthe affordances around the city centre of Turku). The total numberof localized affordances by an individual child varied from 1 to 58,with the mean being 8.2. The age groups differed significantly inthe number of localized affordances (Z ¼ �5.8, df ¼ 1498,
Fig. 3. The affordances marked by the children in the city centre of Turku.
p¼ 0.000), the younger children mapping almost 9 places per childand the older only 7.5 on average.
The most often located functional affordances at the action level(What do I do in Turku?) were bicycling, playing ball games, andrunning. In the leisure-time activity category (Leisure time inTurku), computer use, shopping, and playing sports were amongthe most commonly located activities. Place mappings concerningmeeting friends, being yourself, and being in peace and quietdominated in the social affordance category (Alone and together inTurku). And in the emotional affordance category (How does Turkufeel?), safe, feel-good, and peaceful places were marked mostfrequently (see Table 1).
Boys reached their affordances alone significantly more often(34%) than girls (28%), whereas two-thirds of the places marked bygirls were reachedwith friends (63%), the proportion for boys being57%. These differences between genders were significant (c2¼ 34.7,df¼ 2, p¼ 0.000). Therewas no gender difference in the proportionof affordances reached in the company of an adult (9%). Interest-ingly, there were no significant differences between the two agegroups regarding the company in which the affordances werereached.
Affordances that were most often reached in the company of anadult were seeing a show, going to a museum, and spending timewith adults. The smallest parental attendance was reported inplaces of bullying, playing, hanging/dangling and adventuring.Affordances most often reached alone were places where one getsto be in peace and quiet, where one is lonely, spends time on acomputer or with animals.
In all, children liked the affordances they marked on the map.There were small but significant differences between the agegroups and genders in average positivity towards the affordances:girls liked their affordances a little more (mean likeability 80) thanboys (77) (t ¼ 4.1, df¼ 10,039, p¼ 0.000), and the older age group alittle more (80) than the younger (77) (t ¼ �4.5, df ¼ 10,039,p ¼ 0.000).
The affordances that children liked the most on average were agood place to be (mean¼ 92,N¼ 212, SD¼ 14), being at a computer(mean ¼ 90, N ¼ 384, SD ¼ 18), cleanness (mean ¼ 89, N ¼ 123,SD ¼ 18), and safety/security (mean ¼ 89, N ¼ 268, SD ¼ 16).
3.2. Urban structure and affordances
Urban structure was significantly different in the four differentaffordance categories. The differences applied to the floor area ratio(F ¼ 102.0, df ¼ 3, p ¼ 0.000), the housing density of the builtenvironment (F ¼ 29.8, df ¼ 3, p ¼ 0.000), and the latter’s closecompanion population density (F¼ 33.7, df¼ 3, p¼ 0. 0000) and fora contrasting measure, the proportion of green structures(F ¼ 116.4, df ¼ 3, p ¼ 0.000).
Activity-level functional affordances differed significantly fromall the other categories and were in the most densely built areas(floor area ratio on average 0.75). Emotional affordances (mean0.44) differed nearly significantly from both the social (mean 0.5)and action-level functional (mean 0.38) affordances (Tukey’sp ¼ 0.02 and p ¼ 0.018, respectively). Examples of affordanceswhere the FAR is highest are going to cinema, shopping, andvisiting library, museums and sporting events. Affordances with theleast densely built surroundings include actions such as sleighriding, climbing, and skiing or skating, but also beautiful places andplaces where air feels good to breath.
Looking closer at the differences in housing density aroundaffordances, the differences distil into the action-level functionalaffordances being situated in the least densely built surroundings(mean 16 housing units per hectare). The mean housing density forthe other categories lies between 23 and 25 housing units per

A. Broberg et al. / Journal of Environmental Psychology 35 (2013) 110e120 117
hectare, the differences being not significant. Population-wise,similar findings apply. The size of the population around action-level functional affordances differs from all the other categories eit is smaller. Also, emotional affordances and activity-level func-tional affordances differ from each other, the latter being insignificantly more densely populated settings. The affordanceswhere housing and population densities are high include going tothe cinema, using a computer, playing, and spending time withadults. These can be seen as affordances typical for residentialareas. Within the five most densely housed affordances are alsoemotional places where the feeling is rowdy or rough (mean 34 hu/ha).
The amount of greenery varies significantly between all thecategories. Action-level functional affordances (green structures onaverage 44%) and emotional affordances (mean 33%) were locatedin the most green environments. Leisure-time, activity-level func-tional affordances (mean 27%) and social affordances (mean 29%)were situated in the least green places. The most green affordancesurroundings are around places where respondents ski or skate,swim, and play water games, but also around places experienced asbeautiful. The list of least green affordance surroundings includesthe already listed city-life affordances of shopping, visiting the li-brary, and going to the cinema, but even less green are places wherenew friends can be made and places that are noisy.
The affordances marked by girls (mean percentage green 32%)were in significantly less green surroundings than those marked byboys (36%) (t ¼ 6.1, df ¼ 12,309, p ¼ 0.000). There were no differ-ences between age groups. Correspondingly, the affordancesmarked by girls were in significantly more densely built sur-roundings (mean 23.7 hu/ha, FAR 0.58) than those marked by boys(20.5 hu/ha, FAR 0.45) (thu/ha ¼ �4.2, df ¼ 12,309, p ¼ 0.000 andtFAR ¼ 8.2, df ¼ 11,993, p ¼ 0.000).
Interestingly, when the density of the built environment isexamined as housing density, the younger age group’s affordancesare in nearly significantly denser settings (mean 22.8 hu/ha) thanthose of the older age group (21.3) (t ¼ 2.0, df ¼ 12,309, p ¼ 0.045).But when we scrutinize density as floor area ratio, the oppositeholds true: the older age group has marked their affordances insignificantly denser surroundings (FAR 0.56) than the younger agegroup (FAR 0.46) (t ¼ �7.3, df ¼ 11,993, p ¼ 0.000). This suggeststhat the affordances of younger children concentrate on residentialareas, whereas those of older children concentrate on commercialor central areas.
Fig. 4. Child friendliness of the environments in the ci
3.3. Urban structure effects on the independent access to andpositivity towards the affordances
Next we analysed the effect of the urban structure on children’sindependent access to their marked affordances. Gender wasincluded in all the logistic regression models but is not reportedupon separately. Housing density around affordances increased thelikelihood of a child coming to the affordance alone (OR¼ 1.004, CIs1.003e1.005, p ¼ 0.000). The amount of population around theaffordance had a similar effect on the likelihood of accessing theaffordance independently (OR¼ 1.004, CIs 1.003e1.005, p¼ 0.000).An increase in the floor area ratio decreased the likelihood ofreaching the place alone (OR ¼ 0.786, CIs 0.734e0.843, p ¼ 0.000).Interpreting these results, affordances that are situated in resi-dential areas are likely to be reached alone, whereas affordancessituated in densely built urban cores are likely to be reached withothers. The proportion of green structures did not have any sig-nificant effect on the likelihood of independent access.
Some of the urban structural variables were associated withchildren’s stated preference for affordances, namely populationaround affordances (OR ¼ 1.002, CIs 1.001e1.004, p ¼ 0.001) andthe proportion of green structures (OR ¼ 1.004, CIs 1.002e1.006,p ¼ 0.000). Gender and age group were included in these logisticregression models, but their effect on the models is not reportedupon separately. An increase in the size of population aroundaffordances increased the likelihood of stating a positive value oflikeability, and interestingly, the result was different betweendifferent affordance categories. The effect of the populationnumbers on positivity was found specifically in the emotional(OR ¼ 1.002, CIs 1.000e1.005, p ¼ 0.03) and social (OR ¼ 1.004, CIs1.002e1.007, p ¼ 0.001) affordance categories. The more peoplethere were living around the affordance, the more likely the chil-drenwere to state a positive preference towards the affordance. Thegreen structures’ positive effect on the likelihood of a positiveperception held only in the emotional affordance category(OR ¼ 1.009, CIs 1.006e1.011, p ¼ 0.000), and here the greennessaround the emotional affordance significantly increased the likeli-hood of liking the place.
3.4. Testing the Bullerby model of child friendliness
The series of maps on Fig. 4 represent our operationalization ofthe Bullerby model. The first of the maps shows the number of
ty of Turku as evaluated with the Bullerby model.

A. Broberg et al. / Journal of Environmental Psychology 35 (2013) 110e120118
affordances in the 250-m grid cells and gives an idea of theimportance of the city centre to the respondents as well as theabundance of affordance localizations around residential areas ofTurku. The diversity of different affordance categories in the cells,shown on the second map, follows to some extent the overallnumber of affordances; but diversity can also be great in cellswhere the actual numbers are not the highest. Areas in Turku,where the majority of the affordances are reached independently,are scattered around the city, and generally the city centre gatherslower levels of independent access, as can be seen from the thirdmap.
The last of the maps looks at the variety in affordances and in-dependent access to them simultaneously and thus draws a pictureof the child friendliness of Turku, as understood according to theBullerby model. Large areas of the city centre fall into the Glass-house category, where variety in affordances is large, but inde-pendent mobility is on a low level. Bullerby types of environments,where affordances are many and can be reached alone, borderGlasshouse environments near the city centre, but areas like thisare also scattered around the whole study area. Only largerstretches of Cell types of environments can be found in the areassouth and southwest from the centre, on the way to the residentialareas on the islands.
According to our operationalization of the Bullerbymodel, 28.5%of the cells were categorized into Cell and 26.6.% into Glasshousetypes of environments, while a little over one-fifth (21.6%) wereWasteland environments and 23.4% were of the Bullerby type.Variables concerning the urban structure, such as populationdensity or proportion of green structures, were calculated for thegrid cells, and variance in these structural variables between cellscategorized differently according to the Bullerby model was ana-lysed. There was significant structural variation between the gridcells in relation to size of population (F ¼ 24.6, df ¼ 3, p ¼ 0.000)and proportion of green structures (F ¼ 13.0, df ¼ 3, p ¼ 0.000),whereas the cells in the different categories did not vary in theirresidential density or floor area ratio.
Looking at population numbers, the main result is that Bullerbyand Glasshouse types of environments differ from Wasteland andCell types (Tukey: Bullerby/Wasteland p ¼ 0.000, Bullerby/Cellp ¼ 0.000, Glasshouse/Wasteland p ¼ 0.008, Glasshouse/Cellp¼ 0.000). Bullerby and Glasshouse represent environments wherethe residential density is relatively high (on average 240 and 244persons living in the cells, respectively), whereas Cell (mean 108)and Wasteland (mean 126) are more sparsely populated. The pro-portion of green structure differentiates the groups in a similarmanner, Wasteland and Cell forming the greener pair (means 42%and 46%, respectively), Bullerby (33%) and Glasshouse (33%) beingthe less green.
4. Discussion & conclusions
Combining place-based knowledge (first based on children’sexperience and second derived from objective measurable qualitiesof the physical environment) provided a valuable methodologicalcontribution to studies on environmental child friendliness. Thestudy revealed that as a whole, the studied Finnish childrenenjoyed widespread possibilities for active and independentmobility and the building of a personal experiential relationshipwith their outdoor environment. We chose to study environmentalchild friendliness from the viewpoint of the Bullerby model,concentrating on the affordances that an environment provides thechildren and on children’s independent access to these. These twocriteria proved to offer interesting insights on different urban en-vironments. The children had many personally meaningful placesin outdoor settings. The softGIS methodology used in the study
allowed children to mark personally meaningful affordances on themap, and children located on average eight places per child.
Our results partly confirmed the previous findings frommobilityresearch about the ability of some urban environmental charac-teristics to promote children’s independent mobility. We discov-ered positive associations between residential and populationdensity and children’s independent access to affordances, whereasbuilding density, measured as floor area ratio, had a negative as-sociation with children’s independence in reaching affordances.Urban density around the affordances marked by the younger andthe older age group were different. Older children and adolescentsmarked their affordances in central locations where building den-sities were high, while affordances of the younger group werelocated more in residential areas, where housing density andpopulation numbers were high. One might also assume that theolder age group reaches their affordances more independently thanthe younger, be it alone or with peers, but age group differences inreaching the affordance did not occur in our data. This might haveto do with the fact that the affordances of the older group arefurther away from their home. Ideally, residential areas could bedeveloped to offer more intriguing places for youth. Indeed, notonly child friendliness but also youth friendliness of environmentsshould be studied (see also Woolcock et al., 2010).
Green areas are important settings for children’s experiences.Especially action-level functional affordances were present in sur-roundings where green structures were prominent. The greenest ofall the affordances were beautiful places. And indeed, when lookingat emotional affordances, the larger the proportion of greenstructures, the likelier the positive evaluation of the place. Thisreflects well-documented previous research literature on therestorative qualities of green settings: the proximity to natureassociatedwith sparse building promotesmental health as a settingfor stress restoration (van den Berg, Koole, & van der Wulp, 2003).We have also found that the amount of green structure around achild’s home is positively associated with good perceived health(Kyttä et al., 2012). Then again, different urban structures areimportant for different experiences. As an example of this, popu-lation numbers were bigger around social affordances than anyother category. Also, the more residents there were around thesocial affordance, the more children liked the place.
The ability of the Bullerby model to reveal the essential char-acteristics of the physical environment that contribute to envi-ronmental child friendliness was supported in this study. Theapproach was especially useful for the analysis of the resourcedimension, which is seldom studied in close connection with thephysical characteristics of the environment. Physical environmentswhere the diversity of affordances was vast were more denselypopulated and less green than the less diverse environments. Thedimension measuring the independent access to affordances,however, did not show differences between the urban structure ofthe grid cells categorized into different environmental types of theBullerbymodel. Theway the access of independence was measuredwas also problematic, not only because thereweremissing data butbecause of the narrow definition of independence being used. In-dependence of mobility is not necessarily moving alone, butmoving without adults, among peers (Mikkelsen & Christensen,2009). Also, results from a previous study concentrating on chil-dren’s activity levels in parks highlight the importance of inde-pendence from parents or supervisors but with other childrenpresent. The presence of parental supervisionwhile the child was ina park had a strong negative effect on children’s activity, while thepresence of other active children was strongly positively associatedwith park-based physical activity (Floyd et al., 2011).
While we completely agree on children’s mobility being social,in this study we used the narrow definition of reaching the
A. Broberg et al. / Journal of Environmental Psychology 35 (2013) 110e120 119
affordance alone as a measure of independence. This is due to thelow parental attendance that the children reported: 9% for both agegroups. In other, more restrictive mobility contexts, it would beworthwhile to use the broader definition of independent mobility.We also suggest that in future research, the accessibility dimensionshould be studied, more broadly taking into account not only in-dependent mobility, but also travel mode and frequency of visits,possibly also the social equality of accessibility. Future research invariable contexts could also enable the finding of some standard-ized thresholds for the levels of independence and variability ofaffordances that would have to be met for an environment to beconsidered child-friendly. It is worth noting that green areas didn’tappear as child-friendly in our Bullerby analysis. However, theyproved to be very important for the children in the affordance-based analysis. This implies that measuring the emotionalresponse to the place along with the accessibility is important.
Despite the need for future research on the Bullerby model,there was evidence that the two basic dimensions, the independentaccess to and diversity of the affordances, are connected. Our pre-vious study showed, for example, that the number of affordancesthat children marked was correlated with physical activity on theschool journey (Kyttä et al., 2012). This strengthens the conceptionthat there is a close connection between the two central features ofa child-friendly living environment, independent mobility andrichness of affordances. The affordances were also very central tochildren in the research using Chatterjee’s concept of the child-friendly place (Chatterjee, 2006; Ramezani & Said, 2012). Maybethe learning and competence building that Chatterjee (2005) pro-poses as a criterion for child-friendliness could in effect be seen asan outcome of the situation where a child lives in a child-friendlyenvironment, rather than characteristics of the environment. In asimilar line of reasoning, health outcomes are often attributed tosituations where a child (or an adult, for that matter) lives in anenvironment that allows physical activity.
When discussing the child friendliness of environments,concentrating on outdoor environments can be too narrow a view.One of the affordances children themselves liked most was being ata computer, and also the sheer number of these localizations wasthe third most liked. Even if this can reflect computer use being oneof the few home-based affordances the children were offered tolocate, it should be noted that virtual and electronic environmentscan act as important spaces for play, interaction and socializationfor children and youth.
The reliability and validity of research data collected via web-based methodology demand critical evaluation. Finnish childrenare probably used to communicating via the Internet because 99%of Finnish households with children have Internet access (EuropeanCommission, 2011). Earlier studies have shown that adolescentstend to prefer a Web-based over a paper-based questionnaire, andhealth-related surveys generally result in equal results regardless ofthe method of implementation (Mangunkusumo et al., 2005).However, web-based surveys can be vulnerable to mistakes in theprogramming work, as was shown by the missing independentmobility data on emotional affordances. Our research themes e
environmental experiences and independent mobility e werestudied as perceived, subjective phenomena. To develop valid andreliable measures, we used existing scales and taxonomies fromprevious studies as much as possible. In most of the themes, self-reports by the youths studied (ages 10e12 and 13e15) are prob-ably more reliable than proxy reports from parents. And children’sability to report their experiences on a map can also be questioned.Nordin and Berglund (2010) have researched the use of GIS-basedmapping methods with Swedish children aged 10e15 years andhave found them capable of reading maps and using a GIS appli-cation for communicating their interests. Even if we did not
specifically research children’s ability to respond to the mappingquestions, it can be hypothesized that the skill level is on a similarlevel as in Sweden. Orienteering is also a part of the national cur-riculum in Finland.
Several limitations and strengths of the study should bementioned. First, as the softGIS method for children was used forthe first time in this study, some mishaps occurred. The order inwhich the affordance categories were shown on the main page wasnot randomized for different users, and thus the numbers ofdifferent affordances, especially between categories, do not indis-putably reflect the relative importance of these affordances for thechildren. Data on independent mobility was missing from 41% ofthe affordances. Half of this was due to a mistake in the application;but the other half might be due to the vagueness of the definition.Children might sometimes come to the places alone, while othertimes with friends or adults; and thus it might be complicated topick just one option. Another limitation was the relatively lowquality of the register-based GIS data. This did not allow very fineanalysis of the urban environment. In future studies concerningenvironmental affordances and mobility, the urban structural an-alyses should include measures concerning the possibilities forlight traffic, public transportation options, and functions of theurban environment, such as shops, restaurants, and playgrounds.Finally, the Bullerby grid-based analysis of environmental childfriendliness seems to emphasize grid cells where there are plenty ofaffordance localizations, and this does not necessarily reflect onlythe importance of these places, but also the number of respondentswho live near that place. Then again, the Shannon diversity indexused to study the richness of the affordances is logarithmic andtakes into account the number of localizations.
The strengths of the study lie in the innovative, Internet-basedsoftGIS method that proved to be a promising way to study theconditions of child-friendly living environments in a detailedmanner and in a way that also inspires children. Linking the dis-cussion of child-friendly environments to actual physical environ-ments in a simple way e grounded in the experiences of childrenrather than in the ideals of researcherse can alsomake the conceptmore usable to urban planners. It is important to develop theenvironmental child friendliness of whole environments and notjust focus on school journeys or places specially designed for chil-dren. Children do not move around actively if the environmentdoes not offer them intriguing challenges and a rich variety ofpossibilities for diverse activities. Children should also be seen asabled and active users of their environment and as informantspossessing valuable insights into the possibilities and restrictions ofdifferent environments.
Acknowledgements
The authors wish to thank themultisectoral steering group fromthe city of Turku for extremely active and valuable co-operation.We are very grateful to the headmasters, teachers, and naturallythe pupils of participant schools. The idea of using Shannon di-versity index was born in discussions with colleagues at Laboratoryof Computer Cartography (UTU-LCC) at University of Turku. Mar-ketta Kyttä worked as doctoral researcher of the Academy ofFinland during the project. The project was funded by Tekes, theFinnish Funding Agency for Technology and Innovation, and theFinnish Ministry of Education and Culture.
References
van den Berg, A. E., Koole, S. L., & van der Wulp, N. Y. (2003). Environmentalpreference and restoration: (How) are they related? Journal of EnvironmentalPsychology, 23(2), 135e146. http://dx.doi.org/10.1016/S0272-4944(02)00111-1.

A. Broberg et al. / Journal of Environmental Psychology 35 (2013) 110e120120
Bringolf-Isler, B., Grize, L., Mäder, U., Ruch, N., Sennhauser, F. H., & Braun-Fahrländer, C. (2008). Personal and environmental factors associated withactive commuting to school in Switzerland. Preventive Medicine, 46(1), 67e73.http://dx.doi.org/10.1016/j.ypmed.2007.06.015.
Bronfenbrenner, U. (1993). The ecology of cognitive development: Research modelsand fugitive findings. In R. H. Wozniak, & K. W. Fischer (Eds.), Development incontext: Acting and thinking in specific environments (pp. 3e44). Hillsdale, NJ,England: Lawrence Erlbaum Associates.
Carroll, P., Witten, K., & Kearns, R. (2011). Housing intensification in Auckland, NewZealand: Implications for children and families. Housing Studies, 26(3), 353e367. http://dx.doi.org/10.1080/02673037.2011.542096.
Carver, A., Salmon, J., Campbell, K., Baur, L., Garnett, S., & Crawford, D. (2005). Howdo perceptions of local neighborhood relate to adolescents’ walking andcycling? American Journal of Health Promotion, 20(2), 139e147.
Carver, A., Timperio, A., & Crawford, D. (2008). Playing it safe: The influence ofneighbourhood safety on children’s physical activitydA review. Health & Place,14(2), 217e227. http://dx.doi.org/10.1016/j.healthplace.2007.06.004.
Chatterjee, S. (2005). Children’s friendship with place: A conceptual inquiry. Chil-dren, Youth and Environments, 15(1), 1e26.
Chatterjee, S. (2006). Children’s friendship with place: An exploration of environmentalchild friendliness of children’s environments in cities. North Carolina StateUniversity.
Chawla, L. (2002). Growing up in an urbanising world. London: Earthscan.Clark, C., & Uzzell, D. L. (2002). The affordances of the home, neighbourhood, school
and town centre for adolescents. Journal of Environmental Psychology, 22(1e2),95e108. http://dx.doi.org/10.1006/jevp.2001.0242.
De Vries, S. I., Bakker, I., Van Mechelen, W., & Hopman-Rock, M. (2007). De-terminants of activity-friendly neighborhoods for children: Results from theSPACE study. American Journal of Health Promotion, 21, 312e316.
European Commission. eCommunications household survey: The results of a specialEurobarometer survey. Available at http://ec.europa.eu/information_society/policy/ecomm/library/ext_studies/index_en.htm Accessed 10.06.11.
Floyd, M. F., Bocarro, J. N., Smith, W. R., Baran, P. K., Moore, R. C., Cosco, N. G., et al.(2011). Park-based physical activity among children and adolescents. AmericanJournal of Preventive Medicine, 41(3), 258e265. http://dx.doi.org/10.1016/j.amepre.2011.04.013.
Frank, L., Kerr, J., Chapman, J., & Sallis, J. (2007). Urban form relationships with walktrip frequency and distance among youth. American Journal of Health Promotion,21(4 Suppl.), 305e311.
Freeman, C., & Tranter, P. (2011). Children and their urban environment: Changingworlds. London: Earthscan.
Fyhri, A., & Hjorthol, R. (2009). Children’s independent mobility to school, friendsand leisure activities. Journal of Transport Geography, 17(5), 377e384. http://dx.doi.org/10.1016/j.jtrangeo.2008.10.010.
Fyhri, A., Hjorthol, R., Mackett, R. L., Fotel, T. N., & Kyttä, M. (2011). Children’s activetravel and independent mobility in four countries: Development, socialcontributing trends and measures. Transport Policy, 18(5), 703e710. http://dx.doi.org/10.1016/j.tranpol.2011.01.005.
Gibson, J. (1986). The ecological approach to visual perception. Hillsdale, N.J.: Law-rence Erlbaum Associates.
Gilliland, J., Holmes, M., Irwin, J. D., & Tucker, P. (2006). Environmental equity ischild’s play: Mapping public provision of recreation opportunities in urbanneighbourhoods. Vulnerable Children and Youth Studies, 1(3), 256e268.
Haider, J. (2007). Inclusive design: Planning public urban spaces for children.Proceedings of the Institution of Civil Engineers. Municipal Engineer, 160(2),83e88.
Haikkola, L., Pacilli, M. G., Horelli, L., & Prezza, M. (2007). Interpretations of urbanchild-friendliness: A comparative study of two neighbourhoods in Helsinki andRome. Children, Youth and Environments, 17(4), 319e351.
Heft, H. (1988). Affordances of children’s environments: A functional approach toenvironmental description. Children’s Environments Quarterly, 5(3), 29e37.
Heft, H. (2001). Ecological psychology in context: James Gibson, Roger Barker, and thelegacy of William James’s radical empiricism. Mahwah, N.J.: Lawrence ErlbaumAssociates Publishers.
Hillman, M., Adams, J., & Whitelegg, J. (1990). One false move. A study of children’sindependent mobility. London: Policy Studies Institute.
Horelli, L. (2007). Constructing a theoretical framework for environmental child-friendliness. Children, Youth and Environments, 17(4), 267e292.
Kahila, M., & Kyttä, M. (2009). SoftGIS as a bridge-builder in collaborative urbanplanning. In S. Geertman, & J. Stillwell (Eds.), Planning support systems bestpractice and new methods (pp. 389e411). Netherlands: Springer. http://dx.doi.org/10.1007/978-1-4020-8952-7_19.
Krebs, C. J. (1989). Ecological methodology. New York: Harper & Row Publishers.Kyttä, M. (2002). Affordances of children’s environments in the context of cities,
small towns, suburbs and rural villages in Finland and Belarus. Journal ofEnvironmental Psychology, 22(1e2), 109e123. http://dx.doi.org/10.1006/jevp.2001.0249.
Kyttä, M. (2004). The extent of children’s independent mobility and the number ofactualized affordances as criteria for child-friendly environments. Journal ofEnvironmental Psychology, 24(2), 179e198. http://dx.doi.org/10.1016/S0272-4944(03)00073-2.
Kytta, M. (2008). Children in outdoor contexts affordances and independent mobility inthe assessment of environmental child friendliness. Saarbrücken: VDM Verlag Dr.Müller.
Kyttä, M. (2011). SoftGIS methods in planning evaluation. In A. D. Hull,E. R. Alexander, A. Khakee, & J. Woltjer (Eds.), Evaluation for sustainability andparticipation in planning (pp. 334e354). London: Routledge.
Kyttä, M., Broberg, A., & Kahila, M. (2012). Urban environment and children’s activelifestyle: SoftGIS revealing children’s behavioral patterns and meaningful pla-ces. American Journal of Health Promotion, 26(5), e137ee148.
Kyttä, M., & Kahila, M. (2011). SoftGIS methodology e Building bridges in urbanplanning. GIM International, 25(3), 37e41.
Leontjev, A. N. (1978). Activity, consciousness, personality. Englewood Cliffs, N.J.:Prentice Hall.
van Loon, J., & Frank, L. (2011). Urban form relationships with youth physical ac-tivity: Implications for research and practice. Journal of Planning Literature,26(3), 280e308. http://dx.doi.org/10.1177/0885412211400978.
Ludwig, J. A., & Reynolds, J. F. (1988). Statistical ecology: A primer on methods andcomputing. New York: John Wiley & Sons, Inc.
McAllister, C. (2009). Child friendly cities and land use planning: Implications forchildren’s health. Environments: A Journal of Interdisciplinary Studies, 35(3), 45e61.
McMillan, T. E. (2005). Urban form and a child’s trip to school: The current literatureand a framework for future research. Journal of Planning Literature, 19(4), 440e456. http://dx.doi.org/10.1177/0885412204274173.
Malone, K. (2001). Children, youth and sustainable cities. Local Environment, 6(1),5e12. http://dx.doi.org/10.1080/13549830120024215.
Mangunkusumo, R. T., Moorman, P. W., Van Den Berg-de Ruiter, A. E., Van Der Lei, J., DeKoning, H. J., & Raat, H. (2005). Internet-administered adolescent health question-naires compared with a paper version in a randomized study. Journal of AdolescentHealth, 36(1), 70.e1e70.e6. http://dx.doi.org/10.1016/j.jadohealth.2004.02.020.
Miettinen, S. (2006). Lapsena lähiössä. 10e11-vuotiaiden näkökulma asuinalueensatiloihin [A child in a suburb. Views of 10 to 11 year old children towards the res-idential spaces in their neighbourhood] [licentiate thesis]. Jyväskylä, Finland:University of Jyväskylä.
Mikkelsen, M. R., & Christensen, P. (2009). Is children’s independent mobility reallyindependent? A study of children’s mobility combining ethnography and GPS/mobile phone technologies. Mobilities, 4(1), 37e58. http://dx.doi.org/10.1080/17450100802657954.
Moore, R. C. (1986). Childhood’s domain: Play and place in child development. London:Croom Helm.
Nordin, K., & Berglund, U. (2010). Children’s maps in GIS: A tool for communicatingoutdoor experiences in urban planning. International Journal of InformationCommunication Technologies and Human Development, 2(2), 1e16. http://dx.doi.org/10.4018/jicthd.2010040101.
Nordström, M. (2010). Children’s views on child-friendly environments in differentgeographical, cultural and social neighbourhoods. Urban Studies, 47(3), 514e528. http://dx.doi.org/10.1177/0042098009349771.
Page, A. S., Cooper, A. R., Griew, P., & Jago, R. (2010). Independent mobility, per-ceptions of the built environment and children’s participation in play, activetravel and structured exercise and sport: The PEACH project. InternationalJournal of Behavioral Nutrition and Physical Activity, 7, 17. http://dx.doi.org/10.1186/1479-5868-7-17.
Ramezani, S., & Said, I. (2012). Children’s nomination of friendly places in an urbanneighbourhood in Shiraz, Iran. Children’s Geographies, 1e21.
Rantanen, H., & Kahila, M. (2009). The SoftGIS approach to local knowledge. Journalof Environmental Management, 90(6), 1981e1990. http://dx.doi.org/10.1016/j.jenvman.2007.08.025.
Reed, P., & Brown, G. (2003). Values suitability analysis: A methodology for iden-tifying and integrating public perceptions of ecosystem values in forest plan-ning. Journal of Environmental Planning and Management, 46(5), 643e658.http://dx.doi.org/10.1080/0964056032000138418.
Riggio, E. (2002). Child friendly cities: Good governance in the best interests of thechild. Environment and Urbanization, 14(2), 45e58.
Schulze, S., & Moneti, F. (2007). The child friendly cities initiative. Proceedings of theInstitution of Civil Engineers. Municipal Engineer, 160(2), 77e81.
Timperio, A., Ball, K., Salmon, J., Roberts, R., Giles-Corti, B., Simmons, D., et al.(2006). Personal, family, social, and environmental correlates of activecommuting to school. American Journal of Preventive Medicine, 30(1), 45e51.http://dx.doi.org/10.1016/j.amepre.2005.08.047.
Tranter, P., & Pawson, E. (2001). Children’s access to local environments: A case-study of Christchurch, New Zealand. Local Environment, 6(1), 27e48.
Veitch, J., Salmon, J., & Ball, K. (2007). Children’s perceptions of the use of publicopen spaces for active free-play. Children’s Geographies, 5(4), 409e422.
Whitzman, C., Worthington, M., & Mizrachi, D. (2010). The journey and the desti-nation matter: Child-friendly cities and children’s right to the city. Built Envi-ronment, 36(4), 474e486.
Woolcock, G., Gleeson, B., & Randolph, B. (2010). Urban research and child-friendlycities: A new Australian outline. Children’s Geographies, 8(2), 177e192. http://dx.doi.org/10.1080/14733281003691426.
Wridt, P. (2010). A qualitative GIS approach to mapping urban neighborhoods withchildren to promote physical activity and child-friendly community planning.Environment and Planning B: Planning and Design, 37(1), 129e147.
Related Documents