Child Care In Thirteen Economically Disadvantaged Communities May 2006

child-care-in-thirteen
Mar 10, 2016
child-care-in-thirteen-economically-disadvantaged-communities
Welcome message from author
This document is posted to help you gain knowledge. Please leave a comment to let me know what you think about it! Share it to your friends and learn new things together.
Transcript

Child Care In Thirteen Economically Disadvantaged Communities May 2006

Child Care In Thirteen Economically Disadvantaged Communities May 2006

About The National Association Of Child Care Resource & Referral Agencies
NACCRRA, the National Association of Child Care Resource & Referral Agencies, is our nation’s leading voice for child care. We work with more than 800 state and local Child Care Resource & Referral agencies to ensure that families in every local community have access to high-quality, affordable child care. To achieve our mission, we lead projects that increase
the quality and availability of child care, offer comprehensive training to child care professionals, undertake groundbreaking research, and advocate child care policies that positively impact the lives of children and families. To learn more about NACCRRA and how you can join us in ensuring access to high-quality child care for all families, visit us at www.naccrra.org.
Acknowledgments
NACCRRA thanks the Annie E. Casey Foundation – this project would not have been possible without their support.
NACCRRA also appreciates the efforts of all staff members who ensured that this project was successful. We would especially like to acknowledge the contributions of the following staff members: Mousumi Sarkar for designing the study, collecting and analyzing the data and writing the report; Linda Smith and Grace Reef for advising and editing; Ginnie Pera for proofreading and editing the report; and Patricia Sadiq for layout and the graphic design of the report.
© NACCRRA 2006
Executive Summary . . . . . . . . . . . . . . . . . . . . . . . . . . . . . . . . . . . . . . . . . . . . . . . . . . . . . . . . . . . . . . . . . . . . . . . . . . . . . . . . . . . . 1
About This Report. . . . . . . . . . . . . . . . . . . . . . . . . . . . . . . . . . . . . . . . . . . . . . . . . . . . . . . . . . . . . . . . . . . . . . . . . . . . . . . . . . . . . .4
Introduction . . . . . . . . . . . . . . . . . . . . . . . . . . . . . . . . . . . . . . . . . . . . . . . . . . . . . . . . . . . . . . . . . . . . . . . . . . . . . . . . . . . . . . . . . . .5
About The Communities . . . . . . . . . . . . . . . . . . . . . . . . . . . . . . . . . . . . . . . . . . . . . . . . . . . . . . . . . . . . . . . . . . . . . . . . . . . . . . . .6
Child Care Arrangements For Children . . . . . . . . . . . . . . . . . . . . . . . . . . . . . . . . . . . . . . . . . . . . . . . . . . . . . . . . . . . . . . . . . . .8
Quality Care Matters For Children In Low Income Families . . . . . . . . . . . . . . . . . . . . . . . . . . . . . . . . . . . . . . . . . . . . . . . . .8
Families With Children In These Communities . . . . . . . . . . . . . . . . . . . . . . . . . . . . . . . . . . . . . . . . . . . . . . . . . . . . . . . . . . . . .9
The Need For Child Care Within These Communities . . . . . . . . . . . . . . . . . . . . . . . . . . . . . . . . . . . . . . . . . . . . . . . . . . . . . 10
Licensed/Regulated Child Care. . . . . . . . . . . . . . . . . . . . . . . . . . . . . . . . . . . . . . . . . . . . . . . . . . . . . . . . . . . . . . . . . . . . . . . . . 14
Supply . . . . . . . . . . . . . . . . . . . . . . . . . . . . . . . . . . . . . . . . . . . . . . . . . . . . . . . . . . . . . . . . . . . . . . . . . . . . . . . . . . . . . . . . . . . . . . . . . 14
Price of Child Care . . . . . . . . . . . . . . . . . . . . . . . . . . . . . . . . . . . . . . . . . . . . . . . . . . . . . . . . . . . . . . . . . . . . . . . . . . . . . . . . . . . . . 15
The Connection Between Early Learning and School Success . . . . . . . . . . . . . . . . . . . . . . . . . . . . . . . . . . . . . . . . . . . . . 19
Next Steps . . . . . . . . . . . . . . . . . . . . . . . . . . . . . . . . . . . . . . . . . . . . . . . . . . . . . . . . . . . . . . . . . . . . . . . . . . . . . . . . . . . . . . . . . . . . .20
Conclusions and Recommendations . . . . . . . . . . . . . . . . . . . . . . . . . . . . . . . . . . . . . . . . . . . . . . . . . . . . . . . . . . . . . . . . . . . . 21
Table Of Contents

Table 1: The Making Connections Communities . . . . . . . . . . . . . . . . . . . . . . . . . . . . . . . . . . . . . . . . . . . . . . . . . . . . . . . . . . .7
Table 2: Population Under 6 . . . . . . . . . . . . . . . . . . . . . . . . . . . . . . . . . . . . . . . . . . . . . . . . . . . . . . . . . . . . . . . . . . . . . . . . . . . .9
Table 3: Families At Or Below Poverty Level . . . . . . . . . . . . . . . . . . . . . . . . . . . . . . . . . . . . . . . . . . . . . . . . . . . . . . . . . . . . 10
Table 4: The Need For Child Care . . . . . . . . . . . . . . . . . . . . . . . . . . . . . . . . . . . . . . . . . . . . . . . . . . . . . . . . . . . . . . . . . . . . . . .11
Table 5: Referral Requests Care By Child’s Age And Needs . . . . . . . . . . . . . . . . . . . . . . . . . . . . . . . . . . . . . . . . . . . . . . 12
Table 6: Referral Requests By Hours Of Care . . . . . . . . . . . . . . . . . . . . . . . . . . . . . . . . . . . . . . . . . . . . . . . . . . . . . . . . . . . 13
Table 7: Supply Of Licensed/Regulated Child Care For Children Under 6 . . . . . . . . . . . . . . . . . . . . . . . . . . . . . . . . . . 15
Table 8: Average Price Of Infant/toddler Care In Unaccredited Licensed/Regulated Setting . . . . . . . . . . . . . . . . 16
Table 9: Average Price Of Care For A Pre-School Age Child In Unaccredited Licensed/regulated Setting . . . . . . . . . . . . . . . . . . . . . . . . . . . . . . . . . . . . . . . . . . . . . . . . . . . . 18
Table 10: National Assessment Of Educational Progress (NAEP) Reading Results For 2005, Grade 4 . . . . . . . . . . . . . . . . . . . . . . . . . . . . . . . . . . . . . . . . . . . . . . . . . . 20
List Of Tables And Figures

Page �
This report looks at the need for child care compared to the supply of child care in 13 urban communities across the United States that are economically challenged. Because the research shows that quality care can have the greatest impact on low income children, the National Association of Child Care Resource & Referral Agencies (NACCRRA) surveyed local Child Care Resource & Referral (CCR&R) agencies to gather data about the supply and cost of licensed or regulated child care arrangements within these communities. Federal Law requires states to ensure that licensed or regulated child care providers protect the health and safety of children. While standards vary by state, licensing and regulation are a bare minimum indicator of quality care.
The Annie E. Casey Foundation selected “tough” neighborhoods around the country to implement a series of initiatives to help families improve outcomes for children. One of the most critical challenges for families in these communities is to find reliable, quality child care that they can afford so that they can work and their children can be in an environment in which they can be safe and learn.
About The Communities:
• Compared to the nation, a greater percentage of families in these communities have children under 6 (9.6 percent versus 8.4 percent). About 105,209 of the children are under age 6.
• Nearly one-third of the children under 6 (32.6 percent) in these communities live in single parent working families. Nationally, 18.6 percent of children under 6 live in such families.
Executive Summary

Page �
• Almost one-quarter of the families (24.3 percent) living in these communities live at or below the poverty line, compared to 9.2 percent nationally.
• Nationally, one-quarter of the families (25.3 percent) at or below the poverty line have children under 5. However, within these communities, 44.4 percent of families living at or below the poverty line have children under 5.
Need For Quality Care:
• The quality of child care matters for all children, but research shows quality care has the greatest impact on children in low income families.
• Higher levels of quality care are linked to better socio-emotional development, cognitive development, and success in school and later in life. Quality care helps reduce behavioral problems and improves a child’s quantitative skills.
• Research shows that 90 percent of brain development occurs before age 5.
• Reading test scores demonstrate a wide chasm between children of low income families and their peers’ 4th grade reading levels. On average, children in low income families are more than twice as likely to read below grade level in 4th grade compared to their peers.
The Supply Of Child Care Falls Far Short Of The Demand:
• Based on 2000 Census data, 52,878 children under 6 (50.3 percent of all children under 6) potentially need child care in these communities, but less than 24,000 licensed or regulated spaces are available to children under 6 requiring care.*
• Nearly half of the children under 6 (47.8 percent) who need child care have no access to licensed or regulated child care, due to the lack of supply of such spaces.
• In 11 of the 13 communities studied, from one-third (31 percent) to over three-quarters (77 percent) of children under 6 of working parents had no access to licensed or regulated child care.
The Price Of Child Care
• In some situations, parents in these communities pay as much as 70 percent of their income for full-time child care for an infant or toddler, and some of them pay more than two-thirds of their income for the full-time care of a pre-school age child.
• A recent report on child care from the U.S. Census Bureau shows that families in the United States with children under 5 pay 9.5 percent of their income, on average, for child care. Families living below the poverty line, with children under 5, however, pay about 25 percent for child care. Compared to these national numbers, it is evident that parents in many of these communities are spending a substantially larger share of their income on child care than parents nationally.
Recommendations:
The supply of licensed or regulated child care within the 13 communities analyzed falls far short of meeting the demand. The supply that is available is not affordable for many of the families given the large percentage of working poor families with young children. With so many families with young children lacking access to quality child care, which the science shows can significantly improve the likelihood of future school success, it is time to connect the dots between the earliest learning environments, in which children spend so much time, and later school performance.
NACCRRA calls on policy-makers to:
Expand the Supply of Licensed or Regulated Child Care:
u Offer tax credits to child care providers to build or expand upon the supply of child care available to families with young children.
u Offer tax credits to child care providers to underwrite the cost of care to make child care more affordable for families with young children. (Even with an expanded supply, families cannot access care if they can’t afford the cost).
u Offer grants to communities to partner with nonprofit organizations to build or expand the supply of child care, and to underwrite operating costs of child care centers and family child care homes. This will expand access for families with young children.
*The number of children under 6 living in married couple families where both parents are in the labor force, and the number of children under 6 living in single parent families, where the parent is in the labor force, were combined to calculate the number of children requiring child care.

Page �
u Increase subsidies (both the overall amount of funding available for subsidies and the monthly subsidy amount) for working poor families so that they can afford licensed or regulated child care.
Strengthen the Quality of Available Child Care:
u Offer tax credits to invest in equipment and materials to promote early learning (e.g., books and classroom materials, playground equipment, etc.).
u Offer tax credits and grants to assist child care providers to become accredited (i.e., licensed or regulated care is a minimum standard; accreditation is a higher standard).
u Provide grants for community training systems through the CCR&Rs to ensure that all providers are trained in early childhood core competencies to promote age-appropriate child development.
u Provide grants to communities to develop innovative training initiatives to reach informal care providers to promote early learning.
Page �
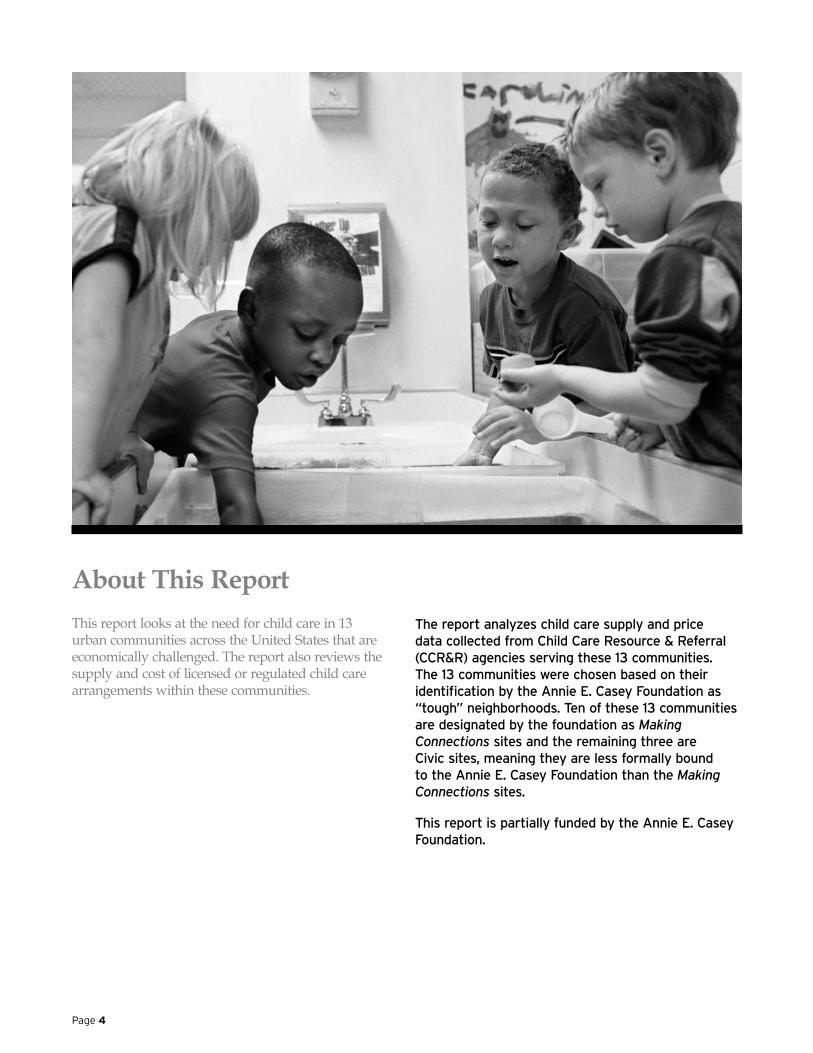
This report looks at the need for child care in 13 urban communities across the United States that are economically challenged. The report also reviews the supply and cost of licensed or regulated child care arrangements within these communities.
The report analyzes child care supply and price data collected from Child Care Resource & Referral (CCR&R) agencies serving these 13 communities. The 13 communities were chosen based on their identification by the Annie E. Casey Foundation as “tough” neighborhoods. Ten of these 13 communities are designated by the foundation as Making Connections sites and the remaining three are Civic sites, meaning they are less formally bound to the Annie E. Casey Foundation than the Making Connections sites.
This report is partially funded by the Annie E. Casey Foundation.
About This Report

Page �
The National Association of Child Care Resource & Referral Agencies (NACCRRA) works with over 800 CCR&Rs throughout the country to help parents access quality child care and to strengthen the quality of child care within communities. NACCRRA designed a survey for local CCR&Rs to collect data about the supply and price of child care within 13 communities identified by the Annie E. Casey Foundation facing challenges related to poverty.
Local CCR&Rs collected data about licensed or regulated child care as meeting a bare minimum quality threshold set by each state – NACCRRA considers these requirements to be the minimum level of quality care. Access to quality care is critical for children from low income families given the research that shows that quality child care has the greatest impact on this set of children.
NACCRRA first wanted to examine whether there was a sufficient supply of licensed or regulated child care to meet the demand within these communities for families with young children. Because access is related to cost, NACCRRA also looked at the price of child care related to income. Finally, based on the findings within this report, NACCRRA made several recommendations to expand access to quality care within the 13 communities.
Introduction
Page �
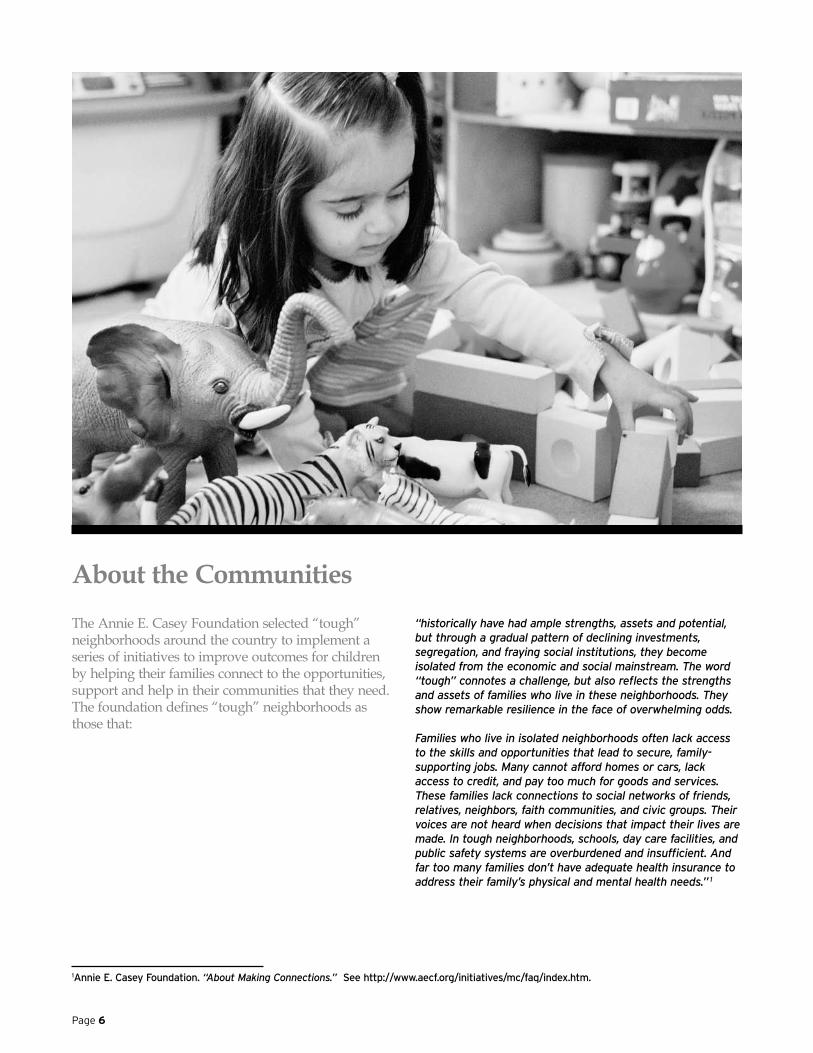
The Annie E. Casey Foundation selected “tough” neighborhoods around the country to implement a series of initiatives to improve outcomes for children by helping their families connect to the opportunities, support and help in their communities that they need. The foundation defines “tough” neighborhoods as those that:
“historically have had ample strengths, assets and potential, but through a gradual pattern of declining investments, segregation, and fraying social institutions, they become isolated from the economic and social mainstream. The word “tough” connotes a challenge, but also reflects the strengths and assets of families who live in these neighborhoods. They show remarkable resilience in the face of overwhelming odds.
Families who live in isolated neighborhoods often lack access to the skills and opportunities that lead to secure, family-supporting jobs. Many cannot afford homes or cars, lack access to credit, and pay too much for goods and services. These families lack connections to social networks of friends, relatives, neighbors, faith communities, and civic groups. Their voices are not heard when decisions that impact their lives are made. In tough neighborhoods, schools, day care facilities, and public safety systems are overburdened and insufficient. And far too many families don’t have adequate health insurance to address their family’s physical and mental health needs.” 1
1Annie E. Casey Foundation. “About Making Connections.” See http://www.aecf.org/initiatives/mc/faq/index.htm.
About the Communities

Page �
Table 1: The Making Connections Communities
Cities Zip Code
Atlanta, GA 30310
30312
30315
Baltimore, MD 21205
21213
21217
Denver, CO 80204
80205
80223
Des Moines, IA 50311
50314
50316
Hartford, CT 06105
06106
06112
06120
06510
Indianapolis, IN 46203
46218
Table 1: The Making Connections Communities
Cities Zip Code
Louisville, KY 40202
40203
40204
40210
Milwaukee, WI 53208
53210
New Haven, CT 06510
06511
06513
06515
06519
Oakland, CA 94606
Providence, RI 02903
02905
02907
02909
San Antonio, TX 78207
78228
78237
Seattle, WA 98146
98168
Among all the challenges families in these communities face, key among them is the necessity for parents of young children to find reliable, quality child care that they can afford so that they can work and their children can be in an environment in which they can be safe and learn.
Using data maintained by local CCR&Rs, NACCRRA assessed whether or not the supply and cost of licensed or regulated child care in these communities matched the need for child care. The communities, known as Making Connections communities, are defined by zip code boundaries and they are as follows (see Table 1):
Note: These zip codes are larger than the Making Connections areas. But as data were only available at the zip code level, the entire zip code was included for the purposes of this study.

Page �
The data collected from CCR&Rs documents the supply of licensed or regulated (licensed or license-exempt) child care in these communities. A much more extensive survey would be necessary to track the type of child care actually used by children in these communities. What is known from Census Bureau data is that children of working mothers spend, on average, 36 hours each week in some type of child care setting. And, families with young children living in poverty tend to rely more heavily on informal care. Whether or not this is a preference or the only option available remains unclear.
According to the Census Bureau, families in poverty with an employed mother rely to a much greater extent on grandparents and fathers (about 29 percent each) than on child care centers (14 percent) or family child care homes (7 percent) for children under 52. About one-quarter (24.2 percent) of children under 6 living in poverty are in multiple child care arrangements every week3. It is unclear whether this is related to supply, work schedule (nontraditional hours or shift work), price, or access to other part-time programs such as Head Start.
Quality Care Matters for Children in Low Income Families
The quality of child care matters for all children, but it is particularly important for children from low-income families where the research shows quality care has the greatest impact. Higher levels
Child Care Arrangements for Children
2Who’s Minding the Kids? Child Care Arrangements: Winter 2002, Census Bureau October 2005.3Ibid.
Page �
the quality of care within child care settings in which children spend so many hours every week. This is a critical time for development that is related to a child’s ability to start school ready to succeed.
Families with Children in These Communities
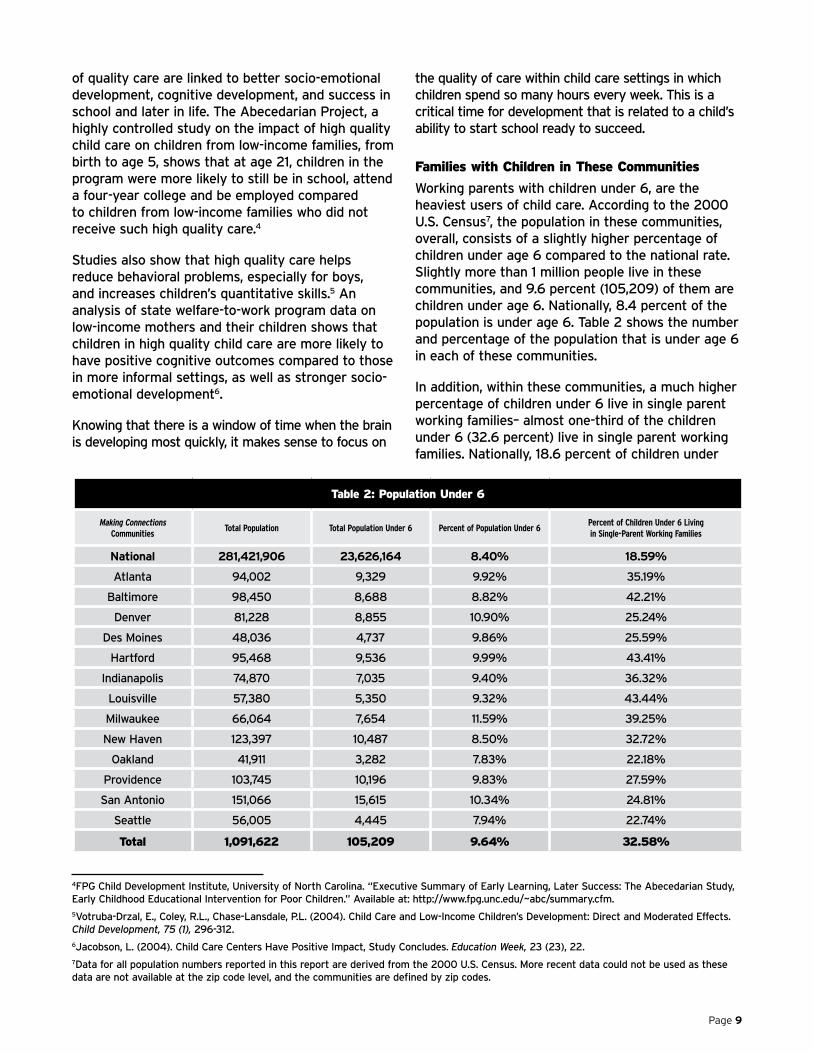
Working parents with children under 6, are the heaviest users of child care. According to the 2000 U.S. Census7, the population in these communities, overall, consists of a slightly higher percentage of children under age 6 compared to the national rate. Slightly more than 1 million people live in these communities, and 9.6 percent (105,209) of them are children under age 6. Nationally, 8.4 percent of the population is under age 6. Table 2 shows the number and percentage of the population that is under age 6 in each of these communities.
In addition, within these communities, a much higher percentage of children under 6 live in single parent working families– almost one-third of the children under 6 (32.6 percent) live in single parent working families. Nationally, 18.6 percent of children under
4FPG Child Development Institute, University of North Carolina. “Executive Summary of Early Learning, Later Success: The Abecedarian Study, Early Childhood Educational Intervention for Poor Children.” Available at: http://www.fpg.unc.edu/~abc/summary.cfm.5Votruba-Drzal, E., Coley, R.L., Chase-Lansdale, P.L. (2004). Child Care and Low-Income Children’s Development: Direct and Moderated Effects. Child Development, 75 (1), 296-312. 6Jacobson, L. (2004). Child Care Centers Have Positive Impact, Study Concludes. Education Week, 23 (23), 22.7Data for all population numbers reported in this report are derived from the 2000 U.S. Census. More recent data could not be used as these data are not available at the zip code level, and the communities are defined by zip codes.
of quality care are linked to better socio-emotional development, cognitive development, and success in school and later in life. The Abecedarian Project, a highly controlled study on the impact of high quality child care on children from low-income families, from birth to age 5, shows that at age 21, children in the program were more likely to still be in school, attend a four-year college and be employed compared to children from low-income families who did not receive such high quality care.4
Studies also show that high quality care helps reduce behavioral problems, especially for boys, and increases children’s quantitative skills.5 An analysis of state welfare-to-work program data on low-income mothers and their children shows that children in high quality child care are more likely to have positive cognitive outcomes compared to those in more informal settings, as well as stronger socio-emotional development6.
Knowing that there is a window of time when the brain is developing most quickly, it makes sense to focus on
Table 2: Population Under 6
Making Connections Communities
Total Population Total Population Under 6 Percent of Population Under 6Percent of Children Under 6 Living in Single-Parent Working Families
National ���,���,�0� ��,���,��� �.�0% ��.��%
Atlanta 94,002 9,329 9.92% 35.19%
Baltimore 98,450 8,688 8.82% 42.21%
Denver 81,228 8,855 10.90% 25.24%
Des Moines 48,036 4,737 9.86% 25.59%
Hartford 95,468 9,536 9.99% 43.41%
Indianapolis 74,870 7,035 9.40% 36.32%
Louisville 57,380 5,350 9.32% 43.44%
Milwaukee 66,064 7,654 11.59% 39.25%
New Haven 123,397 10,487 8.50% 32.72%
Oakland 41,911 3,282 7.83% 22.18%
Providence 103,745 10,196 9.83% 27.59%
San Antonio 151,066 15,615 10.34% 24.81%
Seattle 56,005 4,445 7.94% 22.74%
Total 1,091,622 105,209 9.64% 32.58%

Page �0
6 live in such families (see Table 2). These children are most likely to need child care, since their single parents are the sole household providers. In some of the communities, more than four in 10 children live in single parent working families.
Given the higher percentage of single-parent families in these communities, it is not surprising that a higher percentage of families with children under 5 live at or below the poverty line, as single-income families usually have lower earning potential than dual-income families. Almost one-quarter of the families (24.3 percent) living in these communities are at or below the poverty level, compared to 9.2 percent nationally (see Table 3). The data also show that married-couple families with children under 5 are twice as likely to be at or below the poverty level, while single-parent families with children under 5 are four times as likely to be at or below the poverty level within these communities compared to families nationally (see Table 3).
Nationally, one-quarter of families (25.3 percent) living at or below the poverty line have children
under 5. Within these communities, however, 44.4 percent of families at or below the poverty line have children under 5 (see Table 3). In some communities more than half the families with children under 5 are living at or below the poverty level. Thus, not only do these communities have a higher percentage of families living at or below the poverty level, but more of these families have children under 5.
The Need for Child Care Within These Communities
Slightly more than half the children under 6 living in these communities need child care,8 with these children most likely to be living in single-parent working families. Based on 2000 Census data, 52,878 children under 6 (50.3 percent of all children under 6) potentially need child care in these communities. Nationally, about 12.8 million children under 6 (54.1 percent) need child care (see Table 4). While the overall rate of children under 6 needing child care is slightly lower than the national rate (based on the percentage of families with young children who are working), in six of the 13 communities the percentage of children requiring
Table 3: Families At Or Below Poverty Level
Making Connections Communities
Total FamiliesTotal Families in
PovertyPercent of
Families in Poverty
Percent of Married-Couple Families With
Children Under 5 in Poverty (based
on all families)
Percent of Single Parent Families With Children
Under 5 in Poverty (based on all
families)
Total Number of Families
With Children Under 5 in Poverty
Percent of Families in Poverty
With Children Under 5 (based on
all families)
Percent of Families in Poverty
With Children Under 5 (based on families in
poverty)
National 72,261,780 6,620,945 9.16% 0.08% 2.23% 1,675,302 2.3% 25.30%
Atlanta 19,834 6,467 32.61% 2.08% 12.87% 2,965 12.87% 45.85%
Baltimore 22,768 6,412 28.16% 1.05% 9.21% 2,337 9.21% 36.45%
Denver 16,891 3,654 21.63% 4.38% 6.81% 1,889 6.81% 51.70%
Des Moines 10,527 1,454 13.81% 2.95% 5.11% 849 5.11% 58.39%
Hartford 21,223 6,201 29.22% 1.41% 10.55% 2,539 10.55% 40.95%
Indianapolis 19,045 3,461 18.17% 0.96% 6.00% 1,325 6.00% 38.28%
Louisville 12,160 3,793 31.19% 1.01% 14.06% 1,833 14.06% 48.33%
Milwaukee 14,673 3,809 25.96% 1.50% 11.73% 1,941 11.73% 50.96%
New Haven 26,286 5,307 20.19% 1.60% 7.27% 2,331 7.27% 43.92%
Oakland 8,708 1,900 21.82% 3.46% 3.92% 642 3.92% 33.79%
Providence 22,490 6,244 27.76% 2.75% 9.83% 2,828 9.83% 45.29%
San Antonio
34,449 9,107 26.44% 5.12% 7.23% 4,256 7.23% 46.73%
Seattle 13,647 1,091 7.99% 1.32% 1.85% 432 1.85% 39.60%
Total 242,701 58,900 24.27% 2.39% 8.39% 26,167 10.78% 44.43%
8The number of children under 6 living in married couple families where both parents are in the labor force, and the number of children under 6 living in single parent families, where the parent is in the labor force, were combined to calculate the number of children requiring child care.
Page ��
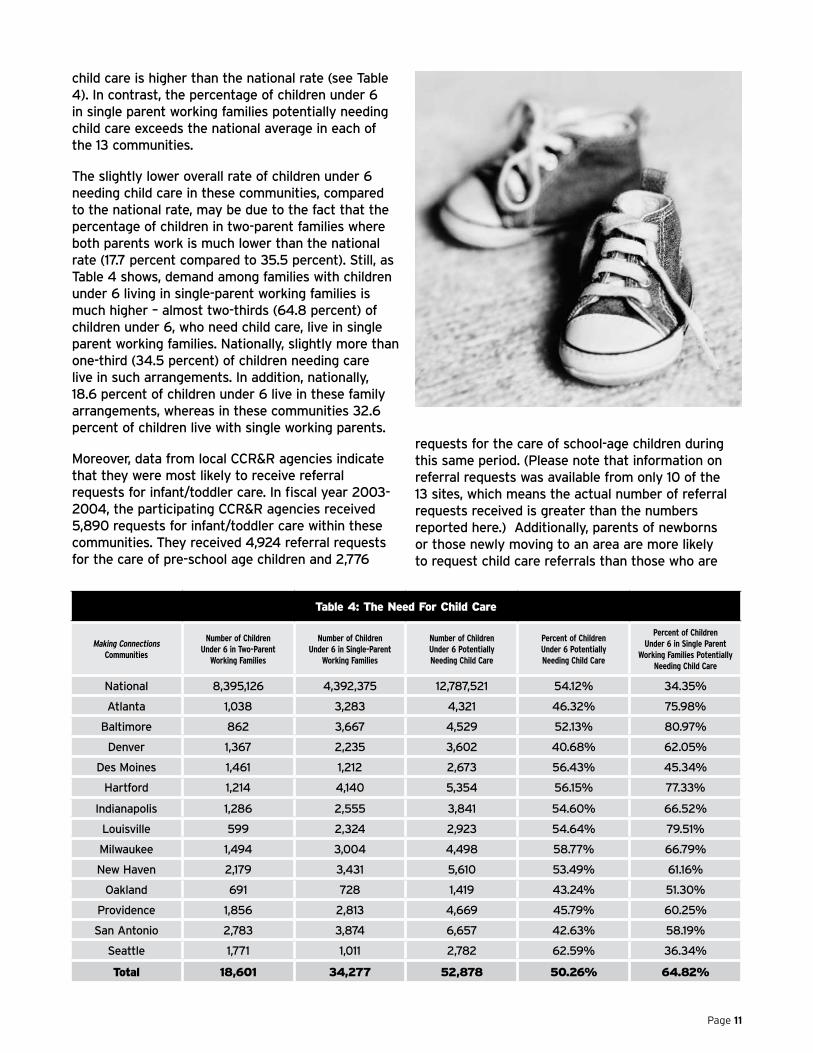
child care is higher than the national rate (see Table 4). In contrast, the percentage of children under 6 in single parent working families potentially needing child care exceeds the national average in each of the 13 communities.
The slightly lower overall rate of children under 6 needing child care in these communities, compared to the national rate, may be due to the fact that the percentage of children in two-parent families where both parents work is much lower than the national rate (17.7 percent compared to 35.5 percent). Still, as Table 4 shows, demand among families with children under 6 living in single-parent working families is much higher – almost two-thirds (64.8 percent) of children under 6, who need child care, live in single parent working families. Nationally, slightly more than one-third (34.5 percent) of children needing care live in such arrangements. In addition, nationally, 18.6 percent of children under 6 live in these family arrangements, whereas in these communities 32.6 percent of children live with single working parents.
Moreover, data from local CCR&R agencies indicate that they were most likely to receive referral requests for infant/toddler care. In fiscal year 2003-2004, the participating CCR&R agencies received 5,890 requests for infant/toddler care within these communities. They received 4,924 referral requests for the care of pre-school age children and 2,776
Table 4: The Need For Child Care
Making Connections Communities
Number of Children Under 6 in Two-Parent
Working Families
Number of Children Under 6 in Single-Parent
Working Families
Number of Children Under 6 Potentially Needing Child Care
Percent of Children Under 6 Potentially Needing Child Care
Percent of Children Under 6 in Single Parent
Working Families Potentially Needing Child Care
National 8,395,126 4,392,375 12,787,521 54.12% 34.35%
Atlanta 1,038 3,283 4,321 46.32% 75.98%
Baltimore 862 3,667 4,529 52.13% 80.97%
Denver 1,367 2,235 3,602 40.68% 62.05%
Des Moines 1,461 1,212 2,673 56.43% 45.34%
Hartford 1,214 4,140 5,354 56.15% 77.33%
Indianapolis 1,286 2,555 3,841 54.60% 66.52%
Louisville 599 2,324 2,923 54.64% 79.51%
Milwaukee 1,494 3,004 4,498 58.77% 66.79%
New Haven 2,179 3,431 5,610 53.49% 61.16%
Oakland 691 728 1,419 43.24% 51.30%
Providence 1,856 2,813 4,669 45.79% 60.25%
San Antonio 2,783 3,874 6,657 42.63% 58.19%
Seattle 1,771 1,011 2,782 62.59% 36.34%
Total 18,601 34,277 52,878 50.26% 64.82%
requests for the care of school-age children during this same period. (Please note that information on referral requests was available from only 10 of the 13 sites, which means the actual number of referral requests received is greater than the numbers reported here.) Additionally, parents of newborns or those newly moving to an area are more likely to request child care referrals than those who are

Page ��
longer-term residents of the area or who have more than one child. This means that the number of referral requests received does not give the complete picture of the actual demand for child care in these communities (see Table 5).
Available data also show that more than seven in 10 referral requests received are for full-time care (see Table 6), which indicates that parents in these communities need child care in order to work.
Table 6: Referral Requests By Hours Of Care
Making Connections CommunitiesNumber of Referral Requests
for Full-Time CareNumber of Referral Requests
for Part-Time CareNumber of Referral Requests for
Non-Traditional Hours Care
Atlanta 1,086 55 235
Baltimore 781 428 100
Denver 655 44 20
Des Moines Not reported Not reported Not reported
Hartford Not reported Not reported Not reported
Indianapolis Not reported Not reported Not reported
Louisville Not reported Not reported Not reported
Milwaukee 195 55 24
New Haven Not reported Not reported Not reported
Oakland 85 99 29
Providence 301 3 17
San Antonio 262 31 3
Seattle 246 190 49
Total 3,611 905 477
Percent of all requests 72.32% 18.13% 9.55%
Table 5: Referral Requests for Care By Child’s Age and Needs
Making Connections Communities
Number of Referral Requests for Infant/Toddler Care
Number of Referral Requests for Pre-School Care
Number of Referral Requests for School-Age Care*
Number of Referral Requests for Care for Children With
Special Needs
Number of Referral Requests for Before
and After School Care
Atlanta 468 282 299 20 72
Baltimore 383 448 249 56 164
Denver 271 218 171 11 38
Des Moines Not reported Not reported Not reported Not reported Not reported
Hartford Not reported Not reported Not reported Not reported Not reported
Indianapolis 3,430 3,184 1,468 1,372 174
Louisville 634 392 340 23 136
Milwaukee 103 57 69 23 22
New Haven Not reported Not reported Not reported Not reported Not reported
Oakland 106 61 31 3 14
Providence 180 103 62 17 30
San Antonio 149 54 22 98 19
Seattle 166 125 65 2 44
Total 5,890 4,924 2,776 1,625 713
* Includes request for summer and other holiday care.

Page ��

Page ��
CCR&Rs collected data about the supply of licensed or regulated child care within communities. The supply of licensed or regulated child care for children under 6 was about half (52 percent) of the potential demand for child care within these communities. Available data show that nearly half (47.8 percent) of children under 6, who need child care, have no access to licensed or regulated child care (see Table 7), due to the lack of supply.
Supply
In all, except for communities in two cities in the study, from about one-third (�� percent) to over three-quarters (�� percent) of children under � of working parents had no access to licensed or regulated child care. In Des Moines and Louisville, the potential demand is only slightly lower than the supply, with 8 percent and 13 percent more supply, respectively. (It should be noted that the Making Connections areas in both Des Moines and Louisville are near downtown business districts, and are likely serving more than just the area children. In fact, the data show that most of the parents using child care in the Louisville ZIP codes are actually commuters into the area and not residents). In the one Des Moines ZIP code, where supply exceeds the potential demand, almost eight in 10 spaces are in family child care home settings, and the supply of this type of care is high in the area, probably partly due to the less restrictive regulations9 these providers are required to meet. Overall, more than
Licensed/Regulated Child Care
9Iowa allows 6 children to be cared for in a family child care home before requiring state regulation.

Page ��
one-quarter of the spaces (28.8 percent) available to children under 6 in these communities are in family child care home settings.
While the supply of licensed or regulated child care for children under 6 is far less in almost all these communities than the potential demand, 60.7 percent of all licensed or regulated child care spaces available in these communities are spaces for infant/toddlers and pre-school children (i.e., children under 6). This indicates that even though the majority of licensed or regulated spaces in these communities are for children under 6, the supply is still not adequate to serve all children in that age group who might require care.
Overall, these communities are served by 382 licensed or regulated centers, which have a total of 26,691 spaces; and 2,055 licensed or regulated family child care homes, which have a total of 12,679 spaces, for a total of 39,370 spaces. These spaces include slots for children of all age groups. As Census data show, the number of children under 6, who potentially need care, which is 52,878 (see
Table 3), is far greater than the number of licensed or regulated spaces available for children of all ages who require child care.
Price of Child Care
The scarcity in child care spaces can lead to high prices. In some situations, parents in these communities pay as much as 70 percent of their income for full-time child care for an infant or toddler, and some of them pay more than two-thirds of their income for the full-time care of a pre-school age child. For parents living at or below the poverty level, the percent of their income they would pay for licensed or regulated full-time care of a child under 6 is even higher. Therefore, even if there were an adequate supply of child care in these communities, at those price levels, most parents still would not be able to access this care, as they would not be able to afford it. It should also be noted that many of these communities are near downtown areas. So, in many of these communities the available licensed or regulated child care is serving the children of parents commuting to work rather than children who live in
10The number of children under 6 potentially needing child care (45,775) reflected in this table excludes Atlanta and Seattle because supply information was not reported.
Table 7: Supply of Licensed/Regulated Child Care For Children Under 6
Making Connections Communities
Number of Total Child Care Spaces
Number of Total Spaces for
Infant/Toddlers
Number of Total Spaces for Pre-
School Age Children
Number of Total Spaces for Children
Under 6
Number of Children Under 6 Potentially Needing Child Care*
Gap in Supply of Child Care for
Children Under 6**
Percent Gap in Supply of Child Care for Children
Under 6**
Atlanta 2787 Not reported Not reported Not reported 4321 Cannot be computed
Cannot be computed
Baltimore 2343 476 1803 2279 4529 -2250 -49.7%
Denver 2419 536 1084 1620 3602 -1982 -55.0%
Des Moines 3184 1177 1721 2898 2673 225 8.4%
Hartford 3221 748 1761 2509 5354 -2845 -53.1%
Indianapolis 1551 172 711 883 3841 -2958 -77.0%
Louisville 4283 1358 1947 3305 2923 382 13.1%
Milwaukee 4506 916 1806 2722 4498 -1776 -39.5%
New Haven 2820 626 1668 2294 5610 -3316 -59.1%
Oakland 1147 63 912 975 1419 -444 -31.3%
Providence 6816 969 978 1947 4669 -2722 -58.3%
San Antonio 3082 1143 1330 2473 6657 -4184 -62.9%
Seattle 1211 Not reported Not reported Not reported 2782Cannot be computed
Cannot be computed
Total 39,370 8,184 15,721 23,905 45,77510 -21,870 -47.77%
* Excludes areas (Atlanta and Seattle) where information on the number of spaces by age group was unavailable.
** Negative numbers and percents mean there are fewer spaces than the number of children. Positive numbers and percents mean there are more spaces than the number of children.

Page ��
Table 8: Average Price of Infant/Toddler Care in Unaccredited Licensed/Regulated Setting
Making Connections Communities
Zip Code Median Family IncomeAverage Price of Infant/Toddler Care in a Center
Percent of Median Income Spent on Infant/Toddler
Care in a Center
Average Price of Infant/Toddler Care in a Family
Child Care Home
Percent of Median Income Spent on Infant/Toddler Care in a Family Child Care Home
Atlanta 30310 $27,262.00 $5,543.72 20.33% $5,013.32 18.39%
Atlanta 30312 $19,680.00 $5,720.00 29.07% $7,280.00 36.99%
Atlanta 30315 $21,192.00 $5,374.46 25.36% $8,008.00 37.79%
Baltimore 21205 $23,336.00 $6,500.00 27.85% $6,707.00 28.74%
Baltimore 21213 $30,258.00 $7,524.00 24.87% $6,977.00 23.06%
Baltimore 21217 $24,042.00 $9,247.00 38.46% $7,090.00 29.49%
Denver 80204 $29,808.00 $10,400.00 34.89% $7,228.00 24.25%
Denver 80205 $30,683.00 $11,203.40 36.51% $7,228.00 23.56%
Denver 80223 $37,456.00 $8,580.00 22.91% $7,020.00 18.74%
Des Moines 50311 $50,576.00 $7,800.00 15.42% $6,318.00 12.49%
Des Moines 50314 $26,582.00 $7,800.00 29.34% $5,408.00 20.34%
Des Moines 50316 $37,268.00 $6,812.00 18.28% $5,876.00 15.77%
Hartford 06105 $25,582.00 $9,828.00 38.42% $7,948.72 31.07%
Hartford 06106 $26,335.00 Not reported Not reported $7,035.60 26.72%
Hartford 06112 $31,442.00 Not reported Not reported $7,215.00 22.95%
Hartford 06120 $18,760.00 Not reported Not reported $7,202.00 38.39%
Hartford 06510 $29,063.00 $11,960.00 41.15% $7,800.00 26.84%
Indianapolis 46203 $35,122 $9,490 27.02% $5,157.00 14.68
Indianapolis 46218 $30,630 $9,490 30.98% $5,801.64 18.94%
Louisville 40202 $8,510.00 $5,980.00 70.27% Not reported Not reported
Louisville 40203 $16,564.00 $6,460.00 39.00% $5,580.00 33.69%
these communities. This may be why the price of child care in these communities is so high, especially compared to the income of the people living there.
Median income within these communities, on average, ranges from $8,510 in Louisville, KY to $50,576 in Des Moines, IA, according to the 2000 Census. The percent of families with children under 5 (based on total families) living at or below the poverty level ranges from 15.1 percent in Louisville to 3.2 percent in Seattle. Within the communities in Atlanta (14.9 percent), Milwaukee (13.2 percent), Providence (12.6 percent), San Antonio (12.3 percent), Hartford (12 percent), and Denver (11.2 percent), the poverty rates are particularly high. Overall, 10.8 percent of all families are families with children under 5 living at or below poverty in these communities, whereas nationally 2.3 percent of families with children under 5 are at or below poverty. See Table 3 for details.
Given that the median income in most of these communities is below $30,000, the price of child care,
especially for infant/toddlers, can be prohibitive. The price for the full-time care of an infant/toddler in an unaccredited center ranges from $5,304 in parts of the community in San Antonio, TX to $11,960 in New Haven, CT, as Table 8 shows. As a percentage of median income, parents with an infant/toddler can pay between 15.4 percent and 70.3 percent for full-time care in an unaccredited licensed or regulated center. Overall, on average, parents of infant/toddlers pay almost $3 for every $10 they earn for full-time child care in an unaccredited center. The price of accredited care is even higher (largely because the cost of accredited care requires a lower ratio of children to caregivers, which improves the quality of care but makes child care settings more expensive to operate).
In an unaccredited licensed or regulated family child care home setting, they are paying slightly less: between $5,013 in part of the Atlanta, GA community to $9,308 in Milwaukee, WI. Parents still pay well over $2 for every $10 they earn for child care for an infant/toddler in an unaccredited licensed or regulated family child care home (see Table 8).

Page ��
* Averages have not been adjusted for differences in cost of living or other demographic or economic factors.
Table 8: Average Price of Infant/Toddler Care in Unaccredited Licensed/Regulated Setting
Making Connections Communities
Zip Code Median Family IncomeAverage Price of Infant/Toddler Care in a Center
Percent of Median Income Spent on Infant/Toddler
Care in a Center
Average Price of Infant/Toddler Care in a Family
Child Care Home
Percent of Median Income Spent on Infant/Toddler Care in a Family Child Care Home
Louisville 40204 $45,928.00 $7,193.00 15.66% Not reported Not reported
Louisville 40210 $25,563.00 $6,344.00 24.82% $5,308.00 20.76%
Milwaukee 53208 $28,518.00 Not reported Not reported Not reported Not reported
Milwaukee 53210 $33,397.00 $9,672.00 28.96% $9,308.00 27.87%
New Haven 06510 $29,063.00 $11,960.00 41.15% $7,800.00 26.84%
New Haven 06511 $37,642.00 $9,041.24 24.02% $7,664.80 20.36%
New Haven 06513 $37,197.00 $10,400.00 27.96% $7,845.24 21.09%
New Haven 06515 $46,056.00 $9,568.00 20.77% $8,320.00 18.06%
New Haven 06519 $26,811.00 Not reported Not reported $7,077.72 26.40%
Oakland 94606 $32,616.00 Not reported Not reported $8,632.00 26.47%
Providence 02903 $29,063.00 $9,360.00 32.21% $7,384.00 25.41%
Providence 02905 $37,943.00 $9,100.00 23.98% $7,592.00 20.01%
Providence 02907 $24,913.00 $9,568.00 38.41% Not reported Not reported
Providence 02909 $26,187.00 $9,776.00 37.33% $7,748.00 29.59%
San Antonio 78207 $22,901.00 $5,304.00 23.16% $5,538.52 24.18%
San Antonio 78228 $33,298.00 $5,894.00 17.70% $5,104.84 15.33%
San Antonio 78237 $26,389.00 Not reported Not reported Not reported Not reported
Seattle 98146 $52,691.00 $10,582.00 20.08% $8,498.00 16.13%
Seattle 98168 $46,099.00 $9,100.00 19.74% $8,320.00 18.05%
Total $30,560.65 $8,3441.66* 27.62%* $7,029.55* 23.0%*

Page ��
As Table 9 shows, the price for full-time care of a pre-school age child in an unaccredited licensed or regulated center varies from $4,188 in San Antonio, TX to $10,400 in Hartford, CT. Parents of a pre-school age child may pay as much as 63.6 percent of their salary for full-time child care in an unaccredited center. Prices in a licensed or regulated family child
care home setting are slightly lower, ranging from $4,467 in Atlanta, GA to $8,372 in Milwaukee, WI. But still, parents could be paying more than a fifth of their wages (21.7 percent) for the full-time child care of their pre-school age child in an unaccredited licensed or regulated family child care home.
Table 9: Average Price of Care for a Pre-School Age Child in Unaccredited Licensed/Regulated Setting
Making Connections Communities
Zip Code Median Family IncomeAverage Price of Child Care for a Pre-School Age Child
in a Center
Percent of Median Income Spent for Child Care
for a Pre-School Age Child in a Center
Average Price of Child Care for a Pre-School
Age Child in a Family Child Care Home
Percent of Median Income Spent on a Pre-School
Age Child in a Family Child Care Home
Atlanta 30310 $27,262.00 $4,880.20 17.90% $4,501.00 16.51%
Atlanta 30312 $19,680.00 $5,038.28 25.60% $7,280.00 36.99%
Atlanta 30315 $21,192.00 $4,716.92 22.26% $4,467.32 21.08%
Baltimore 21205 $23,336.00 $6,500.00 27.85% $5,284.00 22.64%
Baltimore 21213 $30,258.00 $5,402.00 17.85% $5,615.00 18.56%
Baltimore 21217 $24,042.00 $5,919.00 24.62% $5,745.00 23.90%
Denver 80204 $29,808.00 $8,372.00 28.09% $6,188.00 20.76%
Denver 80205 $30,683.00 $7,800.00 25.42% $6,500.00 21.18%
Denver 80223 $37,456.00 $8,580.00 22.91% $6,188.00 16.52%
Des Moines 50311 $50,576.00 $5,806.00 11.48% $5,902.00 11.67%
Des Moines 50314 $26,582.00 $6,760.00 25.43%
Des Moines 50316 $37,268.00 $5,876.00 15.77% $5,070.00 13.60%
Hartford 06105 $25,582.00 $8,060.00 31.51% $7,131.28 27.88%
Hartford 06106 $26,335.00 $6,416.28 24.36%
Hartford 06112 $31,442.00 $6,463.08 20.56%
Hartford 06120 $18,760.00 $6,380.40 34.01%
Hartford 06510 $29,063.00 $10,400.00 35.78% $7,280.00 25.05%
Indianapolis 46203 $35,122.00 $7,399.00 21.07% $4,680.00 13.32%
Indianapolis 46218 $30,630.00 $8,320.00 27.16% $5,024.24 16.40%
Louisville 40202 $8,510.00 $5,408.00 63.55%
Louisville 40203 $16,564.00 $5,675.00 34.26% $4,966.00 29.98%
Louisville 40204 $45,928.00 $5,876.00 12.79%
Louisville 40210 $25,563.00 $5,668.00 22.17% $4,893.00 19.14%
Milwaukee 53208 $28,518.00
Milwaukee 53210 $33,397.00 $8,736.00 26.16% $8,372.00 25.07%
New Haven 06510 $29,063.00 $10,400.00 35.78% $7,280.00 25.05%
New Haven 06511 $37,642.00 $7,559.24 20.08% $7,306.52 19.41%
New Haven 06513 $37,197.00 $7,930.00 21.32% $7,392.84 19.87%
New Haven 06515 $46,056.00 $9,568.00 20.77% $6,846.84 14.87%
New Haven 06519 $26,811.00 $6,500.00 24.24%
Oakland 94606 $32,616.00 $9,030.00 27.69% $7,696.00 23.60%
Providence 02903 $29,063.00 $6,803.16 23.41% $7,176.00 24.69%
Providence 02905 $37,943.00 $9,100.00 23.98% $7,696.00 20.28%

Page ��
Table 9: Average Price of Care for a Pre-School Age Child in Unaccredited Licensed/Regulated Setting
Making Connections Communities
Zip Code Median Family IncomeAverage Price of Child Care for a Pre-School Age Child
in a Center
Percent of Median Income Spent for Child Care
for a Pre-School Age Child in a Center
Average Price of Child Care for a Pre-School
Age Child in a Family Child Care Home
Percent of Median Income Spent on a Pre-School
Age Child in a Family Child Care Home
Providence 02907 $24,913.00
Providence 02909 $26,187.00 $8,424.00 32.17% $7,540.00 28.79%
San Antonio 78207 $22,901.00 $4,188.60 18.29% $4,708.60 20.56%
San Antonio 78228 $33,298.00 $5,139.68 15.44% $4,667.00 14.02%
San Antonio 78237 $26,389.00
Seattle 98146 $52,691.00 $7,410.00 14.06% $7,094.00 13.46%
Seattle 98168 $46,099.00 $6,916.00 15.00% $6,812.00 14.78%
Total $28,790.50 $7,030.39* 24.50%* $6,354.94* 21.66%*
* Averages have not been adjusted for differences in cost of living or other demographic or economic factors.
A recent report on child care from the U.S. Census Bureau shows that families in the U.S. with children under 5 pay 9.5 percent of their income, on average, for child care11. Families living below the poverty level, with children under 5, however, pay 25.1 percent, on average, for child care12. Compared to these national numbers, it is evident that parents in many of the Making Connections communities are spending a substantially larger share of their income on child care than parents nationally. In addition, these high prices do not necessarily ensure high quality child care, as licensing requirements can be minimal in many states, and in some cases programs can operate legally without being licensed.
Still, subsidies for child care can help parents finance care for their children while they work. In the seven communities for which subsidy data were available, parents of 10,389 children under 6 received at least some subsidy for child care. In these seven communities, potentially 27,966 children under 6 need child care and many of their parents earn wages that are at or below the poverty level (families with children under 5 account for 34 percent to 48 percent of all families at or below poverty within these seven communities). So, while the data are not conclusive, they seem to indicate that many children who may qualify for child care assistance are currently not receiving such support.
The Connection Between Early Learning and School Success
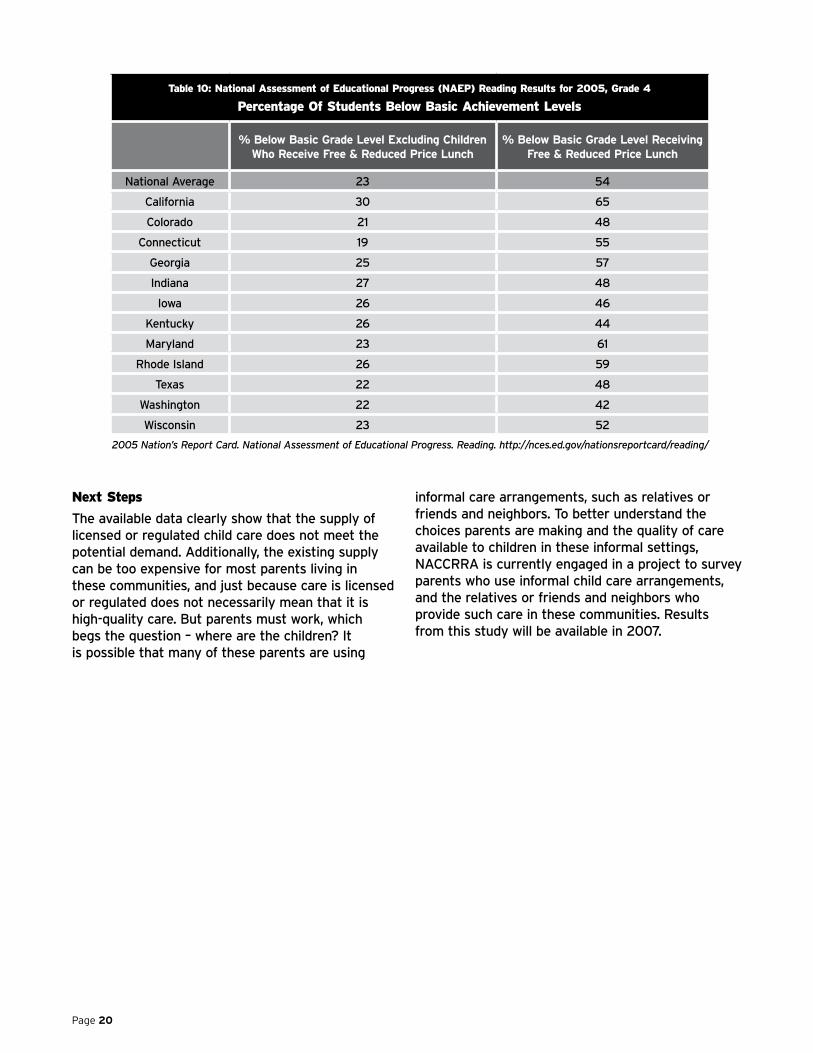
There has been much discussion both on the national level and among the states about the need to reduce the school readiness gap between children from economically disadvantaged backgrounds and their more well-off peers. The National Assessment of Educational Progress (NAEP) reading test given to 4th grade students reveals that far too many children fail to read at grade level. The NAEP results are clear that a much greater percentage of children living at or near the poverty line fail to read at grade level (score below NAEP’s basic achievement level) compared to the average child in 4th grade (which excludes children eligible for free or reduced price lunch). In fact, on average, children in low income families are more than twice as likely to read below grade level in 4th grade compared to their peers. (See Table 10).
The 4th grade reading results are a reflection of progress in the preceding elementary grades as well as a child’s basic readiness for school in kindergarten. This is why access to quality care before a child reaches the age of mandatory school attendance is so important.
11U.S. Census Bureau. “Who’s Minding the Kids? Child Care Arrangements: Winter 2002. October 200512Ibid.
Page �0
Table 10: National Assessment of Educational Progress (NAEP) Reading Results for 2005, Grade 4
Percentage Of Students Below Basic Achievement Levels
% Below Basic Grade Level Excluding Children Who Receive Free & Reduced Price Lunch
% Below Basic Grade Level Receiving Free & Reduced Price Lunch
National Average 23 54
California 30 65
Colorado 21 48
Connecticut 19 55
Georgia 25 57
Indiana 27 48
Iowa 26 46
Kentucky 26 44
Maryland 23 61
Rhode Island 26 59
Texas 22 48
Washington 22 42
Wisconsin 23 52
2005 Nation’s Report Card. National Assessment of Educational Progress. Reading. http://nces.ed.gov/nationsreportcard/reading/
Next Steps
The available data clearly show that the supply of licensed or regulated child care does not meet the potential demand. Additionally, the existing supply can be too expensive for most parents living in these communities, and just because care is licensed or regulated does not necessarily mean that it is high-quality care. But parents must work, which begs the question – where are the children? It is possible that many of these parents are using
informal care arrangements, such as relatives or friends and neighbors. To better understand the choices parents are making and the quality of care available to children in these informal settings, NACCRRA is currently engaged in a project to survey parents who use informal child care arrangements, and the relatives or friends and neighbors who provide such care in these communities. Results from this study will be available in 2007.

Page ��
It is clear that the supply of licensed or regulated child care falls far short of the demand within these communities. Even if the supply were adequate, the high price of such care is too expensive for many parents who live in these communities where a large percentage of families with young children live at or below the poverty line.
Research shows that 90 percent of brain development occurs during a child’s first 5 years of life and that access to quality care has the largest impact on children in low income families. Yet, most young children in low income families do not have access to licensed or regulated child care that meets minimum quality standards. With children of working mothers spending, on average, 36 hours a week in some type of child care setting, it is time to ensure that all children have access to quality, affordable child care, particularly children in low income families where the potential for improving later school success is the greatest. The National Assessment of Educational Progress (NAEP) 4th grade test scores clearly demonstrate the wide chasm between children of low income families and their peers in failing to read at grade level. The science argues to reach children earlier, even before they enter the public school system. It is time to connect the dots between the earliest learning environments in which children spend so much time and later school performance.
Conclusions and Recommendations

Page ��
NACCRRA calls on policy-makers to:
Expand the Supply of Licensed or Regulated Child Care:
u Offer tax credits to child care providers to build or expand upon the supply of child care available to families with young children.
u Offer tax credits to child care providers to underwrite the cost of care to make child care more affordable for families with young children. (Even with an expanded supply, families cannot access care if they can’t afford the cost).
u Offer grants to communities to partner with nonprofit organizations to build or expand the supply of child care, and to underwrite operating costs of child care centers and family child care homes. This will expand access for families with young children.
u Increase subsidies (both the overall amount of funding available for subsidies and the monthly subsidy amount) for working poor families so that they can afford licensed or regulated child care.
Strengthen the Quality of Available Child Care:
u Offer tax credits to invest in equipment and materials to promote early learning (e.g., books and classroom materials, playground equipment, etc).
u Offer tax credits and grants to assist child care providers to become accredited (i.e., licensed or regulated care is a minimum standard; accreditation is a higher standard).
u Provide grants for community training systems through the CCR&Rs to ensure that all providers are trained in early childhood core competencies to promote age-appropriate child development.
u Provide grants to communities to develop innovative training initiatives to reach informal care providers to promote early learning.

National Association of Child Care Resource & Referral Agencies 3101 Wilson Boulevard, Suite 350, Arlington, VA 22201
Phone (703) 341-4100 Fax (703) 341-4101 www.naccrra.org
13
8-0
62
1
Related Documents