PCWTA is a program of the Academy for Professional Excellence at San Diego State University School of Social Work in collaboration with our University partners, CSU San Bernardino, Loma Linda University and CSU Fullerton If you do not have speakers or a headset Dial 888-531-7584 to participate by teleconference Please mute your phone during the presentation (do not place on hold). If you have speakers or a headset (no microphone) You can call into the conference call phone line if you want to ask a question or make a comment. While on the teleconference line, please turn your computer speakers off to avoid an echo. You can also use the chat feature located in the lower right corner of the screen and type your question in the chat. Child and Family Services Review 3: Outcome Measure Performance & Accountability System Planning Webinar: November 3, 2015: 9:00 am – 11:00 am

Welcome message from author
This document is posted to help you gain knowledge. Please leave a comment to let me know what you think about it! Share it to your friends and learn new things together.
Transcript

PCWTA is a program of the Academy for Professional Excellence at San
Diego State University School of Social Work in collaboration with our
University partners, CSU San Bernardino, Loma Linda University and
CSU Fullerton
If you do not have speakers or a headset
Dial 888-531-7584 to participate by teleconference
Please mute your phone during the presentation (do not place on hold).
If you have speakers or a headset (no microphone)
You can call into the conference call phone line if you want to ask a question or make a
comment. While on the teleconference line, please turn your computer speakers off to
avoid an echo. You can also use the chat feature located in the lower right corner of the
screen and type your question in the chat.
Child and Family Services Review 3: Outcome Measure Performance & Accountability System Planning
Webinar: November 3, 2015: 9:00 am – 11:00 am

Dawn Schoonhoven Scott, MSW,
Program Director, PCWTA
Child and Family Services Review 3: Outcome Measure Performance & Accountability System Planning
Webinar: November 3, 2015: 9:00 am – 11:00 am

Child and Family Services Review 3: Outcome Measure Performance &
Accountability System Planning
Dave McDowell, PhD
Outcomes and Accountability Bureau California Department of Social Services
Daniel Webster, PhD
California Child Welfare Indicators Project (CCWIP) School of Social Welfare
University of California, Berkeley
The California Child Welfare Indicators Project (CCWIP) is a collaboration of the California Department of Social Services and the School of Social Welfare, University of California at Berkeley, and is supported by the
California Department of Social Services and the Stuart Foundation
CFSR ROUND THREE

Outcomes & Accountability Plans
• Introduction of New Measures by ACF (Administration for Children and Families)
– First introduced in October 2014
– Revised May 2015
• New Measures more closely resemble what we want to know and how practice works
– Placement Stability
– Maltreatment in Foster Care

Outcomes & Accountability Plans
• 2015 APSR (Annual Progress and Services Report) – First federally required document with the new measures
• CFSR (Child and Family Services Review)
– Statewide Assessment and APSR
– Onsite Review
– Program Improvement Plan

Outcomes & Accountability Plans
• AB 636 – Added Welfare and Institutions Code 10601.2 (WIC 10601.2)
– Removed Division 31 Compliance reviews
– Established the California Child and Family Services Review (C-CFSR) • Components of C-CFSR
– Requires that: • “Child and family service reviews shall maximize compliance with the federal
regulations…”
• “ The California Child and Family Service Review System outcome indicators shall be consistent with the federal child and family service review measures and standards for child and family outcomes and system factors…“

Outcomes & Accountability Plans
• Transition to Round 3 Measures – Draft ACL reviewed in July 2015
– Counties will be required to report on the new outcome measures in C-CFSR documents due to CDSS after October 1, 2015
– State Measures • Being re-visited to determine relevance and utility
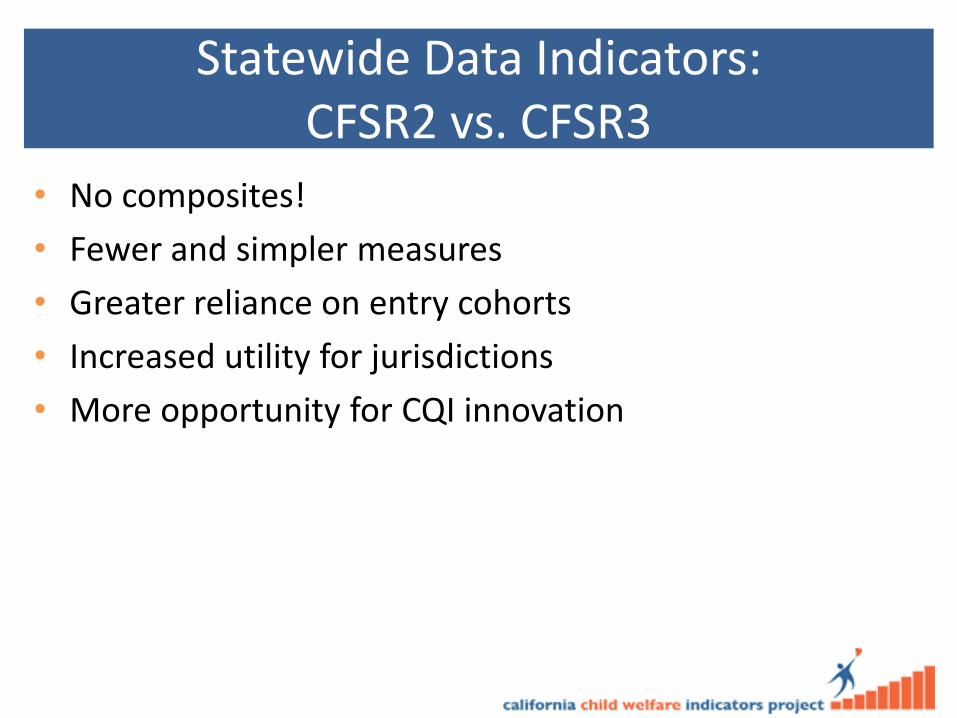
Statewide Data Indicators: CFSR2 vs. CFSR3
• No composites!
• Fewer and simpler measures
• Greater reliance on entry cohorts
• Increased utility for jurisdictions
• More opportunity for CQI innovation
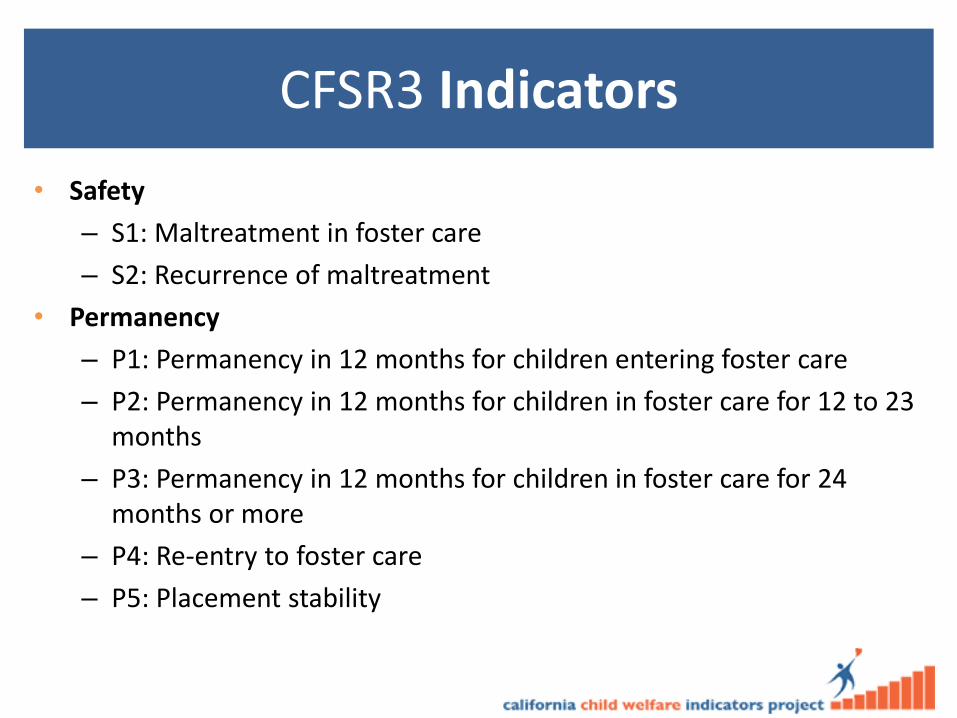
CFSR3 Indicators
• Safety
– S1: Maltreatment in foster care
– S2: Recurrence of maltreatment
• Permanency
– P1: Permanency in 12 months for children entering foster care
– P2: Permanency in 12 months for children in foster care for 12 to 23 months
– P3: Permanency in 12 months for children in foster care for 24 months or more
– P4: Re-entry to foster care
– P5: Placement stability

Methods
• Cohorts
– In foster care during the 12-month period (S1)
– Children who were victims of a substantiated report of maltreatment during the 12-month period (S2)
– Children entering care during the 12-month period (P1, P4, P5)
– In foster care on the first day of the year (P2, P3)
• Measures – Percent (S2, P1, P2, P3, P4)
– Count/rate per day of foster care (S1, P5)
• Accounts for time at risk for the outcome (maltreatment in care or placement moves) using the total number of days eligible children were in care

Companion Measures
Entry Cohort: Permanency in 12 months
Re-entries to Foster Care
• Using California as an example, in order to meet the PIP goal for P1, the state must:
– Increase the percentage of children achieving permanency to 39.0%
– Not allow the percentage of children re-entering care to exceed 10.7% (the threshold for Re-entry to care – P4)
• Conversely, to meet the PIP goal for P4, CA must reduce the percentage of children re-entering care to 8.1%, but cannot allow the percentage of children achieving permanency to decline further than 35.6%

National Standards
*Rate per 100,00 days in care **Rate per 1,000 days in care

California’s Performance
*Risk Standardized Performance
Sources
• CFSR Round 3 Statewide Data Indicators
– http://kt.cfsrportal.org/action.php?kt_path_info=ktcore.actions.document.view&fDocumentId=73607
• CFSR Technical Bulletin #7
– http://kt.cfsrportal.org/action.php?kt_path_info=ktcore.actions.document.view&fDocumentId=72431
• Federal Register Notice: Statewide Data Indicators and National Standards for Child and Family
Services Reviews
– https://federalregister.gov/a/2014-09001
– Final rule: http://www.gpo.gov/fdsys/pkg/FR-2014-10-10/pdf/2014-24204.pdf
• Sustaining the Momentum: The Next Round of Reviews
– http://kt.cfsrportal.org/action.php?kt_path_info=ktcore.actions.document.view&fDocumentId=72464
– Children's Bureau Plan for CFSR Statewide Data Indicators and National Standards
• http://kt.cfsrportal.org/action.php?kt_path_info=ktcore.actions.document.view&fDocumentId=72553
• For additional information: https://training.cfsrportal.org/resources/3044

California Data Trends

S1: Maltreatment in Foster Care
Of all children in foster care during a 12-month period, what is the rate of victimization per day of foster care?
• What’s changed?
– Rate of maltreatment per child days in foster care vs. percentage of children not maltreated in foster care
– Includes all maltreatment types by any perpetrator vs. just maltreatment by foster parents/facility staff
• Includes all days in foster care during the year (across episodes)
• Multiple incidents of substantiated maltreatment for the same child are included in the numerator
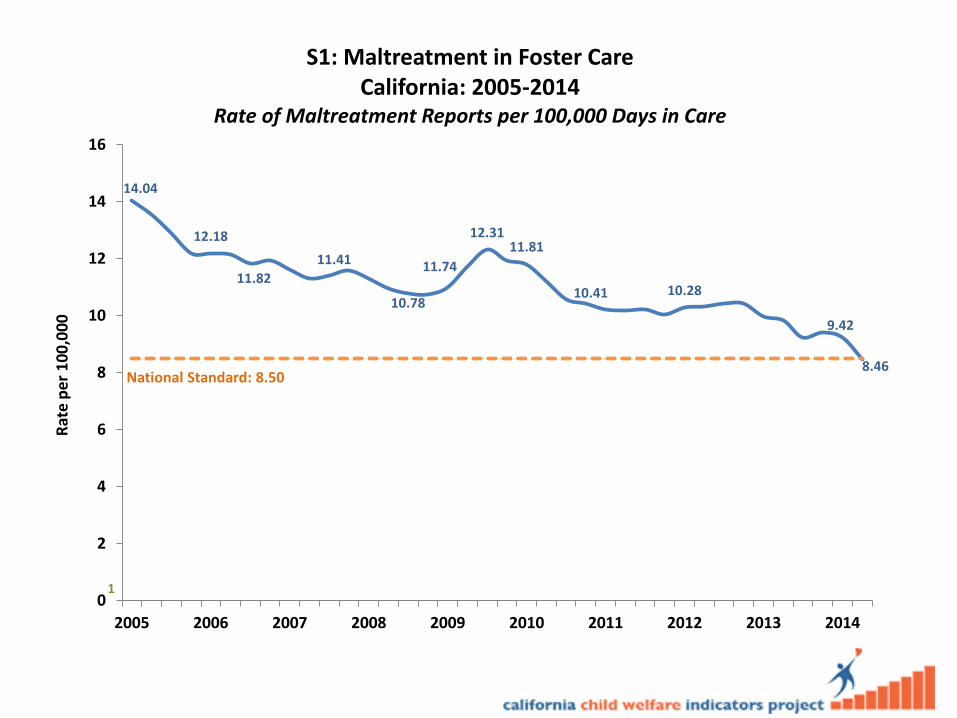
14.04
12.18
11.82
11.41
10.78
11.74
12.3111.81
10.41 10.28
9.42
8.46National Standard: 8.50
10
2
4
6
8
10
12
14
16
2005 2006 2007 2008 2009 2010 2011 2012 2013 2014
Rat
e p
er
10
0,0
00
S1: Maltreatment in Foster CareCalifornia: 2005-2014
Rate of Maltreatment Reports per 100,000 Days in Care
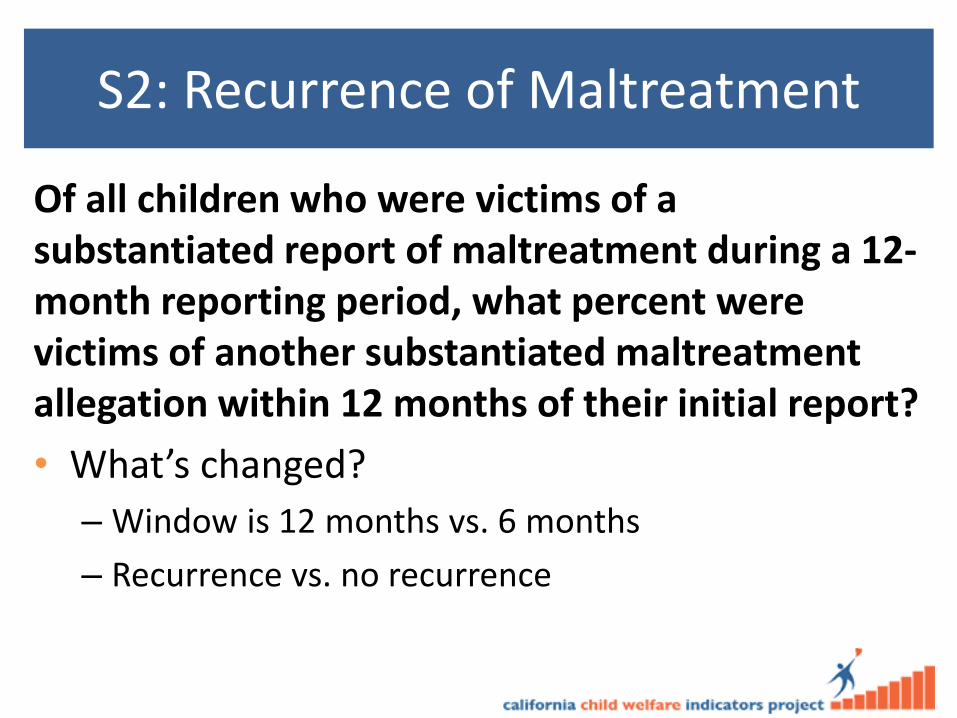
S2: Recurrence of Maltreatment
Of all children who were victims of a substantiated report of maltreatment during a 12-month reporting period, what percent were victims of another substantiated maltreatment allegation within 12 months of their initial report?
• What’s changed?
– Window is 12 months vs. 6 months
– Recurrence vs. no recurrence

11.7
10.910.6
9.9 10 1010.3
10.2
10.1
10.410.2
National Standard: 9.1%
0.0
2.0
4.0
6.0
8.0
10.0
12.0
14.0
2004 2005 2006 2007 2008 2009 2010 2011 2012 2013
Pe
rce
nt
S2: Recurrence of MaltreatmentCalifornia: 2004-2013
Percent of Children with Recurrence within 12 Months
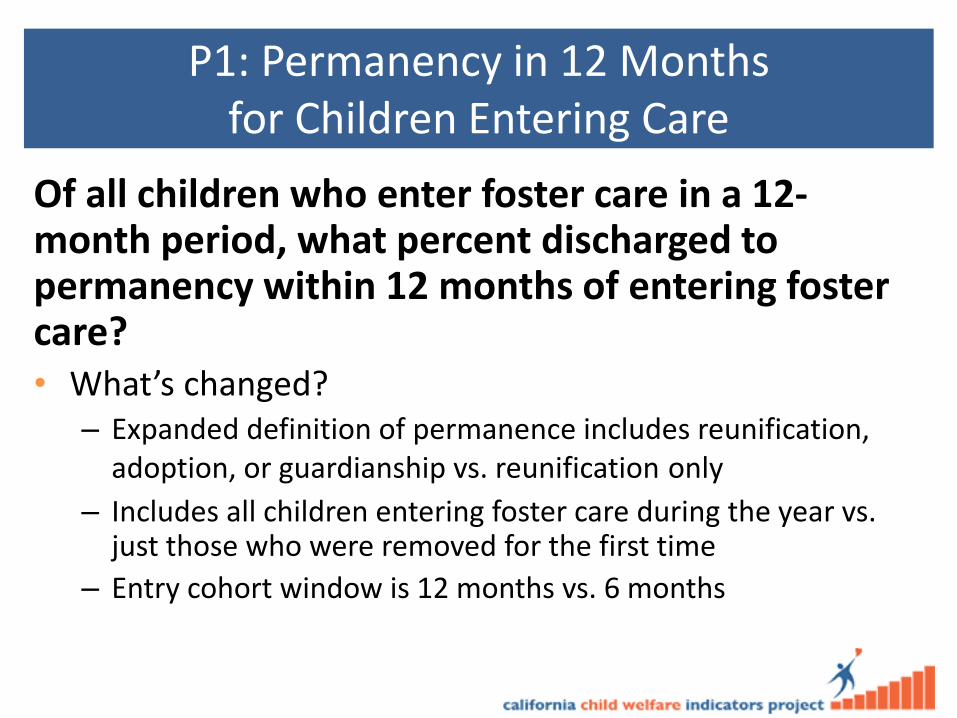
P1: Permanency in 12 Months for Children Entering Care
Of all children who enter foster care in a 12-month period, what percent discharged to permanency within 12 months of entering foster care? • What’s changed?
– Expanded definition of permanence includes reunification, adoption, or guardianship vs. reunification only
– Includes all children entering foster care during the year vs. just those who were removed for the first time
– Entry cohort window is 12 months vs. 6 months
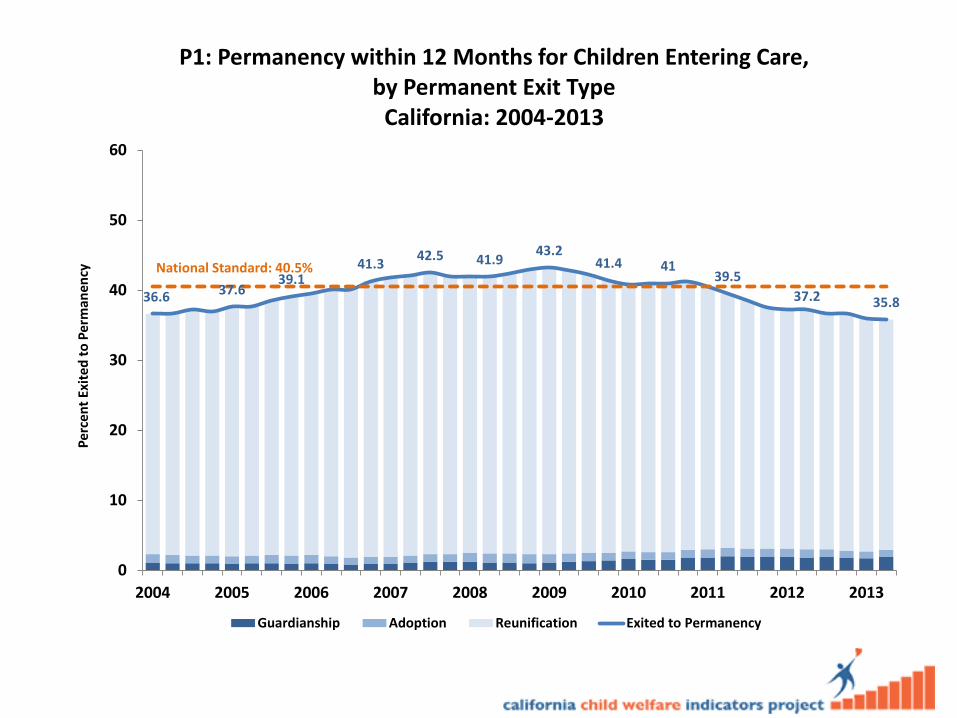
36.6 37.639.1
41.342.5 41.9
43.241.4 41
39.5
37.2 35.8
National Standard: 40.5%
0
10
20
30
40
50
60
2004 2005 2006 2007 2008 2009 2010 2011 2012 2013
Per
cen
t Ex
ited
to
Per
man
ency
P1: Permanency within 12 Months for Children Entering Care, by Permanent Exit Type
California: 2004-2013
Guardianship Adoption Reunification Exited to Permanency
P2: Permanency in 12 Months for Children in Care for 12-23 Months
Of all children in foster care on the first day of the 12-month period, who had been in foster care (in that episode) for 12-23 months, what percent discharged to permanency within 12 months of the first day?
• What’s changed?
– New measure with an intermediate time period (between 12 and 23 months)

42.740.7
42.4
44.446.1 46.9 45.9 46.9
49.2
46.046.7
45.6
National Standard: 43.6%
0.0
10.0
20.0
30.0
40.0
50.0
60.0
2005 2006 2007 2008 2009 2010 2011 2012 2013 2014
Per
cen
t Ex
itie
d t
o P
erm
anen
cyP2: Permanency within 12 Months for Children in Care 12-23 Months, by Permanent Exit Type
California: 2005-2014
Guardianship Adoption Reunification Exited to Permanency
P3: Permanency in 12 Months for Children in Care for 24+ Months
Of all children in foster care on the first day of the 12-month period, who had been in foster care (in that episode) for 24 or more months, what percent discharged to permanency within 12 months of the first day?
• What’s changed?
– No change

20.2 19.7 19.8
22.323.8
24.926.1
24.1 24.425.9 25.5 25.2 25.9
26.8
National Standard: 30.3%
0.0
5.0
10.0
15.0
20.0
25.0
30.0
35.0
40.0
2005 2006 2007 2008 2009 2010 2011 2012 2013 2014
Per
cen
t Ex
ited
to
Per
man
ency
P3: Permanency within 12 Months for Children in Care 24+ Months, by Permanent Exit Type
California: 2005-2014
Guardianship Adoption Reunification Exited to Permanency
P4: Re-entry to Foster Care
Of all children who enter foster care in a 12- month period and are discharged within 12 months to reunification or guardianship, what percent re-entered foster care within 12 months of their date of discharge? • What’s changed?
– Entry cohort (denominator includes all children who enter care during the year and exit within 12 months) vs. all children who exit during the year
– Includes exits to reunification and guardianship vs. reunification only

12.4
13.5
13.9
11.9
11.5
12.6
11.711.4
12.012.5
12.0
11.1
National Standard: 8.3%
0.0
2.0
4.0
6.0
8.0
10.0
12.0
14.0
16.0
2003 2004 2005 2006 2007 2008 2009 2010 2011 2012
Pe
rce
nt
P4: Re-entry to Foster CareCalifornia: 2003-2012
Percent of Children with Re-entries to Care within 12 Months
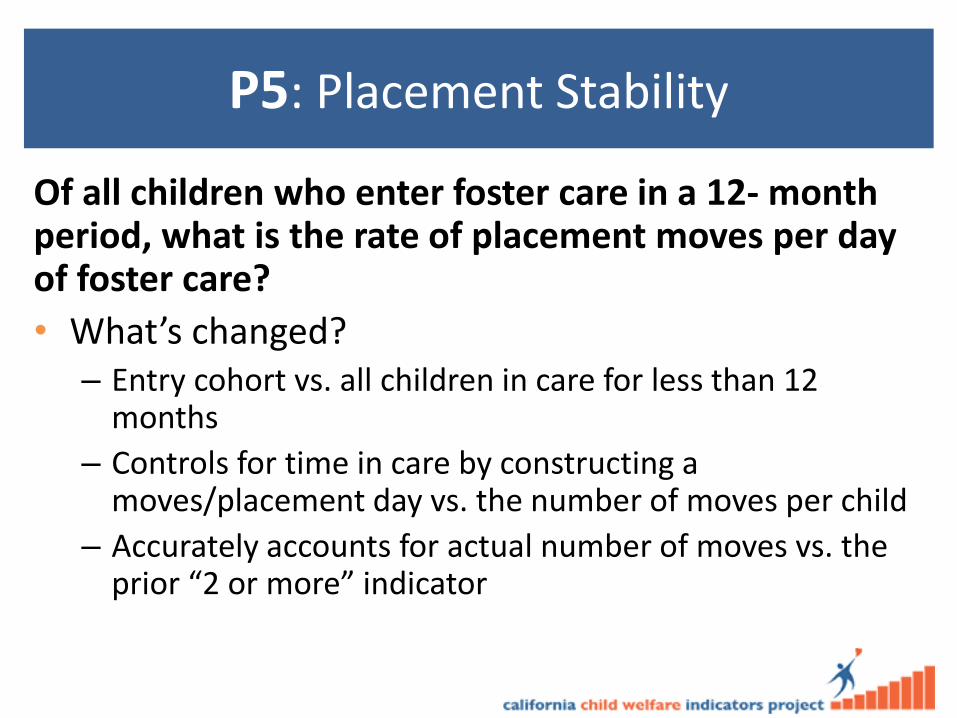
P5: Placement Stability
Of all children who enter foster care in a 12- month period, what is the rate of placement moves per day of foster care?
• What’s changed? – Entry cohort vs. all children in care for less than 12
months
– Controls for time in care by constructing a moves/placement day vs. the number of moves per child
– Accurately accounts for actual number of moves vs. the prior “2 or more” indicator
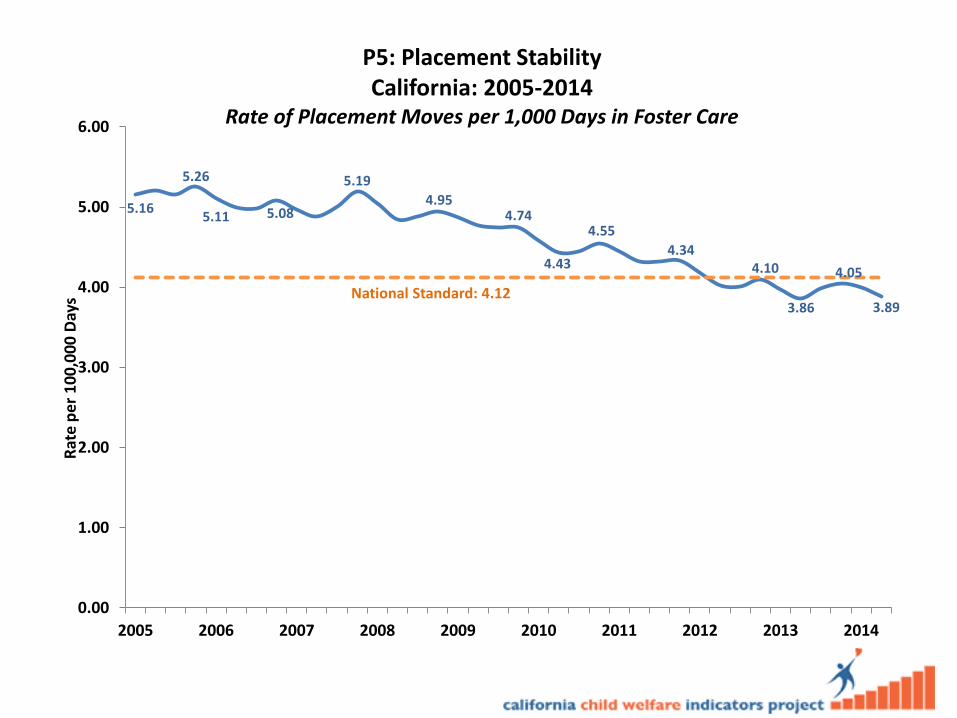
5.16
5.26
5.11 5.08
5.19
4.954.74
4.43
4.55
4.344.10
3.86
4.05
3.89National Standard: 4.12
0.00
1.00
2.00
3.00
4.00
5.00
6.00
2005 2006 2007 2008 2009 2010 2011 2012 2013 2014
Rat
e p
er
10
0,0
00
Day
sP5: Placement StabilityCalifornia: 2005-2014
Rate of Placement Moves per 1,000 Days in Foster Care
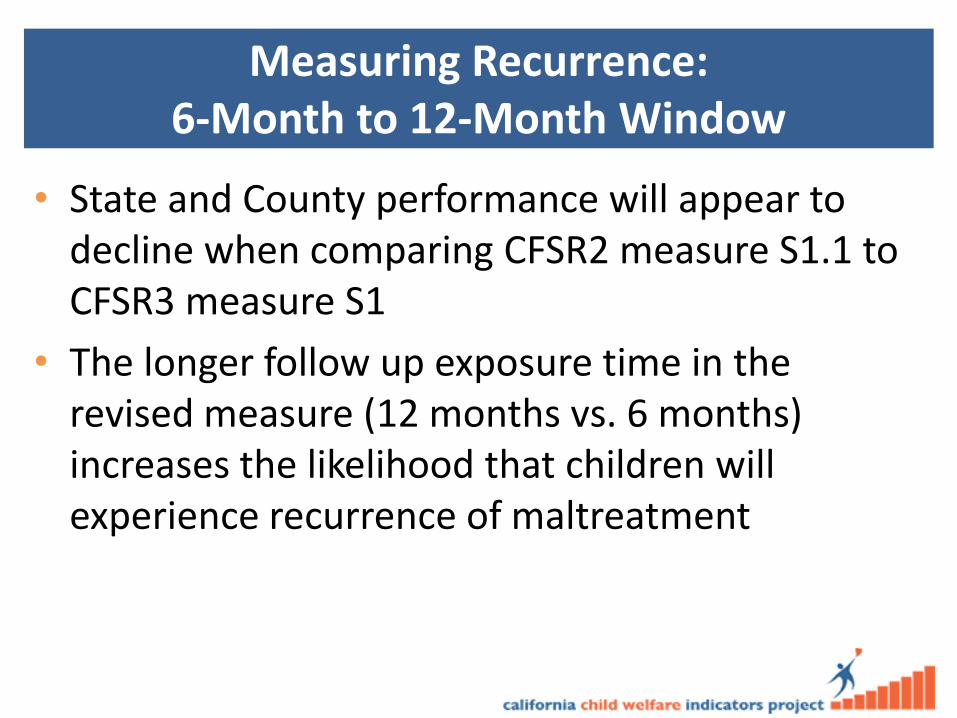
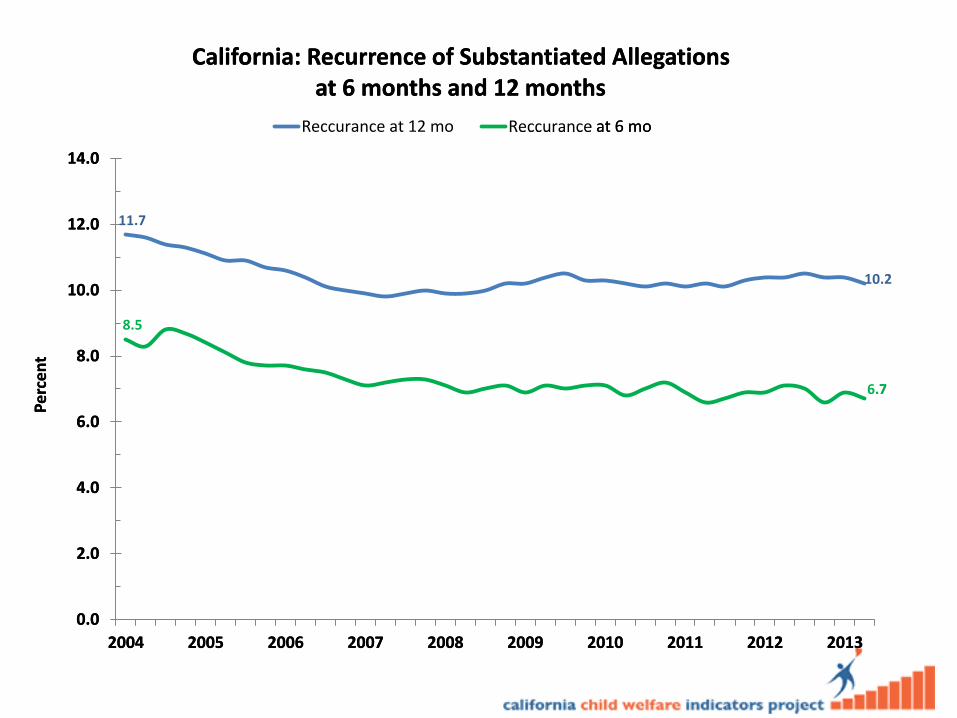
Measuring Recurrence: 6-Month to 12-Month Window
• State and County performance will appear to decline when comparing CFSR2 measure S1.1 to CFSR3 measure S1
• The longer follow up exposure time in the revised measure (12 months vs. 6 months) increases the likelihood that children will experience recurrence of maltreatment
11.7
10.2
8.5
6.7
0.0
2.0
4.0
6.0
8.0
10.0
12.0
14.0
2004 2005 2006 2007 2008 2009 2010 2011 2012 2013
Pe
rce
nt
California: Recurrence of Substantiated Allegationsat 6 months and 12 months
Reccurance at 12 mo Reccurance at 6 mo
11.7
10.2
8.5
6.7
0.0
2.0
4.0
6.0
8.0
10.0
12.0
14.0
2004 2005 2006 2007 2008 2009 2010 2011 2012 2013
Pe
rce
nt
California: Recurrence of Substantiated Allegationsat 6 months and 12 months
Reccurance at 12 mo Reccurance at 6 mo

Understanding Performance Differences: CFSR 2 & 3
Measuring Timely Reunification: Exit Cohorts vs. Entry Cohorts
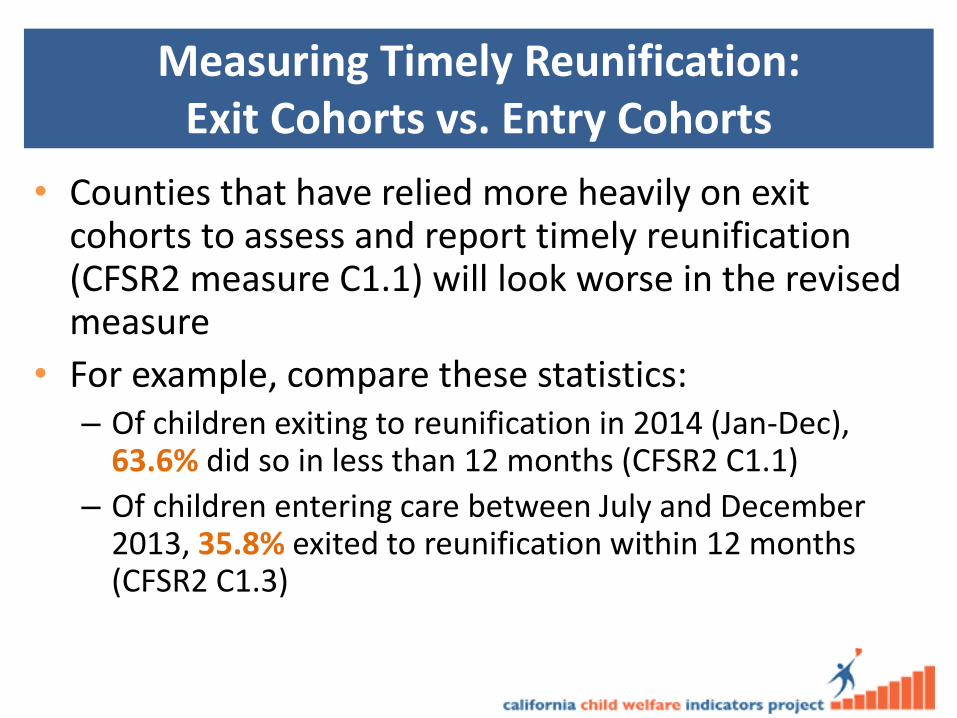
• Counties that have relied more heavily on exit cohorts to assess and report timely reunification (CFSR2 measure C1.1) will look worse in the revised measure
• For example, compare these statistics: – Of children exiting to reunification in 2014 (Jan-Dec),
63.6% did so in less than 12 months (CFSR2 C1.1)
– Of children entering care between July and December 2013, 35.8% exited to reunification within 12 months (CFSR2 C1.3)
Measuring Timely Reunification: Exit Cohorts vs. Entry Cohorts
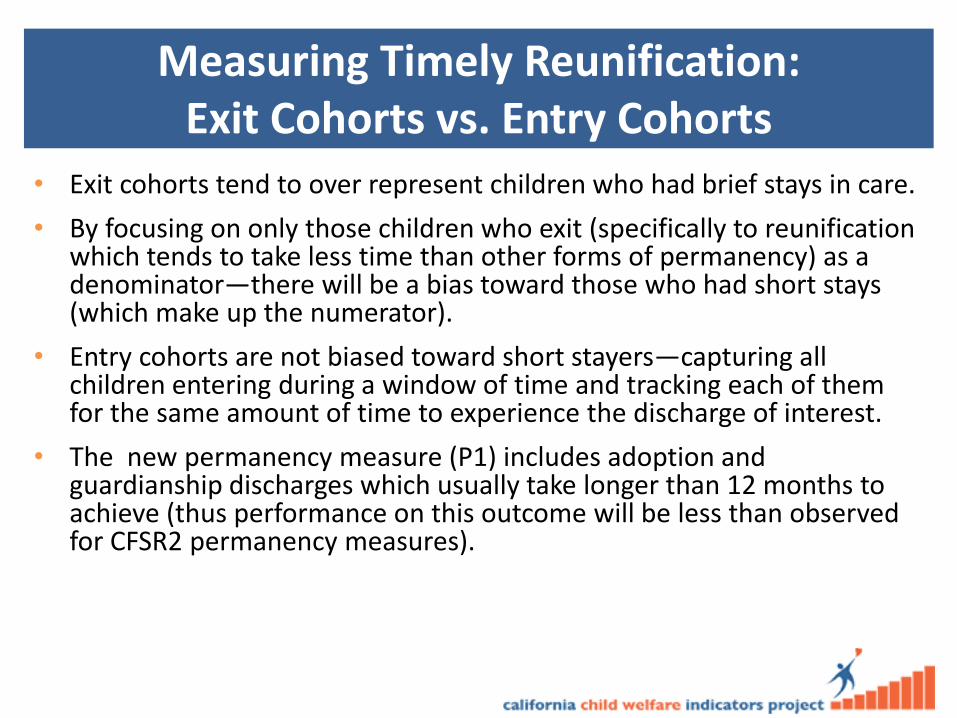
• Exit cohorts tend to over represent children who had brief stays in care.
• By focusing on only those children who exit (specifically to reunification which tends to take less time than other forms of permanency) as a denominator—there will be a bias toward those who had short stays (which make up the numerator).
• Entry cohorts are not biased toward short stayers—capturing all children entering during a window of time and tracking each of them for the same amount of time to experience the discharge of interest.
• The new permanency measure (P1) includes adoption and guardianship discharges which usually take longer than 12 months to achieve (thus performance on this outcome will be less than observed for CFSR2 permanency measures).

Measuring Timely Reunification: Entry Cohorts vs. Exit Cohorts
10/1/12 10/1/13 10/1/14

CFSR2/C1.1: Exit Cohort
10/1/12 10/1/13 10/1/14
Children discharged to reunification during the year: 5 Children reunified within 12 months: 4 Performance (C1.1): 80% Median time to reunification (C1.2): 4 months

CFSR3/P1: Entry Cohort
10/1/12 10/1/13 10/1/14
Children entering care during the year: 6 Children achieving permanency within 12 months: 4 Performance (P1): 60% Median time to permanency: 8 months
Measuring Reentry: CFSR3 vs. CFSR2
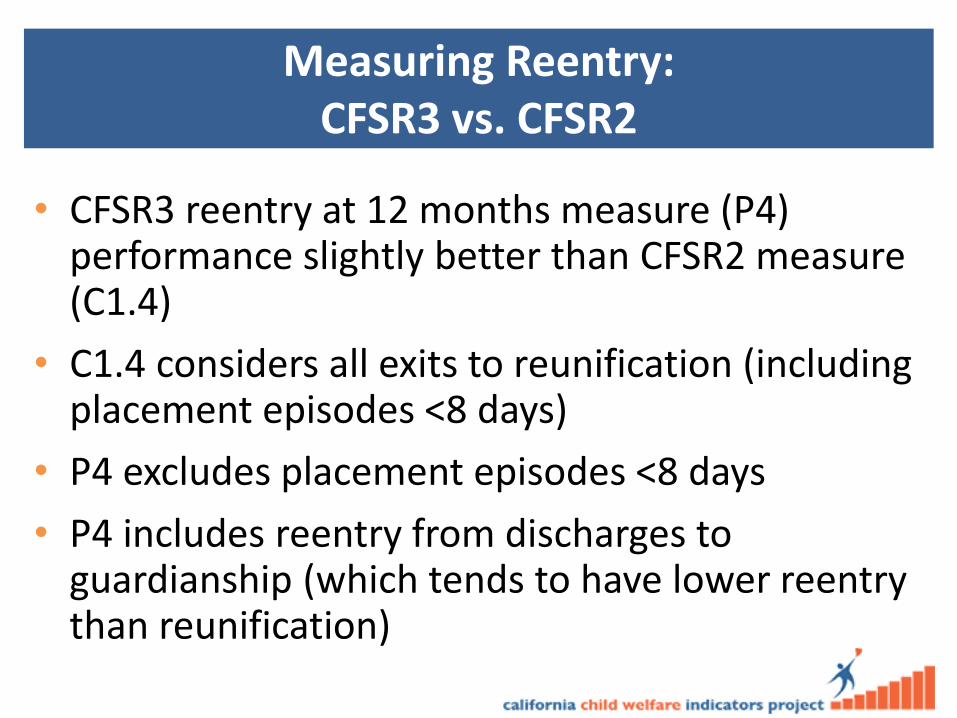
• CFSR3 reentry at 12 months measure (P4) performance slightly better than CFSR2 measure (C1.4)
• C1.4 considers all exits to reunification (including placement episodes <8 days)
• P4 excludes placement episodes <8 days
• P4 includes reentry from discharges to guardianship (which tends to have lower reentry than reunification)

http://cssr.berkeley.edu/ucb_childwelfare
Webster, D., Armijo, M., Lee, S., Dawson, W., Magruder, J., Exel, M., Cuccaro-Alamin, S., Putnam-Hornstein,
E., King, B., Morris, Z., Sandoval, A., Yee, H., Mason, F., Benton, C., & Pixton, E. (2015). CCWIP reports.
Retrieved 4/2015, from University of California at Berkeley California Child Welfare Indicators Project website.
URL: http://cssr.berkeley.edu/ucb_childwelfare
QUESTIONS ?
Daniel Webster, PhD 510.290.6779
Related Documents