1 Chihiro Watanabe Platform Ecosystems Impact on GDP Research Professor, University of Jyvaskyla, Finland Research Scholar, International Institute for Applied Systems Analysis (IIASA) Professor Emeritus, Tokyo Institute of Technology [email protected] [email protected] Watanabe Foresight 20161123 Foresight Meeting Helsinki 23 November 2016 WP 7 Platform Ecosystems Impact on GDP Increasing Dependency on Un- captured GDP and Its Consequences to Finland Future

Chihiro Watanabe: Platform Ecosystems Impact on GDP - Increasing Dependency on Un-captured GDP and Its Consequences to Finland's Future
Jan 17, 2017
Welcome message from author
This document is posted to help you gain knowledge. Please leave a comment to let me know what you think about it! Share it to your friends and learn new things together.
Transcript

1
Chihiro Watanabe
Platform Ecosystems Impact on GDP
Research Professor, University of Jyvaskyla, Finland Research Scholar, International Institute for Applied Systems Analysis (IIASA)
Professor Emeritus, Tokyo Institute of Technology
[email protected] [email protected]
Watanabe Foresight 20161123 Foresight MeetingHelsinki 23 November 2016
WP 7 Platform Ecosystems Impact on GDP
Increasing Dependency on Un-captured GDPand Its Consequences to Finland Future
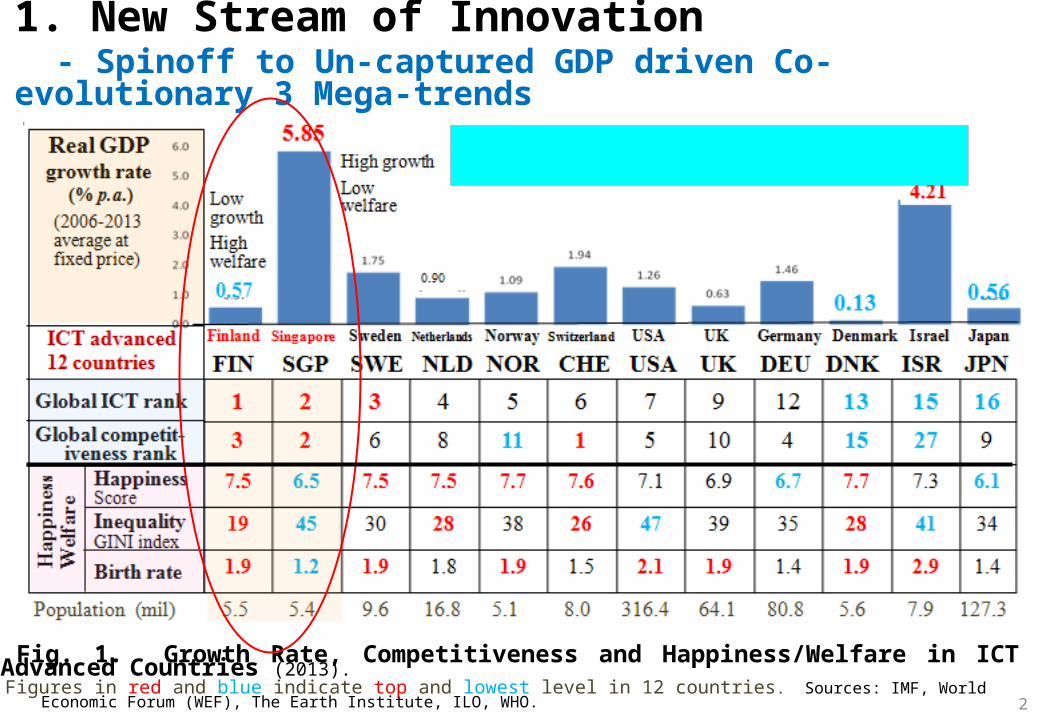
Fig. 1. Growth Rate, Competitiveness and Happiness/Welfare in ICT Advanced Countries (2013).
1. New Stream of Innovation - Spinoff to Un-captured GDP driven Co-evolutionary 3 Mega-trends(1) Dilemma of World ICT Leaders
Figures in red and blue indicate top and lowest level in 12 countries. Sources: IMF, World Economic Forum (WEF), The Earth Institute, ILO, WHO.2
CapturedGDP
TraditionalICT
Economic
functionality
Un-capturedGDP
Supra-
functionality
beyond
economic value
(2) Co-evolution of 3 Mega-trends – Shift from Traditional to New Co-evolution
Advancement of ICT
People’s
preferences
Paradigm change
1. Internet has changed the computer-initiated ICT world significantly.
2. Internet provides utility and happiness to people but cannot be captured by GDP.
5. Consequently, current ICT driven economy depends on shifting two co- evolutional mega-trends:
(1) Traditional co-evolution between ICT, captured GDP and economic functionality, (Singapore)
(2) New co-evolution between Internet, un-captured GDP and supra-functionality (Finland).
6. While Finland has shifted to new co-evolution, Singapore has maintained traditional growth – oriented co-evolution.
Fig. 2. Co-evolution between the Internet, Un-captured GDP and Supra-functionality.
3. Un-captured GDP has become the major source of consumers utility .
4. This corresponds to people’s preferences shift and induces further Internet advancement.
Singapore
Finland
Internet
3
IoT
4
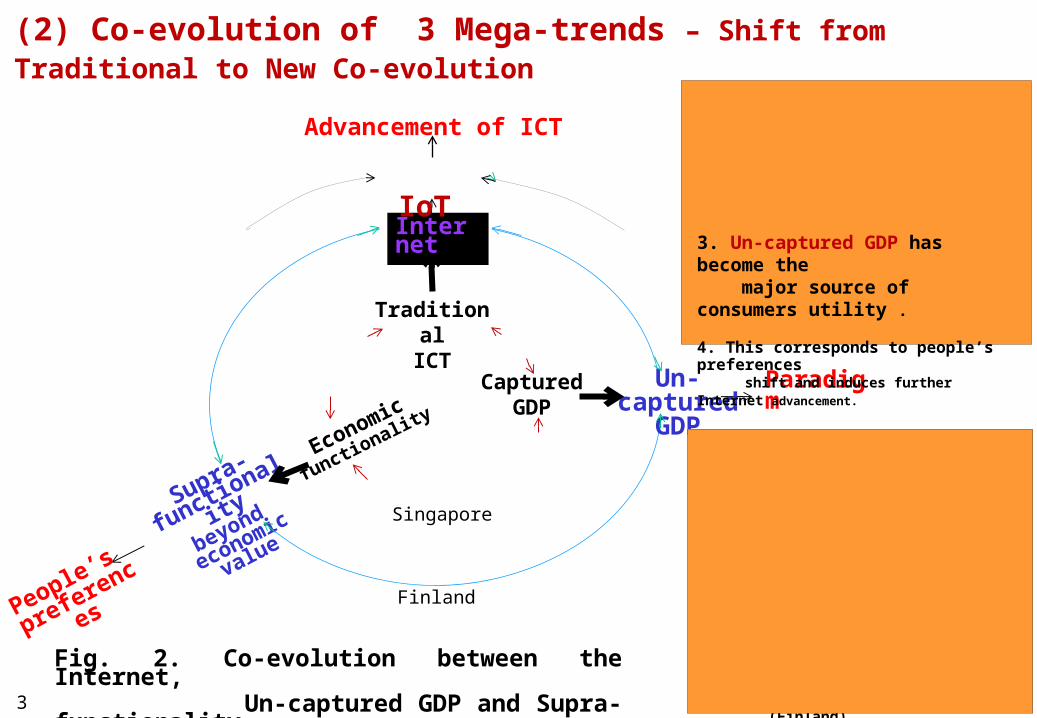
The 21st-century economy
How to measure prosperityGDP is a bad gauge of material well-being. Time for a fresh approach
April 30, 2016
第 1 章 ICT によるイノベーションと経済成長 第 4 節 経済社会に対する ICT の多面的な貢献 2 . ICT 化による経済社会の非貨幣的側面の変化
White Paper on Telecommunications (Ministry of Internal Affairs and Communications) August 1, 2016
Beyond GDP
IoT, Big data, AINew values that network and data create

5
Fig. 3. Two-faced Nature of ICT.
TT
YT
TY
XX
YX
XY
YYTXFY
),(
YR
pp
YR
TY
Y
T
decreaseYY
declineTY
decreasepT
Y: GDP, X: Traditional production factors (Labor, Capital), T: Technology stock ( ) , R: R&D investment
(Marginal productivity) (Relative prices)
RT
Tyler Cowen Professor of economics at George Mason University
Tp
T
Internet dependency
ICT’s contribution to growth
(3) Un-captured GDP 1) Trap in ICT Advancement – Two-faced Nature of ICT
Prices of
ICT
pric
es
ICT advancement
Trend in ICT Prices
Prices increase by new functionality
Prices decline due to freebies, easy copying, standardization
Growth stagnation
Un-captured GDP
Decline in marginal productivity of technology.
Increase in ICT stock Search engineSocial networksOnline advertisingSocio-cultural value
Internet provides new utility and happiness but cannot be captured by GDP data ( Un-captured GDP)

2) Bi-polarization of Digital Economy -Fatality of Logistic GrowthLogistic growth function as a function of time t can be depicted as follows:
This function can be developed to the following bi-polarization function:
atbeNY
NYaY
dtdY
1)1(
Inflection point
Fig. 4. Bi-polarization Fatal to Logistic Growth Function. 6
Excessive increase changes to a vicious cycle.

7Fig. 5. Transformative Role of Co-evolutionary Acclimatization.
.
that harnesses the vigor of counterparts enables both economies maintain sustainable growth.
While the advancement of ICT contributes to enhancing its prices by increasing new functionality development, dramatic advancement of the Internet tends to decrease ICT prices due to freebies, easy copying and mass standardization, among other things.
ICT advanced economies suffer a vicious cycle between ICT advance-ment and marginal productivity decline.
ICT growing economies expect growth as ICT increases but they cannot afford
Co-evolutionary Acclimatization
3) Consequence of Two-faced nature of ICT

8
IGE: ICT growing economies
Fig. 6. Scheme of Optimal Dynamism for Balancing Captured and Un-captured GDP.
4) Optimal Balance between Captured GDP and Un-captured GDP
ICT advanced economies ICT growing economies

2. Measurement of Un-captured GDP 2.1 Framework of the Analysis (1) Basic UnderstandingUn-captured GDP can be traced from both sides as: a. New functions of online intermediaries such as e-commerce, online advertising and search engines, and b. Consumer’s preferences shift from economic functionality to supra-functionality beyond economic value.
(2) Both Sides of Un-captured GDP Emergence 1) New Services provided by Online Intermediaries
2) Consumers Preferences Shift9
Locomotive of the Spin-off Emerging Un-captured GDP.
10
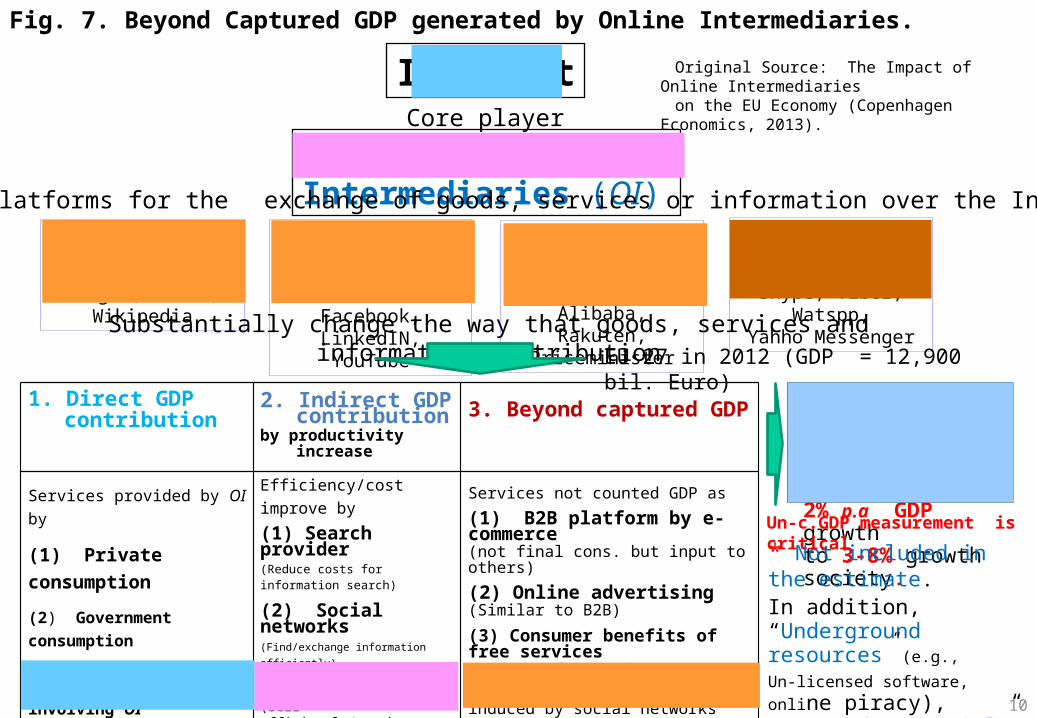
Internet
Online Intermediaries (OI)Core player
Provide platforms for the exchange of goods, services or information over the Internet
Substantially change the way that goods, services and information distribution
Social networksTwitter, Facebook,
LinkedIN, YouTube
Search engineGoogle, Yahoo,
Wikipedia
e-commerce platformeBay, Amazon, Alibaba, Rakuten, Priceminister
Cloud computing Skype, Viber, Watspp,
Yahho Messenger
1. Direct GDP contribution
2. Indirect GDP contribution
by productivity increase3. Beyond captured GDP
Services provided by OI by
(1) Private consumption(2) Government consumption
(3) Investment involving OI*(4) Exported or imported
Efficiency/cost improve by
(1) Search provider(Reduce costs for information search)
(2) Social networks(Find/exchange information efficiently)
(3) e-commerce(Sell efficiently/purchase cheaper)
(4) Cloud computing(Turning fixed costs into marginal costs)
Services not counted GDP as
(1) B2B platform by e-commerce(not final cons. but input to others)
(2) Online advertising(Similar to B2B)
(3) Consumer benefits of free services as Google search
(4) Socio cultural valueinduced by social networks *
220 bil. Euro (1.7% of GDP) 210 bil. Euro (1.65%) 640 bil. Euro (5.0%)
EU 27 in 2012 (GDP = 12,900 bil. Euro)
Original Source: The Impact of Online Intermediaries
on the EU Economy (Copenhagen Economics, 2013).
Substantial total valuesincluding un-captured GDP change current 2% p.a GDP growthto 3-8% growth society.
Fig. 7. Beyond Captured GDP generated by Online Intermediaries.
Un-c.GDP measurement is critical
* Not included in the estimate.In addition,“Underground resources” (e.g.,Un-licensed software, online piracy),“Un-used potential” due to organizational reform delaycannot be overlooked.

11
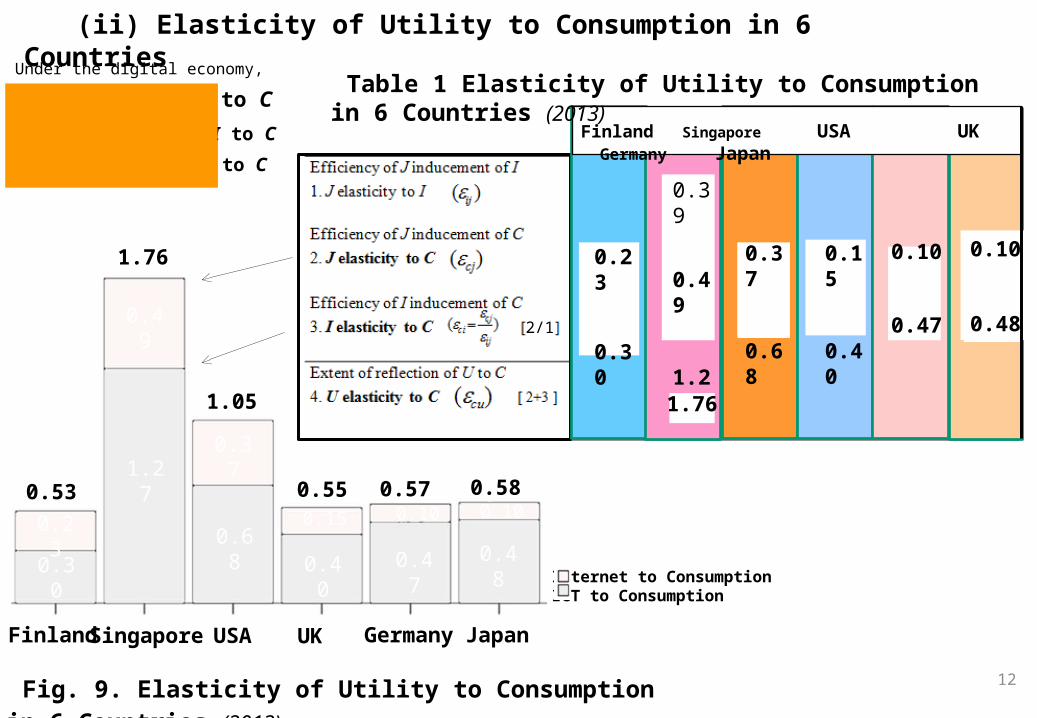
2) Consumer’s Preferences Shift (i) Measurement of Elasticity of Utility to Consumption
Un-captured GDP is non-reflection of utility to consumption (measured by captured GDP) and its magnitude can be measured by elasticity of utility to consumption.
Utility is governed by ICT stock (I) and Internet dependency (J) in the digital economy, its elasticity to consumption can be decomposed to elasticity of ICT to consumption and elasticity of the Internet to consumption as follows:
)()()(
),(
),(),,(),(
cjcicu
CJ
JC
CI
IC
CU
UC
JJCI
IC
CUJ
JUI
IUJIUU
JIQQJIVVQVUU
U: Utility, C: Traditional consumptionV: Economic functionality, Q: Supra-functionality J: Internet dependency, I: ICT stock
Thus, elasticity of utility to consumption can be estimated by a sum of elasticity of I to C and J to C. Utility is particularly induced by J.
Fig. 8. Governing Factor of Utility in the Digital Economy.
1.76
0.49
1.27
0.30
0.23
0.37
0.680.15
0.40
0.10 0.10
0.47 0.48
0.53
1.05
0.55 0.57 0.58
Finland Singapore USA UK Germany Japan
Internet to ConsumptionICT to Consumption
12Fig. 9. Elasticity of Utility to Consumption in 6 Countries (2013).
Finland Singapore USA UK Germany Japan
Table 1 Elasticity of Utility to Consumption in 6 Countries (2013)
2/1
(ii) Elasticity of Utility to Consumption in 6 Countries
0.23
0.30
0.39
0.49
1.27
1.76
0.37
0.68
0.15
0.40
0.10
0.47
0.10
0.48
Under the digital economy,
Elasticity of U to C = Elasticity of I to C
+ Elasticity of J to C
Captured G
DP
Un-captured G
DP
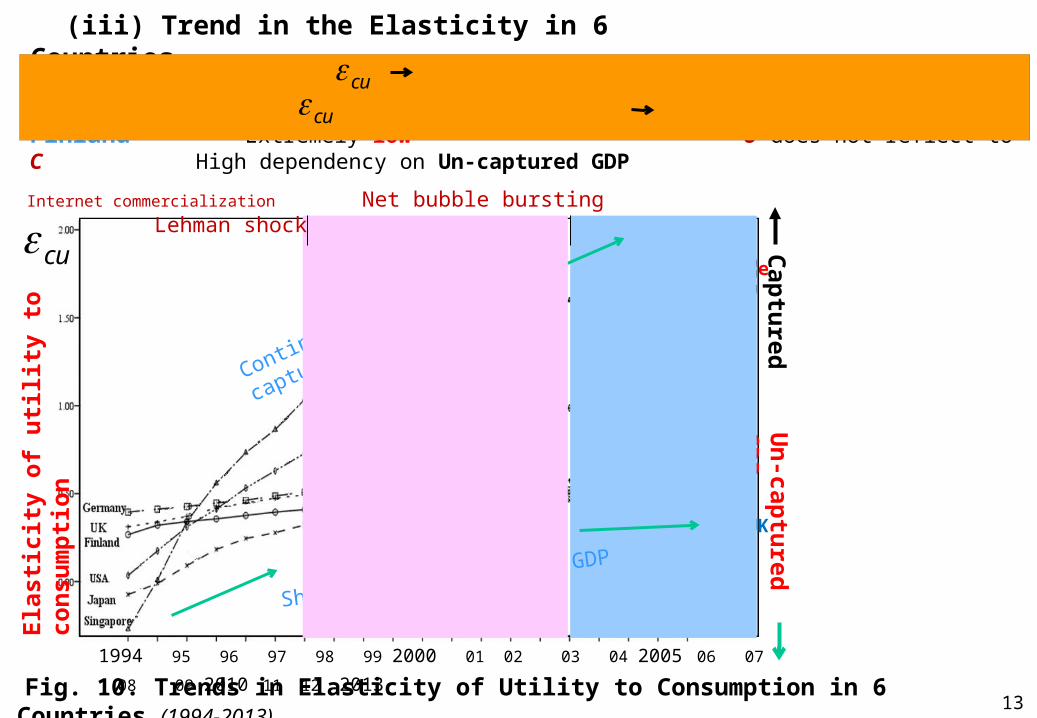
Fig. 10. Trends in Elasticity of Utility to Consumption in 6 Countries (1994-2013).
(iii) Trend in the Elasticity in 6 Countries
Singapore
USA
Japan Germany UK Finland
13
Ela
stic
ity o
f util
ity to
con
sum
ptio
n
1994 95 96 97 98 99 2000 01 02 03 04 2005 06 07 08 09 2010 11 12 2013
Singapore Conspicuously high U reflects to C High dependency on Captured GDP
Finland Extremely low U does not reflect to C High dependency on Un-captured GDP
Continue to increase captured GDP
Shifted to un-captured GDP
Internet commercialization Net bubble bursting Lehman shock
cu
cucu
14
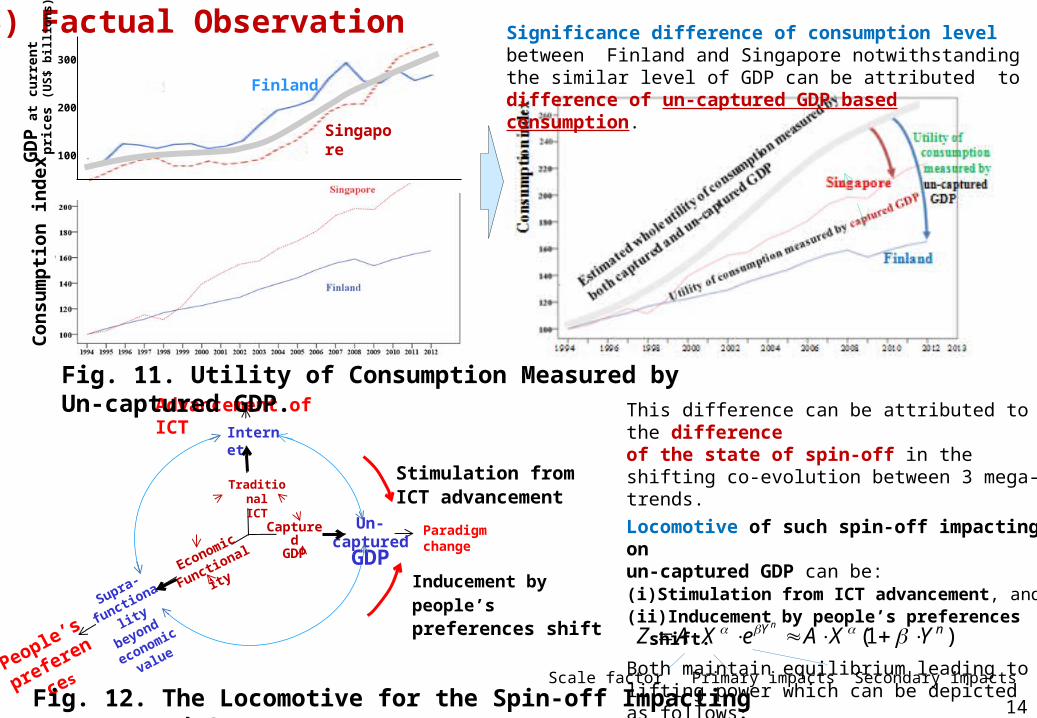
(3) Factual Observation
CapturedGDP
TraditionalICT
Economic
Functionality
Internet
Un-capturedGDP
Supra-
functionality
beyond
economic
value
Advancement of ICT
Paradigmchange
People’s
preferences
GD
P at
cur
rent
pri
ces (
US$
bill
ions
)
Stimulation fromICT advancement
Inducement by people’s preferences shift
Significance difference of consumption level between Finland and Singapore notwithstanding the similar level of GDP can be attributed to difference of un-captured GDP based consumption.
This difference can be attributed to the difference of the state of spin-off in the shifting co-evolution between 3 mega-trends.Locomotive of such spin-off impacting on un-captured GDP can be:(i) Stimulation from ICT advancement, and(ii)Inducement by people’s preferences shift.
Both maintain equilibrium leading to lifting power which can be depicted as follows:
)1( nY YXAeXAZn
Scale factor Primary impacts Secondary impacts
Singapore
Finland
300
200
100
Con
sum
ptio
n in
dex
Fig. 11. Utility of Consumption Measured by Un-captured GDP.
Fig. 12. The Locomotive for the Spin-off Impacting Un-captured GDP.

15
(4) Measurement of the Magnitude of Un-captured GDP 1) Consumption Function
Level of consumptionC = a’ + b’ Y
H = a + bY
Y Y + uY
Consumption measured by captured GDP
Estimated gross consumption measured by both captured and un-captured GDP
Gross income level motivating consumption
Additional consumption measured by un-captured GDP (W)
Captured GDP un-captured GDP
aBase consumption
2) Discrepancy between two consumption functions
(i) ICT advancement stimulation (Attributed to the Internet (J) with secondary impacts of consumer’s preferences)). : adjusting factor (= a - a’) (4)
[ see Note] (ii) Consumer’s preferences inducement (Represented by elasticity of utility to consumption (E) with secondary impacts of J)
(5)
buYaaYbbaabYaYbaHCW )'()'()'()(''
nJeEAbuY
Since (4) and (5) maintain equilibrium, leading to lifting power. (6)
(7)
(9)
Un-captured GDP ratio
(10)
nm JE eEAeJHbuY
mn
m
n EJE
J eeJEAeJ
eEAH
1
nn EJJEAH lnlnlnln
beEeuY
nJA
ln
YuY
mEeJHYb
(1)
(2)
(3)
3) Identification of un-captured GDP
a, a’: base consumption, b, b’ : marginal propensity to consume.
mEeJHHuY
HY
YH
YHuY
YHbuY
HeJeJ
YuY
HY
YH mm EE
,,
(8)
Note
(Y elasticity to H) 0H

16
2.2 Empirical ResultTable 2 Governing Factors of Household Consumption in Finland and Singapore (1994-2013)
19158.1998.0.917.01003.1ln208.0ln185.1435.6ln 20.26.14 AICDWRadjEJJEH
19061.1998.0.887.01070.1ln214.0ln230.1520.6ln 22.25.14 AICDWRadjEJJEH
19060.1998.0.939.01003.1ln209.0ln158.1380.6ln 28.16.14 AICDWRadjEJJEH
12263.1982.0.575.11000.1ln198.0ln740.0721.3ln 222.000.12 AICDWRadjEJJEH
12163.1981.0.484.11070.1ln229.0ln735.0856.3ln 222.090.02 AICDWRadjEJJEH
12262.1982.0.658.11060.0ln172.0ln745.0593.3ln 222.010.12 AICDWRadjEJJEH
(7.24*) (2.23*2) (-3.10*) (1.60*4) (0.69*5)
(7.52*) (2.35*2) (-3.29*) (1.58*4) (0.64*5)
(6.69*) (2.10*2) (-3.63*) (1.61*4) (0.69*5)
(3.28*) (2.14*2) (-3.32*) (5.41*) (1.37*4)
(3.27*) (2.08*2) (-3.64*) (5.31*) (1.25*4)
(3.27*) (2.18*2) (-2.99*) (5.49*) (1.48*4)
Finland S
H
L
Singapore S
H
L
S: Standard estimate, H: higher possible estimate, L: lower possible estimate.H: Household consumption (Index: 1994=100), E: Elasticity of utility to consumption, J: Internet dependency.Singapore’s E for 1994 -1996 are adjusted taking backward trend between 1997-2000.Figures in parenthesis indicate t-statistics (*, *2, *4, *5 means significant at the 1%, 5%, 20% and 50% level, respectively).

0.95 H0.87 S0.83 L
0.43 H
0.35 S0.29 L
(1) Magnitude of Un-captured GDP – Un-captured GDP Ratio
Fig. 13. Trend in the Internet-driven Un-captured GDP Ratio in Finland and Singapore (1994-2012).
Un-captured GDP ratio = Un-captured GDP/ Captured GDP.S: Standard estimate, H: Higher possible estimate, L: Lower possible estimate.
17

18
Finland
Singapore
Un-captured GDPUn-captured GDP
Captured GDP
505
302269
407
74
105
GDP at current prices (US$ billions)
GD
P
1994 2000 2005 2010 2013
600
500
400
300
200
100
0
Fig. 14. Trends in Captured and Un-captured GDP in Finland and Singapore (1994-2013).
(2) Trends in Captured and Un-captured GDP

19
600
500
400
300
200
100
0
Singapore
Un-captured GDP 302
407
Captured GDP74
1994 2000 2005 2010 2013
Fig. 15. Comparison of Captured and Un-captured GDP in Finland and Singapore (1994-2013).
While (captured) GDP is lower than Singapore,Finland depends largely on un-captured GDP. (3) Dependency on Un-captured GDP
GDP at current prices (US$ billions)
Captured GDP
1960 1965 1970 1975 1980 1985 1990 1995 2000 2005 2010 2015
300
250
200
150
100
50
Finland Singapore Internet dependency 93 75 Experience ratio 48 30 Share of retail sales 9 2 Clothing/footwear purchase Popular 4 B2B Internet use 1 14(world rank)
Comparison of the Internet Use (2013) %
Sources: ITU, WEF, Statistics Finland, Singapore DOS.
Onl
ine
shop
ping
600
500
400
300
200
100
0
Finland
Un-captured GDP269
505
Captured GDP105
1994 2000 2005 2010 2013
19
302
269

Finland (1996 – 2013)
1996
2013
Internet productivity of ICT
Singapore (1996 – 2013)
19962013
Fig. 16. Contrast of the Shift to New Co-evolution between Finland and Singapore (1996-2013).
3. Consequence of Increasing Dependency on Un-captured GDP (1) Shift to New Mega Trend
2003
2000
20
Cling to traditional mega-trend
Un-
capt
ured
GD
P ra
tio
Spun off to new mega-trend since 2003
Spin off

21
(2) Correspondence to People’s Preferences Shift
Economic Functionality
Fig. 17. Shift from Economic Functionality to Supra-functionality beyond Economic Value.
People’s preferences shift in JapanSource: Japan Cabinet Office.

1 FIN 2 SGP 3 SWE 4 NLD 5 NOR 6 CHE 7 USA 9 UK 12 DEU 13 DNK 15 ISR 16 JPN
Gaining profits from abroad
GN
I / G
DP
ratio
Fig. 18. Comparison of Interactive Return Gain Structure in 12 ICT Advanced Countries (2012, 2013 average).
Figures on the country indicates the ICT competitiveness rank in 2013.Sources: World Economic Outlook Database (IMF 2013, 2014), World Health Statistics 2014 (WHO 2014),.
GNI / GDP Ratio
1 FIN 2 SGP 3 SWE 4 NLD 5 NOR 6 CHE 7 USA 9 UK 12 DEU 13 DNK 15 ISR 16 JPN
GDP Growth Rate (2006-2013) % p.a. at fixed price
GD
P gr
owth
rat
e (%
p.a
.) (3) Change in Interactive Return Gain Structure
Losing domestic gains
Singapore’s Losing Structure
While Singapore enjoys growth, it loses domestic gains. Finland gains profits from abroad under the great stagnation.
22
GNI – GDP = Income balance + balance derived from favorable terms of trade (higher exports prices with lower imports prices).
This irony can be attributed to the consequences of the strategic option in shifting to new co-evolution or clinging to traditional co-evolution.

23
(4) Emergence of Disruptive Business Model
Fig. 19. Consumer Surplus of Music and Audio - visual Services (Person per month: Aged 20s.).
Source: White Paper of Japan’s ICT (Min. of Internal affairs and Communication, 2016).
Fig. 20. Un-captured GDP Emerged by Uber (US$/trip, NYC).
Source : Uber's Ride-sharing Revolution (Watanabe et al., 2016).
Un-captured GDP
1) Music and Audiovisual Services 2) Ride Sharing Service: Uber
% of cumulative answer
Yen
Willingto pay
Actual payment (146 Yen/m)
24
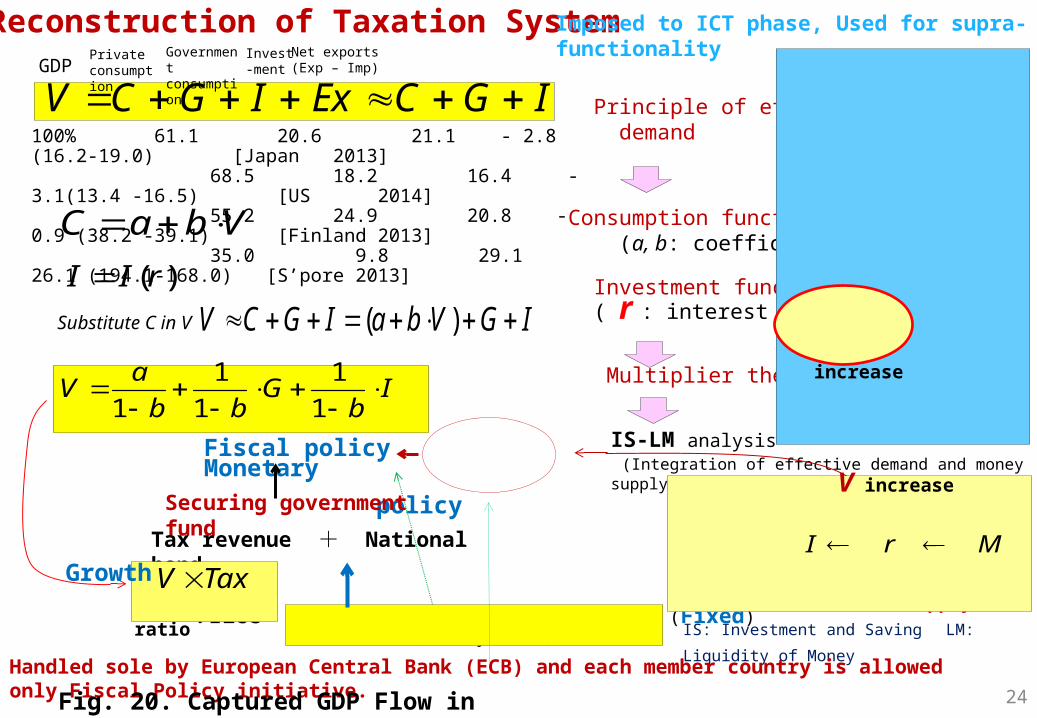
IS LM
Principle of effective demand
Consumption function (a, b: coefficient )
Investment function ( r : interest rate)
Multiplier theory
GDP
VbaC )(rII
Substitute C in V IGVbaIGCV )(
Ib
Gbb
aV
1
11
11
Fiscal policy r Monetary policy
MrI CV
(Money supply )
Price x Interest rate = Interest (Fixed) (Bond yields)
Securing government fund
IS: Investment and Saving LM: Liquidity of
Money
Tax revenue + National bond
TaxV Income Tax ratio
r
IS-LM analysis (Integration of effective demand and money supply and interest)
Growth
Privateconsumption
Government consumption
IGCExIGCV Invest-ment
Net exports(Exp – Imp)
(5) Reconstruction of Taxation System Good economic condition
(Maximize synergy effects as a consolidated system)
Lower r
I increase
V increase
Tax increase C increase
V increase
G increase
Handled sole by European Central Bank (ECB) and each member country is allowed only Fiscal Policy initiative.
100% 61.1 20.6 21.1 - 2.8 (16.2-19.0) [Japan 2013] 68.5 18.2 16.4 -3.1(13.4 -16.5) [US 2014] 55.2 24.9 20.8 - 0.9 (38.2 -39.1) [Finland 2013] 35.0 9.8 29.1 26.1 (194.1-168.0) [S’pore 2013]
Fig. 20. Captured GDP Flow in EMU.
Imposed to ICT phase, Used for supra-functionality

25
(6) Optimal Dynamism Harnessing the Vigor of ICT Growing Economies
Co-evolutionary Acclimatization
Past experiences Current resourcesFuture dreamUn-captured Captured GDP GDP
Fig. 21. Optimal Dynamism Harnessing the Vigor of ICT Growing Economies.
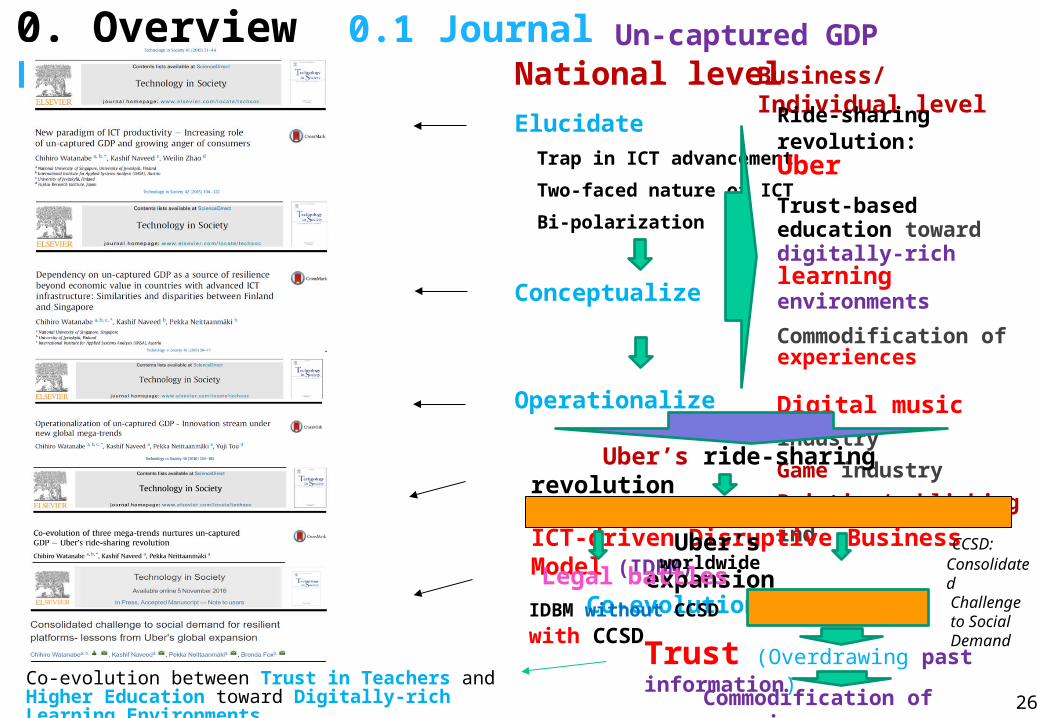
National levelElucidate Trap in ICT advancement
Two-faced nature of ICT
Bi-polarization
Conceptualize
Operationalize
Business/Individual levelUn-captured GDP
Ride-sharing revolution: UberTrust-based education toward digitally-rich learning environments
Commodification of experiences
Digital music industryGame industryPrinting/publishing ind.
Uber’s ride-sharing revolution
ICT-driven Disruptive Business Model (IDBM)Uber’s worldwide
expansion
0. Overview 0.1 Journal Papers
Legal battles Co-evolutionIDBM without CCSD IDBM with CCSD
Co-evolution between Trust in Teachers and Higher Education toward Digitally-rich Learning Environments
CCSD: Consolidated Challenge to Social DemandTrust (Overdrawing past information)
Commodification of experiences 26

27
0. Overview1. New Stream of Innovation -Spinoff to Un-captured GDP-driven Co-evolutionary 3 Mega-trends
2. Uber’s Ridesharing Revolution - ICT-driven Disruptive Business Model (IDBM)
3. Trust-based Education toward Digitally-rich Learning Environments
4. Optimization through Commodification of Experiences
5. Harnessing the Vigor of Memory and Dream 6. Conclusion
Platform Ecosystems Impact on GDPICT-driven Disruptive Business Model with Consolidated Challenge to Social Demand
28
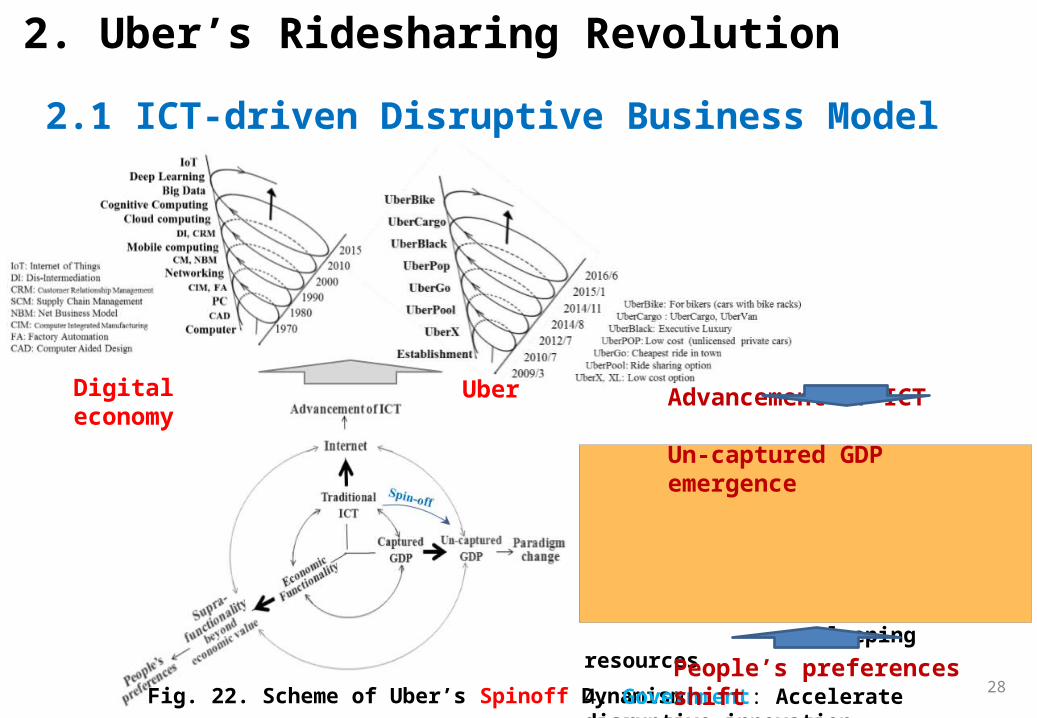
2. Uber’s Ridesharing Revolution
2.1 ICT-driven Disruptive Business Model (1) Uber: Hero of Spin-off
Fig. 22. Scheme of Uber’s Spinoff Dynamism.
1. Customer: Convenient, cheep, time saving2. Driver: No invest, use time, to be a boss
3. Uber: Market creation, optimal price, utilize sleeping resources
4. Government: Accelerate disruptive innovation
People’s preferences shift
Advancement of ICT
Un-captured GDP emergenceDigital economy Uber

Fig. 23. Uber’s Astounding Rise in Trips and Continuous Decline in Prices in NYC.
$0
$200
$400
$600
$800
$1,000
$1,200
$1,400
$1,600
Mar. 2009Uber established
Jun 2013: Medallion prices stagnate
May 2011: Uber launched in NYC
2013/6 2015/1 2015/92014/52011/5PT
PT
PU
UT
TT
MP
Un-captured GDP per trip
31
2004/1 2009/3 2011/5 2013/6 2014/5 2015/9
Magnitude ofUn-captured GDP
te eMP 02.036.61
2247
TT
TUTTA UT
UPTPP
Trips
Prices
Estimated medallion prices without Uber
Aggregated prices
(2) Uber’s Conspicuous Development Taxi price
Taxi price
Uber price
Uber trips
Taxi trips
Uber
Uber
Taxi
Taxi
NYC corporate medallion prices MP (1,000 US$)
1. Astounding rise in trips and prices decline.
2. Provide striking value to all stakeholders as(1) Better services, with cost and time saving for passengers,(2) High efficient operation without new investment for drivers, (3) Optimal price-setting and market making for company(4) Advancement of nation’s disruptive innovation for government.

Fig. 24. Dynamism of ICT-driven Disruptive Business Model (IDBM).
30
(2) Dynamism of ICT-driven Disruptive Business Model
Uber’s system success1. Co-existing development trajectory with taxi corresponds to two-faced nature of ICT, 2. This can be attributed to a virtuous cycle between price decline and trips increase,
3. This virtuous cycle can be attributed to ICT’s self-propagating function, and
4. This function plays a vital role in spinoffs from traditional co-evolution to new co-evolution.
Computer initiated ICT Taxi
Internet Uber
Demand

31
2.2 Consequence of ICT-driven Disruptive Business Model - Uber’s Expansion and Battles
(1) Rapid Expansion
Fig. 25. Uber’s Expansion in 479 Cities in the World (as of June 2016). Source: Uber.
Uber expanded rapidly: 479 cities in more than 75 countries by June of 2016.
(2) Emergence of Legal BattlesProportional to such rapid expansion legal battles emerged significantly.
Operating notwithstanding legality Ban/Partial ban
Fig. 26. Contrasting Features of Uber’s Global Expansion in 16 Countries (as of June 2016).Sources: Authors classification based on, NY Times, HuffPo, Reuters, WSI, CNN and local news reports.
32
2.3 Specific Features of ICT - Sources of Uber’s Expansion and Battles
(1) Specific Features Since Uber is seen as the jewel of ICT, its system success (expansion) and failure (battles) can be attributed to the following ICT’s indigenous function:

33
(2) ICT’s Indigenous Functions Derived from its Specific Features1) Self-propagating NatureDiffusion trajectory of innovative goods Y Simple Logistic Growth (SLG) with fixed carrying capacity (N)
Particular innovation which create new N during Logistic Growth within a Dynamic Carrying Capacity the process of diffusion. (LGDCC)
Carrying capacity increases as Y increases. Functionality spirally increases as Y increases.
Self-pr
))(1)(()(N
tYtaYdt
tdY atbe
NtY
1)(
))()(1)(()(tNtYtaY
dttdY
taaa
batk
k
k
k ebeNY
/11
)()(11
1)()(tYtY
a
tYtNdt
tdY
tYtY
a
tYtYtNFD )(
)()(1
)(1
1)()(
Self-propagation
a. Spinoff b. Institutional elasticity

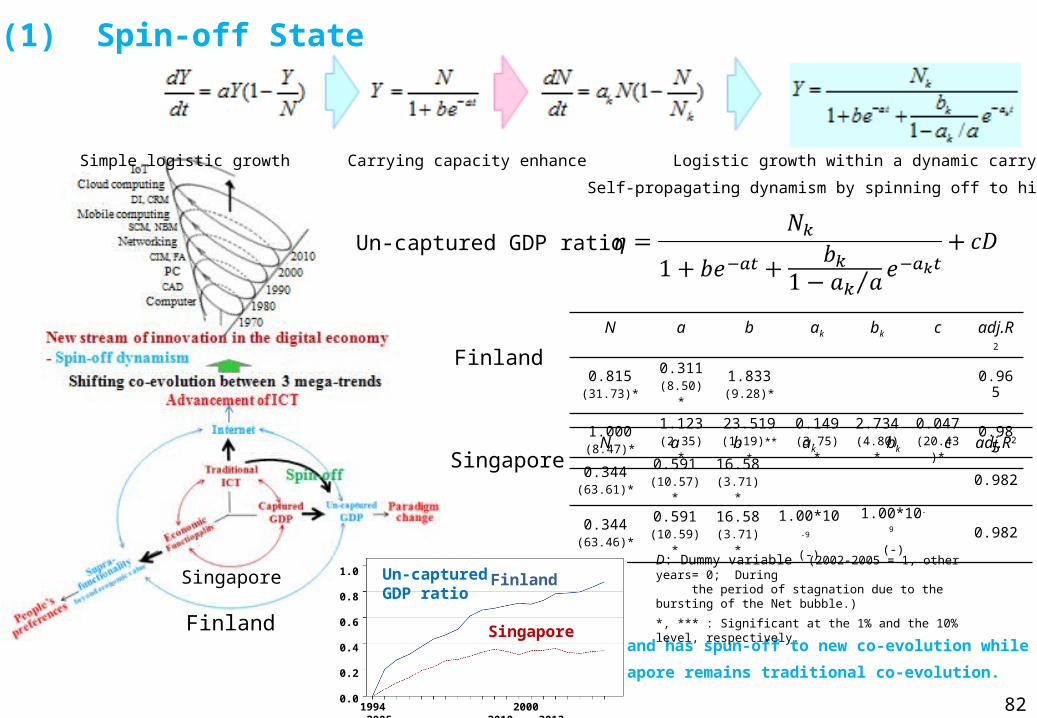
Comparison of Spinoff State in Finland vs Singapore and Taxi vs Uber
Simple logistic growth Carrying capacity enhance Logistic growth within a dynamic carrying capacity Self-propagating dynamism by spinning off to higher functionality level
Finland
Singapore
36
N a b ak bk c adj.R2
0.815(31.73)
0.311(8.50)
1.833(9.28)
0.965
1.000(8.47)
1.123(2.35)
23.519(1.19)**
0.149(3.75)
2.734(4.80)
0.047(20.43)
0.985
N a b ak bk c adj.R2
0.344(63.61)*
0.591(10.57)*
16.58(3.71)*
0.982
0.344(63.46)*
0.591(10.59)*
16.58(3.71)*
1.00*10-9 (-)
1.00*10-9
(-) 0.982
Un-captured GDP ratio(1994-2013)
SLC
LGDCC
SLC
LGDCC
Table 3 Comparison of Spin-off State between Finland vs Singapore and Taxi vs Uber
Self-propagating
Self-propagating

2) Bi-polarization Fatality of Logistic GrowthLogistic growth function as a function of time t can be depicted as follows:
This function can be developed to the following bi-polarization function:
atbeNY
NYaY
dtdY
1)1(
Inflection point
Fig. 27. Bi-polarization Fatal to Logistic Growth Function. 37

36Fig. 28. Transformative Role of Co-evolutionary Acclimatization
.
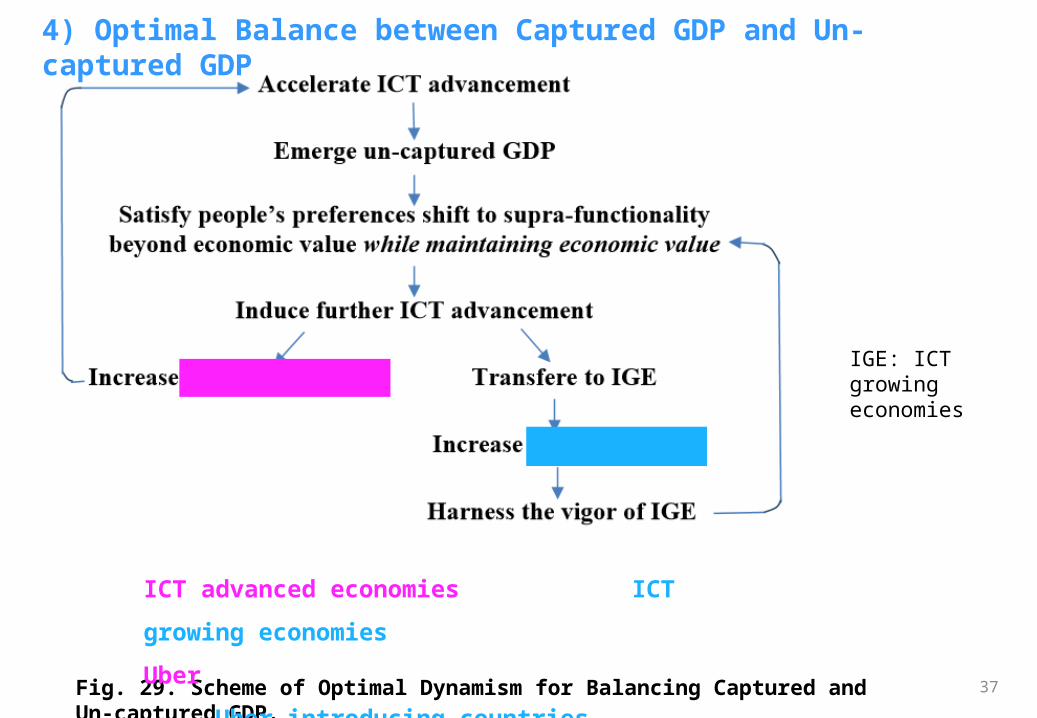
that harnesses the vigor of counterparts enables both economies maintain sustainable growth.
3) Two-faced nature of ICTWhile the advancement of ICT contributes to enhancing its prices by increasing new functionality development, dramatic advancement of the Internet tends to decrease ICT prices due to freebies, easy copying and mass standardization, among other things.
ICT advanced economies suffer a vicious cycle between ICT advance-ment and marginal productivity decline.
ICT growing economies expect growth as ICT increases but they cannot afford
Co-evolutionary Acclimatization
37
IGE: ICT growing economies
Fig. 29. Scheme of Optimal Dynamism for Balancing Captured and Un-captured GDP.
4) Optimal Balance between Captured GDP and Un-captured GDP
ICT advanced economies ICT growing economies
Uber Uber introducing countries

38
2.4 Structural Sources of Legal BattlesGiven that Uber’s system success depends on the advancement of ICT, its considerable legal battles proportional to its rapid expansion can be attributed to ICT’s indigenous functions characterized as
(1) Spin-off,
(2) Institutional elasticity, and
(3) Co-evolutionary acclimatization.
39
1 2 3 4 5 6 7 8 9 10 11 12 13 14 15 16 17 18 19 20 21 22 23 24 25 26 27 280.00
10.00
20.00
30.00
40.00
50.00
60.00Trips per day
2
1
T
T
UU
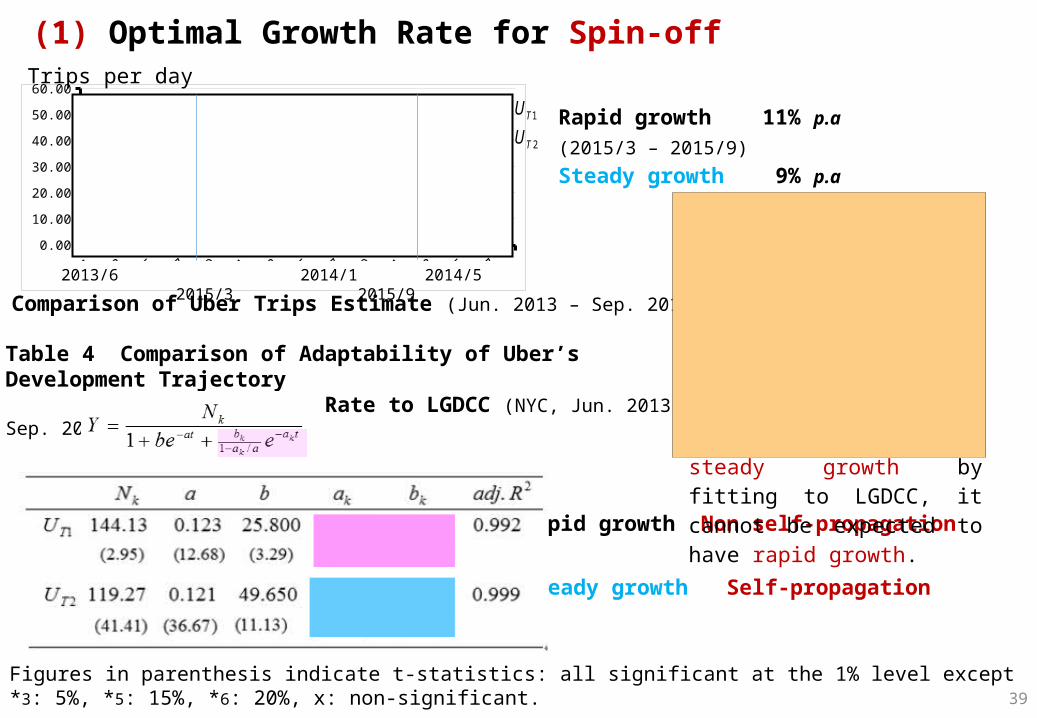
(1) Optimal Growth Rate for Spin-off
Fig. 30. Comparison of Uber Trips Estimate (Jun. 2013 – Sep. 2015).
2013/6 2014/1 2014/5 2015/3 2015/9
Table 4 Comparison of Adaptability of Uber’s Development Trajectory by Growth Rate to LGDCC (NYC, Jun. 2013-Sep. 2015)
Rapid growth 11% p.a (2015/3 – 2015/9)Steady growth 9% p.a
Rapid growth Non self-propagation
Steady growth Self-propagation
Optimal velocity of growth would be crucial to self-propagating functionality development that leads to spin-off. While self-propagation can be expected in steady growth by fitting to LGDCC, it cannot be expected to have rapid growth.
Figures in parenthesis indicate t-statistics: all significant at the 1% level except *3: 5%, *5: 15%, *6: 20%, x: non-significant.

40
Fig. 31. Correlation between Centralization of Wage Setting and Union and CBA Density in 19 Countries in the Late 1990s. CBA: Collective bargaining agreements. Union and CBA density = (Union density + CBA coverage)/2Sources: Warner (2002), The Global Competitiveness Report 2015-2016 (World Economic Forum, 2015).
(2) Institutional Elasticity of the Host
Flexibility of wage setting (not centralized ratio)
Uni
on a
nd C
BA
den
sity
Ranking of flexibility of wage determination

Functional Development level
Rapid growth Steady growth
Resistance to new innovation
Elastic nation/city
Non-elastic nation/city
Time
Level ofFunctionality Development,Institutional elasticity
Co-
evol
utio
n w
ith in
stitu
tion
Dis
enga
gem
ent
from
inst
itutio
n
GermanyFrance
SingaporeSaudi Arabia
Tokyo
Finland
Non-adaptive level
Fig. 32. Scheme of Adaption of Uber in Institutional Systems .
)()(11
1
tYtY
a
FD
Uber Adaption in Countries/Cities depending on Growth Rate and Institutional Elasticity
43
Growth rate
42
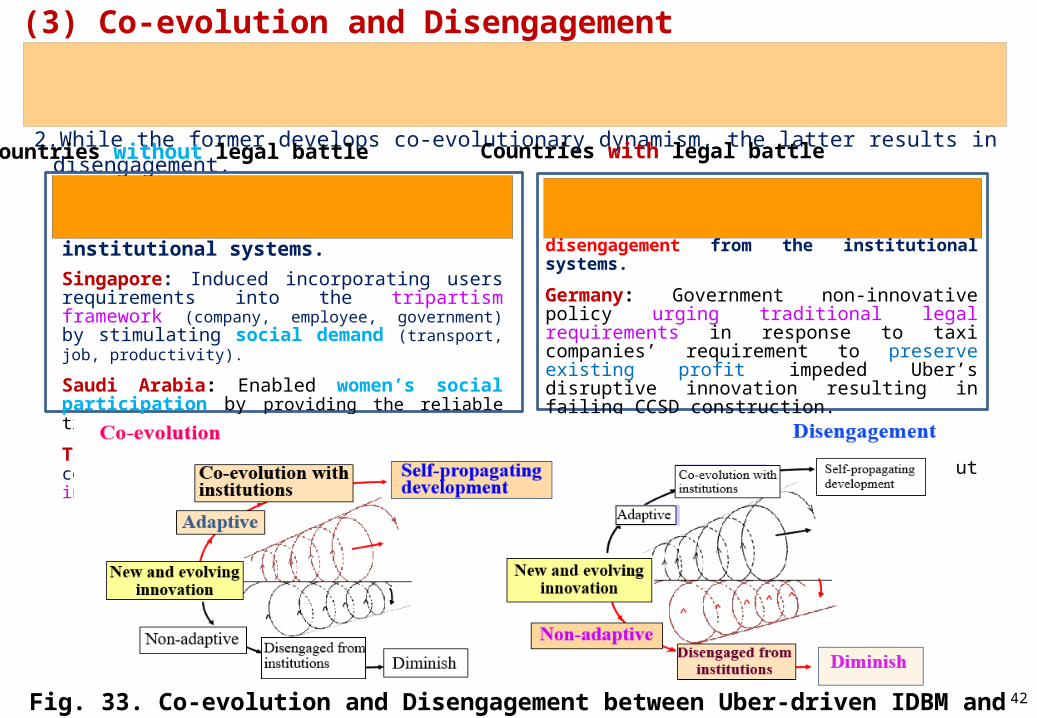
1. Contrast between countries with and without legal battles can be attributed to with or without CCSD (Consolidated Challenge to Social Demand).
2. While the former develops co-evolutionary dynamism, the latter results in disengagement.
Fig. 33. Co-evolution and Disengagement between Uber-driven IDBM and Institutional Systems.
(3) Co-evolution and Disengagement
Countries without legal battle Countries with legal battle Uber induced CCSD leading to a co-evolution between ride-sharing revolution and advancement of the institutional systems. Singapore: Induced incorporating users requirements into the tripartism framework (company, employee, government) by stimulating social demand (transport, job, productivity).
Saudi Arabia: Enabled women’s social participation by providing the reliable transportation leading to a co-evolution.
Tokyo: Stimulated better service seeking competitive market, broader stakeholders involvement for social demand solution.
Traditional quasi-monopolistic market protected by non-innovative government impeded Uber’s revolution resulting in disengagement from the institutional systems.
Germany: Government non-innovative policy urging traditional legal requirements in response to taxi companies’ requirement to preserve existing profit impeded Uber’s disruptive innovation resulting in failing CCSD construction.
France follows the similar results.Finland: Suspicious to illegal, but connive to operate.

(4) Co-evolutionary Acclimatization -ICT-driven Disruptive Business Model with Consolidated Challenge to Social Demand
Host: Uber introducing countries/cities
Harness the vigor of counterparts(CCSD)
Co-evolutionary acclimatization
Bi-polarization between ICT advanced and growing group
Fig. 34. Scheme for ICT-Driven Disruptive Business Model with Consolidated Challenge to Social Demand (IDBM – CCSD).
Thus, ICT-Driven Disruptive Business Model with Consolidated Challenge to Social Demand (IDBM – CCSD) by harnessing the vigor of counterparts would be decisive for resilient IDBM.
45
Computer initiated ICT Taxi
Internet Uber

44
2.5 Lessons from Success Model 2.5.1 IDBM with CCSD (1) CCSD in Success
Table 5 Structure in CCSD in Success Countries/Cities
Consolidated challengeby all stakeholders
Social demand Co-evolutionary acclimatization
Singapore Tripartism framework User involvement Company, employee, user, government consolidation
Traffic service, Job opportunity, Overall productivity enhance,Digital innovation
Tripartism framework,Well developed infrastructure,Innovation seeking spirit
Saudi Arabia Women (user, employee)
Company involvement
Government involvement
Women’s social participation, Education, Industrial structure
Strong inertia to women’s social participation,Affluent financial base
Japan User welcome Company, employee concern Government involvement
Traffic service, ICT advancement, e-commerce, Depopulation, Aging society
High potential demand,Demanding nature,Matured competitive environment

45
NTUC this Week, 26 Jan. 2007 (NTUC: National Trades Union Congress).
(2) Lessons from Tripartism
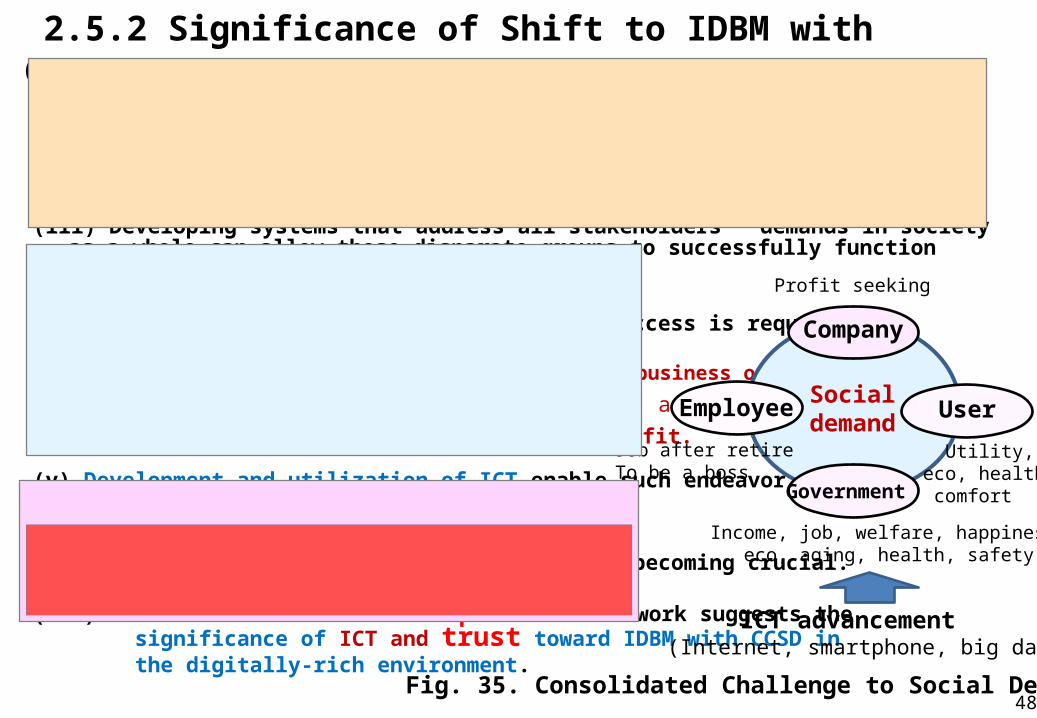
2.5.2 Significance of Shift to IDBM with CCSD(i) Nowadays, a key factor in obtaining business opportunities is the ability to solve social demand. [SD]
(ii) A company to gain a profit must consolidating all stakeholders: company, employee, user, and government with respective heterogeneous objectives.
(iii) Developing systems that address all stakeholders’ demands in society as a whole can allow these disparate groups to successfully function together. [CC]
(iv) The company that can attain such system success is required following abilities: (a) Penetrate the social demand that can be its business opportunity, (b) Organize and orchestrate all stakeholders, and (c) Attain the system success thereby gain profit.
(v) Development and utilization of ICT enable such endeavor. [IDBM]
(vi) Thus, shifting to IDBM with CCSD has been becoming crucial.
(vii) Function of trust-based tripartism framework suggests the significance of ICT and trust toward IDBM with CCSD in the digitally-rich environment.
Company
Employee User
Government
Socialdemand
Profit seeking
Job after retireTo be a boss
Utility,eco, health, comfort
Income, job, welfare, happiness,eco, aging, health, safety
ICT advancement (Internet, smartphone, big data )
48Fig. 35. Consolidated Challenge to Social Demand.

47
3. Trust-based Education toward Digitally-rich Learning Environments 3.1 Co-evolution with Trust as a Consequence of IDBM with CCSD (1) Consequence of IDBM with CCSD
Fig. 36. Consequence of IDBM with CCSD.
Own experiences+
Past information
Decrease risk and uncertainty
Enhance trust

Fig. 37. Scheme of Spinoff Dynamism.
UberRide sharing
evolution
DILE (Digitally-rich Innovative Learning Environments)
48
(2) Spinoff from Traditional Co-evolution to Un-captured GDP oriented New Co-evolution
Spinoff
Transforming
Infusing
Applying
Emerging
Digital economy
Shiftingfrom trust in personalityto trust in system of augmented reality (AR)

49
3.2 Co-evolution between ICT, Trust and Higher Education (1) Comparison in 20 Countries
Fig. 38-2. Higher Education (2013). Fig. 38-3. Trust in Teachers (2013).
Fig. 38-1. ICT Advancement (2012-2015 average).

50
(2) ICT-driven Education Development
Fig. 39. ICT-driven Education Development in 120 Countries (2013).
atbeNY
NYaY
dtdY
1)1(
IACISC
IGC
ICT advancement (Z)
Hig
her e
duca
tion
(Y)

51
(3) Correlations
Table 6 Co-evolution and Disengagement between ICT, Educational Level, and Trust in Teachers
Fig. 40-1. Correlation between Higher Education and Trust (2013). Fig. 40-2. Correlation between ICT and Trust (2013).
+: Co-evolution- : Disengagement
Y
X
X
Z
Why trust decrease as ICT advance?
(1)
(2)
(3)
( < 0)
IAC
ISC
IGC
IACISC
IGC
872.0. 2Radj IAC ISC IGC IAC ISC IGC 848.0. 2Radj
D: Dummy (D1: IAC, D2: ISC, D3: IGC, D: Jpan, Kor, Isr, Chz =1, Others = 0). Figures in parenthesis: t-statistics (all significant at the 1 % level, except **: 3%)

52
3.3 Structural Sources of Trust Decrease as ICT Advance(1) Bi-polarization
Fatality
(2) ICT Elasticity to Trust
(3) Composition of ICT Elasticity to Trust (4) ICT Elasticity to Higher Education
IGCISC IAC
IAC: ICT advanced countriesISC: ICT semi-advanced countriesIGC: ICT growing countries
1. Trust decrease
( ) )
depends on stage of
ICT advancement.
2. ISC suffers a vicious cycle between Z and Y.
53
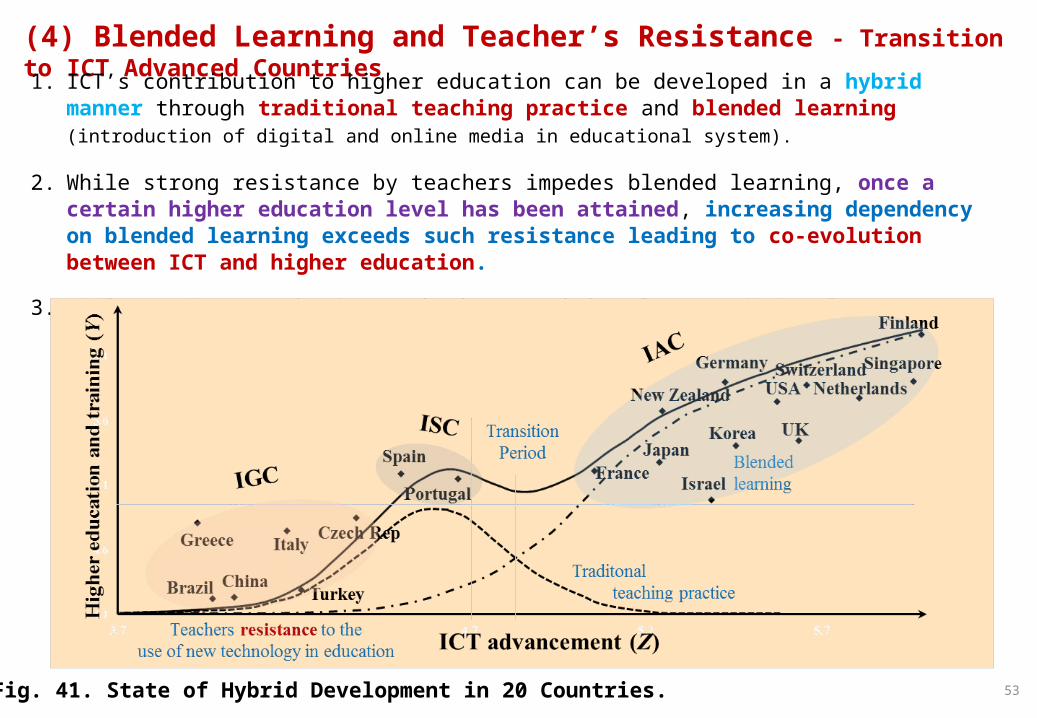
(4) Blended Learning and Teacher’s Resistance - Transition to ICT Advanced Countries
Fig. 41. State of Hybrid Development in 20 Countries.
1. ICT’s contribution to higher education can be developed in a hybrid manner through traditional teaching practice and blended learning (introduction of digital and online media in educational system).
2. While strong resistance by teachers impedes blended learning, once a certain higher education level has been attained, increasing dependency on blended learning exceeds such resistance leading to co-evolution between ICT and higher education.
3. While IAC has attained, ISC is in transition from traditional to blended learning overcoming resistance.
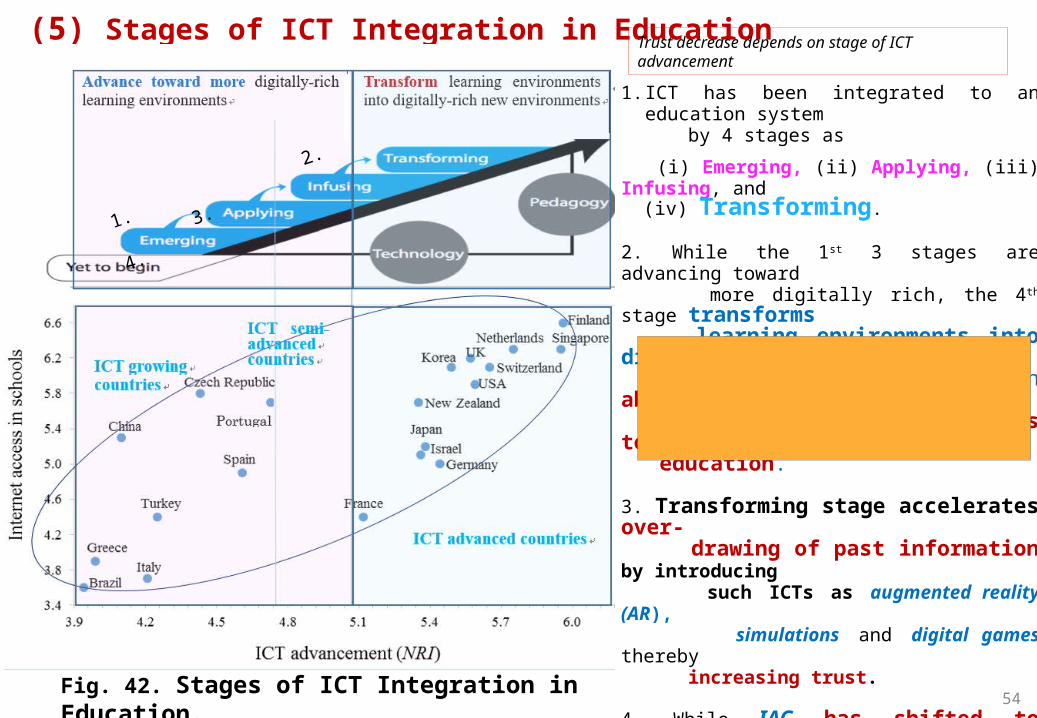
54Fig. 42. Stages of ICT Integration in Education.
(5) Stages of ICT Integration in Education
1. ICT has been integrated to an education system by 4 stages as
(i) Emerging, (ii) Applying, (iii) Infusing, and (iv) Transforming.
2. While the 1st 3 stages are advancing toward more digitally rich, the 4th stage transforms learning environments into digitally-rich new environments that can absorb and apply ICT-driven new services to higher education.
3. Transforming stage accelerates over- drawing of past information by introducing such ICTs as augmented reality (AR), simulations and digital games thereby increasing trust.
4. While IAC has shifted to transforming stage and constructed a virtuous cycle between ICT and trust by overdrawing past information. ISC and IGC have remained non-transforming stage thereby suffered a vicious cycle between ICT and trust.
1. 2
. 3.
4.
Trust decrease depends on stage of ICT advancement

55
)11(FD
aYdZdY
Overdrawing past information
3.4 Co-evolutionary Acclimatization toward Digitally-rich Learning Environments – Harness the vigor of Past Information (1) Reconstruction of a Virtuous Cycle
ISC, IGC IAC
Shifting to higher productivity level by harnessing the vigor of past information
Fig. 43. Co-evolutionary Acclimatization Harnessing the Vigor of Past Information.dYdZ
dYdZ
2,0
0)2()(
1
)1(1
1
2
NYanddZdYwhen
dZdYNY
YYN
aYdZd
dZd
dYdZ
dZd
NY
dZdY
Z
Enables absorption and application of ICT-driven new services for higher education, which hitherto could not be afforded (Un-captured GDP)
Reconstruct a virtuous cycle by overcoming trap in ICT advancement
Transformative ICT

56
Current Past Future
National Economy
Uber Sleeping resources
Digital learning Time
Music/Game Memory Dream
(2) Transformative Direction of Co-evolutionary Acclimatization Target
Fig. 44. Transformative Direction of Co-evolutionary Acclimatization Target in ICT-driven Disruptive Business Model.
Increasing significance of co-evolutionary acclimatization for ICT-driven disruptive business model.
Its target has been shifting from current economy (e.g., economic growth in growing economies) to sleeping resources (e.g., Uber’s ride sharing revolution), past time (e.g., trust-based higher education), and to past memory/future dream (e.g., digital music, game).

57Fig. 45. Optimal Dynamism Harnessing the Vigor of Time, Memory, Dream.
ICT advance T (Z)
)(dYdZ
dYdT
(3) Optimal Dynamism Harnessing the Vigor of Time, Memory, Dream
Co-evolutionary Acclimatization
Enables absorption and application of ICT-driven new services, which hitherto could not be afforded (Un-captured GDP)
Past experiences Current resourcesFuture dream
58
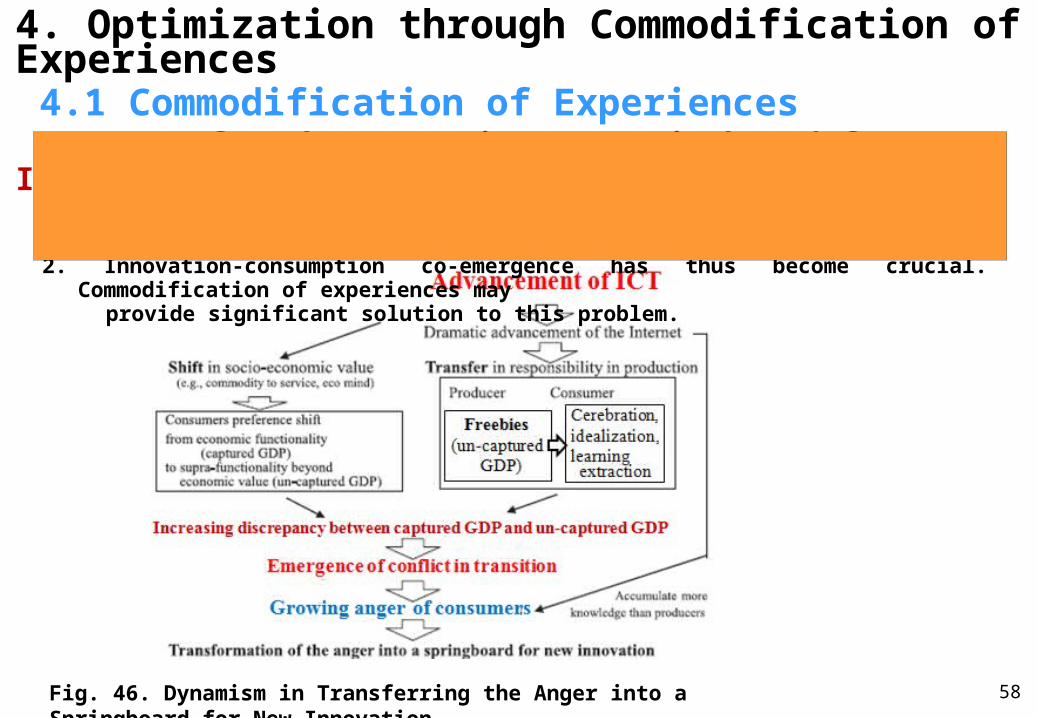
4. Optimization through Commodification of Experiences 4.1 Commodification of Experiences (1) Transfer the Anger into a Springboard for New Innovation
1. Shift of consumers preference from economic functionality to supra-functionality beyond economic value emerges conflict in the transition leading to growing anger of consumers.
2. Innovation-consumption co-emergence has thus become crucial. Commodification of experiences may provide significant solution to this problem.
Fig. 46. Dynamism in Transferring the Anger into a Springboard for New Innovation.

59
(2) From Invisible Hand of God to Voiceless Voice of Consumers
Fig. 47. Scheme in Conceptualizing Invisible Voice of Consumers.
Optimization
60
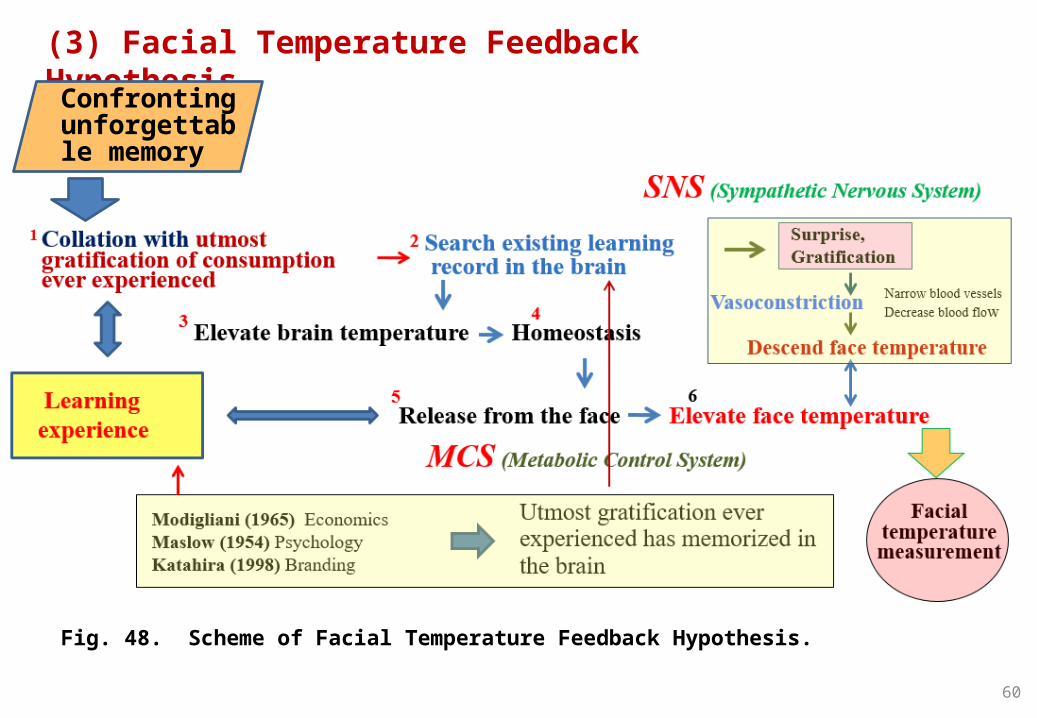
Fig. 48. Scheme of Facial Temperature Feedback Hypothesis.
(3) Facial Temperature Feedback Hypothesis
Confrontingunforgettable memory

(1) MethodologyMonitor the consumers’ facial temperature by the thermography: novel psychophisiologal measuring technique enables observation in the objective circumstances without providing any cautions to examinees.
Record in a PC
Analyze the recorded data by the exclusive software “FLIR Research IR” (able to identify a pin-point temperature)
33.4
4.2 Demonstration by Experiment (a) With the measurement of the relationship between attractive goods and consumers’ facial temperature elevations at the leading supermarkets in Japan and Finland.
(b) Demonstrate facial temperature feedback hypothesis.
63

Event wagon on which sweetened ban is displayed (15 February)
Installation of PC for data recording (15 February)
Hanging situation of the thermography (15 February)
Shelf on which PC is stalled (15 February)
Positions of event wagon and the thermography (15 February)
Angle of the thermography and target of monitoring (21 February)
64
(2) Pilot Experiment at a Leading Supermarket 1) Tokyo
Fig. 49. Pilot Experiment at a Japanese Leading Supermarket in Tokyo (February 16-21, 2011).
Melon-breadwith reasonable price, attractive enough to empting shoppers appetite

2) Finland Cosmetics corner of Sokos Supermarket (7 March 2012)
Cosmetics corner Thermography connected to PC
Shoppers accessing to cosmetics corner
Examining anticipating cosmetics Inducement by
sales promoter Trial makeup
65Fig. 50. Pilot Experiment at a Finish Leading Supermarket in Jyvaskyla (March 6, 7 2012).

31.0
31.5
32.0
32.5
33.0
33.5
34.0
1 2 3 4 5 6 7
Accessed to the event corner
PerceivedRecognized
Decided to purchase
31.4 31.731.7 31.6 31.9 31.7 33.3
Further perceived
Further recognizedAccessed to the event corner
Perceived Further perceived Recognized
Further recognized
Resemble past learning Surprise Rememberpast learning Gratification Correspondence with
gratification experienced
Face temperature
MCS SNS MCS SNS MCS
(3) Empirical Results – Tokyo 1) Facial temperature
31.4 ℃ 31.7 31.7 31.6 31.9 31.7 33.3
MCS: Metabolic Control System (elevate temperature), SNS: Sympathetic Nervous System (descend temperature)
Fig. 51. Standard Pattern of Facial Temperature Change in Purchased (Tokyo).
Decided to purchase
Facial temperatures elevate recalling gratification ever experienced.
66
2/19 15:00-16:00
2/19 16:00-17:00
2/19 17:00-18:00
2/20 15:00-16:00
2/20 16:00-17:00
2/20 17:00-18:00
2/20 18:00-19:00
0
2
4
6
8
10
12
14
16
18
20
0 100 200 300 400 500 600 700
S
X
Salesvolume: S
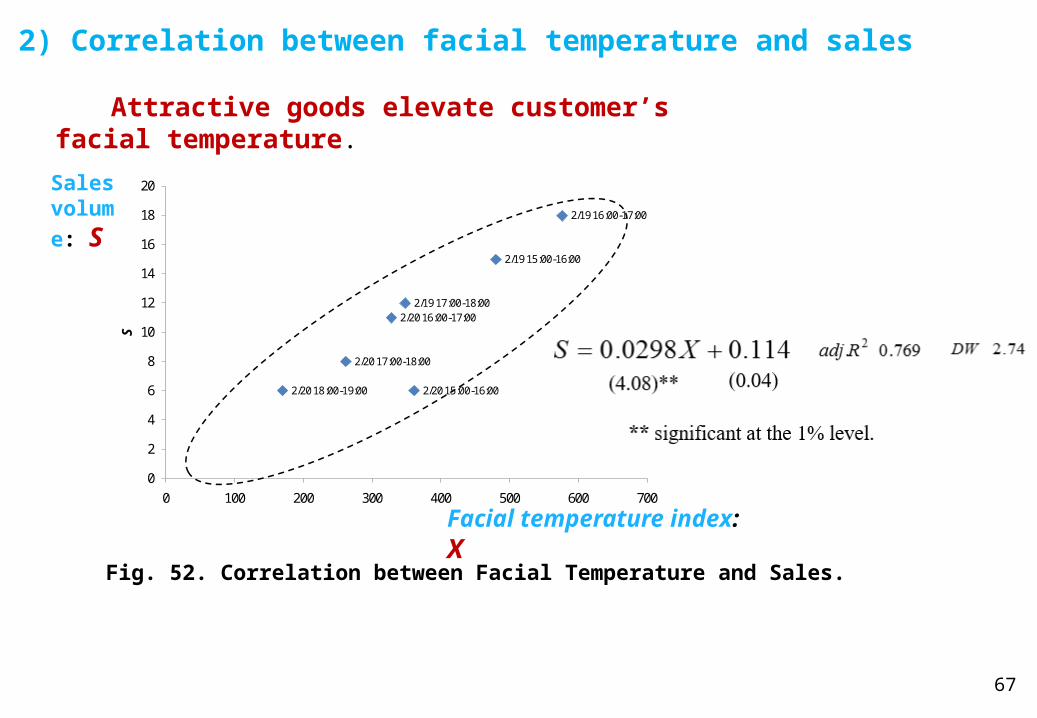
2) Correlation between facial temperature and sales
Attractive goods elevate customer’s facial temperature.
Facial temperature index: X
67
Fig. 52. Correlation between Facial Temperature and Sales.
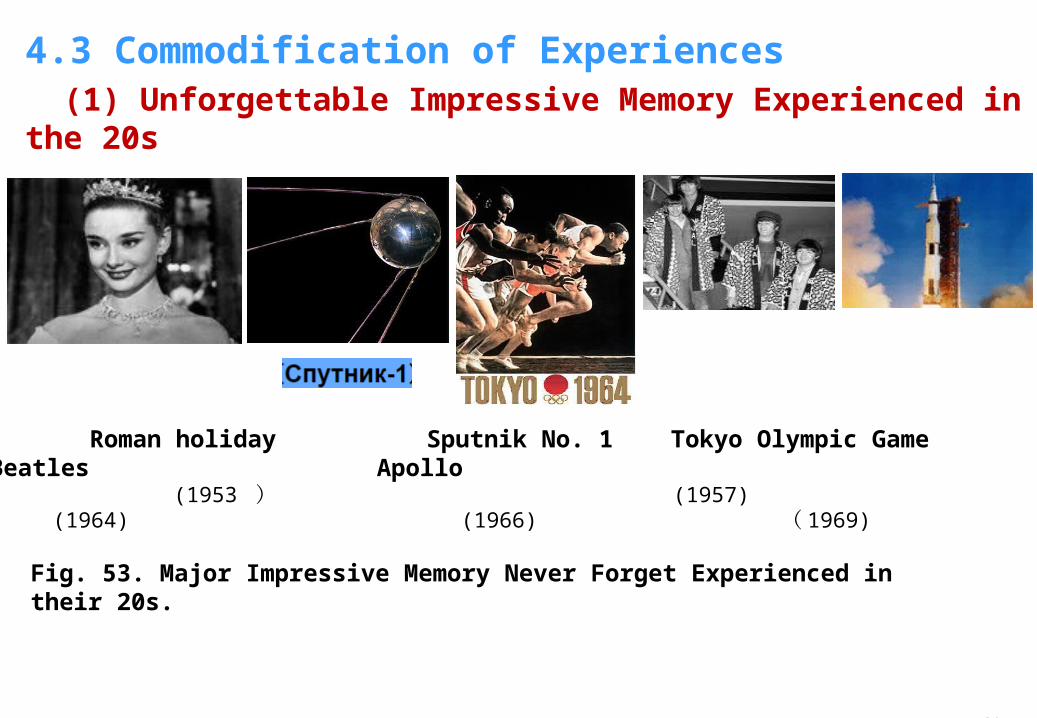
Roman holiday Sputnik No. 1 Tokyo Olympic Game Beatles Apollo (1953 ) (1957) (1964) (1966) ( 1969)
4.3 Commodification of Experiences (1) Unforgettable Impressive Memory Experienced in the 20s
68
Fig. 53. Major Impressive Memory Never Forget Experienced in their 20s.

69
(2) Sublimation of 20s Experiences into Supra-functionality beyond Economic Value Social value
Cultural value
Aspirational value
Tribal value
Emotional value
Energy saving
Small is beautiful
Eco
Cool
Sensitivity
Private brand
Voluntary social service
Aesthetic senseQuiet simplicity
Distance between firms and society, Creation of social valueSocial welfare, Support of social disabilityCreation of social communication, Contribution to social platformContribution to social needs (e.g. PV)Shifting from tough agreement to loose agreement
Brand value, Private brand (PB)Solicitation of saving mindAesthetic sense, Quiet simplicity, Cool, Cute, J-senseVoluntary participation
Sensitivity of Japanese products (Steve Jobs aspired)Authentic goods, Goods with high-grade senseProfessional, Rich
Sense of recognizing own position Fellow feeling, PatriotismRe-recognition of Made in Japan
Symbolic meaningFive senses, SensitivityOnly one
Casio-mini Cassette-tape Apple II Carry-compo Walkman PC Card calculator (Casio) (Sony) (Apple) (Apple) (Sony) (NEC) (Sharp)
Cup noodle
Bulgaria yogurt
Chipstar
Surprise chocolate
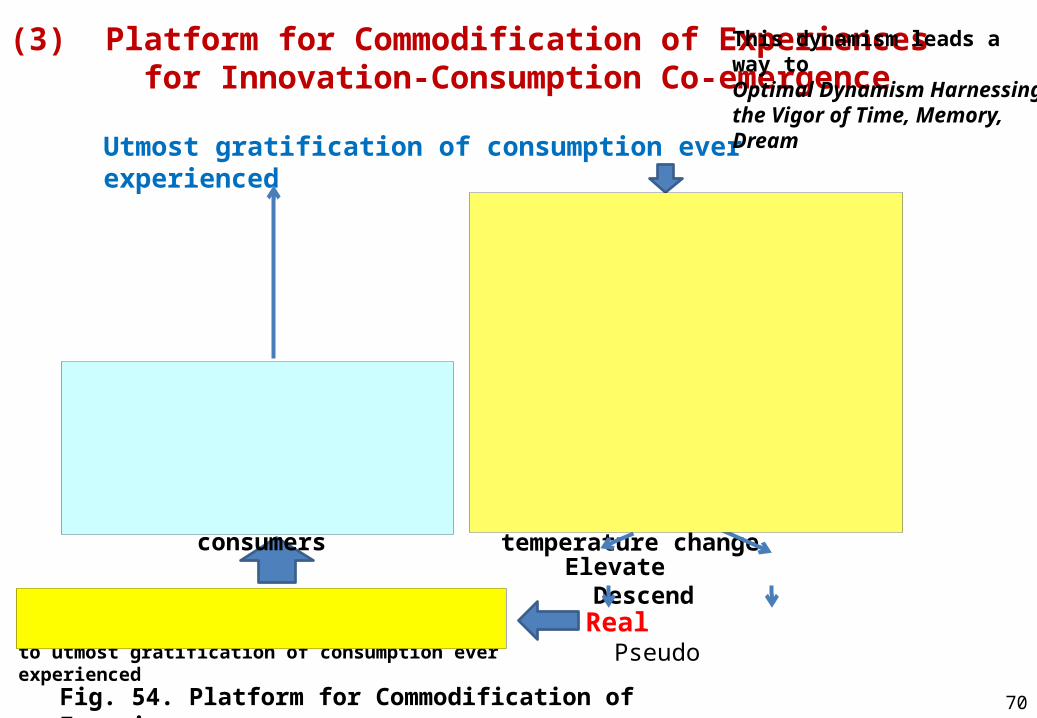
(3) Platform for Commodification of Experiences for Innovation-Consumption Co-emergence
Utmost gratification of consumption ever experienced
Memorize in the brain
Similar innovative goods/services
Collate with memory of utmost gratification
Facial temperature change
Elevate Descend
Awake sleeping experiences on utmost gratification once experienced
Real PseudoCommodification of experiences corresponding to utmost gratification of consumption ever experienced
Fig. 54. Platform for Commodification of Experiences.
Induce resonance betweeninnovative goods and consumers
Trigger innovation-consumption co-emergence
70
This dynamism leads a way to Optimal Dynamism Harnessing the Vigor of Time, Memory, Dream

69
5. Harness the Vigor of Memory and Dream 5.1 Digital Music as a Platform for Retrieving Music Information – Bridging Digital Innovation to the World of Memory Retrieval
(1) Approach1. The advancement of the Internet has changed the way of business and daily life dramatically. Evolutional change in the music industry over the last decade can be one of the most striking example.
2. Fundamental source of this evolution can be attributed to the dramatic advancement of the Internet- mediated technologies that enabled constructing a platform for retrieving music information thereby customers can enjoy music ubiquitously by their own initiative.
3. This platform provides significant insight in bridging digital innovation to the world of memory retrieval.
4. Given the increasing significance of memory retrieval in creating customer initiated business model in the digital economy, dynamism of this platform should be analyzed.

Adoption of Digital music
Enable customers to enjoy music ubiquitously by own initiatives
Music information retrieval (MIR)
MIR enabled applications
70
Fig. 55. Platform of Digital Music Industry.
Platform
MUSIC ENVIRONM
ENT
PAST EXPERIENCES
Internet-mediated technologies
Digital innovation
Musical MomentListen Music
Cognitive itch Stuck in head
Appreciate & Memorize
Striking / intriguing
Hooked Catchy part Invoke
Past memories
Emotionally, structurally, perceptually
Catchy part of the song
Mediation tools
Description
Search music by Singing or humming, natural language search, keyboard search, similarity search, text search etc.
Music service providers, music search engines, music generators etc.
Enable to categorize, manipulate and even create music (Recommender systems, track separation, instrument recognition, auto transcription, categorization and music generation etc.)
Customers
Key features
Substitution for physical music
New style of music treat (search, deep discovery, listening,
personalization and sharing)
Music intelligence enabled services
Transformation to music information
(2) Platform of Digital Music Industry

71
(3) Empirical AnalysesOn the basis of the empirical analysis of the development trajectory of the music industry in the world over the last 4 decades, unique dynamism of the music industry enabling to retrieve information identical to music is elucidated.
Conceptualization of this dynamism applicable to business model construction in the digital economy is also attempted.
1) Substitution Dynamism 1. Digital music for physical music (1974-2014) monthly 2. Within digital music (2004-2014) monthly
Logistic growth within a dynamic carrying capacity (self-propagation function) Bi-logistic growth, tri-logistic growth (substitution dynamism)
2) Institutional Factors Contrasting Heterogeneous Dependency on Digital Music 1. 50 countries in 2007 – 2014 (comparison between 2007, 2010 and 2014?) 2. Music: Subscription vs streaming ? Institutional factors: Global Competitiveness Report, Global Information Technology Report
Principal Component Analysis Factor Analysis
Note Demand pattern of digital music Almost all data are supply side (e.g., sales, revenues)
72
5.2 Social Gaming as a Platform for Harnessing the Vigor of Dream
6. Conclusion
75
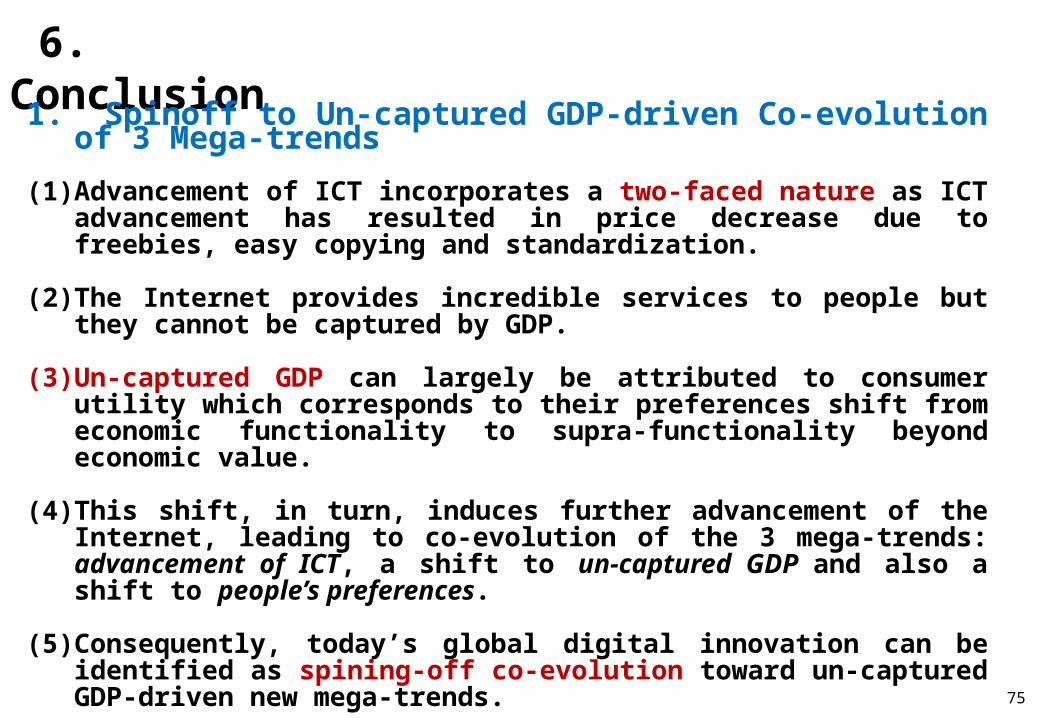
1. Spinoff to Un-captured GDP-driven Co-evolution of 3 Mega-trends(1) Advancement of ICT incorporates a two-faced nature as ICT advancement has
resulted in price decrease due to freebies, easy copying and standardization.
(2) The Internet provides incredible services to people but they cannot be captured by GDP.
(3) Un-captured GDP can largely be attributed to consumer utility which corresponds to their preferences shift from economic functionality to supra-functionality beyond economic value.
(4) This shift, in turn, induces further advancement of the Internet, leading to co-evolution of the 3 mega-trends: advancement of ICT, a shift to un-captured GDP and also a shift to people’s preferences.
(5) Consequently, today’s global digital innovation can be identified as spining-off co-evolution toward un-captured GDP-driven new mega-trends.
6. Conclusion (2)
76
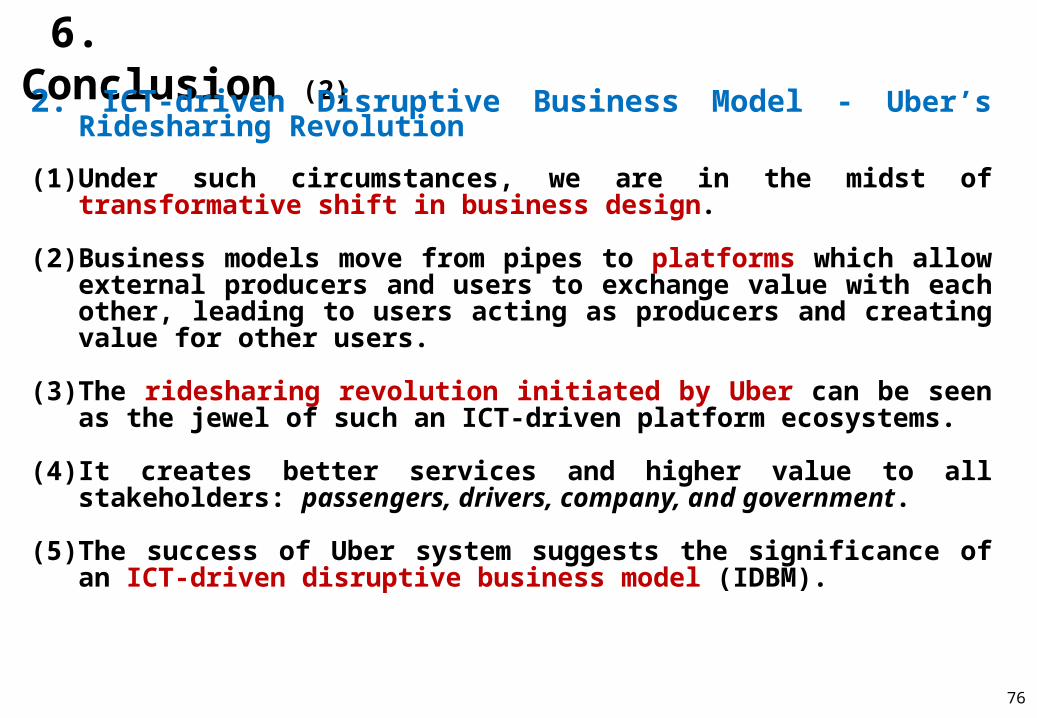
2. ICT-driven Disruptive Business Model - Uber’s Ridesharing Revolution
(1) Under such circumstances, we are in the midst of transformative shift in business design.
(2) Business models move from pipes to platforms which allow external producers and users to exchange value with each other, leading to users acting as producers and creating value for other users.
(3) The ridesharing revolution initiated by Uber can be seen as the jewel of such an ICT-driven platform ecosystems.
(4) It creates better services and higher value to all stakeholders: passengers, drivers, company, and government.
(5) The success of Uber system suggests the significance of an ICT-driven disruptive business model (IDBM).

6. Conclusion (3)
2.-2 Consolidated Challenge to Social Demand for Resilient Platforms (1) While Uber has expanded rapidly worldwide, the contrast between co-
evolutionary success and legal battles with host countries/cities has become distinct.
(2) This can be attributed to the bi-polar nature of ICT’s rapid advancement, suggesting the significance of harnessing the vigor of counterparts.
(3) Lessons from successful co-evolution suggest the significance of IDBM with CCSD (consolidated challenge to social demand).
(4) Thus, IDBM with CCSD suggest the significance of resilient platform ecosystems that incorporate contingency.
77

6. Conclusion (4)
78
3. Trust-based Education toward Digitally-rich Learning Environments (1) Lessons of IDBM with CCSD suggest the significance of ICT and trust toward the
digitally-rich learning environments.
(2) While ICT advanced countries have embarked on co-evolution between ICT, higher education and trust, ICT growing countries have not been successful in this due to a vicious cycle between ICT and trust.
(3) This co-evolution can be attributed to co-evolutionary acclimatization by harnessing the vigor of past information thereby absorption and application of ICT-driven new services for higher education, which hitherto could not be afforded, were enabled. This is equivalent to un-captured GDP emergence.
(4) With the notion that trust depends on overdrawing of past information, such business model as constructing co-evolutionary acclimatization by harnessing the
vigor of time should be envisioned.
6. Conclusion (5)
79
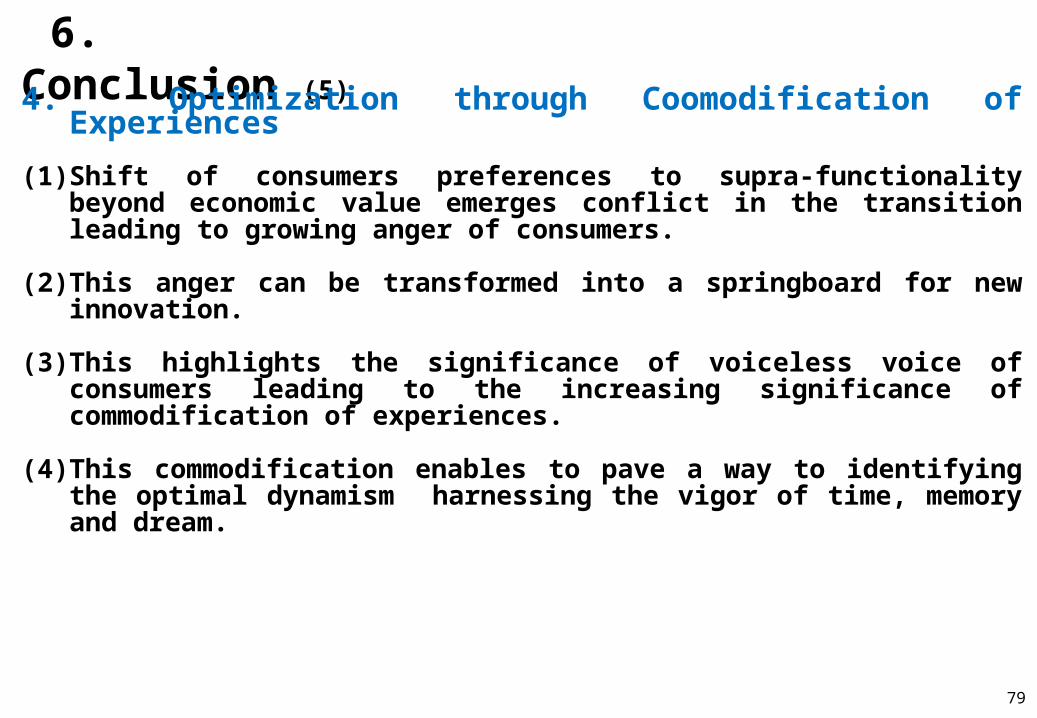
4. Optimization through Coomodification of Experiences(1) Shift of consumers preferences to supra-functionality beyond economic value
emerges conflict in the transition leading to growing anger of consumers.
(2) This anger can be transformed into a springboard for new innovation.
(3) This highlights the significance of voiceless voice of consumers leading to the increasing significance of commodification of experiences.
(4) This commodification enables to pave a way to identifying the optimal dynamism harnessing the vigor of time, memory and dream.

78
References1. C. Watanabe, K. Naveed, P. Neittaanmaki and B. Fox, “Consolidated Challenge to Social Demand for Resilient Platforms: Lessons from Uber’s Global Expansion,” Technology in Society (2016) in print.
2. C. Watanabe, K. Naveed, P. Neittaanmaki, “Co-evolution of Three Mega-trends Natures Un-Captured GDP: Uber’s Ride-sharing Revolution,” Technology in Society 46 (2016) 164-185. 3. C. Watanabe, K. Naveed, P. Neittaanmaki and Y. Tou, “Operationalization of Un-captured GDP: Innovation Stream under New Global Mega-trends,” Technology in Society 45 (2016) 58-77. 4. C. Watanabe, K. Naveed and P. Neittaanmaki, “Dependency on Un-captured GDP as a Source of Resilience Beyond Economic Value in Countries with Advanced ICT Infrastructure: Similarity and Disparities between Finland and Singapore,” Technology in Society 42 (2015) 104-122. 5. C. Watanabe, K. Naveed and W. Zhao, “New Paradigm of ICT Productivity: Increasing Role of Un- captured GDP and Growing Anger of Consumers,” Technology in Society 41 (2015) 21-44.
6. C. Watanabe, “Innovation-Consumption Co-emergence Leads a Resilience Business,” Innovation and Supply Chain Management 7, No. 3 (2013) 92-104.
7. C. Watanabe, W. Zhao and M. Nasuno, “Resonance between Innovation and Consumers: Suggestions to Emerging Market Customers,” Journal of Technology Management for Growing Economies 3, No. 1 (2012) 7-31.
Appendix I. Measurement of Un-captured GDP
81
Un-captured GDP ratio
(1) Spin-off State
Simple logistic growth Carrying capacity enhance Logistic growth within a dynamic carrying capacity
Self-propagating dynamism by spinning off to higher functionality level
Finland
Singapore
Finland
Singapore
Finland has spun-off to new co-evolution while
Singapore remains traditional co-evolution.
82
D: Dummy variable (2002-2005 = 1, other years= 0; During the period of stagnation due to the bursting of the Net bubble.)
*, *** : Significant at the 1% and the 10% level, respectively.
N a b ak bk c adj.R2
0.815(31.73)*
0.311(8.50)*
1.833(9.28)*
0.965
1.000(8.47)*
1.123(2.35)*
23.519(1.19)***
0.149(3.75)*
2.734(4.80)*
0.047(20.43)*
0.985
N a b ak bk c adj.R2
0.344(63.61)*
0.591(10.57)*
16.58(3.71)*
0.982
0.344(63.46)*
0.591(10.59)*
16.58(3.71)*
1.00*10-9 (-)
1.00*10-9
(-) 0.982
Finland
Singapore
1994 2000 2005 2010 2013
1.0
0.8
0.6
0.4
0.2
0.0
Un-captured GDP ratio

81
Institutional factors Finland Singapore References
Small income disparity Inequality (GINI index: 2010)
Capacity for innovation Capacity for industry innovation
Association capacity and collaborative practices University-industry collaboration in R&D
Absorptive capacity Firm-level technology absorption
Trusting relationship Willingness to delegate authority Generosity (score) Freedom to make life choices (score)
Women in working life Women in labor force
Government ICT usage Importance of ICT to government vision Government online service Government success in ICT promotion
Labor-employer relationsCooperation in labor-employer relations
19
2
2
7
4 0.33 0.52
12
16 7 16
21
45
18
4
13
23 0.19 0.43
76
3 1 4
2
Distribution of Household Income by Source (ILO, 2012)
The Global Information Technology Report 2014 (WEF, 2014)
The Global Competitiveness Report 2013-2014 (WEF, 2014)
The Global Information Technology Report 2014 (WEF, 2014)
The Global Competitiveness Report 2013-2014 (WEF, 2014)World Happiness Report (The Earth Institute, Columbia Univ. et al., 2013)idem
The Global Competitiveness Report 2013-2014 (WEF, 2014)
The Global Information Technology Report 2014 (WEF, 2014)
idem
idem
The Global Competitiveness Report 2013-2014 (WEF, 2014)
Table A1.1 Engine and Brake in Finland and Singapore (2013) Figures indicate world rank otherwise indicated.
(2) Engine and Brake for Spin-off to the External Link
Finland’s advancement in shifting to new co-evolution can be attributed to its powerful engine.
While Singapore’s strong government initiatives in accelerating its ICT
advancement has played a significant role as an engine for the nation to be a world ICT leader, it resulted in the delay in transferring business initiative which is essential in shifting from traditional co-evolution to new co-evolution.
82
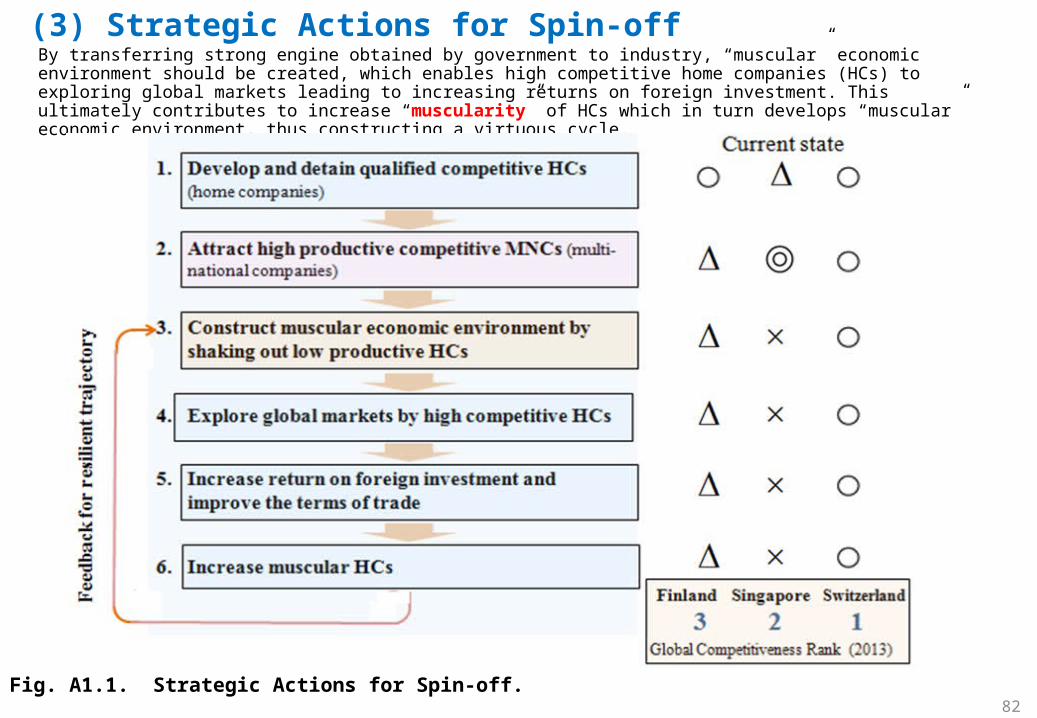
(3) Strategic Actions for Spin-off
Fig. A1.1. Strategic Actions for Spin-off.
By transferring strong engine obtained by government to industry, “muscular” economic environment should be created, which enables high competitive home companies (HCs) to exploring global markets leading to increasing returns on foreign investment. This ultimately contributes to increase “muscularity” of HCs which in turn develops “muscular” economic environment, thus constructing a virtuous cycle.

83
Appendix II. Uber’s Ride-sharing Revolution

Jun-
13
Aug
-13
Oct
-13
Dec
-13
Feb-
14
Apr
-14
Jun-
14
Aug
-14
Oct
-14
Dec
-14
Feb-
15
Apr
-15
Jun-
15
Aug
-15
0
10
20
30
40
50
60
AII.1 Uber’s Conspicuous Launch
Fig. AII.1. Trends in Uber and Taxi Trips in the US (Jun. 2013 – Sep. 2015).
Sources: Taxi: Fig. 3-2; Uber: authors’ estimate based on , where UT: Uber trip, TT: Taxi trip, UD: Uber share (Fig. 2) (See Appendix 1).
Trips per day
Uber
Taxi
TTUD
UDUT
1
84
UT
TT
Jun-
13
Aug
-13
Oct
-13
Dec
-13
Feb-
14
Apr
-14
Jun-
14
Aug
-14
Oct
-14
Dec
-14
Feb-
15
Apr
-15
Jun-
15
Aug
-15
$10
$12
$14
$16
$18
$20
$22
$24
Taxi
Uber
Average prices per trip
PT
PU
Fig. AII.2. Trends in Uber and Taxi Prices in NYC (Jun. 2013 – Sep. 2015).
Sources: Taxi: Fig. 3-3; Uber – Jun. 2013 - Nov. 2014: Lunden (2014): other period: authors ‘estimate based on TLC, Uber, Stone (2015) and Silverstein (2014) (See Appendix 1).
1. Corresponding to its astounding success, Uber’s prices continued to decline and reached in May 2014 the same level as taxis, The prices further declined with the introduction of UberPool in August 2014.
2. This decline in prices was reversed as a consequence of Uber’s surge pricing, which resulted in an “F” (flunk) rating from the Better Business Bureau (BBB) in Oct. 2014. BBB cited complaints over unexpectedly high charges.
3. In response to such complaints and also to competition from competitors such as Lyft, Uber managed to decrease prices by introducing Uber Go in Nov. 2014.
4. This move, together with the establishment of the Uber Advanced Technology Center in Feb. 2015, led to lower prices again in 2015.
2014/5 14/8 14/10 14/11 2015/1

AII.2 Institutional Enablers Creating Platform Ecosystems AII.2.1 Preference Shift to Sharing Economy
1. In line with people’s preferences shift from economic functionality to supra-functionality beyond economic value, sharing economy in physical products (i.e., rooms and cars) has been gaining momentum.
2. The underlining paradigm of the original sharing economy is that users aim at increasing resource-use efficiency. This is done either to lower costs or to create new value. The resources are offered to others at times when the owners do not use them themselves.
3. Online trading platforms such as Napster and eMula were amongst the first to provide users with a shared access to digital music and videos.
4. It was possible to download these digital products from lenders on the platform for free, and uploading and downloading happened simultaneously. This constitutes the very essence of sharing economy (Winterhalter et al., 2015).
5. People’s preference shift to supra-functionality has led to requests for a similar platform also for physical products. People wish to use such products (which were provided passively, primarily for their economic functionality) in a more sophisticated manner and by their own initiative (Adner, 2012).
6. Sharing economy for physical products (initiated by Uber and AirbnB: car transport and rooms, respectively) is needed by the market with such underlining paradigm.
85
PU decrease rate
Contribution byPeriod
SP increase rate UT increase rate Miscellaneous
-2.58 -0.911 x 1.34 = -1.22 -0.173 x 11.28 = -1.95 0.59 2013/6 - 2014/9
-2.34 -0.737 x 0.61 = -0.45 -0.359 x 11.14 = -4.00 2.11 2014/10 - 2015/9
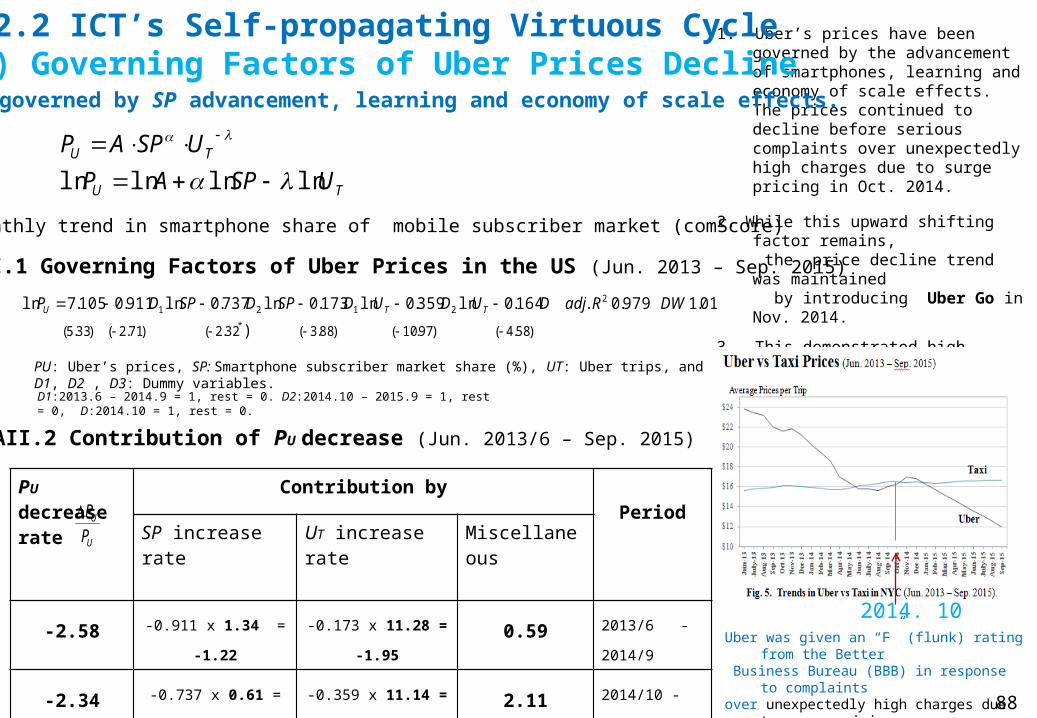
1. Uber’s prices have been governed by the advancement of smartphones, learning and economy of scale effects. The prices continued to decline before serious complaints over unexpectedly high charges due to surge pricing in Oct. 2014.
2. While this upward shifting factor remains, the price decline trend was maintained by introducing Uber Go in Nov. 2014.
3. This demonstrated high elasticity of trips to prices and compensated the
stagnation of smartphones’ share increase in 2015.
PU is governed by SP advancement, learning and economy of scale effects.
SP: monthly trend in smartphone share of mobile subscriber market (comScore)
TU
TU
USPAPUSPAP
lnlnlnln
Table AII.2 Contribution of PU decrease (Jun. 2013/6 – Sep. 2015) - % p.a
88
)58.4()97.10()88.3(32.2()71.2()33.5( )
01.1979.0.164.0ln359.0ln173.0ln737.0ln911.0105.7ln*
22121
DWRadjDUDUDSPDSPDP TTU
D1:2013.6 – 2014.9 = 1, rest = 0. D2:2014.10 – 2015.9 = 1, rest = 0, D:2014.10 = 1, rest = 0.
U
U
PP
Table AII.1 Governing Factors of Uber Prices in the US (Jun. 2013 – Sep. 2015)
2014. 10
PU: Uber’s prices, SP: Smartphone subscriber market share (%), UT: Uber trips, and D1, D2 , D3: Dummy variables.
AII.2.2 ICT’s Self-propagating Virtuous Cycle (1) Governing Factors of Uber Prices Decline
Uber was given an “F” (flunk) rating from the Better Business Bureau (BBB) in response to complaints over unexpectedly high charges due to surge pricing.

Fig. AII.4. Virtuous Cycle between Uber’s Trips and Its Prices (Jun. 2013– Sep. 2015).
Figures in parenthesis indicate t-statistics: all significant at the 1% level except #: 15% level.
)16.3()01.18()44.1()34.12()17.68( #
22131211 08.1957.0.573.1ln289.0ln270.0ln398.0639.3ln
DWRadjDUTDUTDUTDPU tttt
)63.4()45.16()52.3()27.20()09.24(
00.2991.0.887.33ln782.2ln275.9ln055.3979.10ln 2111 2321
DWRadjDPUDPUDPUDUT tttt
Fig. AII.3. Correlation between Uber’s Trips and Their Prices (Jun. 2013 – Sep. 2015).
Uber’s trips Uber’s prices
D1:2013.6– 2014.6 = 1, rest = 0.D2:2014.7 – 2014.11 = 1, rest = 0.D3:2014.12 – 2015.9 = 1, rest = 0.
PU: Uber’s prices,UT: Uber tripsD1, D2 , D3 Dummy variables.
D1:2013.6– 2014.6 = 1, rest = 0.D2:2014.7 – 2014.11 = 1, rest = 0.D3:2014.12 – 2015.9 = 1, rest = 0.
Source: Certify.
87
1. Uber’s prices demonstrated sharp decline as smartphones advanced.
2. This decline induced more Uber trips, which in turn further accelerated the decline of Uber’s prices.
3. Thus, a self-propagating virtuous cycle has been created in Uber’s development as demonstrated in Fig. AII.4.
0 10 20 30 40 50$10
$12
$14
$16
$18
$20
$22
$24
$26Jun. 2013
Sep. 2015
Uber’s trips
Ube
r’s
pric
es /
trip
2014/7
2014/11
(2) Virtuous Cycle between Uber Trips Increase and Their Price Decline

Jan-
04M
ay-0
4Se
p-04
Jan-
05M
ay-0
5Se
p-05
Jan-
06M
ay-0
6Se
p-06
Jan-
07M
ay-0
7Se
p-07
Jan-
08M
ay-0
8Se
p-08
Jan-
09M
ay-0
9Se
p-09
Jan-
10M
ay-1
0Se
p-10
Jan-
11M
ay-1
1Se
p-11
Jan-
12M
ay-1
2Se
p-12
Jan-
13M
ay-1
3Se
p-13
Jan-
14M
ay-1
4Se
p-14
Jan-
15M
ay-1
5Se
p-15
$0
$200
$400
$600
$800
$1,000
$1,200
$1,400
$1,600NYC Corporate Medallion Prices (1,000 US$)
Actual
May 2011: Uber launched in NYC
Mar. 2009Uber established
May 2014
Jun 2013: Medallion prices stagnate
Fig. AII.5. Trend in Corporate Medallion Prices and their Estimate without Uber in NYC (Jan. 2004 – Sep. 2015).Source: NYC Taxi and Limousine Commision (TLC).
90
(1) Medallion Prices as a Proxy of the Trend in Taxi Demand
AII.3 Co-evolution of 3 Mega-trends Leading to a Spinoff to Sharing Economy AII.3.1 Emergence of Un-captured GDP
* While advancement of ICT generally contributes to the enhancement of prices by increasing new functionality development, the dramatic advancement of the Internet tends to decrease ICT prices due to its freebies, easy copying and mass standardization, among other things.
Estimated medallion prices without Uber
Declinedue to Uber
Magnitude ofun-captured
GDP
Fig. AII.6. Two-faced Nature of ICT*.
Uncaptured GDP
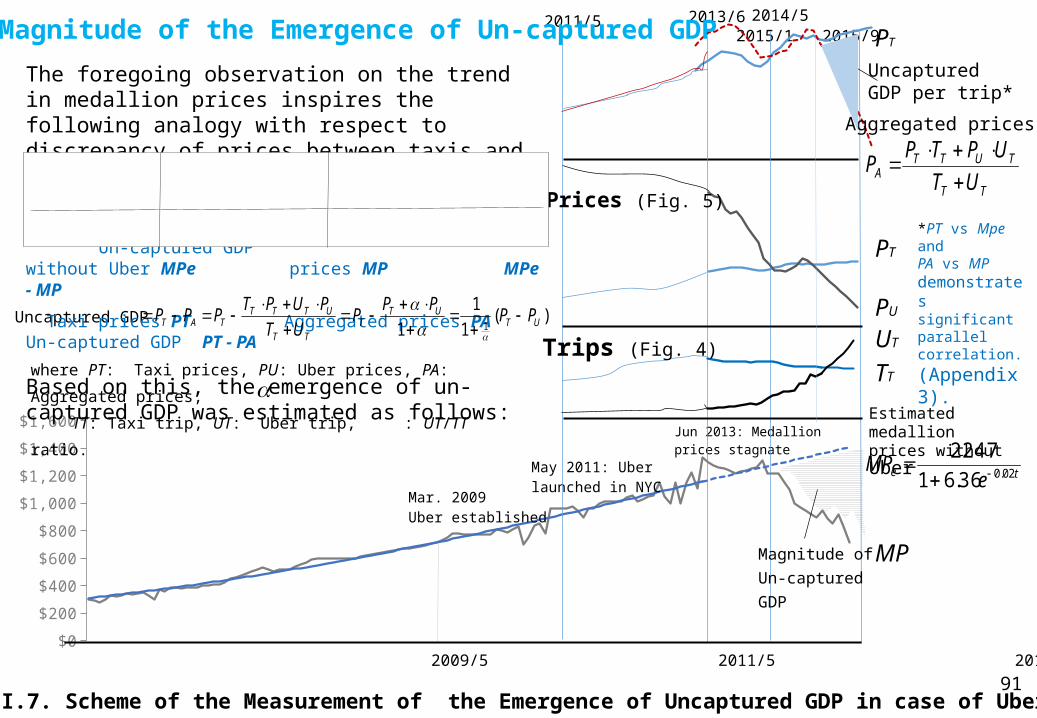
Fig. AII.7. Scheme of the Measurement of the Emergence of Uncaptured GDP in case of Uber in NYC.
$0
$200
$400
$600
$800
$1,000
$1,200
$1,400
$1,600
Mar. 2009Uber established
Jun 2013: Medallion prices stagnate
May 2011: Uber launched in NYC
2013/6 2015/1 2015/92014/52011/5PT
PT
PU
UT
TT
MP
Uncaptured GDP per trip*
912004/1 2009/5 2011/5 2013/6 2014/5 2015/9
Magnitude ofUn-captured GDP
)(1
11 1 UT
UTT
TT
UTTTTAT PPPPP
UTPUPTPPP
Uncaptured GDP
where PT: Taxi prices, PU: Uber prices, PA: Aggregated prices,
TT: Taxi trip, UT: Uber trip, : UT/TT ratio.
te eMP 02.036.61
2247
TT
TUTTA UT
UPTPP
(2) Magnitude of the Emergence of Un-captured GDPThe foregoing observation on the trend in medallion prices inspires the following analogy with respect to discrepancy of prices between taxis and Uber, as illustrated in Fig. 11:
Medallion prices Actual Medallion Un-captured GDPwithout Uber MPe prices MP MPe - MP
Taxi prices PT Aggregated prices PA Un-captured GDP PT - PA
Based on this, the emergence of un-captured GDP was estimated as follows:
Trips (Fig. 4)
Prices (Fig. 5)
Estimated medallion prices without Uber
Aggregated prices
*PT vs Mpe andPA vs MPdemonstrates significant parallel correlation.(Appendix 3).
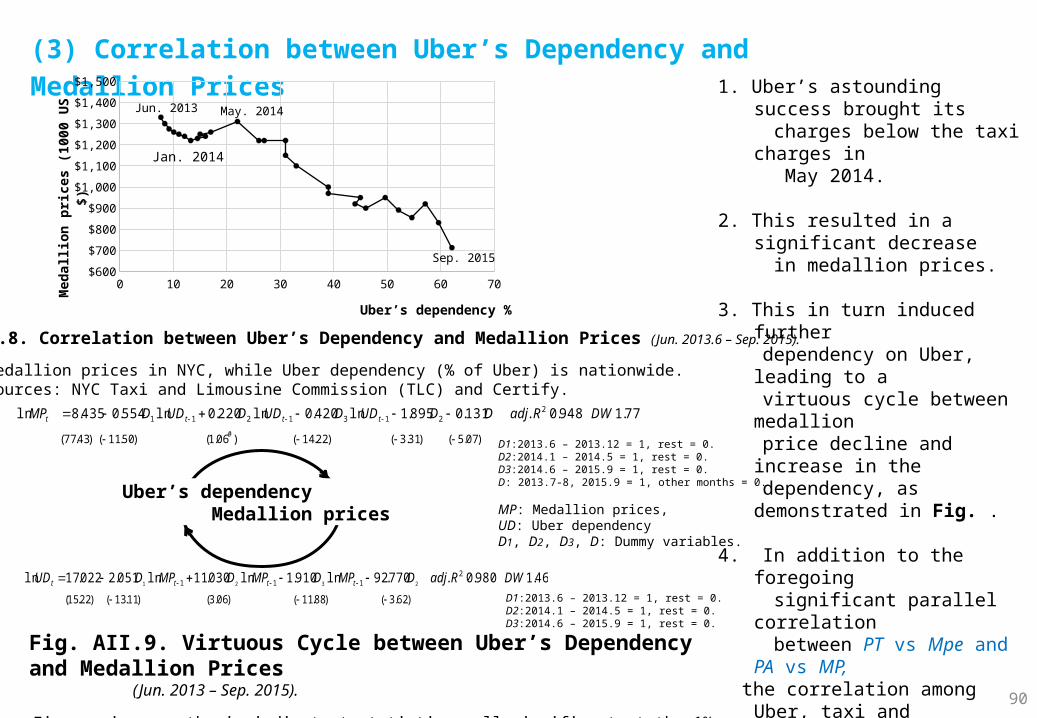
(3) Correlation between Uber’s Dependency and Medallion Prices
Fig. AII.9. Virtuous Cycle between Uber’s Dependency and Medallion Prices (Jun. 2013 – Sep. 2015).
Figures in parenthesis indicate t-statistics: all significant at the 1% level except #: 30% level.
)07.5()31.3()22.14()06.1()50.11()43.77( #
22131211 77.1948.0.131.0895.1ln420.0ln220.0ln554.0435.8ln
DWRadjDDUDDUDDUDDMP tttt
)62.3()88.11()06.3()11.13()22.15(
46.1980.0.770.92ln910.1ln030.11ln051.2022.17ln 2111 2321
DWRadjDMPDMPDMPDUD tttt
Fig. AII.8. Correlation between Uber’s Dependency and Medallion Prices (Jun. 2013.6 – Sep. 2015).
Uber’s dependency Medallion prices
D1:2013.6 – 2013.12 = 1, rest = 0.D2:2014.1 – 2014.5 = 1, rest = 0.D3:2014.6 – 2015.9 = 1, rest = 0.D: 2013.7-8, 2015.9 = 1, other months = 0.
MP: Medallion prices,UD: Uber dependencyD1, D2, D3, D: Dummy variables.
D1:2013.6 – 2013.12 = 1, rest = 0.D2:2014.1 – 2014.5 = 1, rest = 0.D3:2014.6 – 2015.9 = 1, rest = 0.
Medallion prices in NYC, while Uber dependency (% of Uber) is nationwide.Sources: NYC Taxi and Limousine Commission (TLC) and Certify.
90
1. Uber’s astounding success brought its charges below the taxi charges in May 2014.
2. This resulted in a significant decrease
in medallion prices.
3. This in turn induced further dependency on Uber, leading to a virtuous cycle between medallion price decline and increase in the dependency, as demonstrated in Fig. .
4. In addition to the foregoing significant parallel correlation between PT vs Mpe and PA vs MP, the correlation among Uber, taxi and medallion demonstrates the significance of the foregoing analogy with respect to the emergence of un-captured GDP and endorses the view that the balance between taxi prices and aggregated prices represents the emergence of un-captured GDP by Uber.
0 10 20 30 40 50 60 70$600
$700
$800
$900
$1,000
$1,100
$1,200
$1,300
$1,400
$1,500
Jun. 2013 May. 2014
Sep. 2015
Uber’s dependency %
Med
allio
n pr
ices
(100
0 U
S $)
Jan. 2014

TT
TUTTA UT
UPTPP
Jun-
13Ju
ly-1
3A
ug-1
3Se
p-13
Oct
-13
Nov
-13
Dec
-13
Jan-
14Fe
b-14
Mar
-14
Apr
-14
May
-14
Jun-
14Ju
ly-1
4A
ug-1
4Se
p-14
Oct
-14
Nov
-14
Dec
-14
Jan-
15Fe
b-15
Mar
-15
Apr
-15
May
-15
Jun-
15Ju
ly-1
5A
ug-1
5Se
p-15
13.5
14.0
14.5
15.0
15.5
16.0
16.5
17.0
17.5
18.0
PT
PA
Uncaptured GDP
Average prices (US$/trip)
Fig. AII.10. Trends in Taxi Prices and Aggregated Prices in NYC (Jun. 2013 – Sep. 2015).
Aggregated prices PA are measured by the following equation:
93
AII.3.2 Emergence of Uber-Driven Un-captured GDP (1) Concept of the Emergence of Un-captured GDP
High-quality services with lower cost and shorter time. Increasing initiative of passangers and the company’s systematic market strategy of continuous reduction of costs and time in search and matching, eliminating information asymmetries and compiling a massive database.
Supported by the foregoing endorsement, Fig. demonstrates the magnitude of un-captured GDP per trip by Uber.
The substance of this un-captured GDP can be summed up as follows:
Taxi prices
Aggregated prices
2014/6 2015/1
Fig. demonstrates that, while Uber nurtured “negative un-captured GDP value” (its services were unable to catch up with those of taxi accumulated over the last 120 years) by June 2014, it succeeded in nurturing increasing un-captured GDP from the beginning of 2015 corresponding to its success in sustainable decline in prices from the end of 2014.
Jun-
13Ju
ly-1
3A
ug-1
3Se
p-13
Oct
-13
Nov
-13
Dec
-13
Jan-
14Fe
b-14
Mar
-14
Apr
-14
May
-14
Jun-
14Ju
ly-1
4A
ug-1
4Se
p-14
Oct
-14
Nov
-14
Dec
-14
Jan-
15Fe
b-15
Mar
-15
Apr
-15
May
-15
Jun-
15Ju
ly-1
5A
ug-1
5Se
p-15
-1.0
-0.5
0.0
0.5
1.0
1.5
2.0
2.5
3.0
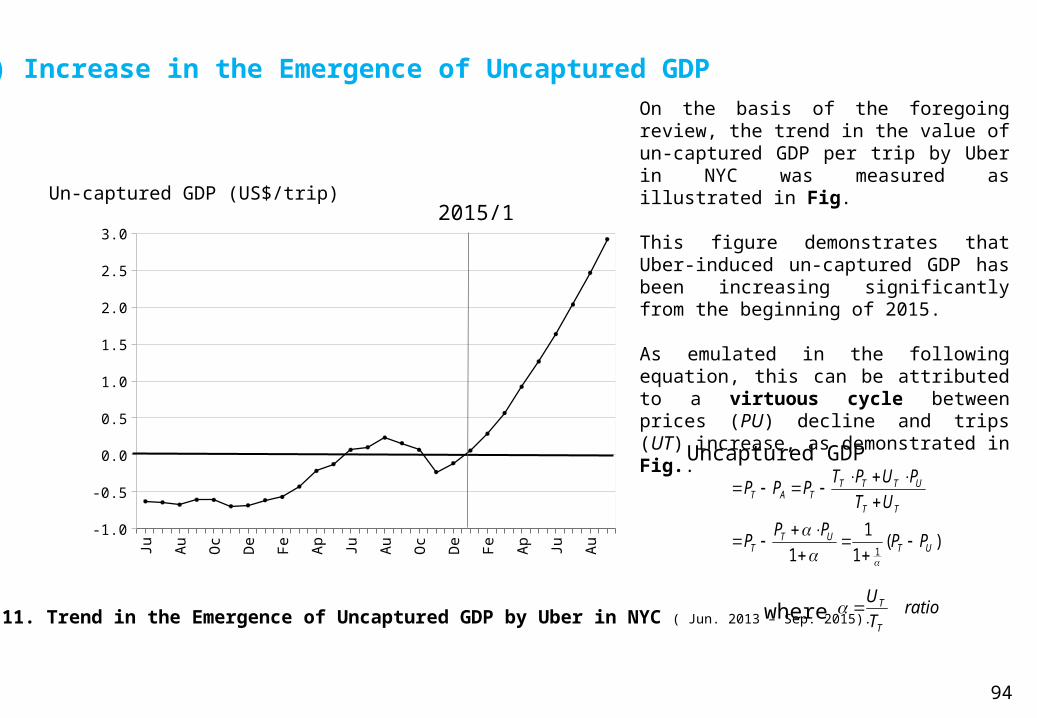
Fig. AII.11. Trend in the Emergence of Uncaptured GDP by Uber in NYC ( Jun. 2013 – Sep. 2015).ratio
TU
T
T
94
(2) Increase in the Emergence of Uncaptured GDP
)(1
11 1 UT
UTT
TT
UTTTTAT
PPPPP
UTPUPTPPP
Un-captured GDP (US$/trip)
Uncaptured GDP
where
On the basis of the foregoing review, the trend in the value of un-captured GDP per trip by Uber in NYC was measured as illustrated in Fig.
This figure demonstrates that Uber-induced un-captured GDP has been increasing significantly from the beginning of 2015.
As emulated in the following equation, this can be attributed to a virtuous cycle between prices (PU) decline and trips (UT) increase, as demonstrated in Fig..
2015/1
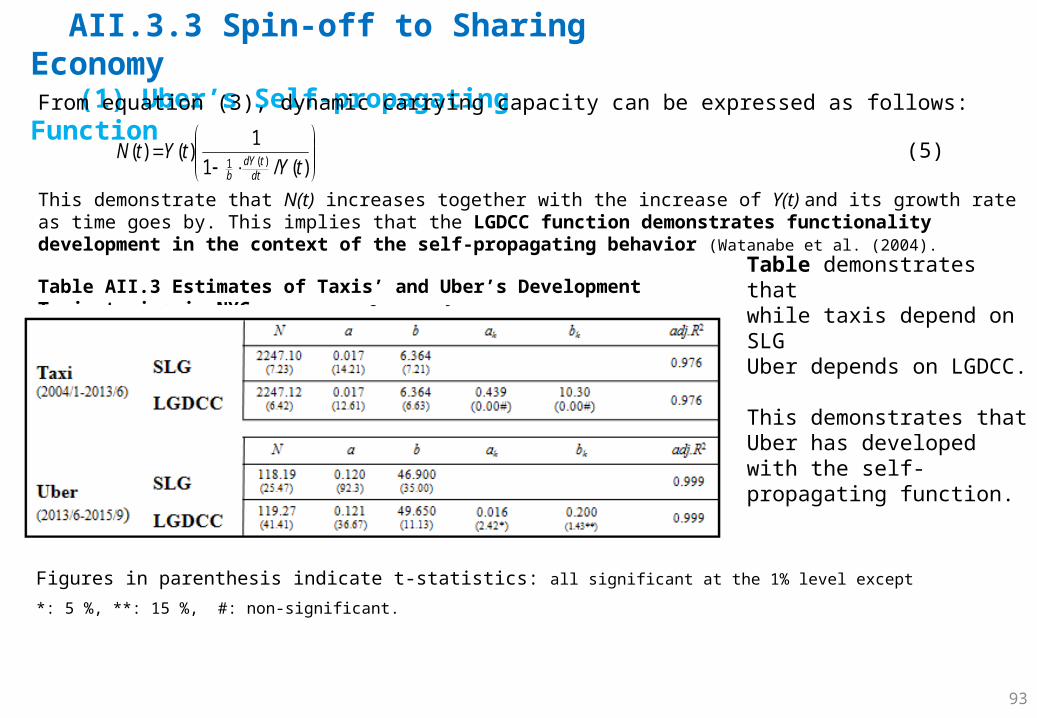
AII.3.3 Spin-off to Sharing Economy (1) Uber’s Self-propagating Function
93
Table AII.3 Estimates of Taxis’ and Uber’s Development Trajectories in NYC
From equation (3), dynamic carrying capacity can be expressed as follows:
(5)
This demonstrate that N(t) increases together with the increase of Y(t) and its growth rate as time goes by. This implies that the LGDCC function demonstrates functionality development in the context of the self-propagating behavior (Watanabe et al. (2004).
)(/1
1)()( )(1 tYtYtN
dttdY
b
Figures in parenthesis indicate t-statistics: all significant at the 1% level except *: 5 %, **: 15 %, #: non-significant.
Table demonstrates thatwhile taxis depend on SLGUber depends on LGDCC.
This demonstrates that Uber has developed with the self-propagating function.

AII.4 ConclusionAII.4.1 Secret of the Success of Uber’s SystemIn light of the disruptive digital-technology-driven business model that Uber has used to trigger a ride-sharing revolution, the institutional sources of the company’s platform ecosystem architecture were analyzed.
Aiming at elucidating institutional enablers creating Uber’s platform ecosystem, an empirical analysis of its co-existing development trajectory with taxi was attempted.
Noteworthy findings include:(i) This co-existing development trajectory corresponds to two-faced nature of ICT that is behind the emergence of uncaptured GDP, (ii) This emergence can be attributed to a virtuous cycle between prices decline and trips increase,(iii) This virtuous cycle can be attributed to its self-propagating function, and(iv) This self-propagating function plays a vital role in spin-offs from traditional co-evolution to new co-evolution ICT advancement,
paradigm change and people’s preference shift.
AII.4.2 Noteworthy Elements Essential to Well-Functioning Platform Ecosystem ArchitectureThese findings form the base for the following suggestions supportive of constructing a well-functioning platform ecosystem:(i) Penetrate the current demand and meet its challenge, (sharing economy, saturation of taxi business, popularity of smartphone)(ii) Fully utilize the advancement of ICT, particularly of the Internet, (smartphone, digital payment, big data analysis)(iii) Construct a co-evolution between sophisticated platform ecosystems and consolidation of stakeholders. (mutual rating system among the company, its drivers and their passengers)(iv) Take care of the platform orchestration for efficiency, development and innovation, (Successive innovation for novel services as competitor like Lyft boosting and also as against movement emerging)(v) Thereby, create a novel business model which has never been conceived before.
94

AII.4.3 Implications of Uncaptured GDPThe emergence of un-captured GDP in case of Uber can be attributed to(i) People’s preference shift to sharing economy and advancement of ICT, particularly of the Internet and later on
smartphones,(ii) Better services, with cost and time saving for passengers, high efficient operation without additional investment and
license fees for drivers, and optimal price-setting and market making beyond marginal cost for the company through a massive database on driver and passenger behavior.
(iii) Paradigm shift from resources to ecosystem that corresponds to the shift from captured GDP to uncaptured GDP.
Thus, Uber’s un-captured GDP can be considered as a consequence of the co-evolution between people’s preference shift, advancement of ICT and this paradigm shift. This co-evolution has been leveraged by Uber to create new business, to create services through interactions between the stakeholders: the company, drivers and passengers. All this can be attributed to systems success: platform ecosystem architecture under the contemporary digital economy.
AII.4.4 Criticism to be SolvedHowever, as a consequence of transition to new dynamism, there remains the following areas of criticism:(iv) Discrimination (e.g., equivalence of services for remote areas with low population density),(v) Safety issues,(vi) Treatment of privacy issues, and(vii) Compliance with labor standards.
AII.4.5 Future WorksThis analysis has explored a prototype of the analysis of co-evolution of three mega-trends that nurtures uncaptured GDP.Further analyses applying this approach are expected to be undertaken for similar disruptive business models in (i) music industry, (ii) game industry, (iii) printing and publishing industry, and (iv) education industry.
95
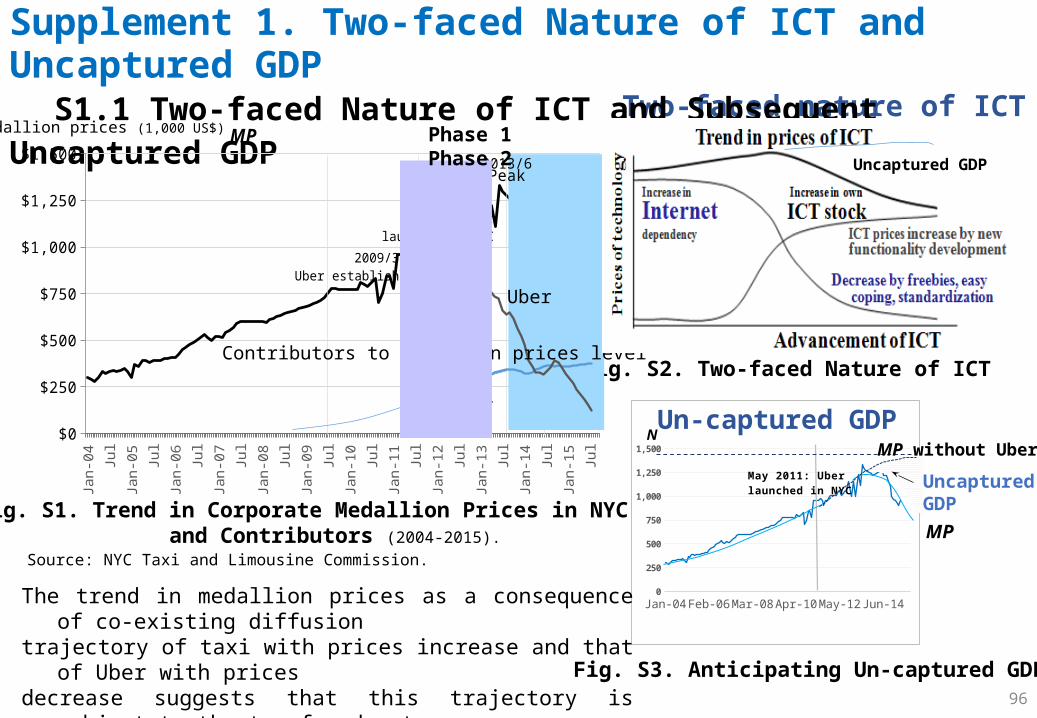
Source: NYC Taxi and Limousine Commission.
Jan-04 Oct-05 July-07 Apr-09 Jan-11 Oct-12 July-140
250
500
750
1,000
1,250
1,500N
May 2011: Uber launched in NYC Uncaptured
GDP
Medallion prices (1,000 US$)Two-faced nature of ICT
Un-captured GDP
Fig. S2. Two-faced Nature of ICT
Fig. S3. Anticipating Un-captured GDP.
Supplement 1. Two-faced Nature of ICT and Uncaptured GDP S1.1 Two-faced Nature of ICT and Subsequent Uncaptured GDP
Fig. S1. Trend in Corporate Medallion Prices in NYC and Contributors (2004-2015).
The trend in medallion prices as a consequence of co-existing diffusion trajectory of taxi with prices increase and that of Uber with prices decrease suggests that this trajectory is subject to the two-faced nature of ICT that is behind the emergence of un-captured GDP.
96
Jan-
04Ju
n-04
Nov
-04
Apr
-05
Sep-
05Fe
b-06
July
-06
Dec
-06
May
-07
Oct
-07
Mar
-08
Aug
-08
Jan-
09Ju
n-09
Nov
-09
Apr
-10
Sep-
10Fe
b-11
July
-11
Dec
-11
May
-12
Oct
-12
Mar
-13
Aug
-13
Jan-
14Ju
n-14
Nov
-14
Apr
-15
Sep-
15
$0
$250
$500
$750
$1,000
$1,250
$1,500
2011/5 Uber launched in NYC
2009/3Uber established
2014/5Start to
fall
2013/6Peak
MP
Uber
Taxi
Contributors to medallion prices level
Phase 1 Phase 2Uncaptured GDP
MP
MP without Uber

S1.2 ICT Prices Trajectory and Two-faced Nature (1) Modified Bi-logistic Growth
Iai
Jaj
I ij ebN
ebNp
11
jiji bbandaa ,,
01
,01
,01
)1)(1(1
1
1111
)1(1
)1(11
1111
11
1
11
1
11
11
2
12
)1)(1(11
ji
ii
ji
jj
ji
ji
ji
jiji
ji
ii
ji
jj
ji
jiji
iji
ij
ji
j
ji
ji
ji
Iai
ji
Jaj
ji
ji
Np
I
Iai
Jajji
jiI
Iai
Jajji
jiIa
iJa
jji
Iai
Jaj
JaIaji
Iai
Jaj
Iai
Jaj
Jaj
Iai
Iai
JajI
bbba
bbba
bbbb
bbbbbb
where
IJIbb
baJbb
babb
bbbb
Iabb
bJabb
bbbbb
bbeb
bbeb
bbbb
pNN
ebebbbbb
Np
ebebbbbb
ebebbbebeb
eebbebebebeb
ebebebeb
Np
ij
I
ij
ijij
ij
jiij
ij
ji
ij
JaandIa ji
.,.0,.,1
,,0
.,.1,1
),0(,0
jiIjj
J
Iii
I
bbThereforepJWhenN
bNb
NNpJWhen
NpIWhenNbb
NpIWhen
(A2)
(A3)
ICT prices can be depicted by the following modified bi-logistic growth as illustrated in Fig. S4:
where I: ICT stock, J: dependency on the Internet, N: carrying capacity, : diffusion velocity of I and J.
[1] Since the Internet has been playing a leading role in the whole ICT and providing significant impacts on the diffusion trajectory of ICT, the carrying capacity of logistic growth in I and reverse logistic growth in J as well as their diffusion tempo ( ) were treated as behaving in the similar way (a i I=a jJ).
Equation (A1) can be developed as follows:
(A1)
Fig. S4. Modified Bi-logistic Growth due to Two-faced Nature of ICT.
Iai
Jaj
I ij ebN
ebNp
11
Uber Taxi
97
PI
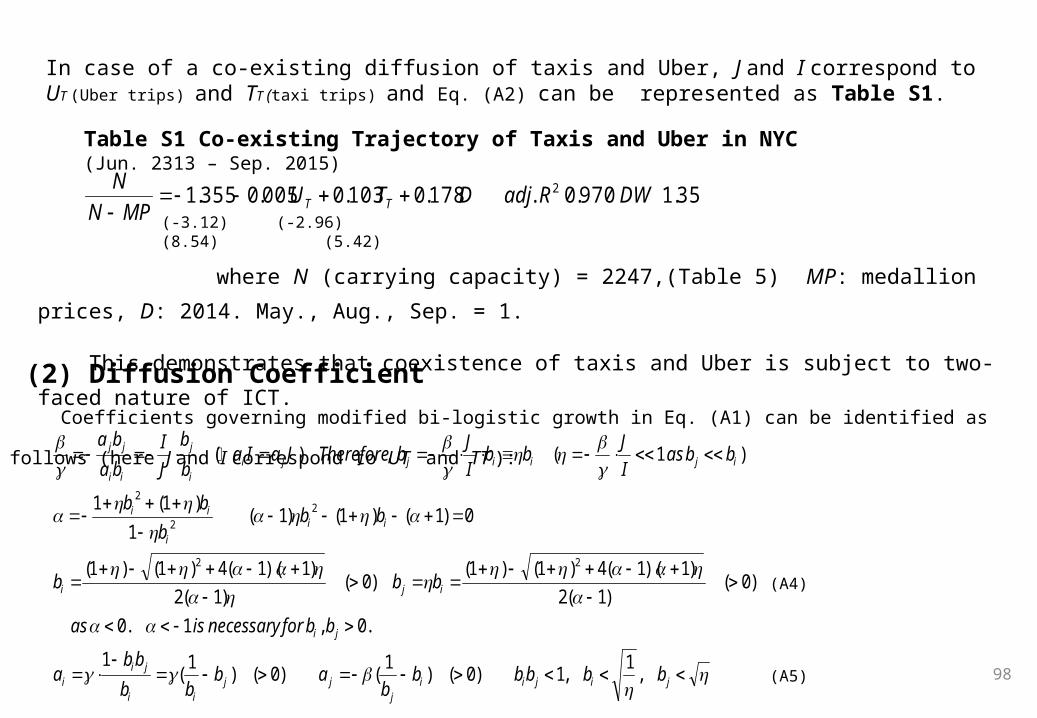
98
jijiij
jjii
jii
ji
iji
iii
ii
ijiijjii
j
ii
jj
bbbbbb
abbb
bba
bbfornecessaryisas
bbb
bbb
bb
bbasIJbb
IJbThereforeJaIa
bb
JI
baba
,1,1)0()1()0()1(1
.0,1.0
)0()1(2
)1)(1(4)1()1()0(
)1(2)1)(1(4)1()1(
0)1()1()1(1
)1(1
)1(,)(
22
22
2
35.1970.0.178.0103.0005.0355.1 2 DWRadjDTUMPN
NTT
(-3.12) (-2.96) (8.54) (5.42)
Table S1 Co-existing Trajectory of Taxis and Uber in NYC (Jun. 2313 – Sep. 2015)
where N (carrying capacity) = 2247,(Table 5) MP: medallion prices, D: 2014. May., Aug., Sep. = 1.
This demonstrates that coexistence of taxis and Uber is subject to two-faced nature of ICT.
In case of a co-existing diffusion of taxis and Uber, J and I correspond to UT (Uber trips) and TT (taxi trips) and Eq. (A2) can be represented as Table S1.
(2) Diffusion Coefficient Coefficients governing modified bi-logistic growth in Eq. (A1) can be identified as follows (here J and I correspond to UT and TT ):
(A4)
(A5)
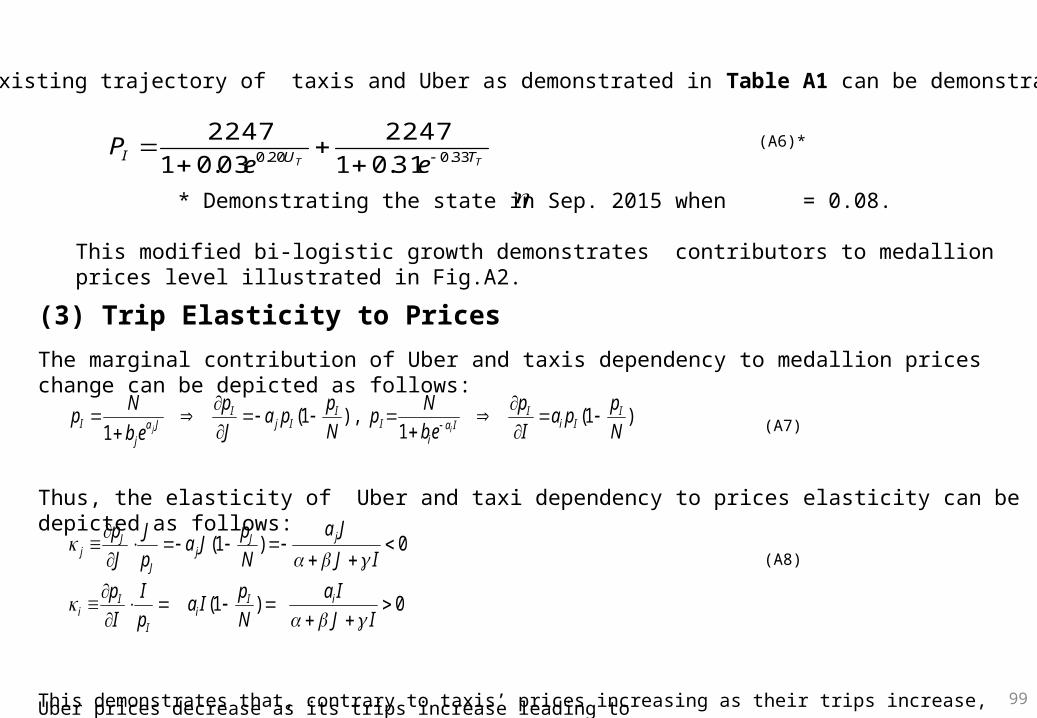
99
0)1(
0)1(
)1(1
),1(1
IJIa
NpIa
pI
Ip
IJJa
NpJa
pJ
Jp
Nppa
Ip
ebNp
Nppa
Jp
ebNp
iIi
I
Ii
jJj
J
Jj
IIi
IIa
iI
IIj
IJa
jI ij
Thus, co-existing trajectory of taxis and Uber as demonstrated in Table A1 can be demonstrated as follows:
TT TUI eeP 33.020.0 31.01
224703.01
2247
(A6)*
* Demonstrating the state in Sep. 2015 when = 0.08.
This modified bi-logistic growth demonstrates contributors to medallion prices level illustrated in Fig.A2.
(3) Trip Elasticity to PricesThe marginal contribution of Uber and taxis dependency to medallion prices change can be depicted as follows:
Thus, the elasticity of Uber and taxi dependency to prices elasticity can be depicted as follows:
This demonstrates that, contrary to taxis’ prices increasing as their trips increase, Uber prices decrease as its trips increase leading to a virtuous cycle for Uber. All this support the analysis of institutional sources being behind the emergence of un-captured GDP.
(A7)
(A8)
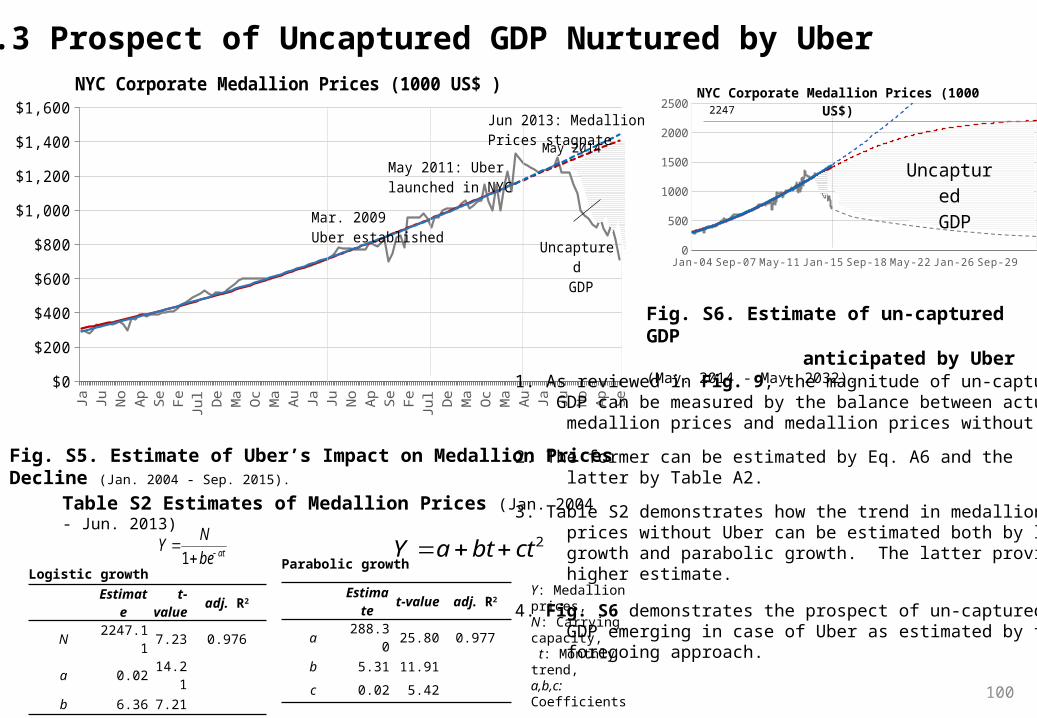
Jan-
04M
ay-0
4Se
p-04
Jan-
05M
ay-0
5Se
p-05
Jan-
06M
ay-0
6Se
p-06
Jan-
07M
ay-0
7Se
p-07
Jan-
08M
ay-0
8Se
p-08
Jan-
09M
ay-0
9Se
p-09
Jan-
10M
ay-1
0Se
p-10
Jan-
11M
ay-1
1Se
p-11
Jan-
12M
ay-1
2Se
p-12
Jan-
13M
ay-1
3Se
p-13
Jan-
14M
ay-1
4Se
p-14
Jan-
15M
ay-1
5Se
p-15
$0
$200
$400
$600
$800
$1,000
$1,200
$1,400
$1,600
NYC Corporate Medallion Prices (1000 US$ )
Actual Logistic Growth
May 2011: Uber launched in NYC
Mar. 2009Uber established
Uncaptured GDP
May 2014
Jun 2013: Medallion Prices stagnate
Logistic growth
Estimate t-value adj. R2
N 2247.11 7.23 0.976
a 0.02 14.21
b 6.36 7.21
Parabolic growth
Estimate t-value adj. R2
a 288.30 25.80 0.977
b 5.31 11.91
c 0.02 5.42
atbeNY
1
S1.3 Prospect of Uncaptured GDP Nurtured by Uber
Fig. S5. Estimate of Uber’s Impact on Medallion Prices Decline (Jan. 2004 - Sep. 2015).
Table S2 Estimates of Medallion Prices (Jan. 2004 - Jun. 2013)
Y: Medallion prices,N: Carrying capacity, t: Monthly trend,a,b,c: Coefficients
Jan-04 Jan-07 Jan-10 Jan-13 Jan-16 Jan-19 Jan-22 Jan-25 Jan-28 Jan-310
500
1000
1500
2000
2500NYC Corporate Medallion Prices (1000 US$)
Uncaptured GDP
2247
Fig. S6. Estimate of un-captured GDP anticipated by Uber (May. 2014 - May. 2032).
1. As reviewed in Fig. 9, the magnitude of un-captured GDP can be measured by the balance between actual medallion prices and medallion prices without Uber.
2. The former can be estimated by Eq. A6 and the latter by Table A2.
3. Table S2 demonstrates how the trend in medallion prices without Uber can be estimated both by logistic growth and parabolic growth. The latter provides higher estimate.
4. Fig. S6 demonstrates the prospect of un-captured GDP emerging in case of Uber as estimated by the foregoing approach.
100
2ctbtaY
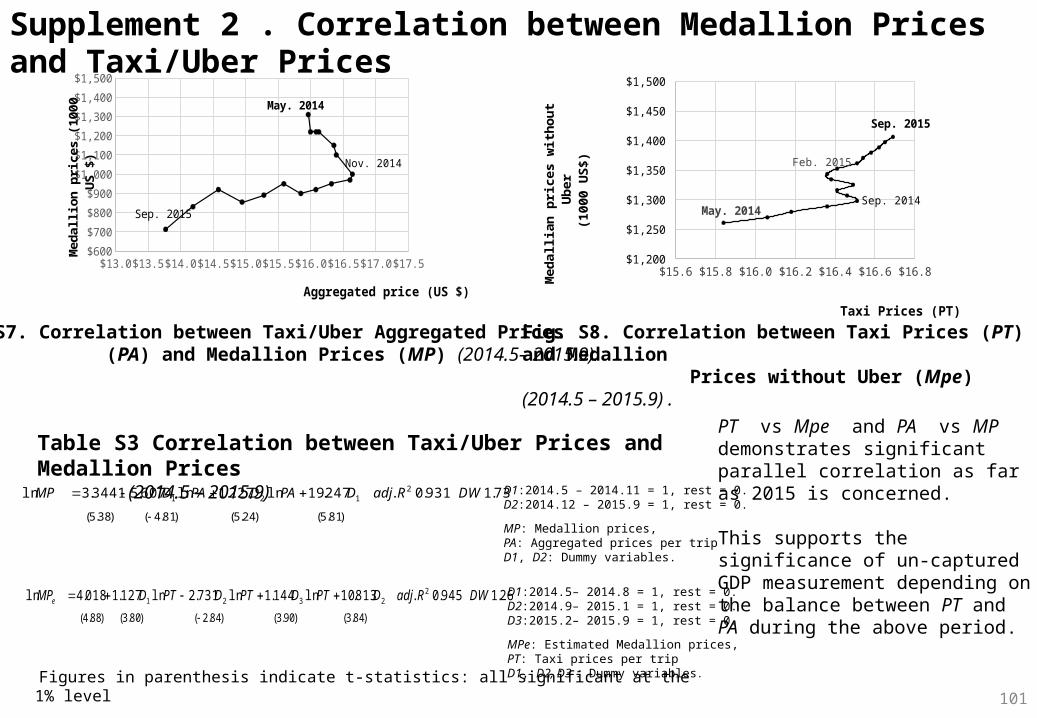
Supplement 2 . Correlation between Medallion Prices and Taxi/Uber Prices
Figures in parenthesis indicate t-statistics: all significant at the 1% level
)81.5()24.5()81.4()38.5(
73.1931.0.247.19ln227.1ln607.53441.3ln 2121
DWRadjDPADPADMP
Fig. S7. Correlation between Taxi/Uber Aggregated Prices (PA) and Medallion Prices (MP) (2014.5– 2015.9).
D1:2014.5 – 2014.11 = 1, rest = 0.D2:2014.12 – 2015.9 = 1, rest = 0.
MP: Medallion prices,PA: Aggregated prices per tripD1, D2: Dummy variables.
D1:2014.5– 2014.8 = 1, rest = 0.D2:2014.9– 2015.1 = 1, rest = 0.D3:2015.2– 2015.9 = 1, rest = 0.
MPe: Estimated Medallion prices,PT: Taxi prices per tripD1, D2, D3 : Dummy variables.
101
$15.6 $15.8 $16.0 $16.2 $16.4 $16.6 $16.8 $1,200
$1,250
$1,300
$1,350
$1,400
$1,450
$1,500
May. 2014Sep. 2014
Feb. 2015
Sep. 2015
Taxi Prices (PT)
Med
allia
n pr
ices
with
out U
ber
(100
0 U
S$)
$13.0 $13.5 $14.0 $14.5 $15.0 $15.5 $16.0 $16.5 $17.0 $17.5$600
$700
$800
$900
$1,000
$1,100
$1,200
$1,300
$1,400
$1,500
May. 2014
Nov. 2014
Sep. 2015
Aggregated price (US $)
Med
allio
n pr
ices
(100
0 U
S $)
)84.3()90.3()84.2()80.3()88.4(
26.1945.0.813.10ln144.1ln731.2ln127.1018.4ln 22321
DWRadjDPTDPTDPTDMPe
Fig. S8. Correlation between Taxi Prices (PT) and Medallion Prices without Uber (Mpe) (2014.5 – 2015.9) .
Table S3 Correlation between Taxi/Uber Prices and Medallion Prices (2014.5 – 2015.9)
PT vs Mpe and PA vs MPdemonstrates significant parallel correlation as far as 2015 is concerned.
This supports the significance of un-captured GDP measurement depending on the balance between PT and PA during the above period.

102
1 2 3 4 5 6 7 8 9 10 11 12 13 14 15 16 17 18 19 20 21 22 23 24 25 26 27 280.00
10.00
20.00
30.00
40.00
50.00
60.00
UT1
3.12 2.753.37 3.093.62 3.473.96 3.94.34 4.384.82 4.925.38 5.515.96 6.186.65 6.926.18 7.747.19 8.669.96 9.67
12.40 10.7912.80 12.0314.92 13.3914.56 14.8915.86 16.5220.46 18.3120.40 20.2526.18 22.2525.06 24.6226.83 27.0530.96 29.6633.95 32.4337.27 35.3640.94 38.4445.03 41.6749.64 45.03
1 Jun-132 July-133 Aug-134 Sep-135 Oct-136 Nov-137 Dec-138 Jan-149 Feb-14
10 Mar-1411 Apr-1412 May-1413 Jun-1414 July-1415 Aug-1416 Sep-1417 Oct-1418 Nov-1419 Dec-1420 Jan-1521 Feb-1522 Mar-1523 Apr-1524 May-1525 Jun-1526 July-1527 Aug-1528 Sep-15
2TT UUPeriod
Trips per day
Trips per day
2013/6 2014/1 2014/5 2015/3 2015/9
2T
T
UU
Supplement 3. Sensitivity of Uber Trips Estimate S3.1 Estimate without and with Spline Interpolation
Fig. S9. Comparison of Uber Trips Estimate (Jun. 2013 – Sep. 2015).
Table S4 Comparison of Uber Trips Estimate (Jun. 2013 – Sep. 2015).
UT: Uber trips estimated by taxi trips and Uber dependency (Appendix 1)UT2: Uber trips estimated with spline interpolation
In analyzing Uber’s diffusion trajectory (3.3 (1) and (2)), given the sensitive impacts of fluctuation on the trajectory formation within the limited samples, comparative analysis was attempted by comparing Uber trips estimate with and without spline interpolation, as shown in Fig. S9 and Table S4. The function used for spline interpolation was based on the logistic growth function .

Jun-
13Ju
ly-1
3A
ug-1
3Se
p-13
Oct
-13
Nov
-13
Dec
-13
Jan-
14Fe
b-14
Mar
-14
Apr
-14
May
-14
Jun-
14Ju
ly-1
4A
ug-1
4Se
p-14
Oct
-14
Nov
-14
Dec
-14
Jan-
15Fe
b-15
Mar
-15
Apr
-15
May
-15
Jun-
15Ju
ly-1
5A
ug-1
5Se
p-15
13.5
14.0
14.5
15.0
15.5
16.0
16.5
17.0
17.5
18.0
TT
TUTTA UT
UPTPP
Uncaptured GDP
Average prices (US$/trip)
Fig. S10. Trends in Taxi Prices and Aggregated Prices in NYC (Jun. 2013 – Sep. 2015).
Aggregated prices PA are measured by the following equation:
105
S3.2 Effects of the Estimates of Uber-Driven Un-captured GDP (1) Emergence of Un-captured GDP in case of Uber
Taxi prices
Aggregated prices
2014/6 2015/1
PT
PA2PA
With spline interpolationWithout spline interpolation
No substantial differences between the interpolations with and without spline.
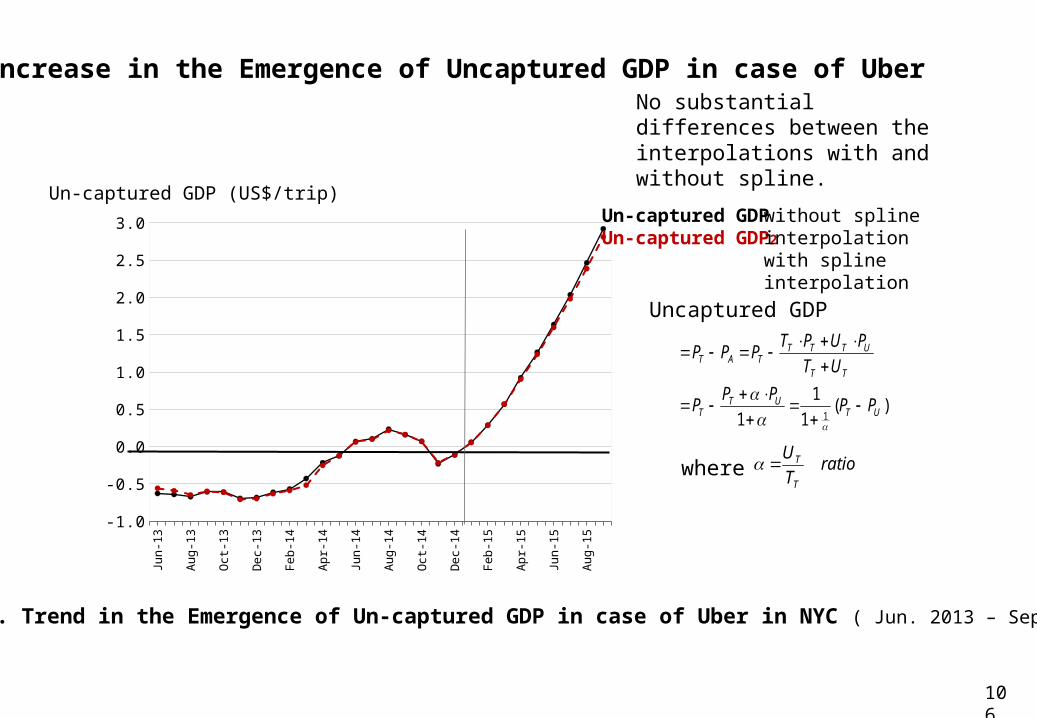
Jun-
13Ju
ly-1
3A
ug-1
3Se
p-13
Oct
-13
Nov
-13
Dec
-13
Jan-
14Fe
b-14
Mar
-14
Apr
-14
May
-14
Jun-
14Ju
ly-1
4A
ug-1
4Se
p-14
Oct
-14
Nov
-14
Dec
-14
Jan-
15Fe
b-15
Mar
-15
Apr
-15
May
-15
Jun-
15Ju
ly-1
5A
ug-1
5Se
p-15
-1.0
-0.5
0.0
0.5
1.0
1.5
2.0
2.5
3.0
Fig. S11. Trend in the Emergence of Un-captured GDP in case of Uber in NYC ( Jun. 2013 – Sep. 2015).
ratioTU
T
T
106
(2) Increase in the Emergence of Uncaptured GDP in case of Uber
)(1
11 1 UT
UTT
TT
UTTTTAT
PPPPP
UTPUPTPPP
Un-captured GDP (US$/trip)
Uncaptured GDP
where
Un-captured GDPUn-captured GDP2
without spline interpolationwith spline interpolation
No substantial differences between the interpolations with and without spline.
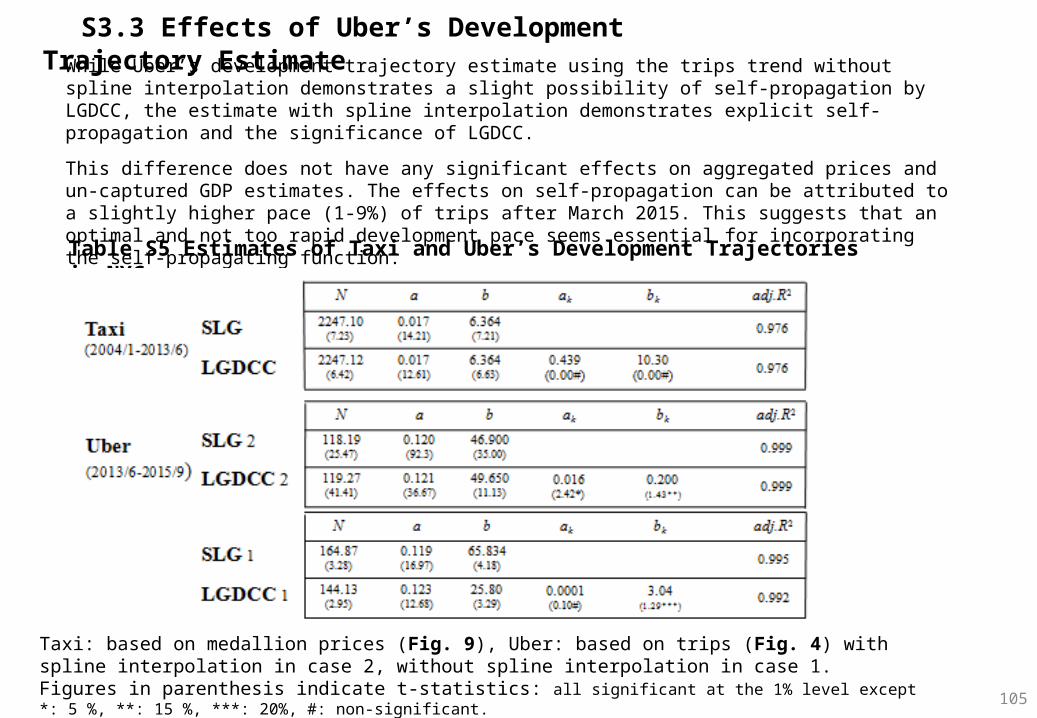
S3.3 Effects of Uber’s Development Trajectory Estimate
105
Table S5 Estimates of Taxi and Uber’s Development Trajectories in NYC
Taxi: based on medallion prices (Fig. 9), Uber: based on trips (Fig. 4) with spline interpolation in case 2, without spline interpolation in case 1. Figures in parenthesis indicate t-statistics: all significant at the 1% level except *: 5 %, **: 15 %, ***: 20%, #: non-significant.
While Uber’s development trajectory estimate using the trips trend without spline interpolation demonstrates a slight possibility of self-propagation by LGDCC, the estimate with spline interpolation demonstrates explicit self-propagation and the significance of LGDCC.
This difference does not have any significant effects on aggregated prices and un-captured GDP estimates. The effects on self-propagation can be attributed to a slightly higher pace (1-9%) of trips after March 2015. This suggests that an optimal and not too rapid development pace seems essential for incorporating the self-propagating function.
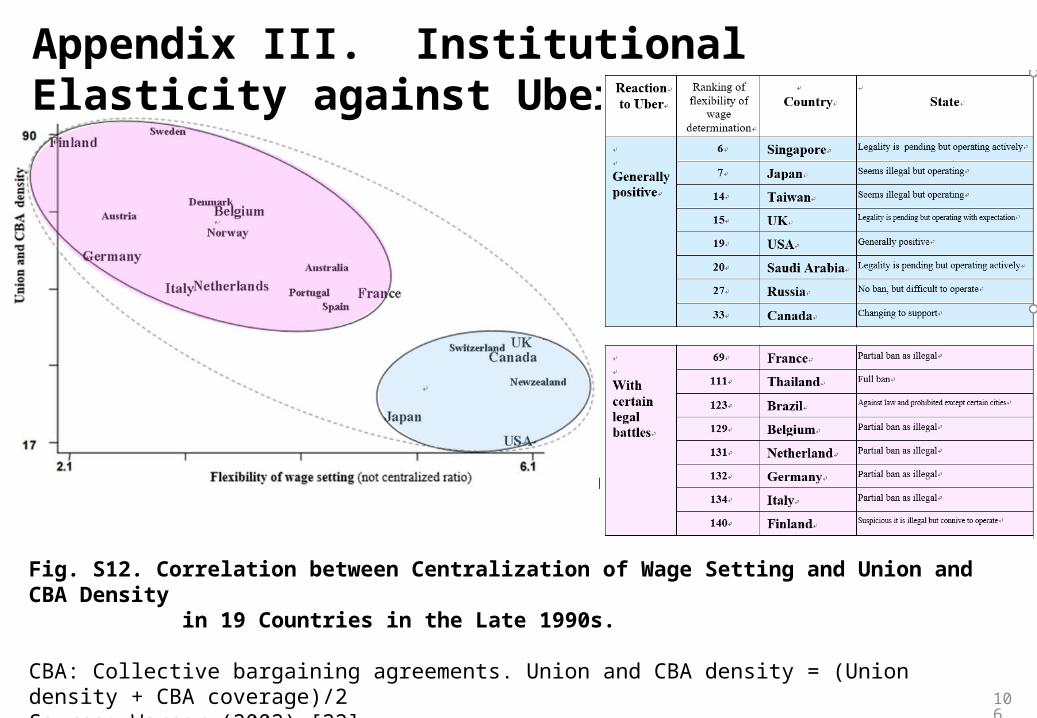
106
Fig. S12. Correlation between Centralization of Wage Setting and Union and CBA Density in 19 Countries in the Late 1990s. CBA: Collective bargaining agreements. Union and CBA density = (Union density + CBA coverage)/2Source: Warner (2002) [22]
Appendix III. Institutional Elasticity against Uber

107
1 Success (1) Singapore [Legality is pending but operating actively]
1. Taxi drivers and passengers in Singapore are generally welcoming taxi app services.
2. This has led to a highly competitive taxi app market in Singapore, and existing taxi companies as ComfortDelgro and Trans-Cab endeavoured to improved their services by introducing their own mobile app services.
3. COE (Certificate of Entitlement) scheme based on the tripartism framework (consists of Ministry of Manpower, National Trades Union Congress, and Singapore National Employers Federation) plays a decisive role in Singaporean’s efficient utilization of ride-sharing.
4. Requirements and complaints can be solved through dialogues with the regulators, employers and employees (drivers) under the tripartism framework.
5. Uber induced incorporating users (passengers) requirements into the tripartism framework by stimulating better services, thereby consolidation of all stakeholders: company, employee, user and government was constructed.
6. Government agile reaction to complains from incumbent through open dialogue with all stakeholders by acknowledging new stream of innovation, not resisting played a key role.
7. The government is secretly* welcoming the taxi app services because (i) young people enjoy using services like Uber, and the government must not resist innovation, (ii) they provide job opportunity to Singapore citizen (toward aging society) and increase the overall productivity, (iii) the ride- sharing can be an approach to tackle problems of traffic clog and achieve efficient road usage.
* Transport Minister urged that “we must always be fair to players, whether incumbent or insurgents, and strike a balanced approach.

108
(2) Tokyo [Seems illegal but operating]1. Uber has had tremendous difficulties in making inroads into the Japanese market due to “Byzantine” and complicated regulations.
2. Uber was ordered to suspend its pilot project in Fukuoka city in Feb. 2015 because it violate the laws. Uber stopped the project in Mar. 2015
3. Tokyo has a rather tranquil market so far due to its qualified service seeking competitive market with 50,000 taxi (20% of the total in Japan and 4 times the number in NYC).
Nov. 2013 Uber started in Tokyo (limited launch. Expanded whole Tokyo area from Aug. 2014).
Jan. 2014 Tokyo Hire-Taxi Association also introduced a mobile app service.
Jan. 2015 Japan’s largest taxi company, Nihon Kotsu launched a mobile app Line Taxi.
Mar. 2015 Japanese government stated Uber probably violates laws (unlicensed, safety). Uber reacted continued to talk.
Mar. 2015 Japan’s e-commerce giant Rakuten entered the ride-sharing industry by purchasing 11.9% in Lyft.
Oct. 2015 Prime Minister Abe instructed relaxing regulation for ride-share in isolated areas.
4. Although the legal framework in Japan does not allow private cars or ordinary person to operate as a paid taxi, taxi companies in Tokyo recognized Uber as a business competitor and worked towards improving their services by developing new functions. 5. With CCSD (government, broader industries involvement for social demand (traffic, aging, isolated rural)) co-
evolution emerged between IDBM (existing taxi companies also improved their services by introducing their own mobile app services) and advancement of institutional systems by solving social demand.
.

109
1. Black taxis have been the kings of the British capital's roads for over a century but now they are battling a high-technology rival that threatens their dominance. Uber is active in three cities (London,
Manchester and Leeds) in the UK.
2. Uber has won a significant legal victory in the UK, with London's high court ruling that Uber’s app does not constitute a taximeter.
3. The legal challenge was brought by London's transport agency Transport for London (TfL), following
pressure from the city's black cab and taxi drivers.
4. While taximeters devices which record distance travelled and are used to calculate fares are only allowed for licensed taxis, the judge ruled that the legal definition of a taximeter doesn't include "smart phones which rely on data from a server outside the vehicle."
5. Uber hailed the decision as a "victory for common sense," adding that the ruling means the company won't have to change how its app works in London.
6. London Mayor reported that “The technological innovation should not banned unnecessarily that will serve a good purpose to the Londoners”. This really showed the positive impact of the service in the country. He also added that some solution needs to be sorted out that the growth of Uber services does not impact the traditional black taxi drivers anyway.
7. London's Licensed Taxi Drivers Association, described the outcome as unbelievable. The transport authority has also asked the court to determine if the service is in fact legal.
7. Notwithstanding the above victory, Uber still faces ongoing legal challenges in London, including proposals to introduce compulsory five-minute wait times and the removal of car icons from the map in the Uber app.
(3) London [Legality is pending but operating with expectation]
110
(4) USA [Generally Positive]
Uber is operating in 75% of US locations although banned in Nevada and Oregon, and there was multiple on-going lawsuits.
State legislators in Ohio and Florida are moving ahead with regulations governing Uber and other ride services that would designate all drivers as independent contractors, bolstering a critical but much-disputed aspect of Uber's business model.

111
(5) Saudi Arabia 1. Saudi Arabia's discriminatory automotive policies against women have allowed Uber to achieve great success, due to females having limited options in transportation.
2. Women are not allowed to drive as it is feared to damage their ovaries leading to children born with clinical problems.
3. Since women cannot keep their jobs in Saudi Arabia because they have trouble in finding reliable transportation to get to work, Uber triggered institutional revolution for women’s social participation as demonstrated by the fact that women make up 70% of Uber's customers.
4. With such expectation, Uber operates in the holy Islamic cities of Mecca and Medina, as well as the capital city of Riyadh, and the port cities of Jeddah and Dammam. The service is expected to be available in several more cities in the near future.
5. While there remains the issue of compliance with traditional government regulations, negotiation with the institutional regulators in Saudi Arabia have been extremely positive compared to other countries reception towards the app business.
6. Thus, Uber is expected to grow 50-60 % in trips per months in Saudi Arabia in 2016, which in turn accelerates social innovation in the country leading to a co-evolution between ICT-driven disruptive innovation and change in institutional systems triggered by women’s social participation.
[Legality is pending but operating actively]
112
(6) Russia [No ban, but difficult to offer service]
1. Regulations in Russia are comparatively simple in comparison to other countries.
2. Moscow has already a culture of unlicensed taxis that makes Uber’s expansion there difficult.
3. Citizens can often hail one by standing on the street corner or via a number of apps that have existed for years before Uber arrived.
4. Since 2011, Russia’s main search engine company, Yandex, has been running an taxi-app that most now simply known as Russia’s Uber.
5. Uber also trails Gett, known as the Uber of Israel, which operates 10,000 cars in Moscow.

113
(7) Canada [Changing to Support]
1. Uber drivers in Canada are required to register, collect and remit HST/GST from their fares to the government, regardless of their income.
2. In December 2012, officials in the city of Toronto charged Uber with 25 municipal licensing infractions. A Toronto city councilor has warned that passengers using UberX may be fined up to $20,000.
3. Uber was made legal in the city of Edmonton by passing by-law. However, Uber ceased its operations in Edmonton in March 2016 citing inability to obtain the necessary insurance. The City of Calgary, Alberta has charged at least 17 drivers illegally driving for Uber.
4. These drivers were operating without legally mandated insurance. Uber continues to operate illegally in the other regions of Canada.
5. Toronto Mayor expressed his support for Uber in 2014 and other cities are slowly beginning to look at regulatory options.
114
(8) Philippines [Developed Nationwide Regulations Making Legal] 1. The Philippines became the first country to develop nationwide ride-hailing regulations, making it legal for app-based transportation services like Uber to operate anywhere in the nation in Nov. 2015.
2. "We view technological innovation as a driver for progress, especially in transportation where it can provide safer and more convenient commuting options to the public,” Jun Abaya, the Philippines’ Department of Transportation and Communications secretary, said. “App-based transport services help address the increasing demand for mobility spurred by rapid urbanization.”
3. All the specifics of the regulations have yet to be finalized, but in general, the DOTC says cars that operate on these services must have a GPS system; must be sedans, Asian Utility Vehicles (AUVs), SUVs, or vans; and can’t be more than seven years old. Operators will also be required to obtain certificates for each vehicle on the service, and drivers must be screened and accredited by Uber (or other ride-hailing services) and registered with the local transportation regulatory board.
4. But Uber still faces challenges unique to the Phillipines. For one, Uber’s routing algorithm doesn’t work as well in Manila, which has some of the world’s worst traffic. And as one writer in the Philippines points out, Uber has been operating in the country a bit like a condo rental service; operators are buying small fleets of brand new cars and hiring individual drivers - essentially layering a new middleman on top of Uber itself. As the incentives Uber has put into place to spur growth are being phased out, drivers’ salaries are apparently taking a hit so that these fleet owners can break even.
5. Many locals do say that the service is often cheaper and more convenient than local cab services. But Uber drivers, regulators and the company itself still have work to do to find the right fit if Uber expects to keep growing in the Philippines.
115
(9) China [Generally positive]Although there was some raids and fines against Uber in some of locations, there is no official and legal banning to Uber services. Major challenge Uber facing in China is from the market rivals and competitors.
Such lack of “legal banning” can be attributed to (i) lack of strict regulations in transportation market, (ii) lack of legal protection to the taxi drivers, and (iii) current lousy services provided by taxi industry.

116
(1) France [Partial ban as illegal]
1. France government initially started to suppress the service with their policy and later started allowing the Uber services in certain case, not all the services.
2. UberX is the low cost service that allows only the licensed drivers to operate the cabs and UberPop is also the service but allows even the drivers without the driving license to operate the cab.
3. Government allowed the former but not the latter stating that it would severely affect the regular taxi drivers drastically.
4. Uber did not accept the decision and filed against government which led to huge violent protests by taxi drivers. Finally, Uber has suspended their UberPop services until hearing the final judicial result.
5. Uber announced that it will re-launch its Pop services if the government considers Uber to be legal. But that seems to be highly unlikely.
6. Currently, UberPop is banned from functioning in France. Uber was facing equal protests from traditional Taxi drivers stating that it is not a fair competition as the taxi drivers are exempted from the taxes paid by them.
2 Failure
117
(2) Thailand [Full ban]
1. Following concerns raised by taxi drivers in Thailand over the lower rates charged by Uber drivers, the head of the country's Department of Land Transport, Teerapong Rodpraser, declared Uber illegal on November 28, 2014, alleging that Uber vehicles are not properly registered in Thailand, the charging methods of Uber drivers are not valid, Thai Uber drivers are not properly licensed, and the service discriminates against people who do not possess credit cards.
2. The Department also raised security concerns over Uber's credit card-only policy in Thailand, and Teerapong said that Uber was also illegal under Thailand's Motor Vehicle Act B.E. 2522.
3. As of the November 2014 announcement, the Uber Black and UberX services are available in the Thai cities of Bangkok and Phuket.
4. Following the announcement, Uber drivers faced a maximum 4,000-baht fine is caught by police.
5. Meanwhile, a meeting of different government agencies was held to decide how Uber services would be managed in the future-the outcome was not publicized in the media at the time of the announcement.

118
(3) Brazil [Against Law but Not Oppose]1. Uber has been used in Brazil since 2015, but only in four major cities: São Paulo, Rio de Janeiro, Belo Horizonte and Brasília. Since it is a user-friendly app and broke up the monopoly of cab drivers on individual transport, Uber use has increased a lot over the first half of 2015. Uber is the preference for passengers who appreciate safety, more diversity in payment options (due to credit cards) and promotional offers.
2. Since cab drivers are very organized in Brazil, they have been frequently protesting against Uber. They complain that since they pay taxes, Uber drivers or owners should too.
3. In some cases, cab drivers have been violent. In Belo Horizonte, they've persecuted Uber drivers. In Rio de Janeiro, threats are common, and there was a massive protest against Uber there in late July. In Brazil, a man was attacked by mistake in the airport of Brazil's capital after cab drivers thought he was an Uber user.
4. Due to the organization of cab drivers, their lobbying power is huge. And in most cities where Uber is used, politicians are working for its prohibition.
5. In São Paulo and Brasília, local legislators have approved different projects to forbid Uber. The mayor of São Paulo has to decide if this prohibition will become a law. The governor of Brazil voted the ban on Uber, although this doesn't technically legalize the service. In Rio de Janeiro and Belo Horizonte, Uber is still running without legal constraints. But their municipal chambers are expected to be as strict as in the other cities.

119
(4) Germany [Partial ban as illegal]1. Taxi industry is archaic in Germany. Large taxi companies were driven by the profit motivation in a
quasi-monopolistic market.
2. They have little reason to invest to improve customer service. Instead of upgrading their system by challenging innovation, they have chosen to continue using an inefficient and outdated system.
3. March 2015, the Frankfurt district court imposed a nationwide ban on local transport services using UberPop (unlicensed taxi) because its drivers didn't have licenses for transport.
4. So Uber had to stop its UberPop service. It resumed service under the name UberX (professional service) with guarantees that its cars and drivers would comply with specific legal requirements. But taxi drivers
still remain skeptical. The taxi driver trade union declared to watch whether Uber is abiding by local regulations.
5. Though UberPop was banned, it introduced another service Uber Black (luxury version of UberX). It is not completely prohibited but still legal proceedings are ongoing stating that they are hired cars different from taxi drivers.
6. In addition, security and insurance issues remain as the drivers need not necessarily own their license.
7. Finally, another new service ‘UberTaxi’ was introduced that adhere to the local and legal requirements of the government.
8. Uber has criticized the German courts for trying to force the digital platform to comply with laws "dating back to the '50s." The app also brought its concerns about the restrictions to the European Commission, which is currently investigating the complaint.
9. Consequently, Uber’s ride-sharing revolution resulted in disengagement from German institutional systems.
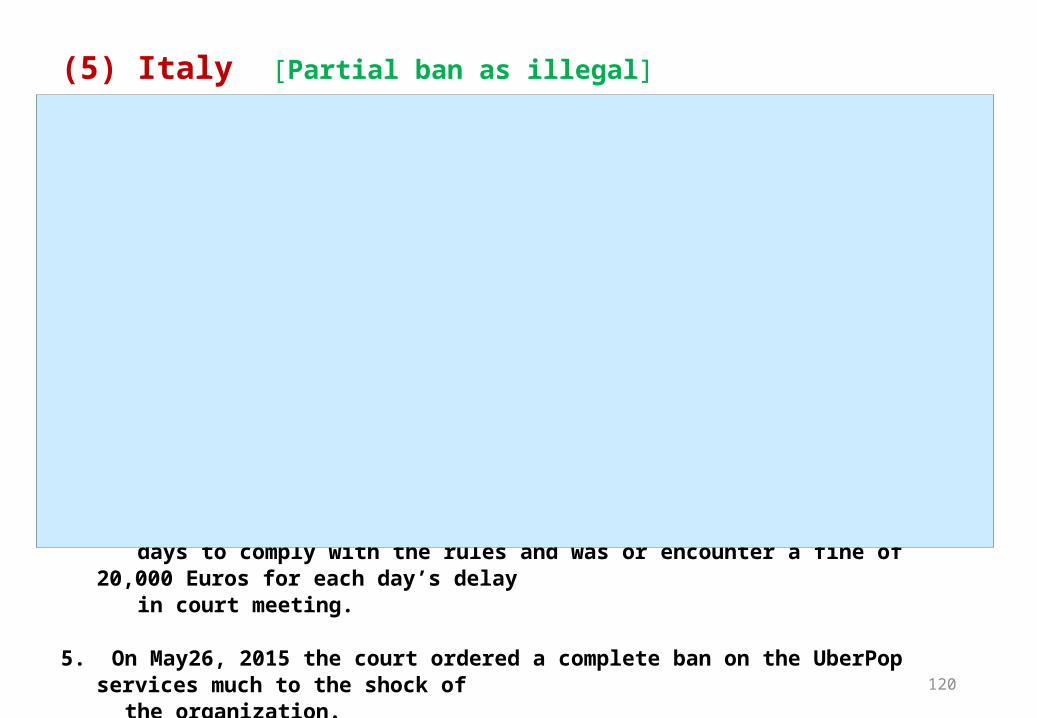
120
(5) Italy [Partial ban as illegal]
1. Traditional taxi drivers of Italy raised a protest against UberPop which was yet another legal battle thrust upon Uber.
2. The court forbade UberPop for allowing unlicensed drivers for the taxi services. UberPop allows ride sharing services and it also allows any person user their car as a taxi which actually increases the risk of customers.
3. UberPop is just a variation version of Uber which is being offered in the country regions where operation of unlicensed taxis is prohibited.
4. The defendant was not immediately available for the trial. Uber was given a time frame of 15 days to comply with the rules and was or encounter a fine of 20,000 Euros for each day’s delay in court meeting.
5. On May26, 2015 the court ordered a complete ban on the UberPop services much to the shock of the organization.
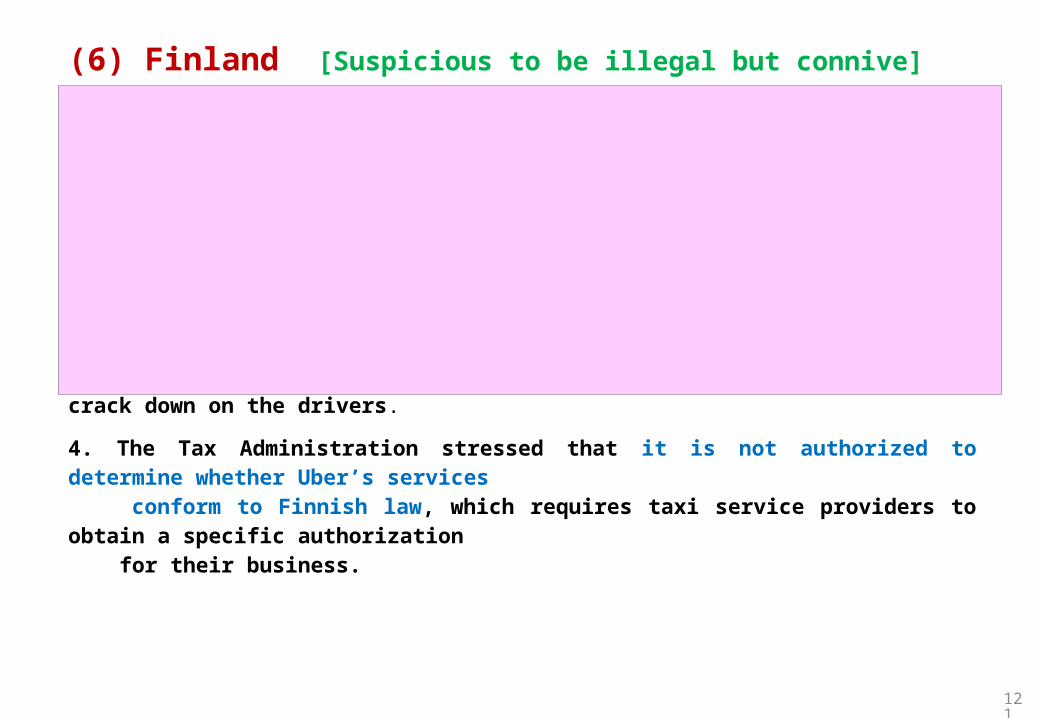
121
(6) Finland [Suspicious to be illegal but connive]
1. Taxies in Finland are fairly expensive (A typical 10 km ride costs 1.2-1.6 times than NYC).
2. Though there is no specific legal issue to ban Uber in Finland, police in Helsinki are asking residents to skip the fare and call the cops if they spot an Uber driver within city limits.
3. Uber clarified itself not a taxi company. But it’s illegal to operate a cab without a license, and police are using citizen reports and even sting operations to crack down on the drivers.
4. The Tax Administration stressed that it is not authorized to determine whether Uber’s services conform to Finnish law, which requires taxi service providers to obtain a specific authorization for their business.
122
(7) Spain [Suspended]
Uber taxi booking service is suspended in Spain in lieu of the charge filed by the MadridAssociation of Taxi drivers. Uber services have been labeled as the ‘unfair’ competition and theSpanish court ordered for its immediate halt of services whereas Uber is trying to approach theproblem legally and in attempts to sort it out.
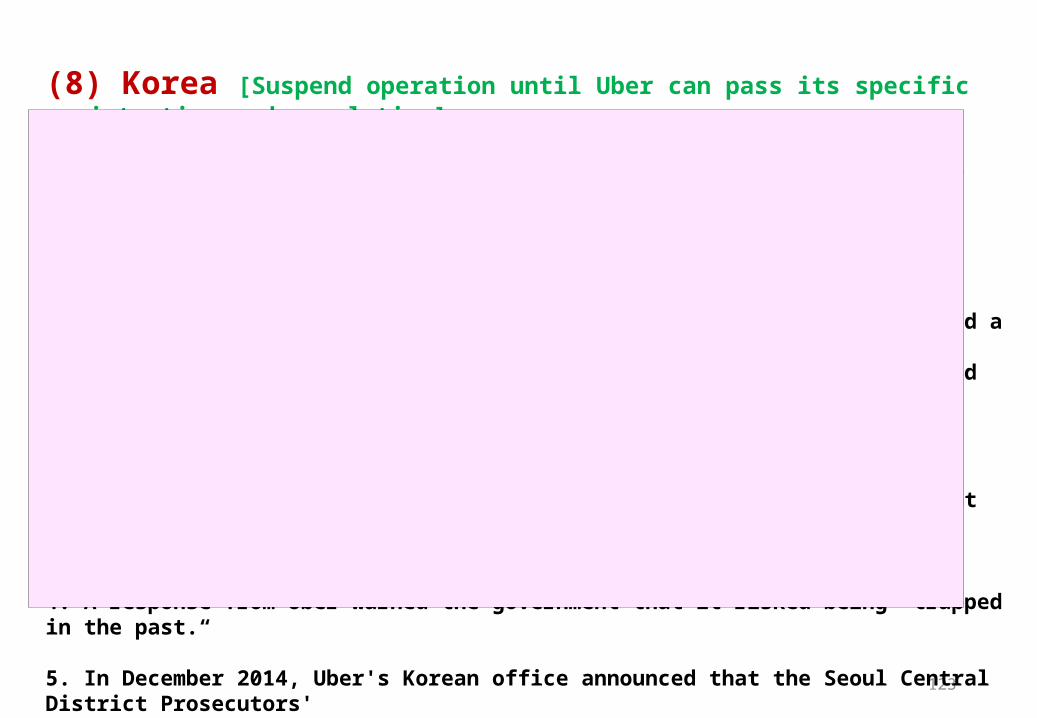
123
(8) Korea [Suspend operation until Uber can pass its specific registration and regulation]
1. The Seoul city government released an official statement in July 2014 expressing its intention to seek a ban on Uber's smart phone app.
2. The government stated that South Korean law prohibits fee-paying transport services that use unregistered private or rented vehicles, and a Seoul driver received a one-million won (US$974) fine in April 2014 after using Uber to solicit customers in a rented car.
3. The city government also initiated a police investigation of Uber in June 2014, but the request was suspended due to a lack of evidence; however, the July statement indicated that the investigation would be recommenced.
4. A response from Uber warned the government that it risked being "trapped in the past.“
5. In December 2014, Uber's Korean office announced that the Seoul Central District Prosecutors' Office had issued an indictment against both them and Kalanick.
6. The indictment is in regard to the violation of a Korean law prohibiting individuals or firms without appropriate licenses from providing or facilitating transportation services.

124
(9) Denmark [Against law but not oppose]
The head in government was not opposed to Uber but stating that the application was contrary to Danish law concerning the passengers safety and employees training.

125
Appendix IV.

126Fig. S13. State of Digitally-rich Learning Environments and Priority Countermeasures.
2. Priority Countermeasures

Sympathetic body temperature regulation pathway
■ Based on stress responses When a stress burden occurs (including surprise or gratification), an elevation of blood pressure, a rise in pulse rate and an increase in body temperature take place simultaneously. While the mechanism of body temperature regulation is not clear, there is a possible relationship between the dorsomedial hypothalamus and the amygdala upstream.
Stress burden
Amygdala (emotion/attitude)
Dorsomedial hypothalamus (nerve centers of temperature information)
Decrease in facial temperature
Vasoconstriction ・reduction of blood flow (= decrease in outer temperature) Heat production by brown fat cells (= increase in inner temperature)
Spinal cord/ sympathetic ganglion (Vasoconstriction・relaxation of excited nerve fibers)
Visual stimuli
Visual cortex
In the brain
Amygdala Hippocampus Somatosensory cortex
Frontal lobe cortex Hypothalamus
・Processing and memory of emotional reactions
・Decision of happiness or sadness
Organ of the brain involved in memory and spatial learning ability
・Recognition, decision ・Conscious recognition
of emotion
Mutual influence
Limbic system
Change in facial temperature
Cerebral blood flow to outside
Vasoconstriction・relaxation of excited nerve fibers
Spinal cord sympathetic ganglion
Change in facial skin and blood vessels
Metabolic body temperature regulation pathway
■Based on metabolism In case of an increase in brain activity, metabolic heat is generated.
Increase in cerebral activity
Increase in oxygen consumption Production of metabolites (CO
2, K)
Production of metabolic heat (= increase in cerebral temperature)
Oxygen supply Metabolite evacuation
Removal of metabolic heat
Cerebral vasodilation Increase in cerebral blood flow
Increase in facial temperature
In the process of blood flow back to the neck, via the blood vessels in the face and capillaries in the nose
Sympathetic preganglionic neurons (send a message of hormone to the body)
3. Consumers Psychophysiogal Behavior (1) Dynamism Governing Consumers Facial Temperature Change
130
Consumers facial temperature change against innovative goods is subject to
(i) Sympathetic Nervous System (SNS): descend temperature
(ii) Metabolic control system (MCS) : elevate temperature
Fig. S14. Mechanism of Facial Temperature Change – Sympathetic and metabolic temperature regulation.
SNS MCS
ChangeChange in facial temperature

Advancement of ICT
Internet
Shifting co-evolution between 3 mega-trends
Spin-off
New stream of innovation in the digital economy- Spin-off dynamism
2010 2000 1990 19801970
IoT Cloud computing DI, CRM Mobile computing SCM, NBM Networking CIM, FA PC CAD Computer
1972 1979 1991 2000 2008 2012
656055504540353025
People’s preferences (%)
Supra-functionalitybeyond economic value
Economic functionality
People’s preferences shift in JapanSource: Japan Cabinet Office.
Un-captured GDP in Finland
Finland
Un-captured GDP
269
505
Captured GDP105
1994 2000 2005 2010 2013
600
500
400
300
200
100
US$ billions at current prices
2. Basic Concept of Platform Ecosystems Impact on GDP - Operationalization of
(1) Shifting Co-evolutionary Mega-trends - New Stream of Innovation in the Digital Economy
Un-captured GDP
Un-captured GDP ratio = Un-captured GDPCaptured GDP
taaa
bat k
k
k ebeN
/11
2.RadjbabaN kk
1.00 1.12 23.52 0.15 2.73 0.985 (8.47) (2.35) (1.19) (3.75) (4.80)
Finland demonstrates spin-off dynamism leading to self-propagating higher dependency on un-captured GDP.
Finland’s un-captured GDP depending trajectory (1994-2013)
DI: Dis-IntermediationCRM: Customer Relationship ManagementSCM: Supply Chain ManagementNBM: Net Business ModelCIM: Computer Integrated ManufacturingFA: Factory AutomationCAD: Computer Aided Design
9
Self-propagating factor
Finland
Singapore
1994 2000 2005 2010 2013
1.0
0.8
0.6
0.4
0.2
0.0
Singapore
Finland
FinlandSingapore
Fig. 3. Basic Concept.

129
Timeline WP7 Platform Ecosystems Impact on GDP
2015 2016 2017 2018 2019 2020 Pilot analysis (i) Trap in ICT advancement (ii) Conceptualization of un-captured GDP (iii) Operationalization of un-captured GDP
Conceptualization of un-captured GDP Operationalization of un-captured GDP Develop new National Accounting System (NAS) Establish new NAS Assessment and envisioning of Finnish trajectory

National levelElucidate Trap in ICT advancement
Two-faced nature of ICT
Bi-polarization
Conceptualize
Operationalize
Business/Individual levelUn-captured GDP
Ride-sharing revolution: UberTrust-based education toward digitally-rich learning environments
Commodification of experiences
Digital music industryGame industryPrinting/publishing ind.
Uber’s ride-sharing revolution
ICT-driven Disruptive Business Model (IDBM)Uber’s worldwide
expansion
0. Overview 0.1 Journal Papers
Legal battles Co-evolutionIDBM without CCSD IDBM with CCSD
Co-evolution between Trust in Teachers and Higher Education toward Digitally-rich Learning Environments
CCSD: Consolidated Challenge to Social DemandTrust (Overdrawing past information)
Commodification of experiences 3

0.2 Research Reports
• BLOCKCHAIN - The Ultimate Disruption in the Financial System - A Brief introductory overview, 19.7.2016, www.jyu.fi/it/tutkimus/muistiot/BLOCKCHAIN.pdf
• THE DEVOPS PHENOMENA - A Brief introductory overview, 19.7.2016, www.jyu.fi/it/tutkimus/muistiot/DEVOPS.pdf
• INDUSTRIAL AND SERVICE ROBOTS - An Overview of industry trends, 19.7.2016,www.jyu.fi/it/tutkimus/muistiot/INDUSTRIALANDSERVICEROBOTS.pdf
• The Biggest Trends in Social Gaming Right Now and the Gamification of Education and Learning, 18.7.2016, www.jyu.fi/it/tutkimus/muistiot/BiggestTrends_SocialGaming_Gamification_of_Education_and_Learning.pdf
• Co-evolution of Three Mega-trends Nurtures Un-captured GDP - Uber’s Ride-sharing Revolution, 16.6.2016, www.jyu.fi/it/tutkimus/muistiot/uudet_liikenteen_digitaaliset_palvelualustat.pdf
• Digital Healthcare Platform, 31.5.2016, www.jyu.fi/it/tutkimus/muistiot/DigitalHealthcarePlatform.pdf
• Transportation Technologies - Researches ・ Trends ・ Models ・ Security, 18.5.2016, www.jyu.fi/it/tutkimus/muistiot/TRANSPORTATIONTECHNOLOGIES.pdf
• Learning Platforms - Expert reviews • Trends • Articles • Models 9.5.2016,www.jyu.fi/it/tutkimus/muistiot/ReportLearningplatforms.pdf
• The Platform Economy and Digital Platforms - Expert reviews • Trends • Articles • Models, 14.4.2016, www.jyu.fi/it/tutkimus/muistiot/ThePlatformEconomyandDigitalPlatforms.pdf 4
Devops: Development and operations
132
0.3 Press Release (A case of Uber’s ridesharing revolution released on 6 July 2016)
The biggest commerce-oriented newspapers in Finland:
1) Kauppalehti: http://www.kauppalehti.fi/uutiset/uusi-tutkimus-uber-lisaa-merkittavasti-taksipalveluiden-kysyntaa/CXjG5TkK
2) Talouselämä: http://www.talouselama.fi/uutiset/tutkimus-taksiliikenteen-uudistuminen-leviaa-maailmanlaajuiseksi-ilmioksi-uusilla-digitaalisilla-palveluilla-kansantaloutta-elvyttava-vaikutus-6564881
3) Taloussanomat: http://www.taloussanomat.fi/autot/2016/07/06/suomalaistutkimus-uber-pudottaa-hintoja-ja-kiihdyttaa-samalla-talouskasvua/20167209/304
4) Tivi: http://www.tivi.fi/Kaikki_uutiset/uberista-paljastui-yllattava-tulos-se-tekeekin-hyvaa-taloudelle-6564996
The national public-broadcasting company
5) Yle: http://yle.fi/uutiset/tutkimus_uber_lisaa_takseihin_kaytettya_rahaa/9005826
Local newspapers:
6) Turun Sanomat: http://www.ts.fi/uutiset/talous/2711766/Tutkijat+Uber+lisaa+kysyntaa+ja+kasvattaa+bruttokansantuotetta
7) Etelä-Suomen Sanomat: http://www.ess.fi/uutiset/kotimaa/art2284079
8) Keskisuomalainen: http://www.ksml.fi/talous/Tutkimus-Kiistelty-Uber-elvytt%C3%A4%C3%A4-taloutta/795669
Related Documents