CFO – Financial update Capital Market Day November 10, 2010 Anders Byström CFO

Chief%20Financial%20Officer
Mar 30, 2016
http://www.aak.com/Global/Chief%20Financial%20Officer.pdf
Welcome message from author
This document is posted to help you gain knowledge. Please leave a comment to let me know what you think about it! Share it to your friends and learn new things together.
Transcript

CFO – Financial updateCapital Market Day November 10, 2010
Anders ByströmCFO

Agenda
Financial performance
Refinancing
Stock option program
CFO - Capital Market Day, 10 November 2010 2

Third quarter - Operating profit in line with last year
CFO - Capital Market Day, 10 November 2010 3
Net sales amounted to SEK 3,774 million (3,828). • Negative currency translation impact of SEK 104
million.• 1% decrease in volumes (higher speciality volumes
but lower commodity volumes).
Group operating profit declined by 2 percent to SEK 231 million (235).
For comparable units (adjusted for divestments) and fixed exchange rates the operating profit amounted to SEK 236 million (231), an improvement of 2 percent.

Highlights first nine months 2010
CFO - Capital Market Day, 10 November 2010 4
Continued improved Group operating profit by 7 percent to SEK 573 million (538).
For comparable units (adjusted for divestments) and fixed exchange rates the operating profit amounted to SEK 598 million (523), an improvement by 14 percent.
Positive cash flow from operating activities before investments amounted to SEK 225 million (1,515).
• The bulk of the strong cash flow in 2009 was due to a significant decline in raw material prices which led to a reduction in working capital, ~SEK 800 million.
• The negative working capital in 2010 was mainly due to increased raw material prices, ~SEK 200 million.

538
3 4314 25
573
YTD 2009 Volume Price/Mix Operating expenses
Currency YTD 2010
P/L Bridge 2010
5CFO - Capital Market Day, 10 November 2010

Translation impact of a stronger SEK
Year to date we have had a negative translation impact of SEK 25 million.
CFO - Capital Market Day, 10 November 2010 6
8,00
8,50
9,00
9,50
10,00
10,50
11,00
11,50
12,00
EUR/SEK
6,00
6,50
7,00
7,50
8,00
8,50
9,00
9,50
10,00
USD/SEK
10,00
10,50
11,00
11,50
12,00
12,50
13,00
13,50
GBP/SEK

Group cost structure
79 % of the cost base is raw material costs
7CFO - Capital Market Day, 10 November 2010

Raw material prices
CFO - Capital Market Day, 10 November 2010 8

Cash flow
CFO - Capital Market Day, 10 November 2010 9
SEK million Q 3 2010
Q 3 2009
Q 1-3 2010
Q 1-3 2009
Cash flow from operating activities 306 290 808 746
Paid tax -51 -21 -223 -29
Change in working capital -340 589 -360 798
Cash flow from operating activities inclchange in working capital
-85 858 225 1 515
Cash flow from investments -65 -59 -244 -203
Free cash flow -150 799 -19 1 312
Cash flow from operating activities reaching SEK 225 million (1,515). – Working capital in the third quarter 2010 increased by SEK 340 million
mainly due to higher inventory value following the recent increased raw material prices.
– The majority of the strong cash flow 2009 was due to a significant decline in raw material prices which led to reduced working capital.

Cash flow bridge year to date
CFO - Capital Market Day, 10 November 2010 10
1515
800
130
585
62 200
15031
225
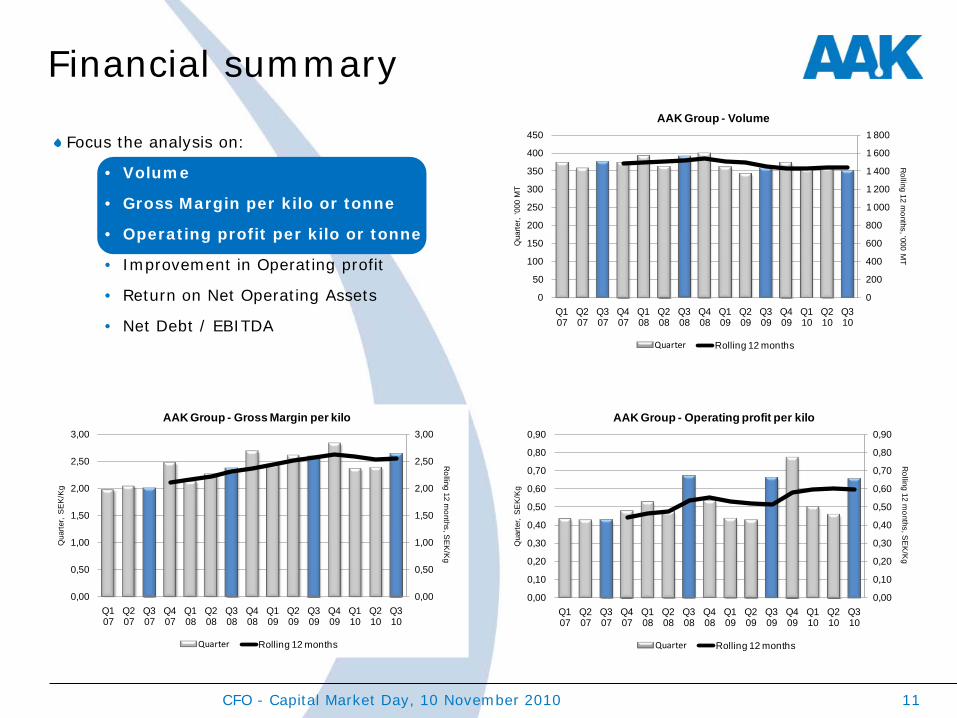
Financial summary
CFO - Capital Market Day, 10 November 2010 11
Focus the analysis on:
• Volume
• Gross Margin per kilo or tonne
• Operating profit per kilo or tonne
• Improvement in Operating profit
• Return on Net Operating Assets
• Net Debt / EBITDA
0,00
0,50
1,00
1,50
2,00
2,50
3,00
0,00
0,50
1,00
1,50
2,00
2,50
3,00
Q1 07
Q2 07
Q3 07
Q4 07
Q1 08
Q2 08
Q3 08
Q4 08
Q1 09
Q2 09
Q3 09
Q4 09
Q1 10
Q2 10
Q3 10
Rolling 12 m
onths, SE
K/K
g
Qua
rter,
SE
K/K
g
AAK Group - Gross Margin per kilo
Quarter Rolling 12 months
0,00
0,10
0,20
0,30
0,40
0,50
0,60
0,70
0,80
0,90
0,00
0,10
0,20
0,30
0,40
0,50
0,60
0,70
0,80
0,90
Q1 07
Q2 07
Q3 07
Q4 07
Q1 08
Q2 08
Q3 08
Q4 08
Q1 09
Q2 09
Q3 09
Q4 09
Q1 10
Q2 10
Q3 10
Rolling 12 m
onths, SE
K/K
g
Qua
rter,
SE
K/K
g
AAK Group - Operating profit per kilo
Quarter Rolling 12 months
0
200
400
600
800
1 000
1 200
1 400
1 600
1 800
0
50
100
150
200
250
300
350
400
450
Q1 07
Q2 07
Q3 07
Q4 07
Q1 08
Q2 08
Q3 08
Q4 08
Q1 09
Q2 09
Q3 09
Q4 09
Q1 10
Q2 10
Q3 10
Rolling 12 m
onths, '000 MT
Qua
rter,
'000
MT
AAK Group - Volume
Quarter Rolling 12 months

Financial summary
CFO - Capital Market Day, 10 November 2010 12
EBITDA is exclusive non recurrent items but includes SEK 70 million in insurance compensation received in Q2 2009.
Focus the analysis on:
• Volume
• Gross Margin per kilo or tonne
• Operating profit per kilo or tonne
• Improvement in Operating profit
• Return on Net Operating Assets
• Net Debt / EBITDA
6,0%
7,0%
8,0%
9,0%
10,0%
11,0%
12,0%
13,0%
14,0%
15,0%
Q1 07 Q2 07 Q3 07 Q4 07 Q1 08 Q2 08 Q3 08 Q4 08 Q1 09 Q2 09 Q3 09 Q4 09 Q1 10 Q2 10 Q3 10
Return on Net Operating Assets - Rolling 12 months
3,87 3,89 3,964,12 4,25
4,564,42
4,174,40
3,85
3,10
2,452,16
2,46 2,48
0,00
0,50
1,00
1,50
2,00
2,50
3,00
3,50
4,00
4,50
5,00
Q1 07 Q2 07 Q3 07 Q4 07 Q1 08 Q2 08 Q3 08 Q4 08 Q1 09 Q2 09 Q3 09 Q4 09 Q1 10 Q2 10 Q3 10
Net Debt/Ebitda
0
100
200
300
400
500
600
700
800
900
1000
0
50
100
150
200
250
300
350
Q1 07
Q2 07
Q3 07
Q4 07
Q1 08
Q2 08
Q3 08
Q4 08
Q1 09
Q2 09
Q3 09
Q4 09
Q1 10
Q2 10
Q3 10
Rolling 12 m
onths, SE
K m
illion
Qua
rter,
SE
K m
illio
n
AAK Group - Operating profit (excl IAS 39)
Quarter Rolling 12 months

Capital expenditures
CFO - Capital Market Day, 10 November 2010 13
SEK
Mill
ion
Capital expenditures (excluding acquisitions and strategicinvestments) will be in line with annual deprectiations.
* Rolling 12 months
0
100
200
300
400
500
600
700
2006 2007 2008 2009 2010*
Investments Depreciations

Refinancing – SEK 4,200 million
The Group’s net borrowings as at 30 September 2010 amounted to SEK 3,080 million
Total committed credit facilities were end of September 2010 SEK ~ 6,750 million.
Large interest from banks to participate in the refinancing.
CFO - Capital Market Day, 10 November 2010 14
SEK 4,200 million expected to be refinanced before end of 2010

Investment Grade Pricing - Interestmargin
~100 bps
15CFO - Capital Market Day, 10 November 2010

Stock option program for senior executives and key managers
The Extraordinary General Meeting has decided to issue a maximum of 1,500,000 subscription warrants.
Dilution of maximum approximately 3.54 percent
Allotment of warrants to approximately 70 senior executives and key managers.
Management will buy the warrants at market value.
CFO - Capital Market Day, 10 November 2010 16

Market conditions
Volumes for speciality products are expected to continue to increase in Food Ingredients as well as in Chocolate & Confectionery Fats.
CFO - Capital Market Day, 10 November 2010 17
Related Documents