Commonwealth Bank of Australia ACN 123 123 124 RESULTS PRESENTATION FOR THE FULL YEAR Ended 30 June 2007 Ralph Norris CHIEF EXECUTIVE OFFICER David Craig CHIEF FINANCIAL OFFICER 15 August 2007

Welcome message from author
This document is posted to help you gain knowledge. Please leave a comment to let me know what you think about it! Share it to your friends and learn new things together.
Transcript

Commonwealth Bank of Australia ACN 123 123 124
RESULTS PRESENTATIONFOR THE FULL YEAREnded 30 June 2007
Ralph NorrisCHIEF EXECUTIVE OFFICER
David CraigCHIEF FINANCIAL OFFICER
15 August 2007

2
The material that follows is a presentation of general background information about the Bank’s activities current at the date of the presentation, 15 August 2007. It is information given in summary form and does not purport to be complete. It is not intended to be relied upon as advice to investors or potential investors and does not take into account the investment objectives, financial situation or needs of any particular investor. These should be considered, with or withoutprofessional advice when deciding if an investment is appropriate.
Disclaimer

3
Agenda
Ralph Norris, CEO – Results & Company Update
David Craig, CFO – Detailed Financials
Ralph Norris, CEO – Outlook
Questions and Answers
4
Notes

5
Overview
Good result - all businesses delivered double digit profit growth
Continued investment in the business to drive future growth
Substantial progress on our five strategic priorities
Credit quality maintained
Good momentum going into new year

6
Other key information Notes
Some overall Bank indicators
Cash NPAT 6 months
6 months
1,916
(145)
2,061
Dec 05
1,9922,2712,333Cash NPAT
000Less: Profit on sale of Hong Kong
1,9922.2712,333Cash NPAT (excl HK sale)
Jun 07 Dec 06 Jun 06($m)
202,667216,438234,569245,347Risk weighted assets ($m)
8.99
1,281m
1,007
Dec 05
1,0051,0101,010Number of branches
1,285m1,284m1,293mWeighted av. No. of shares (cash)
9.4210.2311.65Net tangible assets per share ($)
Jun 07 Dec 06 Jun 06

7
Strong financial results
7%6,427Expense ($m)
80 bpts22.1Return on Equity – Cash (%)
11%13,159Income ($m)
15%1.49Final Dividend ($ per share)
16%353.0Cash EPS (cents) *
18%4,604Cash NPAT ($m) *
Jun 07 vsJun 06
Jun 07
* Excludes profit on sale of Hong Kong Insurance business in half year ended December 2005

8
Notes

9
All brands performing strongly
InsuranceFunds MgtBanking
10
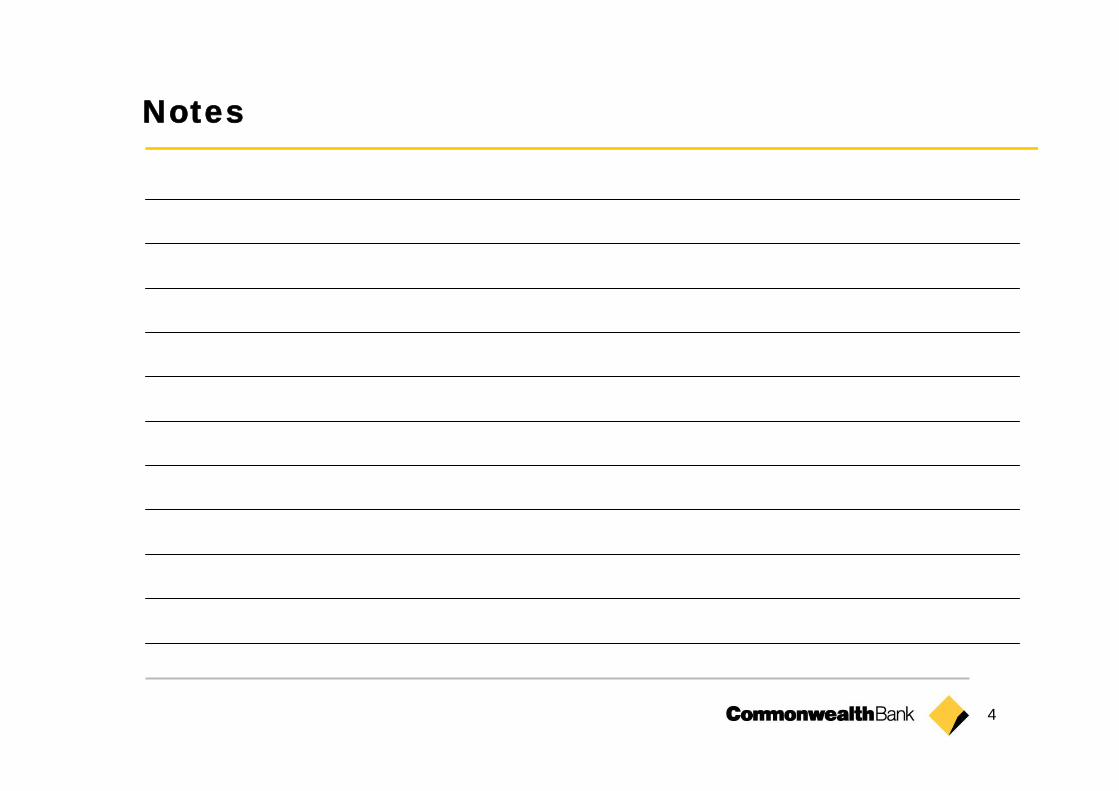
Market shares NotesJun 07 Dec 06 Jun 06
BankingHome loans 18.5% 18.4% 18.7%Credit cards 18.8% 19.3% 20.3%Retail deposits 21.6% 21.9% 22.2%Household deposits 29.0% 28.8% 29.3%Personal lending 16.4% 16.4% 16.1%Business lending - RBA 12.9% 13.0% 13.2%Business lending - APRA 12.4% 12.5% 12.1%Business deposits - APRA 13.0% 12.0% 11.9%Asset finance 13.2% 13.9% 14.5%NZ lending (housing) 23.1% 23.1% 23.1%NZ retail deposits 21.2% 20.7% 20.3%
Funds ManagementAust retail administrator view 14.2% 15.4% 15.4%NZ Managed investments 15.8% 16.1% 16.0%Firstchoice platform 8.5% 8.2% 7.7%
InsuranceAus. Life insurance (total risk) 14.2% 14.4% 13.2%NZ Life insurance 31.8% 31.5% 31.4%
*
* Includes impact of $7bn disengagement of Goldman Sachs JB Were from Avanteos

11
CEO priorities & measures
Customer Service
Business Banking
Technology & Operational Excellence
Trust & Team Spirit
Profitable Growth
Superior operating and financial results
Australia’s finest financial services organisation

12
Notes

13
Customer Service
Continued focus on embedding Sales & Services culture
4,000 front line staff trained in how to better identify customer needs
1,100 new customer facing roles across the Group
New branch operating model to better meet customer needs
Continued improvement in customer satisfaction scores
Complaints reduced; compliments increased
62%
72%
82%
Jun 05 Dec 05 Jun 06 Dec 06 Jun 07
% customers satisfied (Roy Morgan Research – 6 month average)
CBA
Indexed # of retail customer complaints
0.0
0.2
0.4
0.6
0.8
1.0
Jun 05 Dec 05 Jun 06 Dec 06 Jun 07
43% decline since 05/06
14
Notes

15
On a journey...Australian Retail Banking
Revenue growth
Introduction of CommSeeBranch refurbishmentIntroduction of initiatives for our people
Management KPI’slinked to customer satisfactionSales & Service ProgramSaturday tradingMeasurement of customer advocacy
New branch operating modelNew generation retail branch layoutRollout of Needs Analysis masteryTaking ownership and following up training
> 600 new front line staffCompetitive product offerings in all segmentsReduction in customer complaintsFlexible opening hours
Improvements emergingStrong upturn in network salesHome loans
8bpts in 2nd halfDeposits 21bpts in 2nd half
Operations Customers Market Share

16
Notes
17
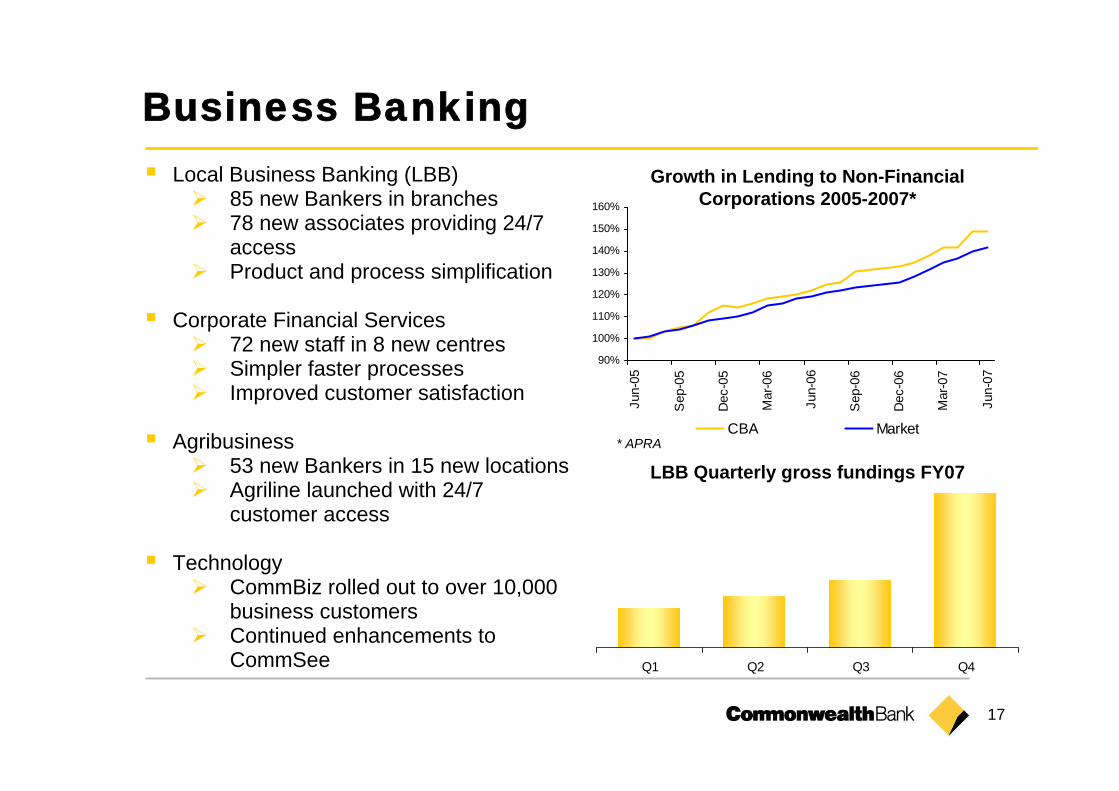
Local Business Banking (LBB)85 new Bankers in branches 78 new associates providing 24/7 accessProduct and process simplification
Corporate Financial Services72 new staff in 8 new centresSimpler faster processesImproved customer satisfaction
Agribusiness53 new Bankers in 15 new locationsAgriline launched with 24/7 customer access
TechnologyCommBiz rolled out to over 10,000 business customersContinued enhancements to CommSee
Business Banking
Q1 Q2 Q3 Q4
LBB Quarterly gross fundings FY07
Growth in Lending to Non-Financial Corporations 2005-2007*
90%
100%
110%
120%
130%
140%
150%
160%
Jun-
05
Sep
-05
Dec
-05
Mar
-06
Jun-
06
Sep
-06
Dec
-06
Mar
-07
Jun-
07
CBA Market* APRA

18
Notes

19
CommBiz – online, real time secure business and corporate banking
FirstChoice – chosen by 50% of IFA’s
CommSec
CommSee – 95% visibility of customer
Netbank – 2m active customers

20
EDS and Gen-i contracts
IT savings reinvested
EDS $398m
Gen-i$113m
FY07Spend
ATM201214-19EDSService Desk
DesktopEnd User Computing
FY08
FY08/FY09
Review
2012
200920082008
Contract End
Enhancements
Consulting
Selective in-sourcing of strategic capabilities
MaintenanceDevelopment
Applications
Telecommunication servicesOptusMobiles
10 - 15TelstraRASGen-iVoice and Data Services
12-14EDSEnterprise Processing Services
Saving $m p.aNew Deal

21
Technology & Operational Excellence
Saved over $100m of IT expense
Successfully delivering large portfolio of IT projects across the business
Significant improvements in system stability, resilience and security
429 staff trained in CommWay, taking total to 1,512
IT Efficiency Ratio *
Severity 1 and 2 IncidentsJune 06 – June 07
17.3% 16.5% 15.5% 15.0%
20.3%
10%
15%
20%
2006 Q1 2007 Q2 2007 Q3 2007 Q4 2007
* Efficiency Ratio = Total IT Expense (excluding strategic initiative spend) / Total bank Op Expenses
# In
cide
nts
0
10
20
30
40
50
60
Jun Jul Aug Sep Oct Nov Dec Jan Feb Mar Apr May Jun
Severity 1 and 2

22
Notes

23
Trust & Team Spirit improving
Continued improvement in the culture:
Increasing focus on customerPositive momentum in people engagement scoresImproved employee benefitsIncreasing sense of pride
Reflected in our people measures: LTIFR down approx 30% in last 12 monthsAbsenteeism down 7%Voluntary turnover down 13%
Continued support for our community 0
5
10
15
Sep 05 Dec 05 Mar 06 Jun 06 Sep 06 Dec 06 Mar 07 Jun 07
IncidentsClaims (Industry standard)
Source: Culture Survey
CARES Survey
0.9
1.0
1.1
1.2
1.3
1.4
1.5
Nov 03 Nov 04 May 05 Nov 05 May 06 Nov 06 May 07
Index
LTIFR
6.5
2.9

24
Notes

25
Asian expansion plans progressing well:
Indonesia - ANK acquisition- acquired JV partner stake in CMG Astra
China - Further capital investment in Hangzhou- Cinda/CFS fund management JV launched
Vietnam - Branch licence applied for
CFS Global Asset Management launched 20 new funds in 2007
Global Markets growth strategy
Cross business unit referrals increasing
Opportunities for Profitable Growth

26
Notes

Commonwealth Bank of Australia ACN 123 123 124
RESULTS PRESENTATIONFOR THE FULL YEAREnded 30 June 2007
David CraigCHIEF FINANCIAL OFFICER
15 August 2007

28
Defined benefit superannuation plan (income) / expense:This amount is influenced by actuarial estimates of the long-term return on plan assets, the discount rate applied to plan liabilities, and the cost of additional member benefits accrued during the period.Due largely to increasing return on assets in the current half, a net income amount is recorded
Treasury Shares valuation adjustment:CBA shares held within life insurance statutory funds (on behalf of policyholders) result in an Income Statement mismatchWhen the Bank’s share price rises, an expense is recognised for the increase in liability to policyholders, with no offsetting gain recognised on the “treasury shares”
One-off AIFRS mismatches:No economic loss has been incurredAccounting loss has arisen due to the unwinding of structured transactions offsetting profit never recognised through P<ransactions had been fully economically hedged at inception, and on transition to AIFRS on 1 July 2005 the hedge profit was recognised in retained earningsUnwind of transactions brings forward the recognition of this expense to the current period
134
64
75
(5)
Jun 07 $m
25Defined benefit superannuation plan (income) / expense
100Treasury Shares valuation adjustment
-One-off AIFRS mismatches
125
Jun 06$m
Non cash items12 months

29
Strong result
Large145Profit on the sale of HK Insurance
7%(125)(134)Non cash items
18%3,9084,604NPAT Cash *13%1,6361,843Tax & Minorities
16%5,5446,447Net profit before tax
11%11,83513,159Operating income
48%101149Shareholder investment returns
11%11,93613,308Income
9%398434Loan impairment expenses
7%5,9946,427Operating expenses
14%3,9284,470Statutory NPAT
Jun 07 vsJun 06
Jun 06$m
Jun 07$m
* Excludes profit on sale of Hong Kong in Dec 05
30
Notes
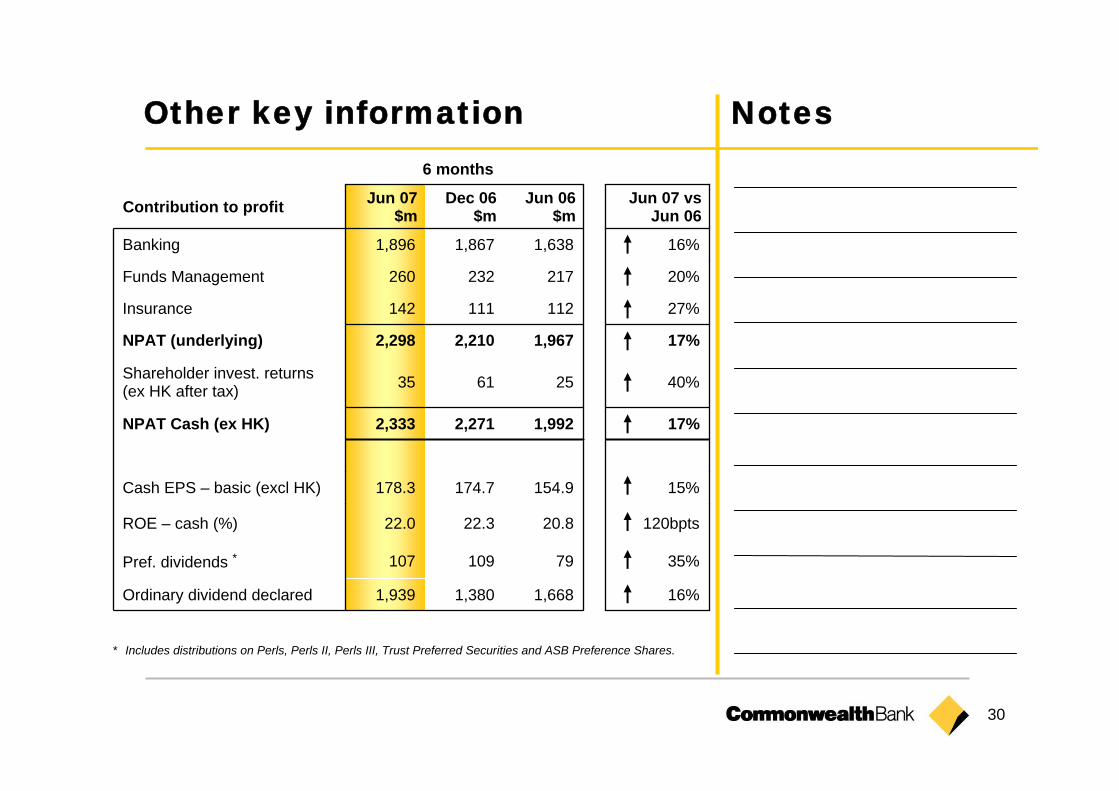
* Includes distributions on Perls, Perls II, Perls III, Trust Preferred Securities and ASB Preference Shares.
1,668
79
20.8
154.9
1,992
25
1,967
112
217
1,638
Jun 06$m
17%2,2712,333NPAT Cash (ex HK)
16%1,3801,939Ordinary dividend declared
35%109107Pref. dividends *
120bpts22.322.0ROE – cash (%)
15%174.7178.3Cash EPS – basic (excl HK)
17%2,2102,298NPAT (underlying)
35
142
260
1,896
Jun 07$m
61
111
232
1,867
Dec 06$m
40%
27%
20%
16%
Jun 07 vs Jun 06
Shareholder invest. returns (ex HK after tax)
Insurance
Funds Management
Banking
Contribution to profit
6 months
Other key information
31
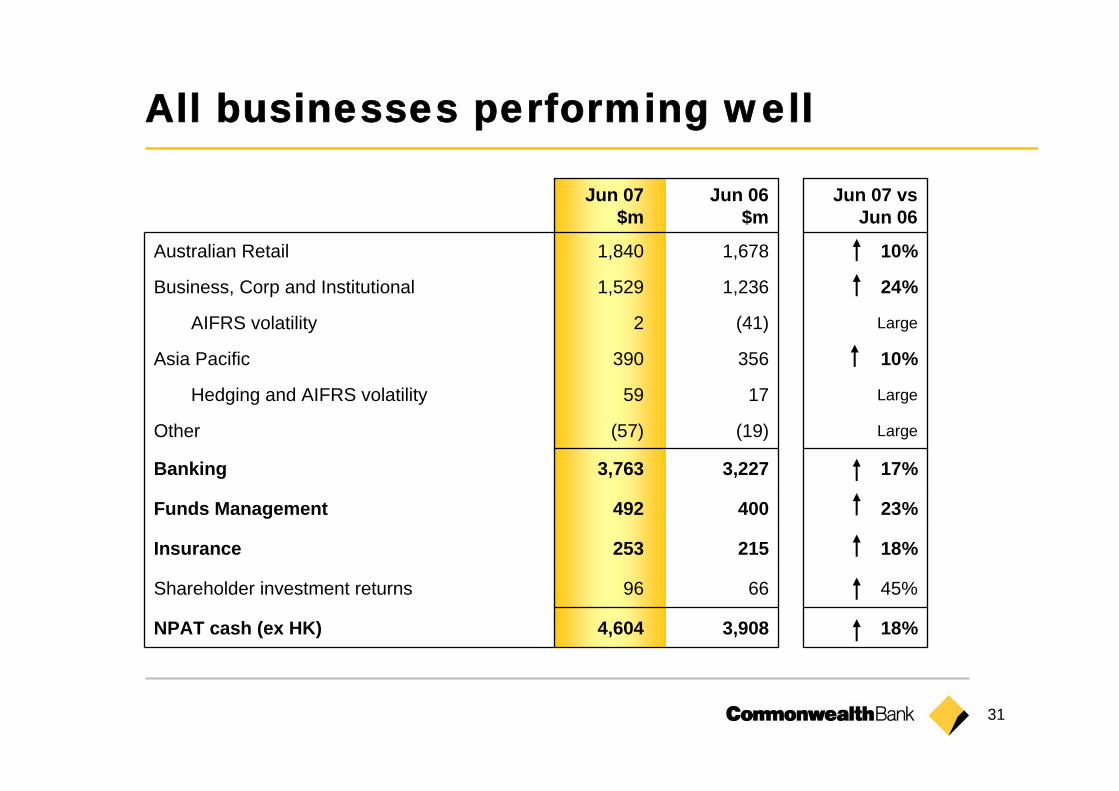
All businesses performing well
Large(41)2AIFRS volatility
Large1759Hedging and AIFRS volatility
45%6696Shareholder investment returns
10%1,6781,840Australian Retail
24%1,2361,529Business, Corp and Institutional
10%356390Asia Pacific
Large(19)(57)Other
18%3,9084,604NPAT cash (ex HK)
253
492
3,763
Jun 07$m
215
400
3,227
Jun 06 $m
18%Insurance
23%Funds Management
17%Banking
Jun 07 vs Jun 06

32
NotesOther key information
100%
6%
15%
26%
53%
Jun 07
14%14%Funds Mgt. income
6%6%Insurance income
Jun 06Dec 06
100%100%Total
26%26%Other banking income
54%54%Net interest income
% of operating income
6 months

33
Revenue growth outstrips costsJun 07 vs Jun 06
Australian Retail
BCI Asia Pacific
11%
19%20%
10%
4%
15%
5%
7%10%
16%
5%
1%
10%
2%
18%
23%23%
17%
10%
24%
10%
0%
5%
10%
15%
20%
25%
30%
Income Expenses NPAT
Banking Funds Management
Insurance Group
a Excludes hedging volatilityb Income is net of volume related expensesc Excludes Hong Kong disposal and the operating result of the businessd Excludes Hong Kong disposal
a
b
b c da
Investment Spend
2%
5%
Investment Spend

34
Notes
13 bpts
9%
15%
Jun 07 vs Jun 06
216
3,489
325,380
Jun 07 Jun 06Dec 06
229222Net interest margin (AIFRS) (bpts)
3,2023,432Net interest income ($m) *
282,553306,868Av interest earning assets ($m) *
* Excluding securitisation
Other key information
6 months

35
Banking profit up 17%
Jun 06 Cash NPAT
Jun 07Cash NPAT
NII Other income
Loan impairment
Expenses Tax & OEI
$3,227m
522
396 (239)(36) (107) $3,763m
Net interest income
Volume 15%
Liquid margin 3%
Other margin 4%
NII 8%
Other income 13%
Sale of Loy Yang $79m
Mastercard $58m (06 $32m)Commissions & fees 8%
Cost to income now 45.8%(June 06 47.7%)

36
Notes12 month margin analysis
Jun 06 Liquidassets
AIFRSvolatility
Assetpricing and
mix
Cash rate& deposit
pricing
Other Jun 07
234
(6) 1
(8)
(3) 1
219
Underlying NIM:core lending & deposits
10bpts
(basis points)

37
Underlying NIM down 6bpts since Dec
Dec 06 NIM Liquid assets
AIFRSvolatility
Asset pricingand mix
Cash rate &depositpricing
Jun 07 NIM
222
Underlying NIM:core lending & deposits
6bpts
2163 (3)
(3)
(3)
(basis points)
NII only 53% of total income
Liquid assets up over $4 billion
AIFRS derivative volatility inflating headline NIM
Asset pricing and mix:Home loans 2 bptsOther 1 bpt
3 bpts
Cash rate & deposit pricing:Cash rate benefit 4 bptsDeposit pricing 3 bptsMix 3 bptsDeeming rate 1 bpts
3 bpts( 50bpts; $20m)

38
NotesGroup impact – non trading derivatives
n/an/an/aPre-AIFRS hedge
CBAPeer 4Peer 1 Peer 3Peer 2
n/aHedge NZ profit
Non-AIFRS-complaint economic hedge
Hedge ineffectiveness (inside 80-125%)
Key
= Included within Cash NPAT = Excluded from Cash NPAT

39
AIFRS volatility – group impact
(24)(2)1759(41)(61)NPAT impact
91(8)(26)1727Tax
-(91)---(91)One-off AIFRS hedging mismatches
TotalNew ZealandAustralia
(33)
22
(55)
FY06$m
88
(32)
120
FY07$m
25
22
3
FY06$m
85(58)3Total banking income
117(58)3AIFRS hedging volatility
(32)--NZ revenue hedge
FY07$m
FY06$m
FY07$m
40
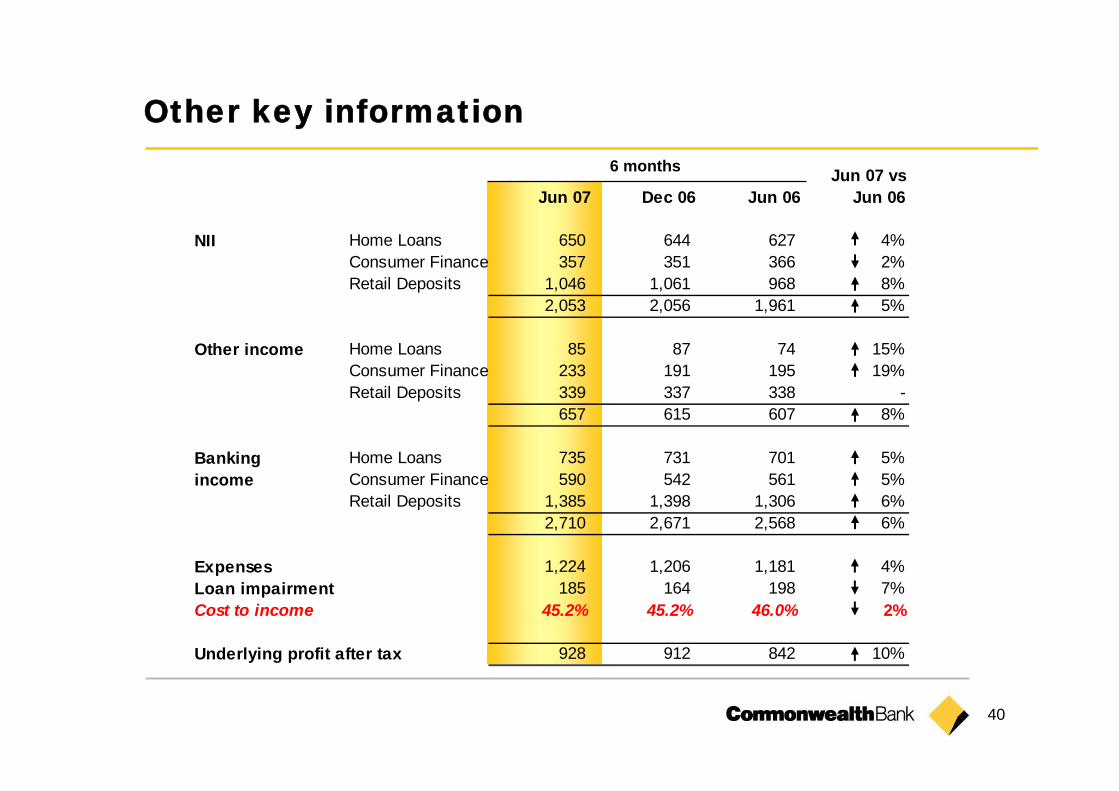
Jun 07 Dec 06 Jun 06Jun 07 vs
Jun 06
NII Home Loans 650 644 627 4%Consumer Finance 357 351 366 2%Retail Deposits 1,046 1,061 968 8%
2,053 2,056 1,961 5%
Other income Home Loans 85 87 74 15%Consumer Finance 233 191 195 19%Retail Deposits 339 337 338 -
657 615 607 8%
Banking Home Loans 735 731 701 5%income Consumer Finance 590 542 561 5%
Retail Deposits 1,385 1,398 1,306 6%2,710 2,671 2,568 6%
Expenses 1,224 1,206 1,181 4%Loan impairment 185 164 198 7%Cost to income 45.2% 45.2% 46.0% 2%
Underlying profit after tax 928 912 842 10%
Other key information6 months

41
4%1,466Home Loans
2%2,430Operating expenses
1%349Loan impairment
8%762Tax
5%5,381Total banking income
10%1,840Underlying profit after tax
7%2,783Retail Deposits
3%1,132Consumer Finance
Jun 07 vsJun 06
Jun 07$m
Australian Retail
Net interest incomeVolume 10%Margin 5%NII 5%
Good volume growth:Home loans 11%Deposits 9%
Expense growth of 2%400+ front line staffOffset by efficiency gains
Improved branch sales performance in the second half
Sound credit quality

42
Notes

43
Australian Retail snapshot% Consumer 30/90 days past due *
* Consumer loans include home loans, credit cards, personal loans
Jun 01 Jun 02 Jun 03 Jun 04 Jun 05 Jun 06 Jun 0716.4%+1bpt+34bpts+9bptsPersonal loans
18.8%
29.0%
18.5%
June 07 Market Share
-113bpts
-32bpts
- 10bpts
Jun 06 Jun 07Dec 06
-43bpts-103bptsCredit cards
+21bpts-51bptsHousehold deposits
+8bpts-30bptsHome loans
APRA market shares
4%
38%
20%
38%
Netbank Saver
Investment Accounts
Savings Deposits
Transactions Accounts
Business Online Saver
Jun 06 Jun 07% of Total deposit balances$ spot balances
38%
19%1% 8%
34%
(Change in 6 month period)
0.0
0.5
1.0
1.5 90 days past due 30 days past due
4b
34b
34b
18b8b
37b
34b
19b
1b

44
Other key information
11%413461460Corporate BankingBanking Income
12%160187179Corporate BankingOther Income
11%253274281Corporate BankingNII
15%1,7051,8981,967
13%780920885
17%9259781,082
24%617762767Underlying profit after tax3%47.6%43.9%46.2%Cost to income
77%312055Loan impairment
18%579619684Financial Markets *15%713818823Lending & Finance
14%346410393Financial Markets *14%274323313Lending & Finance
12%811833908Expenses
16%439495510Lending & Finance25%
Jun 07 vsJun 06
233
Jun 06Dec 06Jun 07
209291Financial Markets *
* Excludes the impact of AIFRS volatility

45
Business, Corporate & Institutional
10%921Corporate Banking
Large2AIFRS volatility
21%1,641Lending & Finance
10%1,741Operating expenses
10%75Loan impairment
11%520Tax
15%3,865Total banking income
24%1,529Underlying profit after tax
14%1,303Financial Markets
Jun 07 vs Jun 06
Jun 07$m
Strong asset growth of 20%
NII 14%
OBI 17%
Core lending and deposits margin stable over the year
Record CommSec trading volumes, margin lending balances 40%
Expenses growth driven by:
investment spend on strategic initiatives
338 new front line staff in business banking

46
Notes

47
Business, Corporate & Institutional snapshot
Global MarketsRecent industry rankings demonstrates momentum
Equity Capital Markets ranked 7th
(previously ranked 14th)
Equity Issuance ranked 7th
(previously ranked 28th)
Australian debt (excluding self-funded transactions) ranked 1st
0
10
20
30
40
50
Assets Liabilities
Institutional Banking * Banking Products * (CFS, LBB, Agribusiness)
Jun 06 Jun 07 Jun 06 Jun 070
102030
40506070
Assets Liabilities
Private Client Services
70% increase in monthly volumes from June 2006 to June 2007
Volu
me
tren
d lin
e 1.1m
0.65m
27%
21%
7%
18%
$bn $bn
Jun 06 Jun 07
* average interest earning assets and interest bearing liabilities

48
1.16
235
99
334
4
267
605
168
437
Dec 06$m
1.161.12New Zealand Dollar Exchange rate (avg) b
5%225236Underlying profit after tax
4%98102Income tax
5%323338Net profit before taxation
6%252266Operating expenses
14
618
165
453
Jun 07$m
9
584
172
412
Jun 06$m
56%Loan impairment
6%Total operating income
4%Other income
10%Net interest income
Jun 07 vs Jun 06ASB: New Zealand NZ$m a
6 months
Notes
a Statutory basis and excludes hedging volatilityb Hedging during the period may mean effective rate is different
Other key information

49
Asia Pacific
Large59Hedging & AIFRS volatility
1%515Operating expenses
10%18Loan impairment
1%159Tax
4%1,082Total banking income
10%390Underlying profit after tax
1%318Other banking income
6%764Net interest income
Jun 07 vsJun 06
Jun 07$m
ASB contributed $374m
ASB NPAT 8% in NZD excluding the impact of hedging
ASB NII 8%Lending assets 16% Margin 10bpts (largely 1H07)Weaker NZD
Significant hedging volatility separately disclosed

50
NotesOther key information
Loan impairment expense to avg RWA (annualised)
0.15%0.16%
0.19% 0.19%
Jun 04 Dec 04 Jun 05 Dec 05 Jun 06 Dec 06 Jun 07
146126 176 188 210
0.20%
195
0.17%0.20%
239Expense
0.20% 0.19%

51
Credit – maintained high standardsLoan impairment expense as % of RWA down on last year at 0.19% (06: 0.20%)
Limited private equity participation
No exposure to CLO’s / CDO’s, or material direct exposure to US subprime
67% of commercial loans investment grade
Improving unsecured retail lending risk profile
Low doc loans (2.3% of home loans)
On market value, 75% of home loans < 60% LVR and most > 80% LVR insured
Gross impaired assets to RWA
0.00%
0.20%
0.40%
0.60%
0.80%
1.00%
1.20%
Dec01
Jun02
Dec02
Jun03
Dec03
Jun04
Dec04
Jun05
Dec05
Jun06
Dec06
Jun07
CBAANZNABWBC
Individually assessed provisions as a % of advances
0
5
10
15
20
25
Consumer Commercial
FY03 FY04 FY05 FY06 FY07
bpts

52
6 months
* Plan for Life – March 07
Jun 07 Dec 06 Jun 06FUAAv. FUA ($bn) 171 158 148Spot. FUA ($bn) 177 168 152
MarginsOperating income/ av. FUA 1.16 1.13 1.14Net income/ av. FUA 0.98 0.95 0.97
ExpensesOperating expenses/ av.FUA 0.72 0.71 0.72Operating expenses to net income 55.3 56.1 57.3
Market shares*Retail Administrator view 14.2% 15.4% 15.4%First Choice Platforms 8.5% 8.2% 7.7%
Local equities 22.3% 22.8% 22.4%International equities 24.1% 24.2% 22.5%Listed and direct property 18.5% 17.9% 17.9%Fixed interest and cash 35.1% 35.1% 37.2%Total 100.0% 100.0% 100.0%
Breakdown of funds invested
Other key informationFirstChoice Funds Under Administration
balance & market shareFUA market share: Plan for Life All Master Funds
– Administrator View
0
5,000
10,000
15,000
20,000
25,000
30,000
35,000
40,000
Jun 02 Dec 02Jun 03Dec 03Jun 04 Dec 04Jun 05Dec 05Jun 06Dec 06 Jun 070.0%
1.0%
2.0%
3.0%
4.0%
5.0%
6.0%
7.0%
8.0%
9.0%
10.0%
FirstChoice FUA FirstChoice FUA Market Share %
$m
51%

53
Funds Management
16%890Operating expenses
23%492Underlying NPAT
39%232Tax & minority interests
20%1,612Funds management income
20%490Cash NPAT
-14Shareholder investment returns
20%1,598Net income *
Jun 07 vs Jun 06
Jun 07$m
* Net of volume related expenses
FUA 17% to $177bn
Margins stable
Largest retail share (14.2%)
First Choice 51% over last 12 months to $40bn
AWG sell down progressing well, 13% prior to June 07, another 4% in July
Strong investment in business:
developing GAM capability
platform & advice leadership
cross sell initiatives

54
Notes
Breakdown of Shareholders’ Funds
Other key information
Jun 07 Dec 06 Jun 06Claims expense as % of net earned premiumGeneral insurance 68% 50% 57%Life insurance 44% 47% 41%
Sources of profit $M $M $MPlanned profit margins 90 94 77Experience variations 49 7 29Other 0 0 (2)General insurance operating margin 3 10 8Operating margins 142 111 112After tax shareholder investment returns 40 58 20NPAT (cash) 182 169 132
Local equities 1% 1% 2%International equities 1% 1% 1%Property 20% 19% 17%Growth 22% 21% 20%Fixed interest 35% 25% 29%Cash 43% 54% 51%Income 78% 79% 80%Total 100% 100% 100%
6 months

55
a Excludes impact of sale of Hong Kong Insurance business in 2006b Net of volume related expenses
Insurance
10%282Operating expenses
23%253Underlying NPAT
34%137Tax
24%770Total insurance income
34%351Cash NPAT
57%135Shareholder investment returns
19%635Net income b
Jun 07 vs Jun 06 a
Jun 07$m
Inforce premiums 21%
Planned profit margins 26%
Australia total risk market share to 14.2% (June 06 13.2%)
“Life Insurer of the Year” – Aust& NZ Insurance Industry Awards
General insurance result affected by NSW storms

56
NotesOther key information
435
150
285
Jun 07
365350Cash investment spend
130110Capitalised
235240Profit and loss
Jun 06Dec 06
57
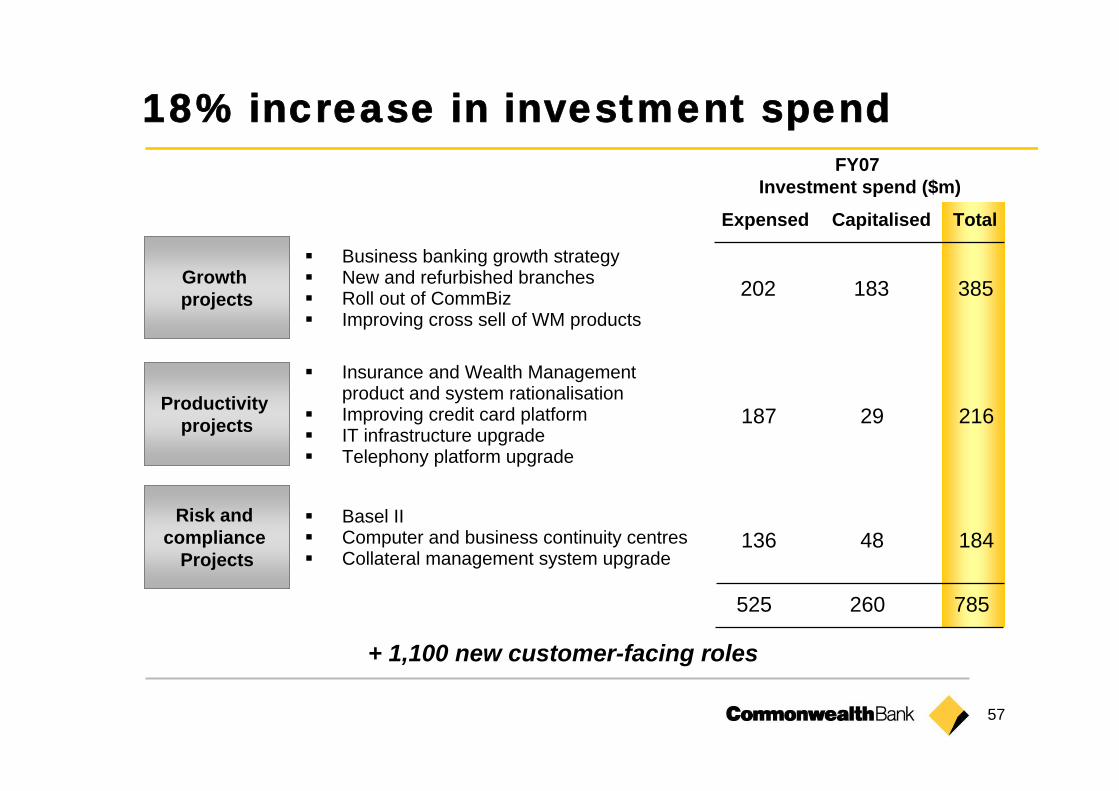
18% increase in investment spend
Growth projects
Productivity projects
Risk and compliance
Projects
Business banking growth strategyNew and refurbished branchesRoll out of CommBizImproving cross sell of WM products
Insurance and Wealth Management product and system rationalisationImproving credit card platformIT infrastructure upgradeTelephony platform upgrade
Basel IIComputer and business continuity centresCollateral management system upgrade
+ 1,100 new customer-facing roles
FY07 Investment spend ($m)
385183202
TotalCapitalisedExpensed
21629187
18448136
785260525

58
Capital treatment
Note: This table is a summary. For the full reconciliation, refer Appendix 13 "Capital Adequacy" on pages 47-50 of the June 2007 Profit Announcement
AIFRS S&P
Shareholders' EquityOrdinary Share CapitalOther Equity Instruments Reserves General Reserve & Capital Reserve GRCL Asset Revaluation Reserve Other reserve accountsRetained EarningsMinority InterestsHybrid Debt Issues & Loan CapitalOther debt issues (subordinated)Collective & other credit provisionsAIFRS transitional relief (T1 & T2)
Capital DeductionsIntangiblesSuperannuation Surplus (after tax)Equity investments in other companiesValue of acquired inforce businessInvestments in offshore banksOther Deductions
APRAAccounting Total ACETier 1 Tier 2
59
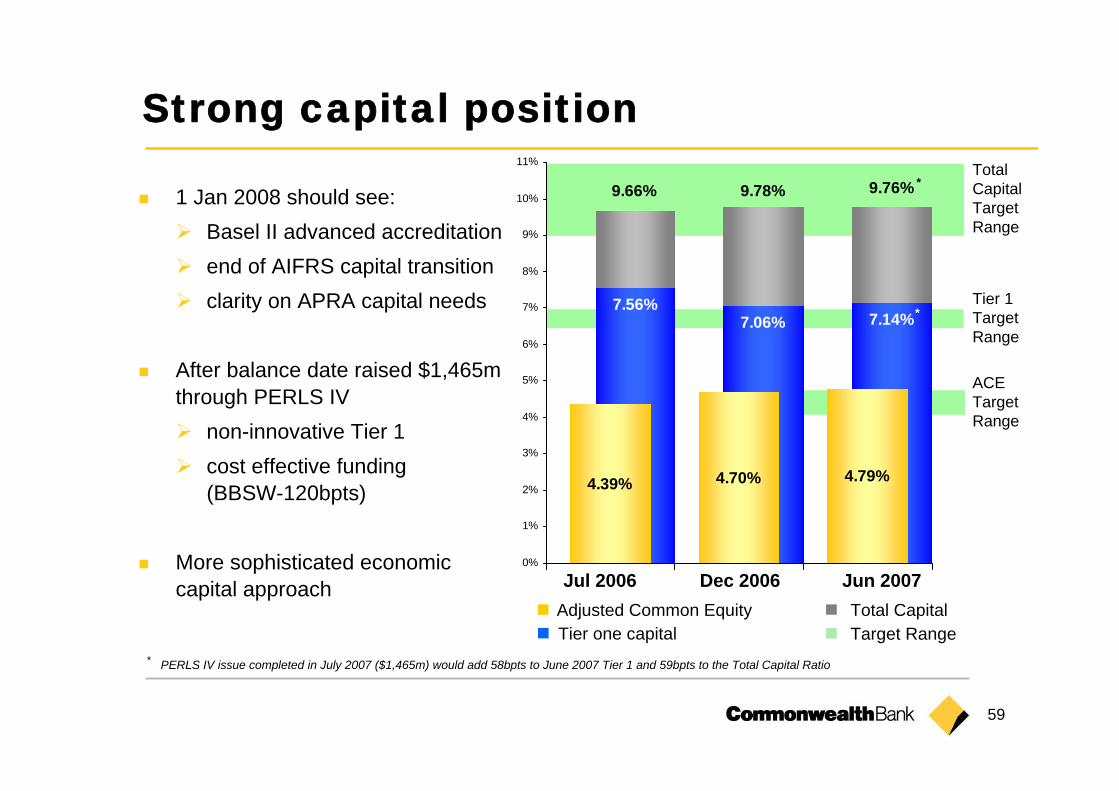
7.56%7.06% 7.14%
9.76%9.78%9.66%
4.39% 4.70% 4.79%
0%
1%
2%
3%
4%
5%
6%
7%
8%
9%
10%
11%
Strong capital position
Adjusted Common EquityTier one capital
Total CapitalTarget Range
Jul 2006 Dec 2006
Total Capital Target Range
Tier 1 Target Range
ACE Target Range
Jun 2007
* PERLS IV issue completed in July 2007 ($1,465m) would add 58bpts to June 2007 Tier 1 and 59bpts to the Total Capital Ratio
*1 Jan 2008 should see:
Basel II advanced accreditationend of AIFRS capital transitionclarity on APRA capital needs
After balance date raised $1,465m through PERLS IV
non-innovative Tier 1cost effective funding (BBSW-120bpts)
More sophisticated economic capital approach
*

60
Notes

61
Summary
Double digit profit growth from all business segments
Continuing to invest for future growth and productivity
Australian Retail market share improvements in second half
Significant opportunities still exist in Business, Corporate andInstitutional
Investment in Funds Management and Insurance driving strong performance
Credit quality and capital position remain strong

62
Notes
18.7%
15.3%
13.2%
Jun 07 Actual
14-16%Business credit
8.5-10.5%Other personal credit
13-15%Housing credit
Jun 08 Forecast *
* CBA economist forecast for the Australian market as at July 2007

63
Outlook
Economic outlook for Australia remains positive
Housing credit growth expected to remain at similar levels to 2007
Some slowing expected in business and personal credit growth
Financial services industry will remain competitive
Given outlook and business mix, expect EPS growth to meet or exceed average of peers

Commonwealth Bank of Australia ACN 123 123 124
RESULTS PRESENTATIONFOR THE FULL YEAREnded 30 June 2007
Ralph NorrisCHIEF EXECUTIVE OFFICER
David CraigCHIEF FINANCIAL OFFICER
15 August 2007

Supplementary materials

Economy

67
GDP, unemployment and cash rates

68
Credit growth

69
Spreads
Aus. BBB Corporates ~ 35bp over swaps
US BBB Corporates ~ 50bp over swaps

Group

71
Fully franked dividends
Dividend (cents per share)
68 6979 85
82 85104
112
10794
149130
0
40
80
120
160
200
240
2002 2003 2004 2005 2006 2007
Cen
ts
Second HalfFirst Half
Payout Ratio(cash basis) 73.9% 73.9% 74.9% 71.0% 73.0%

72
7%5,9946,427Total operating expenses
8%406373Other
6%307326Advertising, marketing etc
1%216213Postage and stationery
691
907
688
3,229
Jun 07 $m
636
985
621
2,823
Jun 06$m
9%Fees and commissions
8%IT Services
11%Occupancy and equipment
14%Staff expenses
Jun 07 vs Jun 06Comparable expenses
12 months
Expenses

Banking
74
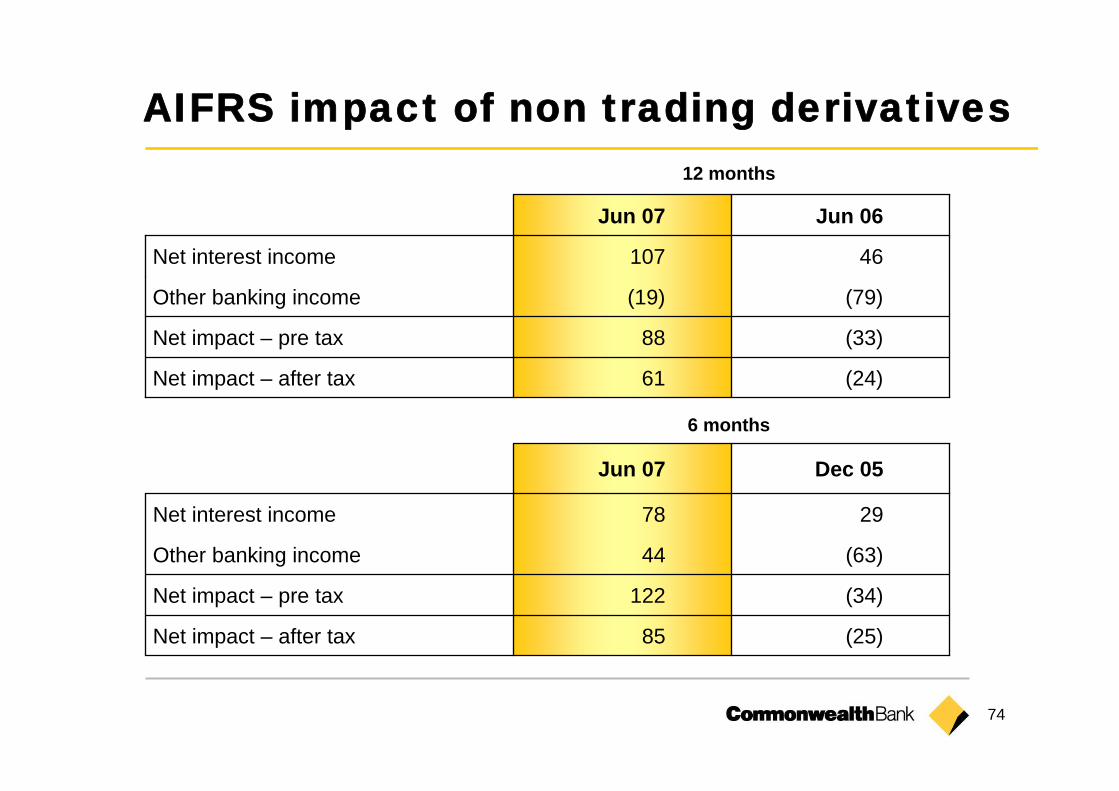
AIFRS impact of non trading derivatives
(24)61Net impact – after tax
88
(19)
107
Jun 07
(33)Net impact – pre tax
(79)Other banking income
46Net interest income
Jun 06
12 months
(25)85Net impact – after tax
(34)122Net impact – pre tax
(63)44Other banking income
2978Net interest income
Jun 07 Dec 05
6 months

75
Banking revenue by product
Consumer Finance11%
Corporate Banking9%
Financial markets13%
Asia Pacific10%
Home Loans14%
Other1%
Lending & Finance
16%
Retail Deposits
26%
6 months
Jun 07 Dec 06 Jun 06Jun 07 vs
Jun 06
Home Loans 735 731 701 5%
Consumer Finance 590 542 561 5%
Retail Deposits 1,385 1,398 1,306 6%
Corporate Banking 460 461 413 11%
Financial Markets 684 619 579 18%
Lending & Finance 823 818 713 15%
Asia Pacific 551 531 537 3%
Other (incl. Hedging and AIFRS volatility) 77 63 40 93%
Total Banking Income 5,305 5,163 4,850 9%

76
Summary - CBA growth vs market*12 months to June 2007
Market
Home lending
Household depositsPersonal lending
10.5%
9.2%
11.7%13.7%11.4%
0.0%
5.0%
10.0%
15.0%
CBA WBC ANZ NAB SGB
2.0%
7.6%
18.5%
7.2%12.2%
0.0%
5.0%
10.0%
15.0%
20.0%
CBA WBC ANZ NAB SGB
22.5%19.4%
13.2%
24.3%
11.1%
5.0%
10.0%
15.0%
20.0%
25.0%
CBA WBC ANZ NAB SGB
12.8%
8.7%
19.9% 8.4%
11.3%
16.8%
7.7%
8.8%
Top 5
7.3%
10.4%8.6%
10.6%8.9%
0.0%
6.0%
12.0%
CBA WBC ANZ NAB SGB
* APRA, RBA stats
Credit cards(as at May 07)

77
Summary - CBA growth vs market*6 months to June 2007
Market
Home lending Credit cards(as at May 07)
Household depositsPersonal lending
6.7%5.4%
6.5%7.5%7.0%
0.0%
5.0%
10.0%
15.0%
CBA WBC ANZ NAB SGB
2.6% 1.5%
8.8%
0.8%0.6%
0.0%
5.0%
10.0%
15.0%
CBA WBC ANZ NAB SGB
15.2% 13.5%
10.6%12.2%11.4%
5.0%
10.0%
15.0%
20.0%
CBA WBC ANZ NAB SGB
6.6%
2.7%
15.1%
0.7%
6.6%
12.4%
1.8%
1.3%
Top 5
1.5%0.5%
1.1%
2.6%
0.7%
0.0%
5.0%
CBA WBC ANZ NAB SGB
* APRA, RBA stats

78
Home lending statistics (domestic balances gross of securitisation)
* Care – Prior periods restated for classification changes between periods
Home loans (domestic)Jun 07 Dec 06 Jun 06
Jun 07 vs Jun 06
Domestic growth profile ($bn)Loan funded 27.1 25.1 24.8 9%Reduction 16.5 19.1 16 3%Net growth 10.6 6.0 8.8 20%Total Home lending assets ($b)Australian home lending assets ($b) 161.4 150.8 144.8 11%Securitisation ($b) (15.6) (10.8) (12.6) 24%Net (Australia) 145.8 140 132.2 10%Asia Pacific home lending assets ($b) 28.9 25.9 22.3 30%Totals (adjusted for rounding) 174.7 165.9 154.5 13%
Balances mix (%) : Jun 07 Dec 06 Jun 06Owner occupied 55% 55% 55%Investment home loans 34% 35% 35%Line of credit 11% 10% 10%
Variable 62% 62% 64%Fixed * 29% 27% 24%Honeymoon * 9% 11% 12%
Originations (% of loans funded) : *3rd Party 35% 34% 32%Proprietary 65% 66% 68%
Broker originated loans as % of Aust. Book 28% 26% 24%

79
Home loan balance growth by channel (half year)
13.3%11.5%14.8%
5.4%
3.0%
4.7%
3.3%
0.01%
2.8%
7.0%
4.1%
6.5% 6.6%5.8%*
7.1%
0%
2%
4%
6%
8%
10%
12%
Brokers Branch Premium Total CBA Total Market
Dec 06
20%
Jun 06
* Prior period number restated by APRA
Jun 07

80
Home loan portfolio – stress tested
Stress test scenario consistent with experience of UK recession of the late 1980s / early 1990s.
Up to 6 fold increase in PD, due to unemployment of 10% & interest rates of 14%
Up to 30% fall in security value
Under current conditions, 1 year HL expected loss at around $12m
Under most stressed conditions, expected loss totals $299m = 3 months home loan net income. This has decreased from $307m at the last Stress Test. The slight reduction in expected loss under the current and stressed case is attributed to general levelling out of property prices in Sydney and continued appreciation elsewhere across Australia.
Additional insured losses of $265m covered by mortgage insurance
Property value x6x4x2x1
Expected loss $m
298.8239.2156.6107.230% decrease
161.0130.087.060.920% decrease
72.059.040.729.210% decrease
27.122.616.111.8No decrease
PD stress factor
Market value stress
Note:PD = Probability of defaultExcludes lines of credit

81
Home loans – LVR profile
LVR profile
Australian Owner Occupied and Investment Housing only, excludes Lines of CreditNumber of loans as at 31 Dec 06 and market value as at 31 Dec 06Market value marked against the APM database
Strong LVR profile
% of loans at <60% LVR:
68% if based on original security value
75% if based on current market values
There has been some shift towards the 60-75% LVR group, from the lower and higher value groups
The majority of loans >80% LVR are mortgage insured18
0%
10%
20%
30%
40%
50%
60%
70%
80%
90%
0-60 60.1-75 75.1 -80 80.1 -90 90.1+
LVR on orginal security value LVR at current market value

82
SummaryJun 07 Dec 06 Jun 06
RWA $245,347 $234,569 $216,438m
Charge for bad debts (6 mths) $239m $195m $210m
Charge for loan impairment to RWA (annualised) 0.20% 0.17% 0.20%
Gross impaired assets $421m $338m $326m
Individually assessed provisions $199m $171m $171m
Collective provisions $1,034m $1,040m $1,046m
General Reserve for credit losses within shareholders equity (pre-tax) $500m $500m $500m
Prudential General Reserve for Credit Losses to RWA 0.63% 0.68% 0.71%
Credit Risk StatisticsCommercial portfolio
Top 20 commercial exposures (as % of total committed exposure) 2.6% 2.5% 2.5%
% of all commercial exposures that are investment grade or better 67% 67% 68%
% of non-investment grade exposure covered by security 82% 82% 83%
Consumer portfolio
Home lending as % of gross lending 54% 55% 55%

83
Home loans – portfolio quality30+ & 90+ day delinquencies
Portfolio credit quality remains sound
In line with seasonal expectations, delinquencies have improved in the last few months
Home Loan collection isfocusing on higher risk loans
Significant differences have been observed across states with NSW/ACT being the highest, and WA the lowest
0.00%
0.20%
0.40%
0.60%
0.80%
1.00%
1.20%
1.40%
$30+ Delinquency by State
0.00%
0.20%
0.40%
0.60%
0.80%
1.00%
1.20%
1.40%
1.60%
May
-06
Jun-
06
Jul-0
6
Aug
-06
Sep
-06
Oct
-06
Nov
-06
Dec
-06
Jan-
07
Feb-
07
Mar
-07
Apr
-07
May
-07
Jun-
07
Month
$30+
(%)
NSW/ACTQLDSA/NTVIC/TASWA
All Australian owner occupied and investment housing only, excludes lines of credit delinquency percentage uses balances
30+ delinquencies by state
30+ days delinquency 90+ days delinquency
Jun
03
Sep
03
Dec
03
Mar
04
Jun
04
Sep
04
Dec
04
Mar
05
Jun
05
Sep
05
Dec
05
Mar
06
Jun
06
Sep
06
Dec
06
Mar
07
Jun
07

84
0 100 200 300 400 500 600 700 800 900 1,000 1,100 1,200
Rating
BBB-
BBB-
A-
BBB-
BBB
A
BBB+
BBB-
BBB
BBB+
A-
BBB
BBB+
A+
A
BBB
BBB+
A-
A
B
Banking - Top 20 commercial exposures($m)
Top 20 exposures – excludes finance and government – comprise 2.6% of committed exposures (2.5% as at Dec 06, 2.7% as at Jun 06)
S&P
Rat
ing
or E
quiv
alen
t

85
The Bank remains well provisioned
0
300
600
900
1,200
1,500
1,800
2,100
Jun 96 Dec 96 Jun 97 Dec 97 Jun 98 Dec 98 Jun 99 Dec 99 Jun 00* Dec00*
Jun 01 Dec 01 Jun 02 Dec 02 Jun 03 Dec 03 Jun 04 Dec 04 Jun 05 Dec 05 Jun 06 Dec 06 Jun 070
50
100
150
200
250
300
350
400
450
500
550
%
General Reserve for Credit Loss (LHS)
Collective Provision (LHS)
Individually Assessed Provision (LHS)
Total Loan Provisions + General Reserve / Gross Impaired Assets (RHS)* Colonial acquisition
$mill
ions
1. The Group GRCL within shareholders equity has been retained as part of the Prudential General Reserve for Credit Losses for prudential reporting purposes2. Loan Impairment provisions have been recalculated under AIFRS from 1 July 2005
(1)
(2)
(2)

86
Banking - Quality of commercial risk-rated exposures
Quality of commercial risk-rated exposures: There is security over 82% of the non-investment
grade exposure
30 35 32 32 29 31 30 30
18 22 20 17 17
17 15 16 16 16 17 20 20
36 33 34 34 33 32 33 33
181717
0%
20%
40%
60%
80%
100%
AAA/AA A BBB Other
Dec 03 Dec 04Jun 04
67% investment grade
Jun 05 Dec 05 Jun 06 Dec 06 Jun 07

87
Banking - total geographic exposure* (commercial + consumer)
Total exposure : $463bHome loans = $174.7 b (excl securitised)Other balance sheet loans = $146.95 bOther exposure = $141.35 b
At 31 Dec 06Total exposure = $443bHome loans = $166.0bOther loans = $133.3bOther exposure = $143.7b
International = 14%New Zealand = 13%Australia = 73%
*Total exposure = balance for uncommitted, greater of limit or balance for committed
Australia 73%
International 14%
New Zealand 13%

88
Banking - total outstandings*(commercial + consumer)
Total outstandings$377.8 b*
* Represents balances actually outstanding (on and off balance sheet).
At 31 Dec 06Total outstanding = $359.0bConsumer = 49.4%Telecoms = 0.2%Agriculture = 2.6%Construction = 1.0%Energy = 1.4%Finance = 24.0%Government = 1.8%Leasing = 1.5%Motor vehiclemanufacturing = 0.1%Other commercial & industrial = 17.9%Technology = 0.1%
Finance 25.7%
Leasing 1.3%
Motor vehicle manufacturing 0.1%
Other C&I 18.1%
Technology 0.2%
Consumer 48.1%
Government 1.4%
Agriculture 2.7%Telecommunication 0.1%
Construction 1.1%Energy 1.2%

89
Banking – international commercial exposures*
AviationTechnologyTelcosEnergyLeasingConstructionAutomobile
International exposure by Industry
Total exposure : $65.7b
*Total exposure = balance for uncommitted, greater of limit or balance for committed. Excludes ASB
Total non-finance off-shore outstandings = $12.7b of which over 84% are investment grade.
At 31 Dec 06Total exposure = $62.4bFinance = 80%Government = 2%Other commercial = 13%Specific industries = 5%
Finance 80%
Specific Industries 5%
Other Commercial 13%Government 2%

90
Banking credit exposure - agriculture sector
11,574
6,289
3,202
1,849
234
$m
30 Jun 07
30 Jun 06
31 Dec 06
11,011
5,987
3,155
1,614
255
$m
10,152TOTAL
5,477< BB-
3,022BB to BB-
1,320BBB+ to BBB-
333AAA to A-
$mRating
Total exposure: $11,574m
**Illustrates Australia and NZ component only of Agriculture sector.
At 31 Dec 06Total exposure = $11,011mAustralia = 60%New Zealand = 40%
*Total exposure = balance for uncommitted, greater of limit or balance for committed.
New Zealand 41%
Australia 59%

91
Banking credit exposure - aviation sector
3,737
58
94
2,633
952
$m
30 Jun 07
30 Jun 06
31 Dec 06
3,828
70
70
2,561
1,127
$m
3,087TOTAL
118< BB-
313BB to BB-
1,516BBB+ to BBB-
1,140AAA to A-
$mRating
Total exposure: $3,737mAt 31 Dec 06Total exposure = $3,828mAustralia = 75%New Zealand = 11%Other = 14%
*Total exposure = balance for uncommitted, greater of limit or balance for committed.
Other 14%
New Zealand 11%
Australia 75%

92
Bankingcredit exposure - energy sector
6,842
142
468
5,441
791
$m
30 Jun 07
30 Jun 06
31 Dec 06
7,027
206
503
5,178
1,140
$m
6,889TOTAL
292< BB-
408BB to BB-
4,588BBB+ to BBB-
1,601AAA to A-
$mRating
Total exposure: $6,841mAt 31 Dec 06Total exposure = $7,027mAustralia = 67.0%New Zealand = 10.9%Asia = 3.2%Europe = 16.2%Americas = 2.7%
*Total exposure = balance for uncommitted, greater of limit or balance for committed.
Australia 65.3%
Americas 6.1%
Europe 14.9%
Asia 3.3%
New Zealand 10.4%

93
Bankingcredit exposure - telcos sector
663
80
89
128
366
$m
30 Jun 07
30 Jun 06
31 Dec 06
990
71
192
134
593
$m
1,391TOTAL
108< BB-
150BB to BB-
277BBB+ to BBB-
856AAA to A-
$mRating
Total exposure: $663mAt 31 Dec 06Total exposure = $990mAustralia = 75%New Zealand = 6%Europe = 12%Asia = 8%
*Total exposure = balance for uncommitted, greater of limit or balance for committed.
Asia 11%
Europe 0%New Zealand
12%
Australia 77%
Funds Management & Insurance

95
Investment performanceNumber of funds in each asset class out
performing benchmark (3 years)
100%
87%
100%
60%
83%
50%
74%78%
67%
0%
20%
40%
60%
80%
100%
120%
DomesticEquities
GlobalResources
PropertyTrusts
FixedInterest
Cash Hedgefunds
CFSProperty
FSI Total

96
Other key information
17177,07123,7951,763151,513Total – funds under administration
(36)5,8752,040(5,363)9,198Avanteos
20171,19621,7557,126142,315Funds under administration (Excl Avanteos)
3639,9368,3422,13329,461Internationally sourced
16131,26013,4134,993112,854Domestically sourced
(2)
7
16
20
82
19
(2)
(15)
51
Growth YOY
%
(472)
(1,397)
2,865
3,997
155
3,842
(4,669)
(685)
9,196
Netflows$m
3,6353993,708Other d14,8432,33113,909Property
34,4691,78929,815Wholesale
78,3138,89465,422Australian retail
76,6978,31964,536Retail products b
886
34,669
3,690
26,177
Opening balance Jun 06
$m
575
4,022
125
4,172
Investment income &
other e$m
1,616Other retail c
34,022Legacy products a3,130Cash management
39,545FirstChoice
Closing balance Jun 07
$mFunds Under Administration
a Includes stand alone retail and legacy retail productsb Retail products (excluding Avanteos) align to Plan for Life market releasesc Includes listed equity trusts and regular premium plans. These retail products are not reported in market share datad Includes life company assets sourced from retail investors but not attributable to a funds management product (e.g. premiums from risk products). These
amounts do not appear in retail market share datae Includes foreign exchange gains and losses from translation of internationally sourced business
Full Year Ended 30 June 2007

Capital Management

98
ACE calculation
* Net of intangible component deducted from Tier One capital
Jun 07 Dec 06 Jun 06Adjusted Common Equity * $m $m $mTier One capital 17,512 16,553 16,354Add:
Deferred income tax 37 39 -Equity investments in other companies 700 820 -
Deduct:Eligible loan capital (245) (263) (281)Other hybrid equity instruments (3,474) (3,522) (3,659)Minority interest (net of minority interest component deducted from Tier One capital) (512) (508) (508)
Investment in non-consolidated subsidiaries (net of intangible component deducted from Tier One capital) (409) (283) (2,012)Other deductions (178) (166) (151)
Impact upon adoption of AIFRS (1,641) (1,641) -
Total Adjusted Common Equity 11,790 11,029 9,743
Risk Weighted Assets (S&P) 246,047 234,569 216,438
Adjusted Common Equity Ratio 4.79% 4.70% 4.50%
Credit Ratings Long Term Short Term Affirmed/UpgradedStandard & Poors' AA A-1 + Feb 07Moody's Investor Services Aa1 P-1 May 07Fitch Ratings AA F1+ Feb 07

99
ACE movement in half year ended June 2007
4.70%
(0.05%)
(0.22%)0.11%0.20%
(0.79%)0.95%
(0.11%) 4.79%
3.0%
3.5%
4.0%
4.5%
5.0%
5.5%
6.0%
ACE Dec 2006
$11,029m
Cash NPAT
$2,333m
Growth in RWA
($11,478m)
ACE Jun 2007
$11,790m
Ordinary Dividends ($1,939m)
Other c
($262m)Investment
in non consolidated subsidiaries
($126m)
DRP a
$485mDRP b$270m
a June 2007 final dividend (25% participation)b Additional DRP take up on interim 2007 dividendc Primarily reflects statutory adjusted profit items and higher intangibles

100
Tier 1 movement in half year June 2007
7.06%
0.95% (0.79%)
(0.31%)0.20%
0.11% (0.08%) 7.14%
5.0%
5.5%
6.0%
6.5%
7.0%
7.5%
8.0%
8.5%
9.0%
Tier 1 Dec 2006 $16,553m
Cash NPAT
$2,333m
Ord. Dividends($1,939m)
Growth in RWA
($10,778m)
DRP a$485m
Currency and Other
Movements c($190m)
Tier 1 Jun 2007$17,512m
a June 2007 final dividend (25% participation)b Additional DRP take up on interim 2007 dividendc Primarily reflects statutory adjusted profit items and foreign exchange movement. d PERLS IV issue completed in July 2007 ($1,465m) would increase the June 2007 Tier 1 ratio to 7.72%
d
DRP b$270m

101
Hybrid instrument information
Preference shares - breakdown
Hybrid dividends
Issue Date Currency Amount ($M)
Maturity Balance Sheet Classification
Trust Preferred Securities 2003 06-Aug-03 USD $550 12 years Tier 1 Loan CapitalPERLS II 06-Jan-04 AUD $750 Perpetual Tier 1 Loan CapitalPERLS III 06-Apr-06 AUD $1,166 Perpetual Tier 1 Loan CapitalPERLS IV 12-Jul-07 AUD $1,465 5 years Tier 1 Loan CapitalTrust Preferred Securities 2006 15-Mar-06 USD $700 10 years Other equity instrumentsASB Capital prefs 10-Dec-02 NZD $200 Perpetual Outside equity interestsASB Capital No.2 prefs 22-Dec-04 NZD $350 Perpetual Outside equity interestsCBA Capital 18-May-05 NZD $350 10 years Tier 2 Loan Capital
Jun 07 Dec 06 Jun 06Franked/ Imputed
PERLS I - - 13PERLS II 19 19 18 FPERLS III 31 29 13 FTrust Preferred Securities 2003 17 21 22 N/ATrust Preferred Securities 2006 27 27 - N/AASB Capital prefs 5 5 5 IASB Capital No.2 prefs 9 8 8 ICBA Capital 10 8 8 F
117 117 87
Commonwealth Bank of Australia ACN 123 123 124
RESULTS PRESENTATIONFOR THE FULL YEAREnded 30 June 2007
Ralph NorrisCHIEF EXECUTIVE OFFICER
David CraigCHIEF FINANCIAL OFFICER
15 August 2007
Related Documents