CHICAGO’S 2021 REASSESSMENT: HOW MIGHT TAXES SHIFT? JUNE 2021 ULI Chicago Property Tax Incidence Task Force

Welcome message from author
This document is posted to help you gain knowledge. Please leave a comment to let me know what you think about it! Share it to your friends and learn new things together.
Transcript
CHICAGO’S 2021 REASSESSMENT:HOW MIGHT TAXES SHIFT?
JUNE 2021
ULI Chicago Property Tax Incidence Task Force
About Urban Land Institute ChicagoThe Urban Land Institute (ULI) is a global, member-driven organization dedicated to advancing the Institute’s mission: shape the future of the built environment for transformative impact in communities worldwide. ULI Chicago, a District Council of the Urban Land Institute, has over 1,400 members in the Chicago area representing all aspects of the real estate industry, including developers, property owners, investors, architects, planners, public officials, real estate brokers, appraisers, attorneys, engineers, financiers, and academics.
1
ULI Chicago Property Tax Incidence Task Force Chicago’s 2021 Reassessment: How Might Taxes Shift?
June 2021
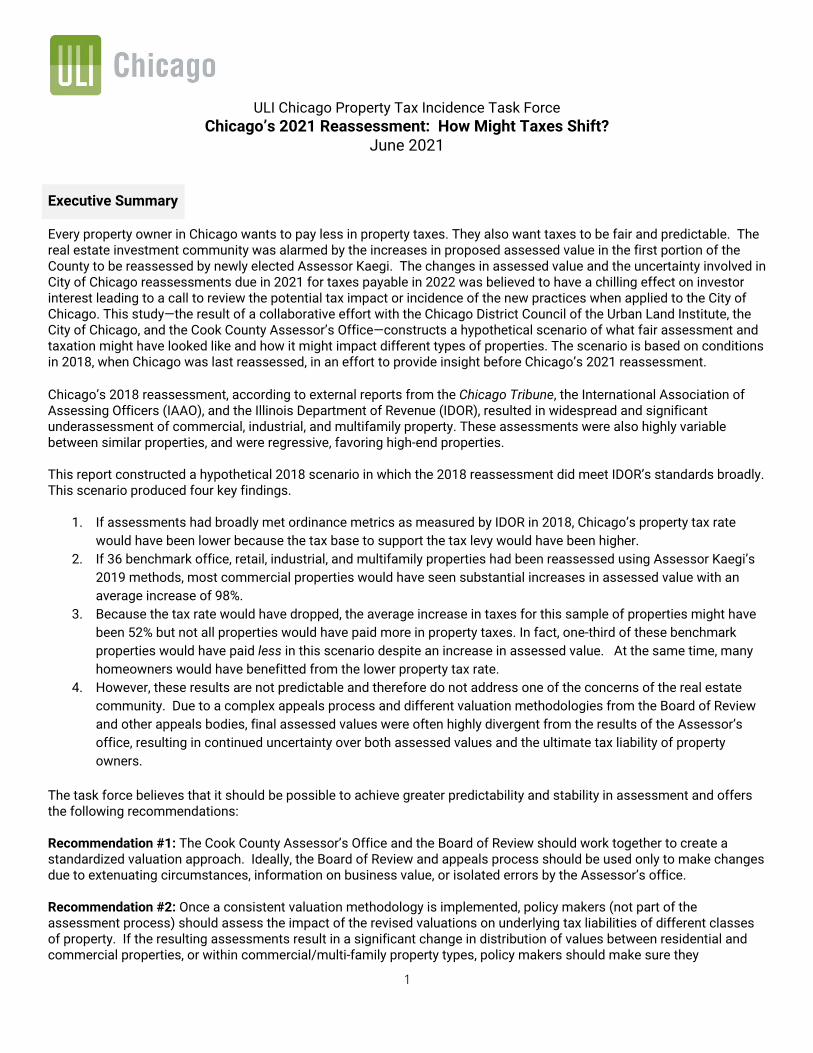
Executive Summary Every property owner in Chicago wants to pay less in property taxes. They also want taxes to be fair and predictable. The real estate investment community was alarmed by the increases in proposed assessed value in the first portion of the County to be reassessed by newly elected Assessor Kaegi. The changes in assessed value and the uncertainty involved in City of Chicago reassessments due in 2021 for taxes payable in 2022 was believed to have a chilling effect on investor interest leading to a call to review the potential tax impact or incidence of the new practices when applied to the City of Chicago. This study—the result of a collaborative effort with the Chicago District Council of the Urban Land Institute, the City of Chicago, and the Cook County Assessor’s Office—constructs a hypothetical scenario of what fair assessment and taxation might have looked like and how it might impact different types of properties. The scenario is based on conditions in 2018, when Chicago was last reassessed, in an effort to provide insight before Chicago’s 2021 reassessment. Chicago’s 2018 reassessment, according to external reports from the Chicago Tribune, the International Association of Assessing Officers (IAAO), and the Illinois Department of Revenue (IDOR), resulted in widespread and significant underassessment of commercial, industrial, and multifamily property. These assessments were also highly variable between similar properties, and were regressive, favoring high-end properties. This report constructed a hypothetical 2018 scenario in which the 2018 reassessment did meet IDOR’s standards broadly. This scenario produced four key findings.
1. If assessments had broadly met ordinance metrics as measured by IDOR in 2018, Chicago’s property tax rate would have been lower because the tax base to support the tax levy would have been higher.
2. If 36 benchmark office, retail, industrial, and multifamily properties had been reassessed using Assessor Kaegi’s 2019 methods, most commercial properties would have seen substantial increases in assessed value with an average increase of 98%.
3. Because the tax rate would have dropped, the average increase in taxes for this sample of properties might have been 52% but not all properties would have paid more in property taxes. In fact, one-third of these benchmark properties would have paid less in this scenario despite an increase in assessed value. At the same time, many homeowners would have benefitted from the lower property tax rate.
4. However, these results are not predictable and therefore do not address one of the concerns of the real estate community. Due to a complex appeals process and different valuation methodologies from the Board of Review and other appeals bodies, final assessed values were often highly divergent from the results of the Assessor’s office, resulting in continued uncertainty over both assessed values and the ultimate tax liability of property owners.
The task force believes that it should be possible to achieve greater predictability and stability in assessment and offers the following recommendations: Recommendation #1: The Cook County Assessor’s Office and the Board of Review should work together to create a standardized valuation approach. Ideally, the Board of Review and appeals process should be used only to make changes due to extenuating circumstances, information on business value, or isolated errors by the Assessor’s office. Recommendation #2: Once a consistent valuation methodology is implemented, policy makers (not part of the assessment process) should assess the impact of the revised valuations on underlying tax liabilities of different classes of property. If the resulting assessments result in a significant change in distribution of values between residential and commercial properties, or within commercial/multi-family property types, policy makers should make sure they
2
understand the implications on taxes of each property type for development, housing affordability, economic attractiveness and the fair distribution of the property tax burden. This study is narrow, only seeking to address the impact of the effort to reassess property at the required ratios to fair market value according to State Law and County Ordinance in an alternative 2018. Changes to the real estate market after 2018, including the effects of the COVID-19 pandemic, are not incorporated in this 2018 scenario. 2021 assessments will reflect recent changes in the residential and commercial real estate market so the same effects in this scenario are not necessarily expected in 2021. The hypothetical scenario explored in this report is solely for illustrative purposes. All figures and calculations therein should be regarded as mere approximations, used pedagogically to demonstrate the relationship between variables in the property tax assessment and billing cycle. The CCAO, ULI, and the City of Chicago expressly disclaim any liability for any party's reliance on any aspect of this hypothetical scenario.
Introduction and Purpose Chicago’s real estate will be reassessed in 2021 by the Cook County Assessor’s Office under the leadership of Assessor Fritz Kaegi. Kaegi was elected in 2019 as a reformer after, among other reports, the Chicago Tribune series “The Tax Divide” published in 2018 revealed significant inequities in the assessment of property and divergence from statutory standards to assess based on fair market value. One-third of Cook County (referred to as a Triad) is assessed on a triennial cycle. The North Triad was the first to be re-assessed by Kaegi. The results of the initial assessment of the North, including Evanston and Schaumburg, indicated large assessment increases for some commercial and multi-family property – more than 100% increases some cases. The potential realignment aside, assessment increases alone will not directly result in increased taxes because increased assessments increase the total tax base. Assuming a constant tax levy amount, this results in a corresponding reduction in the tax rate required to raise the tax levy. The proposed assessments never-the-less created alarm in the real estate investment community because if commercial and multi-family assessments rise more than other classes of property then such properties will shoulder a bigger share while others (such as 1 to 6 unit residences) will bear less. Further, the Board of Review appeals process reversed some of the assessor’s changes to an extent that creates greater uncertainty in the outcome. The real estate investment and development community believes that the uncertainty revealed in the North Triad results had a chilling effect on investment in Chicago and Cook County. Investors want and need to be able to project the tax burden on a property and have confidence that it will not change abruptly from year-to-year. The 2021 reassessment of the City of Chicago is of particular concern given the scale of investment-grade commercial and multi-family real estate. The Chicago District Council of the Urban Land Institute agreed to convene a task force to attempt to estimate the impacts of reassessment in the City of Chicago on how the actual tax burden would have been shared among various property types – the changes in Tax Incidence - as a result of the reassessment. The City of Chicago and the Cook County Assessor’s Office joined with ULI in a memorandum of understanding to collaborate and cooperate in the study and jointly make this report. This study is narrow, only seeking to address the impact of the effort to reassess property at the required ratios to fair market value according to State Law and County Ordinance. The COVID-19 Pandemic and its aftermath will also greatly impact property values and assessments and the Assessor has indicated the 2021 reassessment will attempt to reflect those impacts. To provide insight into the possible impact of the 2021 reassessment, this study seeks to apply the Assessor’s current methodology to the 2018 reassessment of the City of Chicago using select properties as benchmarks. How the System Works Property taxes are governed by a complex set of state laws and county ordinances involving how property is valued for tax purposes and how taxes are determined. Two helpful guides can be found on the Civic Federation’s web site:
3
1) The Assessment Primer at https://www.civicfed.org/file/5730/download?token=wZFcHTHS; 2) The Cook County Property Tax Extension Process: a Primer on Levies, Tax Caps, Tax Bills and the Effects of Tax Increment Financing Districts | The Civic Federation).
Property taxes are a balance between two key elements:
The total amount of property tax dollars to be collected, established by taxing districts each year.
o Units of government with property taxing authority (municipalities, school districts, park districts, the County, etc.) establish their tax levy each year. The levy is limited for non-home rule entities by the Property Tax Extension Limitation Law (PTEL) to the rate of inflation or 5%, whichever is less, plus the increase due to new or rehabilitated property. Many non-limited units of government also adhere to similar practices
The property tax base (i.e., total Equalized Assessed Value) within the taxing district. By law, assessments are
market-based.
o State law and the State Constitution require property to be assessed based on Fair Market Value o Fair Market Values are used to calculate Assessed Values based on the assessment ratio of the property
class. Cook County is permitted to establish different assessment ratios for different classes of property (see below).
o For purposes of state aid it is necessary that there be a uniform understanding of the value in each county so the Illinois Department of Revenue (IDOR) equalizes values to equate to 1/3 of market value in each county. To calculate Cook County's Equalizer, IDOR conducts ratio studies that compare assessed values to recent sale prices.
The County Clerk calculates the resulting tax rate necessary to raise the required levy on the final certified Equalized Assessed Value (EAV). Given a flat property tax levy, when total EAV grows, the tax rate is lower; and when EAV shrinks, the tax rate is higher.
The assessment of property is only the first step in determining the tax on any given property. Assessments can be appealed to the Assessor, the Board of Review, the Property Tax Appeals Board, and the Courts. As a result, final assessments will vary from the “first pass” and significant changes were made in the North Triad.
Cook County has established different assessment ratios for different classes of property. Overhauled in 2009 by Ordinance 08-O-51 and most recently amended in October 2017, Market Value Percentages (Assessment Ratios) were established ultimately bringing the ratio for all residential property to 10% and commercial and industrial property to 25%. By Illinois Constitution the highest ratio cannot exceed the lowest ratio by more than 2.5 times. There are also a number of incentive classes applicable to affordable housing, commercial, industrial, and historic properties. The equalization factor applies uniformly to all property classes so the result is that commercial property is generally taxed at 2.5 times the rate of residential property.
The Assessor’s goal is to apply the relevant assessment ratio to the fair market, fee simple value of property. The property tax system is not intended to capture business value or unique user value from a particular site, a concept appraisers call “Leased-Fee Value” and which may be reflected in individual sales. Instead, the Assessor uses mass-appraisal techniques researching average/median rents, prices, expenses and cap rates for different land uses, classes, and locations of property -- not the actual NOI of a particular building.
Why is the Reassessment Resulting in Big Changes to Assessed Values?
As noted in the introduction, the Chicago Tribune series “The Tax Divide” and other studies showed that property values and taxes were inequitable across the City and County. A key factor in the inequitable result was underassessment and inconsistency in assessments matching the target ratio, individually and by class of property. The inequity is also revealed by the annual sales ratio studies performed by the Illinois Department of Revenue in order to establish the
4
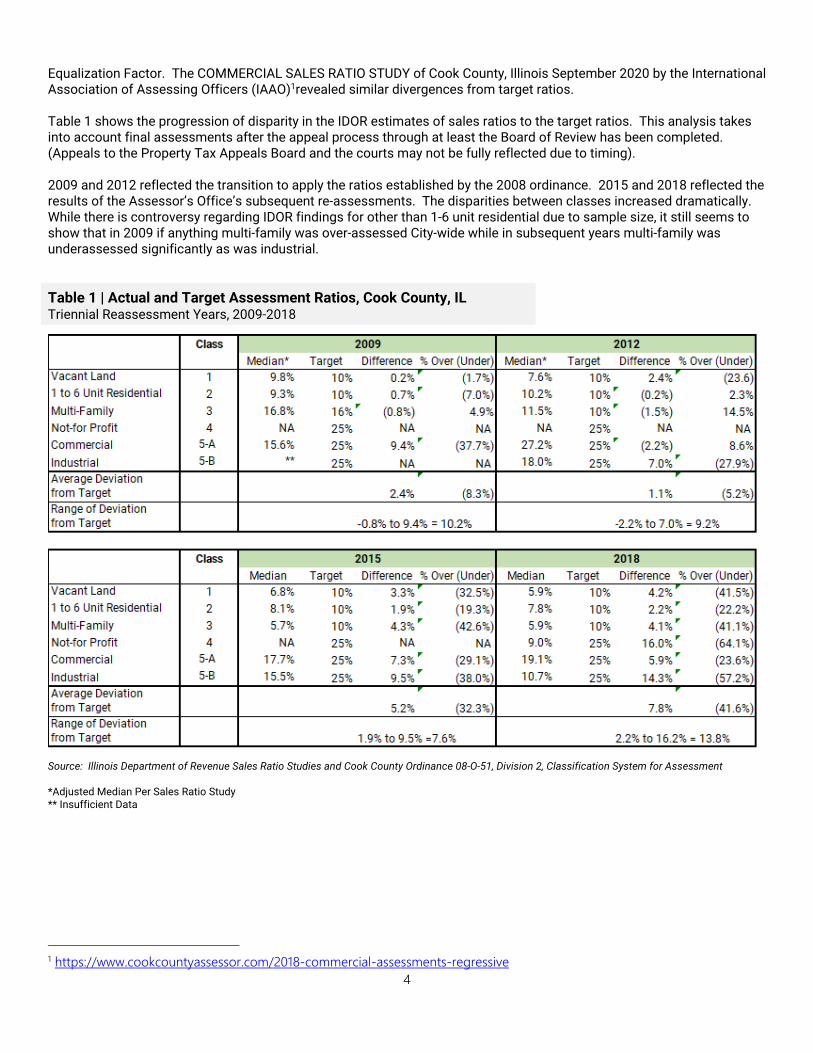
Equalization Factor. The COMMERCIAL SALES RATIO STUDY of Cook County, Illinois September 2020 by the International Association of Assessing Officers (IAAO)1revealed similar divergences from target ratios. Table 1 shows the progression of disparity in the IDOR estimates of sales ratios to the target ratios. This analysis takes into account final assessments after the appeal process through at least the Board of Review has been completed. (Appeals to the Property Tax Appeals Board and the courts may not be fully reflected due to timing). 2009 and 2012 reflected the transition to apply the ratios established by the 2008 ordinance. 2015 and 2018 reflected the results of the Assessor’s Office’s subsequent re-assessments. The disparities between classes increased dramatically. While there is controversy regarding IDOR findings for other than 1-6 unit residential due to sample size, it still seems to show that in 2009 if anything multi-family was over-assessed City-wide while in subsequent years multi-family was underassessed significantly as was industrial. Table 1 | Actual and Target Assessment Ratios, Cook County, IL Triennial Reassessment Years, 2009-2018 Source: Illinois Department of Revenue Sales Ratio Studies and Cook County Ordinance 08-O-51, Division 2, Classification System for Assessment *Adjusted Median Per Sales Ratio Study ** Insufficient Data
1 https://www.cookcountyassessor.com/2018-commercial-assessments-regressive
5
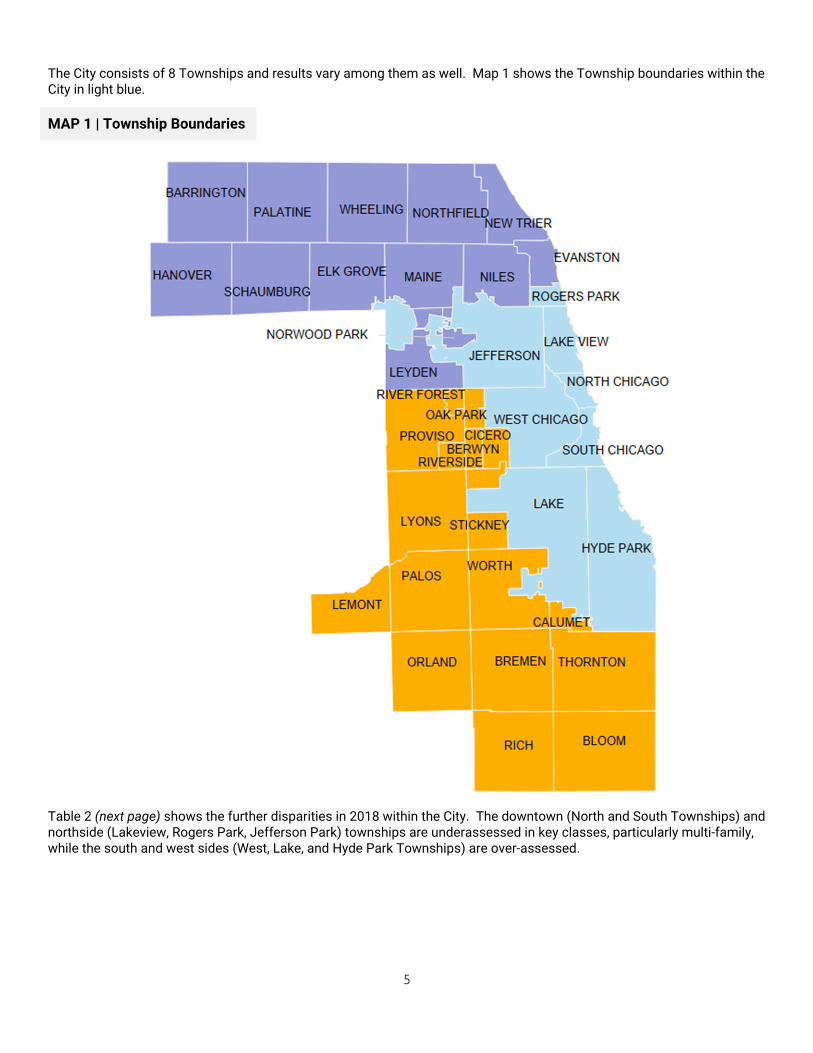
The City consists of 8 Townships and results vary among them as well. Map 1 shows the Township boundaries within the City in light blue. MAP 1 | Township Boundaries
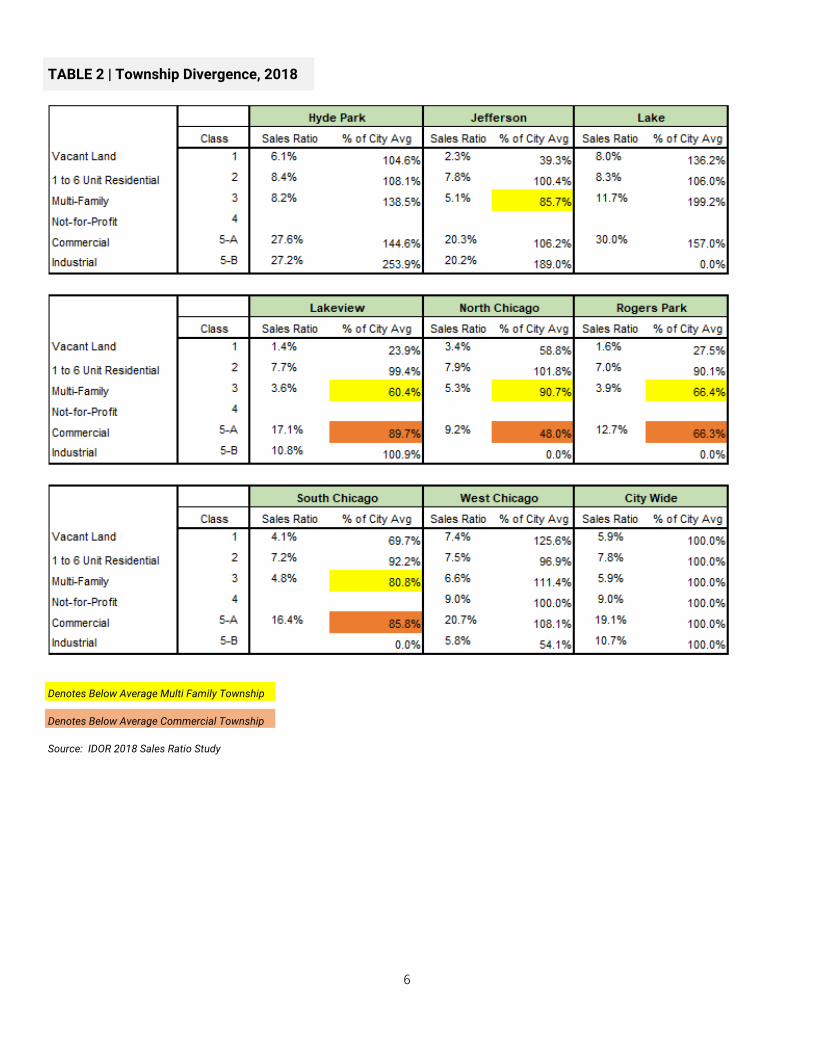
Table 2 (next page) shows the further disparities in 2018 within the City. The downtown (North and South Townships) and northside (Lakeview, Rogers Park, Jefferson Park) townships are underassessed in key classes, particularly multi-family, while the south and west sides (West, Lake, and Hyde Park Townships) are over-assessed.
6
TABLE 2 | Township Divergence, 2018 Denotes Below Average Multi Family Township Denotes Below Average Commercial Township Source: IDOR 2018 Sales Ratio Study
7
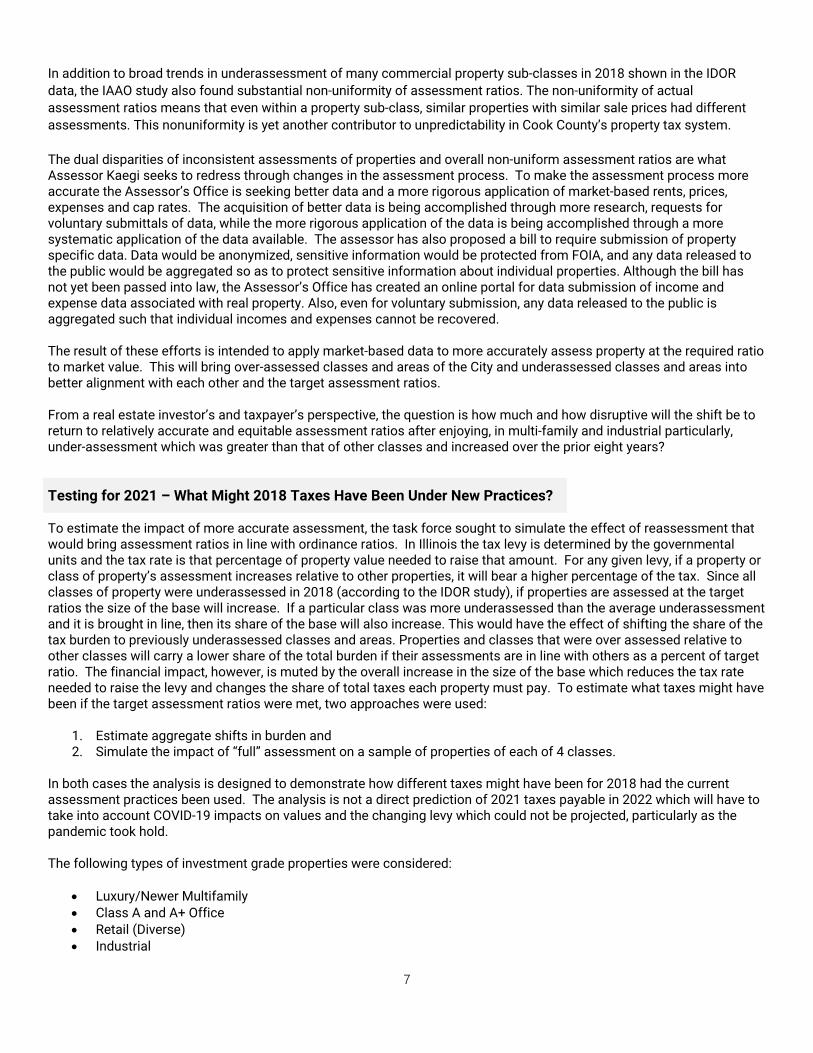
In addition to broad trends in underassessment of many commercial property sub-classes in 2018 shown in the IDOR data, the IAAO study also found substantial non-uniformity of assessment ratios. The non-uniformity of actual assessment ratios means that even within a property sub-class, similar properties with similar sale prices had different assessments. This nonuniformity is yet another contributor to unpredictability in Cook County’s property tax system. The dual disparities of inconsistent assessments of properties and overall non-uniform assessment ratios are what Assessor Kaegi seeks to redress through changes in the assessment process. To make the assessment process more accurate the Assessor’s Office is seeking better data and a more rigorous application of market-based rents, prices, expenses and cap rates. The acquisition of better data is being accomplished through more research, requests for voluntary submittals of data, while the more rigorous application of the data is being accomplished through a more systematic application of the data available. The assessor has also proposed a bill to require submission of property specific data. Data would be anonymized, sensitive information would be protected from FOIA, and any data released to the public would be aggregated so as to protect sensitive information about individual properties. Although the bill has not yet been passed into law, the Assessor’s Office has created an online portal for data submission of income and expense data associated with real property. Also, even for voluntary submission, any data released to the public is aggregated such that individual incomes and expenses cannot be recovered. The result of these efforts is intended to apply market-based data to more accurately assess property at the required ratio to market value. This will bring over-assessed classes and areas of the City and underassessed classes and areas into better alignment with each other and the target assessment ratios. From a real estate investor’s and taxpayer’s perspective, the question is how much and how disruptive will the shift be to return to relatively accurate and equitable assessment ratios after enjoying, in multi-family and industrial particularly, under-assessment which was greater than that of other classes and increased over the prior eight years? Testing for 2021 – What Might 2018 Taxes Have Been Under New Practices? To estimate the impact of more accurate assessment, the task force sought to simulate the effect of reassessment that would bring assessment ratios in line with ordinance ratios. In Illinois the tax levy is determined by the governmental units and the tax rate is that percentage of property value needed to raise that amount. For any given levy, if a property or class of property’s assessment increases relative to other properties, it will bear a higher percentage of the tax. Since all classes of property were underassessed in 2018 (according to the IDOR study), if properties are assessed at the target ratios the size of the base will increase. If a particular class was more underassessed than the average underassessment and it is brought in line, then its share of the base will also increase. This would have the effect of shifting the share of the tax burden to previously underassessed classes and areas. Properties and classes that were over assessed relative to other classes will carry a lower share of the total burden if their assessments are in line with others as a percent of target ratio. The financial impact, however, is muted by the overall increase in the size of the base which reduces the tax rate needed to raise the levy and changes the share of total taxes each property must pay. To estimate what taxes might have been if the target assessment ratios were met, two approaches were used:
1. Estimate aggregate shifts in burden and 2. Simulate the impact of “full” assessment on a sample of properties of each of 4 classes.
In both cases the analysis is designed to demonstrate how different taxes might have been for 2018 had the current assessment practices been used. The analysis is not a direct prediction of 2021 taxes payable in 2022 which will have to take into account COVID-19 impacts on values and the changing levy which could not be projected, particularly as the pandemic took hold. The following types of investment grade properties were considered:
Luxury/Newer Multifamily Class A and A+ Office Retail (Diverse) Industrial
8
Appraisers from real estate companies CBRE and Jones Lang LaSalle searched their databases to identify a sample of properties of these types concentrating on the Central Area for multi-family and office and more broadly dispersed for retail and industrial.
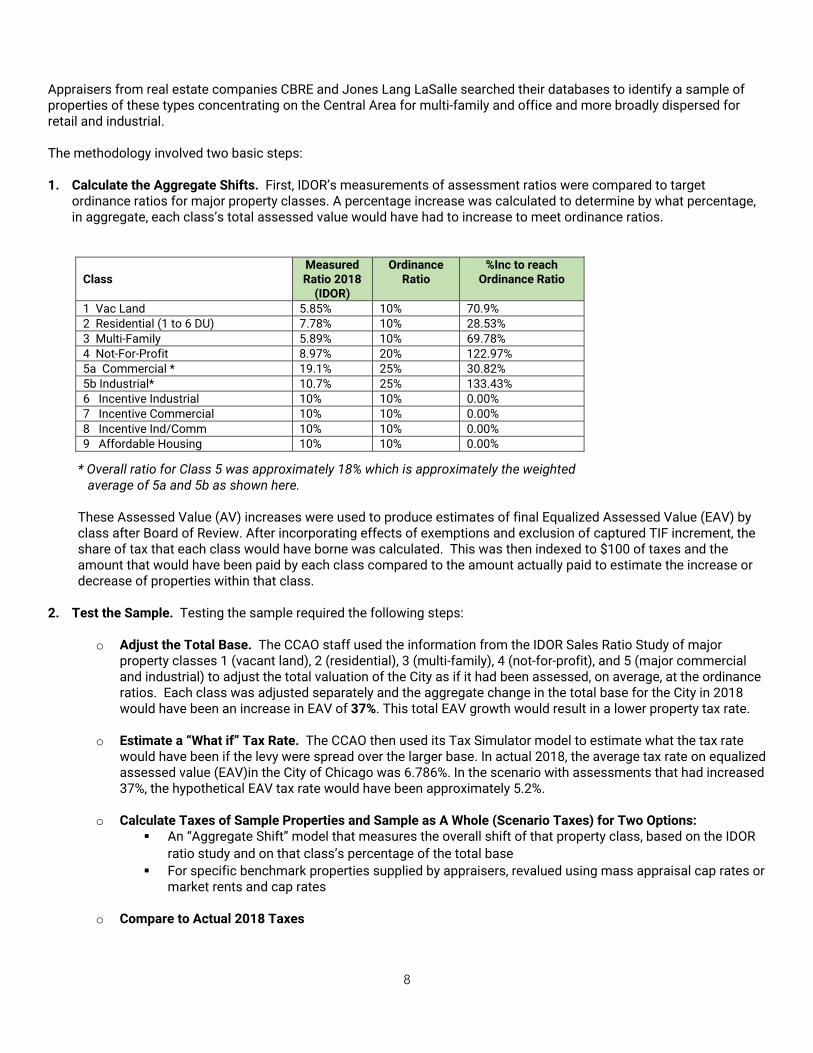
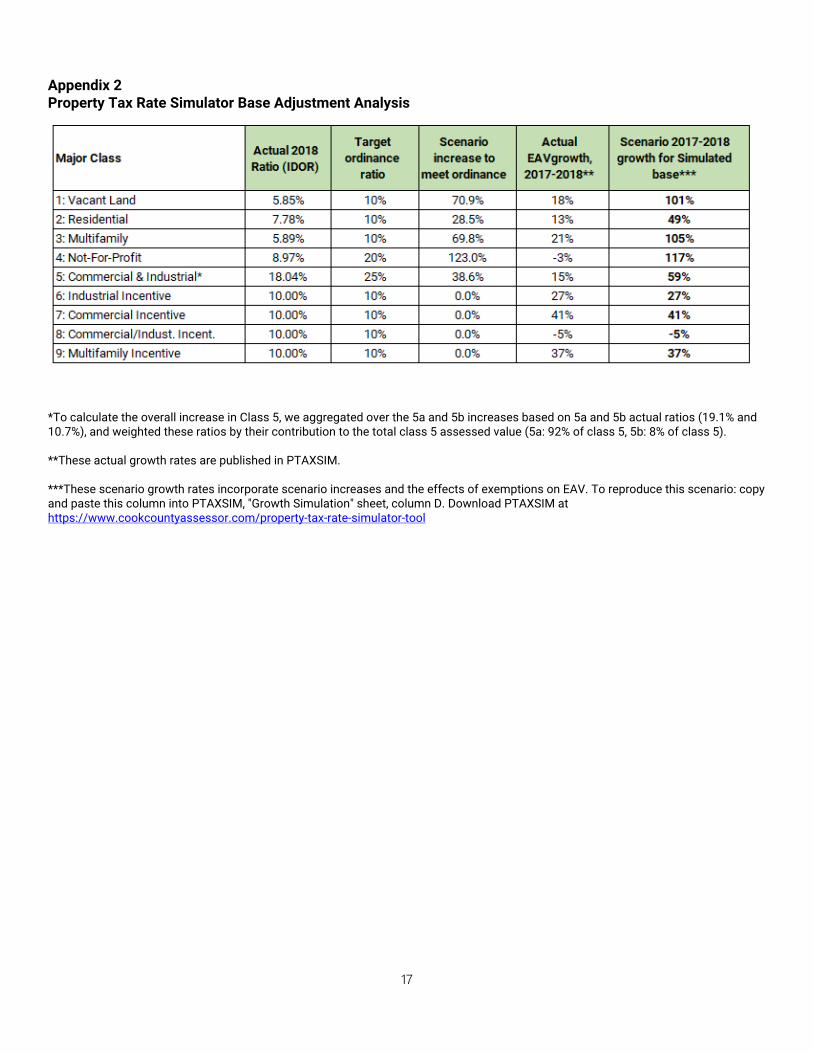
The methodology involved two basic steps: 1. Calculate the Aggregate Shifts. First, IDOR’s measurements of assessment ratios were compared to target
ordinance ratios for major property classes. A percentage increase was calculated to determine by what percentage, in aggregate, each class’s total assessed value would have had to increase to meet ordinance ratios.
Class
Measured Ratio 2018
(IDOR)
Ordinance Ratio
%Inc to reach Ordinance Ratio
1 Vac Land 5.85% 10% 70.9% 2 Residential (1 to 6 DU) 7.78% 10% 28.53% 3 Multi-Family 5.89% 10% 69.78% 4 Not-For-Profit 8.97% 20% 122.97% 5a Commercial * 19.1% 25% 30.82% 5b Industrial* 10.7% 25% 133.43% 6 Incentive Industrial 10% 10% 0.00% 7 Incentive Commercial 10% 10% 0.00% 8 Incentive Ind/Comm 10% 10% 0.00% 9 Affordable Housing 10% 10% 0.00%
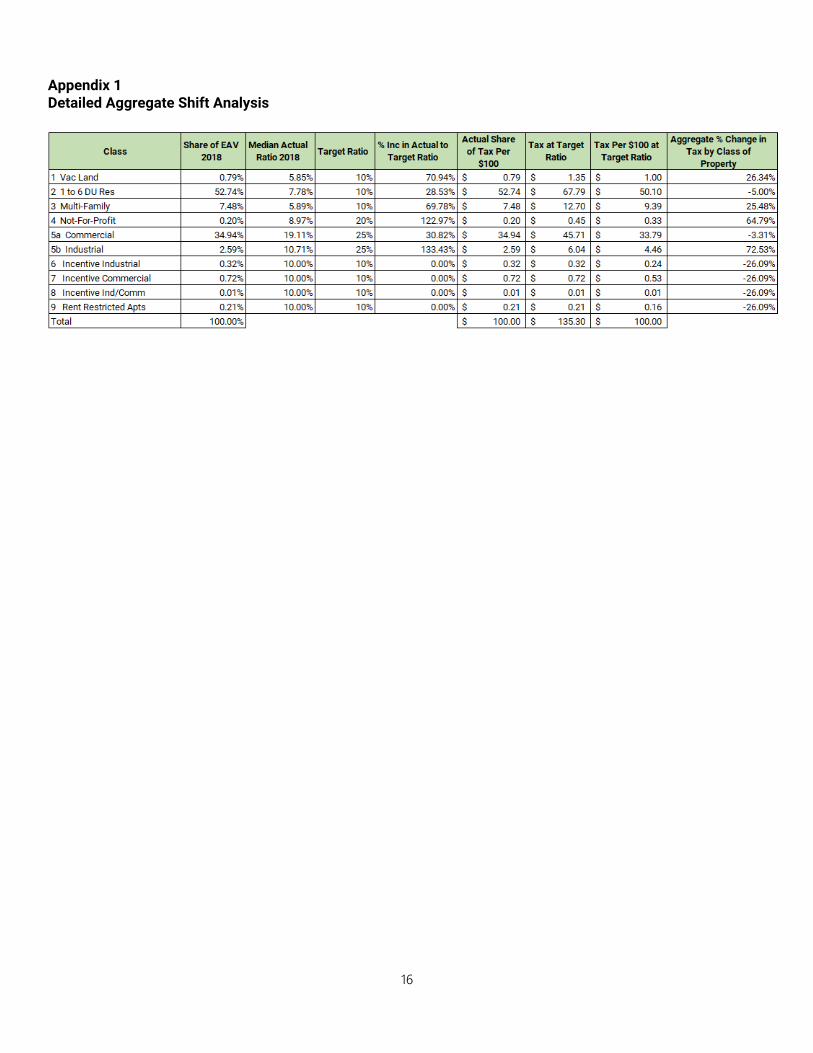
* Overall ratio for Class 5 was approximately 18% which is approximately the weighted average of 5a and 5b as shown here. These Assessed Value (AV) increases were used to produce estimates of final Equalized Assessed Value (EAV) by class after Board of Review. After incorporating effects of exemptions and exclusion of captured TIF increment, the share of tax that each class would have borne was calculated. This was then indexed to $100 of taxes and the amount that would have been paid by each class compared to the amount actually paid to estimate the increase or decrease of properties within that class.
2. Test the Sample. Testing the sample required the following steps:
o Adjust the Total Base. The CCAO staff used the information from the IDOR Sales Ratio Study of major
property classes 1 (vacant land), 2 (residential), 3 (multi-family), 4 (not-for-profit), and 5 (major commercial and industrial) to adjust the total valuation of the City as if it had been assessed, on average, at the ordinance ratios. Each class was adjusted separately and the aggregate change in the total base for the City in 2018 would have been an increase in EAV of 37%. This total EAV growth would result in a lower property tax rate.
o Estimate a “What if” Tax Rate. The CCAO then used its Tax Simulator model to estimate what the tax rate would have been if the levy were spread over the larger base. In actual 2018, the average tax rate on equalized assessed value (EAV)in the City of Chicago was 6.786%. In the scenario with assessments that had increased 37%, the hypothetical EAV tax rate would have been approximately 5.2%.
o Calculate Taxes of Sample Properties and Sample as A Whole (Scenario Taxes) for Two Options: An “Aggregate Shift” model that measures the overall shift of that property class, based on the IDOR
ratio study and on that class’s percentage of the total base For specific benchmark properties supplied by appraisers, revalued using mass appraisal cap rates or
market rents and cap rates
o Compare to Actual 2018 Taxes
9
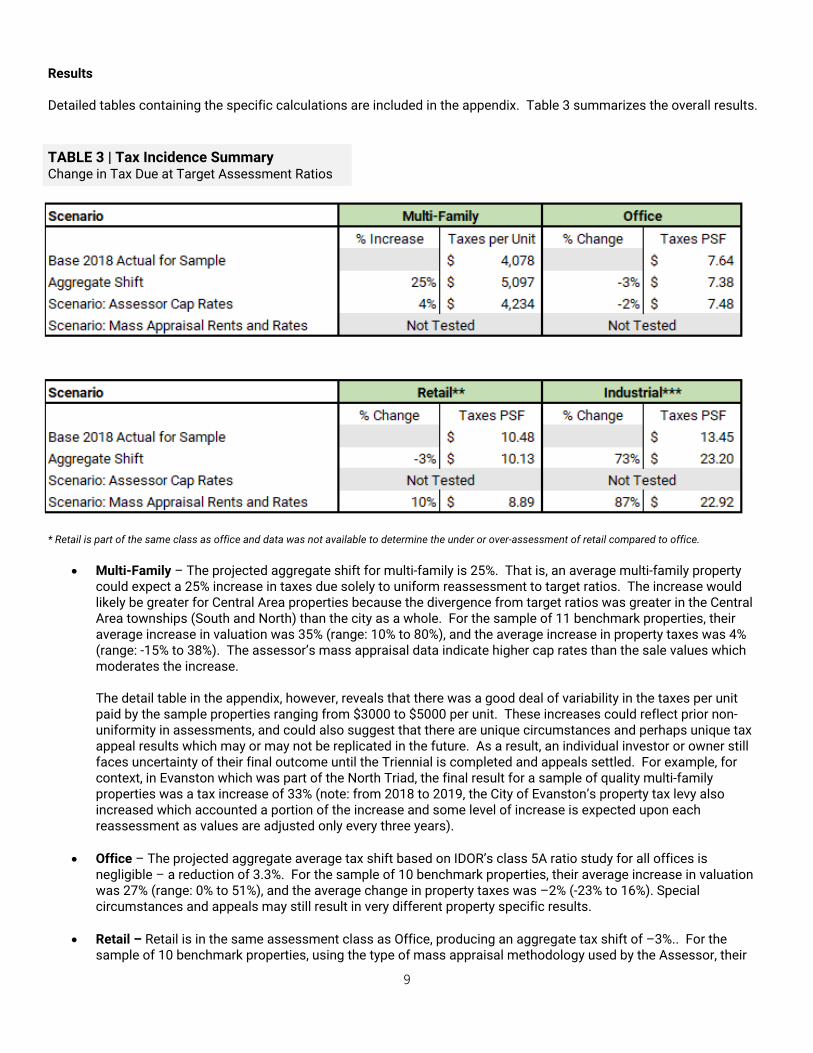
Results Detailed tables containing the specific calculations are included in the appendix. Table 3 summarizes the overall results. TABLE 3 | Tax Incidence Summary Change in Tax Due at Target Assessment Ratios * Retail is part of the same class as office and data was not available to determine the under or over-assessment of retail compared to office.
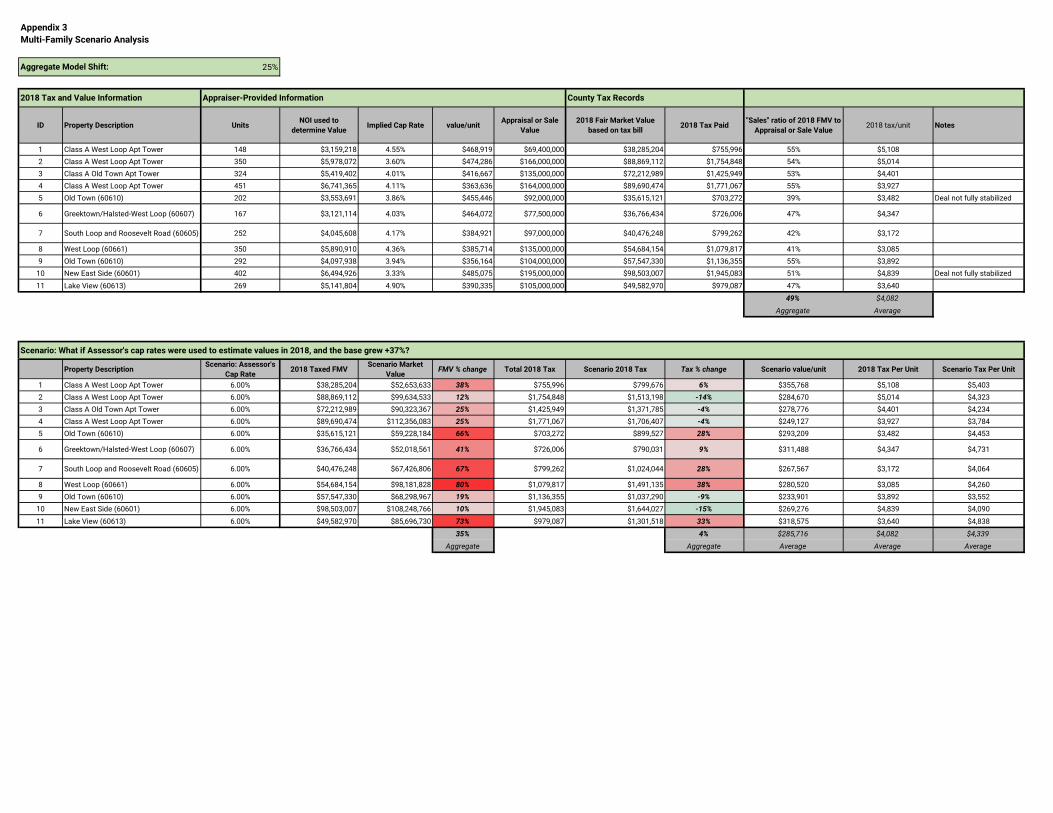
Multi-Family – The projected aggregate shift for multi-family is 25%. That is, an average multi-family property could expect a 25% increase in taxes due solely to uniform reassessment to target ratios. The increase would likely be greater for Central Area properties because the divergence from target ratios was greater in the Central Area townships (South and North) than the city as a whole. For the sample of 11 benchmark properties, their average increase in valuation was 35% (range: 10% to 80%), and the average increase in property taxes was 4% (range: -15% to 38%). The assessor’s mass appraisal data indicate higher cap rates than the sale values which moderates the increase. The detail table in the appendix, however, reveals that there was a good deal of variability in the taxes per unit paid by the sample properties ranging from $3000 to $5000 per unit. These increases could reflect prior non-uniformity in assessments, and could also suggest that there are unique circumstances and perhaps unique tax appeal results which may or may not be replicated in the future. As a result, an individual investor or owner still faces uncertainty of their final outcome until the Triennial is completed and appeals settled. For example, for context, in Evanston which was part of the North Triad, the final result for a sample of quality multi-family properties was a tax increase of 33% (note: from 2018 to 2019, the City of Evanston’s property tax levy also increased which accounted a portion of the increase and some level of increase is expected upon each reassessment as values are adjusted only every three years).
Office – The projected aggregate average tax shift based on IDOR’s class 5A ratio study for all offices is negligible – a reduction of 3.3%. For the sample of 10 benchmark properties, their average increase in valuation was 27% (range: 0% to 51%), and the average change in property taxes was –2% (-23% to 16%). Special circumstances and appeals may still result in very different property specific results.
Retail – Retail is in the same assessment class as Office, producing an aggregate tax shift of –3%.. For the sample of 10 benchmark properties, using the type of mass appraisal methodology used by the Assessor, their
10
average increase in valuation was 43% (range: -5% to 92%), with an average property tax increase of 10% (range: -27% to 47%). This is more than the aggregate for the Commercial class, but a relatively modest number. Retail properties, however, due to their uniqueness, are likely to appeal and, given that this class has been heavily impacted by COVID-19, that is even more likely in 2021. However, mass appraisal techniques suggest a modest aggregate shift.
Industrial – Industrial is its own class (5B) and IDOR’s Ratio Study indicated that it was substantially underassessed, with a median actual ratio of 10.71% falling far short of the 25% statutory ratio. IDOR’s assessment ratio suggests that this class would on aggregate need to increase 133%. Based on this, the Aggregate Shift model indicated taxes on industrial properties would increase 73%. For the sample of 6 benchmark properties, their average increase in valuation was 143% (range: 31% to 290%), with an average increase in property taxes of 87% (range: 1% to 384%). The sample included a number of properties with unique locational characteristics that made them highly valuable for specific users (for example a garage leased for service trucks located close to the customers). The uniqueness of many industrial properties may be expected to lead to continued appeals.
Further a high proportion of newer and expanded industrial properties in the city receive the 6b incentive reducing their assessment ratio to 10%. This status intrinsically should buffer newer properties increased assessments. IDOR does not publish a sales ratio for such properties. These properties were not sampled and the degree to which this mitigates potential industrial valuation increases was not studied. Are North Triad Results Similar to What Might Happen in Chicago? The Impact of the Board of Review The assessment process begins with the Assessor, but property owners may appeal first within the Assessor’s Office, then to the Board of Review and, if still in disagreement to the Property Tax Appeals Board and the Courts. Results can change significantly. Therefore to “ground” the analysis the committee also looked at the results for the North Triad which was reassessed in 2019 and for which the primary appeal process to the Board of Review has been completed. While the Assessor’s Office has attempted to standardize the assessment process and create more transparency and predictability for businesses, taxpayers, and real estate investors, the values determined by the Assessor’s office are often changed dramatically by the Board of Review, especially on commercial and multifamily properties. The Assessor has noted this in its recent “North Suburban Reassessment Report.” In Evanston, the Board of Review reduced the Assessor’s values for commercial property (including multi-family 7 units or more) by 33% overall. We also looked at specific samples of properties for multi-family rental apartments and office buildings. JLL recently completed a study highlighting eight Class A multifamily properties in Evanston, comparing 2018 Assessed Value, 2019 “first pass” Assessed Value from the Assessor’s office, and the final Assessed Value after review by the Board of Review and other appeals. The chart below highlights the results, which showed on average the Assessor’s office increased AV by 142%, but by the time review and appeals were complete, the increased AV was reduced to 58%.
11
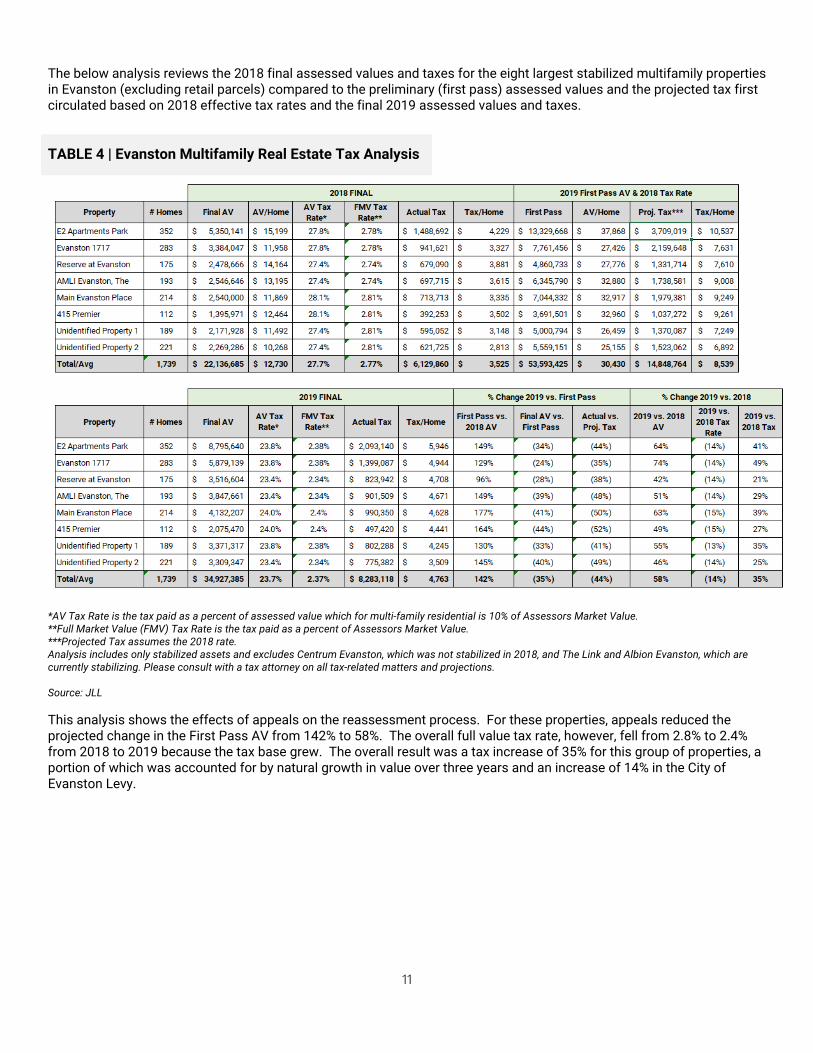
The below analysis reviews the 2018 final assessed values and taxes for the eight largest stabilized multifamily properties in Evanston (excluding retail parcels) compared to the preliminary (first pass) assessed values and the projected tax first circulated based on 2018 effective tax rates and the final 2019 assessed values and taxes. TABLE 4 | Evanston Multifamily Real Estate Tax Analysis *AV Tax Rate is the tax paid as a percent of assessed value which for multi-family residential is 10% of Assessors Market Value. **Full Market Value (FMV) Tax Rate is the tax paid as a percent of Assessors Market Value. ***Projected Tax assumes the 2018 rate. Analysis includes only stabilized assets and excludes Centrum Evanston, which was not stabilized in 2018, and The Link and Albion Evanston, which are currently stabilizing. Please consult with a tax attorney on all tax-related matters and projections. Source: JLL This analysis shows the effects of appeals on the reassessment process. For these properties, appeals reduced the projected change in the First Pass AV from 142% to 58%. The overall full value tax rate, however, fell from 2.8% to 2.4% from 2018 to 2019 because the tax base grew. The overall result was a tax increase of 35% for this group of properties, a portion of which was accounted for by natural growth in value over three years and an increase of 14% in the City of Evanston Levy.
12
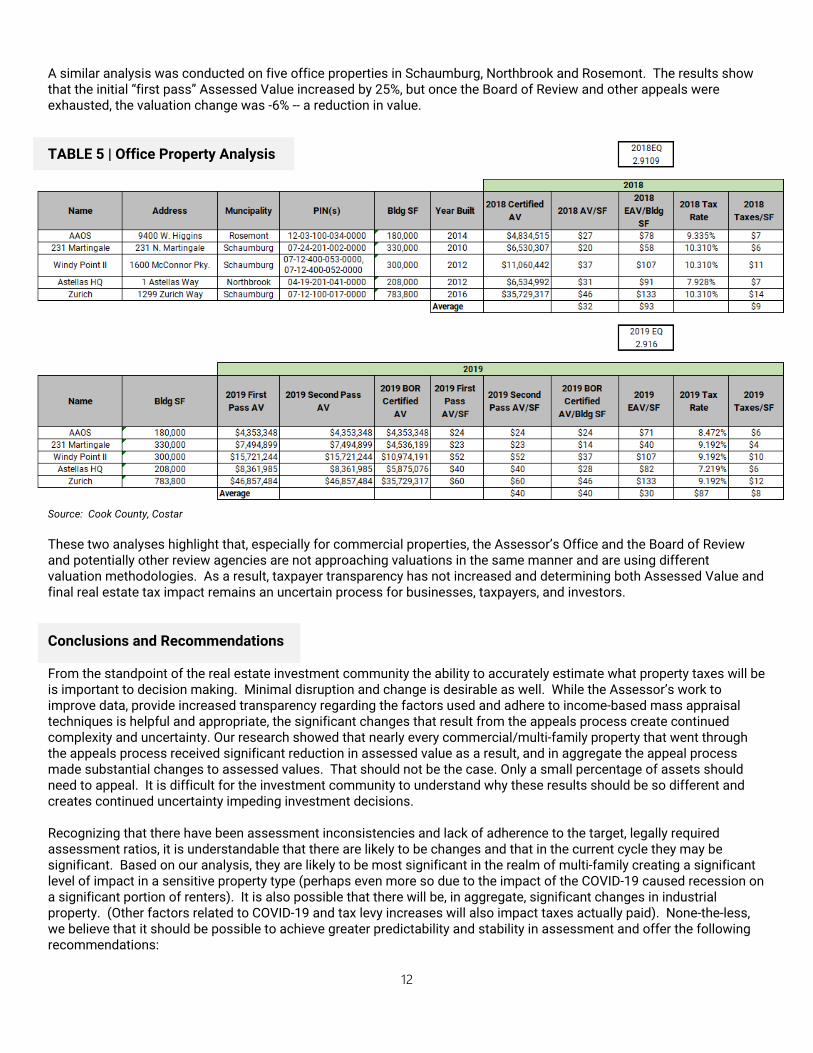
A similar analysis was conducted on five office properties in Schaumburg, Northbrook and Rosemont. The results show that the initial “first pass” Assessed Value increased by 25%, but once the Board of Review and other appeals were exhausted, the valuation change was -6% -- a reduction in value. TABLE 5 | Office Property Analysis Source: Cook County, Costar These two analyses highlight that, especially for commercial properties, the Assessor’s Office and the Board of Review and potentially other review agencies are not approaching valuations in the same manner and are using different valuation methodologies. As a result, taxpayer transparency has not increased and determining both Assessed Value and final real estate tax impact remains an uncertain process for businesses, taxpayers, and investors. Conclusions and Recommendations From the standpoint of the real estate investment community the ability to accurately estimate what property taxes will be is important to decision making. Minimal disruption and change is desirable as well. While the Assessor’s work to improve data, provide increased transparency regarding the factors used and adhere to income-based mass appraisal techniques is helpful and appropriate, the significant changes that result from the appeals process create continued complexity and uncertainty. Our research showed that nearly every commercial/multi-family property that went through the appeals process received significant reduction in assessed value as a result, and in aggregate the appeal process made substantial changes to assessed values. That should not be the case. Only a small percentage of assets should need to appeal. It is difficult for the investment community to understand why these results should be so different and creates continued uncertainty impeding investment decisions. Recognizing that there have been assessment inconsistencies and lack of adherence to the target, legally required assessment ratios, it is understandable that there are likely to be changes and that in the current cycle they may be significant. Based on our analysis, they are likely to be most significant in the realm of multi-family creating a significant level of impact in a sensitive property type (perhaps even more so due to the impact of the COVID-19 caused recession on a significant portion of renters). It is also possible that there will be, in aggregate, significant changes in industrial property. (Other factors related to COVID-19 and tax levy increases will also impact taxes actually paid). None-the-less, we believe that it should be possible to achieve greater predictability and stability in assessment and offer the following recommendations:

13
Recommendation #1: The Cook County Assessor’s Office and the Board of Review should work together to create a standardized valuation approach. Ideally, the Board of Review and appeals process should be used only to make changes due to extenuating circumstances, information on business value, or isolated errors by the Assessor’s office. Recommendation #2: Once a consistent valuation methodology is implemented, policy makers (not part of the assessment process) should assess the impact of the revised valuations on underlying tax liabilities of different classes of property. If the resulting assessments result in a significant change in distribution of values between residential and commercial properties, or within commercial/multi-family property types, policy makers should make sure they understand the implications on taxes of each property type for development, housing affordability, economic attractiveness and the fair distribution of the property tax burden.

15
Chicago’s 2021 Reassessment: How Might Taxes Shift?
APPENDIX
16
Appendix 1 Detailed Aggregate Shift Analysis
17
Appendix 2 Property Tax Rate Simulator Base Adjustment Analysis *To calculate the overall increase in Class 5, we aggregated over the 5a and 5b increases based on 5a and 5b actual ratios (19.1% and 10.7%), and weighted these ratios by their contribution to the total class 5 assessed value (5a: 92% of class 5, 5b: 8% of class 5). **These actual growth rates are published in PTAXSIM. ***These scenario growth rates incorporate scenario increases and the effects of exemptions on EAV. To reproduce this scenario: copy and paste this column into PTAXSIM, "Growth Simulation" sheet, column D. Download PTAXSIM at https://www.cookcountyassessor.com/property-tax-rate-simulator-tool
Appendix 3Multi-Family Scenario Analysis
Aggregate Model Shift: 25%
2018 Tax and Value Information Appraiser-Provided Information County Tax Records
ID Property Description Units NOI used to determine Value Implied Cap Rate value/unit Appraisal or Sale
Value2018 Fair Market Value
based on tax bill 2018 Tax Paid "Sales" ratio of 2018 FMV to Appraisal or Sale Value 2018 tax/unit Notes
1 Class A West Loop Apt Tower 148 $3,159,218 4.55% $468,919 $69,400,000 $38,285,204 $755,996 55% $5,1082 Class A West Loop Apt Tower 350 $5,978,072 3.60% $474,286 $166,000,000 $88,869,112 $1,754,848 54% $5,0143 Class A Old Town Apt Tower 324 $5,419,402 4.01% $416,667 $135,000,000 $72,212,989 $1,425,949 53% $4,4014 Class A West Loop Apt Tower 451 $6,741,365 4.11% $363,636 $164,000,000 $89,690,474 $1,771,067 55% $3,9275 Old Town (60610) 202 $3,553,691 3.86% $455,446 $92,000,000 $35,615,121 $703,272 39% $3,482 Deal not fully stabilized
6 Greektown/Halsted-West Loop (60607) 167 $3,121,114 4.03% $464,072 $77,500,000 $36,766,434 $726,006 47% $4,347
7 South Loop and Roosevelt Road (60605) 252 $4,045,608 4.17% $384,921 $97,000,000 $40,476,248 $799,262 42% $3,172
8 West Loop (60661) 350 $5,890,910 4.36% $385,714 $135,000,000 $54,684,154 $1,079,817 41% $3,0859 Old Town (60610) 292 $4,097,938 3.94% $356,164 $104,000,000 $57,547,330 $1,136,355 55% $3,892
10 New East Side (60601) 402 $6,494,926 3.33% $485,075 $195,000,000 $98,503,007 $1,945,083 51% $4,839 Deal not fully stabilized
11 Lake View (60613) 269 $5,141,804 4.90% $390,335 $105,000,000 $49,582,970 $979,087 47% $3,640
49% $4,082
Aggregate Average
Scenario: What if Assessor's cap rates were used to estimate values in 2018, and the base grew +37%?
Property Description Scenario: Assessor's Cap Rate 2018 Taxed FMV Scenario Market
Value FMV % change Total 2018 Tax Scenario 2018 Tax Tax % change Scenario value/unit 2018 Tax Per Unit Scenario Tax Per Unit
1 Class A West Loop Apt Tower 6.00% $38,285,204 $52,653,633 38% $755,996 $799,676 6% $355,768 $5,108 $5,4032 Class A West Loop Apt Tower 6.00% $88,869,112 $99,634,533 12% $1,754,848 $1,513,198 -14% $284,670 $5,014 $4,3233 Class A Old Town Apt Tower 6.00% $72,212,989 $90,323,367 25% $1,425,949 $1,371,785 -4% $278,776 $4,401 $4,2344 Class A West Loop Apt Tower 6.00% $89,690,474 $112,356,083 25% $1,771,067 $1,706,407 -4% $249,127 $3,927 $3,7845 Old Town (60610) 6.00% $35,615,121 $59,228,184 66% $703,272 $899,527 28% $293,209 $3,482 $4,453
6 Greektown/Halsted-West Loop (60607) 6.00% $36,766,434 $52,018,561 41% $726,006 $790,031 9% $311,488 $4,347 $4,731
7 South Loop and Roosevelt Road (60605) 6.00% $40,476,248 $67,426,806 67% $799,262 $1,024,044 28% $267,567 $3,172 $4,064
8 West Loop (60661) 6.00% $54,684,154 $98,181,828 80% $1,079,817 $1,491,135 38% $280,520 $3,085 $4,2609 Old Town (60610) 6.00% $57,547,330 $68,298,967 19% $1,136,355 $1,037,290 -9% $233,901 $3,892 $3,552
10 New East Side (60601) 6.00% $98,503,007 $108,248,766 10% $1,945,083 $1,644,027 -15% $269,276 $4,839 $4,090
11 Lake View (60613) 6.00% $49,582,970 $85,696,730 73% $979,087 $1,301,518 33% $318,575 $3,640 $4,838
35% 4% $285,716 $4,082 $4,339
Aggregate Aggregate Average Average Average
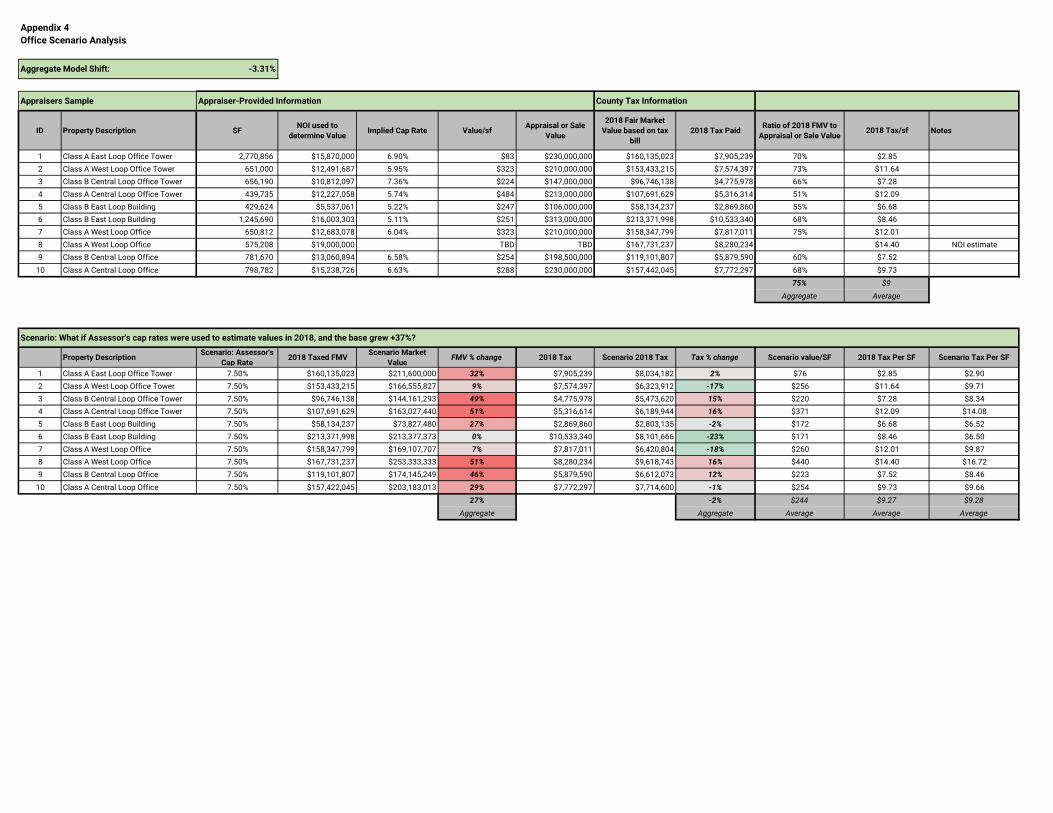
Appendix 4Office Scenario Analysis
Aggregate Model Shift: -3.31%
Appraisers Sample Appraiser-Provided Information County Tax Information
ID Property Description SF NOI used to determine Value Implied Cap Rate Value/sf Appraisal or Sale
Value
2018 Fair Market Value based on tax
bill2018 Tax Paid Ratio of 2018 FMV to
Appraisal or Sale Value2018 Tax/sf Notes
1 Class A East Loop Office Tower 2,770,856 $15,870,000 6.90% $83 $230,000,000 $160,135,023 $7,905,239 70% $2.852 Class A West Loop Office Tower 651,000 $12,491,687 5.95% $323 $210,000,000 $153,433,215 $7,574,397 73% $11.643 Class B Central Loop Office Tower 656,190 $10,812,097 7.36% $224 $147,000,000 $96,746,138 $4,775,978 66% $7.284 Class A Central Loop Office Tower 439,735 $12,227,058 5.74% $484 $213,000,000 $107,691,629 $5,316,314 51% $12.095 Class B East Loop Building 429,624 $5,537,061 5.22% $247 $106,000,000 $58,134,237 $2,869,860 55% $6.686 Class B East Loop Building 1,245,690 $16,003,303 5.11% $251 $313,000,000 $213,371,998 $10,533,340 68% $8.467 Class A West Loop Office 650,812 $12,683,078 6.04% $323 $210,000,000 $158,347,799 $7,817,011 75% $12.018 Class A West Loop Office 575,208 $19,000,000 TBD TBD $167,731,237 $8,280,234 $14.40 NOI estimate9 Class B Central Loop Office 781,670 $13,060,894 6.58% $254 $198,500,000 $119,101,807 $5,879,590 60% $7.52
10 Class A Central Loop Office 798,782 $15,238,726 6.63% $288 $230,000,000 $157,442,045 $7,772,297 68% $9.7375% $9
Aggregate Average
Scenario: What if Assessor's cap rates were used to estimate values in 2018, and the base grew +37%?
Property Description Scenario: Assessor's Cap Rate
2018 Taxed FMV Scenario Market Value
FMV % change 2018 Tax Scenario 2018 Tax Tax % change Scenario value/SF 2018 Tax Per SF Scenario Tax Per SF
1 Class A East Loop Office Tower 7.50% $160,135,023 $211,600,000 32% $7,905,239 $8,034,182 2% $76 $2.85 $2.902 Class A West Loop Office Tower 7.50% $153,433,215 $166,555,827 9% $7,574,397 $6,323,912 -17% $256 $11.64 $9.713 Class B Central Loop Office Tower 7.50% $96,746,138 $144,161,293 49% $4,775,978 $5,473,620 15% $220 $7.28 $8.344 Class A Central Loop Office Tower 7.50% $107,691,629 $163,027,440 51% $5,316,614 $6,189,944 16% $371 $12.09 $14.085 Class B East Loop Building 7.50% $58,134,237 $73,827,480 27% $2,869,860 $2,803,135 -2% $172 $6.68 $6.526 Class B East Loop Building 7.50% $213,371,998 $213,377,373 0% $10,533,340 $8,101,666 -23% $171 $8.46 $6.507 Class A West Loop Office 7.50% $158,347,799 $169,107,707 7% $7,817,011 $6,420,804 -18% $260 $12.01 $9.878 Class A West Loop Office 7.50% $167,731,237 $253,333,333 51% $8,280,234 $9,618,743 16% $440 $14.40 $16.729 Class B Central Loop Office 7.50% $119,101,807 $174,145,249 46% $5,879,590 $6,612,073 12% $223 $7.52 $8.46
10 Class A Central Loop Office 7.50% $157,422,045 $203,183,013 29% $7,772,297 $7,714,600 -1% $254 $9.73 $9.6627% -2% $244 $9.27 $9.28
Aggregate Aggregate Average Average Average
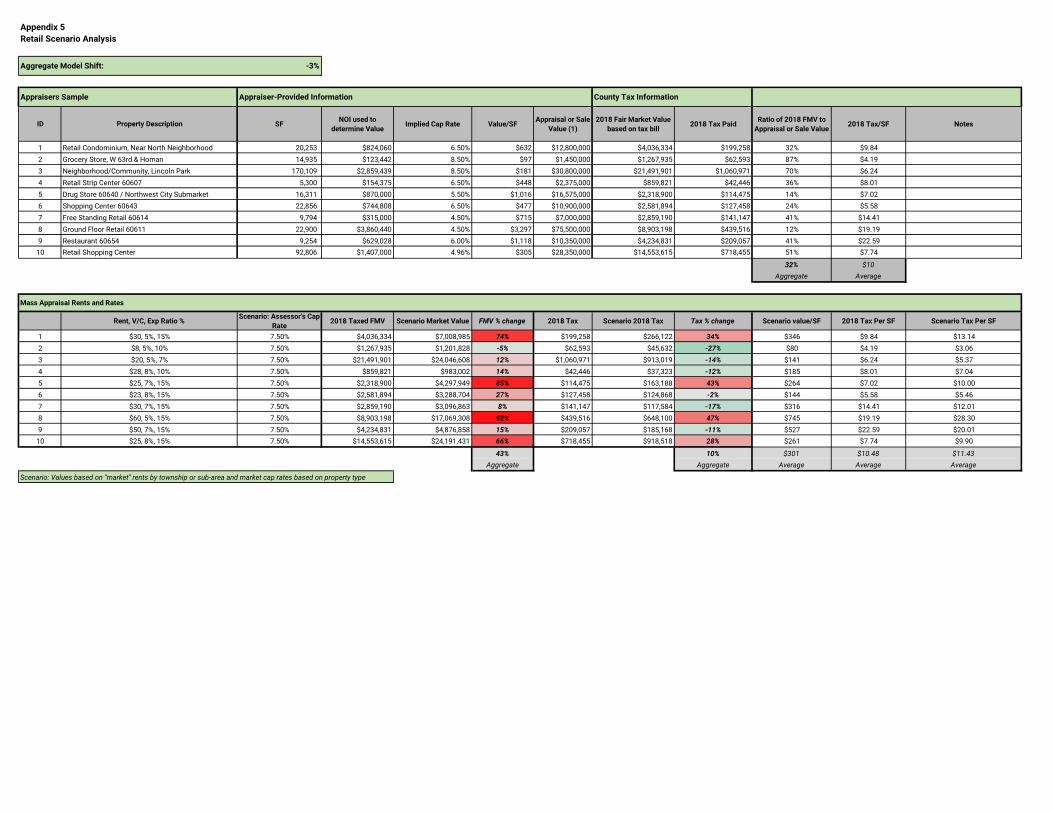
Appendix 5Retail Scenario Analysis
Aggregate Model Shift: -3%
Appraisers Sample Appraiser-Provided Information County Tax Information
ID Property Description SF NOI used to determine Value
Implied Cap Rate Value/SF Appraisal or Sale Value (1)
2018 Fair Market Value based on tax bill
2018 Tax Paid Ratio of 2018 FMV to Appraisal or Sale Value
2018 Tax/SF Notes
1 Retail Condominium, Near North Neighborhood 20,253 $824,060 6.50% $632 $12,800,000 $4,036,334 $199,258 32% $9.842 Grocery Store, W 63rd & Homan 14,935 $123,442 8.50% $97 $1,450,000 $1,267,935 $62,593 87% $4.193 Neighborhood/Community, Lincoln Park 170,109 $2,859,439 8.50% $181 $30,800,000 $21,491,901 $1,060,971 70% $6.244 Retail Strip Center 60607 5,300 $154,375 6.50% $448 $2,375,000 $859,821 $42,446 36% $8.015 Drug Store 60640 / Northwest City Submarket 16,311 $870,000 5.50% $1,016 $16,575,000 $2,318,900 $114,475 14% $7.026 Shopping Center 60643 22,856 $744,808 6.50% $477 $10,900,000 $2,581,894 $127,458 24% $5.587 Free Standing Retail 60614 9,794 $315,000 4.50% $715 $7,000,000 $2,859,190 $141,147 41% $14.418 Ground Floor Retail 60611 22,900 $3,860,440 4.50% $3,297 $75,500,000 $8,903,198 $439,516 12% $19.199 Restaurant 60654 9,254 $629,028 6.00% $1,118 $10,350,000 $4,234,831 $209,057 41% $22.59
10 Retail Shopping Center 92,806 $1,407,000 4.96% $305 $28,350,000 $14,553,615 $718,455 51% $7.74
32% $10Aggregate Average
Mass Appraisal Rents and Rates
Rent, V/C, Exp Ratio % Scenario: Assessor's Cap Rate
2018 Taxed FMV Scenario Market Value FMV % change 2018 Tax Scenario 2018 Tax Tax % change Scenario value/SF 2018 Tax Per SF Scenario Tax Per SF
1 $30, 5%, 15% 7.50% $4,036,334 $7,008,985 74% $199,258 $266,122 34% $346 $9.84 $13.142 $8, 5%, 10% 7.50% $1,267,935 $1,201,828 -5% $62,593 $45,632 -27% $80 $4.19 $3.063 $20, 5%, 7% 7.50% $21,491,901 $24,046,608 12% $1,060,971 $913,019 -14% $141 $6.24 $5.374 $28, 8%, 10% 7.50% $859,821 $983,002 14% $42,446 $37,323 -12% $185 $8.01 $7.045 $25, 7%, 15% 7.50% $2,318,900 $4,297,949 85% $114,475 $163,188 43% $264 $7.02 $10.006 $23, 8%, 15% 7.50% $2,581,894 $3,288,704 27% $127,458 $124,868 -2% $144 $5.58 $5.467 $30, 7%, 15% 7.50% $2,859,190 $3,096,863 8% $141,147 $117,584 -17% $316 $14.41 $12.018 $60, 5%, 15% 7.50% $8,903,198 $17,069,308 92% $439,516 $648,100 47% $745 $19.19 $28.309 $50, 7%, 15% 7.50% $4,234,831 $4,876,858 15% $209,057 $185,168 -11% $527 $22.59 $20.01
10 $25, 8%, 15% 7.50% $14,553,615 $24,191,431 66% $718,455 $918,518 28% $261 $7.74 $9.90
43% 10% $301 $10.48 $11.43Aggregate Aggregate Average Average Average
Scenario: Values based on "market" rents by township or sub-area and market cap rates based on property type

Appendix 6Industrial Appendix Analysis
Aggregate Model Shift: 73%
Appraisers Sample Appraiser-Provided Information County Tax Information
ID Property Description SF NOI used to determine Value Implied Cap Rate Value/SF Appraisal or Sale
Value (1)
2018 Fair Market Value based on tax
bill2018 Tax Paid Ratio of 2018 FMV to
Appraisal or Sale Value 2018 Tax/SF Notes
1 South Chicago Industrial Submarket 20,253 $541,641 5.25% $494 $10,000,000 $3,745,507 $184,901 37% $9.132 South Chicago Industrial Submarket 14,935 $1,667,024 4.50% $2,283 $34,100,000 $15,308,162 $755,704 45% $50.603 Industrial Building 60608 170,109 $1,120,938 5.00% $128 $21,800,000 $4,168,024 $205,759 19% $1.214 Industrial Building 60655 5,300 $70,752 8.50% $158 $840,000 $614,612 $30,341 73% $5.725 Industrial Building 60638 16,311 $1,591,888 7.25% $1,349 $22,000,000 $3,635,857 $179,488 17% $11.006 Industrial Building 60642 22,856 $552,625 8.50% $208 $4,750,000 $1,399,746 $69,100 29% $3.02
(1) Leased fee, not fee simple. 31% $13
Aggregate Average
Mass Appraisal Rents and Rates
Rent, V/C, Exp Ratio % Scenario: Assessor's Cap Rate 2018 Taxed FMV Scenario Market Value FMV % change 2018 Tax Scenario 2018 Tax Tax % change Scenario value/SF 2018 Tax Per SF Scenario Tax Per SF
1 $8, 10%, 6.5% 7.50% $3,745,507 $6,676,481 78% $184,907 $253,497 37% $330 $9.13 $12.522 $13, 10%, 6.5% 7.50% $15,308,162 $21,240,005 39% $755,704 $806,456 7% $1,422 $50.60 $54.003 $18, 10%, 6.5% 7.50% $4,168,024 $13,186,800 216% $205,759 $500,686 143% $78 $1.21 $2.944 $5, 10%, 6.5% 7.50% $614,612 $804,375 31% $30,341 $30,541 1% $152 $5.72 $5.765 $5, 10%, 6.5% 7.50% $3,635,857 $22,856,625 529% $179,488 $867,837 384% $1,401 $11.00 $53.216 $20, 10%, 6.5% 7.50% $1,399,746 $5,464,602 290% $69,100 $207,484 200% $239 $3.02 $9.08
143% 87% $604 $13.45 $22.92
Aggregate Aggregate Average Average Average
Scenario: Values based on "market" rents by township or sub-area and market cap rates based on property type
Stephen B. FriedmanTask Force ChairSB Friedman Development Advisors
Keith LargayULI Chicago ChairJLL
James AndersonRiverside Investment & Development
Randal DawsonCBRE
Eric EnloeJLL
Logan HeinleinRiverside Investment & Development
Mark KirincichCabrera Capital
ULI Chicago Property Tax Incidence Task Force Members
Jaron Kleiman
Stanley PezzellaCabrera Capital
Jeff ShapackShapack Partners
Sarah WetmoreThe Civic Federation
Joe WisniewskiDeloitte
Cindy McSherryULI Chicago
In Partnership with:
Cook County Assessor’s Office
City of Chicago
ULI Chicago 1700 W. Irving Park Road, Suite 208 Chicago, IL 60613
773 549 4972 [email protected]
chicago.uli.org
Related Documents