Using SPSS for Chi Square Dr Athar Khan MBBS, MCPS, DPH, DCPS-HCSM, DCPS-HPE, MBA, PGD-Statistics Associate Professor Liaquat College of Medicine & Dentistry

Welcome message from author
This document is posted to help you gain knowledge. Please leave a comment to let me know what you think about it! Share it to your friends and learn new things together.
Transcript
Using SPSS for Chi Square
Dr Athar Khan
MBBS, MCPS, DPH, DCPS-HCSM, DCPS-HPE, MBA, PGD-Statistics
Associate Professor
Liaquat College of Medicine & Dentistry

Outline
• Introduction
• Dataset
• Chi-square
• Exercise
12/7/2016 2DR ATHAR KHAN - LCMD

Introduction
• The chi-square test for independence, also
called Pearson's chi-square test or the chi-
square test of association, is used to
discover if there is a relationship between
two categorical variables.
12/7/2016 3DR ATHAR KHAN - LCMD

BMI
• Body mass index (BMI) is a measure of body fatbased on height and weight that applies to bothadult men and women.
– Under & normal weight: BMI <25
– Overweight & obesity: BMI ≥ 25
12/7/2016 4DR ATHAR KHAN - LCMD
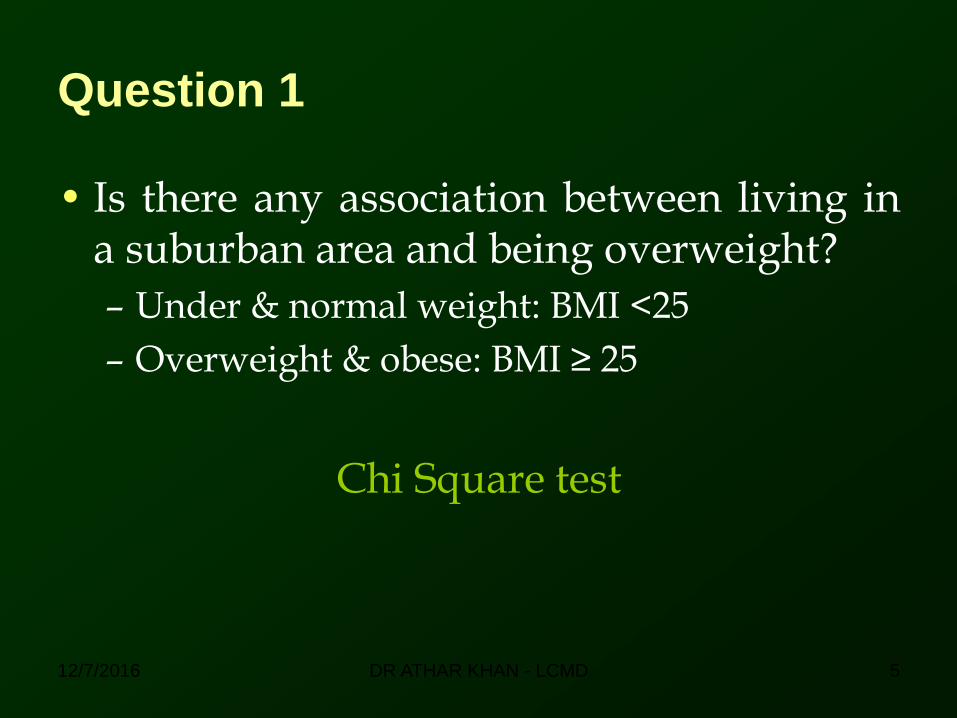
Question 1
• Is there any association between living ina suburban area and being overweight?
– Under & normal weight: BMI <25
– Overweight & obese: BMI ≥ 25
Chi Square test
12/7/2016 5DR ATHAR KHAN - LCMD
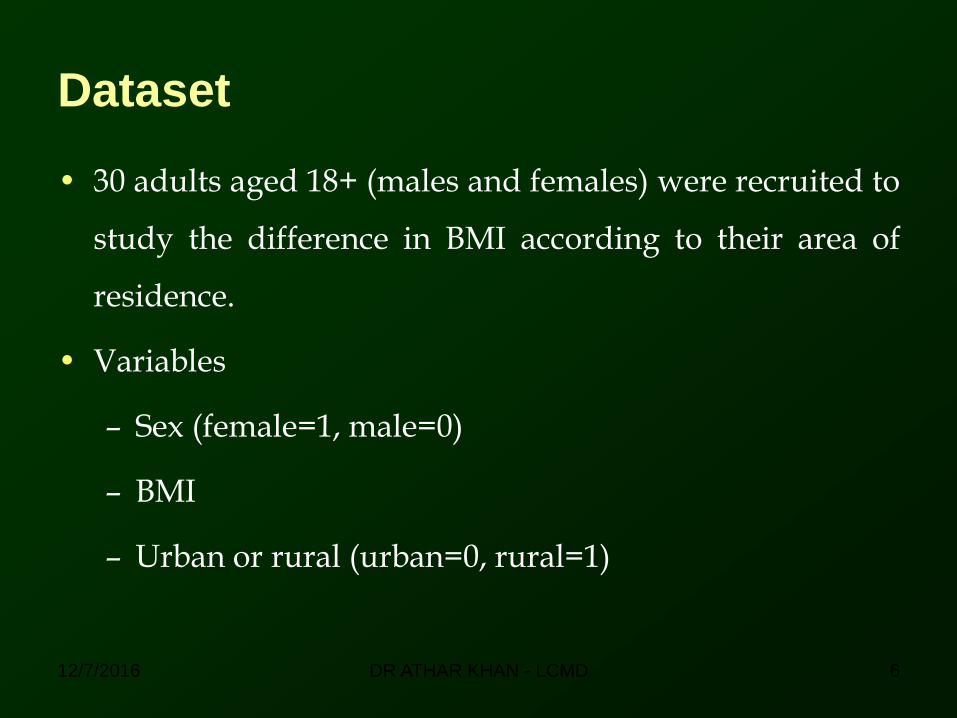
Dataset
• 30 adults aged 18+ (males and females) were recruited to
study the difference in BMI according to their area of
residence.
• Variables
– Sex (female=1, male=0)
– BMI
– Urban or rural (urban=0, rural=1)
12/7/2016 6DR ATHAR KHAN - LCMD

Area of Residence
Total
Urban Rural
BMI Categories
Normal and Underweight
7 11 18
Overweight and Obesity
10 2 12
Total 17 13 30
12/7/2016 7DR ATHAR KHAN - LCMD

Assumptions
• Assumption #1:
• Two variables should be measured atan ordinal or nominallevel (i.e., categorical data).
12/7/2016 8DR ATHAR KHAN - LCMD
Assumptions
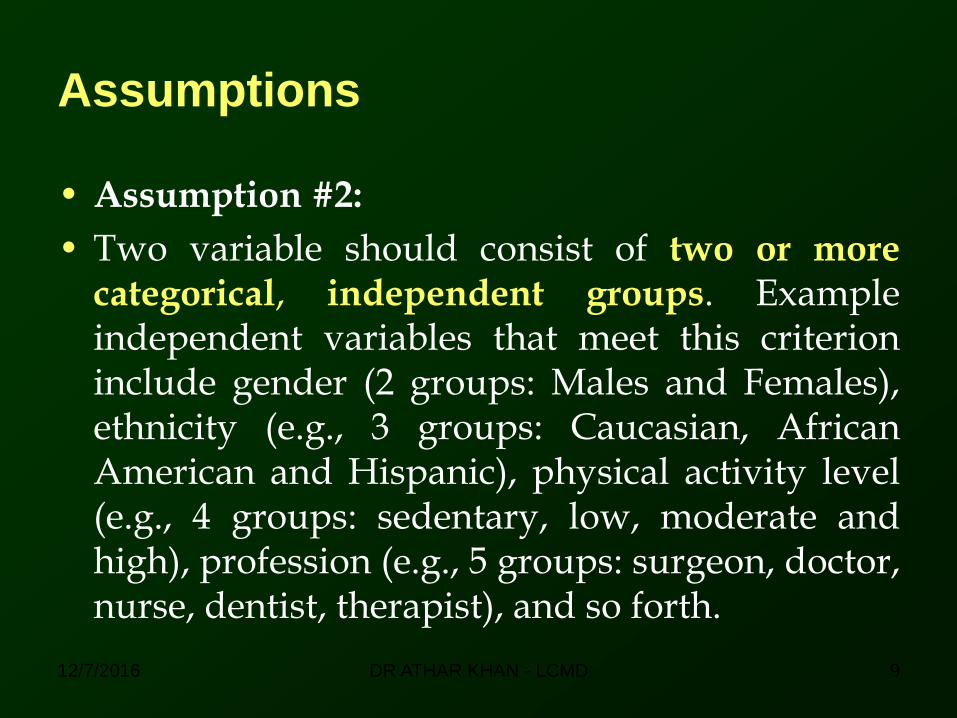
• Assumption #2:
• Two variable should consist of two or morecategorical, independent groups. Exampleindependent variables that meet this criterioninclude gender (2 groups: Males and Females),ethnicity (e.g., 3 groups: Caucasian, AfricanAmerican and Hispanic), physical activity level(e.g., 4 groups: sedentary, low, moderate andhigh), profession (e.g., 5 groups: surgeon, doctor,nurse, dentist, therapist), and so forth.
12/7/2016 9DR ATHAR KHAN - LCMD
Hypothesis Testing– Step by Step
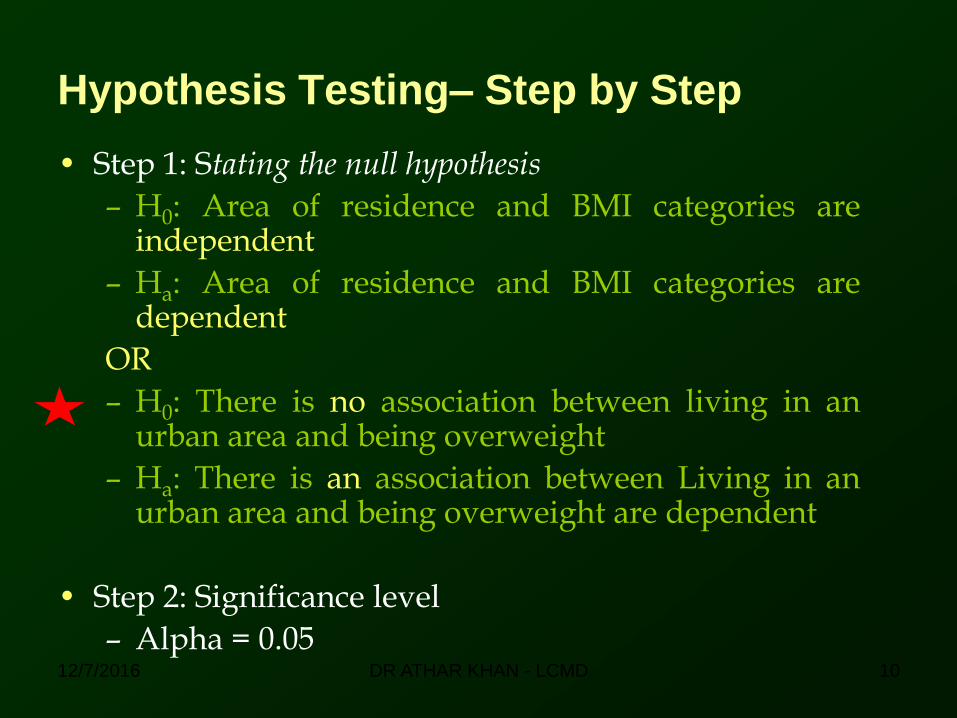
• Step 1: Stating the null hypothesis
– H0: Area of residence and BMI categories areindependent
– Ha: Area of residence and BMI categories aredependent
OR
– H0: There is no association between living in anurban area and being overweight
– Ha: There is an association between Living in anurban area and being overweight are dependent
• Step 2: Significance level
– Alpha = 0.0512/7/2016 10DR ATHAR KHAN - LCMD
Hypothesis Testing– Step by Step
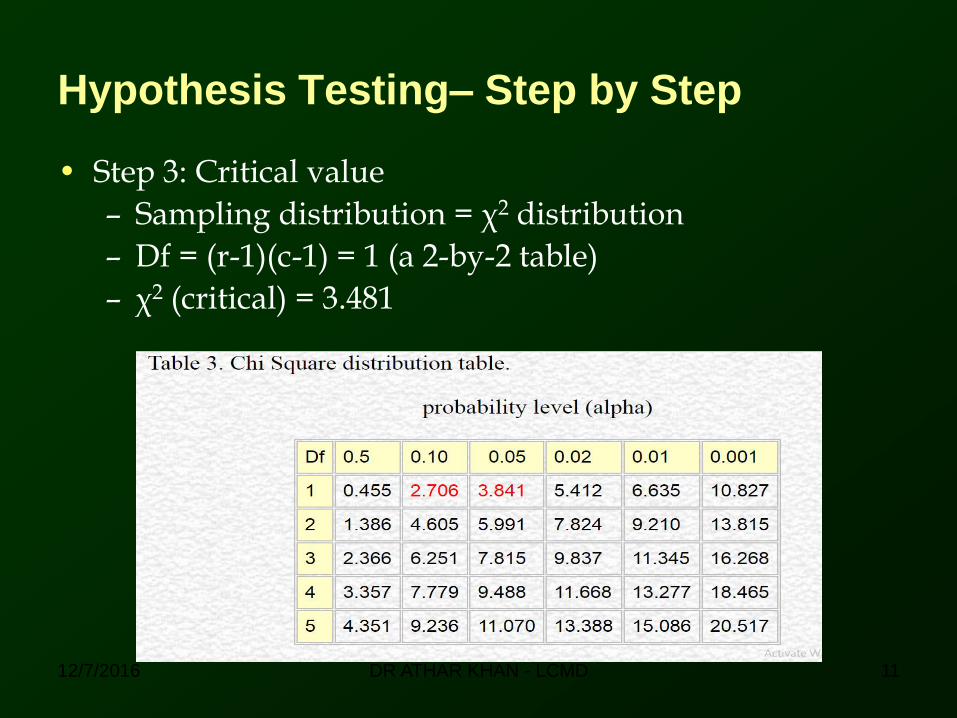
• Step 3: Critical value
– Sampling distribution = χ2 distribution
– Df = (r-1)(c-1) = 1 (a 2-by-2 table)
– χ2 (critical) = 3.481
12/7/2016 11DR ATHAR KHAN - LCMD
Hypothesis Testing– Step by Step
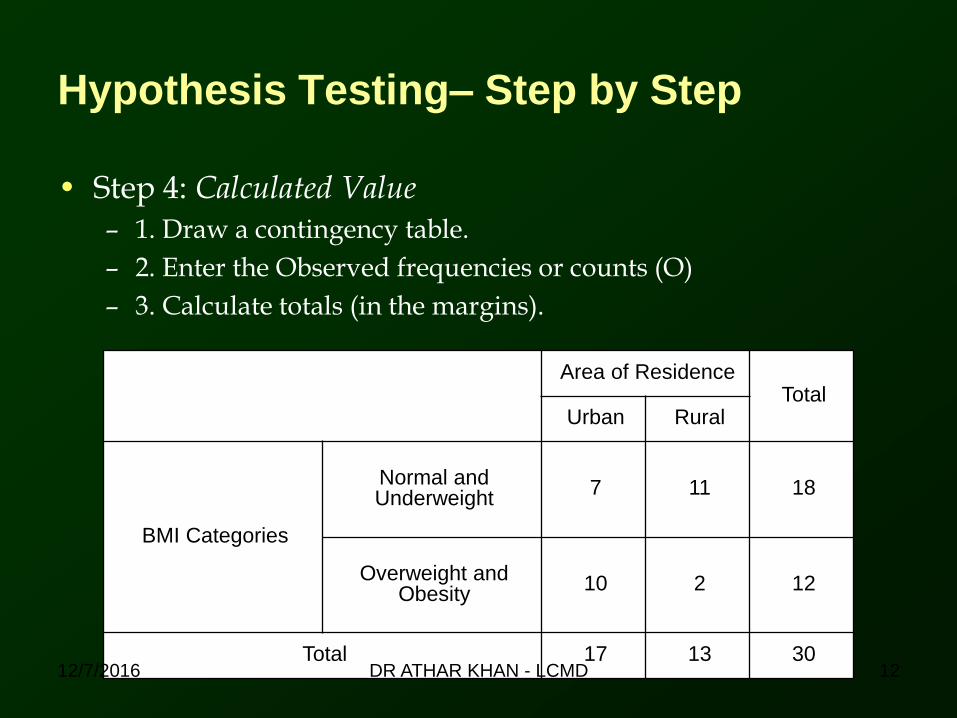
• Step 4: Calculated Value– 1. Draw a contingency table.
– 2. Enter the Observed frequencies or counts (O)
– 3. Calculate totals (in the margins).
Area of ResidenceTotal
Urban Rural
BMI Categories
Normal and Underweight
7 11 18
Overweight and Obesity
10 2 12
Total 17 13 3012/7/2016 12DR ATHAR KHAN - LCMD
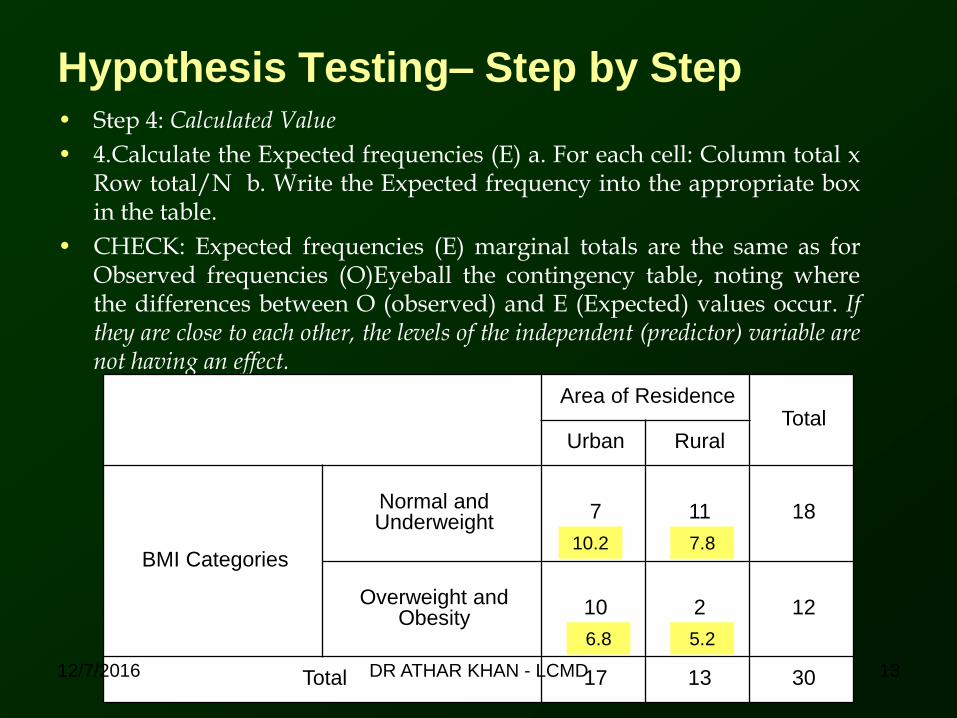
Hypothesis Testing– Step by Step• Step 4: Calculated Value
• 4.Calculate the Expected frequencies (E) a. For each cell: Column total xRow total/N b. Write the Expected frequency into the appropriate boxin the table.
• CHECK: Expected frequencies (E) marginal totals are the same as forObserved frequencies (O)Eyeball the contingency table, noting wherethe differences between O (observed) and E (Expected) values occur. Ifthey are close to each other, the levels of the independent (predictor) variable arenot having an effect.
Area of ResidenceTotal
Urban Rural
BMI Categories
Normal and Underweight
7 11 18
Overweight and Obesity
10 2 12
Total 17 13 30
10.2 7.8
6.8 5.2
12/7/2016 13DR ATHAR KHAN - LCMD

Important Point:
Chi-square can be used if no more than 20% of
the expected frequencies are less than 5 and none
is less than 1 (see note 'a.' at the bottom of SPSS
output to see if this is a problem).
It is possible to 'pool' or 'collapse' categories into
fewer, but this must only be done if it is meaningful
to group the data in this way.
12/7/2016 14DR ATHAR KHAN - LCMD

Hypothesis Testing– Step by Step
Area of ResidenceTotal
Urban Rural
BMI Categories
Normal and Underweight
7 11 18
Overweight and Obesity
10 2 12
Total 17 13 30
10.2 7.8
6.8 5.2
12/7/2016 15DR ATHAR KHAN - LCMD
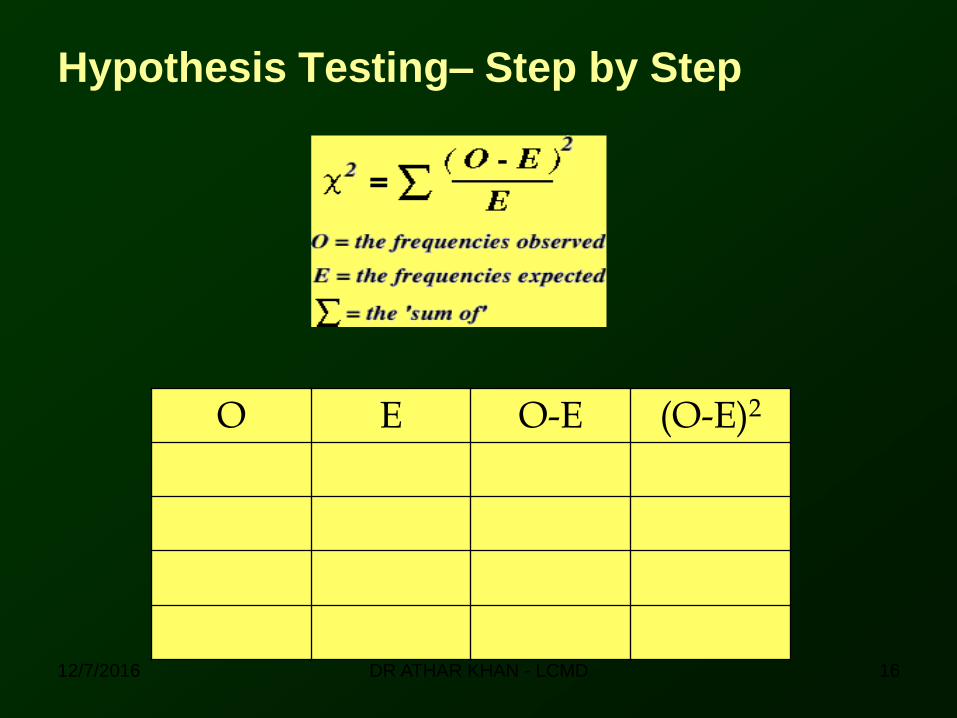
Hypothesis Testing– Step by Step
O E O-E (O-E)2
12/7/2016 16DR ATHAR KHAN - LCMD

Hypothesis Testing– Step by Step
• Step 5: Decision
• Step 6: Conclusion
12/7/2016 17DR ATHAR KHAN - LCMD
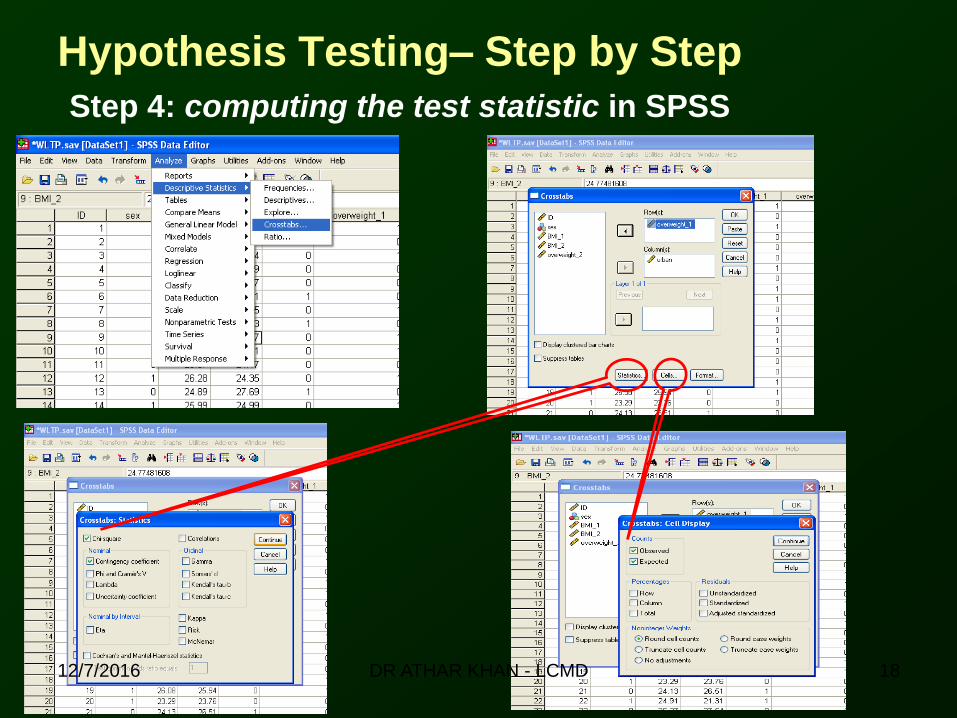
Hypothesis Testing– Step by Step
Step 4: computing the test statistic in SPSS
12/7/2016 18DR ATHAR KHAN - LCMD
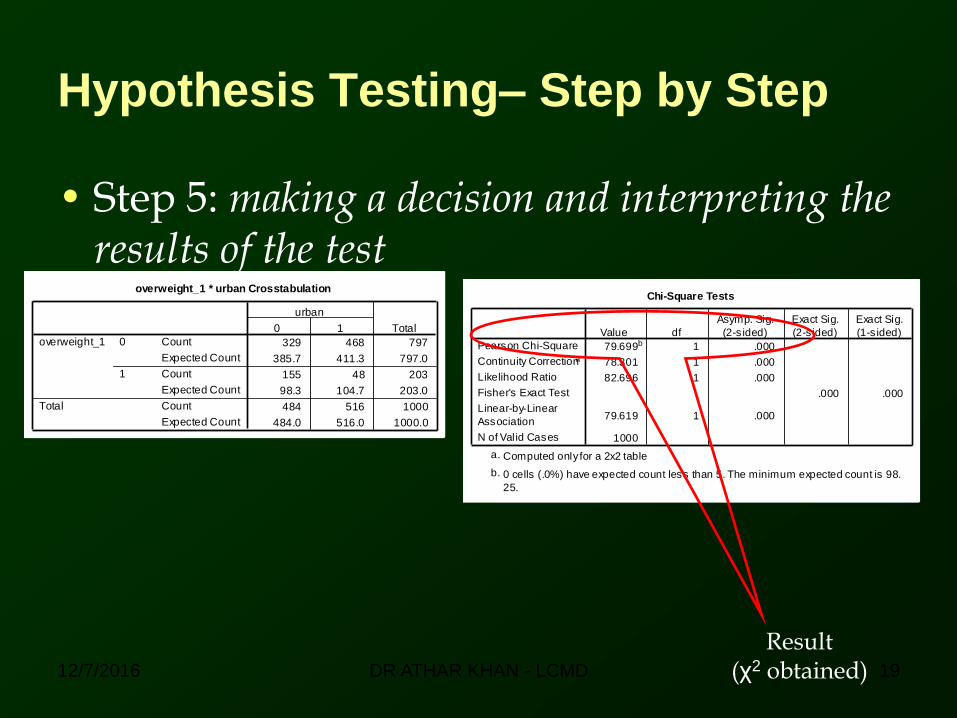
Hypothesis Testing– Step by Step
• Step 5: making a decision and interpreting the results of the test
overweight_1 * urban Crosstabulation
329 468 797
385.7 411.3 797.0
155 48 203
98.3 104.7 203.0
484 516 1000
484.0 516.0 1000.0
Count
Expected Count
Count
Expected Count
Count
Expected Count
0
1
overweight_1
Total
0 1
urban
Total
Chi-Square Tests
79.699b 1 .000
78.301 1 .000
82.696 1 .000
.000 .000
79.619 1 .000
1000
Pearson Chi-Square
Continuity Correctiona
Likelihood Ratio
Fisher's Exact Test
Linear-by-Linear
Association
N of Valid Cases
Value df
Asymp. Sig.
(2-s ided)
Exact Sig.
(2-s ided)
Exact Sig.
(1-s ided)
Computed only for a 2x2 tablea.
0 cells (.0%) have expected count less than 5. The minimum expected count is 98.
25.
b.
Result(χ2 obtained)12/7/2016 19DR ATHAR KHAN - LCMD
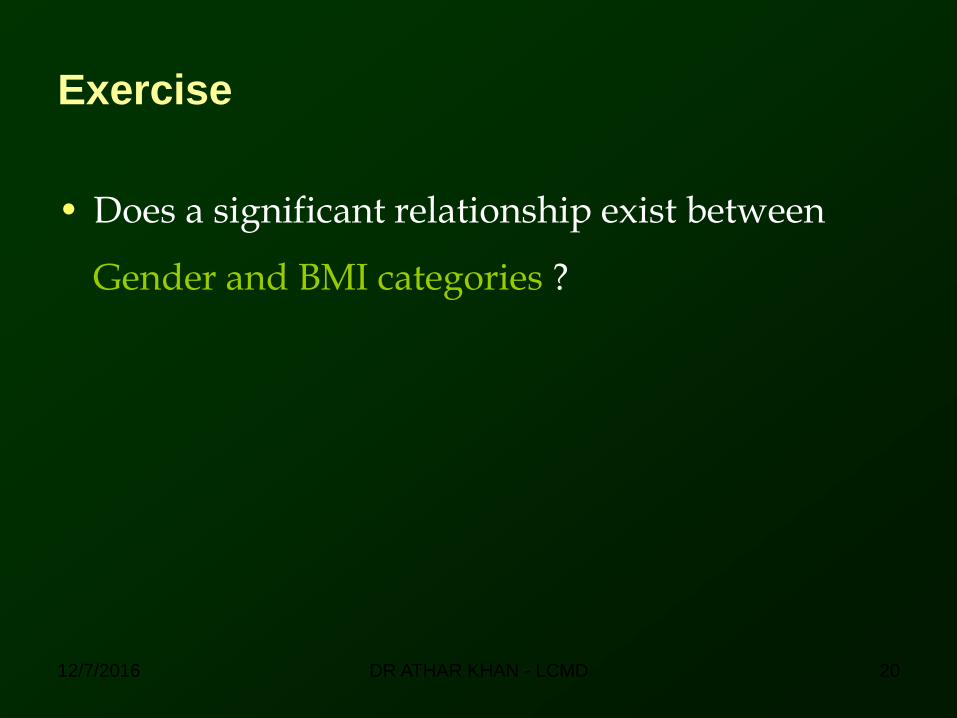
Exercise
• Does a significant relationship exist between
Gender and BMI categories ?
12/7/2016 20DR ATHAR KHAN - LCMD

BMI Categories * Gender Crosstabulation
Gender
TotalMale Female
BMI Categories
<25
Count 7 11 18
Expected Count 7.2 10.8 18.0
% within Gender 58.3% 61.1% 60.0%
>25
Count 5 7 12
Expected Count 4.8 7.2 12.0
% within Gender 41.7% 38.9% 40.0%
Total
Count 12 18 30
Expected Count 12.0 18.0 30.0
% within Gender 100.0% 100.0% 100.0%
12/7/2016 21DR ATHAR KHAN - LCMD
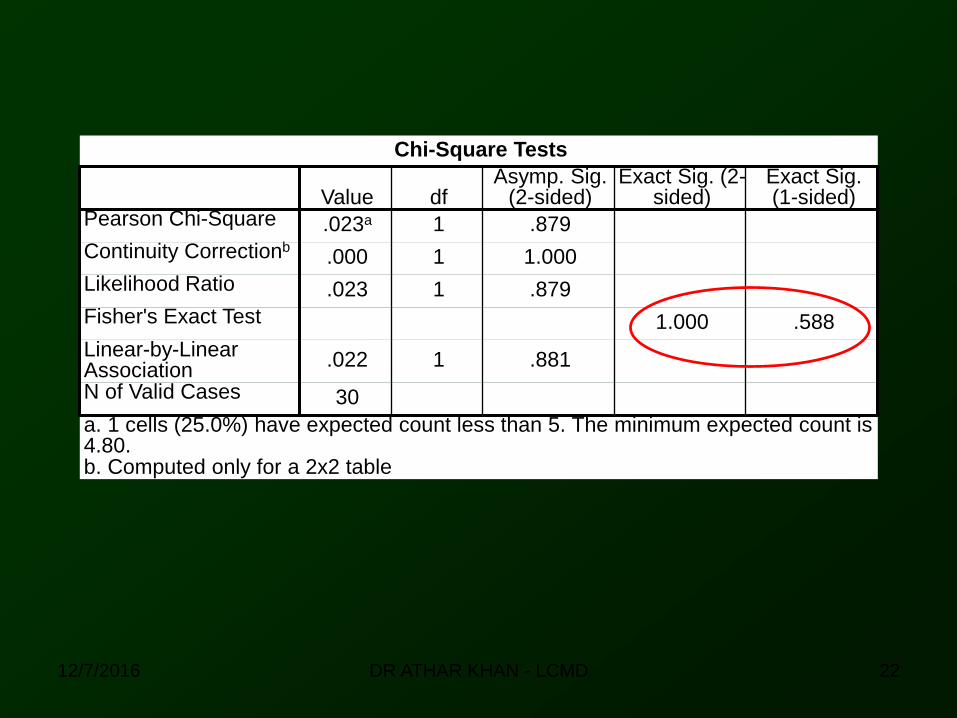
Chi-Square Tests
Value dfAsymp. Sig.
(2-sided)Exact Sig. (2-
sided)Exact Sig. (1-sided)
Pearson Chi-Square .023a 1 .879
Continuity Correctionb.000 1 1.000
Likelihood Ratio .023 1 .879
Fisher's Exact Test 1.000 .588
Linear-by-Linear Association
.022 1 .881
N of Valid Cases 30
a. 1 cells (25.0%) have expected count less than 5. The minimum expected count is 4.80.b. Computed only for a 2x2 table
12/7/2016 22DR ATHAR KHAN - LCMD
Related Documents