Chi-square test Chi-square test or 2 test Notes: Page 218 1. Goodness of Fit 2. Independence 3. Homogeneity

Chi-square test Chi-square test or 2 test Notes: Page 218 1.Goodness of Fit 2.Independence 3.Homogeneity.
Jan 02, 2016
Welcome message from author
This document is posted to help you gain knowledge. Please leave a comment to let me know what you think about it! Share it to your friends and learn new things together.
Transcript

Chi-square testChi-square testor
2 test
Notes: Page 218
1. Goodness of Fit
2. Independence3. Homogeneity
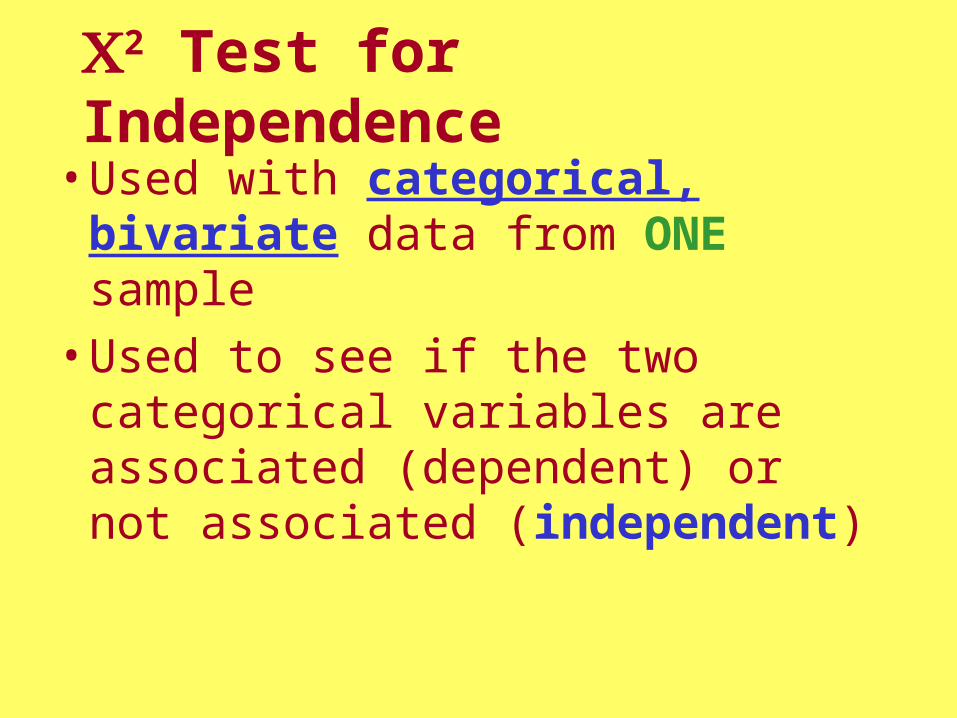
2 Test for Independence
•Used with categorical, bivariate data from ONE sample
•Used to see if the two categorical variables are associated (dependent) or not associated (independent)

Assumptions & Assumptions & formula remain the formula remain the
same!same!

Hypotheses – written in Hypotheses – written in wordswords
H0: two variables are independentHa: two variables are dependent
Be sure to write in context!

A beef distributor wishes to determine whether there is a relationship between geographic region and cut of meat preferred. If there is no relationship, we will say that beef preference is independent of geographic region. Suppose that, in a random sample of 500 customers, 300 are from the North and 200 from the South. Also, 150 prefer cut A, 275 prefer cut B, and 75 prefer cut C.
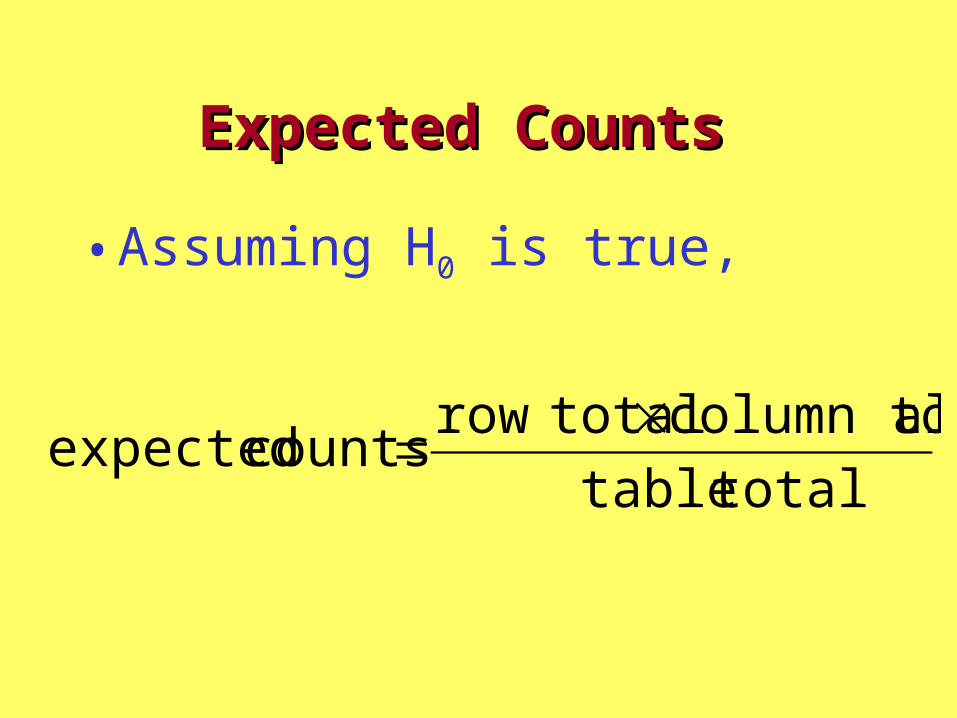
Expected Counts Expected Counts
•Assuming H0 is true,
totaltable
alcolumn tot totalrow counts expected
If beef preference is independent of geographic region, how would we expect this table to be filled in?
North South Total
Cut A 150
Cut B 275
Cut C 75
Total 300 200 500
90 60
165
110
45 30
(300/500) x150 = 90
(300/500) x150 = 90
(200/500) x150 = 60
(200/500) x150 = 60

Degrees of freedomDegrees of freedom
)1c)(1(r df Or cover up one row & one column & count the number of cells remaining!
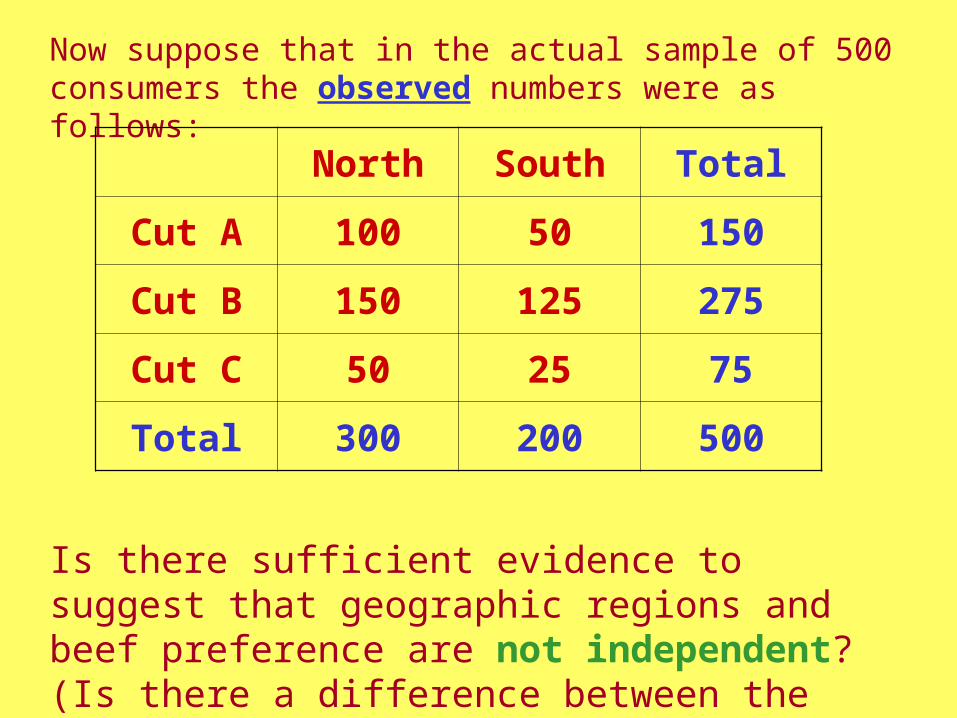
Now suppose that in the actual sample of 500 consumers the observed numbers were as follows:
Is there sufficient evidence to suggest that geographic regions and beef preference are not independent? (Is there a difference between the expected and observed counts?)
North South Total
Cut A 100 50 150
Cut B 150 125 275
Cut C 50 25 75
Total 300 200 500
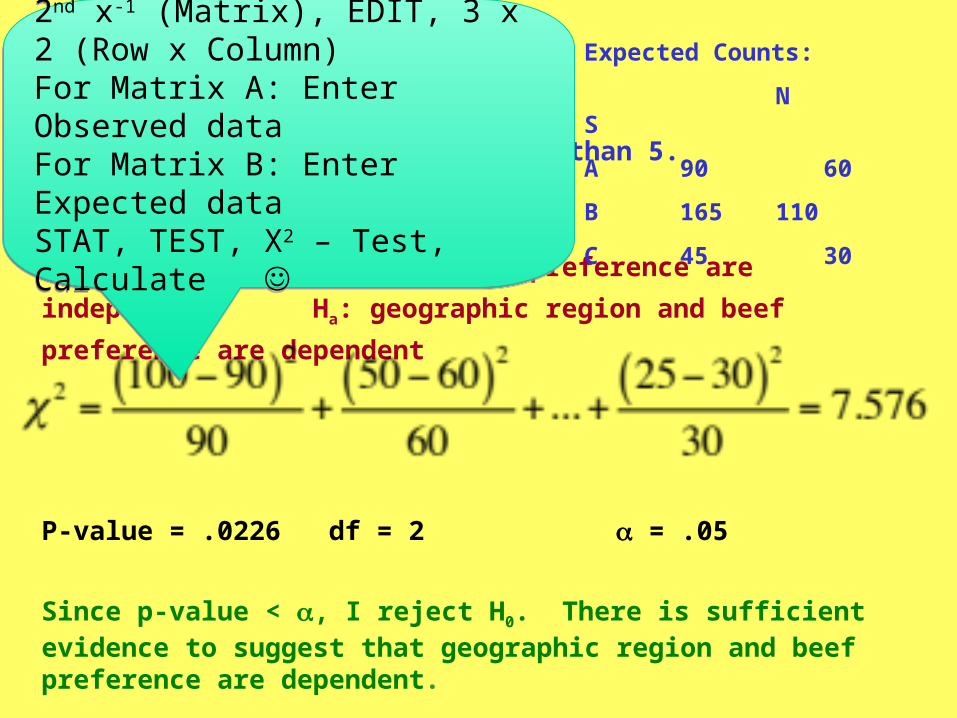
Assumptions:
•Have a random sample of people
•All expected counts are greater than 5.
H0: geographic region and beef preference are
independent Ha: geographic region and beef
preference are dependent
P-value = .0226 df = 2 = .05
Since p-value < , I reject H0. There is sufficient evidence to suggest that geographic region and beef preference are dependent.
Expected Counts:
N S
A 90 60
B 165 110
C 45 30
Calculator:2nd x-1 (Matrix), EDIT, 3 x 2 (Row x Column)For Matrix A: Enter Observed dataFor Matrix B: Enter Expected dataSTAT, TEST, X2 – Test, Calculate
Calculator:2nd x-1 (Matrix), EDIT, 3 x 2 (Row x Column)For Matrix A: Enter Observed dataFor Matrix B: Enter Expected dataSTAT, TEST, X2 – Test, Calculate

Assumptions:
•Have a random sample of people
•All expected counts are greater than 5.
H0: geographic region and beef preference are
independent Ha: geographic region and beef
preference are dependent
P-value = .0226 df = 2 = .05
Since p-value < , I reject H0. There is sufficient evidence to suggest that geographic region and beef preference are dependent.
Expected Counts:
N S
A 90 60
B 165 110
C 45 30
HOWEVER, the Calculator can find Matrix B for you! Try this:2nd x-1 (Matrix), EDIT, 3 x 2 (Row x Column)For Matrix A: Enter Observed dataFor Matrix B: Leave this blankSTAT, TEST, X2 – Test, CalculateIt still ran the test! Now go to 2nd x-1 (Matrix), EDIT, Select B and you will see the Expected Values
HOWEVER, the Calculator can find Matrix B for you! Try this:2nd x-1 (Matrix), EDIT, 3 x 2 (Row x Column)For Matrix A: Enter Observed dataFor Matrix B: Leave this blankSTAT, TEST, X2 – Test, CalculateIt still ran the test! Now go to 2nd x-1 (Matrix), EDIT, Select B and you will see the Expected Values
SO, There are TWO ways to find your Expected Values:Use the formula OR let the calculator find them for you.Be sure to know BOTH methods
SO, There are TWO ways to find your Expected Values:Use the formula OR let the calculator find them for you.Be sure to know BOTH methods

22 test for homogeneity test for homogeneity
•Used with a single single categoricalcategorical variable from two (or more) independent two (or more) independent samplessamples
•Used to see if the two populations are the same (homogeneous)
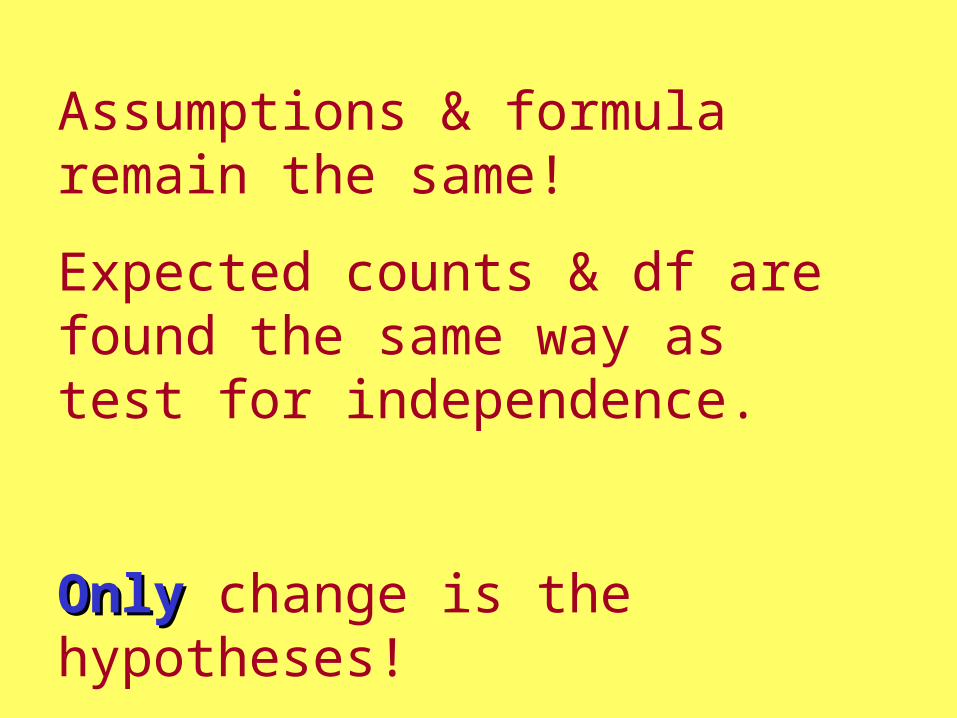
Assumptions & formula remain the same!
Expected counts & df are found the same way as test for independence.
OnlyOnly change is the hypotheses!

Hypotheses – written in Hypotheses – written in wordswords
H0: the proportions for the two (or more) distributions are the sameHa: At least one of the proportions for the distributions is different
Be sure to write in context!
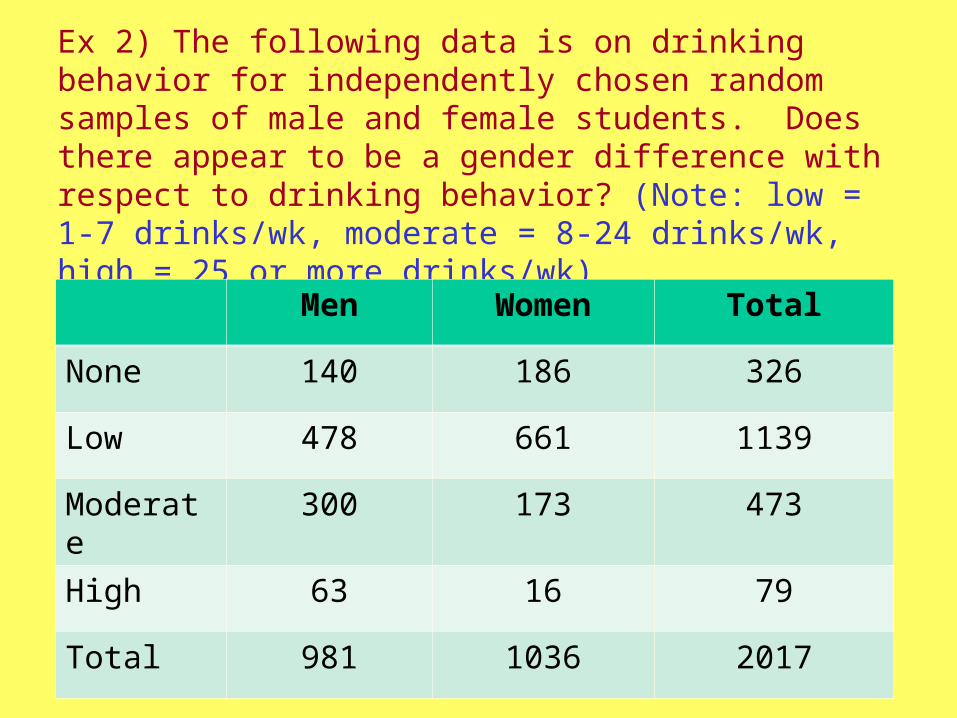
Ex 2) The following data is on drinking behavior for independently chosen random samples of male and female students. Does there appear to be a gender difference with respect to drinking behavior? (Note: low = 1-7 drinks/wk, moderate = 8-24 drinks/wk, high = 25 or more drinks/wk)
Men Women Total
None 140 186 326
Low 478 661 1139
Moderate 300 173 473
High 63 16 79
Total 981 1036 2017
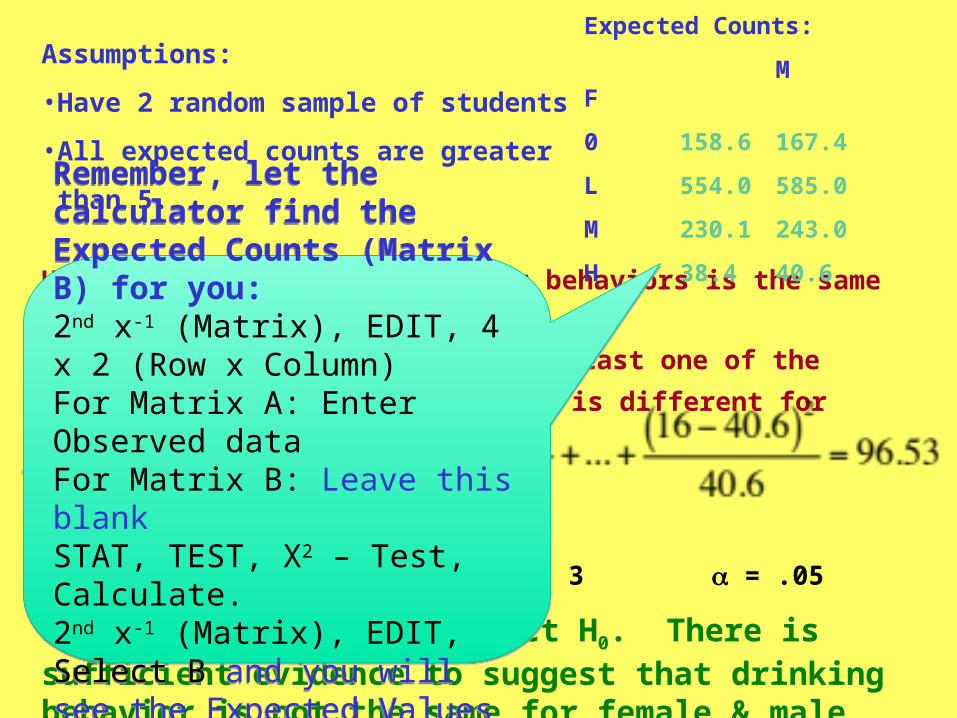
Assumptions:
•Have 2 random sample of students
•All expected counts are greater
than 5.
H0: the proportions of drinking behaviors is the same
for female & male students Ha: at least one of the proportions of
drinking behavior is different for female & male students
P-value = 8.67E-21 ≈ 0 df = 3 = .05
Since p-value < , I reject H0. There is sufficient evidence to suggest that drinking behavior is not the same for female & male students.
Expected Counts:
M F
0 158.6 167.4
L 554.0 585.0
M 230.1 243.0
H 38.4 40.6
Remember, let the calculator find the Expected Counts (Matrix B) for you:2nd x-1 (Matrix), EDIT, 4 x 2 (Row x Column)For Matrix A: Enter Observed dataFor Matrix B: Leave this blankSTAT, TEST, X2 – Test, Calculate.2nd x-1 (Matrix), EDIT, Select B and you will see the Expected Values
Remember, let the calculator find the Expected Counts (Matrix B) for you:2nd x-1 (Matrix), EDIT, 4 x 2 (Row x Column)For Matrix A: Enter Observed dataFor Matrix B: Leave this blankSTAT, TEST, X2 – Test, Calculate.2nd x-1 (Matrix), EDIT, Select B and you will see the Expected Values

Homework:• Finish Page 222, 223
• This concludes our last lesson. The test will be next Tuesday. (We will practice and review Friday and Monday)
•SuperMonday 6-9pm, RHS Cafeteria Annex – Be there
Related Documents