© 2020 Chevron Corporation Chevron 2021 Investor Presentation February 2021

Welcome message from author
This document is posted to help you gain knowledge. Please leave a comment to let me know what you think about it! Share it to your friends and learn new things together.
Transcript

© 2020 Chevron Corporation
Chevron 2021Investor Presentation
February 2021
2© 2020 Chevron Corporation
Cautionary statementCAUTIONARY STATEMENTS RELEVANT TO FORWARD-LOOKING INFORMATION
FOR THE PURPOSE OF “SAFE HARBOR” PROVISIONS OF THE PRIVATE SECURITIES LITIGATION REFORM ACT OF 1995
This presentation contains forward-looking statements relating to Chevron's operations that are based on management's current expectations, estimates and projections about the petroleum, chemicals and other energy-related industries. Words
or phrases such as “anticipates,” “expects,” “intends,” “plans,” “targets,” “forecasts,” “projects,” “believes,” “seeks,” “schedules,” “estimates,” “positions,” “pursues,” “may,” “could,” “should,” “will,” “budgets,” “outlook,” “trends,” “guidance,” “focus,”
“on schedule,” “on track,” “is slated,” “goals,” “objectives,” “strategies,” “opportunities,” “poised,” “potential” and similar expressions are intended to identify such forward-looking statements. These statements are not guarantees of future
performance and are subject to certain risks, uncertainties and other factors, many of which are beyond the company’s control and are difficult to predict. Therefore, actual outcomes and results may differ materially from what is expressed or
forecasted in such forward-looking statements. The reader should not place undue reliance on these forward-looking statements, which speak only as of the date of this presentation. Unless legally required, Chevron undertakes no obligation to
update publicly any forward-looking statements, whether as a result of new information, future events or otherwise.
Among the important factors that could cause actual results to differ materially from those in the forward-looking statements are: changing crude oil and natural gas prices and demand for our products, and production curtailments due to market
conditions; crude oil production quotas or other actions that might be imposed by the Organization of Petroleum Exporting Countries and other producing countries; public health crises, such as pandemics (including coronavirus (COVID-19)) and
epidemics, and any related government policies and actions; changing economic, regulatory and political environments in the various countries in which the company operates; general domestic and international economic and political conditions;
changing refining, marketing and chemicals margins; the company's ability to realize anticipated cost savings, expenditure reductions and efficiencies associated with enterprise transformation initiatives; actions of competitors or regulators; timing
of exploration expenses; timing of crude oil liftings; the competitiveness of alternate-energy sources or product substitutes; technological developments; the results of operations and financial condition of the company's suppliers, vendors, partners
and equity affiliates, particularly during extended periods of low prices for crude oil and natural gas during the COVID-19 pandemic; the inability or failure of the company's joint-venture partners to fund their share of operations and development
activities; the potential failure to achieve expected net production from existing and future crude oil and natural gas development projects; potential delays in the development, construction or start-up of planned projects; the potential disruption or
interruption of the company's operations due to war, accidents, political events, civil unrest, severe weather, cyber threats, terrorist acts, or other natural or human causes beyond the company's control; the potential liability for remedial actions or
assessments under existing or future environmental regulations and litigation; significant operational, investment or product changes required by existing or future environmental statutes and regulations, including international agreements and
national or regional legislation and regulatory measures to limit or reduce greenhouse gas emissions; the potential liability resulting from pending or future litigation; the company’s ability to successfully integrate the operations of Chevron and
Noble Energy and achieve the anticipated benefits from the acquisition of Noble Energy; the company's future acquisitions or dispositions of assets or shares or the delay or failure of such transactions to close based on required closing
conditions; the potential for gains and losses from asset dispositions or impairments; government mandated sales, divestitures, recapitalizations, industry-specific taxes, tariffs, sanctions, changes in fiscal terms or restrictions on scope of company
operations; foreign currency movements compared with the U.S. dollar; material reductions in corporate liquidity and access to debt markets; the receipt of required Board authorizations to pay future dividends; the effects of changed accounting
rules under generally accepted accounting principles promulgated by rule-setting bodies; the company's ability to identify and mitigate the risks and hazards inherent in operating in the global energy industry; and the factors set forth under the
heading “Risk Factors” on pages 18 through 21 of the company's 2019 Annual Report on Form 10-K, as updated by Part II, Item 1A, “Risk Factors” in the company’s subsequently filed Quarterly Reports on Form 10-Q, and in other subsequent
filings with the U.S. Securities and Exchange Commission. Other unpredictable or unknown factors not discussed in this presentation could also have material adverse effects on forward-looking statements.
As used in this presentation, the term “Chevron” and such terms as “the company,” “the corporation,” “our,” “we,” “us” and “its” may refer to Chevron Corporation, one or more of its consolidated subsidiaries, or to all of them taken as a whole. All of
these terms are used for convenience only and are not intended as a precise description of any of the separate companies, each of which manages its own affairs.
Terms such as “resources” may be used in this presentation to describe certain aspects of Chevron’s portfolio and oil and gas properties beyond the proved reserves. For definitions of, and further information regarding, this and other terms, see
the “Glossary of Energy and Financial Terms” on pages 54 through 55 of Chevron’s 2019 Supplement to the Annual Report available at chevron.com.
This presentation is meant to be read in conjunction with the Third Quarter 2020 Transcript posted on chevron.com under the headings “Investors,” “Events & Presentations.”

© 2020 Chevron Corporation
Corporate overview
4© 2020 Chevron Corporation
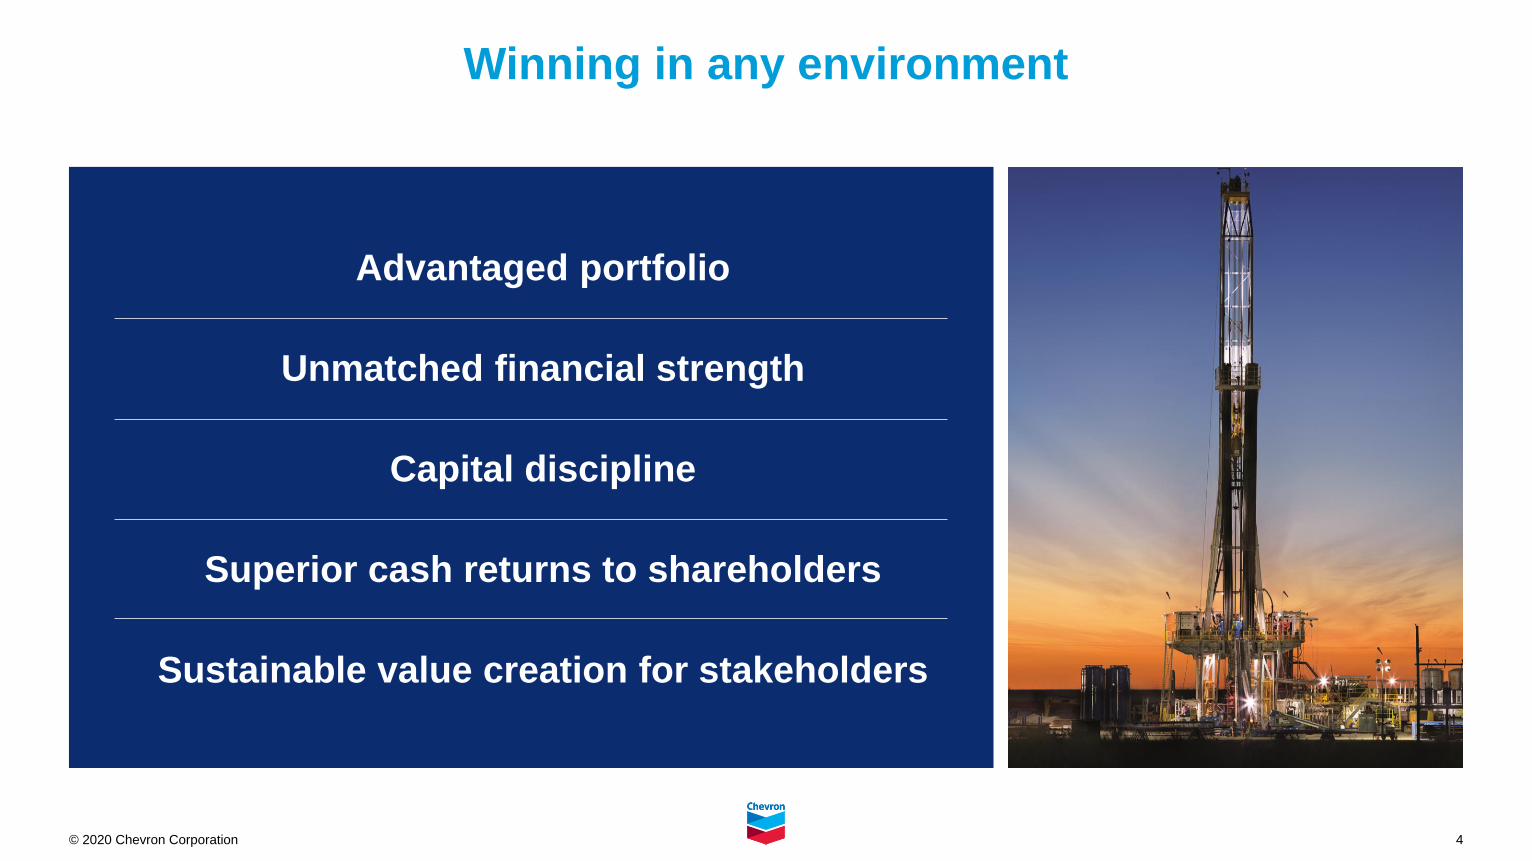
Winning in any environment
Advantaged portfolio
Unmatched financial strength
Capital discipline
Superior cash returns to shareholders
Sustainable value creation for stakeholders
5© 2020 Chevron Corporation
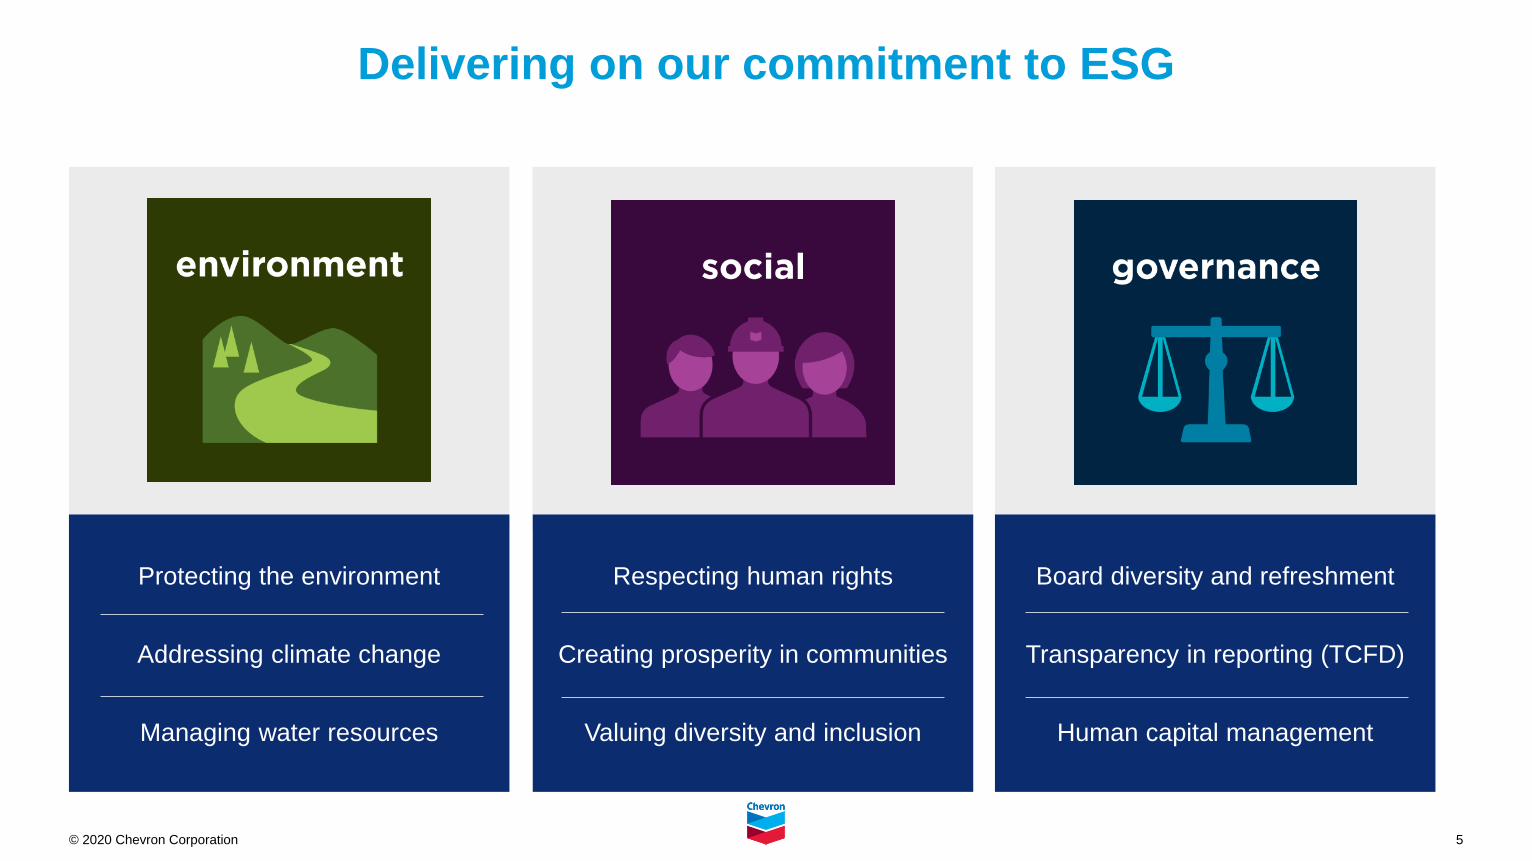
Delivering on our commitment to ESG
Protecting the environment
Addressing climate change
Managing water resources
Board diversity and refreshment
Transparency in reporting (TCFD)
Human capital management
Respecting human rights
Creating prosperity in communities
Valuing diversity and inclusion
6© 2020 Chevron Corporation
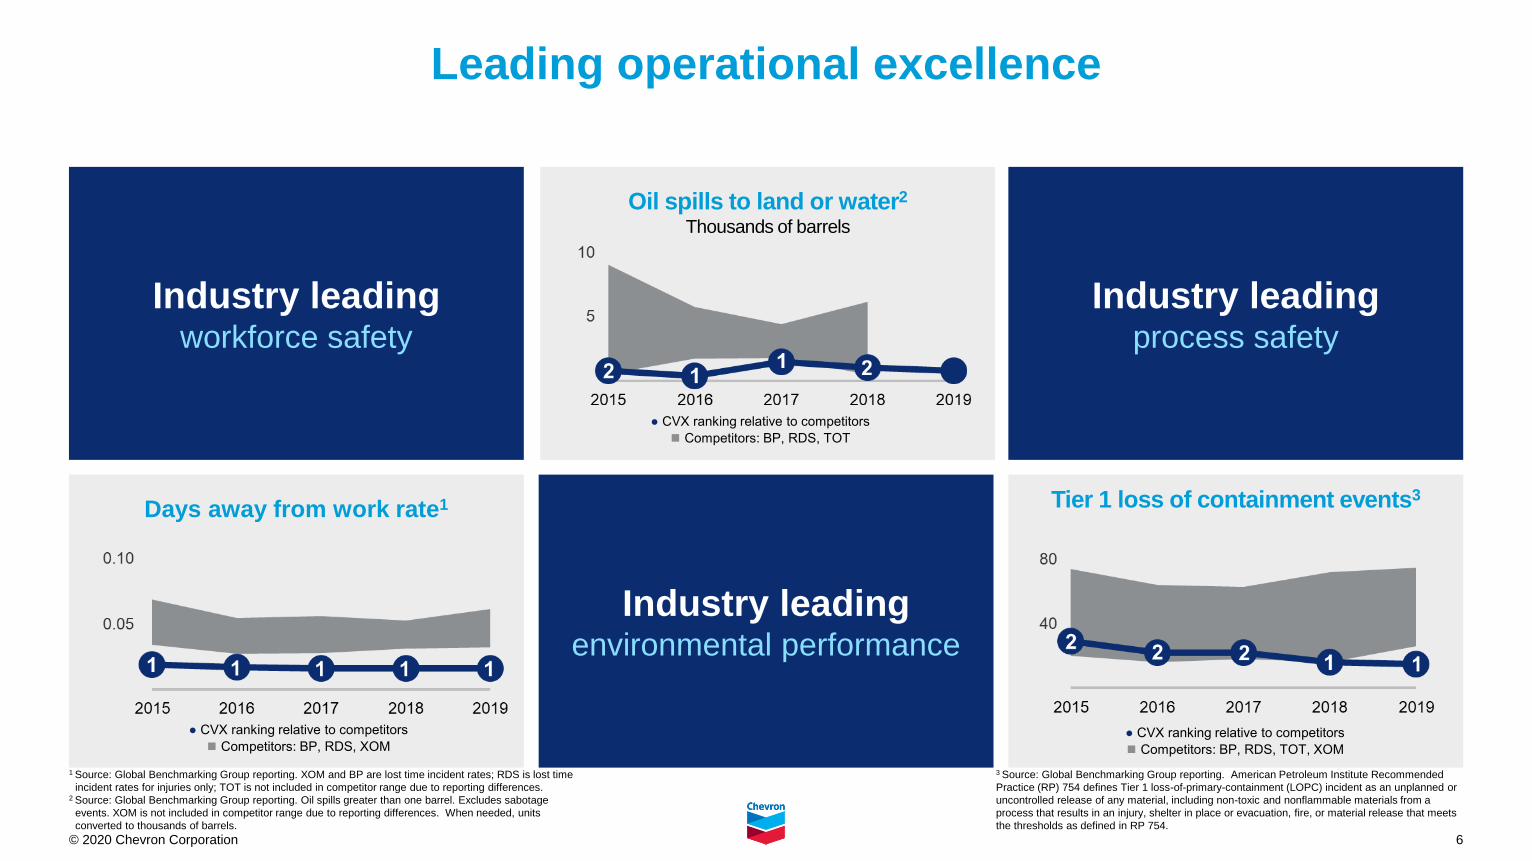
Leading operational excellence
Oil spills to land or water2
Thousands of barrels
Industry leadingworkforce safety
Industry leading process safety
1 Source: Global Benchmarking Group reporting. XOM and BP are lost time incident rates; RDS is lost time
incident rates for injuries only; TOT is not included in competitor range due to reporting differences. 2 Source: Global Benchmarking Group reporting. Oil spills greater than one barrel. Excludes sabotage
events. XOM is not included in competitor range due to reporting differences. When needed, units
converted to thousands of barrels.
Days away from work rate1 Tier 1 loss of containment events3
Industry leading environmental performance
● CVX ranking relative to competitors
◼︎ Competitors: BP, RDS, XOM
● CVX ranking relative to competitors
◼︎ Competitors: BP, RDS, TOT
● CVX ranking relative to competitors
◼︎ Competitors: BP, RDS, TOT, XOM
3 Source: Global Benchmarking Group reporting. American Petroleum Institute Recommended
Practice (RP) 754 defines Tier 1 loss-of-primary-containment (LOPC) incident as an unplanned or
uncontrolled release of any material, including non-toxic and nonflammable materials from a
process that results in an injury, shelter in place or evacuation, fire, or material release that meets
the thresholds as defined in RP 754.
7© 2020 Chevron Corporation
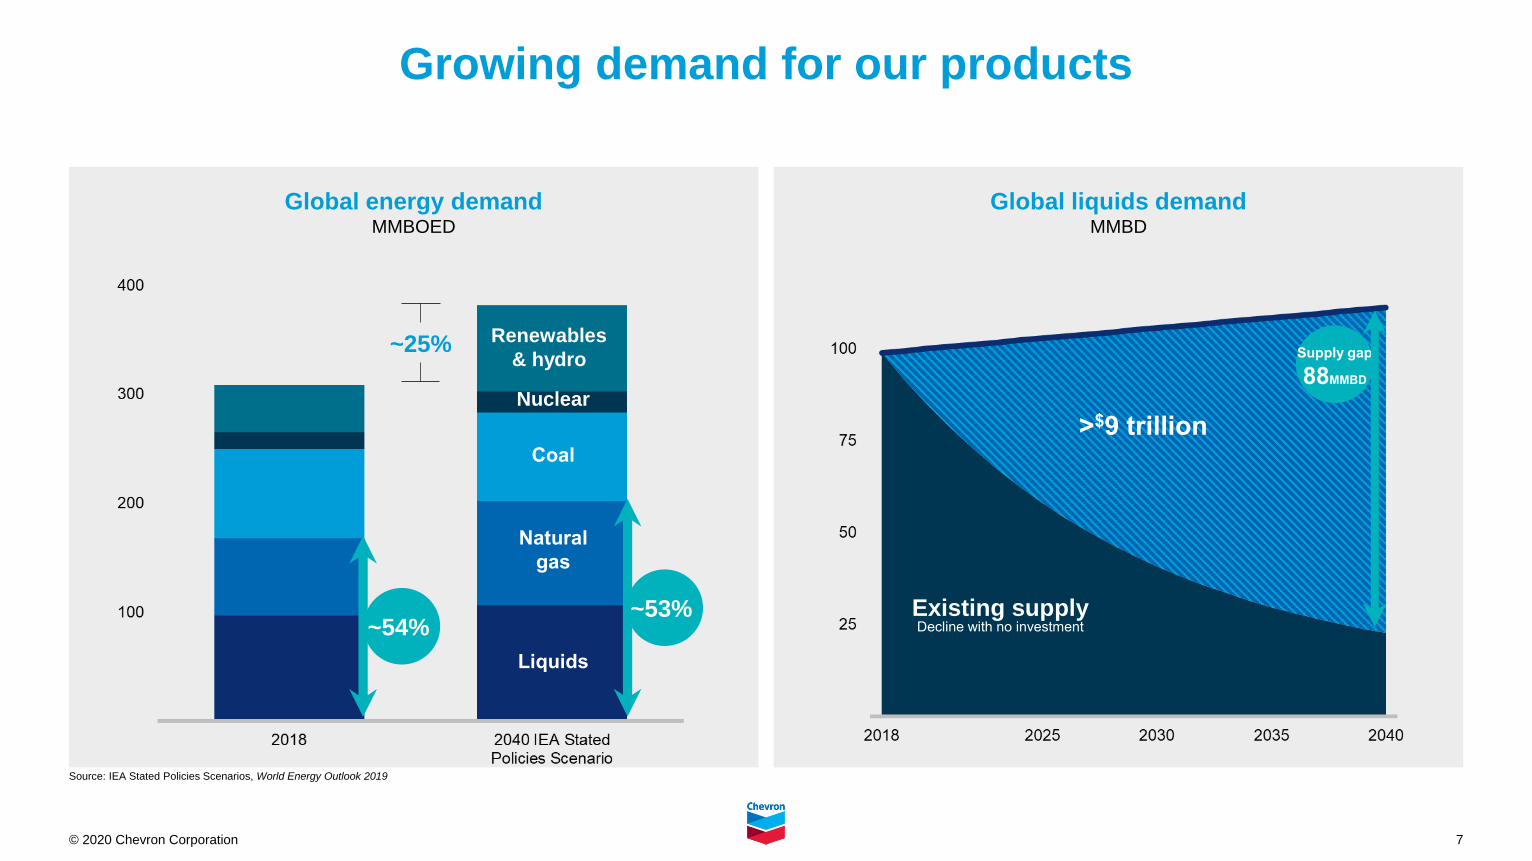
Global liquids demandMMBD
Global energy demandMMBOED
Liquids
Natural
gas
Coal
Nuclear
Renewables
& hydro
Growing demand for our products
Source: IEA Stated Policies Scenarios, World Energy Outlook 2019
~54%
>$9 trillion
Supply gap
88MMBD
Decline with no investmentExisting supply~53%
~25%

8© 2020 Chevron Corporation
ROCE
at flat $60 Brent nominal2019 - 2024
Adjusted
ROCE
ROCE
excl. special items2015 - 2019 improvement
Increasing returns on capital
Strongest ROCE1
improvement since 2015
Driving to >10% by 2024
~9% CAGR in
adjusted EPS2
supports ROCE growth
%
Capital
efficiency
Cost
& margin
2
1 ROCE excluding special items for all periods (2015 - 2019).
Note: $60/bbl. Brent nominal is for illustrative purposes only and not necessarily indicative of
Chevron’s price forecast.
Price
upside
Percentage points
◼︎ Competitors: BP, RDS, TOT, XOM2 Adjusted EPS and adjusted ROCE do not include earnings impact of special items and FX.
Price normalized to $60 Brent nominal and mid-cycle Downstream & Chemicals margins.
Adjusted EPS includes assumption of $5B per year share repurchase. $1.1 billion mid-cycle
Downstream & Chemical margins is based on past 7 years average margin.
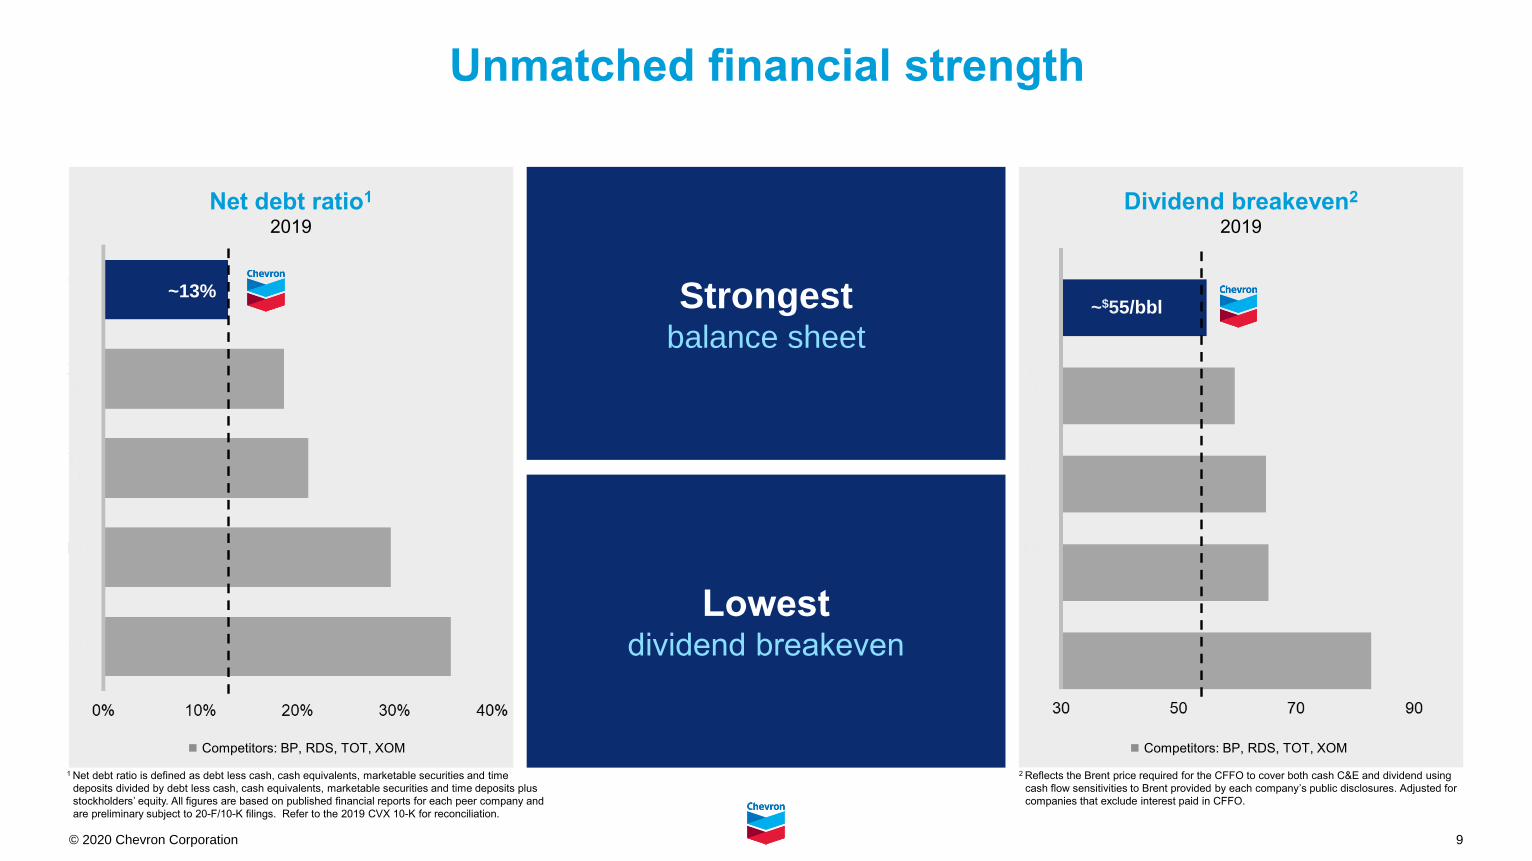
9© 2020 Chevron Corporation
Dividend breakeven2
2019
Net debt ratio1
2019
Unmatched financial strength
~13%
◼︎ Competitors: BP, RDS, TOT, XOM ◼︎ Competitors: BP, RDS, TOT, XOM
~$55/bblStrongestbalance sheet
Lowest dividend breakeven
1 Net debt ratio is defined as debt less cash, cash equivalents, marketable securities and time
deposits divided by debt less cash, cash equivalents, marketable securities and time deposits plus
stockholders’ equity. All figures are based on published financial reports for each peer company and
are preliminary subject to 20-F/10-K filings. Refer to the 2019 CVX 10-K for reconciliation.
2 Reflects the Brent price required for the CFFO to cover both cash C&E and dividend using
cash flow sensitivities to Brent provided by each company’s public disclosures. Adjusted for
companies that exclude interest paid in CFFO.
10© 2020 Chevron Corporation
Exploration
Key areas
Low cost
Proven
hydrocarbon basins
Downstream & Chemicals
Petrochemicals projectsYeosu
USGC II
Ras Laffan
Value chain integrationPasadena / Permian
Asia / Australia fuels
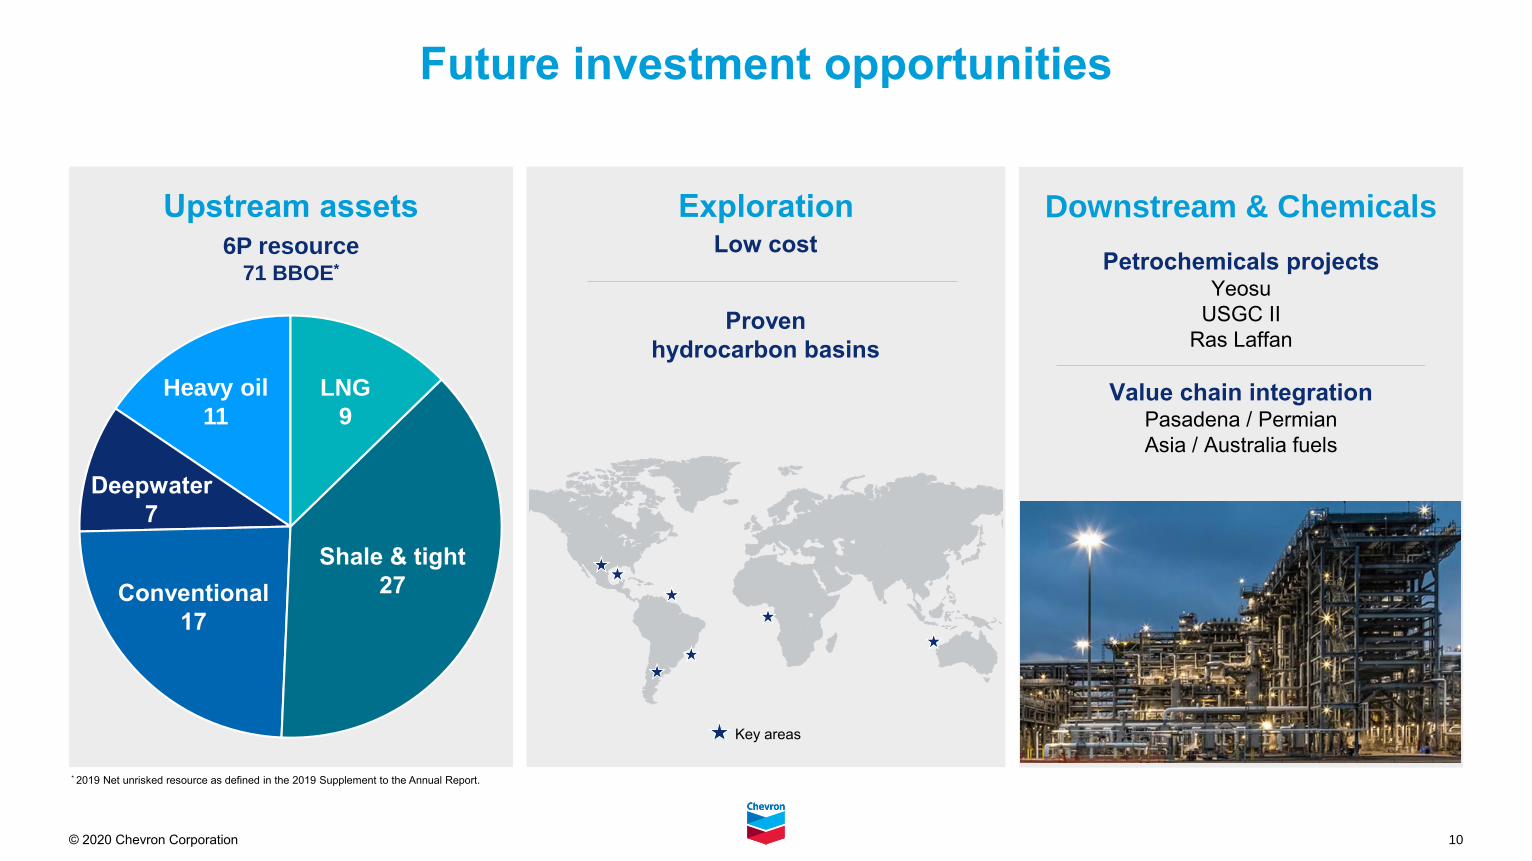
Future investment opportunities
Upstream assets6P resource
71 BBOE
Heavy oil
Deepwater
Conventional
Shale & tight
LNG
Australia
OtherLNG
9
Other
Permian
Shale & tight
27Conventional
17
Other
West AfricaKazakhstan
Deepwater
7
Other
West Africa
U.S. GoM
Heavy oil
11
Other
Partitioned Zone
& Venezuela
Heavy oil
11
Deepwater
7
Conventional
17
Shale & tight
27
LNG
9
Exploration
Key areas
Low cost
Proven
hydrocarbon basins
Downstream & Chemicals
Petrochemicals projectsYeosu
USGC II
Ras Laffan
Value chain integrationPasadena / Permian
Asia / Australia fuels
Upstream assets6P resource
71 BBOE*
Heavy oil
11
Deepwater
7
Conventional
17
Shale & tight
27
LNG
9
* 2019 Net unrisked resource as defined in the 2019 Supplement to the Annual Report.
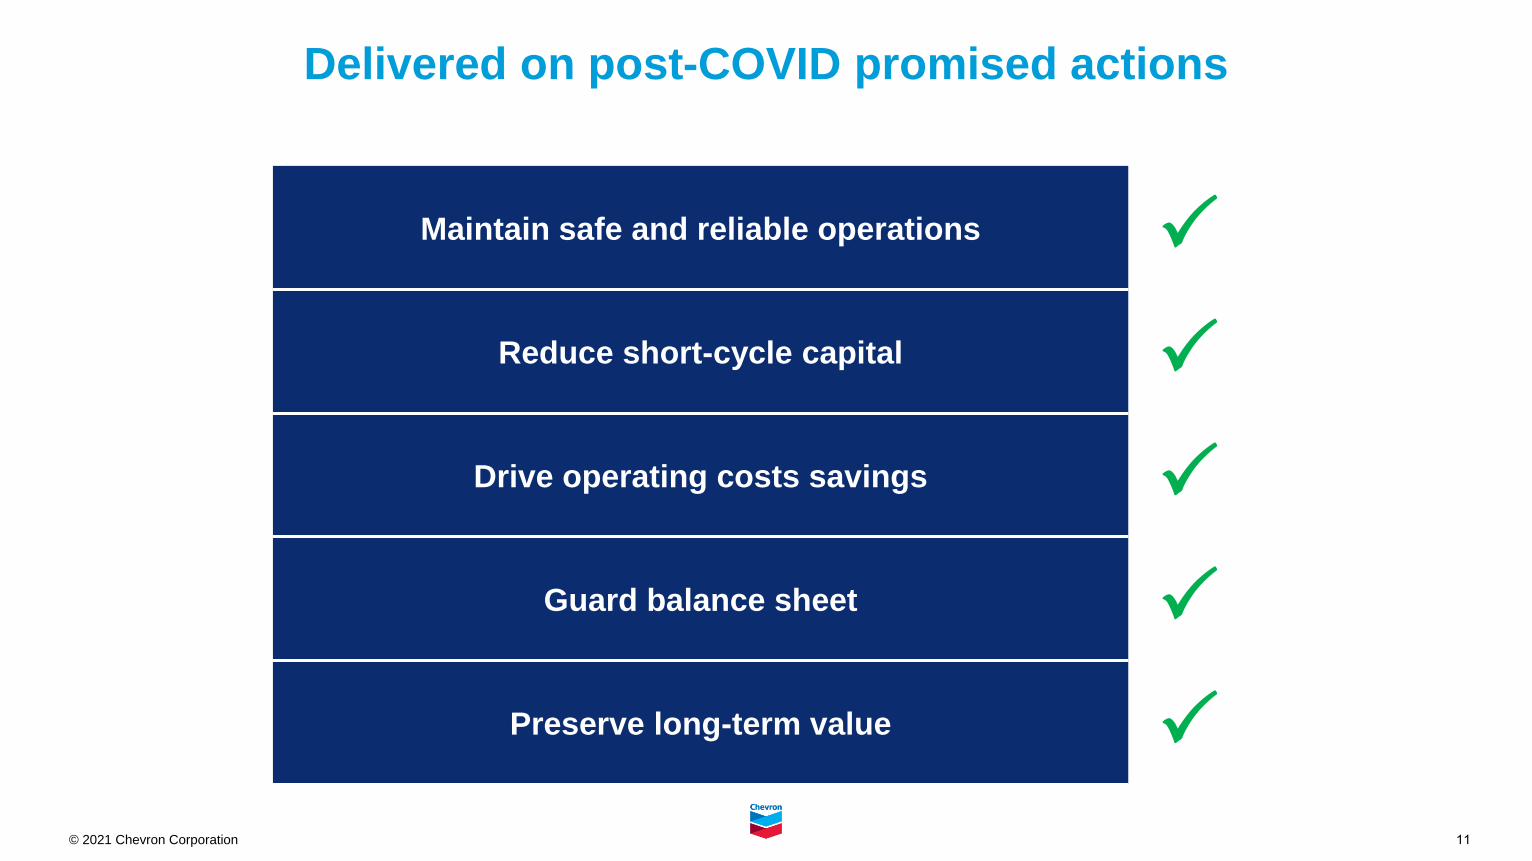
11© 2021 Chevron Corporation
Delivered on post-COVID promised actions
Maintain safe and reliable operations
Reduce short-cycle capital
Drive operating costs savings
Guard balance sheet
Preserve long-term value
12© 2021 Chevron Corporation
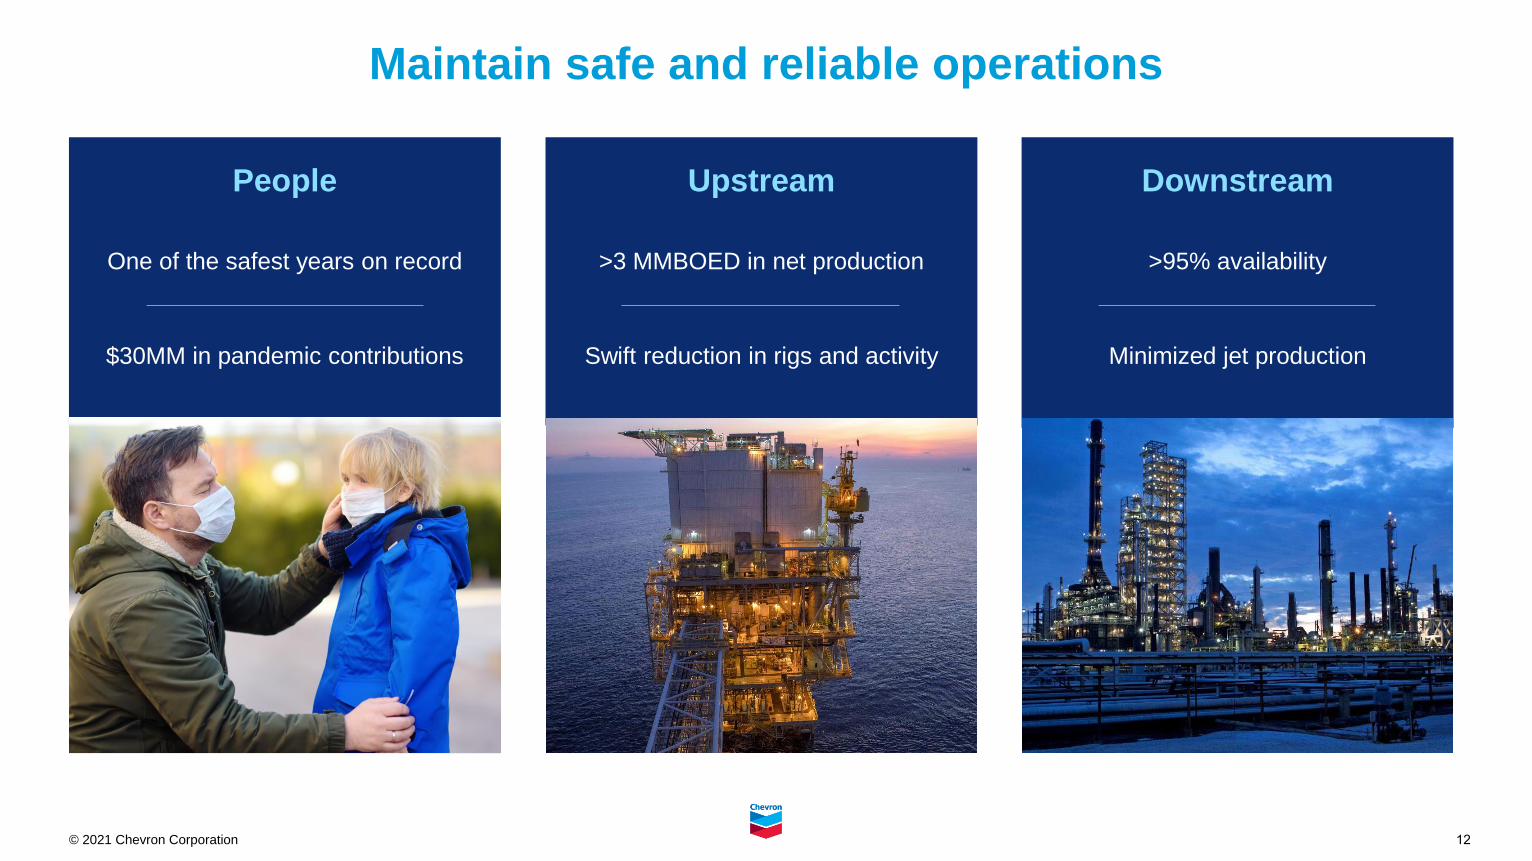
Maintain safe and reliable operations
Upstream
>3 MMBOED in net production
Swift reduction in rigs and activity
People
One of the safest years on record
$30MM in pandemic contributions
Downstream
>95% availability
Minimized jet production
13© 2021 Chevron Corporation
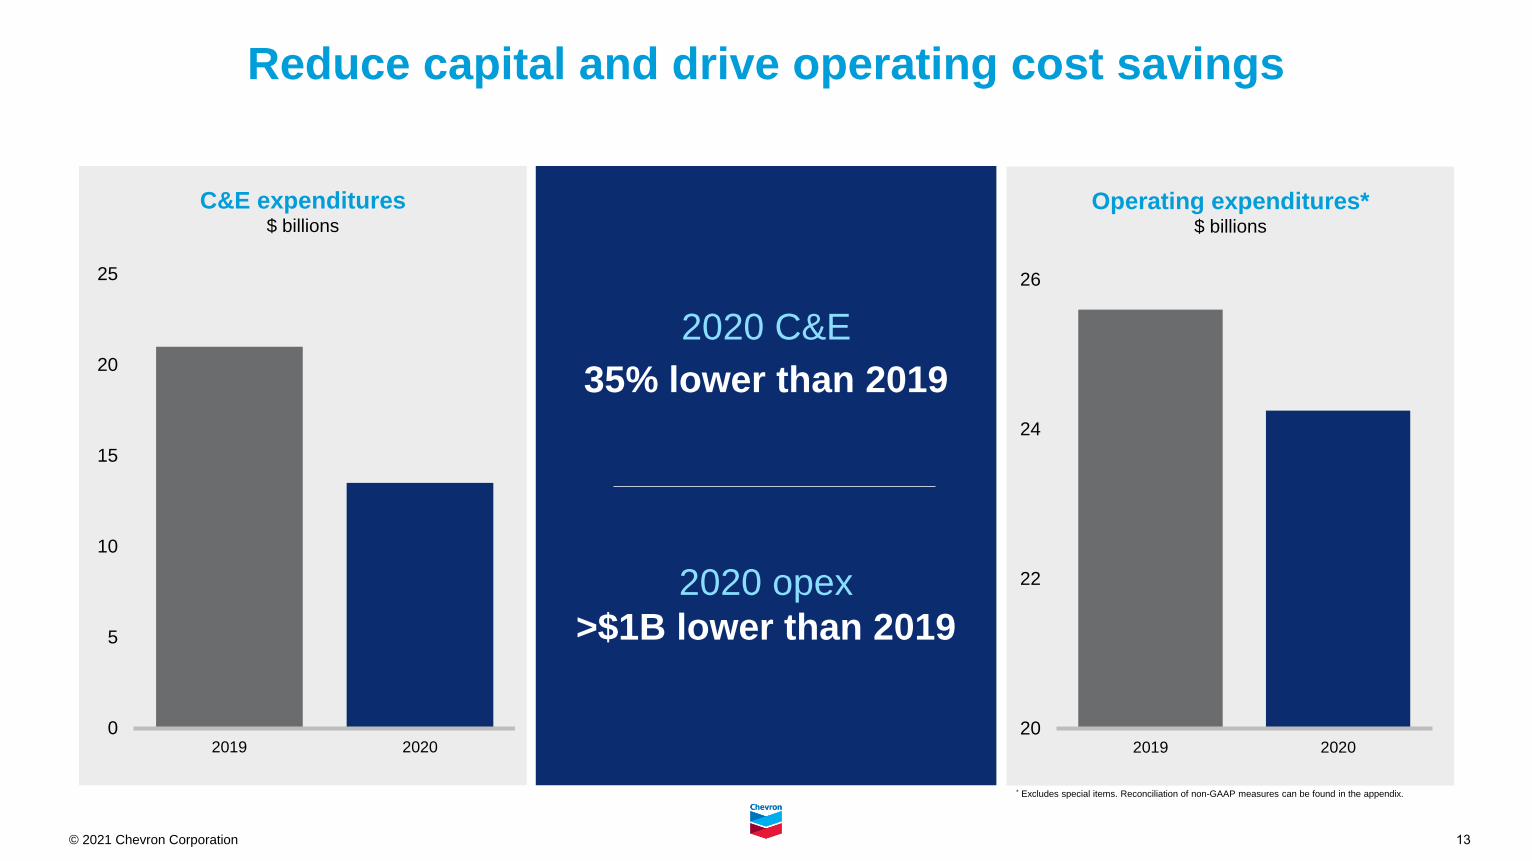
Reduce capital and drive operating cost savings
2020 C&E
35% lower than 2019
2020 opex
>$1B lower than 2019
Operating expenditures*$ billions
* Excludes special items. Reconciliation of non-GAAP measures can be found in the appendix.
C&E expenditures$ billions
20
22
24
26
2019 20200
5
10
15
20
25
2019 2020
14© 2021 Chevron Corporation
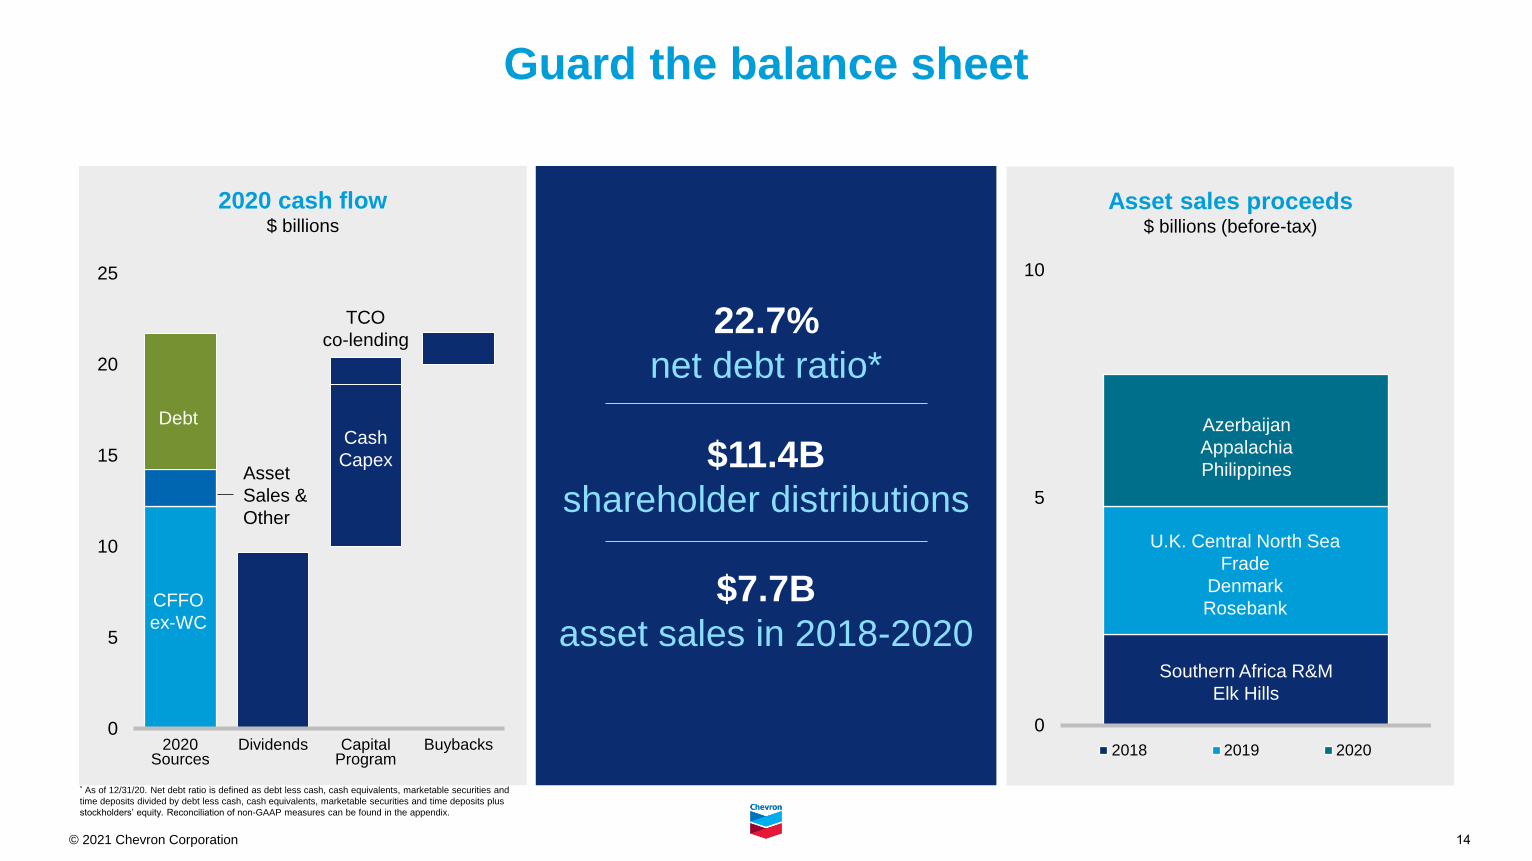
2020 cash flow$ billions
0
5
10
15
20
25
2020 Sources
Dividends Capital Program
Buybacks
Guard the balance sheet
22.7%
net debt ratio*
$11.4B
shareholder distributions
$7.7B
asset sales in 2018-2020
Asset sales proceeds$ billions (before-tax)
0
5
10
2018 2019 2020
Azerbaijan
Appalachia
Philippines
U.K. Central North Sea
Frade
Denmark
Rosebank
Southern Africa R&M
Elk Hills
Debt
CFFO
ex-WC
Asset
Sales &
Other
Cash
Capex
TCO
co-lending
* As of 12/31/20. Net debt ratio is defined as debt less cash, cash equivalents, marketable securities and
time deposits divided by debt less cash, cash equivalents, marketable securities and time deposits plus
stockholders’ equity. Reconciliation of non-GAAP measures can be found in the appendix.
15© 2021 Chevron Corporation
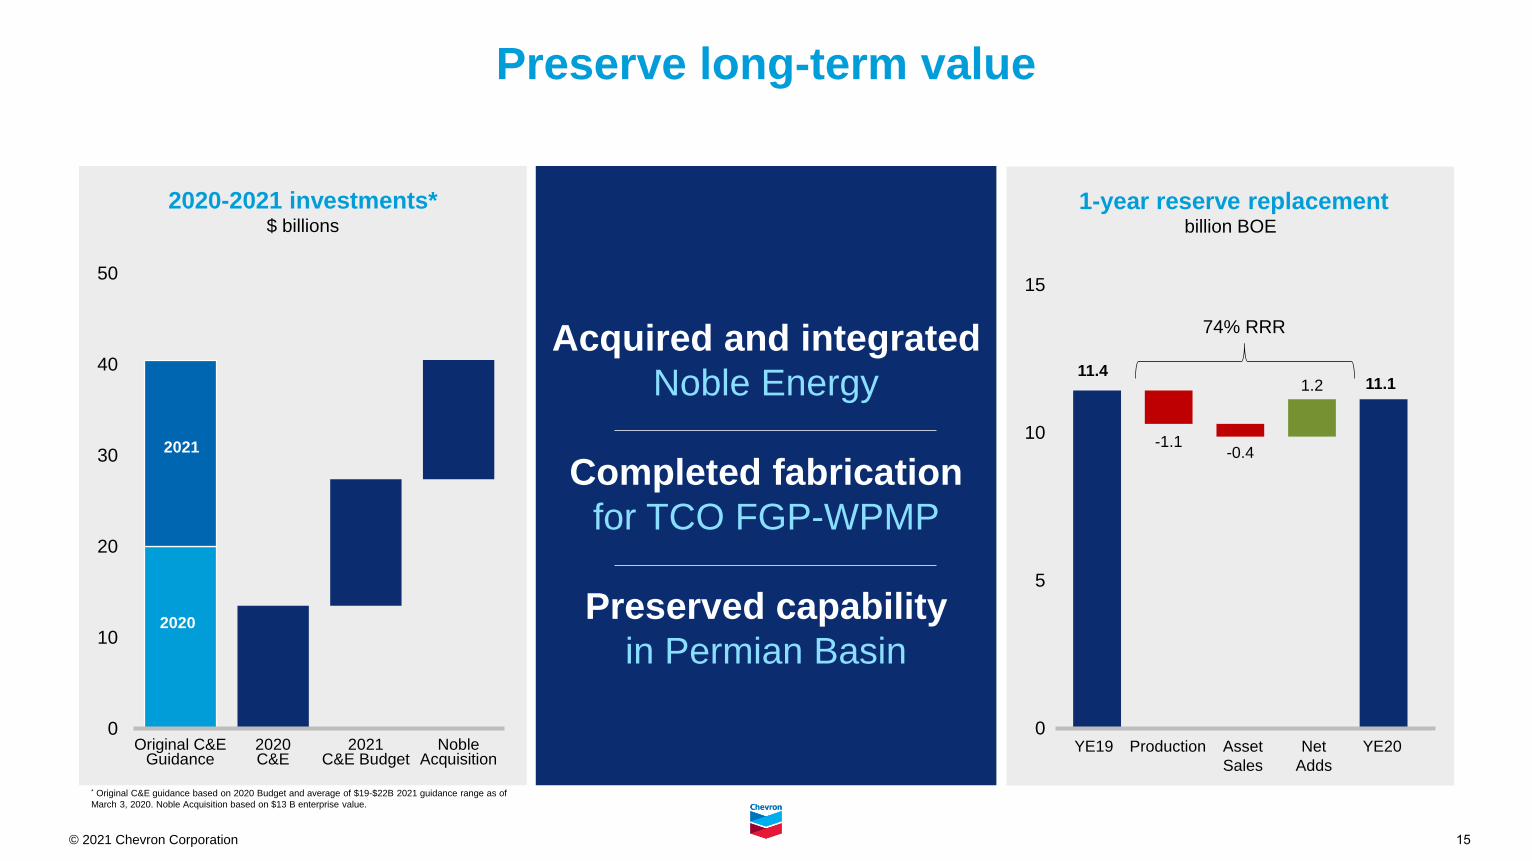
1-year reserve replacementbillion BOE
11.411.11.2
-1.1-0.4
0
5
10
15
2020-2021 investments*$ billions
0
10
20
30
40
50
Original C&E Guidance
2020C&E
2021C&E Budget
NobleAcquisition
Preserve long-term value
Acquired and integrated
Noble Energy
Completed fabrication
for TCO FGP-WPMP
Preserved capability
in Permian Basin
YE19 YE20Production Asset
Sales
Net
Adds
74% RRR
2021
2020
* Original C&E guidance based on 2020 Budget and average of $19-$22B 2021 guidance range as of
March 3, 2020. Noble Acquisition based on $13 B enterprise value.
16© 2021 Chevron Corporation
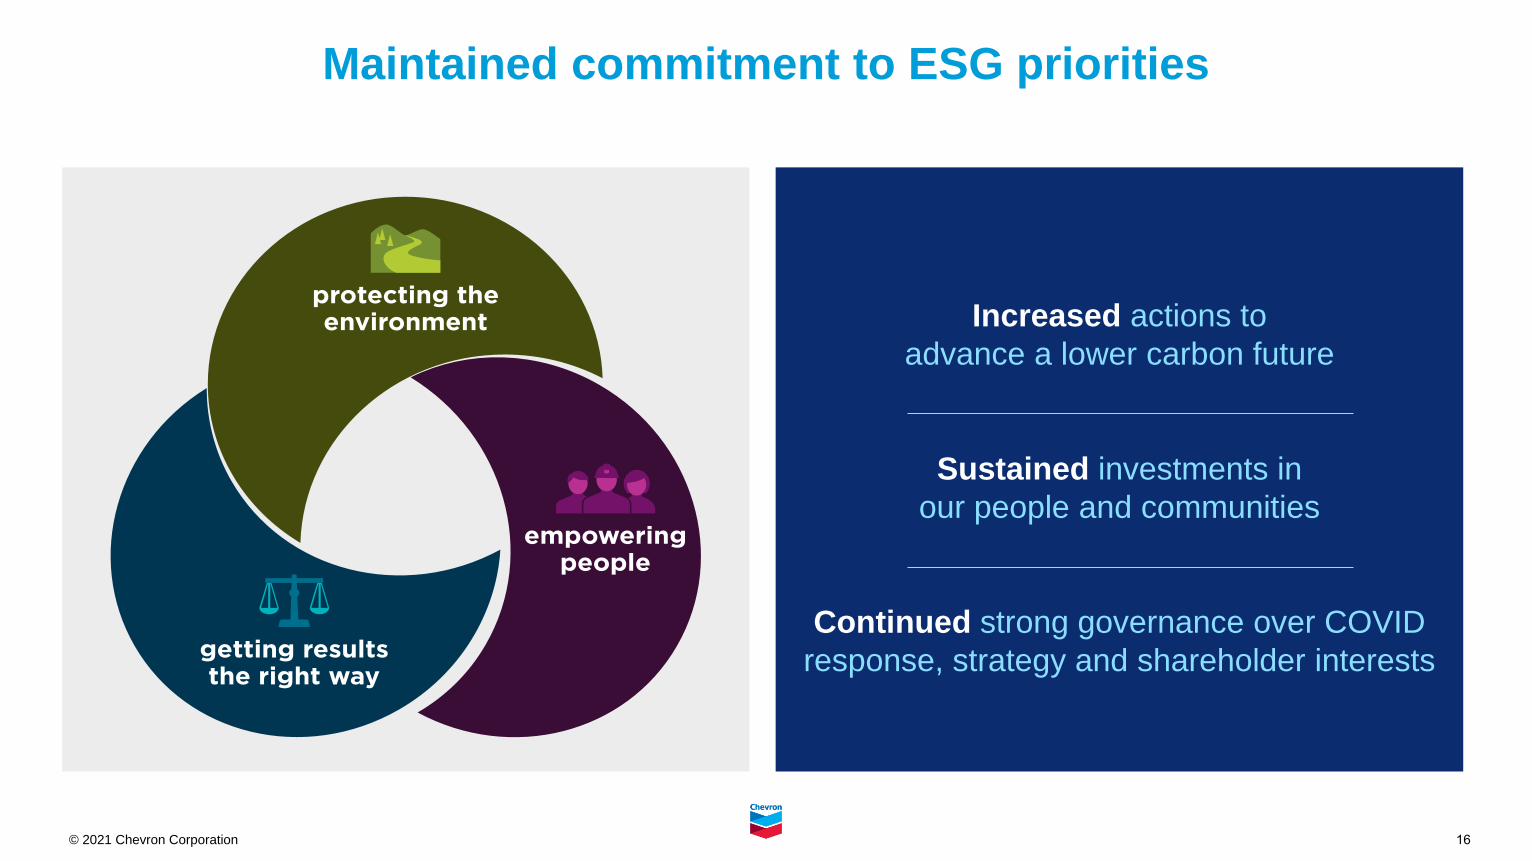
Maintained commitment to ESG priorities
Increased actions to
advance a lower carbon future
Sustained investments in
our people and communities
Continued strong governance over COVID
response, strategy and shareholder interests
17© 2021 Chevron Corporation
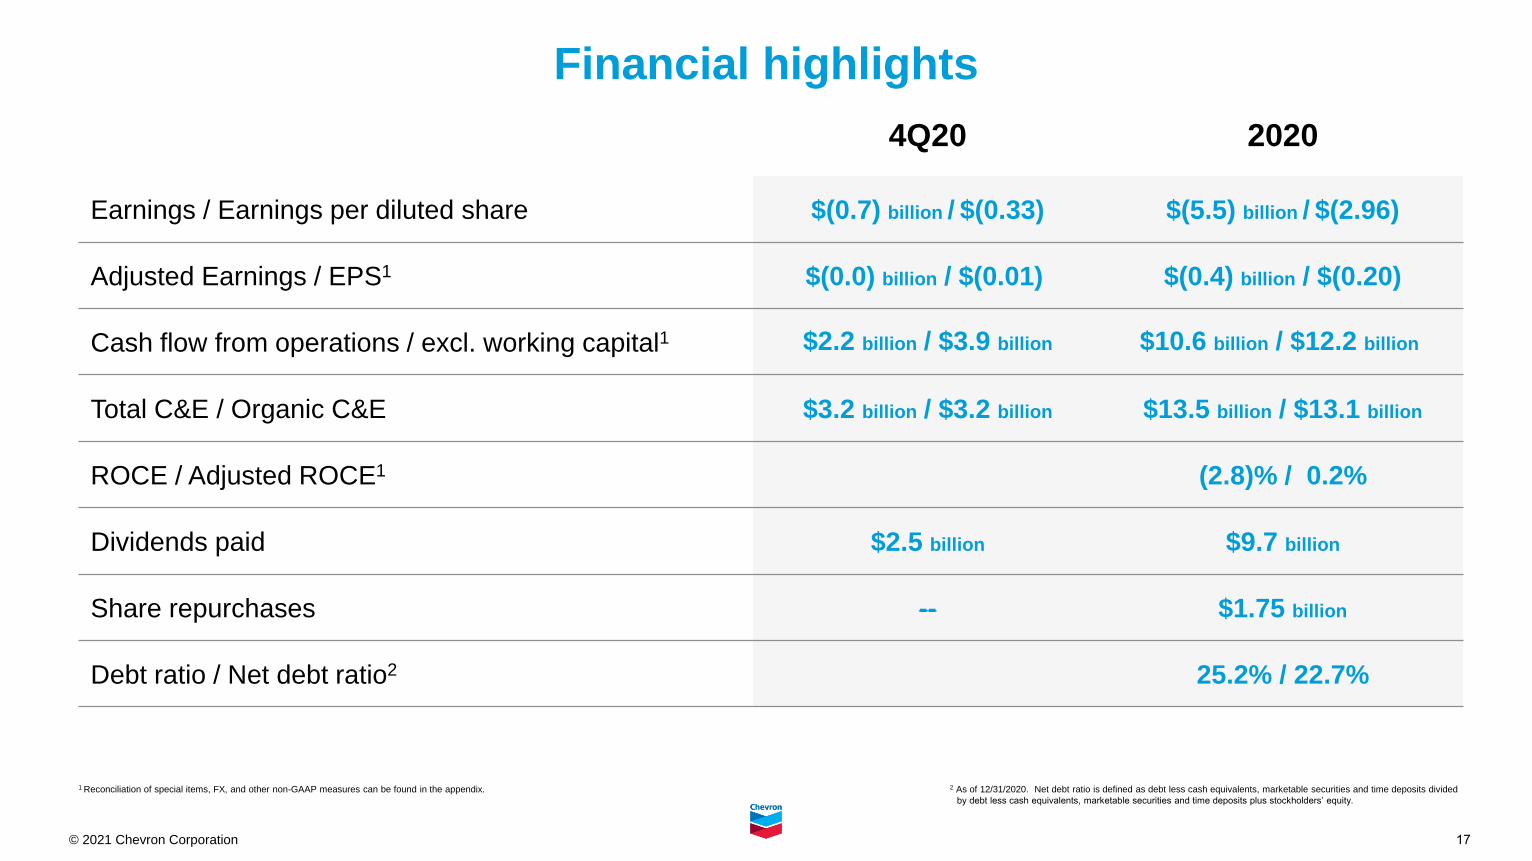
Financial highlights
1 Reconciliation of special items, FX, and other non-GAAP measures can be found in the appendix.
4Q20 2020
Earnings / Earnings per diluted share $(0.7) billion / $(0.33) $(5.5) billion / $(2.96)
Adjusted Earnings / EPS1 $(0.0) billion / $(0.01) $(0.4) billion / $(0.20)
Cash flow from operations / excl. working capital1 $2.2 billion / $3.9 billion $10.6 billion / $12.2 billion
Total C&E / Organic C&E $3.2 billion / $3.2 billion $13.5 billion / $13.1 billion
ROCE / Adjusted ROCE1 (2.8)% / 0.2%
Dividends paid $2.5 billion $9.7 billion
Share repurchases -- $1.75 billion
Debt ratio / Net debt ratio2 25.2% / 22.7%
2 As of 12/31/2020. Net debt ratio is defined as debt less cash equivalents, marketable securities and time deposits divided
by debt less cash equivalents, marketable securities and time deposits plus stockholders’ equity.
18© 2021 Chevron Corporation
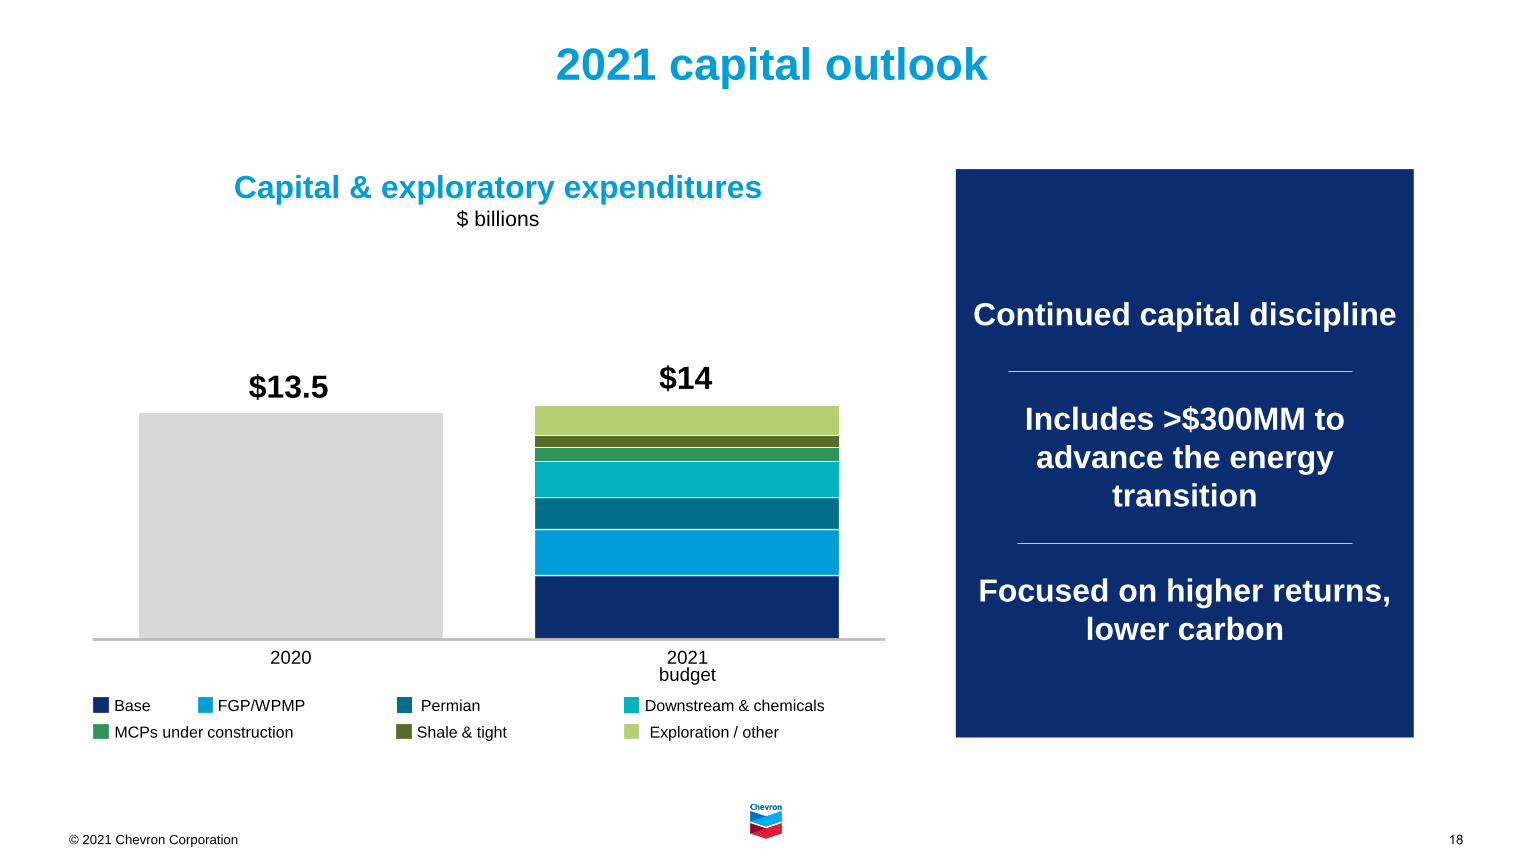
2020 2021budget
Capital & exploratory expenditures$ billions
Continued capital discipline
Includes >$300MM to
advance the energy
transition
Focused on higher returns,
lower carbon
2021 capital outlook
Shale & tight
FGP/WPMP
MCPs under construction
Base
Exploration / other
Permian Downstream & chemicals
$14$13.5
19© 2021 Chevron Corporation
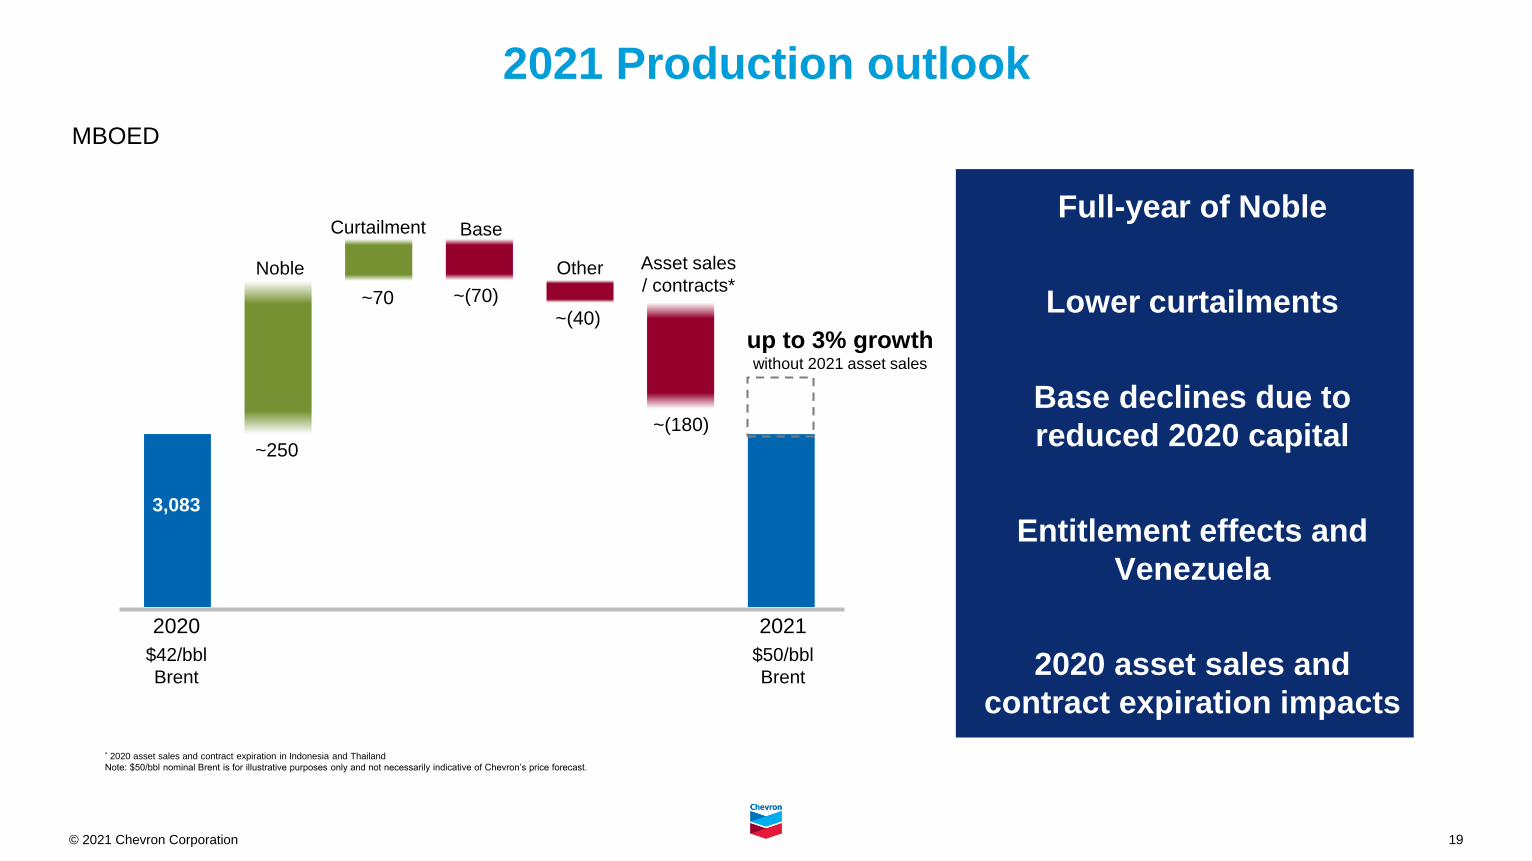
3,083
Noble
Curtailment Base
Asset sales
/ contracts*
2020 2021
$42/bbl
Brent
$50/bbl
Brent
2021 Production outlook
Full-year of Noble
Lower curtailments
Base declines due to
reduced 2020 capital
Entitlement effects and
Venezuela
2020 asset sales and
contract expiration impacts
* 2020 asset sales and contract expiration in Indonesia and Thailand
Note: $50/bbl nominal Brent is for illustrative purposes only and not necessarily indicative of Chevron’s price forecast.
up to 3% growthwithout 2021 asset sales
MBOED
~250
~70 ~(70)
~(180)
Other
~(40)
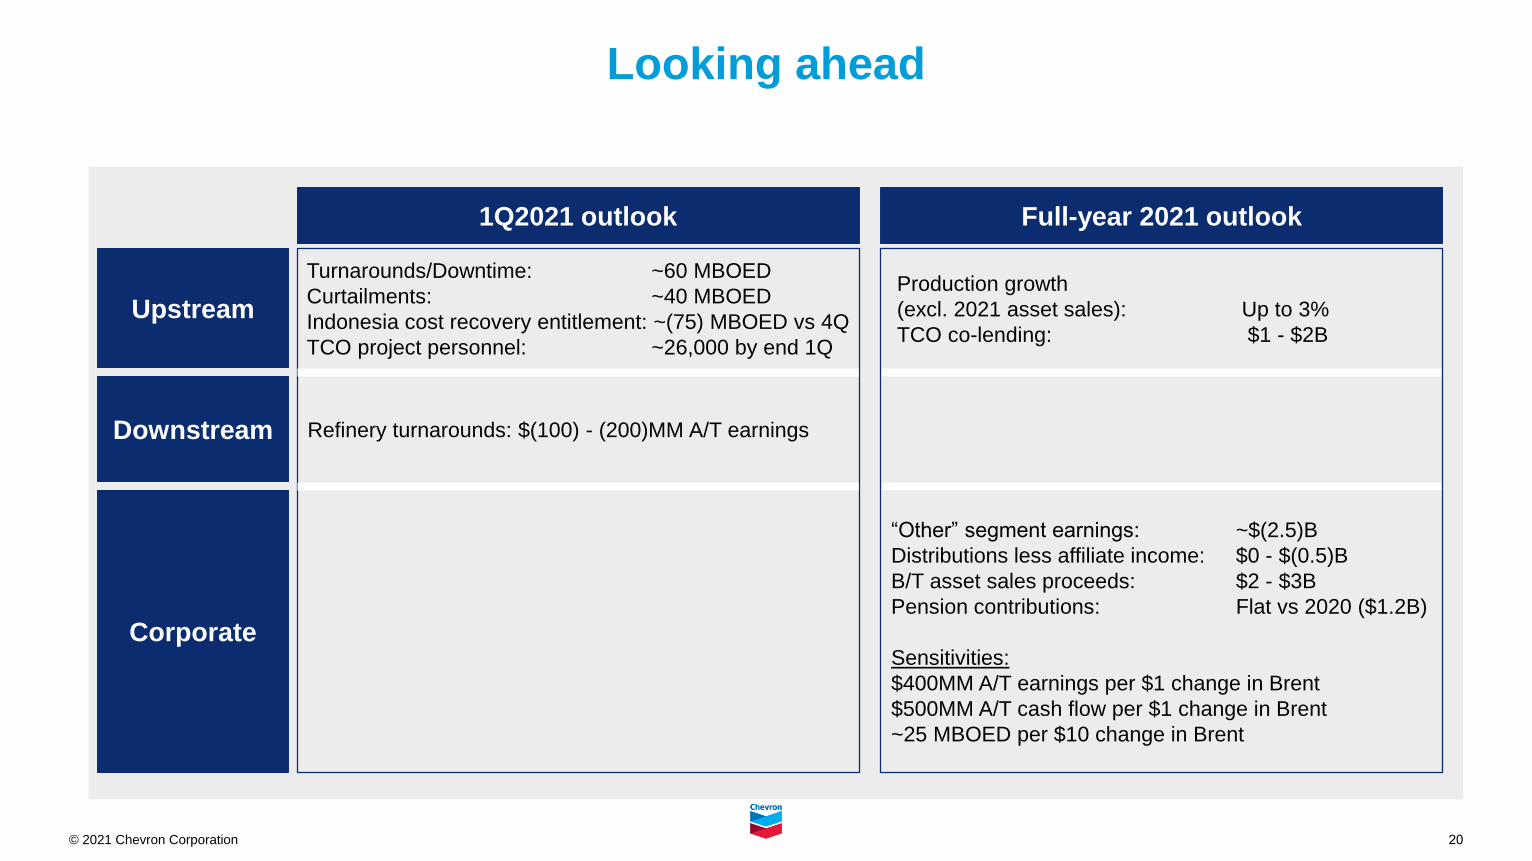
20© 2021 Chevron Corporation
“Other” segment earnings: ~$(2.5)B
Distributions less affiliate income: $0 - $(0.5)B
B/T asset sales proceeds: $2 - $3B
Pension contributions: Flat vs 2020 ($1.2B)
Sensitivities:
$400MM A/T earnings per $1 change in Brent
$500MM A/T cash flow per $1 change in Brent
~25 MBOED per $10 change in Brent
Looking ahead
1Q2021 outlook Full-year 2021 outlook
Upstream
Downstream
Corporate
Turnarounds/Downtime: ~60 MBOED
Curtailments: ~40 MBOED
Indonesia cost recovery entitlement: ~(75) MBOED vs 4Q
TCO project personnel: ~26,000 by end 1Q
Refinery turnarounds: $(100) - (200)MM A/T earnings
Production growth
(excl. 2021 asset sales): Up to 3%
TCO co-lending: $1 - $2B
21© 2020 Chevron Corporation
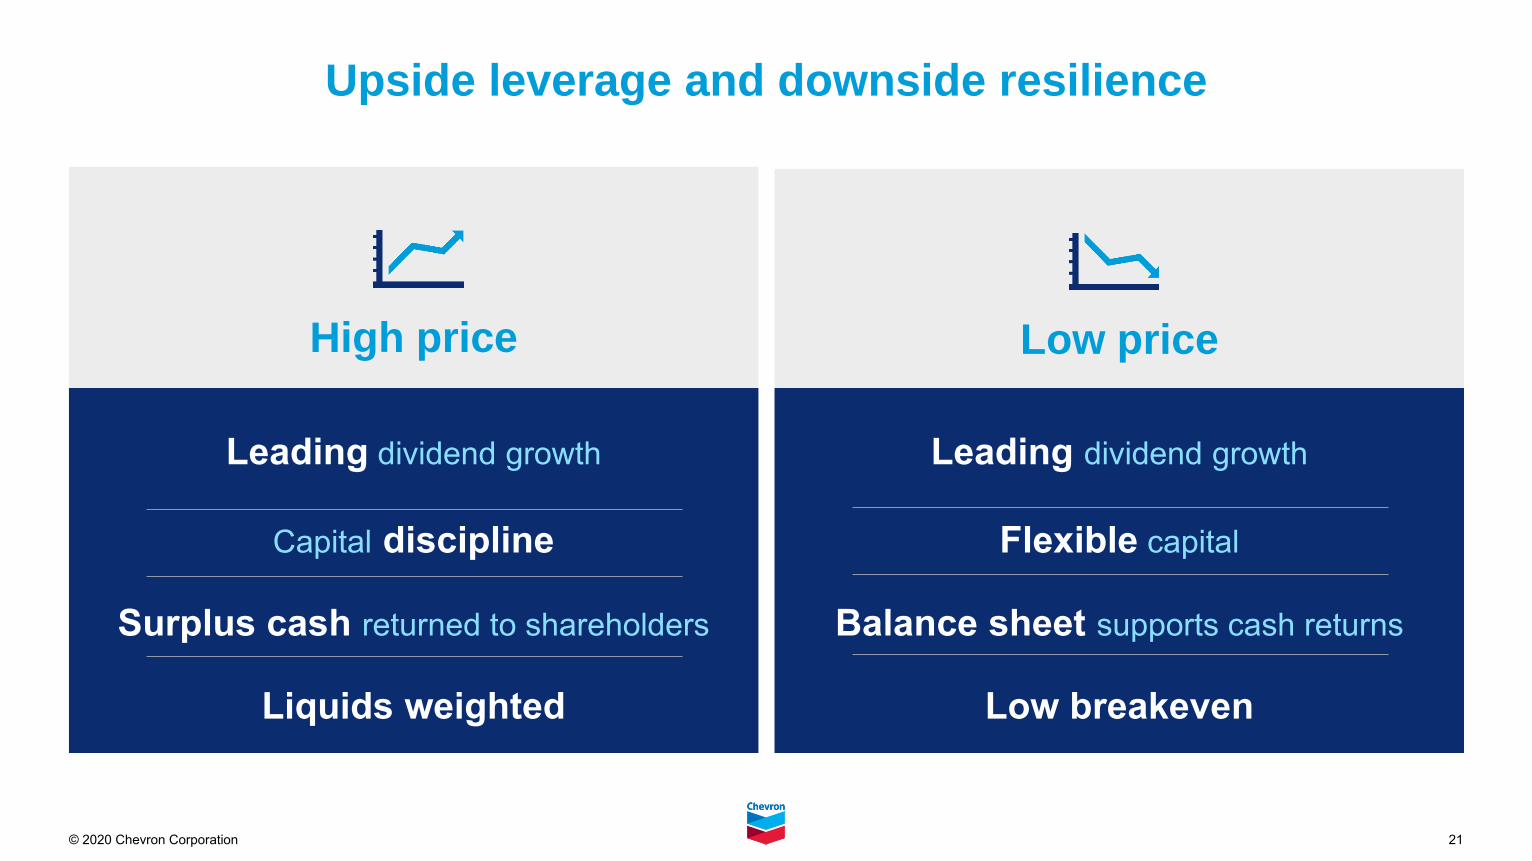
High price
Competitive dividend growth
Disciplined C&E
Surplus cash returned to shareholders
Liquids weighted portfolio
Leading dividend growth
Capital discipline
Surplus cash returned to shareholders
Liquids weighted
Upside leverage and downside resilience
Low price
Competitive dividend growth
Flexible C&E
Balance sheet supports cash returns
Low breakeven
Leading dividend growth
Flexible capital
Balance sheet supports cash returns
Low breakeven
© 2020 Chevron Corporation
Upstream overview
23© 2020 Chevron Corporation
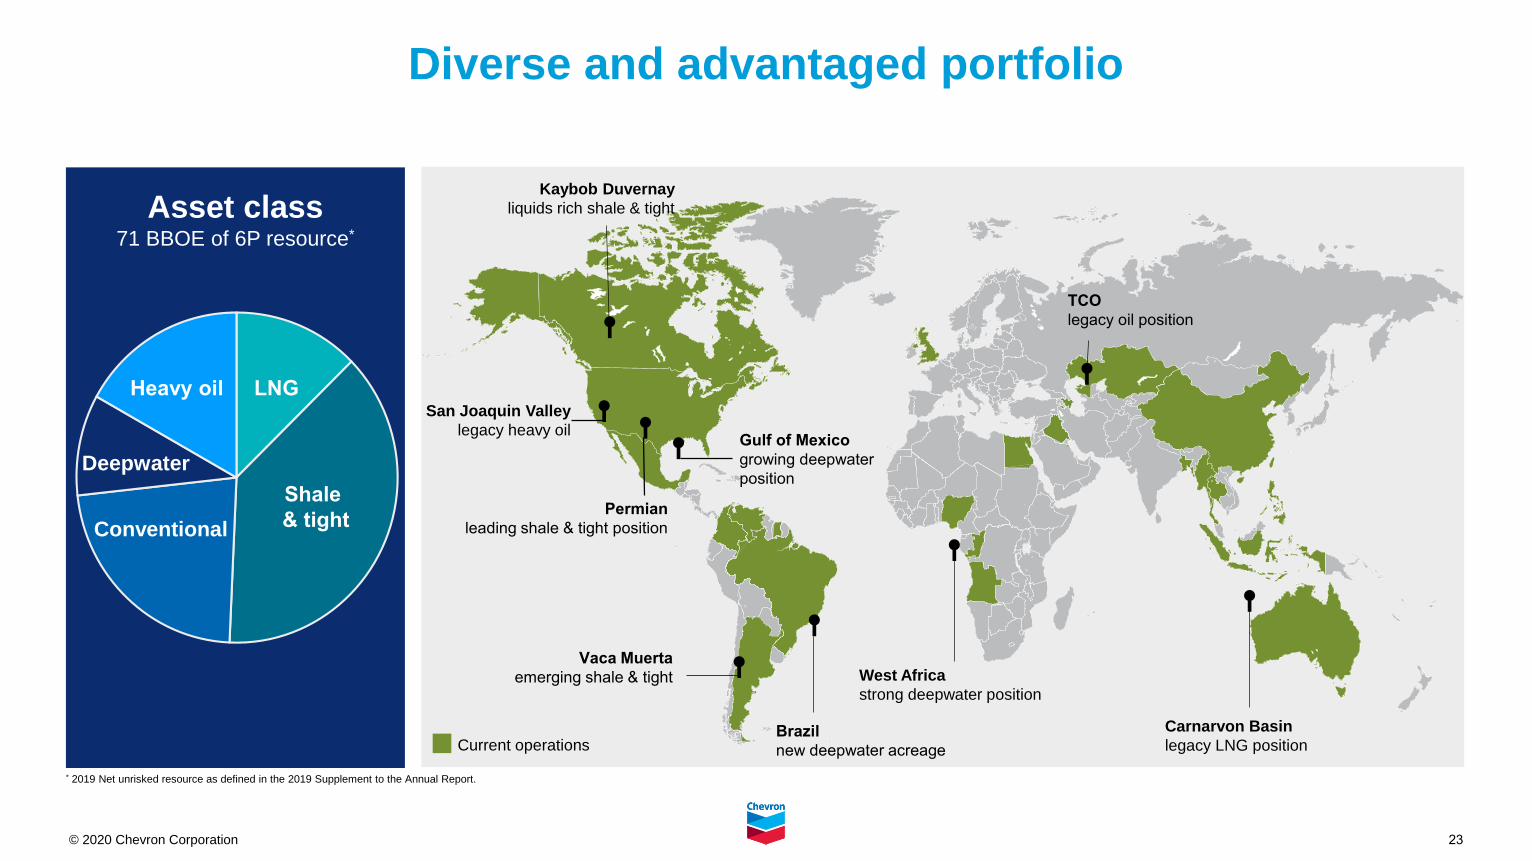
Diverse and advantaged portfolio
Asset class 71 BBOE of 6P resource*
Current operations
TCO
legacy oil position
Permian
leading shale & tight position
Gulf of Mexico
growing deepwater
position
San Joaquin Valley
legacy heavy oil
West Africa
strong deepwater position
Vaca Muerta
emerging shale & tight
Carnarvon Basin
legacy LNG position
Kaybob Duvernay
liquids rich shale & tight
Brazil
new deepwater acreage
LNG
Shale
& tightConventional
Deepwater
Heavy oil
* 2019 Net unrisked resource as defined in the 2019 Supplement to the Annual Report.
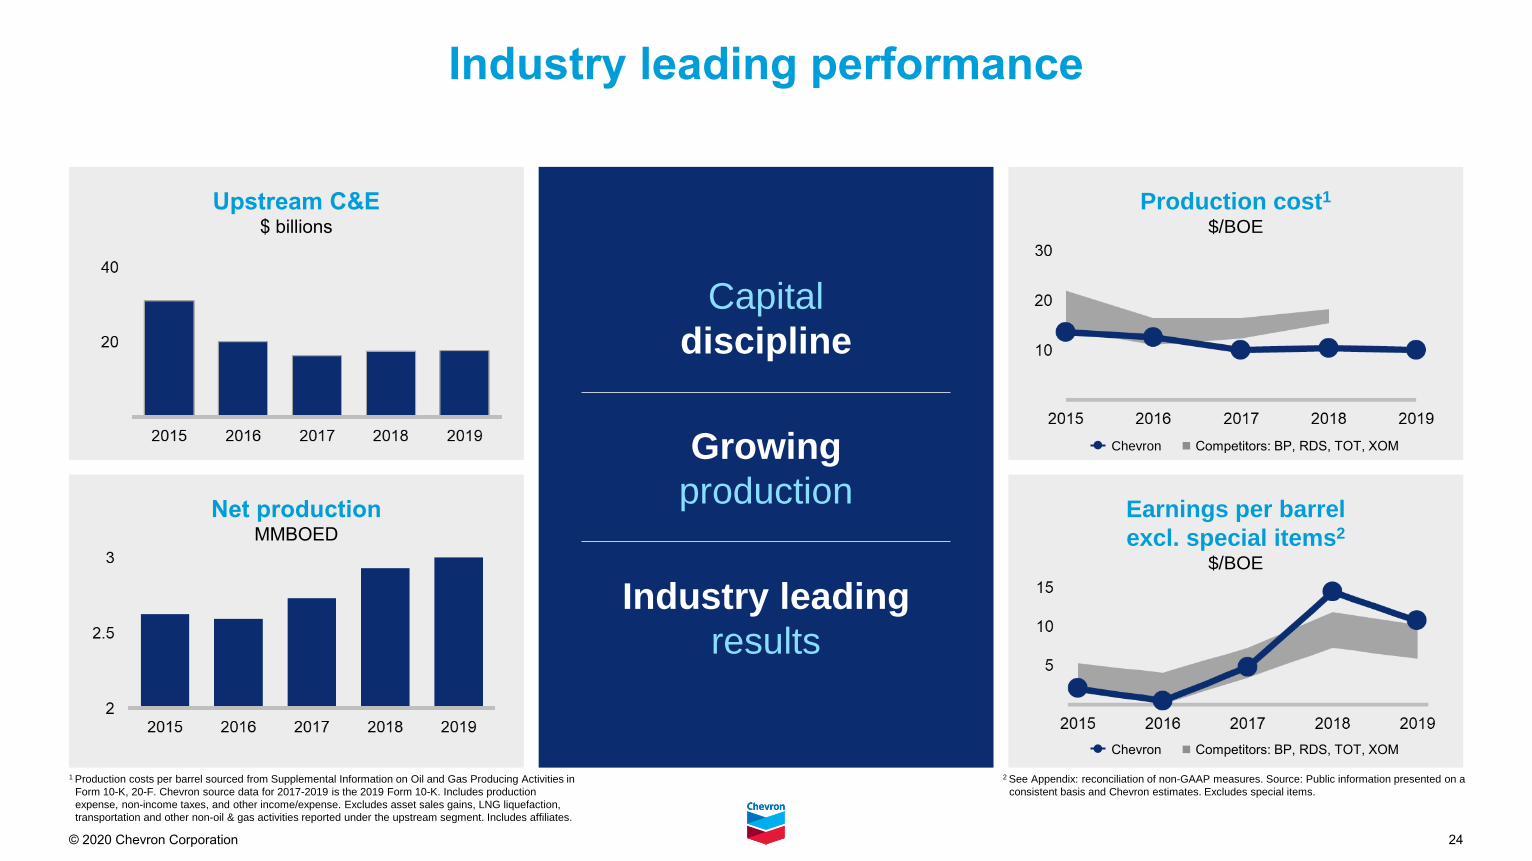
24© 2020 Chevron Corporation
Upstream C&E$ billions
Industry leading performance
Production cost1
$/BOE
Capital
discipline
Growing
production
Industry leading
results
Net productionMMBOED
Earnings per barrel
excl. special items2
$/BOE
Chevron ◼︎ Competitors: BP, RDS, TOT, XOM
Chevron ◼︎ Competitors: BP, RDS, TOT, XOM
1 Production costs per barrel sourced from Supplemental Information on Oil and Gas Producing Activities in
Form 10-K, 20-F. Chevron source data for 2017-2019 is the 2019 Form 10-K. Includes production
expense, non-income taxes, and other income/expense. Excludes asset sales gains, LNG liquefaction,
transportation and other non-oil & gas activities reported under the upstream segment. Includes affiliates.
2 See Appendix: reconciliation of non-GAAP measures. Source: Public information presented on a
consistent basis and Chevron estimates. Excludes special items.
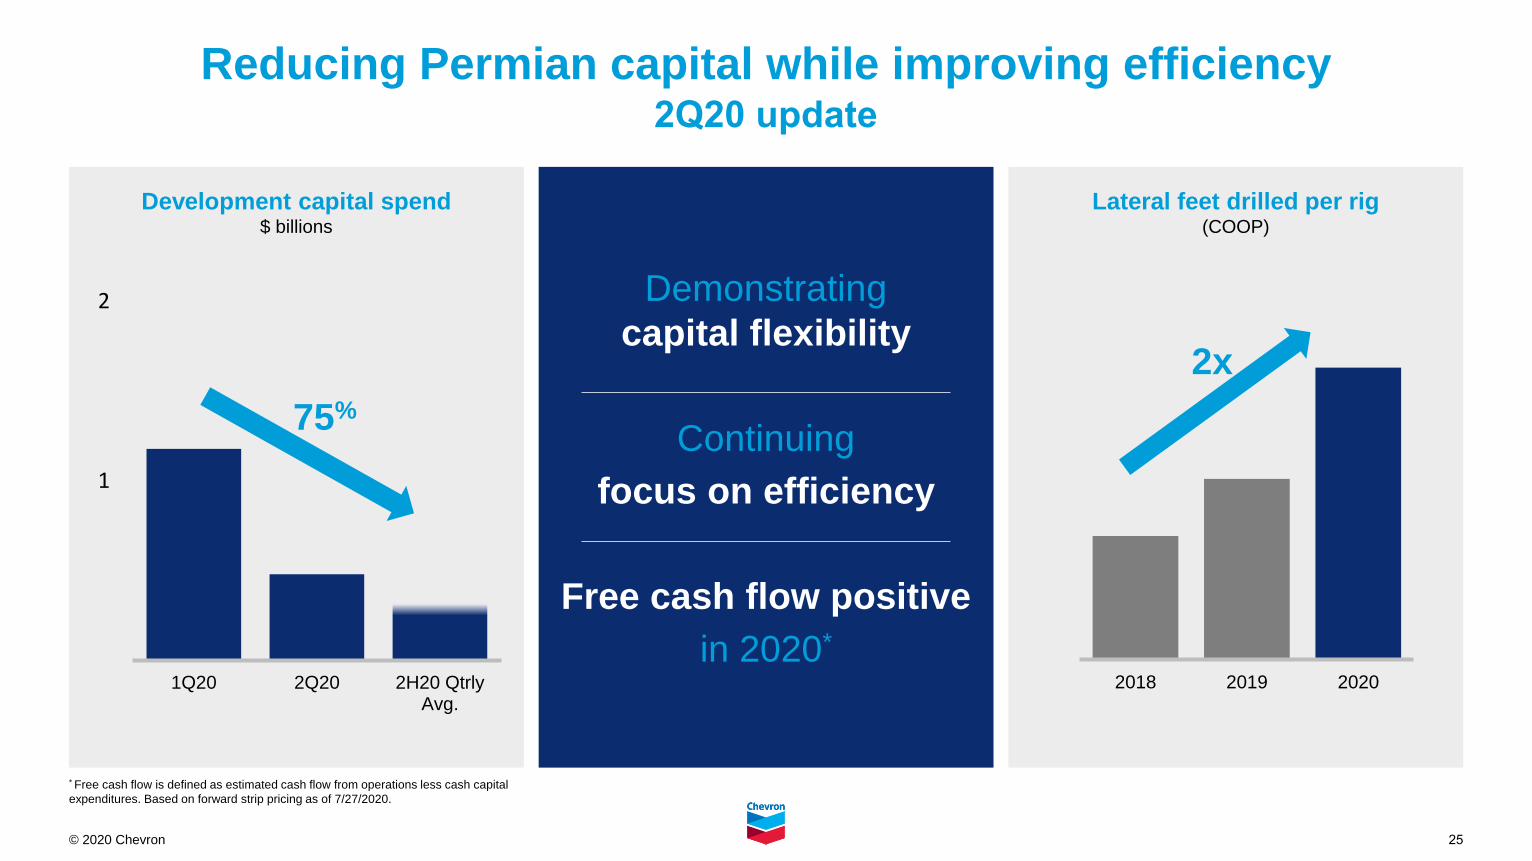
25© 2020 Chevron
Development capital spend$ billions
Reducing Permian capital while improving efficiency2Q20 update
Demonstrating
capital flexibility
Continuing
focus on efficiency
Free cash flow positive
in 2020*
Lateral feet drilled per rig(COOP)
2018 2019 2020
1
2
1Q20 2Q20 2H20 QtrlyAvg.
2x
* Free cash flow is defined as estimated cash flow from operations less cash capital
expenditures. Based on forward strip pricing as of 7/27/2020.
75%
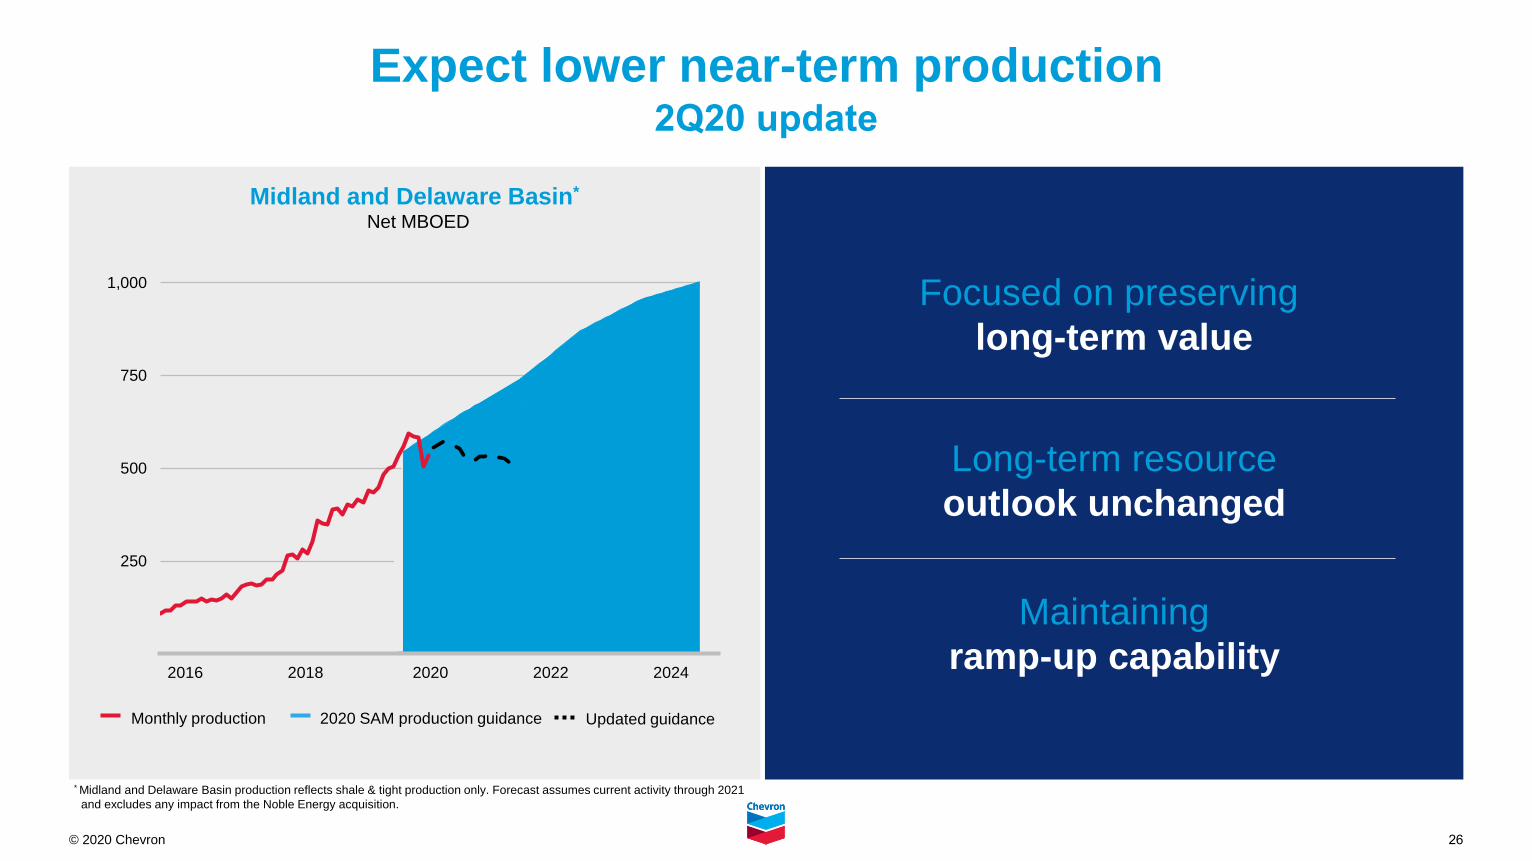
26© 2020 Chevron
Focused on preserving
long-term value
Long-term resource
outlook unchanged
Maintaining
ramp-up capability
Expect lower near-term production2Q20 update
* Midland and Delaware Basin production reflects shale & tight production only. Forecast assumes current activity through 2021
and excludes any impact from the Noble Energy acquisition.
Midland and Delaware Basin*
Net MBOED
250
500
750
1,000
2016 2018 2020 2022 2024
Monthly production 2020 SAM production guidance Updated guidance
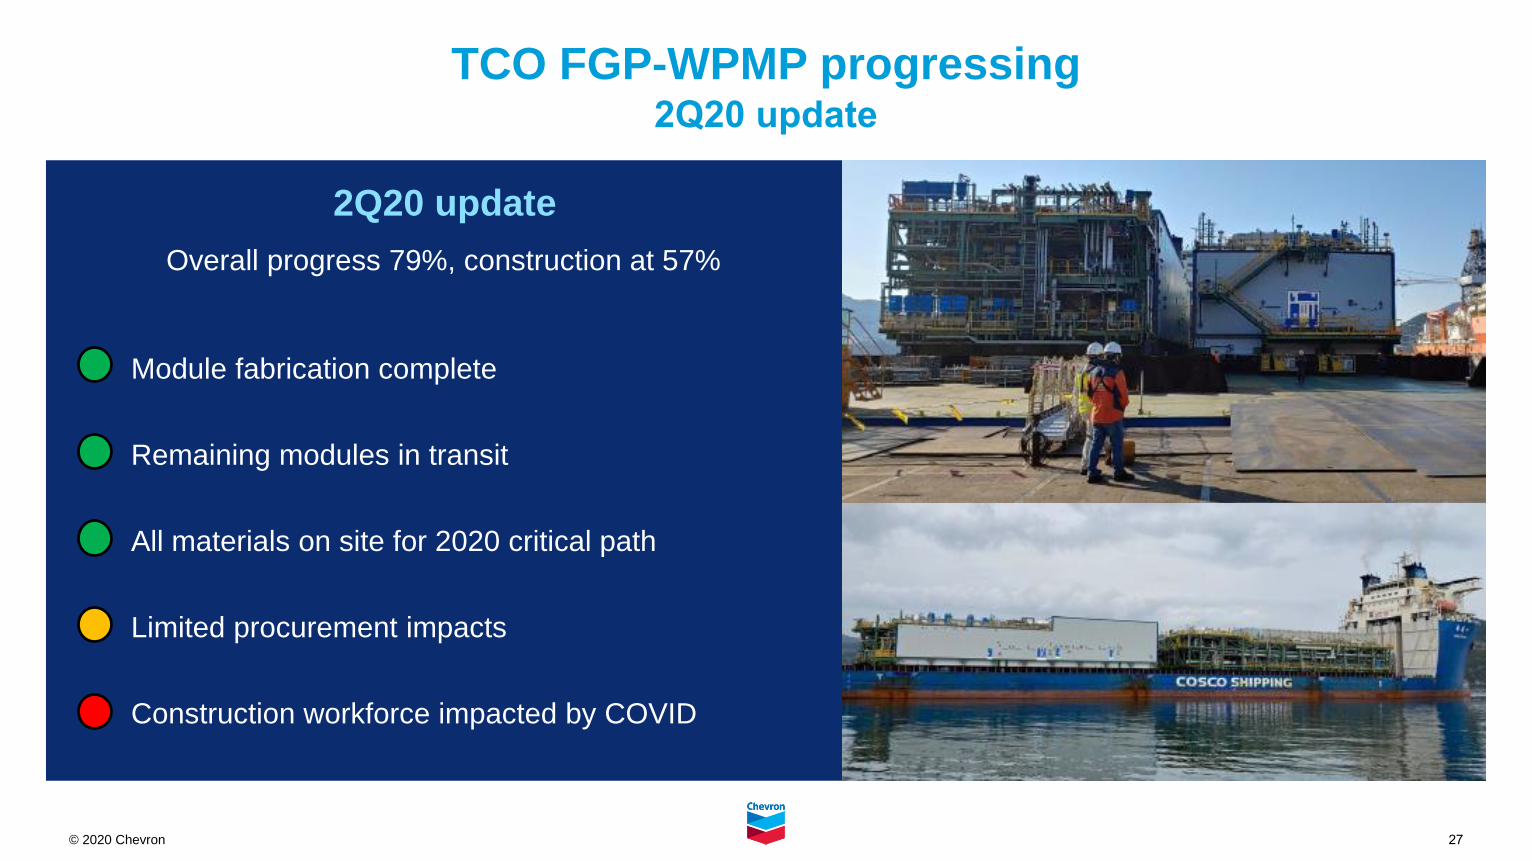
© 2020 Chevron
TCO FGP-WPMP progressing2Q20 update
2Q20 update
Module fabrication complete
Remaining modules in transit
All materials on site for 2020 critical path
Limited procurement impacts
Construction workforce impacted by COVID
Overall progress 79%, construction at 57%
27
© 2020 Chevron
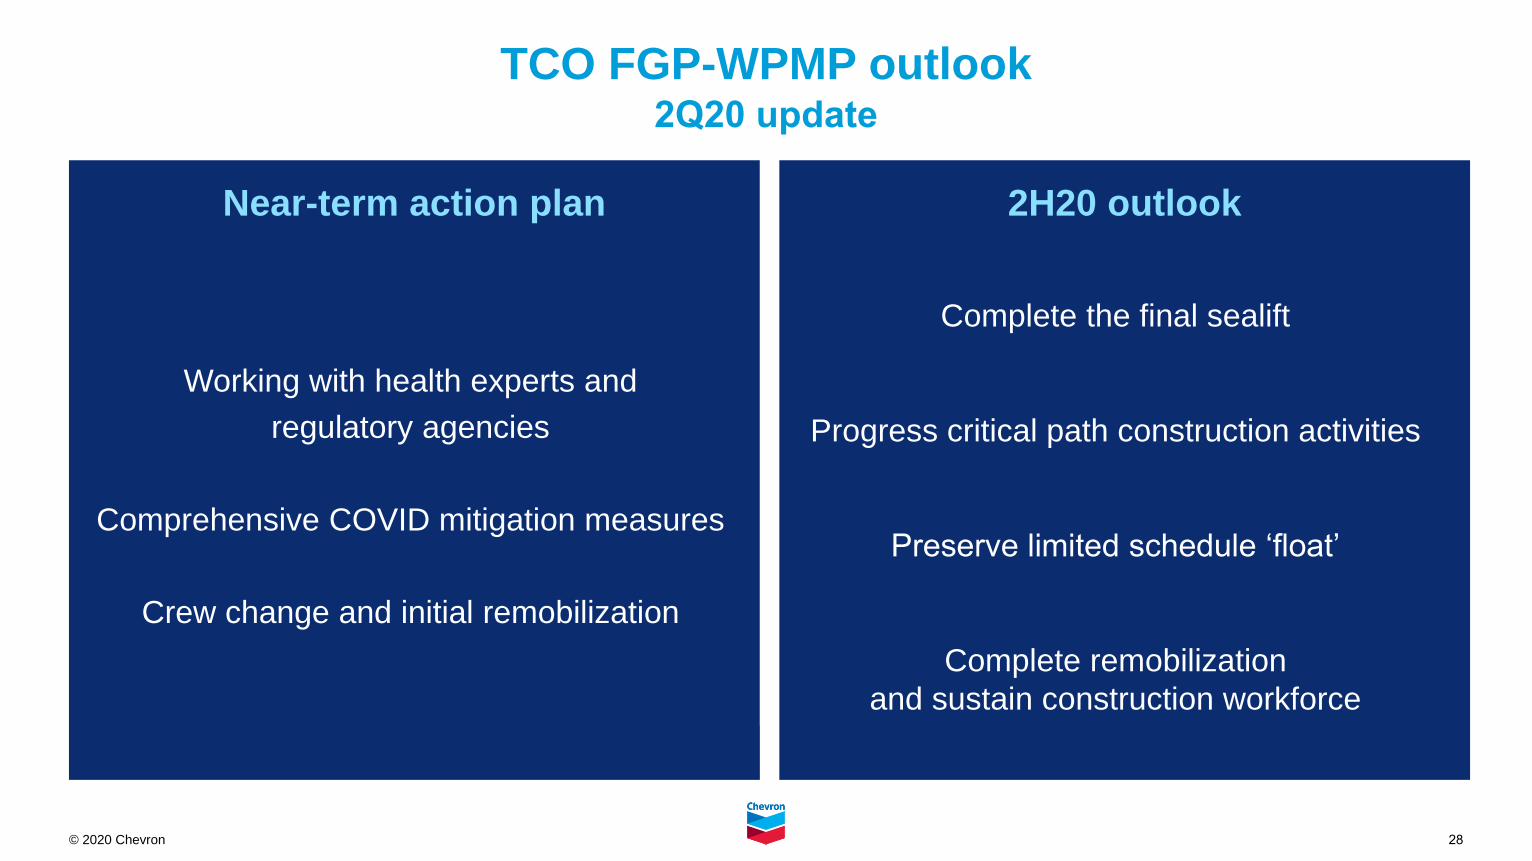
TCO FGP-WPMP outlook2Q20 update
Near-term action plan 2H20 outlook
Working with health experts and
regulatory agencies
Comprehensive COVID mitigation measures
Crew change and initial remobilization
Complete the final sealift
Progress critical path construction activities
Preserve limited schedule ‘float’
Complete remobilization
and sustain construction workforce
28
29© 2020 Chevron Corporation
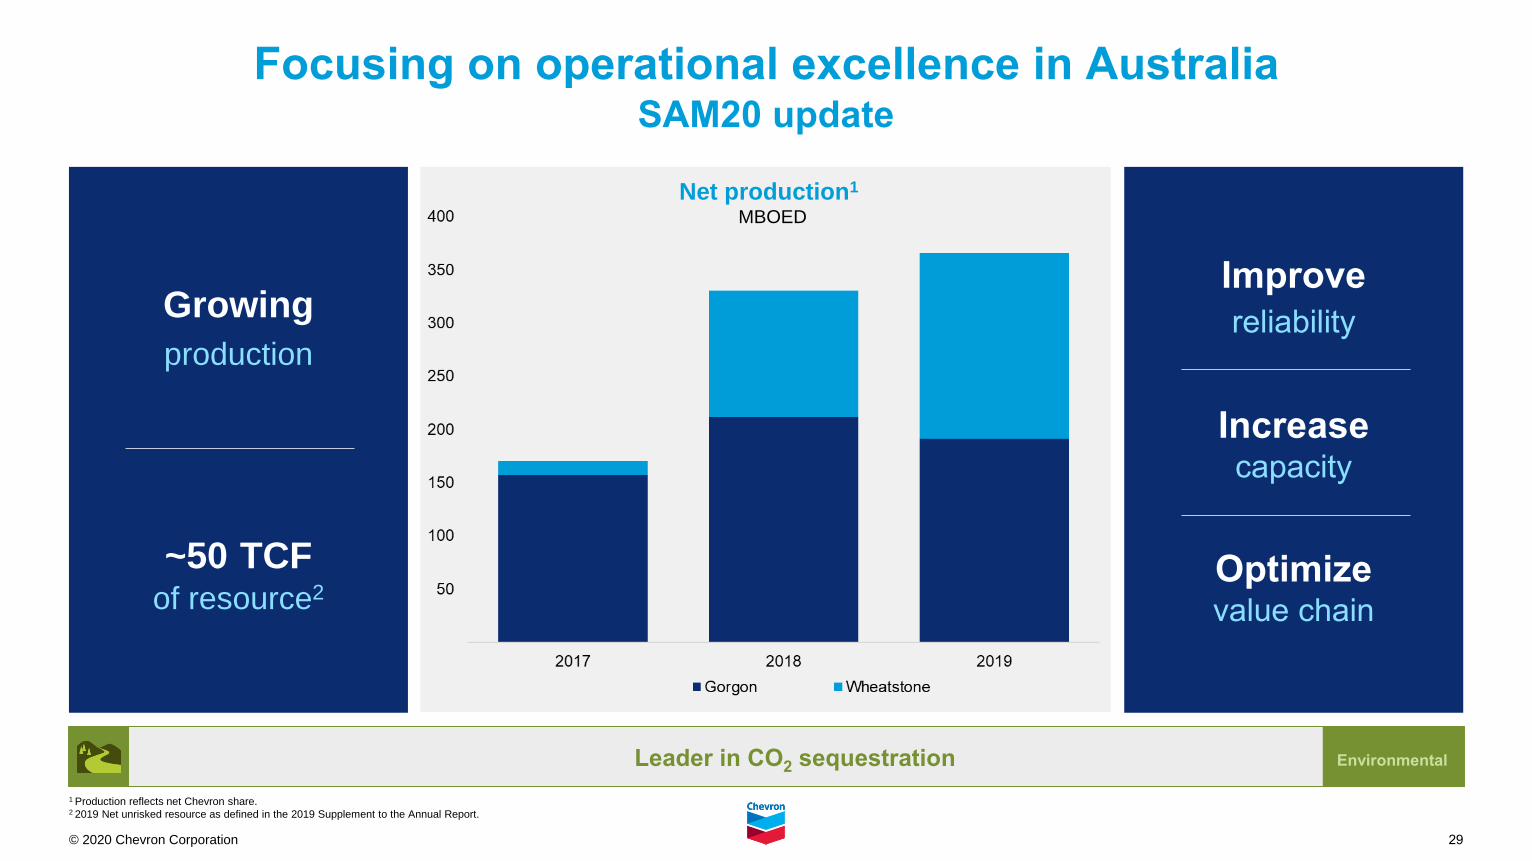
Focusing on operational excellence in AustraliaSAM20 update
Growing
production
~50 TCF of resource2
Improve
reliability
Increasecapacity
Optimizevalue chain
Leader in CO2 sequestration Environmental
Net production1
MBOED
1 Production reflects net Chevron share.2 2019 Net unrisked resource as defined in the 2019 Supplement to the Annual Report.
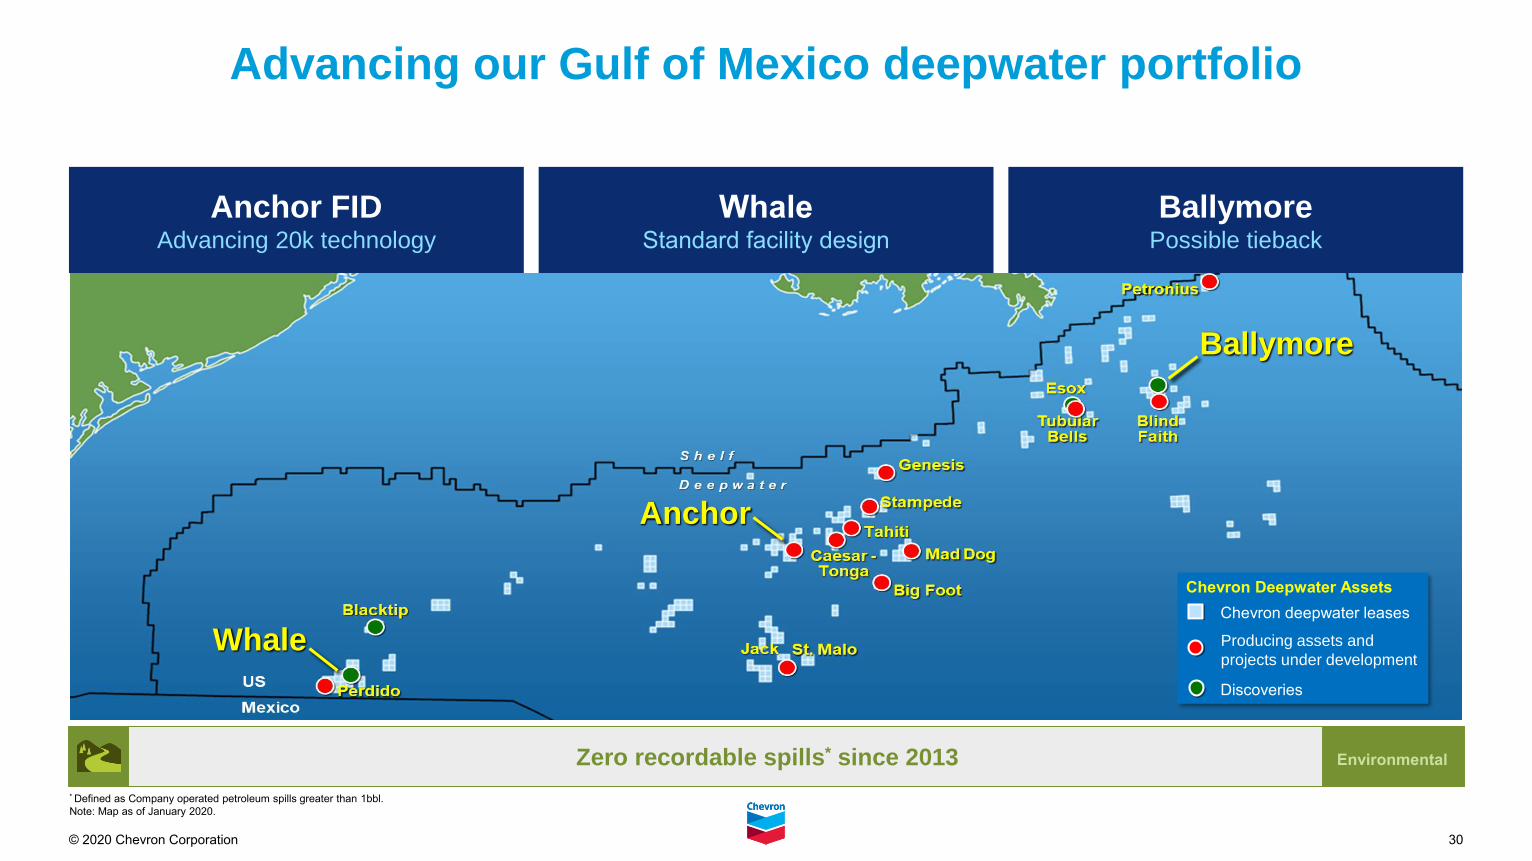
30© 2020 Chevron Corporation
Advancing our Gulf of Mexico deepwater portfolio
Anchor FIDAdvancing 20k technology
BallymorePossible tieback
WhaleStandard facility design
Zero recordable spills* since 2013 Environmental
Ballymore
Whale
Anchor
Chevron deepwater leases
Producing assets and
projects under development
Chevron Deepwater Assets
Discoveries
* Defined as Company operated petroleum spills greater than 1bbl.
Note: Map as of January 2020.
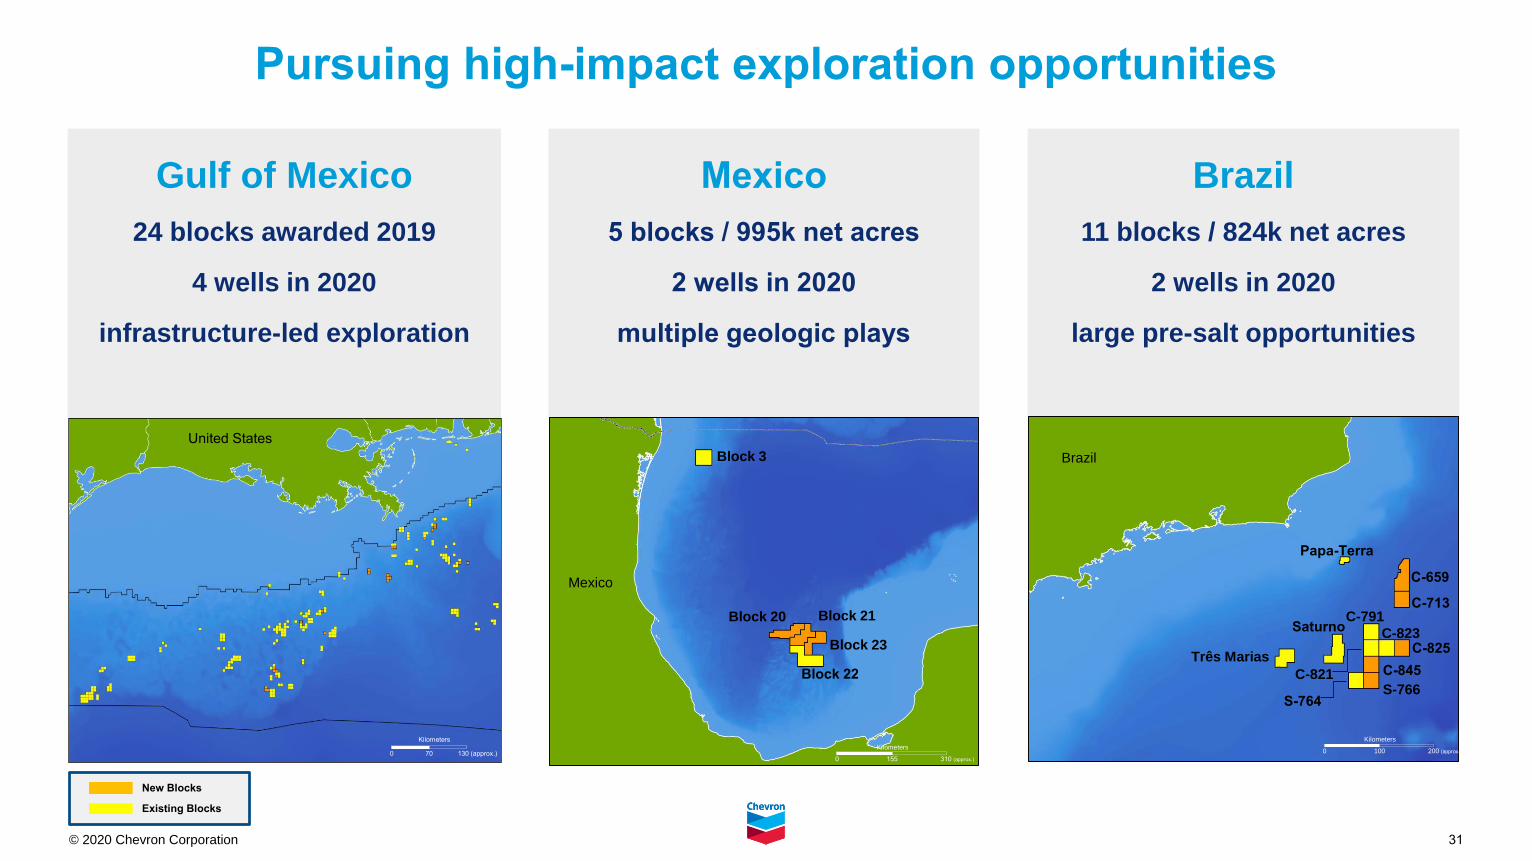
31© 2020 Chevron Corporation
Brazil
11 blocks / 824k net acres
2 wells in 2020
large pre-salt opportunities
Mexico
5 blocks / 995k net acres
2 wells in 2020
multiple geologic plays
Gulf of Mexico
24 blocks awarded 2019
4 wells in 2020
infrastructure-led exploration
Pursuing high-impact exploration opportunities
New Blocks
Existing Blocks
Block 23
Block 21Block 20
Block 22
Block 3
C-659
C-713
C-825C-823
C-791
C-821 C-845
S-766S-764
Papa-Terra
Saturno
Três Marias
Brazil
Mexico
United States
0 70 130 (approx.)
Kilometers Kilometers
0 100 200 (approx.)Kilometers
0 155 310 (approx.)
32© 2020 Chevron Corporation
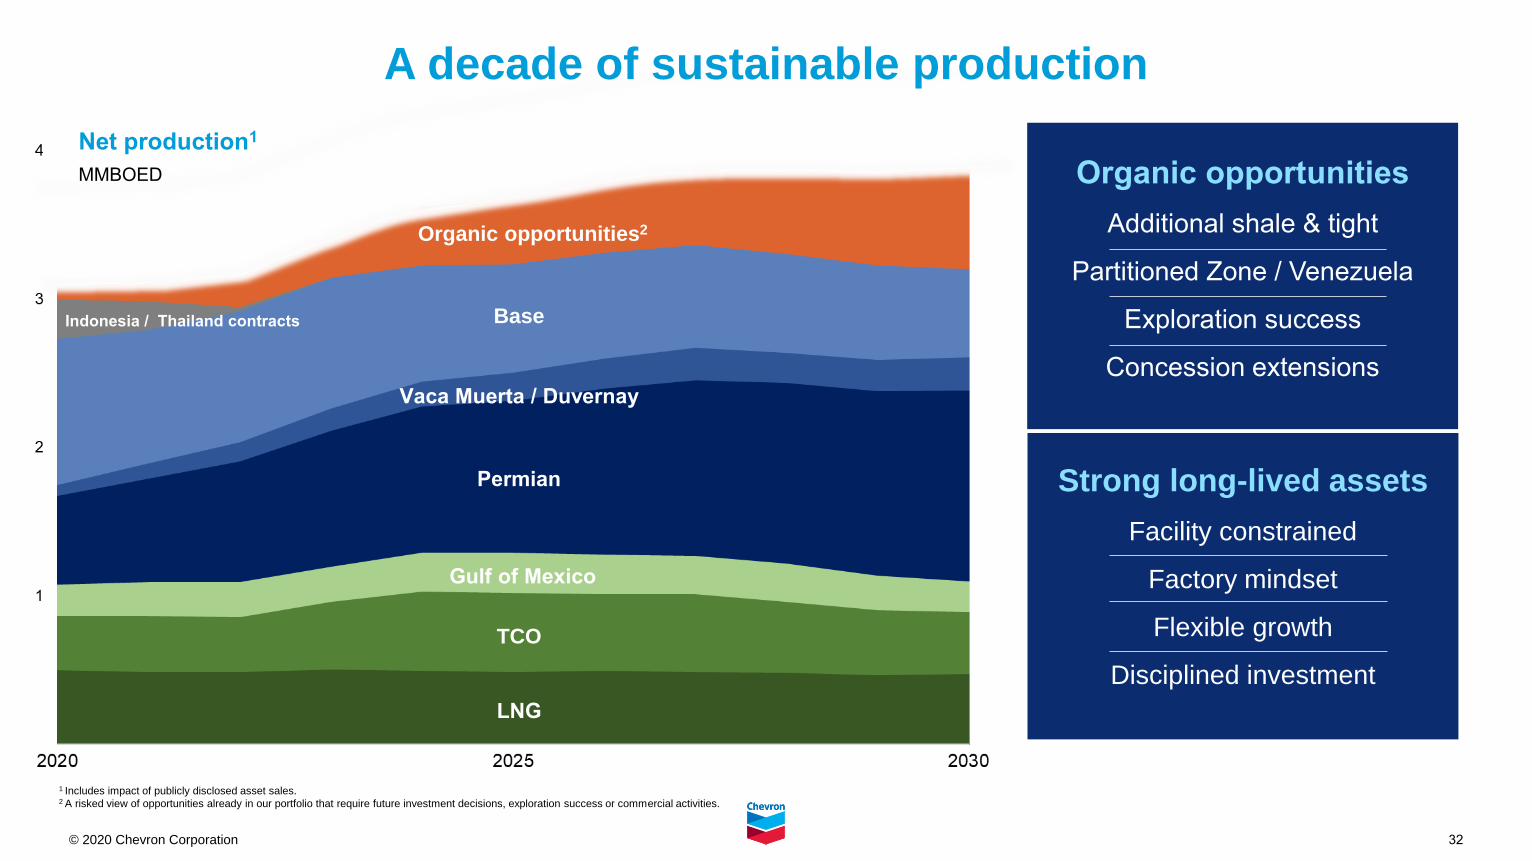
A decade of sustainable production
LNG
TCO
Permian
Vaca Muerta / Duvernay
Gulf of Mexico
Base
Organic opportunities2
Strong long-lived assets
Facility constrained
Factory mindset
Flexible growth
Disciplined investment
Organic opportunities
Additional shale & tight
Partitioned Zone / Venezuela
Exploration success
Concession extensions
1 Includes impact of publicly disclosed asset sales. 2 A risked view of opportunities already in our portfolio that require future investment decisions, exploration success or commercial activities.
Indonesia / Thailand contracts
Net production1
MMBOED
© 2020 Chevron Corporation
Downstream & Chemicals
34© 2020 Chevron Corporation
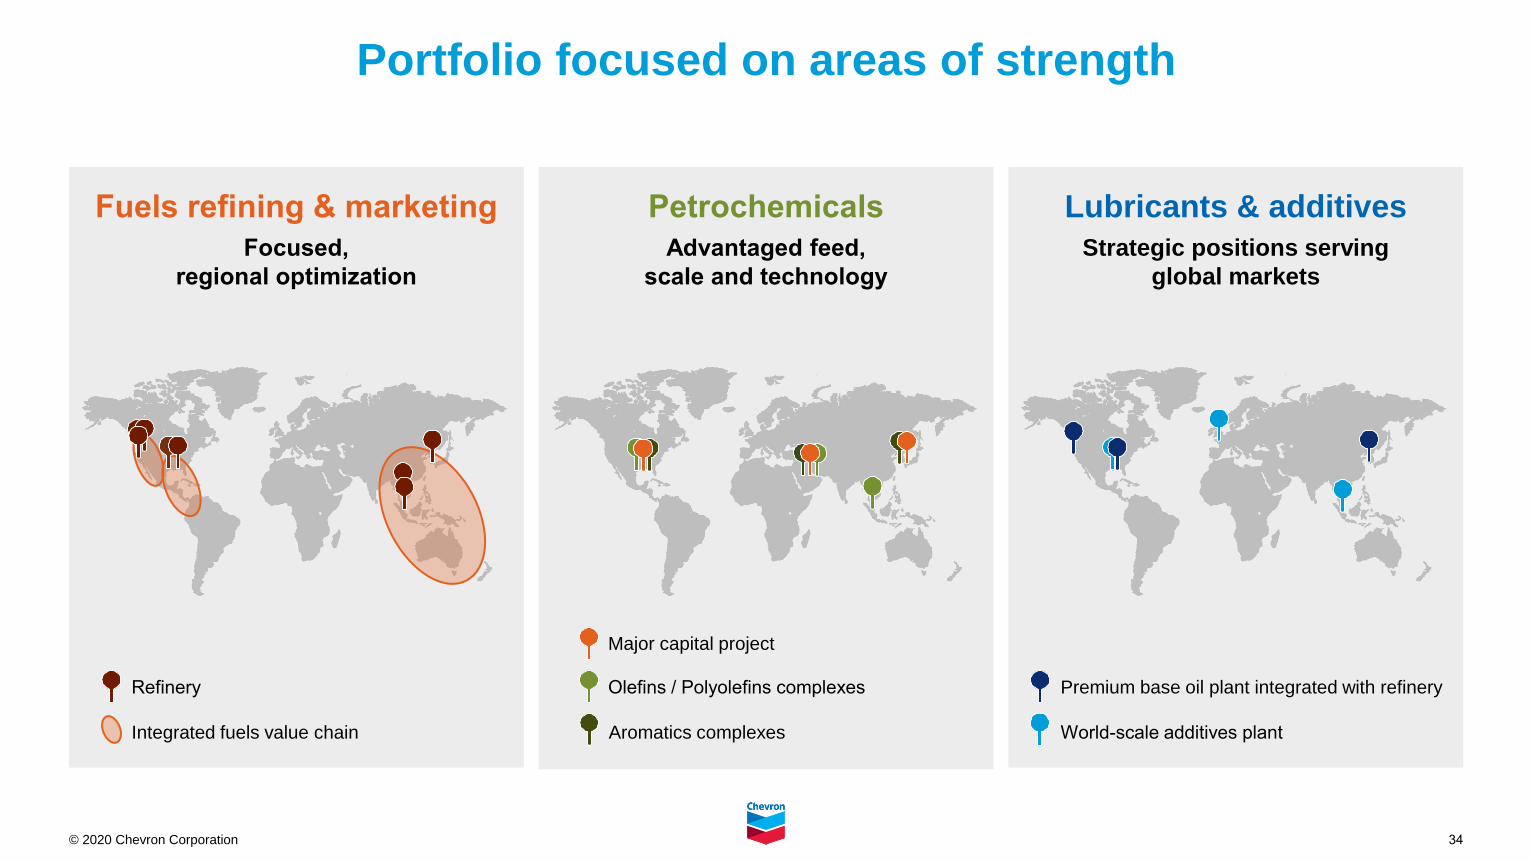
Portfolio focused on areas of strength
Fuels refining & marketing
Focused,
regional optimization
Lubricants & additives
Strategic positions serving
global markets
Petrochemicals
Advantaged feed,
scale and technology
Refinery
Integrated fuels value chain World-scale additives plant
Premium base oil plant integrated with refinery
Aromatics complexes
Olefins / Polyolefins complexes
Major capital project
35© 2020 Chevron Corporation
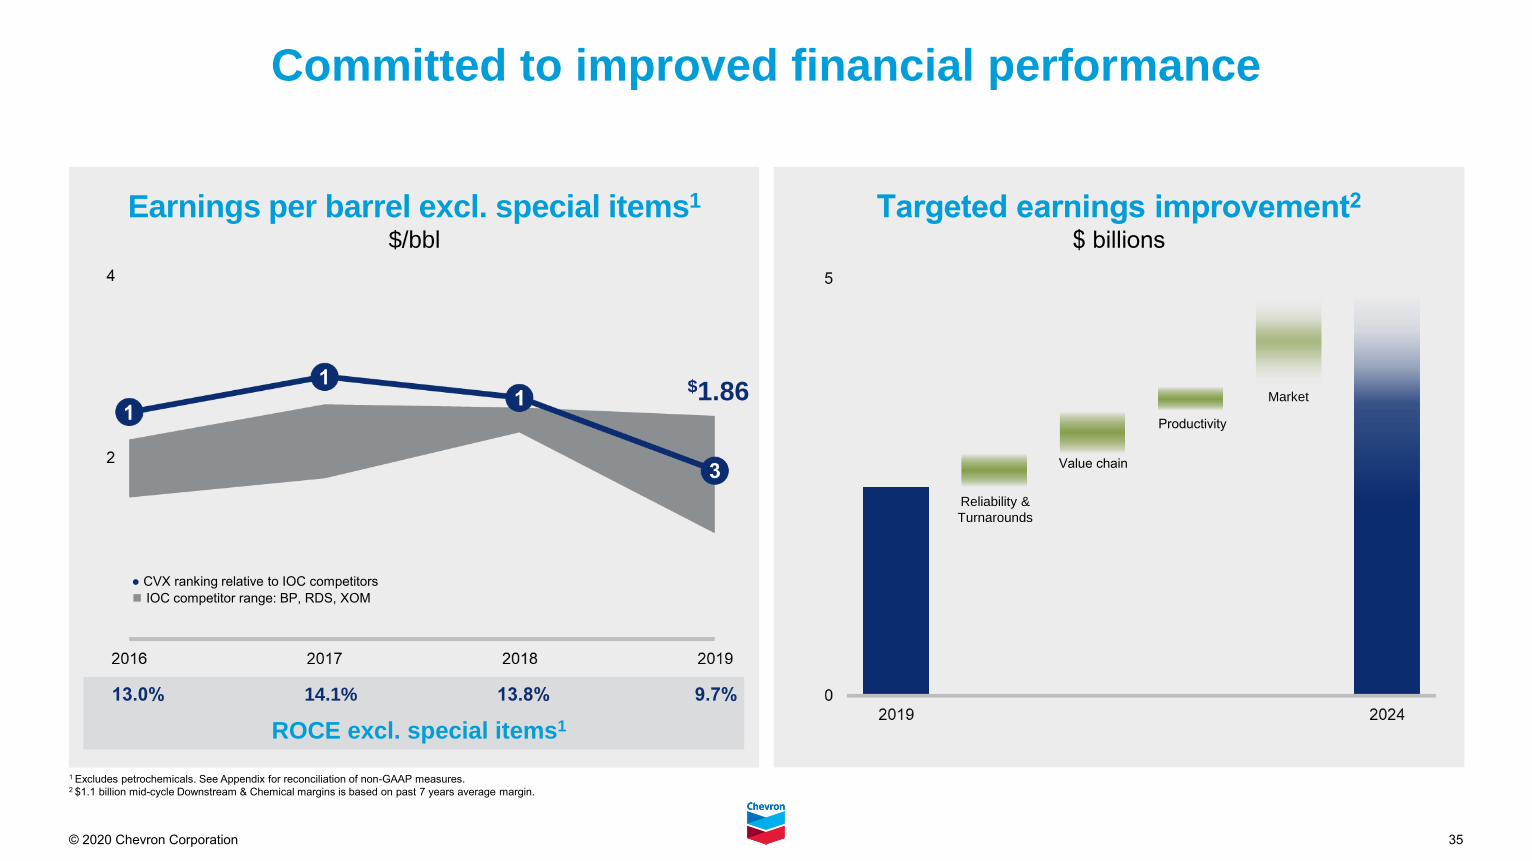
Earnings per barrel excl. special items1
$/bbl
Targeted earnings improvement2
$ billions
Committed to improved financial performance
13.8%14.1%13.0% 9.7%
ROCE excl. special items1
● CVX ranking relative to IOC competitors
◼︎ IOC competitor range: BP, RDS, XOM
$1.86
Reliability &
Turnarounds
Productivity
Market
Value chain
1 Excludes petrochemicals. See Appendix for reconciliation of non-GAAP measures.2 $1.1 billion mid-cycle Downstream & Chemical margins is based on past 7 years average margin.
36© 2020 Chevron Corporation
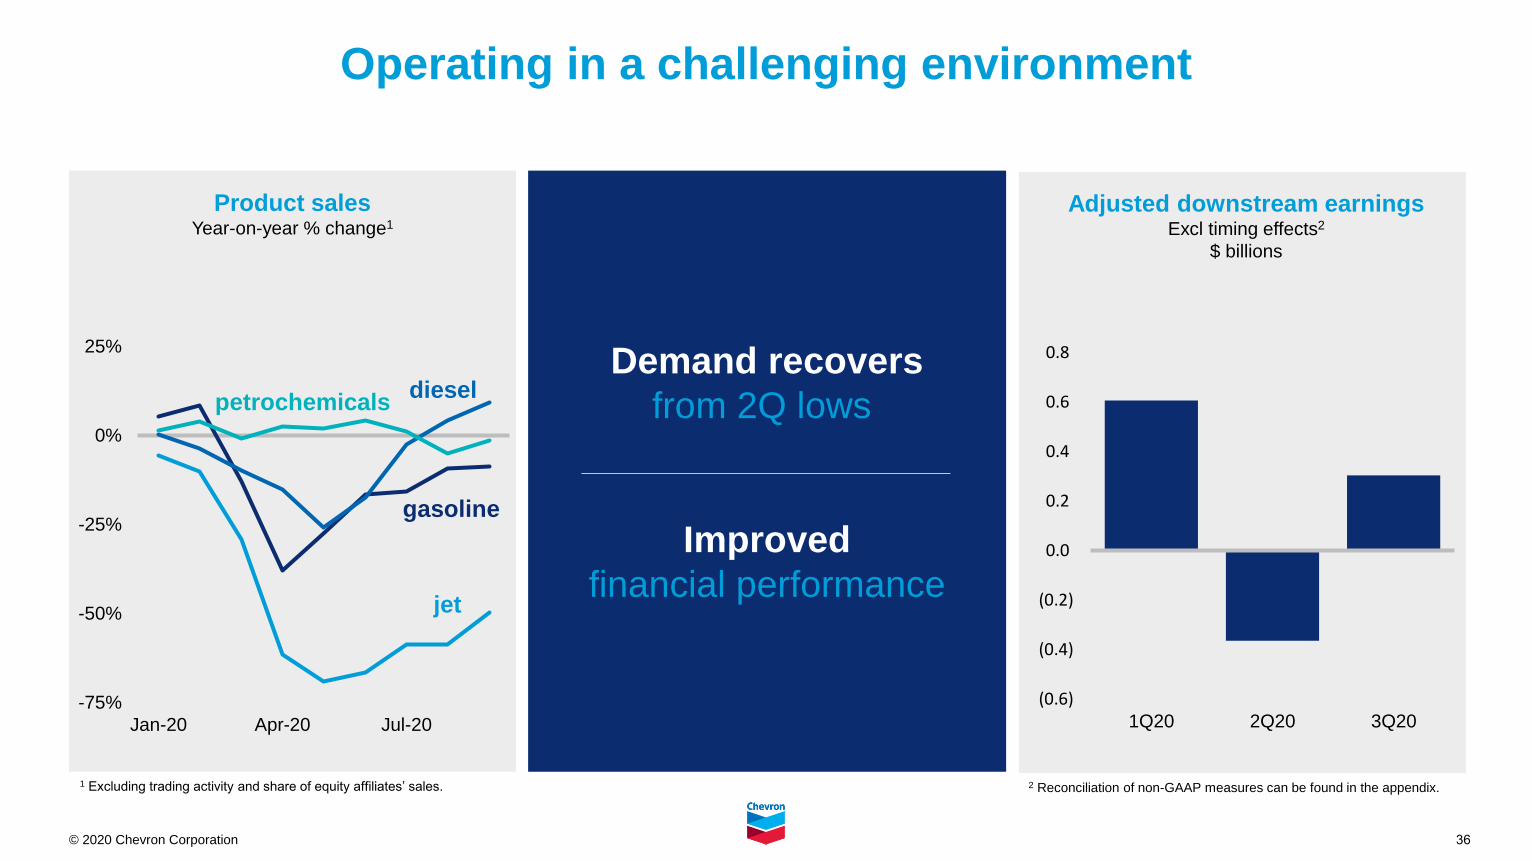
Demand recovers
from 2Q lows
Improved
financial performance
Adjusted downstream earningsExcl timing effects2
$ billions
(0.6)
(0.4)
(0.2)
0.0
0.2
0.4
0.6
0.8
1Q20 2Q20 3Q20-75%
-50%
-25%
0%
25%
Jan-20 Apr-20 Jul-20
jet
diesel
gasoline
petrochemicals
Product salesYear-on-year % change1
1 Excluding trading activity and share of equity affiliates’ sales. 2 Reconciliation of non-GAAP measures can be found in the appendix.
Operating in a challenging environment
37© 2020 Chevron Corporation
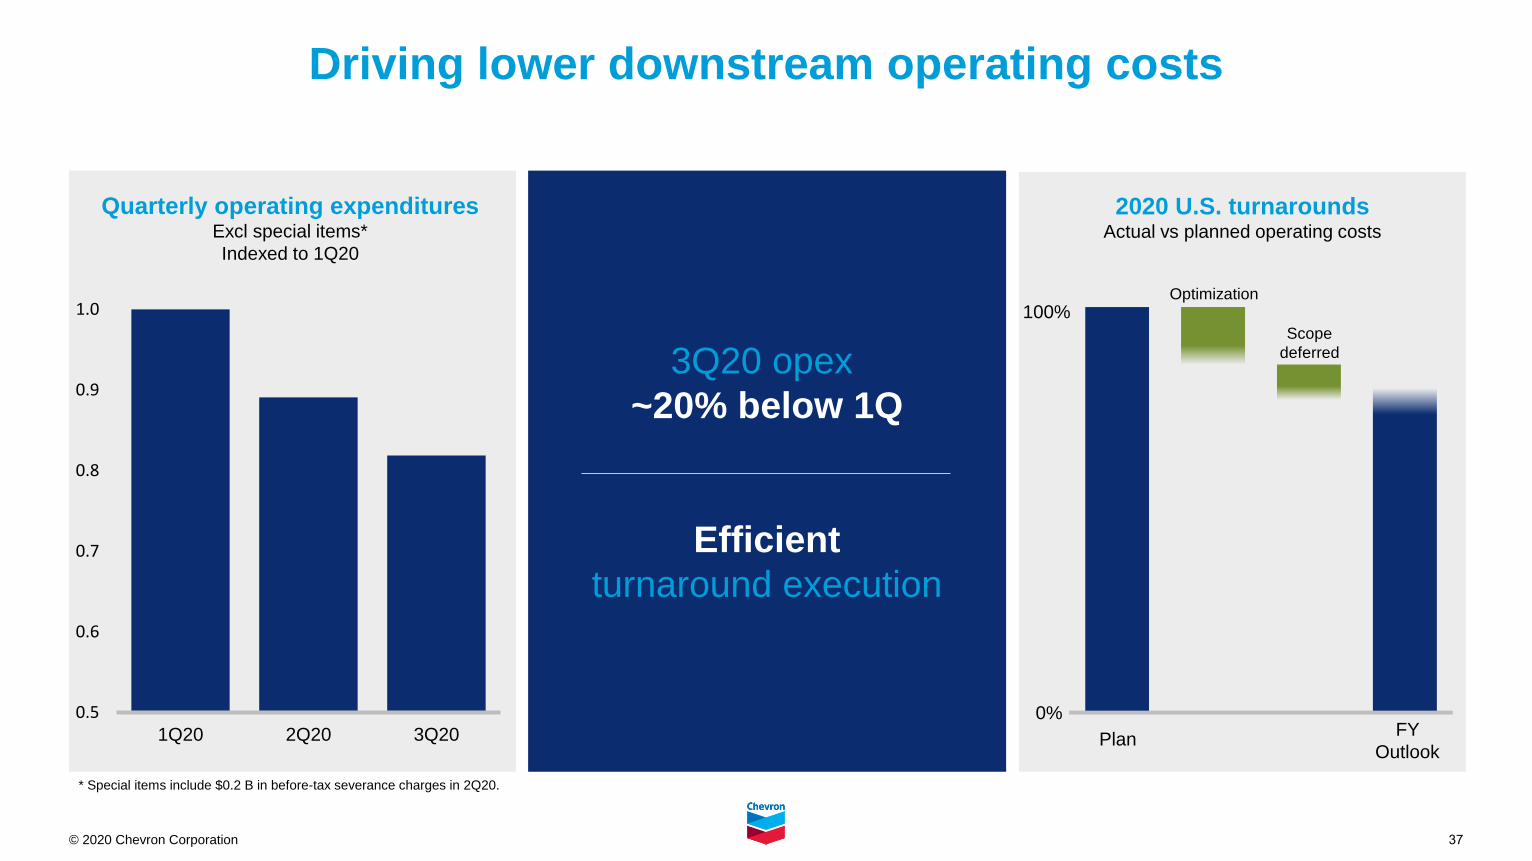
2020 U.S. turnaroundsActual vs planned operating costs
Driving lower downstream operating costs
3Q20 opex
~20% below 1Q
Efficient
turnaround execution
Quarterly operating expendituresExcl special items*
Indexed to 1Q20
0.5
0.6
0.7
0.8
0.9
1.0
1Q20 2Q20 3Q20
* Special items include $0.2 B in before-tax severance charges in 2Q20.
100%
0%
PlanFY
Outlook
Scope
deferred
Optimization
38© 2020 Chevron Corporation
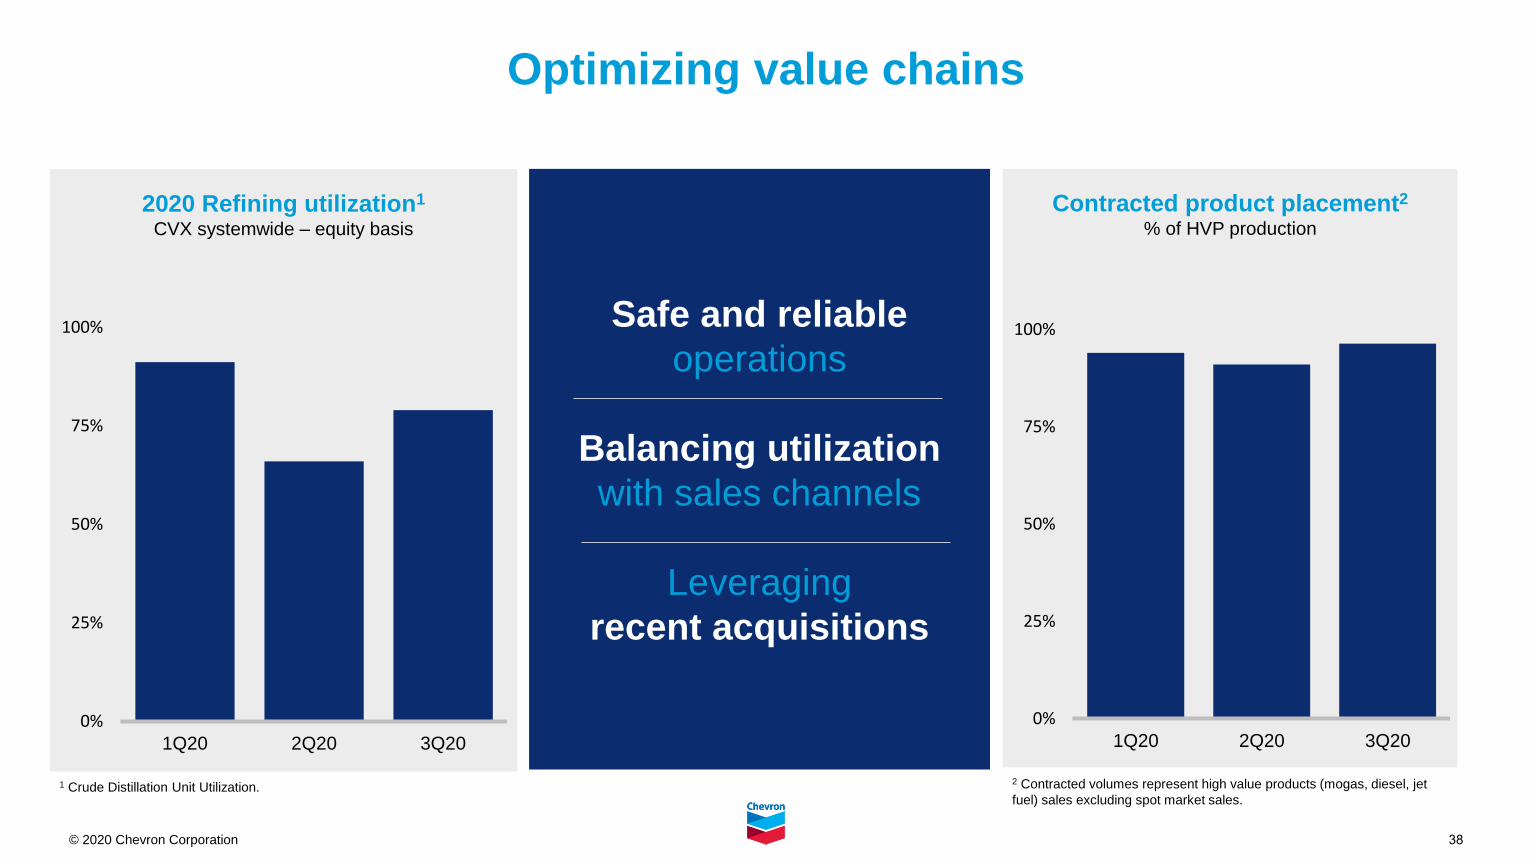
Optimizing value chains
2020 Refining utilization1
CVX systemwide – equity basis
Safe and reliable
operations
Balancing utilization
with sales channels
Leveraging
recent acquisitions
Contracted product placement2
% of HVP production
0%
25%
50%
75%
100%
1Q20 2Q20 3Q20
2 Contracted volumes represent high value products (mogas, diesel, jet
fuel) sales excluding spot market sales.
0%
25%
50%
75%
100%
1Q20 2Q20 3Q20
1 Crude Distillation Unit Utilization.
39© 2020 Chevron Corporation
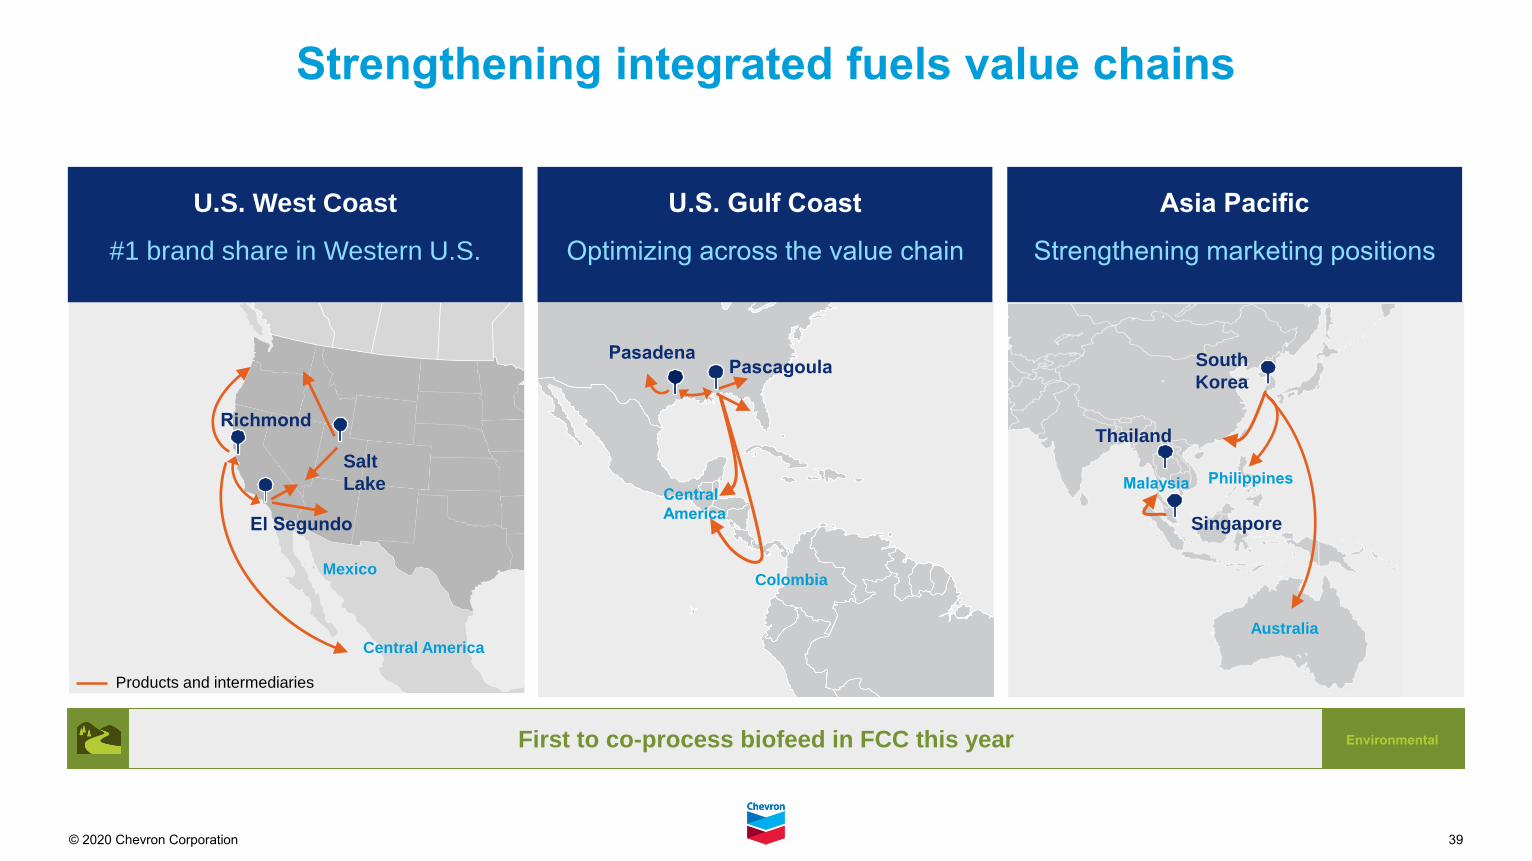
First to co-process biofeed in FCC this year
Strengthening integrated fuels value chains
Richmond
Salt
Lake
El Segundo
Central America
Mexico
Central
America
Colombia
PascagoulaPasadena South
Korea
Malaysia
Thailand
Singapore
Philippines
U.S. West Coast
#1 brand share in Western U.S.
Asia Pacific
Strengthening marketing positions
U.S. Gulf Coast
Optimizing across the value chain
Australia
Environmental
Products and intermediaries
40© 2020 Chevron Corporation
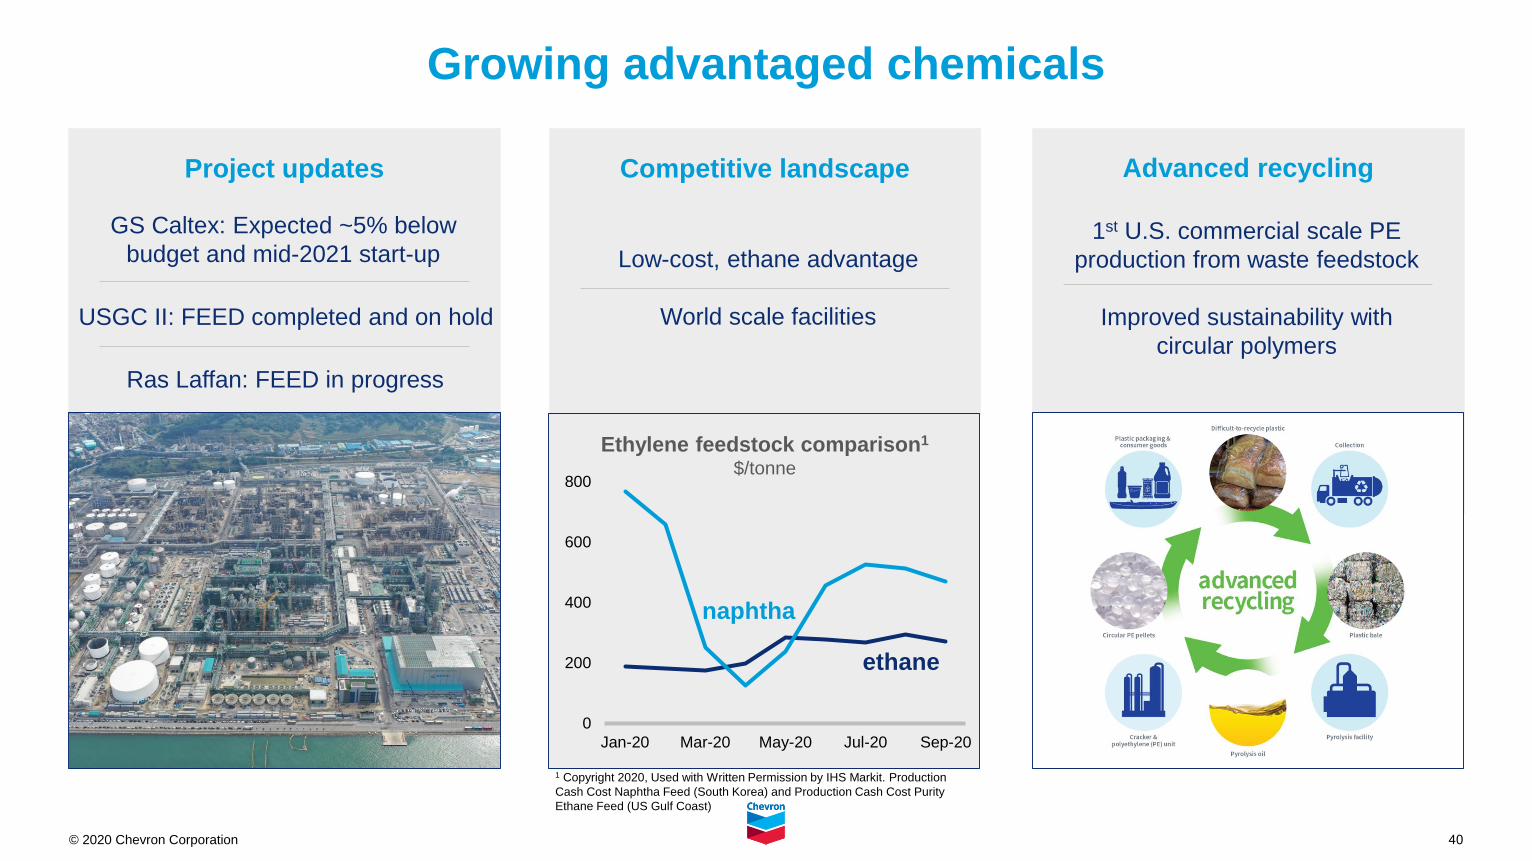
Advanced recycling
Growing advantaged chemicals
Competitive landscapeProject updates
GS Caltex: Expected ~5% below
budget and mid-2021 start-up1st U.S. commercial scale PE
production from waste feedstock
Improved sustainability with
circular polymers
USGC II: FEED completed and on hold
Ras Laffan: FEED in progress
Low-cost, ethane advantage
World scale facilities
1 Copyright 2020, Used with Written Permission by IHS Markit. Production
Cash Cost Naphtha Feed (South Korea) and Production Cash Cost Purity
Ethane Feed (US Gulf Coast)
0
200
400
600
800
Jan-20 Mar-20 May-20 Jul-20 Sep-20
Ethylene feedstock comparison1
$/tonne
naphtha
ethane
41© 2020 Chevron Corporation
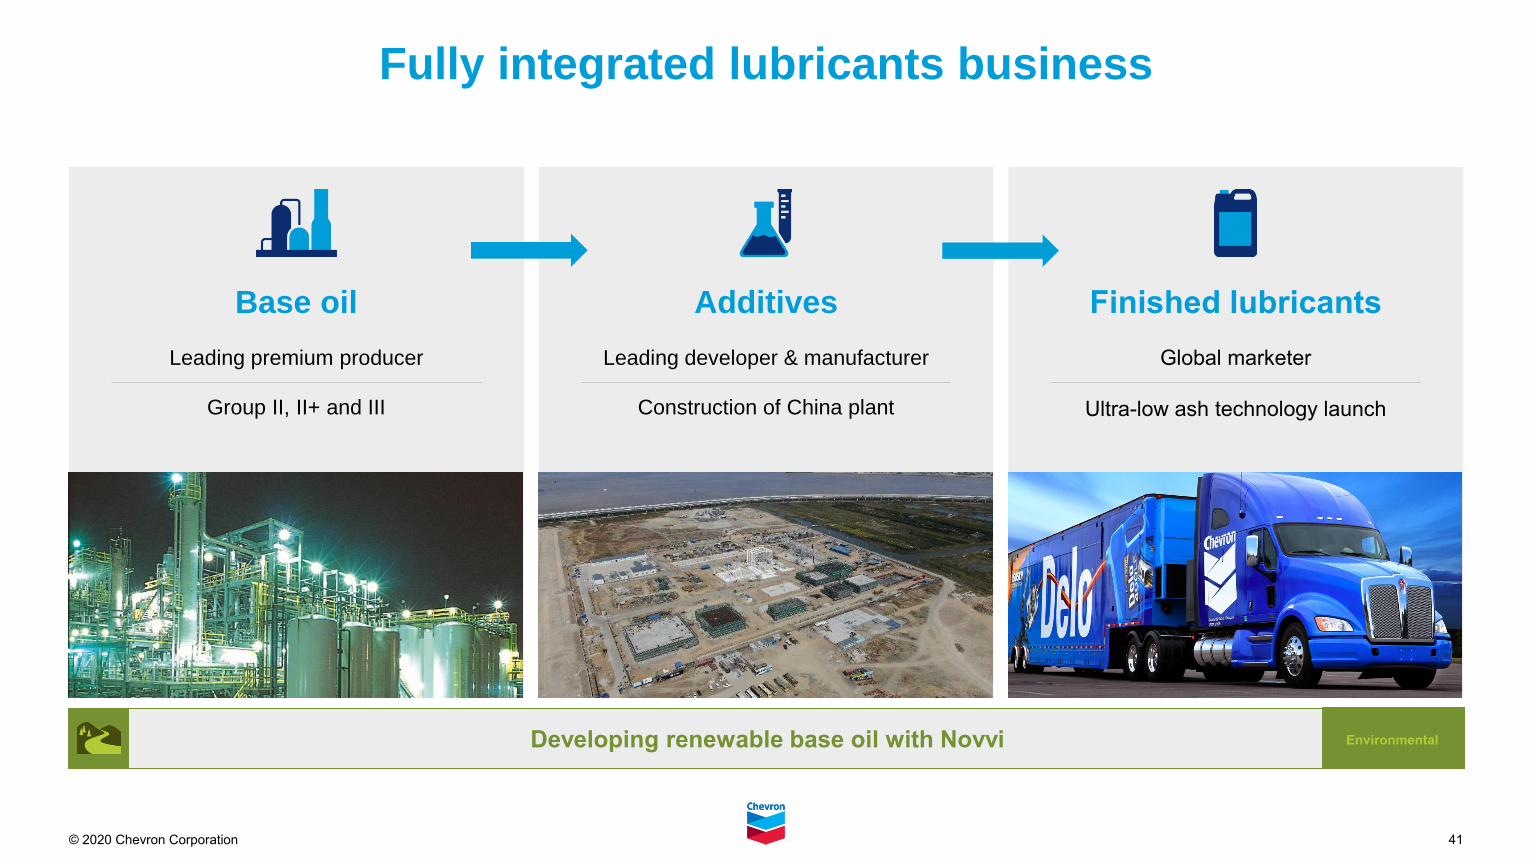
Fully integrated lubricants business
Base oil
Leading premium producer
Group II, II+ and III
Finished lubricants
Global marketer
Ultra-low ash technology launch
Additives
Leading developer & manufacturer
Construction of China plant
Developing renewable base oil with Novvi Environmental
42© 2020 Chevron Corporation
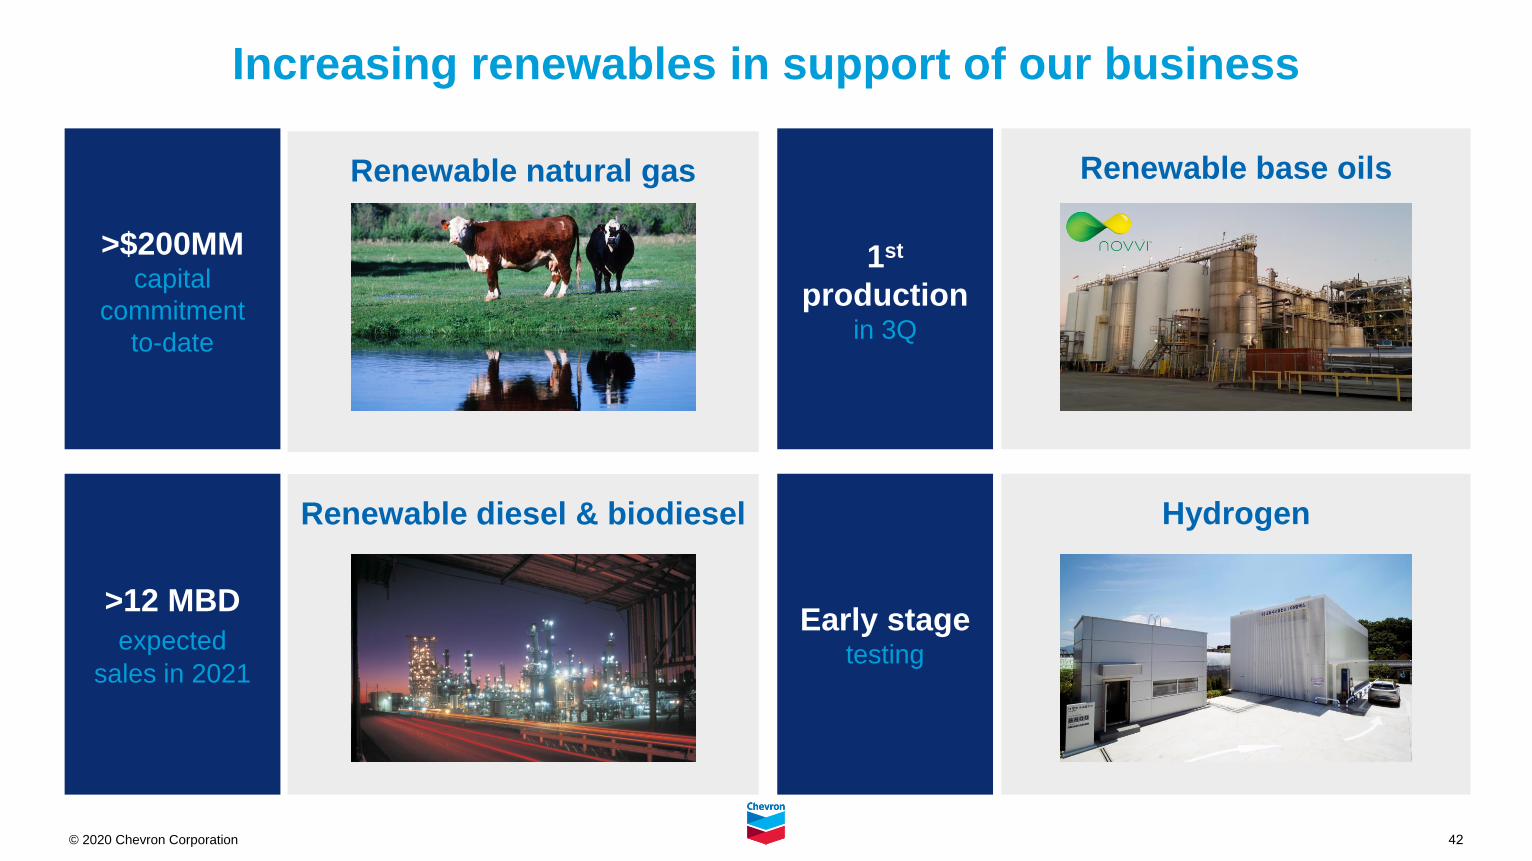
Increasing renewables in support of our business
Renewable natural gas
Renewable diesel & biodiesel
>$200MMcapital
commitment
to-date
>12 MBD
expected
sales in 2021
Hydrogen
Renewable base oils
1st
production in 3Q
Early stage testing

© 2020 Chevron Corporation
Finance and ESG overview
44© 2020 Chevron Corporation
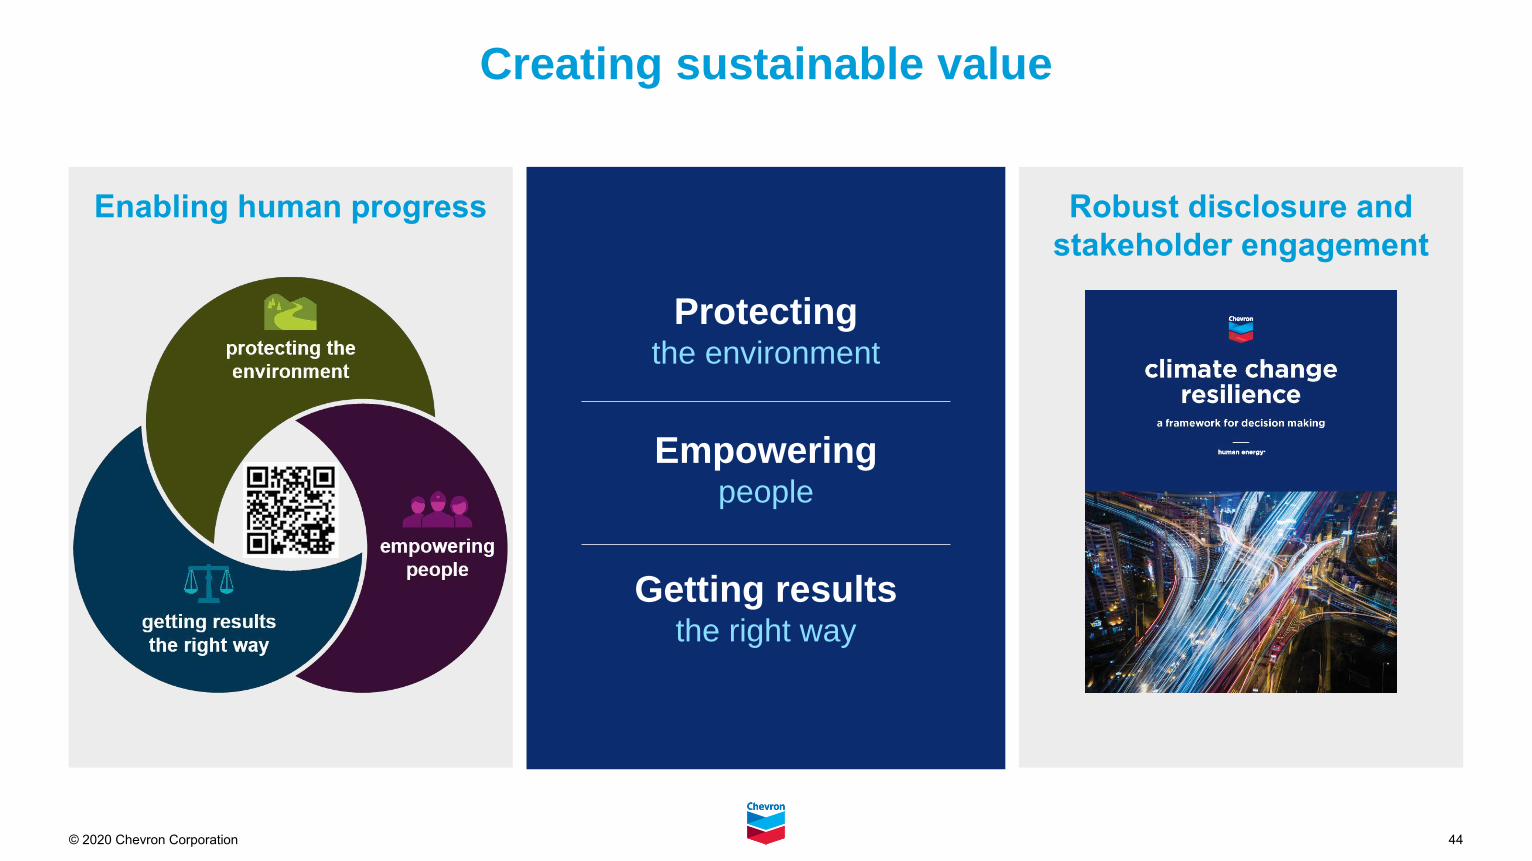
Creating sustainable value
Enabling human progress Robust disclosure and
stakeholder engagement
Protectingthe environment
Empoweringpeople
Getting resultsthe right way
45© 2020 Chevron Corporation
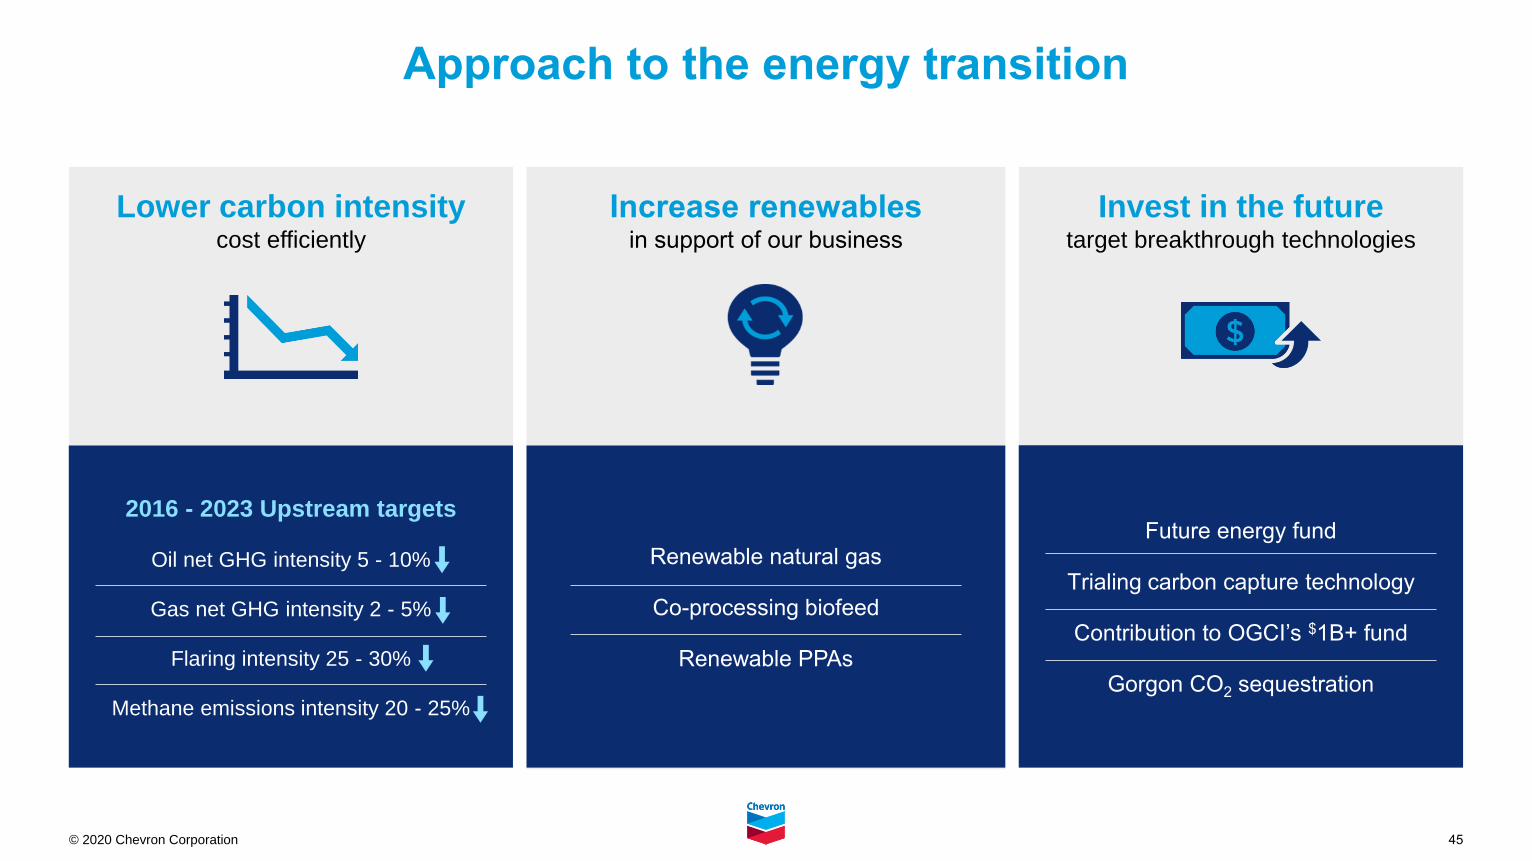
Approach to the energy transition
Lower carbon intensitycost efficiently
Invest in the futuretarget breakthrough technologies
Increase renewablesin support of our business
Renewable natural gas
Co-processing biofeed
Renewable PPAs
2016 - 2023 Upstream targets
Oil net GHG intensity 5 - 10%
Gas net GHG intensity 2 - 5%
Flaring intensity 25 - 30%
Methane emissions intensity 20 - 25%
Future energy fund
Trialing carbon capture technology
Contribution to OGCI’s $1B+ fund
Gorgon CO2 sequestration
46© 2020 Chevron Corporation
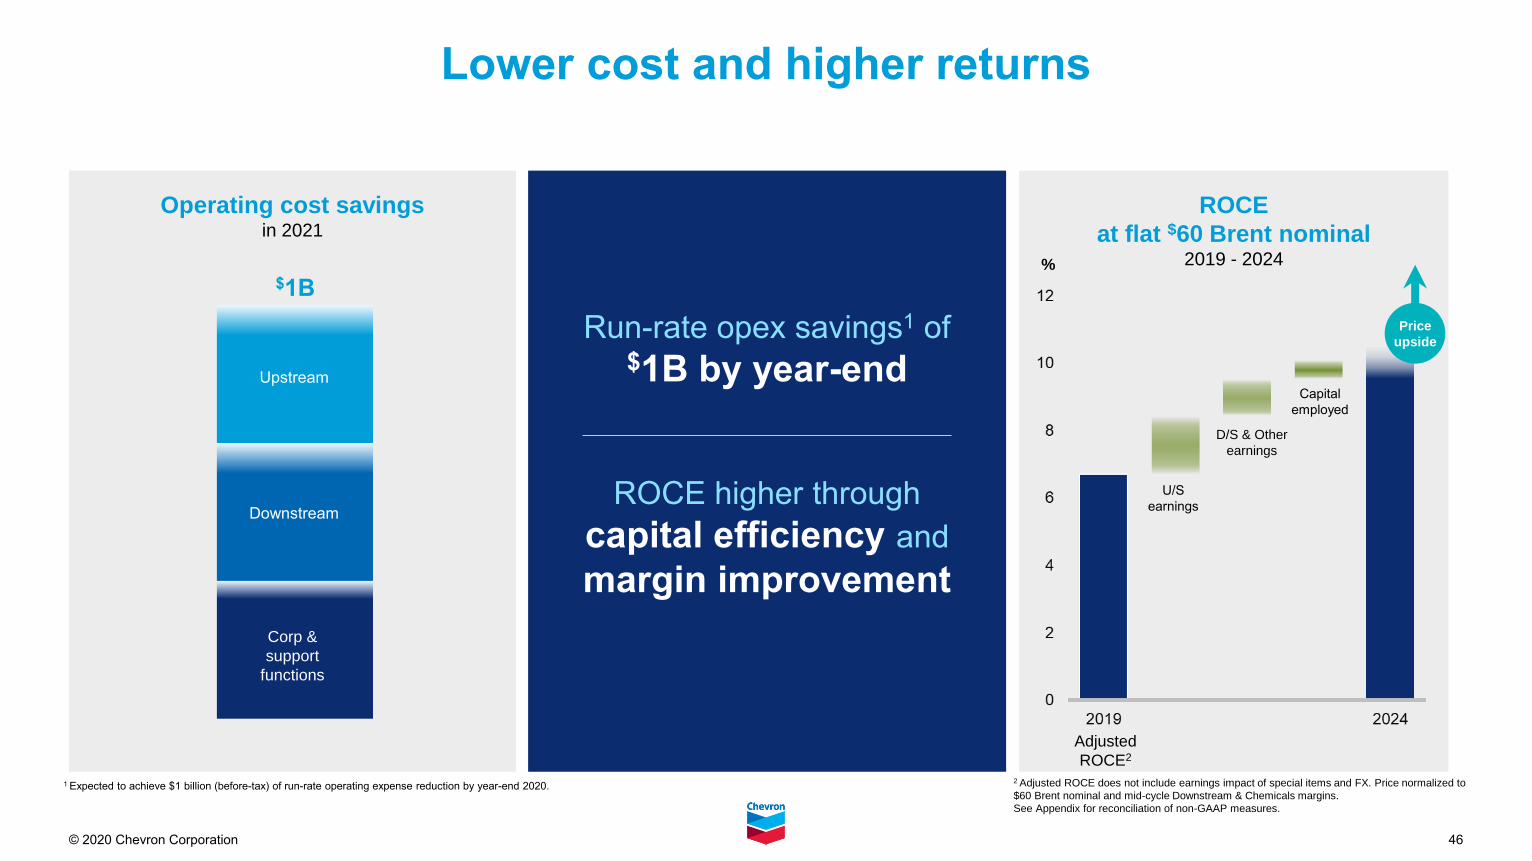
ROCE
at flat $60 Brent nominal2019 - 2024
Operating cost savingsin 2021
Run-rate opex savings1 of $1B by year-end
ROCE higher through
capital efficiency and
margin improvement
Lower cost and higher returns
2 Adjusted ROCE does not include earnings impact of special items and FX. Price normalized to
$60 Brent nominal and mid-cycle Downstream & Chemicals margins.
See Appendix for reconciliation of non-GAAP measures.
Capital
employed
D/S & Other
earnings
U/S
earnings
Price
upside
Corp &
support
functions
Downstream
Upstream
Adjusted
ROCE2
$1B%
1 Expected to achieve $1 billion (before-tax) of run-rate operating expense reduction by year-end 2020.
47© 2020 Chevron Corporation
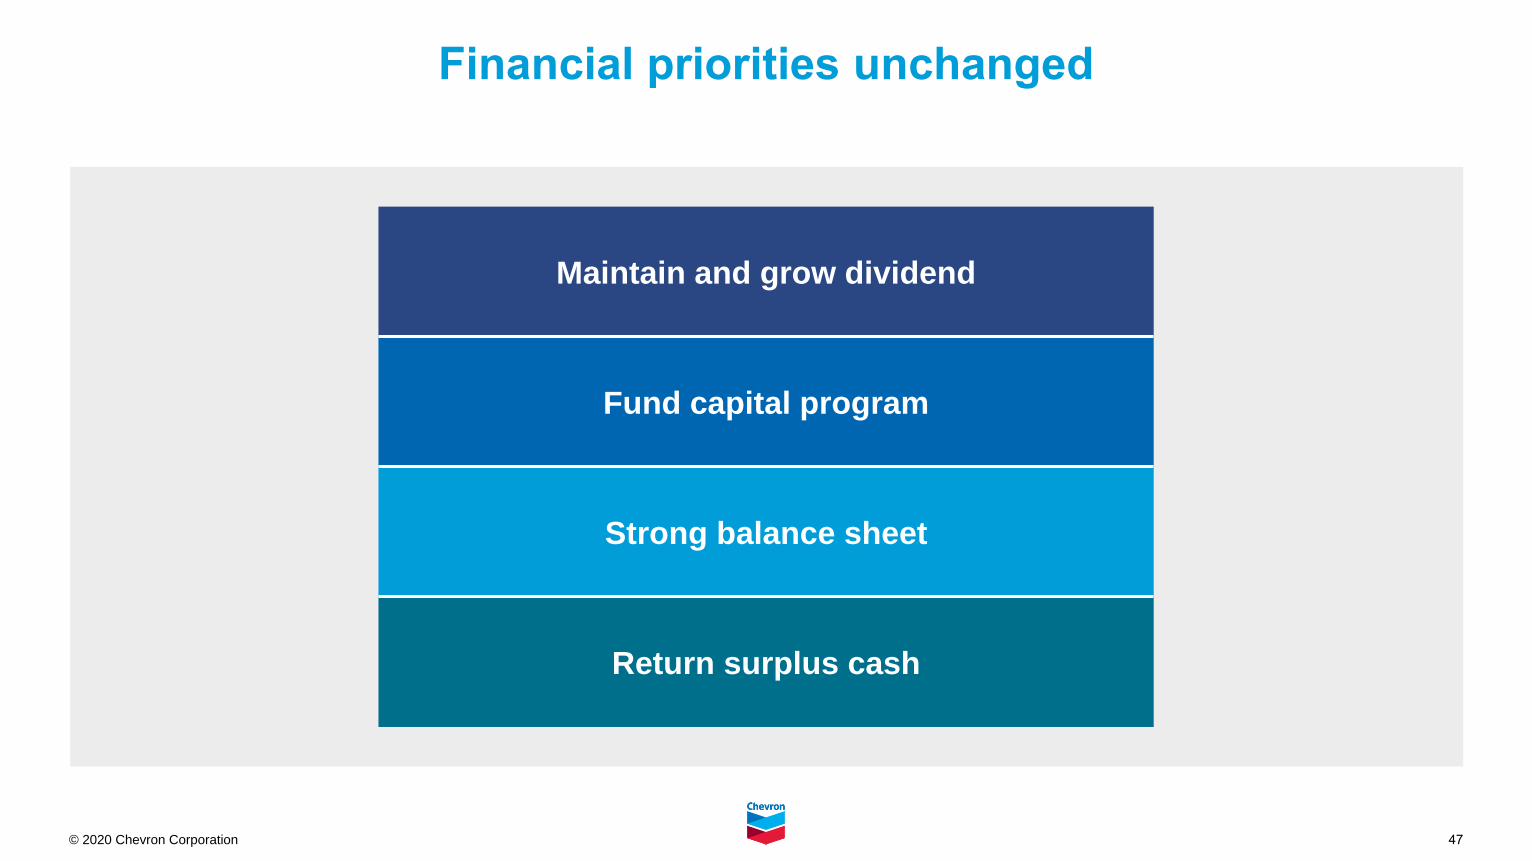
Financial priorities unchanged
Maintain and grow dividend
Fund capital program
Strong balance sheet
Return surplus cash
48© 2020 Chevron Corporation
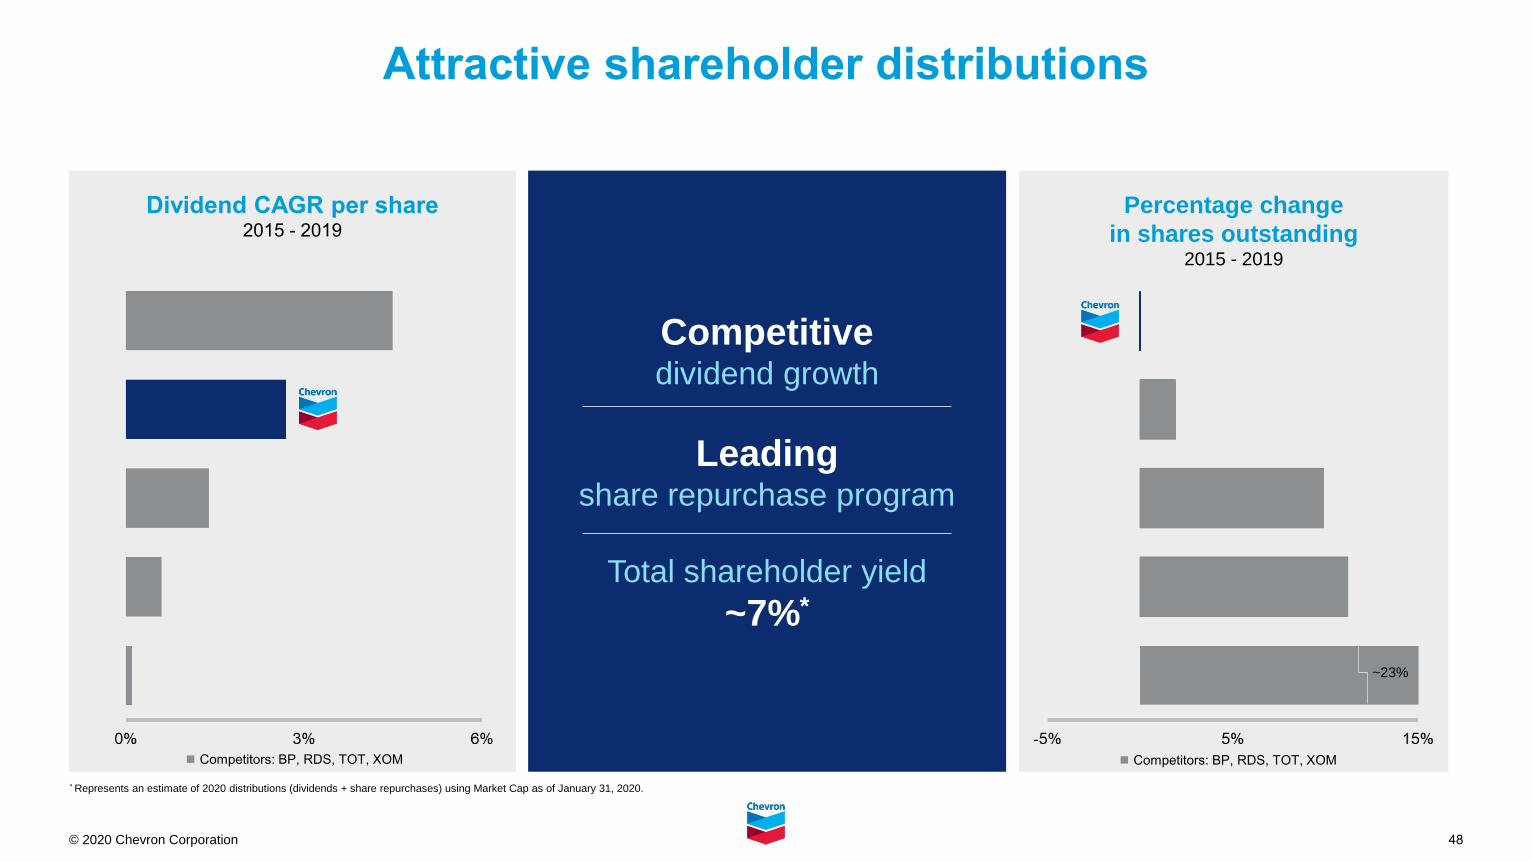
Percentage change
in shares outstanding2015 - 2019
Dividend CAGR per share2015 - 2019
Competitivedividend growth
Leading share repurchase program
Total shareholder yield
~7%*
Attractive shareholder distributions
◼︎ Competitors: BP, RDS, TOT, XOM ◼︎ Competitors: BP, RDS, TOT, XOM
~23%
* Represents an estimate of 2020 distributions (dividends + share repurchases) using Market Cap as of January 31, 2020.
49© 2020 Chevron Corporation
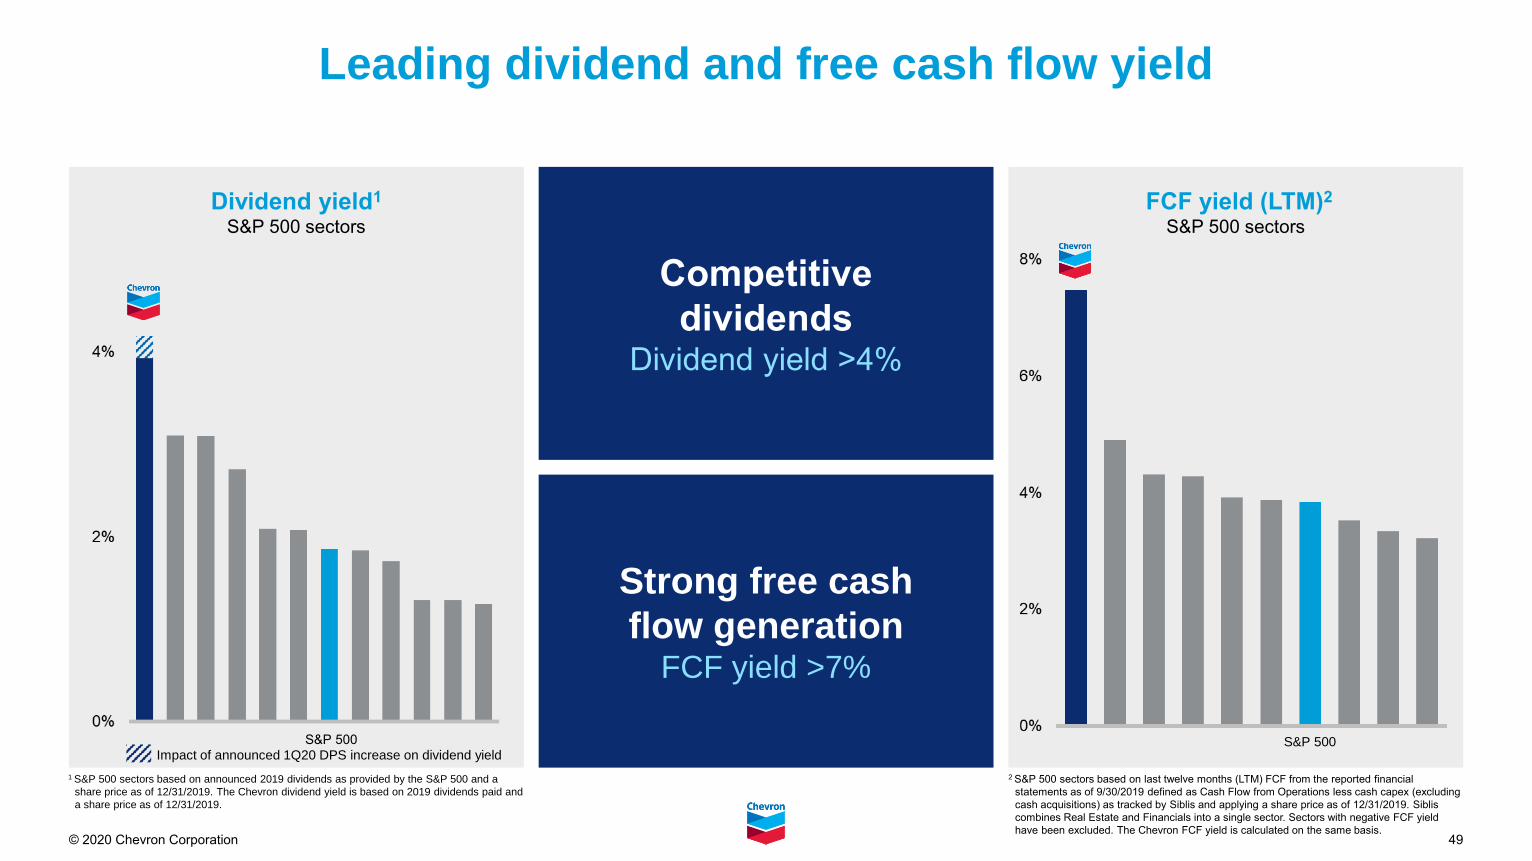
Leading dividend and free cash flow yield
Dividend yield1
S&P 500 sectors
FCF yield (LTM)2
S&P 500 sectors
Competitive
dividendsDividend yield >4%
1 S&P 500 sectors based on announced 2019 dividends as provided by the S&P 500 and a
share price as of 12/31/2019. The Chevron dividend yield is based on 2019 dividends paid and
a share price as of 12/31/2019.
Strong free cash
flow generationFCF yield >7%
S&P 500S&P 500Impact of announced 1Q20 DPS increase on dividend yield
2 S&P 500 sectors based on last twelve months (LTM) FCF from the reported financial
statements as of 9/30/2019 defined as Cash Flow from Operations less cash capex (excluding
cash acquisitions) as tracked by Siblis and applying a share price as of 12/31/2019. Siblis
combines Real Estate and Financials into a single sector. Sectors with negative FCF yield
have been excluded. The Chevron FCF yield is calculated on the same basis.
© 2020 Chevron Corporation
Midstream overview
51© 2020 Chevron Corporation
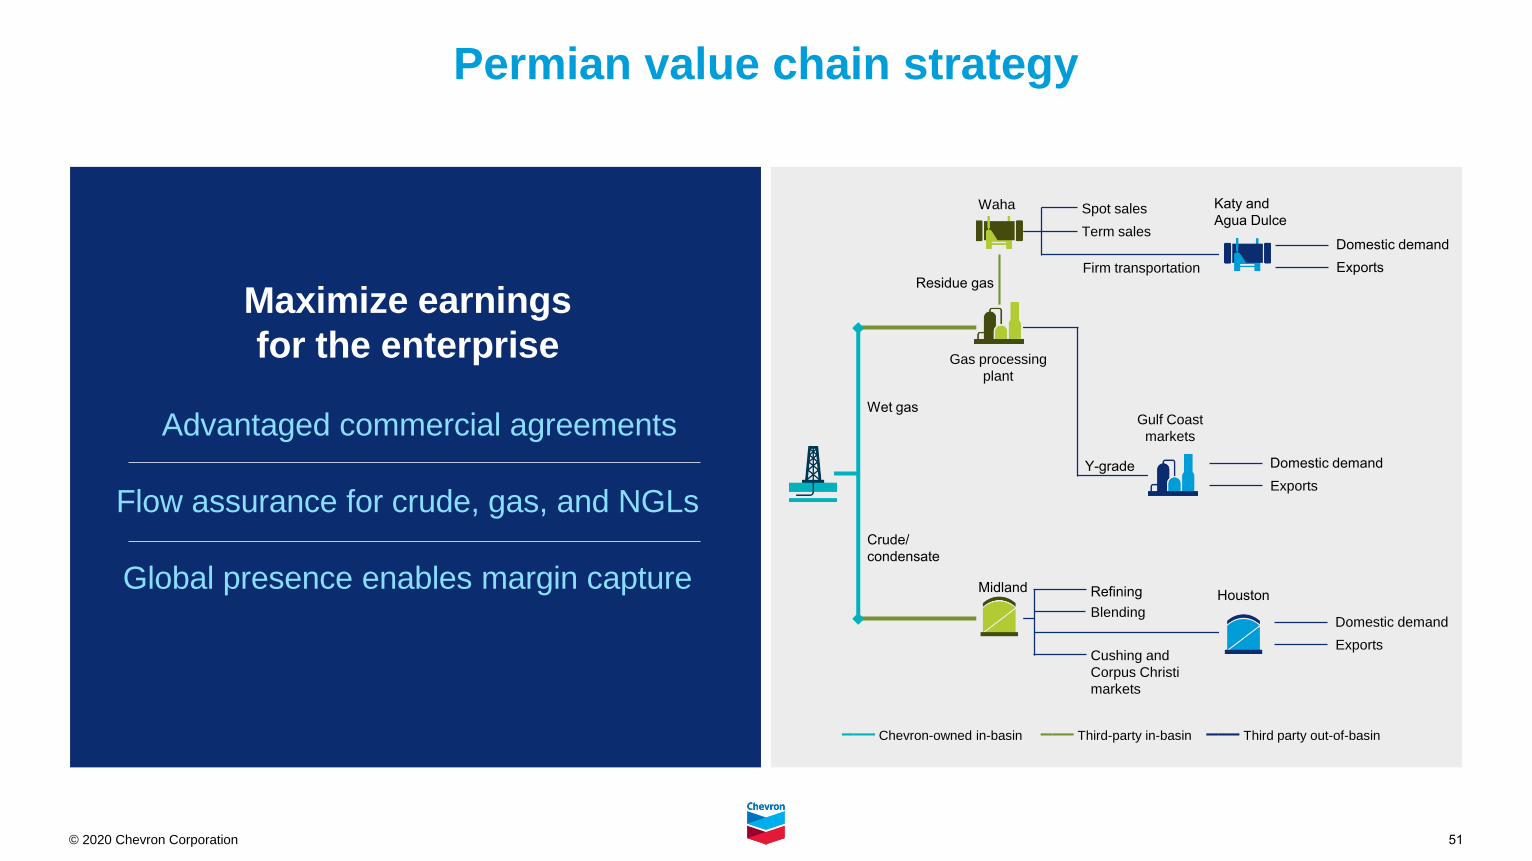
Maximize earnings
for the enterprise
Advantaged commercial agreements
Flow assurance for crude, gas, and NGLs
Global presence enables margin capture
Permian value chain strategy
–— Chevron-owned in-basin –— Third-party in-basin –— Third party out-of-basin
Wet gas
Crude/
condensate
Residue gas
Spot sales
Term sales
Firm transportation
Katy and
Agua Dulce
Gulf Coast
markets
MidlandHoustonRefining
Blending
Cushing and
Corpus Christi
markets
Gas processing
plant
Y-grade
Waha
Domestic demand
Exports
Domestic demand
Exports
Domestic demand
Exports
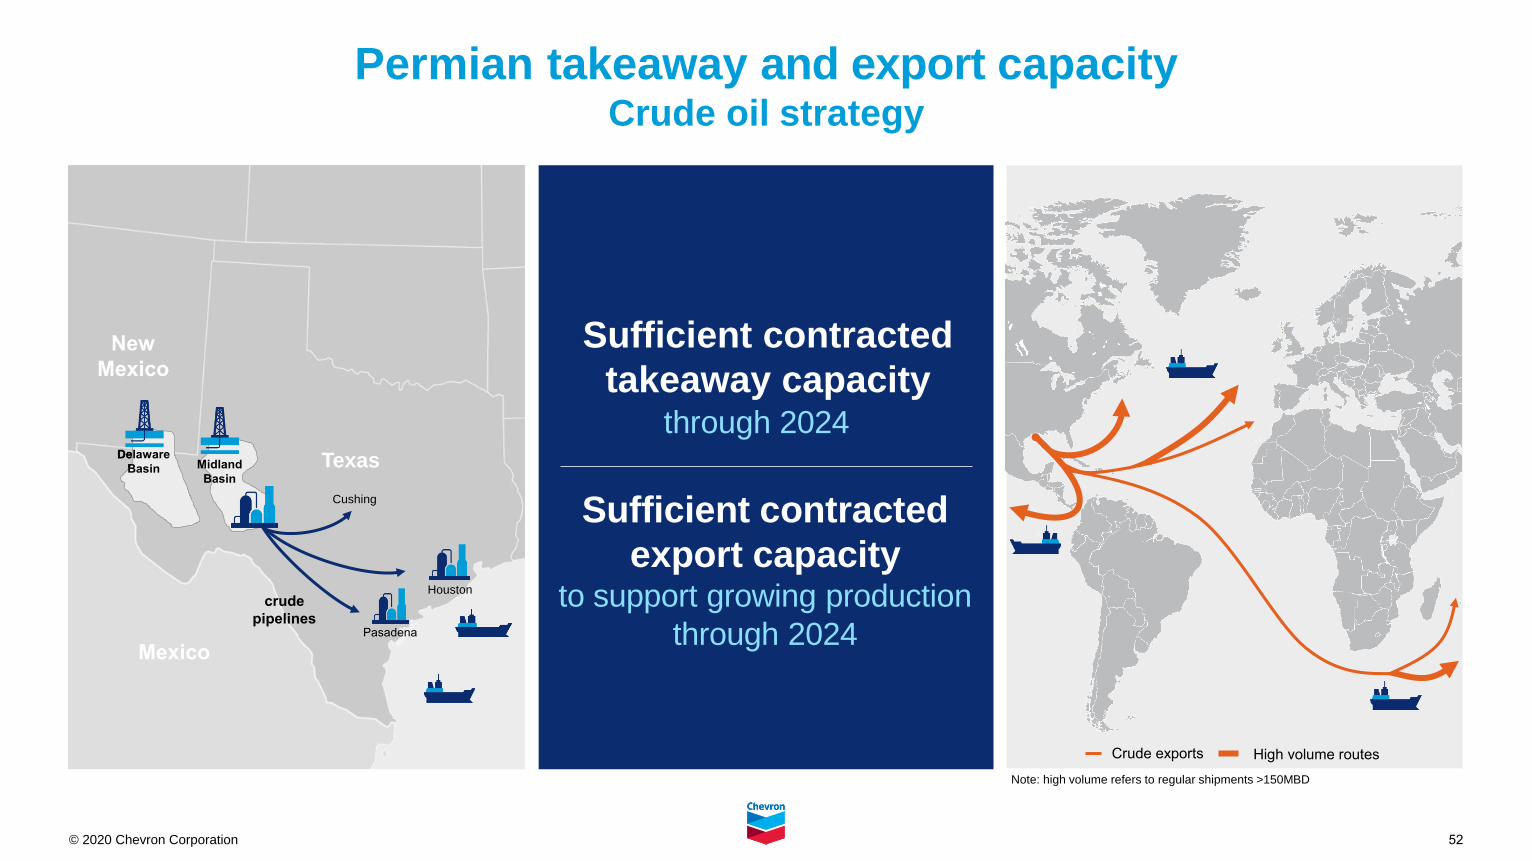
52© 2020 Chevron Corporation
Permian takeaway and export capacityCrude oil strategy
Houston
Delaware
Basin
crude
pipelines
Cushing
Pasadena
Crude exports High volume routes
Note: high volume refers to regular shipments >150MBD
Sufficient contracted
takeaway capacitythrough 2024
Sufficient contracted
export capacityto support growing production
through 2024
New
Mexico
TexasMidland
Basin
Delaware
Basin
Mexico
53© 2020 Chevron Corporation
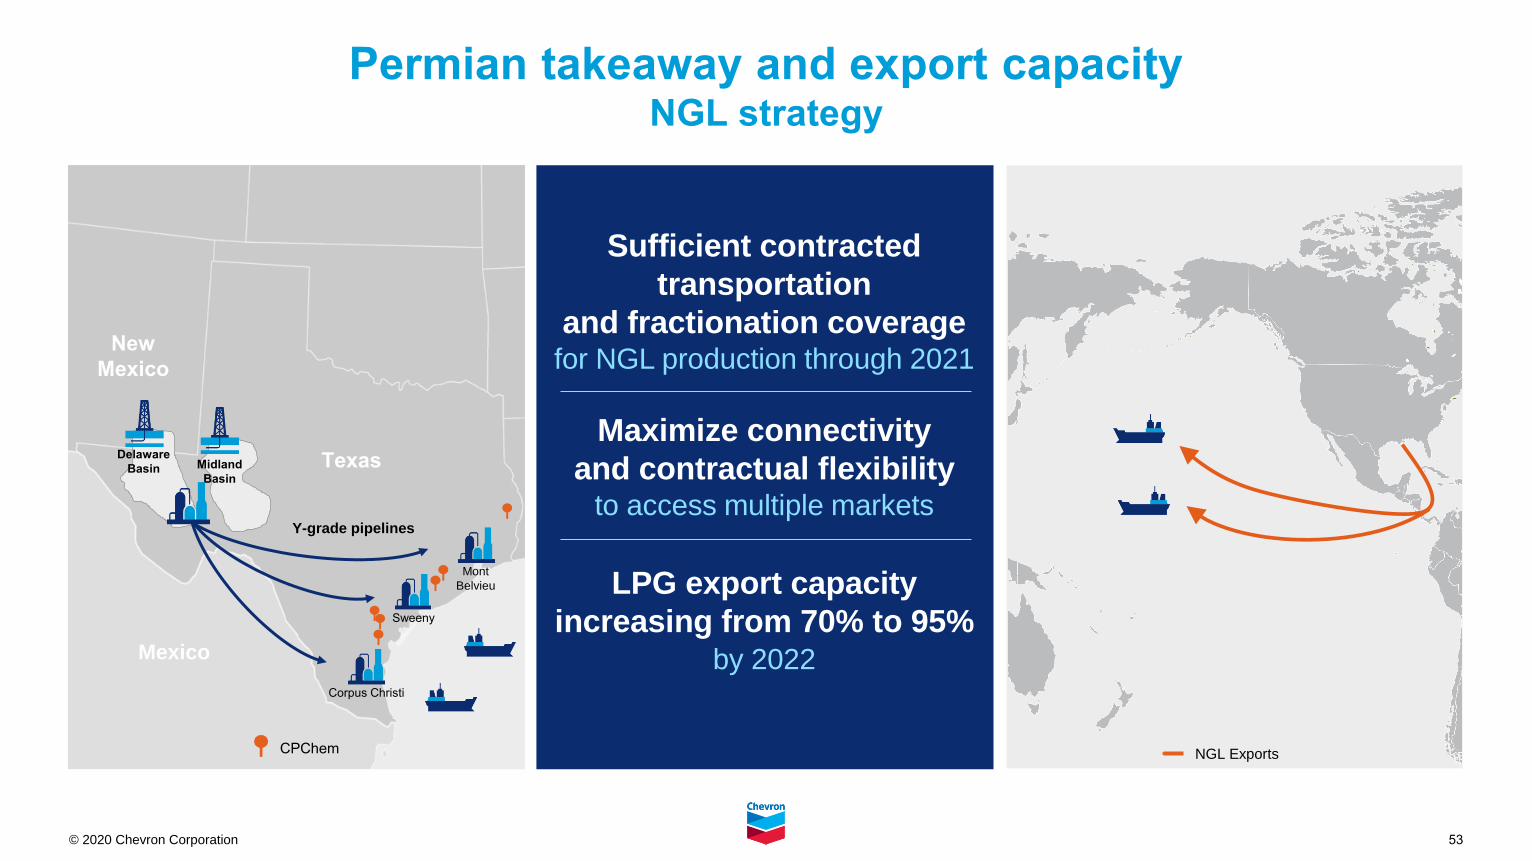
New
Mexico
Permian takeaway and export capacityNGL strategy
Corpus Christi
Sweeny
Mont
Belvieu
Y-grade pipelines
NGL ExportsCPChem
Sufficient contracted
transportation
and fractionation coveragefor NGL production through 2021
Maximize connectivity
and contractual flexibilityto access multiple markets
LPG export capacity
increasing from 70% to 95%by 2022
Midland
Basin
Delaware
Basin Texas
Mexico
54© 2020 Chevron Corporation
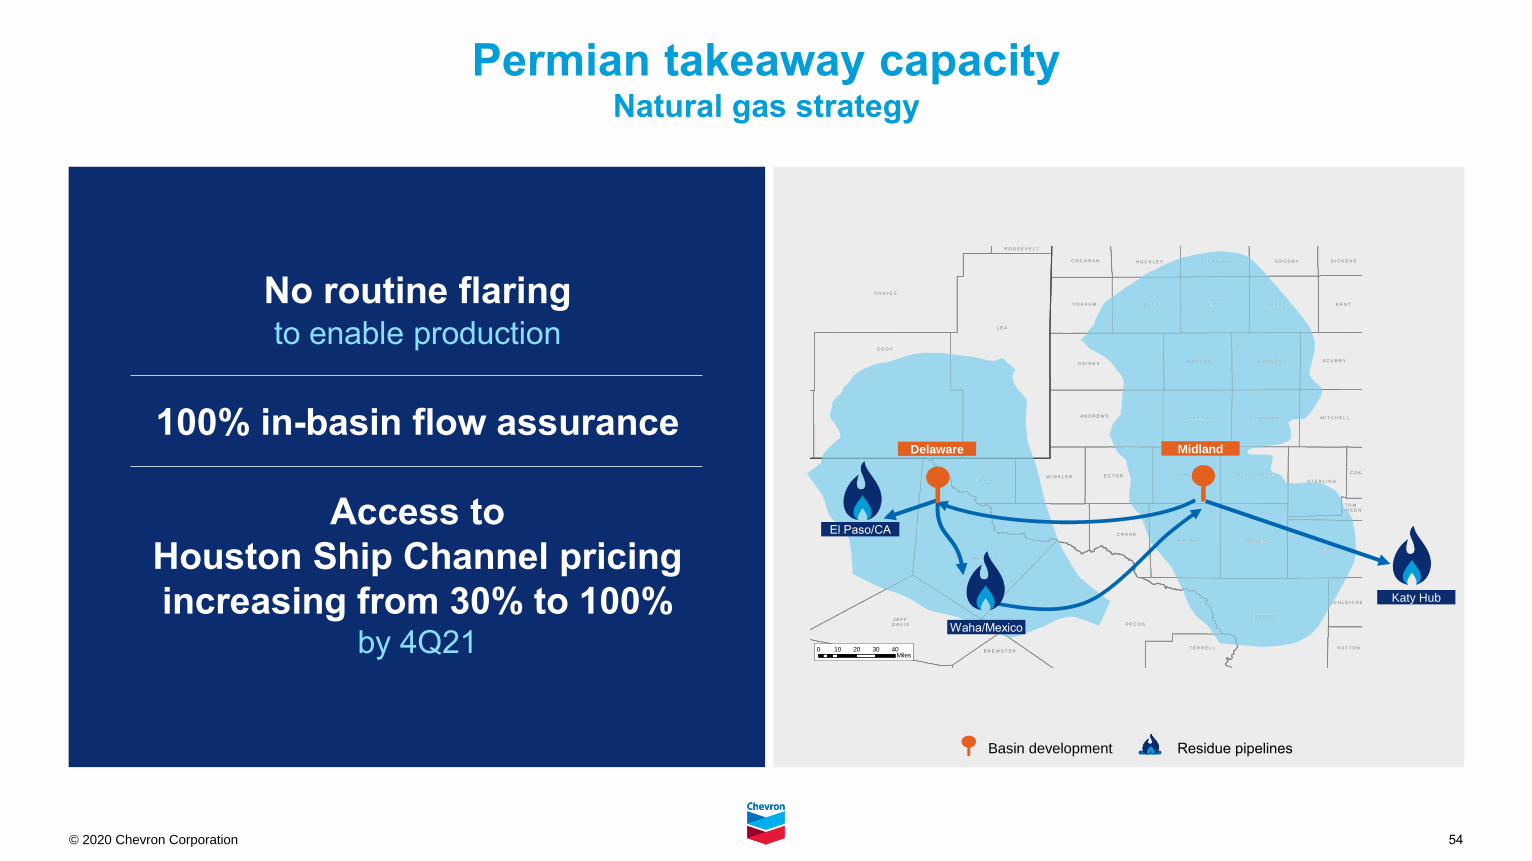
Permian takeaway capacityNatural gas strategy
No routine flaring to enable production
100% in-basin flow assurance
Access to
Houston Ship Channel pricing
increasing from 30% to 100% by 4Q21
E D D Y
C R A N E
C R O C K E T T
C R O S B Y D I C K E N S
G A I N E S
G A R Z A
H O C K L E Y
H O W A R D
L E A
C H A V E S
R O O S E V E L T
C U L B E R S O N
D A W S O N
C O C H R A N
C O K EE C T O R G L A S S C O C K
I R I O N
J E F FD AV I S
A N D R E W S
T O MG R E E N
P E C O S
P R E S I D I OP R E S I D I O
R E A G A NU P T O N
W A R D
M I D L A N D
M I T C H E L L
K E N T
R E E V E S
S C H L E I C H E R
S C U R R Y
W I N K L E R
Y O A K U M
B O R D E N
B R E W S T E R
L O V I N G
L U B B O C K
LY N N
S T E R L I N G
S U T T O NT E R R E L L
M A R T I N
T E R R Y
0 10 20 30 40Miles
C R O C K E T T
G A R Z A
H O W A R D
D A W S O N
G L A S S C O C K
I R I O N
G R
R E A G A NU P T O N
M I D L A N D
S C
B O R D E N
L U B B O C K
LY N N
S T E R
M A R T I N
T E R R Y
C U L B E R S O N
R E E V E S
L O V I N G
El Paso/CA
Waha/Mexico
Katy Hub
Midland
Basin development Residue pipelines
Delaware
55© 2020 Chevron Corporation
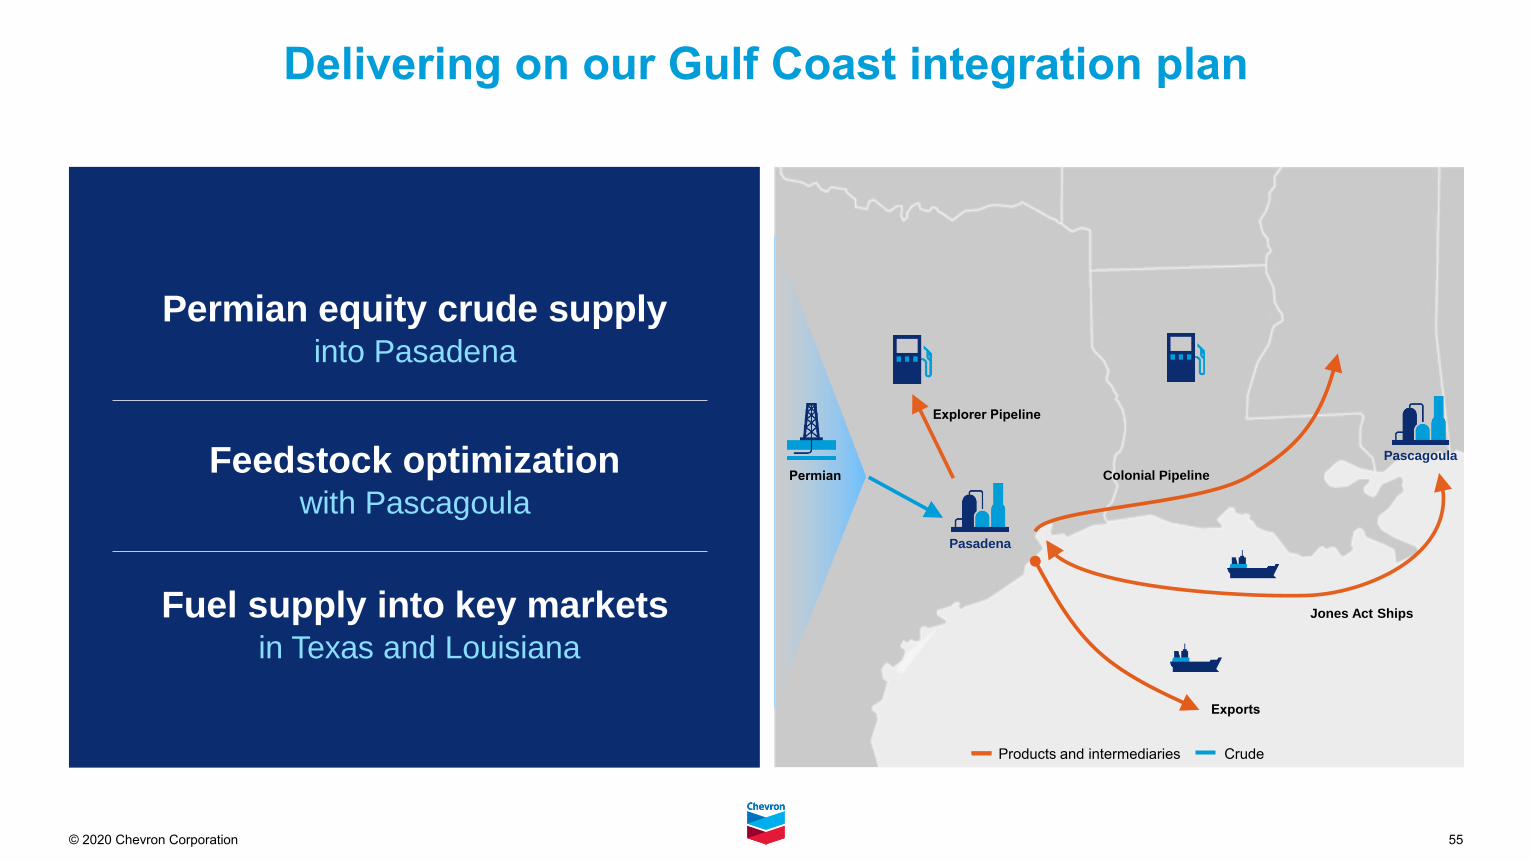
Delivering on our Gulf Coast integration plan
Permian equity crude supply into Pasadena
Feedstock optimizationwith Pascagoula
Fuel supply into key marketsin Texas and Louisiana
Pascagoula
Pasadena
Exports
Colonial Pipeline
Explorer Pipeline
Permian
Products and intermediaries Crude
Jones Act Ships
56© 2020 Chevron Corporation
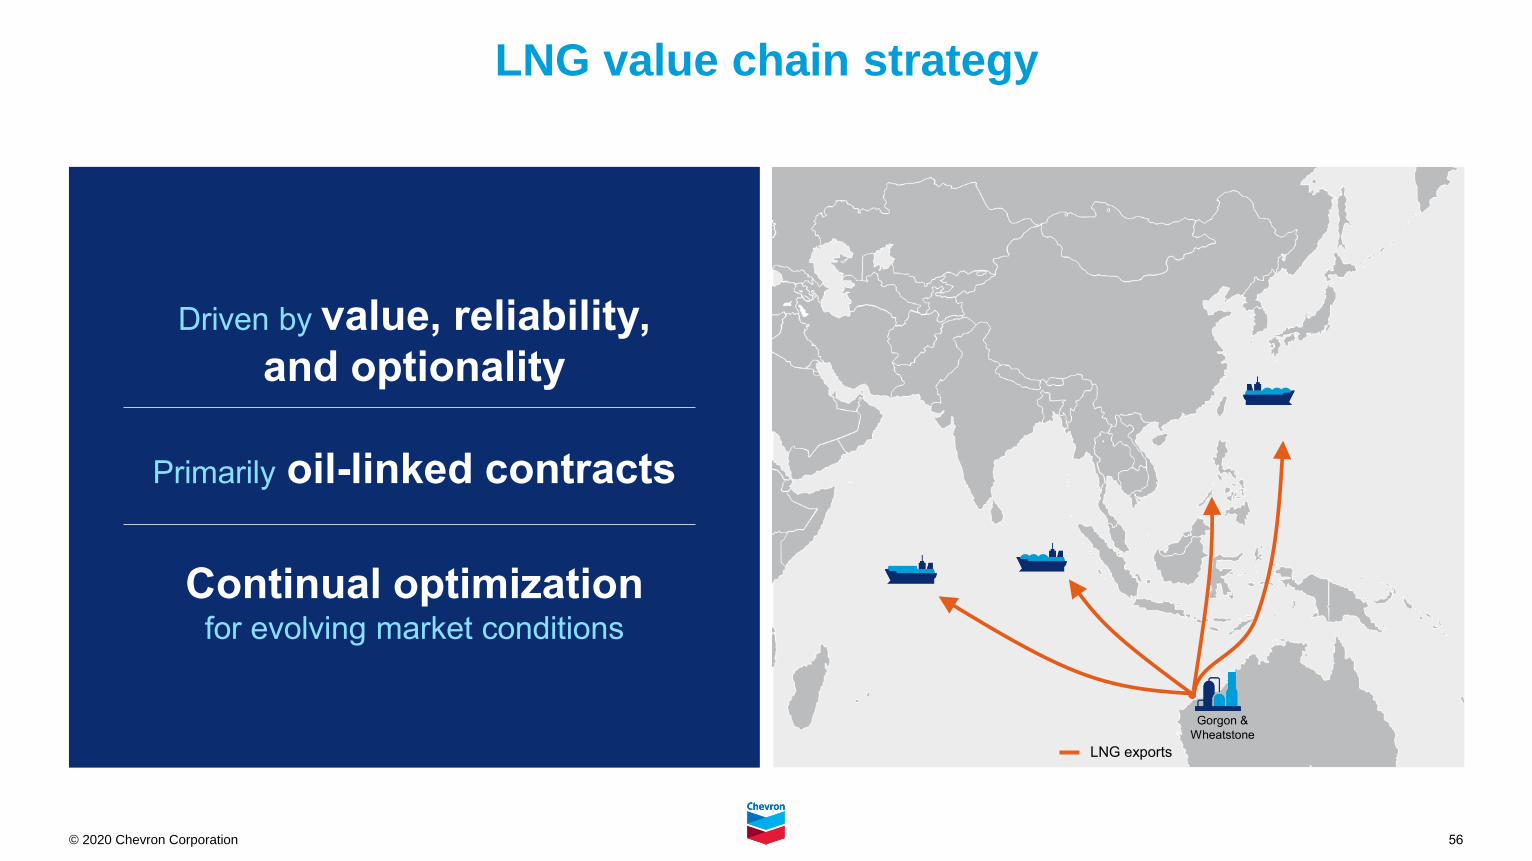
LNG value chain strategy
Driven by value, reliability,
and optionality
Primarily oil-linked contracts
Continual optimization for evolving market conditions
Gorgon &
Wheatstone
LNG exports
© 2020 Chevron. All rights reserved.
Chevron to acquireNoble Energy
July 20, 2020
58© 2020 Chevron
This communication contains forward-looking statements within the meaning of the Private Securities Litigation Reform Act of 1995, Section 27A of the Securities Act of 1933, as amended, and Section 21E of the Securities Exchange Act of 1934, as amended. These forward-looking
statements generally include statements regarding the potential transaction between Chevron Corporation (“Chevron”) and Noble Energy, Inc. (“Noble Energy”), including any statements regarding the expected timetable for completing the potential transaction, the ability to complete the
potential transaction, the expected benefits of the potential transaction (including anticipated annual run-rate operating and other cost synergies and anticipated accretion to return on capital employed, free cash flow, and earnings per share), projected financial information, future
opportunities, and any other statements regarding Chevron’s and Noble Energy’s future expectations, beliefs, plans, objectives, results of operations, financial condition and cash flows, or future events or performance. These statements are often, but not always, made through the use of
words or phrases such as “anticipates,” “expects,” “intends,” “plans,” “targets,” “forecasts,” “projects,” “believes,” “seeks,” “schedules,” “estimates,” “positions,” “pursues,” “may,” “could,” “should,” “will,” “budgets,” “outlook,” “trends,” “guidance,” “focus,” “on schedule,” “on track,” “is slated,”
“goals,” “objectives,” “strategies,” “opportunities,” “poised,” “potential” and similar expressions. All such forward-looking statements are based on current expectations of Chevron’s and Noble Energy’s management and therefore involve estimates and assumptions that are subject to risks,
uncertainties and other factors that could cause actual results to differ materially from the results expressed in the statements. Key factors that could cause actual results to differ materially from those projected in the forward-looking statements include the ability to obtain the requisite Noble
Energy stockholder approval; uncertainties as to the timing to consummate the potential transaction; the risk that a condition to closing the potential transaction may not be satisfied; the risk that regulatory approvals are not obtained or are obtained subject to conditions that are not anticipated
by the parties; the effects of disruption to Chevron’s or Noble Energy’s respective businesses; the effect of this communication on Chevron’s or Noble Energy’s stock prices; the effects of industry, market, economic, political or regulatory conditions outside of Chevron’s or Noble Energy’s
control; transaction costs; Chevron’s ability to achieve the benefits from the proposed transaction, including the anticipated annual run-rate operating and other cost synergies and accretion to return on capital employed, free cash flow, and earnings per share; Chevron’s ability to promptly,
efficiently and effectively integrate acquired operations into its own operations; unknown liabilities; and the diversion of management time on transaction-related issues. Other important factors that could cause actual results to differ materially from those in the forward-looking statements are:
changing crude oil and natural gas prices and demand for our products and production curtailments due to market conditions; crude oil production quotas or other actions that might be imposed by the Organization of Petroleum Exporting Countries and other producing countries; public health
crises, such as pandemics (including coronavirus (COVID-19)) and epidemics, and any related government policies and actions; changing economic, regulatory and political environments in the various countries in which the company operates; general domestic and international economic
and political conditions; changing refining, marketing and chemicals margins; the company's ability to realize anticipated cost savings, expenditure reductions and efficiencies associated with enterprise transformation initiatives; actions of competitors or regulators; timing of exploration
expenses; timing of crude oil liftings; the competitiveness of alternate-energy sources or product substitutes; technological developments; the results of operations and financial condition of the company's suppliers, vendors, partners and equity affiliates, particularly during extended periods of
low prices for crude oil and natural gas during the COVID-19 pandemic; the inability or failure of the company's joint-venture partners to fund their share of operations and development activities; the potential failure to achieve expected net production from existing and future crude oil and
natural gas development projects; potential delays in the development, construction or start-up of planned projects; the potential disruption or interruption of the company's operations due to war, accidents, political events, civil unrest, severe weather, cyber threats, terrorist acts, or other
natural or human causes beyond the company's control; the potential liability for remedial actions or assessments under existing or future environmental regulations and litigation; significant operational, investment or product changes required by existing or future environmental statutes and
regulations, including international agreements and national or regional legislation and regulatory measures to limit or reduce greenhouse gas emissions; the potential liability resulting from pending or future litigation; the company's future acquisitions or dispositions of assets or shares or the
delay or failure of such transactions to close based on required closing conditions; the potential for gains and losses from asset dispositions or impairments; government-mandated sales, divestitures, recapitalizations, industry-specific taxes, tariffs, sanctions, changes in fiscal terms or
restrictions on scope of company operations; foreign currency movements compared with the U.S. dollar; material reductions in corporate liquidity and access to debt markets; the receipt of required Board authorizations to pay future dividends; the effects of changed accounting rules under
generally accepted accounting principles promulgated by rule-setting bodies; the company's ability to identify and mitigate the risks and hazards inherent in operating in the global energy industry; and the factors set forth under the heading “Risk Factors” on pages 18 through 21 of the
company's 2019 Annual Report on Form 10-K and in subsequent filings with the U.S. Securities and Exchange Commission. Other unpredictable or unknown factors not discussed in this communication could also have material adverse effects on forward-looking statements. Chevron
assumes no obligation to update any forward-looking statements, except as required by law. Readers are cautioned not to place undue reliance on these forward-looking statements that speak only as of the date hereof.
Important Information For Investors And Stockholders
This communication does not constitute an offer to sell or the solicitation of an offer to buy any securities or a solicitation of any vote or approval, nor shall there be any sale of securities in any jurisdiction in which such offer, solicitation or sale would be unlawful prior to registration or
qualification under the securities laws of any such jurisdiction. No offer of securities shall be made except by means of a prospectus meeting the requirements of Section 10 of the Securities Act of 1933, as amended. In connection with the potential transaction, Chevron expects to file a
registration statement on Form S-4 with the Securities and Exchange Commission (“SEC”) containing a preliminary prospectus of Chevron that also constitutes a preliminary proxy statement of Noble Energy After the registration statement is declared effective, Noble Energy will mail a
definitive proxy statement/prospectus to stockholders of Noble Energy . This communication is not a substitute for the proxy statement/prospectus or registration statement or for any other document that Chevron or Noble Energy may file with the SEC and send to Noble Energy ’s
stockholders in connection with the potential transaction. INVESTORS AND SECURITY HOLDERS OF CHEVRON AND NOBLE ENERGY ARE URGED TO READ THE PROXY STATEMENT/PROSPECTUS AND OTHER DOCUMENTS FILED WITH THE SEC CAREFULLY AND IN
THEIR ENTIRETY WHEN THEY BECOME AVAILABLE BECAUSE THEY WILL CONTAIN IMPORTANT INFORMATION. Investors and security holders will be able to obtain free copies of the proxy statement/prospectus (when available) and other documents filed with the SEC by Chevron
or Noble Energy through the website maintained by the SEC at http://www.sec.gov. Copies of the documents filed with the SEC by Chevron will be available free of charge on Chevron’s website at http://www.chevron.com/investors and copies of the documents filed with the SEC by Noble
Energy will be available free of charge on Noble Energy ’s website at http://investors.nblenergy.com.
Chevron and Noble Energy and certain of their respective directors, certain of their respective executive officers and other members of management and employees may be considered participants in the solicitation of proxies with respect to the potential transaction under the rules of the
SEC. Information about the directors and executive officers of Chevron is set forth in its Annual Report on Form 10-K for the year ended December 31, 2019, which was filed with the SEC on February 21, 2020, and its proxy statement for its 2020 annual meeting of stockholders, which was
filed with the SEC on April 7, 2020. Information about the directors and executive officers of Noble Energy is set forth in its Annual Report on Form 10-K for the year ended December 31, 2019, which was filed with the SEC on February 12, 2020, and its proxy statement for its 2020 annual
meeting of stockholders, which was filed with the SEC on March 10, 2020. These documents can be obtained free of charge from the sources indicated above. Additional information regarding the interests of such participants in the solicitation of proxies in respect of the potential transaction
will be included in the registration statement and proxy statement/prospectus and other relevant materials to be filed with the SEC when they become available.
As used in this presentation, the term “Chevron” and such terms as “the company,” “the corporation,” “our,” “we,” “us” and “its” may refer to Chevron Corporation, one or more of its consolidated subsidiaries, or to all of them taken as a whole. All of these terms are used for convenience only
and are not intended as a precise description of any of the separate companies, each of which manages its own affairs.
Terms such as “resources” may be used in this news release to describe certain aspects of Chevron’s and Noble Energy’s portfolio and oil and gas properties beyond the proved reserves. For definitions of, and further information regarding, this and other terms, see the “Glossary of Energy
and Financial Terms” on pages 54 through 55 of Chevron’s 2019 Supplement to the Annual Report available at chevron.com.
This presentation is meant to be read in conjunction with the Chevron Announces Agreement to Acquire Noble Energy Transcript posted on chevron.com under the headings “Investors,” “Events & Presentations.”
Cautionary statementCAUTIONARY STATEMENTS RELEVANT TO FORWARD-LOOKING INFORMATION
FOR THE PURPOSE OF “SAFE HARBOR” PROVISIONS OF THE PRIVATE SECURITIES LITIGATION REFORM ACT OF 1995
59© 2020 Chevron
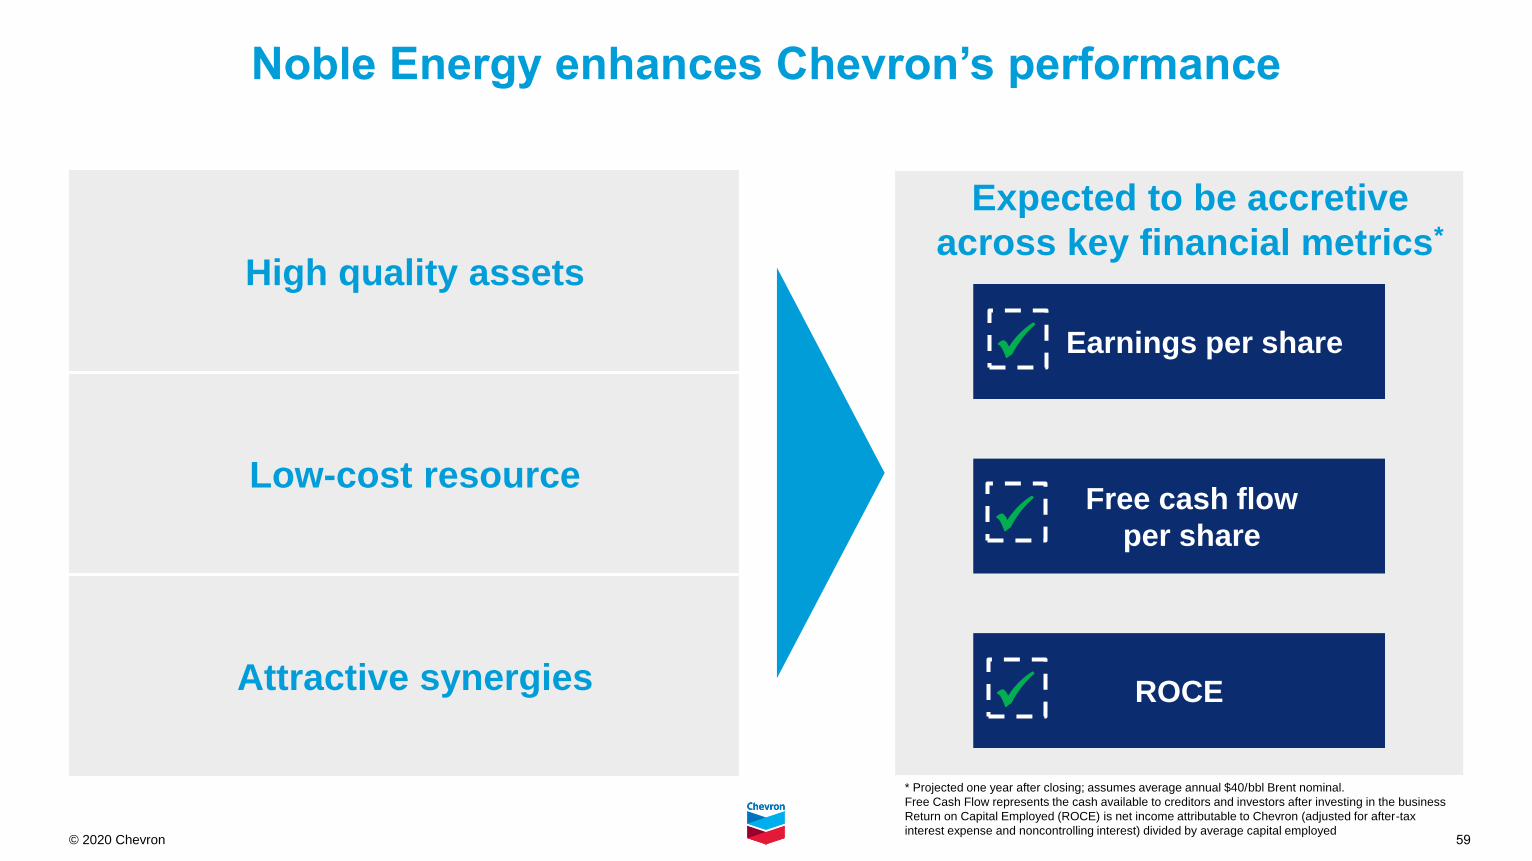
Noble Energy enhances Chevron’s performance
Expected to be accretive
across key financial metrics*
Earnings per share
Free cash flow
per share
ROCE
✓
✓
✓
* Projected one year after closing; assumes average annual $40/bbl Brent nominal.
Free Cash Flow represents the cash available to creditors and investors after investing in the business
Return on Capital Employed (ROCE) is net income attributable to Chevron (adjusted for after-tax
interest expense and noncontrolling interest) divided by average capital employed
High quality assets
Low-cost resource
Attractive synergies
60© 2020 Chevron
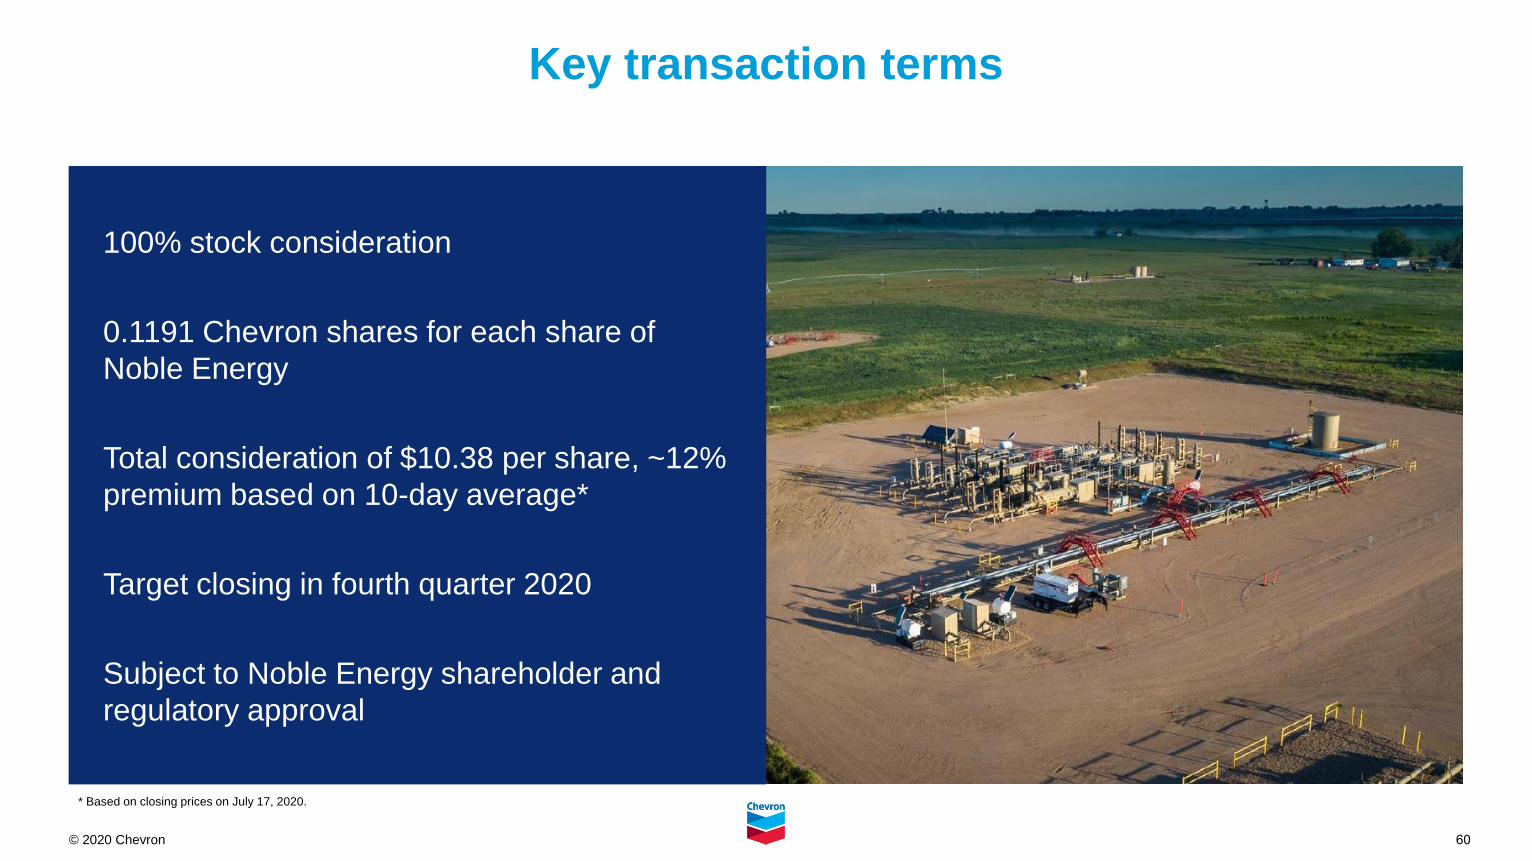
Key transaction terms
100% stock consideration
0.1191 Chevron shares for each share of
Noble Energy
Total consideration of $10.38 per share, ~12%
premium based on 10-day average*
Target closing in fourth quarter 2020
Subject to Noble Energy shareholder and
regulatory approval
* Based on closing prices on July 17, 2020.
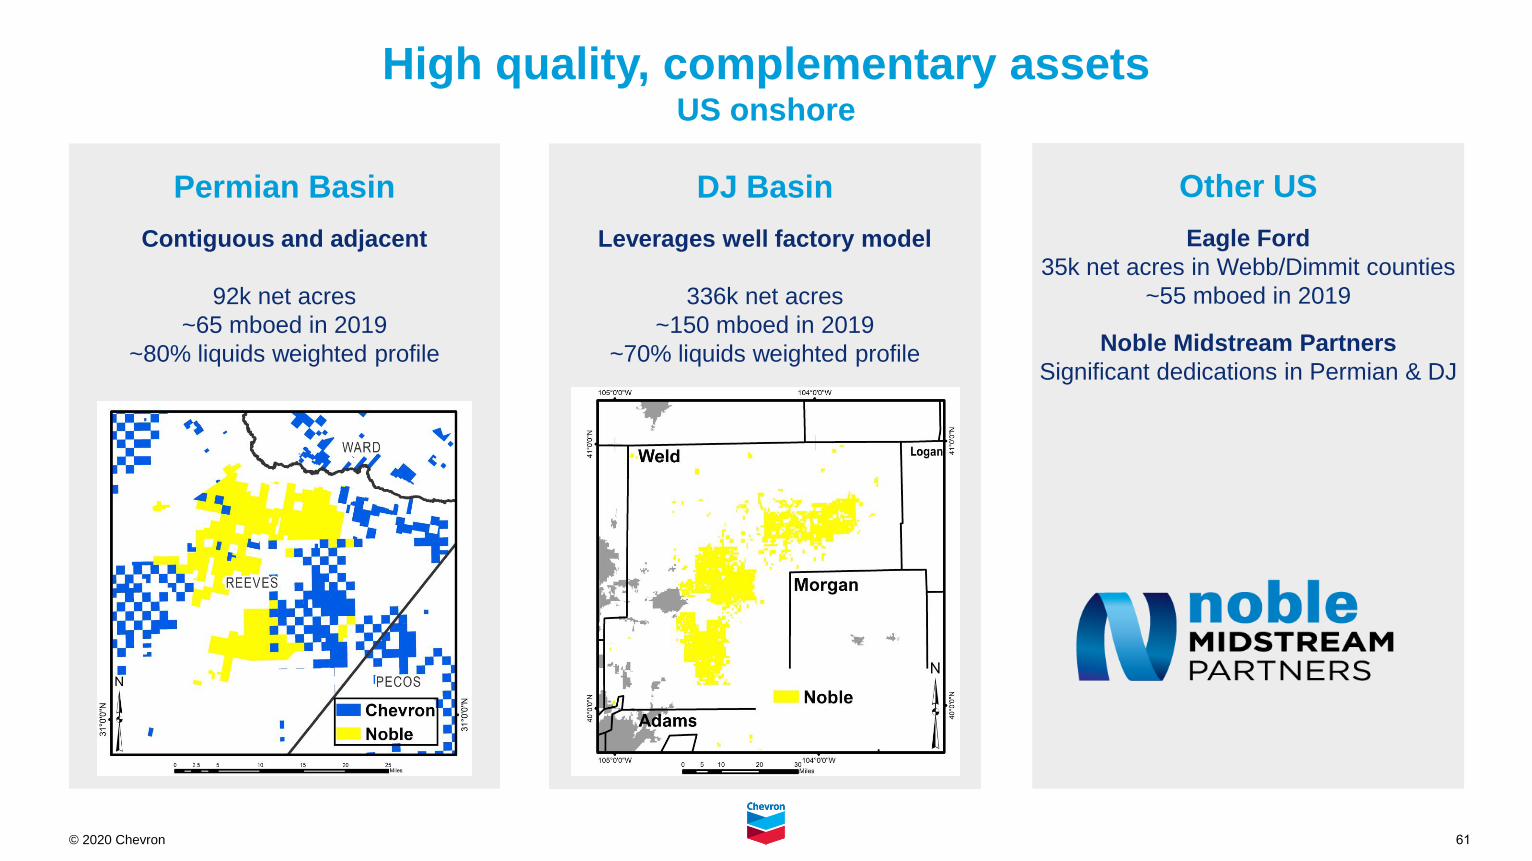
61© 2020 Chevron
Permian Basin
Contiguous and adjacent
92k net acres
~65 mboed in 2019
~80% liquids weighted profile
High quality, complementary assetsUS onshore
Other US
Eagle Ford
35k net acres in Webb/Dimmit counties
~55 mboed in 2019
Noble Midstream Partners
Significant dedications in Permian & DJ
DJ Basin
Leverages well factory model
336k net acres
~150 mboed in 2019
~70% liquids weighted profile
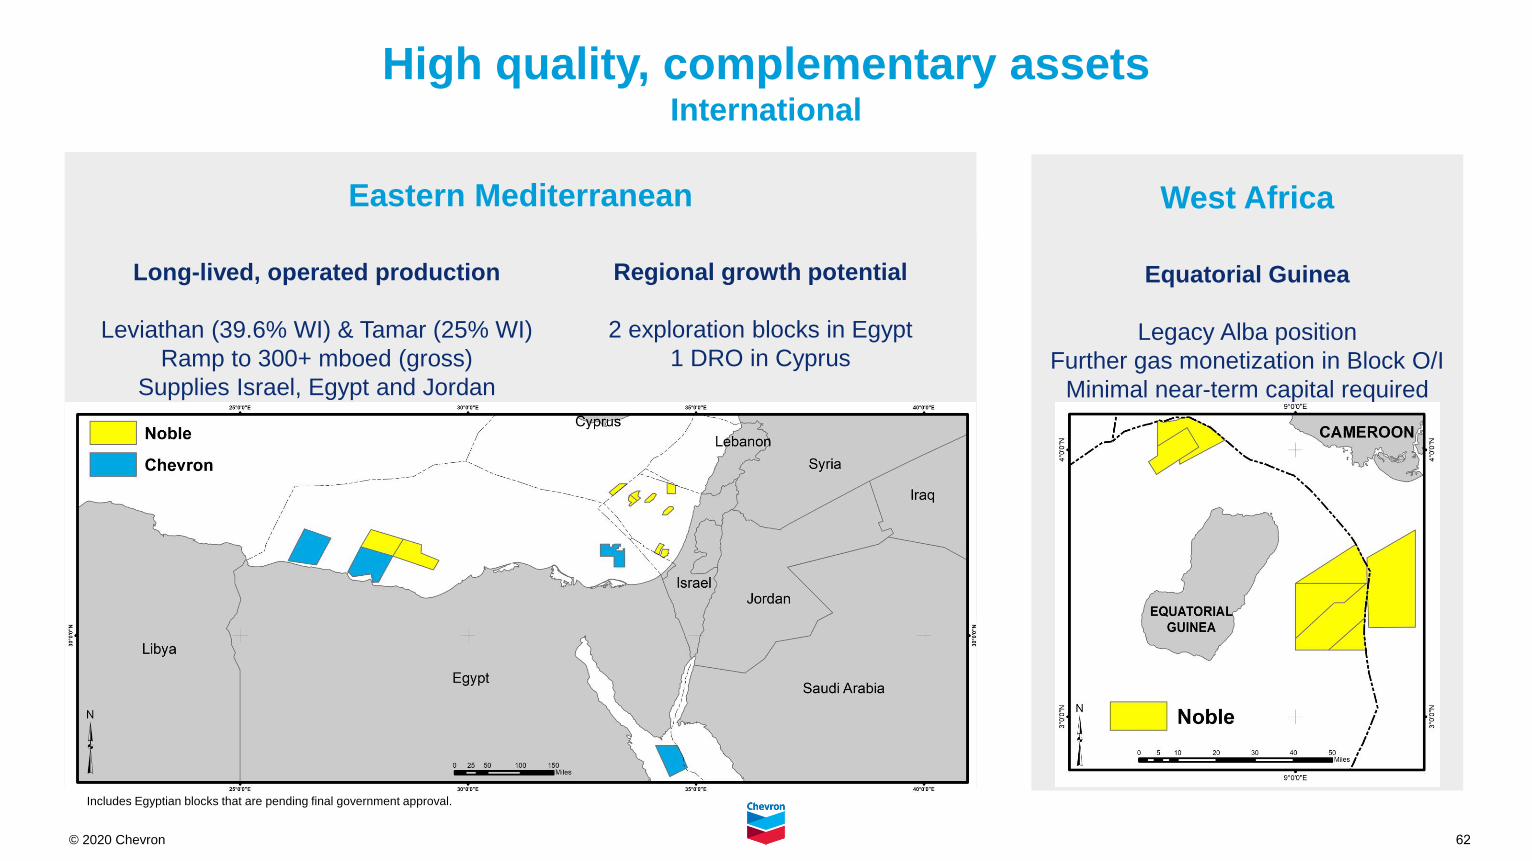
62© 2020 Chevron
Eastern Mediterranean
Regional growth potential
2 exploration blocks in Egypt
1 DRO in Cyprus
Long-lived, operated production
Leviathan (39.6% WI) & Tamar (25% WI)
Ramp to 300+ mboed (gross)
Supplies Israel, Egypt and Jordan
High quality, complementary assetsInternational
West Africa
Equatorial Guinea
Legacy Alba position
Further gas monetization in Block O/I
Minimal near-term capital required
Noble Energy
Leviathan
Tamar
Aphrodite
Includes Egyptian blocks that are pending final government approval.
*
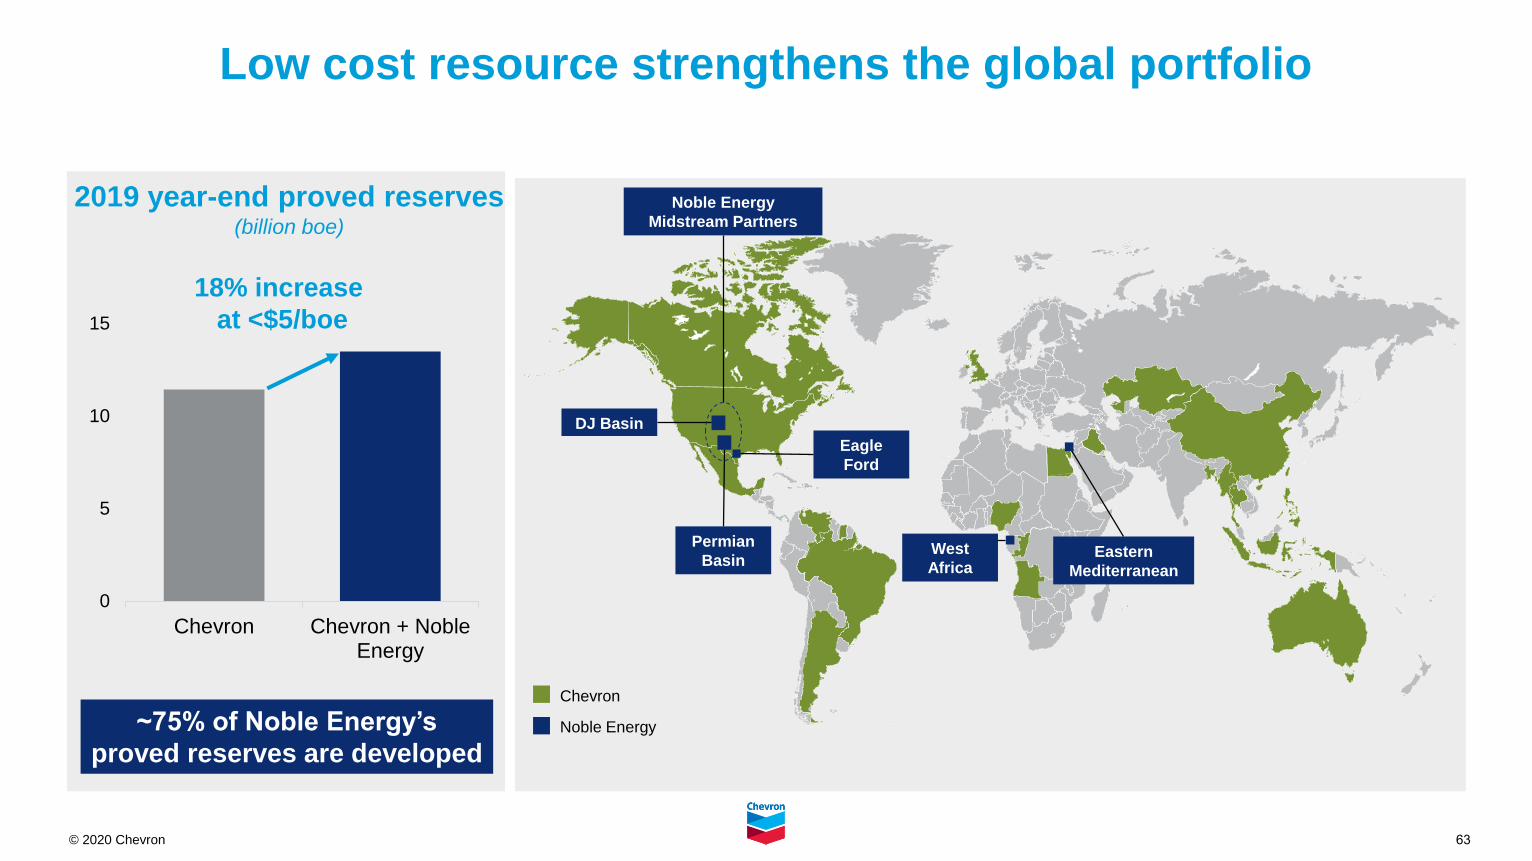
63© 2020 Chevron
Low cost resource strengthens the global portfolio
2019 year-end proved reserves(billion boe)
0
5
10
15
Chevron Chevron + NobleEnergy
18% increase
at <$5/boe
~75% of Noble Energy’s
proved reserves are developed
Chevron
Permian
Basin
Noble Energy
DJ Basin
West
AfricaEastern
Mediterranean
Eagle
Ford
Noble Energy
Midstream Partners
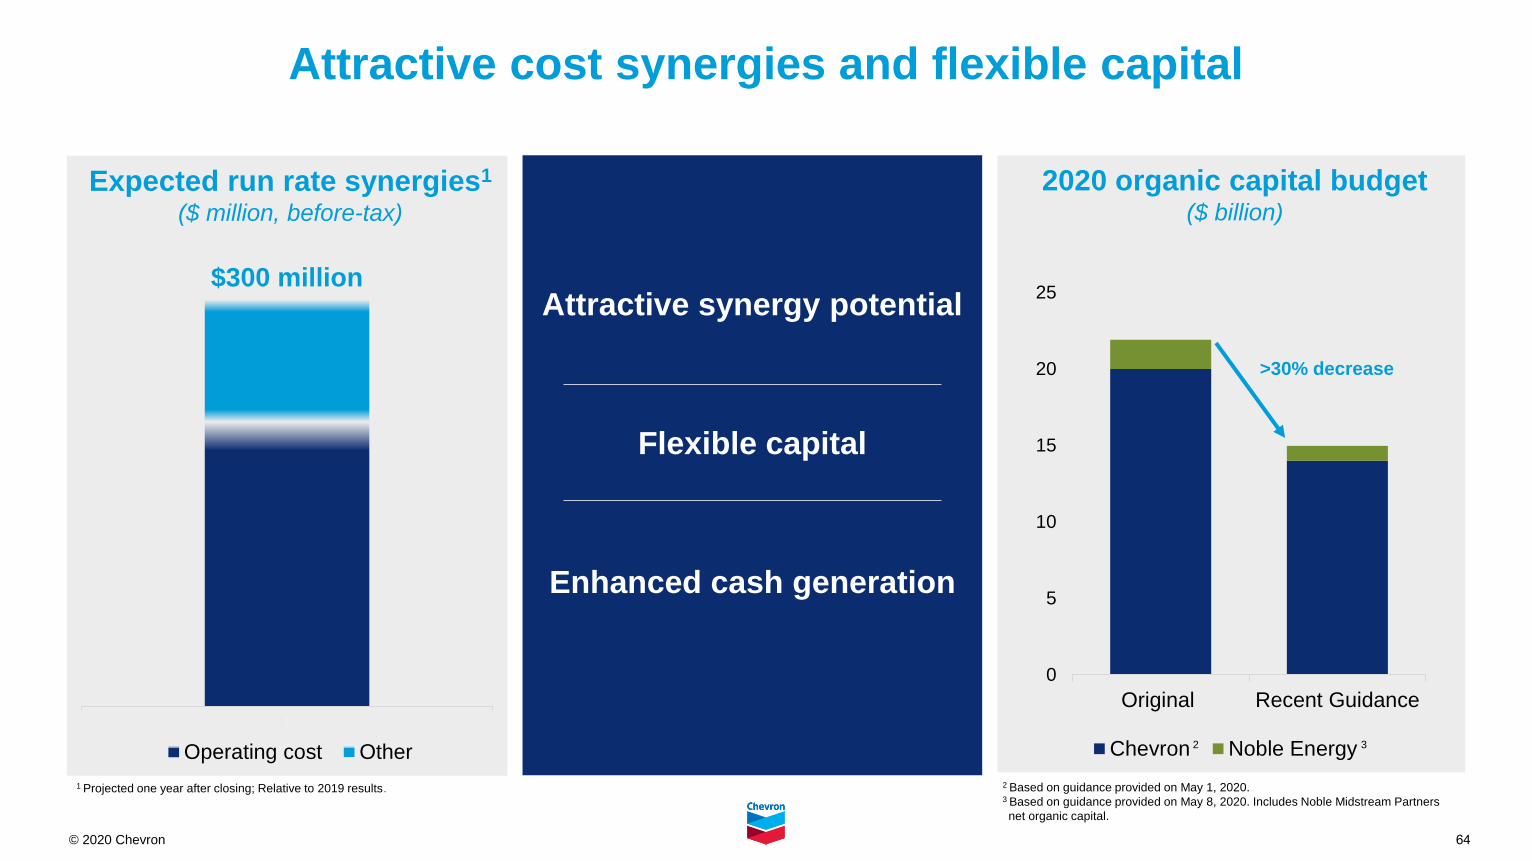
64© 2020 Chevron
Attractive cost synergies and flexible capital
Expected run rate synergies1
($ million, before-tax)
1
Operating cost Other
Attractive synergy potential
Flexible capital
Enhanced cash generation
1 Projected one year after closing; Relative to 2019 results.
2020 organic capital budget($ billion)
0
5
10
15
20
25
Original Recent Guidance
Chevron Noble Energy
>30% decrease
2 Based on guidance provided on May 1, 2020.3 Based on guidance provided on May 8, 2020. Includes Noble Midstream Partners
net organic capital.
3
$300 million
2
65© 2020 Chevron
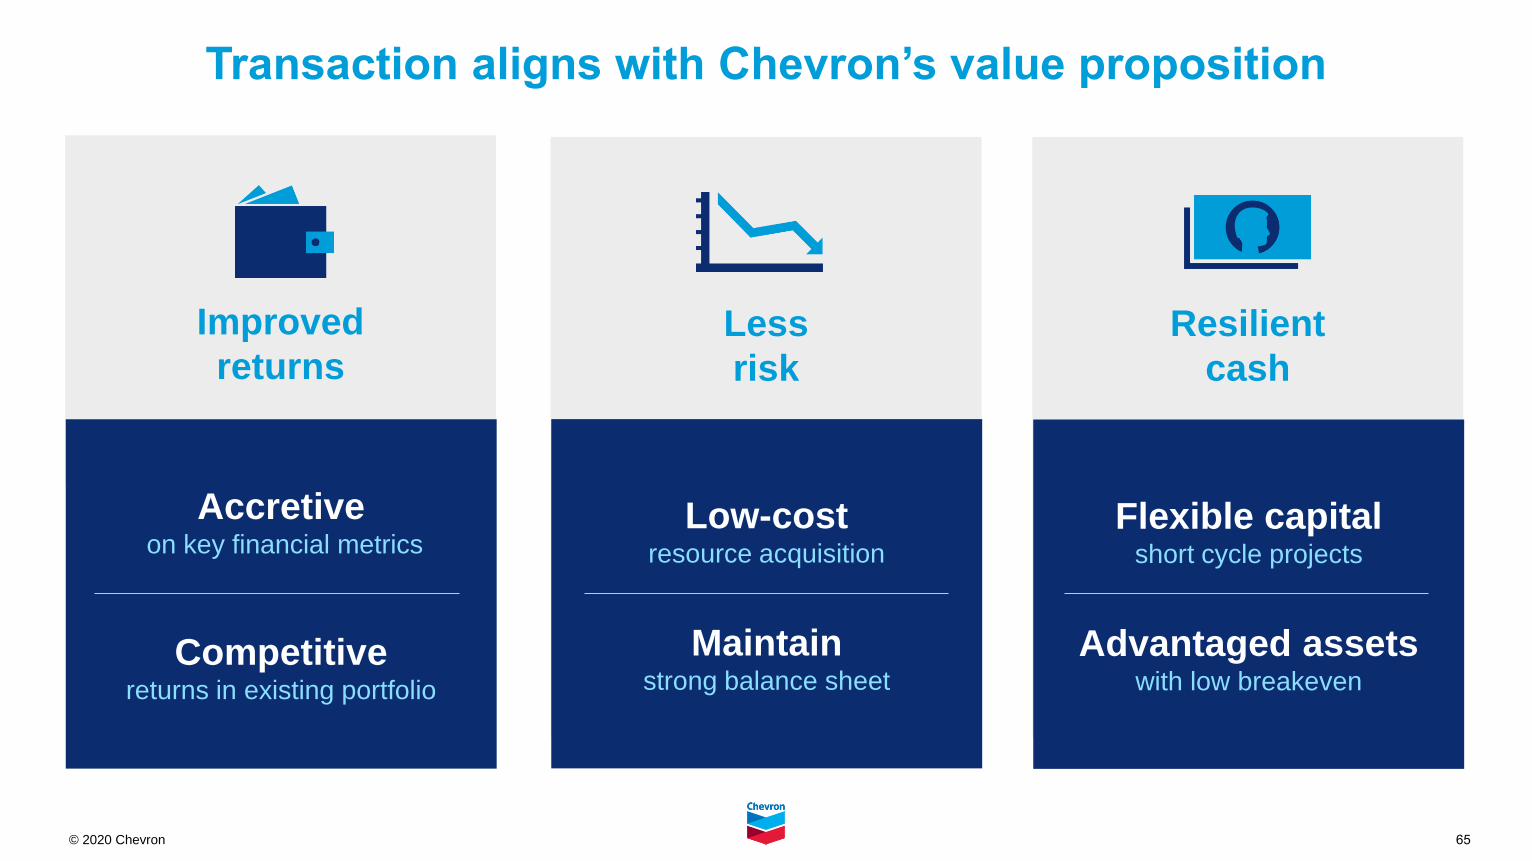
Resilient
cash
Flexible capitalshort cycle projects
Advantaged assetswith low breakeven
Improved
returns
Transaction aligns with Chevron’s value proposition
Less
risk
Low-costresource acquisition
Maintainstrong balance sheet
Accretiveon key financial metrics
Competitive returns in existing portfolio
© 2020 Chevron Corporation
Appendix Slides
© 2020 Chevron Corporation
Corporate
68© 2020 Chevron Corporation
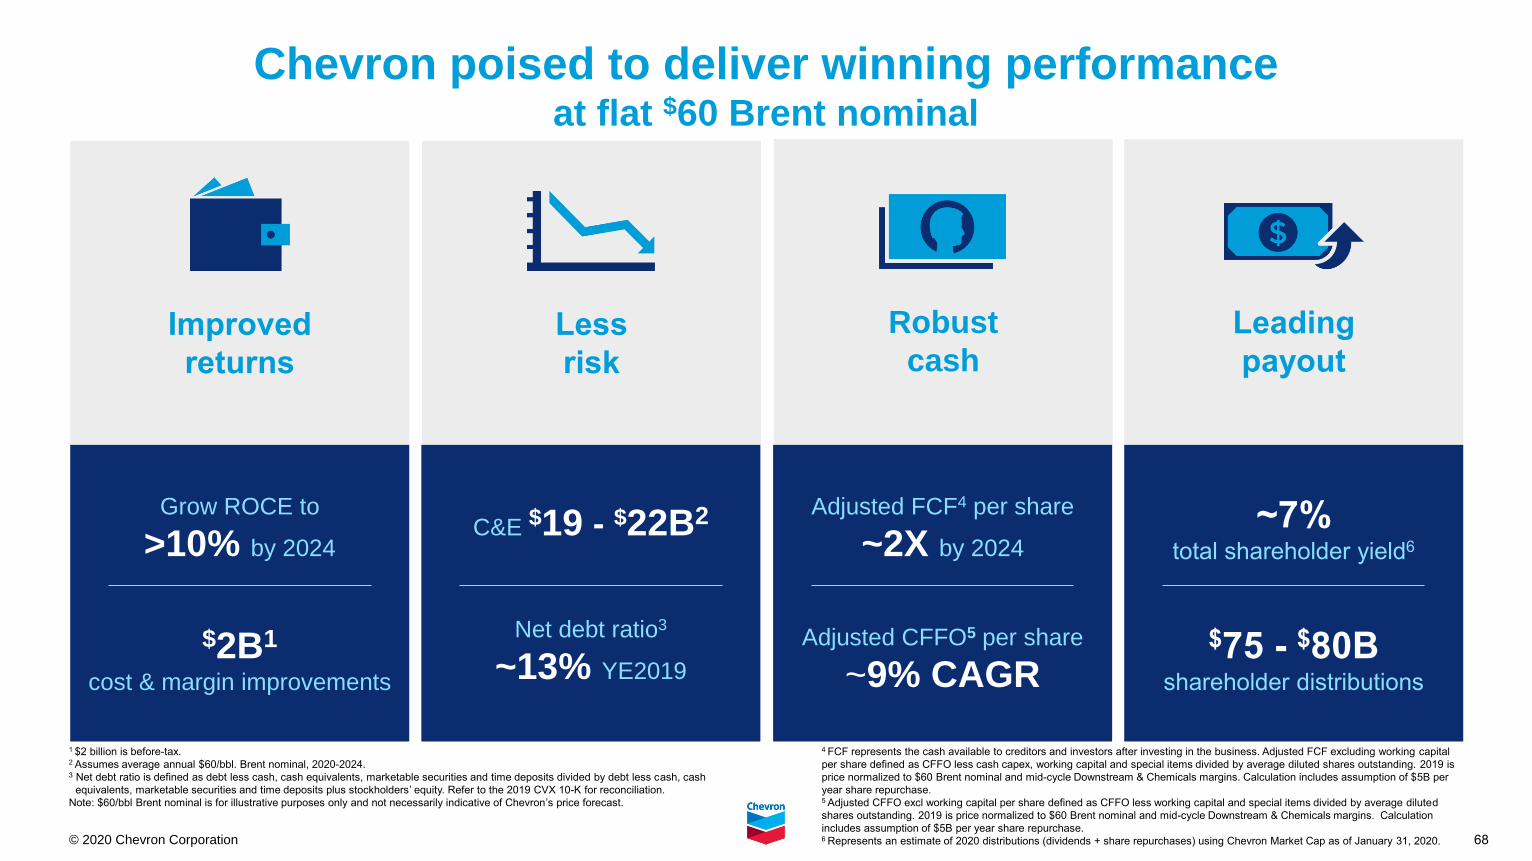
Chevron poised to deliver winning performanceat flat $60 Brent nominal
Leading
payout
~7%total shareholder yield6
$75 - $80Bshareholder distributions
Improved
returns
Grow ROCE to
>10% by 2024
$2B1
cost & margin improvements
Less
risk
C&E $19 - $22B2
Net debt ratio3
~13% YE2019
Robust
cash
Adjusted FCF4 per share
~2X by 2024
Adjusted CFFO5 per share
~9% CAGR
1 $2 billion is before-tax.2 Assumes average annual $60/bbl. Brent nominal, 2020-2024.3 Net debt ratio is defined as debt less cash, cash equivalents, marketable securities and time deposits divided by debt less cash, cash
equivalents, marketable securities and time deposits plus stockholders’ equity. Refer to the 2019 CVX 10-K for reconciliation.
Note: $60/bbl Brent nominal is for illustrative purposes only and not necessarily indicative of Chevron’s price forecast.
4 FCF represents the cash available to creditors and investors after investing in the business. Adjusted FCF excluding working capital
per share defined as CFFO less cash capex, working capital and special items divided by average diluted shares outstanding. 2019 is
price normalized to $60 Brent nominal and mid-cycle Downstream & Chemicals margins. Calculation includes assumption of $5B per
year share repurchase.5 Adjusted CFFO excl working capital per share defined as CFFO less working capital and special items divided by average diluted
shares outstanding. 2019 is price normalized to $60 Brent nominal and mid-cycle Downstream & Chemicals margins. Calculation
includes assumption of $5B per year share repurchase.6 Represents an estimate of 2020 distributions (dividends + share repurchases) using Chevron Market Cap as of January 31, 2020.
69© 2020 Chevron Corporation
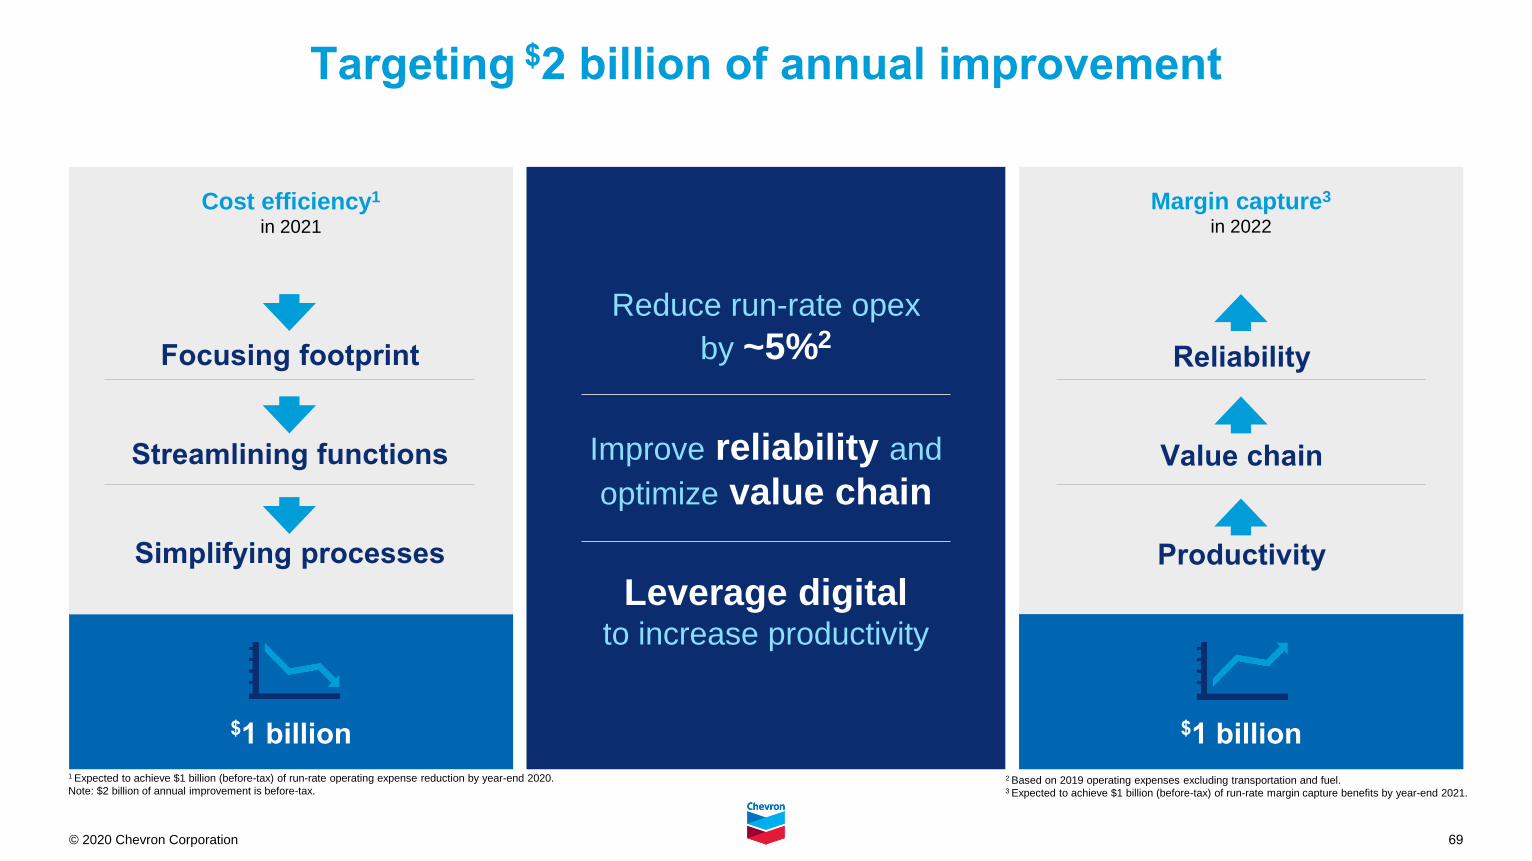
Targeting $2 billion of annual improvement
Cost efficiency1
in 2021
Margin capture3
in 2022
Reduce run-rate opex
by ~5%2
Improve reliability and
optimize value chain
Leverage digital to increase productivity
$1 billion $1 billion
Reliability
Value chain
Productivity
1 Expected to achieve $1 billion (before-tax) of run-rate operating expense reduction by year-end 2020.
Note: $2 billion of annual improvement is before-tax.
Focusing footprint
Streamlining functions
Simplifying processes
2 Based on 2019 operating expenses excluding transportation and fuel.3 Expected to achieve $1 billion (before-tax) of run-rate margin capture benefits by year-end 2021.
70© 2020 Chevron Corporation
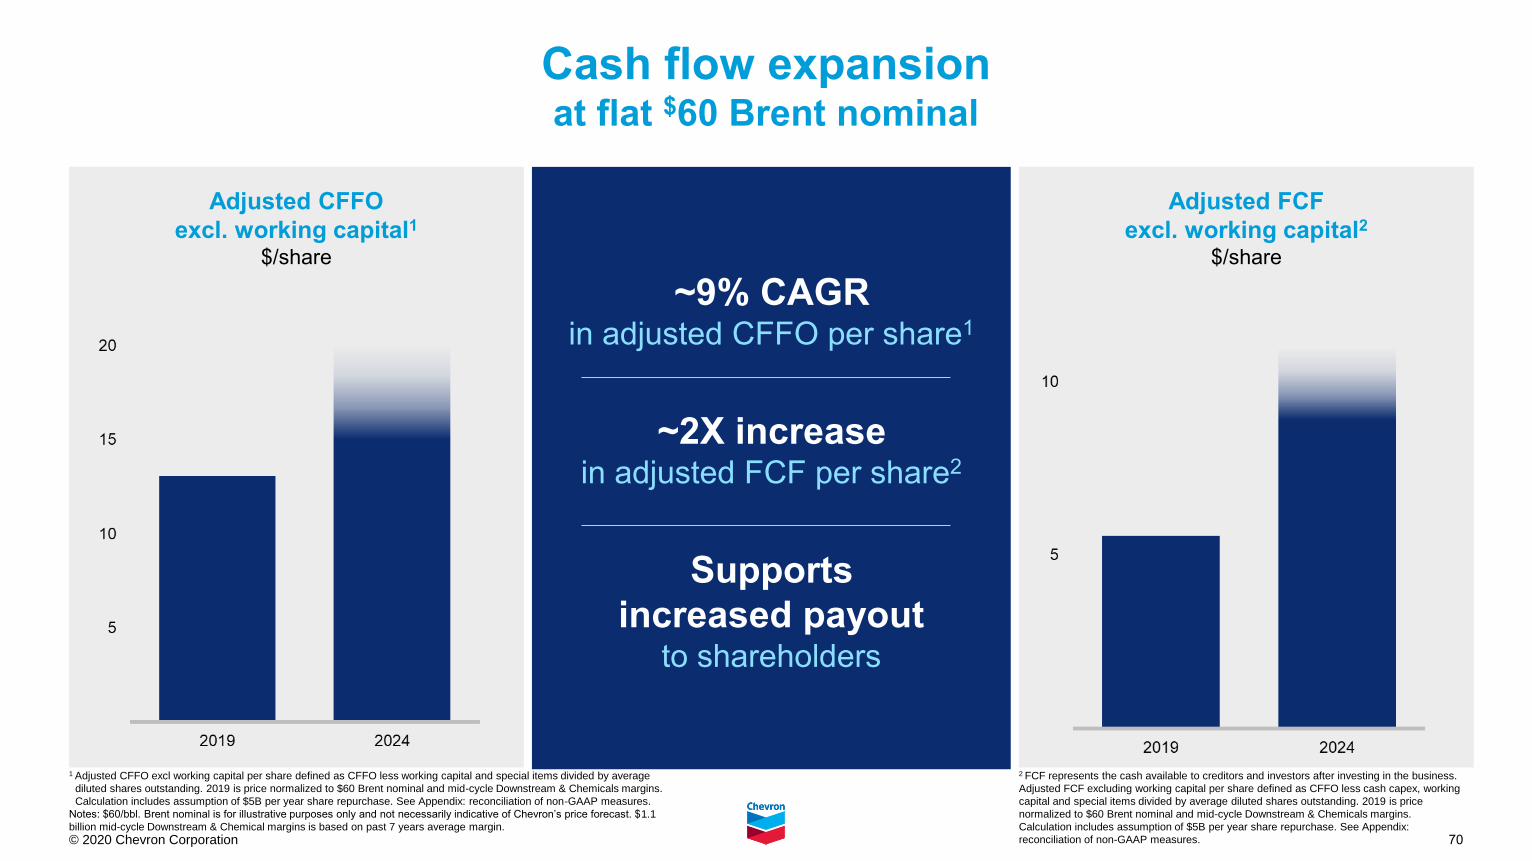
Adjusted CFFO
excl. working capital1
$/share
Cash flow expansion at flat $60 Brent nominal
~9% CAGR in adjusted CFFO per share1
~2X increase in adjusted FCF per share2
Supports
increased payoutto shareholders
1 Adjusted CFFO excl working capital per share defined as CFFO less working capital and special items divided by average
diluted shares outstanding. 2019 is price normalized to $60 Brent nominal and mid-cycle Downstream & Chemicals margins.
Calculation includes assumption of $5B per year share repurchase. See Appendix: reconciliation of non-GAAP measures.
Notes: $60/bbl. Brent nominal is for illustrative purposes only and not necessarily indicative of Chevron’s price forecast. $1.1
billion mid-cycle Downstream & Chemical margins is based on past 7 years average margin.
Adjusted FCF
excl. working capital2
$/share
2 FCF represents the cash available to creditors and investors after investing in the business.
Adjusted FCF excluding working capital per share defined as CFFO less cash capex, working
capital and special items divided by average diluted shares outstanding. 2019 is price
normalized to $60 Brent nominal and mid-cycle Downstream & Chemicals margins.
Calculation includes assumption of $5B per year share repurchase. See Appendix:
reconciliation of non-GAAP measures.
71© 2020 Chevron Corporation
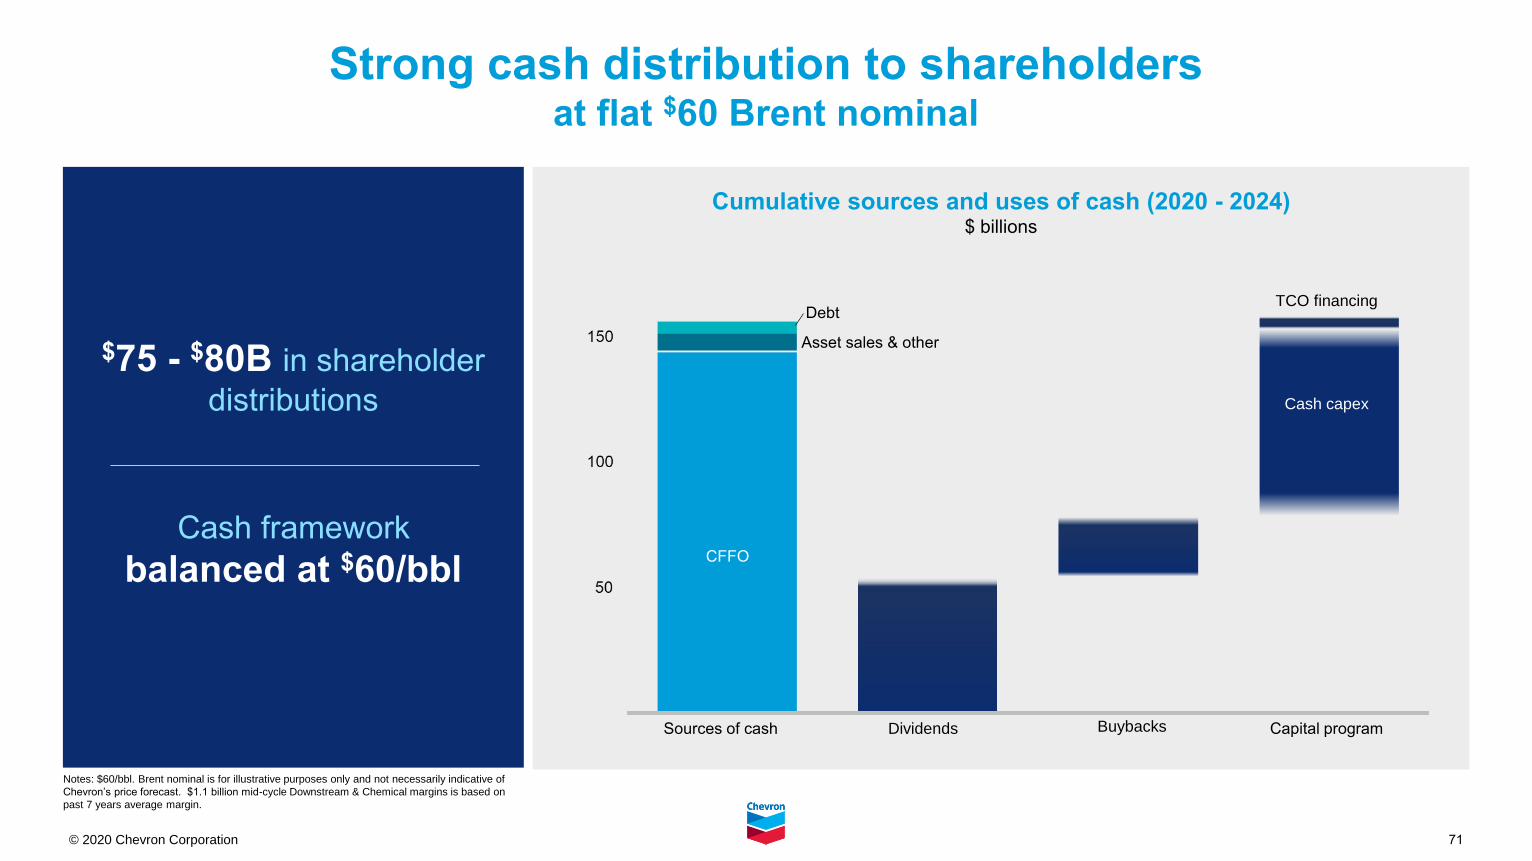
Cumulative sources and uses of cash (2020 - 2024)$ billions
Strong cash distribution to shareholdersat flat $60 Brent nominal
Sources of cash Buybacks Capital programDividends
Cash capex
TCO financingDebt
CFFO
$75 - $80B in shareholder
distributions
Cash framework
balanced at $60/bbl
Notes: $60/bbl. Brent nominal is for illustrative purposes only and not necessarily indicative of
Chevron’s price forecast. $1.1 billion mid-cycle Downstream & Chemical margins is based on
past 7 years average margin.
Asset sales & other
© 2020 Chevron Corporation
Upstream
73© 2020 Chevron Corporation
Upstream cash margin2
$/BOE
Net production MMBOED
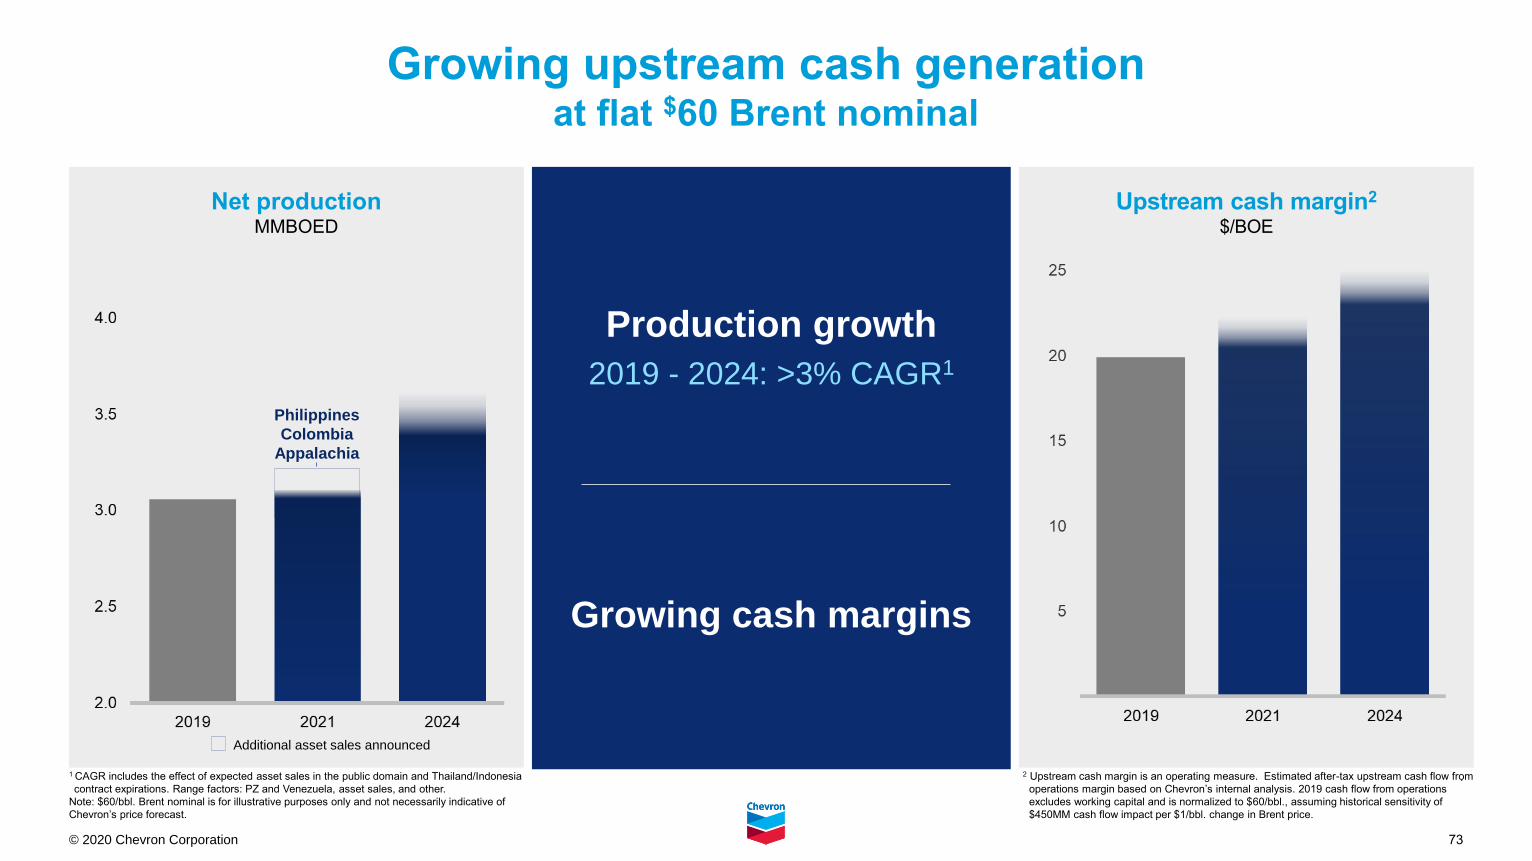
Growing upstream cash generationat flat $60 Brent nominal
Production growth
2019 - 2024: >3% CAGR1
Growing cash margins
1 CAGR includes the effect of expected asset sales in the public domain and Thailand/Indonesia
contract expirations. Range factors: PZ and Venezuela, asset sales, and other.
Note: $60/bbl. Brent nominal is for illustrative purposes only and not necessarily indicative of
Chevron’s price forecast.
.
Philippines
Colombia
Appalachia
Additional asset sales announced
2 Upstream cash margin is an operating measure. Estimated after-tax upstream cash flow from
operations margin based on Chevron’s internal analysis. 2019 cash flow from operations
excludes working capital and is normalized to $60/bbl., assuming historical sensitivity of
$450MM cash flow impact per $1/bbl. change in Brent price.
74© 2020 Chevron Corporation
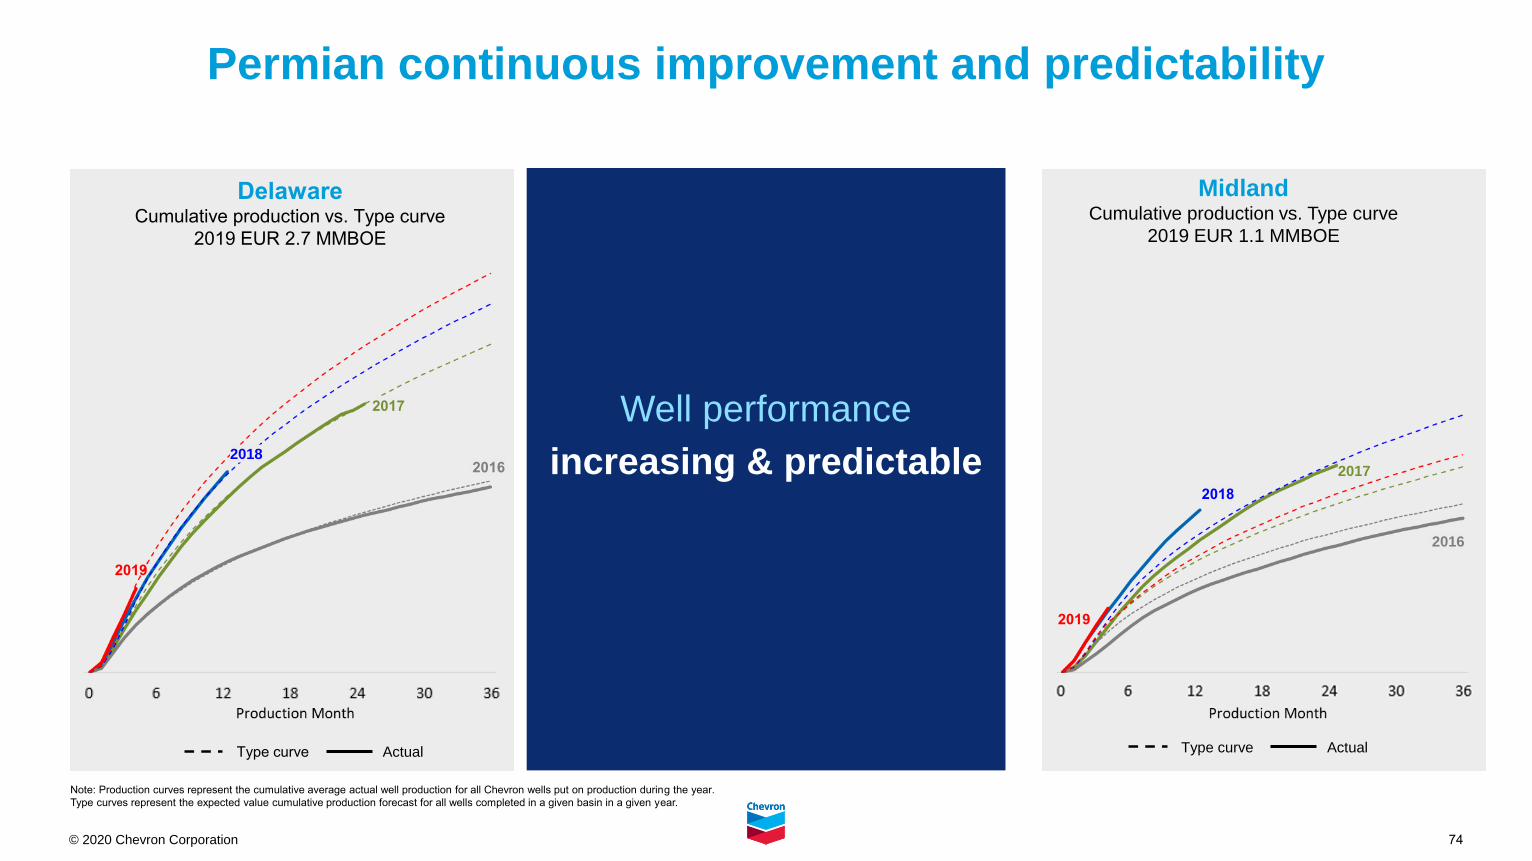
Permian continuous improvement and predictability
DelawareCumulative production vs. Type curve
2019 EUR 2.7 MMBOE
2016
2017
2018
2019
Midland Cumulative production vs. Type curve
2019 EUR 1.1 MMBOE
2016
2017
2018
2019
ActualType curve ActualType curve
Well performance
increasing & predictable
Note: Production curves represent the cumulative average actual well production for all Chevron wells put on production during the year.
Type curves represent the expected value cumulative production forecast for all wells completed in a given basin in a given year.
75© 2020 Chevron Corporation
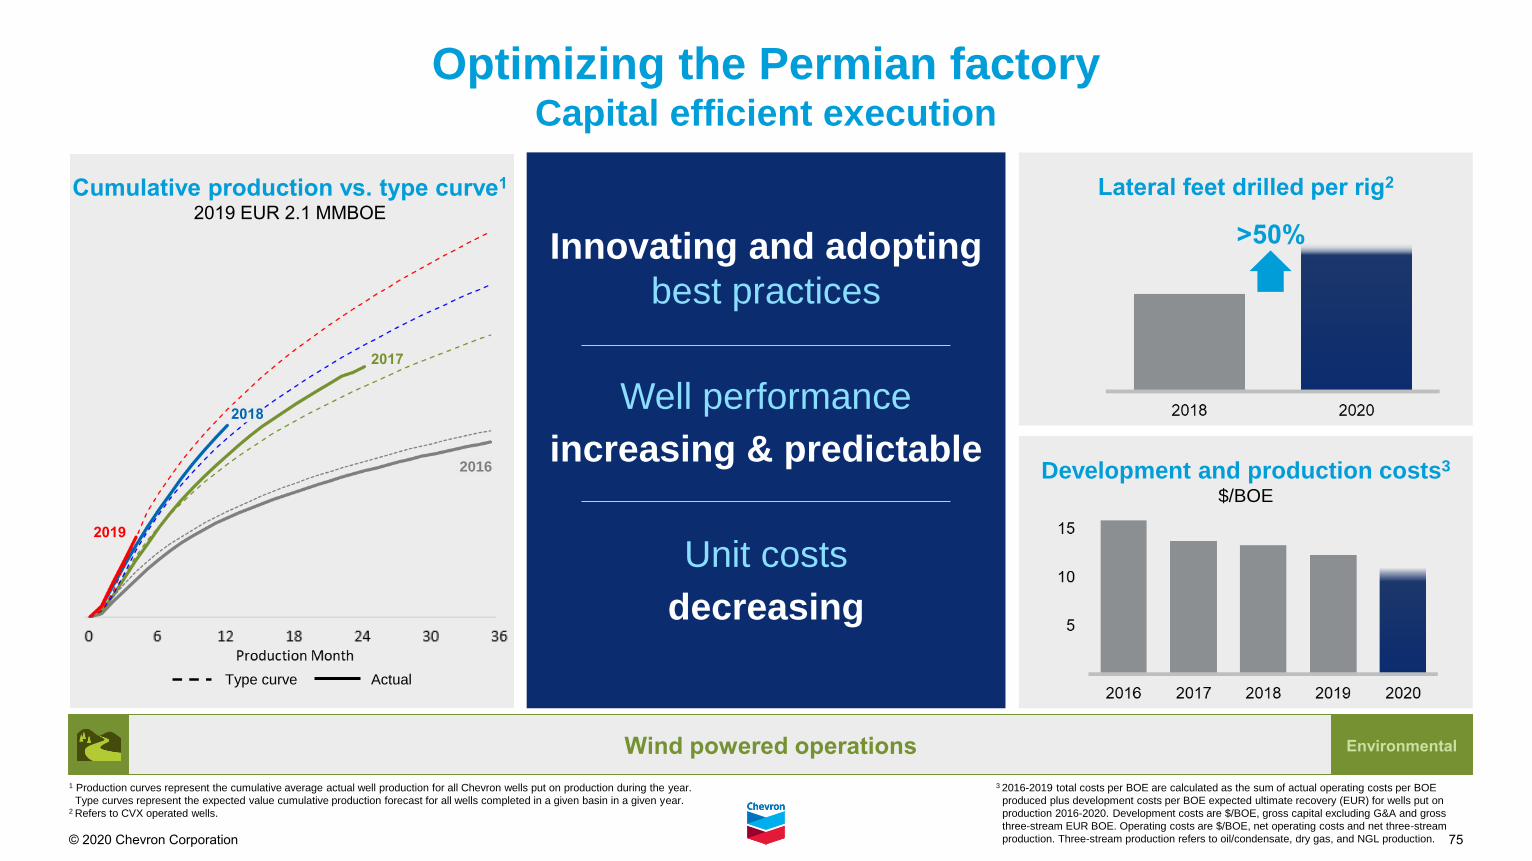
Development and production costs3
$/BOE
Lateral feet drilled per rig2
Optimizing the Permian factoryCapital efficient execution
Innovating and adopting
best practices
Well performance
increasing & predictable
Unit costs
decreasing
>50%
EnvironmentalWind powered operations
3 2016-2019 total costs per BOE are calculated as the sum of actual operating costs per BOE
produced plus development costs per BOE expected ultimate recovery (EUR) for wells put on
production 2016-2020. Development costs are $/BOE, gross capital excluding G&A and gross
three-stream EUR BOE. Operating costs are $/BOE, net operating costs and net three-stream
production. Three-stream production refers to oil/condensate, dry gas, and NGL production.
Cumulative production vs. type curve1
2019 EUR 2.1 MMBOE
ActualType curve
2016
2017
2018
2019
1 Production curves represent the cumulative average actual well production for all Chevron wells put on production during the year.
Type curves represent the expected value cumulative production forecast for all wells completed in a given basin in a given year.2 Refers to CVX operated wells.
© 2020 Chevron Corporation
Downstream & Chemicals
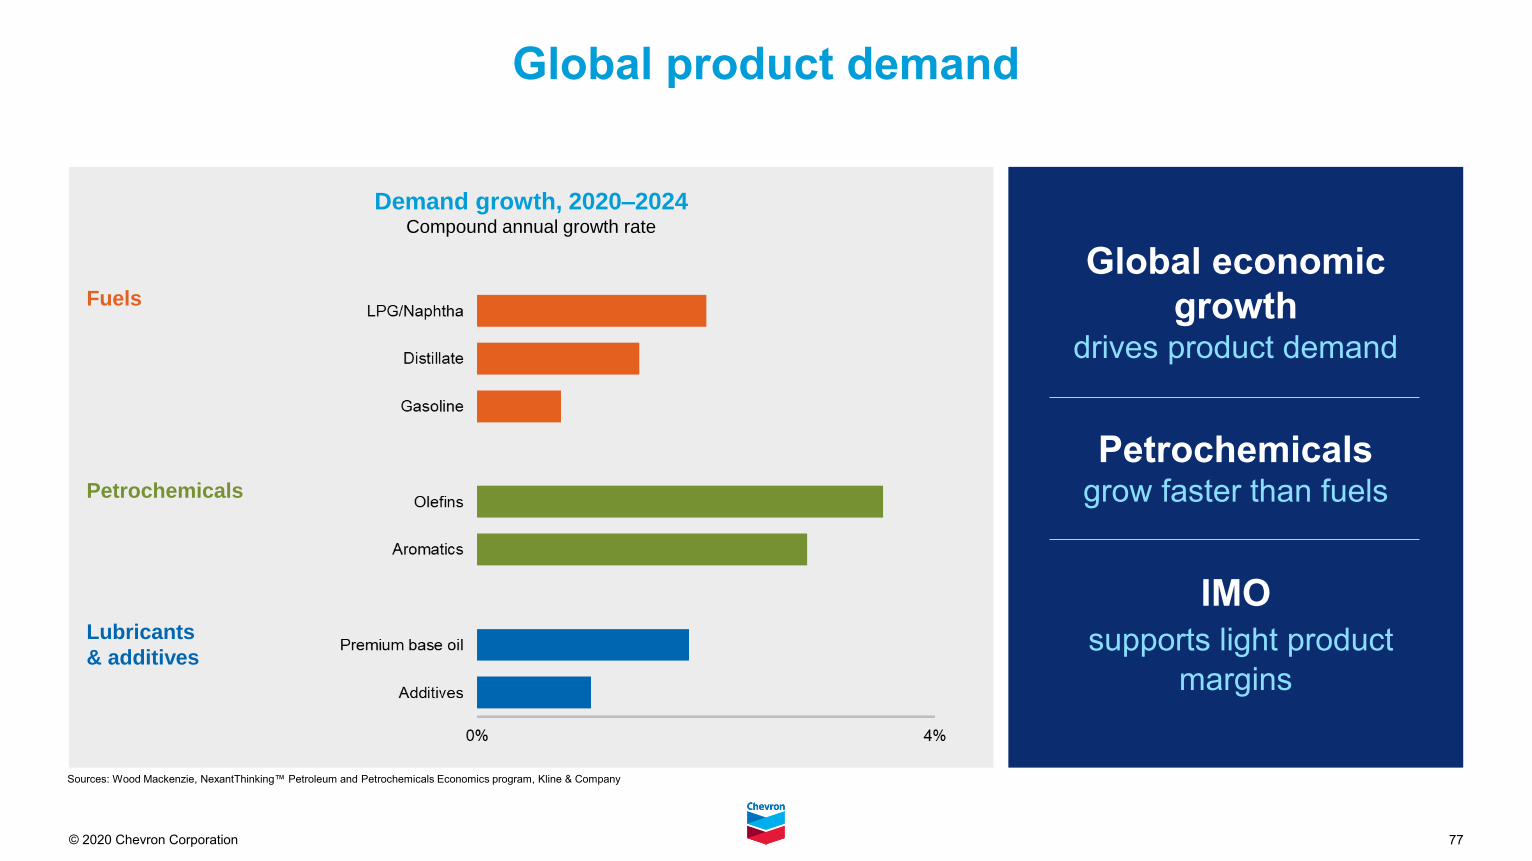
77© 2020 Chevron Corporation
Demand growth, 2020–2024 Compound annual growth rate
Global product demand
Global economic
growthdrives product demand
Petrochemicals grow faster than fuels
IMO
supports light product
margins
Sources: Wood Mackenzie, NexantThinking™ Petroleum and Petrochemicals Economics program, Kline & Company
Fuels
Petrochemicals
Lubricants
& additives
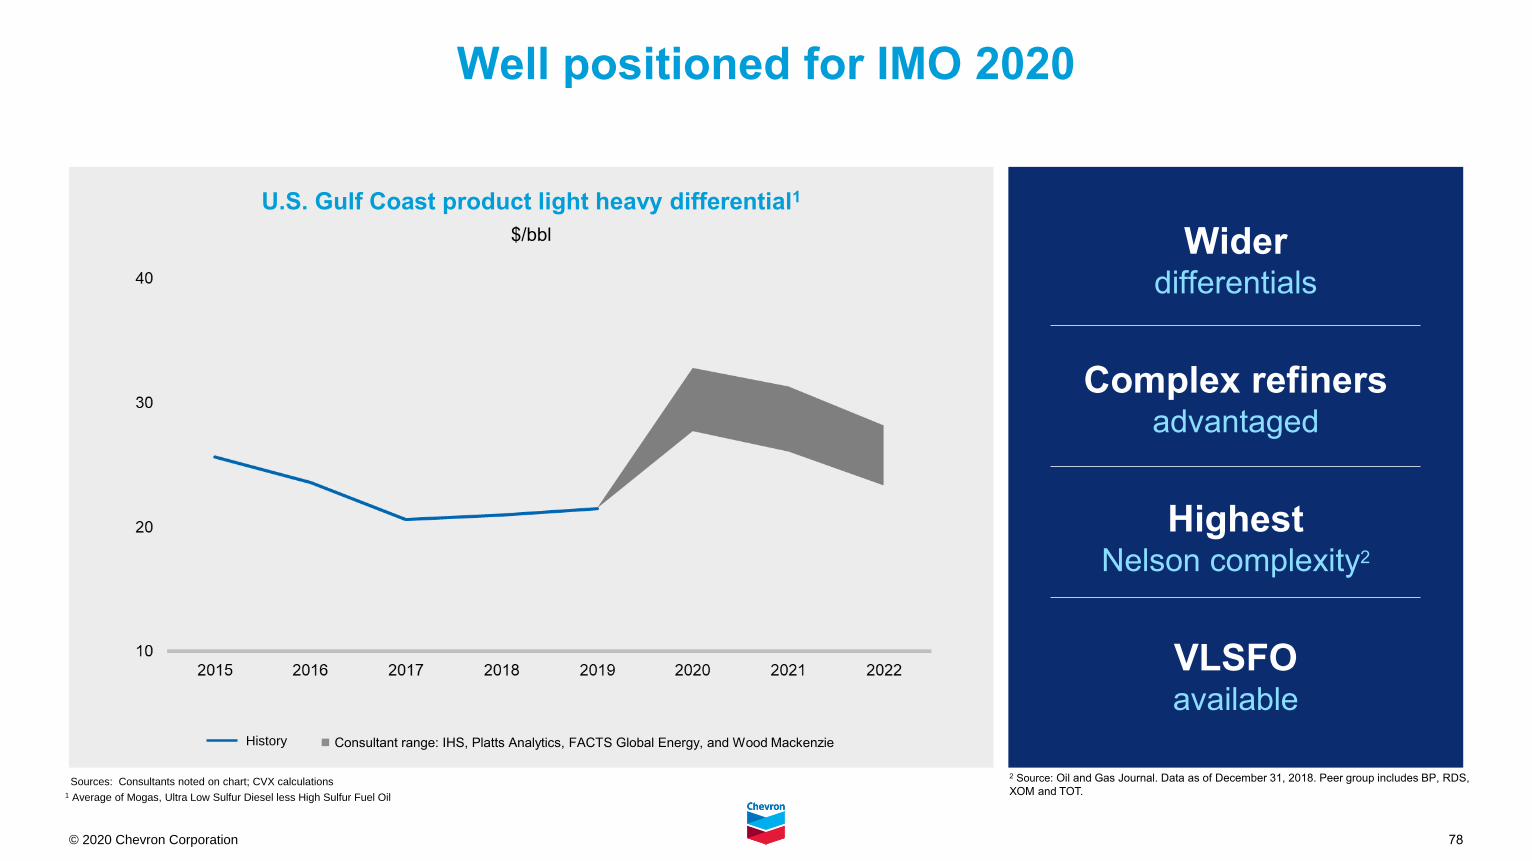
78© 2020 Chevron Corporation
Well positioned for IMO 2020
U.S. Gulf Coast product light heavy differential1
$/bbl Wider differentials
Complex refiners advantaged
HighestNelson complexity2
VLSFOavailable
Sources: Consultants noted on chart; CVX calculations
1 Average of Mogas, Ultra Low Sulfur Diesel less High Sulfur Fuel Oil
◼︎ Consultant range: IHS, Platts Analytics, FACTS Global Energy, and Wood Mackenzie
2 Source: Oil and Gas Journal. Data as of December 31, 2018. Peer group includes BP, RDS,
XOM and TOT.
History
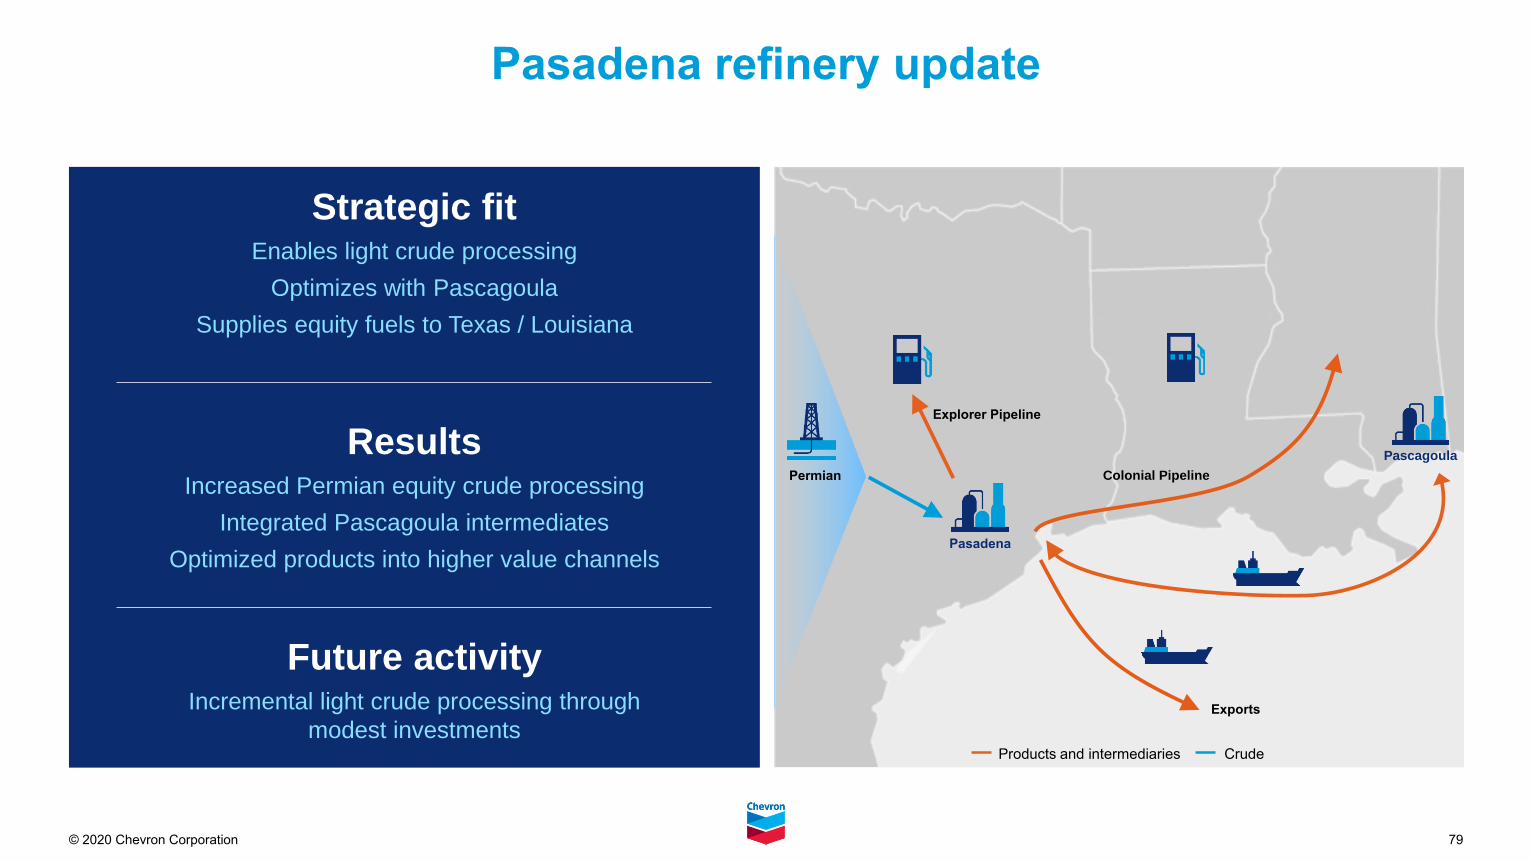
79© 2020 Chevron Corporation
Pasadena refinery update
Strategic fitEnables light crude processing
Optimizes with Pascagoula
Supplies equity fuels to Texas / Louisiana
ResultsIncreased Permian equity crude processing
Integrated Pascagoula intermediates
Optimized products into higher value channels
Future activityIncremental light crude processing through
modest investments
Pascagoula
Pasadena
Exports
Colonial Pipeline
Explorer Pipeline
Permian
Products and intermediaries Crude
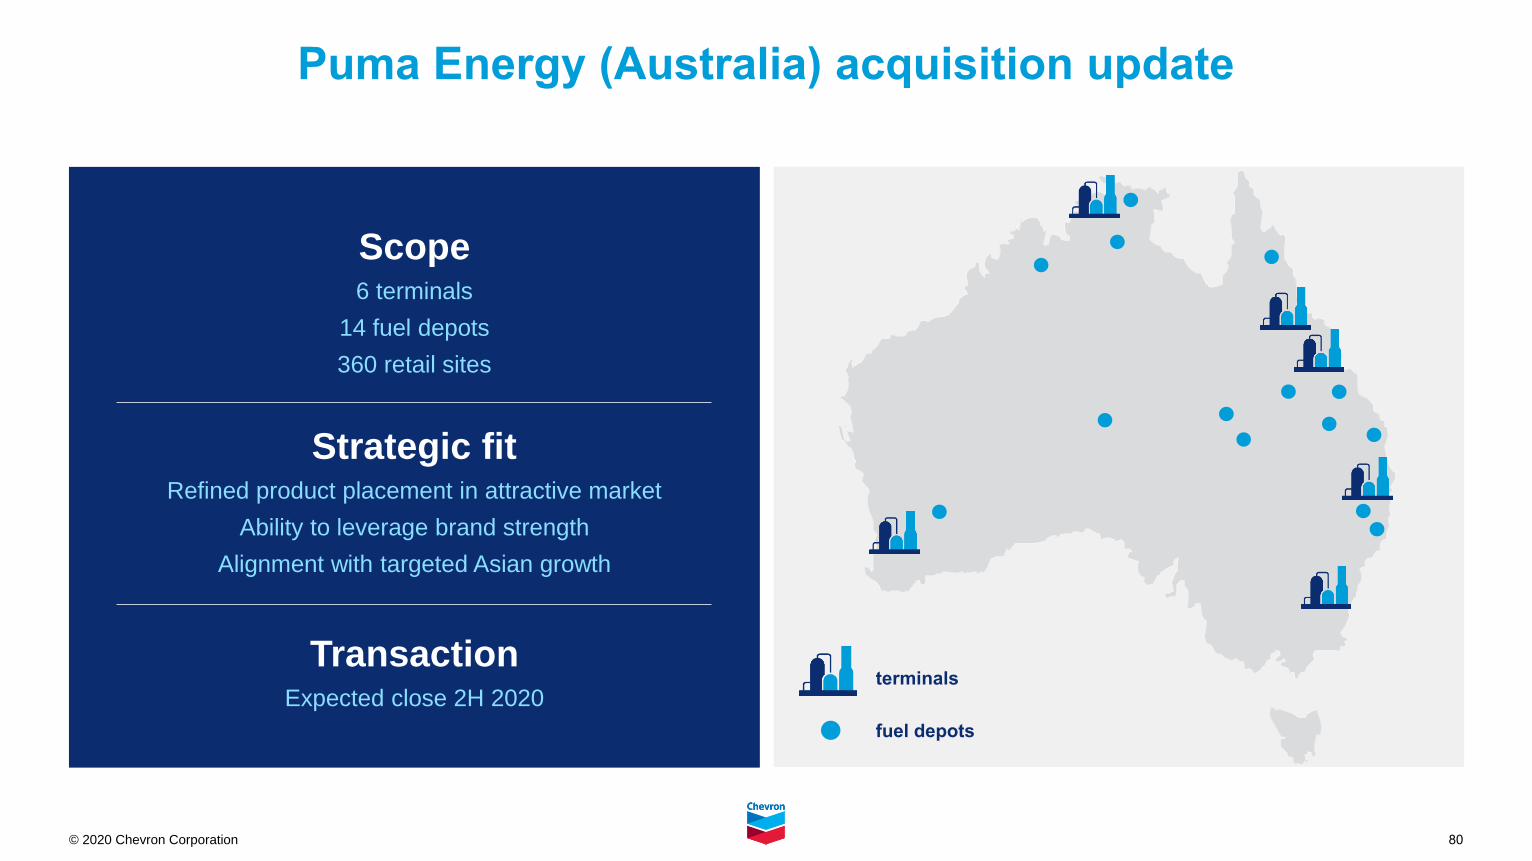
80© 2020 Chevron Corporation
Puma Energy (Australia) acquisition update
Scope6 terminals
14 fuel depots
360 retail sites
Strategic fitRefined product placement in attractive market
Ability to leverage brand strength
Alignment with targeted Asian growth
TransactionExpected close 2H 2020
terminals
fuel depots
© 2020 Chevron Corporation
ESG
82© 2020 Chevron Corporation
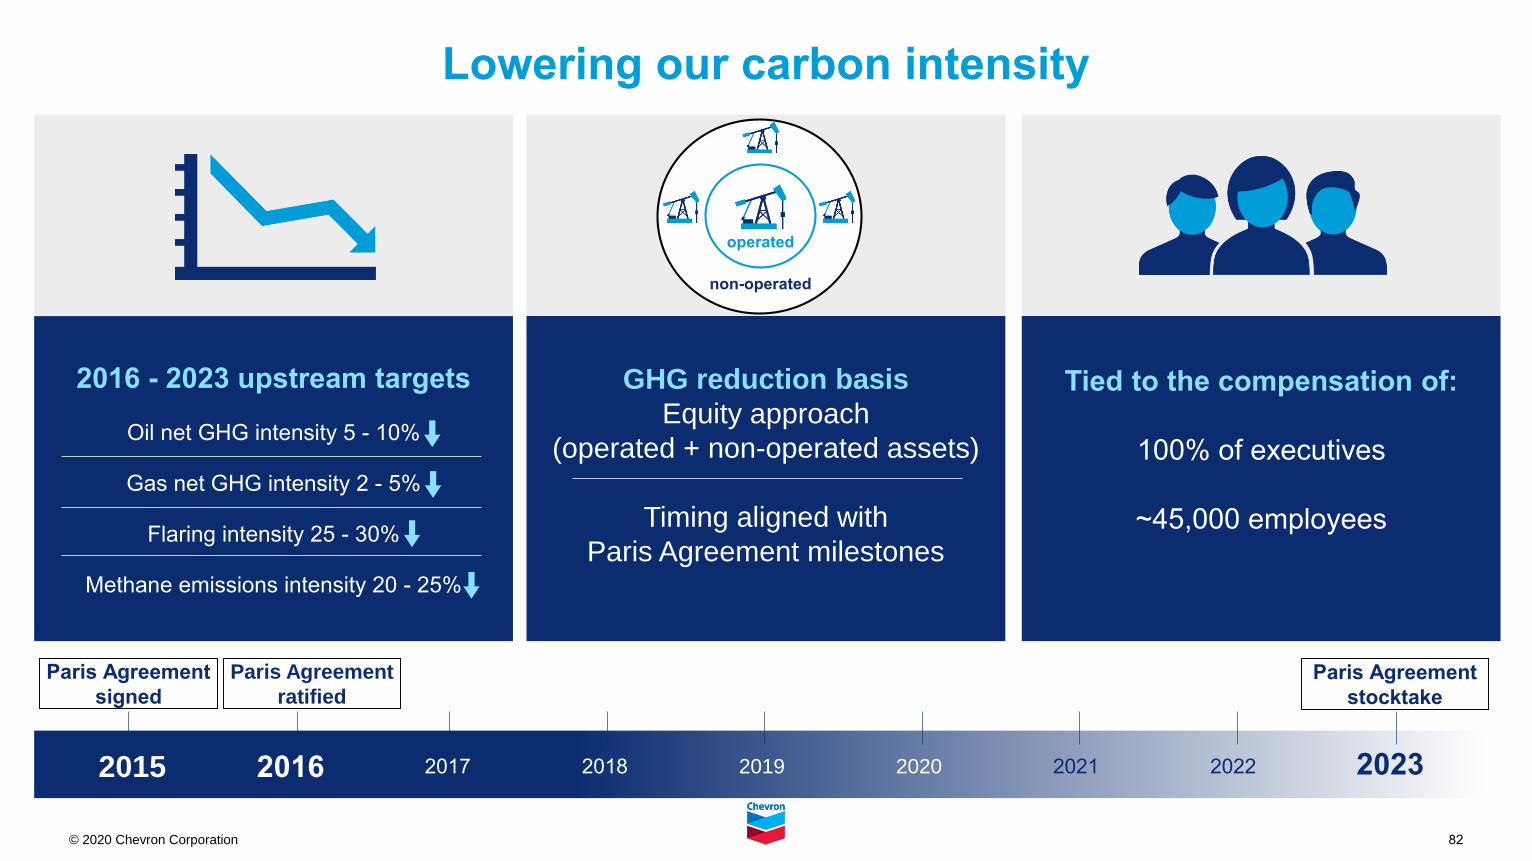
Lowering our carbon intensity
non-operated
operated
Tied to the compensation of:
100% of executives
~45,000 employees
20222015 2016 2017 2018 2019 2020 2021 2023
Paris Agreement
ratified
Paris Agreement
stocktake
Paris Agreement
signed
2016 - 2023 upstream targets
Oil net GHG intensity 5 - 10%
Gas net GHG intensity 2 - 5%
Flaring intensity 25 - 30%
Methane emissions intensity 20 - 25%
GHG reduction basis
Equity approach
(operated + non-operated assets)
Timing aligned with
Paris Agreement milestones
83© 2020 Chevron Corporation
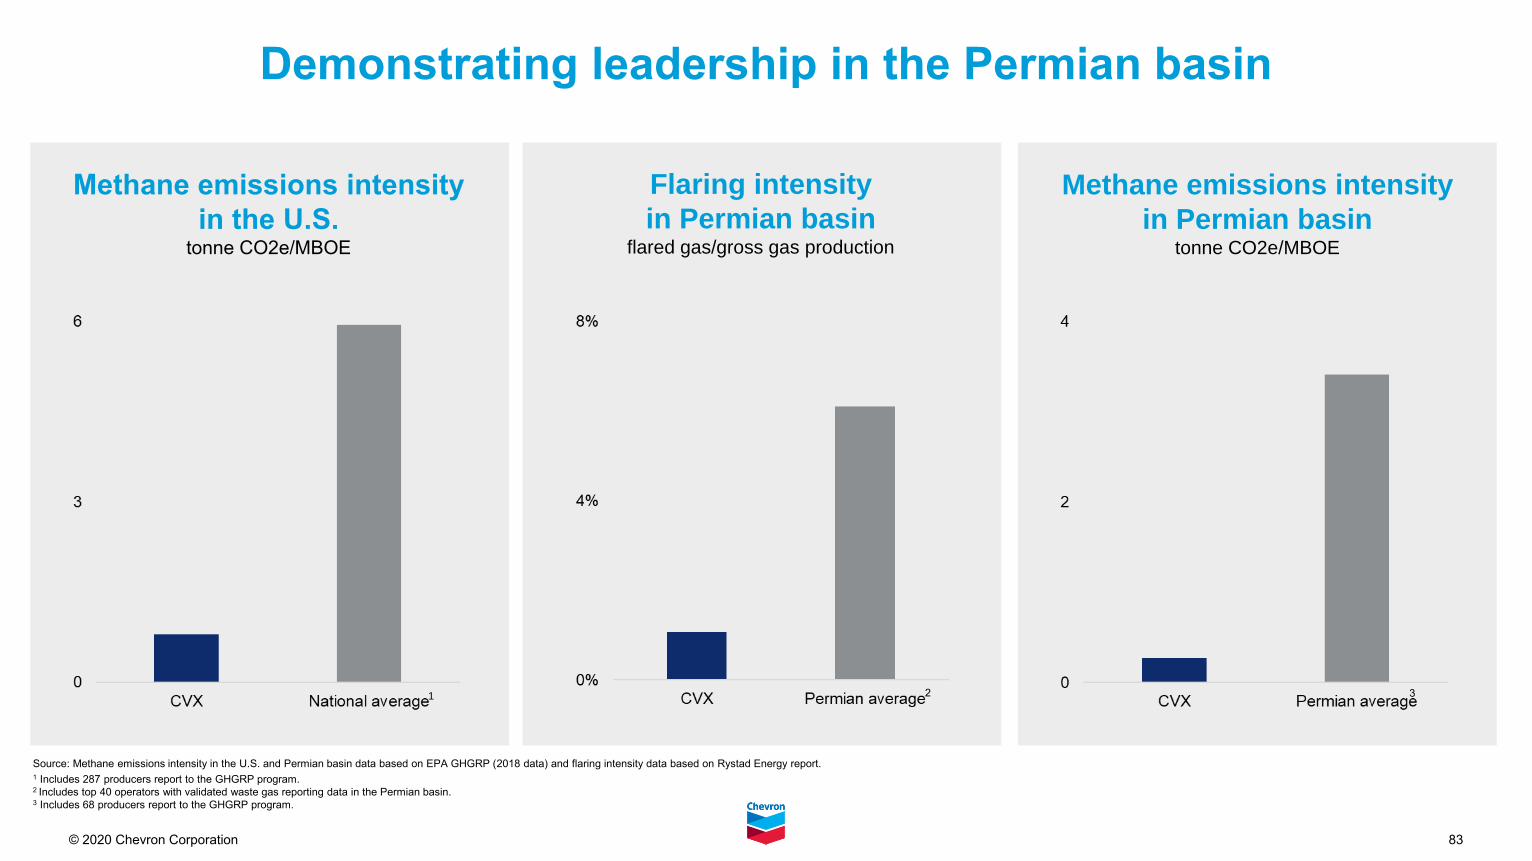
Demonstrating leadership in the Permian basin
Methane emissions intensity
in the U.S.tonne CO2e/MBOE
Flaring intensity
in Permian basin flared gas/gross gas production
Methane emissions intensity
in Permian basintonne CO2e/MBOE
Source: Methane emissions intensity in the U.S. and Permian basin data based on EPA GHGRP (2018 data) and flaring intensity data based on Rystad Energy report. 1 Includes 287 producers report to the GHGRP program.2 Includes top 40 operators with validated waste gas reporting data in the Permian basin.3 Includes 68 producers report to the GHGRP program.
1 32
84© 2020 Chevron Corporation
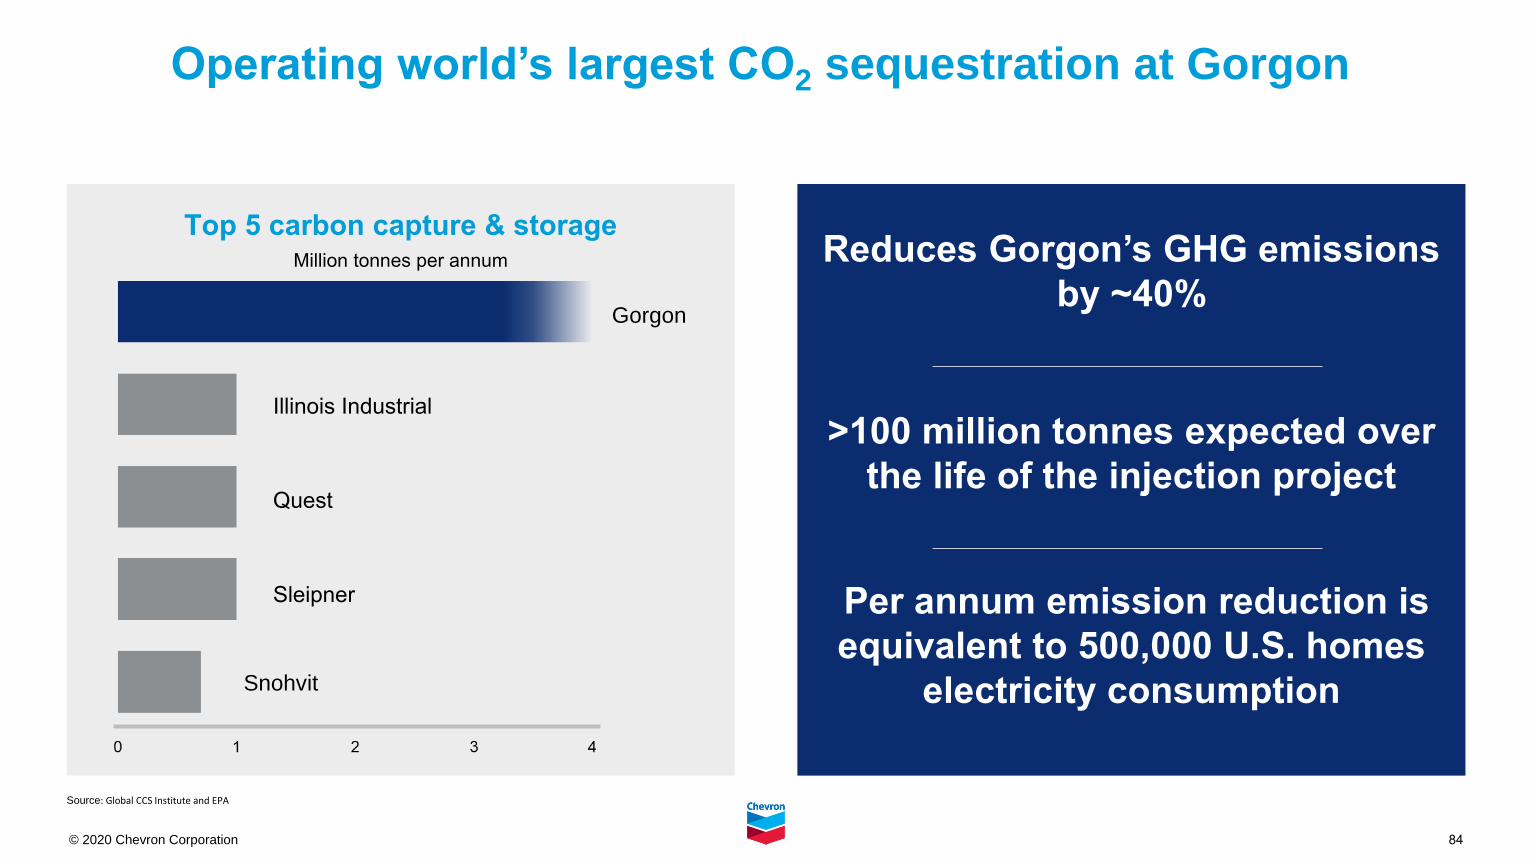
Operating world’s largest CO2 sequestration at Gorgon
Reduces Gorgon’s GHG emissions
by ~40%
>100 million tonnes expected over
the life of the injection project
Per annum emission reduction is
equivalent to 500,000 U.S. homes
electricity consumption
Top 5 carbon capture & storageMillion tonnes per annum
Gorgon
Illinois Industrial
Quest
Sleipner
Snohvit
Source: Global CCS Institute and EPA
85© 2020 Chevron Corporation
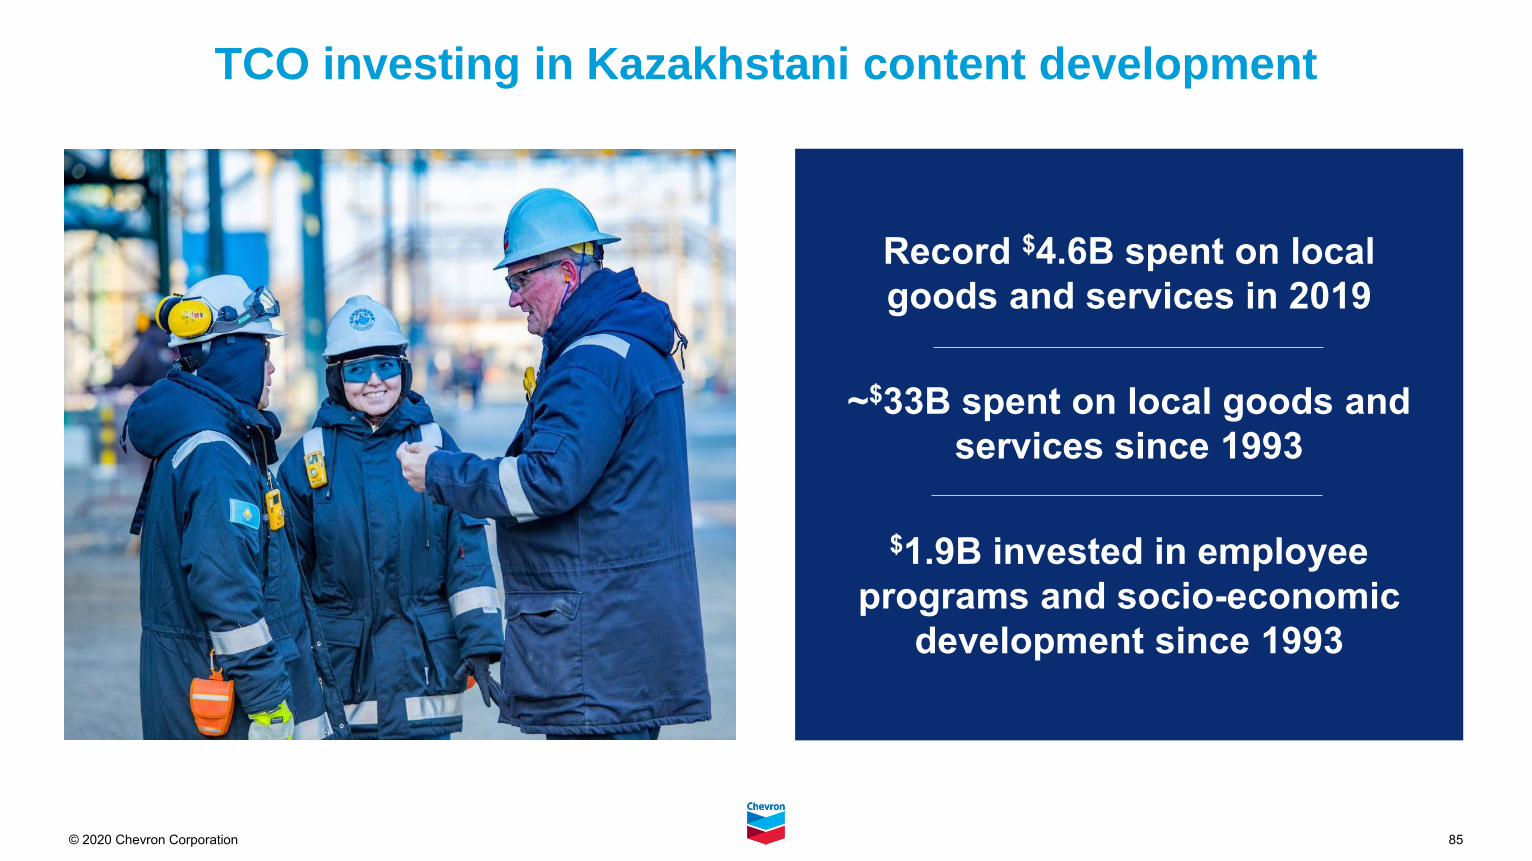
TCO investing in Kazakhstani content development
Record $4.6B spent on local
goods and services in 2019
~$33B spent on local goods and
services since 1993
$1.9B invested in employee
programs and socio-economic
development since 1993
86© 2020 Chevron Corporation
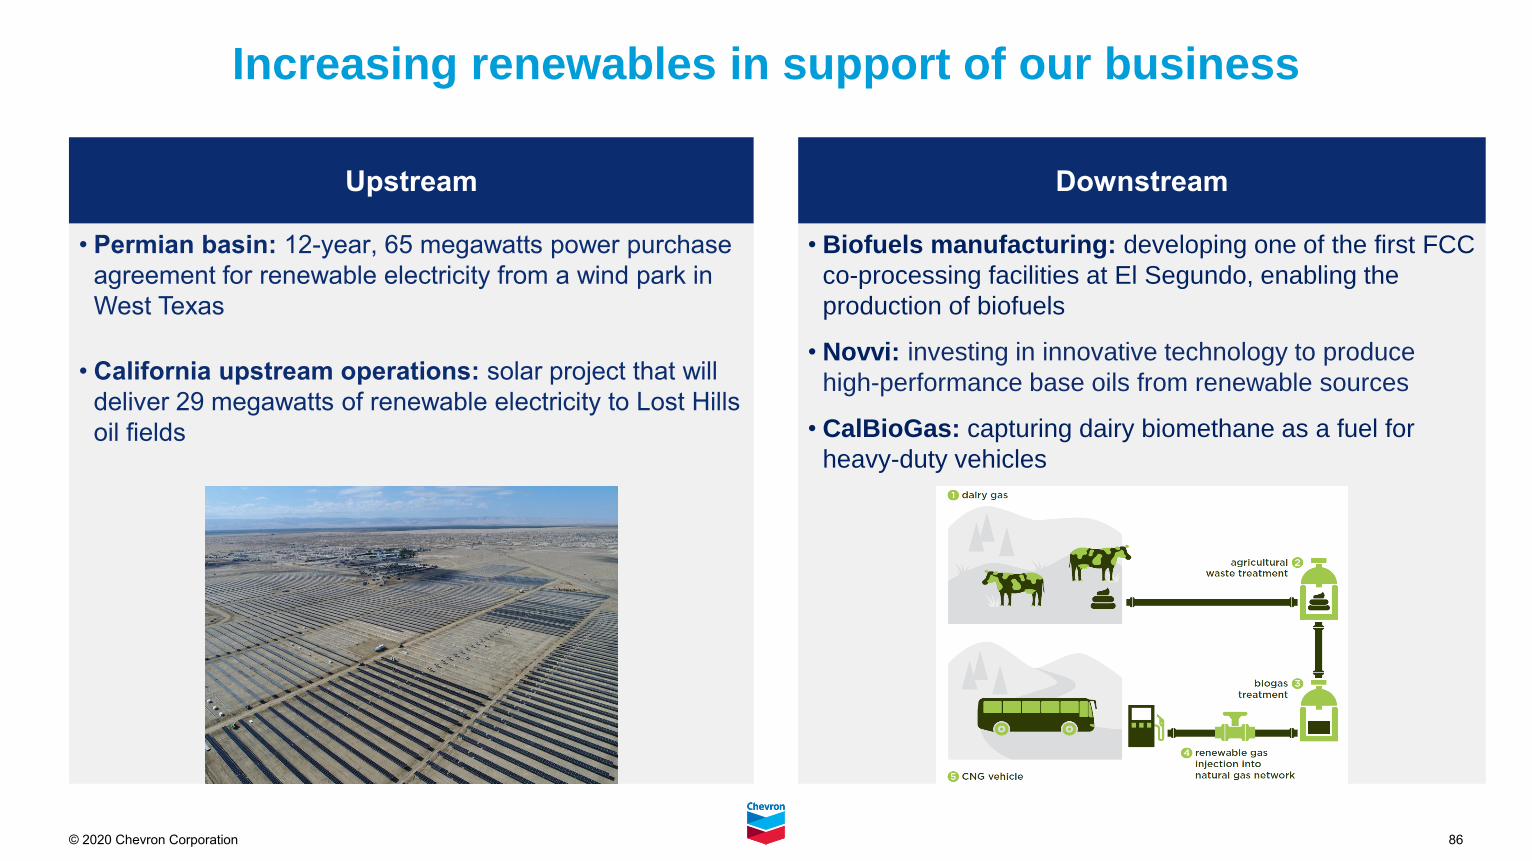
• Permian basin: 12-year, 65 megawatts power purchase
agreement for renewable electricity from a wind park in
West Texas
• California upstream operations: solar project that will
deliver 29 megawatts of renewable electricity to Lost Hills
oil fields
Upstream
Increasing renewables in support of our business
• Biofuels manufacturing: developing one of the first FCC
co-processing facilities at El Segundo, enabling the
production of biofuels
• Novvi: investing in innovative technology to produce
high-performance base oils from renewable sources
• CalBioGas: capturing dairy biomethane as a fuel for
heavy-duty vehicles
Downstream
87© 2020 Chevron Corporation
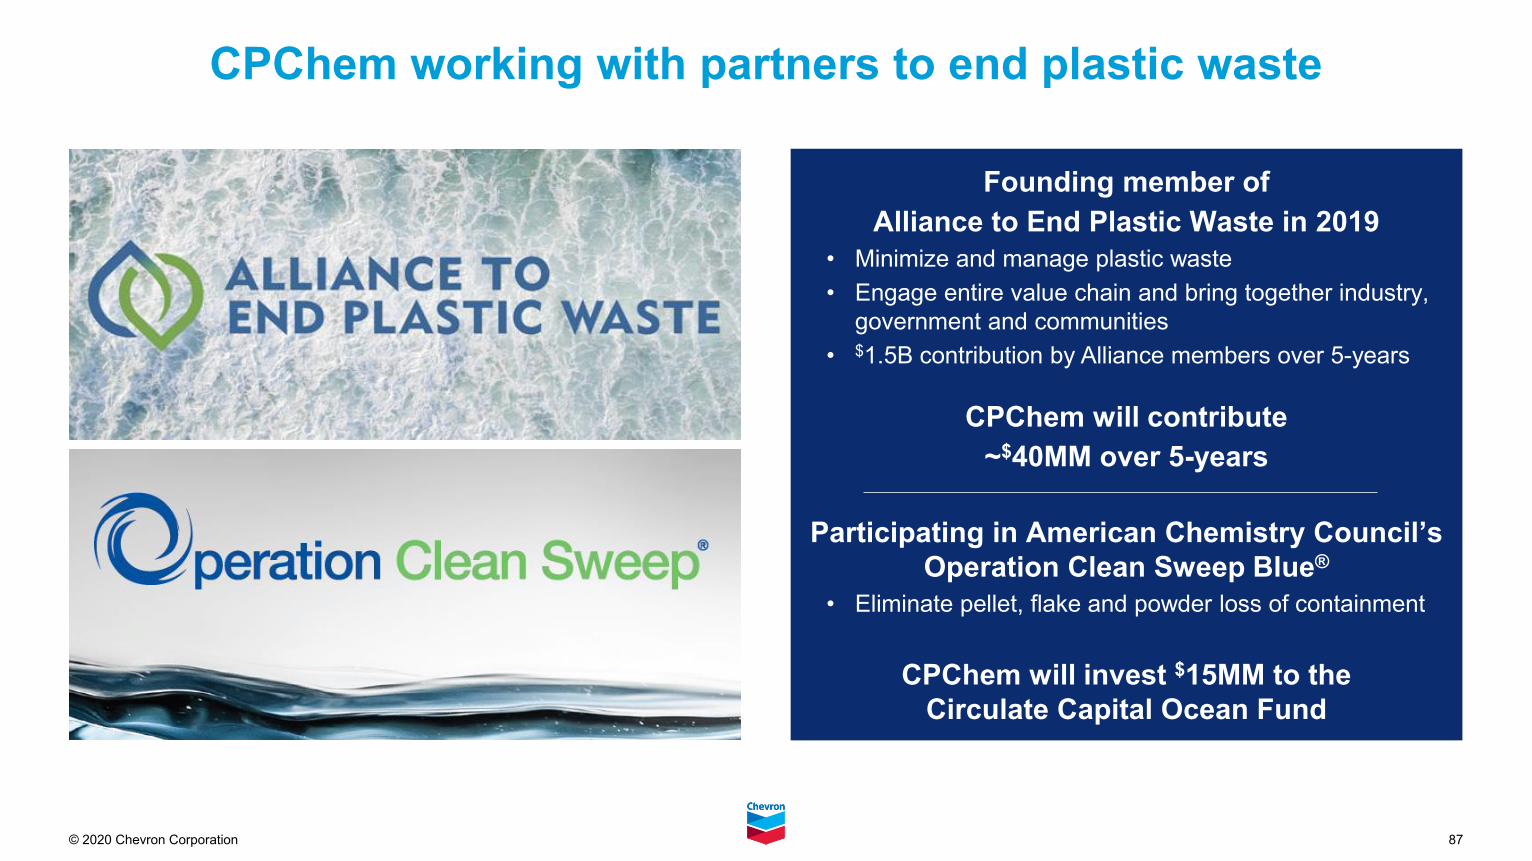
Founding member of
Alliance to End Plastic Waste in 2019
• Minimize and manage plastic waste
• Engage entire value chain and bring together industry,
government and communities
• $1.5B contribution by Alliance members over 5-years
CPChem will contribute
~$40MM over 5-years
Participating in American Chemistry Council’s
Operation Clean Sweep Blue®
• Eliminate pellet, flake and powder loss of containment
CPChem will invest $15MM to the
Circulate Capital Ocean Fund
CPChem working with partners to end plastic waste
88© 2020 Chevron Corporation
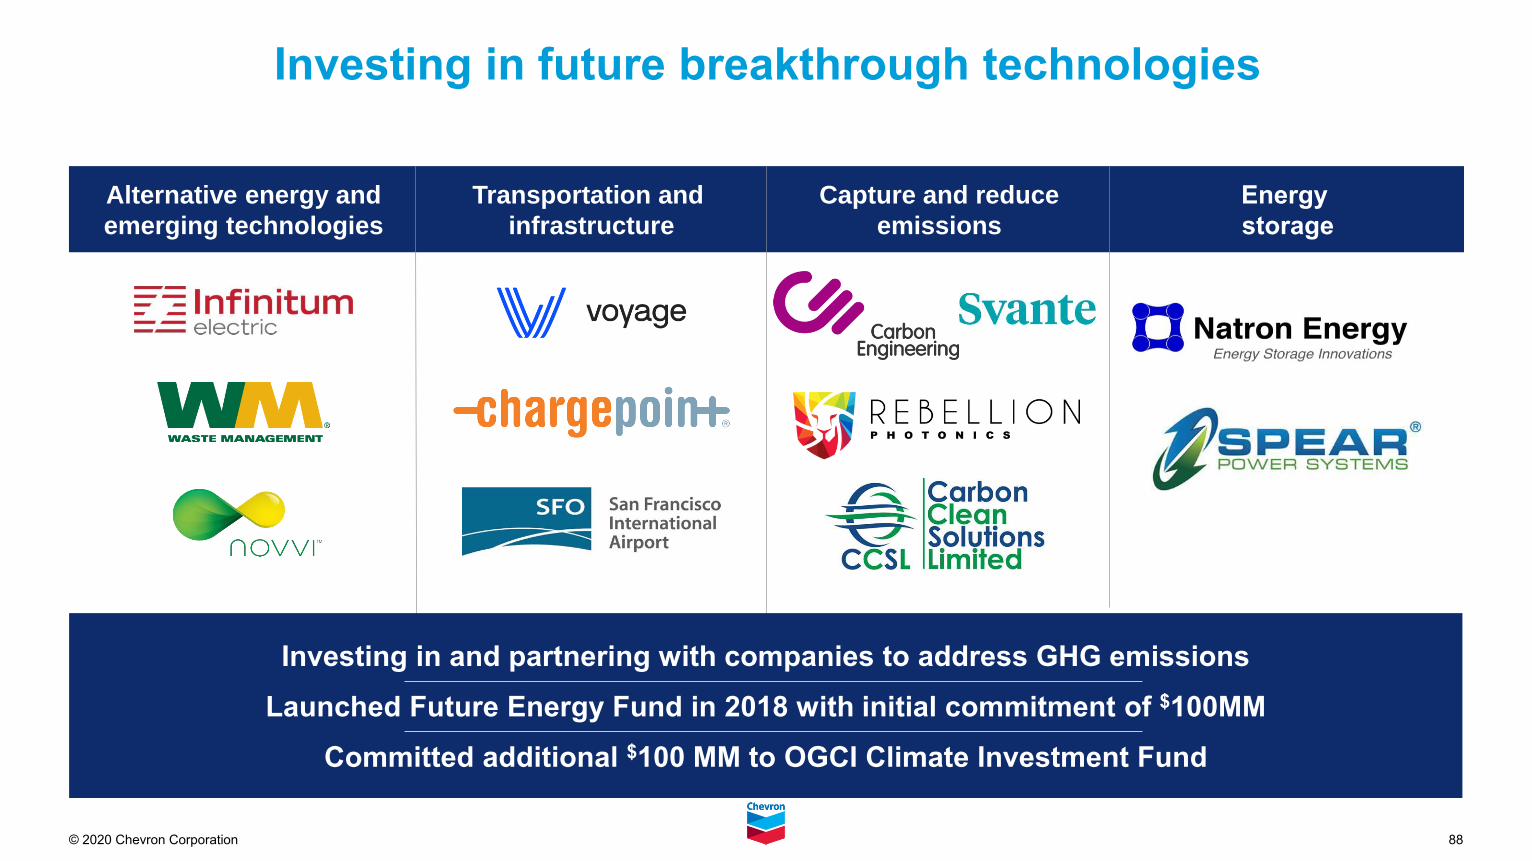
Alternative energy and
emerging technologies
Transportation and
infrastructure
Capture and reduce
emissions
Energy
storage
Investing in future breakthrough technologies
Investing in and partnering with companies to address GHG emissions
Launched Future Energy Fund in 2018 with initial commitment of $100MM
Committed additional $100 MM to OGCI Climate Investment Fund
89© 2020 Chevron Corporation
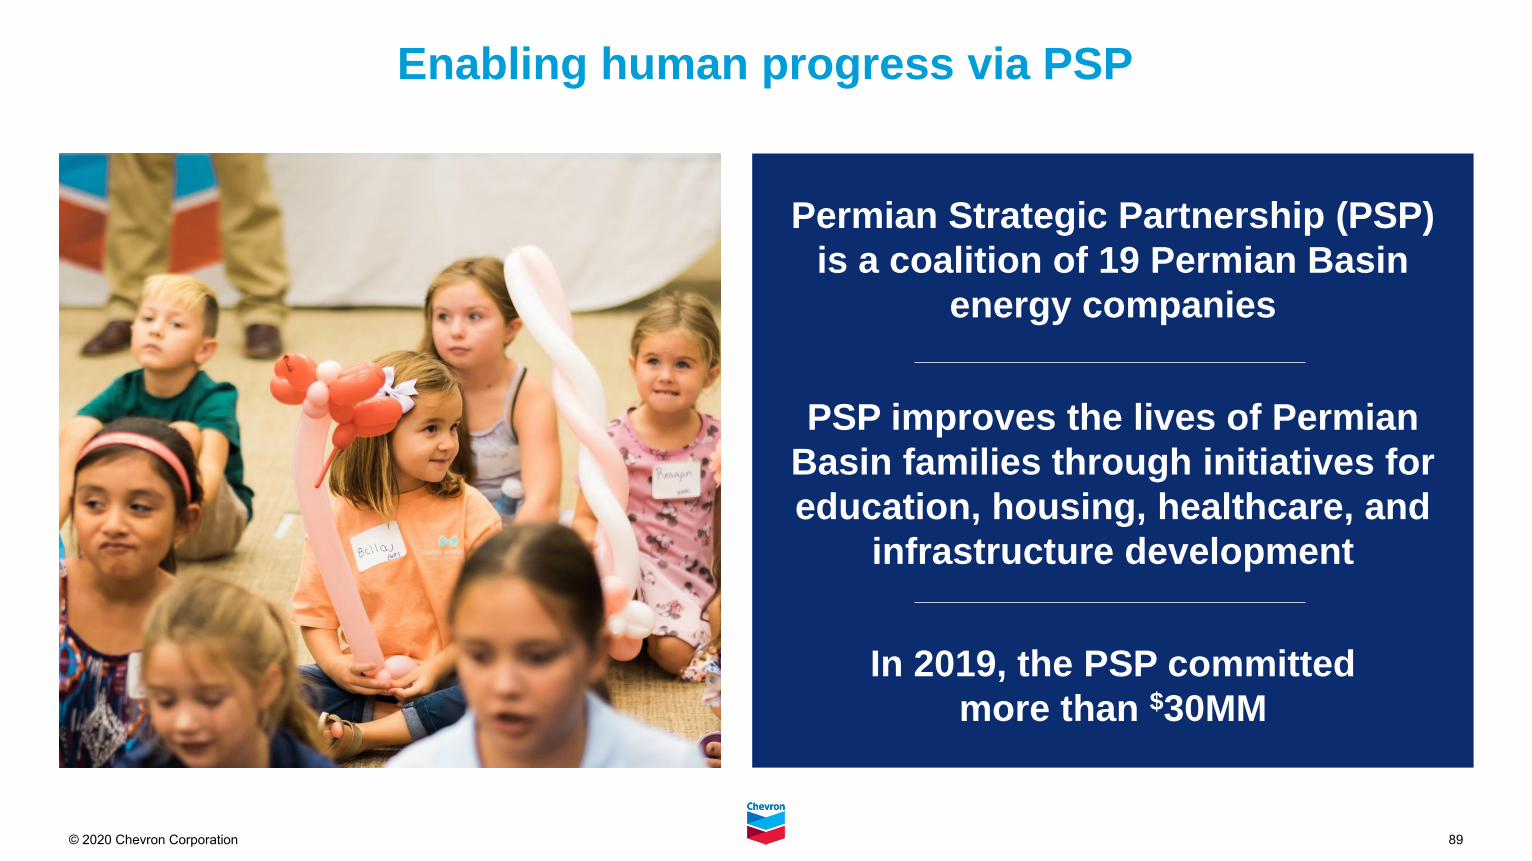
Permian Strategic Partnership (PSP)
is a coalition of 19 Permian Basin
energy companies
PSP improves the lives of Permian
Basin families through initiatives for
education, housing, healthcare, and
infrastructure development
In 2019, the PSP committed
more than $30MM
Enabling human progress via PSP
© 2020 Chevron Corporation
Reconciliation Tables
91© 2020 Chevron Corporation
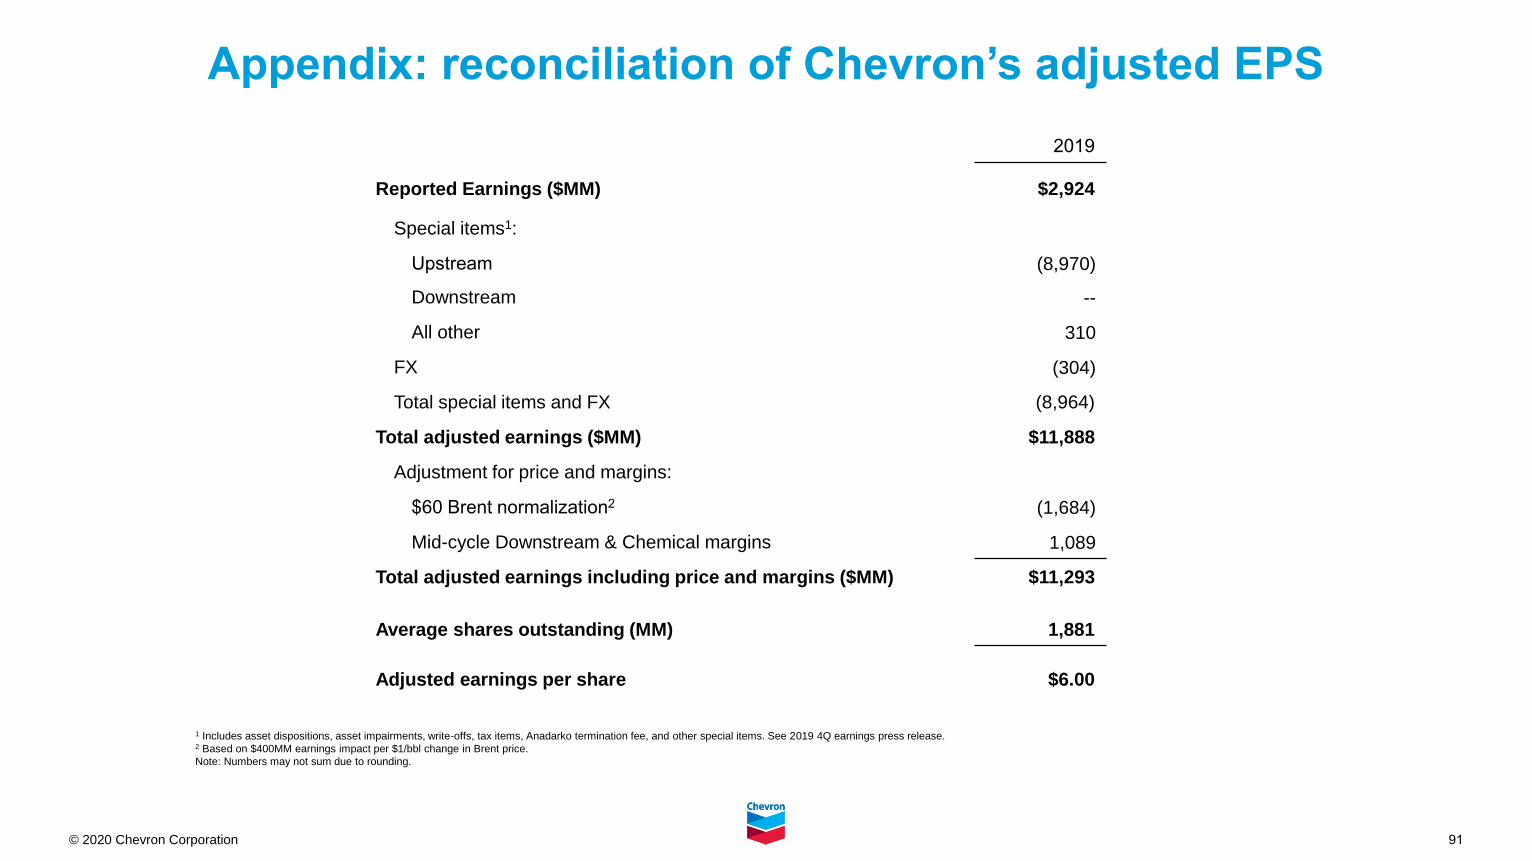
Appendix: reconciliation of Chevron’s adjusted EPS
1 Includes asset dispositions, asset impairments, write-offs, tax items, Anadarko termination fee, and other special items. See 2019 4Q earnings press release.2 Based on $400MM earnings impact per $1/bbl change in Brent price.
Note: Numbers may not sum due to rounding.
2019
Reported Earnings ($MM) $2,924
Special items1:
Upstream (8,970)
Downstream --
All other 310
FX (304)
Total special items and FX (8,964)
Total adjusted earnings ($MM) $11,888
Adjustment for price and margins:
$60 Brent normalization2 (1,684)
Mid-cycle Downstream & Chemical margins 1,089
Total adjusted earnings including price and margins ($MM) $11,293
Average shares outstanding (MM) 1,881
Adjusted earnings per share $6.00
92© 2020 Chevron Corporation
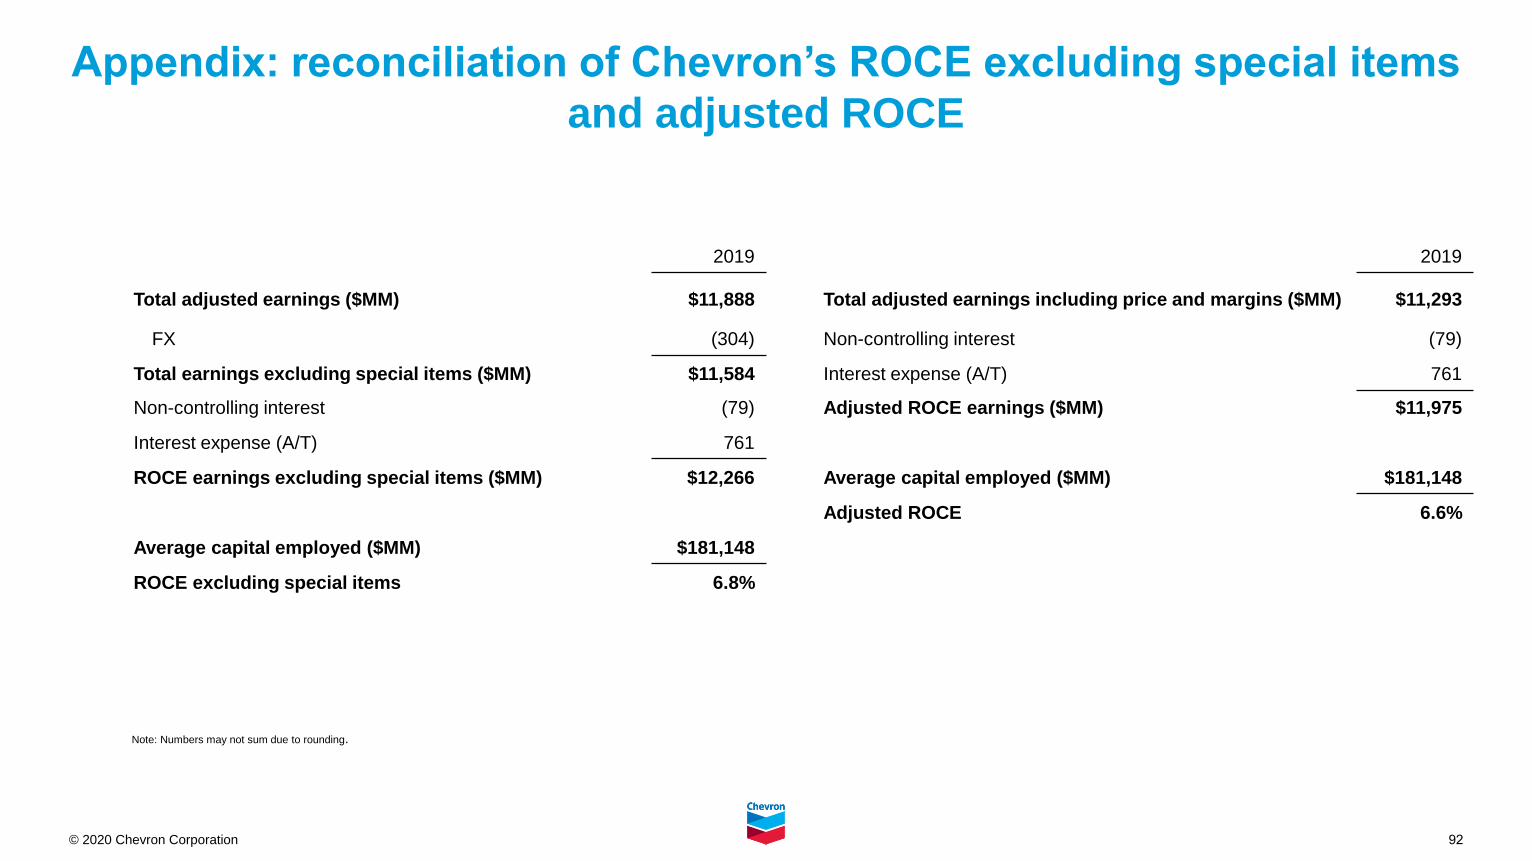
Appendix: reconciliation of Chevron’s ROCE excluding special items
and adjusted ROCE
Note: Numbers may not sum due to rounding.
2019
Total adjusted earnings including price and margins ($MM) $11,293
Non-controlling interest (79)
Interest expense (A/T) 761
Adjusted ROCE earnings ($MM) $11,975
Average capital employed ($MM) $181,148
Adjusted ROCE 6.6%
2019
Total adjusted earnings ($MM) $11,888
FX (304)
Total earnings excluding special items ($MM) $11,584
Non-controlling interest (79)
Interest expense (A/T) 761
ROCE earnings excluding special items ($MM) $12,266
Average capital employed ($MM) $181,148
ROCE excluding special items 6.8%
93© 2020 Chevron Corporation
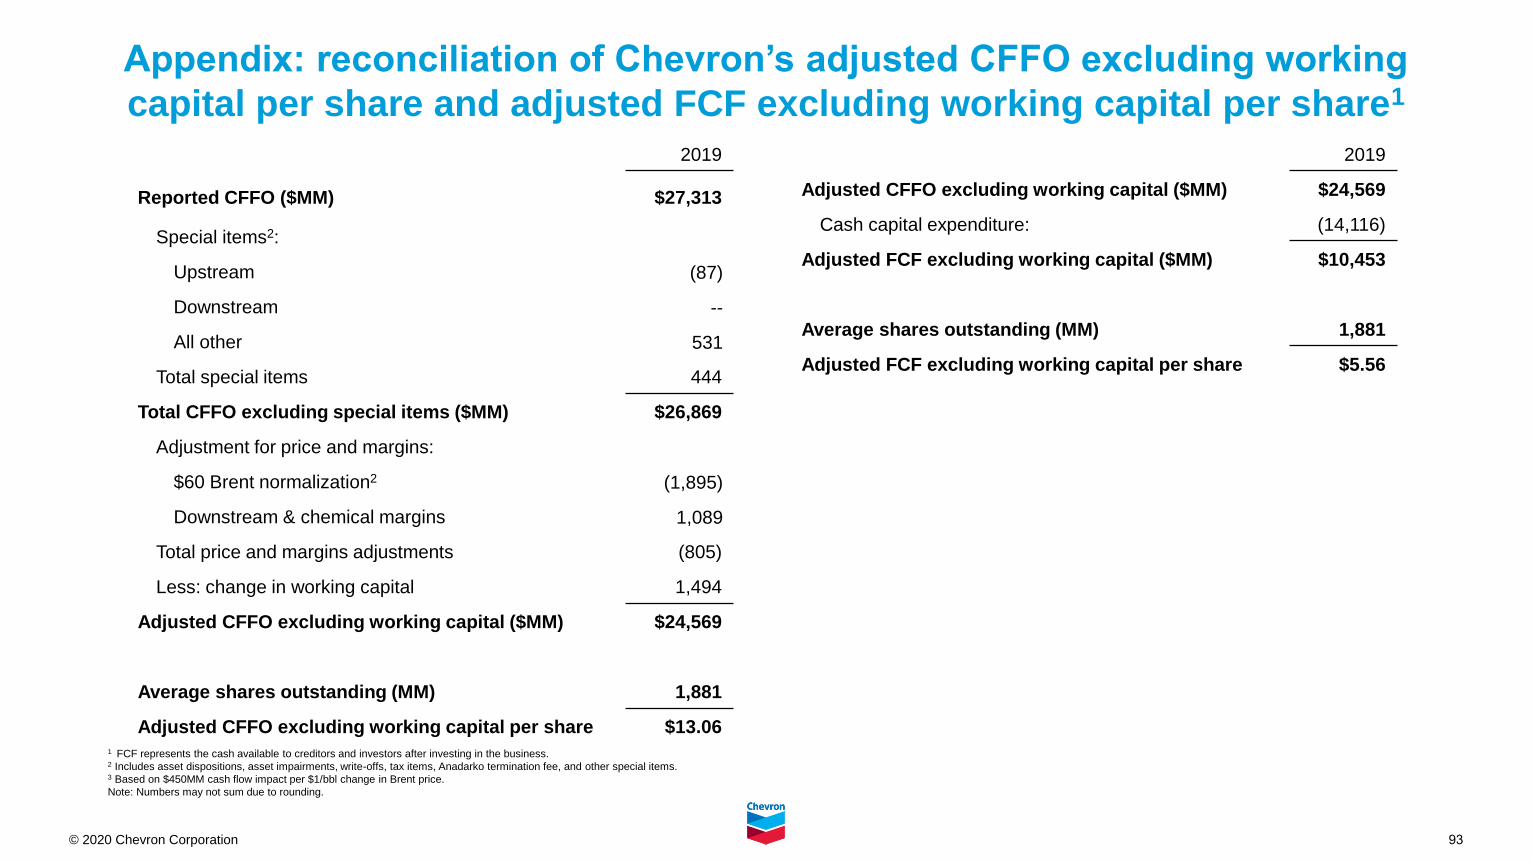
Appendix: reconciliation of Chevron’s adjusted CFFO excluding working
capital per share and adjusted FCF excluding working capital per share1
1 FCF represents the cash available to creditors and investors after investing in the business.2 Includes asset dispositions, asset impairments, write-offs, tax items, Anadarko termination fee, and other special items.3 Based on $450MM cash flow impact per $1/bbl change in Brent price.
Note: Numbers may not sum due to rounding.
2019
Reported CFFO ($MM) $27,313
Special items2:
Upstream (87)
Downstream --
All other 531
Total special items 444
Total CFFO excluding special items ($MM) $26,869
Adjustment for price and margins:
$60 Brent normalization2 (1,895)
Downstream & chemical margins 1,089
Total price and margins adjustments (805)
Less: change in working capital 1,494
Adjusted CFFO excluding working capital ($MM) $24,569
Average shares outstanding (MM) 1,881
Adjusted CFFO excluding working capital per share $13.06
2019
Adjusted CFFO excluding working capital ($MM) $24,569
Cash capital expenditure: (14,116)
Adjusted FCF excluding working capital ($MM) $10,453
Average shares outstanding (MM) 1,881
Adjusted FCF excluding working capital per share $5.56
94© 2020 Chevron Corporation
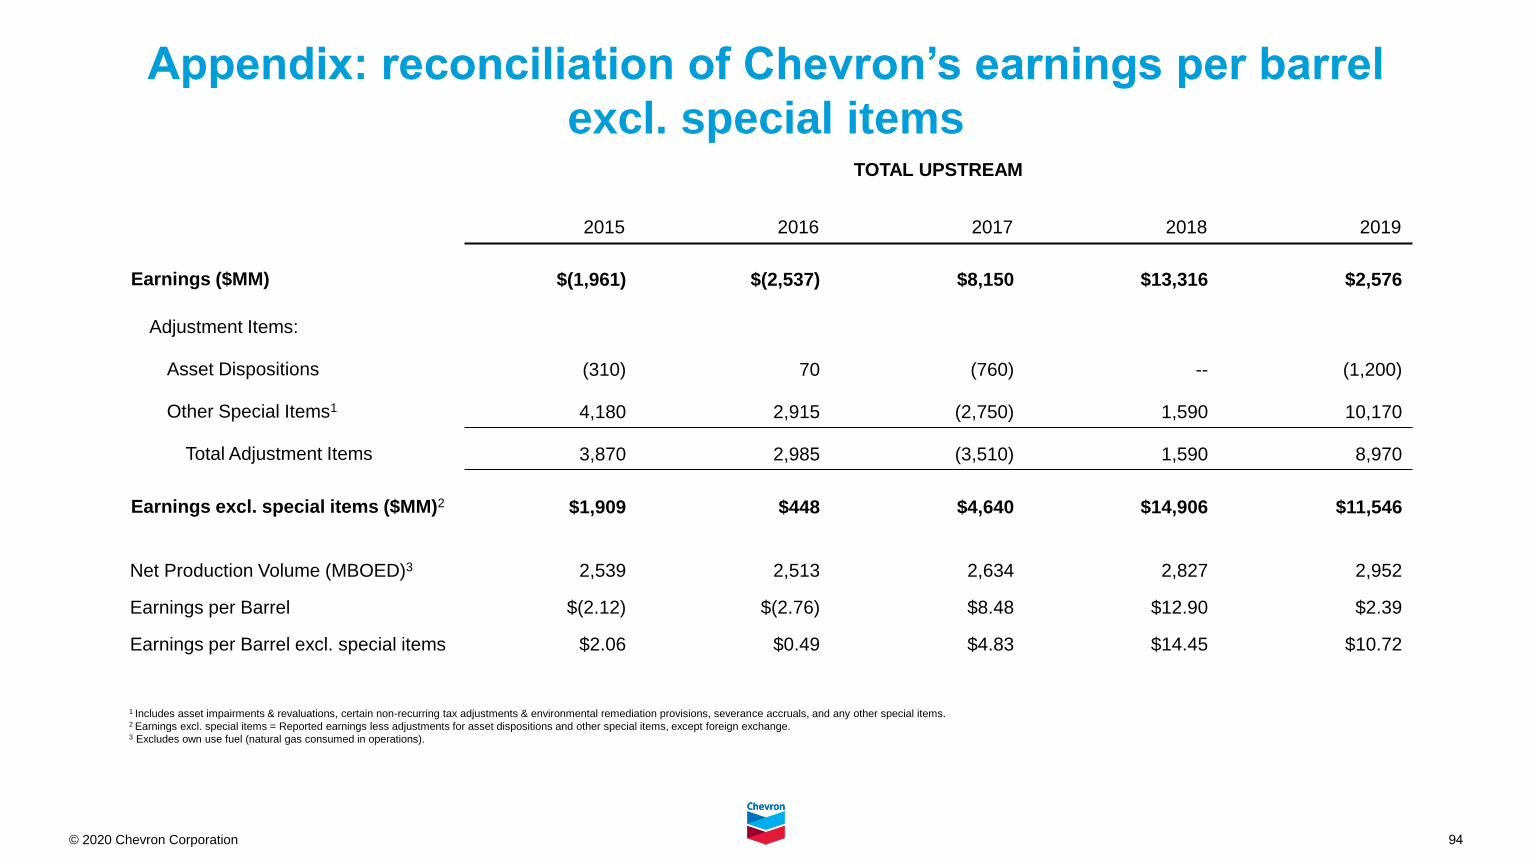
Appendix: reconciliation of Chevron’s earnings per barrel
excl. special items TOTAL UPSTREAM
2015 2016 2017 2018 2019
Earnings ($MM) $(1,961) $(2,537) $8,150 $13,316 $2,576
Adjustment Items:
Asset Dispositions (310) 70 (760) -- (1,200)
Other Special Items1 4,180 2,915 (2,750) 1,590 10,170
Total Adjustment Items 3,870 2,985 (3,510) 1,590 8,970
Earnings excl. special items ($MM)2 $1,909 $448 $4,640 $14,906 $11,546
Net Production Volume (MBOED)3 2,539 2,513 2,634 2,827 2,952
Earnings per Barrel $(2.12) $(2.76) $8.48 $12.90 $2.39
Earnings per Barrel excl. special items $2.06 $0.49 $4.83 $14.45 $10.72
1 Includes asset impairments & revaluations, certain non-recurring tax adjustments & environmental remediation provisions, severance accruals, and any other special items.2 Earnings excl. special items = Reported earnings less adjustments for asset dispositions and other special items, except foreign exchange.3 Excludes own use fuel (natural gas consumed in operations).
95© 2020 Chevron Corporation
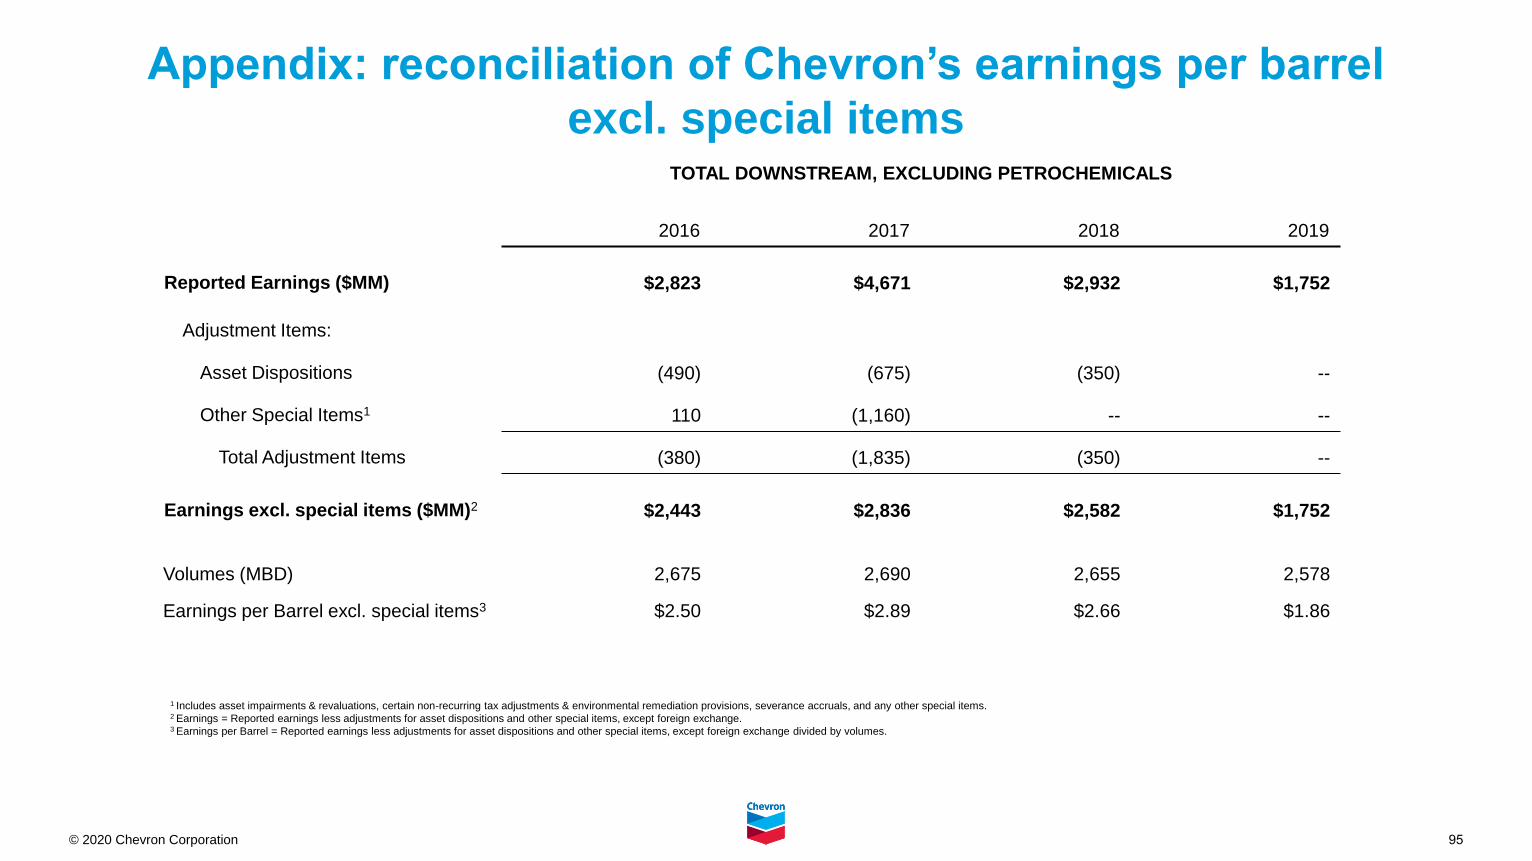
Appendix: reconciliation of Chevron’s earnings per barrel
excl. special items TOTAL DOWNSTREAM, EXCLUDING PETROCHEMICALS
2016 2017 2018 2019
Reported Earnings ($MM) $2,823 $4,671 $2,932 $1,752
Adjustment Items:
Asset Dispositions (490) (675) (350) --
Other Special Items1 110 (1,160) -- --
Total Adjustment Items (380) (1,835) (350) --
Earnings excl. special items ($MM)2 $2,443 $2,836 $2,582 $1,752
Volumes (MBD) 2,675 2,690 2,655 2,578
Earnings per Barrel excl. special items3 $2.50 $2.89 $2.66 $1.86
1 Includes asset impairments & revaluations, certain non-recurring tax adjustments & environmental remediation provisions, severance accruals, and any other special items.2 Earnings = Reported earnings less adjustments for asset dispositions and other special items, except foreign exchange.3 Earnings per Barrel = Reported earnings less adjustments for asset dispositions and other special items, except foreign exchange divided by volumes.
96© 2020 Chevron Corporation
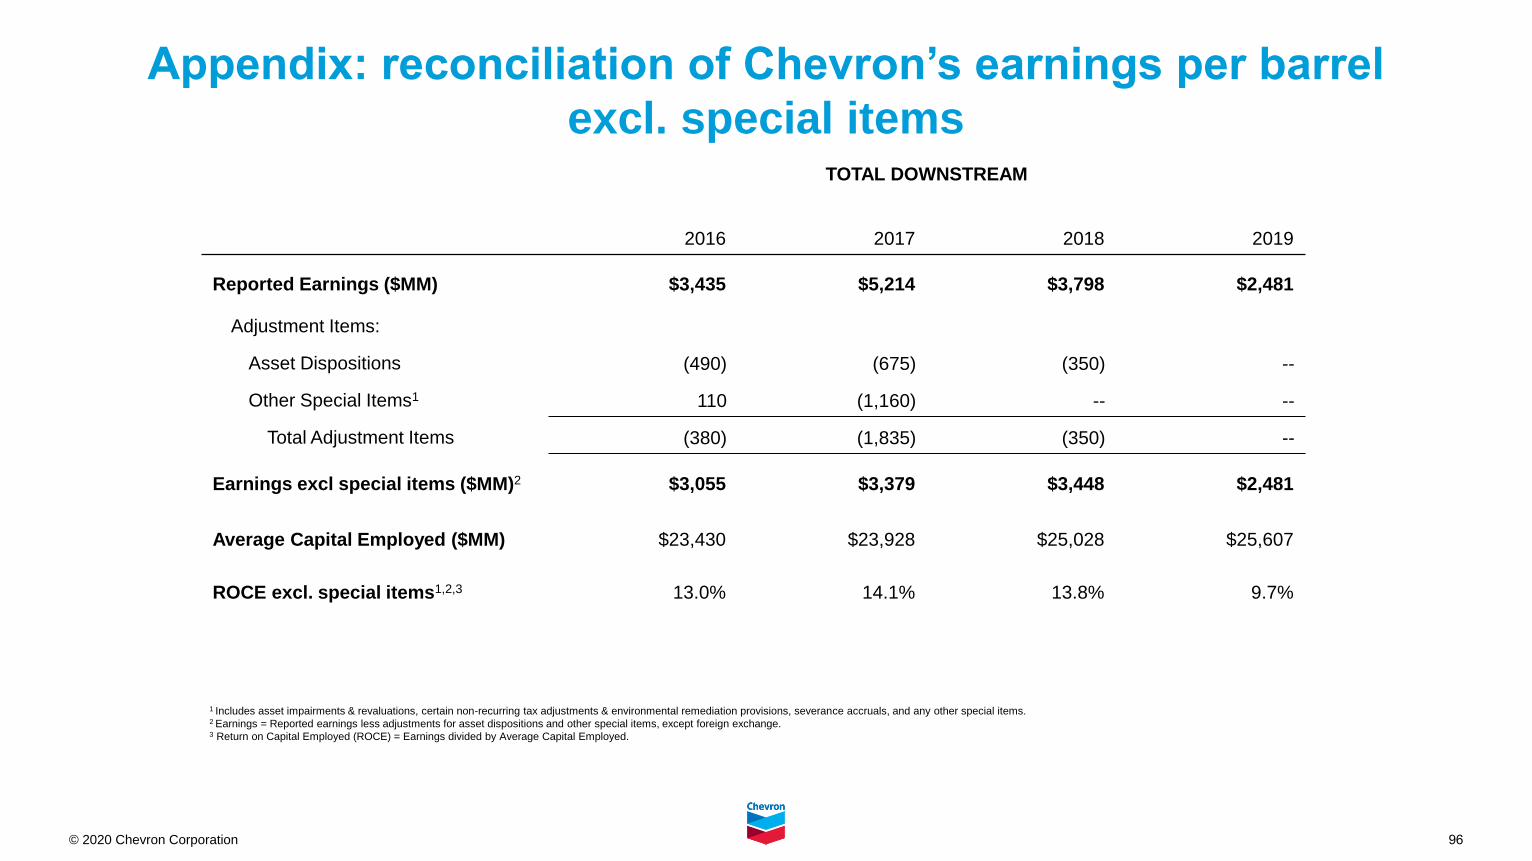
TOTAL DOWNSTREAM
2016 2017 2018 2019
Reported Earnings ($MM) $3,435 $5,214 $3,798 $2,481
Adjustment Items:
Asset Dispositions (490) (675) (350) --
Other Special Items1 110 (1,160) -- --
Total Adjustment Items (380) (1,835) (350) --
Earnings excl special items ($MM)2 $3,055 $3,379 $3,448 $2,481
Average Capital Employed ($MM) $23,430 $23,928 $25,028 $25,607
ROCE excl. special items1,2,3 13.0% 14.1% 13.8% 9.7%
Appendix: reconciliation of Chevron’s earnings per barrel
excl. special items
1 Includes asset impairments & revaluations, certain non-recurring tax adjustments & environmental remediation provisions, severance accruals, and any other special items.2 Earnings = Reported earnings less adjustments for asset dispositions and other special items, except foreign exchange.3 Return on Capital Employed (ROCE) = Earnings divided by Average Capital Employed.
97© 2021 Chevron Corporation
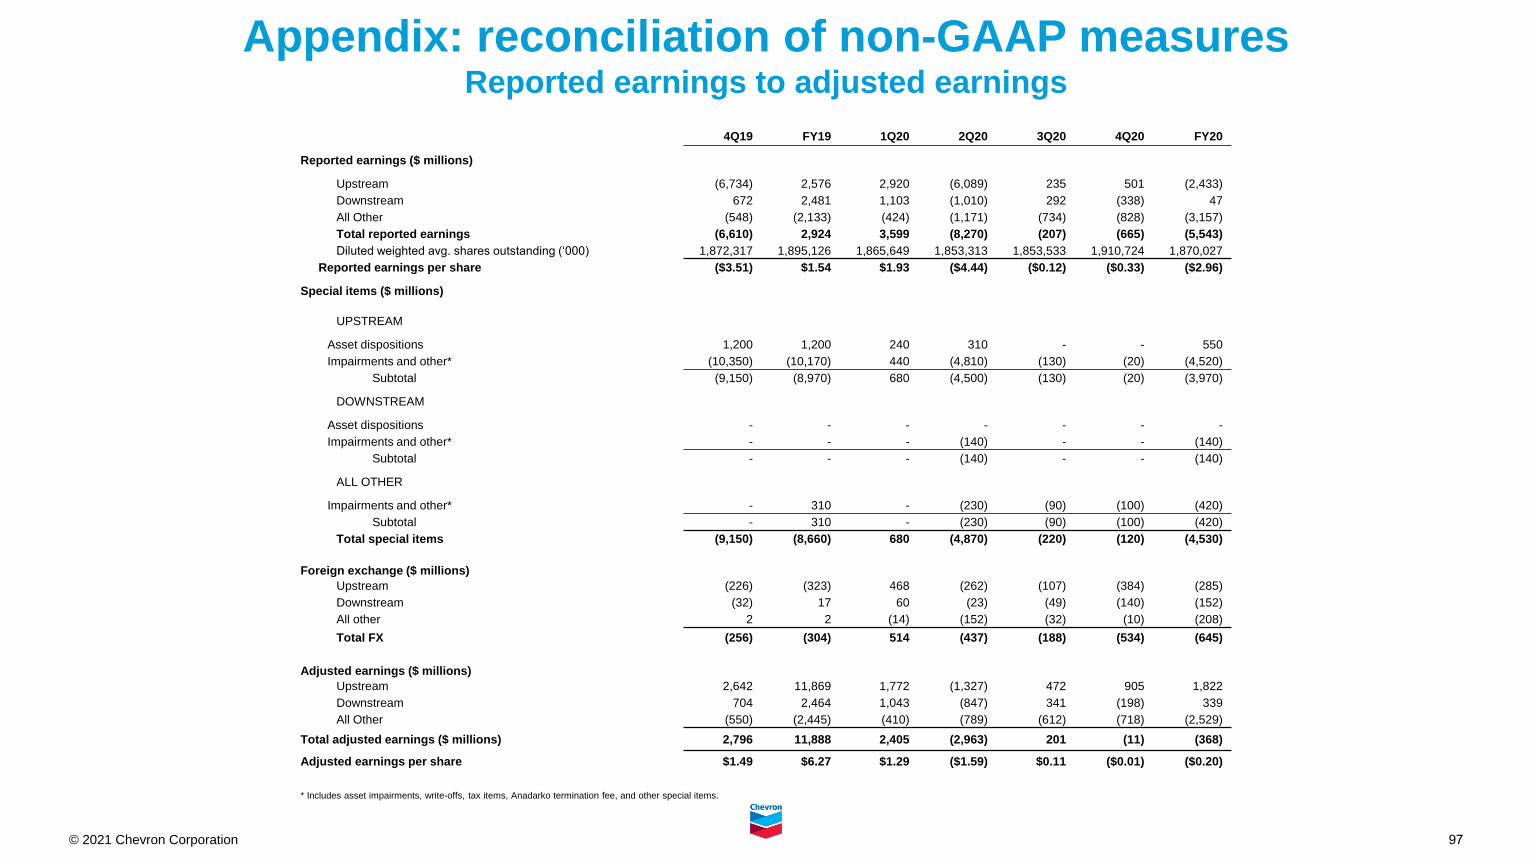
Appendix: reconciliation of non-GAAP measures Reported earnings to adjusted earnings
* Includes asset impairments, write-offs, tax items, Anadarko termination fee, and other special items.
4Q19 FY19 1Q20 2Q20 3Q20 4Q20 FY20
Reported earnings ($ millions)
Upstream (6,734) 2,576 2,920 (6,089) 235 501 (2,433)
Downstream 672 2,481 1,103 (1,010) 292 (338) 47
All Other (548) (2,133) (424) (1,171) (734) (828) (3,157)
Total reported earnings (6,610) 2,924 3,599 (8,270) (207) (665) (5,543)
Diluted weighted avg. shares outstanding (‘000) 1,872,317 1,895,126 1,865,649 1,853,313 1,853,533 1,910,724 1,870,027
Reported earnings per share ($3.51) $1.54 $1.93 ($4.44) ($0.12) ($0.33) ($2.96)
Special items ($ millions)
UPSTREAM
Asset dispositions 1,200 1,200 240 310 - - 550
Impairments and other* (10,350) (10,170) 440 (4,810) (130) (20) (4,520)
Subtotal (9,150) (8,970) 680 (4,500) (130) (20) (3,970)
DOWNSTREAM
Asset dispositions - - - - - - -
Impairments and other* - - - (140) - - (140)
Subtotal - - - (140) - - (140)
ALL OTHER
Impairments and other* - 310 - (230) (90) (100) (420)
Subtotal - 310 - (230) (90) (100) (420)
Total special items (9,150) (8,660) 680 (4,870) (220) (120) (4,530)
Foreign exchange ($ millions)
Upstream (226) (323) 468 (262) (107) (384) (285)
Downstream (32) 17 60 (23) (49) (140) (152)
All other 2 2 (14) (152) (32) (10) (208)
Total FX (256) (304) 514 (437) (188) (534) (645)
Adjusted earnings ($ millions)
Upstream 2,642 11,869 1,772 (1,327) 472 905 1,822
Downstream 704 2,464 1,043 (847) 341 (198) 339
All Other (550) (2,445) (410) (789) (612) (718) (2,529)
Total adjusted earnings ($ millions) 2,796 11,888 2,405 (2,963) 201 (11) (368)
Adjusted earnings per share $1.49 $6.27 $1.29 ($1.59) $0.11 ($0.01) ($0.20)
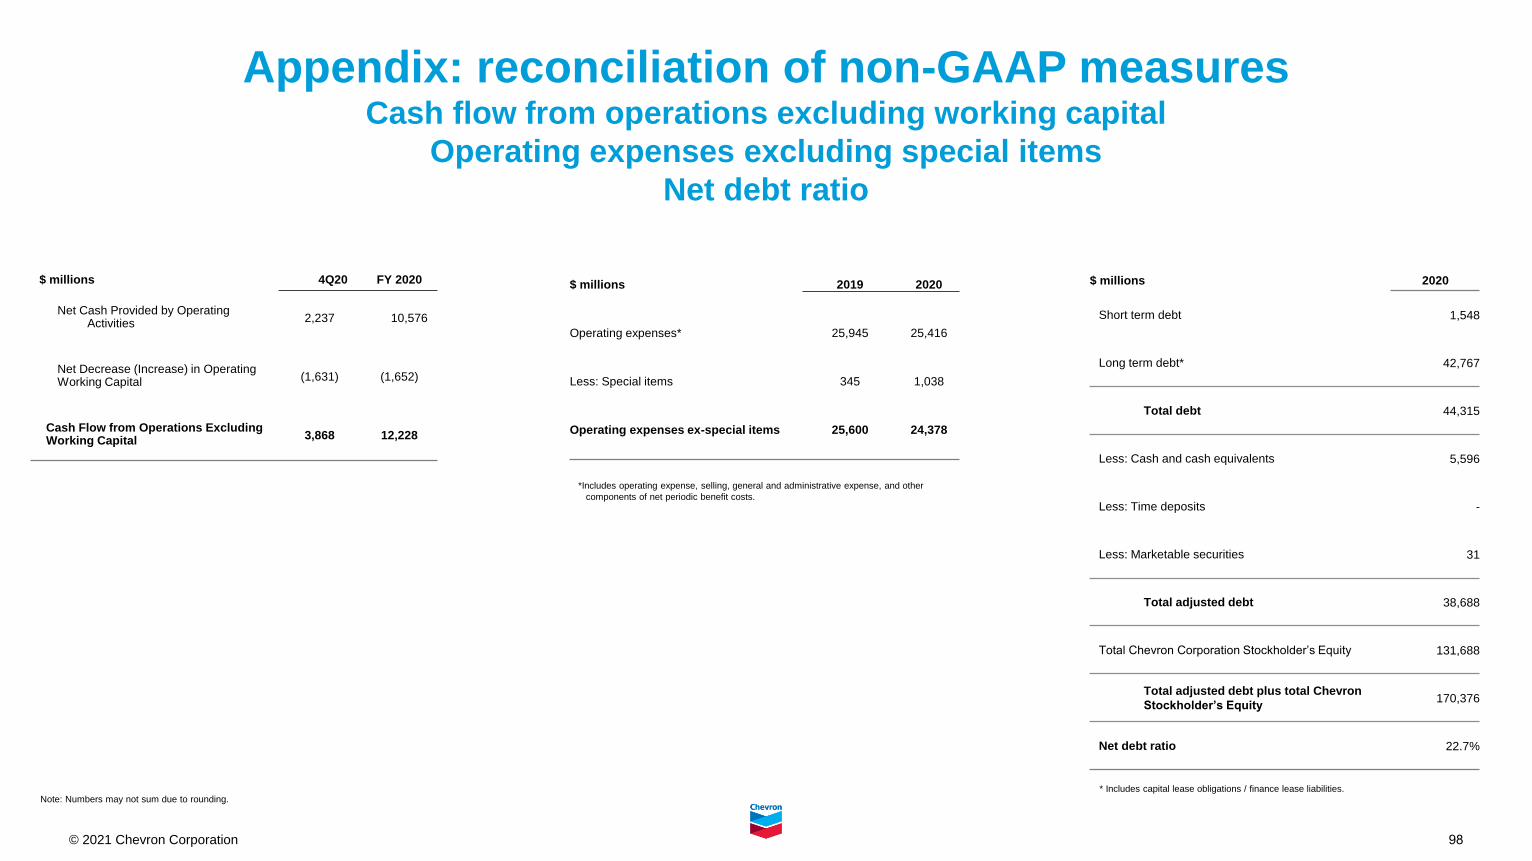
98© 2021 Chevron Corporation
$ millions 4Q20 FY 2020
Net Cash Provided by Operating Activities 2,237 10,576
Net Decrease (Increase) in Operating Working Capital (1,631) (1,652)
Cash Flow from Operations ExcludingWorking Capital 3,868 12,228
Appendix: reconciliation of non-GAAP measures Cash flow from operations excluding working capital
Operating expenses excluding special items
Net debt ratio
Note: Numbers may not sum due to rounding.
*Includes operating expense, selling, general and administrative expense, and other
components of net periodic benefit costs.
$ millions 2019 2020
Operating expenses* 25,945 25,416
Less: Special items 345 1,038
Operating expenses ex-special items 25,600 24,378
$ millions 2020
Short term debt 1,548
Long term debt* 42,767
Total debt 44,315
Less: Cash and cash equivalents 5,596
Less: Time deposits -
Less: Marketable securities 31
Total adjusted debt 38,688
Total Chevron Corporation Stockholder’s Equity 131,688
Total adjusted debt plus total Chevron
Stockholder’s Equity170,376
Net debt ratio 22.7%
* Includes capital lease obligations / finance lease liabilities.
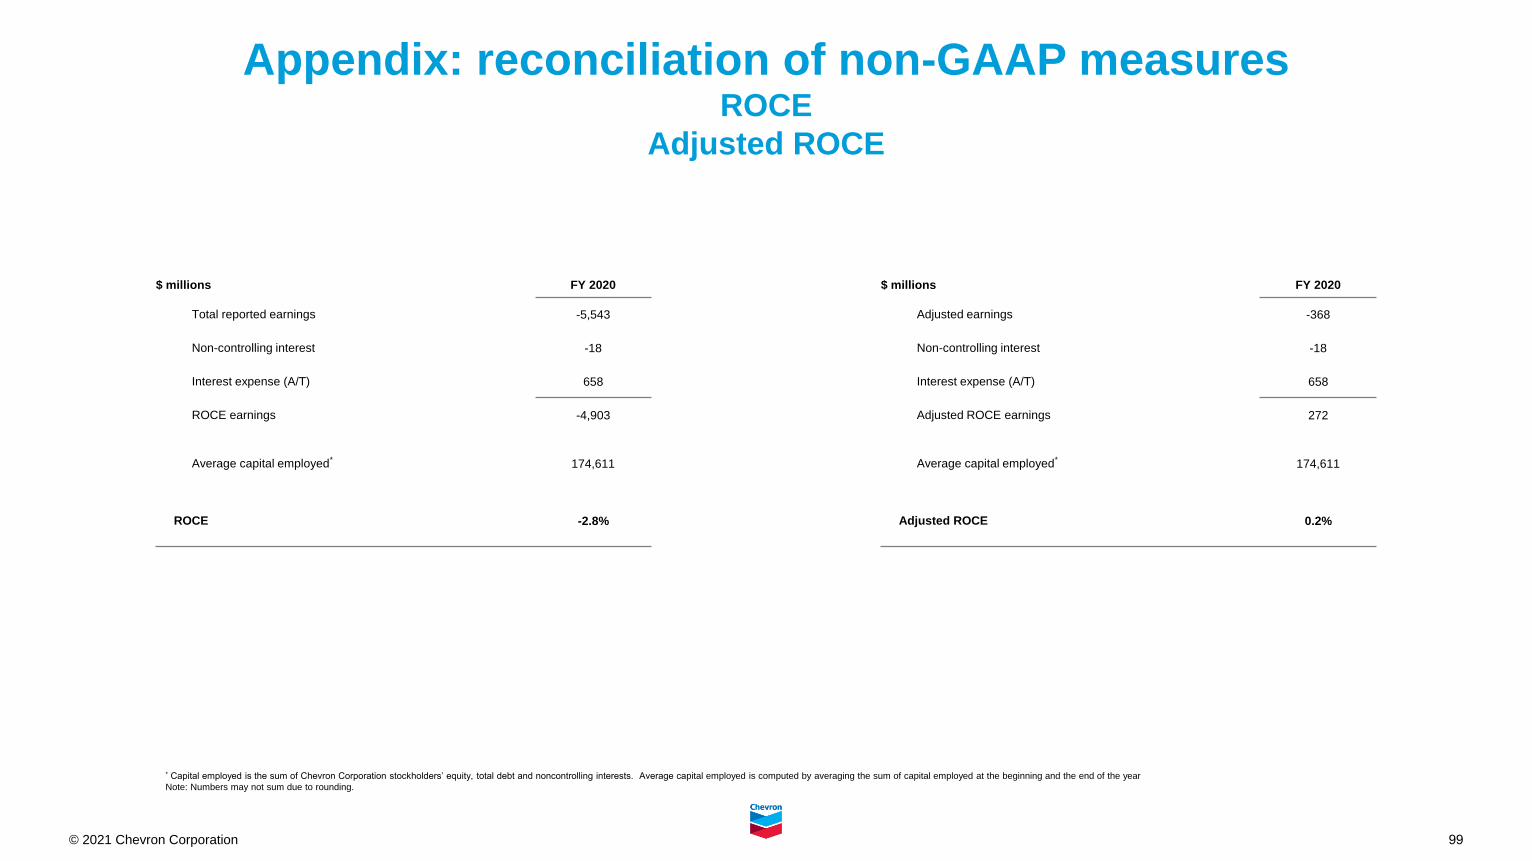
99© 2021 Chevron Corporation
Appendix: reconciliation of non-GAAP measures ROCE
Adjusted ROCE
* Capital employed is the sum of Chevron Corporation stockholders’ equity, total debt and noncontrolling interests. Average capital employed is computed by averaging the sum of capital employed at the beginning and the end of the year
Note: Numbers may not sum due to rounding.
$ millions FY 2020 $ millions FY 2020
Total reported earnings -5,543 Adjusted earnings -368
Non-controlling interest -18 Non-controlling interest -18
Interest expense (A/T) 658 Interest expense (A/T) 658
ROCE earnings -4,903 Adjusted ROCE earnings 272
Average capital employed* 174,611 Average capital employed* 174,611
ROCE -2.8% Adjusted ROCE 0.2%
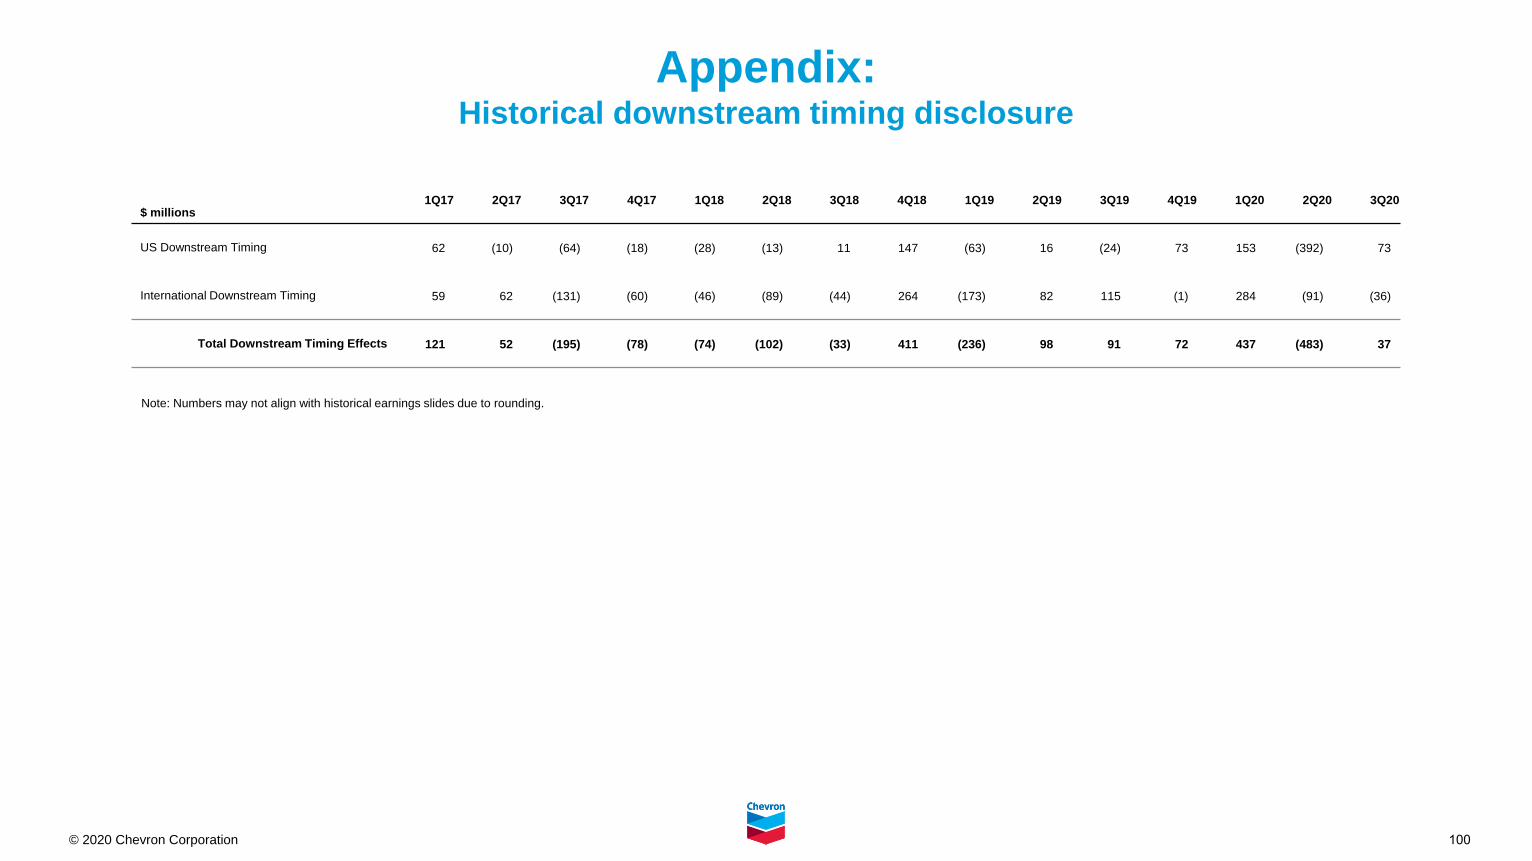
100© 2020 Chevron Corporation
Appendix:Historical downstream timing disclosure
$ millions1Q17 2Q17 3Q17 4Q17 1Q18 2Q18 3Q18 4Q18 1Q19 2Q19 3Q19 4Q19 1Q20 2Q20 3Q20
US Downstream Timing 62 (10) (64) (18) (28) (13) 11 147 (63) 16 (24) 73 153 (392) 73
International Downstream Timing 59 62 (131) (60) (46) (89) (44) 264 (173) 82 115 (1) 284 (91) (36)
Total Downstream Timing Effects 121 52 (195) (78) (74) (102) (33) 411 (236) 98 91 72 437 (483) 37
Note: Numbers may not align with historical earnings slides due to rounding.
Related Documents
