Henri Poupart-Lafarge, CFO 18 March 2010 Cheuvreux Pan-Europe Paris Conference

Welcome message from author
This document is posted to help you gain knowledge. Please leave a comment to let me know what you think about it! Share it to your friends and learn new things together.
Transcript

Henri Poupart-Lafarge, CFO
18 March 2010
Cheuvreux Pan-Europe Paris Conference

P 2
Agenda
1.
Our activities
3.
Conclusion
4.
Appendices
2.
Recent developments
P 3
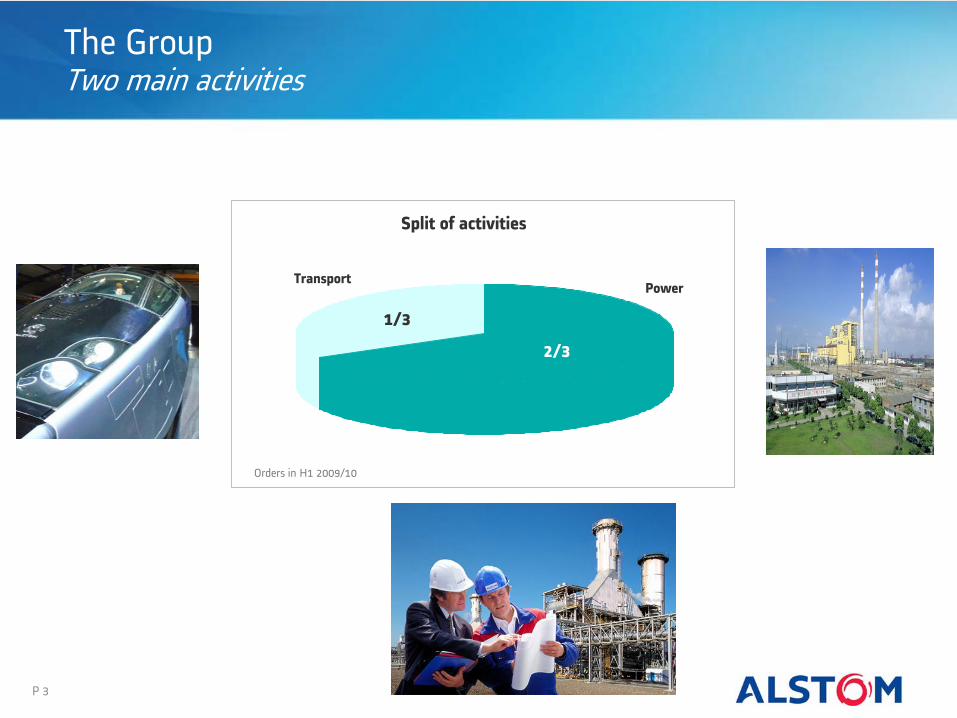
The Group Two main activities
2/3
1/3
Orders in H1 2009/10
Split of activities
TransportPower

P 4
Power Offering
Leading positions in all power generation
markets
GasN°3
CoalN°1*
HydroN°1
Nuclear
(conventional
part) Wind
Plant integrator
for thermal applications
Strong portfolio of CO2
free technologies
* Excluding Chinese and Indian players
N°1 Small presence

P 5
Strong service activity
New build (incl. retrofit)
After-market
Contribution to sales
March 2009 data
Power Offering
OEM supplied at least the turbine, the generator or the steam generatorSource: ALSTOM, UDI (2008)
Total World Installed Base: ~4,600 GW
25%
18%
15%
6%
Contribution to income
from
operations

P 6
Power Drivers
Solid drivers in place
Developed countriesEmerging markets
• Ageing fleet candidate for replacement
• Trend of energy mix diversification
– New wave of investments in CO2
free technologies: wind, nuclear, hydro (pumped storage)
– Growing share of intermittent power driving need for backup capacity
• Strong needs for efficiency improvement creating opportunities in retrofit and services
• Economic outlook improving and renewed growth in electricity consumption even though still fragile
• Insufficient reserve margins
• Strong investment needs driven by high long-term GDP growth

P 7
Power Market
Power generation market in the next five years
Average of 220/240 GW p.a.
Sound medium-term demand & increasing mix diversification
WindHydroNuclearSteamGas
ASIA/PACIFIC
CHINA
INDIA
RUSSIA/CISEUROPE
MEA
NAM
LAM
Source: Alstom

P 8
Power Positioning
A large portfolio of technologies and a strong global coverage
Strong presence
Under development
No presence
Gas
NAM EUROPE CHINA INDIA ASIA/PACIFIC
MEA LAM RUSSIA/CIS
Steam
Nuclear
Hydro
Wind

P 9
Power Short term priorities
• Manage the load−
Properly deliver the backlog
−
Adapt recruitment to execution needs
• Develop industrial footprint in Asia and the USA
• Strengthen positioning on broad portfolio of technologies
• Leverage opportunities on the installed base
• Boost growth by selective acquisitions

P 10
Improvementin efficiency ofpower plants
ECS & CO2 Capture
Developmentin renewable
energies
Power Long term strategy
Strengthen clean power leadership

P 11
Transport Offering
A worldwide leader
Global reach A full range of products and services
Infrastructure
Rolling stockServices
Signalling

P 12
Transport Market and drivers
A sound demand
Key long term drivers
• Stimulus packages
• Increasing mobility & infrastructure saturation
• Growth of urban populations
• Environmental concerns
Large opportunities
in all continents
•
Metros
in Mexico, Canada and USA
•
High speed
lines in the USA
North America
•
Very high speed line
in Brazil
•
Mass transit
projects in Argentina, Chile, Venezuela and Brazil
South America
•
Very high speed
lines in Saudi Arabia and in Morocco
•
Mass transit
projects in the Arabic peninsula and in Northern Africa
MEA
•
Very high speed
in China
•
Locomotives, coaches and infrastructure in India
•
Metros
in China, India and Australia
Asia
Russia•
Double-decker
passenger cars
• Diesel locomotives
Europe•
Very high speed and regional trains in France and Germany
•
Mass transit projects in the UK and in the Netherlands
•
Large signalling
contracts in the UK, Netherlands and in Denmark
• High speed
in Italy

P 13
Transport Short term priorities
• Secure project execution−
Quality focus−
Suppliers panel development−
Cost optimisation
• Take advantage of market conditions−
Large opportunities in France, UK and Germany−
Good momentum worldwide for very high speed and mass transit
−
Development of service with the new private operators
• Differentiate through innovation and accelerate standardisation
• Develop worldwide positions through targeted acquisitions

P 14
• Largest railway market in Europe
• 85,000 kilometres of electrified track
• 1.3 billion passengers per year
• Annual freight of 1.3 billion tons
Partnership with Transmashholding
• Purchase of a 25% stake in TMH’s
equity
−
Downpayment
of $75 million−
Final price depending on TMH’s
results over 2008-2011
• Creation of a joint engineering company for the development and the manufacturing of new products in Russia
Transport Strategic move
Potential of the Russian market

P 15
Agenda
1.
Our activities
3.
Conclusion
4.
Appendices
2.
Recent developments

P 16
Key figures
Sept 2008 Sept 2009
Orders received 15,401 7,134 -54%
Variation
Free cash flow NS1,201 77
Income from operations 697 828 +19%Operating margin 7.8% 8.6%
Sales 8,956 9,683 +8%
Net income +7%527 562
Backlog 46,879 43,787 -7%
In € million
A good operational performance in a difficult economic environment

P 17
Orders
15,401
9,1797,134
H1 2008/09 H2 2008/09 H1 2009/10
In € million Evolution of orders received
Number of contracts above €100 million
• Through in orders in Q2 (€2.4 billion)
– Delays in customers’ decisions in Power
– Impact of the phasing of large contracts in Transport
• Active tendering activity expected to translate into higher orders in H2 2009/10
– Recovery of orders in Q3 (€4.2 billion), with 5 projects above €100 million booked over the period
21
Orders received by country of destination in H1 2009/10
A low level of orders in H1 2009/10
X
1410
58%17%
7%4%
14%
Contracts below €100 million

P 18
Backlog & book-to-bill ratio
A high visibility
46.943.8
In € billion Evolution of backlog
• Backlog representing 27 months of sales
• Solid customer base
• No cancellation/deferral of orders booked
45.7
31 March 200930 Sept 2008 30 Sept 2009
1.72
0.74
Evolution of book-to-bill ratio
0.94
H1 2009/10H1 2008/09 H2 2008/09
• Book-to-bill ratio at 0.9 in Q3 2009/10

P 19
Cost control and flexibility
Adaptation to the new economic environment
Evolution of selling and administrative expenses in % of sales
+11,000
Leavers
-6,500
Mar 08 Starters Sept 09
Evolution of permanent workforce
Breakdown of headcount
Fixed term contractsPermanent employees
Mar 09
Net FY 2008/09: +4,500
2,600
Leavers
-3,100
Starters
Net H1 2009/10:
-500
• First effects of short term measures (control on spending and functions efficiency)
H1 2008/09 H1 2009/10
7.4%
6.9%
81,500 79,500
March 2009 Sept 2009
11,500 10,000
Dec 2009
77,500
9,000
Dec 09
800-1,800
Net Q3 2009/10:
-1,000
LeaversStarters

P 20
Completion of strategic capex plansPrioritisation of R&D
Evolution of capex
125 134+7%
In € million
H1 2008/09 H1 2009/10
• New foundry in Poland unveiled in June
• Wuhan
(China): inauguration of the
factory on 12th
November 2009
• Chatanooga
(USA): progressive ramp-up
from mid-2010
Power Capex and R&D
R&D: key events
• Inauguration of Alstom/AEP CCS site at Mountaineer in West Virginia (USA) on 30th
October 2009
• Agreement signed with Clean Current Power Systems Incorporated
to enter the
ocean energy market−
Commercialisation of tidal products expected by 2012
• Marketing of the new Eco100 wind turbine (3MW)
100 m
Airbus 380

P 21
52 50
In € million
Selective capex and R&D programmes
Evolution of capex
H1 2008/09 H1 2009/10
Transport Capex and R&D
• AGV in Italy−
On-going tests−
Certification expected in 2010
• Prima II locomotive prototype unveiled in June−
Start of trials in Germany
R&D: key events
• Capacity expansion for rolling stock in several European countries
-4%

P 22
Renew-able
On-siteStorage
BackupPowerCentralized Generation
Transportation
Residential
Commercial
Industrial
• Global and regional players
• Equipment and product sale
• Multi-clients
• Major global players
• Large projects
• Focused on utilities
Production Transmission Distribution Consumption
Renew-able
On-siteStorage
BackupPowerCentralized Generation
Transportation
Residential
Commercial
Industrial
• Global and regional players
• Equipment and product sale
• Multi-clients
• Major global players
• Large projects
• Focused on utilities
Production Transmission Distribution Consumption
Portfolio development
Alstom/Schneider Electric: the best partners for Areva T&D

P 23
Financial impact of the deal
Enterprise value Pensionsunderfunding
Net debt asat 30.06.2009
Equity value
~ €0.2
Bn€1.05 Bn
€2.3
Bn
Alstom sharec. 2/3
EV: €1,55 Bn
Debt: €0,7 Bn
To be financed by Alstom
€2,25 Bn~ €0,4
Bn
*= 8x est. 2009 EBITDA
Minorities
Total financing
Accretive from financial year 2010/11
~ €4
Bn*

P 24
Areva Transmission: a major step
forward
for Alstom’s
growth
Alstom today: 2 Sectors Alstom tomorrow: a Group based
on 3 pillars
Sales: ~ €22 billionEmployees: ~ 100,000
Power Transport
Sales: ~ €19 billionEmployees: ~ 80,000
Stronger
presence
in Asia
• China: from
7,000 to
10,000 employees
• India: from
4,000 to
6,500 employees
Strong
technological
base
• R&D spending
to grow
to ~ €750 million
More balanced
spread of activities
• Transmission: an activity
combining
projects
and
products; smaller
projects;
less
cyclical
POWER TRANSPORT POWER TRANSPORTTRANSMISSION

P 25
Agenda
1.
Our activities
3.
Conclusion
4.
Appendices
2.
Recent developments

P 26
Conclusion
• Commercial activity expected to rebound
• Execution of backlog under control
• March 2010 operating margin forecast confirmed: around 9%
for the Group
−
Power: between 10% and 11%−
Transport: between 7% and 8%

P 27
Agenda
1.
Our activities
3.
Conclusion
4.
Appendices
2.
Recent developments

P 28
In € million
Sept 2008 Sept 2009 Variation
Power Key figures
Orders
10,203
4,731
-54%
Backlog
26,738
24,631
-8%
Sales
6,284
6,895
+10%
Income from op
581
677
+17%
Operating margin
9.2%
9.8%

P 29
• Retrofit
orders in the USA and in Poland
•
Small and medium-sized service
projects in Europe and in Asia
• No substantial O&M
contracts
Power Orders received
10,203
4,731
-54%
In € million
Orders by Businesses
H1 2008/09 H1 2009/10
RenewablesThermal Services
Thermal Systems & Products
• Gas
power plant in the UK, incl. 5xGT26
• Steam
contracts in Germany and in India
• Geothermal order in Mexico
Thermal Systems & Products
6,600
2,607
996
Main orders of H1 2009/10
Thermal Services
•
Various hydro
orders in Switzerland, India and Spain
• Wind
contracts in Europe
Renewables
Investments in new power plants temporarily delayed
1,849
2,173
709

P 30
In € million
Sept 2008 Sept 2009 Variation
Transport Key figures
Orders
5,198
2,403
-54%
Backlog
20,141
19,156
-5%
Sales
2,672
2,788
+4%
Income from op
176
195
+11%
Operating margin
6.6%
7.0%

P 31
Transport Orders received
5,198
2,403
-54%
In € million
Evolution of orders
H1 2008/09 H1 2009/10
•
Sub-urban train in Paris (France)
•
Metro
contracts in Sao Paulo and Brasilia (Brazil)
•
Tramways
in Brasilia and Montpellier (France)
•
Regional trains
in Denmark and Germany
Rolling Stock
Main orders of H1 2009/10
•
Various orders for signalling
systems in Brazil, Canada, Asia and the Netherlands
Signalling
Order intake level influenced by large contracts

P 32
Income statement
In € million
Sept 2008 Sept 2009 Variation
Sales
8,956
9,683
+8%
Income from operations 697 828
+19%
Restructuring costs
(13) (27)
Capital gains & other
2
(19)
EBIT
686 782
+14%
Financial result
19 (12)
Tax result
(174) (199)
Minority interest & other
(4)
(9)
Net result
527
562
+7%

P 33
Free cash flow
In € million
Sept 2008 Sept 2009
Change in working capitalvs book-to-bill
1.72
0.94
Btb: 1
+771
-158
0.74
In € million
H1 2008/09 H1 2009/10H2 2008/09
-475
Income from operations
697
828
Restructuring cash out
(39)
(38)Depreciation 108 131Capital expenditure
(195) (210)
R&D cap. & amort. of acq. Techno.
4
(23)Pensions (46)
(34)Change in working capital
771 (475)
Tax cash out
(129) (97)
Financial cash out
14
(1)Other
16 (4)
Free cash flow
1,201
77

P 34
Evolution of net cash & equity
In € million
(*) Employee share purchase schemes and stock options
Net cash31 Mar 09
1,866
2,051 (323)
Net cash position
Free cashflow
Dividends Capitalincrease*
Other Net cash30 Sept 09
In € million
Equity31 Mar 09
3,099
2,884
(323) (46)
Evolution of equity
Net income Dividends Pensionsvariation
Other Equity30 Sept 09
77
562 22
12 49

P 35
Contacts & agenda
• Emmanuelle Châtelain -
VP Investor
Relations
+33 (0)1 41 49 37 38
• Emmanuelle Douëzy
-
Individual Shareholders
+33 (0)1 41 49 37 59
• Dymphna Hawksley -
Logistics
+33 (0)1 41 49 37 22
• 04/05/2010
Annual results
of FY2009/10

P 36
Disclaimer
This presentation contains forward-looking statements which are based on current plans and forecasts of Alstom’s management. Such forward-looking statements are by their nature subject to a number of important risk and uncertainty factors (such as those described in the documents filed by Alstom with the French AMF) that could cause actual results to differ from the plans, objectives and expectations expressed in such forward-looking statements. These such forward-looking statements speak only as of the date on which they are made, and Alstom
undertakes no obligation to update or revise any of them, whether as a result of
new information, future events or otherwise.

www.alstom.com

INVESTOR RELATIONS –
3 avenue André Malraux –
92300 Levallois (France) –
www.alstom.com
Phone: 33 (0)1 41 49 37 38 –
Fax: 33 (0)1 41 49 79 25 –
Related Documents