Cheniere Energy June 2013

Welcome message from author
This document is posted to help you gain knowledge. Please leave a comment to let me know what you think about it! Share it to your friends and learn new things together.
Transcript

Cheniere Energy
June 2013
Forward Looking Statements
2
This presentation contains certain statements that are, or may be deemed to be, “forward-looking statements” within the meaning of Section 27A of the Securities Act of 1933, as amended, and Section 21E of the Securities Exchange Act of 1934, as amended. All statements, other than statements of historical facts, included herein are “forward-looking statements.” Included among “forward-looking statements” are, among other things:
statements regarding the ability of Cheniere Energy Partners, L.P. to pay distributions to its unitholders; statements regarding our expected receipt of cash distributions from Cheniere Energy Partners, L.P., Sabine Pass LNG, L.P., Sabine Pass Liquefaction, LLC or Cheniere Creole
Trail Pipeline, L.P.; statements that we expect to commence or complete construction of our proposed liquefied natural gas (“LNG”) terminal or our proposed pipelines, liquefaction facilities or
other projects, or any expansions thereof, by certain dates or at all; statements regarding future levels of domestic and international natural gas production, supply or consumption or future levels of LNG imports into or exports from North
America and other countries worldwide, regardless of the source of such information, or the transportation or demand for and prices related to natural gas, LNG or other hydrocarbon products;
statements regarding any financing transactions or arrangements, or ability to enter into such transactions; statements relating to the construction of our natural gas liquefaction trains (“Trains”), or modifications to the Creole Trail Pipeline, including statements concerning the
engagement of any engineering, procurement and construction ("EPC") contractor or other contractor and the anticipated terms and provisions of any agreement with any EPC or other contractor, and anticipated costs related thereto;
statements regarding any agreement to be entered into or performed substantially in the future, including any revenues anticipated to be received and the anticipated timing thereof, and statements regarding the amounts of total LNG regasification, liquefaction or storage capacities that are, or may become, subject to contracts;
statements regarding counterparties to our commercial contracts, construction contracts and other contracts; statements regarding our planned construction of additional Trains, including the financing of such Trains; statements that our Trains, when completed, will have certain characteristics, including amounts of liquefaction capacities; statements regarding any business strategy, our strengths, our business and operation plans or any other plans, forecasts, projections or objectives, including anticipated
revenues and capital expenditures and EBITDA, any or all of which are subject to change; statements regarding projections of revenues, expenses, earnings or losses, working capital or other financial items; statements regarding legislative, governmental, regulatory, administrative or other public body actions, requirements, permits, investigations, proceedings or decisions; statements regarding our anticipated LNG and natural gas marketing activities; and any other statements that relate to non-historical or future information.
These forward-looking statements are often identified by the use of terms and phrases such as “achieve,” “anticipate,” “believe,” “contemplate,” “develop,” “estimate,” “example,” “expect,” “forecast,” “opportunities,” “plan,” “potential,” “project,” “propose,” “subject to,” “strategy,” and similar terms and phrases, or by use of future tense. Although we believe that the expectations reflected in these forward-looking statements are reasonable, they do involve assumptions, risks and uncertainties, and these expectations may prove to be incorrect. You should not place undue reliance on these forward-looking statements, which speak only as of the date of this presentation. Our actual results could differ materially from those anticipated in these forward-looking statements as a result of a variety of factors, including those discussed in “Risk Factors” in the Cheniere Energy, Inc. and Cheniere Energy Partners, L.P. Annual Reports on Form 10-K filed with the SEC on February 22, 2013, each as amended by Amendment No. 1 on Form 10-K/A filed with the SEC on March 1, 2013, and the Cheniere Energy Partners, L.P. Current Report on Form 8-K filed with the SEC on May 29, 2013, which are incorporated by reference into this presentation. All forward-looking statements attributable to us or persons acting on our behalf are expressly qualified in their entirety by these ”Risk Factors”. These forward-looking statements are made as of the date of this presentation, and other than as required under the securities laws, we undertake no obligation to publicly update or revise any forward-looking statements.

2.0% Interest & Incentive Dist. Rights
Cheniere Energy, Inc. (NYSE MKT: LNG)
Sabine Pass LNG, L.P. (“SPLNG”)
Sabine Pass Liquefaction, LLC
(“SPL”)
Cheniere Energy Partners, L.P.
(NYSE MKT: CQP)
Cheniere Creole Trail Pipeline, L.P.
(“CTPL”)
Corpus Christi Liquefaction, LLC
Cheniere Marketing, LLC
(“CMI”)
Cheniere Energy Partners GP, LLC 55.9% Interest (1)
100% Interest
100% Interest 100% Interest 100% Interest
(1) Represents ownership interest before accretion of Class B units.
Future Developments
Summary Organizational Structure
3
Blackstone 29.0% Public 13.1%
• 13.5 mtpa LNG production, 3 trains
• 4.0 Bcf/d of regas • 17 Bcf of storage • 2 berths
• Up to 27.0 mtpa LNG production, 6 trains

Operating Assets
Sabine Pass LNG Terminal Creole Trail Pipeline
4
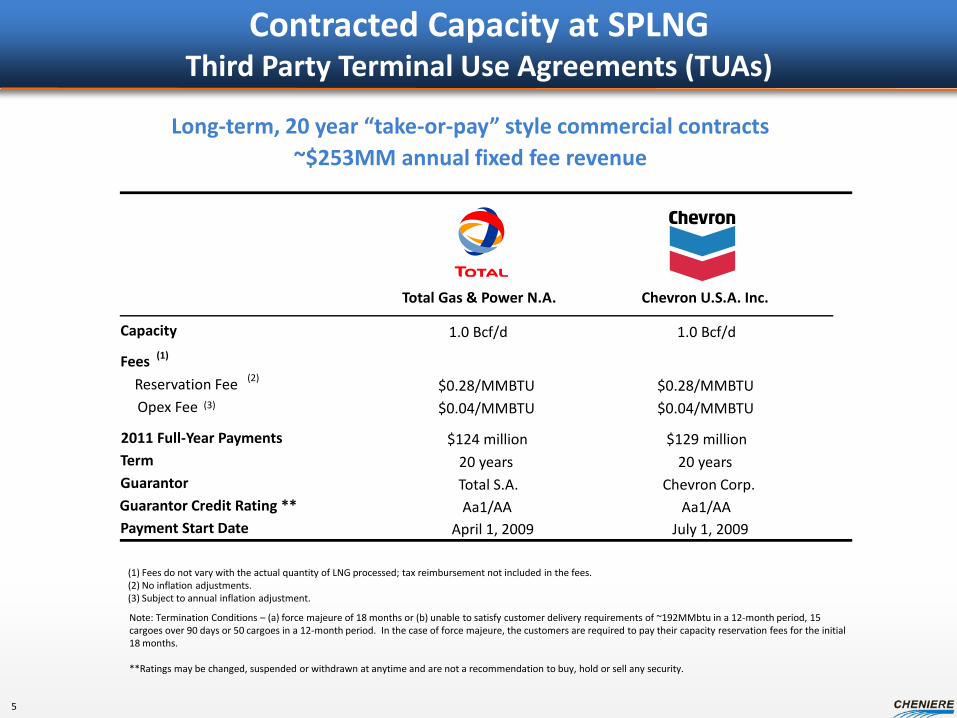
Contracted Capacity at SPLNG Third Party Terminal Use Agreements (TUAs)
Long-term, 20 year “take-or-pay” style commercial contracts ~$253MM annual fixed fee revenue
Total Gas & Power N.A. Chevron U.S.A. Inc.
Capacity 1.0 Bcf/d 1.0 Bcf/d
Fees (1)
Reservation Fee (2) $0.28/MMBTU $0.28/MMBTU Opex Fee (3) $0.04/MMBTU $0.04/MMBTU
2011 Full-Year Payments $124 million $129 million Term 20 years 20 years Guarantor Total S.A. Chevron Corp. Guarantor Credit Rating ** Aa1/AA Aa1/AA Payment Start Date April 1, 2009 July 1, 2009
(1) Fees do not vary with the actual quantity of LNG processed; tax reimbursement not included in the fees. (2) No inflation adjustments. (3) Subject to annual inflation adjustment.
Note: Termination Conditions – (a) force majeure of 18 months or (b) unable to satisfy customer delivery requirements of ~192MMbtu in a 12-month period, 15 cargoes over 90 days or 50 cargoes in a 12-month period. In the case of force majeure, the customers are required to pay their capacity reservation fees for the initial 18 months. **Ratings may be changed, suspended or withdrawn at anytime and are not a recommendation to buy, hold or sell any security.
5
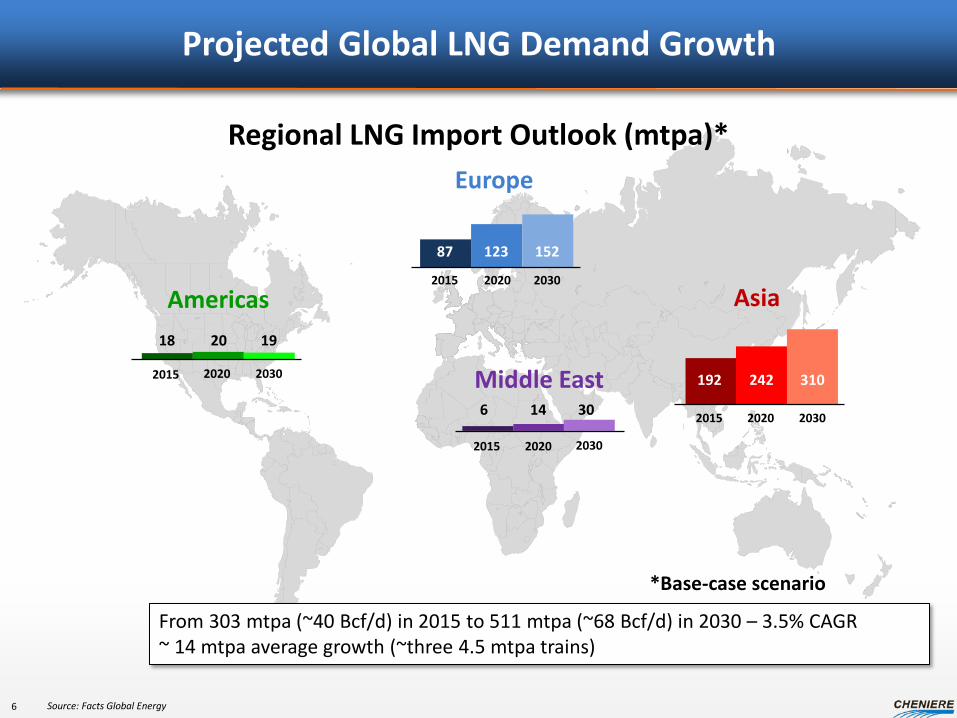
Projected Global LNG Demand Growth
Regional LNG Import Outlook (mtpa)*
Source: Facts Global Energy
18 20 19
2015 2020 2030
2015 2020 2030
6 14 30
2015 2020 2030
2015 2020 2030
Americas
Europe
Asia
Middle East
*Base-case scenario
192 242 310
87 123 152
From 303 mtpa (~40 Bcf/d) in 2015 to 511 mtpa (~68 Bcf/d) in 2030 – 3.5% CAGR ~ 14 mtpa average growth (~three 4.5 mtpa trains)
6

0
2
4
6
8
10
12
14
16
18
20
May
-08
May
-09
May
-10
May
-11
May
-12
May
-13
$/MMBtu Regional Natural Gas & LNG Prices
As of May 28, 2013
NBP IFERC HH Monthly
Japan avg LNG European Gas Contract
Estimated Prices Henry Hub: $4.00 / MMBtu Brent Crude: $100 / Barrel
($/MMBtu) Americas Europe Asia
Henry Hub 4.00 $ 4.00 4.00
Fuel/Basis
Shipping 0.50 1.00 3.00
0.60 0.60 0.60
$ 8.10 8.60 10.60
4.40
Regional Price @ 15% 15.00 12.00 15.00
Margin 6.90 $ 3.40
Liquefaction 3.00 3.00 3.00
Delivered Cost
Source: Cheniere Research estimates
Compelling Price Advantage Current Prices = ~$2B-$3B of Spread for Each Bcf/d
@ 12% @ 15%
$
$
$
$
$
$
Worldwide Gas Prices = 11% to 15% of Crude Oil
7
$4.19
$9.84
$16.16
$10.16

Brownfield Project Utilizes Existing Assets Trains 1-4 Under Construction
Significant infrastructure in place including storage, marine and pipeline interconnection facilities; pipeline quality natural gas to be sourced from U.S. pipeline network
Liquefaction Trains 3 & 4 LSTK EPC contract w/ Bechtel Construction commenced in May 2013 Operations estimated 2016-2017
Liquefaction Expansion - Trains 5 & 6 Bechtel commenced preliminary engineering Permitting initiated February 2013 FERC application to be completed in 2H 2013
Current Facility ~1,000 acres in Cameron Parish, LA 40 ft ship channel 3.7 miles from coast 2 berths; 4 dedicated tugs 5 LNG storage tanks (~17 Bcf of storage) 5.3 Bcf/d of pipeline interconnection
Liquefaction Trains 1 & 2 LSTK EPC contract w/ Bechtel Operations estimated 2015-2016 Overall construction 30% complete (as of 4/13)
Design production capacity is expected to be ~4.5 mtpa per train
8
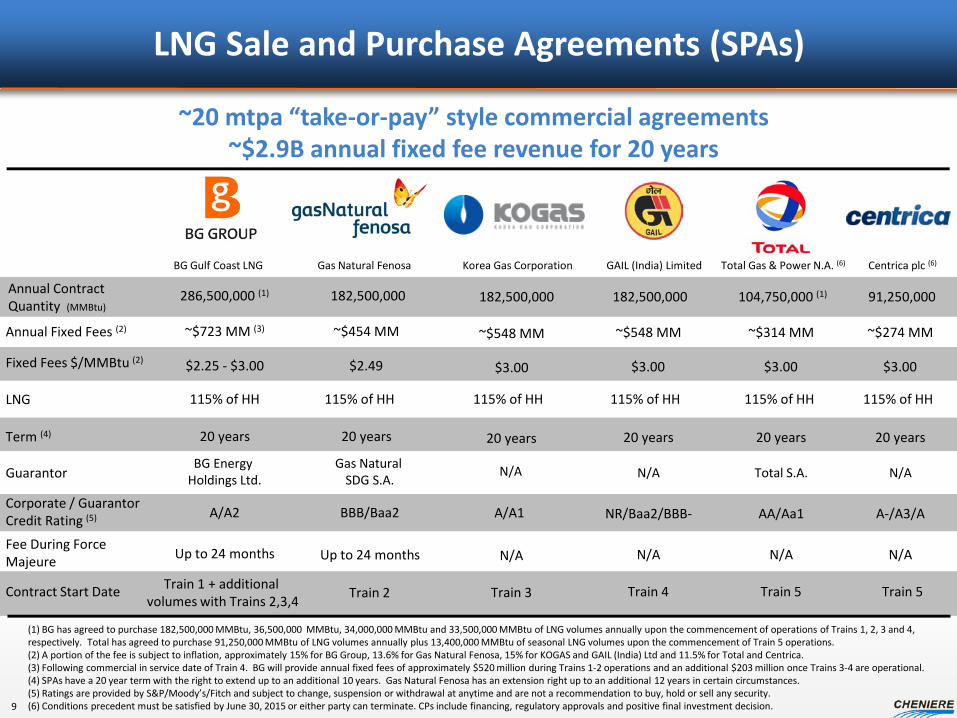
LNG Sale and Purchase Agreements (SPAs)
(1) BG has agreed to purchase 182,500,000 MMBtu, 36,500,000 MMBtu, 34,000,000 MMBtu and 33,500,000 MMBtu of LNG volumes annually upon the commencement of operations of Trains 1, 2, 3 and 4, respectively. Total has agreed to purchase 91,250,000 MMBtu of LNG volumes annually plus 13,400,000 MMBtu of seasonal LNG volumes upon the commencement of Train 5 operations. (2) A portion of the fee is subject to inflation, approximately 15% for BG Group, 13.6% for Gas Natural Fenosa, 15% for KOGAS and GAIL (India) Ltd and 11.5% for Total and Centrica. (3) Following commercial in service date of Train 4. BG will provide annual fixed fees of approximately $520 million during Trains 1-2 operations and an additional $203 million once Trains 3-4 are operational. (4) SPAs have a 20 year term with the right to extend up to an additional 10 years. Gas Natural Fenosa has an extension right up to an additional 12 years in certain circumstances. (5) Ratings are provided by S&P/Moody’s/Fitch and subject to change, suspension or withdrawal at anytime and are not a recommendation to buy, hold or sell any security. (6) Conditions precedent must be satisfied by June 30, 2015 or either party can terminate. CPs include financing, regulatory approvals and positive final investment decision.
BG Gulf Coast LNG Gas Natural Fenosa
Annual Contract Quantity (MMBtu)
286,500,000 (1)
Fixed Fees $/MMBtu (2)
Annual Fixed Fees (2) ~$723 MM (3) ~$454 MM
Term (4)
Guarantor
20 years
BG Energy Holdings Ltd.
Gas Natural SDG S.A.
Corporate / Guarantor Credit Rating (5) A/A2 BBB/Baa2
Fee During Force Majeure Up to 24 months Up to 24 months
20 years
GAIL (India) Limited
~$548 MM
20 years
NR/Baa2/BBB-
N/A
~20 mtpa “take-or-pay” style commercial agreements ~$2.9B annual fixed fee revenue for 20 years
N/A
Contract Start Date Train 1 + additional volumes with Trains 2,3,4 Train 2 Train 4
$2.25 - $3.00 $2.49 $3.00
182,500,000 182,500,000
20 years
N/A
N/A
A/A1
Train 3
$3.00
~$548 MM
Korea Gas Corporation
182,500,000
~$314 MM
20 years
AA/Aa1
N/A
Total S.A.
Train 5
$3.00
104,750,000 (1)
Total Gas & Power N.A. (6)
~$274 MM
20 years
A-/A3/A
N/A
N/A
$3.00
91,250,000
Centrica plc (6)
9
Train 5
LNG 115% of HH 115% of HH 115% of HH 115% of HH 115% of HH 115% of HH
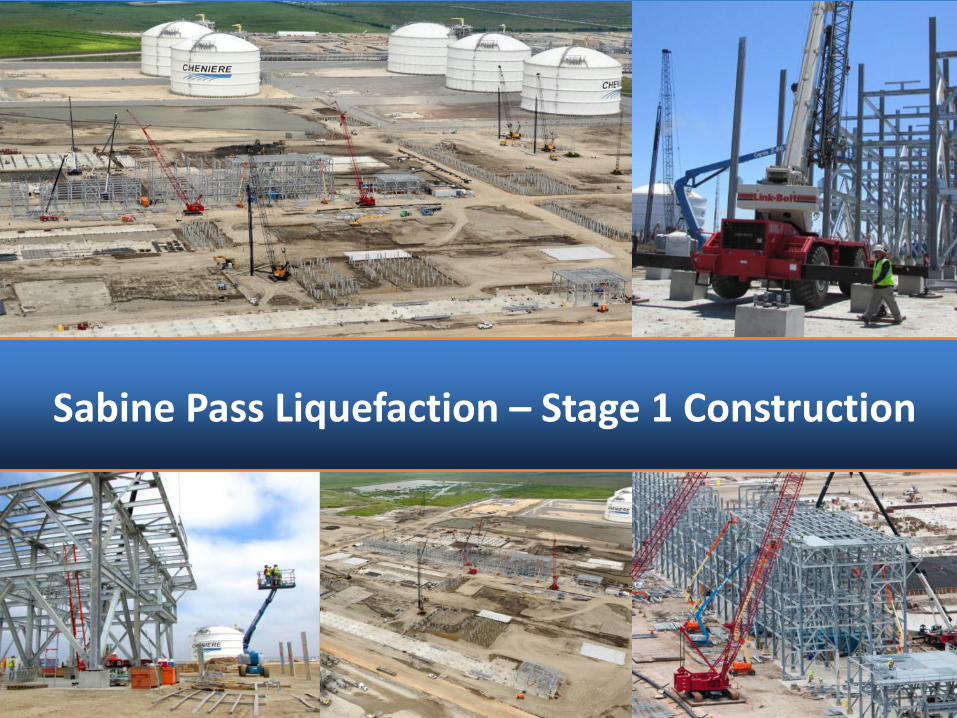
Sabine Pass Liquefaction – Stage 1 Construction
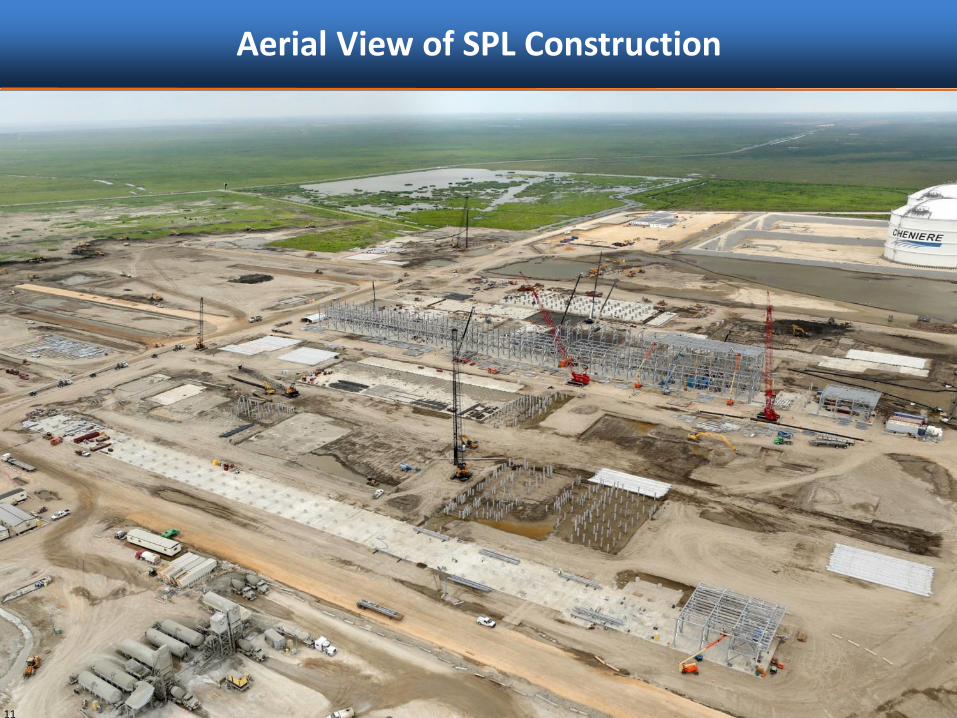
Aerial View of SPL Construction
11
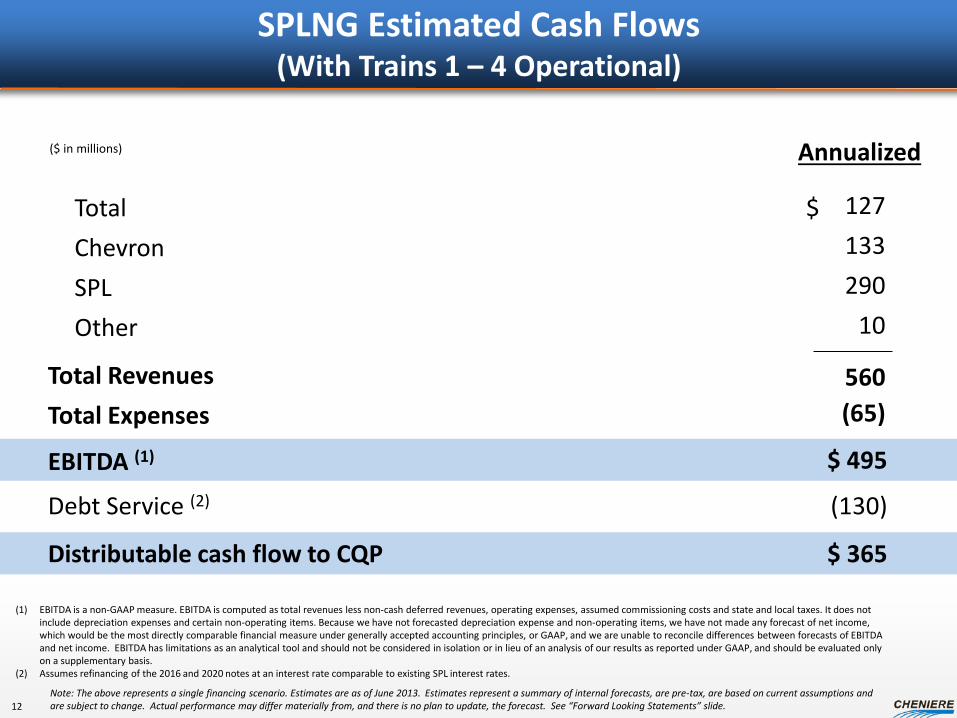
SPLNG Estimated Cash Flows (With Trains 1 – 4 Operational)
Total Revenues Total Expenses
Total Chevron SPL Other
EBITDA (1)
127 133 290
10
560 (65)
$ 495
$
Distributable cash flow to CQP $ 365
($ in millions)
Debt Service (2) (130)
Annualized
(1) EBITDA is a non-GAAP measure. EBITDA is computed as total revenues less non-cash deferred revenues, operating expenses, assumed commissioning costs and state and local taxes. It does not include depreciation expenses and certain non-operating items. Because we have not forecasted depreciation expense and non-operating items, we have not made any forecast of net income, which would be the most directly comparable financial measure under generally accepted accounting principles, or GAAP, and we are unable to reconcile differences between forecasts of EBITDA and net income. EBITDA has limitations as an analytical tool and should not be considered in isolation or in lieu of an analysis of our results as reported under GAAP, and should be evaluated only on a supplementary basis.
(2) Assumes refinancing of the 2016 and 2020 notes at an interest rate comparable to existing SPL interest rates.
Note: The above represents a single financing scenario. Estimates are as of June 2013. Estimates represent a summary of internal forecasts, are pre-tax, are based on current assumptions and are subject to change. Actual performance may differ materially from, and there is no plan to update, the forecast. See “Forward Looking Statements” slide. 12
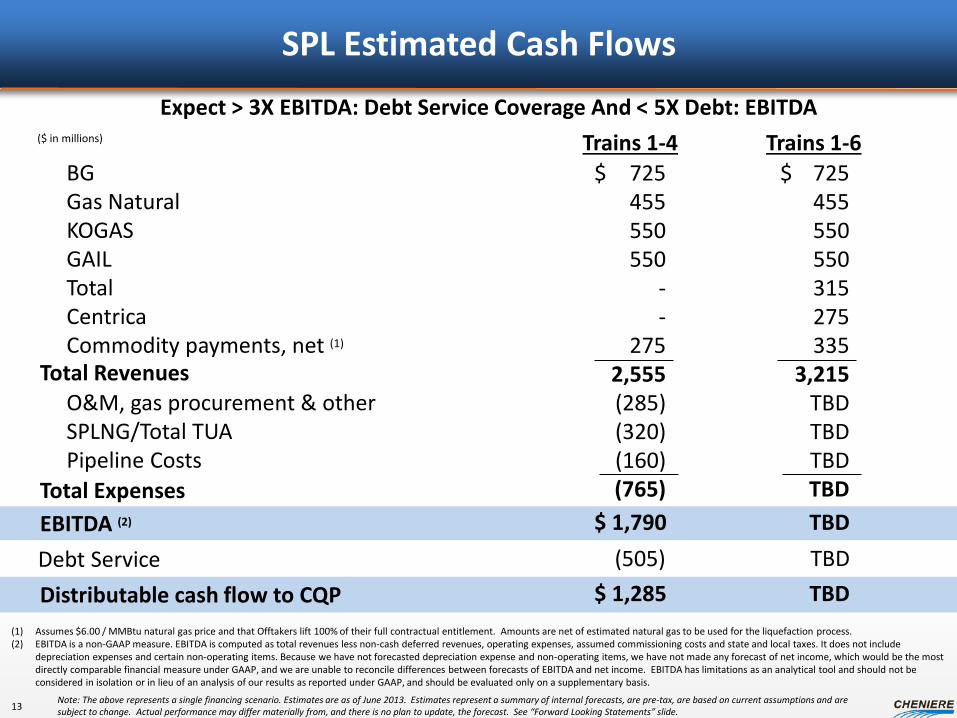
SPL Estimated Cash Flows
Trains 1-4
Total Revenues
BG Gas Natural KOGAS GAIL Total Centrica Commodity payments, net (1)
O&M, gas procurement & other SPLNG/Total TUA Pipeline Costs EBITDA (2)
725 455 550 550
- -
275 2,555 (285) (320) (160) (765)
$ 1,790
$
($ in millions)
Total Expenses
(1) Assumes $6.00 / MMBtu natural gas price and that Offtakers lift 100% of their full contractual entitlement. Amounts are net of estimated natural gas to be used for the liquefaction process. (2) EBITDA is a non-GAAP measure. EBITDA is computed as total revenues less non-cash deferred revenues, operating expenses, assumed commissioning costs and state and local taxes. It does not include
depreciation expenses and certain non-operating items. Because we have not forecasted depreciation expense and non-operating items, we have not made any forecast of net income, which would be the most directly comparable financial measure under GAAP, and we are unable to reconcile differences between forecasts of EBITDA and net income. EBITDA has limitations as an analytical tool and should not be considered in isolation or in lieu of an analysis of our results as reported under GAAP, and should be evaluated only on a supplementary basis.
Note: The above represents a single financing scenario. Estimates are as of June 2013. Estimates represent a summary of internal forecasts, are pre-tax, are based on current assumptions and are subject to change. Actual performance may differ materially from, and there is no plan to update, the forecast. See “Forward Looking Statements” slide.
Expect > 3X EBITDA: Debt Service Coverage And < 5X Debt: EBITDA
13
Trains 1-6
725 455 550 550 315 275 335
3,215 TBD TBD TBD TBD
TBD
$
Debt Service (505) Distributable cash flow to CQP $ 1,285 TBD
TBD

CQP Estimated Distributable Cash Flows
Trains 1-4
Distributions (1)
Public common units Cheniere common units General partner
Distribution per unit (1)
690 690 295
$ 3.00
$
Total distributions from contracted cash flow $ 1,675
($ in millions)
SPLNG distributable cash flow SPL distributable cash flow CTPL distributable cash flow CQP expenses
$ 365 1,285
40 (15)
plus: Est. CF generated at CQP from CMI SPA (2) $0 - $250
(1) Assumes the conversion of all subordinated units and Class B units to common units and assumes ~231 million of public common units, ~231 Cheniere common units and 2% general partner interest held by Cheniere.
(2) Assumes net margins of up to $10.00/MMBtu. Note: The above represents a single financing scenario. Estimates are as of June 2013. Estimates represent a summary of internal forecasts, are pre-tax, are based on current assumptions and are subject to change. Actual performance may differ materially from, and there is no plan to update, the forecast. See “Forward Looking Statements” slide. 14
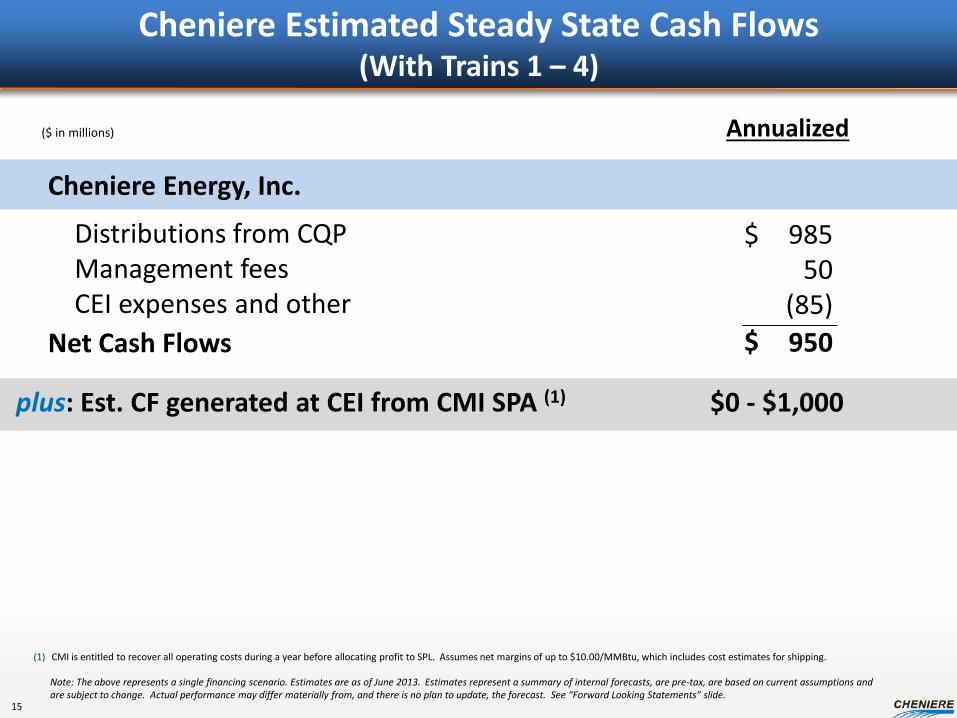
Cheniere Estimated Steady State Cash Flows (With Trains 1 – 4)
($ in millions)
Net Cash Flows
Cheniere Energy, Inc.
Distributions from CQP Management fees CEI expenses and other
985 50
(85) 950
$
$
plus: Est. CF generated at CEI from CMI SPA (1) $0 - $1,000
(1) CMI is entitled to recover all operating costs during a year before allocating profit to SPL. Assumes net margins of up to $10.00/MMBtu, which includes cost estimates for shipping.
Note: The above represents a single financing scenario. Estimates are as of June 2013. Estimates represent a summary of internal forecasts, are pre-tax, are based on current assumptions and are subject to change. Actual performance may differ materially from, and there is no plan to update, the forecast. See “Forward Looking Statements” slide.
Annualized
15

Summary Organizational Structure
Cheniere Energy, Inc. (NYSE MKT: LNG)
Cheniere Energy Partners, L.P. (NYSE MKT: CQP)
Sabine Pass LNG, L.P. (SPLNG)
58% Cheniere Energy, Inc. 29% Blackstone 13% Public
BG SPA (286.5 million MMBtu / yr)
Gas Natural SPA (182.5 million MMBtu / yr)
KOGAS SPA (182.5 million MMBtu / yr)
GAIL SPA (182.5 million MMBtu / yr)
Total TUA (1 Bcf/d)
Chevron TUA (1 Bcf/d)
SPL TUA (2 Bcf/d)
Sr Secured Notes $1,666 due 2016 $420 due 2020
($ in millions) No Debt
Cheniere Marketing Corpus Christi Liquefaction
Trains 1-4 Debt $5,900 Credit Facilities
due 2020 (1)
$2,000 Notes due 2021 $1,000 Notes due 2023
CMI SPA (up to 104 million MMBtu / yr)
Total SPA (104.8 million MMBtu / yr)
Sabine Pass Liquefaction, LLC
(SPL)
Centrica SPA (91.3 million MMBtu / yr)
16
Creole Trail Pipeline (CTPL)
SPL Firm Transport (1.5 Bcf/d)
$400 Term Loan due 2017
CQP GP (& IDRs)
(1) Includes $4,400 million term loan facility, $1,080 million Republic of Korea (“ROK”) covered facility and $420 million ROK direct facility. These Credit Facilities mature on the earlier of May 28, 2020 or the second anniversary of Train 4 completion date.

CMI SPA – Excess Volumes from Trains 1-4 at SPL
CMI-SPL SPA provides CMI with up to 2 mtpa of LNG delivered FOB Sabine Pass starting with the initial production from Train 1
• Maximum Annual Contract Quantity of up to 104 TBtu/year from first four trains
SPA sharing mechanic incents profit maximization • Sharing based on ranking of the net profit for each cargo, from highest to lowest:
– Tranche 1: CMI pays SPL up to $3.00/MMBtu – Tranche 2: CMI pays SPL 20% of profits
• Tranches shift at 18 TBtu for Trains 1&2, 36 TBtu for Trains 3&4 • CMI is entitled to recover all operating costs during a year before allocating profit to SPL
Initial deliveries anticipated to begin as early as 4Q 2015 CMI entered into three five-year time-charter contracts for LNG carriers
• Delivery of first LNG carrier expected in 2015 and two additional LNG carriers to be delivered in 2016
Note: See “Forward Looking Statements” slide.
LNG sold 104 Bcf
Net margin $10/MMBtu
Net margin $1 BN
Example Annual Cash Flow on CMI SPA
17

Corpus Christi Liquefaction Project
Proposed Facility >1,000 acres owned and/or controlled near
Corpus Christi, TX 3 trains, each 4.5 mtpa nameplate capacity 2 berths 3 LNG storage tanks (~10.1 Bcfe of storage) ConocoPhillips’ Optimized Cascade® Process
Key Project Attributes Marine environment conducive to
receiving large tankers • 45 ft ship channel 13.7 miles from coast • Protected berth Premier Site Conditions
• Established industrial zone • Elevated site protects from storm surge • Soils do not require piles • Local labor, infrastructure & utilities • Proximate pipeline interconnections to 4.5
Bcf/d receipt/takeaway capacity
Houston New Orleans
Gulf of Mexico Corpus Christi
All major permit applications have been filed 18
Artist’s rendition

Timeline & Milestones
Initiate permitting process (FERC & DOE)
Commercial agreements 2H13
EPC contract 2H13
Financing commitments 1H14
Regulatory approvals 1H14
Commence construction 1H14
Commence operations (1) 2016/17 2017
Milestone Corpus Christi
(1) Each Train is expected to commence operations approximately six to nine months after the previous train. Note: See “Forward Looking Statements” slide.
T3-4 T1-2
Target Date
2015/16
Project teams in place with the same key people that developed Sabine Pass LNG and Creole Trail Pipeline on-time and on-budget
Sabine Pass
T5-6
19
1H15
2018
2H14
1H15
2H14
TBD

Appendix
Sabine Pass Liquefaction Project Update
Trains 1&2 fully financed & under construction, LSTK with Bechtel
• Total EPC contract price ~$3.97 billion • Trains 1&2 construction started August 2012 • Bechtel is ahead of schedule – expect operations by 1Q 2016 • Full $1.89 billion of equity capital has been contributed to SPL
Trains 3&4 fully financed & under construction, LSTK with Bechtel • Total contract price ~$3.77 billion • EPC contract terms materially same as Trains 1&2 • Guaranteed schedule shorter than Trains 1&2 • Construction commenced in May 2013
Trains 5&6 initiated permitting process in Feb. 2013, preliminary engineering with Bechtel • Completed contracts for 3.75 mtpa of LNG volumes from Train 5 • Formal application expected to be filed with FERC in 2H 2013 • Export applications filed with DOE for FTA and Non-FTA authorizations to export LNG
volumes under Total SPA and Centrica SPA
Liquefaction project includes up to six trains in various stages of development
21
2012 2013 2014 2015 2016 2017 20181 2 3 4 5 6 7 8 9 10 11 12 13 14 15 16 17 18 19 20 21 22 23 24 25 26 27 28 29 30 31 32 33 34 35 36 37 38 39 40 41 42 43 44 45 46 47 48 49 50 51 52 53 54 55 56 57 58 59 60 61 62 63 64 65 66 67 68 69 70 71 72
GuaranteedAccelerated
GuaranteedAccelerated
Early Engineering
Guaranteed
Guaranteed
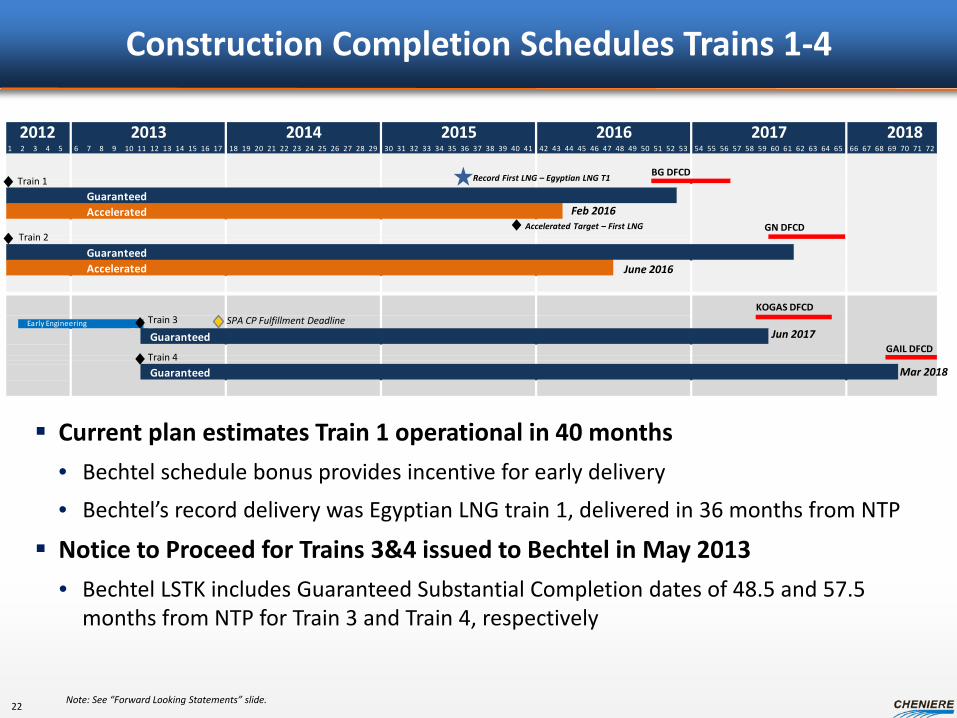
Construction Completion Schedules Trains 1-4
Note: See “Forward Looking Statements” slide.
Current plan estimates Train 1 operational in 40 months • Bechtel schedule bonus provides incentive for early delivery
• Bechtel’s record delivery was Egyptian LNG train 1, delivered in 36 months from NTP
Notice to Proceed for Trains 3&4 issued to Bechtel in May 2013 • Bechtel LSTK includes Guaranteed Substantial Completion dates of 48.5 and 57.5
months from NTP for Train 3 and Train 4, respectively
BG DFCD
GN DFCD
KOGAS DFCD
GAIL DFCD
Record First LNG – Egyptian LNG T1
Accelerated Target – First LNG
Train 1
Train 2
Train 3
Train 4
SPA CP Fulfillment Deadline
Feb 2016
June 2016
Jun 2017
Mar 2018
22

Why Bechtel Constructed one-third of the world’s liquefaction facilities - more than any other contractor Top US construction contractor for 15 straight years by Engineering News-Record Bechtel was the EPC contractor for the regasification project at the Sabine Pass LNG Terminal, which
was constructed on time and on budget
Bechtel Experience
Key Competitive and Cost Advantages
Existing SPLNG infrastructure provides significant cost advantages • Jetty, pipeline, control room, ~17 Bcf storage tanks, etc.
Economies of scale from building multiple trains Easy access to the Gulf Coast labor pool and we believe labor relations are strong Established marine and road access provide easy delivery of materials
Project name Country COD date
Type
Wheatstone LNG Australia 2016 Cost reimbursable Gladstone LNG Australia 2015 Lump sum Australia Pacific LNG Australia 2015 Lump sum Curtis Island LNG Australia 2014 Lump sum Angola LNG Angola 2013 Lump sum
Equatorial Guinea LNG Equatorial Guinea 2007 Lump sum
Darwin LNG Australia 2006 Lump sum
Atlantic LNG Trinidad & Tobago 2006 (1) Lump sum
Egypt LNG Egypt 2005 Lump sum
Kenai LNG Alaska 1969 Construction only (1) Commercial operation of Train 1 in 1999, Train 2 in 2002, Train 3 in 2003 and Train 4 in 2006.
LSTK EPC Contract with Bechtel Minimize Construction Costs and Risks
23
Sabine Pass LNG
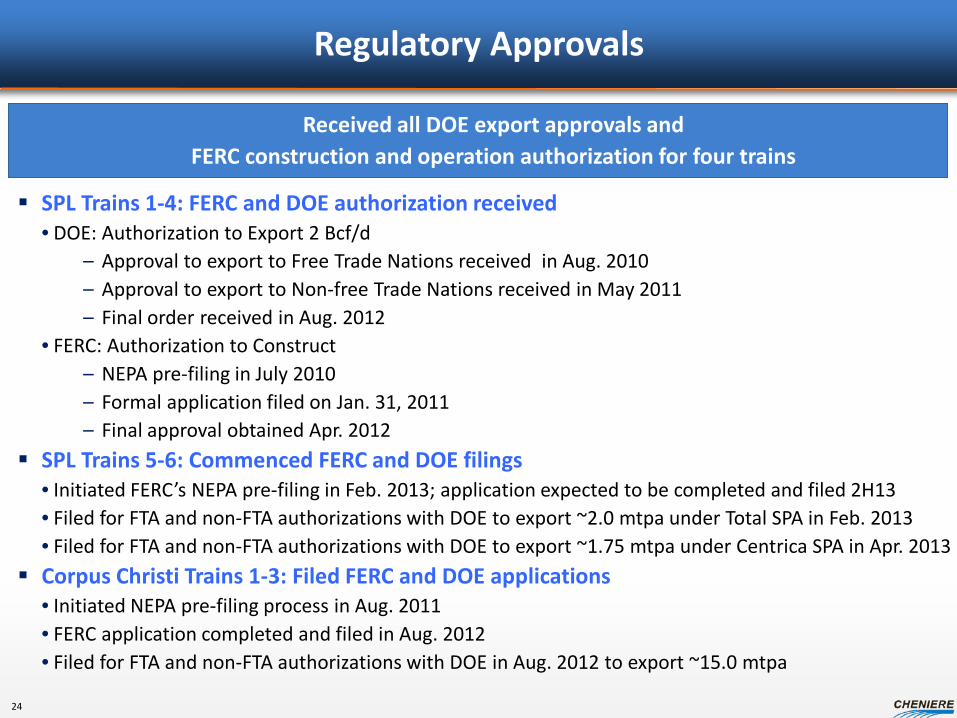
Regulatory Approvals
SPL Trains 1-4: FERC and DOE authorization received • DOE: Authorization to Export 2 Bcf/d
– Approval to export to Free Trade Nations received in Aug. 2010 – Approval to export to Non-free Trade Nations received in May 2011 – Final order received in Aug. 2012
• FERC: Authorization to Construct – NEPA pre-filing in July 2010 – Formal application filed on Jan. 31, 2011 – Final approval obtained Apr. 2012
SPL Trains 5-6: Commenced FERC and DOE filings • Initiated FERC’s NEPA pre-filing in Feb. 2013; application expected to be completed and filed 2H13 • Filed for FTA and non-FTA authorizations with DOE to export ~2.0 mtpa under Total SPA in Feb. 2013 • Filed for FTA and non-FTA authorizations with DOE to export ~1.75 mtpa under Centrica SPA in Apr. 2013 Corpus Christi Trains 1-3: Filed FERC and DOE applications
• Initiated NEPA pre-filing process in Aug. 2011 • FERC application completed and filed in Aug. 2012 • Filed for FTA and non-FTA authorizations with DOE in Aug. 2012 to export ~15.0 mtpa
Received all DOE export approvals and FERC construction and operation authorization for four trains
24
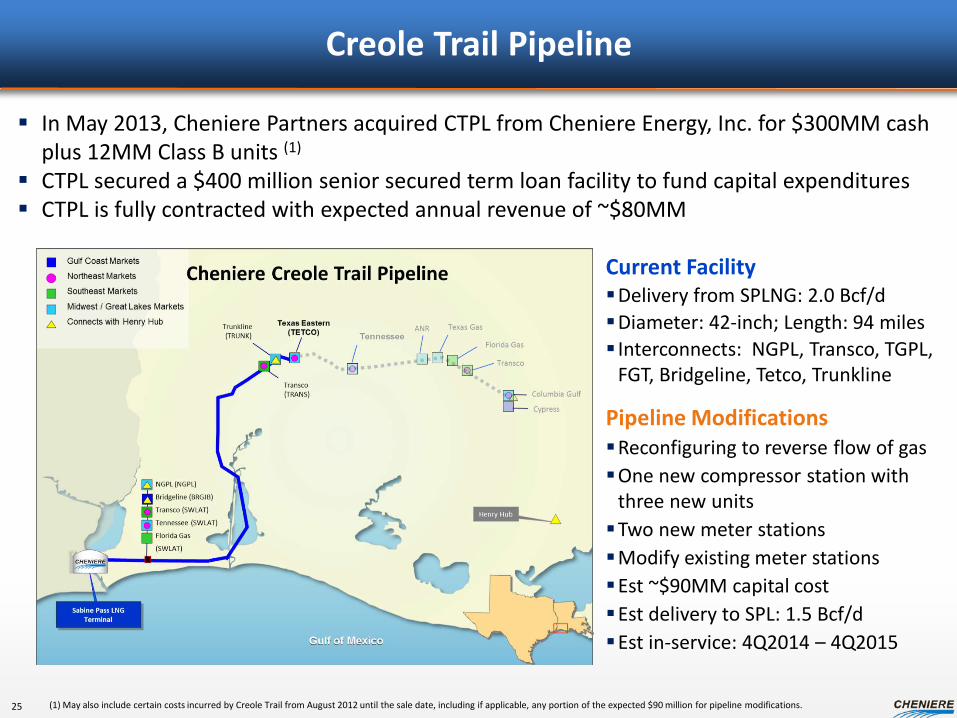
Current Facility Delivery from SPLNG: 2.0 Bcf/d Diameter: 42-inch; Length: 94 miles Interconnects: NGPL, Transco, TGPL,
FGT, Bridgeline, Tetco, Trunkline
Pipeline Modifications Reconfiguring to reverse flow of gas One new compressor station with
three new units Two new meter stations Modify existing meter stations Est ~$90MM capital cost Est delivery to SPL: 1.5 Bcf/d Est in-service: 4Q2014 – 4Q2015
Creole Trail Pipeline
In May 2013, Cheniere Partners acquired CTPL from Cheniere Energy, Inc. for $300MM cash plus 12MM Class B units (1)
CTPL secured a $400 million senior secured term loan facility to fund capital expenditures CTPL is fully contracted with expected annual revenue of ~$80MM
(1) May also include certain costs incurred by Creole Trail from August 2012 until the sale date, including if applicable, any portion of the expected $90 million for pipeline modifications. 25
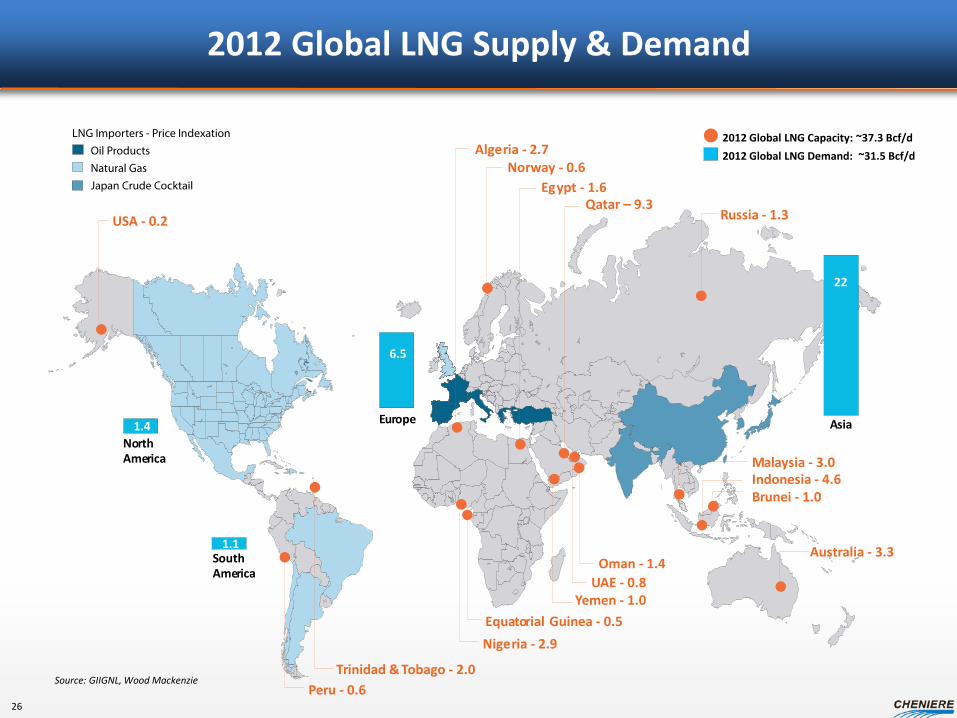
2012 Global LNG Supply & Demand
2012 Global LNG Capacity: ~37.3 Bcf/d
Natural GasOil Products
LNG Importers - Price Indexation
Japan Crude Cocktail
2012 Global LNG Demand: ~31.5 Bcf/d
No r th Ame r ica
S outh Ame r ica
E u r ope A sia
6.5
1.4
1.1
22
A ust r alia - 3.3
B r unei - 1.0 Indonesia - 4.6 M al a y sia - 3.0
A lge r ia - 2.7 N o r w a y - 0.6
Q a tar – 9.3 R ussia - 1.3
E g ypt - 1.6
Y emen - 1.0
Nige r ia - 2.9
T r inidad & T obago - 2.0
E qua t o r ial G uinea - 0.5
Oman - 1.4 U AE - 0.8
USA - 0.2
P e r u - 0.6 Source: GIIGNL, Wood Mackenzie
26

US Proved Non-Producing Reserves
Productive Capacity from Unconventional Reservoirs
Tcf
Bcf/d MMB/d
Current market fundamentals in the U.S. – increased production, increased natural gas reserves and lackluster increase in natural gas demand – have created an opportunity to expand into exports – benefitting U.S. economy, creating jobs and reducing balance of trade
49 5160 67
78 8598
113
0
20
40
60
80
100
120
2003 2004 2005 2006 2007 2008 2009 2010
Source: EIA, US Crude Oil, Natural Gas and Natural Gas Liquids Proved Reserves, 2010.
Source: Advanced Resource Intl; Cheniere Research.
U.S. Natural Gas Markets
Includes Eagle Ford, Barnett Combo, Bakken, Permian, Anadarko, W. Marcellus, Utica, Cotton Valley, Piceance & Uinta
US Natural Gas Resources Tcf
Source: Potential Gas Committee, 2013; EIA, Natural Gas Proved Reserves, 2010
US Gas Consumptions vs. Production
Source: EIA 2012 Natural Gas Annual.
18.1 18.519.3
20.2 20.621.3
22.924.122.0 21.7
23.1 23.3 22.924.1 24.4
25.5
10
12
14
16
18
20
22
24
26
2005 2006 2007 2008 2009 2010 2011 2012E
US Gas ProductionUS Gas Consumption
Tcf
• U.S. resources increased by 75% since 2006 • Represents over 100 years of supply at current demand
0
500
1000
1500
2000
2500
3000
2006 2008 2010 2012Shale Other
2,689 2,203 2,081
1,532
27

Montana Thrust Belt
Cody
Gammon
Hilliard Baxter- Mancos
Greater Green River Basin Forest
City Basin
Pierre
Illinois Basin
Piceance Basin
Lewis San Juan
Basin
Raton Basin Anadarko
Basin
PaloDuro Basin
Permian Basin Barnett
Woodford
Pearsall
Eagle Ford Rio Grande Embayment
Barnett
Woodford
Michigan Basin Antrim
New Albany
Chattanooga
Texas Louisiana Mississippi Salt Basin
Fayetteville
Ft. Worth Basin
Arkoma Basin Conasauga Black Warrior
Basin
Marfa Basin
Paradox Basin
Maverick Sub-Basin
Hermosa
Mancos Cherokee Platform
Excello- Mulky
Appalachian Basin
Marcellus/Utica
Shale Plays
Basins
Sabine Pass LNG
Haynesville Bossier
Granite Wash
Williston Basin
Bakken
Primary Gas Sources for Sabine Pass Liquefaction Conventional Gulf Coast Onshore; Barnett; Haynesville; Bossier; Eagle Ford
Sources: EIA (US map graphic, pipelines and LNG terminals placed by Cheniere) Advanced Resources Intl (Lower 48 Unconventional Recoverable Reserves), ARI shale estimates updated April 2010 Depicted Pipelines: Rockies Express, Texas Eastern, Trunkline, Transco, FGT, C/P/SESH/Gulf Crossing (as a single route)
Rig Count
Production Bcf/d
Barnett 31 5.7 Haynesville 32 7.1 Eagle Ford 169 2.5
Granite wash 106 1.6 Bakken 161 0.7
Marcellus 101 7.3
Source: Lippman Consulting and PIRA, as of January 2013
Uinta
Strategically Located – Extensive Market Access to Gas
366
1,904
Lower 48 Recoverable Unconventional
Reserves (Tcf)
0
500
1500
1996 2012
Shale CBM Tight Gas
Total US Proved
Reserves
2000
318
28
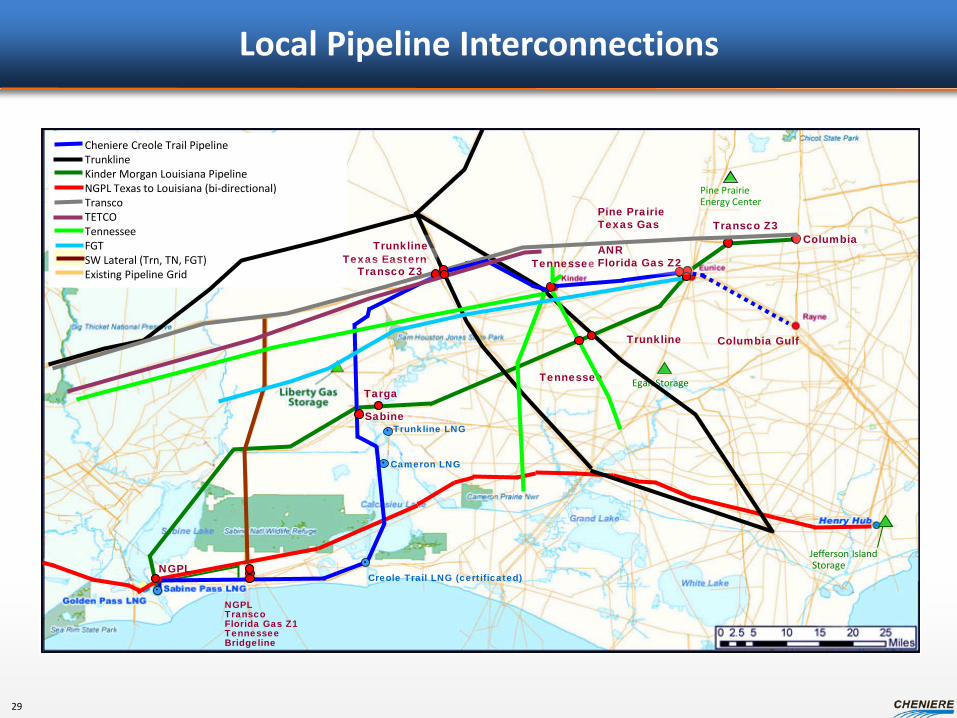
Local Pipeline Interconnections
Targa
Columbia Gulf
Tennessee
Cheniere Creole Trail Pipeline Trunkline Kinder Morgan Louisiana Pipeline NGPL Texas to Louisiana (bi-directional) Transco TETCO Tennessee FGT SW Lateral (Trn, TN, FGT) Existing Pipeline Grid
Transco Z3
Sabine
Pine Prairie Energy Center
Egan Storage
Jefferson Island Storage
Creole Trail LNG (certificated)
Pine Prairie Texas Gas ANR Florida Gas Z2
. Cameron LNG
.
Tennessee
Trunkline
Columbia
Trunkline LNG .
NGPL Transco Florida Gas Z1 Tennessee Bridgeline
. NGPL
Texas Eastern Trunkline
Transco Z3
29

Source: Office of Oil and Gas Global Security and Supply, Office of Fossil Energy, U.S. Department of Energy; U.S. Federal Energy Regulatory Commission; Company releases
U.S. LNG Export Projects
Dominion Cove Point
Under Construction
Company Quantity (Bcf/d) DOE FERC* Contracts
Cheniere Sabine Pass T1 – T4 2.2 Fully permitted Fully
Subscribed
Freeport 1.4 FTA + NonFTA T1-T2
Dominion Cove Point 1.0 FTA
Fully Subscribed
Jordan Cove 1.2/0.8 FTA
Cameron LNG 1.7 FTA Fully Subscribed
Oregon LNG 1.25 FTA
Cheniere Corpus Christi 2.1 FTA
Cheniere Sabine Pass T5 – T6 1.3 T5 Filed
T5 Subscribed
Freeport LNG
Cheniere Corpus Christi
Plus other proposed LNG export projects that have not filed a FERC application. * Application filed = , FERC scheduling notice issued = Filed FERC Application
Proposed Projects
Jordan Cove
Oregon LNG
Southern
Pascagoula Golden Pass
Excelerate Cameron LNG
Lake Charles
Cheniere Sabine Pass
30

Projected Firm Liquefaction Capacity Additions
0.00
0.25
0.50
0.75
1.00
1.25
1.50
1.75
2.00
2.25
2.50
2.75
3.00
13Q1 13Q2 13Q3 13Q4 14Q1 14Q2 14Q3 14Q4 15Q1 15Q2 15Q3 15Q4 16Q1 16Q2 16Q3 16Q4 17Q1 17Q2 17Q3 17Q4 18Q1 18Q2 18Q3 18Q4
2013 2014 2015 2016 2017 2018
Asia Pacific
Atlantic Basin
Bcf/d
Skikda & Angola LNG
PNG T1 & Pacific Rubiales LNG
Gorgon T1, Curtis T1 & Donggi LNG
Gassi Touil
Curtis T2 & PNG T2
Gorgon T2, APLNG T1, SPL T1
Gladstone T1
Gorgon T3, SPL T2
APLNG T2
Ichtys T1, Wheatstone T1, Gladstone T3
Wheatstone T2, Petronas FLNG, SPL T3
Ichtys T2
SPL T4
Prelude FLNG
Nameplate Liquefaction Capacity ~ 37 Bcf/d as of YE 2012 ~ 51.5 Bcf/d by YE 2018
Source: Cheniere Research 31

Pro Forma CQP Ownership
Current common unit annualized distribution expected to be $1.70/unit (1)
Class B units accrete 3.5% quarterly until convertible into common units
(1) Currently, CQP is paying distributions on the common units and the applicable 2% distribution to the GP.
Note: The above represents a summary of internal forecasts, are based on current assumptions and are subject to change. Actual performance may differ materially from, and there is no plan to update, the forecast. See “Forward Looking Statements” slide. Unit amounts are current units outstanding, including Blackstone’s total investment of $1.5B but excluding accretion of Class B Units.
32
(in millions) CEI Blackstone Public Total
Common units 12.0 45.1 57.1 Class B units 45.3 100.0 145.3 Subordinated units 135.4 135.4 General Partner @ 2% 6.9 6.9 199.6 100.0 45.1 344.7 Percent of total (as of 5/31/13) 57.9% 29.0% 13.1% 100.0% Pro forma accretion YE2016 241.0 185.7 45.1 471.8 Percent of total (pro forma YE2016) 51.1% 39.4% 9.6% 100.0%

Condensed Balance Sheets Pro Forma CTPL Purchase and Credit Facility
Other Cheniere Energy, Inc. unrestricted cash and cash equivalents adjusted for sale of Creole Trail Pipeline in May 2013 of $314 million
CQP restricted cash and cash equivalents adjusted for proceeds from CTPL term loan, net of CTPL purchase
CQP long-term debt adjusted for CTPL term loan of $400 million
33
(in millions) As of March 31, 2013
Pro Forma CTPL Purchase and Credit Facility
CQP
Other Cheniere
Energy, Inc. (1) Consolidated
CEI (2)
CQP
Other Cheniere
Energy, Inc. (1) Consolidated
CEI (2)
Unrestricted cash and cash equivalents $ - $ 178 $ 178 $ - $ 492 $ 492
Restricted cash and cash equivalents (3) 2,176 13 2,189 2,253
13 2,266
Long-term debt, net of discount 3,668 - 3,668 4,068 - 4,068
(1) Includes intercompany eliminations and reclassifications. (2) For complete balance sheets, see the Cheniere Energy, Inc., Cheniere Energy Partners, L.P and Sabine Pass LNG, L.P. Quarterly Report on Form 10-Q for the quarter ended March 31,
2013, filed with the SEC on May 3, 2013. (3) Restricted cash and cash equivalents include liquefaction reserves and debt service reserves as required per the Sabine Pass Liquefaction credit facility and the Sabine Pass LNG
indentures, respectively. Cash is presented as restricted at the consolidated level.


Nancy Bui: Director, Investor Relations – (713) 375-5280, [email protected] Christina Burke: Manager, Investor Relations – (713) 375-5104, [email protected]
Investor Relations Contacts:
Related Documents