Analytica Chimica Acta 705 (2011) 174–181 Contents lists available at ScienceDirect Analytica Chimica Acta jou rn al hom epa ge: www.elsevier.com/locate/aca Chemometric methods applied to the calibration of a Vis–NIR sensor for gas engine’s condition monitoring Alberto Villar a,∗ , Eneko Gorritxategi a , Deitze Otaduy a , Jose I. Ciria b , Luis A. Fernandez c a Manufacturing Processes Department, Tekniker-IK4, Av.Otaola 20, 20600 Eibar, Spain b Industrial Analysis Department, Tekniker-IK4, Av.Otaola 20, 20600 Eibar, Spain c Department of Analytical Chemistry, University of the Basque Country, 48080 Bilbao, Spain a r t i c l e i n f o Article history: Received 10 January 2011 Received in revised form 13 April 2011 Accepted 21 April 2011 Available online 5 May 2011 Keywords: Oil condition monitoring Partial least squares Gas engine On-line sensor Calibration Visible–Near Infrared a b s t r a c t This paper describes the calibration process of a Visible–Near Infrared sensor for the condition monitoring of a gas engine’s lubricating oil correlating transmittance oil spectra with the degradation of a gas engine’s oil via a regression model. Chemometric techniques were applied to determine different parameters: Base Number (BN), Acid Number (AN), insolubles in pentane and viscosity at 40 ◦ C. A Visible–Near Infrared (400–1100 nm) sensor developed in Tekniker research center was used to obtain the spectra of artificial and real gas engine oils. In order to improve sensor’s data, different preprocessing methods such as smoothing by Saviztky–Golay, moving average with Multivariate Scatter Correction or Standard Normal Variate to eliminate the scatter effect were applied. A combination of these preprocessing methods was applied to each parameter. The regression models were developed by Partial Least Squares Regression (PLSR). In the end, it was shown that only some models were valid, fulfilling a set of quality requirements. The paper shows which models achieved the established validation requirements and which preprocessing methods perform better. A discussion follows regarding the potential improvement in the robustness of the models. © 2011 Elsevier B.V. All rights reserved. 1. Introduction Lubricating oil is a critical fluid in gas engines and constant mon- itoring is necessary in order to avoid failures in the engine. Gas engine lubricating oil during its operation life suffers high pres- sures, temperatures and is contaminated with harmful external fluids and particles. These conditions lead to the degradation of the oil. In gas engines a pre-established period of oil change does not exist. The life of the oil depends on the capacity of the carter, running conditions, temperature, air/gas relation, oil features and the limits established by the manufactures which sometimes are highly conservative and give rise to an increase of the costs if the oil is changed before needed [1]. Nowadays, on-line monitoring sensors can be the solution for these problems and result in significant savings in operational costs by solving the following challenges in the industry: a reduc- tion in the number of surveys performed, an increase in the time the equipment is available for utilisation and savings on material and components held on stocks which are prematurely discarded. Industry will benefit from real time analysis in the following ways: ∗ Corresponding author. Tel.: +34 943 20 67 44; fax: +34 943 20 27 57. E-mail address: [email protected] (A. Villar). access to lubrication conditions in extreme circumstances and no accessible engines, real knowledge of the mechanical components’ behaviour in the engine and establishment of a good predictive and proactive maintenance to detect early stages of degradation and abnormal performance [2]. Besides, it is also possible to reduce the serious environmental problems associated with lubricant disposal and to decrease the waste due to unnecessary oil changes. In relevant literature one can find different in-line or on- line sensors developed to monitor the lubricating oil in engines. These sensors are based in different techniques, such as in mid- infrared spectroscopy absorption [3], attenuated total reflectance infrared (ATR-IR) spectroscopy [4,5], electrochemical impedance spectroscopy [6] or dielectric parameters (electrostatic, permittiv- ity and resistance) measurements [7–10]. In this case the on-line sensor developed by Tekniker is based in Vis–NIR spectroscopy. This work involves correlating transmittance oil spectra with the condition of a gas engine’s oil and explores the possibility of using chemometric techniques for determining important chemi- cal oil parameters such as the Base Number (BN), the Acid Number (AN), the viscosity at 40 ◦ C and the amount of insolubles in pen- tane. A Visible–Near Infrared (400–1100 nm) sensor developed in Tekniker was employed together with artificial and real oil sam- ples. The former were obtained in Tekniker’s oil laboratory and the latter were supplied by Guascor (Vitoria, Spain). First, reference val- 0003-2670/$ – see front matter © 2011 Elsevier B.V. All rights reserved. doi:10.1016/j.aca.2011.04.048

Welcome message from author
This document is posted to help you gain knowledge. Please leave a comment to let me know what you think about it! Share it to your friends and learn new things together.
Transcript
Ce
Aa
b
c
a
ARRAA
KOPGOCV
1
iesfltnrtho
tcttaI
0d
Analytica Chimica Acta 705 (2011) 174– 181
Contents lists available at ScienceDirect
Analytica Chimica Acta
jou rn al hom epa ge: www.elsev ier .com/ locate /aca
hemometric methods applied to the calibration of a Vis–NIR sensor for gasngine’s condition monitoring
lberto Villara,∗, Eneko Gorritxategia, Deitze Otaduya, Jose I. Ciriab, Luis A. Fernandezc
Manufacturing Processes Department, Tekniker-IK4, Av.Otaola 20, 20600 Eibar, SpainIndustrial Analysis Department, Tekniker-IK4, Av.Otaola 20, 20600 Eibar, SpainDepartment of Analytical Chemistry, University of the Basque Country, 48080 Bilbao, Spain
r t i c l e i n f o
rticle history:eceived 10 January 2011eceived in revised form 13 April 2011ccepted 21 April 2011vailable online 5 May 2011
eywords:il condition monitoringartial least squares
a b s t r a c t
This paper describes the calibration process of a Visible–Near Infrared sensor for the condition monitoringof a gas engine’s lubricating oil correlating transmittance oil spectra with the degradation of a gas engine’soil via a regression model. Chemometric techniques were applied to determine different parameters: BaseNumber (BN), Acid Number (AN), insolubles in pentane and viscosity at 40 ◦C. A Visible–Near Infrared(400–1100 nm) sensor developed in Tekniker research center was used to obtain the spectra of artificialand real gas engine oils.
In order to improve sensor’s data, different preprocessing methods such as smoothing bySaviztky–Golay, moving average with Multivariate Scatter Correction or Standard Normal Variate to
as enginen-line sensoralibrationisible–Near Infrared
eliminate the scatter effect were applied. A combination of these preprocessing methods was appliedto each parameter. The regression models were developed by Partial Least Squares Regression (PLSR).In the end, it was shown that only some models were valid, fulfilling a set of quality requirements. Thepaper shows which models achieved the established validation requirements and which preprocessingmethods perform better. A discussion follows regarding the potential improvement in the robustness ofthe models.
. Introduction
Lubricating oil is a critical fluid in gas engines and constant mon-toring is necessary in order to avoid failures in the engine. Gasngine lubricating oil during its operation life suffers high pres-ures, temperatures and is contaminated with harmful externaluids and particles. These conditions lead to the degradation ofhe oil. In gas engines a pre-established period of oil change doesot exist. The life of the oil depends on the capacity of the carter,unning conditions, temperature, air/gas relation, oil features andhe limits established by the manufactures which sometimes areighly conservative and give rise to an increase of the costs if theil is changed before needed [1].
Nowadays, on-line monitoring sensors can be the solution forhese problems and result in significant savings in operationalosts by solving the following challenges in the industry: a reduc-ion in the number of surveys performed, an increase in the time
he equipment is available for utilisation and savings on materialnd components held on stocks which are prematurely discarded.ndustry will benefit from real time analysis in the following ways:∗ Corresponding author. Tel.: +34 943 20 67 44; fax: +34 943 20 27 57.E-mail address: [email protected] (A. Villar).
003-2670/$ – see front matter © 2011 Elsevier B.V. All rights reserved.oi:10.1016/j.aca.2011.04.048
© 2011 Elsevier B.V. All rights reserved.
access to lubrication conditions in extreme circumstances and noaccessible engines, real knowledge of the mechanical components’behaviour in the engine and establishment of a good predictive andproactive maintenance to detect early stages of degradation andabnormal performance [2]. Besides, it is also possible to reduce theserious environmental problems associated with lubricant disposaland to decrease the waste due to unnecessary oil changes.
In relevant literature one can find different in-line or on-line sensors developed to monitor the lubricating oil in engines.These sensors are based in different techniques, such as in mid-infrared spectroscopy absorption [3], attenuated total reflectanceinfrared (ATR-IR) spectroscopy [4,5], electrochemical impedancespectroscopy [6] or dielectric parameters (electrostatic, permittiv-ity and resistance) measurements [7–10]. In this case the on-linesensor developed by Tekniker is based in Vis–NIR spectroscopy.
This work involves correlating transmittance oil spectra withthe condition of a gas engine’s oil and explores the possibility ofusing chemometric techniques for determining important chemi-cal oil parameters such as the Base Number (BN), the Acid Number(AN), the viscosity at 40 ◦C and the amount of insolubles in pen-
tane. A Visible–Near Infrared (400–1100 nm) sensor developed inTekniker was employed together with artificial and real oil sam-ples. The former were obtained in Tekniker’s oil laboratory and thelatter were supplied by Guascor (Vitoria, Spain). First, reference val-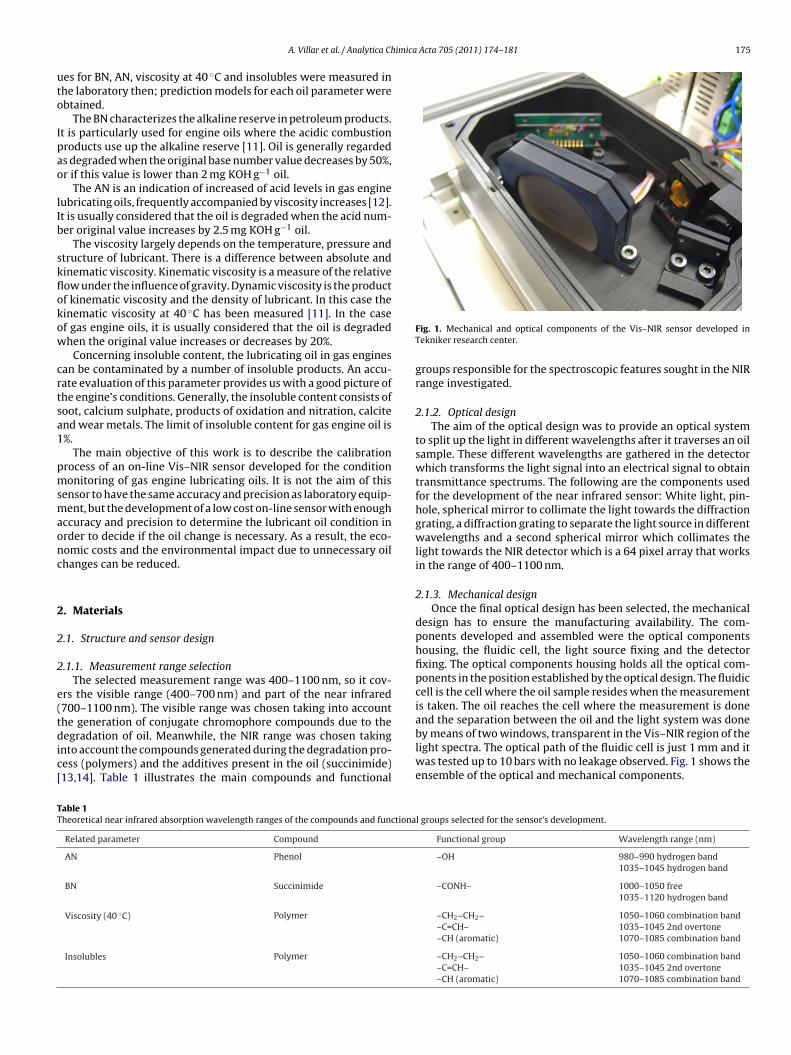
imica Acta 705 (2011) 174– 181 175
uto
Ipao
lIb
skflokow
crtsa1
pmsmaonc
2
2
2
e(tdic[
TT
A. Villar et al. / Analytica Ch
es for BN, AN, viscosity at 40 ◦C and insolubles were measured inhe laboratory then; prediction models for each oil parameter werebtained.
The BN characterizes the alkaline reserve in petroleum products.t is particularly used for engine oils where the acidic combustionroducts use up the alkaline reserve [11]. Oil is generally regardeds degraded when the original base number value decreases by 50%,r if this value is lower than 2 mg KOH g−1 oil.
The AN is an indication of increased of acid levels in gas engineubricating oils, frequently accompanied by viscosity increases [12].t is usually considered that the oil is degraded when the acid num-er original value increases by 2.5 mg KOH g−1 oil.
The viscosity largely depends on the temperature, pressure andtructure of lubricant. There is a difference between absolute andinematic viscosity. Kinematic viscosity is a measure of the relativeow under the influence of gravity. Dynamic viscosity is the productf kinematic viscosity and the density of lubricant. In this case theinematic viscosity at 40 ◦C has been measured [11]. In the casef gas engine oils, it is usually considered that the oil is degradedhen the original value increases or decreases by 20%.
Concerning insoluble content, the lubricating oil in gas enginesan be contaminated by a number of insoluble products. An accu-ate evaluation of this parameter provides us with a good picture ofhe engine’s conditions. Generally, the insoluble content consists ofoot, calcium sulphate, products of oxidation and nitration, calcitend wear metals. The limit of insoluble content for gas engine oil is%.
The main objective of this work is to describe the calibrationrocess of an on-line Vis–NIR sensor developed for the conditiononitoring of gas engine lubricating oils. It is not the aim of this
ensor to have the same accuracy and precision as laboratory equip-ent, but the development of a low cost on-line sensor with enough
ccuracy and precision to determine the lubricant oil condition inrder to decide if the oil change is necessary. As a result, the eco-omic costs and the environmental impact due to unnecessary oilhanges can be reduced.
. Materials
.1. Structure and sensor design
.1.1. Measurement range selectionThe selected measurement range was 400–1100 nm, so it cov-
rs the visible range (400–700 nm) and part of the near infrared700–1100 nm). The visible range was chosen taking into accounthe generation of conjugate chromophore compounds due to the
egradation of oil. Meanwhile, the NIR range was chosen takingnto account the compounds generated during the degradation pro-ess (polymers) and the additives present in the oil (succinimide)13,14]. Table 1 illustrates the main compounds and functional
able 1heoretical near infrared absorption wavelength ranges of the compounds and functiona
Related parameter Compound
AN Phenol
BN Succinimide
Viscosity (40 ◦C) Polymer
Insolubles Polymer
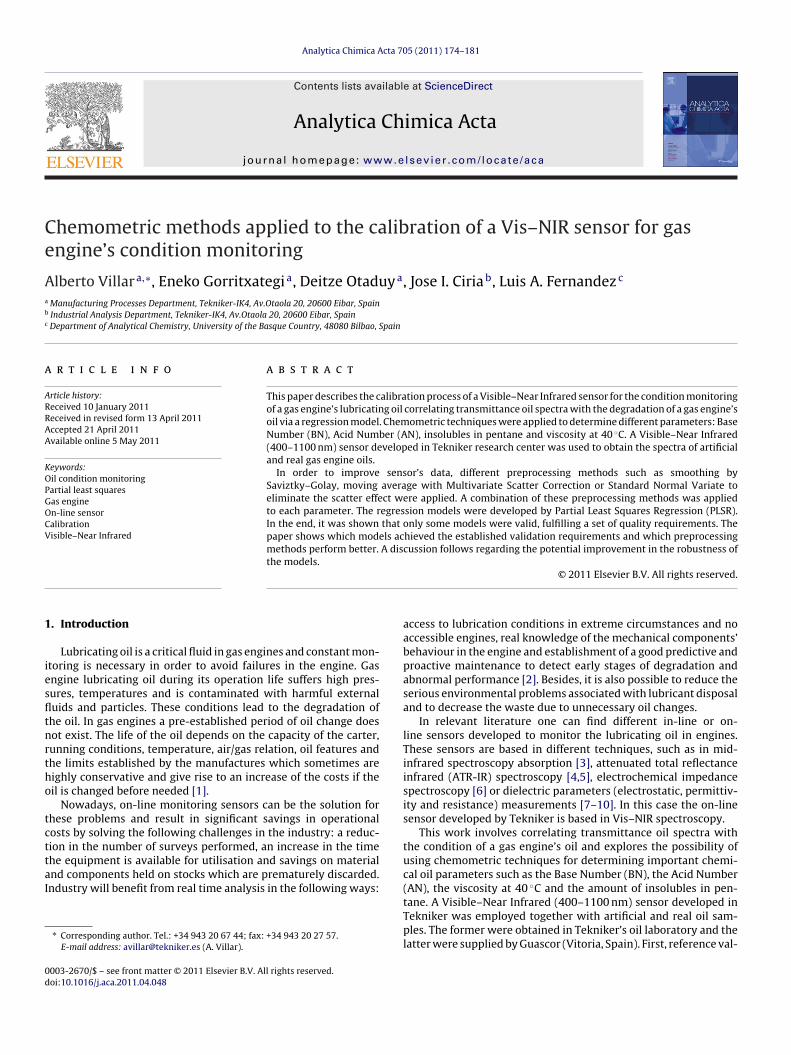
Fig. 1. Mechanical and optical components of the Vis–NIR sensor developed inTekniker research center.
groups responsible for the spectroscopic features sought in the NIRrange investigated.
2.1.2. Optical designThe aim of the optical design was to provide an optical system
to split up the light in different wavelengths after it traverses an oilsample. These different wavelengths are gathered in the detectorwhich transforms the light signal into an electrical signal to obtaintransmittance spectrums. The following are the components usedfor the development of the near infrared sensor: White light, pin-hole, spherical mirror to collimate the light towards the diffractiongrating, a diffraction grating to separate the light source in differentwavelengths and a second spherical mirror which collimates thelight towards the NIR detector which is a 64 pixel array that worksin the range of 400–1100 nm.
2.1.3. Mechanical designOnce the final optical design has been selected, the mechanical
design has to ensure the manufacturing availability. The com-ponents developed and assembled were the optical componentshousing, the fluidic cell, the light source fixing and the detectorfixing. The optical components housing holds all the optical com-ponents in the position established by the optical design. The fluidiccell is the cell where the oil sample resides when the measurementis taken. The oil reaches the cell where the measurement is doneand the separation between the oil and the light system was done
by means of two windows, transparent in the Vis–NIR region of thelight spectra. The optical path of the fluidic cell is just 1 mm and itwas tested up to 10 bars with no leakage observed. Fig. 1 shows theensemble of the optical and mechanical components.l groups selected for the sensor’s development.
Functional group Wavelength range (nm)
–OH 980–990 hydrogen band1035–1045 hydrogen band
–CONH– 1000–1050 free1035–1120 hydrogen band
–CH2–CH2– 1050–1060 combination band–C=CH– 1035–1045 2nd overtone–CH (aromatic) 1070–1085 combination band
–CH2–CH2– 1050–1060 combination band–C=CH– 1035–1045 2nd overtone–CH (aromatic) 1070–1085 combination band
176 A. Villar et al. / Analytica Chimica
2
pws
2
tbec5opa
2
aGoot1
3
3
Taan
3
mwdi
Fig. 2. Vis–NIR sensor installed in gas engine No 11 at GUASCOR facilities.
.2. Oil samples
In the calibration of the sensor artificially degraded oil sam-les and samples degraded in a gas engine were used. The formerere degraded in Tekniker oil laboratory whereas the latter were
upplied by GUASCOR (Vitoria, Spain) from one of its gas engines.
.2.1. Artificially degraded oil samplesCEPSA 3040 Plus oil (2 L) was degraded in Tekniker oil labora-
ory using an IKA®–Werke HBR4 digital heater bath with an LR-2STasic kit (Bracket system LR-2.ST, security disconnection LR-2.SI,urostar power control-visc P7 and ancora’s mixer LR 2000.11). Theonditions of the degradation process are detailed below: 175 ◦C,
L min−1 of air flow and constant shaking. Every two days 150 mLf oil sample was taken out with a view to obtaining twelve sam-les in varying conditions of degradation. Then all samples werenalyzed in Tekniker oil laboratory.
.2.2. Real oil samplesThe engine selected for testing was a SFGLD 560 model operating
t 1500 rpm and generating 945 Kwe, situated at position No 11 atuascor I + D facilities. As Fig. 2 shows, the sensor was placed in anil circuit point with positive pressure and after the oil filter. Theil flows through the sensor and returns to the sump oil. Guascorakes oil samples with different work hours (21 h, 153 h, 1496 h and565 h) in order to be analyzed in Tekniker oil laboratory.
. Experimental methods
.1. Laboratory analysis
All the oil samples were analyzed in Tekniker oil laboratory.he parameters analyzed were AN, BN, viscosity at 40 ◦C and themount of insolubles in pentane. These parameters were analyzedccording to the American Society for Testing and Materials (ASTM)orms D974-04, D2896, D445 and D4055-97, respectively.
.2. Sensor measurements
The sensor calibration was the first step to begin with sample
easurement, for this reason a parameter called integration timeas adjusted. The integration time is the time that the sensor’setector is acquiring information, i.e., the time that the light sources switched on. This time depends on the type of oil.
Acta 705 (2011) 174– 181
The measurements of oil samples began after the calibrationprocess. For this, three measurements per sample were carried outin order to obtain an averaged measurement to minimize error.However, before starting with the measurements, the fluidic cellwas homogenized with the same oil sample to be analyzed. Thenall oil samples were introduced in the sensor through a 5 mL syringeand between every measurement the fluidic cell was cleaned twicewith petroleum ether. After pushing the measurement button, twominutes of standby are elapsed in order to stabilize the oil samplein the fluidic cell. To minimize the effect of temperature variationin the near infrared measurements all oil samples were measuredat a temperature range of 21–22 ◦C.
3.3. Data analysis
The purpose of the sensor’s development is to correlate the spec-tra obtained in the range between 400 and 1100 nm with someoil quality parameters analyzed in the laboratory. For this, chemo-metric methods were applied to obtain the best regression modelfor each parameter. The strategy to obtain a successful regressionmodel consists of the following steps: data collection, data prepro-cessing, and generation of a mathematical model and validation ofthe model. The Unscrambler 9.2 was the tool used for the develop-ment of the regression models.
3.3.1. Data preprocessingIn order to improve sensor’s data for an optimal analysis, dif-
ferent preprocessing steps were applied with the aim of choosingthe optimum preprocessing strategy. In all cases the first step wasto transform all the transmittance spectra in absorbance to reducethe dynamic range of the measurements. Then to reduce the noiseof the data, different smoothing methods were applied such assmoothing by moving average or Savitzky–Golay. The next stepwas the elimination of scatter effects applying Standard NormalVariate (SNV) or Multiplicative Scatter Correction (MSC) methods.Although these two methods are very similar, significant differ-ences were obtained in the results applying one or the other. Finallyall spectra were centered.
3.3.2. Generation of mathematical modelPrincipal Component Regression (PCR) and Partial Least Squares
Regression (PLSR) have been commonly used to obtain regressionmodels from spectroscopic data. In this work, the prediction mod-els were obtained through partial least square regression, PLS1 tobe precise. PLSR is a method for relating the variations in one orseveral response variables (Y-variables) to the variations of severalpredictors (X-variables) with explanatory or predictive purposes[15]. Experience with NIR data shows that PLSR gives better regres-sion models, with a smaller number of principal components thanPCR, which is other modelling method usually applied in infraredspectroscopy. On account of it, the number of components neededfor interpreting the information with PLSR is smaller than withPCR [16]. PLSR regression has been usually used to obtain regres-sion models for the condition monitoring of engine’s lubricatingoil using both Medium Infrared and Near Infrared spectroscopy[17–23].
The main advantage of PLS-based regression methods is thatthey try to optimize two things at same time, spanning the maintypes of Vis–NIR variations and relating the chemical data to theVis–NIR data [17]. In PCR analysis the variables are chosen takinginto account their ability to describe the greatest possible variancein the predictor variables, so PCR does not take into account the
relation between the response and the predictor variables. On theother hand, in PLS regression an extra weight is assigned to the vari-ables which show a high correlation with the response variablesbecause they should be more effective in the prediction. Thus, in
imica Acta 705 (2011) 174– 181 177
PcardbbfP[
3
olostadeat
sRaswhotvts
mittttPwrisam
TR
123
A. Villar et al. / Analytica Ch
LS linear combinations of predictor’s variables which are highlyorrelated with the response variables and also explain the vari-tion in the predictor variables are chosen to obtain an optimumesponse. Regarding its disadvantages, PLSR, has a stronger ten-ency to over-fitting than PCR when there is noise in the Y matrixecause its components are correlated with Y data. However, it haseen observed that if the X data contain a lot of irrelevant variablesor modelling the response variables, PLSR has a better chance thanCR of extracting only the relevant X structures before over-fitting17].
.3.3. Validation of PLSR modelThe full cross validation is the method chosen for the validation
f PLSR models. It is the usual method used when there are not aot of samples to build the model. It is a validation technique basedn the calibration data only. With full cross validation, as manyub-models as objects are made, each time leaving out just one ofhe objects and only this is used for the testing. The availability of
small number of samples was the reason for choosing this vali-ation technique, overall it is extremely difficult to obtain real gasngine oil samples that cover all the working range. The ideal situ-tion could be to have enough samples to do a calibration and theno have a test set for the validation of the model.
Each regression model was chosen taking into account thetatistical values obtained from the model and the variation ofMSECV with the number of PCs. The experience working with
similar sensor, applied in the monitoring of lubricating oil, hashown that the regression models can be considered acceptablehen they achieve the following requirements: correlation valuesave to be higher than or equal to 0.90; the Root Mean Square Errorf Cross Validation (RMSECV) and Standard Error of Cross Valida-ion (SECV) have to be similar being the value of low bias; SECValues have to be lower than the double of lab error; slope mustend to 1 and the number of Principal Components (PCs) less thaneven [24].
The SECV will be used to compare the prediction error of theodel with the error of the laboratory measurements. In this cal-
bration process it is desired that the value of SECV will be lowerhan double of the lab error. The reason for this decision is that inhe development of the models it is necessary to take into accounthe error of laboratory measurements in addition to the error ofhe spectrums obtained with the sensor. Concerning the number ofCs, if the models have a number of PCs higher than 6 the RMSECVill increase as a result of the modelling of the spectral noise and
andom errors coming from the measurements of reference values
n the laboratory. This causes the effect known as over-fitting. Con-equently these models cannot be considered sufficiently robust,s they are sensitive to the spectroscopic noise introduced by theeasurement of new samples.able 2esults of the different preprocessing strategies used for the quantitative determination
Parameter Preprocessing Strategy
AN (mg KOH g−1 oil) 1
2
3
BN (mg KOH g−1 oil) 1
23
Viscosity 40 ◦C (cSt) 1
2
3
– Transmittance–absorbance conversion + smoothing by moving average (segment size – Transmittance–absorbance conversion + smoothing by moving average (segment size – Transmittance–absorbance conversion + smoothing by moving average (segment size
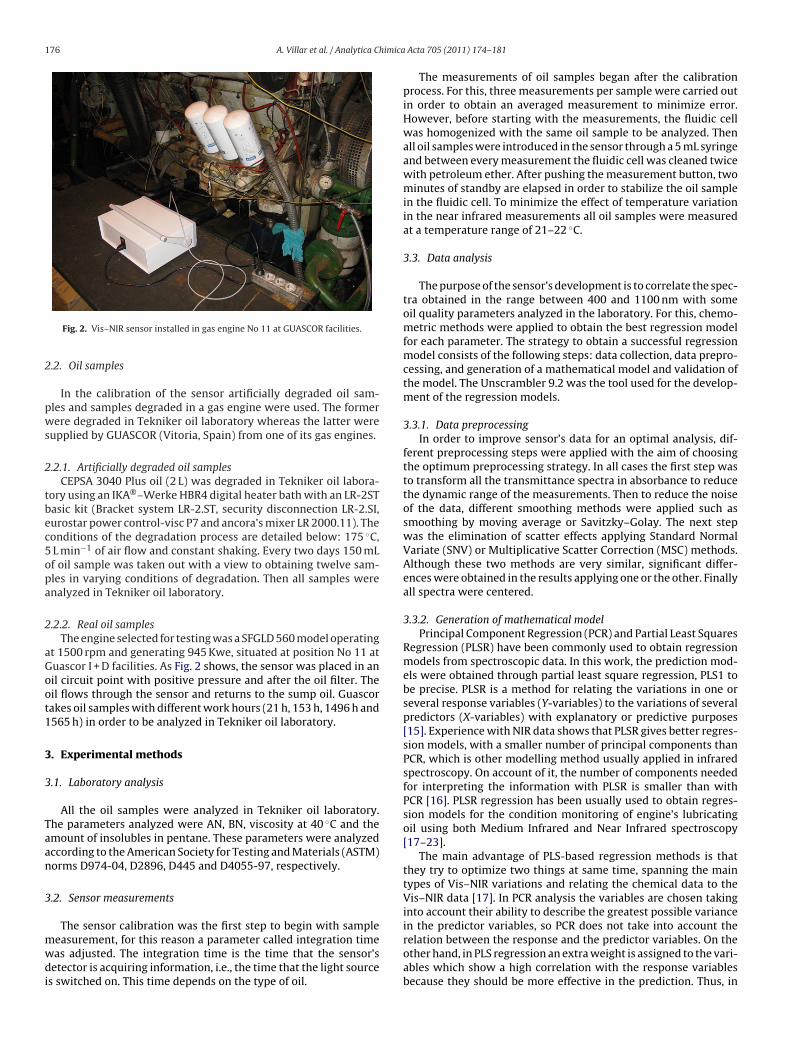
Fig. 3. Transmittance spectra of all samples.
4. Results and discussion
4.1. Preprocessing strategy
In order to improve sensor data, different preprocessing meth-ods were applied taking into account both the oil parameters andsensor data. With the aim of obtaining the best results differentpreprocessing strategies were applied. As a result of this study, theneed to apply different preprocessing steps for AN, BN and viscosity(40 ◦C) and for insoluble quantification was concluded.
4.1.1. AN, BN and viscosity (40 ◦C)The preprocessing strategy chosen for AN, BN and viscosity
(40 ◦C) quantification was the following:
• Transmittance–absorbance conversion,• Smoothing by moving average (segment size = 5),• MSC,• Average of the three measurements per sample.
Table 2 summarizes the results obtained applying different pre-processing strategies. The segment size for smoothing by movingaverage was selected based on the experience gained in prepro-cessing of similar spectra in a several studies
In Figs. 3 and 4 the spectra obtained with Vis–NIR sensor beforeand after the preprocessing process are shown.
4.1.2. Insolubles in pentaneThe preprocessing strategy chosen for the insolubles quantifi-
cation was:
of AN, BN and viscosity at 40 ◦C.
Correlation SECV Number of PCs
0.832 0.287 60.879 0.341 40.936 0.258 5
0.923 0.683 50.925 0.747 40.958 0.597 5
0.931 7.82 50.971 6.41 60.952 6.27 4
= 3) + SNV + average. = 3) + MSC + average. = 5) + MSC + average.
178 A. Villar et al. / Analytica Chimica Acta 705 (2011) 174– 181
••
•
r
eraam
Table 3Results of the different preprocessing strategies for the quantitative determinationof the amount of insolubles in pentane.
Preprocessing strategy Correlation SECV Number of PCs
1 0.855 0.066 52 0.841 0.062 63 0.816 0.071 64 0.926 0.024 65 0.940 0.022 6
1 – Transmittance–absorbance conversion + smoothing by moving average (seg-ment size = 3) + SNV + average.2 – Transmittance–absorbance conversion + smoothing by moving average (seg-ment size = 3) + MSC + average.3 – Transmittance–absorbance conversion + smoothing by moving average (seg-ment size = 5) + MSC + average.4 – Transmittance–absorbance conversion + Savitzky–Golay smoothing (polynomialorder = 2, segment size = 5) + average.5 – Transmittance–absorbance conversion + Savitzky–Golay smoothing (polynomialorder = 2, segment size = 7) + average.
Table 4Comparative table of the error of the model and the laboratory error for eachparameter.
Parameter SECV Laboratory error
AN (mg KOH g−1 oil) ±0.258 ±0.12BN (mg KOH g−1 oil)) ±0.597 ±0.5
Fh
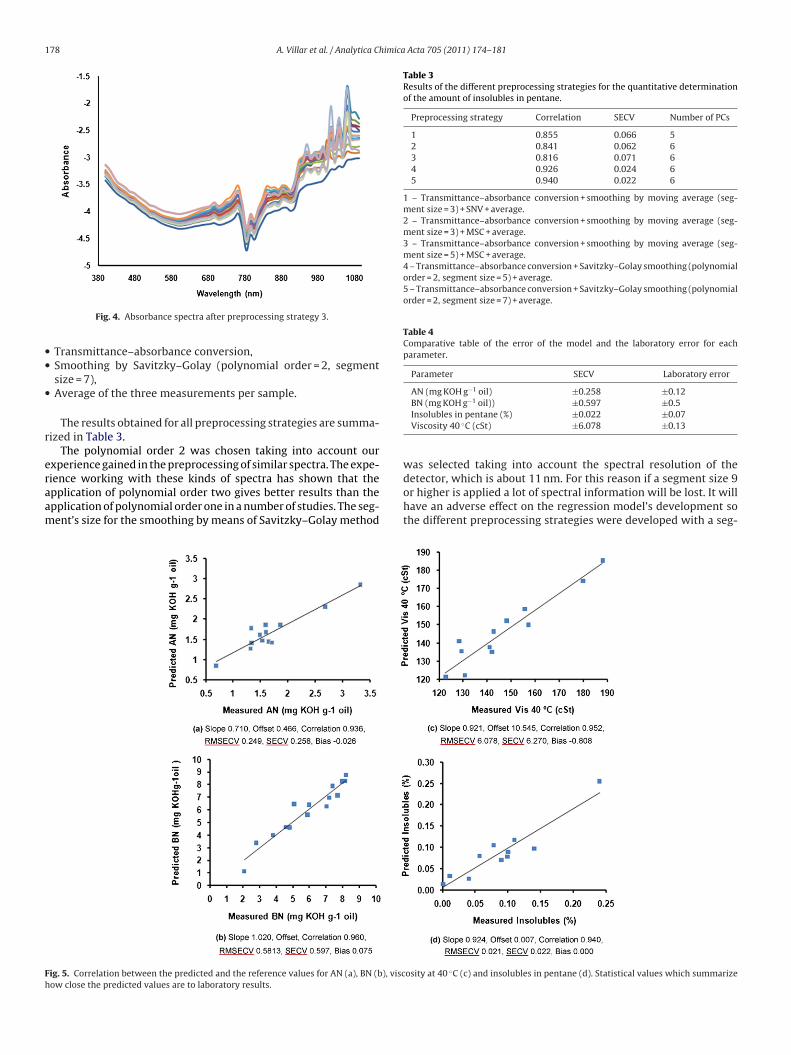
Fig. 4. Absorbance spectra after preprocessing strategy 3.
Transmittance–absorbance conversion,Smoothing by Savitzky–Golay (polynomial order = 2, segmentsize = 7),Average of the three measurements per sample.
The results obtained for all preprocessing strategies are summa-ized in Table 3.
The polynomial order 2 was chosen taking into account ourxperience gained in the preprocessing of similar spectra. The expe-
ience working with these kinds of spectra has shown that thepplication of polynomial order two gives better results than thepplication of polynomial order one in a number of studies. The seg-ent’s size for the smoothing by means of Savitzky–Golay methodig. 5. Correlation between the predicted and the reference values for AN (a), BN (b), viscow close the predicted values are to laboratory results.
Insolubles in pentane (%) ±0.022 ±0.07Viscosity 40 ◦C (cSt) ±6.078 ±0.13
was selected taking into account the spectral resolution of the
detector, which is about 11 nm. For this reason if a segment size 9or higher is applied a lot of spectral information will be lost. It willhave an adverse effect on the regression model’s development sothe different preprocessing strategies were developed with a seg-osity at 40 ◦C (c) and insolubles in pentane (d). Statistical values which summarize
A. Villar et al. / Analytica Chimica Acta 705 (2011) 174– 181 179
Table 5The most significant wavelengths for the quantitative determination of each parameter taking into account the regression coefficients and the loading weights obtained fromeach PLS regression model.
Parameters Wavelength (nm)
AN 466, 477, 488, 499, 510, 521, 532, 543, 554, 565, 576, 587, 598, 609, 620, 631, 752, 818, 829, 840, 1016, 1027, 1071 and 1082.
BN 400, 411, 422, 598, 609, 620, 631, 642, 653, 884, 895, 906, 917, 928, 994 and 1038.
Viscosity 40 ◦C 400, 411, 422, 433, 587, 598, 609, 807, 818, 829, 840, 851, 862, 873, 884, 972, 994, 1005, 1016, 1049, 1060, 1071, 1082 and 1093Insolubles 455, 466, 477, 488, 499, 510, 521, 554, 565, 587, 598, 609, 697. 708 and 719.
Table 6Proposed wavelengths assignment in NIR range for the quantification of AN, BN and viscosity at 40 ◦C.
Wavelength (nm) Parameter Assignment
752 AN 3rd overtone of O–H stretching of H2O807 Viscosity 3rd overtone of N–H stretching of RNH2
818 AN and Viscosity 3rd overtone of N–H stretching of RNHR’829 AN and Viscosity 2 N–H stretching + 2 N–H deformation + 2 C–N stretching for RNHR’840 AN and Viscosity 3rd overtone of C=C of vinyl group851 AN and Viscosity 3rd overtone of C=C of vinyl group862 Viscosity 3rd overtone of C=C873 Viscosity 3rd overtone of C=C884 BN and Viscosity 3rd overtone of C–H asymmetric stretching of –CH3
895 BN 3rd overtone of C–H anti-symmetric stretching of –CH2
906 BN 3rd overtone of C–H symmetric stretching of –CH917 BN 3rd overtone of C–H asymmetric stretching of –CH2
972 Viscosity 2nd overtone of H2o994 BN and Viscosity 2nd overtone of –OH intermolecular hydrogen bond
1005 Viscosity 2nd overtone of NH2 symmetric stretching of –CONH2
1016 AN and Viscosity 2nd overtone of NH2 symmetric stretching of –CONH2
1027 AN 2nd overtone of N–H symmetric stretching of NH2
1038 BN 2nd overtone of –C=CH1049 Viscosity 2 C–H stretching + 2 C–H deformation + (CH2)n
1060 Viscosity 2 C–H stretching + C–H bending of –CH2
mochs
gg
4
fmtsa
tbBdtadc
boa
m
1071 AN
1082 AN
1093 AN and viscosity
ent size lower than 9. On the other hand, in the literature, a lotf studies where a segment size higher than 9 have been appliedan be found. This is due to that in most of the cases the spectraave been obtained from a commercial spectrophotometer whosepectral resolution is about 2 nm.
As Table 3 shows, the previous preprocessing strategy 3 did notive good results. On the other hand, the preprocessing strategy 5ave very good results, so this one was chosen.
.2. Final regression models
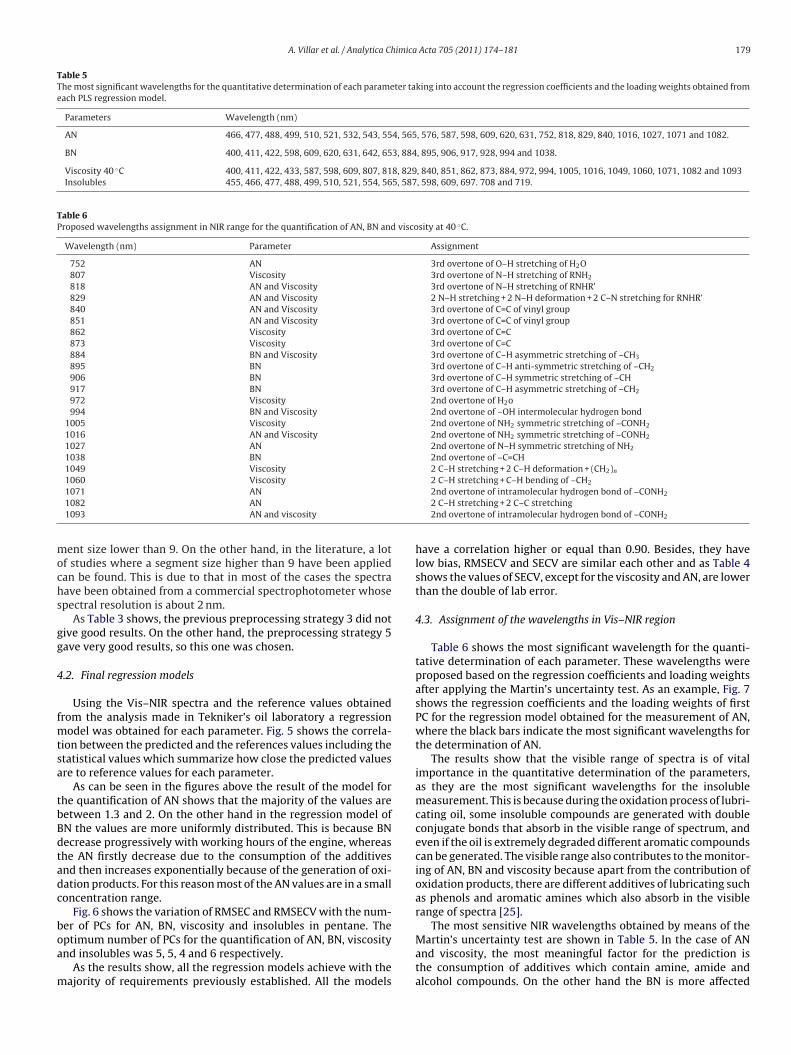
Using the Vis–NIR spectra and the reference values obtainedrom the analysis made in Tekniker’s oil laboratory a regression
odel was obtained for each parameter. Fig. 5 shows the correla-ion between the predicted and the references values including thetatistical values which summarize how close the predicted valuesre to reference values for each parameter.
As can be seen in the figures above the result of the model forhe quantification of AN shows that the majority of the values areetween 1.3 and 2. On the other hand in the regression model ofN the values are more uniformly distributed. This is because BNecrease progressively with working hours of the engine, whereashe AN firstly decrease due to the consumption of the additivesnd then increases exponentially because of the generation of oxi-ation products. For this reason most of the AN values are in a smalloncentration range.
Fig. 6 shows the variation of RMSEC and RMSECV with the num-er of PCs for AN, BN, viscosity and insolubles in pentane. The
ptimum number of PCs for the quantification of AN, BN, viscositynd insolubles was 5, 5, 4 and 6 respectively.As the results show, all the regression models achieve with theajority of requirements previously established. All the models
2nd overtone of intramolecular hydrogen bond of –CONH2
2 C–H stretching + 2 C–C stretching2nd overtone of intramolecular hydrogen bond of –CONH2
have a correlation higher or equal than 0.90. Besides, they havelow bias, RMSECV and SECV are similar each other and as Table 4shows the values of SECV, except for the viscosity and AN, are lowerthan the double of lab error.
4.3. Assignment of the wavelengths in Vis–NIR region
Table 6 shows the most significant wavelength for the quanti-tative determination of each parameter. These wavelengths wereproposed based on the regression coefficients and loading weightsafter applying the Martin’s uncertainty test. As an example, Fig. 7shows the regression coefficients and the loading weights of firstPC for the regression model obtained for the measurement of AN,where the black bars indicate the most significant wavelengths forthe determination of AN.
The results show that the visible range of spectra is of vitalimportance in the quantitative determination of the parameters,as they are the most significant wavelengths for the insolublemeasurement. This is because during the oxidation process of lubri-cating oil, some insoluble compounds are generated with doubleconjugate bonds that absorb in the visible range of spectrum, andeven if the oil is extremely degraded different aromatic compoundscan be generated. The visible range also contributes to the monitor-ing of AN, BN and viscosity because apart from the contribution ofoxidation products, there are different additives of lubricating suchas phenols and aromatic amines which also absorb in the visiblerange of spectra [25].
The most sensitive NIR wavelengths obtained by means of the
Martin’s uncertainty test are shown in Table 5. In the case of ANand viscosity, the most meaningful factor for the prediction isthe consumption of additives which contain amine, amide andalcohol compounds. On the other hand the BN is more affected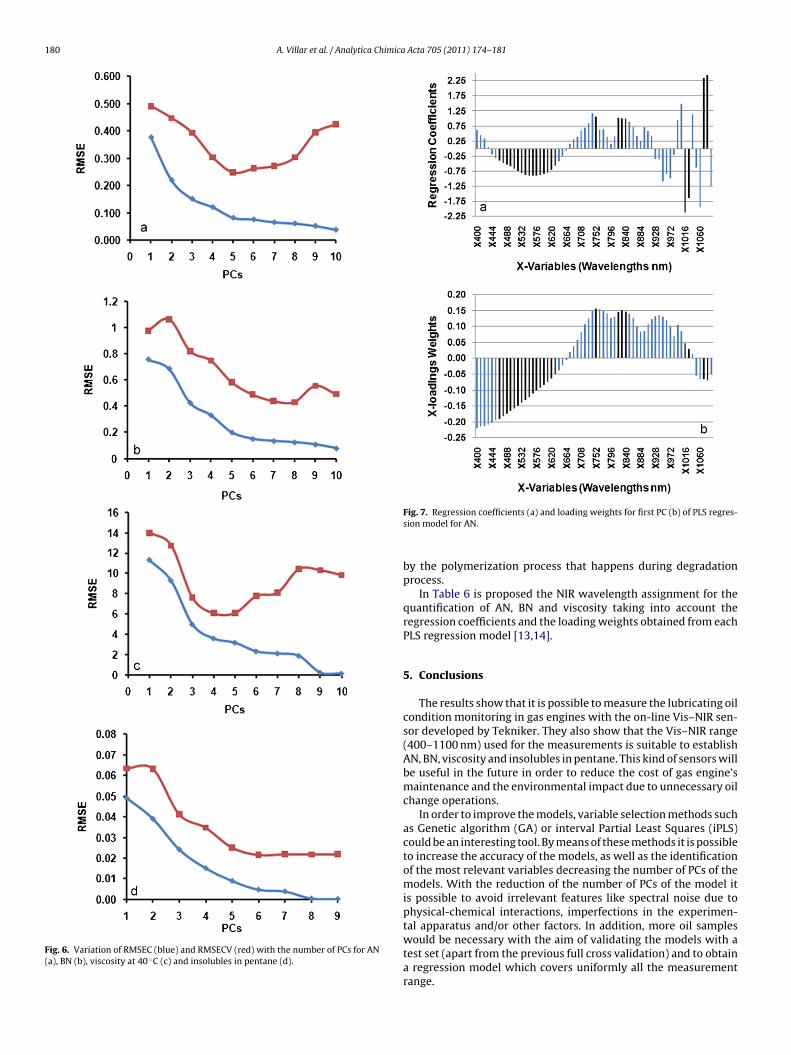
180 A. Villar et al. / Analytica Chimica Acta 705 (2011) 174– 181
Fig. 6. Variation of RMSEC (blue) and RMSECV (red) with the number of PCs for AN(a), BN (b), viscosity at 40 ◦C (c) and insolubles in pentane (d).
Fig. 7. Regression coefficients (a) and loading weights for first PC (b) of PLS regres-sion model for AN.
by the polymerization process that happens during degradationprocess.
In Table 6 is proposed the NIR wavelength assignment for thequantification of AN, BN and viscosity taking into account theregression coefficients and the loading weights obtained from eachPLS regression model [13,14].
5. Conclusions
The results show that it is possible to measure the lubricating oilcondition monitoring in gas engines with the on-line Vis–NIR sen-sor developed by Tekniker. They also show that the Vis–NIR range(400–1100 nm) used for the measurements is suitable to establishAN, BN, viscosity and insolubles in pentane. This kind of sensors willbe useful in the future in order to reduce the cost of gas engine’smaintenance and the environmental impact due to unnecessary oilchange operations.
In order to improve the models, variable selection methods suchas Genetic algorithm (GA) or interval Partial Least Squares (iPLS)could be an interesting tool. By means of these methods it is possibleto increase the accuracy of the models, as well as the identificationof the most relevant variables decreasing the number of PCs of themodels. With the reduction of the number of PCs of the model itis possible to avoid irrelevant features like spectral noise due tophysical-chemical interactions, imperfections in the experimen-tal apparatus and/or other factors. In addition, more oil sampleswould be necessary with the aim of validating the models with a
test set (apart from the previous full cross validation) and to obtaina regression model which covers uniformly all the measurementrange.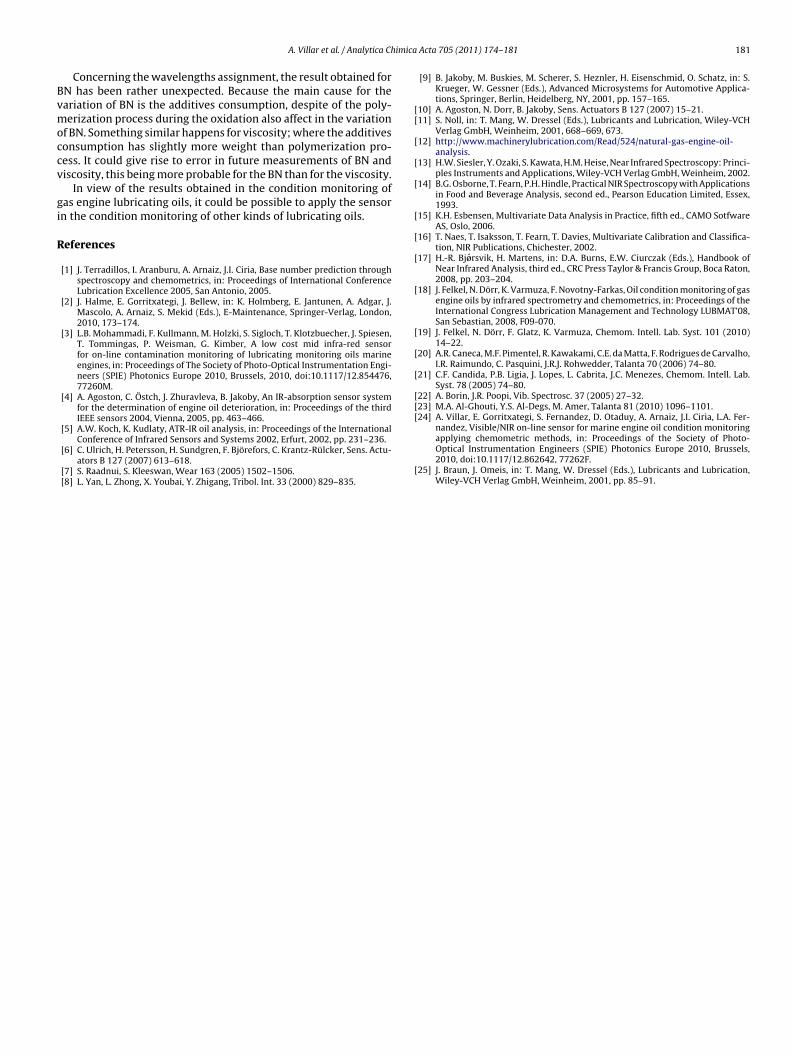
imica
Bvmoccv
gi
R
[[
[
[
[
[
[
[
[
[
[
[
[[[
A. Villar et al. / Analytica Ch
Concerning the wavelengths assignment, the result obtained forN has been rather unexpected. Because the main cause for theariation of BN is the additives consumption, despite of the poly-erization process during the oxidation also affect in the variation
f BN. Something similar happens for viscosity; where the additivesonsumption has slightly more weight than polymerization pro-ess. It could give rise to error in future measurements of BN andiscosity, this being more probable for the BN than for the viscosity.
In view of the results obtained in the condition monitoring ofas engine lubricating oils, it could be possible to apply the sensorn the condition monitoring of other kinds of lubricating oils.
eferences
[1] J. Terradillos, I. Aranburu, A. Arnaiz, J.I. Ciria, Base number prediction throughspectroscopy and chemometrics, in: Proceedings of International ConferenceLubrication Excellence 2005, San Antonio, 2005.
[2] J. Halme, E. Gorritxategi, J. Bellew, in: K. Holmberg, E. Jantunen, A. Adgar, J.Mascolo, A. Arnaiz, S. Mekid (Eds.), E-Maintenance, Springer-Verlag, London,2010, 173–174.
[3] L.B. Mohammadi, F. Kullmann, M. Holzki, S. Sigloch, T. Klotzbuecher, J. Spiesen,T. Tommingas, P. Weisman, G. Kimber, A low cost mid infra-red sensorfor on-line contamination monitoring of lubricating monitoring oils marineengines, in: Proceedings of The Society of Photo-Optical Instrumentation Engi-neers (SPIE) Photonics Europe 2010, Brussels, 2010, doi:10.1117/12.854476,77260M.
[4] A. Agoston, C. Östch, J. Zhuravleva, B. Jakoby, An IR-absorption sensor systemfor the determination of engine oil deterioration, in: Proceedings of the thirdIEEE sensors 2004, Vienna, 2005, pp. 463–466.
[5] A.W. Koch, K. Kudlaty, ATR-IR oil analysis, in: Proceedings of the International
Conference of Infrared Sensors and Systems 2002, Erfurt, 2002, pp. 231–236.[6] C. Ulrich, H. Petersson, H. Sundgren, F. Björefors, C. Krantz-Rülcker, Sens. Actu-ators B 127 (2007) 613–618.
[7] S. Raadnui, S. Kleeswan, Wear 163 (2005) 1502–1506.[8] L. Yan, L. Zhong, X. Youbai, Y. Zhigang, Tribol. Int. 33 (2000) 829–835.
[
Acta 705 (2011) 174– 181 181
[9] B. Jakoby, M. Buskies, M. Scherer, S. Heznler, H. Eisenschmid, O. Schatz, in: S.Krueger, W. Gessner (Eds.), Advanced Microsystems for Automotive Applica-tions, Springer, Berlin, Heidelberg, NY, 2001, pp. 157–165.
10] A. Agoston, N. Dorr, B. Jakoby, Sens. Actuators B 127 (2007) 15–21.11] S. Noll, in: T. Mang, W. Dressel (Eds.), Lubricants and Lubrication, Wiley-VCH
Verlag GmbH, Weinheim, 2001, 668–669, 673.12] http://www.machinerylubrication.com/Read/524/natural-gas-engine-oil-
analysis.13] H.W. Siesler, Y. Ozaki, S. Kawata, H.M. Heise, Near Infrared Spectroscopy: Princi-
ples Instruments and Applications, Wiley-VCH Verlag GmbH, Weinheim, 2002.14] B.G. Osborne, T. Fearn, P.H. Hindle, Practical NIR Spectroscopy with Applications
in Food and Beverage Analysis, second ed., Pearson Education Limited, Essex,1993.
15] K.H. Esbensen, Multivariate Data Analysis in Practice, fifth ed., CAMO SotfwareAS, Oslo, 2006.
16] T. Naes, T. Isaksson, T. Fearn, T. Davies, Multivariate Calibration and Classifica-tion, NIR Publications, Chichester, 2002.
17] H.-R. Bjørsvik, H. Martens, in: D.A. Burns, E.W. Ciurczak (Eds.), Handbook ofNear Infrared Analysis, third ed., CRC Press Taylor & Francis Group, Boca Raton,2008, pp. 203–204.
18] J. Felkel, N. Dörr, K. Varmuza, F. Novotny-Farkas, Oil condition monitoring of gasengine oils by infrared spectrometry and chemometrics, in: Proceedings of theInternational Congress Lubrication Management and Technology LUBMAT’08,San Sebastian, 2008, F09-070.
19] J. Felkel, N. Dörr, F. Glatz, K. Varmuza, Chemom. Intell. Lab. Syst. 101 (2010)14–22.
20] A.R. Caneca, M.F. Pimentel, R. Kawakami, C.E. da Matta, F. Rodrigues de Carvalho,I.R. Raimundo, C. Pasquini, J.R.J. Rohwedder, Talanta 70 (2006) 74–80.
21] C.F. Candida, P.B. Ligia, J. Lopes, L. Cabrita, J.C. Menezes, Chemom. Intell. Lab.Syst. 78 (2005) 74–80.
22] A. Borin, J.R. Poopi, Vib. Spectrosc. 37 (2005) 27–32.23] M.A. Al-Ghouti, Y.S. Al-Degs, M. Amer, Talanta 81 (2010) 1096–1101.24] A. Villar, E. Gorritxategi, S. Fernandez, D. Otaduy, A. Arnaiz, J.I. Ciria, L.A. Fer-
nandez, Visible/NIR on-line sensor for marine engine oil condition monitoring
applying chemometric methods, in: Proceedings of the Society of Photo-Optical Instrumentation Engineers (SPIE) Photonics Europe 2010, Brussels,2010, doi:10.1117/12.862642, 77262F.25] J. Braun, J. Omeis, in: T. Mang, W. Dressel (Eds.), Lubricants and Lubrication,Wiley-VCH Verlag GmbH, Weinheim, 2001, pp. 85–91.
Related Documents