ORIGINAL PAPER Chemometric evaluation of nine alcohol biomarkers in a large population of clinically-classified subjects: pre-eminence of ethyl glucuronide concentration in hair for confirmatory classification Valentina Pirro & ValeriaValente & Paolo Oliveri & Angela De Bernardis & Alberto Salomone & Marco Vincenti Received: 29 April 2011 /Revised: 3 August 2011 /Accepted: 3 August 2011 /Published online: 4 September 2011 # Springer-Verlag 2011 Abstract An important goal of forensic and clinical toxicology is to identify biological markers of ethanol consumption that allow an objective diagnosis of chronic alcohol misuse. Blood and head hair samples were collected from 175 subjects—objectively classified as non-drinkers (N =65), social drinkers (N =51) and active heavy drinkers (N =59)—and analyzed to determine eight traditional indirect biomarkers of ethanol consumption [aspartate aminotransferase (AST), alanine aminotransfer- ase (ALT), gamma-glutamyltransferase (γ-GT), alkaline phosphatase (ALP), mean corpuscular volume (MCV), carbohydrate-deficient transferrin (CDT), and cholesterol and triglycerides in blood] and one direct biomarker [ethyl glucuronide (EtG) in head hair]. The experimental values obtained from these determinations were submitted to statistical evaluations. In particular, Kruskal –Wallis, Mann–Whitney and ROC curve analyses, together with principal component analysis (PCA), allowed the diagnos- tic performances of the various biomarkers to be evaluated and compared consistently. From these evaluations, it was possible to deduce that EtG measured in head hair is the only biomarker that can conclusively discriminate active heavy drinkers from social and non-drinkers, using a cut-off value of 30 pg/mg. In contrast, a few indirect biomarkers such as ALP, cholesterol, and triglycerides showed extremely low diagnostic abilities and may convey misleading information. AST and ALT proved to be highly correlated and exhibited quite low sensitivity and specificity. Consequently, either of these parameters can be discarded without compromising the classification efficiency. Among the indirect biomarkers, γ-GT provided the highest diagnostic accuracy, while CDT and MCV yielded high specificity but low sensitivity. It was therefore concluded that EtG in head hair is the only biomarker capable of supporting a confirmatory diagnosis of chronic alcohol abuse in both forensic and clinical practice, while it was found that γ-GT, CDT, MCV , and AST—whether used alone or in combination—do not allow the conclusive classification of subjects according to ethanol consumption. However, a diagnostic strategy com- bining these four parameters could be formulated in order to create a multivariate model capable of screening suspected active heavy drinkers. Electronic supplementary material The online version of this article (doi:10.1007/s00216-011-5314-7) contains supplementary material, which is available to authorized users. V . Pirro : V . Valente : M. Vincenti (*) Dipartimento di Chimica Analitica, Università degli Studi di Torino, Via Pietro Giuria 5, 10125 Turin, Italy e-mail: [email protected] V . Pirro : A. Salomone : M. Vincenti Centro Regionale Antidoping e di Tossicologia “A. Bertinaria”, Regione Gonzole 10/1, 10043 Orbassano, Turin, Italy P. Oliveri Dipartimento di Chimica e Tecnologie Farmaceutiche ed Alimentari, Università degli Studi di Genova, Via Brigata Salerno 13, 16147 Genoa, Italy A. De Bernardis Dipartimento di Patologie delle Dipendenze, ASO-TO4, Via Mazzini 13, 10073 Ciriè, Turin, Italy Anal Bioanal Chem (2011) 401:2153–2164 DOI 10.1007/s00216-011-5314-7

Welcome message from author
This document is posted to help you gain knowledge. Please leave a comment to let me know what you think about it! Share it to your friends and learn new things together.
Transcript

ORIGINAL PAPER
Chemometric evaluation of nine alcohol biomarkersin a large population of clinically-classified subjects:pre-eminence of ethyl glucuronide concentrationin hair for confirmatory classification
Valentina Pirro & Valeria Valente & Paolo Oliveri &Angela De Bernardis & Alberto Salomone &
Marco Vincenti
Received: 29 April 2011 /Revised: 3 August 2011 /Accepted: 3 August 2011 /Published online: 4 September 2011# Springer-Verlag 2011
Abstract An important goal of forensic and clinicaltoxicology is to identify biological markers of ethanolconsumption that allow an objective diagnosis of chronicalcohol misuse. Blood and head hair samples werecollected from 175 subjects—objectively classified asnon-drinkers (N=65), social drinkers (N=51) and activeheavy drinkers (N=59)—and analyzed to determine eighttraditional indirect biomarkers of ethanol consumption[aspartate aminotransferase (AST), alanine aminotransfer-ase (ALT), gamma-glutamyltransferase (γ-GT), alkaline
phosphatase (ALP), mean corpuscular volume (MCV),carbohydrate-deficient transferrin (CDT), and cholesteroland triglycerides in blood] and one direct biomarker [ethylglucuronide (EtG) in head hair]. The experimental valuesobtained from these determinations were submitted tostatistical evaluations. In particular, Kruskal–Wallis,Mann–Whitney and ROC curve analyses, together withprincipal component analysis (PCA), allowed the diagnos-tic performances of the various biomarkers to be evaluatedand compared consistently. From these evaluations, it waspossible to deduce that EtG measured in head hair is theonly biomarker that can conclusively discriminate activeheavy drinkers from social and non-drinkers, using a cut-offvalue of 30 pg/mg. In contrast, a few indirectbiomarkers such as ALP, cholesterol, and triglyceridesshowed extremely low diagnostic abilities and mayconvey misleading information. AST and ALT provedto be highly correlated and exhibited quite lowsensitivity and specificity. Consequently, either of theseparameters can be discarded without compromising theclassification efficiency. Among the indirect biomarkers,γ-GT provided the highest diagnostic accuracy, while CDTand MCV yielded high specificity but low sensitivity. Itwas therefore concluded that EtG in head hair is theonly biomarker capable of supporting a confirmatorydiagnosis of chronic alcohol abuse in both forensic andclinical practice, while it was found that γ-GT, CDT, MCV,and AST—whether used alone or in combination—do notallow the conclusive classification of subjects according toethanol consumption. However, a diagnostic strategy com-bining these four parameters could be formulated in order tocreate a multivariate model capable of screening suspectedactive heavy drinkers.
Electronic supplementary material The online version of this article(doi:10.1007/s00216-011-5314-7) contains supplementary material,which is available to authorized users.
V. Pirro :V. Valente :M. Vincenti (*)Dipartimento di Chimica Analitica,Università degli Studi di Torino,Via Pietro Giuria 5,10125 Turin, Italye-mail: [email protected]
V. Pirro :A. Salomone :M. VincentiCentro Regionale Antidoping e di Tossicologia “A. Bertinaria”,Regione Gonzole 10/1,10043 Orbassano, Turin, Italy
P. OliveriDipartimento di Chimica e Tecnologie Farmaceuticheed Alimentari, Università degli Studi di Genova,Via Brigata Salerno 13,16147 Genoa, Italy
A. De BernardisDipartimento di Patologie delle Dipendenze, ASO-TO4,Via Mazzini 13,10073 Ciriè, Turin, Italy
Anal Bioanal Chem (2011) 401:2153–2164DOI 10.1007/s00216-011-5314-7
Keywords Ethyl glucuronide . Hair. Alcohol biomarker.
Chemometric . PCA . ROC curve
Introduction
Alcoholism is the most frequent addiction encountered inmany Western countries. Therefore, an important goal offorensic and clinical toxicology is to identify biologicalmarkers of ethanol consumption that are capable ofobjectively supporting the diagnosis of chronic excessivealcohol consumption [1, 2].
A wide variety of biochemical and hematologicalparameters are affected by alcohol consumption and usedas potential biomarkers in order to determine (i) bingedrinking, (ii) hazardous or harmful alcohol consumption,(iii) alcohol dependence, or (iv) abstinence [3]. Theseparameters are usually classified as direct biomarkers iftheir levels directly reflect the alcohol intake, or indirectbiomarkers if their values are related to organ (most oftenthe liver) damage resulting from repeated heavy ethanolexposure [4].
In Europe, several indirect biomarkers are collectivelyused to monitor excessive alcohol consumption—forexample, when deciding whether to relicense a driver andduring workplace impairment testing—although a uniquerecognized standard protocol for selecting the most appro-priate biomarkers does not exist, and no cut-off level hasbeen defined for them. On the other hand, indirectparameters do not appear to be applied systematically inNorth America [4].
Among indirect biomarkers, the ones most commonly usedare aspartate aminotransferase (AST) and alanine aminotrans-ferase (ALT), gamma-glutamyltransferase (γ-GT), alkalinephosphatase (ALP), mean corpuscular volume (MCV),cholesterol (in particular high-density lipoprotein cholesterol,HDL-C), triglycerides, and carbohydrate-deficient transferrin(CDT) [3]. In particular, the latter was considered the mostclinically significant marker of alcohol misuse until a fewyears ago [5].
All the markers mentioned so far are determined in eitherblood plasma or serum, and provide informative resultsover a relatively short retrospective period [6]. Also, manybiological factors such as age, gender, body mass index,and ethnicity have been shown to cause wide inter- andintra-individual variability in their normal values [3]. Theseindirect biomarkers also present low specificity andsensitivity because they can be affected by several factorsthat are not correlated with ethanol consumption, such asthe presence of metabolic disorders, nonalcoholic hepatitis,and biliary diseases. A main consequence of this lack ofspecificity and sensitivity is that these biomarkers do nothave sufficient diagnostic accuracy to identify alcohol
misuse. To improve their diagnostic potential, severalstudies have proposed that mathematical combinations ofindirect biomarkers should be considered. For example,some authors have suggested various mathematicalequations that combine γ-GT and CDT values in orderto increase sensitivity without compromising specificity[7–12]. More complex statistical methods have also beenproposed to improve both sensitivity and specificity usingan Early Detection of Alcohol Consumption (EDAC) test,based on a combination of various routine laboratory tests[13, 14].
The determination of direct ethanol metabolites invarious biological matrices is currently the most accreditedstrategy for proving chronic alcohol abuse. Unlike indirectbiomarkers, ethyl glucuronide (EtG), ethyl sulfate (EtS),and fatty acid ethyl esters (FAEEs) appear to be specific andsensitive direct biomarkers. Their concentrations in allbiological matrices are likely to show a direct correlationwith alcohol intake, with a minor chance of positiveinterference from spurious factors [15]. Furthermore, EtGand FAEEs can be easily detected in the keratin matrix too.Determining EtG and FAEEs in hair samples providesinformation on previous alcohol intake over a longretrospective period [16], a feature which has proved tobe very useful in forensic practice [17–19]. Hair samplesare easily collected by a noninvasive procedure and storedat room temperature.
Lately, EtG determination in hair has become thecriterion most widely used to diagnose alcohol addiction.The mechanism of the incorporation of EtG into hair is notcompletely understood yet, but uptake from sweat appearsto be involved [20], without any influence of the melanincontent [15, 22]—in other words, natural hair color anddegree of pigmentation do not induce any bias; nor doesethnicity [21]. In contrast, exposure to stressful environ-mental conditions, washing habits, and the use of specialcosmetic products do appear to represent possible sourcesof bias [15, 23, 24].
Recently, an international consensus conference fixed theEtG cut-off level for identifying chronic alcohol abusers at30 pg/mg [25], although some toxicologists have raisedwarnings about the general applicability of this cut-off level[2, 26]. For instance, it is suggested that pubic and axillaryhair samples should not be employed as matrices instead ofhead hair [27, 28]. A relatively large inter-individualvariability in EtG synthesis and metabolism is alsoexpected, which possibly affects the conversion of ethanolinto EtG, and consequently the concentration of it in allbiological matrices [2]. Although high biological variabilityis described in the literature, this has not prevented wideacceptance of hair EtG data in a forensic context [17, 18].In general, it has been demonstrated that since EtG is abiomarker that originates directly from ethanol, it is an
2154 V. Pirro et al.
excellent indicator of alcohol intake, but careful interpreta-tion of the data is advised, and it is suggested thatadditional evidence, possibly including traditional alcoholbiomarkers, should be considered too [17].
In the present study, head hair and blood sampleswere collected from 175 subjects that were clinicallyclassified as non-drinkers (N=65), social drinkers(N=51), and active heavy drinkers (N=59). AST, ALT,γ-GT, CDT, MCV, cholesterol, triglycerides, and ALPwere determined in blood samples, while EtG wasmeasured in head hair samples. The experimental valuesobtained were mathematically transformed and normal-ized in order to perform statistical evaluations. Kruskal–Wallis, Mann–Whitney, and ROC curve analyses, togetherwith principal component analysis (PCA), were utilizedto evaluate the diagnostic power of each biomarker toidentify chronic alcohol abuse, as well as to comparethe biomarkers.
Our objective was to determine whether head hairEtG can be used as a unique biomarker to support theconfirmatory diagnosis of chronic alcohol abuse inforensic and clinical practice. Our second goal was todetermine which of the indirect biomarkers can beutilized to screen for alcohol misuse. Although thecombined determination of both EtG and FAEEs isexpected to produce the most accurate diagnosis ofalcohol abuse [19], the high number of samples passed toour laboratory (over 7000 hair samples per year), togetherwith the availability of an ISO/IEC 17025:2005accredited procedure for hair EtG, and the slightly higherreliability of EtG than FAEEs (i.e., fewer false-positiveresults) [18, 29], led us to consider EtG alone as aconfirmation biomarker.
Experimental
Chemicals, reagents, and standard solutions
Ethyl glucuronide and ethyl glucuronide-d5 (EtG-d5), usedas the internal standard (IS), were acquired fromMedichem® (Steinenbronn, Germany). Standard solutionsof EtG and EtG-d5 were prepared in methanol at aconcentration of 10 μg/mL and stored at −20 °C. Workingsolutions were prepared by progressive dilution. Calibrationsamples were obtained by spiking the blank head hairsamples with the working solutions. Blank head hairsamples were obtained from laboratory personnel who werenon-drinkers (two subjects); these samples were stored atroom temperature and used as surrogate matrix. Acetonitrile(CHROMASOLV®), dichloromethane (CHROMASOLV®),methanol (CHROMASOLV®), and formic acid wereobtained from Sigma–Aldrich (St. Louis, MO, USA). Water
was produced by a Milli-Q System (Millipore, Billerica,MA, USA). All of the chemicals and reagents used were ofanalytical purity grade.
The determinations of AST, ALT, γ-GT, MCV, cholesterol,triglycerides, and ALP were performed using appropriate kitsin accordance with the International Federation of ClinicalChemistry (IFCC) recommendations.
Determination of AST, ALT, γ-GT, MCV, cholesterol,triglycerides, and ALP in blood samples
Serum activities of AST, ALT, γ-GT, cholesterol,triglycerides, and ALP were measured using a RocheCobas Integra 800® autoanalyzer (Roche Diagnostics,Basel, Switzerland). MCV was measured by an Advia®2120 hematology autoanalyzer (Siemens HealthcareDiagnostics, Milan, Italy). The upper reference limitsused as cut-off values were 40, 50, 64, and 150 IU/L,respectively for AST, ALT, γ-GT, and ALP; 100 fL forMCV, and 200 mg/dL for cholesterol and triglycerides.
Determination of CDT in serum samples
%CDT was determined using the HPLC reagent kit fromBioRad (Munich, Germany). Blood samples were preparedfollowing the manufacturer’s instructions. Briefly, thesample was centrifuged at 3500 rpm for 10 min. Next,150 μL of serum were added to 450 μL of the solventmixture; this was then agitated for few seconds andincubated at room temperature for 30 min. The resultingsolution was centrifuged at 11,300 rpm for 10 min andthe supernatant (500 μL) was transferred to a vial forHPLC–DAD analysis. The chromatographic separationwas performed using an Agilent Technologies (Milan,Italy) series 1100 instrument interfaced to a G1315Bdiode-array detector (DAD). A wavelength of 460 nmwas utilized for CDT detection. LC separation wasachieved by an anion-exchange cartridge maintained at+40 °C and eluted with a ternary buffer gradientdelivered at a flow rate of 1.4 mL/min. For eachsample, 100 μL of supernatant were injected. The totalruntime was 10 min. After integrating transferrin glyco-form peaks using the ChemStation software (Agilent®),the relative percentage of low-carbohydrate transferrin(%CDT; consisting of asialo-, monosialo-, and disialo-transferrin isoforms) was calculated in accordance withthe Working Group on Standardization of CDT Mea-surement guidelines [30]. An upper reference limit of2.0% was used as the cut-off value [31]. The presentmethod was fully validated and accredited in accordancewith ISO/IEC 17025:2005 rules. Linearity range, preci-sion, carry over effect, and detection and quantificationlimits (LOD and LOQ) were evaluated.
Chemometric evaluation of nine alcohol biomarkers, including ethyl glucuronide in hair 2155
Determination of EtG in head hair samples
Determinations of EtG in head hair samples were executedusing a procedure described in the literature [32] underpreviously published analytical conditions [28].
Briefly, all hair samples were washed twice usingmethylene chloride and methanol (3 ml, 3 min) insequence and then dried. Each sample was cut intosmall pieces (1–2 mm length) and weighed. About50 mg of hair were added to 25 ng of EtG-d5 as wellas 720 μl of a 35:1 v:v water and methanol mixture.Next, the samples were centrifugated (4000 rpm, 5 min)and incubated overnight at room temperature. Fifteenhours later, the samples were ultrasonicated with theUCI-150 ultrasonic cleaning bath (Raypa©, Ankara,Turkey) for 90 min, and then 100 μl of the liquid phasewere transferred to a vial for LC-MS/MS analysis.
Analyses were performed using an Agilent HPLC 1100liquid chromatograph interfaced to an Applied BiosystemsAPI 4000 triple-quadrupole mass spectrometer operating inESI–negative ion mode. LC separation was performedusing a LiChroCART Purospher STAR RP-18E column(150 mm × 4.6 mm i.d.) with a particle size of 5 μm. TwoMS/MS transitions were utilized to identify and determineEtG and its internal standard. The EtG transition 221→75was used for quantification.
The method was validated and accredited in accordancewith ISO/IEC 17025:2005 rules. Linearity range, precision,accuracy, trueness, detection and quantification limits(LOD and LOQ), recovery, selectivity, specificity, andcarryover effects were evaluated. Identification criteria forthe analyte were established based on international [33,34] and national [35] guidelines.
Laboratory performance in hair EtG analysis was alsomonitored through its regular participation in interlaboratoryproficiency tests organized by the Centre UniversitaireRomand deMédecine Légale (University Hospital of Geneva,Switzerland) for the Society of Hair Testing.
Linearity was observed in the range from 10 to500 pg/mg with a correlation coefficient (R2) of 0.995.Intra-assay precision was satisfied, as the coefficient ofvariation (CV%) was below 10.0% at an EtG concentra-tion of 10 pg/mg, and below 5.0% at 30 and 50 pg/mg.Both accuracy and trueness, expressed as the percentbias, were found to be lower than 15% at 10, 30, and50 pg/mg. LOD and LOQ values, calculated fromanalyses of multiple blank head hair samples, were 3and 10 pg/mg, respectively. The detection of 3 pg/mg wasexperimentally confirmed by testing five spiked blankhair samples. An extraction recovery of 97.1±1.4% wasestimated for samples spiked with EtG at a concentrationof 30 pg/mg. Selectivity, specificity, and carryover testsall proved successful.
Study protocol
Blood and head hair samples were collected betweenOctober 2009 and December 2010 from two AlcoholAbuse Treatment Services located in Ciriè and Torino(Piedmont, Italy). One hundred seventy-five patients (30women and 145 men aged 22–74, mean=44.6) who wereparticipating in treatment or clinical trials were involved inthe study. Using medical records, the patients wereclassified as active heavy drinkers (N=59, 10 women and49 men aged 23–74, mean=46.9), social drinkers (N=51, 5women and 46 men aged 22–74, mean=40.5) or non-drinkers(N=65, 11 women and 54 men aged 22–73, mean = 45.6).Not all of the participating social and non-drinkers presentedprevious alcohol dependence problems.
The subjects were classified by medical doctors on aclinical basis, following OMS criteria DSM-IVand ICD-10,and using a combination of periodical blood tests, objectiveclinical symptoms, a questionnaire (essentially AUDIT),and personal interviews. In particular, most heavy drinkershad a full-blown medical history of alcohol abuse. Generalinformation on the estimated daily intake of ethanol duringthe past six months was gathered for each patient. Subjectswho consumed more than 60 g ethanol per day wereclassified as active heavy drinkers [25]. Non-drinkersincluded people who had abstained from alcohol consump-tion for the last six months at least: some of them wereformer patients who were still under strict control; otherswere teetotallers who had volunteered to participate to thestudy. Social drinkers were mainly patients of the AddictionServices who were undergoing therapy for addictions otherthan alcohol (i.e., gambling, doping, and psychoactivedrugs) and had volunteered to take part in the presentstudy. In general, only patients who could be attributed to acertain group were included in the study; patients with anuncertain classification were discarded.
Information on both recent and previous use of otherlegitimate and illicit drugs was also obtained. Medicalhistory data on the occurrence of hepatic diseases (i.e.,HCV, viral hepatitis, and hepatic cirrhosis) were alsocollected, which showed that 58 out of the 175 patientssuffered from hepatic diseases.
Each subject underwent venous whole blood samplinginto two standard tubes for MCV and AST, ALT, γ–GT,CDT, cholesterol, triglycerides, and ALP determinations.The blood collected was stored at room temperature for lessthan 2 h and immediately processed to determine biochemicaland hematological parameters.
Hair samples were cut as close as possible to the scalpusing freshly disinfected scissors. The samples were storedat room temperature and analyzed within 10 working days.Only hair segments that referred to a period of time inwhich the subjects maintained a regular alcohol daily intake
2156 V. Pirro et al.
were analyzed, and only the proximal 0–6 cm segment wasconsidered whenever a longer head hair sample wascollected. Short head hair samples were analyzed in theirentirety.
The study protocol was approved by the recognizedEthics Committee at San Luigi Gonzaga UniversityHospital [36, 37] (Turin, Italy). All patients providedwritten informed consent before attending the study, andan anonymous code was attributed to each participatingsubject in order to respect privacy regulations.
Statistical evaluations and ROC curve analyses
Inter-individual samples typically yield independent data;therefore, the Kruskal–Wallis nonparametric hypothesis testand the post hoc Mann–Whitney test were employed toverify the occurrence of statistically significant differencesbetween drinker categories. In the Kruskal–Wallis test, thenull hypothesis H0 affirms that there are no significantdifferences between at least two drinker groups. For thepost hoc Mann–Whitney test, the null hypothesis H0 statesthat there are no significant differences between the twogroups under examination. A significant level (a two-tailedP value) of 0.05 (CI=95%) was chosen for all statisticaltests. When the experimental P value proved to be smallerthan the critical P value, the hypothesis H0 was rejected.
The effects of age and a medical history of hepaticdiseases were evaluated for the same data set. Thecorrelations between age and the levels of the biomarkerswere studied in the whole data set and within the non-drinkers,social drinkers, and active heavy drinkers categories. For eachbiomarker and for all categories, Fisher weights (a measure ofthe ratio of the between-class variance to the within-classvariance, representing the discrimination power) were alsocalculated in order to evaluate the separation between subjectswho had suffered from previous hepatic diseases and thosewho had not. A Fisher weight of >1 indicates separationbetween categories [38]: the greater the value of the Fisherweight, the better the separation based on the consideredvariable.
ROC curve analyses were performed using the wholedata set in order to estimate the sensitivity and specificity ata certain cut-off value as well as the overall accuracy whendiscriminating active heavy drinkers from social and non-drinkers. ROC curves were constructed by plotting (1 −specificity) versus sensitivity. Both variables weremodeled on the heavy drinkers category: the sensitivitywas defined as the ratio of the number of true positiveresults to the total number of heavy drinkers, while thespecificity was the ratio of the number of true negativeresults to the sum of the social drinker and nondrinkercategories. Its complement (1 − specificity) is thereforethe ratio of the number of false-positive results (i.e.,
non-drinkers classified as heavy drinkers) to the sum ofthe social drinker and nondrinker categories [38]. Thearea under the ROC curve (AUC) is an experimentalmeasure of the test accuracy: an AUC value of 0.80 wasselected as an acceptable limit of accuracy for screeningbiomarkers, while a value of 0.90 was chosen as anacceptable limit of accuracy for confirmatory biomarkers[39]. To generate the EtG ROC curve, a numerical valuebetween 0 and the LOD (3 pg/mg) was randomlygenerated and assigned to the samples with nonmeasurable(below the LOD) EtG concentrations.
Correlation coefficients and Fisher weights were calcu-lated using the free chemometric package V-PARVUS 2010(Genoa, Italy) [40].
All statistical tests and ROC curve analyses wereperformed using the software package SPSS® (SPSS Inc.,Chicago, IL, USA; version 17.0 for Windows).
Principal component analysis
The original data matrix had 175 rows (subjects) andnine columns (biomarkers). No values were missingfrom the data set. Numerical values between 0 and theLOD (3 pg/mg) were randomly generated and assignedto the samples with nonmeasurable EtG concentrationsto ensure that the data variance was not underestimated.Since all of the variables showed skewed distributions,a logarithmic (base 10) transformation was applied toeach of them. Skewed distributions are very usual forclinical and toxicological variables, and a logarithmictransformation is commonly used to obtain a normaldistribution from highly skewed data [41]. Columnautoscaling was also executed as a further pretreatmentin order to remove systematic differences among variablesresulting from dissimilar scales and measurement units.
Principal component analysis (PCA) was performed onthe autoscaled data. PCA is one of the most widely usedexplorative techniques, as it provides information on boththe sample distribution and the correlations among varia-bles [42]. PCA is able to concentrate a considerable fractionof the information contained in the original data into areduced number of new uncorrelated variables (the princi-pal components, PCs). The scores are the projections of thesamples onto the new axes, and they provide informationabout the sample distribution. The loading values and thecosines of the angles between each variable and the PCshighlight which of the original variables are the mostimportant in the definition of each PC. Fisher weights werecalculated for each PC in order to estimate their discrim-inative abilities—their abilities to separate two categories.Also, two reduced matrices—with six and five columns(variables), respectively—were submitted to PCA. PCAwasperformed using the software package SPSS®. Fisher
Chemometric evaluation of nine alcohol biomarkers, including ethyl glucuronide in hair 2157
weights were calculated using the free chemometricpackage V–PARVUS 2010.
Results and discussion
Statistical evaluation and ROC curve analysis
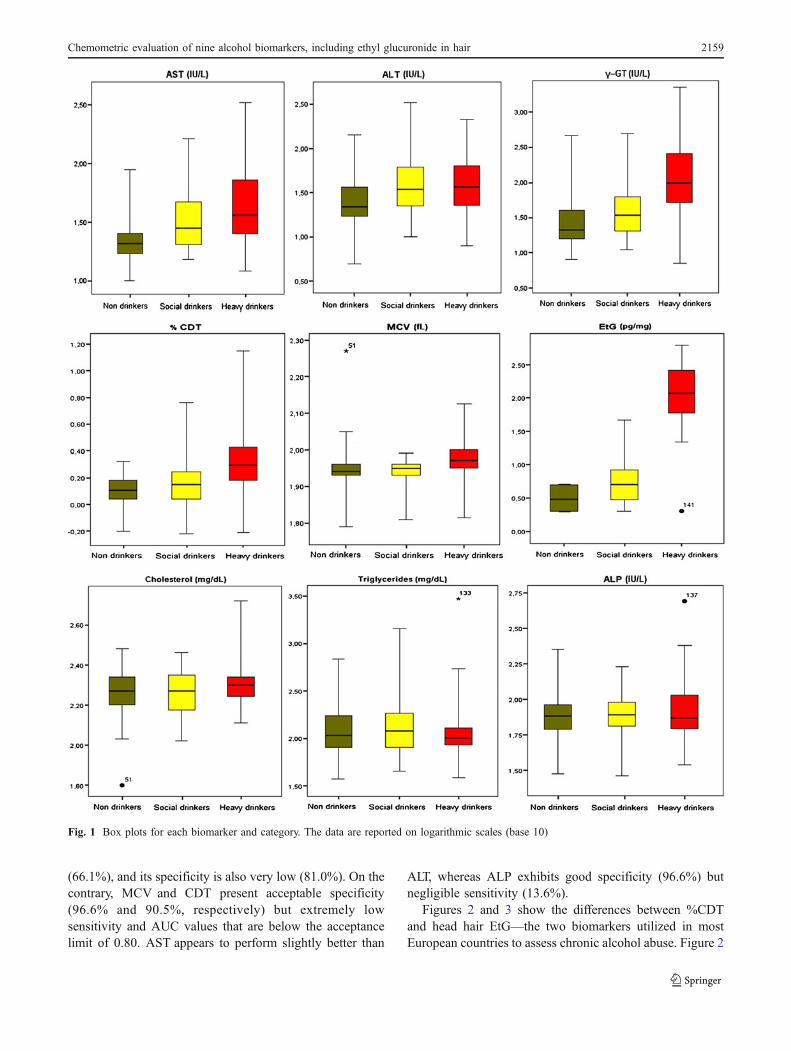
The means and standard deviations calculated for eachbiomarker and category in the whole data set are reported inTable 1. To compare these data distributions, box plots foreach biomarker and category are shown in Fig. 1, where they-axis is represented on a logarithmic scale. The originaldata set is available in the “Electronic supplementarymaterial” as Table S1.
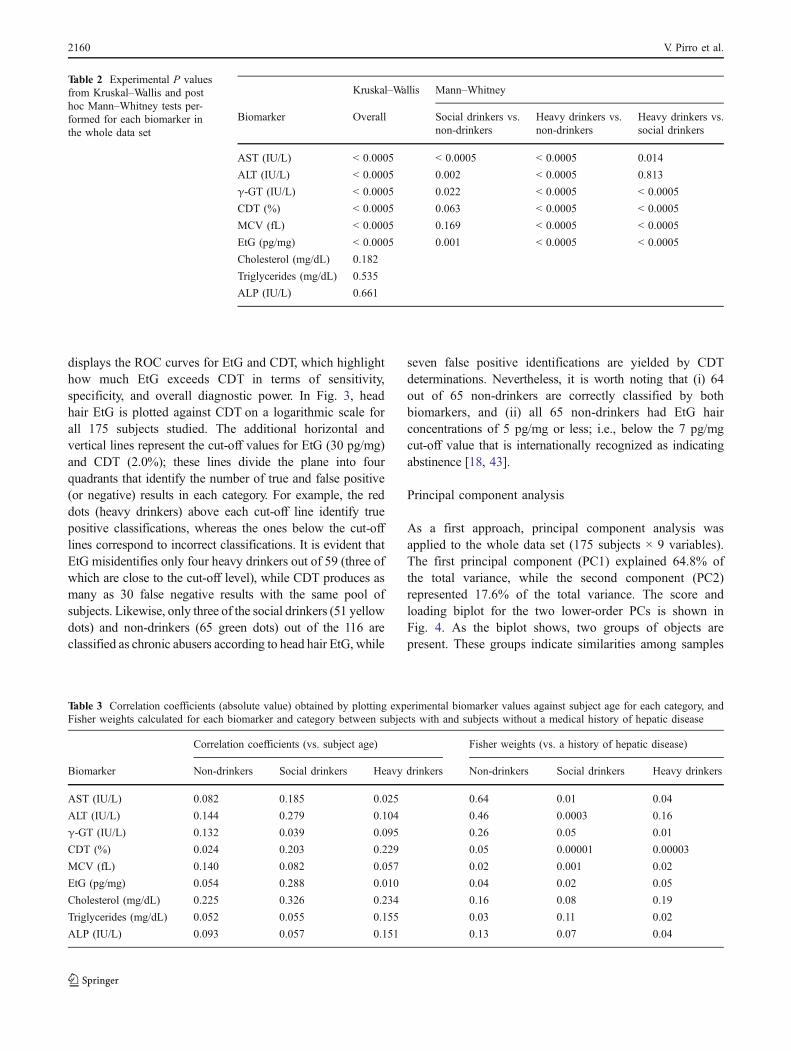
Upon applying the Kruskal–Wallis test, the null hypoth-esis H0 (no difference) was rejected for AST, ALT, γ-GT,CDT, MCVand EtG, confirming that significant differencesexist in at least one of the drinker categories for theseparameters. To understand which of the three populationsets was accountable for the difference, the post hoc Mann–Whitney test was applied. Using this test, it was possible toverify (P<0.05) that the AST, γ-GT, and EtG distributionsshow statistically significant differences between any pairdrawn from the three categories (heavy drinkers, socialdrinkers, and non-drinkers). ALT could not discriminateheavy from social drinkers, while CDT and MCV showedsignificant differences between heavy drinkers and bothsocial and non-drinkers but no differences between socialand non-drinkers. Experimental P values from all of thestatistical tests are reported in Table 2.
A series of correlation coefficients were calculated(Table 3) in order to check whether the experimental valueswere affected by potential sources of bias such as the age ofthe subjects and/or a medical history of hepatic disease. Nocorrelation was found between age and the direct or indirectalcohol biomarkers. Cholesterol provided the highestcorrelation with age for all classes of drinkers, with rcoefficients of 0.234, 0.326, and 0.225, respectively.
Likewise, none of the biomarkers investigated was signif-icantly influenced by a history of previous hepatic disease,since all of their Fisher weights—calculated for eachcategory between subjects who had and those who did nothave a medical history of hepatic diseases—were found tobe <1. It is worth noting that the highest Fisher weightswere obtained for the non-drinkers category with AST(0.64), ALT (0.46), and γ-GT (0.26), respectively, while allother Fisher weights (Table 3) were below 0.2. This result islogical, as the potential previous hepatic damage recordedby AST, ALT and γ-GT is only discernible whenever adirect and relevant cause, such as heavy alcohol consump-tion, is not occurring. It is worth noting that head hair EtG,MCV, and CDT are the biomarkers with the lowest Fisherweights (all below 0.05), which demonstrates that they arenot influenced by previous hepatic diseases, as expected.
AUC, sensitivity, and (1 − specificity) values calculatedfor the whole data set are reported in Table 4. From thesedata, it is clear that EtG in head hair is the most sensitiveand specific biomarker for identifying chronic alcoholmisuse. At the recognized cut-off level of 30 pg/mg,sensitivity and specificity are 91.5% and 97.4%, respec-tively, far above the corresponding values for any otherbiomarker. This indicates that an active heavy drinker has a91.5% chance of being identified as an alcohol abuser,whereas a non-heavy drinker has a 2.6% probability ofbeing misidentified as an alcohol abuser. EtG also presentsan AUC value of 0.982. This indicates that, within a binaryclassification scheme, a randomly selected positive case hasa 98.2% probability of obtaining an higher score (i.e., EtGvalue) than a randomly selected negative case. Aside fromEtG, none of the indirect biomarkers show sufficientdiagnostic accuracy to justify their use as single indicatorsof chronic alcohol misuse for either screening or confirma-tory purposes. Among the indirect biomarkers, γ-GT is theonly one that yields an AUC value that is higher than theacceptable limit for screening purposes; it is the indirectbiomarker aside from EtG in head hair that shows thehighest sensitivity, although this is still unsatisfactory
Table 1 Calculated means andstandard deviations for all of thebiomarkers and categories
Biomarker Overall Non-drinkers Social drinkers Heavy drinkers
AST (IU/L) 43±47 25±16 40±33 65±66
ALT (IU/L) 47±48 30±25 59±63 54±47
γ-GT (IU/L) 121±264 40±61 51±68 271±408
CDT (%) 1.9±1.6 1.3±0.3 1.6±0.8 2.7±2.4
MCV (fL) 90±12 89±15 88±6 94±11
EtG (pg/mg) 68±133 3.5±1.2 8.0±9.2 191±173
Cholesterol (mg/dL) 188±104 190±45 164±173 208±62
Triglycerides (mg/dL) 157±251 138±99 170±208 166±374
ALP (IU/L) 87±48 80±31 82±27 97±70
2158 V. Pirro et al.
(66.1%), and its specificity is also very low (81.0%). On thecontrary, MCV and CDT present acceptable specificity(96.6% and 90.5%, respectively) but extremely lowsensitivity and AUC values that are below the acceptancelimit of 0.80. AST appears to perform slightly better than
ALT, whereas ALP exhibits good specificity (96.6%) butnegligible sensitivity (13.6%).
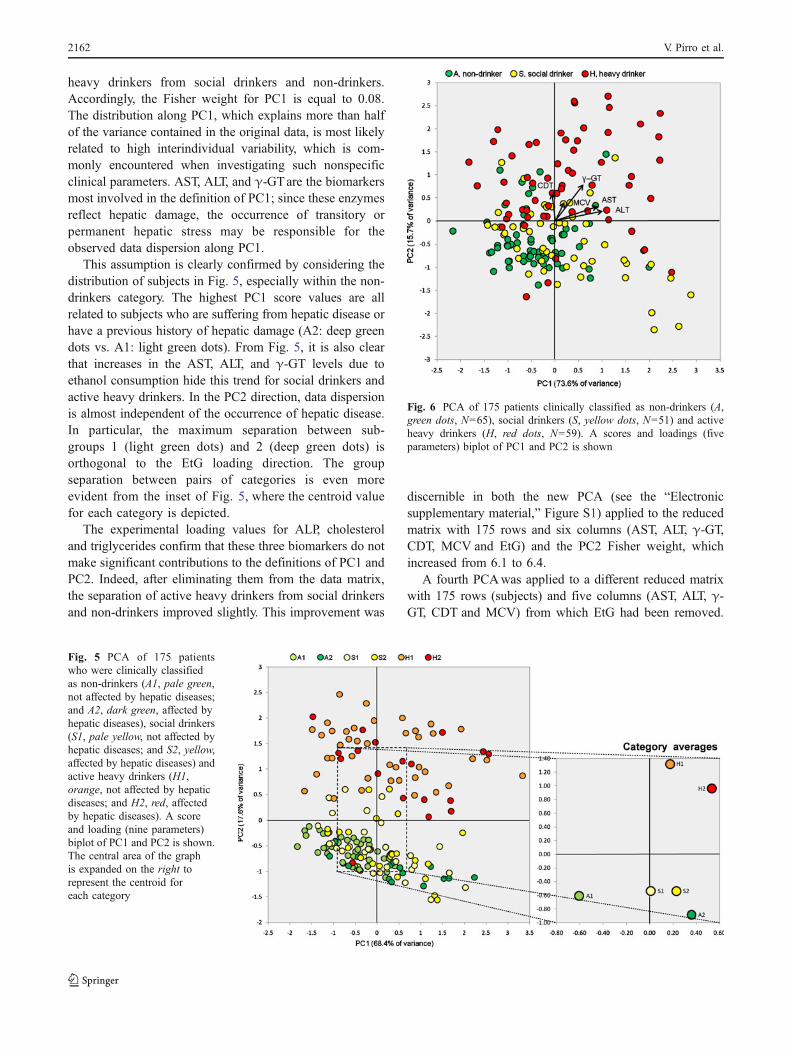
Figures 2 and 3 show the differences between %CDTand head hair EtG—the two biomarkers utilized in mostEuropean countries to assess chronic alcohol abuse. Figure 2
Fig. 1 Box plots for each biomarker and category. The data are reported on logarithmic scales (base 10)
Chemometric evaluation of nine alcohol biomarkers, including ethyl glucuronide in hair 2159
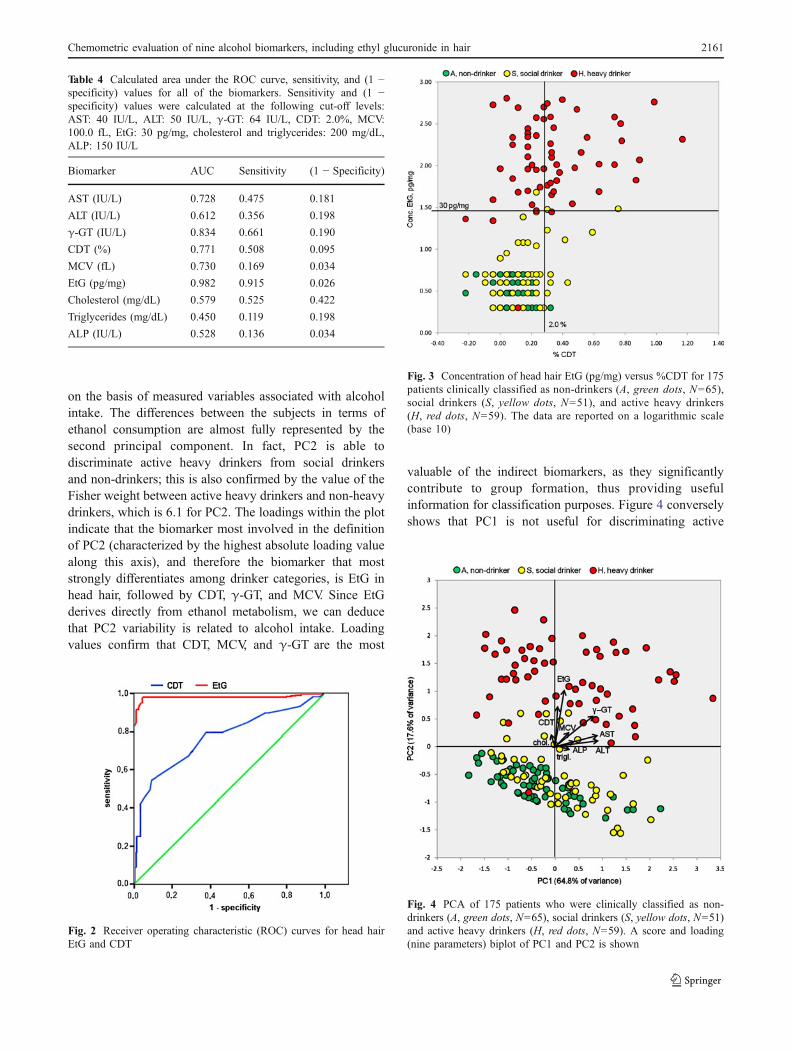
displays the ROC curves for EtG and CDT, which highlighthow much EtG exceeds CDT in terms of sensitivity,specificity, and overall diagnostic power. In Fig. 3, headhair EtG is plotted against CDT on a logarithmic scale forall 175 subjects studied. The additional horizontal andvertical lines represent the cut-off values for EtG (30 pg/mg)and CDT (2.0%); these lines divide the plane into fourquadrants that identify the number of true and false positive(or negative) results in each category. For example, the reddots (heavy drinkers) above each cut-off line identify truepositive classifications, whereas the ones below the cut-offlines correspond to incorrect classifications. It is evident thatEtG misidentifies only four heavy drinkers out of 59 (three ofwhich are close to the cut-off level), while CDT produces asmany as 30 false negative results with the same pool ofsubjects. Likewise, only three of the social drinkers (51 yellowdots) and non-drinkers (65 green dots) out of the 116 areclassified as chronic abusers according to head hair EtG, while
seven false positive identifications are yielded by CDTdeterminations. Nevertheless, it is worth noting that (i) 64out of 65 non-drinkers are correctly classified by bothbiomarkers, and (ii) all 65 non-drinkers had EtG hairconcentrations of 5 pg/mg or less; i.e., below the 7 pg/mgcut-off value that is internationally recognized as indicatingabstinence [18, 43].
Principal component analysis
As a first approach, principal component analysis wasapplied to the whole data set (175 subjects × 9 variables).The first principal component (PC1) explained 64.8% ofthe total variance, while the second component (PC2)represented 17.6% of the total variance. The score andloading biplot for the two lower-order PCs is shown inFig. 4. As the biplot shows, two groups of objects arepresent. These groups indicate similarities among samples
Table 2 Experimental P valuesfrom Kruskal–Wallis and posthoc Mann–Whitney tests per-formed for each biomarker inthe whole data set
Kruskal–Wallis Mann–Whitney
Biomarker Overall Social drinkers vs.non-drinkers
Heavy drinkers vs.non-drinkers
Heavy drinkers vs.social drinkers
AST (IU/L) < 0.0005 < 0.0005 < 0.0005 0.014
ALT (IU/L) < 0.0005 0.002 < 0.0005 0.813
γ-GT (IU/L) < 0.0005 0.022 < 0.0005 < 0.0005
CDT (%) < 0.0005 0.063 < 0.0005 < 0.0005
MCV (fL) < 0.0005 0.169 < 0.0005 < 0.0005
EtG (pg/mg) < 0.0005 0.001 < 0.0005 < 0.0005
Cholesterol (mg/dL) 0.182
Triglycerides (mg/dL) 0.535
ALP (IU/L) 0.661
Table 3 Correlation coefficients (absolute value) obtained by plotting experimental biomarker values against subject age for each category, andFisher weights calculated for each biomarker and category between subjects with and subjects without a medical history of hepatic disease
Correlation coefficients (vs. subject age) Fisher weights (vs. a history of hepatic disease)
Biomarker Non-drinkers Social drinkers Heavy drinkers Non-drinkers Social drinkers Heavy drinkers
AST (IU/L) 0.082 0.185 0.025 0.64 0.01 0.04
ALT (IU/L) 0.144 0.279 0.104 0.46 0.0003 0.16
γ-GT (IU/L) 0.132 0.039 0.095 0.26 0.05 0.01
CDT (%) 0.024 0.203 0.229 0.05 0.00001 0.00003
MCV (fL) 0.140 0.082 0.057 0.02 0.001 0.02
EtG (pg/mg) 0.054 0.288 0.010 0.04 0.02 0.05
Cholesterol (mg/dL) 0.225 0.326 0.234 0.16 0.08 0.19
Triglycerides (mg/dL) 0.052 0.055 0.155 0.03 0.11 0.02
ALP (IU/L) 0.093 0.057 0.151 0.13 0.07 0.04
2160 V. Pirro et al.
on the basis of measured variables associated with alcoholintake. The differences between the subjects in terms ofethanol consumption are almost fully represented by thesecond principal component. In fact, PC2 is able todiscriminate active heavy drinkers from social drinkersand non-drinkers; this is also confirmed by the value of theFisher weight between active heavy drinkers and non-heavydrinkers, which is 6.1 for PC2. The loadings within the plotindicate that the biomarker most involved in the definitionof PC2 (characterized by the highest absolute loading valuealong this axis), and therefore the biomarker that moststrongly differentiates among drinker categories, is EtG inhead hair, followed by CDT, γ-GT, and MCV. Since EtGderives directly from ethanol metabolism, we can deducethat PC2 variability is related to alcohol intake. Loadingvalues confirm that CDT, MCV, and γ-GT are the most
valuable of the indirect biomarkers, as they significantlycontribute to group formation, thus providing usefulinformation for classification purposes. Figure 4 converselyshows that PC1 is not useful for discriminating active
Table 4 Calculated area under the ROC curve, sensitivity, and (1 −specificity) values for all of the biomarkers. Sensitivity and (1 −specificity) values were calculated at the following cut-off levels:AST: 40 IU/L, ALT: 50 IU/L, γ-GT: 64 IU/L, CDT: 2.0%, MCV:100.0 fL, EtG: 30 pg/mg, cholesterol and triglycerides: 200 mg/dL,ALP: 150 IU/L
Biomarker AUC Sensitivity (1 − Specificity)
AST (IU/L) 0.728 0.475 0.181
ALT (IU/L) 0.612 0.356 0.198
γ-GT (IU/L) 0.834 0.661 0.190
CDT (%) 0.771 0.508 0.095
MCV (fL) 0.730 0.169 0.034
EtG (pg/mg) 0.982 0.915 0.026
Cholesterol (mg/dL) 0.579 0.525 0.422
Triglycerides (mg/dL) 0.450 0.119 0.198
ALP (IU/L) 0.528 0.136 0.034
Fig. 2 Receiver operating characteristic (ROC) curves for head hairEtG and CDT
Fig. 3 Concentration of head hair EtG (pg/mg) versus %CDT for 175patients clinically classified as non-drinkers (A, green dots, N=65),social drinkers (S, yellow dots, N=51), and active heavy drinkers(H, red dots, N=59). The data are reported on a logarithmic scale(base 10)
Fig. 4 PCA of 175 patients who were clinically classified as non-drinkers (A, green dots, N=65), social drinkers (S, yellow dots, N=51)and active heavy drinkers (H, red dots, N=59). A score and loading(nine parameters) biplot of PC1 and PC2 is shown
Chemometric evaluation of nine alcohol biomarkers, including ethyl glucuronide in hair 2161
heavy drinkers from social drinkers and non-drinkers.Accordingly, the Fisher weight for PC1 is equal to 0.08.The distribution along PC1, which explains more than halfof the variance contained in the original data, is most likelyrelated to high interindividual variability, which is com-monly encountered when investigating such nonspecificclinical parameters. AST, ALT, and γ-GTare the biomarkersmost involved in the definition of PC1; since these enzymesreflect hepatic damage, the occurrence of transitory orpermanent hepatic stress may be responsible for theobserved data dispersion along PC1.
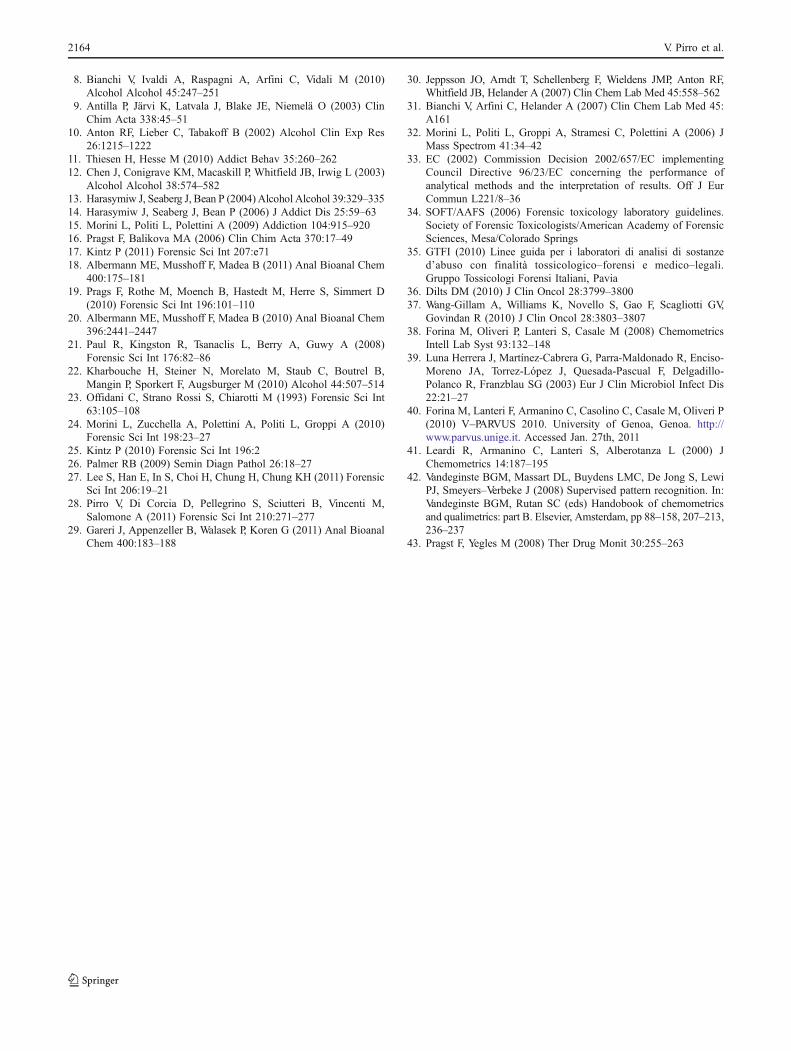
This assumption is clearly confirmed by considering thedistribution of subjects in Fig. 5, especially within the non-drinkers category. The highest PC1 score values are allrelated to subjects who are suffering from hepatic disease orhave a previous history of hepatic damage (A2: deep greendots vs. A1: light green dots). From Fig. 5, it is also clearthat increases in the AST, ALT, and γ-GT levels due toethanol consumption hide this trend for social drinkers andactive heavy drinkers. In the PC2 direction, data dispersionis almost independent of the occurrence of hepatic disease.In particular, the maximum separation between sub-groups 1 (light green dots) and 2 (deep green dots) isorthogonal to the EtG loading direction. The groupseparation between pairs of categories is even moreevident from the inset of Fig. 5, where the centroid valuefor each category is depicted.
The experimental loading values for ALP, cholesteroland triglycerides confirm that these three biomarkers do notmake significant contributions to the definitions of PC1 andPC2. Indeed, after eliminating them from the data matrix,the separation of active heavy drinkers from social drinkersand non-drinkers improved slightly. This improvement was
discernible in both the new PCA (see the “Electronicsupplementary material,” Figure S1) applied to the reducedmatrix with 175 rows and six columns (AST, ALT, γ-GT,CDT, MCV and EtG) and the PC2 Fisher weight, whichincreased from 6.1 to 6.4.
A fourth PCAwas applied to a different reduced matrixwith 175 rows (subjects) and five columns (AST, ALT, γ-GT, CDT and MCV) from which EtG had been removed.
Fig. 5 PCA of 175 patientswho were clinically classifiedas non-drinkers (A1, pale green,not affected by hepatic diseases;and A2, dark green, affected byhepatic diseases), social drinkers(S1, pale yellow, not affected byhepatic diseases; and S2, yellow,affected by hepatic diseases) andactive heavy drinkers (H1,orange, not affected by hepaticdiseases; and H2, red, affectedby hepatic diseases). A scoreand loading (nine parameters)biplot of PC1 and PC2 is shown.The central area of the graphis expanded on the right torepresent the centroid foreach category
Fig. 6 PCA of 175 patients clinically classified as non-drinkers (A,green dots, N=65), social drinkers (S, yellow dots, N=51) and activeheavy drinkers (H, red dots, N=59). A scores and loadings (fiveparameters) biplot of PC1 and PC2 is shown
2162 V. Pirro et al.
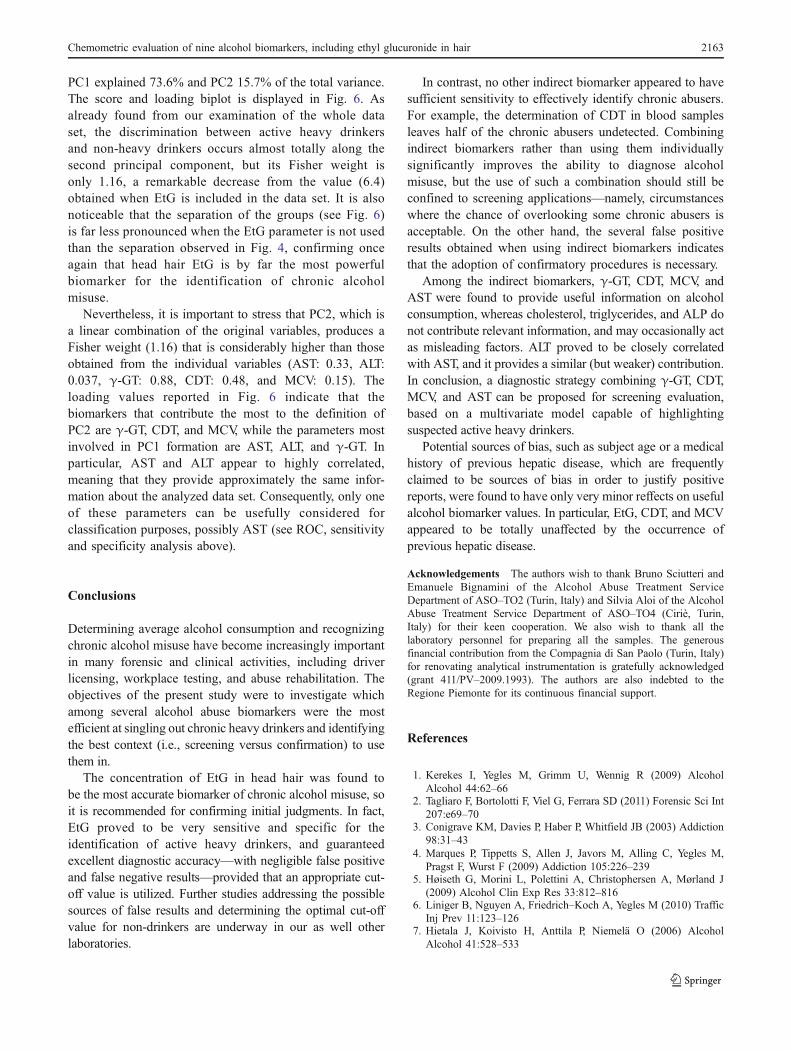
PC1 explained 73.6% and PC2 15.7% of the total variance.The score and loading biplot is displayed in Fig. 6. Asalready found from our examination of the whole dataset, the discrimination between active heavy drinkersand non-heavy drinkers occurs almost totally along thesecond principal component, but its Fisher weight isonly 1.16, a remarkable decrease from the value (6.4)obtained when EtG is included in the data set. It is alsonoticeable that the separation of the groups (see Fig. 6)is far less pronounced when the EtG parameter is not usedthan the separation observed in Fig. 4, confirming onceagain that head hair EtG is by far the most powerfulbiomarker for the identification of chronic alcoholmisuse.
Nevertheless, it is important to stress that PC2, which isa linear combination of the original variables, produces aFisher weight (1.16) that is considerably higher than thoseobtained from the individual variables (AST: 0.33, ALT:0.037, γ-GT: 0.88, CDT: 0.48, and MCV: 0.15). Theloading values reported in Fig. 6 indicate that thebiomarkers that contribute the most to the definition ofPC2 are γ-GT, CDT, and MCV, while the parameters mostinvolved in PC1 formation are AST, ALT, and γ-GT. Inparticular, AST and ALT appear to highly correlated,meaning that they provide approximately the same infor-mation about the analyzed data set. Consequently, only oneof these parameters can be usefully considered forclassification purposes, possibly AST (see ROC, sensitivityand specificity analysis above).
Conclusions
Determining average alcohol consumption and recognizingchronic alcohol misuse have become increasingly importantin many forensic and clinical activities, including driverlicensing, workplace testing, and abuse rehabilitation. Theobjectives of the present study were to investigate whichamong several alcohol abuse biomarkers were the mostefficient at singling out chronic heavy drinkers and identifyingthe best context (i.e., screening versus confirmation) to usethem in.
The concentration of EtG in head hair was found tobe the most accurate biomarker of chronic alcohol misuse, soit is recommended for confirming initial judgments. In fact,EtG proved to be very sensitive and specific for theidentification of active heavy drinkers, and guaranteedexcellent diagnostic accuracy—with negligible false positiveand false negative results—provided that an appropriate cut-off value is utilized. Further studies addressing the possiblesources of false results and determining the optimal cut-offvalue for non-drinkers are underway in our as well otherlaboratories.
In contrast, no other indirect biomarker appeared to havesufficient sensitivity to effectively identify chronic abusers.For example, the determination of CDT in blood samplesleaves half of the chronic abusers undetected. Combiningindirect biomarkers rather than using them individuallysignificantly improves the ability to diagnose alcoholmisuse, but the use of such a combination should still beconfined to screening applications—namely, circumstanceswhere the chance of overlooking some chronic abusers isacceptable. On the other hand, the several false positiveresults obtained when using indirect biomarkers indicatesthat the adoption of confirmatory procedures is necessary.
Among the indirect biomarkers, γ-GT, CDT, MCV, andAST were found to provide useful information on alcoholconsumption, whereas cholesterol, triglycerides, and ALP donot contribute relevant information, and may occasionally actas misleading factors. ALT proved to be closely correlatedwith AST, and it provides a similar (but weaker) contribution.In conclusion, a diagnostic strategy combining γ-GT, CDT,MCV, and AST can be proposed for screening evaluation,based on a multivariate model capable of highlightingsuspected active heavy drinkers.
Potential sources of bias, such as subject age or a medicalhistory of previous hepatic disease, which are frequentlyclaimed to be sources of bias in order to justify positivereports, were found to have only very minor reffects on usefulalcohol biomarker values. In particular, EtG, CDT, and MCVappeared to be totally unaffected by the occurrence ofprevious hepatic disease.
Acknowledgements The authors wish to thank Bruno Sciutteri andEmanuele Bignamini of the Alcohol Abuse Treatment ServiceDepartment of ASO–TO2 (Turin, Italy) and Silvia Aloi of the AlcoholAbuse Treatment Service Department of ASO–TO4 (Ciriè, Turin,Italy) for their keen cooperation. We also wish to thank all thelaboratory personnel for preparing all the samples. The generousfinancial contribution from the Compagnia di San Paolo (Turin, Italy)for renovating analytical instrumentation is gratefully acknowledged(grant 411/PV–2009.1993). The authors are also indebted to theRegione Piemonte for its continuous financial support.
References
1. Kerekes I, Yegles M, Grimm U, Wennig R (2009) AlcoholAlcohol 44:62–66
2. Tagliaro F, Bortolotti F, Viel G, Ferrara SD (2011) Forensic Sci Int207:e69–70
3. Conigrave KM, Davies P, Haber P, Whitfield JB (2003) Addiction98:31–43
4. Marques P, Tippetts S, Allen J, Javors M, Alling C, Yegles M,Pragst F, Wurst F (2009) Addiction 105:226–239
5. Høiseth G, Morini L, Polettini A, Christophersen A, Mørland J(2009) Alcohol Clin Exp Res 33:812–816
6. Liniger B, Nguyen A, Friedrich–Koch A, Yegles M (2010) TrafficInj Prev 11:123–126
7. Hietala J, Koivisto H, Anttila P, Niemelä O (2006) AlcoholAlcohol 41:528–533
Chemometric evaluation of nine alcohol biomarkers, including ethyl glucuronide in hair 2163
8. Bianchi V, Ivaldi A, Raspagni A, Arfini C, Vidali M (2010)Alcohol Alcohol 45:247–251
9. Antilla P, Järvi K, Latvala J, Blake JE, Niemelä O (2003) ClinChim Acta 338:45–51
10. Anton RF, Lieber C, Tabakoff B (2002) Alcohol Clin Exp Res26:1215–1222
11. Thiesen H, Hesse M (2010) Addict Behav 35:260–26212. Chen J, Conigrave KM, Macaskill P, Whitfield JB, Irwig L (2003)
Alcohol Alcohol 38:574–58213. Harasymiw J, Seaberg J, Bean P (2004) Alcohol Alcohol 39:329–33514. Harasymiw J, Seaberg J, Bean P (2006) J Addict Dis 25:59–6315. Morini L, Politi L, Polettini A (2009) Addiction 104:915–92016. Pragst F, Balikova MA (2006) Clin Chim Acta 370:17–4917. Kintz P (2011) Forensic Sci Int 207:e7118. Albermann ME, Musshoff F, Madea B (2011) Anal Bioanal Chem
400:175–18119. Prags F, Rothe M, Moench B, Hastedt M, Herre S, Simmert D
(2010) Forensic Sci Int 196:101–11020. Albermann ME, Musshoff F, Madea B (2010) Anal Bioanal Chem
396:2441–244721. Paul R, Kingston R, Tsanaclis L, Berry A, Guwy A (2008)
Forensic Sci Int 176:82–8622. Kharbouche H, Steiner N, Morelato M, Staub C, Boutrel B,
Mangin P, Sporkert F, Augsburger M (2010) Alcohol 44:507–51423. Offidani C, Strano Rossi S, Chiarotti M (1993) Forensic Sci Int
63:105–10824. Morini L, Zucchella A, Polettini A, Politi L, Groppi A (2010)
Forensic Sci Int 198:23–2725. Kintz P (2010) Forensic Sci Int 196:226. Palmer RB (2009) Semin Diagn Pathol 26:18–2727. Lee S, Han E, In S, Choi H, Chung H, Chung KH (2011) Forensic
Sci Int 206:19–2128. Pirro V, Di Corcia D, Pellegrino S, Sciutteri B, Vincenti M,
Salomone A (2011) Forensic Sci Int 210:271–27729. Gareri J, Appenzeller B, Walasek P, Koren G (2011) Anal Bioanal
Chem 400:183–188
30. Jeppsson JO, Arndt T, Schellenberg F, Wieldens JMP, Anton RF,Whitfield JB, Helander A (2007) Clin Chem Lab Med 45:558–562
31. Bianchi V, Arfini C, Helander A (2007) Clin Chem Lab Med 45:A161
32. Morini L, Politi L, Groppi A, Stramesi C, Polettini A (2006) JMass Spectrom 41:34–42
33. EC (2002) Commission Decision 2002/657/EC implementingCouncil Directive 96/23/EC concerning the performance ofanalytical methods and the interpretation of results. Off J EurCommun L221/8–36
34. SOFT/AAFS (2006) Forensic toxicology laboratory guidelines.Society of Forensic Toxicologists/American Academy of ForensicSciences, Mesa/Colorado Springs
35. GTFI (2010) Linee guida per i laboratori di analisi di sostanzed’abuso con finalità tossicologico–forensi e medico–legali.Gruppo Tossicologi Forensi Italiani, Pavia
36. Dilts DM (2010) J Clin Oncol 28:3799–380037. Wang-Gillam A, Williams K, Novello S, Gao F, Scagliotti GV,
Govindan R (2010) J Clin Oncol 28:3803–380738. Forina M, Oliveri P, Lanteri S, Casale M (2008) Chemometrics
Intell Lab Syst 93:132–14839. Luna Herrera J, Martínez-Cabrera G, Parra-Maldonado R, Enciso-
Moreno JA, Torrez-López J, Quesada-Pascual F, Delgadillo-Polanco R, Franzblau SG (2003) Eur J Clin Microbiol Infect Dis22:21–27
40. Forina M, Lanteri F, Armanino C, Casolino C, Casale M, Oliveri P(2010) V–PARVUS 2010. University of Genoa, Genoa. http://www.parvus.unige.it. Accessed Jan. 27th, 2011
41. Leardi R, Armanino C, Lanteri S, Alberotanza L (2000) JChemometrics 14:187–195
42. Vandeginste BGM, Massart DL, Buydens LMC, De Jong S, LewiPJ, Smeyers–Verbeke J (2008) Supervised pattern recognition. In:Vandeginste BGM, Rutan SC (eds) Handobook of chemometricsand qualimetrics: part B. Elsevier, Amsterdam, pp 88–158, 207–213,236–237
43. Pragst F, Yegles M (2008) Ther Drug Monit 30:255–263
2164 V. Pirro et al.
Related Documents