i ` CHEMISTRY II 201 L Laboratory Packet Dr. Fred O. Garces Spring 2021

Welcome message from author
This document is posted to help you gain knowledge. Please leave a comment to let me know what you think about it! Share it to your friends and learn new things together.
Transcript

i
`
CHEMISTRY II 201 L
Laboratory Packet
Dr. Fred O. Garces
Spring 2021
ii
Miramar Chem. Laboratory Policy and Procedure 1/21 -FG
Welcome to Miramar College's Chemistry 201 laboratory. There are a number of policies that should be followed when you are in the laboratory, S6-201/203. Please be sure to read everything carefully and to practice these policies so your safety is not compromised.
1. All students are required to have, and wear, safety goggles when conducting experiments (Goggles not glasses). There are NO exceptions to this rule. Goggles are available for purchase at the bookstore. If you are not wearing your goggles, do not proceed with the experiments. Your instructor will not allow you to be present in the lab classroom while experiments are being conducted without them. You should bring safety goggles by the time you begin with the first experiment. Some instructors will penalize your lab safety quiz up to 50% off for not bringing or using your goggles during experiments. 2. All students are required to wear safety gloves (nitrile not latex since some students are allergic to latex) when conducting experiments. Remove gloves when leaving the classroom. The idea is not to cross-contaminate areas that has not been exposed to chemicals. Remove gloves and dispose of in the proper solid waste refuse. 3. All students are to wear proper attire when present in lab. That means clothing that minimize skin exposure. Furthermore, students are to wear lab coats (white) when conducting lab work at all times. When leaving the lab (for bathroom or lunch break) remove lab coats and leave in your equipment drawer. Upon returning to continue lab work, put back on your lab coat.
4. Each student must purchase a Master™ Combination lock with the following serial numbers: V99XXX, V629XXX, or 10976xxx (the last three numbers are different from lock to lock). These special Master™ locks can be opened by the lab technicians with a master key. The Miramar Bookstore sells these locks, and it is departmental policy that all students must exchange the department's brass locks with these Master™ combination locks by the second week of the term. If you do not have a lock, the instructor will ask you to go to the bookstore to purchase these locks before being allowed to perform an experiment. All other locks that do not conform to the Master™ Combination lock just described will be cut off. Lab techs must have access to student lockers at all times in case of emergency. Write the combination of these locks in your locker agreement sheet.
5. Students are not allowed into the classroom earlier than ten minutes prior to the start of class. Furthermore, students are not allowed in the lab room without instructor supervision.
6. The department has a very strong HAZMAT policy. Absolutely no chemicals—not even things like sodium chloride or sucrose are allowed down the sinks. Contamination of the sewer system with toxic chemicals cannot be allowed. The department has a blanket policy that all chemicals must be placed in the proper waste container. Violation of this rule will result in a grade adjustment on the student’s lab assignment.
7. The MSDS library contains hazard information for all chemicals used in this course and can be found in the cabinets to the sides. You can also go online to the MSDS site. https://www.msdsonline.com/ Also available in these cabinets are the Merck Index and the Handbook of Chemistry and Physics. These reference texts are for student use.
8. Students are not allowed to use the phone in the lab or the prep room. All cell phones should be turned off when entering the laboratory. Do not put your phone on silent/vibrate mode, you should turn off your cell phone instead. If it is an emergency, the instructor will place the phone call. There is an emergency telecom (red call box) at the front of the room to contact the district's dispatch office. 9. Students are not allowed in the prep room (chemical storage), the lab technician’s office, or behind the instructor’s table at any time. Students are allowed in the instrument room and the balance only with permission from the instructor.
10. The lab room is equipped with hot plates, balances, and Bunsen burners and other community equipment. Your instructor will inform you of where this equipment is stored. Students must return all equipment back to its proper location before leaving the classroom. Under no circumstances are the equipment to be kept in the student's lockers.
11. A first-aid kit is located at the rear of the class, near the entrance to the prep room. The hand broom and dustpan is found just to the right of the instructor’s table. The emergency shower is on the northwest corner of the room. Contact a lab tech or your instructor in the event of any chemical spill. It is an absolute policy to report all accidents to the instructor.
12. Students are not allowed to keep supplies/equipment that have been set out for each experiment such as: burets, pH meters, thermometers and rulers, in their lockers. Violating this rule will result in a deduction in the lab assignment score.
13. It is the responsibility of all students to clean the laboratory before leaving. The lab techs work very hard to keep the laboratory clean and uncluttered. All students should clean messy lab benches and sink areas and push in their chairs before leaving the classroom; in general, clean up around your lab area and the hoods and back counter before leaving the lab. Spray down your lab bench area and wipe dry before leaving the lab. Regularly leaving the lab without consideration of this policy will result in a poor lab technique grade.
iii
Forward Your laboratory work is the core of your chemistry course. You have a challenging opportunity to observe many of the facets of chemistry under controlled laboratory conditions and to experience first-hand the method of inquiry that is the foundation of all experimental sciences. The chemistry laboratory illustrates the scientific method in action. Here are a few brief recommendations that will give you a good start in this course.
1. Gain self-confidence by working individually, unless the experiments require teamwork. Don't hesitate to ask questions if you are uncertain about a procedure, the interpretation of results, or the calculations.
2. Use your ingenuity and common sense. Laboratory directions, while quite specific, leave ample opportunity for clear-cut,
logical, original, and imaginative thinking. This attitude is a prerequisite in any scientific endeavor. 3. Don't waste time by coming unprepared to the laboratory. Prepare for each experiment by studying all aspects of the
experiment. Review lab procedures and/or theories from other sources if you are uncertain about certain aspects of the lab. 4. Prepare your “Laboratory Reports” for each experiment with care. To record your data, use a permanently bound notebook as
prescribed by your instructor. All data should be recorded directly into your laboratory notebook, not on loose sheets or scraps of paper. If calculations are involved, show an orderly calculation for the first set of data, but do not clutter the calculation section with arithmetic details. Likewise, think through and answer important questions that are intended to give you an understanding of the principles on which the experimental procedure is based as you perform the experiment.
5. Scientists learn much by talking with one another. You may learn a lot by talking to your classmates, but not by copying from
them. Integrity is the keystone of scientific work. You will also profit by referring to your text while working in the laboratory. (Books are generally an even more reliable and complete sources of information than are your classmates!)
6. For tabular data on the properties of substances, you may wish to consult handbooks such as the Handbook of Chemistry and
Physics (CRC Press, Inc., Boca Raton, Florida) or Lange's Handbook of Chemistry (McGraw-Hill, New York).
SAFETY RULES Familiarize yourself with the safety rules given in the lab manual. Observance of these rules, as modified or added to by your instructor, is essential for the sake of your safety and that of others in the laboratory. Your instructor will indicate the location and show you the proper use of the fire extinguishers, fire blanket, eyewash fountain, safety shower, and first-aid cabinet and supplies. The instructor will also tell you when you should wear safety goggles. GOOD LABORATORY PRACTICES Familiarize yourself with the good laboratory practices in the lab manual. It is essential that these regulations, as modified or added to by your instructor, be followed carefully and to the letter. BASIC LABORATORY EQUIPMENT AND PROCEDURES Check the equipment in the laboratory locker assigned to you as directed by your instructor. Before your first laboratory experiment, read over the introductory part on common lab techniques i.e., handling of chemicals, care of laboratory glassware, and volumetric measurements of liquids, etc. Supplemental information can be found in the following website:
http://faculty.sdmiramar.edu/fgarces/zCourse/All_Year/Ch201/bFrames/Content_Frames_WebCT_LC.html
http://faculty.sdmiramar.edu/fgarces/ChemComon/Tutorial/Tutorial.htm
J.L.Roberts, J.L.Hollenberg, J.M.Postma "Chemistry in the Laboratory" 4th Ed., Freeman. 1997
iv
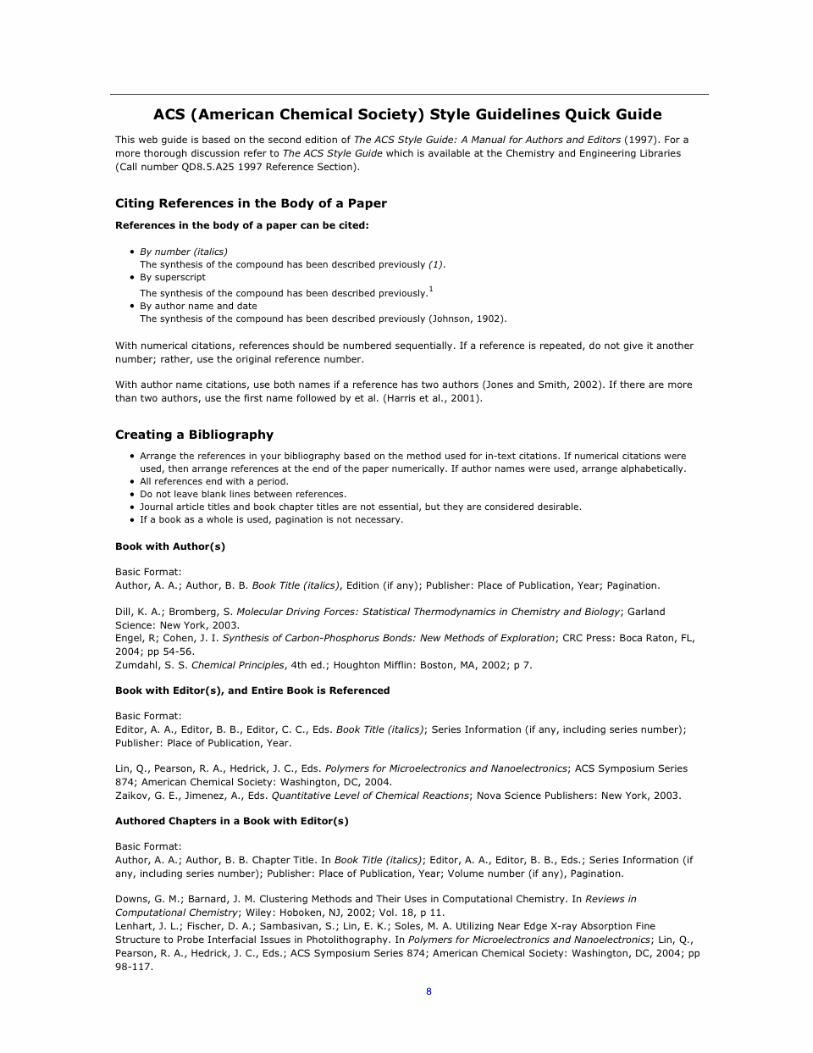
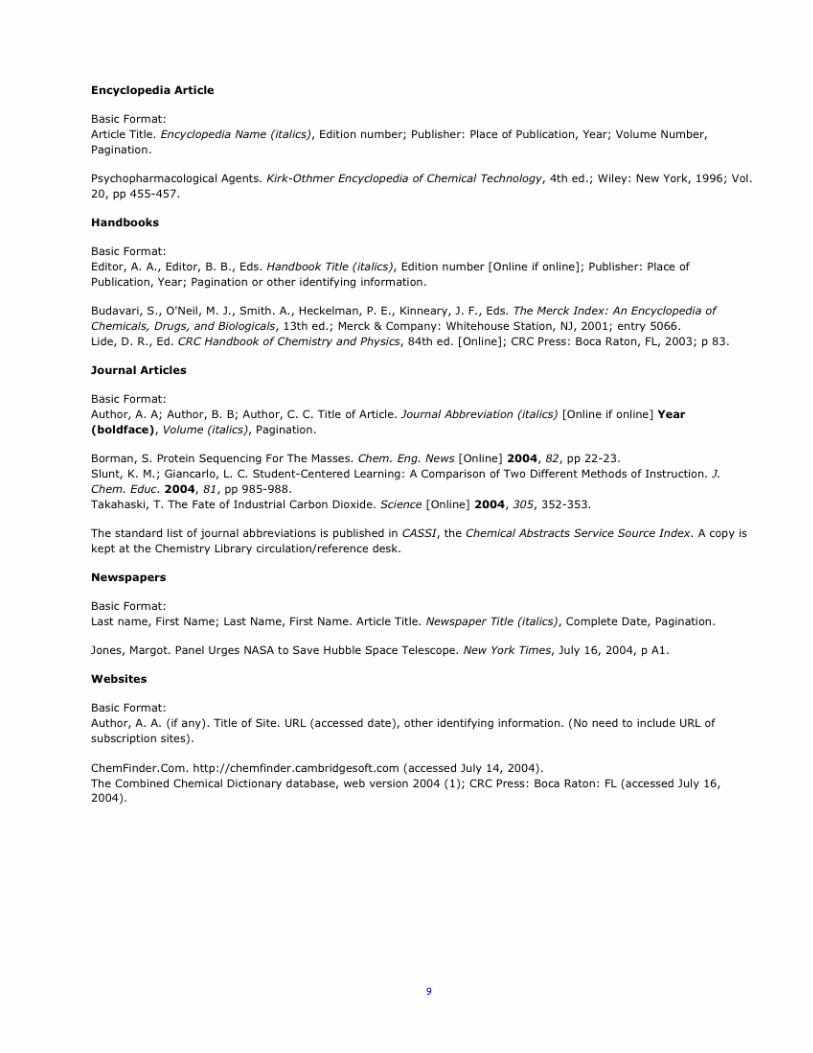
Lab Manual Chemistry 201 L Page #
INTRODUCTION 1 Typical Laboratory Equipment 3 General Writing in the Science Lab
Technical Writing The Scientific Notebook Notebook Example The Scientific Report (General Format) ACS (American Chemical Society) Style Guidelines Quick Guide
4 4 5 6 7 8
Lab Notebook and Write-up 10 Experiment Lab Report, Write-up Criteria (Grading rubric) 13 Statistical Treatment of Experimental Measurements 14-16 Laboratory Safety Contract 17 Safety Quiz 18
ACTIVITIES 19 A-1 Concentration Conversion 21-22 A-2 Keeping a Laboratory Notebook and Writing up a Laboratory Report 23-26 A-3 Calibration Curves with Excel 27-32 A-4 Getting to Know Vernier 33-44 A-5 Kinetics and Mechanism 45-48 A-6 Chemical Equilibrium and Application of LeChatelier’s Principle 49-52 A-7 Acid - Base Chemistry 53-60 A-8 Titration of Weak Acid and Base 61-66 A-9 Thermodynamics 67-70 A-10 Oxidation-Reduction Equations 71-72 A-11 Electrochemistry (with Thermodynamics) 73-78 A-12 Coordination Chemistry Modeling 79-82 A-13 Basics of Radioactivity 83-88
EXPERIMENTS 89 E-1 Rate Law Determination of Crystal Violet Reaction 91-94 E-2 Chemical Equilibrium, Finding a Constant, Kf 95-98
E-3 Equilibrium and Le Châtelier's Principle 199-102 E-4 Titration curves of Strong and Weak Acids and Bases 103-104 E-5 Determination of the Molecular Weight and Acidity Constant of a Weak Acid 105-108 E-6 Preparation and Analysis of a Complex Nickel Salt Ni(en)x(H2O)6-2x]SO4 • Y H2O 109-113
E-7 Thermodynamics of Potassium Nitrate Dissolving in Water 115-122 E-8 Establishing a Reduction Potential Table for a Variety of Metals 123-126
APPENDIX 127 Practical Stoichiometry of a Redox Reaction 129-134
Apx-1 Caring and Handling of Chemicals 135 Apx-2 Measurement of Mass 135 Apx-3 Measurement of Volume 136-137 Apx-4 Titration Technique 138 Apx-5 Using the CARY UV-VIS Spectrometer 139 Apx-6 Electromagnetic Spectrum 140 Apx-7 Physical Properties of Water: Density and Vapor Pressure of Water 141 Apx-8 Acid-Base Indicators / Common Laboratory Acid/Base Solutions 142 Apx-9 Acid Dissociation Constants 143 Apx-10 Standard Reduction Potentials 144 Apx-11 Thermodynamic Quantities for Selected Substances 145-146 Apx-12 Logger Pro 3, Quick Reference 147-148 Apx-13 Miscellaneous Chemical Information and Equations 149-155

1
INTRODUCTION
INTRODUCTION
INTRODUCTION
INTRODUCTION

2
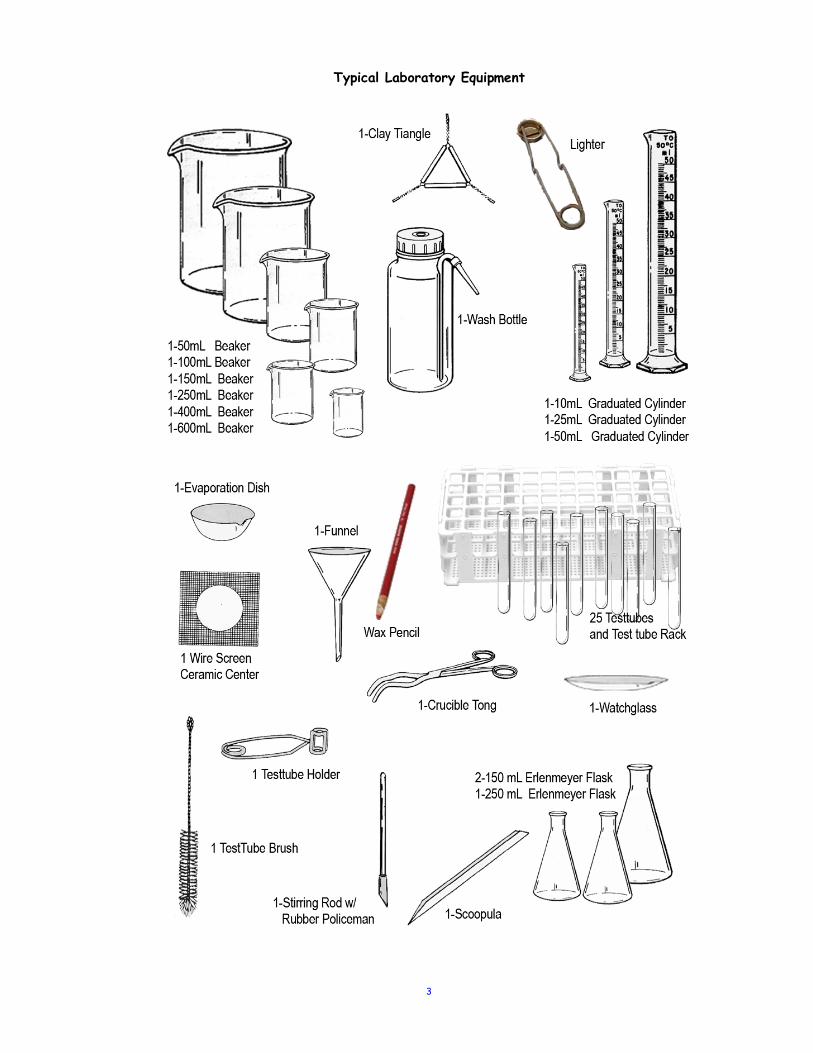
3
Typical Laboratory Equipment
4
General Writing in the Chemistry Lab
I. Resources and Style- Scientific writing is not limited to scientific journal articles. Scientists at every level are more likely to achieve success if they are able to describe their work and explain its significance to others. Technical writing can vary from a brief explanation of how to use a piece of equipment to a lengthy report on the activities in the laboratory. Technical writers produce articles written for the layman explaining technical subjects in understandable terms. Effective technical writing is a job skill that is very much in demand. College-level assignments that involve report writing on technical subjects require the same considerations as professional writing.
First, consider the audience. Will a skilled professional or a layman read the material? In this case it will be your instructor, (consider him/her a skilled professional) but never assume however that your instructor is familiar with the basic principles of the field being covered; you must include some basic background information, with special attention given to explaining technical vocabulary that is specific for the topic being discussed.
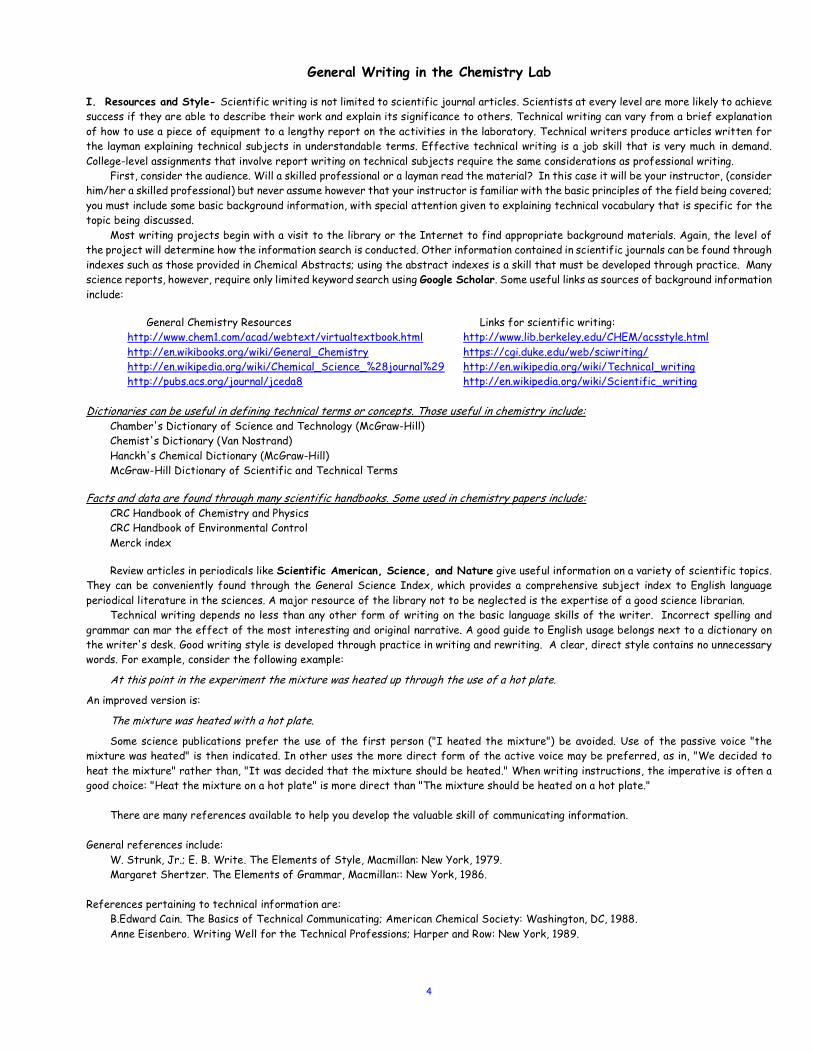
Most writing projects begin with a visit to the library or the Internet to find appropriate background materials. Again, the level of the project will determine how the information search is conducted. Other information contained in scientific journals can be found through indexes such as those provided in Chemical Abstracts; using the abstract indexes is a skill that must be developed through practice. Many science reports, however, require only limited keyword search using Google Scholar. Some useful links as sources of background information include:
General Chemistry Resources http://www.chem1.com/acad/webtext/virtualtextbook.html http://en.wikibooks.org/wiki/General_Chemistry http://en.wikipedia.org/wiki/Chemical_Science_%28journal%29 http://pubs.acs.org/journal/jceda8
Links for scientific writing: http://www.lib.berkeley.edu/CHEM/acsstyle.html https://cgi.duke.edu/web/sciwriting/ http://en.wikipedia.org/wiki/Technical_writing http://en.wikipedia.org/wiki/Scientific_writing
Dictionaries can be useful in defining technical terms or concepts. Those useful in chemistry include: Chamber's Dictionary of Science and Technology (McGraw-Hill) Chemist's Dictionary (Van Nostrand) Hanckh's Chemical Dictionary (McGraw-Hill) McGraw-Hill Dictionary of Scientific and Technical Terms
Facts and data are found through many scientific handbooks. Some used in chemistry papers include: CRC Handbook of Chemistry and Physics CRC Handbook of Environmental Control Merck index Review articles in periodicals like Scientific American, Science, and Nature give useful information on a variety of scientific topics.
They can be conveniently found through the General Science Index, which provides a comprehensive subject index to English language periodical literature in the sciences. A major resource of the library not to be neglected is the expertise of a good science librarian.
Technical writing depends no less than any other form of writing on the basic language skills of the writer. Incorrect spelling and grammar can mar the effect of the most interesting and original narrative. A good guide to English usage belongs next to a dictionary on the writer's desk. Good writing style is developed through practice in writing and rewriting. A clear, direct style contains no unnecessary words. For example, consider the following example:
At this point in the experiment the mixture was heated up through the use of a hot plate.
An improved version is:
The mixture was heated with a hot plate.
Some science publications prefer the use of the first person ("I heated the mixture") be avoided. Use of the passive voice "the mixture was heated" is then indicated. In other uses the more direct form of the active voice may be preferred, as in, "We decided to heat the mixture" rather than, "It was decided that the mixture should be heated." When writing instructions, the imperative is often a good choice: "Heat the mixture on a hot plate" is more direct than "The mixture should be heated on a hot plate."
There are many references available to help you develop the valuable skill of communicating information.
General references include:
W. Strunk, Jr.; E. B. Write. The Elements of Style, Macmillan: New York, 1979. Margaret Shertzer. The Elements of Grammar, Macmillan:: New York, 1986.
References pertaining to technical information are: B.Edward Cain. The Basics of Technical Communicating; American Chemical Society: Washington, DC, 1988. Anne Eisenbero. Writing Well for the Technical Professions; Harper and Row: New York, 1989.
5
II. Keeping up with the Laboratory Notebook: "A laboratory notebook is one of a scientist’s most valuable tools. It contains the permanent written record of the researcher’s mental and physical activities for experiment and observation, to the ultimate understanding of physical phenomena. The act of writing in the notebook causes the scientist to stop and think about what is being done in the laboratory. It is in this way an essential part of doing good science." “The foremost reason for using a bound notebook rather than a loose-leaf binder or spiral notebook is that the pages are permanently and strongly attached together. The date of a particular entry is less subject to question if notes are recorded in a chronological order with no blank or missing parts. The industrial researcher, whose work may lead to patents, has no choice except to use a bound notebook for all laboratory note taking." Most Chem-201 students will be using LabArchives. The procedure of documenting lab work using LabArchives is no different that of a laboratory notebook described in the previous paragraph. The only difference is that it is in a digital format. From Writing the Laboratory Notebook by Howard M. Kanare; American Chemical Society 1985 The scientific notebook is the scientist's own record of experiments performed and phenomena observed. Beginning with the first student laboratory report there are special requirements for recording experimental results. The requirements may seem rigid at first, but they are very understandable in light of the purposes of the notebook.
For the professional scientist the claim to original work is found in the scientific notebook. Millions of dollars in patent rights may depend on the existence of a properly dated and authenticated scientific notebook. Many of the rules that are followed in recording data follow from this important function of the notebook. Nothing is ever erased; and incorrect reading is crossed out and the correct one written beside it. Work is recorded in a bound notebook with pages that cannot be removed or added. Every entry is dated, signed, and countersigned by the scientist in charge of the laboratory. All these rules are designed to produce a record that will constitute proof not only of what experiments were performed, but of the exact date. This is important, because if two scientists make the same discovery, the first one to do so will gain all the legal rights and most of the credit for the work. Obviously, it is more important to have a complete and original record than a perfectly neat one. A few crossed-out readings are not uncommon, and a few blots from spilled chemicals are not unheard of either. These are preferable in the laboratory notebook to a perfect page that has been copied over at a later date and no longer constitutes an authentic original record. Under no circumstances is data to be recorded on loose paper rather than directly into the notebook! If you write your data or observations on loose pieces of paper, at best you lose 5pts or up to 20% per violation and at most you will receive zero for that day's lab technique grade. Another important function of the notebook is to record the procedure and observations so clearly and completely that the experiment can easily be repeated at a later date. Experiments that cannot be repeated by the same researcher or by other laboratories are soon discredited. For the student in the laboratory, complete notes are important as well. If something goes wrong, it should be possible to find the error in procedure from the lab notebook. At times, the numbers in the crossed-out data entries tell an interesting story. Occasionally an interesting and unexpected phenomenon will be observed that merits further study. Keeping a complete clear record of what has happened in the laboratory is essential. In order to keep a complete record, each experiment entered into the notebook should include certain features. On each page entry, the scientist's name and the date should be entered. The title of the experiment being performed is an important element that is often neglected. "Chemistry Lab" is an inadequate substitute for the experiment title, which is usually readily available. Often it is useful to begin by writing the objective, or the purpose, of the experiment. Stating the objective clearly helps both the experimenter and the reader of the notebook to understand the experiment. A complete record of experimental procedure is essential, either as a step-by-step description or a pictorial flowchart followed by a complete reference to a standard experimental procedure. If a standard procedure is given, great care must be made to note any deviations from that procedure. A list of materials and equipment used can be a great help in organization if it is included as a part of the experimental procedure. Finally, a description of any safety or hazardous guidelines should be included. Though the laboratory notebook does not have to be perfectly pristine, it is certainly desirable that it should be as organized as possible. Some time and thought spent in planning before the laboratory period begins will result in a better notebook and a more successful experiment. As mentioned above, the date, title, experimenter's name and objective of the experiment should be entered before the experiment begins. If the experimental procedure that has been provided does not already give labeled data tables for an experiment, it is worth some time and thought to set up such tables before entering the laboratory, rather than waste time during the experiment deciding how to do so. Ample space should be provided not only for the expected data, but also for corrections and notes. Unused space can be crossed out later as necessary, though extra pages are never torn out. Sometimes only the right-hand pages of the notebook are used, leaving the other pages free for later notes or calculations. Individual research laboratories or student laboratories may have standard notebooks or forms in which to write laboratory results. All of them share the basic objective of recording in a useful way the scientist's actions, observations, and thoughts while in the laboratory.
6
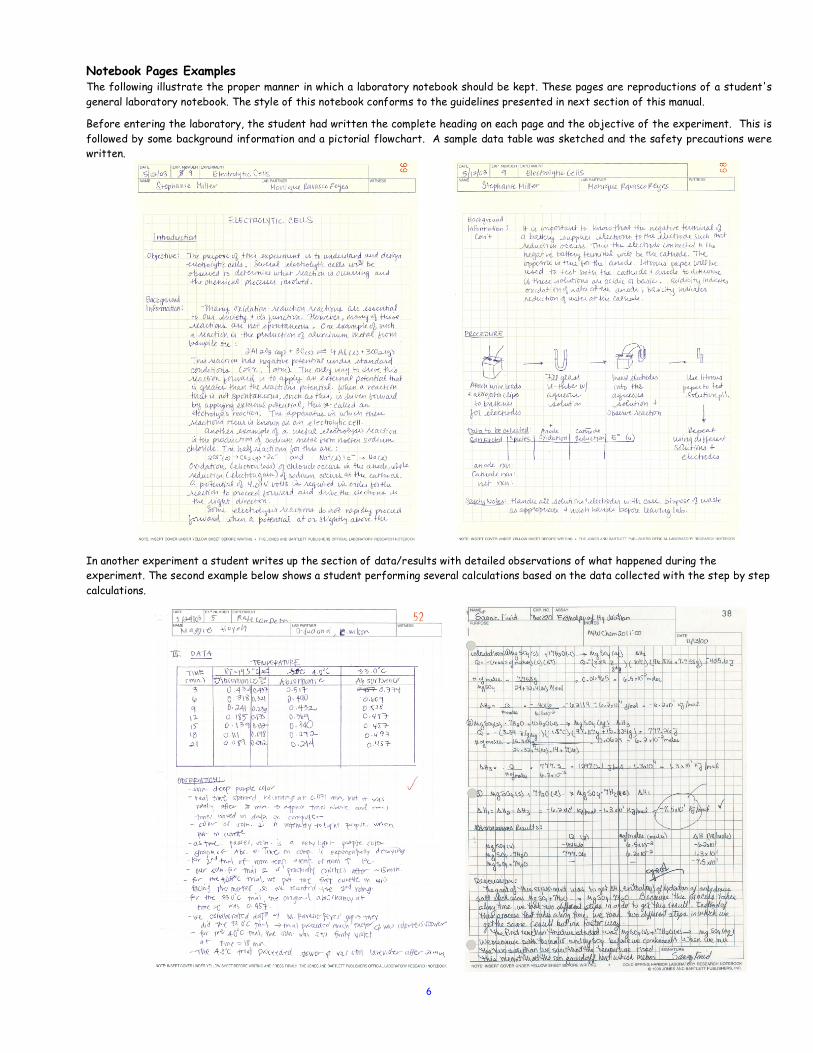
Notebook Pages Examples The following illustrate the proper manner in which a laboratory notebook should be kept. These pages are reproductions of a student's general laboratory notebook. The style of this notebook conforms to the guidelines presented in next section of this manual.
Before entering the laboratory, the student had written the complete heading on each page and the objective of the experiment. This is followed by some background information and a pictorial flowchart. A sample data table was sketched and the safety precautions were written.
In another experiment a student writes up the section of data/results with detailed observations of what happened during the experiment. The second example below shows a student performing several calculations based on the data collected with the step by step calculations.
7
III. The Chemistry Report (Formal)
When the scientist prepares a formal written report of experiments performed in the laboratory, the report follows a generally accepted outline. Introduction, results and discussion/conclusions follow in order as separate sections and these are clearly labeled. Lists of references and even the title are treated in standard ways. All this is typed in a journal type format.
The Title of a scientific paper is seldom an occasion for creativity. Titles for articles in scientific journals are carefully constructed
from words that will be useful key words for information searches by computer. Titles for student laboratory reports are usually indicated in the assignment. As with the laboratory notebook, "Chemistry Laboratory" is unacceptably vague as a laboratory report title. Abbreviations as part of a title should be avoided.
The Introduction section should make clear to the reader the purpose and the background of the experiment. The objective of the
work that is being discussed should always be clearly stated. It may be appropriate to discuss the basis of the experimental methods that were used as well as the scientific theory on which the work is based. Usually a well-written introduction makes use of written resources in the form of scientific books and papers, which must be listed in the references cited and footnoted with the appropriate reference.
The Experimental Procedure section explains in detail exactly how the experiment was conducted. It should be possible to reproduce
the experiment using the information found in this section. If standard procedures are used and not explained in detail, a reference should be given. A list of materials and equipment is often a useful component in this section. It includes all chemicals used, including the concentrations of solutions and all special equipment.
The Results section includes the data that were obtained in the experiment together with an explanation of the data. Often it is
useful to organize the results of the experiment in tables, and sometimes graphs are required as well. All tables and figures should be titled and numbered. All columns in tables and axes of graphs, should be carefully labeled, not omitting units. If calculations have been performed, the equations used should be clearly indicated and enough information about the calculations should be included so that they can be clearly followed. The precision and accuracy of the results should be calculated by standard statistical methods if appropriate to the experiment.
The Discussion / Conclusions section contains the thoughts of the experimenter about the significance of the work performed. Each
part of the experiment should be discussed. Numerical results should be evaluated, and the meaning of any statistical calculations explained. The success of the experiment should be evaluated by referring to the objective of the experiment as presented in the introduction. Was the experiment successful? Were the objectives met? What is the overall significance of the experiment?
The Literature Cited section lists all the references used in preparing the report. This section is the most formal in its format. It
is important to adhere to the style used. Each scientific journal has a slightly different style that contributors must follow to the letter. Student reports may also be required to follow a certain form. The best way to write this section is with the help of an example. Often college courses use scientific journals as models. The Journal of Chemical Education, Analytical Chemistry and the Journal of the American Chemical Society are examples of chemical journals that have been used in this way; the Journal of Organic Chemistry is often used in organic chemistry courses. When giving references, it is important to notice carefully all words that are set in italics or boldface in the example references. Typesetters use different fonts for italics and boldface that are difficult to reproduce when typing or handwriting, though many word-processing programs are able to reproduce them. Words that are set in italics can be indicated by an underline. Boldface can be represented by a wavy underline.
Typically, a reference to a book appears as follows: Reid R.C.; Sherwood T.K. Prausnitz J. M. Properties of Gases & Liquids; McGraw Hill: NY. 1977
A reference to a scientific journal follows this general form:
Lee L.G.; Whiteside G.M., J. Am. Chem. Soc. 1985, 107, 6999.
An example of a laboratory notebook http://www.uic.edu/classes/chem/clandrie/CHEM112/syllabus/syllabus.html#example http://www.dartmouth.edu/~chemlab/info/notebooks/sample.html http://www.rod.beavon.clara.net/lab_book.htm http://www.chem.purdue.edu/courses/chm25701/reports.html
8
9
10
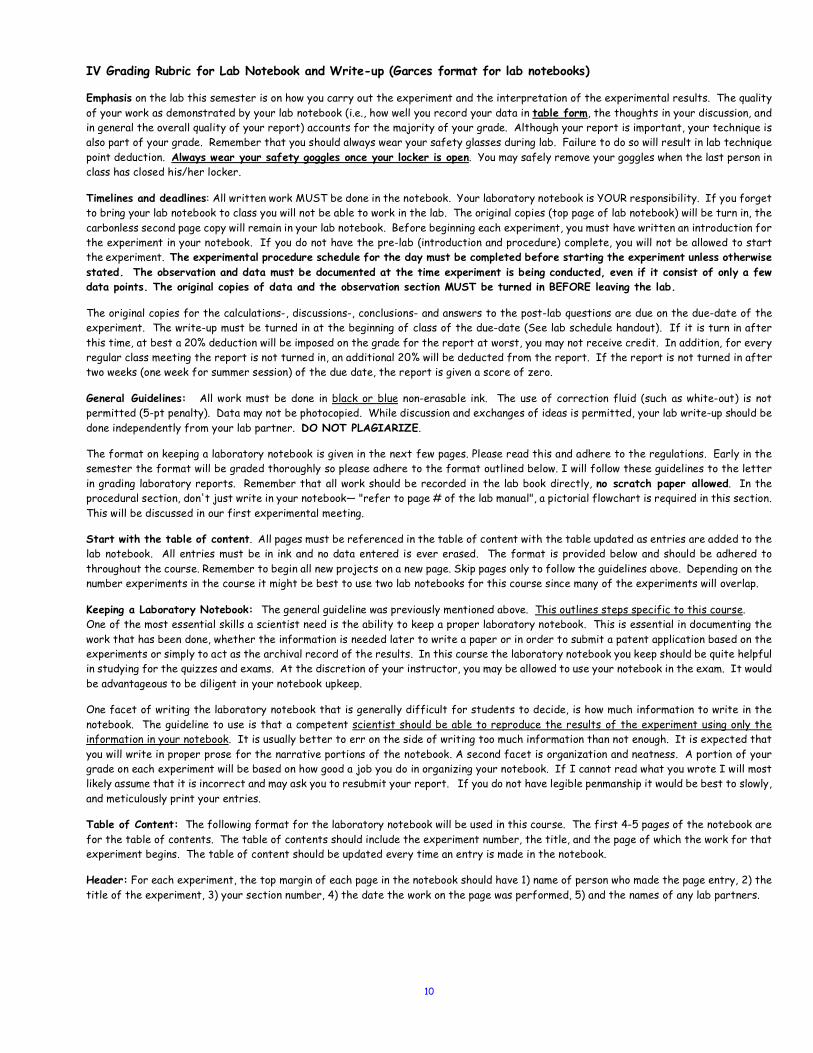
IV Grading Rubric for Lab Notebook and Write-up (Garces format for lab notebooks)
Emphasis on the lab this semester is on how you carry out the experiment and the interpretation of the experimental results. The quality of your work as demonstrated by your lab notebook (i.e., how well you record your data in table form, the thoughts in your discussion, and in general the overall quality of your report) accounts for the majority of your grade. Although your report is important, your technique is also part of your grade. Remember that you should always wear your safety glasses during lab. Failure to do so will result in lab technique point deduction. Always wear your safety goggles once your locker is open. You may safely remove your goggles when the last person in class has closed his/her locker.
Timelines and deadlines: All written work MUST be done in the notebook. Your laboratory notebook is YOUR responsibility. If you forget to bring your lab notebook to class you will not be able to work in the lab. The original copies (top page of lab notebook) will be turn in, the carbonless second page copy will remain in your lab notebook. Before beginning each experiment, you must have written an introduction for the experiment in your notebook. If you do not have the pre-lab (introduction and procedure) complete, you will not be allowed to start the experiment. The experimental procedure schedule for the day must be completed before starting the experiment unless otherwise stated. The observation and data must be documented at the time experiment is being conducted, even if it consist of only a few data points. The original copies of data and the observation section MUST be turned in BEFORE leaving the lab.
The original copies for the calculations-, discussions-, conclusions- and answers to the post-lab questions are due on the due-date of the experiment. The write-up must be turned in at the beginning of class of the due-date (See lab schedule handout). If it is turn in after this time, at best a 20% deduction will be imposed on the grade for the report at worst, you may not receive credit. In addition, for every regular class meeting the report is not turned in, an additional 20% will be deducted from the report. If the report is not turned in after two weeks (one week for summer session) of the due date, the report is given a score of zero.
General Guidelines: All work must be done in black or blue non-erasable ink. The use of correction fluid (such as white-out) is not permitted (5-pt penalty). Data may not be photocopied. While discussion and exchanges of ideas is permitted, your lab write-up should be done independently from your lab partner. DO NOT PLAGIARIZE.
The format on keeping a laboratory notebook is given in the next few pages. Please read this and adhere to the regulations. Early in the semester the format will be graded thoroughly so please adhere to the format outlined below. I will follow these guidelines to the letter in grading laboratory reports. Remember that all work should be recorded in the lab book directly, no scratch paper allowed. In the procedural section, don't just write in your notebook— "refer to page # of the lab manual", a pictorial flowchart is required in this section. This will be discussed in our first experimental meeting.
Start with the table of content. All pages must be referenced in the table of content with the table updated as entries are added to the lab notebook. All entries must be in ink and no data entered is ever erased. The format is provided below and should be adhered to throughout the course. Remember to begin all new projects on a new page. Skip pages only to follow the guidelines above. Depending on the number experiments in the course it might be best to use two lab notebooks for this course since many of the experiments will overlap.
Keeping a Laboratory Notebook: The general guideline was previously mentioned above. This outlines steps specific to this course. One of the most essential skills a scientist need is the ability to keep a proper laboratory notebook. This is essential in documenting the work that has been done, whether the information is needed later to write a paper or in order to submit a patent application based on the experiments or simply to act as the archival record of the results. In this course the laboratory notebook you keep should be quite helpful in studying for the quizzes and exams. At the discretion of your instructor, you may be allowed to use your notebook in the exam. It would be advantageous to be diligent in your notebook upkeep.
One facet of writing the laboratory notebook that is generally difficult for students to decide, is how much information to write in the notebook. The guideline to use is that a competent scientist should be able to reproduce the results of the experiment using only the information in your notebook. It is usually better to err on the side of writing too much information than not enough. It is expected that you will write in proper prose for the narrative portions of the notebook. A second facet is organization and neatness. A portion of your grade on each experiment will be based on how good a job you do in organizing your notebook. If I cannot read what you wrote I will most likely assume that it is incorrect and may ask you to resubmit your report. If you do not have legible penmanship it would be best to slowly, and meticulously print your entries.
Table of Content: The following format for the laboratory notebook will be used in this course. The first 4-5 pages of the notebook are for the table of contents. The table of contents should include the experiment number, the title, and the page of which the work for that experiment begins. The table of content should be updated every time an entry is made in the notebook.
Header: For each experiment, the top margin of each page in the notebook should have 1) name of person who made the page entry, 2) the title of the experiment, 3) your section number, 4) the date the work on the page was performed, 5) and the names of any lab partners.
11
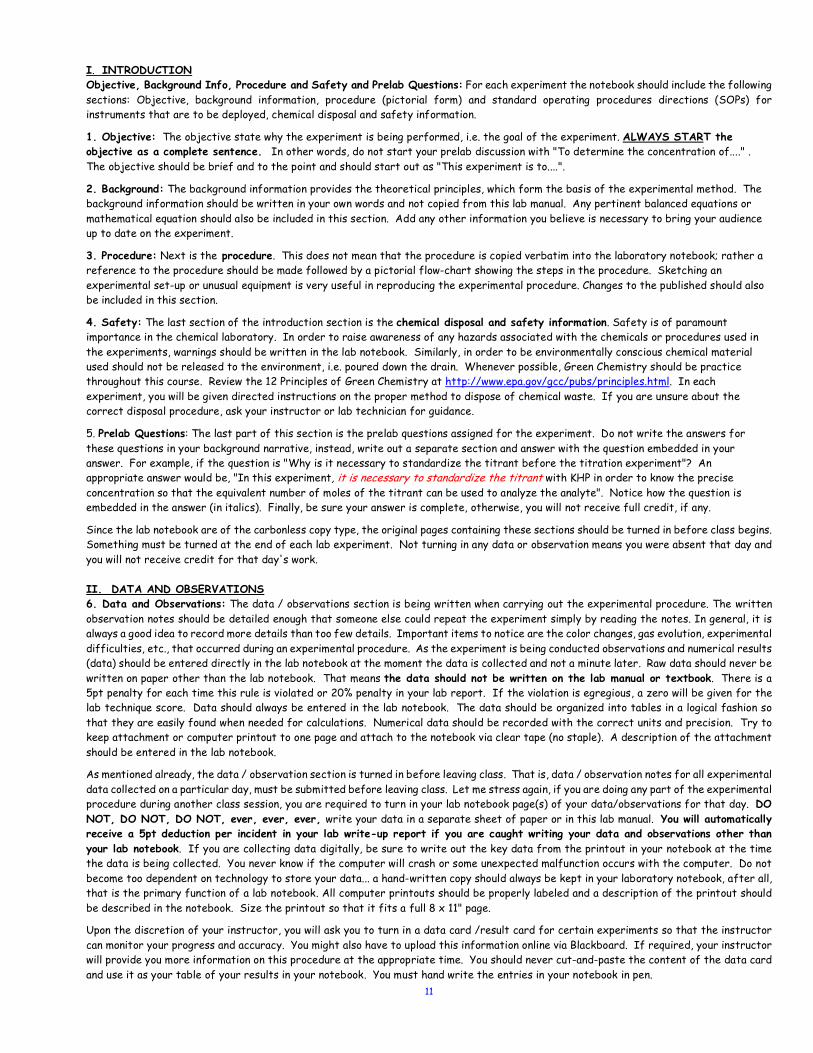
I. INTRODUCTION Objective, Background Info, Procedure and Safety and Prelab Questions: For each experiment the notebook should include the following sections: Objective, background information, procedure (pictorial form) and standard operating procedures directions (SOPs) for instruments that are to be deployed, chemical disposal and safety information.
1. Objective: The objective state why the experiment is being performed, i.e. the goal of the experiment. ALWAYS START the objective as a complete sentence. In other words, do not start your prelab discussion with "To determine the concentration of...." . The objective should be brief and to the point and should start out as "This experiment is to....".
2. Background: The background information provides the theoretical principles, which form the basis of the experimental method. The background information should be written in your own words and not copied from this lab manual. Any pertinent balanced equations or mathematical equation should also be included in this section. Add any other information you believe is necessary to bring your audience up to date on the experiment.
3. Procedure: Next is the procedure. This does not mean that the procedure is copied verbatim into the laboratory notebook; rather a reference to the procedure should be made followed by a pictorial flow-chart showing the steps in the procedure. Sketching an experimental set-up or unusual equipment is very useful in reproducing the experimental procedure. Changes to the published should also be included in this section.
4. Safety: The last section of the introduction section is the chemical disposal and safety information. Safety is of paramount importance in the chemical laboratory. In order to raise awareness of any hazards associated with the chemicals or procedures used in the experiments, warnings should be written in the lab notebook. Similarly, in order to be environmentally conscious chemical material used should not be released to the environment, i.e. poured down the drain. Whenever possible, Green Chemistry should be practice throughout this course. Review the 12 Principles of Green Chemistry at http://www.epa.gov/gcc/pubs/principles.html. In each experiment, you will be given directed instructions on the proper method to dispose of chemical waste. If you are unsure about the correct disposal procedure, ask your instructor or lab technician for guidance.
5. Prelab Questions: The last part of this section is the prelab questions assigned for the experiment. Do not write the answers for these questions in your background narrative, instead, write out a separate section and answer with the question embedded in your answer. For example, if the question is "Why is it necessary to standardize the titrant before the titration experiment"? An appropriate answer would be, "In this experiment, it is necessary to standardize the titrant with KHP in order to know the precise concentration so that the equivalent number of moles of the titrant can be used to analyze the analyte". Notice how the question is embedded in the answer (in italics). Finally, be sure your answer is complete, otherwise, you will not receive full credit, if any.
Since the lab notebook are of the carbonless copy type, the original pages containing these sections should be turned in before class begins. Something must be turned at the end of each lab experiment. Not turning in any data or observation means you were absent that day and you will not receive credit for that day's work.
II. DATA AND OBSERVATIONS 6. Data and Observations: The data / observations section is being written when carrying out the experimental procedure. The written observation notes should be detailed enough that someone else could repeat the experiment simply by reading the notes. In general, it is always a good idea to record more details than too few details. Important items to notice are the color changes, gas evolution, experimental difficulties, etc., that occurred during an experimental procedure. As the experiment is being conducted observations and numerical results (data) should be entered directly in the lab notebook at the moment the data is collected and not a minute later. Raw data should never be written on paper other than the lab notebook. That means the data should not be written on the lab manual or textbook. There is a 5pt penalty for each time this rule is violated or 20% penalty in your lab report. If the violation is egregious, a zero will be given for the lab technique score. Data should always be entered in the lab notebook. The data should be organized into tables in a logical fashion so that they are easily found when needed for calculations. Numerical data should be recorded with the correct units and precision. Try to keep attachment or computer printout to one page and attach to the notebook via clear tape (no staple). A description of the attachment should be entered in the lab notebook.
As mentioned already, the data / observation section is turned in before leaving class. That is, data / observation notes for all experimental data collected on a particular day, must be submitted before leaving class. Let me stress again, if you are doing any part of the experimental procedure during another class session, you are required to turn in your lab notebook page(s) of your data/observations for that day. DO NOT, DO NOT, DO NOT, ever, ever, ever, write your data in a separate sheet of paper or in this lab manual. You will automatically receive a 5pt deduction per incident in your lab write-up report if you are caught writing your data and observations other than your lab notebook. If you are collecting data digitally, be sure to write out the key data from the printout in your notebook at the time the data is being collected. You never know if the computer will crash or some unexpected malfunction occurs with the computer. Do not become too dependent on technology to store your data... a hand-written copy should always be kept in your laboratory notebook, after all, that is the primary function of a lab notebook. All computer printouts should be properly labeled and a description of the printout should be described in the notebook. Size the printout so that it fits a full 8 x 11" page.
Upon the discretion of your instructor, you will ask you to turn in a data card /result card for certain experiments so that the instructor can monitor your progress and accuracy. You might also have to upload this information online via Blackboard. If required, your instructor will provide you more information on this procedure at the appropriate time. You should never cut-and-paste the content of the data card and use it as your table of your results in your notebook. You must hand write the entries in your notebook in pen.
12
III. RESULTS, CALCULATIONS AND DISCUSSION
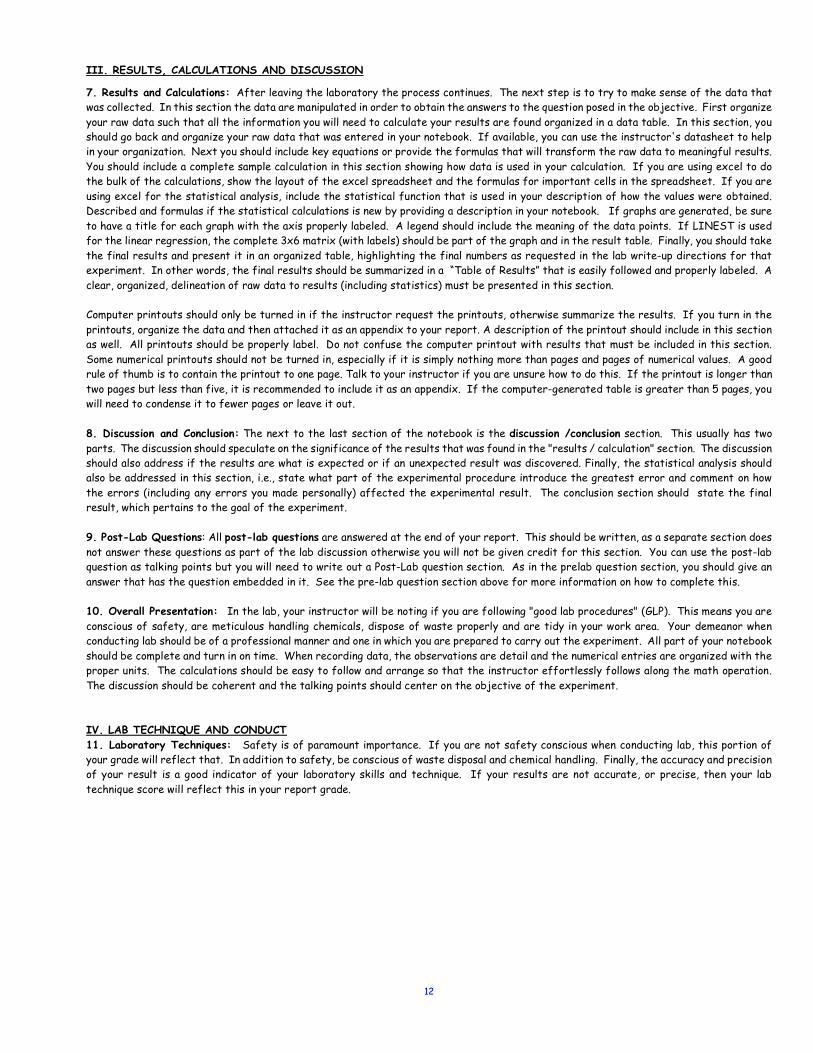
7. Results and Calculations: After leaving the laboratory the process continues. The next step is to try to make sense of the data that was collected. In this section the data are manipulated in order to obtain the answers to the question posed in the objective. First organize your raw data such that all the information you will need to calculate your results are found organized in a data table. In this section, you should go back and organize your raw data that was entered in your notebook. If available, you can use the instructor's datasheet to help in your organization. Next you should include key equations or provide the formulas that will transform the raw data to meaningful results. You should include a complete sample calculation in this section showing how data is used in your calculation. If you are using excel to do the bulk of the calculations, show the layout of the excel spreadsheet and the formulas for important cells in the spreadsheet. If you are using excel for the statistical analysis, include the statistical function that is used in your description of how the values were obtained. Described and formulas if the statistical calculations is new by providing a description in your notebook. If graphs are generated, be sure to have a title for each graph with the axis properly labeled. A legend should include the meaning of the data points. If LINEST is used for the linear regression, the complete 3x6 matrix (with labels) should be part of the graph and in the result table. Finally, you should take the final results and present it in an organized table, highlighting the final numbers as requested in the lab write-up directions for that experiment. In other words, the final results should be summarized in a “Table of Results” that is easily followed and properly labeled. A clear, organized, delineation of raw data to results (including statistics) must be presented in this section. Computer printouts should only be turned in if the instructor request the printouts, otherwise summarize the results. If you turn in the printouts, organize the data and then attached it as an appendix to your report. A description of the printout should include in this section as well. All printouts should be properly label. Do not confuse the computer printout with results that must be included in this section. Some numerical printouts should not be turned in, especially if it is simply nothing more than pages and pages of numerical values. A good rule of thumb is to contain the printout to one page. Talk to your instructor if you are unsure how to do this. If the printout is longer than two pages but less than five, it is recommended to include it as an appendix. If the computer-generated table is greater than 5 pages, you will need to condense it to fewer pages or leave it out. 8. Discussion and Conclusion: The next to the last section of the notebook is the discussion /conclusion section. This usually has two parts. The discussion should speculate on the significance of the results that was found in the "results / calculation" section. The discussion should also address if the results are what is expected or if an unexpected result was discovered. Finally, the statistical analysis should also be addressed in this section, i.e., state what part of the experimental procedure introduce the greatest error and comment on how the errors (including any errors you made personally) affected the experimental result. The conclusion section should state the final result, which pertains to the goal of the experiment. 9. Post-Lab Questions: All post-lab questions are answered at the end of your report. This should be written, as a separate section does not answer these questions as part of the lab discussion otherwise you will not be given credit for this section. You can use the post-lab question as talking points but you will need to write out a Post-Lab question section. As in the prelab question section, you should give an answer that has the question embedded in it. See the pre-lab question section above for more information on how to complete this. 10. Overall Presentation: In the lab, your instructor will be noting if you are following "good lab procedures" (GLP). This means you are conscious of safety, are meticulous handling chemicals, dispose of waste properly and are tidy in your work area. Your demeanor when conducting lab should be of a professional manner and one in which you are prepared to carry out the experiment. All part of your notebook should be complete and turn in on time. When recording data, the observations are detail and the numerical entries are organized with the proper units. The calculations should be easy to follow and arrange so that the instructor effortlessly follows along the math operation. The discussion should be coherent and the talking points should center on the objective of the experiment. IV. LAB TECHNIQUE AND CONDUCT 11. Laboratory Techniques: Safety is of paramount importance. If you are not safety conscious when conducting lab, this portion of your grade will reflect that. In addition to safety, be conscious of waste disposal and chemical handling. Finally, the accuracy and precision of your result is a good indicator of your laboratory skills and technique. If your results are not accurate, or precise, then your lab technique score will reflect this in your report grade.
13
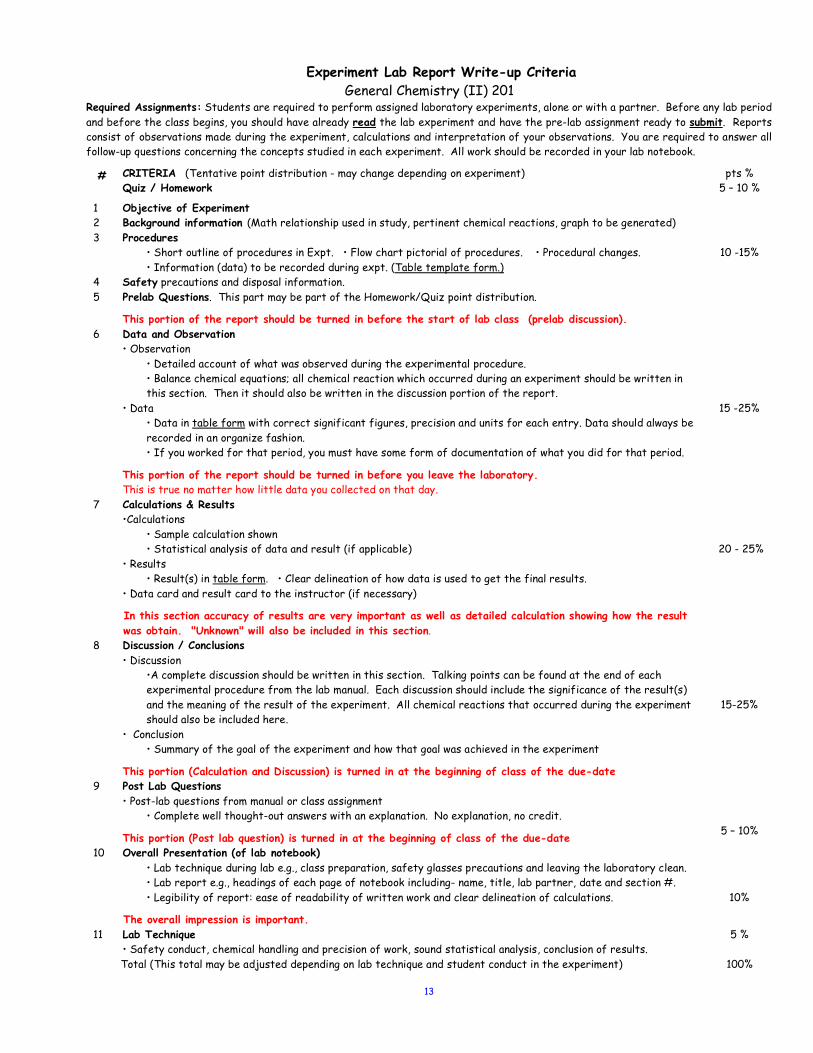
Experiment Lab Report Write-up Criteria General Chemistry (II) 201
Required Assignments: Students are required to perform assigned laboratory experiments, alone or with a partner. Before any lab period and before the class begins, you should have already read the lab experiment and have the pre-lab assignment ready to submit. Reports consist of observations made during the experiment, calculations and interpretation of your observations. You are required to answer all follow-up questions concerning the concepts studied in each experiment. All work should be recorded in your lab notebook.
# CRITERIA (Tentative point distribution - may change depending on experiment) pts % Quiz / Homework 5 – 10 %
1 2 3 4 5
Objective of Experiment Background information (Math relationship used in study, pertinent chemical reactions, graph to be generated) Procedures • Short outline of procedures in Expt. • Flow chart pictorial of procedures. • Procedural changes. • Information (data) to be recorded during expt. (Table template form.) Safety precautions and disposal information. Prelab Questions. This part may be part of the Homework/Quiz point distribution.
This portion of the report should be turned in before the start of lab class (prelab discussion).
10 -15%
6 Data and Observation • Observation • Detailed account of what was observed during the experimental procedure. • Balance chemical equations; all chemical reaction which occurred during an experiment should be written in
this section. Then it should also be written in the discussion portion of the report. • Data • Data in table form with correct significant figures, precision and units for each entry. Data should always be
recorded in an organize fashion. • If you worked for that period, you must have some form of documentation of what you did for that period.
This portion of the report should be turned in before you leave the laboratory. This is true no matter how little data you collected on that day.
15 -25%
7 Calculations & Results •Calculations • Sample calculation shown
• Statistical analysis of data and result (if applicable) • Results • Result(s) in table form. • Clear delineation of how data is used to get the final results. • Data card and result card to the instructor (if necessary)
In this section accuracy of results are very important as well as detailed calculation showing how the result was obtain. "Unknown" will also be included in this section.
20 - 25%
8 Discussion / Conclusions • Discussion •A complete discussion should be written in this section. Talking points can be found at the end of each
experimental procedure from the lab manual. Each discussion should include the significance of the result(s) and the meaning of the result of the experiment. All chemical reactions that occurred during the experiment should also be included here.
• Conclusion • Summary of the goal of the experiment and how that goal was achieved in the experiment
This portion (Calculation and Discussion) is turned in at the beginning of class of the due-date
15-25%
9 Post Lab Questions • Post-lab questions from manual or class assignment • Complete well thought-out answers with an explanation. No explanation, no credit.
This portion (Post lab question) is turned in at the beginning of class of the due-date
5 – 10%
10 Overall Presentation (of lab notebook) • Lab technique during lab e.g., class preparation, safety glasses precautions and leaving the laboratory clean. • Lab report e.g., headings of each page of notebook including- name, title, lab partner, date and section #. • Legibility of report: ease of readability of written work and clear delineation of calculations.
The overall impression is important.
10%
11 Lab Technique • Safety conduct, chemical handling and precision of work, sound statistical analysis, conclusion of results.
5 %
Total (This total may be adjusted depending on lab technique and student conduct in the experiment) 100%
14
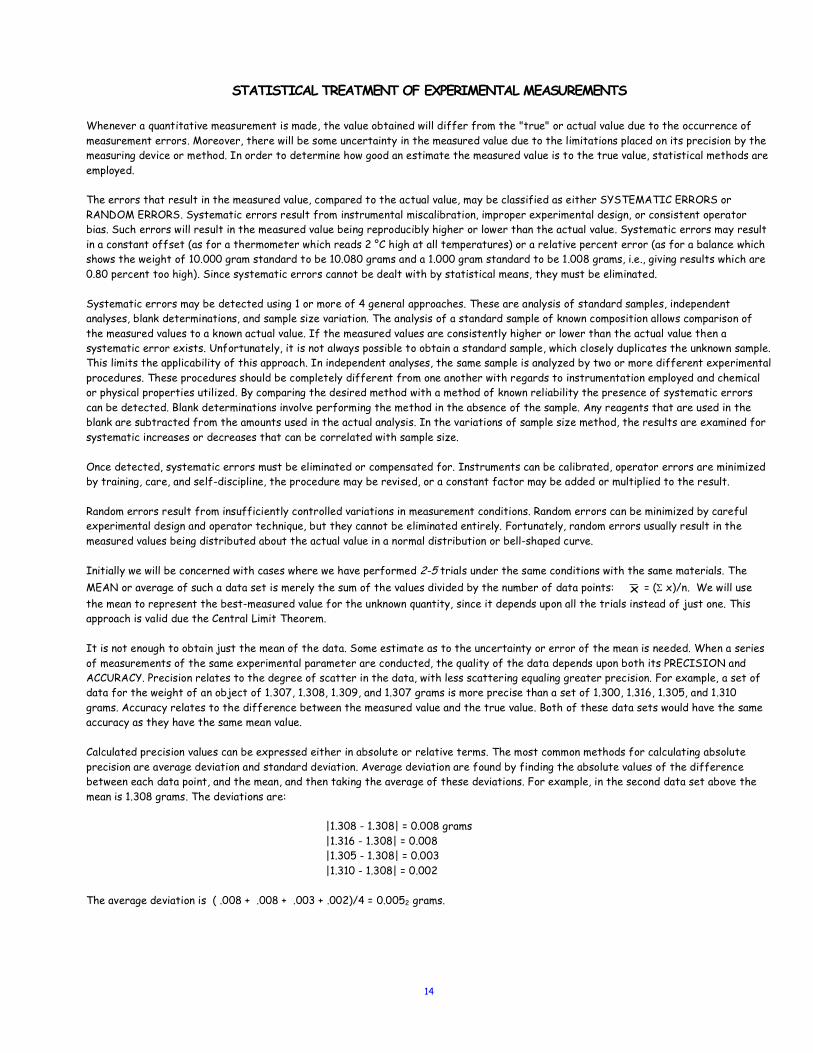
STATISTICAL TREATMENT OF EXPERIMENTAL MEASUREMENTS
Whenever a quantitative measurement is made, the value obtained will differ from the "true" or actual value due to the occurrence of measurement errors. Moreover, there will be some uncertainty in the measured value due to the limitations placed on its precision by the measuring device or method. In order to determine how good an estimate the measured value is to the true value, statistical methods are employed. The errors that result in the measured value, compared to the actual value, may be classified as either SYSTEMATIC ERRORS or RANDOM ERRORS. Systematic errors result from instrumental miscalibration, improper experimental design, or consistent operator bias. Such errors will result in the measured value being reproducibly higher or lower than the actual value. Systematic errors may result in a constant offset (as for a thermometer which reads 2 °C high at all temperatures) or a relative percent error (as for a balance which shows the weight of 10.000 gram standard to be 10.080 grams and a 1.000 gram standard to be 1.008 grams, i.e., giving results which are 0.80 percent too high). Since systematic errors cannot be dealt with by statistical means, they must be eliminated. Systematic errors may be detected using 1 or more of 4 general approaches. These are analysis of standard samples, independent analyses, blank determinations, and sample size variation. The analysis of a standard sample of known composition allows comparison of the measured values to a known actual value. If the measured values are consistently higher or lower than the actual value then a systematic error exists. Unfortunately, it is not always possible to obtain a standard sample, which closely duplicates the unknown sample. This limits the applicability of this approach. In independent analyses, the same sample is analyzed by two or more different experimental procedures. These procedures should be completely different from one another with regards to instrumentation employed and chemical or physical properties utilized. By comparing the desired method with a method of known reliability the presence of systematic errors can be detected. Blank determinations involve performing the method in the absence of the sample. Any reagents that are used in the blank are subtracted from the amounts used in the actual analysis. In the variations of sample size method, the results are examined for systematic increases or decreases that can be correlated with sample size. Once detected, systematic errors must be eliminated or compensated for. Instruments can be calibrated, operator errors are minimized by training, care, and self-discipline, the procedure may be revised, or a constant factor may be added or multiplied to the result. Random errors result from insufficiently controlled variations in measurement conditions. Random errors can be minimized by careful experimental design and operator technique, but they cannot be eliminated entirely. Fortunately, random errors usually result in the measured values being distributed about the actual value in a normal distribution or bell-shaped curve. Initially we will be concerned with cases where we have performed 2-5 trials under the same conditions with the same materials. The MEAN or average of such a data set is merely the sum of the values divided by the number of data points: = (S x)/n. We will use the mean to represent the best-measured value for the unknown quantity, since it depends upon all the trials instead of just one. This approach is valid due the Central Limit Theorem. It is not enough to obtain just the mean of the data. Some estimate as to the uncertainty or error of the mean is needed. When a series of measurements of the same experimental parameter are conducted, the quality of the data depends upon both its PRECISION and ACCURACY. Precision relates to the degree of scatter in the data, with less scattering equaling greater precision. For example, a set of data for the weight of an object of 1.307, 1.308, 1.309, and 1.307 grams is more precise than a set of 1.300, 1.316, 1.305, and 1.310 grams. Accuracy relates to the difference between the measured value and the true value. Both of these data sets would have the same accuracy as they have the same mean value. Calculated precision values can be expressed either in absolute or relative terms. The most common methods for calculating absolute precision are average deviation and standard deviation. Average deviation are found by finding the absolute values of the difference between each data point, and the mean, and then taking the average of these deviations. For example, in the second data set above the mean is 1.308 grams. The deviations are: |1.308 - 1.308| = 0.008 grams |1.316 - 1.308| = 0.008 |1.305 - 1.308| = 0.003 |1.310 - 1.308| = 0.002 The average deviation is ( .008 + .008 + .003 + .002)/4 = 0.0052 grams.
x
15
In the real world we only rarely have a large number of measured values to work with. It is much more common to have 3-5 values. Moreover, for unknown samples the true value is not known. Another measure of the absolute precision is the standard deviation:
While this expression is the formal definition of s, it is easier to calculate it from the following formula:
It is often more informative to express precision in relative terms. Here we relate the size of the deviation to the magnitude of the measurement. An average deviation of 0.001 grams is a small uncertainty compared to a measured value of 10.000 grams but quite large compared to 0.010 grams. We calculate relative deviation according to the formula
(absolute precision ) x (factor) mean value
Thus for the above data set the relative precision expressed as a percentage is
We can also express relative deviation as parts per thousand (ppt) by making the factor 1000, parts per million (ppm) using a factor of 1,000,000, and so on. An alternate method for conveying the relative uncertainty in a value is to use the significant figure convention. Here we assume that all of the digits in a number are certain except the last one, which has an uncertainty of +1 unit. The significant figure convention is discussed in detail in your textbook. Accuracy may also be calculated in absolute or relative terms. Absolute error is the difference between the measured and the accepted values. Suppose the true or accepted value for the weight is 1.311 grams. Then the absolute error E is
E = 1.308 - 1.311 = - 0.003 grams
The relative error is found by an analogous calculation as was used for relative precision. Here the relative error is
Often we wish to express this as a percent error.
Example Suppose a student has dissolved solid NaOH in a 500 mL volumetric flask and then titrated it with standardized HCl in order to determine the molarity of the resulting basic solution. (This is necessary because NaOH (s) is hygroscopic and some of the mass of the solid used is undoubtedly H2O.) Three 25 mL aliquots of the basic solution were titrated using 12.75, 12.80, and 12.71 mL of 0.2000 M
HCl solution. Since the three experimental values for the molarity of the basic solution are 0.1020, 0.1024, and 0.1017 M.
The mean value is
The standard deviation of this data set is x values x2 values 0.1020 0.010404 0.1024 0.0104858 0.1017 0.0103429 S 0.3061 S2 0.0312327
σ =x − x#$%
&'(2
∑n − 1
σ =
x2∑( ) − x∑( )2/n
$
%&
'
()
n − 1
0.005grams x 1001.308 grams
= 0.4%
0.005grams x 1001.308 grams
= 0.4%
%error = (true value − experimental value)true value
"
#$$
%
&''∗100
MB =M
A x V
A
VB
X =0.1020 + 0.1024 + 0.1017( )
3= 0.1020 M
σx2 =
0.0312327( ) − 0.3061( )2/3
"
#$
%
&'
2= 1.4833•10−7
σx= 3.85•10−4
16
The relative standard deviation express in percent is: relativestddeviaion = ..01•3456
4.3474x100 = 0.38%
If the true value of the molarity is 0.1015 M, then the absolute error Dc is
Dc = (0.1015 - 0.1020)M = -0.0005 M
The percentage error is % error = [(0.1015 - 0.1020) / 0.1020] • 100 = -0.49 %
Sometimes in a data set there will be one value that appears to be anomalous, e.g., 15.25, 15.28, 15.30, and 16.34%. The first approach to this situation is to ascertain whether there is a valid experimental reason to delete this point, such as an error in calculation or a procedural error in the analysis itself. If this is not the case then the validity of the point can be established by using a Q-TEST:
If the absolute value of Q exceeds the value in Table 1 for a given confidence level then the point may be rejected. Otherwise. the point must be kept in the data set. Using the above data set
For 4 trials the 95% Q value in the table is 0.85. Since 0.96 > 0.85 we may reject this value with 95% confidence.
TABLE I
REJECTION QUOTIENT Number of Trials Q-Value
(90%) 3 0.94 4 0.76 5 0.64 10 0.41
Most instrumental methods are based upon calibration data obtained by measurements performed on a series of standards containing known concentrations of the analyte. Plots of concentration versus experimental observable are made. The "best" straight line through the points is then determined by linear regression. We will consider only the simplest case, called the METHOD OF LEAST SQUARES, which applies when there is a linear relationship between the analyte concentration and the measured variable. The method of least squares depends upon two assumptions: that a relationship of the form y = mx + b exists between the measured observable (y) and the analyte concentration (x), and that the error in x is negligible compared to the error in y. The line generated by the least-squares method is the one that minimizes the squares of the individual vertical displacements, called residuals, from the line. A residual q has the form q = [y1- (m + bx1)], and is thus a measure of the difference of the experimental value for y (y1) and the value for y calculated from the line
(m + bx1). This method minimizes the sum of q2, hence its name. The value of the least-squares method is that the slope and intercept of the line are obtained as well as the standard deviation for an analysis based upon this line. Thus from the measurement of y for an unknown sample we can calculate both a value for x and its standard deviation using this method. In this course we will use computer programs to generate the best fitting line through a set of data points. The program we use is based on the method of least squares described above. Reference: 1. http://ull.chemistry.uakron.edu/analytical/Statistics/ 2. http://science.widener.edu/svb/stats/stats.html
Q= (Suspect Value-Nearest Value)(Suspect Value-Furthest Value)
Q=(16.43 - 15.30)(16.43 - 15.25)
= 0.96
17
Laboratory Safety Contract
The safety of yourself and your classmates is of paramount importance while in the laboratory. Safety regulations must always be observed as it only takes one accident to cause blindness or serious permanent injury. Safety goggles must be worn at all times. After the first day of lab a 50% penalty will be assessed to your safety quiz if you come to lab without your safety goggles. If you remove your safety goggles when lab is being conducted, your instructor will give you a verbal warning once; the second time, an additional 10 points will be deducted from your lab report; finally, a third offense will result in dismissal from lab.
In the laboratory, the chemist works with many potentially dangerous substances and equipment. Yet with constant alertness, awareness of potential hazards, and some common-sense precautions, laboratory operations can be carried out with a high degree of safety. The most general rules for safe laboratory operations are: be alert, stay alert, and take the trouble to understand what you are doing and the potential hazards associated with the operation you are performing. Some basic rules and precautions are:
1 Always wear safety goggles (ANSI Z87.1) to protect your eyes from chemical splashes and broken glassware splinters. 2. Shoes covering the tops of feet must be worn at all times while in the lab (flip-flops, sandals, etc. are never allowed).
3. Never work alone in the laboratory - another person must be in the lab room at all times.
4. Use a fume hood when working with poisonous or offensive gases and fumes, or when conducting procedures involving a flame or explosive material.
5. Never heat organic solvents (alcohol, ether, benzene, etc.) in an open vessel over an open flame. Organic solvents are highly flammable and may ignite/explode so only hot plates or a heating mantle should be used around these flammable liquids.
6. Avoid pointing the mouth of a vessel that is being heated toward any person, including yourself and the instructor.
7. Never heat chemicals of any kind in a fully closed system - be sure the system is open to the air to prevent pressure build-up and explosion.
8. Never add anything (including water) to concentrated acid - instead slowly add the acid to the other substance to avoid splashing of the acid.
9. Lubricate glass tubes & thermometers with glycerol or soapy water then hold with a towel or gloves when pushing through a stopper.
10. Never pipet anything by mouth - especially toxic or corrosive substances.
11. Immediately sweep up spills taking place on the balance. Clean up all spills immediately, even those occurring on your lab bench.
12. Be sure to label all chemical containers correctly at all times.
13. Do not perform any unauthorized experiments.
14. Beware of hot glass tubing - glassware looks cool long before it can be handled safely.
15. Never throw matches, litmus, or any insoluble solids in the sink.
16. Avoid using excessive amounts of reagents - 1 to 3 mL will suffice for test tube reactions.
17. Do not lay down the bottle stoppers. Impurities may be picked up and contaminate the solution when the stopper is returned.
18. Do not heat thick glassware such as volumetric flasks, graduated cylinders, or bottles; they break easily with heat. Always check glassware for stress and fatigue such as stars and cracks before using. Do not use these pieces of glassware.
19. Never pour anything back into a reagent stock bottle - take out only the amount that will be used.
20. Tie back long hair and refrain from wearing flowing, fluffy clothing - both are fire hazards in the laboratory.
21. Know the location of exits, fire extinguishers, eye washers, first aid kits, the fire blanket, and other safety devices in the lab.
22. De-ionized water may be obtained through the curved faucet of each sink. The faucet operated by the foot pedal is the tap water. (Generally, it is good lab technique to do a final rinse with de-ionized water when cleaning glassware.)
23. Never use the thermometer as a stirrer because it might break and in some cases, release toxic mercury.
These are by no means the only safety precautions you should take when working in the laboratory, but instead these are guidelines as to how you can avoid some of the common hazards. Above all else, use common sense precautions such as cleaning-up after a spill, not picking up red-hot objects, no horseplay in lab, etc. Follow the precautions and rules mentioned above and discussed in the first day of lab, as well as your head so that there is a high degree of safety in the laboratory.
SAFETY STATEMENT: I am aware that there are hazards associated with being in a chemistry laboratory. I have been made aware of the safety equipment available in S5-209 and how it is to be used. I have also been made aware of some common hazards such as: broken glass, fire, acids, bases, and the poisonous nature of most chemicals. I will always wear my safety goggles during lab. I understand that special precautions for individual experiments will appear in the lab manual in a section entitled "Safety". (Please sign your lab manual below).
Signature Date
Print name Last 4 Digit SSN
18
Safety Quiz Name, last:_________________First_______________ Chemistry 201L Day / Time of Normal Lab Meetings _____/______
True / False (Please pay attention to the details) 1 __ Always pour reagent solution to a smaller container before measuring to prevent contamination and excess waste. 2 __ The only type of goggles students can wear in the lab is (American National Standard Institute, ANSI- Z87.1) and it must be
worn at all times in the lab when ANY chemicals substance is being handled by any student. 3 __ Thick gloves and lubricate of the rubber stopper hole with glycerol or water should be perform when inserting glass (i.e.,
thermometer) into a stopper. 4 __ It is okay to occasional use thermometers as a stirrer especially if a glass stirring rod is not readily available. 5 __ During times when experiments are to be conducted, it is okay to wear flip-flops, sandals or open-toe shoes to class. 6 __ It is never important to immediately sweep and clean Balances/Scales after use. In other words, the next person to use the
balance/scale can clean up the mess left behind. 7 __ Before using glassware and especially if the glassware is to be heated, it should be inspected for stars, crack or fatigue. If
the glassware is deemed unsafe, it should be replaced. 8 __ It is okay to eat, drink, or smoke in the laboratory, especially if it is lunch time and no experiments are being conducted. 9 __ When igniting a gas flame through a Bunsen burner, light the matchstick first before turning on the gas. 10 __ Always place chemicals directly on the balance pan (without a weighing paper or weighing boat). 11 __ At the end of the lab, you should: (a) wash your glassware, (b) wipe your station clean with a sponge, (c) return glassware and
equipment to its origin and (d) secure your lab equipment and lock your drawers. 12 __ If you break glassware that does not contain any chemicals you should immediately, clean up and place the glass in the
classroom regular waste bin. 13 __ Pour water into acid (not acid into water). Water will absorb the heat generated from the exothermic process. 14 __ Never point the open end of a test tube toward yourself or your neighbor when heating a chemical. 15 __ Never pour any chemical down the drain. All chemical waste should be disposed of in properly marked waste container.
Write your answers in a separate sheet of paper if you run out of room. 16 Place the location of the following safety equipment via their numbers. Write a statement of when these should be used.
a) Eyewash station (1) b) Shower (2)
c) Fire extinguisher (3) d) First-Aid Kit (4)
e) Fire blanket (5)
g) Chemical Waste (7)
i) Broken Glass Bin (9)
f) Emergency call box (6) h) HazMat Waste Bin (8)
j) Extra Chemical Waste container (10)
Room illustration is for S6-203
17 1) Khem Jones arrives to lab to carry out a titration to determine the pKa of an unknown acid salt. 2) He is wearing a t-shirt, shorts, and flip-flops. 3) He places his safety glasses over his head to keep his free flowing hair from covering his eyes. 4) He proceed to put on his lab coat and goes to the cart station to gather the necessary equipment and glassware. 5) As he prepare for his experiment, he pours some hydrochloric acid directly from the reagent stock bottle into his buret. 6) Some of the acid spills on the bench work area while trying to remove air bubbles in his buret. 7) He records his data on a scratch piece of paper with a pencil. 8) Next he goes to the balance station where he places a weighing boat on the scale and tares the scale. 9) He uses a spatula to take a portion of his analyte unknown acid then proceed to weigh his unknown. 10) He makes a mental note of the mass. 11) While in the balance room he leaves his unknown container open with some of the content spilled on the bench area and on the balance. 12) Khem’s lab partner, Elly Meyer sets up the Vernier pH probe where Khem had set up the buret for titration. 13) Since she had not have lunch yet, she proceeds to takes out a sandwich and soda from her backpack to eat her lunch. 14) Elly unknowingly gets hydrochloric acid on her hands and within a few minutes feels a burning sensation. 15) She immediately wipes off the liquid with her shirt and continues to eat her sandwich. 16) After her lunch, she and and Khem proceed determining the pka of their unknown acid.
On a separate sheet of printer paper, Write 1 – 16 (length wise) and then for each of the numbered sentence in the scenario above, cite the safety violations (SV) and/or incidents of poor laboratory practices (PLP). Write NA if none of these applies to the sentence. Be sure to label each sentences with SV or PLP, ie., 10 (PLP). If a sentence has no violation or no pool lab practice, do not place anything after the number. Give a detailed the remedy for at least five safety violation that you listed. Cite by number the violation you are referring to. Finally, why will Khem’s experiment fail. Cite the major flaw in Khem and Elly’s setup.
19
ACTIVITIES
ACTIVITIES
ACTIVITIES
ACTIVITIES

20
21
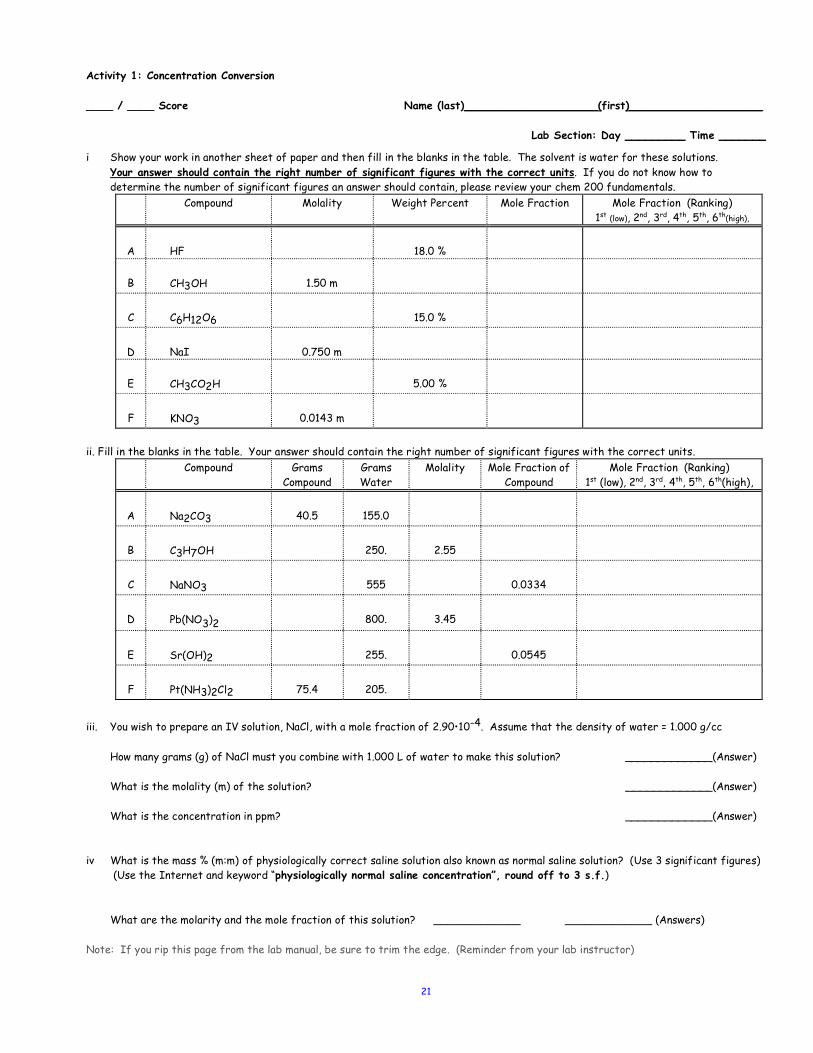
Activity 1: Concentration Conversion ____ / ____ Score Name (last)____________________(first)____________________
Lab Section: Day _________ Time _______
i Show your work in another sheet of paper and then fill in the blanks in the table. The solvent is water for these solutions. Your answer should contain the right number of significant figures with the correct units. If you do not know how to determine the number of significant figures an answer should contain, please review your chem 200 fundamentals.
Compound Molality Weight Percent Mole Fraction Mole Fraction (Ranking) 1st (low), 2nd, 3rd, 4th, 5th, 6th(high),
A HF 18.0 %
B CH3OH 1.50 m
C C6H12O6 15.0 %
D NaI 0.750 m
E CH3CO2H 5.00 %
F KNO3 0.0143 m
ii. Fill in the blanks in the table. Your answer should contain the right number of significant figures with the correct units.
Compound Grams Compound
Grams Water
Molality Mole Fraction of Compound
Mole Fraction (Ranking) 1st (low), 2nd, 3rd, 4th, 5th, 6th(high),
A Na2CO3 40.5 155.0
B C3H7OH 250. 2.55
C NaNO3 555 0.0334
D Pb(NO3)2 800. 3.45
E Sr(OH)2 255. 0.0545
F Pt(NH3)2Cl2 75.4 205.
iii. You wish to prepare an IV solution, NaCl, with a mole fraction of 2.90•10-4. Assume that the density of water = 1.000 g/cc
How many grams (g) of NaCl must you combine with 1.000 L of water to make this solution? _____________(Answer)
What is the molality (m) of the solution? _____________(Answer)
What is the concentration in ppm? _____________(Answer)
iv What is the mass % (m:m) of physiologically correct saline solution also known as normal saline solution? (Use 3 significant figures) (Use the Internet and keyword “physiologically normal saline concentration”, round off to 3 s.f.)
What are the molarity and the mole fraction of this solution? _____________ _____________ (Answers)
Note: If you rip this page from the lab manual, be sure to trim the edge. (Reminder from your lab instructor)

22
23
2. Activity: Keeping a Laboratory Notebook and Writing up a Laboratory Report Criteria for Write-up Grade for Chemistry 200 & 201 Emphasis on the lab this semester is on how you carry out the experiment and your understanding (interpretation) of the experimental results. The quality of your work, as demonstrated by your lab notebook (i.e., how well you record your data in table form, the thoughts in your discussion, the overall quality of your report), accounts for the majority of your grade. Remember that you should always wear your safety goggles during lab. Failure to do so will result in: 1st failure: warning, 2nd failure: minus 10 pts from report, 3rd failure: dismissal from class and receiving a zero for the day’s experiment. Attendance is mandatory. No late pre-labs will be accepted (turn in pre-lab assignment to the instructor’s table before class begins). Lab Notebooks: All written work MUST be done in the notebook (this includes pre-lab and post-lab questions). Your laboratory notebook is YOUR responsibility. If you forget to bring your lab notebook to class there will be a 20% point penalty. Your instructor at times will initial your notebook when experiments are being conducted in class. The original copy of your work will be turned in, the carbonless copy will remain in your lab notebook. Prior to the lab you must have completed the prelab write-up. The experimental work (as assigned by your instructor) must be completed during the lab period. The original copies of your pre-lab write-up must be turned in at the beginning of class and the data and observation section MUST be turned in BEFORE leaving the laboratory. All work must be done in black or blue non-erasable ink. The use of correction fluid (such as white-out) is not permitted. Data may not be photocopied. While discussion and exchanges of ideas are permitted, your lab write-up should be done independently. DO NOT PLAGIARIZE. Violation of this policy will result in a grade of zero for the assignment. Depending on the extent of this violation, as judged by the instructor, all students involved will be reported to the Chair of the department and the Dean of Academic affairs. Students may be expelled from the course and receive a failing grade. Their transcript will also reflect this violation of the academic code of conduct. The original copies of the calculations, discussions-conclusions, and answers to the post-lab questions are due on the due-date of the experiment. The write-up must be turned in at the beginning of class of the due-date (See lab schedule handout). If it is turned in after this time, a 5-pt deduction will be imposed on the grade for the report. For every day it is not turned in, 5 pts will be deducted from the report. After three lab meetings, no write-ups will be accepted. The format on keeping a laboratory notebook is given in the next few pages. Please read this and adhere to the description. Your instructor will follow these guidelines to the letter in assessing the final grade in all lab reports. Remember that all laboratory experiment work (with the exception of "Getting to Know Vernier" activity) should be recorded in the lab notebook directly, no scratch paper allowed. You must use black or blue pen when documenting your work in the lab notebook. These are standard procedures in any scientific work. If you do not adhere to these guidelines, you will be penalized 20% of the maximum score for the assignment. In the procedural section, a description such as "refer to page # of the lab manual", is unacceptable. As will be discussed in class, a pictorial flowchart is required in this section. Details of this format will be discussed in class. Keeping a Laboratory Notebook: One of the most essential skills a scientist must master is the ability to keep a proper laboratory notebook. This is essential in documenting the work the scientist has done, whether the information is needed later to write a paper or in order to submit a patent application based on the experiment or simply to act as the archival record of the results. In this course, the laboratory notebook you keep should be quite helpful in studying for lab quizzes and exams. If kept properly, it will contain the answers to many of the questions in the lab assessment exercises. One facet of keeping a laboratory notebook that is difficult for the students to gauge is how much information to write in the notebook. The guideline to use here is that a competent scientist should be able to reproduce the results of an experiment using only the written information found in the lab notebook. It is usually better to err on the side of writing too much information than too little. A second facet is organization and neatness. A portion of your grade on each experiment will be based on how good a job you do in organizing your notebook. If your instructor cannot read what you wrote he or she will most likely assume that it is incorrect. If you do not have legible penmanship, print the pre-lab report and type the report. It is expected that you will write in proper prose for the narrative portions of the lab report. We will be using the following general format for the laboratory notebook. The first four pages of the notebook are for the table of contents. The table of contents should include the experiment number, the title, and the page of which the work for that experiment begins. Update the table of contents when making new entries. The top margin of each page of an experiment should have 1) your name, 2) the title of the experiment, 3) your section number, 4) the date the work on the page was performed, and 5) the names of any lab partners. For each experiment the notebook should include the following sections: objective, background information, procedure, chemical disposal / safety information, answers to prelab questions, data / observations, results and calculations, interpretation of the results, discussion, answers to post-lab questions and finally the conclusions. Since you are using a notebook that records carbonless copies, you are required to turn in the original pages containing these sections as part of your report for each experiment.
24
The lab notebook Every page for a particular experiment should have the title of the experiment and the date on when the experiment was performed. The first section for an experiment is the introduction. This section includes the reason (objective) that the experiment is being performed, i.e. the goal of the experiment, and the theoretical principles which form the basis of the experimental method. These ideas should be written in your own words and not copied from this lab manual. Any pertinent background information and balanced equations or mathematical relationships that are known in advance for the experiment should be part of the introduction. The second section is the procedure. This does not mean that you have to copy the procedure verbatim into your laboratory notebook; rather you should write an outline of the procedure, then write-up a pictorial flow-chart showing the steps in the procedure. For each step in which data is collected, you should show the labels that will be used in the table of data that will be used. Finally you should include any changes to the published procedure. When such changes occur, they will be posted on the announcements section of the webpage or announced when the experiment is being discussed in class. You are responsible for checking the website or obtaining the information from your instructor on the modifications concerning the experiments. Next comes the chemical disposal and safety information. Safety is of paramount importance in a chemical laboratory. In order to make sure that you are aware of any special hazards associated with the chemicals or procedures used in the experiments, it is required that you write the warnings into your notebook. Similarly, in trying to be environmentally conscious in the design and practice of the experiments, material waste should not be released to the environment, i.e. chemicals should never be poured down the drain. In each experiment, you will be directed on how to dispose of your chemical waste. The chemical waste container will be found in the hood at the back of the room. The last section of the introduction should contain the prelab questions. For non-numerical questions, write your answer in such a manner that you restate the questions in your answer. For example, a non-numerical question might be "Which of the concentration units is independent of temperature?". You could answer, "A concentration unit that is independent of temperature is...". All pre-lab questions should be written in the lab notebook. If an excel spreadsheet is used to answer the question (prelab and post lab) then the initial equation that is to be used should be written in the lab notebook but the spreadsheet results (and graph) can be turned in attached to the pre-lab section. As you perform the experiment, you should record your steps and observations. The numerical results (data) you obtain should be collected in an organized table with experimental details describing the condition of how the data was obtained. The procedural notes should be detailed enough that someone else could repeat the experiment using them. Organization is key in this section, the data should be organized in a logical fashion so that the results are easily found when needed for calculations. Numerical data should always be recorded with the correct units and precision. In general most students write too few observations. Try and be thorough. For example, it is always a good idea to record the length of the procedure, the calibration procedure used, the computer program launched, as well as details of what was observed when chemicals were mixed. Record any experimental difficulties that occurred during the experiment so that if the results are anomalous, the reasons could be traced back to the experimental conditions as written in the lab notebook After you leave the laboratory, the experiment continues as now you must try to make sense of the data and observations that was collected. The first such section is the result-calculations and interpretation of results section. Here the data recorded is manipulated in order to obtain the answers to the question, which is after all the goal of the experiment. Any statistical analysis of the results is presented here as well as any graphs that explain the data. The final results table should summarize the results section with a short discussion on the meaning of the results following. In summary, any non-experimental work that is performed in order to arrive at the answers to the questions posed by the experiment is included in this section. The last section of the notebook (and the laboratory report) is the discussion, post-lab questions and conclusion section. In the discussion section, you should speculate as to the significance of the results which you have obtained in the experiment, e.g. why the results turned out as they did, answer the question posed by the experiments, and evaluate the accuracy of the experiment, i.e., state what part of the experimental procedure introduced the greatest error and comment on how the errors (including any errors made during the experiment) affected the experimental result. The post-lab questions are written after the discussion section followed by the conclusion. Answers to post-lab questions should be written in the same style as the prelab questions and should be written in the lab notebook. See the prelab question discussion above. The conclusion section should be brief and should not expand on the discussion. It simply states the final results as it pertains to the goal of the experiment. If you have any question about how to keep a laboratory notebook, be sure to ask your instructor. See the example on "The Penny experiment an Introduction to the Scientific Method" for details of the requirements for the correct laboratory write-up.
25
Activity 2: Lab Write-up
____ / ____ Score Name (last)____________________(first)____________________
Lab Section: Day _________ Time _______
i All lab write-ups should be written directly in the laboratory notebook. What is the type of lab notebook accepted in this course?
ii All information should be recorded in the lab notebook using black or blue pen only. Pencils are not allowed and writing on scratch
pieces of paper and then re-entering it in the lab notebook later is not allowed. Describe why this is important and what penalty will be incurred if this policy is violated.
iii It is not permissible at any time to plagiarize your lab write-up in whole or part. THIS IS A SERIOUS VIOLATION OF THE
ACADEMIC INTEGRITY POLICY. If this policy is violated, what are the consequences for all students involved? iv Each experiment and activity should be read prior to the date on which the experiment is scheduled to be performed. Write a
description of each section of the report below and state when these lab sections are due: a) Prelab questions __________________________________________Deadline
b) Prelab write-up __________________________________________Deadline
c) Data and Observations __________________________________________Deadline
d) Calculation and Discussion __________________________________________Deadline
v Describe in detail what is written in the introduction section of the prelab. vi Explain why observations, data and notes pertaining to the experiment being conducted should be written in the lab notebook
directly. Why is it important to err in more details than vague description?
What should be included in this section?
If computer data is to be generated, how should this be handled?
vii Where is the grading criteria for each experiment available for this course? Describe the similarities and difference between a formal and an informal report. How are each prepared? Where can the grading criteria be obtained for the experiments in this course? viii Rewrite the outline of the grading criteria for formal reports to be completed in this course, then write a short one or two
sentence description for each of the points in this outline. (Use the back of this page) Note: If you rip this page from the lab manual, be sure to trim the edge. (Reminder from your lab instructor)

26
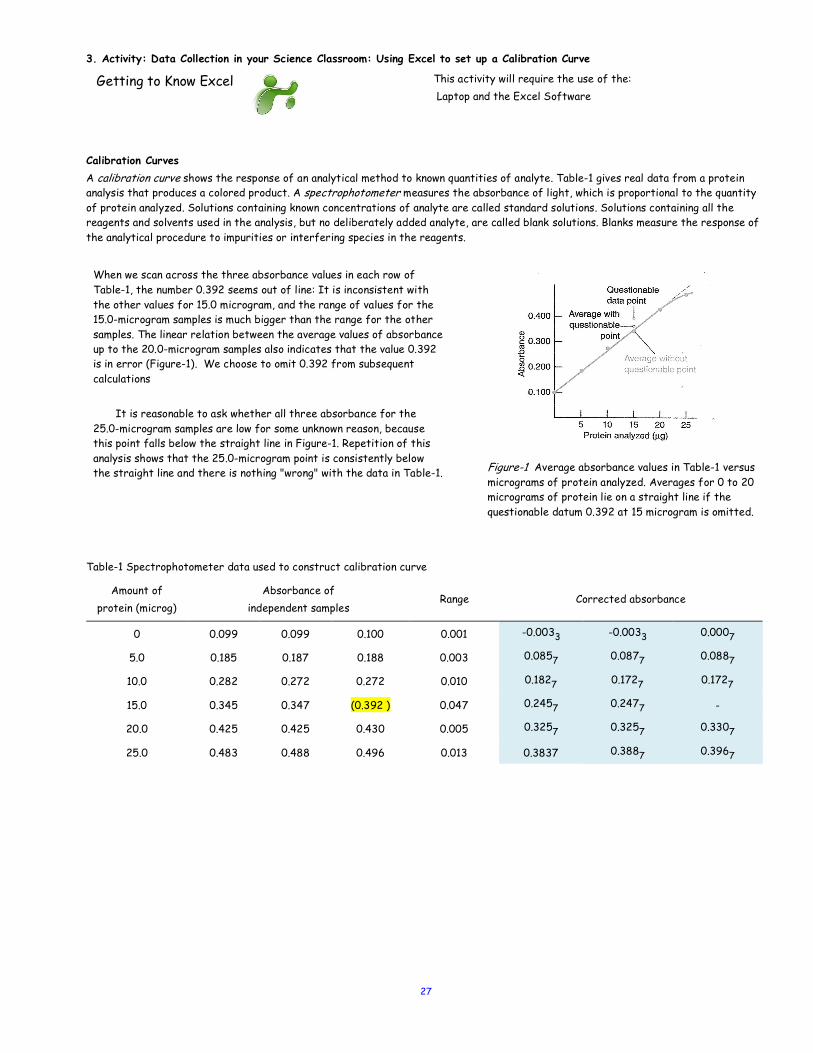
27
3. Activity: Data Collection in your Science Classroom: Using Excel to set up a Calibration Curve
Getting to Know Excel This activity will require the use of the: Laptop and the Excel Software
Calibration Curves A calibration curve shows the response of an analytical method to known quantities of analyte. Table-1 gives real data from a protein analysis that produces a colored product. A spectrophotometer measures the absorbance of light, which is proportional to the quantity of protein analyzed. Solutions containing known concentrations of analyte are called standard solutions. Solutions containing all the reagents and solvents used in the analysis, but no deliberately added analyte, are called blank solutions. Blanks measure the response of the analytical procedure to impurities or interfering species in the reagents.
When we scan across the three absorbance values in each row of Table-1, the number 0.392 seems out of line: It is inconsistent with the other values for 15.0 microgram, and the range of values for the 15.0-microgram samples is much bigger than the range for the other samples. The linear relation between the average values of absorbance up to the 20.0-microgram samples also indicates that the value 0.392 is in error (Figure-1). We choose to omit 0.392 from subsequent calculations
It is reasonable to ask whether all three absorbance for the 25.0-microgram samples are low for some unknown reason, because this point falls below the straight line in Figure-1. Repetition of this analysis shows that the 25.0-microgram point is consistently below the straight line and there is nothing "wrong" with the data in Table-1. Figure-1 Average absorbance values in Table-1 versus
micrograms of protein analyzed. Averages for 0 to 20 micrograms of protein lie on a straight line if the questionable datum 0.392 at 15 microgram is omitted.
Table-1 Spectrophotometer data used to construct calibration curve
Amount of protein (microg)
Absorbance of independent samples
Range Corrected absorbance
0 0.099 0.099 0.100 0.001 -0.0033 -0.0033 0.0007
5.0 0.185 0.187 0.188 0.003 0.0857 0.0877 0.0887
10.0 0.282 0.272 0.272 0.010 0.1827 0.1727 0.1727
15.0 0.345 0.347 (0.392 ) 0.047 0.2457 0.2477 -
20.0 0.425 0.425 0.430 0.005 0.3257 0.3257 0.3307
25.0 0.483 0.488 0.496 0.013 0.3837 0.3887 0.3967
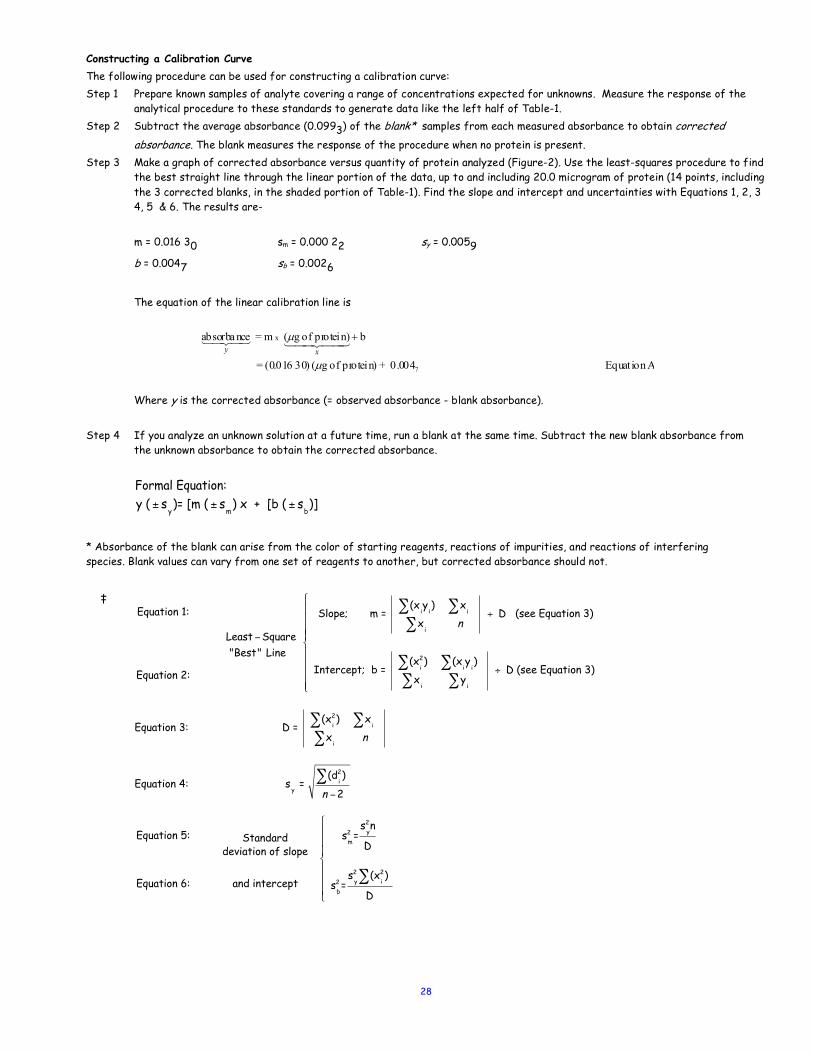
28
Constructing a Calibration Curve The following procedure can be used for constructing a calibration curve: Step 1 Prepare known samples of analyte covering a range of concentrations expected for unknowns. Measure the response of the
analytical procedure to these standards to generate data like the left half of Table-1. Step 2 Subtract the average absorbance (0.0993) of the blank* samples from each measured absorbance to obtain corrected
absorbance. The blank measures the response of the procedure when no protein is present. Step 3 Make a graph of corrected absorbance versus quantity of protein analyzed (Figure-2). Use the least-squares procedure to find
the best straight line through the linear portion of the data, up to and including 20.0 microgram of protein (14 points, including the 3 corrected blanks, in the shaded portion of Table-1). Find the slope and intercept and uncertainties with Equations 1, 2, 3 4, 5 & 6. The results are-
m = 0.016 30 sm = 0.000 22 sy = 0.0059
b = 0.0047 sb = 0.0026
The equation of the linear calibration line is
Where y is the corrected absorbance (= observed absorbance - blank absorbance). Step 4 If you analyze an unknown solution at a future time, run a blank at the same time. Subtract the new blank absorbance from
the unknown absorbance to obtain the corrected absorbance.
* Absorbance of the blank can arise from the color of starting reagents, reactions of impurities, and reactions of interfering species. Blank values can vary from one set of reagents to another, but corrected absorbance should not.
‡
AEquat ion 0.004 + protein) of g( 30) (0.016 =
b)protein of g( m = absorba nce
7
x
µ
µ +!! "!! #$!"!#$
xy
Formal Equation:y ( ± s
y)= [m ( ± s
m) x + [b ( ± s
b)]
Equation 1:
Equation 2:
Least −Square"Best" Line
Slope; m = (x
iy
i) ∑ x
i ∑
xi ∑ n
÷ D (see Equation 3)
Intercept; b = (x
i2) ∑ (x
iy
i) ∑
xi ∑ y
i ∑
÷ D (see Equation 3)
#
$
%%%%
&
%%%%
Equation 3: D = (x
i2) ∑ x
i ∑
xi ∑ n
Equation 4: sy =
(di2) ∑
n −2
Equation 5:
Equation 6:
Standarddeviation of slope
and intercept
sm2 =
sy2n
D
sb2 =
sy2 (x
i2) ∑
D
#
$
%%%
&
%%%
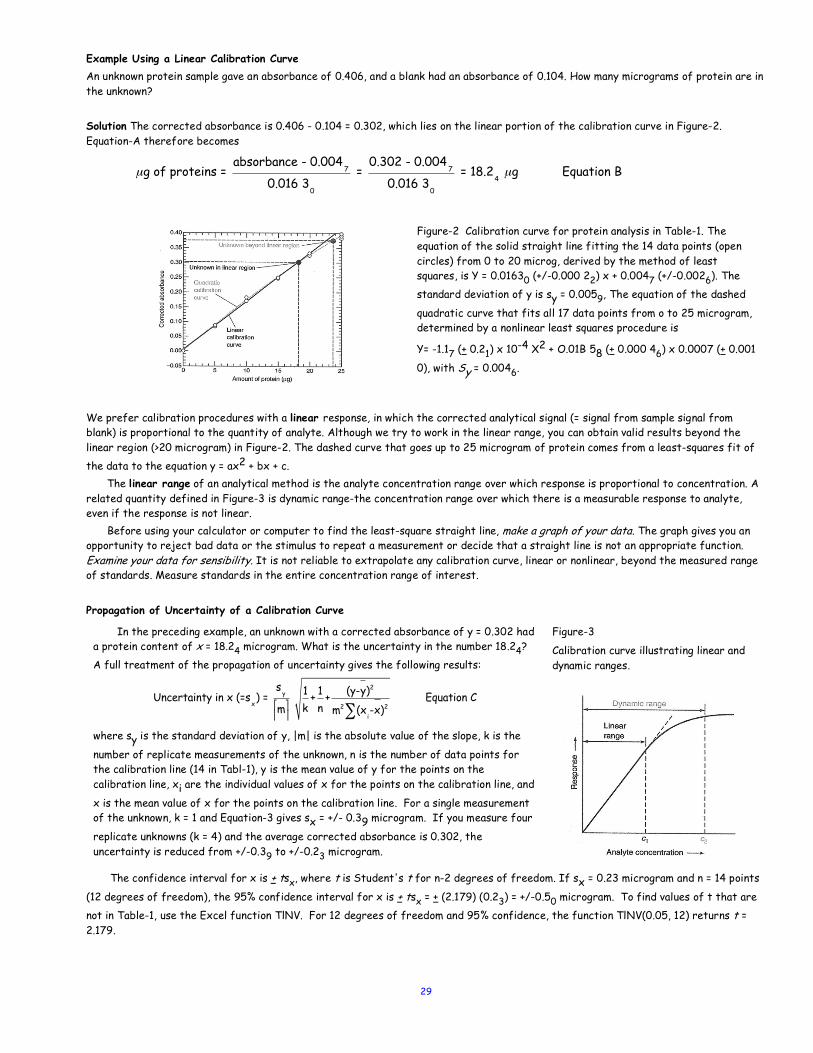
29
Example Using a Linear Calibration Curve An unknown protein sample gave an absorbance of 0.406, and a blank had an absorbance of 0.104. How many micrograms of protein are in the unknown? Solution The corrected absorbance is 0.406 - 0.104 = 0.302, which lies on the linear portion of the calibration curve in Figure-2. Equation-A therefore becomes
Figure-2 Calibration curve for protein analysis in Table-1. The equation of the solid straight line fitting the 14 data points (open circles) from 0 to 20 microg, derived by the method of least squares, is Y = 0.01630 (+/-0.000 22) x + 0.0047 (+/-0.0026). The standard deviation of y is sy = 0.0059, The equation of the dashed
quadratic curve that fits all 17 data points from o to 25 microgram, determined by a nonlinear least squares procedure is
Y= -1.17 (+ 0.21) x 10-4 X2 + O.01B 58 (+ 0.000 46) x 0.0007 (+ 0.001
0), with Sy = 0.0046.
We prefer calibration procedures with a linear response, in which the corrected analytical signal (= signal from sample signal from blank) is proportional to the quantity of analyte. Although we try to work in the linear range, you can obtain valid results beyond the linear region (>20 microgram) in Figure-2. The dashed curve that goes up to 25 microgram of protein comes from a least-squares fit of the data to the equation y = ax2 + bx + c.
The linear range of an analytical method is the analyte concentration range over which response is proportional to concentration. A related quantity defined in Figure-3 is dynamic range-the concentration range over which there is a measurable response to analyte, even if the response is not linear.
Before using your calculator or computer to find the least-square straight line, make a graph of your data. The graph gives you an opportunity to reject bad data or the stimulus to repeat a measurement or decide that a straight line is not an appropriate function. Examine your data for sensibility. It is not reliable to extrapolate any calibration curve, linear or nonlinear, beyond the measured range of standards. Measure standards in the entire concentration range of interest.
Propagation of Uncertainty of a Calibration Curve
In the preceding example, an unknown with a corrected absorbance of y = 0.302 had a protein content of x = 18.24 microgram. What is the uncertainty in the number 18.24? A full treatment of the propagation of uncertainty gives the following results:
where sy is the standard deviation of y, |m| is the absolute value of the slope, k is the
number of replicate measurements of the unknown, n is the number of data points for the calibration line (14 in Tabl-1), y is the mean value of y for the points on the calibration line, xi are the individual values of x for the points on the calibration line, and
x is the mean value of x for the points on the calibration line. For a single measurement of the unknown, k = 1 and Equation-3 gives sx = +/- 0.39 microgram. If you measure four
replicate unknowns (k = 4) and the average corrected absorbance is 0.302, the uncertainty is reduced from +/-0.39 to +/-0.23 microgram.
Figure-3
Calibration curve illustrating linear and dynamic ranges.
The confidence interval for x is + tsx, where t is Student's t for n-2 degrees of freedom. If sx = 0.23 microgram and n = 14 points
(12 degrees of freedom), the 95% confidence interval for x is + tsx = + (2.179) (0.23) = +/-0.50 microgram. To find values of t that are not in Table-1, use the Excel function TlNV. For 12 degrees of freedom and 95% confidence, the function TlNV(0.05, 12) returns t = 2.179.
µg of proteins = absorbance - 0.004
7
0.016 30
= 0.302 - 0.004
7
0.016 30
= 18.24 µg Equation B
Uncertainty in x (=sx) =
sy
m!"#$
1k
+ 1n
+ (y-y)2
m2 (xi-x)2∑
Equation C
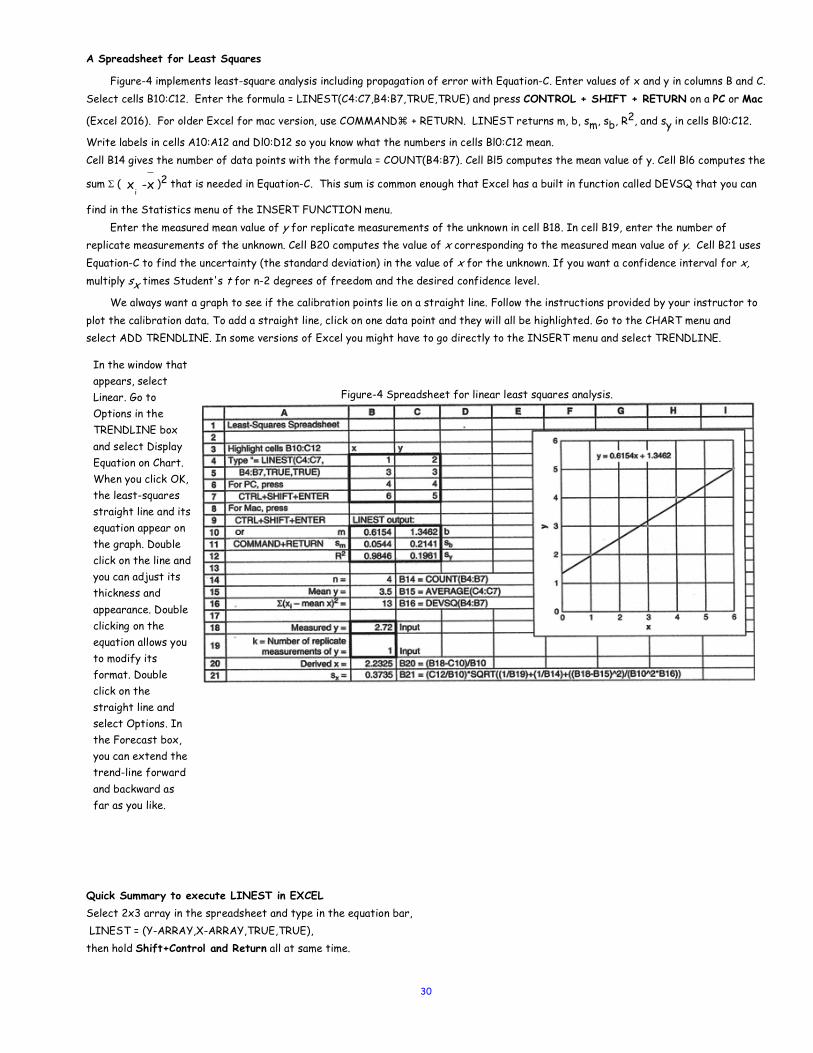
30
A Spreadsheet for Least Squares
Figure-4 implements least-square analysis including propagation of error with Equation-C. Enter values of x and y in columns B and C. Select cells B10:C12. Enter the formula = LINEST(C4:C7,B4:B7,TRUE,TRUE) and press CONTROL + SHIFT + RETURN on a PC or Mac
(Excel 2016). For older Excel for mac version, use COMMAND⌘ + RETURN. LINEST returns m, b, sm, sb, R2, and sy in cells Bl0:C12.
Write labels in cells A10:A12 and Dl0:D12 so you know what the numbers in cells Bl0:C12 mean. Cell B14 gives the number of data points with the formula = COUNT(B4:B7). Cell Bl5 computes the mean value of y. Cell Bl6 computes the
sum S ( )2 that is needed in Equation-C. This sum is common enough that Excel has a built in function called DEVSQ that you can
find in the Statistics menu of the INSERT FUNCTION menu. Enter the measured mean value of y for replicate measurements of the unknown in cell B18. In cell B19, enter the number of
replicate measurements of the unknown. Cell B20 computes the value of x corresponding to the measured mean value of y. Cell B21 uses Equation-C to find the uncertainty (the standard deviation) in the value of x for the unknown. If you want a confidence interval for x, multiply sx times Student's t for n-2 degrees of freedom and the desired confidence level.
We always want a graph to see if the calibration points lie on a straight line. Follow the instructions provided by your instructor to plot the calibration data. To add a straight line, click on one data point and they will all be highlighted. Go to the CHART menu and select ADD TRENDLINE. In some versions of Excel you might have to go directly to the INSERT menu and select TRENDLINE.
In the window that appears, select Linear. Go to Options in the TRENDLINE box and select Display Equation on Chart. When you click OK, the least-squares straight line and its equation appear on the graph. Double click on the line and you can adjust its thickness and appearance. Double clicking on the equation allows you to modify its format. Double click on the straight line and select Options. In the Forecast box, you can extend the trend-line forward and backward as far as you like.
Figure-4 Spreadsheet for linear least squares analysis.
Quick Summary to execute LINEST in EXCEL Select 2x3 array in the spreadsheet and type in the equation bar, LINEST = (Y-ARRAY,X-ARRAY,TRUE,TRUE), then hold Shift+Control and Return all at same time.
xi -x

31
See the tutorial on- https://www.youtube.com/watch?v=nC2GEB8_k7Y What is not shown in this video is that upon completing the equation, the shift+control+return was simultaneously typed to execute the command.
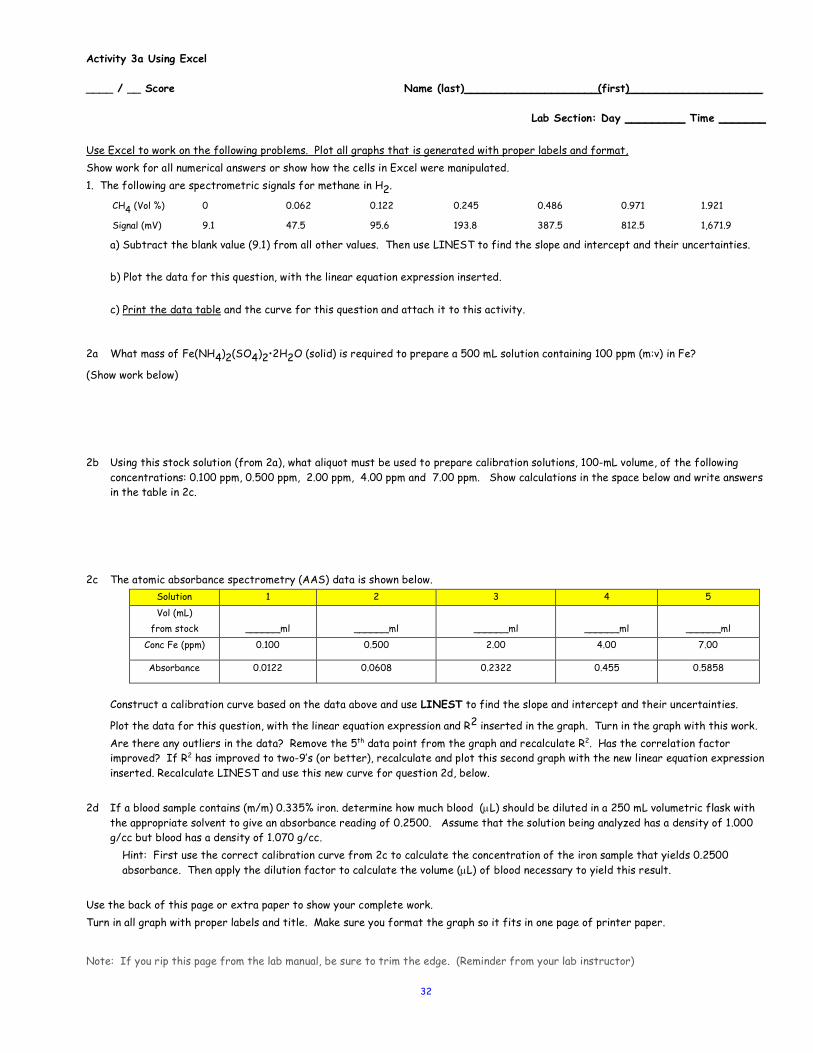
32
Activity 3a Using Excel ____ / __ Score Name (last)____________________(first)____________________
Lab Section: Day _________ Time _______
Use Excel to work on the following problems. Plot all graphs that is generated with proper labels and format, Show work for all numerical answers or show how the cells in Excel were manipulated. 1. The following are spectrometric signals for methane in H2.
CH4 (Vol %) 0 0.062 0.122 0.245 0.486 0.971 1.921
Signal (mV) 9.1 47.5 95.6 193.8 387.5 812.5 1,671.9
a) Subtract the blank value (9.1) from all other values. Then use LINEST to find the slope and intercept and their uncertainties.
b) Plot the data for this question, with the linear equation expression inserted.
c) Print the data table and the curve for this question and attach it to this activity.
2a What mass of Fe(NH4)2(SO4)2•2H2O (solid) is required to prepare a 500 mL solution containing 100 ppm (m:v) in Fe?
(Show work below) 2b Using this stock solution (from 2a), what aliquot must be used to prepare calibration solutions, 100-mL volume, of the following
concentrations: 0.100 ppm, 0.500 ppm, 2.00 ppm, 4.00 ppm and 7.00 ppm. Show calculations in the space below and write answers in the table in 2c.
2c The atomic absorbance spectrometry (AAS) data is shown below.
Solution 1 2 3 4 5 Vol (mL)
from stock
______ml
______ml
______ml
______ml
______ml Conc Fe (ppm) 0.100 0.500 2.00 4.00 7.00
Absorbance 0.0122 0.0608 0.2322 0.455 0.5858
Construct a calibration curve based on the data above and use LINEST to find the slope and intercept and their uncertainties.
Plot the data for this question, with the linear equation expression and R2 inserted in the graph. Turn in the graph with this work. Are there any outliers in the data? Remove the 5th data point from the graph and recalculate R2. Has the correlation factor
improved? If R2 has improved to two-9’s (or better), recalculate and plot this second graph with the new linear equation expression inserted. Recalculate LINEST and use this new curve for question 2d, below.
2d If a blood sample contains (m/m) 0.335% iron. determine how much blood (µL) should be diluted in a 250 mL volumetric flask with
the appropriate solvent to give an absorbance reading of 0.2500. Assume that the solution being analyzed has a density of 1.000 g/cc but blood has a density of 1.070 g/cc.
Hint: First use the correct calibration curve from 2c to calculate the concentration of the iron sample that yields 0.2500 absorbance. Then apply the dilution factor to calculate the volume (µL) of blood necessary to yield this result.
Use the back of this page or extra paper to show your complete work. Turn in all graph with proper labels and title. Make sure you format the graph so it fits in one page of printer paper.
Note: If you rip this page from the lab manual, be sure to trim the edge. (Reminder from your lab instructor)

33
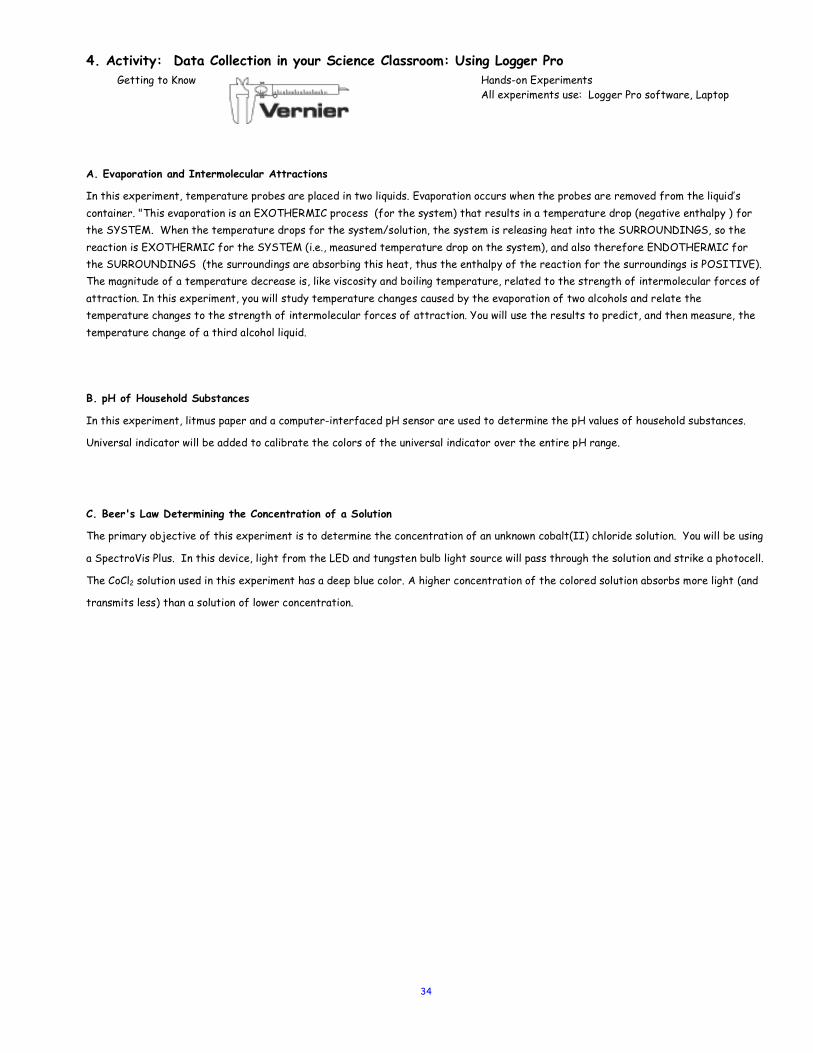
34
4. Activity: Data Collection in your Science Classroom: Using Logger Pro Getting to Know Hands-on Experiments
All experiments use: Logger Pro software, Laptop
A. Evaporation and Intermolecular Attractions
In this experiment, temperature probes are placed in two liquids. Evaporation occurs when the probes are removed from the liquid’s container. "This evaporation is an EXOTHERMIC process (for the system) that results in a temperature drop (negative enthalpy ) for the SYSTEM. When the temperature drops for the system/solution, the system is releasing heat into the SURROUNDINGS, so the reaction is EXOTHERMIC for the SYSTEM (i.e., measured temperature drop on the system), and also therefore ENDOTHERMIC for the SURROUNDINGS (the surroundings are absorbing this heat, thus the enthalpy of the reaction for the surroundings is POSITIVE). The magnitude of a temperature decrease is, like viscosity and boiling temperature, related to the strength of intermolecular forces of attraction. In this experiment, you will study temperature changes caused by the evaporation of two alcohols and relate the temperature changes to the strength of intermolecular forces of attraction. You will use the results to predict, and then measure, the temperature change of a third alcohol liquid.
B. pH of Household Substances
In this experiment, litmus paper and a computer-interfaced pH sensor are used to determine the pH values of household substances.
Universal indicator will be added to calibrate the colors of the universal indicator over the entire pH range.
C. Beer's Law Determining the Concentration of a Solution
The primary objective of this experiment is to determine the concentration of an unknown cobalt(II) chloride solution. You will be using
a SpectroVis Plus. In this device, light from the LED and tungsten bulb light source will pass through the solution and strike a photocell.
The CoCl2 solution used in this experiment has a deep blue color. A higher concentration of the colored solution absorbs more light (and
transmits less) than a solution of lower concentration.
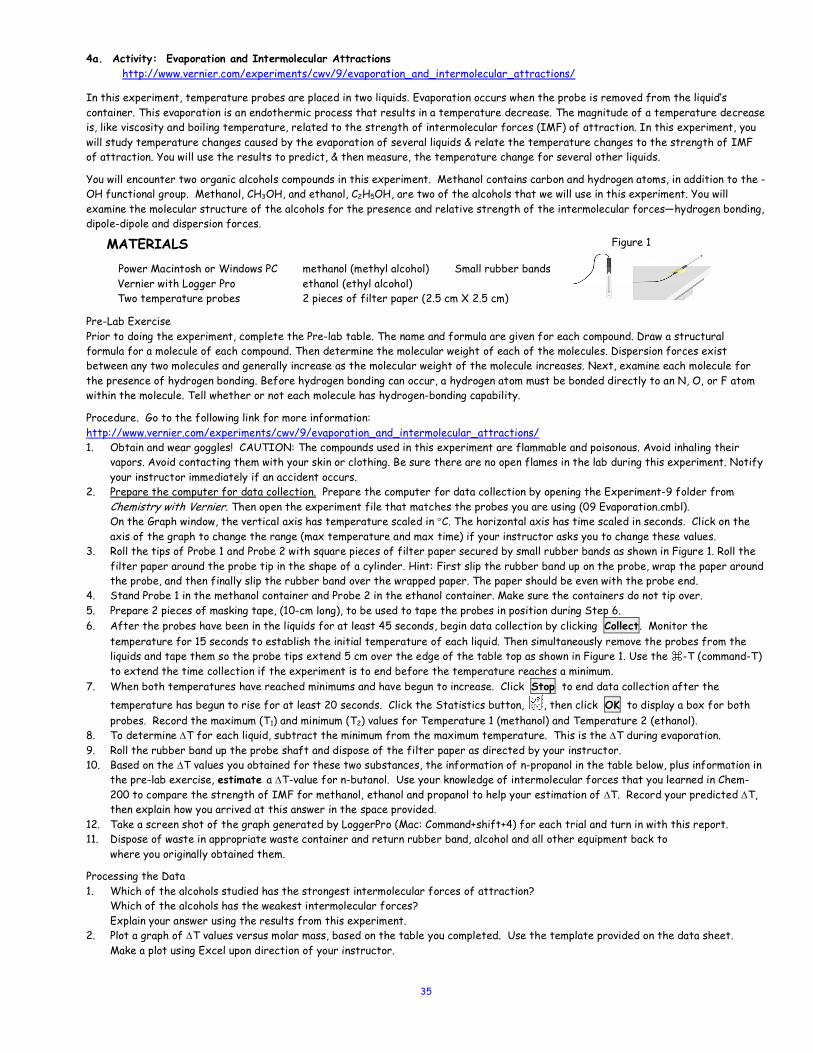
35
4a. Activity: Evaporation and Intermolecular Attractions http://www.vernier.com/experiments/cwv/9/evaporation_and_intermolecular_attractions/
In this experiment, temperature probes are placed in two liquids. Evaporation occurs when the probe is removed from the liquid’s container. This evaporation is an endothermic process that results in a temperature decrease. The magnitude of a temperature decrease is, like viscosity and boiling temperature, related to the strength of intermolecular forces (IMF) of attraction. In this experiment, you will study temperature changes caused by the evaporation of several liquids & relate the temperature changes to the strength of IMF of attraction. You will use the results to predict, & then measure, the temperature change for several other liquids.
You will encounter two organic alcohols compounds in this experiment. Methanol contains carbon and hydrogen atoms, in addition to the -OH functional group. Methanol, CH3OH, and ethanol, C2H5OH, are two of the alcohols that we will use in this experiment. You will examine the molecular structure of the alcohols for the presence and relative strength of the intermolecular forces—hydrogen bonding, dipole-dipole and dispersion forces.
MATERIALS Figure 1
Power Macintosh or Windows PC Vernier with Logger Pro Two temperature probes
methanol (methyl alcohol) Small rubber bands ethanol (ethyl alcohol) 2 pieces of filter paper (2.5 cm X 2.5 cm)
Pre-Lab Exercise Prior to doing the experiment, complete the Pre-lab table. The name and formula are given for each compound. Draw a structural formula for a molecule of each compound. Then determine the molecular weight of each of the molecules. Dispersion forces exist between any two molecules and generally increase as the molecular weight of the molecule increases. Next, examine each molecule for the presence of hydrogen bonding. Before hydrogen bonding can occur, a hydrogen atom must be bonded directly to an N, O, or F atom within the molecule. Tell whether or not each molecule has hydrogen-bonding capability.
Procedure. Go to the following link for more information: http://www.vernier.com/experiments/cwv/9/evaporation_and_intermolecular_attractions/ 1. Obtain and wear goggles! CAUTION: The compounds used in this experiment are flammable and poisonous. Avoid inhaling their
vapors. Avoid contacting them with your skin or clothing. Be sure there are no open flames in the lab during this experiment. Notify your instructor immediately if an accident occurs.
2. Prepare the computer for data collection. Prepare the computer for data collection by opening the Experiment-9 folder from Chemistry with Vernier. Then open the experiment file that matches the probes you are using (09 Evaporation.cmbl).
On the Graph window, the vertical axis has temperature scaled in °C. The horizontal axis has time scaled in seconds. Click on the axis of the graph to change the range (max temperature and max time) if your instructor asks you to change these values.
3. Roll the tips of Probe 1 and Probe 2 with square pieces of filter paper secured by small rubber bands as shown in Figure 1. Roll the filter paper around the probe tip in the shape of a cylinder. Hint: First slip the rubber band up on the probe, wrap the paper around the probe, and then finally slip the rubber band over the wrapped paper. The paper should be even with the probe end.
4. Stand Probe 1 in the methanol container and Probe 2 in the ethanol container. Make sure the containers do not tip over. 5. Prepare 2 pieces of masking tape, (10-cm long), to be used to tape the probes in position during Step 6. 6. After the probes have been in the liquids for at least 45 seconds, begin data collection by clicking Collect . Monitor the
temperature for 15 seconds to establish the initial temperature of each liquid. Then simultaneously remove the probes from the liquids and tape them so the probe tips extend 5 cm over the edge of the table top as shown in Figure 1. Use the ⌘-T (command-T)
to extend the time collection if the experiment is to end before the temperature reaches a minimum. 7. When both temperatures have reached minimums and have begun to increase. Click Stop to end data collection after the
temperature has begun to rise for at least 20 seconds. Click the Statistics button, , then click OK to display a box for both probes. Record the maximum (T1) and minimum (T2) values for Temperature 1 (methanol) and Temperature 2 (ethanol).
8. To determine DT for each liquid, subtract the minimum from the maximum temperature. This is the DT during evaporation. 9. Roll the rubber band up the probe shaft and dispose of the filter paper as directed by your instructor. 10. Based on the DT values you obtained for these two substances, the information of n-propanol in the table below, plus information in
the pre-lab exercise, estimate a DT-value for n-butanol. Use your knowledge of intermolecular forces that you learned in Chem-200 to compare the strength of IMF for methanol, ethanol and propanol to help your estimation of DT. Record your predicted DT, then explain how you arrived at this answer in the space provided.
12. Take a screen shot of the graph generated by LoggerPro (Mac: Command+shift+4) for each trial and turn in with this report. 11. Dispose of waste in appropriate waste container and return rubber band, alcohol and all other equipment back to
where you originally obtained them.
Processing the Data 1. Which of the alcohols studied has the strongest intermolecular forces of attraction? Which of the alcohols has the weakest intermolecular forces? Explain your answer using the results from this experiment. 2. Plot a graph of DT values versus molar mass, based on the table you completed. Use the template provided on the data sheet. Make a plot using Excel upon direction of your instructor.
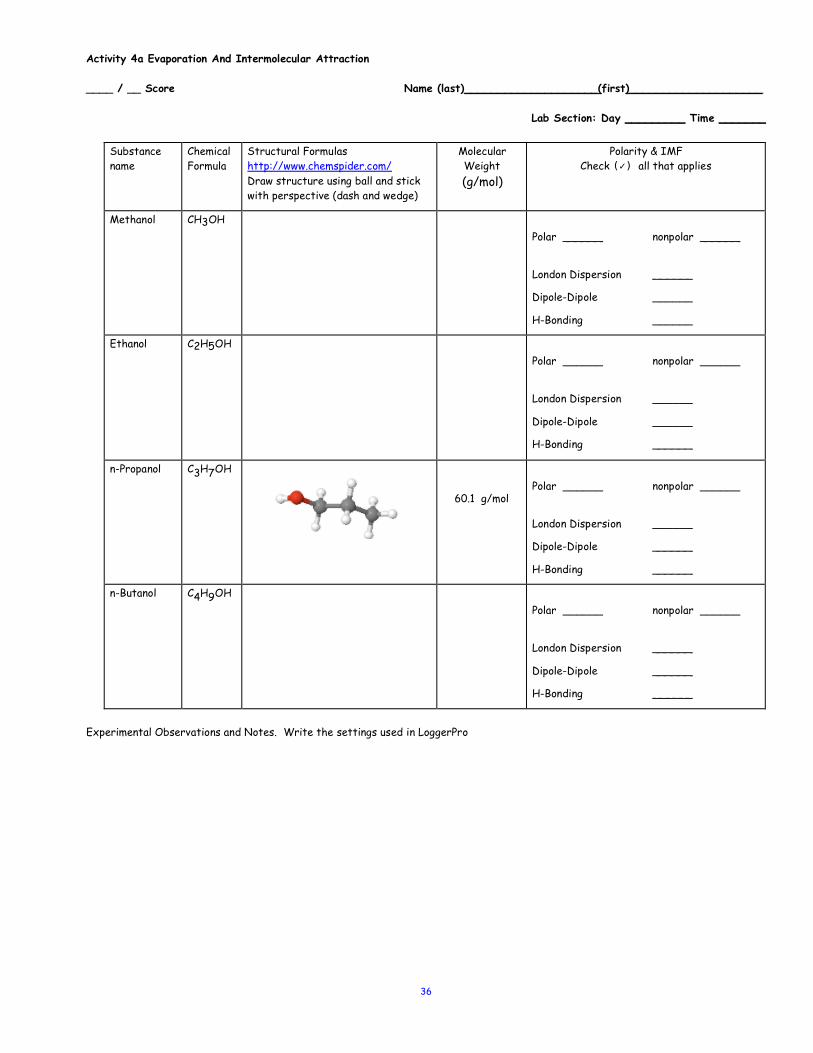
36
Activity 4a Evaporation And Intermolecular Attraction ____ / __ Score Name (last)____________________(first)____________________
Lab Section: Day _________ Time _______
Substance name
Chemical Formula
Structural Formulas http://www.chemspider.com/ Draw structure using ball and stick with perspective (dash and wedge)
Molecular Weight (g/mol)
Polarity & IMF Check (✓) all that applies
Methanol
CH3OH
Polar ______ nonpolar ______
London Dispersion ______
Dipole-Dipole ______
H-Bonding ______ Ethanol
C2H5OH
Polar ______ nonpolar ______
London Dispersion ______
Dipole-Dipole ______
H-Bonding ______
n-Propanol
C3H7OH
60.1 g/mol
Polar ______ nonpolar ______
London Dispersion ______
Dipole-Dipole ______
H-Bonding ______
n-Butanol
C4H9OH
Polar ______ nonpolar ______
London Dispersion ______
Dipole-Dipole ______
H-Bonding ______
Experimental Observations and Notes. Write the settings used in LoggerPro
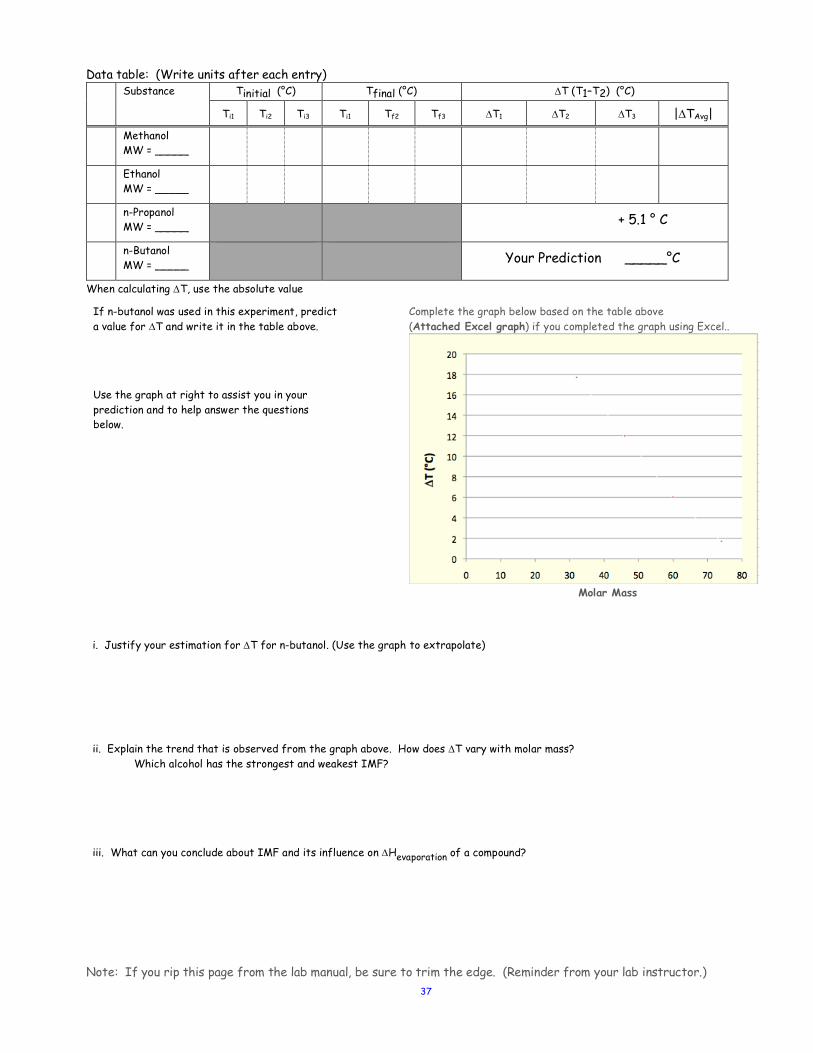
37
Data table: (Write units after each entry) Substance Tinitial (°C) Tfinal (°C) DT (T1–T2) (°C)
Ti1 Ti2 Ti3 Ti1 Tf2 Tf3 DT1 DT2 DT3 |DTAvg|
Methanol MW = _____
Ethanol MW = _____
n-Propanol MW = _____
+ 5.1 ° C
n-Butanol MW = _____
Your Prediction _____°C
When calculating DT, use the absolute value
If n-butanol was used in this experiment, predict a value for DT and write it in the table above.
Use the graph at right to assist you in your prediction and to help answer the questions below.
Complete the graph below based on the table above (Attached Excel graph) if you completed the graph using Excel..
Molar Mass
i. Justify your estimation for DT for n-butanol. (Use the graph to extrapolate) ii. Explain the trend that is observed from the graph above. How does DT vary with molar mass?
Which alcohol has the strongest and weakest IMF? iii. What can you conclude about IMF and its influence on DHevaporation of a compound?
Note: If you rip this page from the lab manual, be sure to trim the edge. (Reminder from your lab instructor.)
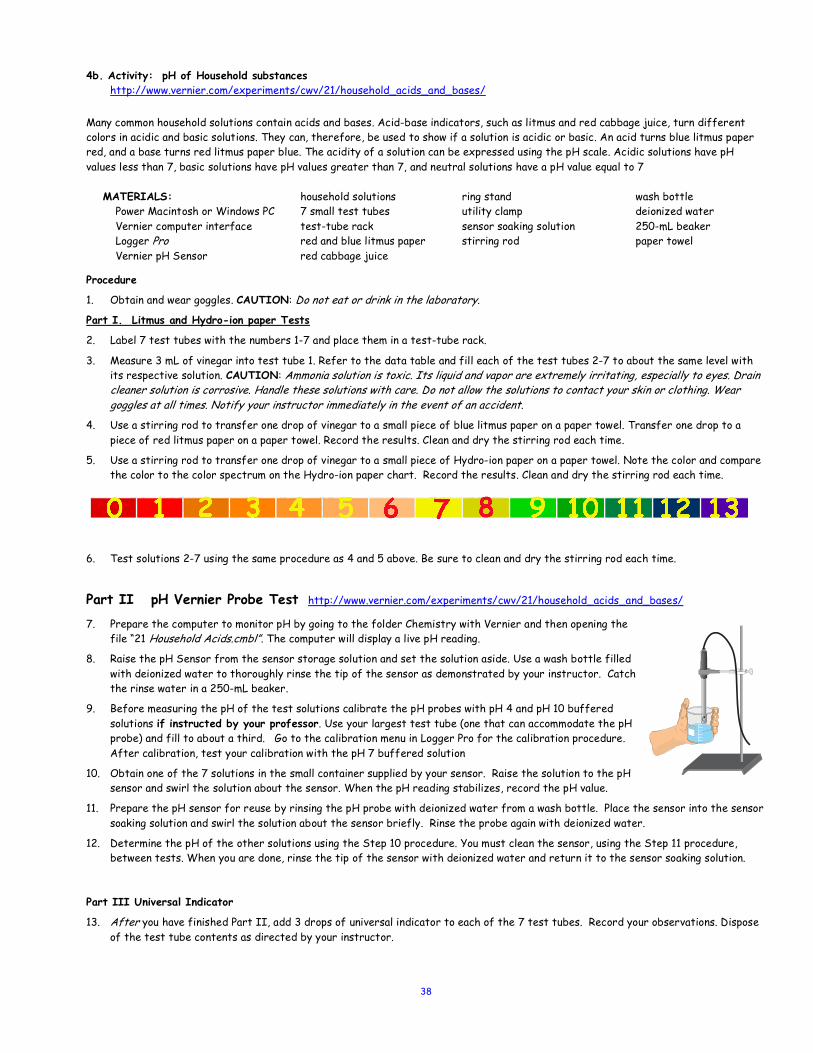
38
4b. Activity: pH of Household substances http://www.vernier.com/experiments/cwv/21/household_acids_and_bases/
Many common household solutions contain acids and bases. Acid-base indicators, such as litmus and red cabbage juice, turn different colors in acidic and basic solutions. They can, therefore, be used to show if a solution is acidic or basic. An acid turns blue litmus paper red, and a base turns red litmus paper blue. The acidity of a solution can be expressed using the pH scale. Acidic solutions have pH values less than 7, basic solutions have pH values greater than 7, and neutral solutions have a pH value equal to 7
MATERIALS: household solutions ring stand wash bottle Power Macintosh or Windows PC 7 small test tubes utility clamp deionized water Vernier computer interface test-tube rack sensor soaking solution 250-mL beaker Logger Pro red and blue litmus paper stirring rod paper towel Vernier pH Sensor red cabbage juice
Procedure
1. Obtain and wear goggles. CAUTION: Do not eat or drink in the laboratory.
Part I. Litmus and Hydro-ion paper Tests
2. Label 7 test tubes with the numbers 1-7 and place them in a test-tube rack.
3. Measure 3 mL of vinegar into test tube 1. Refer to the data table and fill each of the test tubes 2-7 to about the same level with its respective solution. CAUTION: Ammonia solution is toxic. Its liquid and vapor are extremely irritating, especially to eyes. Drain cleaner solution is corrosive. Handle these solutions with care. Do not allow the solutions to contact your skin or clothing. Wear goggles at all times. Notify your instructor immediately in the event of an accident.
4. Use a stirring rod to transfer one drop of vinegar to a small piece of blue litmus paper on a paper towel. Transfer one drop to a piece of red litmus paper on a paper towel. Record the results. Clean and dry the stirring rod each time.
5. Use a stirring rod to transfer one drop of vinegar to a small piece of Hydro-ion paper on a paper towel. Note the color and compare the color to the color spectrum on the Hydro-ion paper chart. Record the results. Clean and dry the stirring rod each time.
6. Test solutions 2-7 using the same procedure as 4 and 5 above. Be sure to clean and dry the stirring rod each time.
Part II pH Vernier Probe Test http://www.vernier.com/experiments/cwv/21/household_acids_and_bases/
7. Prepare the computer to monitor pH by going to the folder Chemistry with Vernier and then opening the file “21 Household Acids.cmbl”. The computer will display a live pH reading.
8. Raise the pH Sensor from the sensor storage solution and set the solution aside. Use a wash bottle filled with deionized water to thoroughly rinse the tip of the sensor as demonstrated by your instructor. Catch the rinse water in a 250-mL beaker.
9. Before measuring the pH of the test solutions calibrate the pH probes with pH 4 and pH 10 buffered solutions if instructed by your professor. Use your largest test tube (one that can accommodate the pH probe) and fill to about a third. Go to the calibration menu in Logger Pro for the calibration procedure. After calibration, test your calibration with the pH 7 buffered solution
10. Obtain one of the 7 solutions in the small container supplied by your sensor. Raise the solution to the pH sensor and swirl the solution about the sensor. When the pH reading stabilizes, record the pH value.
11. Prepare the pH sensor for reuse by rinsing the pH probe with deionized water from a wash bottle. Place the sensor into the sensor soaking solution and swirl the solution about the sensor briefly. Rinse the probe again with deionized water.
12. Determine the pH of the other solutions using the Step 10 procedure. You must clean the sensor, using the Step 11 procedure, between tests. When you are done, rinse the tip of the sensor with deionized water and return it to the sensor soaking solution.
Part III Universal Indicator
13. After you have finished Part II, add 3 drops of universal indicator to each of the 7 test tubes. Record your observations. Dispose of the test tube contents as directed by your instructor.
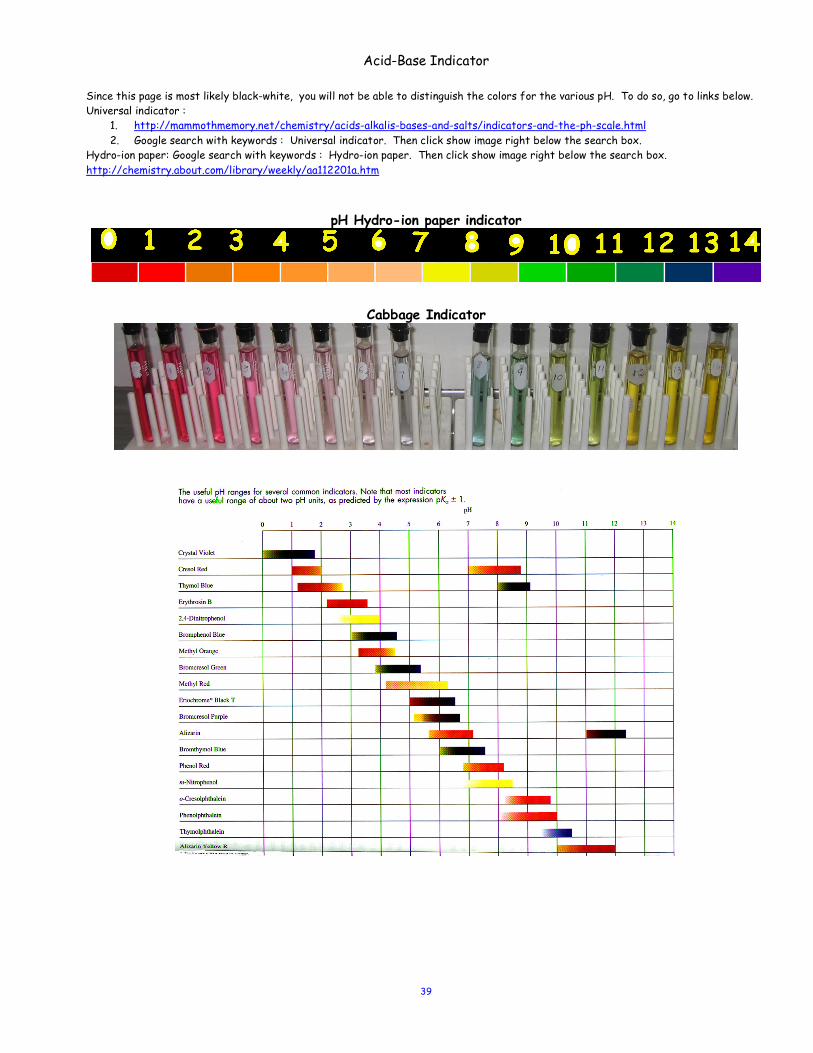
39
Acid-Base Indicator
Since this page is most likely black-white, you will not be able to distinguish the colors for the various pH. To do so, go to links below. Universal indicator :
1. http://mammothmemory.net/chemistry/acids-alkalis-bases-and-salts/indicators-and-the-ph-scale.html 2. Google search with keywords : Universal indicator. Then click show image right below the search box.
Hydro-ion paper: Google search with keywords : Hydro-ion paper. Then click show image right below the search box. http://chemistry.about.com/library/weekly/aa112201a.htm
pH Hydro-ion paper indicator
Cabbage Indicator
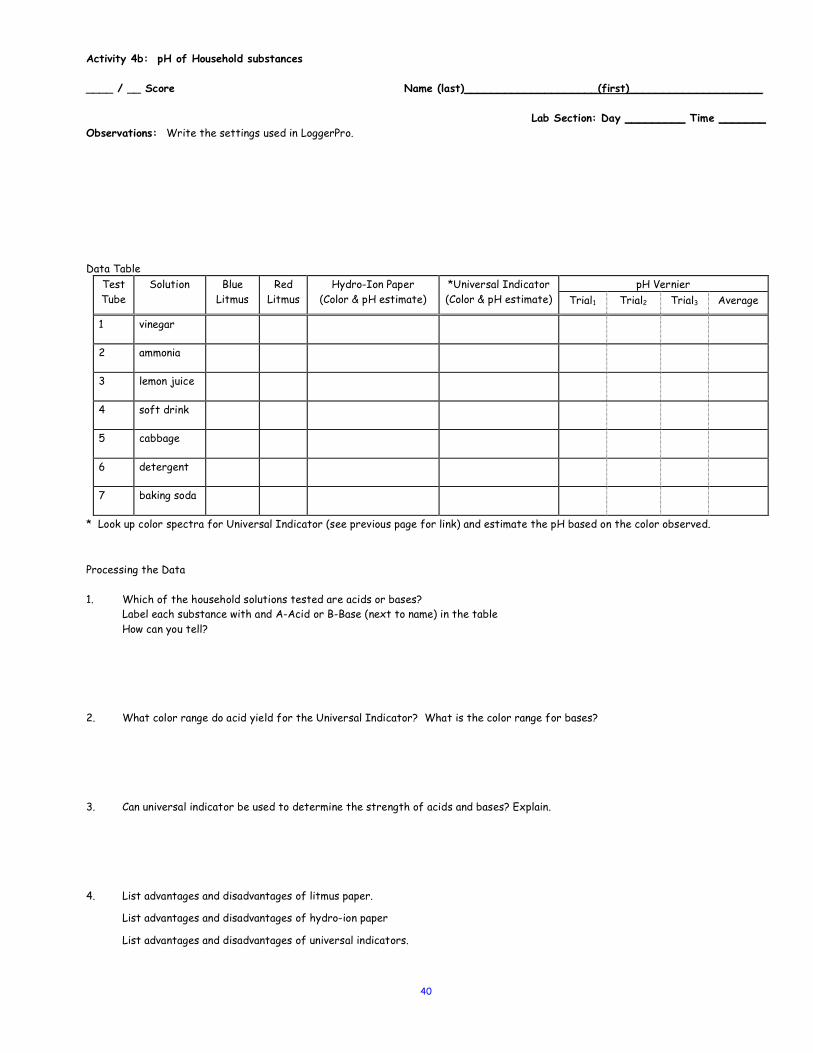
40
Activity 4b: pH of Household substances ____ / __ Score Name (last)____________________(first)____________________
Lab Section: Day _________ Time _______
Observations: Write the settings used in LoggerPro.
Data Table
Test Tube
Solution Blue Litmus
Red Litmus
Hydro-Ion Paper (Color & pH estimate)
*Universal Indicator (Color & pH estimate)
pH Vernier Trial1 Trial2 Trial3 Average
1 vinegar
2 ammonia
3 lemon juice
4 soft drink
5 cabbage
6 detergent
7 baking soda
* Look up color spectra for Universal Indicator (see previous page for link) and estimate the pH based on the color observed.
Processing the Data 1. Which of the household solutions tested are acids or bases?
Label each substance with and A-Acid or B-Base (next to name) in the table How can you tell?
2. What color range do acid yield for the Universal Indicator? What is the color range for bases? 3. Can universal indicator be used to determine the strength of acids and bases? Explain. 4. List advantages and disadvantages of litmus paper.
List advantages and disadvantages of hydro-ion paper
List advantages and disadvantages of universal indicators.
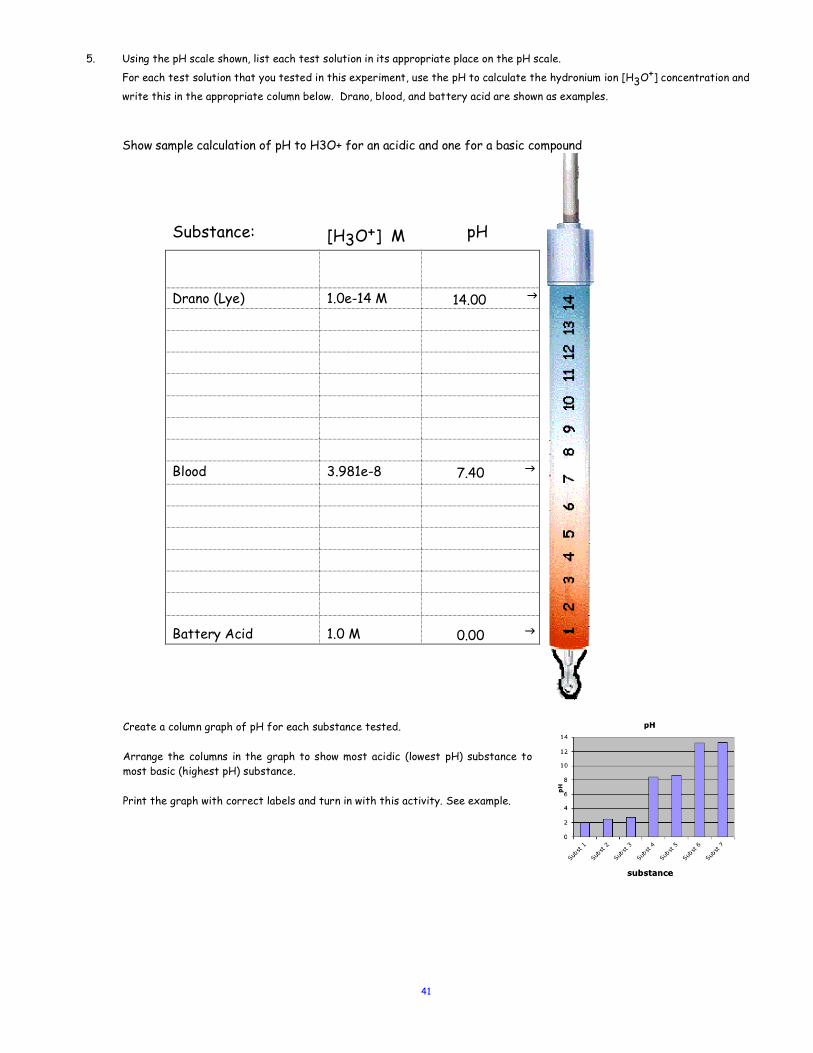
41
5. Using the pH scale shown, list each test solution in its appropriate place on the pH scale.
For each test solution that you tested in this experiment, use the pH to calculate the hydronium ion [H3O+] concentration and
write this in the appropriate column below. Drano, blood, and battery acid are shown as examples. Show sample calculation of pH to H3O+ for an acidic and one for a basic compound
Substance:
[H3O+] M
pH
Drano (Lye) 1.0e-14 M 14.00 g Blood 3.981e-8 7.40 g
Battery Acid 1.0 M 0.00 g
Create a column graph of pH for each substance tested. Arrange the columns in the graph to show most acidic (lowest pH) substance to most basic (highest pH) substance. Print the graph with correct labels and turn in with this activity. See example.
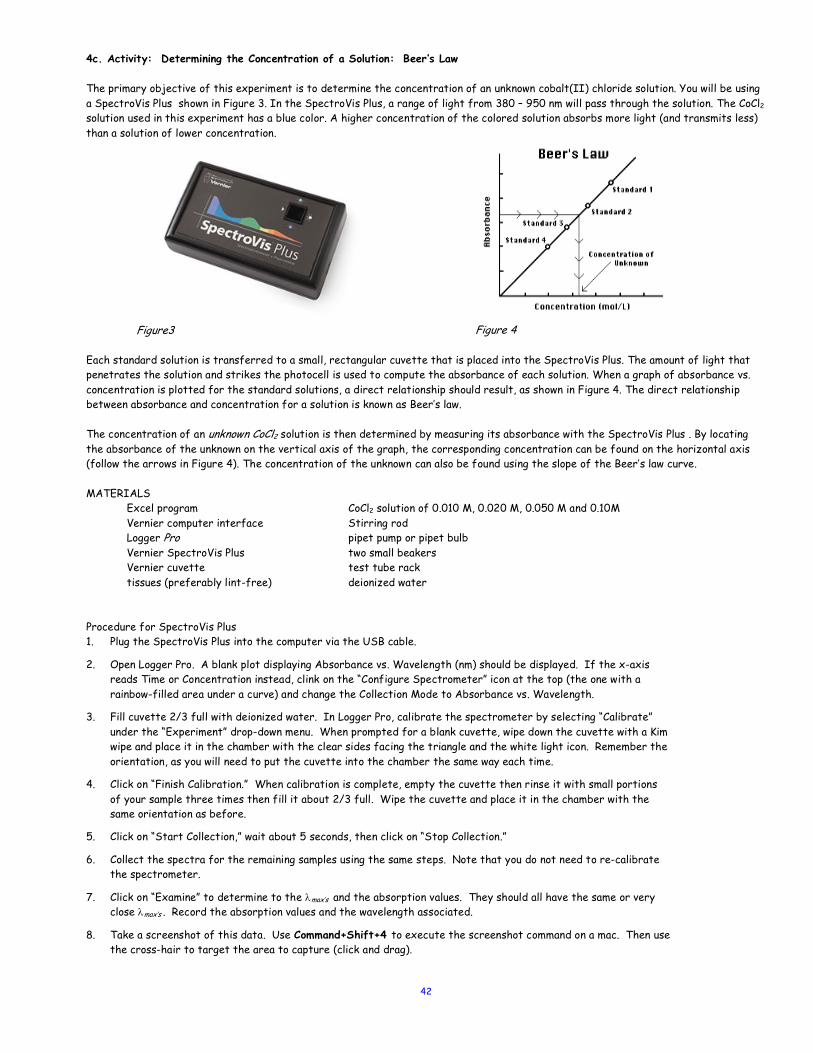
42
4c. Activity: Determining the Concentration of a Solution: Beer’s Law The primary objective of this experiment is to determine the concentration of an unknown cobalt(II) chloride solution. You will be using a SpectroVis Plus shown in Figure 3. In the SpectroVis Plus, a range of light from 380 – 950 nm will pass through the solution. The CoCl2 solution used in this experiment has a blue color. A higher concentration of the colored solution absorbs more light (and transmits less) than a solution of lower concentration.
Figure3
Figure 4
Each standard solution is transferred to a small, rectangular cuvette that is placed into the SpectroVis Plus. The amount of light that penetrates the solution and strikes the photocell is used to compute the absorbance of each solution. When a graph of absorbance vs. concentration is plotted for the standard solutions, a direct relationship should result, as shown in Figure 4. The direct relationship between absorbance and concentration for a solution is known as Beer’s law. The concentration of an unknown CoCl2 solution is then determined by measuring its absorbance with the SpectroVis Plus . By locating the absorbance of the unknown on the vertical axis of the graph, the corresponding concentration can be found on the horizontal axis (follow the arrows in Figure 4). The concentration of the unknown can also be found using the slope of the Beer’s law curve. MATERIALS
Excel program CoCl2 solution of 0.010 M, 0.020 M, 0.050 M and 0.10M Vernier computer interface Stirring rod Logger Pro pipet pump or pipet bulb Vernier SpectroVis Plus Vernier cuvette tissues (preferably lint-free)
two small beakers test tube rack deionized water
Procedure for SpectroVis Plus 1. Plug the SpectroVis Plus into the computer via the USB cable.
2. Open Logger Pro. A blank plot displaying Absorbance vs. Wavelength (nm) should be displayed. If the x-axis reads Time or Concentration instead, clink on the “Configure Spectrometer” icon at the top (the one with a rainbow-filled area under a curve) and change the Collection Mode to Absorbance vs. Wavelength.
3. Fill cuvette 2/3 full with deionized water. In Logger Pro, calibrate the spectrometer by selecting “Calibrate” under the “Experiment” drop-down menu. When prompted for a blank cuvette, wipe down the cuvette with a Kim wipe and place it in the chamber with the clear sides facing the triangle and the white light icon. Remember the orientation, as you will need to put the cuvette into the chamber the same way each time.
4. Click on “Finish Calibration.” When calibration is complete, empty the cuvette then rinse it with small portions of your sample three times then fill it about 2/3 full. Wipe the cuvette and place it in the chamber with the same orientation as before.
5. Click on “Start Collection,” wait about 5 seconds, then click on “Stop Collection.”
6. Collect the spectra for the remaining samples using the same steps. Note that you do not need to re-calibrate the spectrometer.
7. Click on “Examine” to determine to the lmax’s and the absorption values. They should all have the same or very close lmax’s . Record the absorption values and the wavelength associated.
8. Take a screenshot of this data. Use Command+Shift+4 to execute the screenshot command on a mac. Then use the cross-hair to target the area to capture (click and drag).
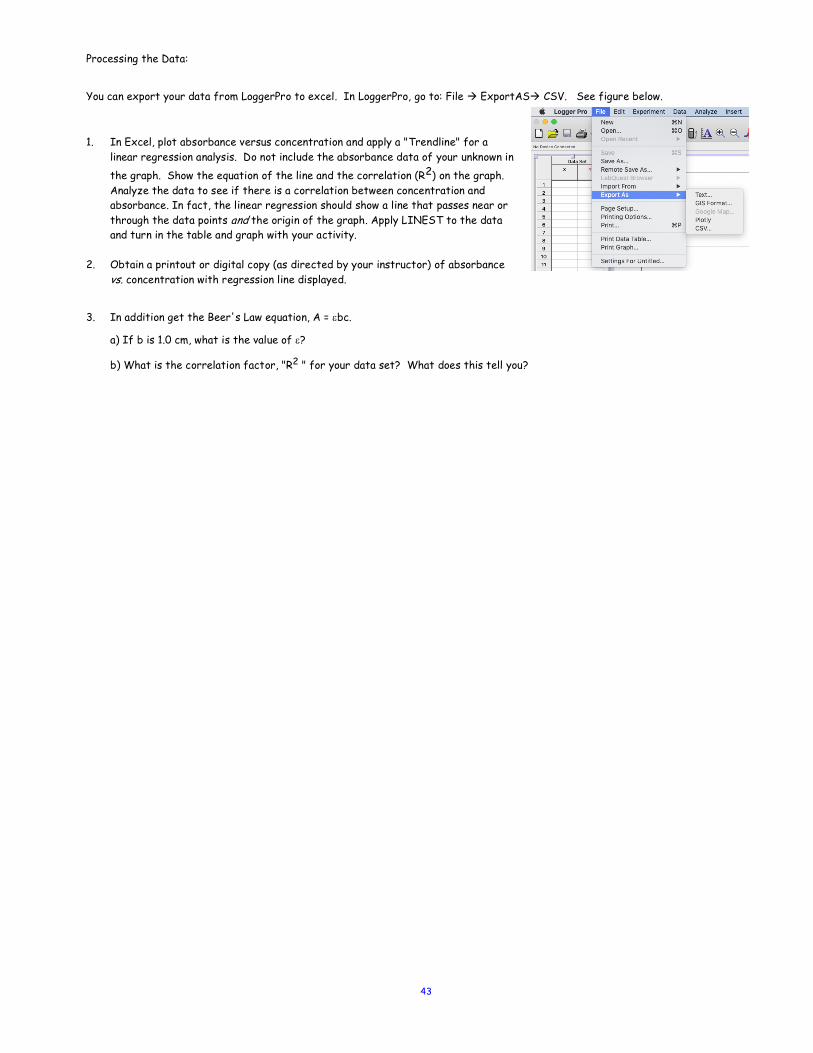
43
Processing the Data:
You can export your data from LoggerPro to excel. In LoggerPro, go to: File à ExportASà CSV. See figure below.
1. In Excel, plot absorbance versus concentration and apply a "Trendline" for a linear regression analysis. Do not include the absorbance data of your unknown in the graph. Show the equation of the line and the correlation (R2) on the graph. Analyze the data to see if there is a correlation between concentration and absorbance. In fact, the linear regression should show a line that passes near or through the data points and the origin of the graph. Apply LINEST to the data and turn in the table and graph with your activity.
2. Obtain a printout or digital copy (as directed by your instructor) of absorbance
vs. concentration with regression line displayed.
3. In addition get the Beer's Law equation, A = ebc.
a) If b is 1.0 cm, what is the value of e?
b) What is the correlation factor, "R2 " for your data set? What does this tell you?
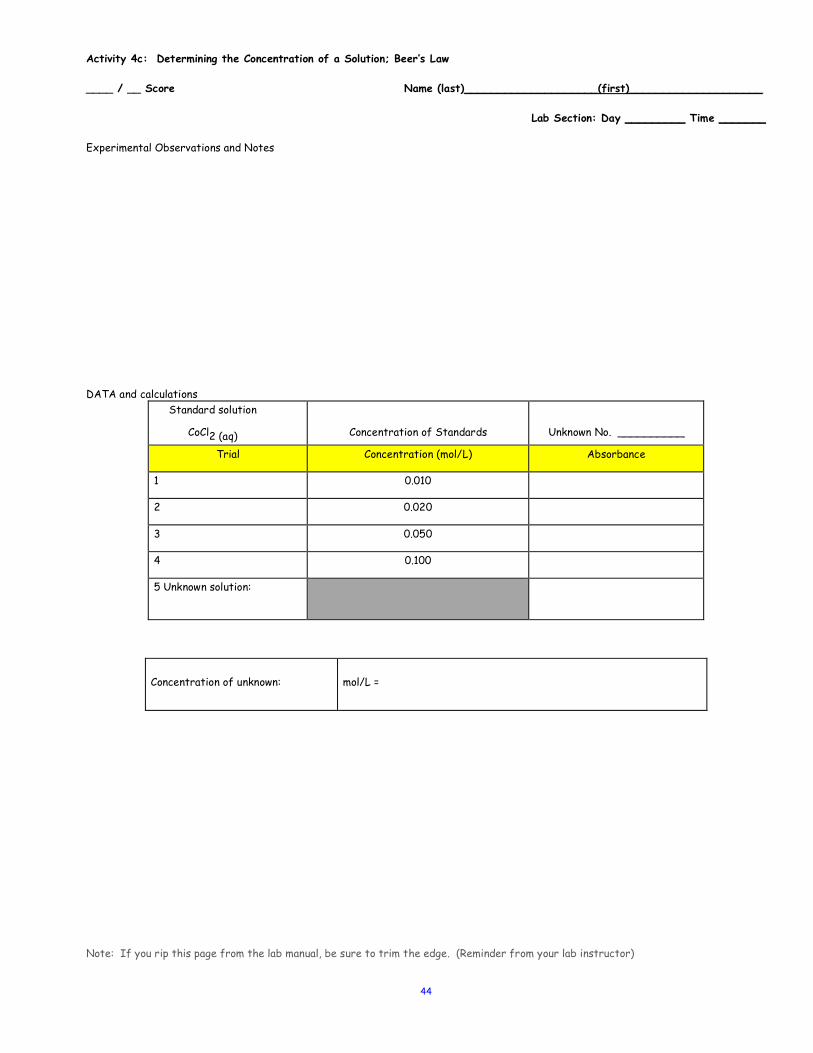
44
Activity 4c: Determining the Concentration of a Solution; Beer’s Law ____ / __ Score Name (last)____________________(first)____________________
Lab Section: Day _________ Time _______
Experimental Observations and Notes
DATA and calculations Standard solution
CoCl2 (aq)
Concentration of Standards
Unknown No. __________
Trial Concentration (mol/L) Absorbance
1 0.010
2 0.020
3 0.050
4 0.100
5 Unknown solution:
Concentration of unknown:
mol/L =
Note: If you rip this page from the lab manual, be sure to trim the edge. (Reminder from your lab instructor)
45
1. In Excel, plot absorbance versus concentration and apply a "Trendline" for a linear regression analysis. Do not include the
absorbance data of your unknown in the graph. Show the equation of the line and the correlation (R2) on the graph. Analyze the data to see if there is a correlation between concentration and absorbance. In fact, the linear regression should show a line that passes near or through the data points and the origin of the graph. Apply LINEST to the data and turn in the table and graph with your activity.
2. Obtain a printout or digital copy (as directed by your instructor) of absorbance vs. concentration with regression line displayed.
3. In addition get the Beer's Law equation, A = ebc.
a) If b is 1.0 cm, what is the value of e?
b) What is the correlation factor, "R2 " for your data set? What does this tell you?
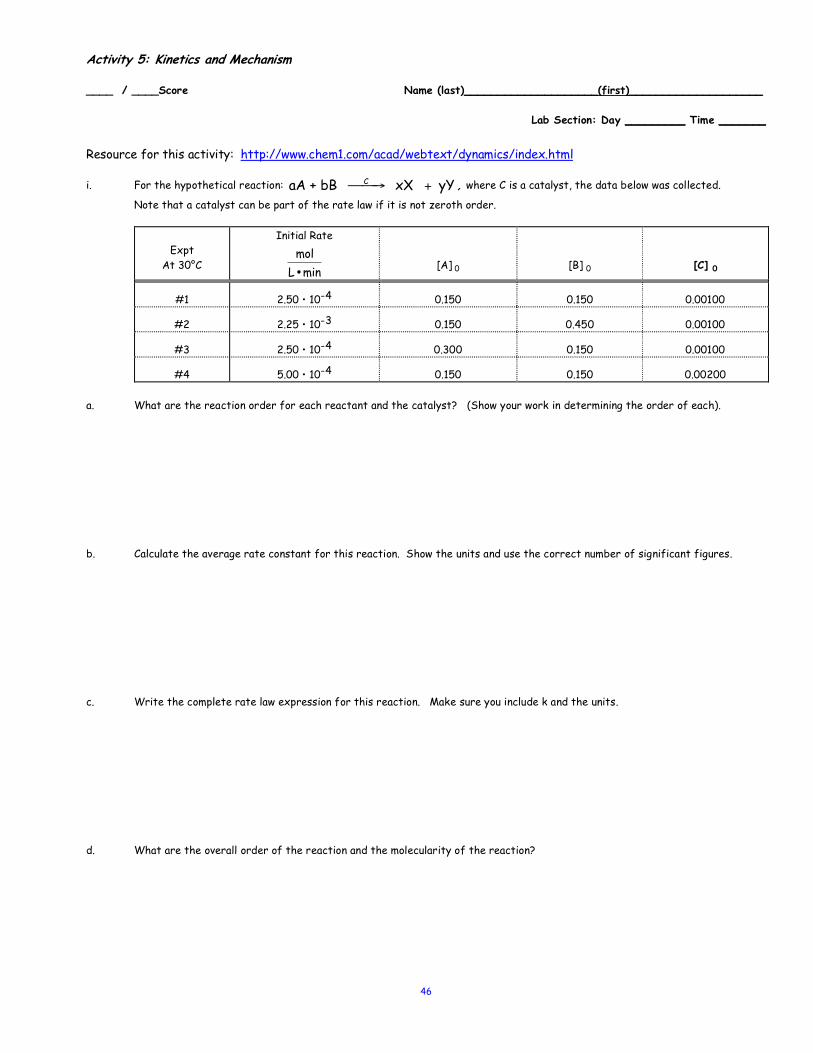
46
Activity 5: Kinetics and Mechanism ____ / ____Score Name (last)____________________(first)____________________
Lab Section: Day _________ Time _______
Resource for this activity: http://www.chem1.com/acad/webtext/dynamics/index.html
i. For the hypothetical reaction: , where C is a catalyst, the data below was collected.
Note that a catalyst can be part of the rate law if it is not zeroth order.
Expt
At 30°C
Initial Rate
[A] 0
[B] 0
[C] 0
#1 2.50 • 10-4 0.150 0.150 0.00100
#2 2.25 • 10-3 0.150 0.450 0.00100
#3 2.50 • 10-4 0.300 0.150 0.00100
#4 5.00 • 10-4 0.150 0.150 0.00200 a. What are the reaction order for each reactant and the catalyst? (Show your work in determining the order of each). b. Calculate the average rate constant for this reaction. Show the units and use the correct number of significant figures. c. Write the complete rate law expression for this reaction. Make sure you include k and the units. d. What are the overall order of the reaction and the molecularity of the reaction?
aA + bB C! →! xX + yY
molL •min
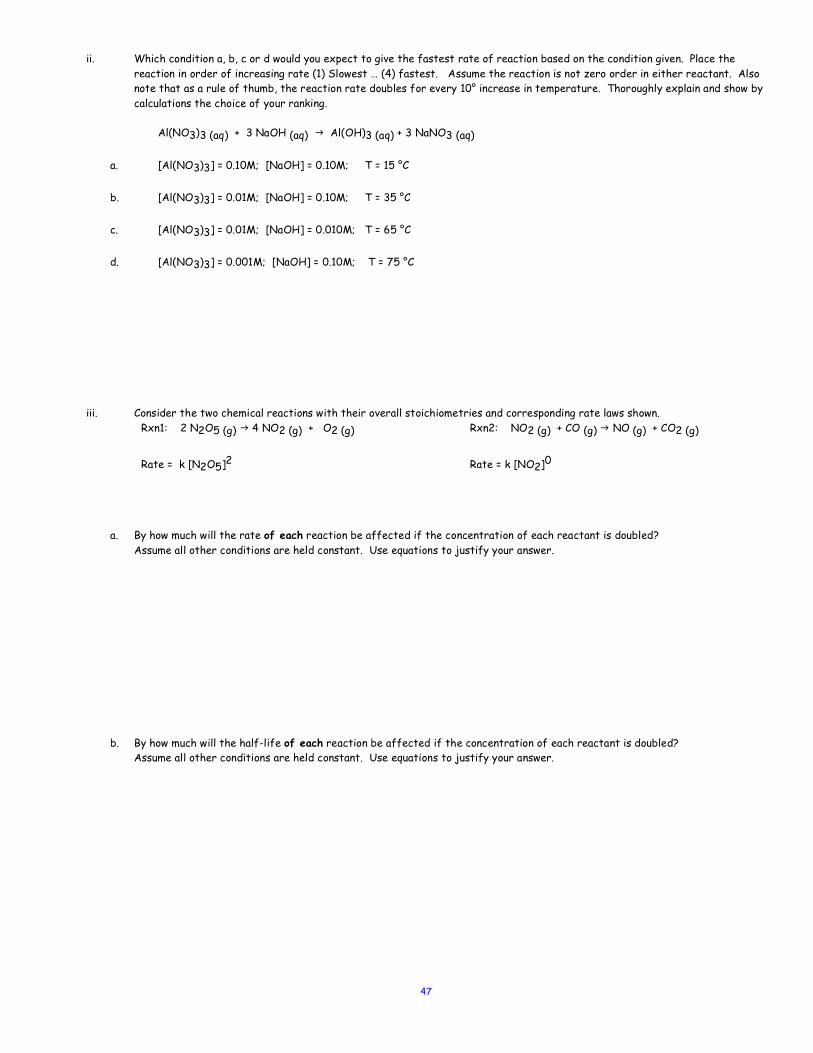
47
ii. Which condition a, b, c or d would you expect to give the fastest rate of reaction based on the condition given. Place the reaction in order of increasing rate (1) Slowest … (4) fastest. Assume the reaction is not zero order in either reactant. Also note that as a rule of thumb, the reaction rate doubles for every 10° increase in temperature. Thoroughly explain and show by calculations the choice of your ranking.
Al(NO3)3 (aq) + 3 NaOH (aq) g Al(OH)3 (aq) + 3 NaNO3 (aq) a. [Al(NO3)3] = 0.10M; [NaOH] = 0.10M; T = 15 °C b. [Al(NO3)3] = 0.01M; [NaOH] = 0.10M; T = 35 °C c. [Al(NO3)3] = 0.01M; [NaOH] = 0.010M; T = 65 °C d. [Al(NO3)3] = 0.001M; [NaOH] = 0.10M; T = 75 °C
iii. Consider the two chemical reactions with their overall stoichiometries and corresponding rate laws shown.
Rxn1: 2 N2O5 (g) g 4 NO2 (g) + O2 (g)
Rate = k [N2O5]2
Rxn2: NO2 (g) + CO (g) g NO (g) + CO2 (g)
Rate = k [NO2]0
a. By how much will the rate of each reaction be affected if the concentration of each reactant is doubled? Assume all other conditions are held constant. Use equations to justify your answer.
b. By how much will the half-life of each reaction be affected if the concentration of each reactant is doubled? Assume all other conditions are held constant. Use equations to justify your answer.
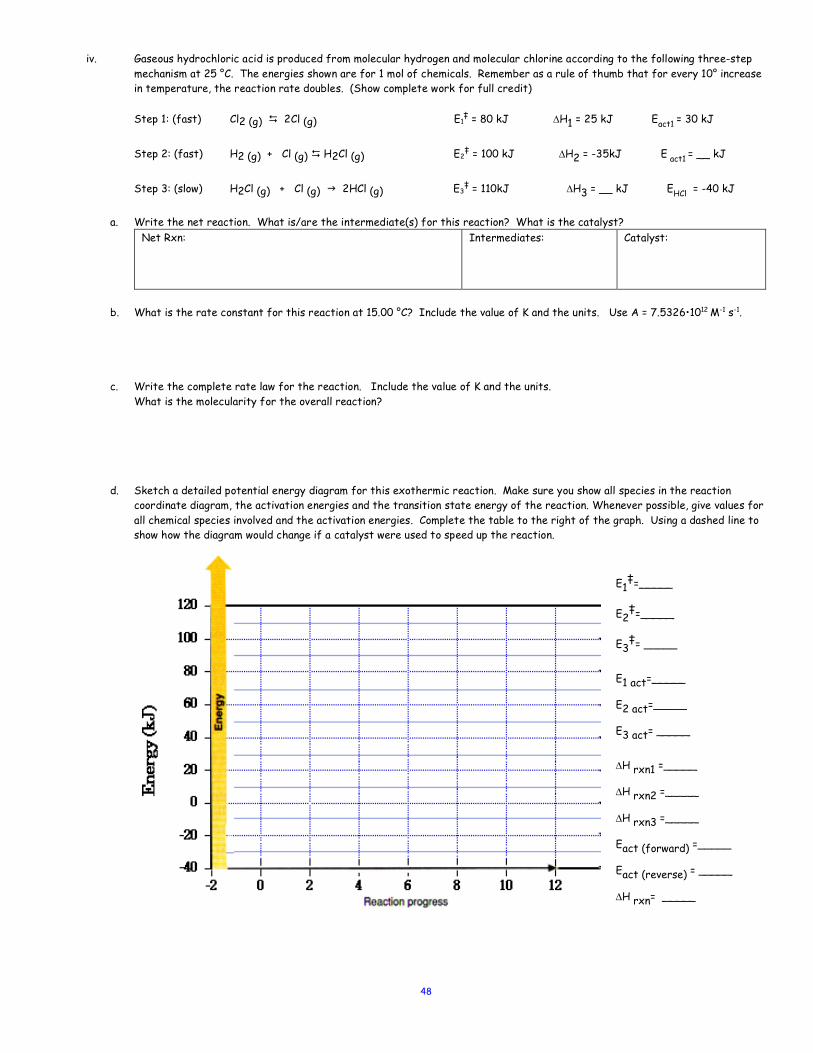
48
iv. Gaseous hydrochloric acid is produced from molecular hydrogen and molecular chlorine according to the following three-step mechanism at 25 °C. The energies shown are for 1 mol of chemicals. Remember as a rule of thumb that for every 10° increase in temperature, the reaction rate doubles. (Show complete work for full credit) Step 1: (fast) Cl2 (g) D 2Cl (g) E1
‡ = 80 kJ DH1 = 25 kJ Eact1 = 30 kJ
Step 2: (fast) H2 (g) + Cl (g) D H2Cl (g) E2
‡ = 100 kJ DH2 = -35kJ E act1 = __ kJ Step 3: (slow) H2Cl (g) + Cl (g) g 2HCl (g) E3
‡ = 110kJ DH3 = __ kJ EHCl = -40 kJ
a. Write the net reaction. What is/are the intermediate(s) for this reaction? What is the catalyst?
Net Rxn:
Intermediates: Catalyst:
b. What is the rate constant for this reaction at 15.00 °C? Include the value of K and the units. Use A = 7.5326•1012 M-1 s-1. c. Write the complete rate law for the reaction. Include the value of K and the units.
What is the molecularity for the overall reaction? d. Sketch a detailed potential energy diagram for this exothermic reaction. Make sure you show all species in the reaction
coordinate diagram, the activation energies and the transition state energy of the reaction. Whenever possible, give values for all chemical species involved and the activation energies. Complete the table to the right of the graph. Using a dashed line to show how the diagram would change if a catalyst were used to speed up the reaction.
E1‡=_____
E2‡=_____
E3‡= _____
E1 act=_____
E2 act=_____
E3 act= _____
DH rxn1 =_____
DH rxn2 =_____
DH rxn3 =_____
Eact (forward) =_____
Eact (reverse) = _____
DH rxn= _____

49
50
Activity 6: Chemical Equilibrium and Application of LeChâtelier’s Principle
Objective: The purpose of this exercise is to use the concept of LeChâtelier's Principle to predict the direction of a reaction system,
originally at equilibrium, due to a stress that is imposed on the reaction system.
Discussion: At the start of a reaction, only reactants are present. As the reaction proceeds, reactants are transformed into products.
Reactant concentrations decrease while product concentrations increase.
A + B g C + D (forward reaction)
When the products come into contact with each other, they too can react, in this case, to reform some of the reactants.
A + B f C + D (reverse reaction)
The forward reaction and the reverse reaction occur simultaneously. As the reaction progresses forward, reactant concentrations
decrease and product concentrations increase to a point at which the rates of the forward and reverse reactions are equal.
A + B D C + D
This is referred to as equilibrium. Reactants and products continue to be in equilibrium until some kind of stress is applied to the
reaction system. When stress is applied, the equilibrium is disturbed and the system reacts to relieve this stress. Eventually, the
system is restored to a new point of equilibrium. This effect of stress on a system at equilibrium is referred to as LeChâtelier's
Principle.
Le Châtelier's Principle states that if a system at equilibrium is disturbed by a change in temperature, pressure, or the concentration of
one of the components, the system will shift its equilibrium position to counteract the effect of the disturbance. Changing the
concentration or pressure of a substance in a reaction at equilibrium is creating stress. The removal of something creates a “deficit
stress,” and adding something creates “excess stress.” Reactions will always respond to stress by adding to the deficit (making more of
what was removed) or by reducing the excess (consuming some of what was added). This description works regardless of which side of
the reaction is changing, as long as the chemicals changing are either in the aqueous or gas phase.
Le Châtelier's Principle also applies if the temperature changes for a system at equilibrium. An increase in the temperature of a system
at equilibrium will shift the reaction so that it will absorb the heat. A catalyst does not change the value of the equilibrium constant,
however, and therefore does not affect the direction of the reaction.
In this exercise, you will state what occurs when the concentrations of reactants and products in a system at equilibrium are changed.
One possible change is to increase concentration by adding more of one substance. If, for example, more B is added, some A reacts to
remove the excess B. In the process, the reaction shifts to the right as more C and D are produced. The products C and D increase
concentration as the concentrations of A and B decreases from its concentration after B was added. This process continues until a new
equilibrium is reached at which time the concentration remains constant for all chemicals.
Another possibility is to decrease concentration by removing one of the chemicals involved in the equilibrium. If for example, some B is
removed, some C and D react to restore some of the B that was removed. In the process, the reaction shifts to the left as the
concentrations of A and B increase from its concentration after B was removed. At the same time, the concentrations of C and D
decrease as they are used up to form A and B. This occurs until equilibrium is reestablished.
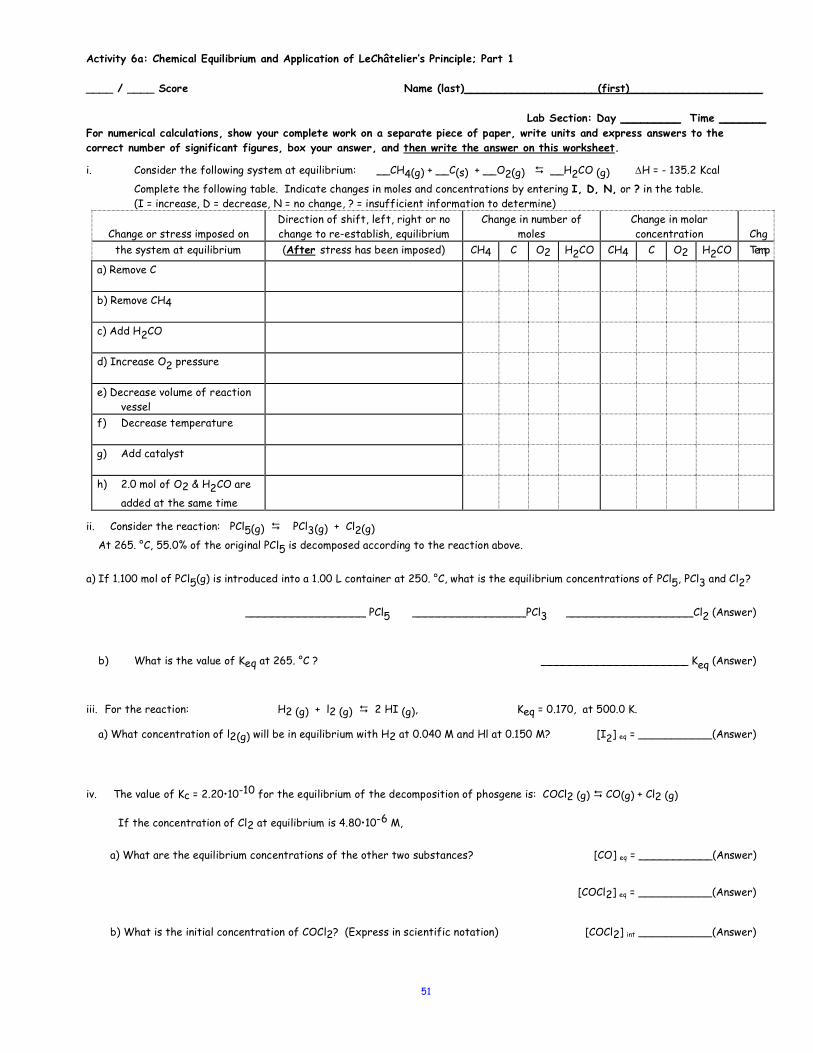
51
Activity 6a: Chemical Equilibrium and Application of LeChâtelier’s Principle; Part 1 ____ / ____ Score Name (last)____________________(first)____________________
Lab Section: Day _________ Time _______
For numerical calculations, show your complete work on a separate piece of paper, write units and express answers to the correct number of significant figures, box your answer, and then write the answer on this worksheet.
i. Consider the following system at equilibrium: __CH4(g) + __C(s) + __O2(g) D __H2CO (g) DH = - 135.2 Kcal Complete the following table. Indicate changes in moles and concentrations by entering I, D, N, or ? in the table.
(I = increase, D = decrease, N = no change, ? = insufficient information to determine)
Change or stress imposed on Direction of shift, left, right or no change to re-establish, equilibrium
Change in number of moles
Change in molar concentration
Chg
the system at equilibrium (After stress has been imposed) CH4 C O2 H2CO CH4 C O2 H2CO Temp
a) Remove C
b) Remove CH4
c) Add H2CO
d) Increase O2 pressure
e) Decrease volume of reaction vessel
f) Decrease temperature
g) Add catalyst
h) 2.0 mol of O2 & H2CO are
added at the same time
ii. Consider the reaction: PCl5(g) D PCl3(g) + Cl2(g)
At 265. °C, 55.0% of the original PCl5 is decomposed according to the reaction above.
a) If 1.100 mol of PCl5(g) is introduced into a 1.00 L container at 250. °C, what is the equilibrium concentrations of PCl5, PCl3 and Cl2?
__________________ PCl5 _________________PCl3 ___________________Cl2 (Answer)
b) What is the value of Keq at 265. °C ? ______________________ Keq (Answer)
iii. For the reaction: H2 (g) + l2 (g) D 2 HI (g), Keq = 0.170, at 500.0 K.
a) What concentration of l2(g) will be in equilibrium with H2 at 0.040 M and Hl at 0.150 M? [I2] eq = ___________(Answer)
iv. The value of Kc = 2.20•10-10 for the equilibrium of the decomposition of phosgene is: COCl2 (g) D CO(g) + Cl2 (g)
If the concentration of Cl2 at equilibrium is 4.80•10-6 M,
a) What are the equilibrium concentrations of the other two substances? [CO] eq = ___________(Answer)
[COCl2] eq = ___________(Answer)
b) What is the initial concentration of COCl2? (Express in scientific notation) [COCl2] int ___________(Answer)
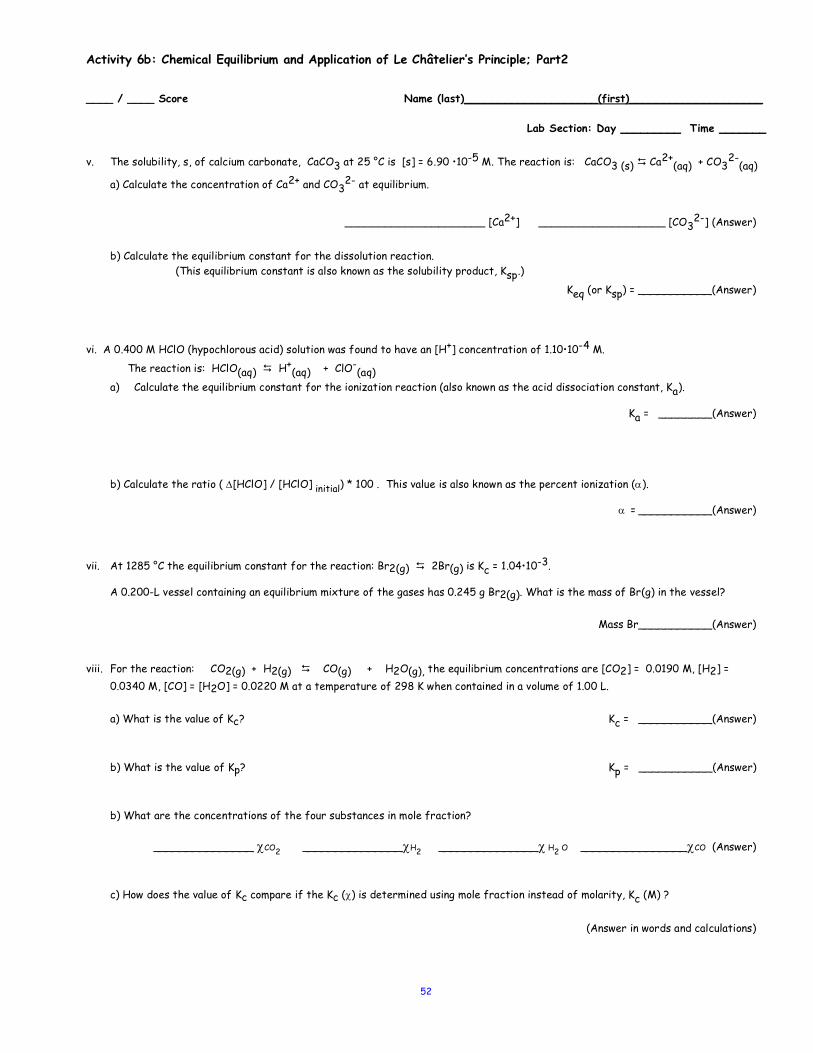
52
Activity 6b: Chemical Equilibrium and Application of Le Châtelier’s Principle; Part2
____ / ____ Score Name (last)____________________(first)____________________
Lab Section: Day _________ Time _______
v. The solubility, s, of calcium carbonate, CaCO3 at 25 °C is [s] = 6.90 •10-5 M. The reaction is: CaCO3 (s) D Ca2+
(aq) + CO3
2-(aq)
a) Calculate the concentration of Ca2+ and CO32- at equilibrium.
_____________________ [Ca2+] ___________________ [CO3
2-] (Answer)
b) Calculate the equilibrium constant for the dissolution reaction. (This equilibrium constant is also known as the solubility product, Ksp.)
Keq (or Ksp) = ___________(Answer)
vi. A 0.400 M HClO (hypochlorous acid) solution was found to have an [H+] concentration of 1.10•10-4 M.
The reaction is: HClO(aq) D H+(aq) + ClO-
(aq)
a) Calculate the equilibrium constant for the ionization reaction (also known as the acid dissociation constant, Ka).
Ka = ________(Answer)
b) Calculate the ratio ( D[HClO] / [HClO] initial) * 100 . This value is also known as the percent ionization (a).
a = ___________(Answer)
vii. At 1285 °C the equilibrium constant for the reaction: Br2(g) D 2Br(g) is Kc = 1.04•10-3.
A 0.200-L vessel containing an equilibrium mixture of the gases has 0.245 g Br2(g). What is the mass of Br(g) in the vessel?
Mass Br___________(Answer)
viii. For the reaction: CO2(g) + H2(g) D CO(g) + H2O(g), the equilibrium concentrations are [CO2] = 0.0190 M, [H2] = 0.0340 M, [CO] = [H2O] = 0.0220 M at a temperature of 298 K when contained in a volume of 1.00 L.
a) What is the value of Kc? Kc = ___________(Answer)
b) What is the value of Kp? Kp = ___________(Answer)
b) What are the concentrations of the four substances in mole fraction?
_______________ cCO2 _______________cH2 _______________c H2 O ________________cCO (Answer)
c) How does the value of Kc compare if the Kc (c) is determined using mole fraction instead of molarity, Kc (M) ?
(Answer in words and calculations)

53
54
Activity 7: Basics of Acid/Base Chemistry
Objective: The purpose of this exercise is to gain proficiency in working with a variety of acid-base problems.
Discussion: Acids are commonly described as sour, tasting like vinegar or lemon juice. Water solutions of bases are said to taste bitter
and feel slippery, but most strong bases like lye (sodium hydroxide) are too bitter and harsh to be tasted. Examples of milder bases are
slaked lime (calcium hydroxide) and ammonium hydroxide. Solutions of ammonia, NH3, in water are often called ammonium hydroxide,
NH4OH, because ammonium ions, NH4+ , and hydroxide ions, OH-, are formed in low concentration in the reaction with water.
NH3(aq) + H2O(aq) D NH4+(aq) + OH-(aq)
Acids are characterized by the presence of H+ ions (actually H3O+ ions) in water solutions, and bases are typically those compounds
having OH- ions. The H+ ions of acids and the OH- ions of bases react with each other to form water, so acids and bases are said to
neutralize each other. For this reason they are considered to be opposites. In this exercise, you will learn to measure and to express in
concise terms the degree of acidity or basicity of a solution. The famed pH scale was devised precisely for this purpose.
An understanding of acidity and basicity in water solution is grounded on the concept of the auto-ionization of water. Pure water auto-
ionizes only about 0.000001%, or 2 in 1 billion; the auto-ionization reaction is shown in the following equation.
H2O + H2O D H3O+ + OH-
The hydronium ion, H3O+ is often written as H+. The ionization of water can be simplified to
H2O D H+ + OH-
The equation shows that in pure water, there are as many H+ ions as there are OH- ions; that is, the H+ ion concentration, [H+], and the
OH- concentration, [OH-], are equal. The actual concentration of each is very small. In pure water at 20 °C, these are both known
experimentally to be only 1 x 10⁻⁷ (0.0000001) mole/L, or 1 x 10⁻⁷ molar (M).
[H+] = [OH-] = 1 x 10⁻⁷ mole/L
In acid solution, the H+ ion (or hydronium ion) concentration is greater than 10-7 mole/L, and the OH- ion (or hydroxide ion)
concentration is less than 10-7: [H+ ] > [OH-]. In basic solution, the opposite is true, and OH- ions predominate: [OH-] > [H+].
The dissociation of water can be described by an equilibrium expression, just like any other reaction at equilibrium. The equilibrium
constant for water, Kw, is found by multiplying the concentration of H+ and OH- ions in pure water, 1 x 10⁻⁷ mole/L for each.
Kw = [H+] [OH-] = (1 x 10⁻⁷)2 = 1 x 10-14
In any aqueous solution at room temperature, the product of the H+ and OH- ion concentrations is always equal to 10-14. As the
concentration of H+ ions becomes greater (in acidic solutions), the OH- ion concentration necessarily becomes smaller; the product of
the two always equals 10-14. Both kinds of ions are present in all water solutions. The acidity or basicity of the solution depends on
which ion predominates. If their concentrations are equal (at 10-7mole/L), the solution is neutral. For example, if the H+ ion
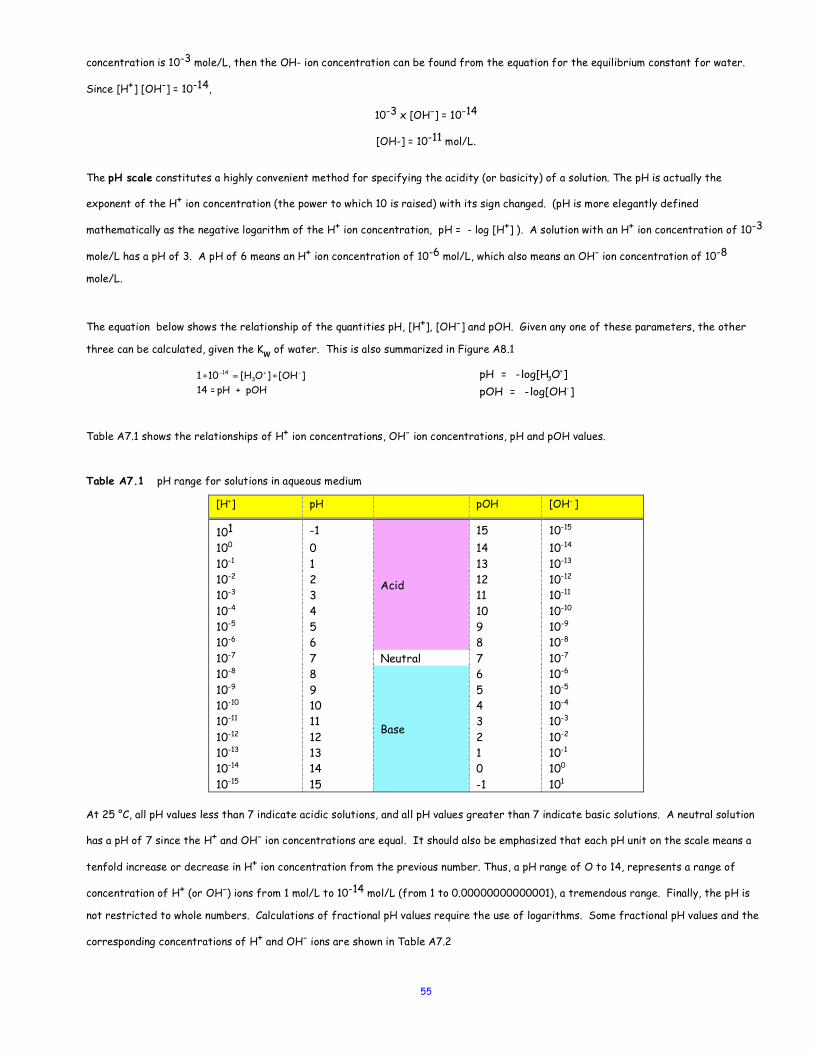
55
concentration is 10-3 mole/L, then the OH- ion concentration can be found from the equation for the equilibrium constant for water.
Since [H+] [OH-] = 10-14,
10-3 x [OH-] = 10-14
[OH-] = 10-11 mol/L.
The pH scale constitutes a highly convenient method for specifying the acidity (or basicity) of a solution. The pH is actually the
exponent of the H+ ion concentration (the power to which 10 is raised) with its sign changed. (pH is more elegantly defined
mathematically as the negative logarithm of the H+ ion concentration, pH = - log [H+] ). A solution with an H+ ion concentration of 10-3
mole/L has a pH of 3. A pH of 6 means an H+ ion concentration of 10-6 mol/L, which also means an OH- ion concentration of 10-8
mole/L.
The equation below shows the relationship of the quantities pH, [H+], [OH-] and pOH. Given any one of these parameters, the other
three can be calculated, given the Kw of water. This is also summarized in Figure A8.1
Table A7.1 shows the relationships of H+ ion concentrations, OH- ion concentrations, pH and pOH values.
Table A7.1 pH range for solutions in aqueous medium
[H+] pH pOH [OH- ]
101 -1
Acid
15 10-15 100 0 14 10-14 10-1 1 13 10-13 10-2 2 12 10-12 10-3 3 11 10-11 10-4 4 10 10-10 10-5 5 9 10-9 10-6 6 8 10-8 10-7 7 Neutral 7 10-7 10-8 8
Base
6 10-6 10-9 9 5 10-5 10-10 10 4 10-4 10-11 11 3 10-3 10-12 12 2 10-2 10-13 13 1 10-1 10-14 14 0 100 10-15 15 -1 101
At 25 °C, all pH values less than 7 indicate acidic solutions, and all pH values greater than 7 indicate basic solutions. A neutral solution
has a pH of 7 since the H+ and OH- ion concentrations are equal. It should also be emphasized that each pH unit on the scale means a
tenfold increase or decrease in H+ ion concentration from the previous number. Thus, a pH range of O to 14, represents a range of
concentration of H+ (or OH-) ions from 1 mol/L to 10-14 mol/L (from 1 to 0.00000000000001), a tremendous range. Finally, the pH is
not restricted to whole numbers. Calculations of fractional pH values require the use of logarithms. Some fractional pH values and the
corresponding concentrations of H+ and OH- ions are shown in Table A7.2
€
1∗10−14 = [H3O+] ∗[OH−]14 = pH + pOH
€
pH = -log[H3O+]pOH = -log[OH-]
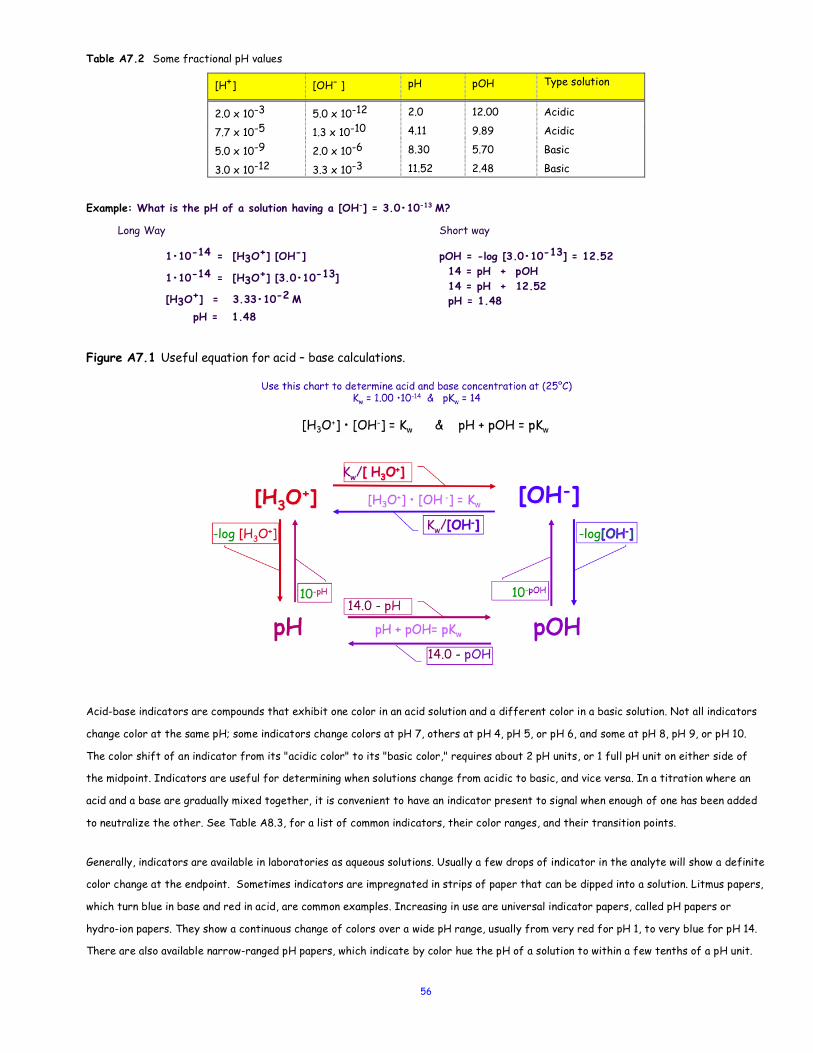
56
Table A7.2 Some fractional pH values
[H+] [OH- ] pH pOH Type solution
2.0 x 10⁻³ 5.0 x 10⁻¹² 2.0 12.00 Acidic
7.7 x 10⁻⁵ 1.3 x 10⁻¹⁰ 4.11 9.89 Acidic
5.0 x 10⁻⁹ 2.0 x 10⁻⁶ 8.30 5.70 Basic
3.0 x 10⁻¹² 3.3 x 10⁻³ 11.52 2.48 Basic
Example: What is the pH of a solution having a [OH-] = 3.0•10-13 M?
Long Way Short way
1•10-14 = [H3O+] [OH-]
1•10-14 = [H3O+] [3.0•10-13]
[H3O+] = 3.33•10-2 M pH = 1.48
pOH = -log [3.0•10-13] = 12.52 14 = pH + pOH 14 = pH + 12.52 pH = 1.48
Figure A7.1 Useful equation for acid – base calculations.
Acid-base indicators are compounds that exhibit one color in an acid solution and a different color in a basic solution. Not all indicators
change color at the same pH; some indicators change colors at pH 7, others at pH 4, pH 5, or pH 6, and some at pH 8, pH 9, or pH 10.
The color shift of an indicator from its "acidic color" to its "basic color," requires about 2 pH units, or 1 full pH unit on either side of
the midpoint. Indicators are useful for determining when solutions change from acidic to basic, and vice versa. In a titration where an
acid and a base are gradually mixed together, it is convenient to have an indicator present to signal when enough of one has been added
to neutralize the other. See Table A8.3, for a list of common indicators, their color ranges, and their transition points.
Generally, indicators are available in laboratories as aqueous solutions. Usually a few drops of indicator in the analyte will show a definite
color change at the endpoint. Sometimes indicators are impregnated in strips of paper that can be dipped into a solution. Litmus papers,
which turn blue in base and red in acid, are common examples. Increasing in use are universal indicator papers, called pH papers or
hydro-ion papers. They show a continuous change of colors over a wide pH range, usually from very red for pH 1, to very blue for pH 14.
There are also available narrow-ranged pH papers, which indicate by color hue the pH of a solution to within a few tenths of a pH unit.
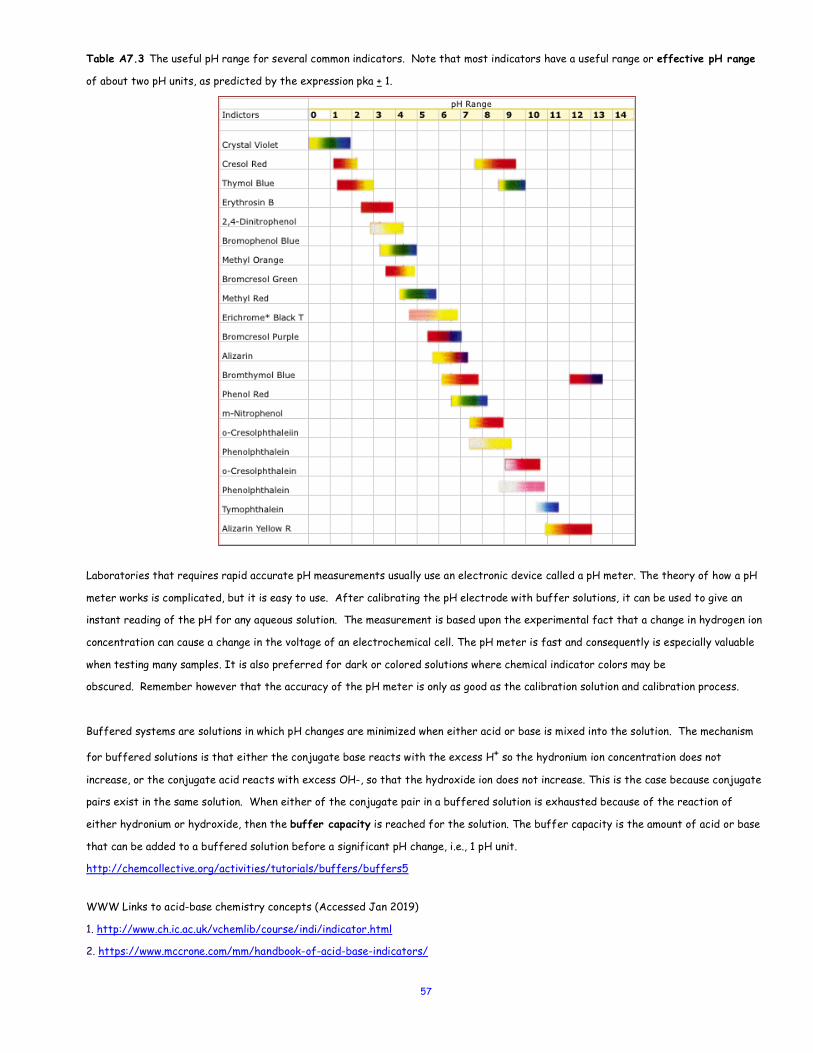
57
Table A7.3 The useful pH range for several common indicators. Note that most indicators have a useful range or effective pH range
of about two pH units, as predicted by the expression pka + 1.
Laboratories that requires rapid accurate pH measurements usually use an electronic device called a pH meter. The theory of how a pH
meter works is complicated, but it is easy to use. After calibrating the pH electrode with buffer solutions, it can be used to give an
instant reading of the pH for any aqueous solution. The measurement is based upon the experimental fact that a change in hydrogen ion
concentration can cause a change in the voltage of an electrochemical cell. The pH meter is fast and consequently is especially valuable
when testing many samples. It is also preferred for dark or colored solutions where chemical indicator colors may be
obscured. Remember however that the accuracy of the pH meter is only as good as the calibration solution and calibration process.
Buffered systems are solutions in which pH changes are minimized when either acid or base is mixed into the solution. The mechanism
for buffered solutions is that either the conjugate base reacts with the excess H+ so the hydronium ion concentration does not
increase, or the conjugate acid reacts with excess OH-, so that the hydroxide ion does not increase. This is the case because conjugate
pairs exist in the same solution. When either of the conjugate pair in a buffered solution is exhausted because of the reaction of
either hydronium or hydroxide, then the buffer capacity is reached for the solution. The buffer capacity is the amount of acid or base
that can be added to a buffered solution before a significant pH change, i.e., 1 pH unit.
http://chemcollective.org/activities/tutorials/buffers/buffers5
WWW Links to acid-base chemistry concepts (Accessed Jan 2019)
1. http://www.ch.ic.ac.uk/vchemlib/course/indi/indicator.html
2. https://www.mccrone.com/mm/handbook-of-acid-base-indicators/
58
Activity 7a: Basics of Acid/Base Chemistry; Part 1
_____ /___Score Name (last)____________________(first)____________________
Lab Section: Day _________ Time _______
Read and follow these directions: For numerical calculations, show your complete work on a separate piece of paper, box your answers, and then write the answer on this worksheet. Remember to use the correct number of significant figures. i. For each chemical listed, write the reaction of these ions in water. Include the phases of all species. Identify and label the
conjugate pairs in your reactions and write the equilibrium constant for each of the reactions you propose. (Use Appendix 9).
a. HPO32-
b. F-
c. HCO3-
ii. (a) Phenoxide ion (C6H5O-) is a weak base, with Kb = 7.70 • 10-5. What is the pKa of the phenol, C6H5OH (conjugate of phenoxide
ion)? Calculate the pH of a 0.50 M aqueous solution of [C6H5O-]. ii. (b) Do you think the pH of 1,0 M tri-methyl ammonium (CH3)3NH+, pKa = 9.80, will be higher or lower than that of 1.0 M phenol,
C6H5OH? What is the difference in pH values for the two acids? iii. Hydrosulfuric acid, also known as hydrogen sulfide, is a diprotic acid. Its two stages of ionization are shown below:
H2S (aq) D H+ + HS-(aq) Kal 5.70 • 10-8
HS- (aq) D H+ + S2-(aq) Ka2 = 1.00 • 10-9
a) Calculate the concentration of HS- ion in a 0.222 M H2S solution. [HS-] =______________(Answer) b) Determine the pH of the solution. pH = ______________(Answer) c) Determine the S2- concentration. [S2-] = ______________(Answer)
iv. Methyl red is a common acid-base indicator. It has a Ka equal to 5.0•10-6. Its un-dissociated form is red and its anionic form is
yellow. a) What color would a methyl red solution have at pH = 7.00? Show your calculations and explain your answers (in words).
Hint: Determine the concentration ratio of methyl red and its conjugate.

59
60
Activity 7b: Acid/Base Chemistry, Common Ion Effect and Buffers; Part 2
_____ / ___Score Name (last)____________________(first)____________________
Lab Section: Day _________ Time _______
Show your calculations for full credit. Reference: https://labs.chem.ucsb.edu/zhang/liming/pdf/pKas_of_Organic_Acids_and_Bases.pdf v. a) Define buffer capacity and effective pH range.
b) What is the effective pH range for a sodium acetate/acetic acid buffer? Ka = 1.80 • 10-5. Explain your answer. ______________(Answer)
c) Calculate the pH of a solution that is 0.45 M CH3COOH and 0.75 M NaCH3COO. ______________(Answer)
vi. HCN is a weak acid with a Ka = 4.90 • 10-10. A 50.00 mL sample of this HCN solution (0.250 M) is titrated with 0.500 M NaOH. a) What is the pH of the original HCN solution?
______________(Answer)
b) What is the pH after 15 mL of NaOH is added? ______________(Answer) c) What is the pH at the equivalence point? ______________(Answer) vii. Rank the following in order of increasing pOH and justify: 0.10 M solutions of chloroacetic acid, carbonic acid, and citric acid Write out the order instead of placing 1, 2 ... viii. Rank the following in order of increasing pKa and justify: 0.10 M mandelic acid, 0.20 M maleic acid, 0.40 M malonic acid. Write out the order instead of placing 1, 2 ...

61
62
Activity 8a: Titration of Weak Acids and Bases; Part 1 ____ / ____Score Name (last)____________________(first)____________________
Lab Section: Day _________ Time _______
Read and follow these directions. For numerical calculations, show your complete work on a separate piece of paper, box your answer, and then write your answer on this worksheet. i. Consider the titration of 20.00 mL of 0.250 M HF solution with 0.250 M KOH. Calculate the pH at: 0.00, 5.00, 10.00, 19.00,
20.00 and 25.00 mL of added base. Sketch and label the titration curve for this problem. Enter your answers here.
Vol KOH 0.00-mL 5.00-mL 10.00-mL 19.00-mL 20.00-mL 25.00-mL pH
0
2
4
6
8
10
12
14
0 5 10 15 20 25 30 35 40 45 50

63
64
Activity 8b: Titration of Weak Acids and Bases; Part 2 ____ / ____Score Name (last)____________________(first)____________________
Lab Section: Day _________ Time _______
ii. Consider the titration of 50.0 mL of 0.200 M pyridine with 0.400 M HCl. Calculate the pH at: 0, 5.00, 12.50, 25.00, 26.00, and
50.00 mL of acid have been added. Sketch and label the titration curve for this problem. Enter your answers here.
Vol HCl 0.00-mL 5.00-mL 12.50-mL 25.00-mL 26.00-mL 50.00-mL pH
0
2
4
6
8
10
12
14
0 5 10 15 20 25 30 35 40 45 50

65
66
Activity 8c: Titration of Weak Acids and Bases; Part 3 ____ / ____Score Name (last)____________________(first)____________________
Lab Section: Day _________ Time _______
Titration simulation program: http://www.iq.usp.br/gutz/Curtipot_.html iii. If instructed, download the indicated program and carry out the following virtual titration. Otherwise, perform the
calculations by hand. Consider the titration of 20.0 mL of 0.100 M perchloric acid with 0.400 M LiOH. Calculate the pH at: 0.00%, 25.0%, 50.0%, 75.0%, 100.0% and 110.0% of equivalence. Complete the table below with your answers and print a properly-labeled copy of the plot (if you did this problem via simulation) or sketch the titration curve using the graph below (if you calculated by hand).
% Titration Vol Titrant pH Analyte 1 0.00% 2 25.0% 3 50.0% 4 75.0% 5 100.0% 6 110.0%
0
2
4
6
8
10
12
14
0 5 10 15 20 25 30 35 40 45 50

67
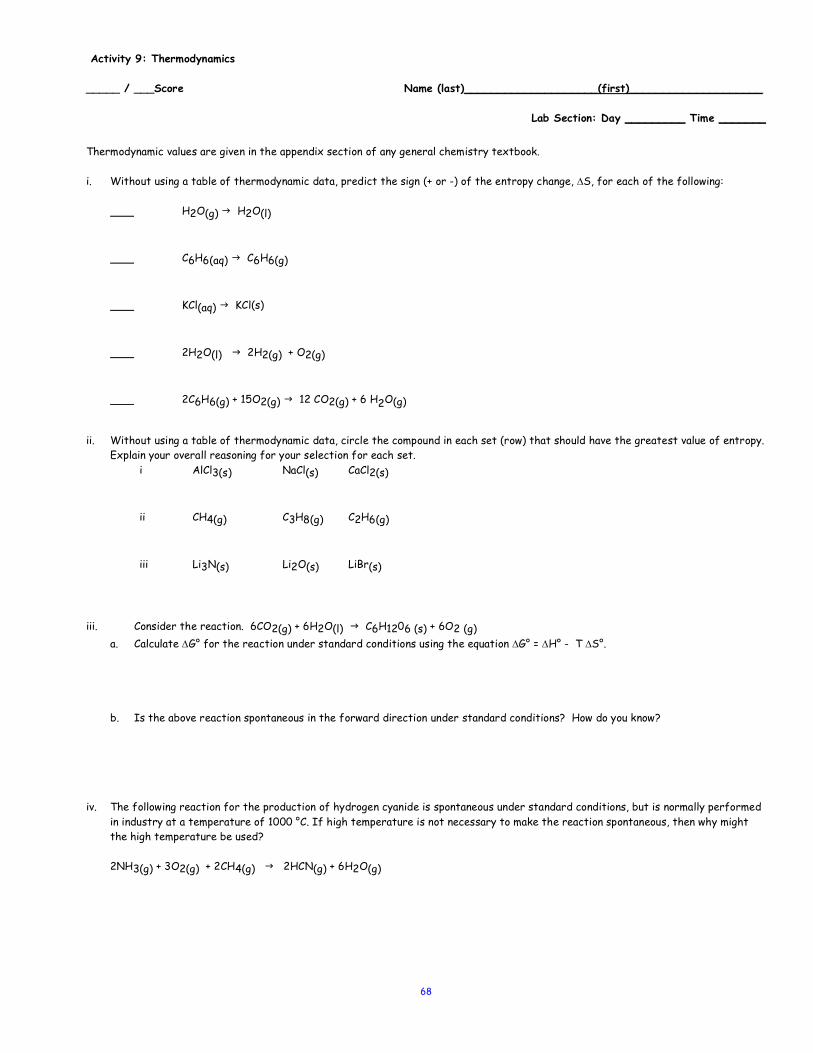
68
Activity 9: Thermodynamics _____ / ___Score Name (last)____________________(first)____________________
Lab Section: Day _________ Time _______
Thermodynamic values are given in the appendix section of any general chemistry textbook. i. Without using a table of thermodynamic data, predict the sign (+ or -) of the entropy change, DS, for each of the following:
H2O(g) g H2O(l)
C6H6(aq) g C6H6(g)
KCl(aq) g KCl(s)
2H2O(l) g 2H2(g) + O2(g)
2C6H6(g) + 15O2(g) g 12 CO2(g) + 6 H2O(g)
ii. Without using a table of thermodynamic data, circle the compound in each set (row) that should have the greatest value of entropy.
Explain your overall reasoning for your selection for each set. i AlCl3(s) NaCl(s) CaCl2(s)
ii CH4(g) C3H8(g) C2H6(g)
iii Li3N(s) Li2O(s) LiBr(s)
iii. Consider the reaction. 6CO2(g) + 6H2O(l) g C6H1206 (s) + 6O2 (g)
a. Calculate DG° for the reaction under standard conditions using the equation DG° = DH° - T DS°. b. Is the above reaction spontaneous in the forward direction under standard conditions? How do you know?
iv. The following reaction for the production of hydrogen cyanide is spontaneous under standard conditions, but is normally performed in industry at a temperature of 1000 °C. If high temperature is not necessary to make the reaction spontaneous, then why might the high temperature be used?
2NH3(g) + 3O2(g) + 2CH4(g) g 2HCN(g) + 6H2O(g)

69
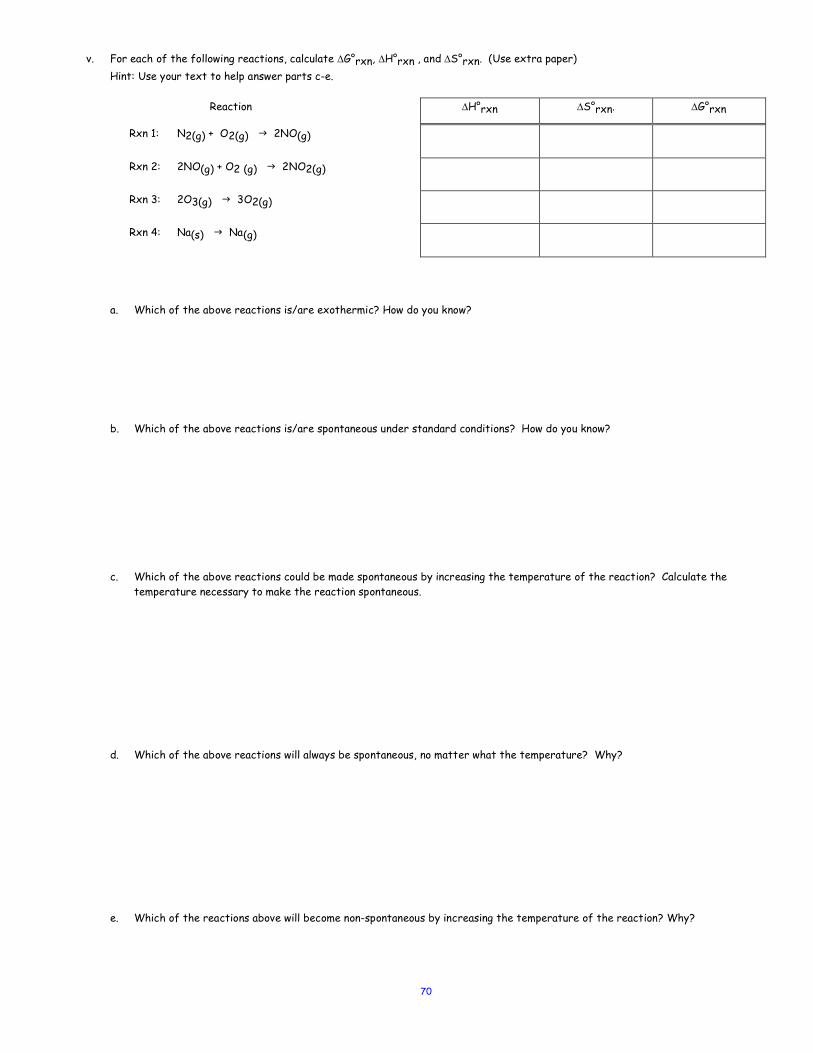
70
v. For each of the following reactions, calculate DG°rxn, DH°rxn , and DS°rxn. (Use extra paper) Hint: Use your text to help answer parts c-e.
Reaction DH°rxn DS°rxn. DG°rxn
Rxn 1: N2(g) + O2(g) g 2NO(g)
Rxn 2: 2NO(g) + O2 (g) g 2NO2(g)
Rxn 3: 2O3(g) g 3O2(g)
Rxn 4: Na(s) g Na(g)
a. Which of the above reactions is/are exothermic? How do you know?
b. Which of the above reactions is/are spontaneous under standard conditions? How do you know?
c. Which of the above reactions could be made spontaneous by increasing the temperature of the reaction? Calculate the temperature necessary to make the reaction spontaneous.
d. Which of the above reactions will always be spontaneous, no matter what the temperature? Why?
e. Which of the reactions above will become non-spontaneous by increasing the temperature of the reaction? Why?

71
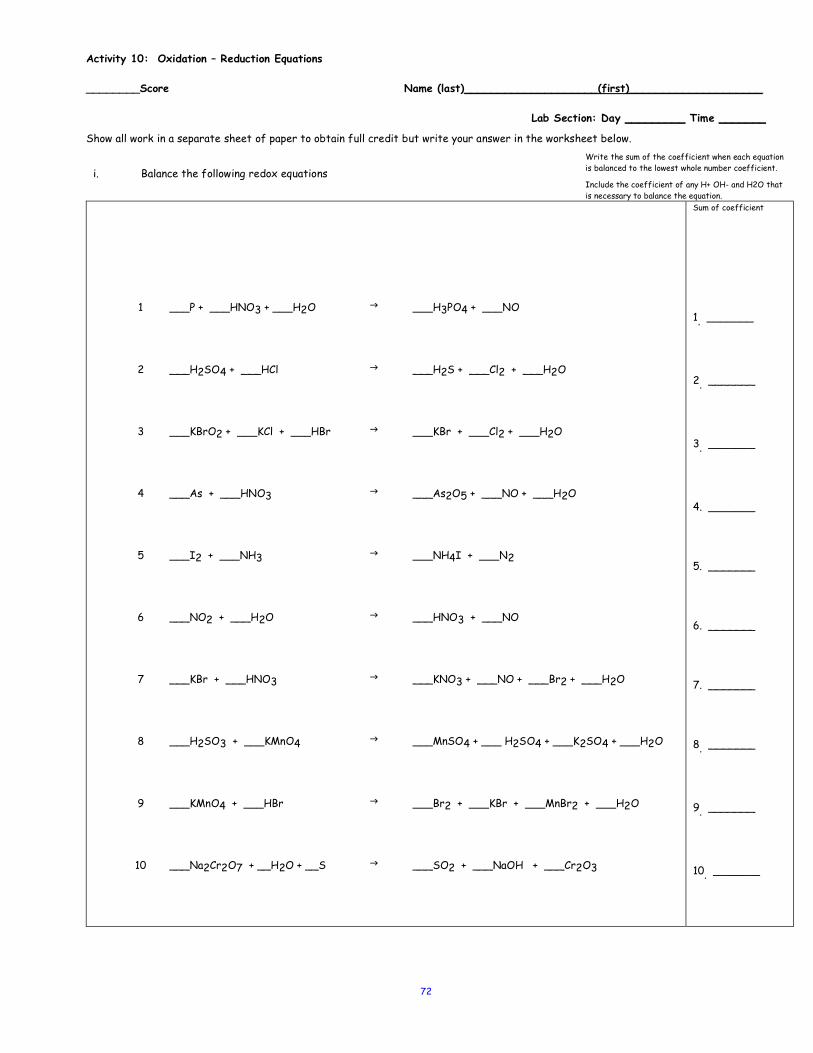
72
Activity 10: Oxidation – Reduction Equations ________Score Name (last)____________________(first)____________________
Lab Section: Day _________ Time _______
Show all work in a separate sheet of paper to obtain full credit but write your answer in the worksheet below.
i. Balance the following redox equations
Write the sum of the coefficient when each equation is balanced to the lowest whole number coefficient.
Include the coefficient of any H+ OH- and H2O that is necessary to balance the equation.
1 ___P + ___HNO3 + ___H2O g ___H3PO4 + ___NO
2 ___H2SO4 + ___HCl g ___H2S + ___Cl2 + ___H2O
3 ___KBrO2 + ___KCl + ___HBr g ___KBr + ___Cl2 + ___H2O
4 ___As + ___HNO3 g ___As2O5 + ___NO + ___H2O
5 ___I2 + ___NH3 g ___NH4I + ___N2
6 ___NO2 + ___H2O g ___HNO3 + ___NO
7 ___KBr + ___HNO3 g ___KNO3 + ___NO + ___Br2 + ___H2O
8 ___H2SO3 + ___KMnO4 g ___MnSO4 + ___ H2SO4 + ___K2SO4 + ___H2O
9 ___KMnO4 + ___HBr g ___Br2 + ___KBr + ___MnBr2 + ___H2O
10 ___Na2Cr2O7 + __H2O + __S g ___SO2 + ___NaOH + ___Cr2O3
Sum of coefficient
1. _______
2. _______
3. _______
4. _______
5. _______
6. _______
7. _______
8. _______
9. _______
10. _______
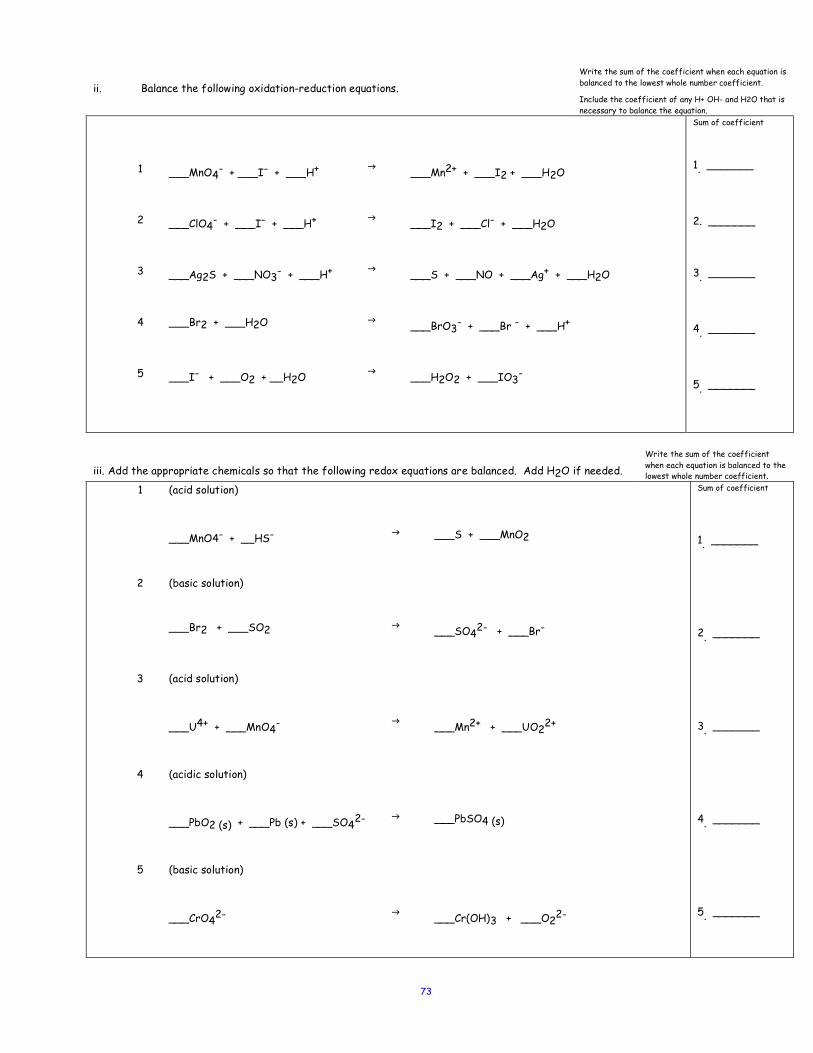
73
ii. Balance the following oxidation-reduction equations.
Write the sum of the coefficient when each equation is balanced to the lowest whole number coefficient.
Include the coefficient of any H+ OH- and H2O that is necessary to balance the equation.
1 ___MnO4- + ___I- + ___H+ g ___Mn2+ + ___I2 + ___H2O
2 ___ClO4- + ___I- + ___H+ g ___I2 + ___Cl- + ___H2O
3 ___Ag2S + ___NO3- + ___H+ g ___S + ___NO + ___Ag+ + ___H2O
4 ___Br2 + ___H2O g ___BrO3- + ___Br - + ___H+
5 ___I- + ___O2 + __H2O g ___H2O2 + ___IO3-
Sum of coefficient
1. _______
2. _______
3. _______
4. _______
5. _______
iii. Add the appropriate chemicals so that the following redox equations are balanced. Add H2O if needed.
Write the sum of the coefficient when each equation is balanced to the lowest whole number coefficient.
1 (acid solution)
___MnO4- + __HS-
g
___S + ___MnO2
2 (basic solution)
___Br2 + ___SO2
g
___SO42- + ___Br-
3 (acid solution)
___U4+ + ___MnO4-
g
___Mn2+ + ___UO22+
4 (acidic solution)
___PbO2 (s) + ___Pb (s) + ___SO42-
g
___PbSO4 (s)
5 (basic solution)
___CrO42-
g
___Cr(OH)3 + ___O22-
Sum of coefficient
1. _______
2. _______
3. _______
4. _______
5. _______
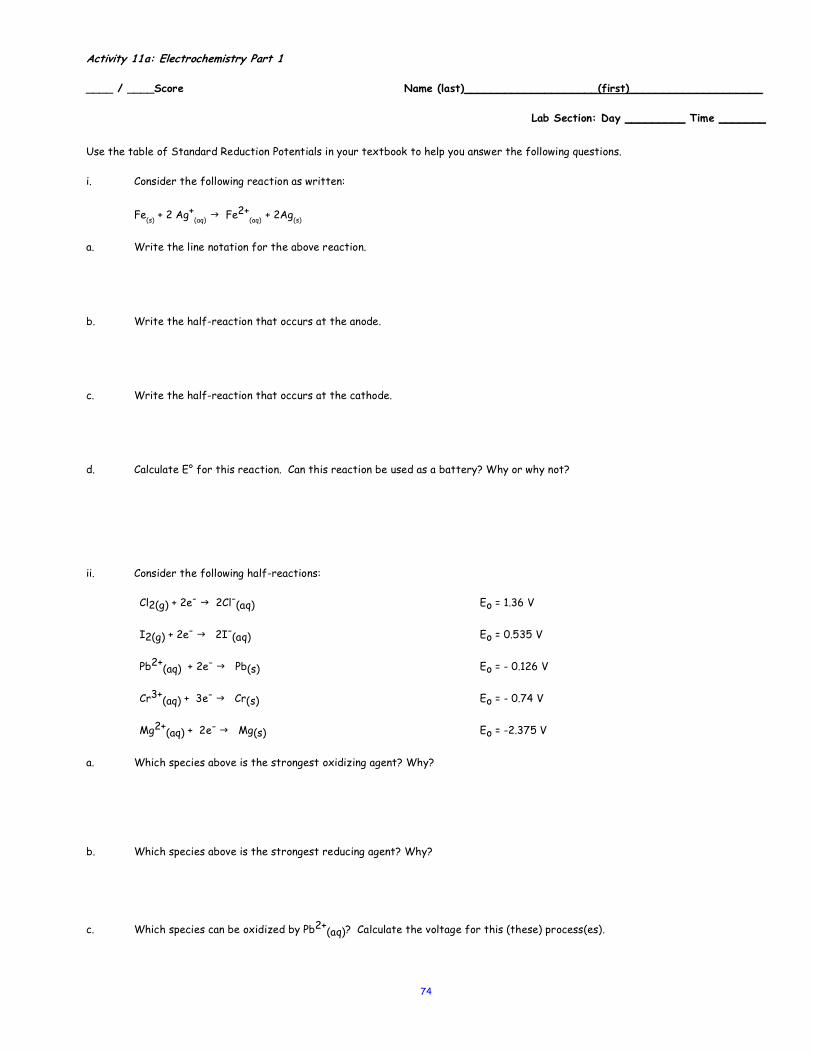
74
Activity 11a: Electrochemistry Part 1 ____ / ____Score Name (last)____________________(first)____________________
Lab Section: Day _________ Time _______
Use the table of Standard Reduction Potentials in your textbook to help you answer the following questions. i. Consider the following reaction as written:
Fe(s) + 2 Ag+(aq) g Fe2+
(aq) + 2Ag(s)
a. Write the line notation for the above reaction. b. Write the half-reaction that occurs at the anode. c. Write the half-reaction that occurs at the cathode. d. Calculate E° for this reaction. Can this reaction be used as a battery? Why or why not? ii. Consider the following half-reactions:
Cl2(g) + 2e- g 2Cl-(aq) Eo = 1.36 V
I2(g) + 2e- g 2I-(aq) Eo = 0.535 V
Pb2+(aq) + 2e- g Pb(s) Eo = - 0.126 V
Cr3+(aq) + 3e- g Cr(s) Eo = - 0.74 V
Mg2+(aq) + 2e- g Mg(s) Eo = -2.375 V a. Which species above is the strongest oxidizing agent? Why? b. Which species above is the strongest reducing agent? Why? c. Which species can be oxidized by Pb2+(aq)? Calculate the voltage for this (these) process(es).

75
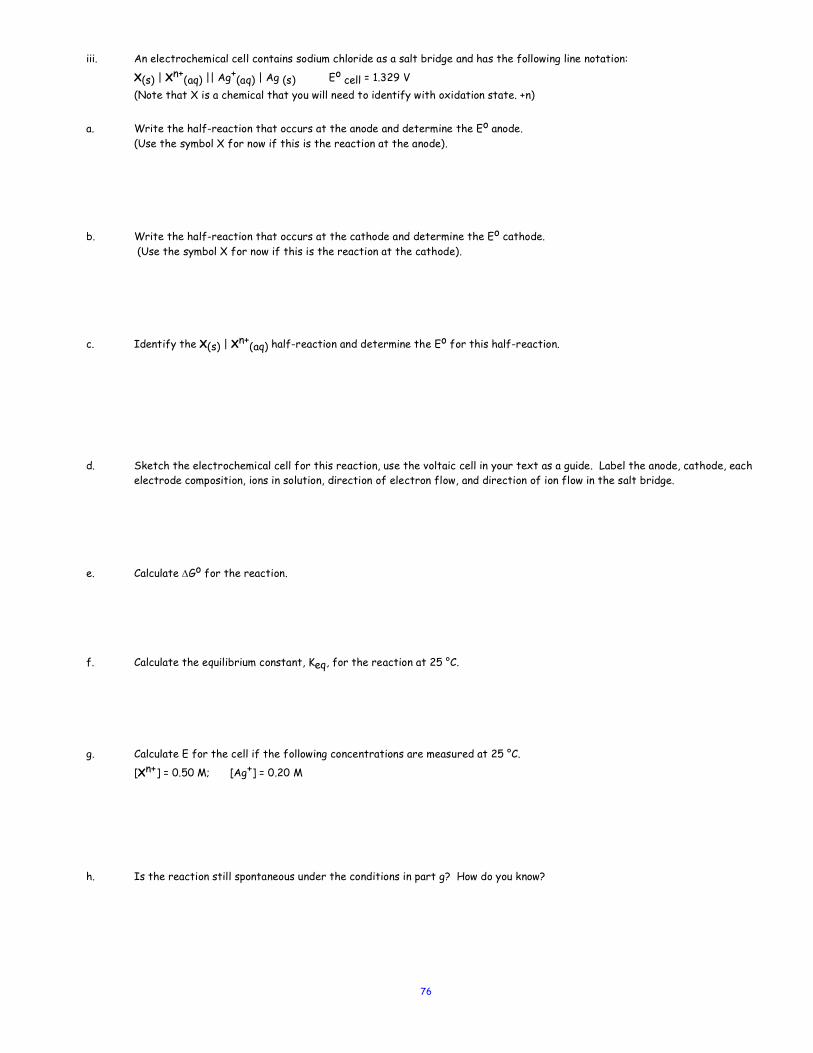
76
iii. An electrochemical cell contains sodium chloride as a salt bridge and has the following line notation:
X(s) | Xn+(aq) || Ag+(aq) | Ag (s) Eo cell = 1.329 V (Note that X is a chemical that you will need to identify with oxidation state. +n)
a. Write the half-reaction that occurs at the anode and determine the Eo anode. (Use the symbol X for now if this is the reaction at the anode).
b. Write the half-reaction that occurs at the cathode and determine the Eo cathode. (Use the symbol X for now if this is the reaction at the cathode).
c. Identify the X(s) | Xn+(aq) half-reaction and determine the Eo for this half-reaction. d. Sketch the electrochemical cell for this reaction, use the voltaic cell in your text as a guide. Label the anode, cathode, each
electrode composition, ions in solution, direction of electron flow, and direction of ion flow in the salt bridge. e. Calculate DGo for the reaction. f. Calculate the equilibrium constant, Keq, for the reaction at 25 °C. g. Calculate E for the cell if the following concentrations are measured at 25 °C.
[Xn+] = 0.50 M; [Ag+] = 0.20 M h. Is the reaction still spontaneous under the conditions in part g? How do you know?

77
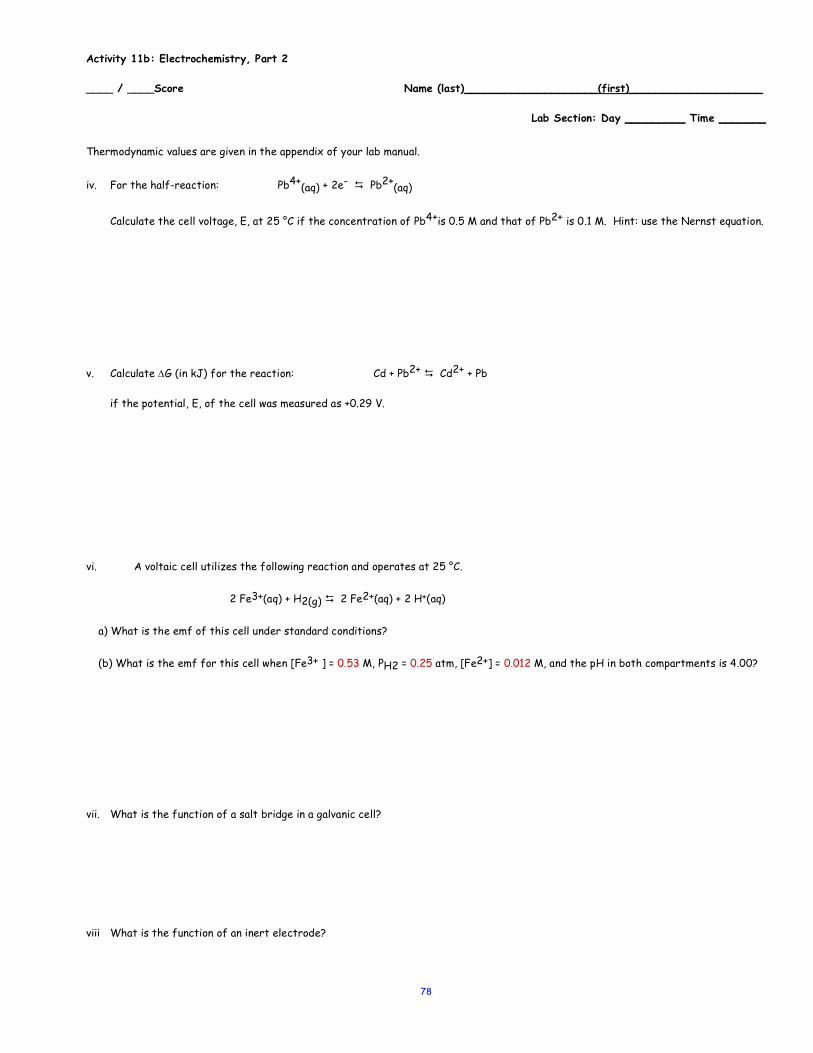
78
Activity 11b: Electrochemistry, Part 2 ____ / ____Score Name (last)____________________(first)____________________
Lab Section: Day _________ Time _______
Thermodynamic values are given in the appendix of your lab manual.
iv. For the half-reaction: Pb4+(aq) + 2e- D Pb2+(aq)
Calculate the cell voltage, E, at 25 °C if the concentration of Pb4+is 0.5 M and that of Pb2+ is 0.1 M. Hint: use the Nernst equation. v. Calculate DG (in kJ) for the reaction: Cd + Pb2+ D Cd2+ + Pb
if the potential, E, of the cell was measured as +0.29 V. vi. A voltaic cell utilizes the following reaction and operates at 25 °C.
2 Fe3+(aq) + H2(g) D 2 Fe2+(aq) + 2 H+(aq)
a) What is the emf of this cell under standard conditions? [0.771] V (b) What is the emf for this cell when [Fe3+ ] = 0.53 M, PH2 = 0.25 atm, [Fe2+] = 0.012 M, and the pH in both compartments is 4.00? [1.087] V
vii. What is the function of a salt bridge in a galvanic cell? viii What is the function of an inert electrode?

79
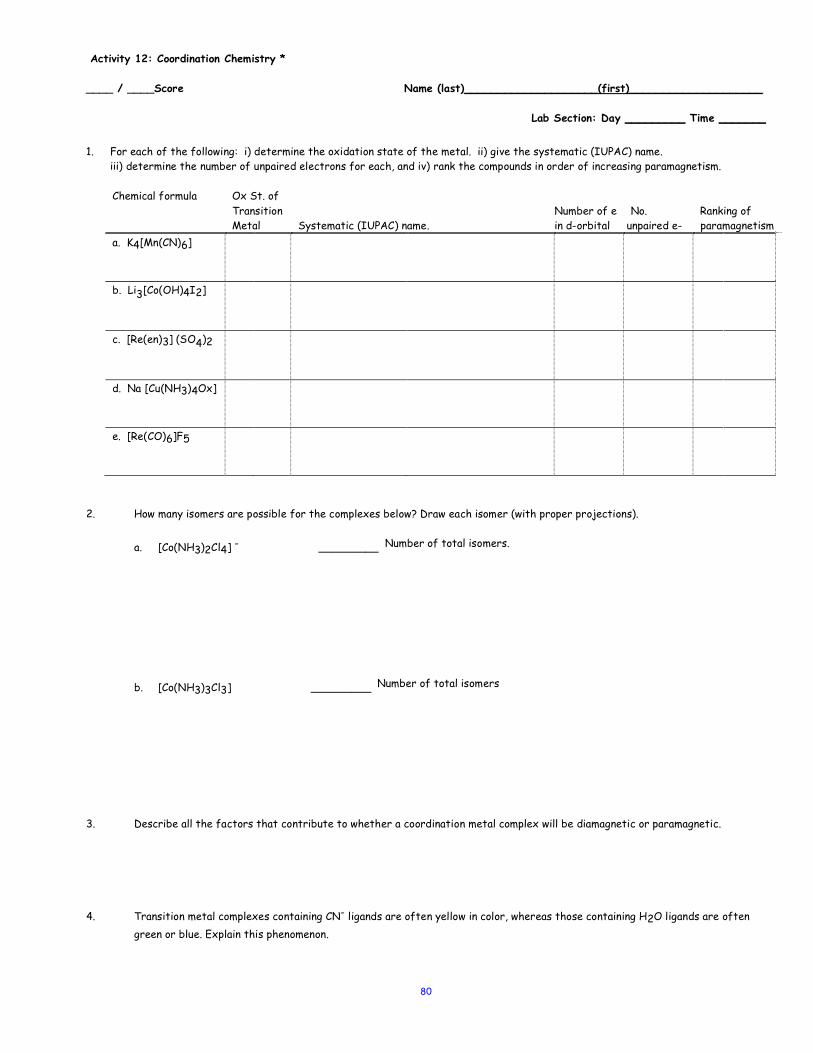
80
Activity 12: Coordination Chemistry * ____ / ____Score Name (last)____________________(first)____________________
Lab Section: Day _________ Time _______
1. For each of the following: i) determine the oxidation state of the metal. ii) give the systematic (IUPAC) name. iii) determine the number of unpaired electrons for each, and iv) rank the compounds in order of increasing paramagnetism.
Chemical formula Ox St. of Transition Metal
Systematic (IUPAC) name.
Number of e in d-orbital
No.
unpaired e-
Ranking of paramagnetism
a. K4[Mn(CN)6]
b. Li3[Co(OH)4I2]
c. [Re(en)3] (SO4)2
d. Na [Cu(NH3)4Ox]
e. [Re(CO)6]F5
2. How many isomers are possible for the complexes below? Draw each isomer (with proper projections).
a. [Co(NH3)2Cl4] - _________ Number of total isomers.
b. [Co(NH3)3Cl3] _________ Number of total isomers
3. Describe all the factors that contribute to whether a coordination metal complex will be diamagnetic or paramagnetic. 4. Transition metal complexes containing CN- ligands are often yellow in color, whereas those containing H2O ligands are often
green or blue. Explain this phenomenon.

81
82
5. The [Pd(Cl)4]2- ion is diamagnetic, whereas the [NiCl4]2- ion is paramagnetic. The two have different geometries even though the ligands are the same. Determine the geometry for each and then draw the crystal field splitting diagrams (with d-orbital labels) for these two complexes and draw the wedge and dash diagrams for each complex.
6. The visible absorption maximum for the complex ion [Co(H2O)6]3+ occurs at 700 nm. (There is another lmax at 350nm) Predict the color of this complex. Explain your reasoning.
7. Write the Lewis structure of each and state whether the following are monodentate or bidentate ligands.
a. C2O42- (oxalate ion, Ox) b. SCN- c. H2NCH2CH2NH2 (ethylenediamine, en) d. CO32-
8. What are the oxidation numbers and the coordination numbers of the metals in the following complex ions?
Complex Ion
Metal; Oxidation Number
Number of d-electrons
Coordination Number
Ligand Number
Li3 [Co(NO3)3CO3]
[Co(Ox)2]
[Co(en)3] PO4
9. Place the following chemicals in order of increasing criteria as listed below: Ca3[Co(NO3)4CO3], [Os(bpy)2(CO)2]Cl2, K4[Re(Ox)3].
a) Increasing oxidation state. b) increasing splitting energy. c) number of unpaired electrons. d) wavelength of light absorbed.
Be sure to give the stated value and show your work or reasoning for full credit.

83
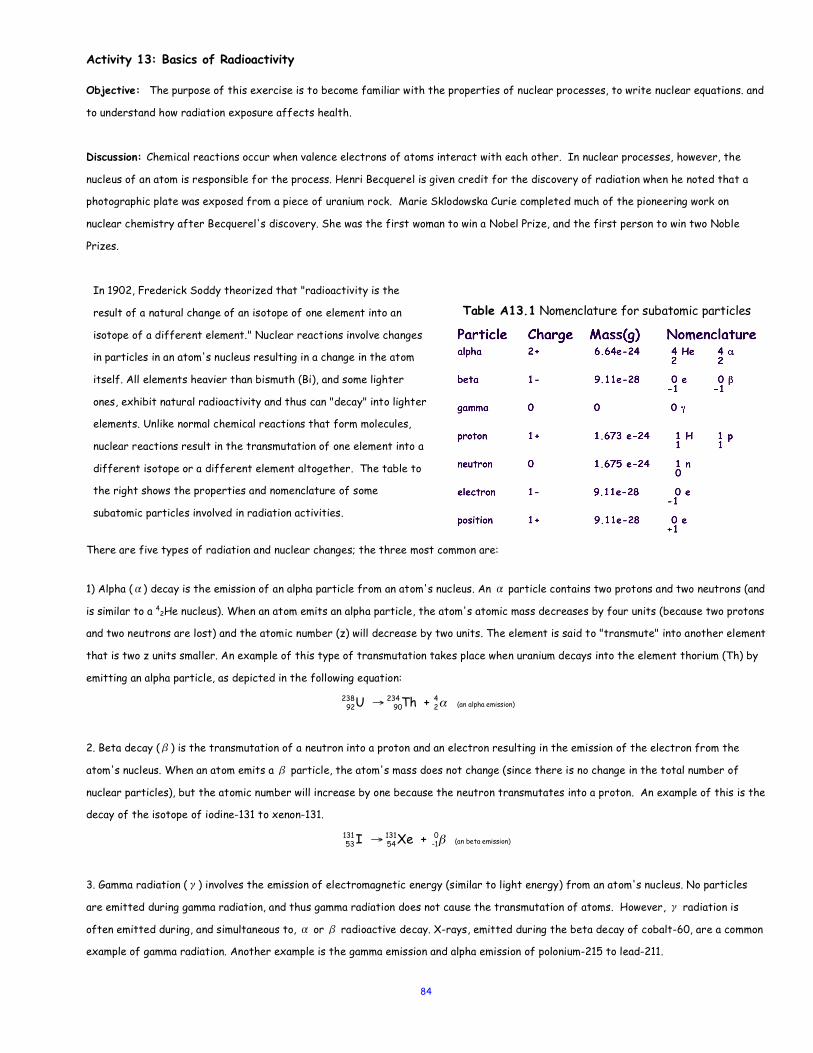
84
Activity 13: Basics of Radioactivity Objective: The purpose of this exercise is to become familiar with the properties of nuclear processes, to write nuclear equations. and
to understand how radiation exposure affects health.
Discussion: Chemical reactions occur when valence electrons of atoms interact with each other. In nuclear processes, however, the
nucleus of an atom is responsible for the process. Henri Becquerel is given credit for the discovery of radiation when he noted that a
photographic plate was exposed from a piece of uranium rock. Marie Sklodowska Curie completed much of the pioneering work on
nuclear chemistry after Becquerel's discovery. She was the first woman to win a Nobel Prize, and the first person to win two Noble
Prizes.
In 1902, Frederick Soddy theorized that "radioactivity is the
result of a natural change of an isotope of one element into an
isotope of a different element." Nuclear reactions involve changes
in particles in an atom's nucleus resulting in a change in the atom
itself. All elements heavier than bismuth (Bi), and some lighter
ones, exhibit natural radioactivity and thus can "decay" into lighter
elements. Unlike normal chemical reactions that form molecules,
nuclear reactions result in the transmutation of one element into a
different isotope or a different element altogether. The table to
the right shows the properties and nomenclature of some
subatomic particles involved in radiation activities.
Table A13.1 Nomenclature for subatomic particles
There are five types of radiation and nuclear changes; the three most common are:
1) Alpha (α) decay is the emission of an alpha particle from an atom's nucleus. An α particle contains two protons and two neutrons (and
is similar to a 42He nucleus). When an atom emits an alpha particle, the atom's atomic mass decreases by four units (because two protons
and two neutrons are lost) and the atomic number (z) will decrease by two units. The element is said to "transmute" into another element
that is two z units smaller. An example of this type of transmutation takes place when uranium decays into the element thorium (Th) by
emitting an alpha particle, as depicted in the following equation:
(an alpha emission)
2. Beta decay (β) is the transmutation of a neutron into a proton and an electron resulting in the emission of the electron from the
atom's nucleus. When an atom emits a β particle, the atom's mass does not change (since there is no change in the total number of
nuclear particles), but the atomic number will increase by one because the neutron transmutates into a proton. An example of this is the
decay of the isotope of iodine-131 to xenon-131.
(an beta emission)
3. Gamma radiation (γ) involves the emission of electromagnetic energy (similar to light energy) from an atom's nucleus. No particles
are emitted during gamma radiation, and thus gamma radiation does not cause the transmutation of atoms. However, γ radiation is
often emitted during, and simultaneous to, α or β radioactive decay. X-rays, emitted during the beta decay of cobalt-60, are a common
example of gamma radiation. Another example is the gamma emission and alpha emission of polonium-215 to lead-211.
€
92238U → 90
234 Th + 24α
€
53131 I → 54
131Xe + -10β
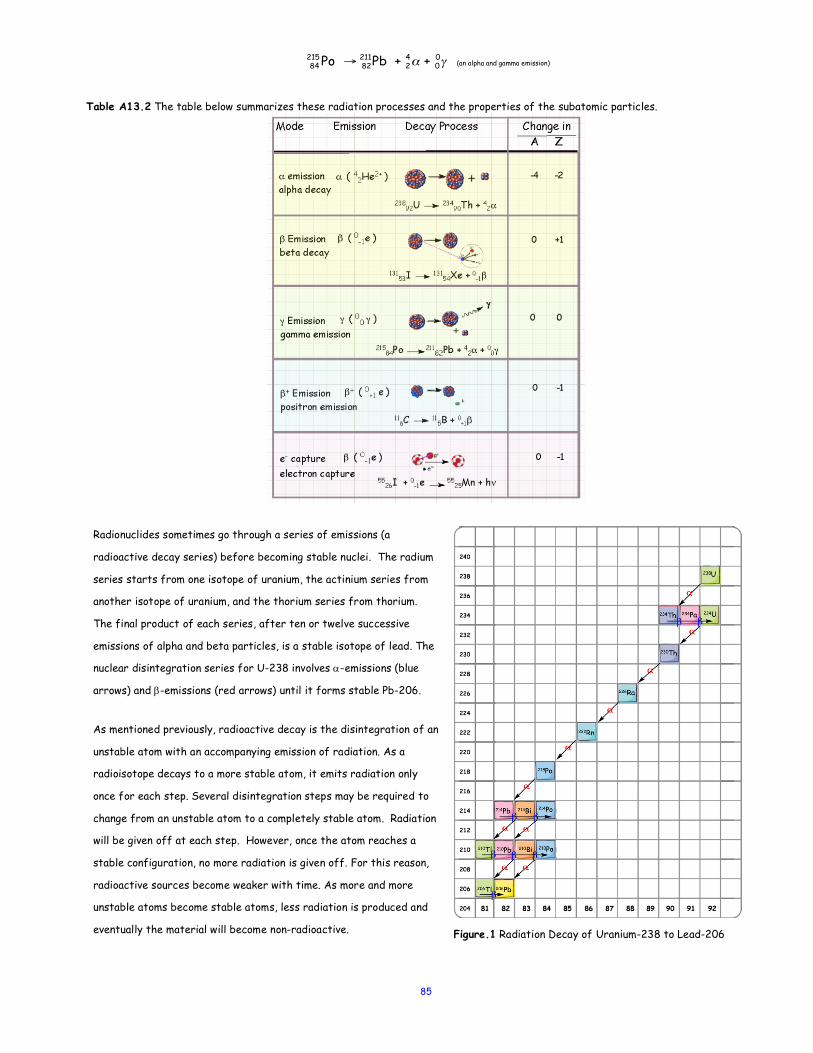
85
(an alpha and gamma emission)
Table A13.2 The table below summarizes these radiation processes and the properties of the subatomic particles.
Radionuclides sometimes go through a series of emissions (a
radioactive decay series) before becoming stable nuclei. The radium
series starts from one isotope of uranium, the actinium series from
another isotope of uranium, and the thorium series from thorium.
The final product of each series, after ten or twelve successive
emissions of alpha and beta particles, is a stable isotope of lead. The
nuclear disintegration series for U-238 involves a-emissions (blue
arrows) and b-emissions (red arrows) until it forms stable Pb-206.
As mentioned previously, radioactive decay is the disintegration of an
unstable atom with an accompanying emission of radiation. As a
radioisotope decays to a more stable atom, it emits radiation only
once for each step. Several disintegration steps may be required to
change from an unstable atom to a completely stable atom. Radiation
will be given off at each step. However, once the atom reaches a
stable configuration, no more radiation is given off. For this reason,
radioactive sources become weaker with time. As more and more
unstable atoms become stable atoms, less radiation is produced and
eventually the material will become non-radioactive.
Figure.1 Radiation Decay of Uranium-238 to Lead-206
€
84215Po → 82
211Pb + 24α + 0
0γ
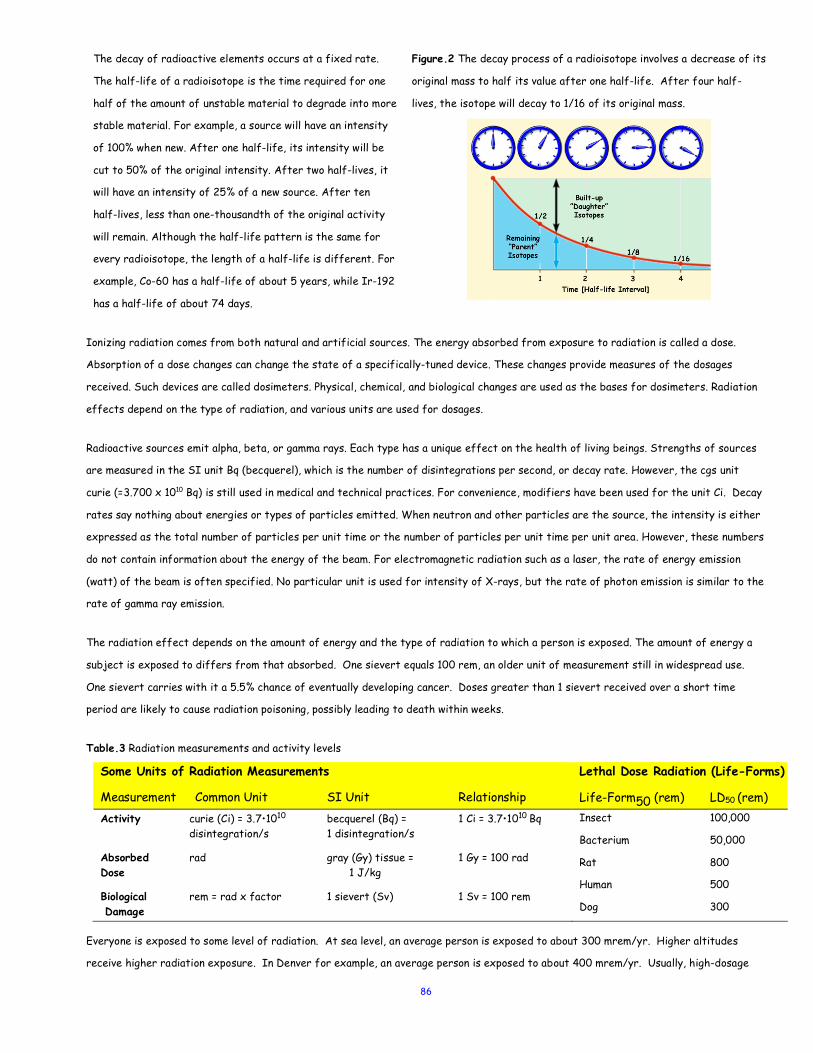
86
The decay of radioactive elements occurs at a fixed rate.
The half-life of a radioisotope is the time required for one
half of the amount of unstable material to degrade into more
stable material. For example, a source will have an intensity
of 100% when new. After one half-life, its intensity will be
cut to 50% of the original intensity. After two half-lives, it
will have an intensity of 25% of a new source. After ten
half-lives, less than one-thousandth of the original activity
will remain. Although the half-life pattern is the same for
every radioisotope, the length of a half-life is different. For
example, Co-60 has a half-life of about 5 years, while Ir-192
has a half-life of about 74 days.
Figure.2 The decay process of a radioisotope involves a decrease of its
original mass to half its value after one half-life. After four half-
lives, the isotope will decay to 1/16 of its original mass.
Ionizing radiation comes from both natural and artificial sources. The energy absorbed from exposure to radiation is called a dose.
Absorption of a dose changes can change the state of a specifically-tuned device. These changes provide measures of the dosages
received. Such devices are called dosimeters. Physical, chemical, and biological changes are used as the bases for dosimeters. Radiation
effects depend on the type of radiation, and various units are used for dosages.
Radioactive sources emit alpha, beta, or gamma rays. Each type has a unique effect on the health of living beings. Strengths of sources
are measured in the SI unit Bq (becquerel), which is the number of disintegrations per second, or decay rate. However, the cgs unit
curie (=3.700 x 10¹⁰ Bq) is still used in medical and technical practices. For convenience, modifiers have been used for the unit Ci. Decay
rates say nothing about energies or types of particles emitted. When neutron and other particles are the source, the intensity is either
expressed as the total number of particles per unit time or the number of particles per unit time per unit area. However, these numbers
do not contain information about the energy of the beam. For electromagnetic radiation such as a laser, the rate of energy emission
(watt) of the beam is often specified. No particular unit is used for intensity of X-rays, but the rate of photon emission is similar to the
rate of gamma ray emission.
The radiation effect depends on the amount of energy and the type of radiation to which a person is exposed. The amount of energy a
subject is exposed to differs from that absorbed. One sievert equals 100 rem, an older unit of measurement still in widespread use.
One sievert carries with it a 5.5% chance of eventually developing cancer. Doses greater than 1 sievert received over a short time
period are likely to cause radiation poisoning, possibly leading to death within weeks.
Table.3 Radiation measurements and activity levels
Some Units of Radiation Measurements
Measurement Common Unit SI Unit Relationship
Lethal Dose Radiation (Life-Forms)
Life-Form50 (rem) LD50 (rem) Activity curie (Ci) = 3.7•1010 becquerel (Bq) = 1 Ci = 3.7•1010 Bq disintegration/s 1 disintegration/s
Absorbed rad gray (Gy) tissue = 1 Gy = 100 rad Dose 1 J/kg
Biological rem = rad x factor 1 sievert (Sv) 1 Sv = 100 rem Damage
Insect 100,000
Bacterium 50,000
Rat 800
Human 500
Dog 300
Everyone is exposed to some level of radiation. At sea level, an average person is exposed to about 300 mrem/yr. Higher altitudes
receive higher radiation exposure. In Denver for example, an average person is exposed to about 400 mrem/yr. Usually, high-dosage

87
exposures cause symptoms to develop immediately, and low dose exposures have delayed effects. The worldwide average total exposure
from all radiation sources is about 360 mrem/yr (http://www2.lbl.gov/abc/wallchart/chapters/appendix/appendixd.html ).
High-dose Radiation Exposures: From experiences in industrial and laboratory accidents, the atomic bomb explosions in Hiroshima and
Nagasaki, atomic and thermonuclear testing grounds, and miscalculated and accidental medical exposures of patients, we have learned
the consequences of high-dose radiation exposures.
Injuries due to radiation in the past have led medical professionals to divide radiation clinical cases into four categories. From these
categories, we learn to appreciate the level of danger when a whole body is exposed to various doses.
Low dosage: less than 1 Sv (100 rem). Patients under radiological treatments with a one-time whole-body exposure of 14-100 rem
showed no particular radiation syndromes, and they all recovered well. Very few cases showed nausea and vomit. Symptoms and harmful
effects vary due to different health conditions of individuals. Data for delayed effects are not reliable.
Medium low dosage: 1-2 Sv (100 - 200 rem). Victims receiving 100-200 rem showed nausea and occasional vomiting on the day of
exposure or the day after (onset of radiation sickness). Itching and burning were felt on the skin after exposure, and these sensations
subsided in few days. Two weeks later, however, dermatitis (skin inflammation), itching, burning and pain were severe. More serious cases
showed epilation (loss of hair), erythema (abnormal redness due to inflammation), necrosis (tissue death), wet desquamation (peel off),
followed by weeping, crusting, and ulceration (open sores). Some cases recovered if infections were prevented by medical treatment.
Medium high dosage: 2-5 Sv (200-450 rem). All victims receiving 200-450 rem showed anorexia (loss of appetite), fatigue, nausea and
vomiting, and some had diarrhea. These symptoms might persist for months, but some may show signs of recovery. However, the patients
in this group were susceptible to infection. Hemorrhaging (discharge of blood) in various tissues may happen, and chances of recovery are
limited to only a few.
High dosage exposure: more than 5 Sv (500 rem and more). The human lethal dose (LD50) is generally believed to be 400 to 500 rem,
and even lower if the dose is received in a short time period. Clinically, survival for victims who receive more than 500 rem is impossible.
Higher doses resulted in quick death. Victims went through stages of disorientation and shock due to injuries to the central nervous
(CN) and cardiovascular systems. On the other hand, some victims overcome infections, and they survived after bone marrow
transplants.
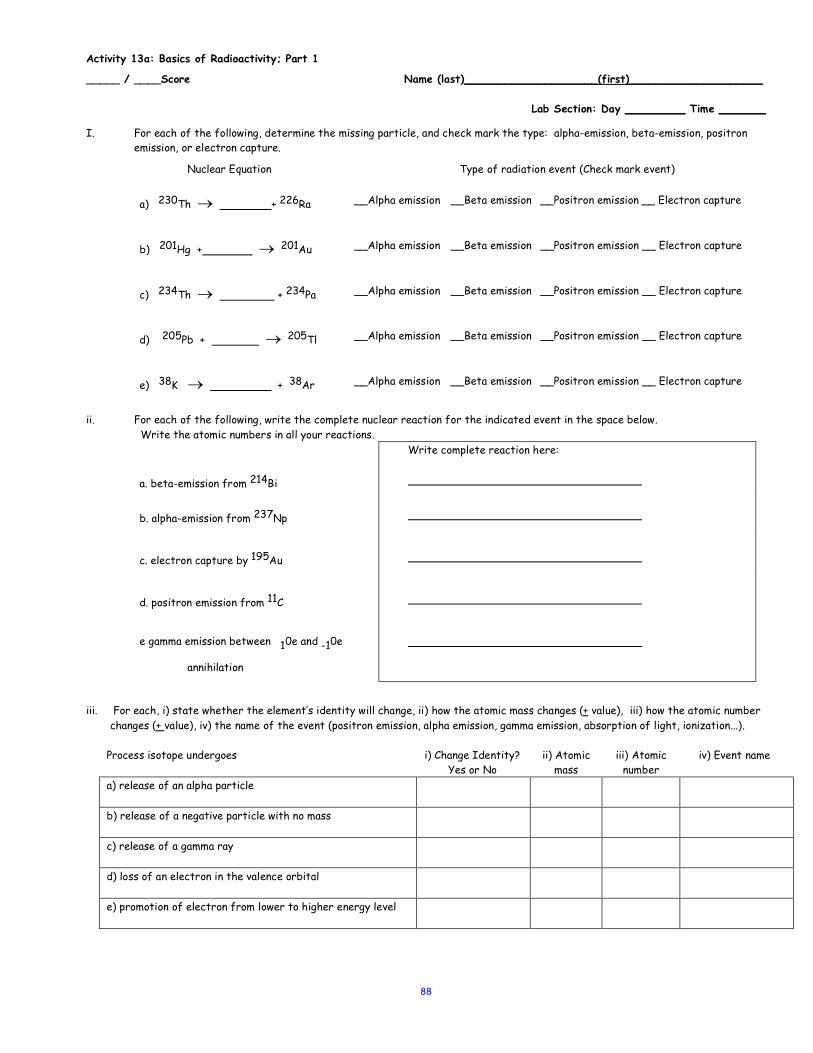
88
Activity 13a: Basics of Radioactivity; Part 1
_____ / ____Score Name (last)____________________(first)____________________
Lab Section: Day _________ Time _______
I. For each of the following, determine the missing particle, and check mark the type: alpha-emission, beta-emission, positron emission, or electron capture.
Nuclear Equation Type of radiation event (Check mark event)
a) 230Th ® + 226Ra __Alpha emission __Beta emission __Positron emission __ Electron capture
b) 201Hg + ® 201Au __Alpha emission __Beta emission __Positron emission __ Electron capture
c) 234Th ® + 234Pa __Alpha emission __Beta emission __Positron emission __ Electron capture
d) 205Pb + ® 205Tl __Alpha emission __Beta emission __Positron emission __ Electron capture
e) 38K ® + 38Ar __Alpha emission __Beta emission __Positron emission __ Electron capture
ii. For each of the following, write the complete nuclear reaction for the indicated event in the space below. Write the atomic numbers in all your reactions.
a. beta-emission from 214Bi
Write complete reaction here:
b. alpha-emission from 237Np
c. electron capture by 195Au
d. positron emission from 11C
e gamma emission between 10e and -10e
annihilation
iii. For each, i) state whether the element’s identity will change, ii) how the atomic mass changes (+ value), iii) how the atomic number
changes (+ value), iv) the name of the event (positron emission, alpha emission, gamma emission, absorption of light, ionization...).
Process isotope undergoes i) Change Identity? Yes or No
ii) Atomic mass
iii) Atomic number
iv) Event name
a) release of an alpha particle
b) release of a negative particle with no mass
c) release of a gamma ray
d) loss of an electron in the valence orbital
e) promotion of electron from lower to higher energy level
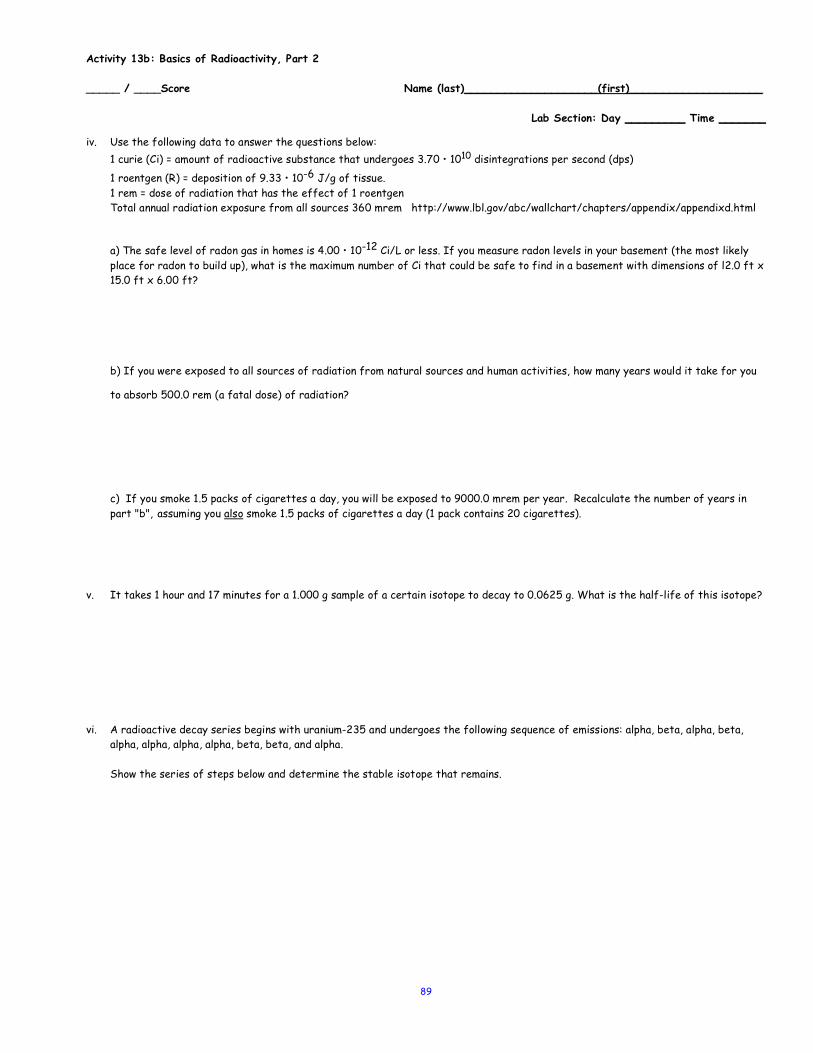
89
Activity 13b: Basics of Radioactivity, Part 2 _____ / ____Score Name (last)____________________(first)____________________
Lab Section: Day _________ Time _______
iv. Use the following data to answer the questions below: 1 curie (Ci) = amount of radioactive substance that undergoes 3.70 • 1010 disintegrations per second (dps)
1 roentgen (R) = deposition of 9.33 • 10-6 J/g of tissue. 1 rem = dose of radiation that has the effect of 1 roentgen Total annual radiation exposure from all sources 360 mrem http://www.lbl.gov/abc/wallchart/chapters/appendix/appendixd.html
a) The safe level of radon gas in homes is 4.00 • 10-12 Ci/L or less. If you measure radon levels in your basement (the most likely place for radon to build up), what is the maximum number of Ci that could be safe to find in a basement with dimensions of l2.0 ft x 15.0 ft x 6.00 ft?
b) If you were exposed to all sources of radiation from natural sources and human activities, how many years would it take for you
to absorb 500.0 rem (a fatal dose) of radiation?
c) If you smoke 1.5 packs of cigarettes a day, you will be exposed to 9000.0 mrem per year. Recalculate the number of years in part "b", assuming you also smoke 1.5 packs of cigarettes a day (1 pack contains 20 cigarettes).
v. It takes 1 hour and 17 minutes for a 1.000 g sample of a certain isotope to decay to 0.0625 g. What is the half-life of this isotope?
vi. A radioactive decay series begins with uranium-235 and undergoes the following sequence of emissions: alpha, beta, alpha, beta,
alpha, alpha, alpha, alpha, beta, beta, and alpha.
Show the series of steps below and determine the stable isotope that remains.
90
EXPERIMENTS
EXPERIMENTS
EXPERIMENTS
EXPERIMENTS

91
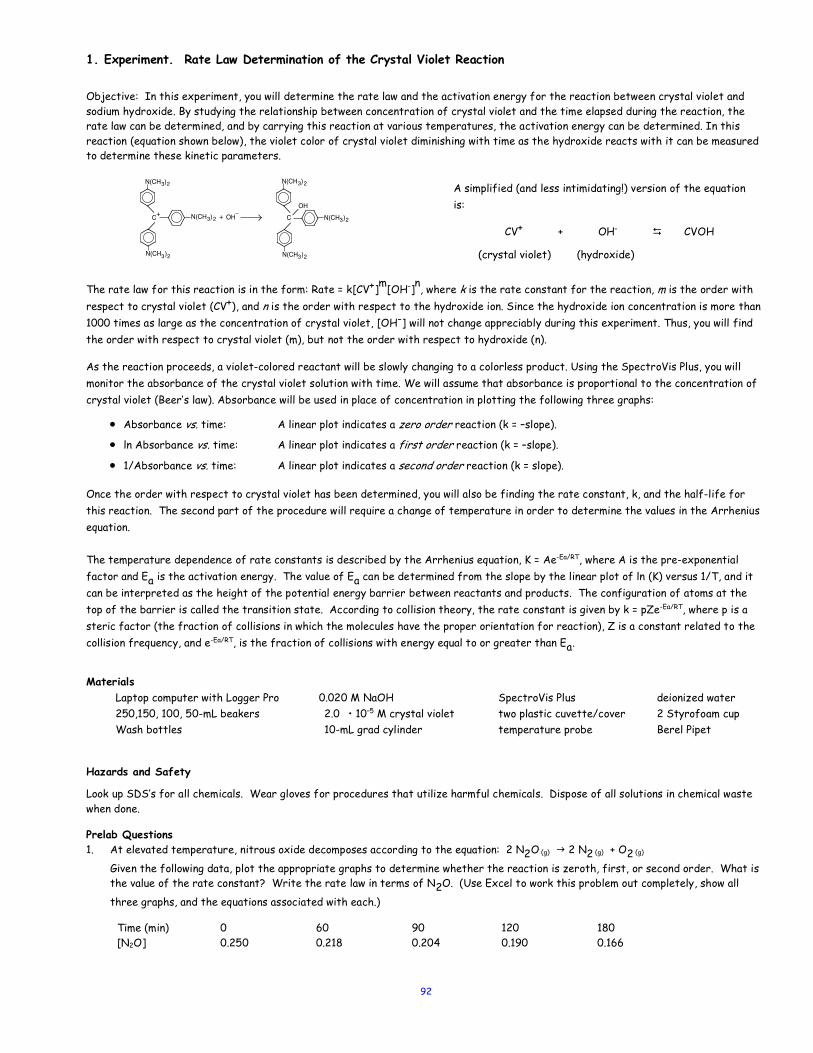
92
1. Experiment. Rate Law Determination of the Crystal Violet Reaction
Objective: In this experiment, you will determine the rate law and the activation energy for the reaction between crystal violet and sodium hydroxide. By studying the relationship between concentration of crystal violet and the time elapsed during the reaction, the rate law can be determined, and by carrying this reaction at various temperatures, the activation energy can be determined. In this reaction (equation shown below), the violet color of crystal violet diminishing with time as the hydroxide reacts with it can be measured to determine these kinetic parameters.
A simplified (and less intimidating!) version of the equation is:
CV+ + OH– D CVOH
(crystal violet) (hydroxide)
The rate law for this reaction is in the form: Rate = k[CV+]m[OH–]n, where k is the rate constant for the reaction, m is the order with respect to crystal violet (CV+), and n is the order with respect to the hydroxide ion. Since the hydroxide ion concentration is more than 1000 times as large as the concentration of crystal violet, [OH-] will not change appreciably during this experiment. Thus, you will find the order with respect to crystal violet (m), but not the order with respect to hydroxide (n).
As the reaction proceeds, a violet-colored reactant will be slowly changing to a colorless product. Using the SpectroVis Plus, you will monitor the absorbance of the crystal violet solution with time. We will assume that absorbance is proportional to the concentration of crystal violet (Beer’s law). Absorbance will be used in place of concentration in plotting the following three graphs:
• Absorbance vs. time: A linear plot indicates a zero order reaction (k = –slope).
• ln Absorbance vs. time: A linear plot indicates a first order reaction (k = –slope).
• 1/Absorbance vs. time: A linear plot indicates a second order reaction (k = slope).
Once the order with respect to crystal violet has been determined, you will also be finding the rate constant, k, and the half-life for this reaction. The second part of the procedure will require a change of temperature in order to determine the values in the Arrhenius equation.
The temperature dependence of rate constants is described by the Arrhenius equation, K = Ae-Ea/RT, where A is the pre-exponential factor and Ea is the activation energy. The value of Ea can be determined from the slope by the linear plot of ln (K) versus 1/T, and it can be interpreted as the height of the potential energy barrier between reactants and products. The configuration of atoms at the top of the barrier is called the transition state. According to collision theory, the rate constant is given by k = pZe-Ea/RT, where p is a steric factor (the fraction of collisions in which the molecules have the proper orientation for reaction), Z is a constant related to the collision frequency, and e-Ea/RT, is the fraction of collisions with energy equal to or greater than Ea.
Materials Laptop computer with Logger Pro 0.020 M NaOH SpectroVis Plus deionized water 250,150, 100, 50-mL beakers Wash bottles
2.0 • 10–5 M crystal violet 10-mL grad cylinder
two plastic cuvette/cover temperature probe
2 Styrofoam cup Berel Pipet
Hazards and Safety
Look up SDS’s for all chemicals. Wear gloves for procedures that utilize harmful chemicals. Dispose of all solutions in chemical waste when done. Prelab Questions 1. At elevated temperature, nitrous oxide decomposes according to the equation: 2 N2O (g) g 2 N2 (g) + O2 (g)
Given the following data, plot the appropriate graphs to determine whether the reaction is zeroth, first, or second order. What is the value of the rate constant? Write the rate law in terms of N2O. (Use Excel to work this problem out completely, show all
three graphs, and the equations associated with each.)
Time (min) 0 60 90 120 180 [N2O] 0.250 0.218 0.204 0.190 0.166
2
CCOH
OH–+
N(CH )
N(CH )
N(CH )
+ N(CH )
N(CH )
N(CH )3 3
3
3
3
32
2
2
2
2
2
93
Procedure
1. Connect the SpectroVis Plus to the USB port on the computer and let it warm up for at least 5 minutes.
2. Use a 10-mL graduated cylinder to measure 10.0 mL of 0.020 M NaOH solution. Use another 10-mL graduated cylinder to obtain 10.0 mL of 2.0 • 10–5 M crystal violet solution.
3. Logger Pro should recognize the spectrophotometer and present a screen showing Absorbance vs. Wavelength (nm). Find the
lambda max (lmax) of 1:1 crystal violet/deionized water by running the absorption analysis. You will use this lmax when monitoring the reaction throughout this experiment.
4. Click on the “Configure Spectrometer” icon on the top (the icon that has a rainbow filled in the area under the curve) and change
the Collection Mode to Absorbance vs. Time. Select the lmax for the wavelength. A digital thermometer (not connected to the computer) is used to record temperature.
5. Click on “Experiment” and then “Data Collection”. Set the duration for 1200 seconds (20 minutes). If you need to extend the time,
you can type Command-T (Apple-T, ⌘-T, on a mac)
6. Prepare a blank by filling an empty cuvette 3/4 full with deionized water. Seal the cuvette with a lid. Remember the following: •All cuvettes should be wiped clean and dry on the outside with a tissue. •Handle cuvettes only by the top and bottom edge of the ribbed face. •All solutions should be free of bubbles. •Always position the cuvette such that the clear sides face the triangle and the white light icon.
7. Calibrate the SpectroVis Plus.
a. In Logger Pro, under the “Experiment” drop-down menu, select “Spectrometer: 1” under “Calibrate.”
b. When Logger Pro asks for a blank cuvette, hold the cuvette by the top and wipe down the sides with a Kim wipe to remove any fingerprints and anything else that may absorb light.
c. Place the cuvette into the SpectroVis Plus. Use something to remember which direction you placed the cuvette into the chamber as you will need to use this same orientation for all of your measurements.
d. Click on “Finish Calibration.”
8. To initiate the reaction, simultaneously pour the 10-mL portions of crystal violet and sodium hydroxide into a 250-mL beaker and stir the reaction mixture with a stirring rod. Click Collect. Note, because the initial data are sometimes sporadic, you will not actually take a reading until 3 minutes have passed. Empty the water from the cuvette. Rinse the cuvette twice with ~1-mL amounts of the reaction mixture and then fill it 3/4 full. Do not put the cuvette in the SpectroVis Plus yet. To keep the solution from warming, the cuvette is left outside the SpectroVis Plus between readings. Use the digital thermometer to keep track of the temperature. Try to maintain a cell at constant temperature.
9. After about three minutes have passed since combining the 2 solutions, wipe the outside of the cuvette and place in the cuvette slot in the SpectroVis Plus. Collect data for approximately 30 seconds. Remove the cuvette then wait 45 seconds. Do not stop the collection however simply allow the spectrometer to continue to run. After the elapse time place the cuvette in the SpectroVis Plus again and collect data for approximately 30 seconds. After collecting this second data set, remove the cuvette. Continue in this manner, collecting data every 45-60 seconds, until 20 minutes have elapsed. After the experiment is complete, click on Stop.
10. Data collection will end after 20 minutes if you have not stopped the experiment. If you need more time then you can select “Experiment” and “Extend Collection”. Discard the beaker and cuvette contents as directed by your instructor.
11. Repeat steps 1 – 8 at a temperature +5° above room temperature and analyze the data as described above, this is referred to as RT+DT1. You need not print a copy of the non-linear graph at this temperature. See notes at end of this section on how to build an
insulator container to maintain constant temperature for these trials.
11. Repeat steps 1 – 8 at a temperature -5° below room temperature and analyze the data as described above, this is referred to as RT-DT2. You need not print a copy of the non-linear graph at this temperature. See notes at end of this section on how to build an
insulator container to maintain constant temperature for these trials.
13. Analyze the data you collected graphically to decide if the reaction is zero, first, or second order with respect to crystal violet.
•Zero Order: If the current graph of absorbance vs. time is linear, the reaction is zero order.
•First Order: To see if the reaction is first order, it is necessary to plot a graph of the natural logarithm (ln) of absorbance vs. time. If this plot is linear, the reaction is first order.
•Second Order: To see if the reaction is second order, plot a graph of the reciprocal of absorbance vs. time. If this plot is linear, the reaction is second order.
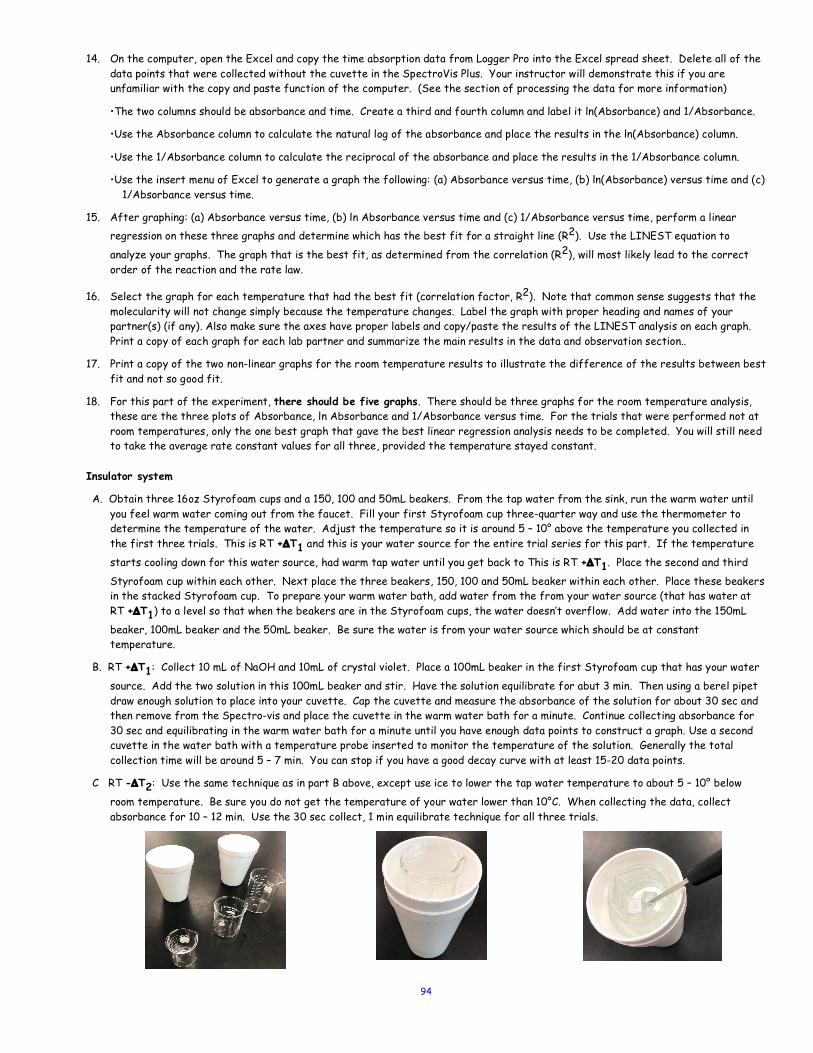
94
14. On the computer, open the Excel and copy the time absorption data from Logger Pro into the Excel spread sheet. Delete all of the data points that were collected without the cuvette in the SpectroVis Plus. Your instructor will demonstrate this if you are unfamiliar with the copy and paste function of the computer. (See the section of processing the data for more information)
•The two columns should be absorbance and time. Create a third and fourth column and label it ln(Absorbance) and 1/Absorbance.
•Use the Absorbance column to calculate the natural log of the absorbance and place the results in the ln(Absorbance) column.
•Use the 1/Absorbance column to calculate the reciprocal of the absorbance and place the results in the 1/Absorbance column.
•Use the insert menu of Excel to generate a graph the following: (a) Absorbance versus time, (b) ln(Absorbance) versus time and (c) 1/Absorbance versus time.
15. After graphing: (a) Absorbance versus time, (b) ln Absorbance versus time and (c) 1/Absorbance versus time, perform a linear regression on these three graphs and determine which has the best fit for a straight line (R2). Use the LINEST equation to
analyze your graphs. The graph that is the best fit, as determined from the correlation (R2), will most likely lead to the correct order of the reaction and the rate law.
16. Select the graph for each temperature that had the best fit (correlation factor, R2). Note that common sense suggests that the molecularity will not change simply because the temperature changes. Label the graph with proper heading and names of your partner(s) (if any). Also make sure the axes have proper labels and copy/paste the results of the LINEST analysis on each graph. Print a copy of each graph for each lab partner and summarize the main results in the data and observation section..
17. Print a copy of the two non-linear graphs for the room temperature results to illustrate the difference of the results between best fit and not so good fit.
18. For this part of the experiment, there should be five graphs. There should be three graphs for the room temperature analysis, these are the three plots of Absorbance, ln Absorbance and 1/Absorbance versus time. For the trials that were performed not at room temperatures, only the one best graph that gave the best linear regression analysis needs to be completed. You will still need to take the average rate constant values for all three, provided the temperature stayed constant.
Insulator system
A. Obtain three 16oz Styrofoam cups and a 150, 100 and 50mL beakers. From the tap water from the sink, run the warm water until you feel warm water coming out from the faucet. Fill your first Styrofoam cup three-quarter way and use the thermometer to determine the temperature of the water. Adjust the temperature so it is around 5 – 10° above the temperature you collected in the first three trials. This is RT +DT1 and this is your water source for the entire trial series for this part. If the temperature
starts cooling down for this water source, had warm tap water until you get back to This is RT +DT1. Place the second and third
Styrofoam cup within each other. Next place the three beakers, 150, 100 and 50mL beaker within each other. Place these beakers in the stacked Styrofoam cup. To prepare your warm water bath, add water from the from your water source (that has water at RT +DT1) to a level so that when the beakers are in the Styrofoam cups, the water doesn’t overflow. Add water into the 150mL
beaker, 100mL beaker and the 50mL beaker. Be sure the water is from your water source which should be at constant temperature.
B. RT +DT1: Collect 10 mL of NaOH and 10mL of crystal violet. Place a 100mL beaker in the first Styrofoam cup that has your water
source. Add the two solution in this 100mL beaker and stir. Have the solution equilibrate for abut 3 min. Then using a berel pipet draw enough solution to place into your cuvette. Cap the cuvette and measure the absorbance of the solution for about 30 sec and then remove from the Spectro-vis and place the cuvette in the warm water bath for a minute. Continue collecting absorbance for 30 sec and equilibrating in the warm water bath for a minute until you have enough data points to construct a graph. Use a second cuvette in the water bath with a temperature probe inserted to monitor the temperature of the solution. Generally the total collection time will be around 5 – 7 min. You can stop if you have a good decay curve with at least 15-20 data points.
C RT -DT2: Use the same technique as in part B above, except use ice to lower the tap water temperature to about 5 – 10° below
room temperature. Be sure you do not get the temperature of your water lower than 10°C. When collecting the data, collect absorbance for 10 – 12 min. Use the 30 sec collect, 1 min equilibrate technique for all three trials.

95
96
Processing the Data.
Perform the analysis for the data taken at room temperature, RT+DT1 and RT+DT2.
1. Label each graph and include proper labeling of the axis and relevant information related to the determination of the rate law.
2. Plot Absorbance vs. time, ln (Absorbance) vs time and 1/(Absorbance) vs time. From the three plots, which provides a straight line?
3 What is the order of the reaction relative to crystal violet? What is the order of the reaction relative to hydroxide (OH-)?
4 Determine the slope of the other two trials, that is the slope for the trial at RT+DT1 and RT+DT2.
5 From the slopes, calculate the rate constant, k, using the slope of the linear regression line for your linear curve (k = –slope for zero and first order and k = slope for second order). Be sure to include correct units for the rate constant. Note: This constant is sometimes referred to as the pseudo rate constant, because it does not take into account the effect of the other reactant, OH-.
6 Fill in the table.
Temperature k ln (k) 1/T 1
2
3
7 Plot ln(k) vs. 1/T, where the temperature is expressed in Kelvin.
8 From the plot, what does the slope represent? The slope provides the activation energy. What does the intercept represent? The intercept is the pre-exponential factor.
9 For each experiment (at the three temperatures) report the complete Rate law that includes the rate constants and the order in terms of CV. Also report t1/2, the activation energy, and the pre-exponential factor found in this experiment.
10. Using the printed data table, estimate the half-life of the reaction; select two points, one with an absorbance value that is about half of the other absorbance value. The time it takes the absorbance (or concentration) to be halved is known the half-life for the reaction. (As an alternative, you may choose to calculate the half-life from the rate constant, k, using the appropriate concentration-time formula.)
Six graphs will be due from each individual to complete this report. Three graphs will be for the room temperature (RT) data, one for
the room temperature RT+DT1 data and another for the and RT+DT2 data. The last graph is the Arrhenius equation that shows the data
for ln(k) versus 1/Temp. For the first five graphs, the plots with linear regression analysis with the equation of a line should be shown.
The correlation factor should also be shown to indicate which plot has the best fit to a straight line. The rate constants should be used
from these analyses. The sixth graph is the Arrhenius equation analysis that shows ln(k) vs 1/T. The plot (ln(K) vs 1/T) is used to
calculate the activation energy (Eact) and the pre-exponential factor (A). All graphs should be properly labeled with a description of
what the graph illustrates.
Post Lab Questions 1. This experiment was designed to find the order of the reaction with respect to crystal violet. What assumption was made about
the order of the hydroxide? 2. Write a description of a modification of this experiment that can be used to determine the order of this reaction with respect to
the hydroxide. 3. Based on your experimental results, do the rate laws for the three different experiments that were recorded at three different
temperatures have the same molecularity?
97
2. Experiment. Chemical Equilibrium: Finding a Constant, Kf
Objective: The purpose of this lab is to experimentally determine the equilibrium constant, Kf, for the following chemical reaction:
Fe3+(aq) + SCN–
(aq) D FeSCN2+(aq)
iron(III) thiocyanate thiocyanatoiron (III)
Materials Laptop 0.0020 M KSCN SpectroVis Plus 0.0020 M Fe(NO3)3 (in 1.0 M HNO3) Logger Pro 0.200 M Fe(NO3)3 (in 1.0 M HNO3) Tissues (preferably lint-free) Four pipets 1 plastic cuvette Pipet bulb or pipet pump One 20 X 150 mm test tubes Three 100-mL beakers Thermometer
Hazards and Safety
Look up SDS’s for all chemicals. Wear gloves for procedures that utilize harmful chemicals. Dispose of all solutions in chemical waste when done. Background:
When Fe3+ and SCN- are combined, equilibrium is established between these two ions and the FeSCN2+ ion. This ion is called a complex ion, and its associated reaction is known as a formation reaction. The corresponding equilibrium is described by a formation constant, Kf. A formation constant is just an ordinary equilibrium constant, and so you will see Kf and Kc used interchangeably. In order to
calculate Kc for the reaction, it is necessary to know the concentrations of all ions at equilibrium: [FeSCN2+]eq, [SCN–]eq, and [Fe3+]eq. You will prepare four equilibrium systems containing different concentrations of these three ions. The equilibrium concentrations of the three ions will then be experimentally determined. These values will be substituted into the equilibrium constant expression to see if Kc is indeed constant. In order to determine [FeSCN2+]eq, you will use the SpectroVis Plus. The FeSCN2+ ion produces solutions with a red color. The
SpectroVis Plus measures the amount of light absorbed by the colored solutions (absorbance, A). By comparing the absorbances of each equilibrium system, Aeq, to the absorbance of a standard solution, Astd, you can determine [FeSCN2+]eq. The standard solution has a
known FeSCN2+ concentration.
To prepare the standard solution, a very large concentration of Fe3+ (100 times larger than [Fe3+] in the equilibrium mixtures) will be added to a small initial concentration of SCN– (hereafter referred to as [SCN–]i. According to LeChâtelier's principle, this high concentration forces the reaction far to the right, using up nearly 100% of the SCN– ions. According to the balanced equation, for
every one mole of SCN– reacted, one mole of FeSCN2+ is produced. Thus [FeSCN2+]std is assumed to be equal to [SCN–]i.
Assuming [FeSCN2+] and absorbance are related directly (Beer's Law), the concentration of FeSCN2+ for any of the equilibrium systems can be found by:
[FeSCN2+]eq = x [FeSCN2+]std
Knowing the concentration of [FeSCN2+]eq allows you to determine the concentrations of the other two ions at equilibrium. For each
mole of FeSCN2+ ions produced, one less mole of Fe3+ ions will be found in the solution (see the 1:1 ratio of coefficients in the equation
above). The [Fe3+] at equilibrium can be determined by:
[Fe3+]eq = [Fe3+]i – [FeSCN2+]eq Because one mole of SCN- is used up for each mole of FeSCN2+ ions produced, [SCN–]eq can be determined by:
[SCN–]eq = [SCN–]i – [FeSCN2+]eq
Knowing the values of [Fe3+]eq, [SCN–]eq, and [FeSCN2+]eq, you can now calculate the value of Kc, the equilibrium constant.
Aeq
Astd
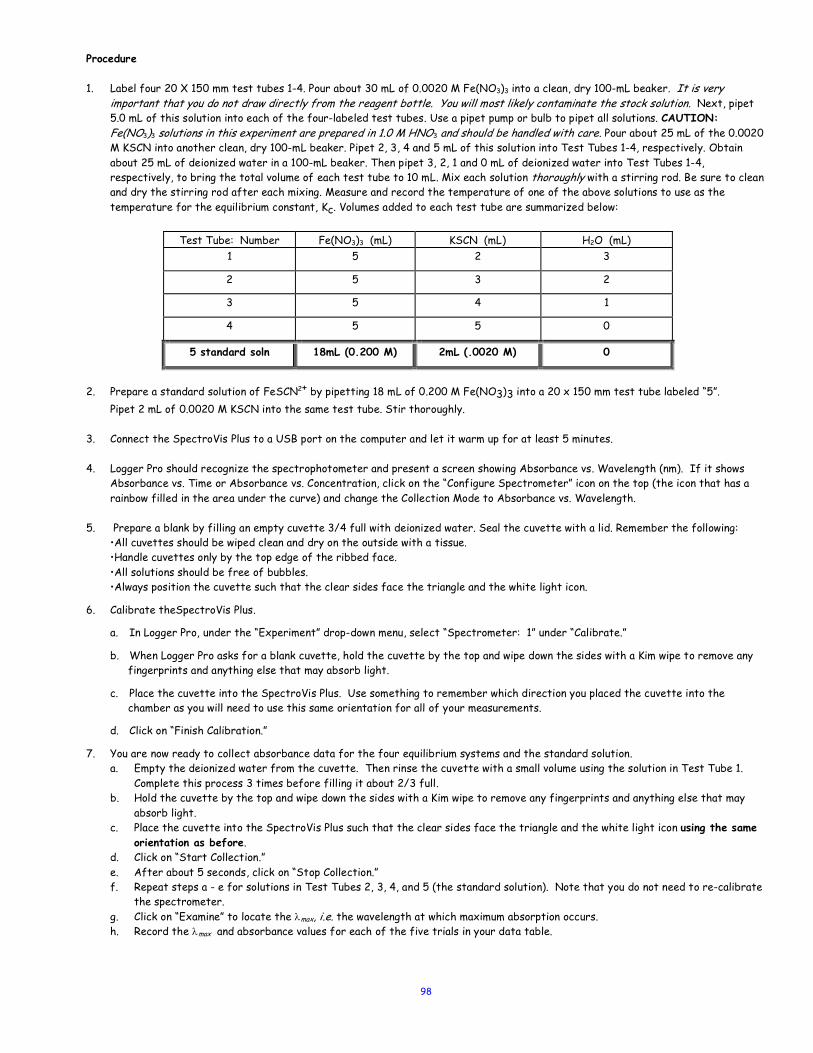
98
Procedure 1. Label four 20 X 150 mm test tubes 1-4. Pour about 30 mL of 0.0020 M Fe(NO3)3 into a clean, dry 100-mL beaker. It is very
important that you do not draw directly from the reagent bottle. You will most likely contaminate the stock solution. Next, pipet 5.0 mL of this solution into each of the four-labeled test tubes. Use a pipet pump or bulb to pipet all solutions. CAUTION: Fe(NO3)3 solutions in this experiment are prepared in 1.0 M HNO3 and should be handled with care. Pour about 25 mL of the 0.0020 M KSCN into another clean, dry 100-mL beaker. Pipet 2, 3, 4 and 5 mL of this solution into Test Tubes 1-4, respectively. Obtain about 25 mL of deionized water in a 100-mL beaker. Then pipet 3, 2, 1 and 0 mL of deionized water into Test Tubes 1-4, respectively, to bring the total volume of each test tube to 10 mL. Mix each solution thoroughly with a stirring rod. Be sure to clean and dry the stirring rod after each mixing. Measure and record the temperature of one of the above solutions to use as the temperature for the equilibrium constant, Kc. Volumes added to each test tube are summarized below:
Test Tube: Number Fe(NO3)3 (mL) KSCN (mL) H2O (mL) 1 5 2 3
2 5 3 2
3 5 4 1
4 5 5 0
5 standard soln 18mL (0.200 M) 2mL (.0020 M) 0
2. Prepare a standard solution of FeSCN2+ by pipetting 18 mL of 0.200 M Fe(NO3)3 into a 20 x 150 mm test tube labeled “5”. Pipet 2 mL of 0.0020 M KSCN into the same test tube. Stir thoroughly. 3. Connect the SpectroVis Plus to a USB port on the computer and let it warm up for at least 5 minutes. 4. Logger Pro should recognize the spectrophotometer and present a screen showing Absorbance vs. Wavelength (nm). If it shows
Absorbance vs. Time or Absorbance vs. Concentration, click on the “Configure Spectrometer” icon on the top (the icon that has a rainbow filled in the area under the curve) and change the Collection Mode to Absorbance vs. Wavelength.
5. Prepare a blank by filling an empty cuvette 3/4 full with deionized water. Seal the cuvette with a lid. Remember the following:
•All cuvettes should be wiped clean and dry on the outside with a tissue. •Handle cuvettes only by the top edge of the ribbed face. •All solutions should be free of bubbles.
•Always position the cuvette such that the clear sides face the triangle and the white light icon.
6. Calibrate theSpectroVis Plus.
a. In Logger Pro, under the “Experiment” drop-down menu, select “Spectrometer: 1” under “Calibrate.”
b. When Logger Pro asks for a blank cuvette, hold the cuvette by the top and wipe down the sides with a Kim wipe to remove any fingerprints and anything else that may absorb light.
c. Place the cuvette into the SpectroVis Plus. Use something to remember which direction you placed the cuvette into the chamber as you will need to use this same orientation for all of your measurements.
d. Click on “Finish Calibration.”
7. You are now ready to collect absorbance data for the four equilibrium systems and the standard solution. a. Empty the deionized water from the cuvette. Then rinse the cuvette with a small volume using the solution in Test Tube 1.
Complete this process 3 times before filling it about 2/3 full. b. Hold the cuvette by the top and wipe down the sides with a Kim wipe to remove any fingerprints and anything else that may
absorb light. c. Place the cuvette into the SpectroVis Plus such that the clear sides face the triangle and the white light icon using the same
orientation as before. d. Click on “Start Collection.” e. After about 5 seconds, click on “Stop Collection.” f. Repeat steps a - e for solutions in Test Tubes 2, 3, 4, and 5 (the standard solution). Note that you do not need to re-calibrate
the spectrometer. g. Click on “Examine” to locate the lmax, i.e. the wavelength at which maximum absorption occurs. h. Record the lmax and absorbance values for each of the five trials in your data table.
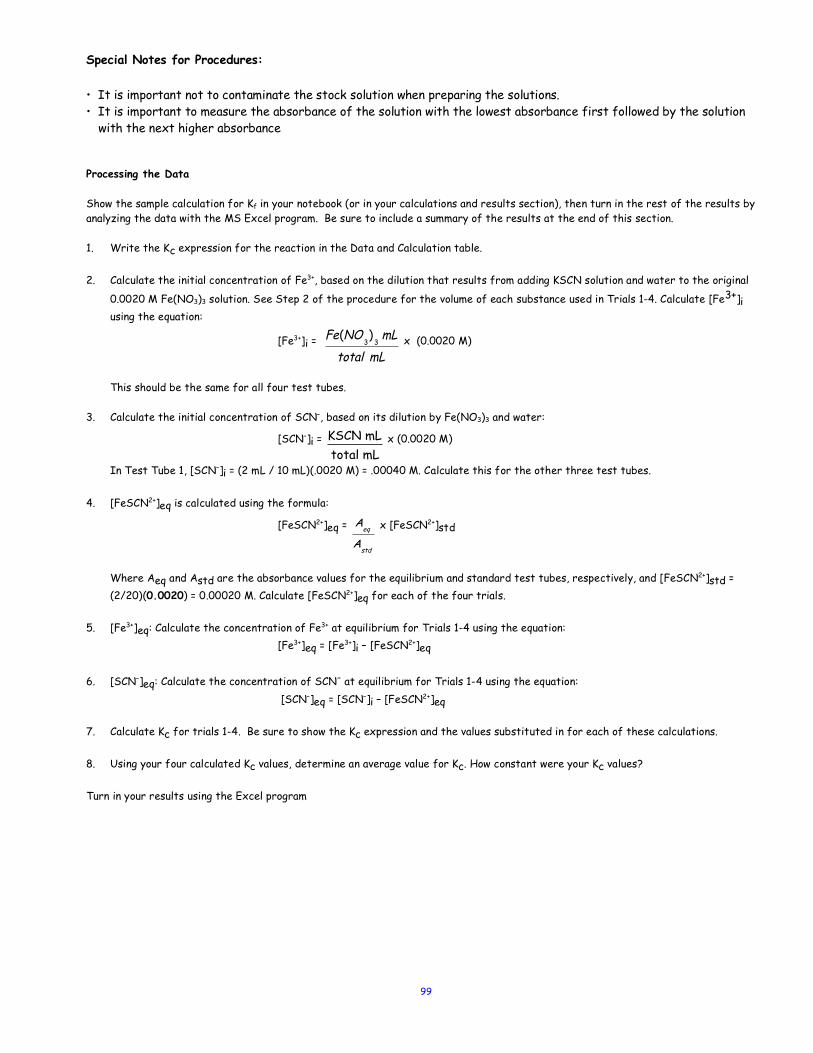
99
Special Notes for Procedures:
• It is important not to contaminate the stock solution when preparing the solutions. • It is important to measure the absorbance of the solution with the lowest absorbance first followed by the solution
with the next higher absorbance Processing the Data Show the sample calculation for Kf in your notebook (or in your calculations and results section), then turn in the rest of the results by analyzing the data with the MS Excel program. Be sure to include a summary of the results at the end of this section. 1. Write the Kc expression for the reaction in the Data and Calculation table. 2. Calculate the initial concentration of Fe3+, based on the dilution that results from adding KSCN solution and water to the original
0.0020 M Fe(NO3)3 solution. See Step 2 of the procedure for the volume of each substance used in Trials 1-4. Calculate [Fe3+]i using the equation:
[Fe3+]i = x (0.0020 M)
This should be the same for all four test tubes. 3. Calculate the initial concentration of SCN–, based on its dilution by Fe(NO3)3 and water:
[SCN–]i = x (0.0020 M)
In Test Tube 1, [SCN–]i = (2 mL / 10 mL)(.0020 M) = .00040 M. Calculate this for the other three test tubes. 4. [FeSCN2+]eq is calculated using the formula:
[FeSCN2+]eq = x [FeSCN2+]std
Where Aeq and Astd are the absorbance values for the equilibrium and standard test tubes, respectively, and [FeSCN2+]std =
(2/20)(0.0020) = 0.00020 M. Calculate [FeSCN2+]eq for each of the four trials. 5. [Fe3+]eq: Calculate the concentration of Fe3+ at equilibrium for Trials 1-4 using the equation: [Fe3+]eq = [Fe3+]i – [FeSCN2+]eq 6. [SCN–]eq: Calculate the concentration of SCN- at equilibrium for Trials 1-4 using the equation: [SCN–]eq = [SCN–]i – [FeSCN2+]eq 7. Calculate Kc for trials 1-4. Be sure to show the Kc expression and the values substituted in for each of these calculations. 8. Using your four calculated Kc values, determine an average value for Kc. How constant were your Kc values? Turn in your results using the Excel program
Fe(NO3)
3 mL
total mL
KSCN mLtotal mL
Aeq
Astd
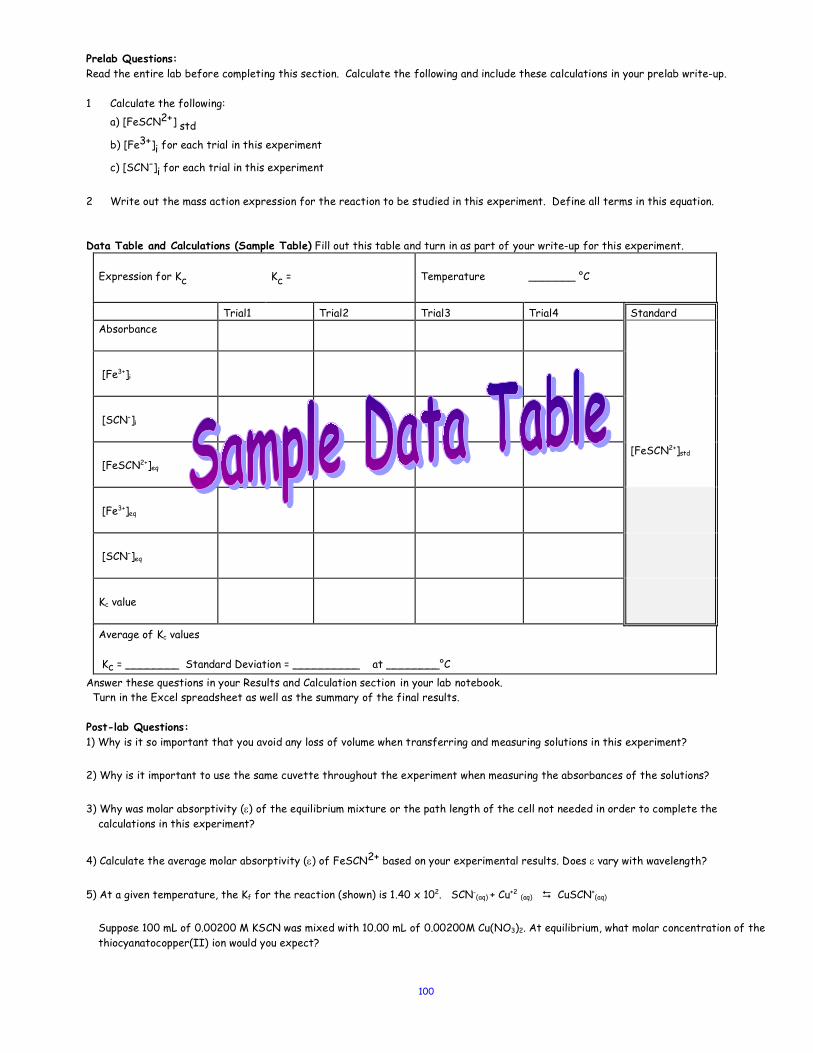
100
Prelab Questions: Read the entire lab before completing this section. Calculate the following and include these calculations in your prelab write-up. 1 Calculate the following: a) [FeSCN2+] std
b) [Fe3+]i for each trial in this experiment
c) [SCN-]i for each trial in this experiment
2 Write out the mass action expression for the reaction to be studied in this experiment. Define all terms in this equation. Data Table and Calculations (Sample Table) Fill out this table and turn in as part of your write-up for this experiment.
Expression for Kc
Kc =
Temperature
_______ °C
Trial1 Trial2 Trial3 Trial4 Standard Absorbance
[Fe3+]i
[SCN–]i
[FeSCN2+]eq
[FeSCN2+]std
[Fe3+]eq
[SCN–]eq
Kc value
Average of Kc values Kc = ________ Standard Deviation = __________ at ________°C
Answer these questions in your Results and Calculation section in your lab notebook. Turn in the Excel spreadsheet as well as the summary of the final results. Post-lab Questions: 1) Why is it so important that you avoid any loss of volume when transferring and measuring solutions in this experiment?
2) Why is it important to use the same cuvette throughout the experiment when measuring the absorbances of the solutions?
3) Why was molar absorptivity (e) of the equilibrium mixture or the path length of the cell not needed in order to complete the calculations in this experiment?
4) Calculate the average molar absorptivity (e) of FeSCN2+ based on your experimental results. Does e vary with wavelength?
5) At a given temperature, the Kf for the reaction (shown) is 1.40 x 10². SCN-(aq) + Cu+2 (aq) D CuSCN+
(aq)
Suppose 100 mL of 0.00200 M KSCN was mixed with 10.00 mL of 0.00200M Cu(NO3)2. At equilibrium, what molar concentration of the thiocyanatocopper(II) ion would you expect?
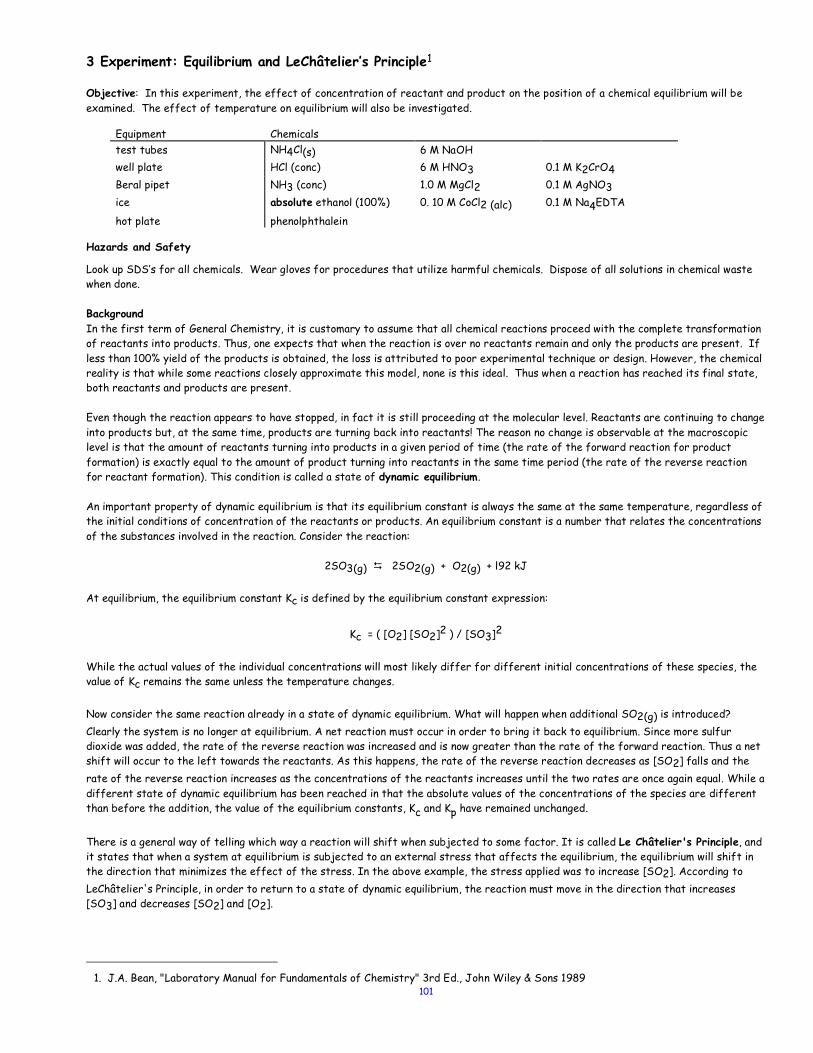
101
3 Experiment: Equilibrium and LeChâtelier’s Principle1 Objective: In this experiment, the effect of concentration of reactant and product on the position of a chemical equilibrium will be examined. The effect of temperature on equilibrium will also be investigated.
Equipment Chemicals test tubes NH4Cl(s) 6 M NaOH well plate HCl (conc) 6 M HNO3 0.1 M K2CrO4 Beral pipet NH3 (conc) 1.0 M MgCl2 0.1 M AgNO3 ice absolute ethanol (100%) 0. 10 M CoCl2 (alc) 0.1 M Na4EDTA
hot plate phenolphthalein Hazards and Safety
Look up SDS’s for all chemicals. Wear gloves for procedures that utilize harmful chemicals. Dispose of all solutions in chemical waste when done. Background In the first term of General Chemistry, it is customary to assume that all chemical reactions proceed with the complete transformation of reactants into products. Thus, one expects that when the reaction is over no reactants remain and only the products are present. If less than 100% yield of the products is obtained, the loss is attributed to poor experimental technique or design. However, the chemical reality is that while some reactions closely approximate this model, none is this ideal. Thus when a reaction has reached its final state, both reactants and products are present. Even though the reaction appears to have stopped, in fact it is still proceeding at the molecular level. Reactants are continuing to change into products but, at the same time, products are turning back into reactants! The reason no change is observable at the macroscopic level is that the amount of reactants turning into products in a given period of time (the rate of the forward reaction for product formation) is exactly equal to the amount of product turning into reactants in the same time period (the rate of the reverse reaction for reactant formation). This condition is called a state of dynamic equilibrium. An important property of dynamic equilibrium is that its equilibrium constant is always the same at the same temperature, regardless of the initial conditions of concentration of the reactants or products. An equilibrium constant is a number that relates the concentrations of the substances involved in the reaction. Consider the reaction:
2SO3(g) D 2SO2(g) + O2(g) + l92 kJ At equilibrium, the equilibrium constant Kc is defined by the equilibrium constant expression:
Kc = ( [O2] [SO2]2 ) / [SO3]2 While the actual values of the individual concentrations will most likely differ for different initial concentrations of these species, the value of Kc remains the same unless the temperature changes. Now consider the same reaction already in a state of dynamic equilibrium. What will happen when additional SO2(g) is introduced? Clearly the system is no longer at equilibrium. A net reaction must occur in order to bring it back to equilibrium. Since more sulfur dioxide was added, the rate of the reverse reaction was increased and is now greater than the rate of the forward reaction. Thus a net shift will occur to the left towards the reactants. As this happens, the rate of the reverse reaction decreases as [SO2] falls and the rate of the reverse reaction increases as the concentrations of the reactants increases until the two rates are once again equal. While a different state of dynamic equilibrium has been reached in that the absolute values of the concentrations of the species are different than before the addition, the value of the equilibrium constants, Kc and Kp have remained unchanged.
There is a general way of telling which way a reaction will shift when subjected to some factor. It is called Le Châtelier's Principle, and it states that when a system at equilibrium is subjected to an external stress that affects the equilibrium, the equilibrium will shift in the direction that minimizes the effect of the stress. In the above example, the stress applied was to increase [SO2]. According to LeChâtelier's Principle, in order to return to a state of dynamic equilibrium, the reaction must move in the direction that increases [SO3] and decreases [SO2] and [O2].
1. J.A. Bean, "Laboratory Manual for Fundamentals of Chemistry" 3rd Ed., John Wiley & Sons 1989
102
In addition to stress applied through a change in concentration, dynamic equilibria also shift in response to temperature. This is not due solely to an indirect effect of changing the concentration of a substance by changing its volume as the temperature changes. In fact, a shift in the equilibrium is observed even when the temperature of a system in a closed, rigid container of fixed volume is varied. Instead the shift that occurs happens because the value of the equilibrium constant itself changes with temperature. Nonetheless LeChâtelier's Principle applies to temperature changes as well. In this experiment, you will subject a number of different chemical systems that are at equilibrium to stresses involving changes in concentration or temperature. You are to determine the direction in which the equilibria shift in response to these stresses and then try to formulate general statements about to the results. In addition, be prepared to write the molecular, complete and net ionic equations for each reaction studied in this experiment. Prelab Questions (Answer these questions using complete sentences and with the question written in your answer). The mass action expression for the reaction in a 1-L vessel is: 2SO2 (g) + O2 (g) D 2SO3 (g) DH = - l92 kJ
1) Explain the purpose of the D symbol in a chemical equation. What do g and f indicate?
2) Briefly define the following: a) Chemical equilibrium b) endothermic reaction c) LeChâtelier’s Principle
3) Consider the reaction: 2SO2(g) + O2(g) D 2SO3(g) DH = - l92 kJ at 400 °C a) What is the mass action expression for this reaction? b) In what direction will this reaction shift if the reaction vessel is increased to 2 L? Explain your answer in terms of LeChâtelier’s Principle (LP) and concentration changes of a gas with change in volume. c) How should the temperature be adjusted in this reaction if more SO3 is to be produced? Explain in terms of LP and Keq
dependency on temperature.
Procedure: Adjust the amounts in this procedure accordingly so that solutions do not overflow in the well plates.
1) Chromate-Dichromate equilibrium - Place 9-10 drops of 0.1 M K2CrO4 (aq) into each of two wells in a well plate labeled well A-1 and
well A-2. Note the color. Add 4 drop of 6 M HNO3(aq) to one well only and observe. A dynamic equilibrium is now present:
2 H+(aq) + 2 CrO42-(aq) D Cr2O72-(aq) + H2O (l) equation (1)
To the same well as you added the nitric acid, add 6 drops of 6 M NaOH and observe (record your observation), followed by 5 drops of 6 M HNO3 and further observation. Use the original solution in the second well for color comparison purposes while making all of these observations. Record your observations and discuss your results in the context of equation 1 above. Write all pertinent reactions in your data table.
Discard the waste in this procedure in the proper waste container. Rinse the container/test tubes with a minimum amount of water
and discharge into the waste container. 2) Saturated NH4Cl solution – Add an amount of ammonium chloride in a test tube which contains about 2 mL of water while stirring.
Add enough ammonium chloride until some of the solid remains undissolved. Note whether the temperature of the solution changes as the solid is dissolving. The system is now at dynamic equilibrium as represented by the reaction:
NH4Cl(s) D NH4+(aq) + Cl-(aq) equation (2)
Pour some of the liquid (and no solid) into a second dry test tube (note that it is important that this tube be dry). Add 2-3 drops of conc. HCl to the liquid. Observe what happens. Put the test tube in a hot water bath and observe what happens. Now place the solution in a cold bath and observe what happens. Record your observations and discuss your results in the context of equation 2 above. Write all pertinent reactions in your data table.
Discard the waste in this procedure in the proper waste container. When cleaning your test tube or container, rinse with a minimum
amount of water to remove residual waste from the container/test tubes and discharge into the waste container.
103
3) Equilibrium effects in complex cations - Aqueous cobalt chloride - The equilibrium under study here is:
4 Cl-(ethanol) + Co(H2O)62+(ethanol) D CoCl42-(ethanol) + 6 H2O(ethanol) equation (3)
Begin by heating 150 mL of deionized water in a 250 mL beaker and using your 400 mL beaker to form an ice bath. These will be used later during these equilibrium procedures.
Place about 10 mL 0.10 M CoCl2(ethanol) into a clean dry test tube and observe the color [Note: CoCl2 completely dissociates
in water to form Co(H2O)62+ and Cl- ions]. Using a dry Beral pipet, add 15 drops of the CoCl2 solution to well B-1. Observe the
initial color of this solution. Using a clean, Beral pipet, add one drop of deionized water to the mixture and mix with a toothpick. Add an additional 3 drops of water dropwise, stirring the mixture after each drop. Note any change (color and temperature) and record this in your notebook.
Slowly add drops of concentrated HCl (CAUTION: conc HCl is an extremely corrosive substance. Avoid inhalation of the
fumes and skin contact) to this mixture in B-1. Stir the mixture and continue to add HCl until you observe a color change. Try and add enough HCl such that there is a distinct color change. Record the changes in your notebook.
Add one drop of AgNO3 solution from the dropper bottle to the mixture in B-1. Stir the mixture while continuing to add
AgNO3 dropwise until you observe a color change. Note that you may have to wait to see a color change. Try and describe the
color of the mixture. Don’t let the white precipitate bias the color you see for the mixture. Record your observations and discuss your results in the context of equation above and any new reactions that occurred. Write all pertinent reactions in your data table.
Using a new dry Beral pipet, half-filled well B-2 with new solution of CoCl2. Add deionized water dropwise while stirring until
the solution has changed color. (One drop of water should suffice in this step, if the solution is already blue). Record your observations in your notebook.
Next add one drop of absolute ethyl alcohol from the dropper bottle to the mixture in B-2. Continue to add ethanol dropwise
until you observe a color change. [Note that if you do not see a color change with ethanol, repeat the procedure in this paragraph but add one drop of water before proceeding with the addition of ethanol. Note that the ethanol must be absolute, 100% ethanol.] Record your observations and discuss your results in the context of equation above and any new reactions that may have occurred. Write all pertinent reactions in your data table.
Using another clean dry Beral pipet, half fill well B-3 with CoCl2 solution. Add enough water until the solution just turns pink
then add enough concentrated HCl until the solution turns light blue or violet. Next draw all the mixture from well B-3 into a clean dry Beral Pipet. Invert the pipet so the solution fills the pipet bulb. Tap the side of the Beral pipet to drain any solution in the pipet stem into the bulb. Place the pipet bulb in your hot-water bath, swirling the pipet and its content to occasionally speed the heating process. Allow the pipet to remain in the hot-water bath until you observe a color change. Turn off the hot plate at this point.
Holding the pipet stem, carefully remove the pipet from the hot-water bath and place the pipet in the ice-water bath. Swirl
the pipet and allow the pipet to remain in the ice water bath until you observe a color change. Record your observations and discuss your results in the context of equation above and any new reactions that may have occurred. Write all pertinent reactions in your data table.
Discard the waste in this procedure in the proper waste container. Rinse the container/test tubes with a minimum amount of
water and discharge into the waste container. Clean all the Beral pipets by rinsing with deionized water. Keep these Beral pipets in your locker for future use.
4) Magnesium hydroxide equilibrium – Place 10 mL of 1.0 MgCl2 in a clean dry test tube. Fill well C-1, C-2, C-3 and C-4 with 10
drops of this solution using a Beral pipet. The equilibrium under study is:
Mg(OH)2(s) D Mg2+(aq) + 2 OH-(aq) equation (4)
Add 1 drop of phenolphthalein to well C-3 and C-4. Thoroughly stir each mixture with a toothpick. Leave the toothpick in the wells. Place 10 mL of 0.5 M NaOH solution in a test tube. From this test tube, use a Beral pipet to add 5 drops of NaOH to each of
the wells, wells C1 through C-4. Thoroughly stir the mixtures with toothpicks and leave the toothpicks in the wells. Record your observations and discuss your results in the context of equation 4 above. Write all pertinent reactions in your data table.
104
‘
Add one drop of concentrated HCl to well C-1. Record your observations and discuss your results in the context of equation 4 above. Write all pertinent reactions in your data table.
‘
Add one drop of Na4EDTA to well C-2. If nothing changes continue to add EDTA solution dropwise until changes are observed.
Remember that it is important to use a dry clean well in the beginning of this experiment. Record your observations and discuss your results in the context of equation 4 above. Write all pertinent reactions in your data table.
‘
Draw the solution and as much of precipitate as possible from C-3 into the bulb of a Beral pipet. Carefully expel the solution back into the well in order to mix thoroughly. Draw the solution again and carefully invert the Beral pipet allowing the solution to fill the pipet bulb. Hold the inverted pipet tip and tap the stem directly to drain the liquid down the bulb. Place the pipet with the content from well C-3 into a hot-water bath. Record your observations and discuss your results in the context of equation 4 above. Write all pertinent reactions in your data table.
Repeat the previous step using well C-4 and place the contents in an ice-water bath. Record your observations and discuss
your results in the context of equation 4 above. Write all pertinent reactions in your data table. ‘
Discard the waste in this procedure in the proper waste container. Rinse the container/test tubes with a minimum amount of water and discharge into the waste container.
Data and Observations Data should be written in table form & detailed observations written within the table or at the bottom of the table. The
reaction under investigation should be written before each procedure, followed by experimental factors that are applied to cause the equilibrium to be disturbed. Side chemical reactions affecting the main reaction should be shown and comments should be written on how such reactions affect the equilibrium. Predictions on the direction of the equilibrium should be made whenever possible before actually carrying out the procedure. Written observations of what occur should be written as the procedure is carried out and the prediction and observations can be compared.
Results and Tabulation Write balanced equations for each observation mode in the above procedure in a summary table. Be sure to state what stresses are introduced to each reaction and how the system responded to each stress imposed. State the direction in which the reaction shifted to and cite the evidence you observed to support your statement.
Discussion and Conclusions 1. Discuss each point brought up in your lab manual as well as each equation again and discuss how Le Châtelier's Principle is operative after each stress on the system. ‘
2. Explain all of the changes you observed during the experiment on the basis of Le Châtelier's principle. ‘
3. Based on your work, make general statements about what happens when: a) more of a substance participating in the equilibrium is added to the system; b) a substance is added which reacts with one of the species participating in the equilibrium; and c) an endothermic reaction is heated.
Post lab Question 1. For a saturated solution of NH4Cl(s), in what direction will the reaction proceed if more NH4Cl(s) is added into the solution
mixture? The equilibrium reaction is: NH4Cl(s) D NH4+(aq) + Cl-(aq) 2. Experience teaches us that most solids are more soluble in warm water than in cold water. Does the solubility of Mg(OH)2 fit
this pattern? Explain. 3. Cobalt(II) chloride is used in many weather-forecasting devices. Based on your observations in the laboratory, explain how an
alcohol solution of CoCl2 can be used to forecast the weather.
4. Look up or calculate the solubility product constant for NH4Cl(s) and Ag2CO3(s) at 20 °C. (Hint use the solubility (s) of these salts found in the CRC reference book to calculate the Ksp.)‡
Special notes about experiment and write-up. • The reaction for the saturated NH4Cl procedure (station #1) will not work if the solution is not saturated.
• If the test tubes are dirty the reaction will not work for Equilibrium 2. • When writing up the discussion for this experiment, don’t just write that the reaction shifts to the right or left, explain why it shifts
in that direction. For the secondary reactions (if any) explain how these reactions affected the main reactions and what changes occurred. Write down the evidence that was observed to support your statement.
‡ http://en.wikipedia.org/wiki/Solubility_table
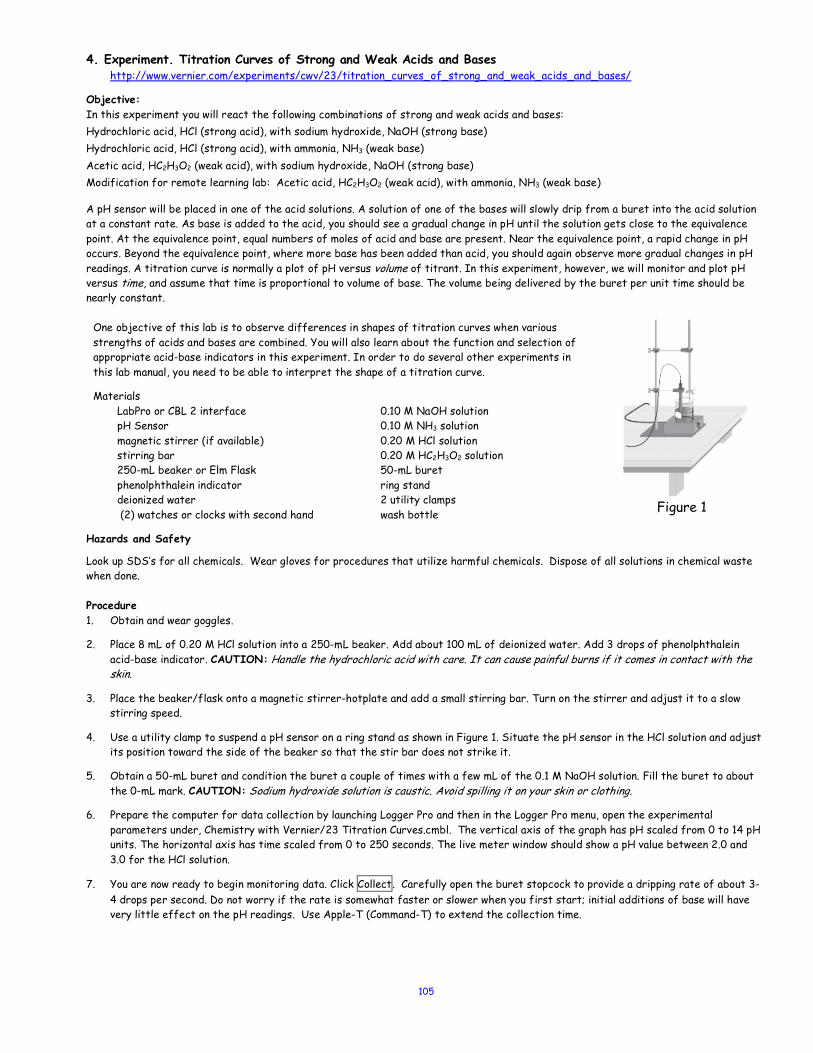
105
4. Experiment. Titration Curves of Strong and Weak Acids and Bases http://www.vernier.com/experiments/cwv/23/titration_curves_of_strong_and_weak_acids_and_bases/
Objective: In this experiment you will react the following combinations of strong and weak acids and bases: Hydrochloric acid, HCl (strong acid), with sodium hydroxide, NaOH (strong base) Hydrochloric acid, HCl (strong acid), with ammonia, NH3 (weak base) Acetic acid, HC2H3O2 (weak acid), with sodium hydroxide, NaOH (strong base) Modification for remote learning lab: Acetic acid, HC2H3O2 (weak acid), with ammonia, NH3 (weak base)
A pH sensor will be placed in one of the acid solutions. A solution of one of the bases will slowly drip from a buret into the acid solution at a constant rate. As base is added to the acid, you should see a gradual change in pH until the solution gets close to the equivalence point. At the equivalence point, equal numbers of moles of acid and base are present. Near the equivalence point, a rapid change in pH occurs. Beyond the equivalence point, where more base has been added than acid, you should again observe more gradual changes in pH readings. A titration curve is normally a plot of pH versus volume of titrant. In this experiment, however, we will monitor and plot pH versus time, and assume that time is proportional to volume of base. The volume being delivered by the buret per unit time should be nearly constant.
One objective of this lab is to observe differences in shapes of titration curves when various strengths of acids and bases are combined. You will also learn about the function and selection of appropriate acid-base indicators in this experiment. In order to do several other experiments in this lab manual, you need to be able to interpret the shape of a titration curve.
Materials LabPro or CBL 2 interface 0.10 M NaOH solution pH Sensor 0.10 M NH3 solution magnetic stirrer (if available) 0.20 M HCl solution stirring bar 0.20 M HC2H3O2 solution 250-mL beaker or Elm Flask 50-mL buret phenolphthalein indicator ring stand deionized water 2 utility clamps (2) watches or clocks with second hand wash bottle
Figure 1
Hazards and Safety
Look up SDS’s for all chemicals. Wear gloves for procedures that utilize harmful chemicals. Dispose of all solutions in chemical waste when done. Procedure 1. Obtain and wear goggles.
2. Place 8 mL of 0.20 M HCl solution into a 250-mL beaker. Add about 100 mL of deionized water. Add 3 drops of phenolphthalein acid-base indicator. CAUTION: Handle the hydrochloric acid with care. It can cause painful burns if it comes in contact with the skin.
3. Place the beaker/flask onto a magnetic stirrer-hotplate and add a small stirring bar. Turn on the stirrer and adjust it to a slow stirring speed.
4. Use a utility clamp to suspend a pH sensor on a ring stand as shown in Figure 1. Situate the pH sensor in the HCl solution and adjust its position toward the side of the beaker so that the stir bar does not strike it.
5. Obtain a 50-mL buret and condition the buret a couple of times with a few mL of the 0.1 M NaOH solution. Fill the buret to about the 0-mL mark. CAUTION: Sodium hydroxide solution is caustic. Avoid spilling it on your skin or clothing.
6. Prepare the computer for data collection by launching Logger Pro and then in the Logger Pro menu, open the experimental parameters under, Chemistry with Vernier/23 Titration Curves.cmbl. The vertical axis of the graph has pH scaled from 0 to 14 pH units. The horizontal axis has time scaled from 0 to 250 seconds. The live meter window should show a pH value between 2.0 and 3.0 for the HCl solution.
7. You are now ready to begin monitoring data. Click Collect. Carefully open the buret stopcock to provide a dripping rate of about 3-4 drops per second. Do not worry if the rate is somewhat faster or slower when you first start; initial additions of base will have very little effect on the pH readings. Use Apple-T (Command-T) to extend the collection time.
106
8. Watch to see if the phenolphthalein changes color before, at the same time, or after the rapid change in pH at the equivalence point. Note: Time is displayed in the live meter window. If phenolphthalein is a suitable indicator for this reaction, it should change from clear to red at about the same time as the jump in pH occurs. In your data table, record the time (displayed in the Table window) when the phenolphthalein indicator changes color. When data collection has ended after 250 seconds, turn the buret stopcock to stop the flow of NaOH titrant. Record the final reading on the buret.
9. To print a graph of pH vs. time: a. Click on the graph title. In the edit box that appears, type the trial and acid and base strength. Click OK. b. Print a copy of the Graph window. Enter your name(s) and the number of copies of the graph you want.
10. You can read pH and time values along the pH curve by clicking the Examine button, . As you move the mouse cursor across the graph, pH and time data points are displayed in the examine-box on the graph. Determine the approximate time for the equivalence point; that is, for the biggest jump in pH in the steep vertical region of the curve. Record this time in the data table. Rinse the pH sensor and return it to the sensor storage solution. Dispose of the beaker contents as directed by your instructor. Clean and dry the 250-mL beaker for the next trial. Note: You do not need to save or store your data for any of the three trials.
11. Repeat the procedure using NaOH titrant and acetic acid solution, HC2H3O2. CAUTION: Handle the solutions with care. You do not need to refill the buret. Add 8 mL of 0.20 M HC2H3O2 solution to the 250-mL beaker. Add about 100 mL of deionized water and 3 drops of phenolphthalein to the beaker. Rinse the tip of the sensor and position it in the acid solution as you did in Step 4. Repeat Steps 7-10 of the procedure.
12. Drain the remaining NaOH from the buret and dispose of it as directed by your instructor.
13. Rinse the 50-mL buret with a few mL of the 0.1 M NH3 solution. Fill the buret with NH3 to about the 0-mL mark. Add 8 mL of 0.20 M HCl solution to the 250-mL beaker. Add about 100 mL of deionized water and 3 drops of phenolphthalein to the beaker. Rinse the sensor and position it in the acid solution as you did in Step 4. Repeat Steps 7-10 of the procedure.
14. Rinse the 50-mL buret with a few mL of the 0.1 M NH3 solution. Fill the buret with NH3 to about the 0-mL mark. Add 8 mL of 0.20 M HC2H3O2 solution to the 250-mL beaker. Add about 100 mL of deionized water and 3 drops of phenolphthalein to the beaker. Rinse the sensor and position it in the acid solution as you did in Step 4. Repeat Steps 7-10 of the procedure.
Processing the data 1. Examine the data for each of the titrations 1-4. In which trial(s) did the indicator change color at about the same time/volume as
the large increase in pH occurred at the equivalence point? In which trial(s) was there a significant difference? 2. Phenolphthalein changes from clear to red at a pH value of about 9. According to your results, with which combination(s) of strong
or weak acids and bases can phenolphthalein be used to determine the equivalence point? 3. Compare your answers to Questions 1 and 2. By examining a titration curve, how can you decide which acid-base indicator to use to
find the equivalence point? 4. Methyl red is an acid-base indicator that changes color at a pH value of about 5. From what you learned in this lab, methyl red could
be used to determine the equivalence point of what combination of strong or weak acids and bases? 5. Of the four-titration curves, which combination of strong or weak acids and bases had the longest vertical region of the
equivalence point? The shortest? 6. The acid-base reaction between HCl and NaOH produces a solution with a pH of 7 at the equivalence point. Why does an acid-base
indicator that changes color at pH 5 or 9 work just as well for this reaction as one that changes color at pH 7? 7. In general, how does the shape of a curve with a weak species (NH3 or HC2H3O2) differ from the shape of a curve with a strong
species (NaOH or HCl)? 8. Complete each of the equations in the table below. Data Table
Trial Equation for acid-base reaction Time of indicator color change
Time at equivalence point
1 NaOH + HCl g s s 2 NaOH + HC2H3O2 g s s 3 NH3 + HCl g s s 4 NH3 + HC2H3O2 g s s
107
5. Experiment. Determination of the Molecular Weight and Acidity Constant for a Weak Acid. http://www.vernier.com/experiments/cwv/27/acid_dissociation_constant_ka/ Objective: In this experiment, the identity of a weak acid will be determined through its molecular weight and its pKa as measured through titrimetry. Materials
Vernier computer interface with Logger Pro 50 mL Buret 0.100 M NaOH Unknown acids, See appendix for Ka values Magnetic stirring hot plate Deionized water Phenolphthalein indicator Small magnets 3-250mL Wide mouth Erlenmeyer flasks Vernier pH probes Various beakers
Hazards and Safety
Look up SDS’s for all chemicals. Wear gloves for procedures that utilize harmful chemicals. Dispose of all solutions in chemical waste when done. Background In this experiment, you will use a standardized NaOH solution to determine the pKa, ka, and molecular weight of a weak monoprotic unknown acid. To do so, you will titrate a solution of the unknown acid against the standardized NaOH solution. The process will require recording pH data continuously, graphing the data, and then analyzing the titration curve. We can collect information about the molecular weight and strength of an unknown acid (HA) using a technique called titration. Titration is the addition of a chemically equivalent volume of a solution of known concentration, a standardized solution, to the solution being analyzed. We use a buret to add the standardized solution, or titrant, to precisely measure the volume required for neutralization. For most titrations, we use a standardized NaOH solution as the titrant to perform the neutralization reaction shown in Equation 1. HA(aq) + NaOH(aq) g NaA(aq) + H2O(l) Eqn-1
The acidity constant, Ka, of the weak acid can then be found based on the equilibrium constant expression. For a generic weak acid, the chemical reaction of interest is HA(aq) + H2O(l) D H3O+(aq) + A-(aq) Eqn-2 The equilibrium constant expression is then given by
Eqn-3
Note that if [HA] = [A-] then these two terms cancel out. Therefore, under this condition:
Ka = [H3O+] Eqn-4
If we define pX = - log X for any quantity X, then taking the negative logarithm of both sides of the above expression and applying the definition yields: pKa = pH Eqn-5
Remember that this equation applies only if [HA] = [A-].
In the second part of the experiment, a sample of the unknown acid is titrated to its equivalence point and then an additional volume of
the original acid solution is pipetted into it. Since all of the original moles of HA were converted to an equal number of moles of A- at the equivalence point, and since the addition of a second aliquot of acid adds back that same number of moles of HA, it follows that moles A- = moles of HA under these conditions. Since they are in the same solution the volume is the same for both, and thus [A-] = [HA]. Therefore, the pH of this solution is equal to the pKa of the weak acid.
The reactants and products involved in most acid-base titrations are clear and colorless. Therefore, when we mix the acid and base, we cannot visually identify the point at which the acid has been completely neutralized by the base. So, we usually use one of the following two methods to monitor a titration. The choice of methods depends on the information we wish to obtain.
If we are only interested in the total volume of titrant required for neutralization, we can add a visual indicator to the acid we are
titrating. Visual indicators are organic compounds whose color depends on the H3O+ concentration, and thus the pH, of the reaction
mixture. As we add NaOH solution to an acid solution, H3O+ ions are neutralized, decreasing the H3O+ concentration and increasing the
solution pH value. At the equivalence point of the titration, when we have added a chemically equivalent amount of NaOH to the acid, the
Ka=
H3O+!
"#$ A
−!"
#$
HA!"
#$
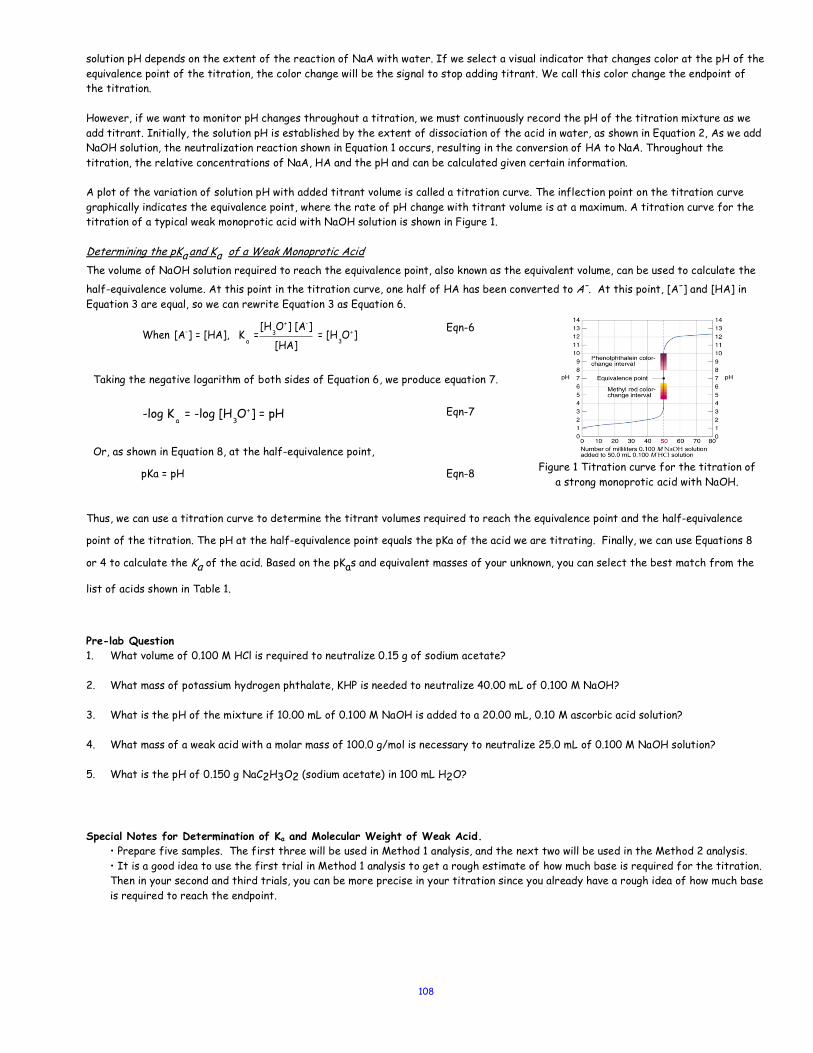
108
solution pH depends on the extent of the reaction of NaA with water. If we select a visual indicator that changes color at the pH of the equivalence point of the titration, the color change will be the signal to stop adding titrant. We call this color change the endpoint of the titration. However, if we want to monitor pH changes throughout a titration, we must continuously record the pH of the titration mixture as we add titrant. Initially, the solution pH is established by the extent of dissociation of the acid in water, as shown in Equation 2, As we add NaOH solution, the neutralization reaction shown in Equation 1 occurs, resulting in the conversion of HA to NaA. Throughout the titration, the relative concentrations of NaA, HA and the pH and can be calculated given certain information. A plot of the variation of solution pH with added titrant volume is called a titration curve. The inflection point on the titration curve graphically indicates the equivalence point, where the rate of pH change with titrant volume is at a maximum. A titration curve for the titration of a typical weak monoprotic acid with NaOH solution is shown in Figure 1. Determining the pKa and Ka of a Weak Monoprotic Acid The volume of NaOH solution required to reach the equivalence point, also known as the equivalent volume, can be used to calculate the
half-equivalence volume. At this point in the titration curve, one half of HA has been converted to A-. At this point, [A-] and [HA] in Equation 3 are equal, so we can rewrite Equation 3 as Equation 6.
Eqn-6
Taking the negative logarithm of both sides of Equation 6, we produce equation 7.
Eqn-7
Or, as shown in Equation 8, at the half-equivalence point,
pKa = pH Eqn-8
Figure 1 Titration curve for the titration of
a strong monoprotic acid with NaOH.
Thus, we can use a titration curve to determine the titrant volumes required to reach the equivalence point and the half-equivalence
point of the titration. The pH at the half-equivalence point equals the pKa of the acid we are titrating. Finally, we can use Equations 8
or 4 to calculate the Ka of the acid. Based on the pKas and equivalent masses of your unknown, you can select the best match from the
list of acids shown in Table 1.
Pre-lab Question 1. What volume of 0.100 M HCl is required to neutralize 0.15 g of sodium acetate? 2. What mass of potassium hydrogen phthalate, KHP is needed to neutralize 40.00 mL of 0.100 M NaOH? 3. What is the pH of the mixture if 10.00 mL of 0.100 M NaOH is added to a 20.00 mL, 0.10 M ascorbic acid solution? 4. What mass of a weak acid with a molar mass of 100.0 g/mol is necessary to neutralize 25.0 mL of 0.100 M NaOH solution? 5. What is the pH of 0.150 g NaC2H3O2 (sodium acetate) in 100 mL H2O?
Special Notes for Determination of Ka and Molecular Weight of Weak Acid.
• Prepare five samples. The first three will be used in Method 1 analysis, and the next two will be used in the Method 2 analysis. • It is a good idea to use the first trial in Method 1 analysis to get a rough estimate of how much base is required for the titration. Then in your second and third trials, you can be more precise in your titration since you already have a rough idea of how much base is required to reach the endpoint.
When [A-] = [HA], Ka =
[H3O+] [A-]
[HA] = [H
3O+]
-log Ka = -log [H
3O+] = pH
109
Titration of Unknown Weak Acid Start your procedure from this point if directed by the instructor. There will be a total of five titrations for this analysis. Ask your instructor if Method 1 is to be Vol Titrant (mL) domain Experiment 24 or Time-Vol Titrant (sec) domain, Experiment 23. If you are going to use Experiment 24 then prepare the computer for data collection by launching Logger Pro and then in the Logger Pro menu, open the experimental parameters under, Chemistry with Vernier/24a Acid-Base Titration.cmbl.
a. Titrating the Unknown Weak Acid with Vernier’s pH probe, three titrations (Method 1) Using the information, you calculated from pre-lab question #4, weigh out three samples of your unknown acid using
this mass. This mass represents the amount that will require approximately 35-40 mL of your standardized NaOH solution for titration. Record the masses of weighing paper and paper plus acid in your lab notebook. Show this to your instructor before proceeding. Transfer acids into a clean labeled wide-mouth Erlenmeyer flask and then add enough deionized water to dissolve each acid sample. Do not add indicator for this analysis.
Note that the total sample size needed for Method 2 is five times the size (~0.80 - 1.3 g) that was calculated from pre-lab question #4. That is, if the answer to question 4 is 0.200 g, then the mass needed to make the solution for Method 2 should amount to 5 x 0.20 g or 1.00 g total.
Note: Use the techniques used in the Vernier activity lab to set up the Vernier pH probe. Set up the Vernier interface with the pH probe. Calibrate the meter using pH 4.0 and pH 10 buffers and test with buffer 7.0. Rinse the electrode with deionized water after each trial. Immerse the electrode in one of your unknown acid solutions.
Figure 3
Note: Ask your instructor which method in Vernier you will be using. Experiment 24a is pH vs Volume Titrant while Experiment 23 is pH vs. Time. Your laboratory instructor may have you stir your titration mixture with a magnetic stirrer and stir bar. If so, be certain to position the electrode so that the spinning stir bar will not bump the fragile glass membrane. See Figure 3.
If you are using Experiment 23, use a magnetic stirrer and titrate the unknown acid with your standardized NaOH solution, continuously letting the computer record the pH value. Record the initial level of NaOH in the buret, then add the titrant such that the flow is continuous, about 3 – 4 drops per second. Continue the titration until the pH of the solution does not change significantly after the addition of titrant. This usually occurs when the solution gives a pH reading of 12 or after 5-8 mL have been added past the equivalence point. Record the final level of NaOH in the buret. Using the initial and final levels, calculate the average rate of NaOH addition by dividing the total volume titrated by the total time of the titration. You can then use the equation: Vol @ eq.pt = (rate * time to reach eq. pt.) to find the equivalence point volume. As an additional check, use the tangent function on Logger Pro to find the point along the curve with the steepest slope. This point corresponds to the equivalence point.
If you are using experiment 24a, Vol base vs. pH, be sure to record your data in your lab notebook even though the data is stored in the computer. Write detailed observations during the experiment. Save your file immediately in the computer and then transfer the data on to an Excel spreadsheet before continuing. Refill the buret with NaOH and then titrate the second and third samples of your unknown acid, following the same procedure as before. After each titration, be sure to save your data and transfer it to an Excel spreadsheet before continuing.
When you have completed this portion of the experiment, pour the titration mixtures into the waste container under the hood.
b. Fourth, fifth and sixth titration of unknown weak acid to the equivalence point, two titrations. (Method 2) 1) For the remaining unknown acid, weigh about five times the mass used in method 1 (~0.80 – 1.3 g). Place the acid in a 250 mL volumetric flask and then add sufficient deionized water to dissolve the solid. Remember to use a volumetric flask for this procedure to ensure the precision of the concentration. Shake and make sure all the solute dissolves and then fill to the mark with water. The solution prepared will be for trials 4, 5 and 6. Do not discard this stock solution until the entire experiment is complete! Ask your instructor if you are unsure.
2) Pipet 25.00 mL of the solution into a 125 mL Erlenmeyer flask (or beaker). Add 2-3 drops of phenolphthalein indicator (recall from earlier work that phenolphthalein is a colorless in acidic and neutral solutions and pink in basic solution: the color change for the titration will be colorless to pink. Note that you do not need to continuously monitor the pH with the pH probe! Titrate the solution to the first permanent appearance of the pink color with your standardized 0.1 M NaOH(aq). Record both the initial and final buret volumes to the nearest 0.01 mL. It is important that you stop at the equivalence point. Do not add anymore titrant. Record the pH of this solution.
3) Pipet an additional 25.00 mL of the acidic solution from the 250 mL stock solution (made in the volumetric flask) into the Erlenmeyer flask or beaker containing the fourth titration. Next, use the pH meter to determine the pH of the combined solution. Recall that the pH reading for this solution satisfies the condition in equation 4 above. Record this pH value in your lab notebook.
4) Repeat this procedure for the fifth and sixth trials using the same steps (2 through 3) above.
c. Clean up: Clean the pH probe and magnetic bar and return to the original location. Turn off the computer, place all Vernier equipment back in the box, and place back to shelves. Take remaining unused NaOH solution and empty in waste bin labeled "Discarded NaOH Solution" beaker. Rinse your buret twice with tap water, once with deionized water and Drain the buret. With the stopcock open, clamp your buret to the support stand in an inverted position, so it can drain. Rinse the electrode with deionized water. Rinse your glassware once with tap water and once with deionized water. Caution: Wash your hands thoroughly with soap or detergent before leaving the laboratory.
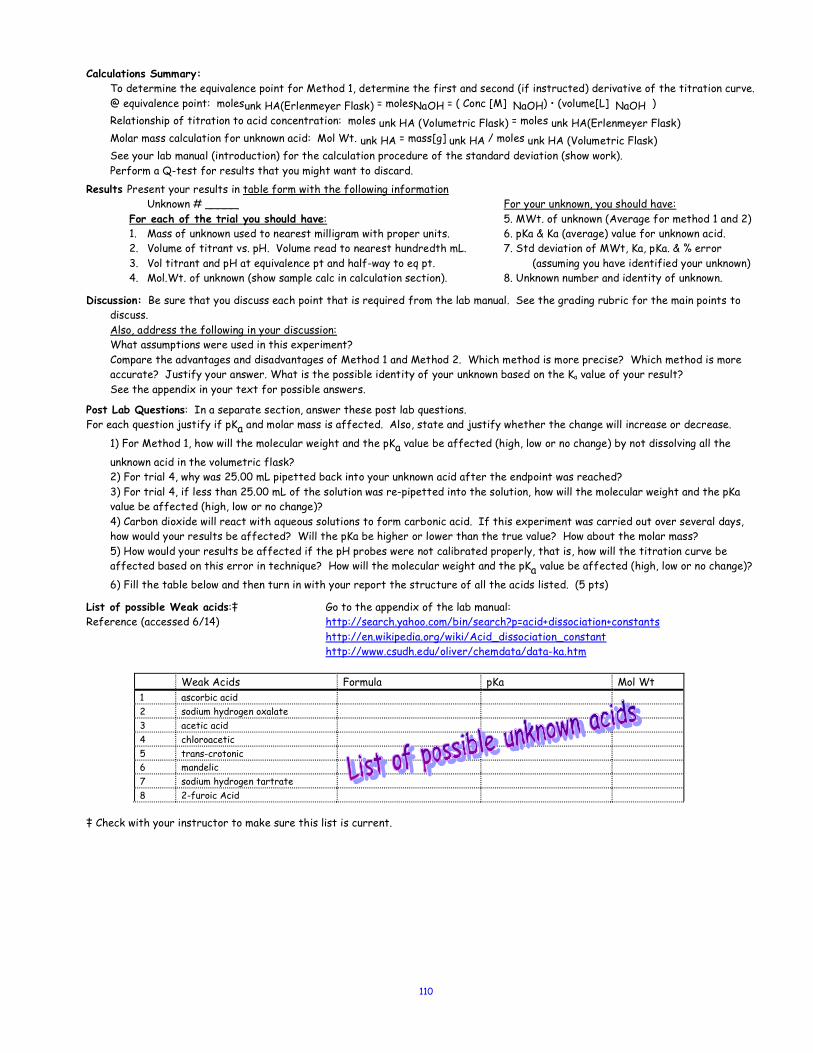
110
Calculations Summary:
To determine the equivalence point for Method 1, determine the first and second (if instructed) derivative of the titration curve. @ equivalence point: molesunk HA(Erlenmeyer Flask) = molesNaOH = ( Conc [M] NaOH) • (volume[L] NaOH ) Relationship of titration to acid concentration: moles unk HA (Volumetric Flask) = moles unk HA(Erlenmeyer Flask) Molar mass calculation for unknown acid: Mol Wt. unk HA = mass[g] unk HA / moles unk HA (Volumetric Flask) See your lab manual (introduction) for the calculation procedure of the standard deviation (show work). Perform a Q-test for results that you might want to discard.
Results Present your results in table form with the following information Unknown # _____ For each of the trial you should have: 1. Mass of unknown used to nearest milligram with proper units. 2. Volume of titrant vs. pH. Volume read to nearest hundredth mL. 3. Vol titrant and pH at equivalence pt and half-way to eq pt. 4. Mol.Wt. of unknown (show sample calc in calculation section).
For your unknown, you should have: 5. MWt. of unknown (Average for method 1 and 2) 6. pKa & Ka (average) value for unknown acid. 7. Std deviation of MWt, Ka, pKa. & % error (assuming you have identified your unknown) 8. Unknown number and identity of unknown.
Discussion: Be sure that you discuss each point that is required from the lab manual. See the grading rubric for the main points to discuss. Also, address the following in your discussion: What assumptions were used in this experiment? Compare the advantages and disadvantages of Method 1 and Method 2. Which method is more precise? Which method is more accurate? Justify your answer. What is the possible identity of your unknown based on the Ka value of your result? See the appendix in your text for possible answers.
Post Lab Questions: In a separate section, answer these post lab questions. For each question justify if pKa and molar mass is affected. Also, state and justify whether the change will increase or decrease.
1) For Method 1, how will the molecular weight and the pKa value be affected (high, low or no change) by not dissolving all the
unknown acid in the volumetric flask? 2) For trial 4, why was 25.00 mL pipetted back into your unknown acid after the endpoint was reached? 3) For trial 4, if less than 25.00 mL of the solution was re-pipetted into the solution, how will the molecular weight and the pKa value be affected (high, low or no change)? 4) Carbon dioxide will react with aqueous solutions to form carbonic acid. If this experiment was carried out over several days, how would your results be affected? Will the pKa be higher or lower than the true value? How about the molar mass? 5) How would your results be affected if the pH probes were not calibrated properly, that is, how will the titration curve be affected based on this error in technique? How will the molecular weight and the pKa value be affected (high, low or no change)?
6) Fill the table below and then turn in with your report the structure of all the acids listed. (5 pts)
List of possible Weak acids:‡ Go to the appendix of the lab manual: Reference (accessed 6/14) http://search.yahoo.com/bin/search?p=acid+dissociation+constants http://en.wikipedia.org/wiki/Acid_dissociation_constant http://www.csudh.edu/oliver/chemdata/data-ka.htm
Weak Acids Formula pKa Mol Wt 1 ascorbic acid 2 sodium hydrogen oxalate 3 acetic acid 4 chloroacetic 5 trans-crotonic 6 mandelic 7 sodium hydrogen tartrate 8 2-furoic Acid
‡ Check with your instructor to make sure this list is current.
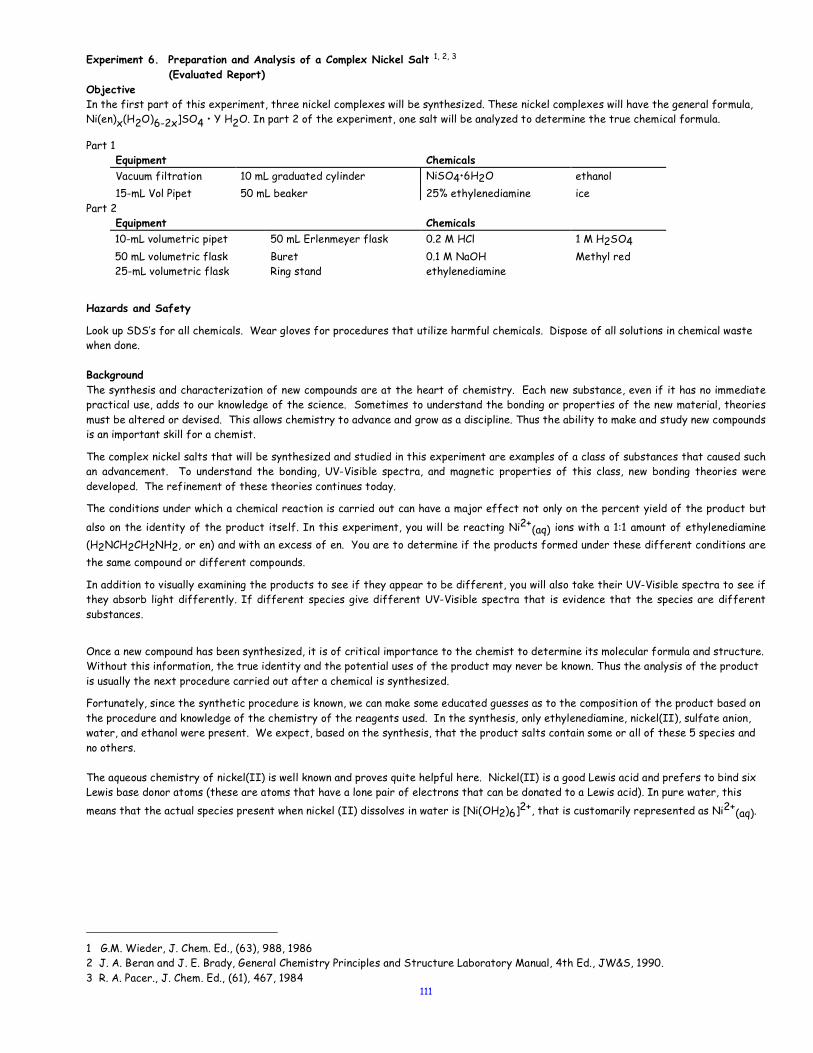
111
Experiment 6. Preparation and Analysis of a Complex Nickel Salt 1, 2, 3 (Evaluated Report) Objective In the first part of this experiment, three nickel complexes will be synthesized. These nickel complexes will have the general formula, Ni(en)x(H2O)6-2x]SO4 • Y H2O. In part 2 of the experiment, one salt will be analyzed to determine the true chemical formula.
Part 1 Equipment Chemicals Vacuum filtration 10 mL graduated cylinder NiSO4•6H2O ethanol 15-mL Vol Pipet 50 mL beaker 25% ethylenediamine ice
Part 2 Equipment Chemicals 10-mL volumetric pipet 50 mL Erlenmeyer flask 0.2 M HCl 1 M H2SO4 50 mL volumetric flask Buret 0.1 M NaOH Methyl red 25-mL volumetric flask Ring stand ethylenediamine
Hazards and Safety
Look up SDS’s for all chemicals. Wear gloves for procedures that utilize harmful chemicals. Dispose of all solutions in chemical waste when done.
Background The synthesis and characterization of new compounds are at the heart of chemistry. Each new substance, even if it has no immediate practical use, adds to our knowledge of the science. Sometimes to understand the bonding or properties of the new material, theories must be altered or devised. This allows chemistry to advance and grow as a discipline. Thus the ability to make and study new compounds is an important skill for a chemist.
The complex nickel salts that will be synthesized and studied in this experiment are examples of a class of substances that caused such an advancement. To understand the bonding, UV-Visible spectra, and magnetic properties of this class, new bonding theories were developed. The refinement of these theories continues today.
The conditions under which a chemical reaction is carried out can have a major effect not only on the percent yield of the product but
also on the identity of the product itself. In this experiment, you will be reacting Ni2+(aq) ions with a 1:1 amount of ethylenediamine (H2NCH2CH2NH2, or en) and with an excess of en. You are to determine if the products formed under these different conditions are the same compound or different compounds.
In addition to visually examining the products to see if they appear to be different, you will also take their UV-Visible spectra to see if they absorb light differently. If different species give different UV-Visible spectra that is evidence that the species are different substances.
Once a new compound has been synthesized, it is of critical importance to the chemist to determine its molecular formula and structure. Without this information, the true identity and the potential uses of the product may never be known. Thus the analysis of the product is usually the next procedure carried out after a chemical is synthesized.
Fortunately, since the synthetic procedure is known, we can make some educated guesses as to the composition of the product based on the procedure and knowledge of the chemistry of the reagents used. In the synthesis, only ethylenediamine, nickel(II), sulfate anion, water, and ethanol were present. We expect, based on the synthesis, that the product salts contain some or all of these 5 species and no others. The aqueous chemistry of nickel(II) is well known and proves quite helpful here. Nickel(II) is a good Lewis acid and prefers to bind six Lewis base donor atoms (these are atoms that have a lone pair of electrons that can be donated to a Lewis acid). In pure water, this means that the actual species present when nickel (II) dissolves in water is [Ni(OH2)6]2+, that is customarily represented as Ni2+(aq).
1 G.M. Wieder, J. Chem. Ed., (63), 988, 1986 2 J. A. Beran and J. E. Brady, General Chemistry Principles and Structure Laboratory Manual, 4th Ed., JW&S, 1990. 3 R. A. Pacer., J. Chem. Ed., (61), 467, 1984
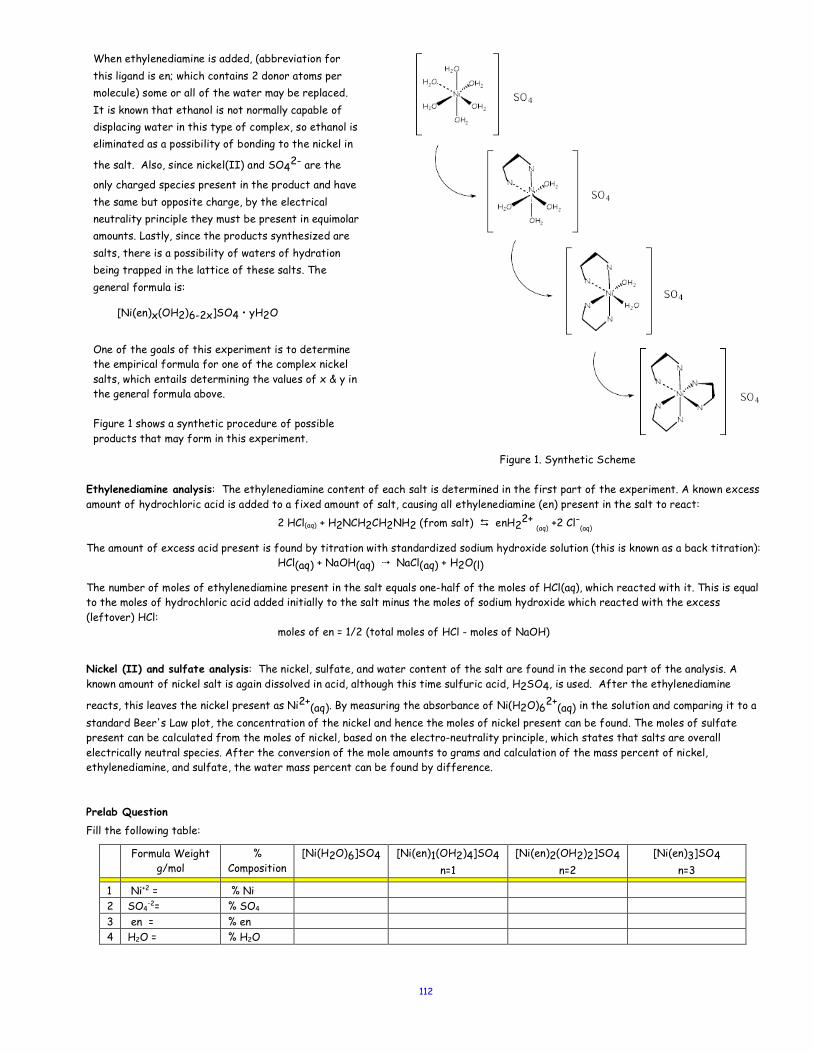
112
When ethylenediamine is added, (abbreviation for this ligand is en; which contains 2 donor atoms per molecule) some or all of the water may be replaced. It is known that ethanol is not normally capable of displacing water in this type of complex, so ethanol is eliminated as a possibility of bonding to the nickel in
the salt. Also, since nickel(II) and SO42- are the
only charged species present in the product and have the same but opposite charge, by the electrical neutrality principle they must be present in equimolar amounts. Lastly, since the products synthesized are salts, there is a possibility of waters of hydration being trapped in the lattice of these salts. The general formula is:
[Ni(en)x(OH2)6-2x]SO4 • yH2O
One of the goals of this experiment is to determine the empirical formula for one of the complex nickel salts, which entails determining the values of x & y in the general formula above. Figure 1 shows a synthetic procedure of possible products that may form in this experiment.
Figure 1. Synthetic Scheme Ethylenediamine analysis: The ethylenediamine content of each salt is determined in the first part of the experiment. A known excess amount of hydrochloric acid is added to a fixed amount of salt, causing all ethylenediamine (en) present in the salt to react: 2 HCl(aq) + H2NCH2CH2NH2 (from salt) D enH22+ (aq) +2 Cl-(aq)
The amount of excess acid present is found by titration with standardized sodium hydroxide solution (this is known as a back titration): HCl(aq) + NaOH(aq) 4 NaCl(aq) + H2O(l)
The number of moles of ethylenediamine present in the salt equals one-half of the moles of HCl(aq), which reacted with it. This is equal to the moles of hydrochloric acid added initially to the salt minus the moles of sodium hydroxide which reacted with the excess (leftover) HCl: moles of en = 1/2 (total moles of HCl - moles of NaOH)
Nickel (II) and sulfate analysis: The nickel, sulfate, and water content of the salt are found in the second part of the analysis. A known amount of nickel salt is again dissolved in acid, although this time sulfuric acid, H2SO4, is used. After the ethylenediamine
reacts, this leaves the nickel present as Ni2+(aq). By measuring the absorbance of Ni(H2O)62+(aq) in the solution and comparing it to a standard Beer's Law plot, the concentration of the nickel and hence the moles of nickel present can be found. The moles of sulfate present can be calculated from the moles of nickel, based on the electro-neutrality principle, which states that salts are overall electrically neutral species. After the conversion of the mole amounts to grams and calculation of the mass percent of nickel, ethylenediamine, and sulfate, the water mass percent can be found by difference. Prelab Question
Fill the following table:
Formula Weight g/mol
% Composition
[Ni(H2O)6]SO4 [Ni(en)1(OH2)4]SO4 n=1
[Ni(en)2(OH2)2]SO4 n=2
[Ni(en)3]SO4 n=3
1 Ni+2 = % Ni 2 SO4
-2= % SO4 3 en = % en 4 H2O = % H2O
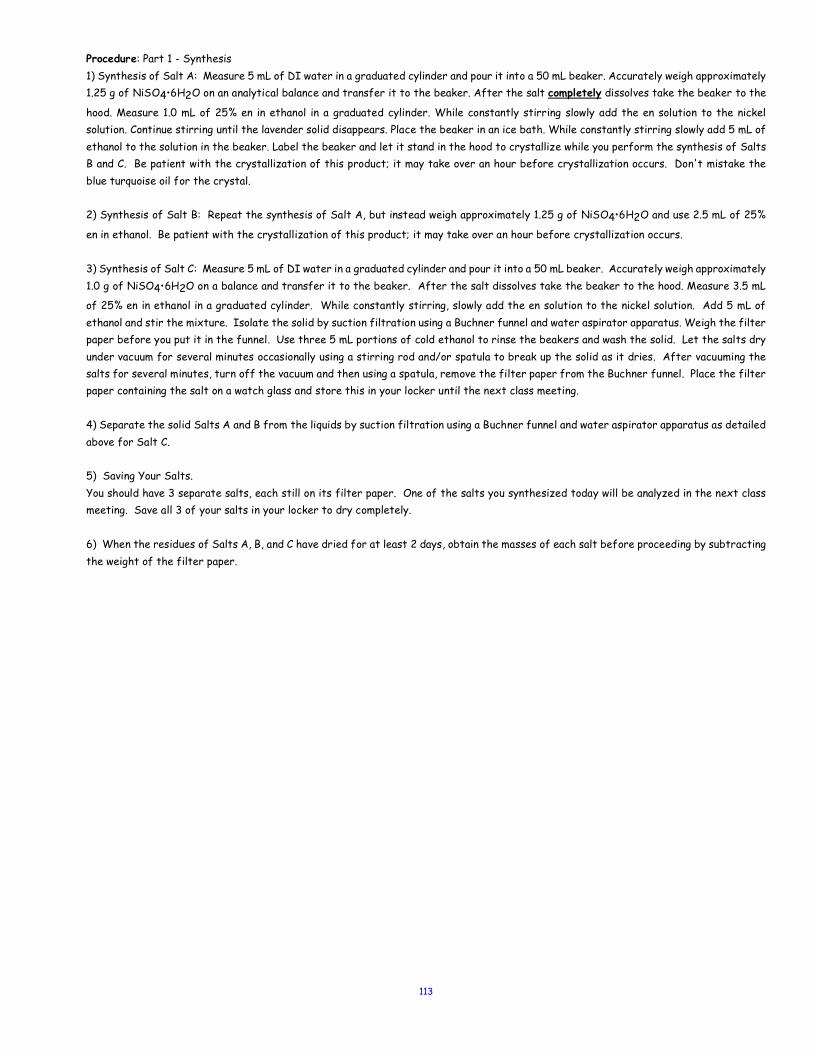
113
Procedure: Part 1 - Synthesis 1) Synthesis of Salt A: Measure 5 mL of DI water in a graduated cylinder and pour it into a 50 mL beaker. Accurately weigh approximately 1.25 g of NiSO4•6H2O on an analytical balance and transfer it to the beaker. After the salt completely dissolves take the beaker to the
hood. Measure 1.0 mL of 25% en in ethanol in a graduated cylinder. While constantly stirring slowly add the en solution to the nickel solution. Continue stirring until the lavender solid disappears. Place the beaker in an ice bath. While constantly stirring slowly add 5 mL of ethanol to the solution in the beaker. Label the beaker and let it stand in the hood to crystallize while you perform the synthesis of Salts B and C. Be patient with the crystallization of this product; it may take over an hour before crystallization occurs. Don't mistake the blue turquoise oil for the crystal. 2) Synthesis of Salt B: Repeat the synthesis of Salt A, but instead weigh approximately 1.25 g of NiSO4•6H2O and use 2.5 mL of 25%
en in ethanol. Be patient with the crystallization of this product; it may take over an hour before crystallization occurs. 3) Synthesis of Salt C: Measure 5 mL of DI water in a graduated cylinder and pour it into a 50 mL beaker. Accurately weigh approximately 1.0 g of NiSO4•6H2O on a balance and transfer it to the beaker. After the salt dissolves take the beaker to the hood. Measure 3.5 mL
of 25% en in ethanol in a graduated cylinder. While constantly stirring, slowly add the en solution to the nickel solution. Add 5 mL of ethanol and stir the mixture. Isolate the solid by suction filtration using a Buchner funnel and water aspirator apparatus. Weigh the filter paper before you put it in the funnel. Use three 5 mL portions of cold ethanol to rinse the beakers and wash the solid. Let the salts dry under vacuum for several minutes occasionally using a stirring rod and/or spatula to break up the solid as it dries. After vacuuming the salts for several minutes, turn off the vacuum and then using a spatula, remove the filter paper from the Buchner funnel. Place the filter paper containing the salt on a watch glass and store this in your locker until the next class meeting. 4) Separate the solid Salts A and B from the liquids by suction filtration using a Buchner funnel and water aspirator apparatus as detailed above for Salt C. 5) Saving Your Salts. You should have 3 separate salts, each still on its filter paper. One of the salts you synthesized today will be analyzed in the next class meeting. Save all 3 of your salts in your locker to dry completely. 6) When the residues of Salts A, B, and C have dried for at least 2 days, obtain the masses of each salt before proceeding by subtracting the weight of the filter paper.
114
Procedure; Part 2 - Analysis You will analyze one salt selected by your instructor. Analysis for Salts A, B, and C i) Ethylenediamine analysis – Ask your instructor which nickel(II) salt you will be analyzing (A, B, or C). Accurately weigh approximately 0.05 g (50 mg) of the sample into a 125 mL Erlenmeyer flask. Add 10.0 mL of standard 0.2 M HCl(aq) to the flask using a volumetric pipet. Add 1 drop of methyl red indicator. The solution should be pink at this point. Titrate the solution with standard 0.1 M NaOH(aq) until the red color fades to a nearly colorless solution (it may appear to be faintly yellow). Be careful not to over-titrate! Repeat the titration as many times as you deem necessary. ii) Nickel analysis - Prepare three standard nickel solutions using the following procedure. Accurately weigh approximately 1.0 g of [Ni(H2O)6]S04 into a 50 mL volumetric flask. Add 10 mL of D.I. water followed by 10 mL of 1 M H2SO4(aq) to dissolve the salt and then dilute to the mark with deionized water. Pipet 10 mL of the solution into one 25 mL volumetric flask and 15 mL into a second 25 mL flask, then dilute both to the mark with deionized water. Accurately weigh approximately 0.25 g of the product, Salt A, B or C (the same one used in Part i above, as assigned by your instructor) into a 25 mL volumetric flask. Add 5 mL 1 M sulfuric acid to dissolve the salt and then dilute to the mark with DI water. Obtain absorption spectra for the four solutions using the SpectroVis Plus Spectrophotometers. Use the “Examine” function to locate the λmax of each spectrum (they all should have the same λmax) and record the absorbance at this wavelength. iii) Visible Spectra Weigh out approximately 0.050 g of each of the salts (salt A, B & C) that you synthesized. Dissolve each salt in 5 mL of water to which 1-2 drops of 25 % en solution have been added. After plugging in the SpectroVis Plus into the computer via the USB cable, open Logger Pro. A blank plot displaying Absorbance vs. Wavelength (nm) should be displayed. If the x-axis reads Time or Concentration instead, click on the “Configure Spectrometer” icon at the top (the one with a rainbow-filled area under a curve) and change the Collection Mode to Absorbance vs. Wavelength. Obtain one cuvette and remember to use only this cuvette for all measurements. Fill it about 2/3 full with deionized water. In Logger Pro, calibrate the spectrometer by selecting “Calibrate” under the “Experiment” drop-down menu. When prompted for a blank cuvette, wipe down the cuvette with a Kim wipe and place it in the chamber with the clear sides facing the triangle and the white light icon. Remember the orientation, as you will need to put the cuvette into the chamber the same way each time. Click on “Finish Calibration.” When calibration is complete, empty the cuvette then rinse it with small portions of you’re salt solution three times then fill it about 2/3 full. Wipe the cuvette and place it in the chamber with the same orientation as before. Click on “Start Collection,” wait about 5 seconds, then click on “Stop Collection.” Add a title to the spectrum and obtain a printout or digital copy (as indicated by your instructor). Result; Part 1- Synthesis Summarize the steps and the data collected in your data table. Results and Calculations; Part 2 - Analysis From the results of ethylenediamine analysis find first the moles of en present in the sample:
Next, convert to grams of en and find the mass percent of en in the salt by
mass percent = grams en/grams sample
Your instructor may ask you to do this by hand in your lab notebook. Construct a Beer's Law plot from the results for the nickel solutions of known concentrations in the Nickel analysis by plotting concentration of Ni(II) (in moles/liter) on the x-axis and absorbance of the solution on the y-axis. Use a graphing program to find the equation of the line. Calculate the concentration of the nickel in the solution prepared from your assigned product by plugging its absorbance in for y in the equation for the line. Next, find the moles and grams of nickel by multiplying the concentration times the volume of the flask and then using the atomic mass of Ni in grams. Lastly, find the mass percent of nickel by dividing the grams of nickel by the grams of sample and multiplying by 100.
From the moles of nickel calculate the moles of sulfate present. Convert to grams of sulfate and calculate the mass percent for sulfate.
Find the mass percent of water as follows: mass percent of water = 100% - (%Ni + %en + %SO4)
Determine the empirical formula of the product (the salt you analyzed). From this find the values of x and y.
Summarize your results in a table of results.
moles en = moles of HCl added −moles of NaOH used in titration2
115
Discussion and Conclusion
Write an appropriate discussion and conclusion for this experiment. Also, discuss the correlation of the colors of the products to their visible spectra and the purpose of adding the additional 5 mL of ethanol in the experiment.
Be sure to answer the following questions in your discussion section:
1) In the analysis of ethylenediamine procedure, how would the mass percent of ethylenediamine in the salt be affected if:
a) The solution was over titrated;
b) More than 10.0 mL of 0.2 M HCl is added to the original solution.
2) In part 2 of the experiment, why is it acceptable to use [Ni(H2O)6]SO4 to establish the calibration curve for the nickel
concentration of your salt?
3) Why would the mass percent of water found experimentally be subject to greater error than the other three mass percentages?

116
117
7. Experiment. The Thermodynamics of Potassium Nitrate Dissolving in Water Objective: The solubility of potassium nitrate in water at several temperatures will provide information leading to the calculation of Ksp, DG, DH, and DS for potassium nitrate dissolving in water.
Equipment and Chemicals Balance 100 mL graduated cylinder Thermometer Potassium nitrate (ACS grade) Weighing paper 2 test tubes, 25 x 200 mm Wire gauze Deionized water 200 mL beaker #5 rubber stopper, 2-hole Utility clamp Hot plate 2 support ring and stand Stirring rod
Hazards and Safety
Look up MSDS’s for all chemicals. Wear gloves for procedures that utilize harmful chemicals. Dispose of all solutions in chemical waste when done. Background: When potassium nitrate (KNO3) dissolves in water, it dissociates into potassium ions (K+) and nitrate ions (NO3-). Once
sufficient quantities of K+ and NO3- are in solution, however, the ions recombine into solid KNO3. Eventually, for every pair of ions that forms, another pair recombines. As a result, the concentrations of the ions remain constant or the system has reached equilibrium. The solubility equilibrium of KNO3 is shown in Equation 1,
KNO3(s) D K+(aq) + NO3-(aq) (Eq. 1 ) We call this system, where undissolved solid is in equilibrium with its dissolved ions, a saturated solution. We can describe the saturated solution with its fixed concentrations of ions with an equilibrium constant expression. Equation 2 defines the equilibrium constant, Ksp, for KNO3 dissolving in water.
Ksp = [K+] [NO3- ] (Eq. 2) The sp stands for solubility product and the square brackets around the ions symbolize molar concentration (M or mol/L). The equation serves as a reminder that the equilibrium constant not only is concerned with solubility, but also is expressed as a product of the ions' molarities. The value for Ksp can be large, greater than 1, for the very soluble KNO3, or small, less than 1 • 10-10, for an insoluble compound such as silver(I) chloride. In addition, because the solubility of a compound changes with the temperature, its Ksp is likewise a function of temperature. We use thermodynamics to understand how and why KNO3 dissolves in water. The enthalpy change DH, for KNO3 dissolving in water provides the difference in energy between solid KNO3 and its dissolved ions. If DH is positive, heat must be added for KNO3 to dissolve. On the other hand, if DH is negative, dissolving KNO3 in water gives off heat. The entropy change DS for KNO3 dissolving in water indicates the relative disorder of the dissolved ions with respect to solid KNO3. We expect DS for solid KNO3 dissolving in water to be positive because the two ions on the product side of Equation 1 possess more disorder than one KNO3 molecule as a reactant. Finally, the free energy change, DG for KNO3 dissolving in water indicates whether this process occurs spontaneously. If DG is negative, solid KNO3 spontaneously dissolves in water. We relate the equilibrium constant to the free energy change by Equation 3, DG = - RT ln(Ksp) (Eq. 3) where R is the constant, 8.314 J/K .mol, T is the temperature in Kelvin, and ln(Ksp) is the natural logarithm of the equilibrium constant. Like Ksp, the free energy change for a reaction also changes with temperature. We also relate the free energy change to enthalpy and entropy changes by the Gibbs-Helmholtz equation, Equation 4 DG = DH – T DS (Eq.4)
Substituting Equation 3 into Equation 4 yields Equation 5. - RT ln(Ksp) = DH – T DS (Eq. 5) Using algebra, we rearrange the equation into the form for a straight line, y = mx + b (Eq. 6)
lnKsp= −
ΔHR
#
$%%
&
'((
1T
#
$%%
&
'((+
ΔSR
118
so that a plot of ln(Ksp) versus 1/T is linear with a slope of -DH / R and a y-intercept of DS/R. One assumption in this derivation is that DH is a constant, independent of temperature. Example 1. When 10.1 g of KNO3 is dissolved in enough water to make 25.0 mL of solution, the result is a saturated solution of KNO3. Determine the Ksp for KNO3. Let us first calculate the number of moles of KNO3 that dissolve,
Equation 1 shows that when 0.100 mol KNO3 dissolves, 0.100 mol K+ and 0.100 mol NO3- form. We then calculate the concentration of each of these ions in the saturated solution,
According to Equation 2,
Example 2. Suppose the equilibrium constant, Ksp, for a compound in water at 25 °C is 2.4. Determine the DG for this process at 25 °C. We apply Equation 3, making sure that the temperature is in the proper units; DG = -(8.314 J/K•mol)(25 + 273 K) • ln (2.4) = -(8.314 J/K•mol)(298 K)(0.88) = -2200 J/mol Because DG is negative, this compound spontaneously dissolves in water at 25 °C. Example 3. Suppose you measure the equilibrium constant, Ksp, for a compound dissolving in water at several temperatures, as shown in the following table:
Temperature (°C) Ksp 25 2.4 35 3.0 45 3.7
Determine DH for this process. In order to use Equation 6 to determine DH, we need to calculate ln(Ksp) and 1/T from the data;
1 / Temperature (K-1) ln Ksp (1 / 25+ 273) = 0.00336 ln 2.4 = 0.88 (1 / 35+ 273) = 0.00325 ln 3.0 = 1.1 (1 / 45+ 273) = 0.00314 ln 3.7 = 1.3
We plot ln(Ksp) as a function of 1/T and draw the best straight line through the three points:
10.1g KNO3=
1mol KNO3
101g KNO3
!
"
##
$
%
&&= 0.100mol KNO
3
[ ] [ ] M 4.001L10
25.0mL mol 0.100NO=K
3
3+ =÷÷
ø
öççè
æ÷øö
çèæ=-
ksp= [K+] ⋅ [NO
3−] = [4.00] ⋅ [4.00] = 16.0
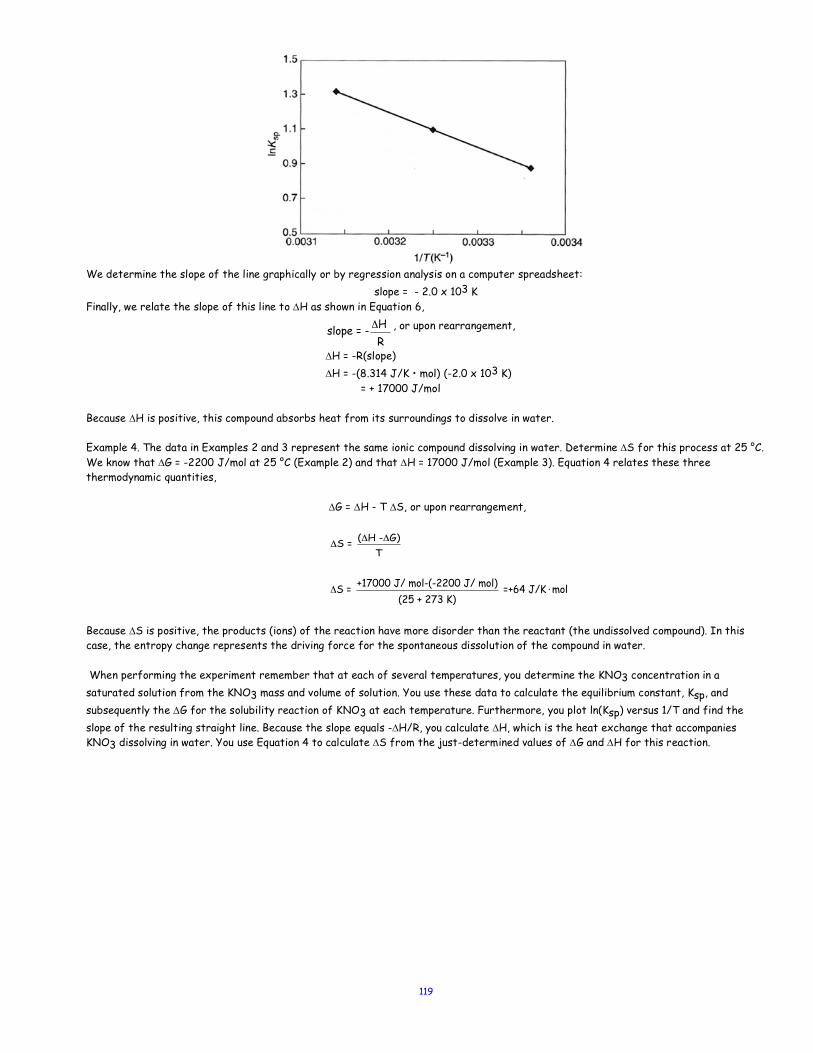
119
We determine the slope of the line graphically or by regression analysis on a computer spreadsheet:
slope = - 2.0 x 10³ K Finally, we relate the slope of this line to DH as shown in Equation 6,
, or upon rearrangement,
DH = -R(slope) DH = -(8.314 J/K • mol) (-2.0 x 10³ K) = + 17000 J/mol Because DH is positive, this compound absorbs heat from its surroundings to dissolve in water. Example 4. The data in Examples 2 and 3 represent the same ionic compound dissolving in water. Determine DS for this process at 25 °C. We know that DG = -2200 J/mol at 25 °C (Example 2) and that DH = 17000 J/mol (Example 3). Equation 4 relates these three thermodynamic quantities, DG = DH - T DS, or upon rearrangement,
Because DS is positive, the products (ions) of the reaction have more disorder than the reactant (the undissolved compound). In this case, the entropy change represents the driving force for the spontaneous dissolution of the compound in water. When performing the experiment remember that at each of several temperatures, you determine the KNO3 concentration in a saturated solution from the KNO3 mass and volume of solution. You use these data to calculate the equilibrium constant, Ksp, and subsequently the DG for the solubility reaction of KNO3 at each temperature. Furthermore, you plot ln(Ksp) versus 1/T and find the slope of the resulting straight line. Because the slope equals -DH/R, you calculate DH, which is the heat exchange that accompanies KNO3 dissolving in water. You use Equation 4 to calculate DS from the just-determined values of DG and DH for this reaction.
slope = - ΔH R
ΔS = (ΔH -ΔG)T
ΔS = +17000 J/ mol-(-2200 J/ mol)(25 + 273 K)
=+64 J/K ⋅mol
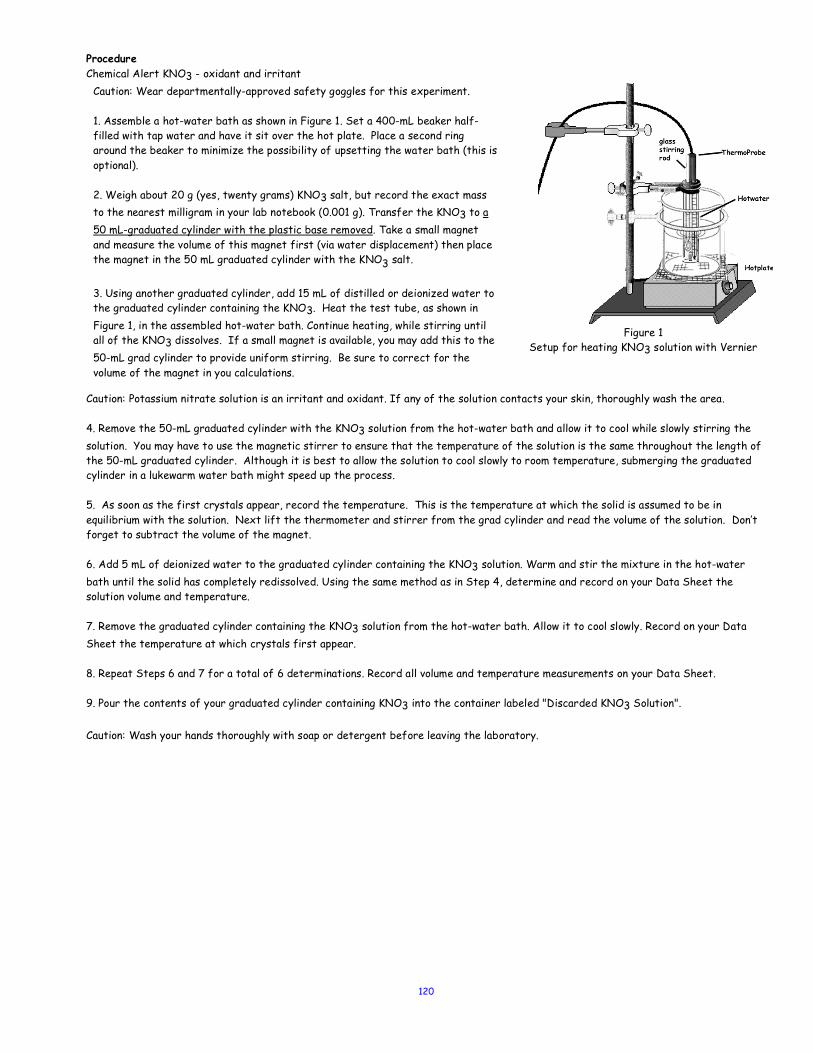
120
Procedure Chemical Alert KNO3 - oxidant and irritant
Caution: Wear departmentally-approved safety goggles for this experiment. 1. Assemble a hot-water bath as shown in Figure 1. Set a 400-mL beaker half-filled with tap water and have it sit over the hot plate. Place a second ring around the beaker to minimize the possibility of upsetting the water bath (this is optional). 2. Weigh about 20 g (yes, twenty grams) KNO3 salt, but record the exact mass to the nearest milligram in your lab notebook (0.001 g). Transfer the KNO3 to a 50 mL-graduated cylinder with the plastic base removed. Take a small magnet and measure the volume of this magnet first (via water displacement) then place the magnet in the 50 mL graduated cylinder with the KNO3 salt.
3. Using another graduated cylinder, add 15 mL of distilled or deionized water to the graduated cylinder containing the KNO3. Heat the test tube, as shown in Figure 1, in the assembled hot-water bath. Continue heating, while stirring until all of the KNO3 dissolves. If a small magnet is available, you may add this to the 50-mL grad cylinder to provide uniform stirring. Be sure to correct for the volume of the magnet in you calculations.
Figure 1
Setup for heating KNO3 solution with Vernier
Caution: Potassium nitrate solution is an irritant and oxidant. If any of the solution contacts your skin, thoroughly wash the area. 4. Remove the 50-mL graduated cylinder with the KNO3 solution from the hot-water bath and allow it to cool while slowly stirring the solution. You may have to use the magnetic stirrer to ensure that the temperature of the solution is the same throughout the length of the 50-mL graduated cylinder. Although it is best to allow the solution to cool slowly to room temperature, submerging the graduated cylinder in a lukewarm water bath might speed up the process. 5. As soon as the first crystals appear, record the temperature. This is the temperature at which the solid is assumed to be in equilibrium with the solution. Next lift the thermometer and stirrer from the grad cylinder and read the volume of the solution. Don’t forget to subtract the volume of the magnet. 6. Add 5 mL of deionized water to the graduated cylinder containing the KNO3 solution. Warm and stir the mixture in the hot-water bath until the solid has completely redissolved. Using the same method as in Step 4, determine and record on your Data Sheet the solution volume and temperature. 7. Remove the graduated cylinder containing the KNO3 solution from the hot-water bath. Allow it to cool slowly. Record on your Data Sheet the temperature at which crystals first appear. 8. Repeat Steps 6 and 7 for a total of 6 determinations. Record all volume and temperature measurements on your Data Sheet. 9. Pour the contents of your graduated cylinder containing KNO3 into the container labeled "Discarded KNO3 Solution". Caution: Wash your hands thoroughly with soap or detergent before leaving the laboratory.
121
Calculations Do the following calculations for each determination and record the results in your notebook using the datasheet as a guide. 1. Use the mass of the KNO3 to calculate the number of moles of KNO3 present. 2. Use the number of moles of KNO3 and the volumes you determined at each temperature to calculate the molar concentration of KNO3 in the solution at each temperature. Because nearly all the KNO3 is still in solution, its molar concentration equals the molar
concentrations of K+ and of NO3- in the saturated solution. 3. Use Equation 2 to calculate the equilibrium constant, Ksp, for dissolving KNO3 in water at each temperature. 4. Convert the temperatures in degrees Celsius (°C) to Kelvin (K). 5. Determine the natural logarithm of Ksp (ln(Ksp) ) at each temperature. 6. Use Equation 3 to calculate D.G at each temperature. 7. Calculate the reciprocal of each Kelvin temperature, 1 / T (K-1). 8. Using graph paper or an Excel spreadsheet program, construct a graph with the y-axis as ln(Ksp) and the x-axis as 1/T. 9. Determine the slope of the resulting straight line on this graph by choosing two widely separated points on the line that are not data points and dividing the difference in their y-values by the difference in their x-values. Alternatively, your laboratory instructor may ask you to use a computer spreadsheet program to perform regression analysis on your experimental data, to plot the data, and to calculate the slope of the best straight line. 10. Calculate: DH for the reaction. Remember that the slope of the straight line in the ln(Ksp) versus 1/T plot equals -DH/R, according to Equation 6. 11. Calculate DS at each temperature using Equation 4. Determine the average DS. Alternatively, if regression analysis is used, obtain the average DS from the y-intercept of the straight line. Discussion: Be sure that you discuss each point that is required from the lab manual. Discuss how solubility is determined for each trial and how this information provides thermodynamic data. To what chemical event do DH, DS and DG refer? In addition, answer the following: What assumptions were used in this experiment? Why must the volume of the solution be measured when the KNO3 precipitates out of solution?
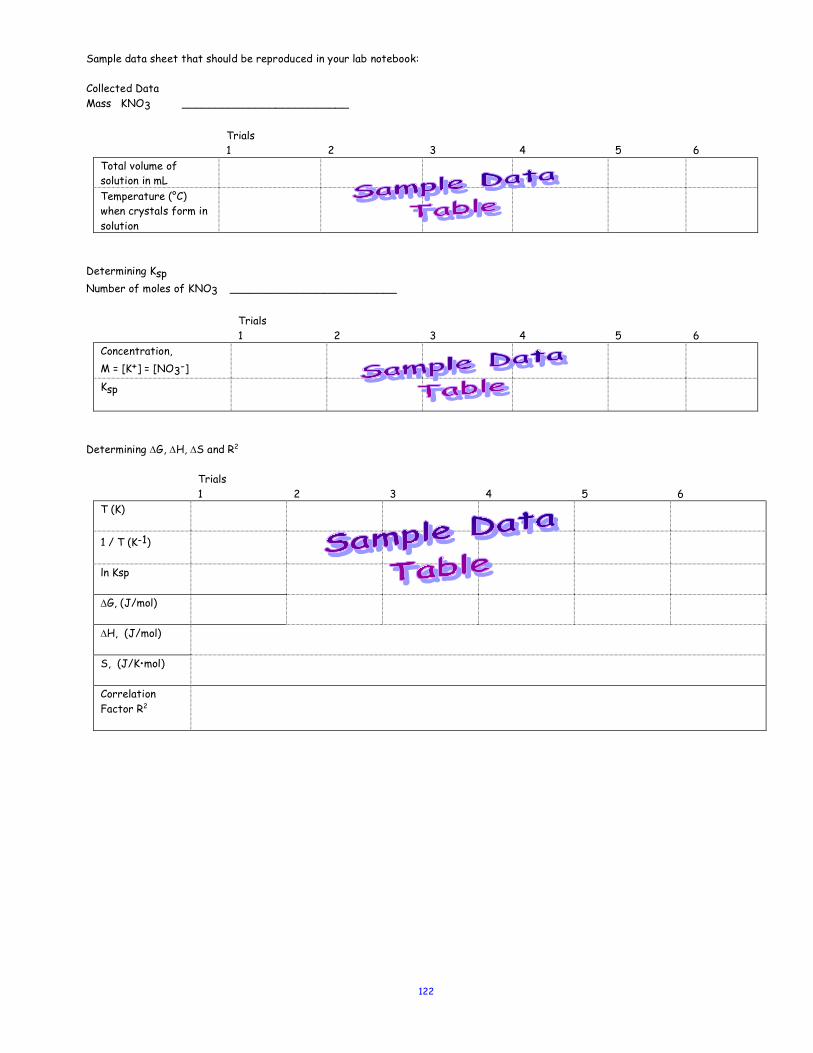
122
Sample data sheet that should be reproduced in your lab notebook: Collected Data Mass KNO3 _________________________
Trials 1 2 3 4 5 6 Total volume of solution in mL
Temperature (°C) when crystals form in solution
Determining Ksp Number of moles of KNO3 _________________________
Trials 1 2 3 4 5 6 Concentration, M = [K+] = [NO3-]
Ksp
Determining DG, DH, DS and R2
Trials 1 2 3 4 5 6 T (K)
1 / T (K-1)
ln Ksp
DG, (J/mol)
DH, (J/mol)
S, (J/K•mol)
Correlation Factor R2
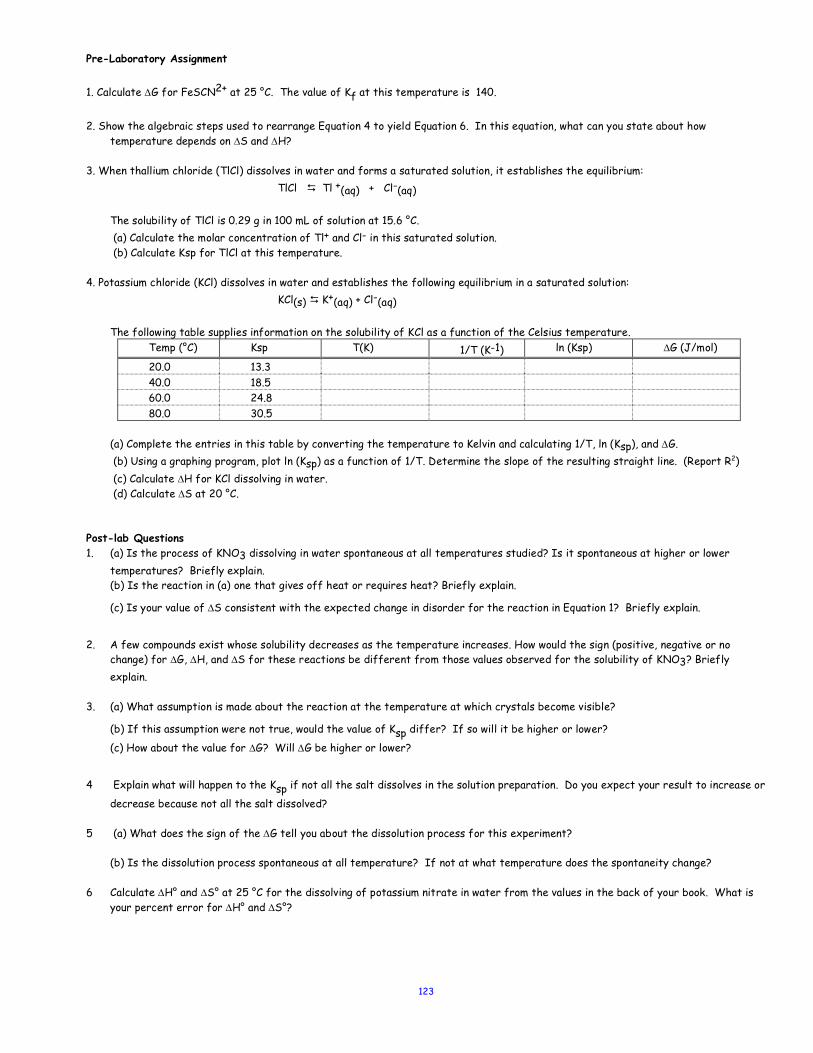
123
Pre-Laboratory Assignment
1. Calculate DG for FeSCN2+ at 25 °C. The value of Kf at this temperature is 140.
2. Show the algebraic steps used to rearrange Equation 4 to yield Equation 6. In this equation, what can you state about how
temperature depends on DS and DH? 3. When thallium chloride (TlCl) dissolves in water and forms a saturated solution, it establishes the equilibrium:
TlCl D Tl +(aq) + Cl-(aq) The solubility of TlCl is 0.29 g in 100 mL of solution at 15.6 °C. (a) Calculate the molar concentration of Tl+ and Cl- in this saturated solution. (b) Calculate Ksp for TlCl at this temperature.
4. Potassium chloride (KCl) dissolves in water and establishes the following equilibrium in a saturated solution: KCl(s) D K+(aq) + Cl-(aq)
The following table supplies information on the solubility of KCl as a function of the Celsius temperature. Temp (°C) Ksp T(K) 1/T (K-1) ln (Ksp) DG (J/mol)
20.0 13.3 40.0 18.5 60.0 24.8 80.0 30.5
(a) Complete the entries in this table by converting the temperature to Kelvin and calculating 1/T, ln (Ksp), and DG. (b) Using a graphing program, plot ln (Ksp) as a function of 1/T. Determine the slope of the resulting straight line. (Report R2) (c) Calculate DH for KCl dissolving in water. (d) Calculate DS at 20 °C.
Post-lab Questions 1. (a) Is the process of KNO3 dissolving in water spontaneous at all temperatures studied? Is it spontaneous at higher or lower
temperatures? Briefly explain. (b) Is the reaction in (a) one that gives off heat or requires heat? Briefly explain.
(c) Is your value of DS consistent with the expected change in disorder for the reaction in Equation 1? Briefly explain.
2. A few compounds exist whose solubility decreases as the temperature increases. How would the sign (positive, negative or no
change) for DG, DH, and DS for these reactions be different from those values observed for the solubility of KNO3? Briefly explain.
3. (a) What assumption is made about the reaction at the temperature at which crystals become visible?
(b) If this assumption were not true, would the value of Ksp differ? If so will it be higher or lower?
(c) How about the value for DG? Will DG be higher or lower?
4 Explain what will happen to the Ksp if not all the salt dissolves in the solution preparation. Do you expect your result to increase or
decrease because not all the salt dissolved? 5 (a) What does the sign of the DG tell you about the dissolution process for this experiment?
(b) Is the dissolution process spontaneous at all temperature? If not at what temperature does the spontaneity change?
6 Calculate DH° and DS° at 25 °C for the dissolving of potassium nitrate in water from the values in the back of your book. What is your percent error for DH° and DS°?
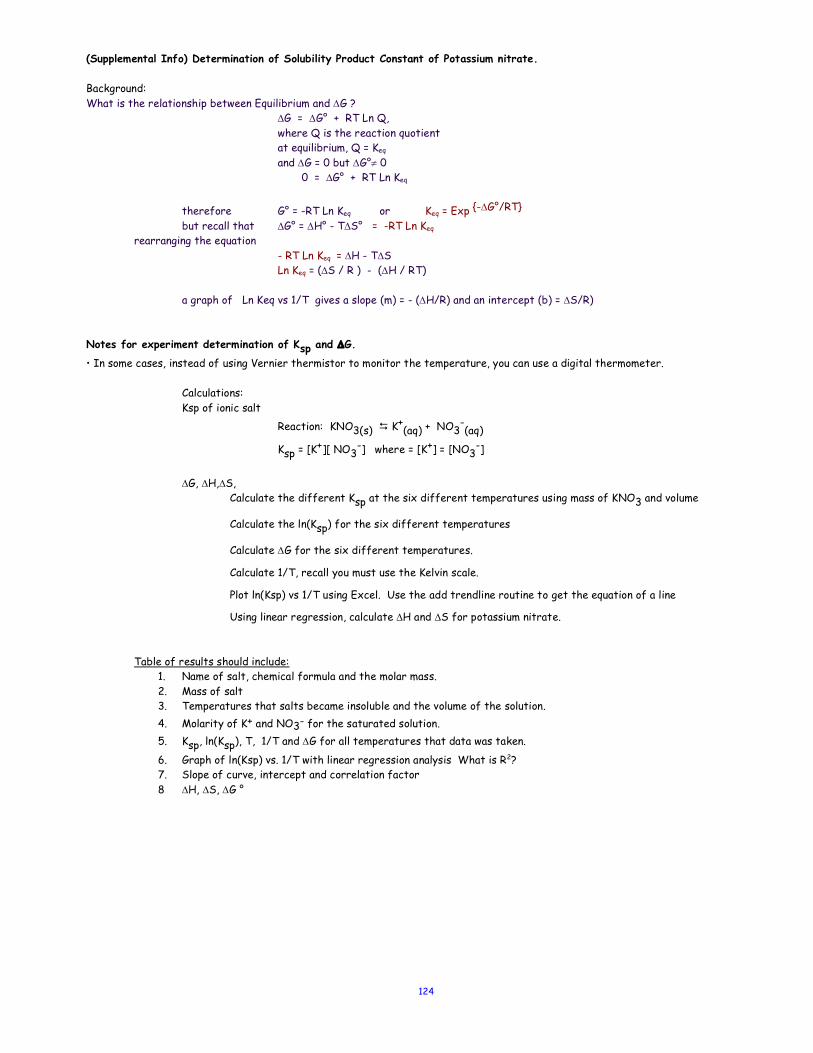
124
(Supplemental Info) Determination of Solubility Product Constant of Potassium nitrate. Background: What is the relationship between Equilibrium and DG ? DG = DG° + RT Ln Q, where Q is the reaction quotient at equilibrium, Q = Keq and DG = 0 but DG°¹ 0 0 = DG° + RT Ln Keq
therefore G° = -RT Ln Keq or Keq = Exp {-DG°/RT}
but recall that DG° = DH° - TDS° = -RT Ln Keq
rearranging the equation - RT Ln Keq = DH - TDS
Ln Keq = (DS / R ) - (DH / RT) a graph of Ln Keq vs 1/T gives a slope (m) = - (DH/R) and an intercept (b) = DS/R) Notes for experiment determination of Ksp and DG.
• In some cases, instead of using Vernier thermistor to monitor the temperature, you can use a digital thermometer. Calculations: Ksp of ionic salt Reaction: KNO3(s) D K+
(aq) + NO3-(aq)
Ksp = [K+][ NO3-] where = [K+] = [NO3
-]
DG, DH,DS, Calculate the different Ksp at the six different temperatures using mass of KNO3 and volume
Calculate the ln(Ksp) for the six different temperatures
Calculate DG for the six different temperatures.
Calculate 1/T, recall you must use the Kelvin scale.
Plot ln(Ksp) vs 1/T using Excel. Use the add trendline routine to get the equation of a line
Using linear regression, calculate DH and DS for potassium nitrate.
Table of results should include:
1. Name of salt, chemical formula and the molar mass. 2. Mass of salt 3. Temperatures that salts became insoluble and the volume of the solution. 4. Molarity of K+ and NO3- for the saturated solution. 5. Ksp, ln(Ksp), T, 1/T and DG for all temperatures that data was taken.
6. Graph of ln(Ksp) vs. 1/T with linear regression analysis What is R2? 7. Slope of curve, intercept and correlation factor
8 DH, DS, DG °
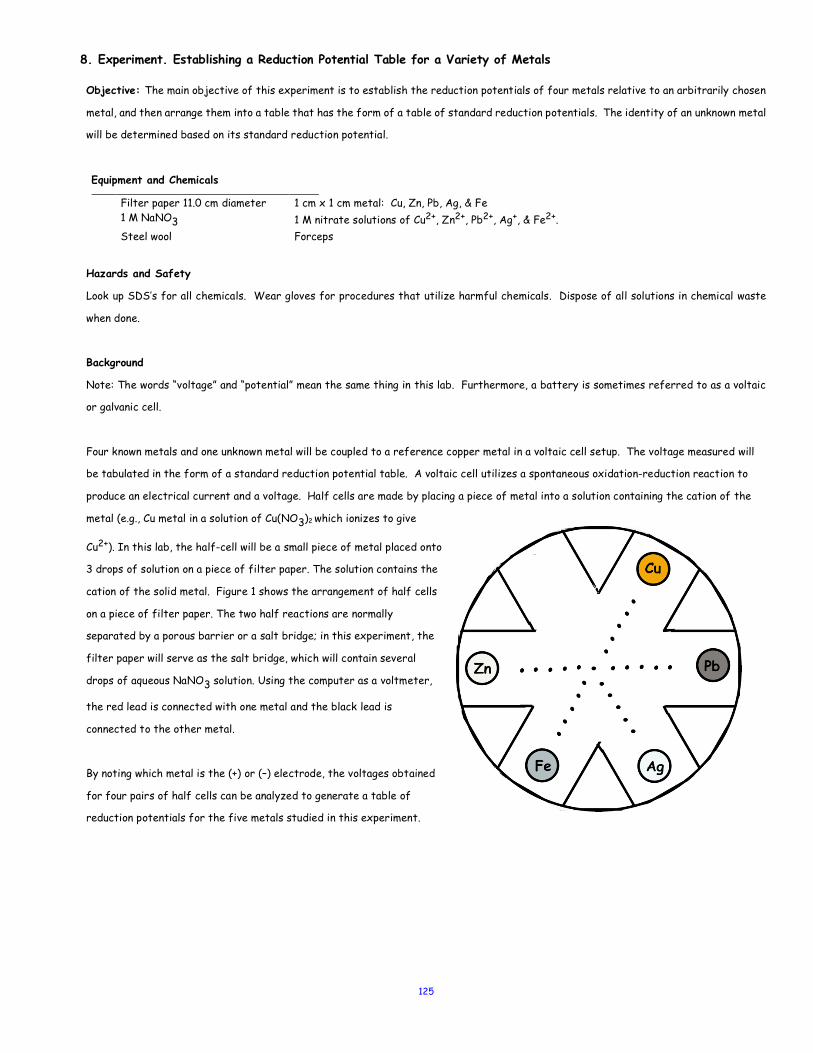
125
8. Experiment. Establishing a Reduction Potential Table for a Variety of Metals Objective: The main objective of this experiment is to establish the reduction potentials of four metals relative to an arbitrarily chosen
metal, and then arrange them into a table that has the form of a table of standard reduction potentials. The identity of an unknown metal
will be determined based on its standard reduction potential.
Equipment and Chemicals
Filter paper 11.0 cm diameter 1 cm x 1 cm metal: Cu, Zn, Pb, Ag, & Fe 1 M NaNO3 1 M nitrate solutions of Cu2+, Zn2+, Pb2+, Ag+, & Fe2+.
Steel wool Forceps
Hazards and Safety
Look up SDS’s for all chemicals. Wear gloves for procedures that utilize harmful chemicals. Dispose of all solutions in chemical waste
when done.
Background
Note: The words “voltage” and “potential” mean the same thing in this lab. Furthermore, a battery is sometimes referred to as a voltaic
or galvanic cell.
Four known metals and one unknown metal will be coupled to a reference copper metal in a voltaic cell setup. The voltage measured will
be tabulated in the form of a standard reduction potential table. A voltaic cell utilizes a spontaneous oxidation-reduction reaction to
produce an electrical current and a voltage. Half cells are made by placing a piece of metal into a solution containing the cation of the
metal (e.g., Cu metal in a solution of Cu(NO3)2 which ionizes to give
Cu2+). In this lab, the half-cell will be a small piece of metal placed onto
3 drops of solution on a piece of filter paper. The solution contains the
cation of the solid metal. Figure 1 shows the arrangement of half cells
on a piece of filter paper. The two half reactions are normally
separated by a porous barrier or a salt bridge; in this experiment, the
filter paper will serve as the salt bridge, which will contain several
drops of aqueous NaNO3 solution. Using the computer as a voltmeter,
the red lead is connected with one metal and the black lead is
connected to the other metal.
By noting which metal is the (+) or (–) electrode, the voltages obtained
for four pairs of half cells can be analyzed to generate a table of
reduction potentials for the five metals studied in this experiment.
126
Procedure
1. Prepare the computer for data collection by launching Logger Pro and then in the Logger Pro menu, open the experimental parameters
under, Chemistry with Vernier/28 Micro-Voltaic Cells.cmbl. The sensor that will be automatically set is called “Voltage (–10 to +10).”
The computer is now set to monitor potential, in volts. You can read the voltage in the meter window when the voltage probe leads are
connected to a cell. When the leads are not in contact with a cell (or each other), a meaningless default voltage may be displayed. If you
touch the two leads together, the voltage will drop to 0.00 V.
2. Obtain a piece of filter paper and draw five small circles in pencil and connect them with dots, as shown in Figure 1. It’s easiest to
place the filter paper over Figure 1 and trace the pattern with your pencil. Be sure the dots are not touching. If a solid pencil line
connects two metal pieces, it will short out the circuit and no voltage reading will be obtained. Label the circles Cu, Zn, Pb, Ag, Fe, Unk.
Place the filter paper in the Petri dish (either the bottom part or the cover, in whichever fits).
3. Wash your hands with soap and water to remove excess grease, which can contaminate the metal pieces. Wipe your hands with paper
towels, not Kim Wipes. Obtain 5 pieces of metal: Cu, Zn, Pb, Ag, and Fe then use steel wool to clean both surfaces of each piece of
metal and the metal contacts of the red and black leads. Wipe off each metal and the leads with a Kim Wipe and from now on, only hold
it with clean forceps. The object is to not get grease or dirt from your fingers on the metal. Place each metal on a clean paper towel,
which is labeled with the names of the metals. It is very important that you don’t mix the metals.
4. Perform measurements of one metal at a time. Place 3 drops of the solution containing the cation of the metal on its circle (Cu2+ on
Cu, etc.). Then place the piece of metal on the wet spot of its respective cation. The top side of the metal should be kept dry. Then add
several drops of 1 M NaNO3 to the line drawn between the circle and the center of the filter paper. Be sure there is a continuous trail
of NaNO3 between the circle and the center. You may have to periodically dampen the filter paper with NaNO3 during the experiment.
Make three measurements for each metal.
5. Use the metal that is obviously copper as the reference metal. Copper is chosen as the reference metal simply because it is so easy to
identify. Determine the voltages of the four cells by connecting Cu to Zn, Cu to Pb, Cu to Ag, Cu to Fe and Cu to the unknown metal one
at a time. Remember to use drops of the 1 M NaNO3 solution to connect each pair that you are measuring. The procedure is done by
taking the red lead of one metal and then connecting it to the black lead with the other metal. The metal contacts must be exposed on
the probes and in contact with the metal squares so that a voltage reading is registered. Start by placing the red lead on the Cu and the
black lead on the zinc. The voltage should be positive. Here is the way the system is designed: If the red lead is connected to the (+)
terminal and the black lead is connected to the (–) terminal, the voltage reading will be positive. Just to see what will happen, reverse
the leads. Notice that the voltage is now negative.
6. With the positive voltage between copper and zinc displayed, wait at least 5 seconds to take a voltage reading, and record the value in
the Data Table in the column Measured Voltage #1. Be sure to wait until the voltage reading has stabilized. Also record which metal is
the (+) terminal and which is the (–) terminal.
7. If the voltage reading is positive, the metal that is connected to the red lead is considered the (+) terminal. The other metal is
considered the (–) terminal. If the voltage reading is negative, the metal connected to the red lead is considered the (–) terminal and
the other metal is considered the (+) terminal. By convention, the red lead is the one that determines the sign of the voltage.
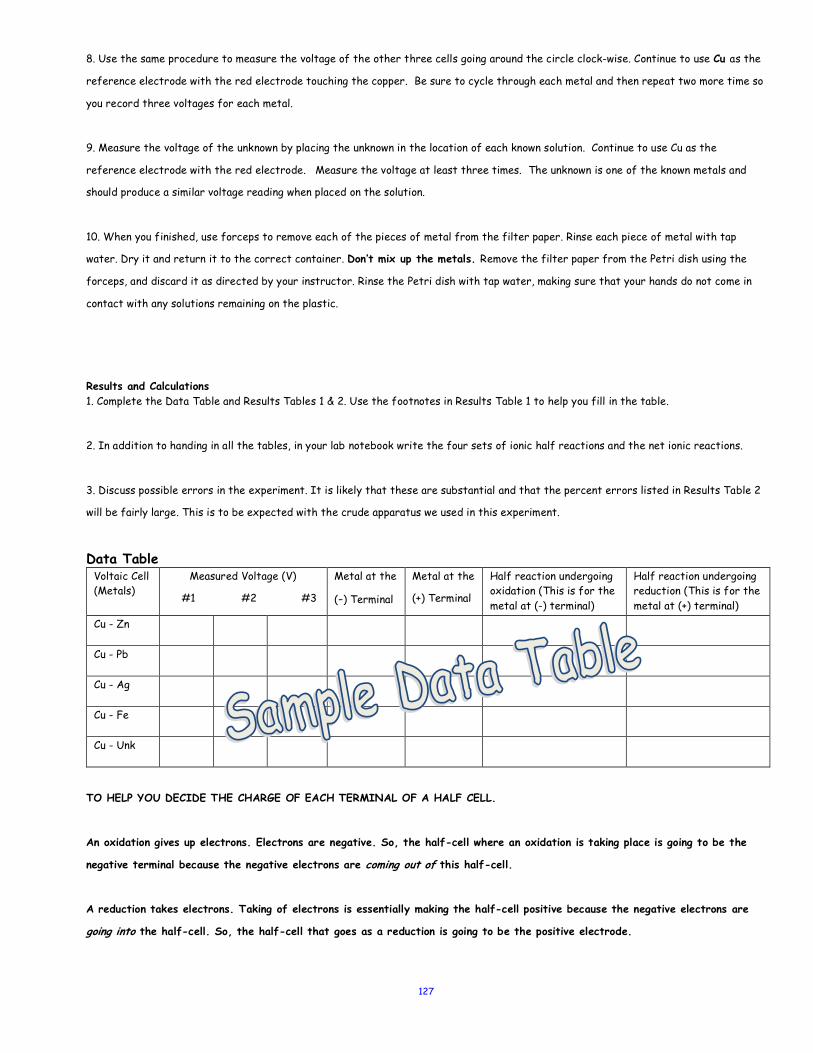
127
8. Use the same procedure to measure the voltage of the other three cells going around the circle clock-wise. Continue to use Cu as the
reference electrode with the red electrode touching the copper. Be sure to cycle through each metal and then repeat two more time so
you record three voltages for each metal.
9. Measure the voltage of the unknown by placing the unknown in the location of each known solution. Continue to use Cu as the
reference electrode with the red electrode. Measure the voltage at least three times. The unknown is one of the known metals and
should produce a similar voltage reading when placed on the solution.
10. When you finished, use forceps to remove each of the pieces of metal from the filter paper. Rinse each piece of metal with tap
water. Dry it and return it to the correct container. Don’t mix up the metals. Remove the filter paper from the Petri dish using the
forceps, and discard it as directed by your instructor. Rinse the Petri dish with tap water, making sure that your hands do not come in
contact with any solutions remaining on the plastic.
Results and Calculations 1. Complete the Data Table and Results Tables 1 & 2. Use the footnotes in Results Table 1 to help you fill in the table.
2. In addition to handing in all the tables, in your lab notebook write the four sets of ionic half reactions and the net ionic reactions.
3. Discuss possible errors in the experiment. It is likely that these are substantial and that the percent errors listed in Results Table 2
will be fairly large. This is to be expected with the crude apparatus we used in this experiment.
Data Table Voltaic Cell (Metals)
Measured Voltage (V)
#1 #2 #3
Metal at the
(-) Terminal
Metal at the
(+) Terminal
Half reaction undergoing oxidation (This is for the metal at (-) terminal)
Half reaction undergoing reduction (This is for the metal at (+) terminal)
Cu - Zn
Cu - Pb
Cu - Ag
Cu - Fe
Cu - Unk
TO HELP YOU DECIDE THE CHARGE OF EACH TERMINAL OF A HALF CELL.
An oxidation gives up electrons. Electrons are negative. So, the half-cell where an oxidation is taking place is going to be the
negative terminal because the negative electrons are coming out of this half-cell.
A reduction takes electrons. Taking of electrons is essentially making the half-cell positive because the negative electrons are
going into the half-cell. So, the half-cell that goes as a reduction is going to be the positive electrode.
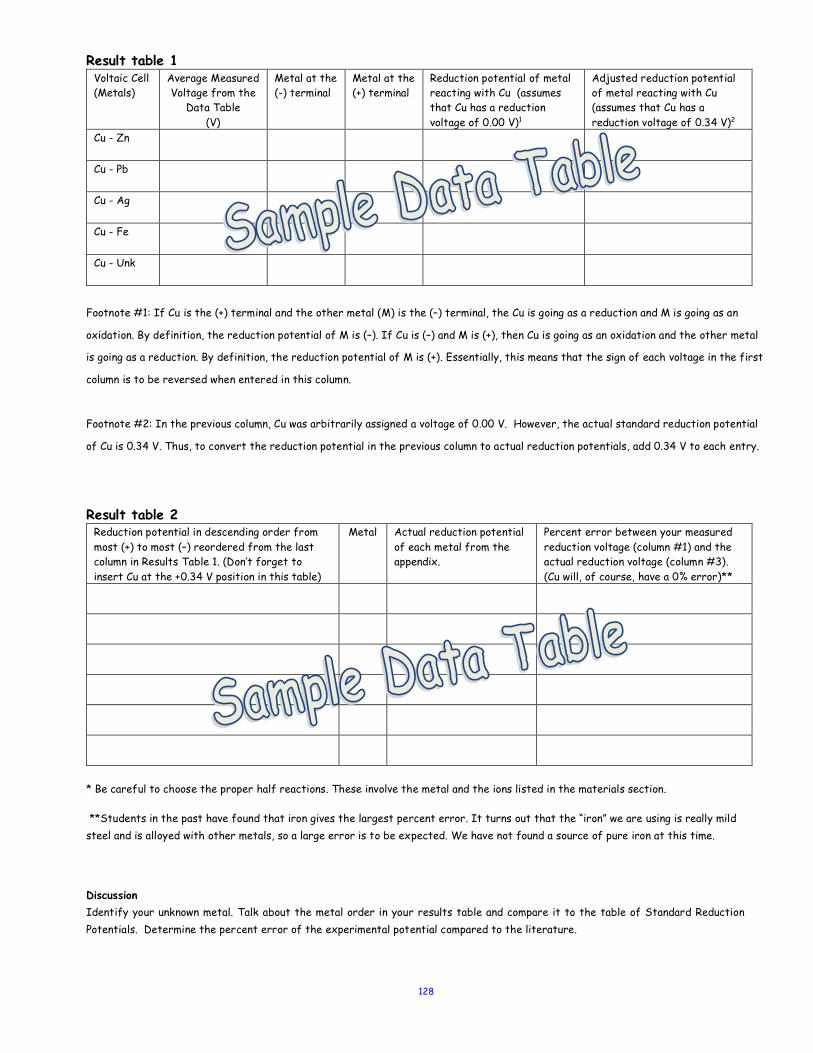
128
Result table 1 Voltaic Cell (Metals)
Average Measured Voltage from the
Data Table (V)
Metal at the (-) terminal
Metal at the (+) terminal
Reduction potential of metal reacting with Cu (assumes that Cu has a reduction voltage of 0.00 V)1
Adjusted reduction potential of metal reacting with Cu (assumes that Cu has a reduction voltage of 0.34 V)2
Cu - Zn
Cu - Pb
Cu - Ag
Cu - Fe
Cu - Unk
Footnote #1: If Cu is the (+) terminal and the other metal (M) is the (–) terminal, the Cu is going as a reduction and M is going as an
oxidation. By definition, the reduction potential of M is (–). If Cu is (–) and M is (+), then Cu is going as an oxidation and the other metal
is going as a reduction. By definition, the reduction potential of M is (+). Essentially, this means that the sign of each voltage in the first
column is to be reversed when entered in this column.
Footnote #2: In the previous column, Cu was arbitrarily assigned a voltage of 0.00 V. However, the actual standard reduction potential
of Cu is 0.34 V. Thus, to convert the reduction potential in the previous column to actual reduction potentials, add 0.34 V to each entry.
Result table 2
Reduction potential in descending order from most (+) to most (–) reordered from the last column in Results Table 1. (Don’t forget to insert Cu at the +0.34 V position in this table)
Metal Actual reduction potential of each metal from the appendix.
Percent error between your measured reduction voltage (column #1) and the actual reduction voltage (column #3). (Cu will, of course, have a 0% error)**
* Be careful to choose the proper half reactions. These involve the metal and the ions listed in the materials section. **Students in the past have found that iron gives the largest percent error. It turns out that the “iron” we are using is really mild steel and is alloyed with other metals, so a large error is to be expected. We have not found a source of pure iron at this time.
Discussion Identify your unknown metal. Talk about the metal order in your results table and compare it to the table of Standard Reduction Potentials. Determine the percent error of the experimental potential compared to the literature.
129
APPENDIX
APPENDIX
APPENDIX
APPENDIX

130
131
Stoichiometry of Redox Reaction - A Lab Practical Chemistry-201 Page 1 of 6 Write all work in this report sheet ___________________________________________ Names • Do not talk to anyone during this practical. If you need clarification see instructor. • Put you name on this lab sheet • Show all work to receive full credit • Record your data based on the precision of the instrument and use correct significant figures • Wear safety goggles and gloves • Wear hand protection when handling hot glassware • Wash hands immediately if any KMnO4 gets on your hands
When a new oxidation-reduction reaction is found, an important goal is to determine the identities of the products in the reaction. If one of the products is known, then the second product can be identified by first determining the stoichiometric ratio of the reactants and then balancing electrons to determine the oxidation state of the atoms in the second product. By balancing the redox reaction, the identity of the second product may be deduced.
The reaction you will investigate today is equation (1).
Reaction: HONH3+(aq) + Fe3+(aq) g Fe2+(aq) + _?_ (1)
The number of iron(II) ions produced can be determined by redox equation (2). (Acidic) Unbalanced Redox Reaction: __MnO4-(aq) + __Fe2+(aq) g __Fe3+(aq) + __Mn2+(aq) (2)
Equipment and Chemicals: HONH3
+ Litmus papers 25 mL Buret 3-125 mL Elm Flask KMnO4 Fe2(SO4)3 10-mL Vol pipet/bulb 1-25 mL Grad cylinder 3 M HCl DI water Wax pencil Hot plate
For 10 students (three trials): 600mL HONH3+, 1-L Fe2(SO4)3, 1-L KMnO4
Procedure: Prepare three identical samples by following the following directions. Make sure you have all the glassware necessary to perform this experiment through its entirety. Clean all glassware before the experiment to avoid contamination of your experiment. Note that the concentrations of hydroxylamine [A], iron(III) sulfate [B], and potassium permanganate [C] will be given to you when you begin your experiment.
1. Prepare a sample by pipetting 10.00 mL of a [A] M aqueous solution of hydroxylamine into a 125 mL Erlenmeyer flask.
2. Add 25 mL of the [B] M aqueous solution of iron(III) sulfate by using the graduated cylinder by the reagent bottle or through the repipetor. This amount represents an excess of iron(III). Add approximately 1 mL of 3 M HCl to the iron(III) sulfate and test the solution with litmus to verify that it is acidic. The dropper may be calibrated or you can count 20 drops. (20 drops ~ 1 mL)
3. Boil the solution for five minutes over a hot plate and then let the solution cool in an ice bath. Wear hand protectors when removing the hot solution from the hot plate.
4. During this cooling period, add 1 drop of hydroxylamine solution into a clean test tube. Add three drops of the iron(III) sulfate solution to this and heat briefly by setting the test tube on a hot plate or in hot water. Add a few drops of potassium permanganate to the test tube and write your observation. This is the result you should observe when iron(II) ions are oxidized to iron(III) in your titration.
5 If you have time, work on the supplemental questions at the end of this lab practical or use the concentration of the hydroxylamine to calculate the moles of hydroxylamine used in this experiment.
6. Obtain approximately 50 mL of KMnO4 and use this solution to fill the Buret at your lab station. Fill a 25-mL buret with standardized [C] M KMnO4 solution. Record the initial volume of the buret. Use your knowledge of titration to set up the buret for this procedure without assistance from your instructor. If you are not comfortable in the titration technique, look at the previous labs performed this semester that utilized titration technique.
7. Titrate the cooled sample with KMnO4 solution until the first permanent color change occurs (as observed in Step 4) in the mixture. A good strategy is to use one sample to determine the approximate amount of KMnO4 required to reach the endpoint. The color of the solution at the endpoint can also be observed in this first trial. In general, the solution goes from pale yellowish orange to a deep orange violet. Use the second and third sample to carefully determine the exact volume of KMnO4 required to reach the endpoint.
8. Record the final volume for your titration in the data sheet. 9. Rinse all equipment with deionized water and clean your work area. 10. Show complete calculations on how you determine the product in this experiment. Write a short conclusion of this experiment in
the data sheet.
132
Chem201 Lab Practical Page 2 of 6 Data Sheet: Use this sheet to record your observations and data. Do all your calculations on this sheet.
Chem201 Lab Practical Page 3 of 6
133
134
Chem201 Lab Practical Page 4 of 6
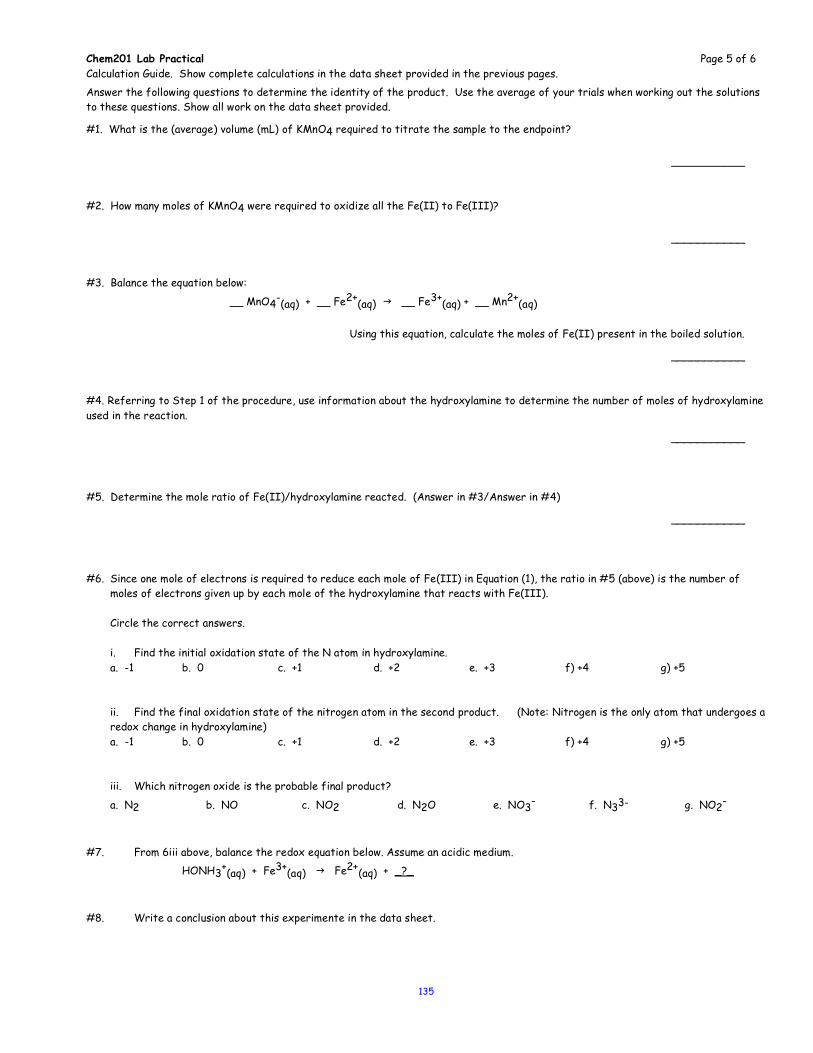
135
Chem201 Lab Practical Page 5 of 6 Calculation Guide. Show complete calculations in the data sheet provided in the previous pages.
Answer the following questions to determine the identity of the product. Use the average of your trials when working out the solutions to these questions. Show all work on the data sheet provided.
#1. What is the (average) volume (mL) of KMnO4 required to titrate the sample to the endpoint? ___________ #2. How many moles of KMnO4 were required to oxidize all the Fe(II) to Fe(III)? ___________ #3. Balance the equation below:
__ MnO4-(aq) + __ Fe2+(aq) g __ Fe3+(aq) + __ Mn2+(aq) Using this equation, calculate the moles of Fe(II) present in the boiled solution.
___________ #4. Referring to Step 1 of the procedure, use information about the hydroxylamine to determine the number of moles of hydroxylamine used in the reaction.
___________ #5. Determine the mole ratio of Fe(II)/hydroxylamine reacted. (Answer in #3/Answer in #4)
___________ #6. Since one mole of electrons is required to reduce each mole of Fe(III) in Equation (1), the ratio in #5 (above) is the number of
moles of electrons given up by each mole of the hydroxylamine that reacts with Fe(III). Circle the correct answers. i. Find the initial oxidation state of the N atom in hydroxylamine. a. -1 b. 0 c. +1 d. +2 e. +3 f) +4 g) +5 ii. Find the final oxidation state of the nitrogen atom in the second product. (Note: Nitrogen is the only atom that undergoes a
redox change in hydroxylamine) a. -1 b. 0 c. +1 d. +2 e. +3 f) +4 g) +5 iii. Which nitrogen oxide is the probable final product?
a. N2 b. NO c. NO2 d. N2O e. NO3- f. N33- g. NO2- #7. From 6iii above, balance the redox equation below. Assume an acidic medium. HONH3+(aq) + Fe3+(aq) g Fe2+(aq) + _?_ #8. Write a conclusion about this experimente in the data sheet.
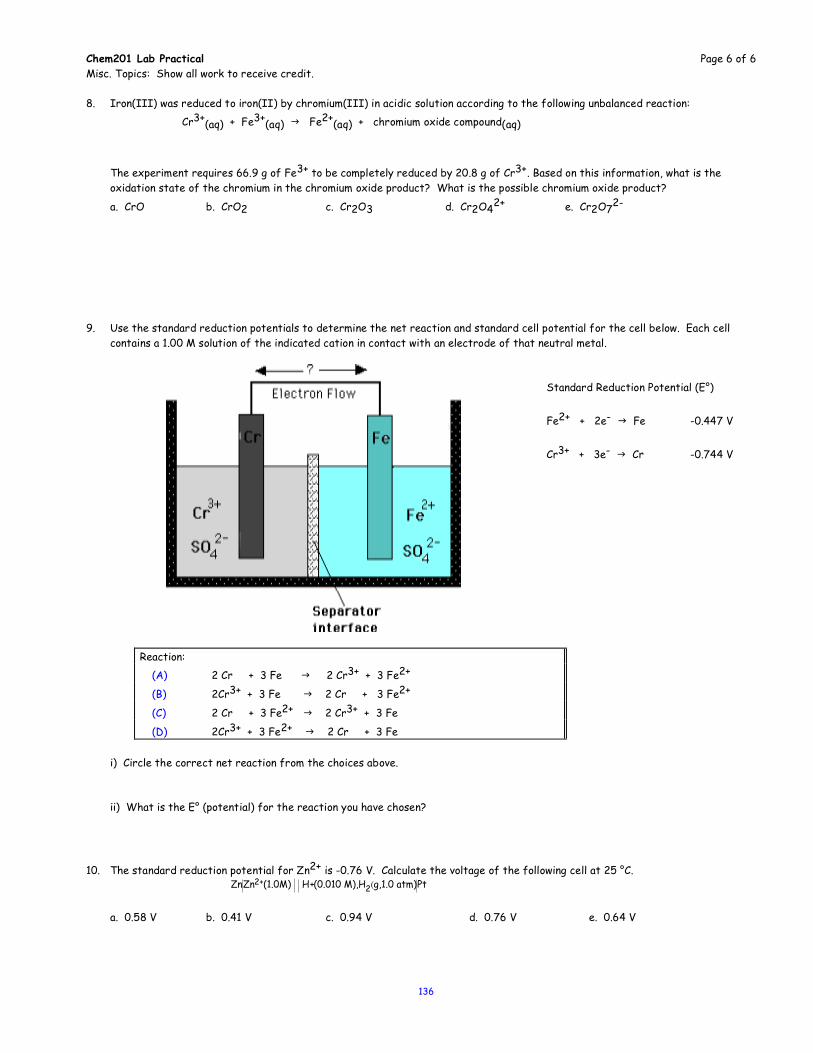
136
Chem201 Lab Practical Page 6 of 6 Misc. Topics: Show all work to receive credit. 8. Iron(III) was reduced to iron(II) by chromium(III) in acidic solution according to the following unbalanced reaction: Cr3+(aq) + Fe3+(aq) g Fe2+(aq) + chromium oxide compound(aq) The experiment requires 66.9 g of Fe3+ to be completely reduced by 20.8 g of Cr3+. Based on this information, what is the
oxidation state of the chromium in the chromium oxide product? What is the possible chromium oxide product?
a. CrO b. CrO2 c. Cr2O3 d. Cr2O42+ e. Cr2O72- 9. Use the standard reduction potentials to determine the net reaction and standard cell potential for the cell below. Each cell
contains a 1.00 M solution of the indicated cation in contact with an electrode of that neutral metal.
Standard Reduction Potential (E°)
Fe2+ + 2e- g Fe -0.447 V Cr3+ + 3e- g Cr -0.744 V
Reaction:
(A) 2 Cr + 3 Fe g 2 Cr3+ + 3 Fe2+
(B) 2Cr3+ + 3 Fe g 2 Cr + 3 Fe2+
(C) 2 Cr + 3 Fe2+ g 2 Cr3+ + 3 Fe
(D) 2Cr3+ + 3 Fe2+ g 2 Cr + 3 Fe i) Circle the correct net reaction from the choices above. ii) What is the E° (potential) for the reaction you have chosen?
10. The standard reduction potential for Zn2+ is -0.76 V. Calculate the voltage of the following cell at 25 °C.
a. 0.58 V b. 0.41 V c. 0.94 V d. 0.76 V e. 0.64 V
€
ZnZn2+(1.0M) H+(0.010 M),H2(g,1.0 atm)Pt
137
Appendix 1 Care and Handling of Chemicals
The success of a chemical reaction or analysis is critically dependent on the purity and quality of the chemicals used. It is of utmost importance that the chemicals supplied for an experiment be of sufficient purity for the experiment to work and that contamination of these chemicals do not occur during the course of a laboratory. Grades of Chemicals: Chemicals are available from suppliers in a number of different grades of purity. The least pure (and also the cheapest grade) is technical grade. This grade of chemical should only he used when contamination is not important or in the initial stages of washing glassware. The most commonly used grade is A.C.S. reagent grade. These chemicals must meet minimum purity standards, which are specified by the American Chemical Society. Reagent grade chemicals are appropriate for all but the most exacting or specialized work. The highest grade of purity is primary-standard grade. These chemicals must he extraordinary pure and extremely stable, and are used when the highest possible accuracy is needed. Some chemicals may also be used for special purposes and are called specialty grade chemicals. Solvents may he specially purified to eliminate light absorbing impurities (spectrophotometric grade) or to eliminate particulate matter (HPLC grade). Specific impurities may be eliminated to enhance the usefulness of the chemical for some specific reaction with which the impurity would interfere. As the cost of a chemical is much greater the higher its purity, only the grade actually needed for the experiment to work is used. Thus, primary-standard grade chemicals are not used for all reactions. Avoiding Contamination of Chemicals: It is absolutely essential that chemical reagents not become contaminated during the course of the entire laboratory sections conducted for each experiment. In order to avoid this, it is very important that the following simple rules he observed:
1) Only take as much of a chemical as you need for the experiment. 2) Never put any excess chemical back into its container. Dispose of it instead. 3) Never place the bottle lid or stopper on the bench top where it may become contaminated. Hold it in your hand or place it on a clean Kim-wipe. Replace the top immediately after use. 4) Never stick a metallic object into a chemical bottle. If the solid inside is not free-flowing gently tap it against the countertop to loosen the solid. If this does not work, a clean porcelain spoon or glass stirring rod may be used to break up the solid. Be careful not to break the rod!
______________________________________________________________________________________________
Appendix 2 Measurement of Mass
Introduction: While a variety of different types of balances exist for the measurement of the mass of a sample, by far the most common today and the one used in this course is the single pan top-loading electronic balance. These balances are quite accurate, with a quality balance measuring to the nearest 0.0001 g. They are also both fast and easy to use. However, as with any piece of electronic equipment they are quite delicate and should be treated with care. General Considerations: There are a number of general considerations that apply to the use of balances to measure mass. Glassware whose mass is to be determined should be clean, dry and at room temperature. Chemicals to be weighed are never placed directly on the balance pan: instead they should be weighed into the container in which they will be used or weighed using weighing paper. If the chemicals are hygroscopic (they absorb water from the atmosphere), they must first be dried in an oven and then cooled in a desiccator before weighing. If the balance has an enclosed chamber all doors must be closed for any weighing operation. The object(s) being weighed must not touch any surface besides the balance pan. Procedures: If the balance is not already switched on, make sure all of the doors (if any) are closed and then turn it on by depressing the lever in the front. After a short period of time a reading of zero mass should appear in the scale. If any other number appears depress the lever again. If the numbers on the scale are rapidly changing or if anything else appears on the scale, consult the instructor. If an object is to be weighed, place it on the pan (opening and closing the doors if necessary) and take the reading. If a chemical is to be weighed, place the container or weighing paper of the pan and depress the lever again. This tares (re-zeros) the balance so that the weight of the container or paper is not included in the reading. Slowly add the chemical to the container or paper until the desired weight is reached. Record the exact value used. If the experiment calls for 2.0 + 0.1 g, don't waste your time trying to get exactly 2.0000 g. Any value between 1.900 and 2.100 g is acceptable as long as you know exactly how much you used. Any chemical spilled must be immediately swept out of the chamber using the brush found on top of the balance.
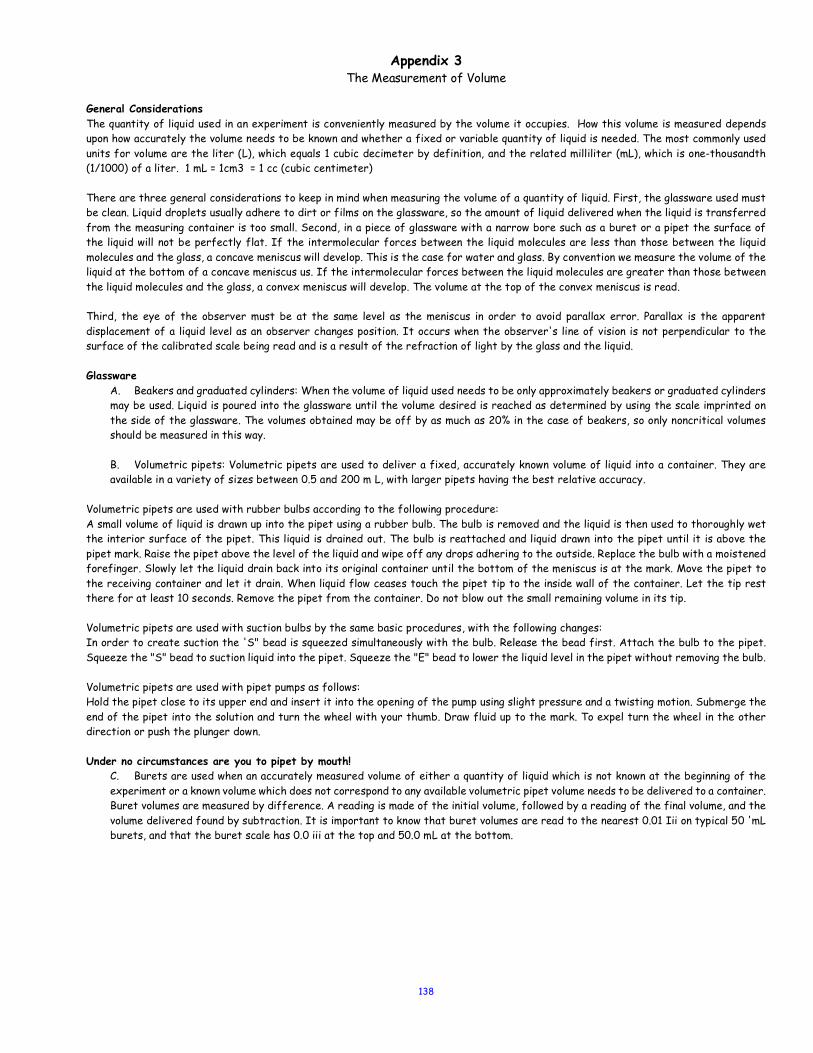
138
Appendix 3 The Measurement of Volume
General Considerations The quantity of liquid used in an experiment is conveniently measured by the volume it occupies. How this volume is measured depends upon how accurately the volume needs to be known and whether a fixed or variable quantity of liquid is needed. The most commonly used units for volume are the liter (L), which equals 1 cubic decimeter by definition, and the related milliliter (mL), which is one-thousandth (1/1000) of a liter. 1 mL = 1cm3 = 1 cc (cubic centimeter) There are three general considerations to keep in mind when measuring the volume of a quantity of liquid. First, the glassware used must be clean. Liquid droplets usually adhere to dirt or films on the glassware, so the amount of liquid delivered when the liquid is transferred from the measuring container is too small. Second, in a piece of glassware with a narrow bore such as a buret or a pipet the surface of the liquid will not be perfectly flat. If the intermolecular forces between the liquid molecules are less than those between the liquid molecules and the glass, a concave meniscus will develop. This is the case for water and glass. By convention we measure the volume of the liquid at the bottom of a concave meniscus us. If the intermolecular forces between the liquid molecules are greater than those between the liquid molecules and the glass, a convex meniscus will develop. The volume at the top of the convex meniscus is read. Third, the eye of the observer must be at the same level as the meniscus in order to avoid parallax error. Parallax is the apparent displacement of a liquid level as an observer changes position. It occurs when the observer's line of vision is not perpendicular to the surface of the calibrated scale being read and is a result of the refraction of light by the glass and the liquid. Glassware
A. Beakers and graduated cylinders: When the volume of liquid used needs to be only approximately beakers or graduated cylinders may be used. Liquid is poured into the glassware until the volume desired is reached as determined by using the scale imprinted on the side of the glassware. The volumes obtained may be off by as much as 20% in the case of beakers, so only noncritical volumes should be measured in this way. B. Volumetric pipets: Volumetric pipets are used to deliver a fixed, accurately known volume of liquid into a container. They are available in a variety of sizes between 0.5 and 200 m L, with larger pipets having the best relative accuracy.
Volumetric pipets are used with rubber bulbs according to the following procedure: A small volume of liquid is drawn up into the pipet using a rubber bulb. The bulb is removed and the liquid is then used to thoroughly wet the interior surface of the pipet. This liquid is drained out. The bulb is reattached and liquid drawn into the pipet until it is above the pipet mark. Raise the pipet above the level of the liquid and wipe off any drops adhering to the outside. Replace the bulb with a moistened forefinger. Slowly let the liquid drain back into its original container until the bottom of the meniscus is at the mark. Move the pipet to the receiving container and let it drain. When liquid flow ceases touch the pipet tip to the inside wall of the container. Let the tip rest there for at least 10 seconds. Remove the pipet from the container. Do not blow out the small remaining volume in its tip. Volumetric pipets are used with suction bulbs by the same basic procedures, with the following changes: In order to create suction the 'S" bead is squeezed simultaneously with the bulb. Release the bead first. Attach the bulb to the pipet. Squeeze the "S" bead to suction liquid into the pipet. Squeeze the "E" bead to lower the liquid level in the pipet without removing the bulb. Volumetric pipets are used with pipet pumps as follows: Hold the pipet close to its upper end and insert it into the opening of the pump using slight pressure and a twisting motion. Submerge the end of the pipet into the solution and turn the wheel with your thumb. Draw fluid up to the mark. To expel turn the wheel in the other direction or push the plunger down. Under no circumstances are you to pipet by mouth!
C. Burets are used when an accurately measured volume of either a quantity of liquid which is not known at the beginning of the experiment or a known volume which does not correspond to any available volumetric pipet volume needs to be delivered to a container. Buret volumes are measured by difference. A reading is made of the initial volume, followed by a reading of the final volume, and the volume delivered found by subtraction. It is important to know that buret volumes are read to the nearest 0.01 Iii on typical 50 'mL burets, and that the buret scale has 0.0 iii at the top and 50.0 mL at the bottom.
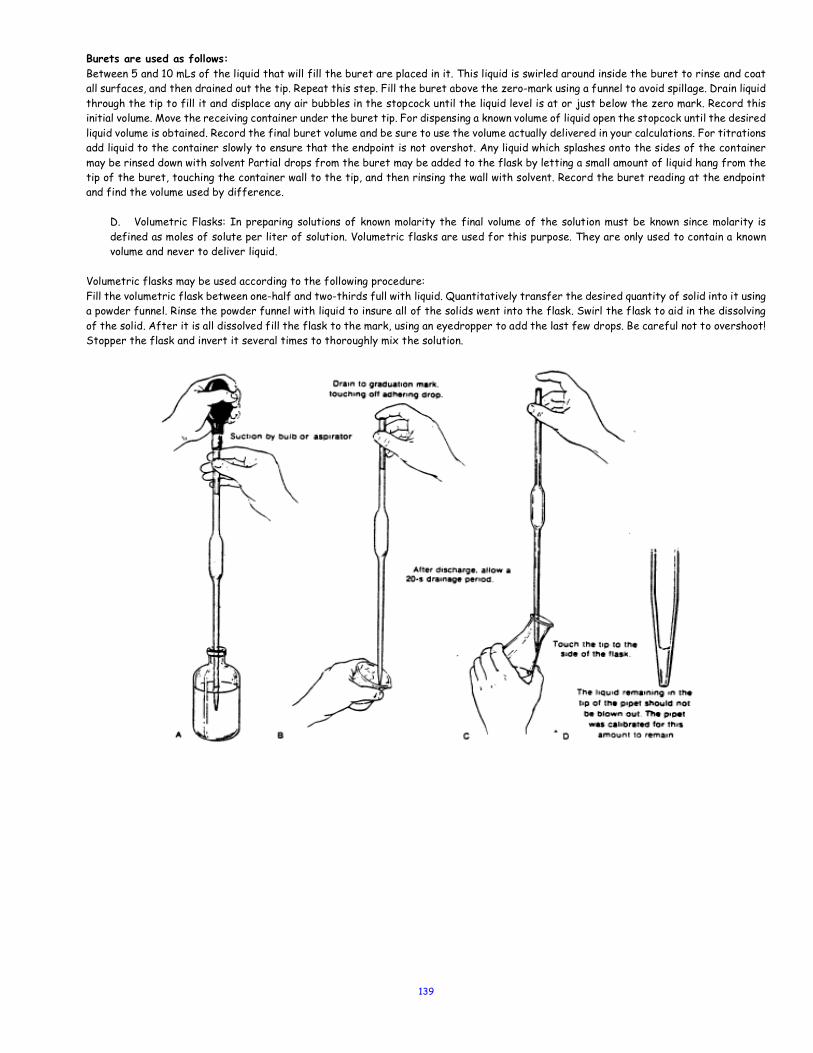
139
Burets are used as follows: Between 5 and 10 mLs of the liquid that will fill the buret are placed in it. This liquid is swirled around inside the buret to rinse and coat all surfaces, and then drained out the tip. Repeat this step. Fill the buret above the zero-mark using a funnel to avoid spillage. Drain liquid through the tip to fill it and displace any air bubbles in the stopcock until the liquid level is at or just below the zero mark. Record this initial volume. Move the receiving container under the buret tip. For dispensing a known volume of liquid open the stopcock until the desired liquid volume is obtained. Record the final buret volume and be sure to use the volume actually delivered in your calculations. For titrations add liquid to the container slowly to ensure that the endpoint is not overshot. Any liquid which splashes onto the sides of the container may be rinsed down with solvent Partial drops from the buret may be added to the flask by letting a small amount of liquid hang from the tip of the buret, touching the container wall to the tip, and then rinsing the wall with solvent. Record the buret reading at the endpoint and find the volume used by difference.
D. Volumetric Flasks: In preparing solutions of known molarity the final volume of the solution must be known since molarity is defined as moles of solute per liter of solution. Volumetric flasks are used for this purpose. They are only used to contain a known volume and never to deliver liquid.
Volumetric flasks may be used according to the following procedure: Fill the volumetric flask between one-half and two-thirds full with liquid. Quantitatively transfer the desired quantity of solid into it using a powder funnel. Rinse the powder funnel with liquid to insure all of the solids went into the flask. Swirl the flask to aid in the dissolving of the solid. After it is all dissolved fill the flask to the mark, using an eyedropper to add the last few drops. Be careful not to overshoot! Stopper the flask and invert it several times to thoroughly mix the solution.
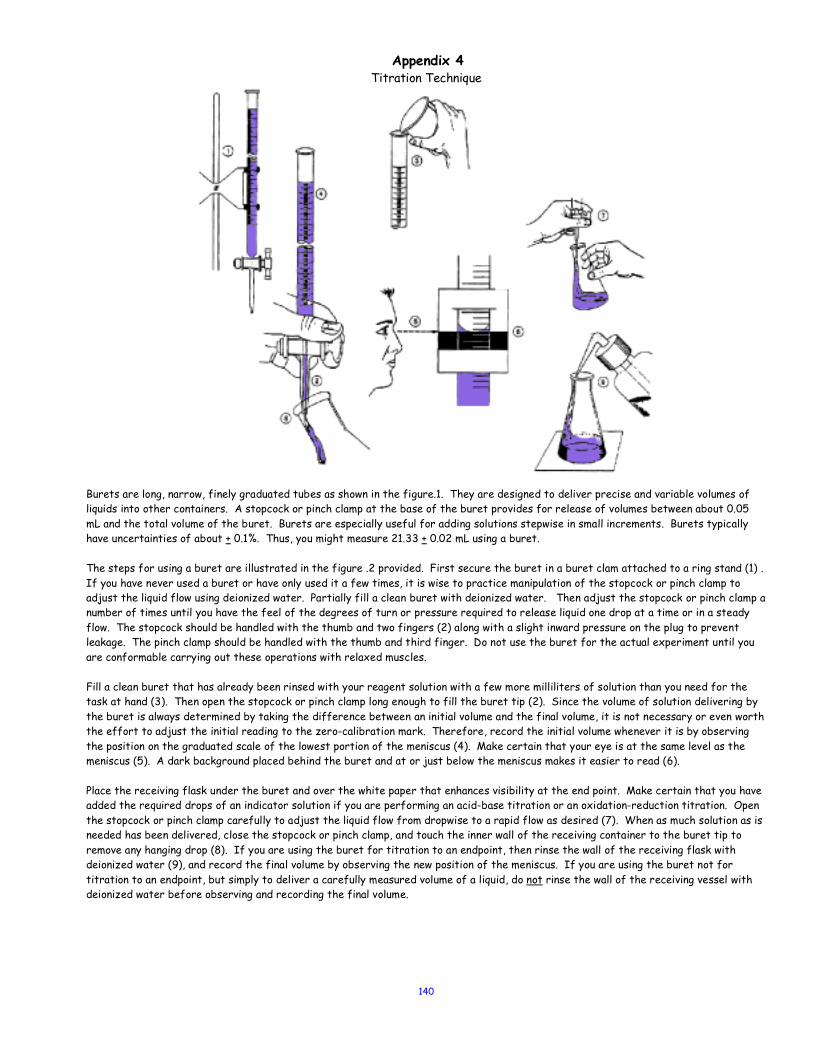
140
Appendix 4 Titration Technique
Burets are long, narrow, finely graduated tubes as shown in the figure.1. They are designed to deliver precise and variable volumes of liquids into other containers. A stopcock or pinch clamp at the base of the buret provides for release of volumes between about 0.05 mL and the total volume of the buret. Burets are especially useful for adding solutions stepwise in small increments. Burets typically have uncertainties of about + 0.1%. Thus, you might measure 21.33 + 0.02 mL using a buret. The steps for using a buret are illustrated in the figure .2 provided. First secure the buret in a buret clam attached to a ring stand (1) . If you have never used a buret or have only used it a few times, it is wise to practice manipulation of the stopcock or pinch clamp to adjust the liquid flow using deionized water. Partially fill a clean buret with deionized water. Then adjust the stopcock or pinch clamp a number of times until you have the feel of the degrees of turn or pressure required to release liquid one drop at a time or in a steady flow. The stopcock should be handled with the thumb and two fingers (2) along with a slight inward pressure on the plug to prevent leakage. The pinch clamp should be handled with the thumb and third finger. Do not use the buret for the actual experiment until you are conformable carrying out these operations with relaxed muscles. Fill a clean buret that has already been rinsed with your reagent solution with a few more milliliters of solution than you need for the task at hand (3). Then open the stopcock or pinch clamp long enough to fill the buret tip (2). Since the volume of solution delivering by the buret is always determined by taking the difference between an initial volume and the final volume, it is not necessary or even worth the effort to adjust the initial reading to the zero-calibration mark. Therefore, record the initial volume whenever it is by observing the position on the graduated scale of the lowest portion of the meniscus (4). Make certain that your eye is at the same level as the meniscus (5). A dark background placed behind the buret and at or just below the meniscus makes it easier to read (6). Place the receiving flask under the buret and over the white paper that enhances visibility at the end point. Make certain that you have added the required drops of an indicator solution if you are performing an acid-base titration or an oxidation-reduction titration. Open the stopcock or pinch clamp carefully to adjust the liquid flow from dropwise to a rapid flow as desired (7). When as much solution as is needed has been delivered, close the stopcock or pinch clamp, and touch the inner wall of the receiving container to the buret tip to remove any hanging drop (8). If you are using the buret for titration to an endpoint, then rinse the wall of the receiving flask with deionized water (9), and record the final volume by observing the new position of the meniscus. If you are using the buret not for titration to an endpoint, but simply to deliver a carefully measured volume of a liquid, do not rinse the wall of the receiving vessel with deionized water before observing and recording the final volume.
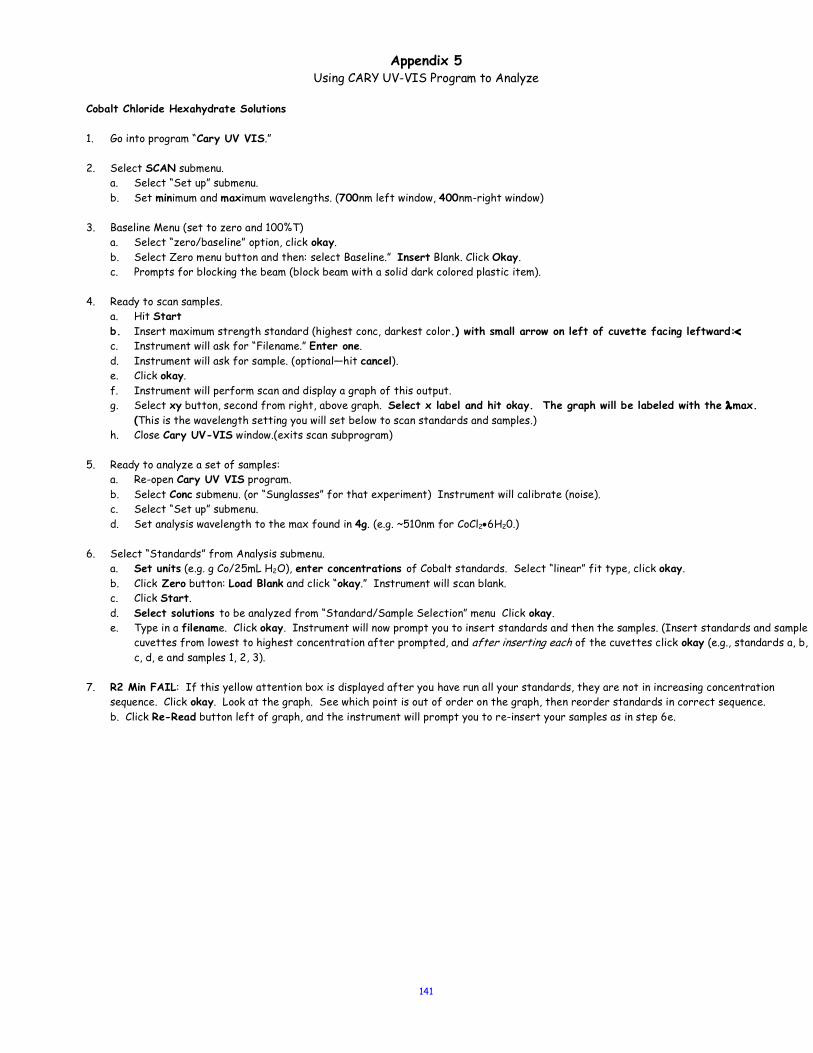
141
Appendix 5 Using CARY UV-VIS Program to Analyze
Cobalt Chloride Hexahydrate Solutions
1. Go into program “Cary UV VIS.” 2. Select SCAN submenu.
a. Select “Set up” submenu. b. Set minimum and maximum wavelengths. (700nm left window, 400nm-right window)
3. Baseline Menu (set to zero and 100%T)
a. Select “zero/baseline” option, click okay. b. Select Zero menu button and then: select Baseline.” Insert Blank. Click Okay. c. Prompts for blocking the beam (block beam with a solid dark colored plastic item).
4. Ready to scan samples.
a. Hit Start b. Insert maximum strength standard (highest conc, darkest color.) with small arrow on left of cuvette facing leftward:< c. Instrument will ask for “Filename.” Enter one. d. Instrument will ask for sample. (optional—hit cancel). e. Click okay. f. Instrument will perform scan and display a graph of this output. g. Select xy button, second from right, above graph. Select x label and hit okay. The graph will be labeled with the lmax.
(This is the wavelength setting you will set below to scan standards and samples.) h. Close Cary UV-VIS window.(exits scan subprogram)
5. Ready to analyze a set of samples:
a. Re-open Cary UV VIS program. b. Select Conc submenu. (or “Sunglasses” for that experiment) Instrument will calibrate (noise). c. Select “Set up” submenu. d. Set analysis wavelength to the max found in 4g. (e.g. ~510nm for CoCl2•6H20.)
6. Select “Standards” from Analysis submenu.
a. Set units (e.g. g Co/25mL H2O), enter concentrations of Cobalt standards. Select “linear” fit type, click okay. b. Click Zero button: Load Blank and click “okay.” Instrument will scan blank. c. Click Start. d. Select solutions to be analyzed from “Standard/Sample Selection” menu Click okay. e. Type in a filename. Click okay. Instrument will now prompt you to insert standards and then the samples. (Insert standards and sample
cuvettes from lowest to highest concentration after prompted, and after inserting each of the cuvettes click okay (e.g., standards a, b, c, d, e and samples 1, 2, 3).
7. R2 Min FAIL: If this yellow attention box is displayed after you have run all your standards, they are not in increasing concentration
sequence. Click okay. Look at the graph. See which point is out of order on the graph, then reorder standards in correct sequence. b. Click Re-Read button left of graph, and the instrument will prompt you to re-insert your samples as in step 6e.

142
Appendix 6
Electromagnetic Spectrum
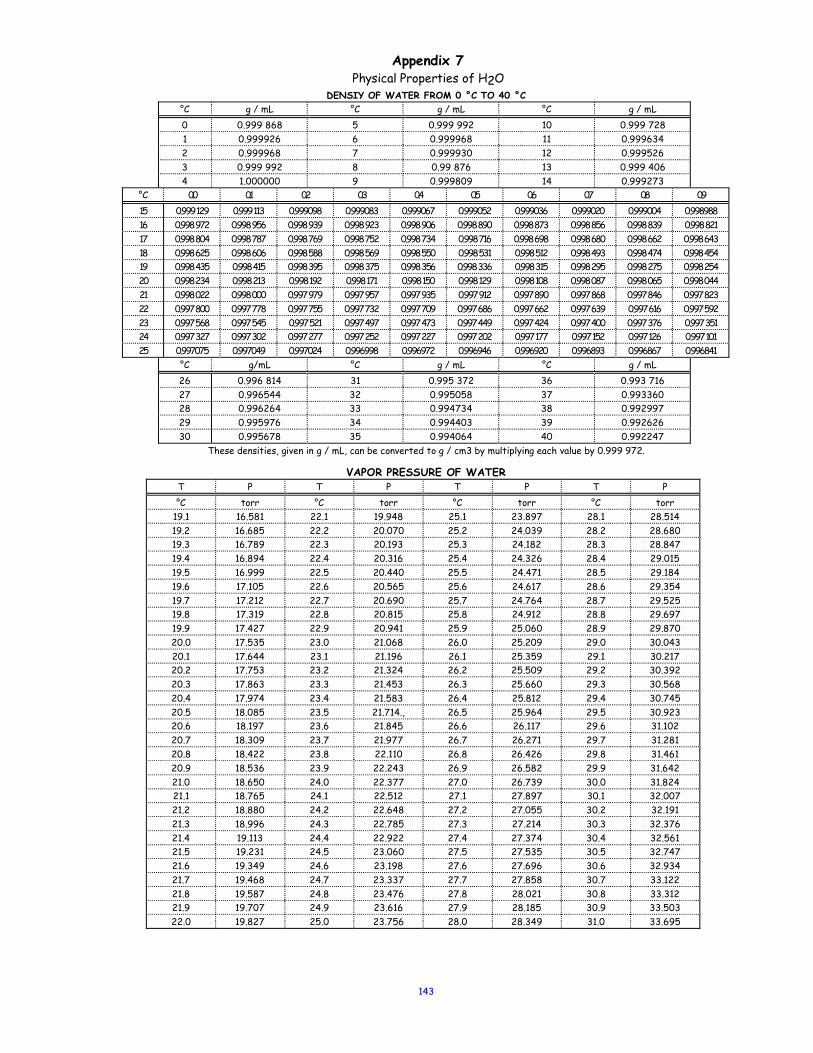
143
Appendix 7 Physical Properties of H2O
DENSIY OF WATER FROM 0 °C TO 40 °C °C g / mL °C g / mL °C g / mL 0 0.999 868 5 0.999 992 10 0.999 728 1 0.999926 6 0.999968 11 0.999634 2 0.999968 7 0.999930 12 0.999526 3 0.999 992 8 0.99 876 13 0.999 406 4 1.000000 9 0.999809 14 0.999273
°C 0.0 0.1 0.2 0.3 0.4 0.5 0.6 0.7 0.8 0.9 15 0.999 129 0.999 113 0.999098 0.999083 0.999067 0.999052 0.999036 0.999020 0.999004 0.998988 16 0.998 972 0.998 956 0.998 939 0.998 923 0.998 906 0.998 890 0.998 873 0.998 856 0.998 839 0.998 821 17 0.998 804 0.998 787 0.998 769 0.998 752 0.998 734 0.998 716 0.998 698 0.998 680 0.998 662 0.998 643 18 0.998 625 0.998 606 0.998 588 0.998 569 0.998 550 0.998 531 0.998 512 0.998 493 0.998 474 0.998 454 19 0.998 435 0.998 415 0.998 395 0.998 375 0.998 356 0.998 336 0.998 315 0.998 295 0.998 275 0.998 254 20 0.998 234 0.998 213 0.998 192 0.998 171 0.998 150 0.998 129 0.998 108 0.998 087 0.998 065 0.998 044 21 0.998 022 0.998 000 0.997 979 0.997 957 0.997 935 0.997 912 0.997 890 0.997 868 0.997 846 0.997 823 22 0.997 800 0.997 778 0.997 755 0.997 732 0.997 709 0.997 686 0.997 662 0.997 639 0.997 616 0.997 592 23 0.997 568 0.997 545 0.997 521 0.997 497 0.997 473 0.997 449 0.997 424 0.997 400 0.997 376 0.997 351 24 0.997 327 0.997 302 0.997 277 0.997 252 0.997 227 0.997 202 0.997 177 0.997 152 0.997 126 0.997 101 25 0.997075 0.997049 0.997024 0.996998 0.996972 0.996946 0.996920 0.996893 0.996867 0.996841
°C g/mL °C g / mL °C g / mL 26 0.996 814 31 0.995 372 36 0.993 716 27 0.996544 32 0.995058 37 0.993360 28 0.996264 33 0.994734 38 0.992997 29 0.995976 34 0.994403 39 0.992626 30 0.995678 35 0.994064 40 0.992247
These densities, given in g / mL, can be converted to g / cm3 by multiplying each value by 0.999 972.
VAPOR PRESSURE OF WATER T P T P T P T P °C torr °C torr °C torr °C torr
19.1 16.581 22.1 19.948 25.1 23.897 28.1 28.514 19.2 16.685 22.2 20.070 25.2 24.039 28.2 28.680 19.3 16.789 22.3 20.193 25.3 24.182 28.3 28.847 19.4 16.894 22.4 20.316 25.4 24.326 28.4 29.015 19.5 16.999 22.5 20.440 25.5 24.471 28.5 29.184 19.6 17.105 22.6 20.565 25.6 24.617 28.6 29.354 19.7 17.212 22.7 20.690 25.7 24.764 28.7 29.525 19.8 17.319 22.8 20.815 25.8 24.912 28.8 29.697 19.9 17.427 22.9 20.941 25.9 25.060 28.9 29.870 20.0 17.535 23.0 21.068 26.0 25.209 29.0 30.043 20.1 17.644 23.1 21.196 26.1 25.359 29.1 30.217 20.2 17.753 23.2 21.324 26.2 25.509 29.2 30.392 20.3 17.863 23.3 21.453 26.3 25.660 29.3 30.568 20.4 17.974 23.4 21.583 26.4 25.812 29.4 30.745 20.5 18.085 23.5 21.714., 26.5 25.964 29.5 30.923 20.6 18.197 23.6 21.845 26.6 26.117 29.6 31.102 20.7 18.309 23.7 21.977 26.7 26.271 29.7 31.281 20.8 18.422 23.8 22.110 26.8 26.426 29.8 31.461 20.9 18.536 23.9 22.243 26.9 26.582 29.9 31.642 21.0 18.650 24.0 22.377 27.0 26.739 30.0 31.824 21.1 18.765 24.1 22.512 27.1 27.897 30.1 32.007 21.2 18.880 24.2 22.648 27.2 27.055 30.2 32.191 21.3 18.996 24.3 22.785 27.3 27.214 30.3 32.376 21.4 19.113 24.4 22.922 27.4 27.374 30.4 32.561 21.5 19.231 24.5 23.060 27.5 27.535 30.5 32.747 21.6 19.349 24.6 23.198 27.6 27.696 30.6 32.934 21.7 19.468 24.7 23.337 27.7 27.858 30.7 33.122 21.8 19.587 24.8 23.476 27.8 28.021 30.8 33.312 21.9 19.707 24.9 23.616 27.9 28.185 30.9 33.503 22.0 19.827 25.0 23.756 28.0 28.349 31.0 33.695
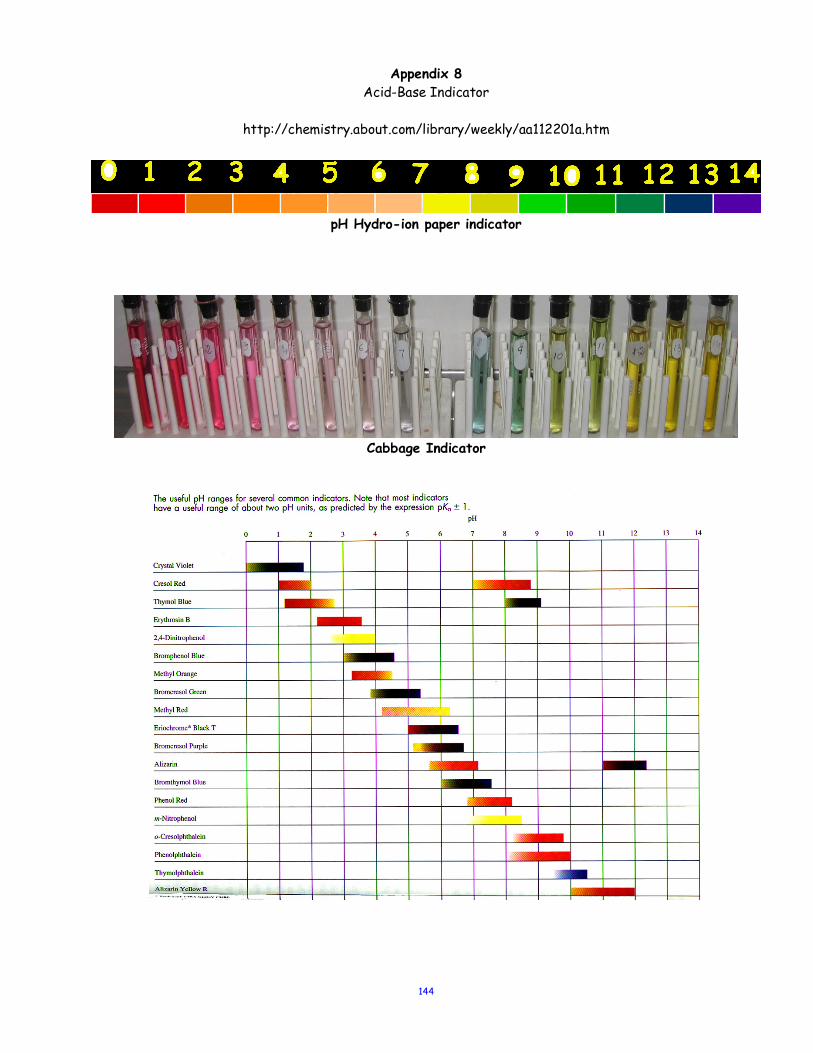
144
Appendix 8
Acid-Base Indicator
http://chemistry.about.com/library/weekly/aa112201a.htm
pH Hydro-ion paper indicator
Cabbage Indicator
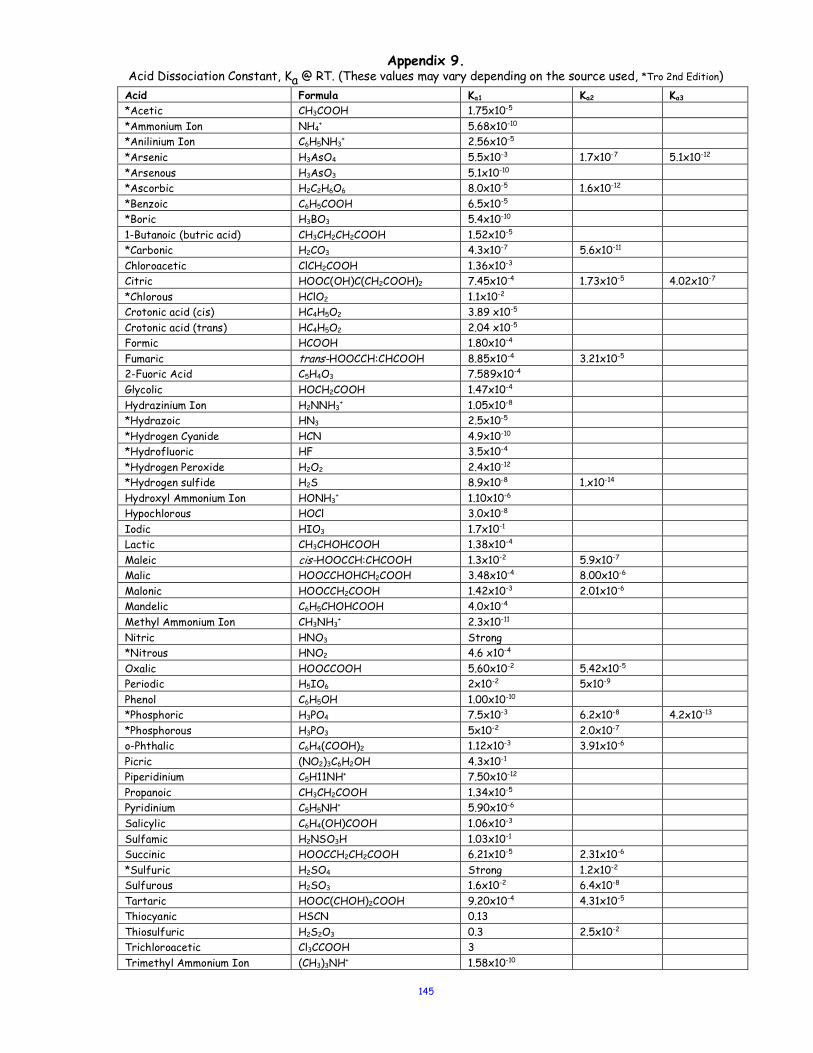
145
Appendix 9. Acid Dissociation Constant, Ka @ RT. (These values may vary depending on the source used, *Tro 2nd Edition) Acid Formula Ka1 Ka2 Ka3 *Acetic CH3COOH 1.75x10⁻⁵ *Ammonium Ion NH4
+ 5.68x10⁻¹⁰ *Anilinium Ion C6H5NH3
+ 2.56x10⁻⁵ *Arsenic H3AsO4 5.5x10⁻³ 1.7x10⁻⁷ 5.1x10⁻¹² *Arsenous H3AsO3 5.1x10⁻¹⁰ *Ascorbic H2C2H6O6 8.0x10⁻⁵ 1.6x10⁻¹² *Benzoic C6H5COOH 6.5x10⁻⁵ *Boric H3BO3 5.4x10⁻¹⁰ 1-Butanoic (butric acid) CH3CH2CH2COOH 1.52x10⁻⁵ *Carbonic H2CO3 4.3x10⁻⁷ 5.6x10⁻¹¹ Chloroacetic ClCH2COOH 1.36x10⁻³ Citric HOOC(OH)C(CH2COOH)2 7.45x10⁻⁴ 1.73x10⁻⁵ 4.02x10⁻⁷ *Chlorous HClO2 1.1x10⁻² Crotonic acid (cis) HC4H5O2 3.89 x10⁻⁵ Crotonic acid (trans) HC4H5O2 2.04 x10⁻⁵ Formic HCOOH 1.80x10⁻⁴ Fumaric trans-HOOCCH:CHCOOH 8.85x10⁻⁴ 3.21x10⁻⁵ 2-Fuoric Acid C5H4O3 7.589x10⁻⁴ Glycolic HOCH2COOH 1.47x10⁻⁴ Hydrazinium Ion H2NNH3
+ 1.05x10⁻⁸ *Hydrazoic HN3 2.5x10⁻⁵ *Hydrogen Cyanide HCN 4.9x10⁻¹⁰ *Hydrofluoric HF 3.5x10⁻⁴ *Hydrogen Peroxide H2O2 2.4x10⁻¹² *Hydrogen sulfide H2S 8.9x10⁻⁸ 1.x10-14 Hydroxyl Ammonium Ion HONH3
+ 1.10x10⁻⁶ Hypochlorous HOCl 3.0x10⁻⁸ Iodic HIO3 1.7x10⁻¹ Lactic CH3CHOHCOOH 1.38x10⁻⁴ Maleic cis-HOOCCH:CHCOOH 1.3x10⁻² 5.9x10⁻⁷ Malic HOOCCHOHCH2COOH 3.48x10⁻⁴ 8.00x10⁻⁶ Malonic HOOCCH2COOH 1.42x10⁻³ 2.01x10⁻⁶ Mandelic C6H5CHOHCOOH 4.0x10⁻⁴ Methyl Ammonium Ion CH3NH3
+ 2.3x10⁻¹¹ Nitric HNO3 Strong *Nitrous HNO2 4.6 x10⁻⁴ Oxalic HOOCCOOH 5.60x10⁻² 5.42x10⁻⁵ Periodic H5IO6 2x10⁻² 5x10⁻⁹ Phenol C6H5OH 1.00x10⁻¹⁰ *Phosphoric H3PO4 7.5x10⁻³ 6.2x10⁻⁸ 4.2x10⁻¹³ *Phosphorous H3PO3 5x10⁻² 2.0x10⁻⁷ o-Phthalic C6H4(COOH)2 1.12x10⁻³ 3.91x10⁻⁶ Picric (NO2)3C6H2OH 4.3x10⁻¹ Piperidinium C5H11NH+ 7.50x10⁻¹² Propanoic CH3CH2COOH 1.34x10⁻⁵ Pyridinium C5H5NH+ 5.90x10⁻⁶ Salicylic C6H4(OH)COOH 1.06x10⁻³ Sulfamic H2NSO3H 1.03x10⁻¹ Succinic HOOCCH2CH2COOH 6.21x10⁻⁵ 2.31x10⁻⁶ *Sulfuric H2SO4 Strong 1.2x10⁻² Sulfurous H2SO3 1.6x10⁻² 6.4x10⁻⁸ Tartaric HOOC(CHOH)2COOH 9.20x10⁻⁴ 4.31x10⁻⁵ Thiocyanic HSCN 0.13 Thiosulfuric H2S2O3 0.3 2.5x10⁻² Trichloroacetic Cl3CCOOH 3 Trimethyl Ammonium Ion (CH3)3NH+ 1.58x10⁻¹⁰
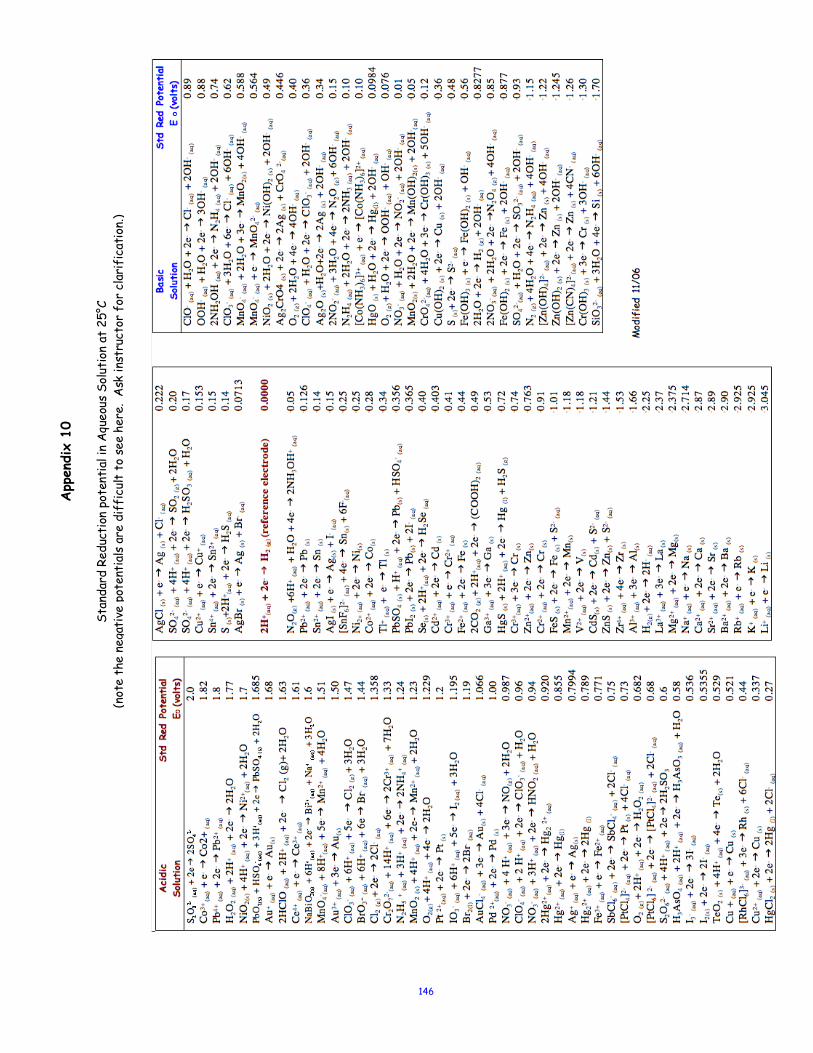
146
Appendix 11 Thermodynamic Quantities for Selected Substances at 298.15 K (25°C)
App
endi
x 10
Stan
dard
Red
ucti
on p
oten
tial
in A
queo
us S
olut
ion
at 2
5°C
(n
ote
the
nega
tive
pot
enti
als
are
diff
icul
t to
see
her
e. A
sk in
stru
ctor
for
cla
rifi
cati
on.)
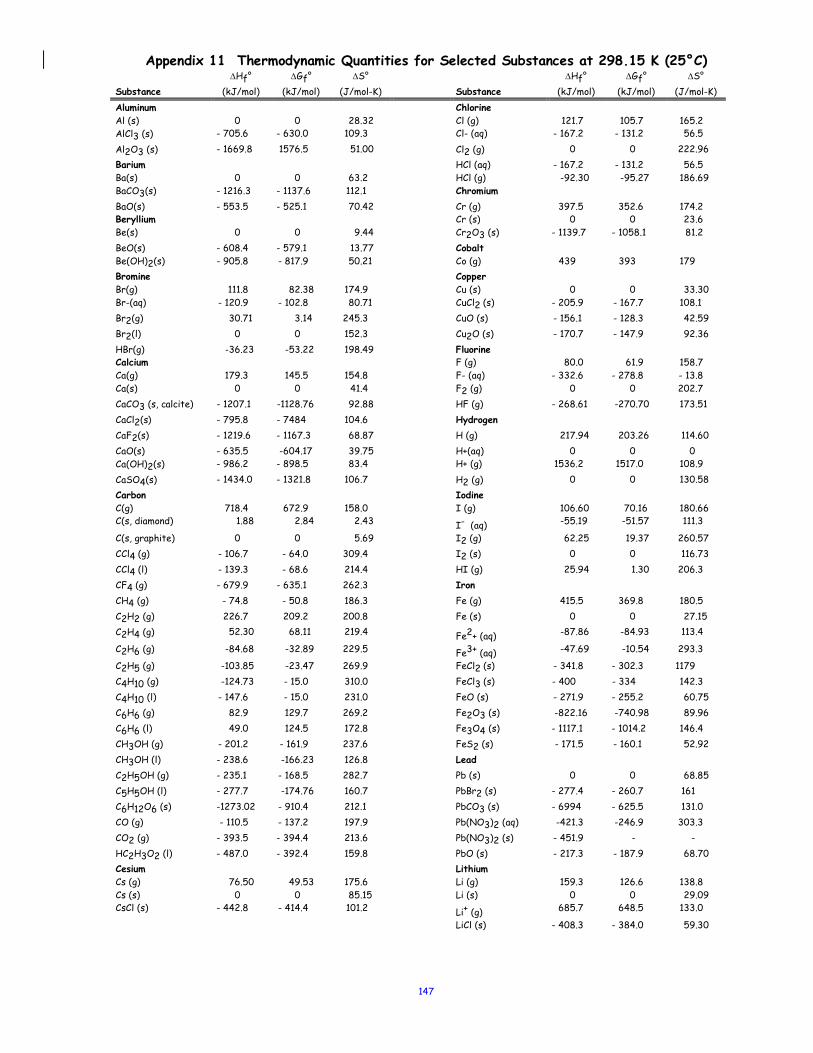
147
Appendix 11 Thermodynamic Quantities for Selected Substances at 298.15 K (25°C) DHf° DGf° DS° DHf° DGf° DS° Substance (kJ/mol) (kJ/mol) (J/mol-K) Substance (kJ/mol) (kJ/mol) (J/mol-K) Aluminum Chlorine Al (s) 0 0 28.32 Cl (g) 121.7 105.7 165.2 AlCl3 (s) - 705.6 - 630.0 109.3 Cl- (aq) - 167.2 - 131.2 56.5 Al2O3 (s) - 1669.8 1576.5 51.00 Cl2 (g) 0 0 222.96 Barium HCl (aq) - 167.2 - 131.2 56.5 Ba(s) 0 0 63.2 HCl (g) -92.30 -95.27 186.69 BaCO3(s) - 1216.3 - 1137.6 112.1 Chromium BaO(s) - 553.5 - 525.1 70.42 Cr (g) 397.5 352.6 174.2 Beryllium Cr (s) 0 0 23.6 Be(s) 0 0 9.44 Cr2O3 (s) - 1139.7 - 1058.1 81.2 BeO(s) - 608.4 - 579.1 13.77 Cobalt Be(OH)2(s) - 905.8 - 817.9 50.21 Co (g) 439 393 179 Bromine Copper Br(g) 111.8 82.38 174.9 Cu (s) 0 0 33.30 Br-(aq) - 120.9 - 102.8 80.71 CuCl2 (s) - 205.9 - 167.7 108.1 Br2(g) 30.71 3.14 245.3 CuO (s) - 156.1 - 128.3 42.59 Br2(l) 0 0 152.3 Cu2O (s) - 170.7 - 147.9 92.36 HBr(g) -36.23 -53.22 198.49 Fluorine Calcium F (g) 80.0 61.9 158.7 Ca(g) 179.3 145.5 154.8 F- (aq) - 332.6 - 278.8 - 13.8 Ca(s) 0 0 41.4 F2 (g) 0 0 202.7 CaCO3 (s, calcite) - 1207.1 -1128.76 92.88 HF (g) - 268.61 -270.70 173.51 CaCl2(s) - 795.8 - 7484 104.6 Hydrogen CaF2(s) - 1219.6 - 1167.3 68.87 H (g) 217.94 203.26 114.60 CaO(s) - 635.5 -604.17 39.75 H+(aq) 0 0 0 Ca(OH)2(s) - 986.2 - 898.5 83.4 H+ (g) 1536.2 1517.0 108.9 CaSO4(s) - 1434.0 - 1321.8 106.7 H2 (g) 0 0 130.58 Carbon Iodine C(g) 718.4 672.9 158.0 I (g) 106.60 70.16 180.66 C(s, diamond) 1.88 2.84 2.43 I- (aq) -55.19 -51.57 111.3
C(s, graphite) 0 0 5.69 I2 (g) 62.25 19.37 260.57 CCl4 (g) - 106.7 - 64.0 309.4 I2 (s) 0 0 116.73 CCl4 (l) - 139.3 - 68.6 214.4 HI (g) 25.94 1.30 206.3 CF4 (g) - 679.9 - 635.1 262.3 Iron CH4 (g) - 74.8 - 50.8 186.3 Fe (g) 415.5 369.8 180.5 C2H2 (g) 226.7 209.2 200.8 Fe (s) 0 0 27.15 C2H4 (g) 52.30 68.11 219.4 Fe2+ (aq) -87.86 -84.93 113.4
C2H6 (g) -84.68 -32.89 229.5 Fe3+ (aq) -47.69 -10.54 293.3
C2H5 (g) -103.85 -23.47 269.9 FeCl2 (s) - 341.8 - 302.3 1179 C4H10 (g) -124.73 - 15.0 310.0 FeCl3 (s) - 400 - 334 142.3 C4H10 (l) - 147.6 - 15.0 231.0 FeO (s) - 271.9 - 255.2 60.75 C6H6 (g) 82.9 129.7 269.2 Fe2O3 (s) -822.16 -740.98 89.96 C6H6 (l) 49.0 124.5 172.8 Fe3O4 (s) - 1117.1 - 1014.2 146.4 CH3OH (g) - 201.2 - 161.9 237.6 FeS2 (s) - 171.5 - 160.1 52.92 CH3OH (l) - 238.6 -166.23 126.8 Lead C2H5OH (g) - 235.1 - 168.5 282.7 Pb (s) 0 0 68.85 C5H5OH (l) - 277.7 -174.76 160.7 PbBr2 (s) - 277.4 - 260.7 161 C6H12O6 (s) -1273.02 - 910.4 212.1 PbCO3 (s) - 6994 - 625.5 131.0 CO (g) - 110.5 - 137.2 197.9 Pb(NO3)2 (aq) -421.3 -246.9 303.3 CO2 (g) - 393.5 - 394.4 213.6 Pb(NO3)2 (s) - 451.9 - - HC2H3O2 (l) - 487.0 - 392.4 159.8 PbO (s) - 217.3 - 187.9 68.70 Cesium Lithium Cs (g) 76.50 49.53 175.6 Li (g) 159.3 126.6 138.8 Cs (s) 0 0 85.15 Li (s) 0 0 29.09 CsCl (s) - 442.8 - 414.4 101.2 Li+ (g) 685.7 648.5 133.0
LiCl (s) - 408.3 - 384.0 59.30
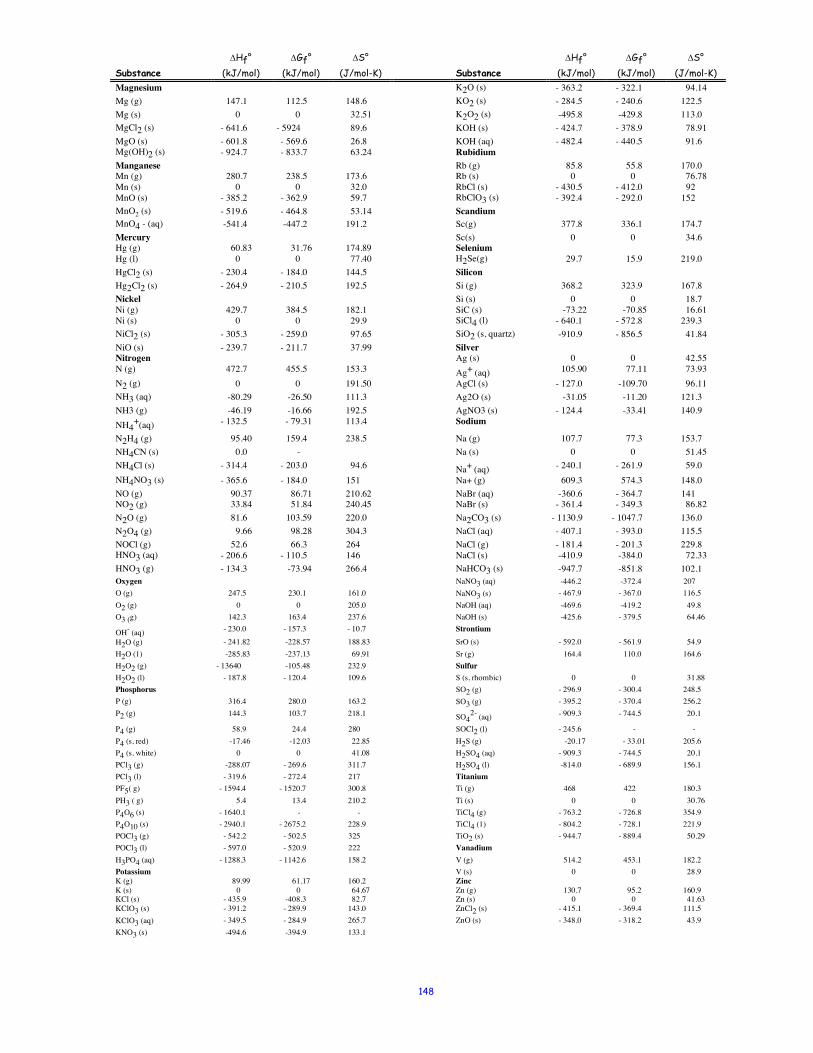
148
DHf° DGf° DS° DHf° DGf° DS° Substance (kJ/mol) (kJ/mol) (J/mol-K) Substance (kJ/mol) (kJ/mol) (J/mol-K) Magnesium K2O (s) - 363.2 - 322.1 94.14 Mg (g) 147.1 112.5 148.6 KO2 (s) - 284.5 - 240.6 122.5 Mg (s) 0 0 32.51 K2O2 (s) -495.8 -429.8 113.0 MgCl2 (s) - 641.6 - 5924 89.6 KOH (s) - 424.7 - 378.9 78.91 MgO (s) - 601.8 - 569.6 26.8 KOH (aq) - 482.4 - 440.5 91.6 Mg(OH)2 (s) - 924.7 - 833.7 63.24 Rubidium Manganese Rb (g) 85.8 55.8 170.0 Mn (g) 280.7 238.5 173.6 Rb (s) 0 0 76.78 Mn (s) 0 0 32.0 RbCl (s) - 430.5 - 412.0 92 MnO (s) - 385.2 - 362.9 59.7 RbClO3 (s) - 392.4 - 292.0 152 MnO2 (s) - 519.6 - 464.8 53.14 Scandium MnO4 - (aq) -541.4 -447.2 191.2 Sc(g) 377.8 336.1 174.7 Mercury Sc(s) 0 0 34.6 Hg (g) 60.83 31.76 174.89 Selenium Hg (l) 0 0 77.40 H2Se(g) 29.7 15.9 219.0 HgCl2 (s) - 230.4 - 184.0 144.5 Silicon Hg2Cl2 (s) - 264.9 - 210.5 192.5 Si (g) 368.2 323.9 167.8 Nickel Si (s) 0 0 18.7 Ni (g) 429.7 384.5 182.1 SiC (s) -73.22 -70.85 16.61 Ni (s) 0 0 29.9 SiCl4 (l) - 640.1 - 572.8 239.3 NiCl2 (s) - 305.3 - 259.0 97.65 SiO2 (s, quartz) -910.9 - 856.5 41.84 NiO (s) - 239.7 - 211.7 37.99 Silver Nitrogen Ag (s) 0 0 42.55 N (g) 472.7 455.5 153.3 Ag+ (aq) 105.90 77.11 73.93 N2 (g) 0 0 191.50 AgCl (s) - 127.0 -109.70 96.11 NH3 (aq) -80.29 -26.50 111.3 Ag2O (s) -31.05 -11.20 121.3 NH3 (g) -46.19 -16.66 192.5 AgNO3 (s) - 124.4 -33.41 140.9 NH4
+(aq) - 132.5 - 79.31 113.4 Sodium
N2H4 (g) 95.40 159.4 238.5 Na (g) 107.7 77.3 153.7 NH4CN (s) 0.0 - Na (s) 0 0 51.45 NH4Cl (s) - 314.4 - 203.0 94.6 Na+ (aq) - 240.1 - 261.9 59.0 NH4NO3 (s) - 365.6 - 184.0 151 Na+ (g) 609.3 574.3 148.0 NO (g) 90.37 86.71 210.62 NaBr (aq) -360.6 - 364.7 141 NO2 (g) 33.84 51.84 240.45 NaBr (s) - 361.4 - 349.3 86.82 N2O (g) 81.6 103.59 220.0 Na2CO3 (s) - 1130.9 - 1047.7 136.0 N2O4 (g) 9.66 98.28 304.3 NaCl (aq) - 407.1 - 393.0 115.5 NOCl (g) 52.6 66.3 264 NaCl (g) - 181.4 - 201.3 229.8 HNO3 (aq) - 206.6 - 110.5 146 NaCl (s) -410.9 -384.0 72.33 HNO3 (g) - 134.3 -73.94 266.4 NaHCO3 (s) -947.7 -851.8 102.1 Oxygen NaNO3 (aq) -446.2 -372.4 207 O (g) 247.5 230.1 161.0 NaNO3 (s) - 467.9 - 367.0 116.5 O2 (g) 0 0 205.0 NaOH (aq) -469.6 -419.2 49.8 O3 (g) 142.3 163.4 237.6 NaOH (s) -425.6 - 379.5 64.46
OH- (aq) - 230.0 - 157.3 - 10.7 Strontium
H2O (g) - 241.82 -228.57 188.83 SrO (s) - 592.0 - 561.9 54.9 H2O (1) -285.83 -237.13 69.91 Sr (g) 164.4 110.0 164.6 H2O2 (g) - 13640 -105.48 232.9 Sulfur H2O2 (l) - 187.8 - 120.4 109.6 S (s, rhombic) 0 0 31.88 Phosphorus SO2 (g) - 296.9 - 300.4 248.5 P (g) 316.4 280.0 163.2 SO3 (g) - 395.2 - 370.4 256.2 P2 (g) 144.3 103.7 218.1 SO4
2- (aq) - 909.3 - 744.5 20.1
P4 (g) 58.9 24.4 280 SOCl2 (l) - 245.6 - - P4 (s, red) -17.46 -12.03 22.85 H2S (g) -20.17 - 33.01 205.6 P4 (s, white) 0 0 41.08 H2SO4 (aq) - 909.3 - 744.5 20.1 PCl3 (g) -288.07 - 269.6 311.7 H2SO4 (l) -814.0 - 689.9 156.1 PCl3 (l) - 319.6 - 272.4 217 Titanium PF5( g) - 1594.4 - 1520.7 300.8 Ti (g) 468 422 180.3 PH3 ( g) 5.4 13.4 210.2 Ti (s) 0 0 30.76 P4O6 (s) - 1640.1 - - TiCl4 (g) - 763.2 - 726.8 354.9 P4O10 (s) - 2940.1 - 2675.2 228.9 TiCl4 (1) - 804.2 - 728.1 221.9 POCl3 (g) - 542.2 - 502.5 325 TiO2 (s) - 944.7 - 889.4 50.29 POCl3 (l) - 597.0 - 520.9 222 Vanadium H3PO4 (aq) - 1288.3 - 1142.6 158.2 V (g) 514.2 453.1 182.2 Potassium V (s) 0 0 28.9 K (g) 89.99 61.17 160.2 Zinc K (s) 0 0 64.67 Zn (g) 130.7 95.2 160.9 KCl (s) - 435.9 -408.3 82.7 Zn (s) 0 0 41.63 KClO3 (s) - 391.2 - 289.9 143.0 ZnCl2 (s) - 415.1 - 369.4 111.5 KClO3 (aq) - 349.5 - 284.9 265.7 ZnO (s) - 348.0 - 318.2 43.9 KNO3 (s) -494.6 -394.9 133.1
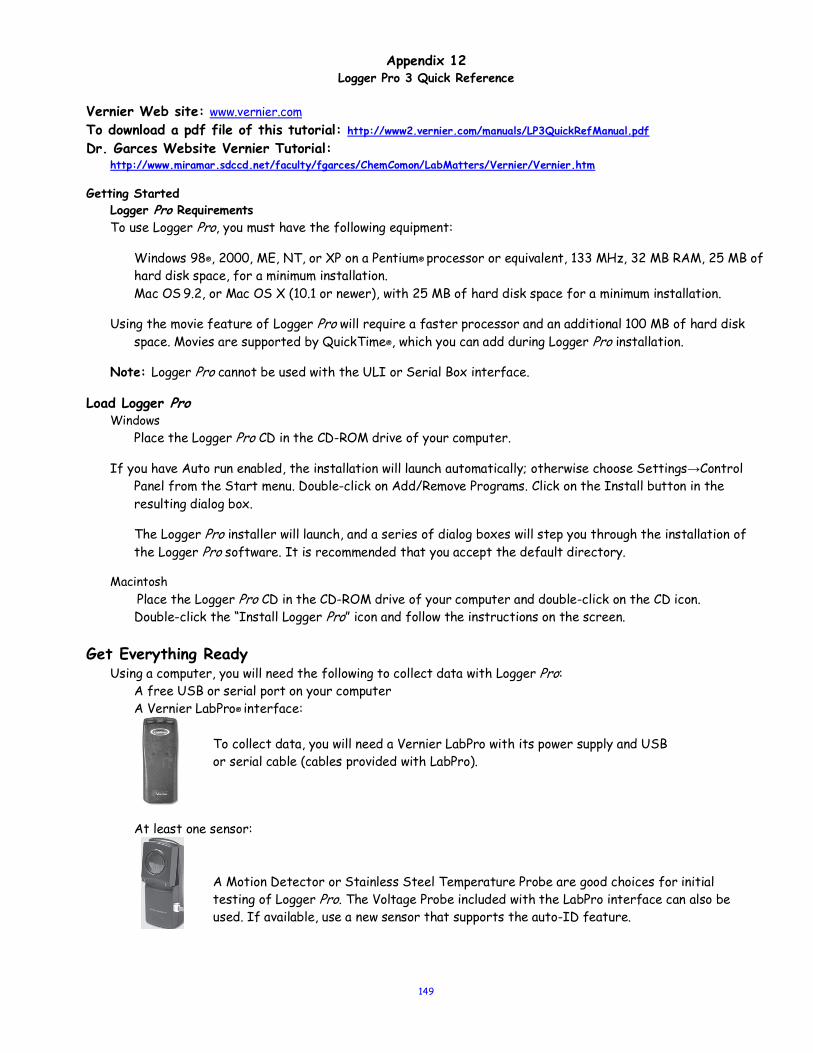
149
Appendix 12 Logger Pro 3 Quick Reference
Vernier Web site: www.vernier.com To download a pdf file of this tutorial: http://www2.vernier.com/manuals/LP3QuickRefManual.pdf
Dr. Garces Website Vernier Tutorial: http://www.miramar.sdccd.net/faculty/fgarces/ChemComon/LabMatters/Vernier/Vernier.htm
Getting Started Logger Pro Requirements To use Logger Pro, you must have the following equipment:
Windows 98®, 2000, ME, NT, or XP on a Pentium® processor or equivalent, 133 MHz, 32 MB RAM, 25 MB of hard disk space, for a minimum installation.
Mac OS 9.2, or Mac OS X (10.1 or newer), with 25 MB of hard disk space for a minimum installation.
Using the movie feature of Logger Pro will require a faster processor and an additional 100 MB of hard disk space. Movies are supported by QuickTime®, which you can add during Logger Pro installation.
Note: Logger Pro cannot be used with the ULI or Serial Box interface.
Load Logger Pro Windows Place the Logger Pro CD in the CD-ROM drive of your computer.
If you have Auto run enabled, the installation will launch automatically; otherwise choose Settings→Control Panel from the Start menu. Double-click on Add/Remove Programs. Click on the Install button in the resulting dialog box.
The Logger Pro installer will launch, and a series of dialog boxes will step you through the installation of the Logger Pro software. It is recommended that you accept the default directory.
Macintosh Place the Logger Pro CD in the CD-ROM drive of your computer and double-click on the CD icon. Double-click the “Install Logger Pro” icon and follow the instructions on the screen.
Get Everything Ready Using a computer, you will need the following to collect data with Logger Pro: A free USB or serial port on your computer A Vernier LabPro® interface:
To collect data, you will need a Vernier LabPro with its power supply and USB or serial cable (cables provided with LabPro).
At least one sensor:
A Motion Detector or Stainless Steel Temperature Probe are good choices for initial testing of Logger Pro. The Voltage Probe included with the LabPro interface can also be used. If available, use a new sensor that supports the auto-ID feature.
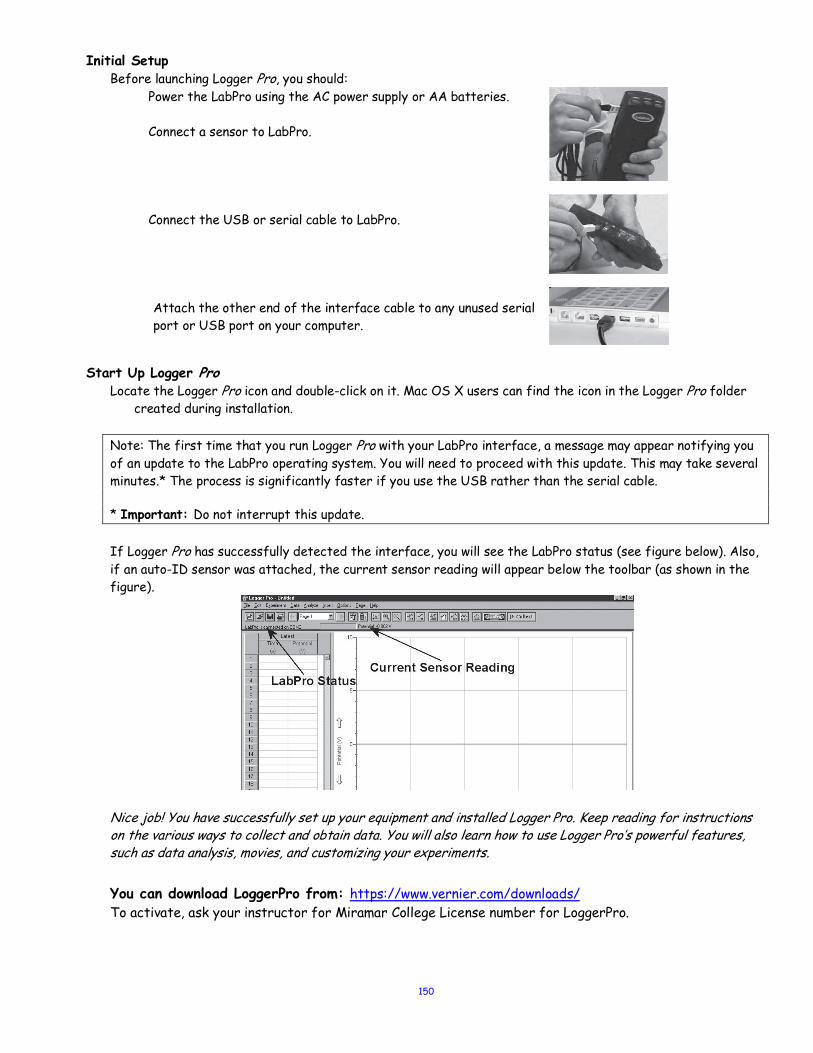
150
Initial Setup Before launching Logger Pro, you should:
Power the LabPro using the AC power supply or AA batteries. Connect a sensor to LabPro. Connect the USB or serial cable to LabPro. Attach the other end of the interface cable to any unused serial port or USB port on your computer.
Start Up Logger Pro Locate the Logger Pro icon and double-click on it. Mac OS X users can find the icon in the Logger Pro folder
created during installation. Note: The first time that you run Logger Pro with your LabPro interface, a message may appear notifying you of an update to the LabPro operating system. You will need to proceed with this update. This may take several minutes.* The process is significantly faster if you use the USB rather than the serial cable. * Important: Do not interrupt this update. If Logger Pro has successfully detected the interface, you will see the LabPro status (see figure below). Also, if an auto-ID sensor was attached, the current sensor reading will appear below the toolbar (as shown in the figure).
Nice job! You have successfully set up your equipment and installed Logger Pro. Keep reading for instructions on the various ways to collect and obtain data. You will also learn how to use Logger Pro’s powerful features, such as data analysis, movies, and customizing your experiments. You can download LoggerPro from: https://www.vernier.com/downloads/ To activate, ask your instructor for Miramar College License number for LoggerPro.
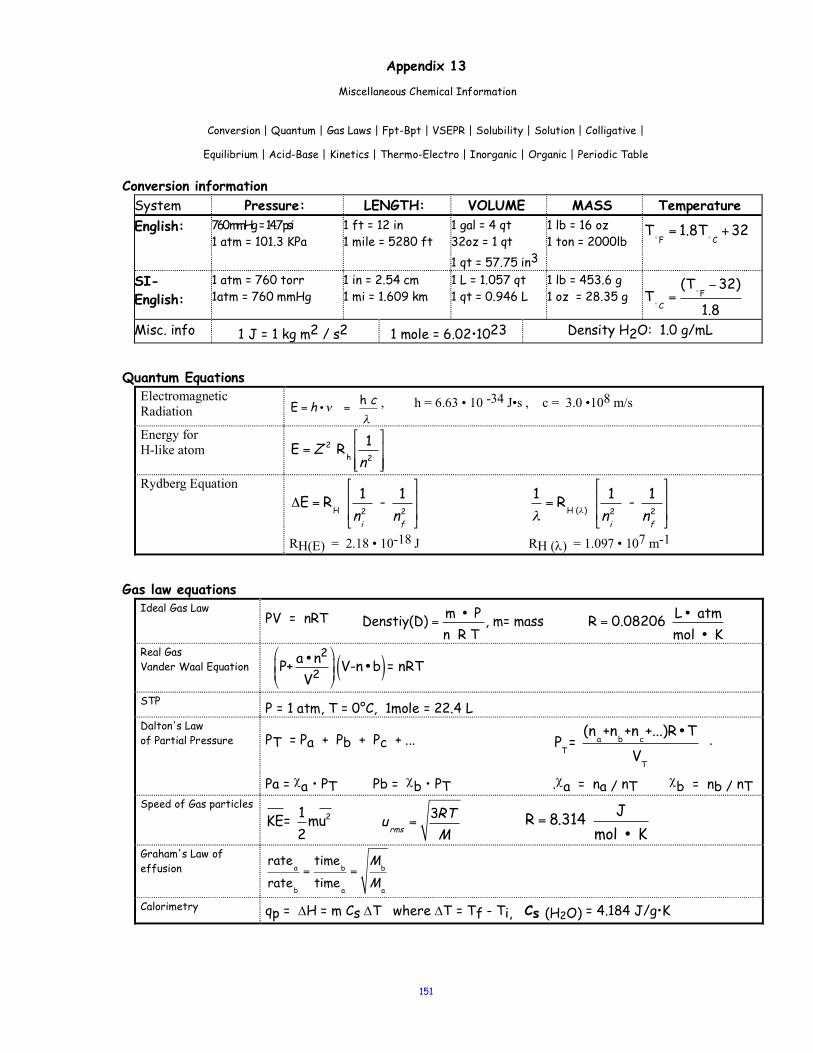
151
Appendix 13
Miscellaneous Chemical Information
Conversion | Quantum | Gas Laws | Fpt-Bpt | VSEPR | Solubility | Solution | Colligative |
Equilibrium | Acid-Base | Kinetics | Thermo-Electro | Inorganic | Organic | Periodic Table Conversion information
System Pressure: LENGTH: VOLUME MASS Temperature English: 760 mmHg = 14.7 psi
1 atm = 101.3 KPa 1 ft = 12 in 1 mile = 5280 ft
1 gal = 4 qt 32oz = 1 qt 1 qt = 57.75 in3
1 lb = 16 oz 1 ton = 2000lb
SI- English:
1 atm = 760 torr 1atm = 760 mmHg
1 in = 2.54 cm 1 mi = 1.609 km
1 L = 1.057 qt 1 qt = 0.946 L
1 lb = 453.6 g 1 oz = 28.35 g
Misc. info 1 J = 1 kg m2 / s2 1 mole = 6.02•1023 Density H2O: 1.0 g/mL
Quantum Equations Electromagnetic Radiation , h = 6.63 • 10 -34 J•s , c = 3.0 •108 m/s
Energy for H-like atom
Rydberg Equation
RH(E) = 2.18 • 10-18 J RH (l) = 1.097 • 107 m-1
Gas law equations
Ideal Gas Law PV = nRT
Real Gas Vander Waal Equation
STP P = 1 atm, T = 0°C, 1mole = 22.4 L Dalton's Law of Partial Pressure PT = Pa + Pb + Pc + ... .
Pa = ca • PT Pb = cb • PT .ca = na / nT cb = nb / nT Speed of Gas particles
Graham's Law of effusion
Calorimetry qp = DH = m Cs DT where DT = Tf - Ti, Cs (H2O) = 4.184 J/g•K
TF= 1.8T
C+32
T C=(T
F−32)
1.8
E = h •ν = h cλ
E = Z 2 Rh
1n2
!
"##
$
%&&
ΔE = RH 1ni2
- 1nf2
"
#
$$
%
&
''
1λ= R
H (λ) 1ni2
- 1nf2
!
"
##
$
%
&&
Denstiy(D) = m • Pn R T
, m= mass R = 0.08206 L • atmmol • K
P+ a •n2
V2
!
"##
$
%&& V-n•b( )= nRT
PT=
(na+n
b+n
c+...)R •T
VT
KE= 12
mu2 urms
=3RTM
R = 8.314 Jmol • K
ratea
rateb
=time
b
timea
=M
b
Ma
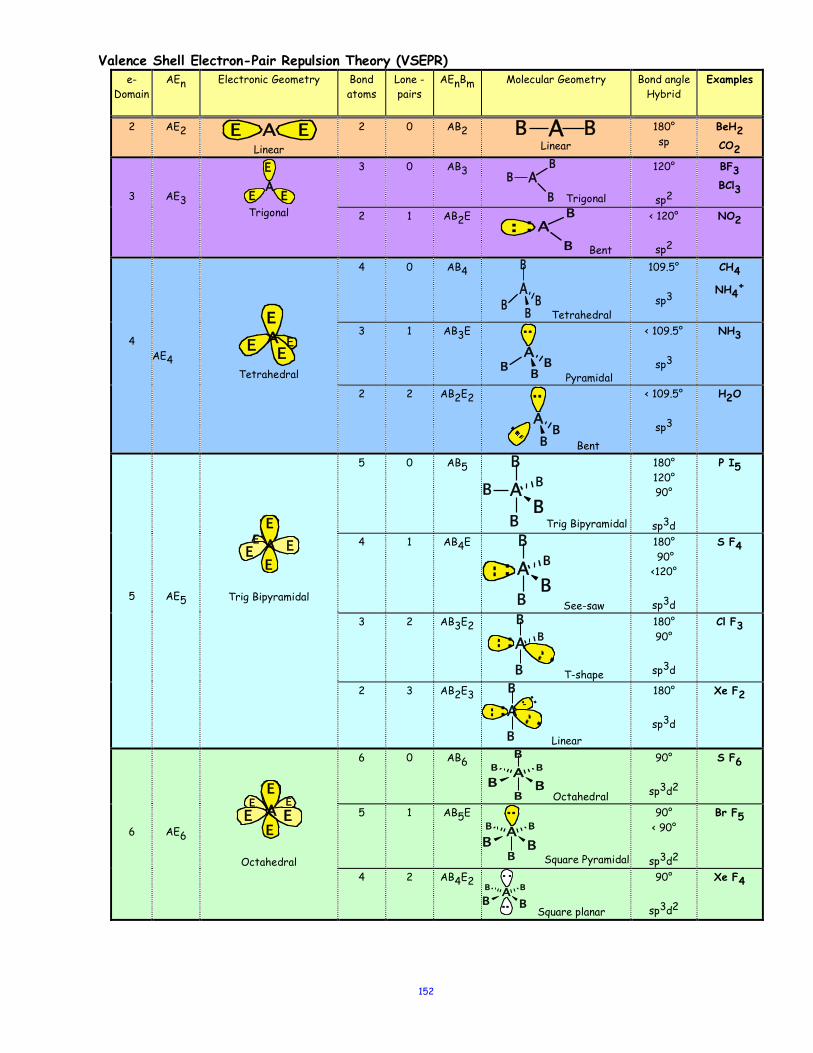
152
Valence Shell Electron-Pair Repulsion Theory (VSEPR) e-
Domain
AEn Electronic Geometry Bond atoms
Lone - pairs
AEnBm Molecular Geometry Bond angle Hybrid
Examples
2 AE2
Linear
2 0 AB2 Linear
180° sp
BeH2
CO2
3
AE3 Trigonal
3 0 AB3
Trigonal
120°
sp2
BF3 BCl3
2 1 AB2E
Bent
< 120°
sp2
NO2
4
AE4
Tetrahedral
4 0 AB4
Tetrahedral
109.5°
sp3
CH4
NH4+
3 1 AB3E
Pyramidal
< 109.5°
sp3
NH3
2 2 AB2E2
Bent
< 109.5°
sp3
H2O
5
AE5
Trig Bipyramidal
5 0 AB5
Trig Bipyramidal
180° 120° 90°
sp3d
P I5
4 1 AB4E
See-saw
180° 90° <120°
sp3d
S F4
3 2 AB3E2
T-shape
180° 90°
sp3d
Cl F3
2 3 AB2E3
Linear
180°
sp3d
Xe F2
6
AE6
Octahedral
6 0 AB6
Octahedral
90°
sp3d2
S F6
5 1 AB5E
Square Pyramidal
90° < 90°
sp3d2
Br F5
4 2 AB4E2
Square planar
90°
sp3d2
Xe F4
EE A B A B
EE
EA B A
B
B
AB
B
..
A EEE
E
BA
BB
B
BA
BB
..
AB
B..
..
A EEE
E
E
B A B
B
B
B
A B
B
B
B
... .A B
B
B
....
. .AB
B
..
E EEA
E
EE
B A B
B
B
BB
B A B
BB
B
..
B A B
BB ..
. .
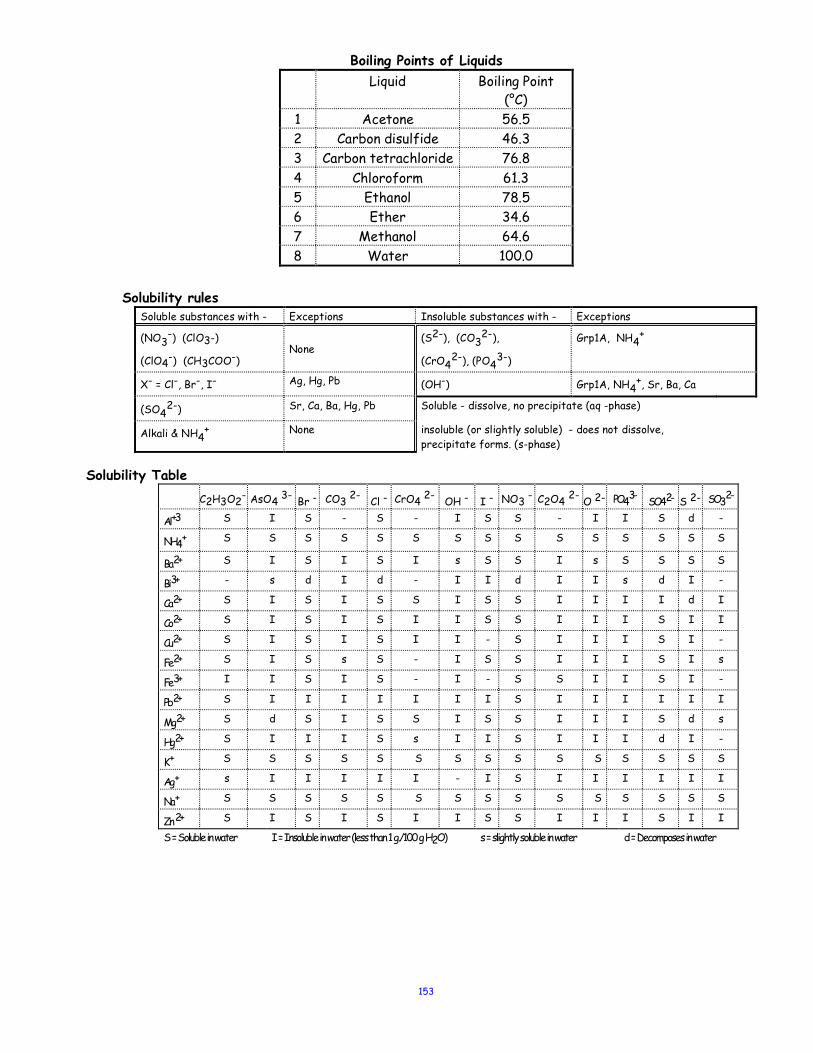
153
Boiling Points of Liquids Liquid Boiling Point
(°C) 1 Acetone 56.5 2 Carbon disulfide 46.3 3 Carbon tetrachloride 76.8 4 Chloroform 61.3 5 Ethanol 78.5 6 Ether 34.6 7 Methanol 64.6 8 Water 100.0
Solubility rules
Soluble substances with - Exceptions Insoluble substances with - Exceptions
(NO3-) (ClO3-)
(ClO4-) (CH3COO-)
None
(S2-), (CO32-),
(CrO42-), (PO4
3-)
Grp1A, NH4+
X- = Cl-, Br-, I- Ag, Hg, Pb (OH-) Grp1A, NH4+, Sr, Ba, Ca
(SO42-) Sr, Ca, Ba, Hg, Pb Soluble - dissolve, no precipitate (aq -phase)
Alkali & NH4+ None insoluble (or slightly soluble) - does not dissolve,
precipitate forms. (s-phase)
Solubility Table
C2H3O2- AsO4 3- Br - CO3 2- Cl - CrO4 2- OH - I - NO3 - C2O4 2- O 2- PO4 3- SO4 2- S 2- SO3 2-
Al +3 S I S - S - I S S - I I S d -
NH4 + S S S S S S S S S S S S S S S
Ba 2+ S I S I S I s S S I s S S S S
Bi 3+ - s d I d - I I d I I s d I -
Ca 2+ S I S I S S I S S I I I I d I
Co 2+ S I S I S I I S S I I I S I I
Cu 2+ S I S I S I I - S I I I S I -
Fe 2+ S I S s S - I S S I I I S I s
Fe 3+ I I S I S - I - S S I I S I -
Pb 2+ S I I I I I I I S I I I I I I
Mg 2+ S d S I S S I S S I I I S d s
Hg 2+ S I I I S s I I S I I I d I -
K + S S S S S S S S S S S S S S S
Ag + s I I I I I - I S I I I I I I
Na + S S S S S S S S S S S S S S S
Zn 2+ S I S I S I I S S I I I S I I
S = Soluble in water I = Insoluble in water (less than 1 g./100 g H2O) s = slightly soluble in water d = Decomposes in water
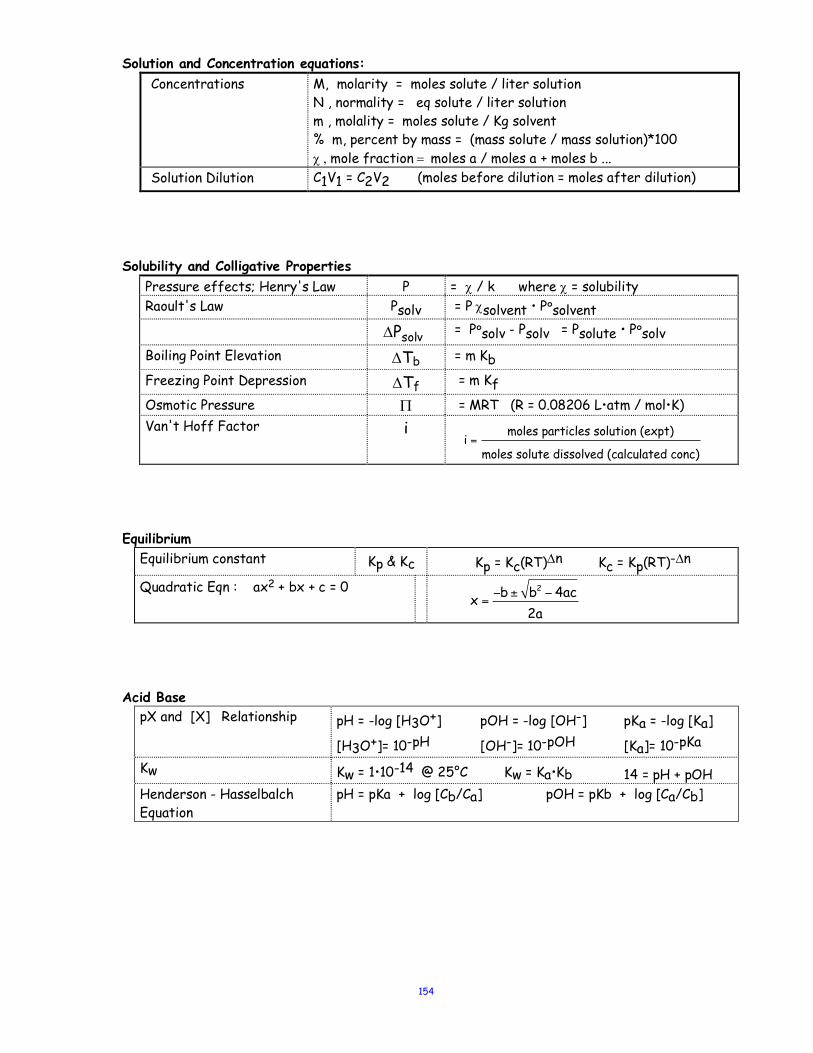
154
Solution and Concentration equations: Concentrations M, molarity = moles solute / liter solution
N , normality = eq solute / liter solution m , molality = moles solute / Kg solvent % m, percent by mass = (mass solute / mass solution)*100 c , mole fraction = moles a / moles a + moles b ...
Solution Dilution C1V1 = C2V2 (moles before dilution = moles after dilution)
Solubility and Colligative Properties
Pressure effects; Henry's Law P = c / k where c = solubility Raoult's Law Psolv = P csolvent • P°solvent DPsolv = P°solv - Psolv = Psolute • P°solv
Boiling Point Elevation DTb = m Kb
Freezing Point Depression DTf = m Kf
Osmotic Pressure P = MRT (R = 0.08206 L•atm / mol•K) Van't Hoff Factor i
Equilibrium
Equilibrium constant Kp & Kc Kp = Kc(RT)Dn Kc = Kp(RT)-Dn
Quadratic Eqn : ax2 + bx + c = 0
Acid Base
pX and [X] Relationship pH = -log [H3O+] pOH = -log [OH-] pKa = -log [Ka]
[H3O+]= 10-pH [OH-]= 10-pOH [Ka]= 10-pKa Kw Kw = 1•10-14 @ 25°C Kw = Ka•Kb 14 = pH + pOH Henderson - Hasselbalch Equation
pH = pKa + log [Cb/Ca] pOH = pKb + log [Ca/Cb]
i =moles particles solution (expt)
moles solute dissolved (calculated conc)
x = −b± b2 − 4ac2a
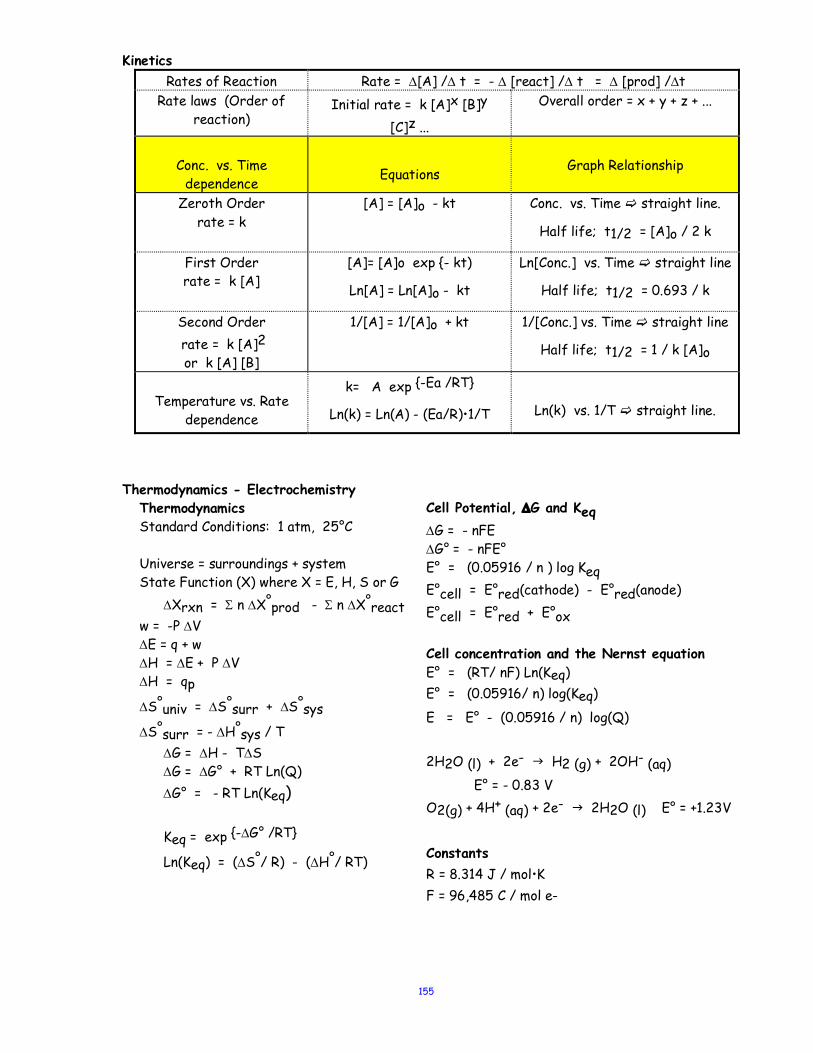
155
Kinetics Rates of Reaction Rate = D[A] /D t = - D [react] /D t = D [prod] /Dt
Rate laws (Order of reaction)
Initial rate = k [A]x [B]y [C]z ...
Overall order = x + y + z + ...
Conc. vs. Time
dependence
Equations
Graph Relationship
Zeroth Order rate = k
[A] = [A]o - kt Conc. vs. Time c straight line.
Half life; t1/2 = [A]o / 2 k
First Order rate = k [A]
[A]= [A]o exp {- kt)
Ln[A] = Ln[A]o - kt
Ln[Conc.] vs. Time c straight line
Half life; t1/2 = 0.693 / k
Second Order rate = k [A]2 or k [A] [B]
1/[A] = 1/[A]o + kt
1/[Conc.] vs. Time c straight line
Half life; t1/2 = 1 / k [A]o
Temperature vs. Rate
dependence
k= A exp {-Ea /RT}
Ln(k) = Ln(A) - (Ea/R)•1/T
Ln(k) vs. 1/T c straight line.
Thermodynamics - Electrochemistry
Thermodynamics Standard Conditions: 1 atm, 25°C Universe = surroundings + system State Function (X) where X = E, H, S or G DXrxn = S n DX°prod - S n DX°react w = -P DV DE = q + w DH = DE + P DV DH = qp
DS°univ = DS°surr + DS°sys
DS°surr = - DH°sys / T DG = DH - TDS DG = DG° + RT Ln(Q) DG° = - RT Ln(Keq) Keq = exp {-DG° /RT}
Ln(Keq) = (DS°/ R) - (DH°/ RT)
Cell Potential, DG and Keq DG = - nFE DG° = - nFE° E° = (0.05916 / n ) log Keq E°cell = E°red(cathode) - E°red(anode) E°cell = E°red + E°ox Cell concentration and the Nernst equation E° = (RT/ nF) Ln(Keq) E° = (0.05916/ n) log(Keq)
E = E° - (0.05916 / n) log(Q) 2H2O (l) + 2e- g H2 (g) + 2OH- (aq)
E° = - 0.83 V O2(g) + 4H+ (aq) + 2e- g 2H2O (l) E° = +1.23V
Constants R = 8.314 J / mol•K
F = 96,485 C / mol e-
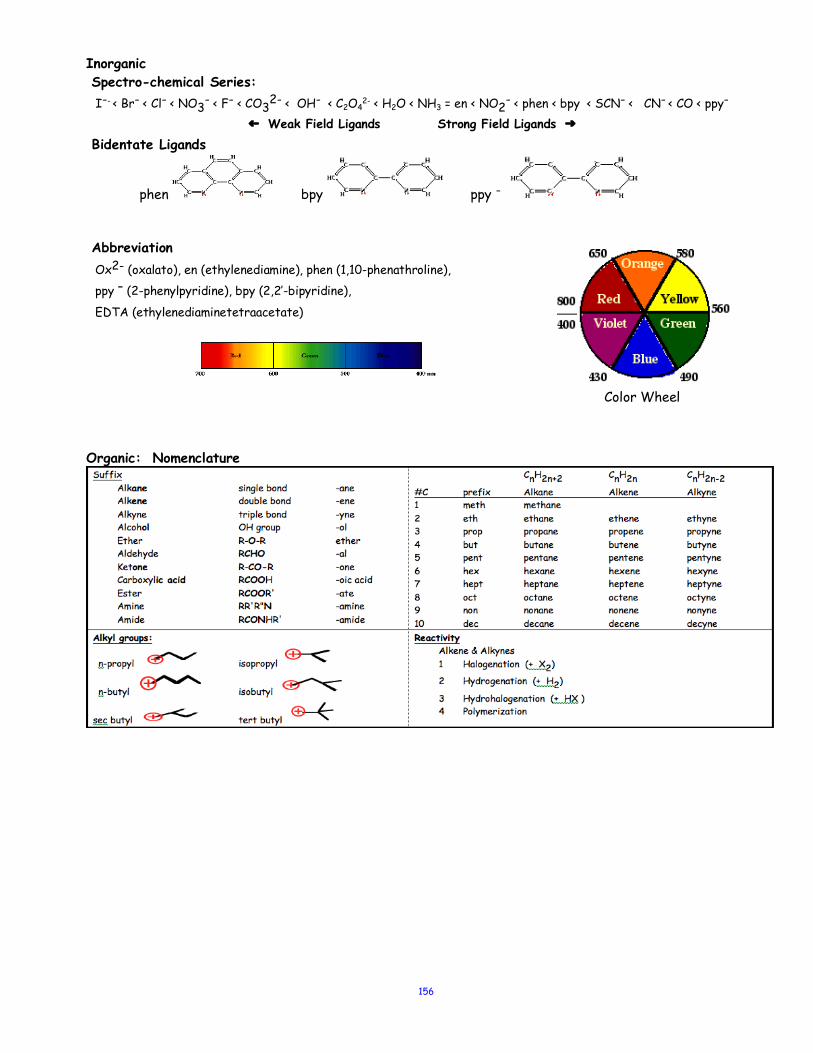
156
Inorganic Spectro-chemical Series: I-- < Br- < Cl- < NO3- < F- < CO32- < OH- < C2O4
2- < H2O < NH3 = en < NO2- < phen < bpy < SCN- < CN- < CO < ppy- f Weak Field Ligands Strong Field Ligands g
Bidentate Ligands
phen bpy ppy -
Abbreviation Ox2- (oxalato), en (ethylenediamine), phen (1,10-phenathroline), ppy – (2-phenylpyridine), bpy (2,2’-bipyridine), EDTA (ethylenediaminetetraacetate)
Color Wheel
Organic: Nomenclature
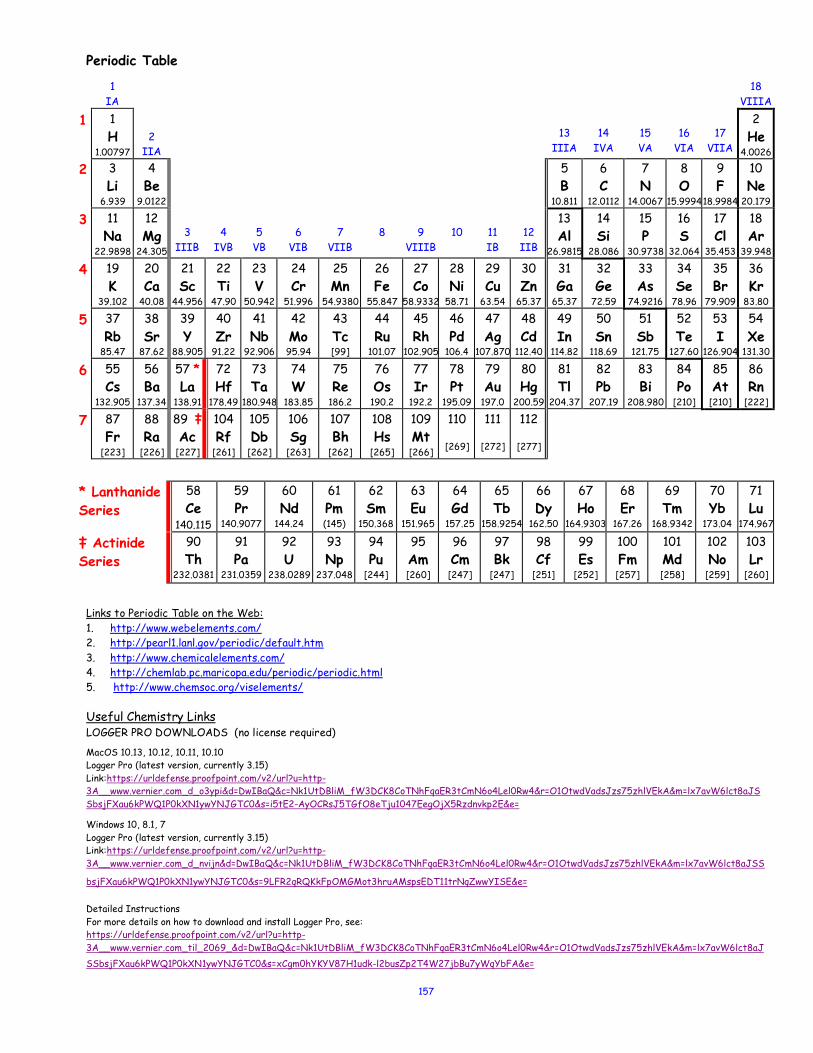
157
Periodic Table
1 IA
18 VIIIA
1 1 H
1.00797
2
IIA
13
IIIA
14
IVA
15 VA
16
VIA
17
VIIA
2 He
4.0026
2 3 Li
6.939
4 Be
9.0122
5 B
10.811
6 C
12.0112
7 N
14.0067
8 O
15.9994
9 F
18.9984
10 Ne
20.179
3 11 Na
22.9898
12 Mg
24.305
3
IIIB
4
IVB
5
VB
6
VIB
7
VIIB
8
9
VIIIB
10
11 IB
12
IIB
13 Al
26.9815
14 Si
28.086
15 P
30.9738
16 S
32.064
17 Cl
35.453
18 Ar
39.948
4 19 K
39.102
20 Ca
40.08
21 Sc
44.956
22 Ti
47.90
23 V
50.942
24 Cr
51.996
25 Mn
54.9380
26 Fe
55.847
27 Co
58.9332
28 Ni
58.71
29 Cu
63.54
30 Zn
65.37
31 Ga
65.37
32 Ge
72.59
33 As
74.9216
34 Se
78.96
35 Br
79.909
36 Kr
83.80
5 37 Rb
85.47
38 Sr
87.62
39 Y
88.905
40 Zr
91.22
41 Nb
92.906
42 Mo
95.94
43 Tc [99]
44 Ru
101.07
45 Rh
102.905
46 Pd
106.4
47 Ag
107.870
48 Cd
112.40
49 In
114.82
50 Sn
118.69
51 Sb
121.75
52 Te
127.60
53 I
126.904
54 Xe
131.30
6 55 Cs
132.905
56 Ba
137.34
57 * La
138.91
72 Hf
178.49
73 Ta
180.948
74 W
183.85
75 Re
186.2
76 Os
190.2
77 Ir
192.2
78 Pt
195.09
79 Au
197.0
80 Hg
200.59
81 Tl
204.37
82 Pb
207.19
83 Bi
208.980
84 Po
[210]
85 At
[210]
86 Rn
[222]
7 87 Fr
[223]
88 Ra
[226]
89 ‡ Ac
[227]
104 Rf
[261]
105 Db
[262]
106 Sg
[263]
107 Bh
[262]
108 Hs
[265]
109 Mt
[266]
110
[269]
111
[272]
112
[277]
* Lanthanide Series
58 Ce
140.115
59 Pr
140.9077
60 Nd
144.24
61 Pm (145)
62 Sm
150.368
63 Eu
151.965
64 Gd
157.25
65 Tb
158.9254
66 Dy
162.50
67 Ho
164.9303
68 Er
167.26
69 Tm
168.9342
70 Yb
173.04
71 Lu
174.967
‡ Actinide Series
90 Th
232.0381
91 Pa
231.0359
92 U
238.0289
93 Np
237.048
94 Pu
[244]
95 Am [260]
96 Cm
[247]
97 Bk
[247]
98 Cf
[251]
99 Es
[252]
100 Fm
[257]
101 Md [258]
102 No
[259]
103 Lr
[260]
Links to Periodic Table on the Web: 1. http://www.webelements.com/ 2. http://pearl1.lanl.gov/periodic/default.htm 3. http://www.chemicalelements.com/ 4. http://chemlab.pc.maricopa.edu/periodic/periodic.html 5. http://www.chemsoc.org/viselements/ Useful Chemistry Links LOGGER PRO DOWNLOADS (no license required)
MacOS 10.13, 10.12, 10.11, 10.10 Logger Pro (latest version, currently 3.15) Link:https://urldefense.proofpoint.com/v2/url?u=http-3A__www.vernier.com_d_o3ypi&d=DwIBaQ&c=Nk1UtDBliM_fW3DCK8CoTNhFqaER3tCmN6o4Lel0Rw4&r=O1OtwdVadsJzs75zhlVEkA&m=lx7avW6lct8aJSSbsjFXau6kPWQ1P0kXN1ywYNJGTC0&s=i5tE2-AyOCRsJ5TGfO8eTju1047EegOjX5Rzdnvkp2E&e=
Windows 10, 8.1, 7 Logger Pro (latest version, currently 3.15) Link:https://urldefense.proofpoint.com/v2/url?u=http-3A__www.vernier.com_d_nvijn&d=DwIBaQ&c=Nk1UtDBliM_fW3DCK8CoTNhFqaER3tCmN6o4Lel0Rw4&r=O1OtwdVadsJzs75zhlVEkA&m=lx7avW6lct8aJSS
bsjFXau6kPWQ1P0kXN1ywYNJGTC0&s=9LFR2qRQKkFpOMGMot3hruAMspsEDT11trNqZwwYISE&e= Detailed Instructions For more details on how to download and install Logger Pro, see: https://urldefense.proofpoint.com/v2/url?u=http-3A__www.vernier.com_til_2069_&d=DwIBaQ&c=Nk1UtDBliM_fW3DCK8CoTNhFqaER3tCmN6o4Lel0Rw4&r=O1OtwdVadsJzs75zhlVEkA&m=lx7avW6lct8aJSSbsjFXau6kPWQ1P0kXN1ywYNJGTC0&s=xCgm0hYKYV87H1udk-l2busZp2T4W27jbBu7yWqYbFA&e=

158
Related Documents