i CHEMICAL PRECIPITATION: WATER SOFTENING Submitted to: Dr. Hashsham Research Complex Engineering Department of Civil and Environmental Engineering Michigan State University East Lansing, MI 48824 Authors Dipa Dey Amanda Herzog Vidya Srinivasan ENE 806 May 2, 2007

Welcome message from author
This document is posted to help you gain knowledge. Please leave a comment to let me know what you think about it! Share it to your friends and learn new things together.
Transcript
i
CHEMICAL PRECIPITATION: WATER SOFTENING
Submitted to: Dr. Hashsham
Research Complex Engineering
Department of Civil and Environmental Engineering
Michigan State University
East Lansing, MI 48824
Authors
Dipa Dey
Amanda Herzog
Vidya Srinivasan
ENE 806
May 2, 2007
ii
Acknowledgement
We are grateful to Dr. Syed A. Hashsham for his invaluable guidance and
support during the course of this project. We would also like to thank Mr.
Joseph Nguyen for his assistance and cooperation.
Dipa Dey
May 2, 2007 Amanda Herzog
Vidya Srinivasan
iii
CONTENTS
Caption Page No.
Title page
i
Acknowledgement
ii
Contents
iii
List of Figures and Tables iv
Abstract
1
Introduction
2
Chemistry of Hardness Removal Process 3
Objective
5
Methods and Materials
5
Results and discussion
6
Conclusions
8
References
9
Appendix -1
10
RAW DATA 10
Appendix-2
11
Sample Calculation to Determine the Lime Dosage 11
Appendix-3
13
Water Softening and alkalinity Protocol 13
Appendix-4 16
Pictures 16
iv
LIST OF FIGURES AND TABLES
Caption Page No.
Figure 1: Variation of hardness, alkalinity and pH for varying lime
dosages (run1)
6
Figure 2: Variation of hardness, alkalinity and pH for varying lime
dosages (run2)
7
Figure3: Comparison of replicate runs
8
Setup and Samples with lime dosages 16
Floc. Formation 16
Filtration Setup 16
Samples After Filtration 16
Before Titration
16
Mid-Titration
16
End of Titration
16
Table 1: : Run1 for varying lime dosages
10
Table2: Run2 for varying lime dosages
10
1
ABSTRACT
Hard water can cause many problems including scaling and excessive soap consumption.
In the United States, hard water is mostly found in the mid western and western states. It
ranges between 120-250 mg/L as CaCO3 or beyond 250 mg/L as CaCO3 for very hard
waters. The acceptable water hardness range is between 60-120 mg/L as CaCO3. A water
softening experiment was conducted in replicate to observe the changes in parameters
such as total hardness, calcium hardness, magnesium hardness, alkalinity and pH with
varying dosages of lime. A lime dosage range of 30-180% of the stoichiometric amount
was chosen for the experiments. The sample used was groundwater from an East Lansing
well which had a total hardness of 332 mg/L as CaCO3. Results indicated that an increase
in lime dosage upto 90% caused a decrease in total hardness, alkalinity, magnesium
hardness and calcium hardness concentrations. However, for a lime dosage beyond
120%, the total hardness, alkalinity, and calcium hardness concentrations increased while
magnesium hardness concentration decreased to lower values. The pH continually
increased for a lime dosage between 30% and 180%.
2
INTRODUCTION
Hard water is the most common water quality problem reported by consumers throughout
the United States. More than 60 percent of the Earth’s water is ground water and hard
water is found in more than 85% of the country. The water travels through rocks and soil
picking up minerals including calcium and magnesium, ions which produce hard water.
(Water Review, Consumer report, 1990).
Hard water interferes with almost every cleaning task from laundering and dishwashing to
bathing and personal grooming (IANR, Water Quality 1996). Clothes laundered in hard
water may look dingy and feel harsh and scratchy. Dealing with hard water problems in
the home can be a nuisance. In addition, hard water affects the amount of soap and
detergent necessary for cleaning. Soap used in hard water combines with the minerals to
form a sticky soap curd. Some synthetic detergents are less effective in hard water
because the active ingredient is partially inactivated by hardness, even though it stays
dissolved. Bathing with soap in hard water leaves a film of sticky soap curd on the
skin. The film may prevent removal of dirt and bacteria. Soap curd interferes with the
return of skin to its normal, slightly acid condition, and may lead to irritation. Soap curd
on hair may make it dull, lifeless and difficult to manage.
Hard water also contributes to inefficient and costly operation of water treatment
equipment. Heated hard water forms a scale of calcium and magnesium minerals that can
contribute to the inefficient operation or failure of water treatment equipment . Pipes can
become clogged with scale which reduces water flow and ultimately results in pipe
replacement.
Hard water is not a health hazard. In fact, the National Research Council (National
Academy of Sciences) states that drinking hard water generally contributes to the total
calcium and magnesium needs in humans.
Water utilities struggling with source water that contains high amounts of calcium and/or
magnesium often turn to lime softening to remove hardness. Raising treatment pH above
9.6 converts soluble calcium bicarbonate hardness to insoluble calcium carbonate. An
increase in pH beyond 10.6 converts soluble magnesium bicarbonate to insoluble
magnesium hydroxide. Aggressive magnesium removal often requires a treatment pH of
11 or higher, a process known as excess lime softening (Jones, C; et.al. 2005).
3
Chemistry of Hardness Removal Process
During precipitation softening, calcium is removed form water in the form of CaCO3
precipitate and magnesium is removed as Mg(OH)2 precipitate (Frederick W. Pontius).
The carbonic acid concentration present and the pH play an important role in the
precipitation of these two solids. Carbonate hardness can be removed by the addition of
hydroxide ions and raising the pH by which the bicarbonate ions are converted to
carbonate form having a pH above 10. Due to the increase in carbonate concentration,
precipitates of calcium carbonate is formed. The remaining calcium, i.e. non carbonate
hardness, cannot be removed by simple adjustment of pH. Therefore, soda ash (sodium
carbonate) must be externally added to precipitate this remaining calcium. Magnesium is
removed due to the precipitation of magnesium hydroxide. In the lime soda ash process,
lime is added to raise the pH while sodium carbonate is added to provide a source of
carbonate ion.
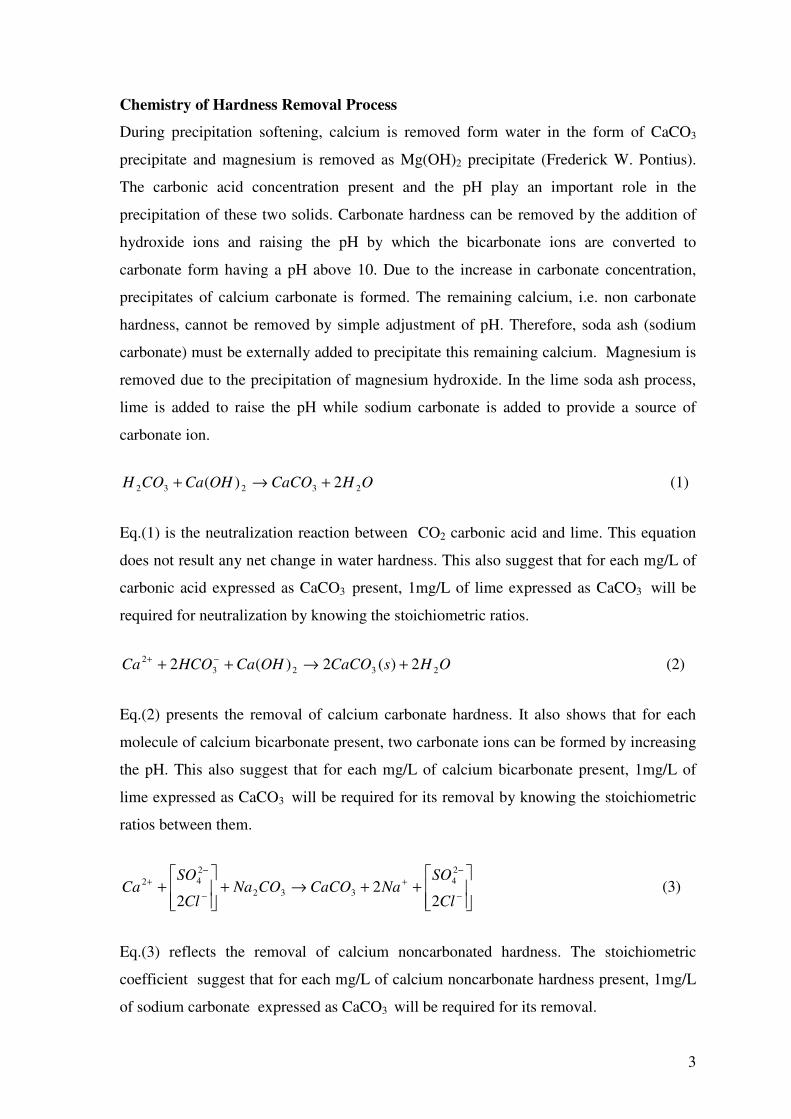
OHCaCOOHCaCOH 23232 2)( +→+ (1)
Eq.(1) is the neutralization reaction between CO2 carbonic acid and lime. This equation
does not result any net change in water hardness. This also suggest that for each mg/L of
carbonic acid expressed as CaCO3 present, 1mg/L of lime expressed as CaCO3 will be
required for neutralization by knowing the stoichiometric ratios.
OHsCaCOOHCaHCOCa 2323
2 2)(2)(2 +→++−+ (2)
Eq.(2) presents the removal of calcium carbonate hardness. It also shows that for each
molecule of calcium bicarbonate present, two carbonate ions can be formed by increasing
the pH. This also suggest that for each mg/L of calcium bicarbonate present, 1mg/L of
lime expressed as CaCO3 will be required for its removal by knowing the stoichiometric
ratios between them.
++→+
+
−
−
+
−
−
+
Cl
SONaCaCOCONa
Cl
SOCa
22
2
2
4
332
2
42 (3)
Eq.(3) reflects the removal of calcium noncarbonated hardness. The stoichiometric
coefficient suggest that for each mg/L of calcium noncarbonate hardness present, 1mg/L
of sodium carbonate expressed as CaCO3 will be required for its removal.
4
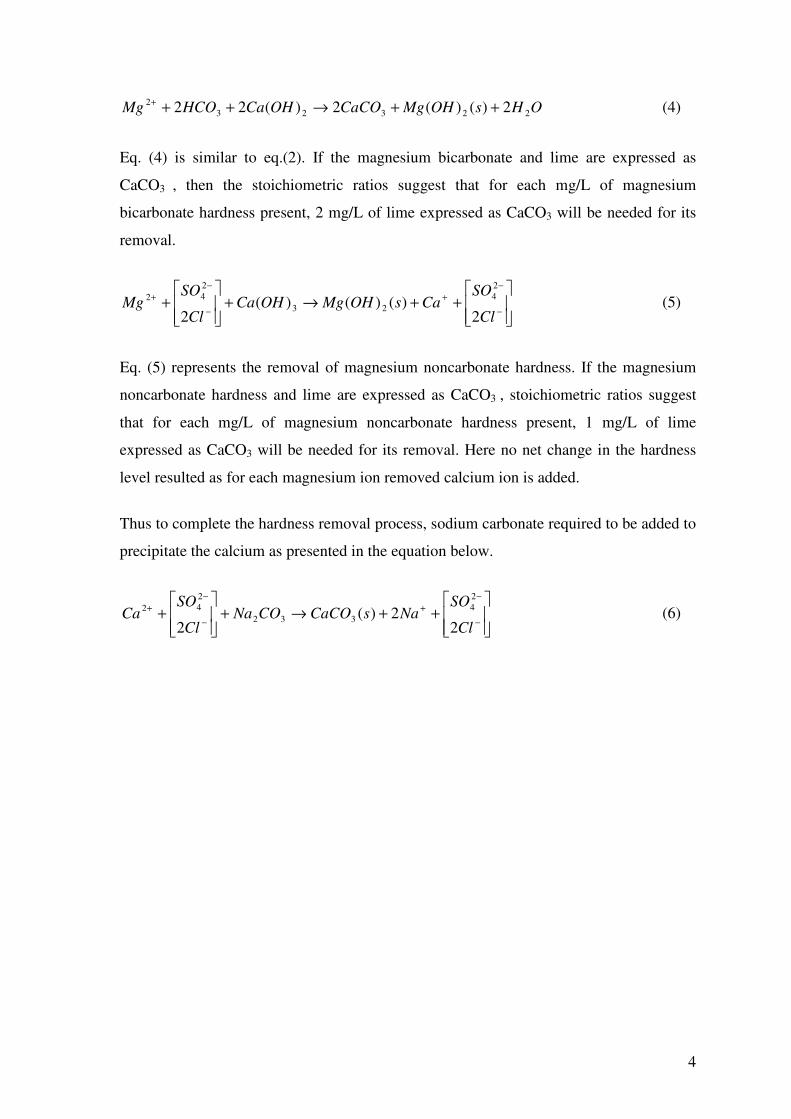
OHsOHMgCaCOOHCaHCOMg 22323
2 2)()(2)(22 ++→+++ (4)
Eq. (4) is similar to eq.(2). If the magnesium bicarbonate and lime are expressed as
CaCO3 , then the stoichiometric ratios suggest that for each mg/L of magnesium
bicarbonate hardness present, 2 mg/L of lime expressed as CaCO3 will be needed for its
removal.
++→+
+
−
−
+
−
−
+
Cl
SOCasOHMgOHCa
Cl
SOMg
2)()()(
2
2
4
23
2
42 (5)
Eq. (5) represents the removal of magnesium noncarbonate hardness. If the magnesium
noncarbonate hardness and lime are expressed as CaCO3 , stoichiometric ratios suggest
that for each mg/L of magnesium noncarbonate hardness present, 1 mg/L of lime
expressed as CaCO3 will be needed for its removal. Here no net change in the hardness
level resulted as for each magnesium ion removed calcium ion is added.
Thus to complete the hardness removal process, sodium carbonate required to be added to
precipitate the calcium as presented in the equation below.
++→+
+
−
−
+
−
−
+
Cl
SONasCaCOCONa
Cl
SOCa
22)(
2
2
4
332
2
42 (6)
5
OBJECTIVE
The objective of the water softening experiment was to determine the effects of varying
lime dosages on parameters such as total hardness, calcium hardness, magnesium
hardness, alkalinity and pH.
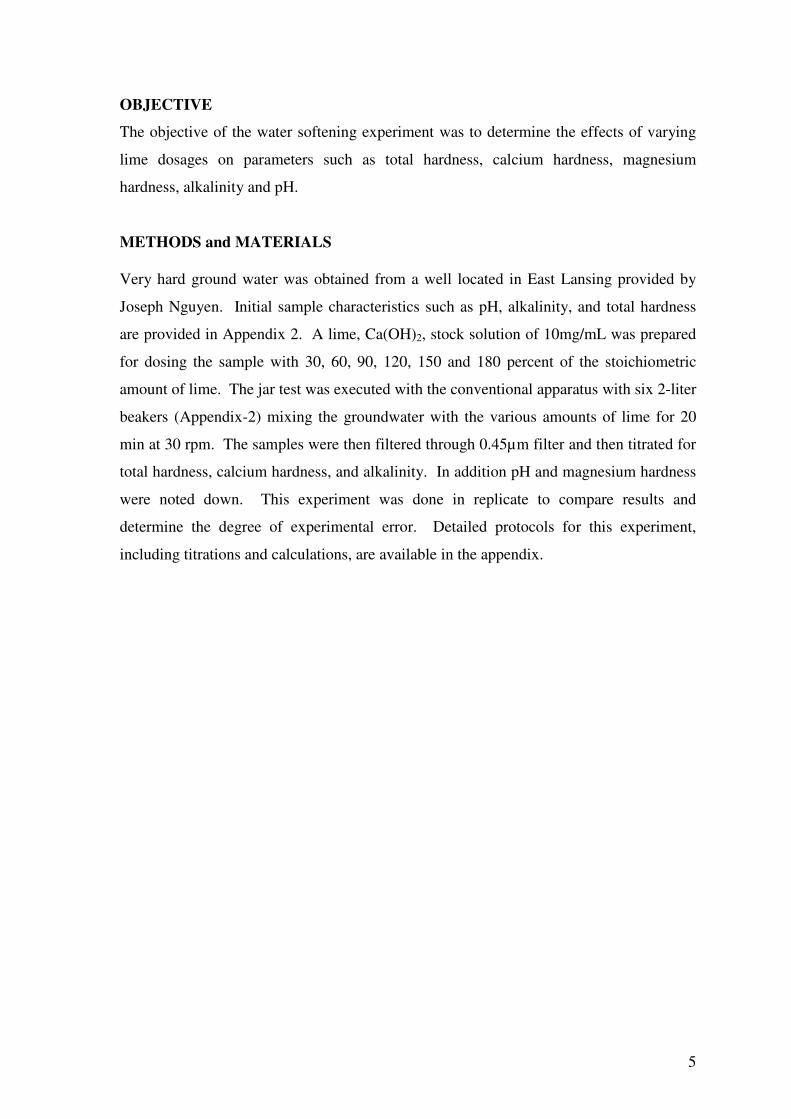
METHODS and MATERIALS
Very hard ground water was obtained from a well located in East Lansing provided by
Joseph Nguyen. Initial sample characteristics such as pH, alkalinity, and total hardness
are provided in Appendix 2. A lime, Ca(OH)2, stock solution of 10mg/mL was prepared
for dosing the sample with 30, 60, 90, 120, 150 and 180 percent of the stoichiometric
amount of lime. The jar test was executed with the conventional apparatus with six 2-liter
beakers (Appendix-2) mixing the groundwater with the various amounts of lime for 20
min at 30 rpm. The samples were then filtered through 0.45µm filter and then titrated for
total hardness, calcium hardness, and alkalinity. In addition pH and magnesium hardness
were noted down. This experiment was done in replicate to compare results and
determine the degree of experimental error. Detailed protocols for this experiment,
including titrations and calculations, are available in the appendix.

6
RESULTS and DISSCUSSION
Run 1: Water Softening
Replicate 1: Variation of Hardness, Alkalinity and pH for varying Lime dosages
Lime dose, % Stoichiometric Amount
0 20 40 60 80 100 120 140 160 180
Co
nc
en
tart
ion
, m
g/L
as
Ca
CO
3
0
50
100
150
200
250
300
350
pH
7
8
9
10
11
12
13
pH
Total Hardness
Alkalinity
Magnesium Hardness
Calcium Hardness
Figure 1: Variation of Hardness, Alkalinity and pH for varying Lime dosages (Run1)
Replicate runs for the water softening experiment evaluated parameters such as alkalinity,
hardness and pH in response to varying lime dosages from 30% to 180% of the
stoichiometric amount. In Run 1, the total hardness reached a minimum value of
approximately 160 mg/L as CaCO3 for a lime dosage of 90% (fig.1). The calcium
hardness first decreased in concentration to a minimum of 35mg/L as CaCO3 for a lime
dosage of 90% and then after that continued to increase in concentration with an increase
of lime dosage. This increase in calcium hardness was observed due to the addition of
excess lime and the absence of alkalinity caused by carbonates. The plateau between 60%
and 90% of lime is due to the presence of extra alkalinity. Any excess lime added in this
region converts bicarbonates to carbonates and those carbonates combine with the free
calcium ions to form precipitates.
Magnesium hardness concentration decreased with the increasing dosage of lime.
Alkalinity decreased to a minimum at approximately 90% of lime and increased
thereafter. This is due to the addition of lime and the precipitation of species, which
consumes alkalinity that causes the initial decrease. At lime dosages higher than 120%,
alkalinity increases due to an addition of excess lime. For every addition of lime, free
7
OH- ions are released, therefore an increase in OH
- ions is responsible for an increase in
pH.
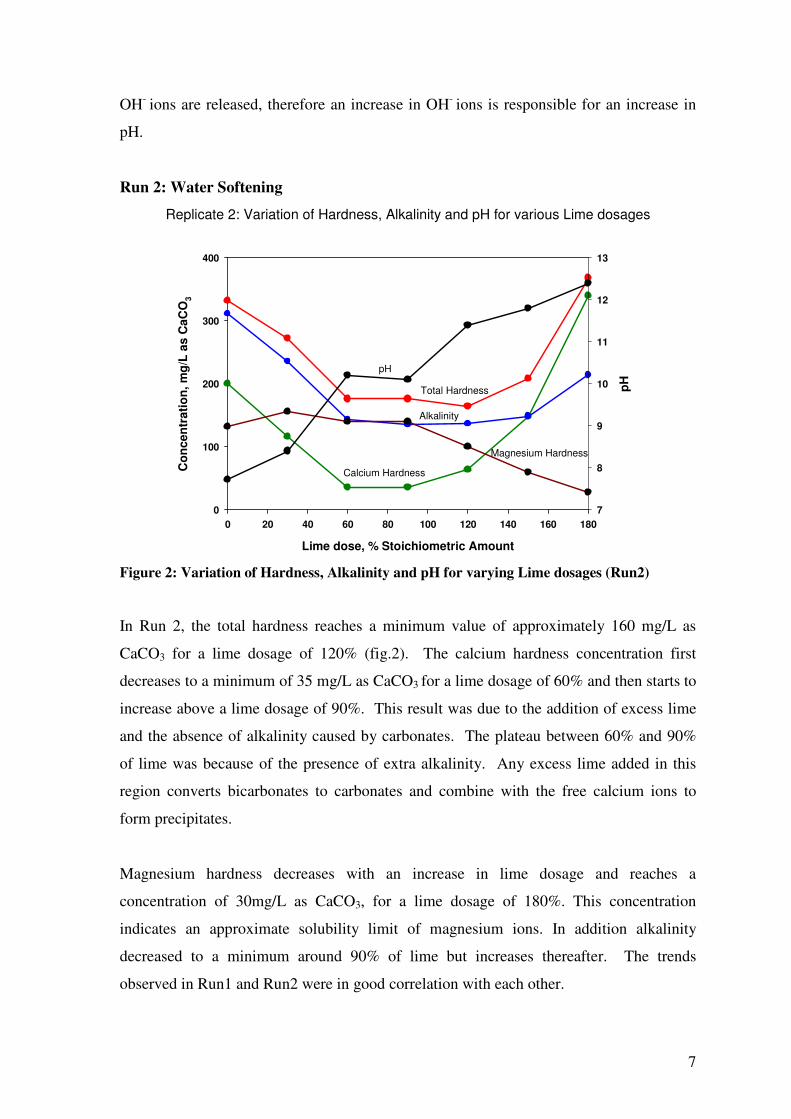
Run 2: Water Softening
Replicate 2: Variation of Hardness, Alkalinity and pH for various Lime dosages
Lime dose, % Stoichiometric Amount
0 20 40 60 80 100 120 140 160 180
Co
nc
en
tra
tio
n,
mg
/L a
s C
aC
O3
0
100
200
300
400
pH
7
8
9
10
11
12
13
pH
Total Hardness
Alkalinity
Magnesium Hardness
Calcium Hardness
Figure 2: Variation of Hardness, Alkalinity and pH for varying Lime dosages (Run2)
In Run 2, the total hardness reaches a minimum value of approximately 160 mg/L as
CaCO3 for a lime dosage of 120% (fig.2). The calcium hardness concentration first
decreases to a minimum of 35 mg/L as CaCO3 for a lime dosage of 60% and then starts to
increase above a lime dosage of 90%. This result was due to the addition of excess lime
and the absence of alkalinity caused by carbonates. The plateau between 60% and 90%
of lime was because of the presence of extra alkalinity. Any excess lime added in this
region converts bicarbonates to carbonates and combine with the free calcium ions to
form precipitates.
Magnesium hardness decreases with an increase in lime dosage and reaches a
concentration of 30mg/L as CaCO3, for a lime dosage of 180%. This concentration
indicates an approximate solubility limit of magnesium ions. In addition alkalinity
decreased to a minimum around 90% of lime but increases thereafter. The trends
observed in Run1 and Run2 were in good correlation with each other.
8
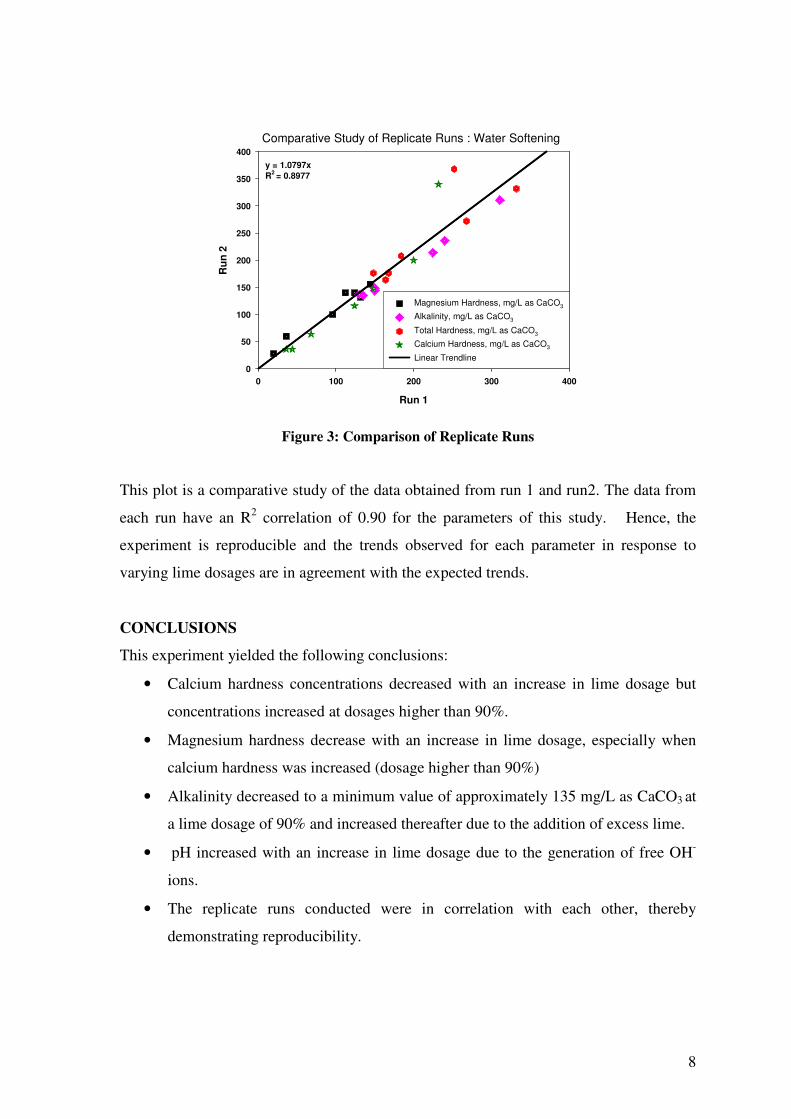
Comparative Study of Replicate Runs : Water Softening
Run 1
0 100 200 300 400
Ru
n 2
0
50
100
150
200
250
300
350
400
Magnesium Hardness, mg/L as CaCO3
Alkalinity, mg/L as CaCO3
Total Hardness, mg/L as CaCO3
Calcium Hardness, mg/L as CaCO3
Linear Trendline
y = 1.0797x
R2 = 0.8977
Figure 3: Comparison of Replicate Runs
This plot is a comparative study of the data obtained from run 1 and run2. The data from
each run have an R2 correlation of 0.90 for the parameters of this study. Hence, the
experiment is reproducible and the trends observed for each parameter in response to
varying lime dosages are in agreement with the expected trends.
CONCLUSIONS
This experiment yielded the following conclusions:
• Calcium hardness concentrations decreased with an increase in lime dosage but
concentrations increased at dosages higher than 90%.
• Magnesium hardness decrease with an increase in lime dosage, especially when
calcium hardness was increased (dosage higher than 90%)
• Alkalinity decreased to a minimum value of approximately 135 mg/L as CaCO3 at
a lime dosage of 90% and increased thereafter due to the addition of excess lime.
• pH increased with an increase in lime dosage due to the generation of free OH-
ions.
• The replicate runs conducted were in correlation with each other, thereby
demonstrating reproducibility.
9
REFERENCES
1. IANR, Water Resources management, Water Quality, 1996.
2. Jones, C; Corriagn,T; Graham, D.B; McMullen, L.D, 2005. “Reduced Lime Feed:
Effects on Operational Costs and water Quality”.
3. Syed Hashsham. Chemical Precipitation: Water Softening. Lab Report, 1993
4. Water Quality and Treatment: A Handbook of Community Water Supplies.
American Water Works Association. Fourth edition, 1990
5. Water Review, Consumer Report, Vol.5,No.1. 1990. A publication of the water
quality research council
6. Water Treatment Principles and Design. MWH. Second edition, 2005
10
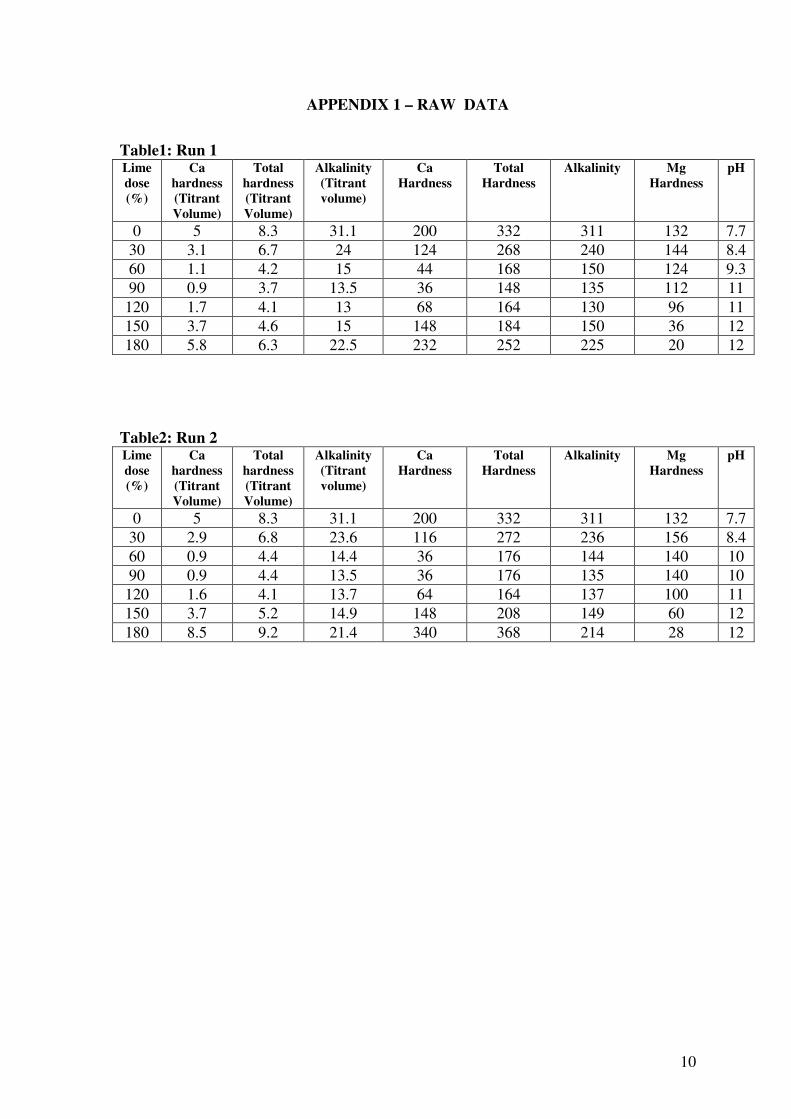
APPENDIX 1 – RAW DATA
Table1: Run 1 Lime
dose
(%)
Ca
hardness
(Titrant
Volume)
Total
hardness
(Titrant
Volume)
Alkalinity
(Titrant
volume)
Ca
Hardness
Total
Hardness
Alkalinity Mg
Hardness
pH
0 5 8.3 31.1 200 332 311 132 7.7
30 3.1 6.7 24 124 268 240 144 8.4
60 1.1 4.2 15 44 168 150 124 9.3
90 0.9 3.7 13.5 36 148 135 112 11
120 1.7 4.1 13 68 164 130 96 11
150 3.7 4.6 15 148 184 150 36 12
180 5.8 6.3 22.5 232 252 225 20 12
Table2: Run 2 Lime
dose
(%)
Ca
hardness
(Titrant
Volume)
Total
hardness
(Titrant
Volume)
Alkalinity
(Titrant
volume)
Ca
Hardness
Total
Hardness
Alkalinity Mg
Hardness
pH
0 5 8.3 31.1 200 332 311 132 7.7
30 2.9 6.8 23.6 116 272 236 156 8.4
60 0.9 4.4 14.4 36 176 144 140 10
90 0.9 4.4 13.5 36 176 135 140 10
120 1.6 4.1 13.7 64 164 137 100 11
150 3.7 5.2 14.9 148 208 149 60 12
180 8.5 9.2 21.4 340 368 214 28 12

11
APPENDIX 2 – Sample Calculation to Determine the Lime Dosage
Sample: Ground water
pH= 7.72
Ca2+
= 200 mg/L
Mg2+
= 132 mg/L
Temperature= 20 0C
Alkalinity= 311 mg/L
Total Hardness= 332 mg/L
Carbonate Hardness= Alkalinity = 311 mg/L CaCO3
Non Carbonate hardness = Total hardness- Alkalinity = 21 mg/L CaCO3
From the above values we know that it is an excess lime soda –ash process
Step1: Assume pH=7, so all alkalinity is in the bicarbonate form
a) [HCO3]=311 )61
1()
1000
1()
50
61( ××× = 6.22 x 10
-3 mol/L
b) K1=1014.8435- 3404.71 /293 – 0.032786 (293)
K1 = 4.26 x 10⁻⁷
K2= 106.498- 2909.39/293-0.02379(293)
K2 = 3.97 x 10⁻¹¹
c) 7
21
71101/1/101
1−−
×++×
=
KKα
71177 101/1097.311026.4/101
1−−−−
××++××
=
= 0.81
0 200 332
0 311
Ca2+
Mg2+
Other Cations
HCO3
Other Anions
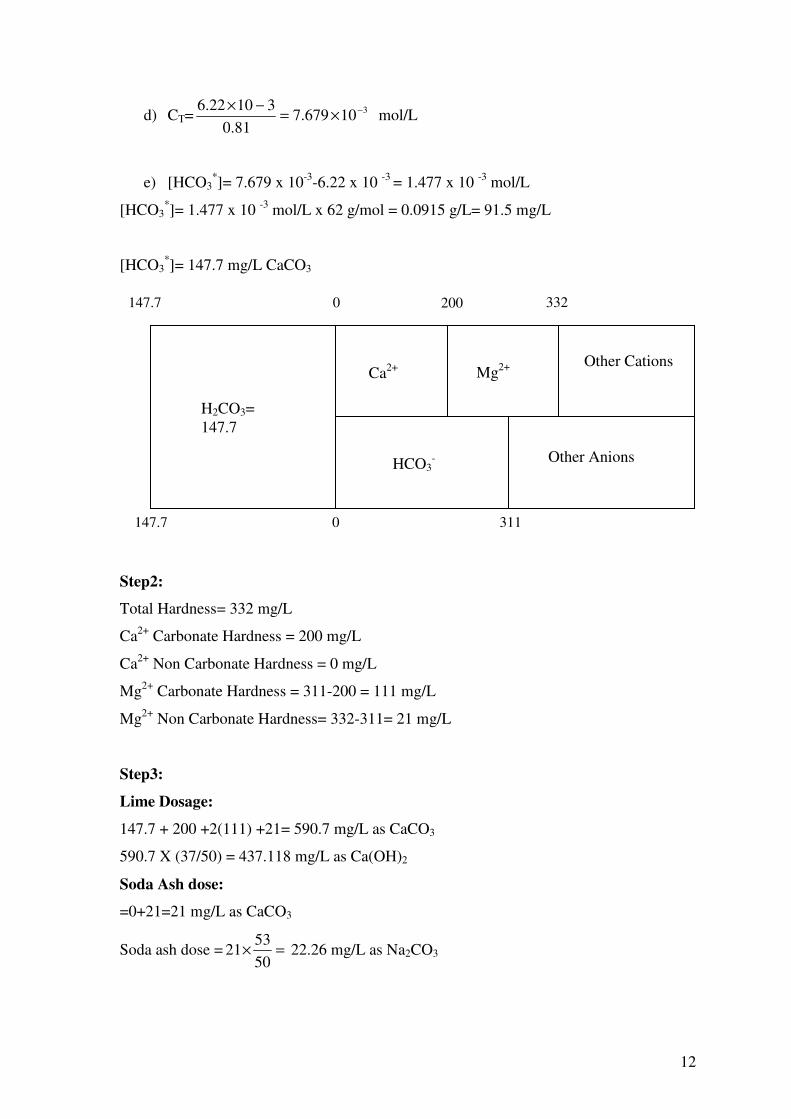
12
d) CT= 310679.781.0
31022.6−
×=−×
mol/L
e) [HCO3*]= 7.679 x 10
-3-6.22 x 10
-3 = 1.477 x 10
-3 mol/L
[HCO3*]= 1.477 x 10
-3 mol/L x 62 g/mol = 0.0915 g/L= 91.5 mg/L
[HCO3*]= 147.7 mg/L CaCO3
Step2:
Total Hardness= 332 mg/L
Ca2+
Carbonate Hardness = 200 mg/L
Ca2+
Non Carbonate Hardness = 0 mg/L
Mg2+
Carbonate Hardness = 311-200 = 111 mg/L
Mg2+
Non Carbonate Hardness= 332-311= 21 mg/L
Step3:
Lime Dosage:
147.7 + 200 +2(111) +21= 590.7 mg/L as CaCO3
590.7 X (37/50) = 437.118 mg/L as Ca(OH)2
Soda Ash dose:
=0+21=21 mg/L as CaCO3
Soda ash dose = =×
50
5321 22.26 mg/L as Na2CO3
147.7 0 311
H2CO3=
147.7
Ca2+ Mg
2+
HCO3-
Other Cations
200 332 0 147.7
Other Anions
13
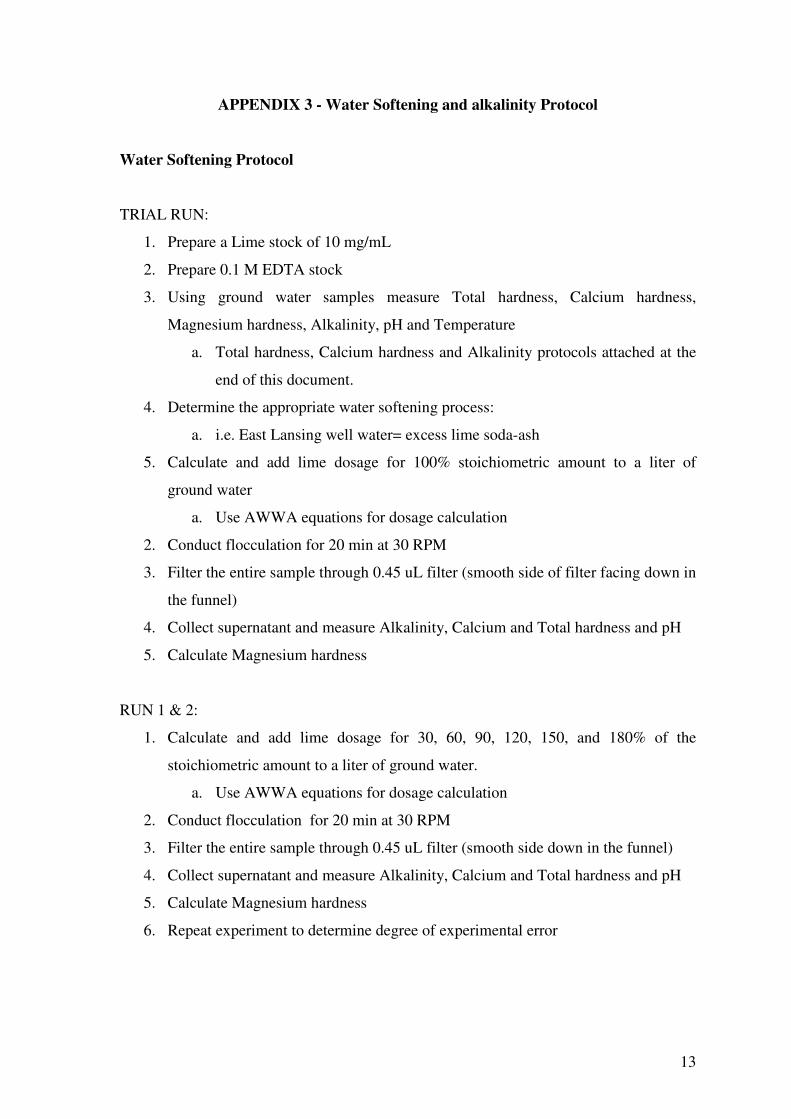
APPENDIX 3 - Water Softening and alkalinity Protocol
Water Softening Protocol
TRIAL RUN:
1. Prepare a Lime stock of 10 mg/mL
2. Prepare 0.1 M EDTA stock
3. Using ground water samples measure Total hardness, Calcium hardness,
Magnesium hardness, Alkalinity, pH and Temperature
a. Total hardness, Calcium hardness and Alkalinity protocols attached at the
end of this document.
4. Determine the appropriate water softening process:
a. i.e. East Lansing well water= excess lime soda-ash
5. Calculate and add lime dosage for 100% stoichiometric amount to a liter of
ground water
a. Use AWWA equations for dosage calculation
2. Conduct flocculation for 20 min at 30 RPM
3. Filter the entire sample through 0.45 uL filter (smooth side of filter facing down in
the funnel)
4. Collect supernatant and measure Alkalinity, Calcium and Total hardness and pH
5. Calculate Magnesium hardness
RUN 1 & 2:
1. Calculate and add lime dosage for 30, 60, 90, 120, 150, and 180% of the
stoichiometric amount to a liter of ground water.
a. Use AWWA equations for dosage calculation
2. Conduct flocculation for 20 min at 30 RPM
3. Filter the entire sample through 0.45 uL filter (smooth side down in the funnel)
4. Collect supernatant and measure Alkalinity, Calcium and Total hardness and pH
5. Calculate Magnesium hardness
6. Repeat experiment to determine degree of experimental error
14
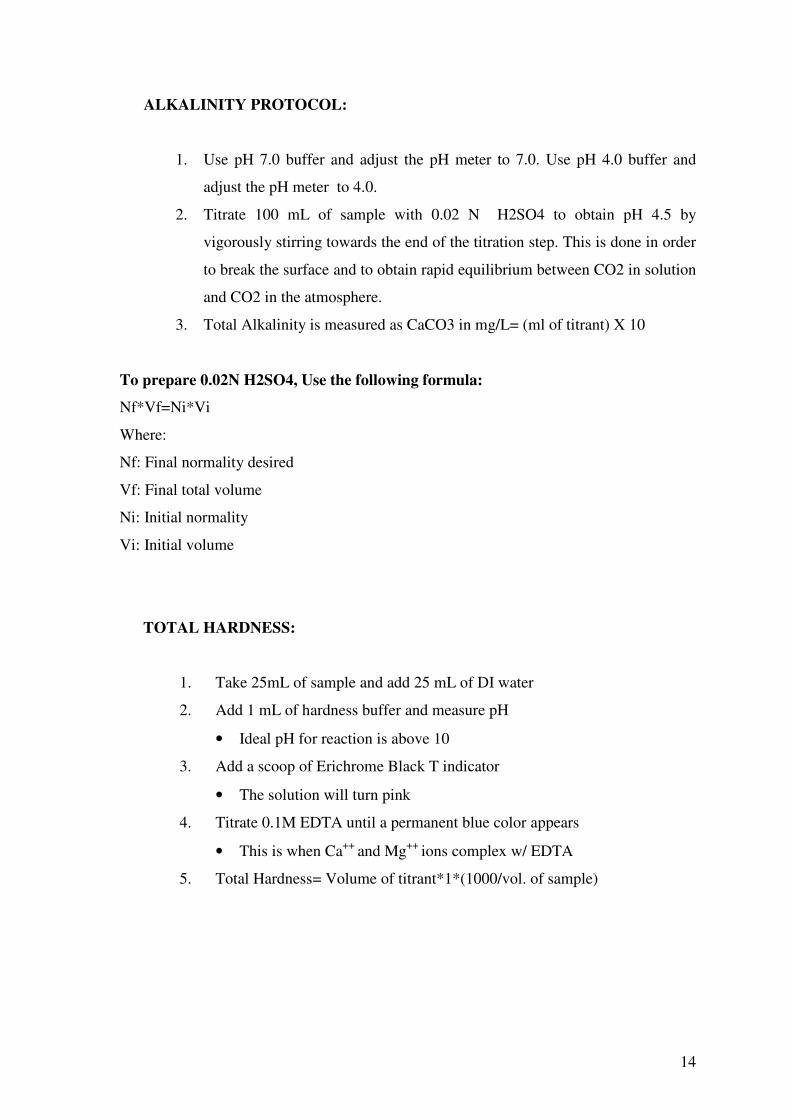
ALKALINITY PROTOCOL:
1. Use pH 7.0 buffer and adjust the pH meter to 7.0. Use pH 4.0 buffer and
adjust the pH meter to 4.0.
2. Titrate 100 mL of sample with 0.02 N H2SO4 to obtain pH 4.5 by
vigorously stirring towards the end of the titration step. This is done in order
to break the surface and to obtain rapid equilibrium between CO2 in solution
and CO2 in the atmosphere.
3. Total Alkalinity is measured as CaCO3 in mg/L= (ml of titrant) X 10
To prepare 0.02N H2SO4, Use the following formula:
Nf*Vf=Ni*Vi
Where:
Nf: Final normality desired
Vf: Final total volume
Ni: Initial normality
Vi: Initial volume
TOTAL HARDNESS:
1. Take 25mL of sample and add 25 mL of DI water
2. Add 1 mL of hardness buffer and measure pH
• Ideal pH for reaction is above 10
3. Add a scoop of Erichrome Black T indicator
• The solution will turn pink
4. Titrate 0.1M EDTA until a permanent blue color appears
• This is when Ca++
and Mg++
ions complex w/ EDTA
5. Total Hardness= Volume of titrant*1*(1000/vol. of sample)
15
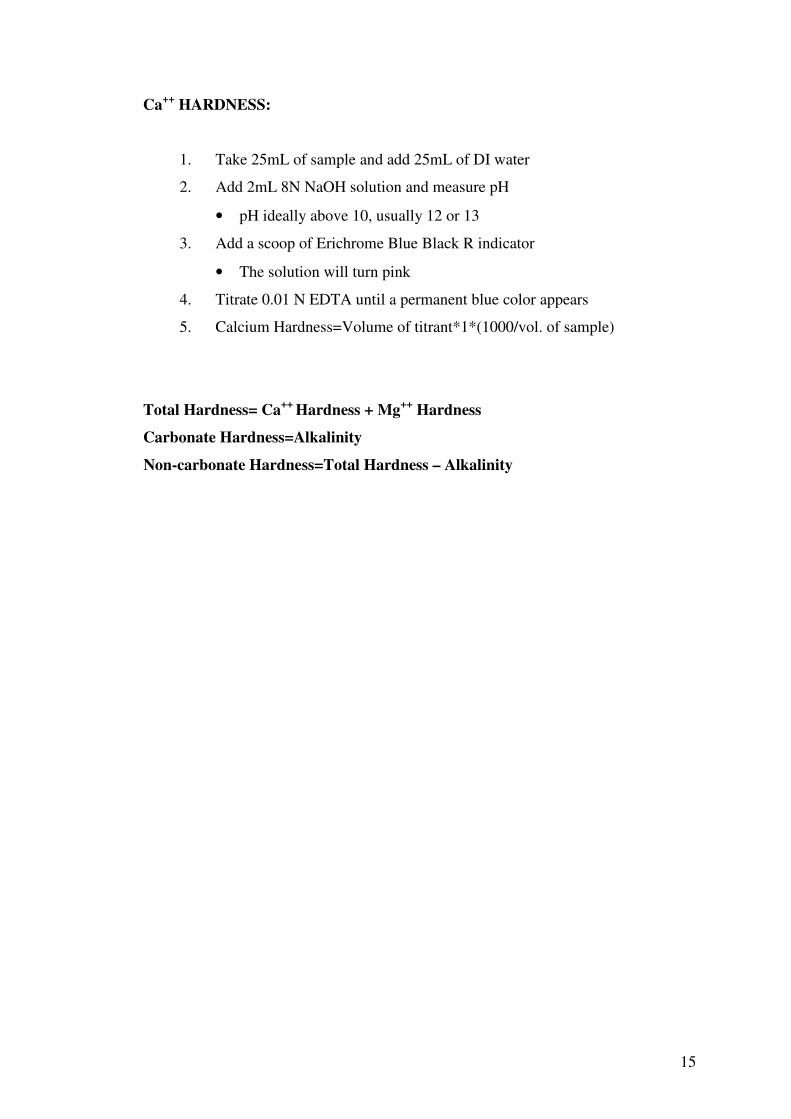
Ca++
HARDNESS:
1. Take 25mL of sample and add 25mL of DI water
2. Add 2mL 8N NaOH solution and measure pH
• pH ideally above 10, usually 12 or 13
3. Add a scoop of Erichrome Blue Black R indicator
• The solution will turn pink
4. Titrate 0.01 N EDTA until a permanent blue color appears
5. Calcium Hardness=Volume of titrant*1*(1000/vol. of sample)
Total Hardness= Ca++
Hardness + Mg++
Hardness
Carbonate Hardness=Alkalinity
Non-carbonate Hardness=Total Hardness – Alkalinity

16
APPENDIX 4 - Pictures
Setup & Samples with Lime Dosage Floc. Formation
Filtration Setup Samples After Filtration
Before Titration Mid-Titration End of Titration
Related Documents


