Chemical effects on the soil–plant system in a secondary treated wastewater irrigated coffee plantation—A pilot field study in Brazil Uwe Herpin a, *, Thomas Vincent Gloaguen a,b , Adriel Ferreira da Fonseca a,c , Ce ´lia Regina Montes a,c , Fernando Campos Mendonc ¸a a,d , Roque Passos Piveli a,e , Gerhard Breulmann f , Maria Cristina Forti a,g , Adolpho Jose ´ Melfi a a Universidade de Sa ˜ o Paulo (USP), Nu ´ cleo de Pesquisa em Geoquı ´mica e Geofı´sica da Litosfera (NUPEGEL), P.O. Box 09, 13418-900 Piracicaba (SP), Brazil b Universidade Federal da Bahia (UFBA), Nu ´ cleo de Engenharia, A ´ gua e Solos (NEAS), 44380-000 Cruz das Almas (BA), Brazil c Universidade de Sa ˜ o Paulo (USP), Centro de Energia Nuclear na Agricultura (CENA), 13400-970 Piracicaba (SP), Brazil d Empresa Brasileira de Pesquisa Agropecua ´ ria (EMBRAPA) – Pecua ´ ria Sudeste, 13560-970 Sa ˜ o Carlos (SP), Brazil e Universidade de Sa ˜ o Paulo (USP), Departamento de Engenharia Hidra ´ ulica e Sanita ´ ria, Escola Polite ´cnica, 05508-900 Sa ˜ o Paulo (SP), Brazil f Inter-American Institute for Global Change Research (IAI), 12227-010 Sa ˜ o Jose ´ dos Campos (SP), Brazil g Instituto Nacional de Pesquisas Espaciais (INPE), 12227-010 Sa ˜ o Jose ´ dos Campos (SP), Brazil agricultural water management 89 (2007) 105–115 article info Article history: Accepted 11 January 2007 Published on line 8 February 2007 Keywords: Treated wastewater Recycling Na Fertilization Nutrients Coffea arabica L. abstract Wastewater reuse in agriculture is recognized worldwide as an alternative water and/or nutrient source. In this study, secondary treated wastewater (STW) from an anaerobic/ facultative pond system at the city of Lins (Sa ˜ o Paulo State, Brazil) was used over 3 years and 7 months to irrigate coffee (Coffea arabica L.). The soil type was Typic Haplustox and the crops were fertilized according to regional agronomical recommendations. Soil and leaf samples from three sampling campaigns were used to study effects on chemical quality parameters, macronutrients and Na within the soil–plant system. Due to high Na contents of the STW applied, Na concentrations showed increases throughout the soil profile compared to untreated soil conditions. Both, low C/N ratio of STW and fertilizer amendments stimulated soil microbial activity and encouraged nitrifica- tion and mineralization of wastewater organic components and soil organic matter (SOM) causing significant decreases of SOM and cation exchange capacity (CEC). Over time exchangeable sodium percentages (ESP) in the topsoil decreased due to Na exchange mainly by Ca and Mg, resulting in increasing exchangeable calcium percentage (ECP) and exchange- able magnesium percentage (EMP) associated with lower soil sodicity. Exchanged Na and available soluble Na from STW led to both elevated ESP at depth by soil migration and high plant uptake. The superficial increase of ECP and EMP favored continuous replenishment of Ca and Mg in the soil solution leading to increasing plant contents over time. The plant Ca, Mg and K contents remained high after fertilization stop and continued STW irrigation. This is expected to be rather a short-lived effect due to a reduction of the essential cation store through constantly provided Na and insufficient supply of essential cations via STW, associated with decrease of SOM and CEC and higher sodicity risk, suggesting the need * Corresponding author. Tel.: +55 19 3429 4469. E-mail address: [email protected] (U. Herpin). available at www.sciencedirect.com journal homepage: www.elsevier.com/locate/agwat 0378-3774/$ – see front matter # 2007 Elsevier B.V. All rights reserved. doi:10.1016/j.agwat.2007.01.001

Welcome message from author
This document is posted to help you gain knowledge. Please leave a comment to let me know what you think about it! Share it to your friends and learn new things together.
Transcript
a g r i c u l t u r a l w a t e r m a n a g e m e n t 8 9 ( 2 0 0 7 ) 1 0 5 – 1 1 5
avai lab le at www.sc iencedi rec t .com
journal homepage: www.e lsev ier .com/ locate /agwat
Chemical effects on the soil–plant system in a secondarytreated wastewater irrigated coffee plantation—A pilotfield study in Brazil
Uwe Herpin a,*, Thomas Vincent Gloaguen a,b, Adriel Ferreira da Fonseca a,c,Celia Regina Montes a,c, Fernando Campos Mendonca a,d, Roque Passos Piveli a,e,Gerhard Breulmann f, Maria Cristina Forti a,g, Adolpho Jose Melfi a
aUniversidade de Sao Paulo (USP), Nucleo de Pesquisa em Geoquımica e Geofısica da Litosfera (NUPEGEL), P.O. Box 09,
13418-900 Piracicaba (SP), BrazilbUniversidade Federal da Bahia (UFBA), Nucleo de Engenharia, Agua e Solos (NEAS), 44380-000 Cruz das Almas (BA), BrazilcUniversidade de Sao Paulo (USP), Centro de Energia Nuclear na Agricultura (CENA), 13400-970 Piracicaba (SP), BrazildEmpresa Brasileira de Pesquisa Agropecuaria (EMBRAPA) – Pecuaria Sudeste, 13560-970 Sao Carlos (SP), BrazileUniversidade de Sao Paulo (USP), Departamento de Engenharia Hidraulica e Sanitaria, Escola Politecnica,
05508-900 Sao Paulo (SP), Brazilf Inter-American Institute for Global Change Research (IAI), 12227-010 Sao Jose dos Campos (SP), Brazilg Instituto Nacional de Pesquisas Espaciais (INPE), 12227-010 Sao Jose dos Campos (SP), Brazil
a r t i c l e i n f o
Article history:
Accepted 11 January 2007
Published on line 8 February 2007
Keywords:
Treated wastewater
Recycling
Na
Fertilization
Nutrients
Coffea arabica L.
a b s t r a c t
Wastewater reuse in agriculture is recognized worldwide as an alternative water and/or
nutrient source. In this study, secondary treated wastewater (STW) from an anaerobic/
facultative pond system at the city of Lins (Sao Paulo State, Brazil) was used over 3 years and
7 months to irrigate coffee (Coffea arabica L.). The soil type was Typic Haplustox and the crops
were fertilized according to regional agronomical recommendations. Soil and leaf samples
from three sampling campaigns were used to study effects on chemical quality parameters,
macronutrients and Na within the soil–plant system.
Due to high Na contents of the STW applied, Na concentrations showed increases
throughout the soil profile compared to untreated soil conditions. Both, low C/N ratio of
STW and fertilizer amendments stimulated soil microbial activity and encouraged nitrifica-
tion and mineralization of wastewater organic components and soil organic matter (SOM)
causing significant decreases of SOM and cation exchange capacity (CEC). Over time
exchangeable sodium percentages (ESP) in the topsoil decreased due to Na exchange mainly
by Ca and Mg, resulting in increasing exchangeable calcium percentage (ECP) and exchange-
able magnesium percentage (EMP) associated with lower soil sodicity. Exchanged Na and
available soluble Na from STW led to both elevated ESP at depth by soil migration and high
plant uptake. The superficial increase of ECP and EMP favored continuous replenishment of
Ca and Mg in the soil solution leading to increasing plant contents over time. The plant Ca,
Mg and K contents remained high after fertilization stop and continued STW irrigation. This
is expected to be rather a short-lived effect due to a reduction of the essential cation store
through constantly provided Na and insufficient supply of essential cations via STW,
as
associated with decre* Corresponding author. Tel.: +55 19 3429 4469.E-mail address: [email protected] (U. Herpin).
0378-3774/$ – see front matter # 2007 Elsevier B.V. All rights reservedoi:10.1016/j.agwat.2007.01.001
e of SOM and CEC and higher sodicity risk, suggesting the need
d.
of continued fertilizer use for soil maintenance. On the other hand, the plant contents of P, N
and S dropped back to deficient values when irrigated solely with STW mainly due to
insufficient replenishment by STW and the anion exchange complex (AEC) indicating moreover
the need to continue fertilization to maintain anion levels in soil for optimum plant growth. The
study revealed that STW can effectively increase water resources for irrigation, however,
innovative and adapted fertilizer/STW management strategies are needed to diminish sodicity
risks and to sustain adequate and balanced nutritional conditions in the soil–plant system.
# 2007 Elsevier B.V. All rights reserved.
a g r i c u l t u r a l w a t e r m a n a g e m e n t 8 9 ( 2 0 0 7 ) 1 0 5 – 1 1 5106
1. Introduction
Increasing population growth and industrialization in the last
decades has caused a considerable rise in wastewater
generation worldwide. The common practice to cope with
the large volume of wastewater is the discharge to surface
waters either untreated or after some preliminary treatments
(Vazquez-Montiel et al., 1996; Cameron et al., 1997; Biswas
et al., 1999). However, the need to preserve existing water
resources has led to a re-evaluation of this practice focusing
on more environmentally sound methods. Various studies
have shown that land application of treated municipal
wastewater as water and/or nutrient source for agricultural
crop production can represent a sustainable alternative (Day
and Tucker, 1959; Quin, 1978; Feigin et al., 1991; Pescod, 1992;
Al Salem, 1996; Biswas et al., 1999; Yadav et al., 2002) although
this practice is traditionally still affected by problems of public
acceptance (Pollice et al., 2004). Nevertheless, Hespanhol
(1999) emphasized that the utilization of new water sources is
crucial because an increase of sustainable agricultural
production may not be attained simply by expansion of
cultivated areas.
The latter is of particular interest for coffee production in
Brazil. Coffee growing was not dependent on irrigation
because the cultivated areas embraced solely regions without
water shortage. However, due to coffee expansion beyond
those regions, the need of alternative water resources has
become a key factor. Additionally, climate change has caused
drier conditions in the Brazilian Cerrado and productive areas
traditionally without water deficiencies, leading to the fact
that irrigation practices had to be expanded into these areas
(Matiello et al., 2002).
Although irrigation with wastewater effluents can mitigate
the utilization of natural water resources and enables the
diversion of nutrients from waterbodies by using soil and
plants as natural filters it may also result in environmental
problems. Of particular concern are long-term sustainability
issues, including nitrate contamination of groundwater,
increased salinity and increased soil sodicity with the
associated risks of soil structure deteriorations, decrease of
soil permeability and reduction of crop yields due to toxic and
osmotic effects (Bouwer and Chaney, 1974; Quirk, 1994; Oster,
1994; Bond, 1998; Biswas et al., 1999; Oster and Shainberg, 2001;
Halliwell et al., 2001).
This study investigates the feasibility of sustainable utiliza-
tion of STW in an agricultural ecosystem in Brazil. The main
objective was to examine chemical effects after STW irrigation
in a fertilized coffee plantation (Coffea arabica L.) on tropical soil
(Oxisol). Besides selected macronutrients and main chemical
parameters emphasis is given to Na as a significant constituent
of the STW and its interactions with fertilizer components. To
our knowledge, this study represents the first longer-term field
approach onmunicipal wastewater reclamation for irrigation in
coffee farming in Brazil.
2. Material and methods
2.1. Study area
The wastewater treatment system is operated near the city of
Lins (498500W, 228210S), a city of 70,000 inhabitants in north-
western Sao Paulo State, Brazil (Fig. 1). The climate is tropical
and characterized by a well-defined dry season (winter) from
May to August and a wet season (summer) from September to
April. The mean annual temperature averages 23 8C with
mean annual rainfall of 1257 mm (Ibrahim, 2002).
The experimental area is located adjacent to a wastewater
stabilization pond system consisting of three anaerobic ponds
(primary treatment), followed by three facultative ponds
(secondary treatment), which are producing about 140 L s�1
of secondary treated wastewaters. The wastewaters remain in
the anaerobic ponds for 5 days and 15 days in the facultative
ponds. One component of this system provides the effluent
which was used throughout the experiment (Fig. 1). Effluents
from the other components are discharged to a nearby river.
The coffee experiment is part of a larger-scale project on
agricultural use of STW in crop production including sugar-
cane, maize, sunflower and bermudagrass (Montes et al.,
2004). The soil is a Typic Haplustox (Soil Survey Staff, 1999),
sandy clay loam, cropped with C. arabica L. The clay
mineralogy of the area is predominately quartz and kaolinite
and subordinately hematite, magnetite and/or maghemite.
The dominance of these minerals commonly found in highly
weathered and acid tropical soils, results in a low cation
exchange capacity (CEC), according to Soil Survey Staff (1999).
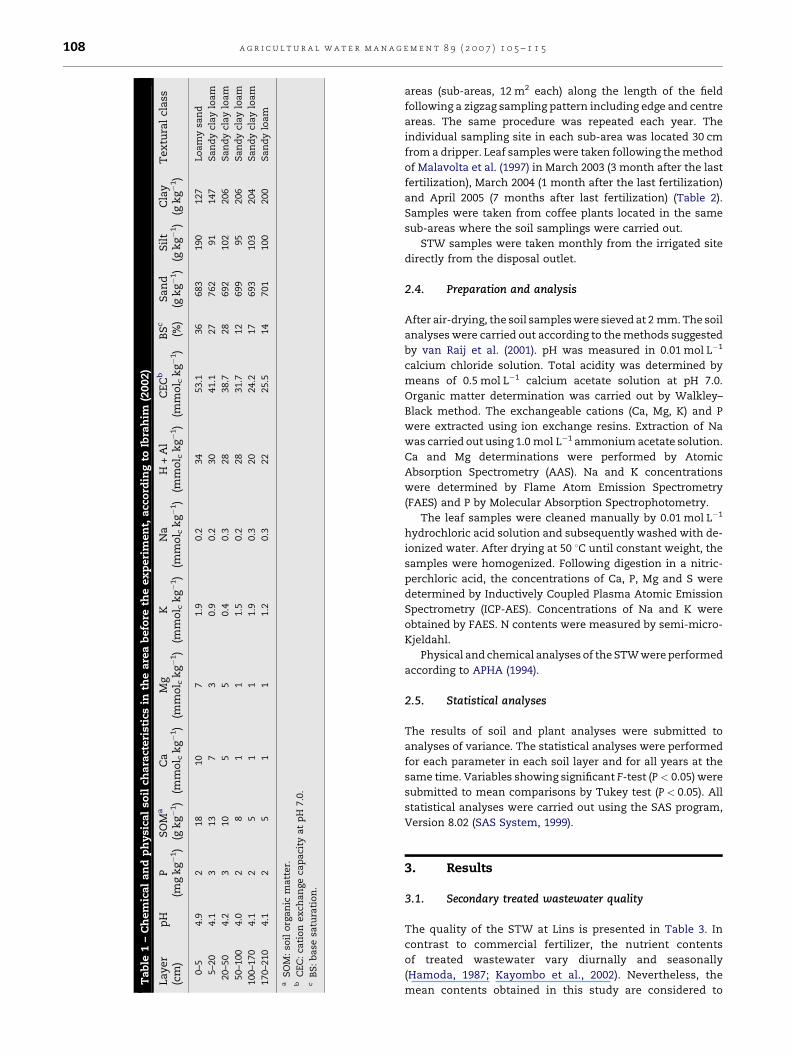
Before installation of the experiment, the area was not
cropped. Chemical soil analyses of the initial soil conditions
indicated low natural fertility with low P contents, low base
saturation (BS) and low CEC. Very low Na concentrations were
found along the entire soil profile (Ibrahim, 2002) (Table 1).
2.2. Crop and irrigation management
Coffee seedlings were planted in August 2001 at a row
spacing of 0.5 m with a distance of 2.7 m between the rows.
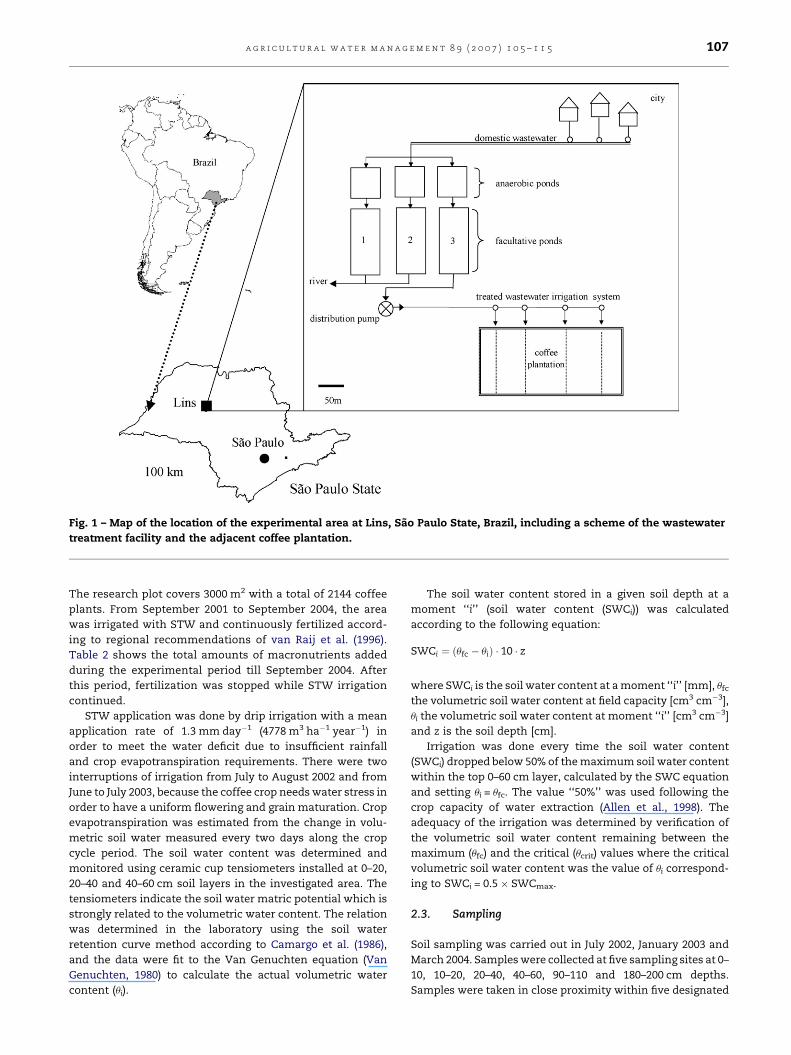
Fig. 1 – Map of the location of the experimental area at Lins, Sao Paulo State, Brazil, including a scheme of the wastewater
treatment facility and the adjacent coffee plantation.
a g r i c u l t u r a l w a t e r m a n a g e m e n t 8 9 ( 2 0 0 7 ) 1 0 5 – 1 1 5 107
The research plot covers 3000 m2 with a total of 2144 coffee
plants. From September 2001 to September 2004, the area
was irrigated with STW and continuously fertilized accord-
ing to regional recommendations of van Raij et al. (1996).
Table 2 shows the total amounts of macronutrients added
during the experimental period till September 2004. After
this period, fertilization was stopped while STW irrigation
continued.
STW application was done by drip irrigation with a mean
application rate of 1.3 mm day�1 (4778 m3 ha�1 year�1) in
order to meet the water deficit due to insufficient rainfall
and crop evapotranspiration requirements. There were two
interruptions of irrigation from July to August 2002 and from
June to July 2003, because the coffee crop needs water stress in
order to have a uniform flowering and grain maturation. Crop
evapotranspiration was estimated from the change in volu-
metric soil water measured every two days along the crop
cycle period. The soil water content was determined and
monitored using ceramic cup tensiometers installed at 0–20,
20–40 and 40–60 cm soil layers in the investigated area. The
tensiometers indicate the soil water matric potential which is
strongly related to the volumetric water content. The relation
was determined in the laboratory using the soil water
retention curve method according to Camargo et al. (1986),
and the data were fit to the Van Genuchten equation (Van
Genuchten, 1980) to calculate the actual volumetric water
content (ui).
The soil water content stored in a given soil depth at a
moment ‘‘i’’ (soil water content (SWCi)) was calculated
according to the following equation:
SWCi ¼ ðufc � uiÞ � 10 � z
where SWCi is the soil water content at a moment ‘‘i’’ [mm], ufc
the volumetric soil water content at field capacity [cm3 cm�3],
ui the volumetric soil water content at moment ‘‘i’’ [cm3 cm�3]
and z is the soil depth [cm].
Irrigation was done every time the soil water content
(SWCi) dropped below 50% of the maximum soil water content
within the top 0–60 cm layer, calculated by the SWC equation
and setting ui = ufc. The value ‘‘50%’’ was used following the
crop capacity of water extraction (Allen et al., 1998). The
adequacy of the irrigation was determined by verification of
the volumetric soil water content remaining between the
maximum (ufc) and the critical (ucrit) values where the critical
volumetric soil water content was the value of ui correspond-
ing to SWCi = 0.5 � SWCmax.
2.3. Sampling
Soil sampling was carried out in July 2002, January 2003 and
March 2004. Samples were collected at five sampling sites at 0–
10, 10–20, 20–40, 40–60, 90–110 and 180–200 cm depths.
Samples were taken in close proximity within five designated
Ta
ble
1–
Ch
em
ica
la
nd
ph
ysi
cal
soil
cha
ract
eri
stic
sin
the
are
ab
efo
reth
eex
peri
men
t,a
cco
rdin
gto
Ibra
him
(20
02
)
La
yer
(cm
)p
HP
(mg
kg�
1)
SO
Ma
(gk
g�
1)
Ca
(mm
ol c
kg�
1)
Mg
(mm
ol c
kg�
1)
K(m
mo
l ck
g�
1)
Na
(mm
ol c
kg�
1)
H+
Al
(mm
ol c
kg�
1)
CE
Cb
(mm
ol c
kg�
1)
BS
c
(%)
Sa
nd
(gk
g�
1)
Sil
t(g
kg�
1)
Cla
y(g
kg�
1)
Tex
tura
lcl
ass
0–5
4.9
218
10
71.9
0.2
34
53.1
36
683
190
127
Lo
am
ysa
nd
5–2
04.1
313
73
0.9
0.2
30
41.1
27
762
91
147
Sa
nd
ycl
ay
loa
m
20–5
04.2
310
55
0.4
0.3
28
38.7
28
692
102
206
Sa
nd
ycl
ay
loa
m
50–1
00
4.0
28
11
1.5
0.2
28
31.7
12
699
95
206
Sa
nd
ycl
ay
loa
m
100–1
70
4.1
25
11
1.9
0.3
20
24.2
17
693
103
204
Sa
nd
ycl
ay
loa
m
170–2
10
4.1
25
11
1.2
0.3
22
25.5
14
701
100
200
Sa
nd
ylo
am
aS
OM
:so
ilo
rga
nic
ma
tter.
bC
EC
:ca
tio
nex
cha
nge
cap
aci
tya
tp
H7.0
.c
BS
:b
ase
satu
rati
on
.
a g r i c u l t u r a l w a t e r m a n a g e m e n t 8 9 ( 2 0 0 7 ) 1 0 5 – 1 1 5108
areas (sub-areas, 12 m2 each) along the length of the field
following a zigzag sampling pattern including edge and centre
areas. The same procedure was repeated each year. The
individual sampling site in each sub-area was located 30 cm
from a dripper. Leaf samples were taken following the method
of Malavolta et al. (1997) in March 2003 (3 month after the last
fertilization), March 2004 (1 month after the last fertilization)
and April 2005 (7 months after last fertilization) (Table 2).
Samples were taken from coffee plants located in the same
sub-areas where the soil samplings were carried out.
STW samples were taken monthly from the irrigated site
directly from the disposal outlet.
2.4. Preparation and analysis
After air-drying, the soil samples were sieved at 2 mm. The soil
analyses were carried out according to the methods suggested
by van Raij et al. (2001). pH was measured in 0.01 mol L�1
calcium chloride solution. Total acidity was determined by
means of 0.5 mol L�1 calcium acetate solution at pH 7.0.
Organic matter determination was carried out by Walkley–
Black method. The exchangeable cations (Ca, Mg, K) and P
were extracted using ion exchange resins. Extraction of Na
was carried out using 1.0 mol L�1 ammonium acetate solution.
Ca and Mg determinations were performed by Atomic
Absorption Spectrometry (AAS). Na and K concentrations
were determined by Flame Atom Emission Spectrometry
(FAES) and P by Molecular Absorption Spectrophotometry.
The leaf samples were cleaned manually by 0.01 mol L�1
hydrochloric acid solution and subsequently washed with de-
ionized water. After drying at 50 8C until constant weight, the
samples were homogenized. Following digestion in a nitric-
perchloric acid, the concentrations of Ca, P, Mg and S were
determined by Inductively Coupled Plasma Atomic Emission
Spectrometry (ICP-AES). Concentrations of Na and K were
obtained by FAES. N contents were measured by semi-micro-
Kjeldahl.
Physical and chemical analyses of the STW were performed
according to APHA (1994).
2.5. Statistical analyses
The results of soil and plant analyses were submitted to
analyses of variance. The statistical analyses were performed
for each parameter in each soil layer and for all years at the
same time. Variables showing significant F-test (P < 0.05) were
submitted to mean comparisons by Tukey test (P < 0.05). All
statistical analyses were carried out using the SAS program,
Version 8.02 (SAS System, 1999).
3. Results
3.1. Secondary treated wastewater quality
The quality of the STW at Lins is presented in Table 3. In
contrast to commercial fertilizer, the nutrient contents
of treated wastewater vary diurnally and seasonally
(Hamoda, 1987; Kayombo et al., 2002). Nevertheless, the
mean contents obtained in this study are considered to
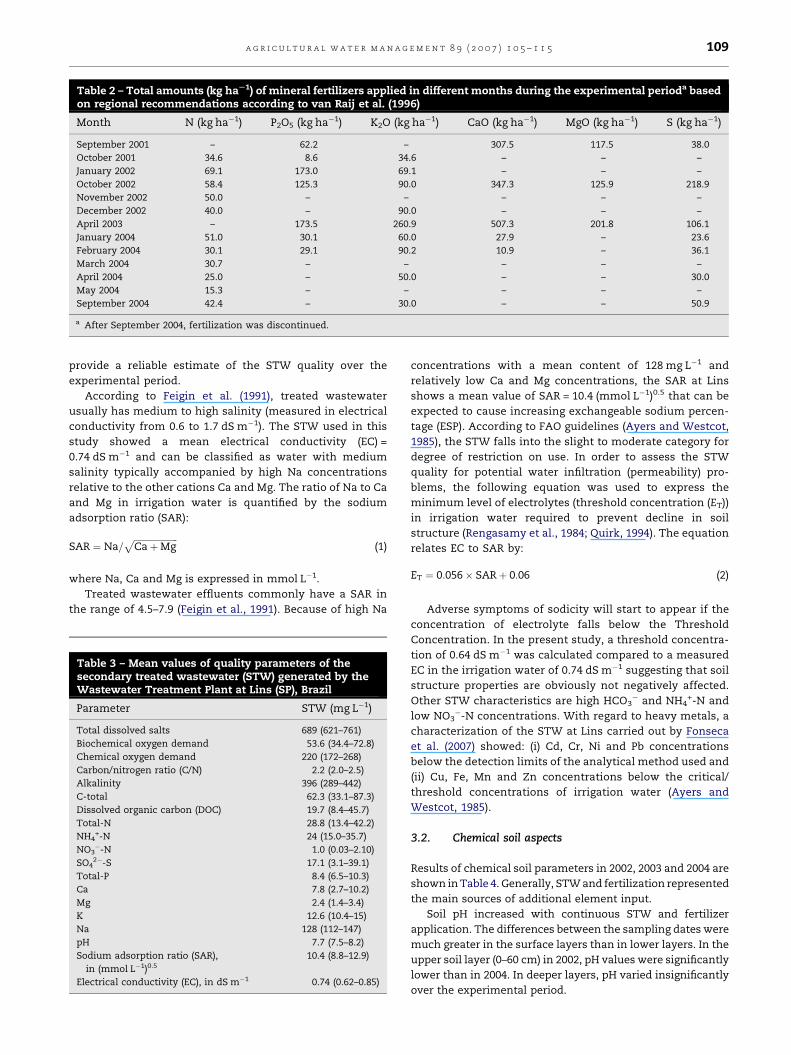
Table 2 – Total amounts (kg haS1) of mineral fertilizers applied in different months during the experimental perioda basedon regional recommendations according to van Raij et al. (1996)
Month N (kg ha�1) P2O5 (kg ha�1) K2O (kg ha�1) CaO (kg ha�1) MgO (kg ha�1) S (kg ha�1)
September 2001 – 62.2 – 307.5 117.5 38.0
October 2001 34.6 8.6 34.6 – – –
January 2002 69.1 173.0 69.1 – – –
October 2002 58.4 125.3 90.0 347.3 125.9 218.9
November 2002 50.0 – – – – –
December 2002 40.0 – 90.0 – – –
April 2003 – 173.5 260.9 507.3 201.8 106.1
January 2004 51.0 30.1 60.0 27.9 – 23.6
February 2004 30.1 29.1 90.2 10.9 – 36.1
March 2004 30.7 – – – – –
April 2004 25.0 – 50.0 – – 30.0
May 2004 15.3 – – – – –
September 2004 42.4 – 30.0 – – 50.9
a After September 2004, fertilization was discontinued.
a g r i c u l t u r a l w a t e r m a n a g e m e n t 8 9 ( 2 0 0 7 ) 1 0 5 – 1 1 5 109
provide a reliable estimate of the STW quality over the
experimental period.
According to Feigin et al. (1991), treated wastewater
usually has medium to high salinity (measured in electrical
conductivity from 0.6 to 1.7 dS m�1). The STW used in this
study showed a mean electrical conductivity (EC) =
0.74 dS m�1 and can be classified as water with medium
salinity typically accompanied by high Na concentrations
relative to the other cations Ca and Mg. The ratio of Na to Ca
and Mg in irrigation water is quantified by the sodium
adsorption ratio (SAR):
SAR ¼ Na=ffiffiffiffiffiffiffiffiffiffiffiffiffiffiffiffiffiffiffiffiCaþMg
p(1)
where Na, Ca and Mg is expressed in mmol L�1.
Treated wastewater effluents commonly have a SAR in
the range of 4.5–7.9 (Feigin et al., 1991). Because of high Na
Table 3 – Mean values of quality parameters of thesecondary treated wastewater (STW) generated by theWastewater Treatment Plant at Lins (SP), Brazil
Parameter STW (mg L�1)
Total dissolved salts 689 (621–761)
Biochemical oxygen demand 53.6 (34.4–72.8)
Chemical oxygen demand 220 (172–268)
Carbon/nitrogen ratio (C/N) 2.2 (2.0–2.5)
Alkalinity 396 (289–442)
C-total 62.3 (33.1–87.3)
Dissolved organic carbon (DOC) 19.7 (8.4–45.7)
Total-N 28.8 (13.4–42.2)
NH4+-N 24 (15.0–35.7)
NO3�-N 1.0 (0.03–2.10)
SO42�-S 17.1 (3.1–39.1)
Total-P 8.4 (6.5–10.3)
Ca 7.8 (2.7–10.2)
Mg 2.4 (1.4–3.4)
K 12.6 (10.4–15)
Na 128 (112–147)
pH 7.7 (7.5–8.2)
Sodium adsorption ratio (SAR),
in (mmol L�1)0.5
10.4 (8.8–12.9)
Electrical conductivity (EC), in dS m�1 0.74 (0.62–0.85)
concentrations with a mean content of 128 mg L�1 and
relatively low Ca and Mg concentrations, the SAR at Lins
shows a mean value of SAR = 10.4 (mmol L�1)0.5 that can be
expected to cause increasing exchangeable sodium percen-
tage (ESP). According to FAO guidelines (Ayers and Westcot,
1985), the STW falls into the slight to moderate category for
degree of restriction on use. In order to assess the STW
quality for potential water infiltration (permeability) pro-
blems, the following equation was used to express the
minimum level of electrolytes (threshold concentration (ET))
in irrigation water required to prevent decline in soil
structure (Rengasamy et al., 1984; Quirk, 1994). The equation
relates EC to SAR by:
ET ¼ 0:056� SARþ 0:06 (2)
Adverse symptoms of sodicity will start to appear if the
concentration of electrolyte falls below the Threshold
Concentration. In the present study, a threshold concentra-
tion of 0.64 dS m�1 was calculated compared to a measured
EC in the irrigation water of 0.74 dS m�1 suggesting that soil
structure properties are obviously not negatively affected.
Other STW characteristics are high HCO3� and NH4
+-N and
low NO3�-N concentrations. With regard to heavy metals, a
characterization of the STW at Lins carried out by Fonseca
et al. (2007) showed: (i) Cd, Cr, Ni and Pb concentrations
below the detection limits of the analytical method used and
(ii) Cu, Fe, Mn and Zn concentrations below the critical/
threshold concentrations of irrigation water (Ayers and
Westcot, 1985).
3.2. Chemical soil aspects
Results of chemical soil parameters in 2002, 2003 and 2004 are
shown in Table 4. Generally, STW and fertilization represented
the main sources of additional element input.
Soil pH increased with continuous STW and fertilizer
application. The differences between the sampling dates were
much greater in the surface layers than in lower layers. In the
upper soil layer (0–60 cm) in 2002, pH values were significantly
lower than in 2004. In deeper layers, pH varied insignificantly
over the experimental period.
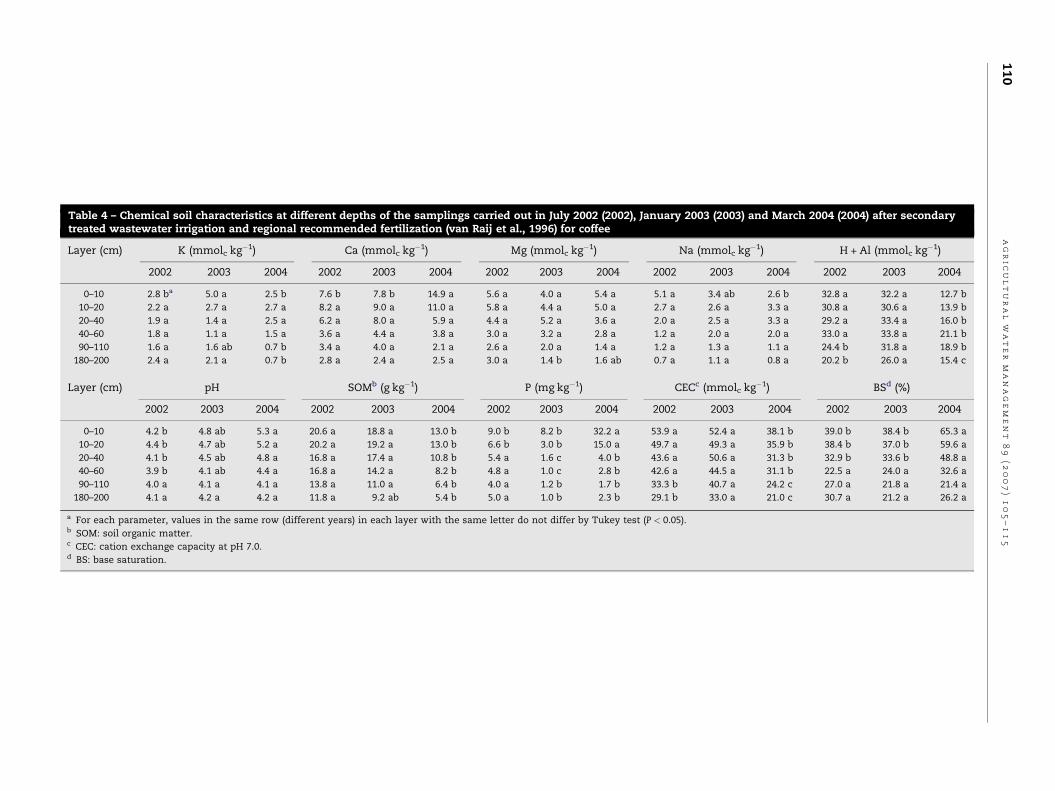
Table 4 – Chemical soil characteristics at different depths of the samplings carried out in July 2002 (2002), January 2003 (2003) and March 2004 (2004) after secondarytreated wastewater irrigation and regional recommended fertilization (van Raij et al., 1996) for coffee
Layer (cm) K (mmolc kg�1) Ca (mmolc kg�1) Mg (mmolc kg�1) Na (mmolc kg�1) H + Al (mmolc kg�1)
2002 2003 2004 2002 2003 2004 2002 2003 2004 2002 2003 2004 2002 2003 2004
0–10 2.8 ba 5.0 a 2.5 b 7.6 b 7.8 b 14.9 a 5.6 a 4.0 a 5.4 a 5.1 a 3.4 ab 2.6 b 32.8 a 32.2 a 12.7 b
10–20 2.2 a 2.7 a 2.7 a 8.2 a 9.0 a 11.0 a 5.8 a 4.4 a 5.0 a 2.7 a 2.6 a 3.3 a 30.8 a 30.6 a 13.9 b
20–40 1.9 a 1.4 a 2.5 a 6.2 a 8.0 a 5.9 a 4.4 a 5.2 a 3.6 a 2.0 a 2.5 a 3.3 a 29.2 a 33.4 a 16.0 b
40–60 1.8 a 1.1 a 1.5 a 3.6 a 4.4 a 3.8 a 3.0 a 3.2 a 2.8 a 1.2 a 2.0 a 2.0 a 33.0 a 33.8 a 21.1 b
90–110 1.6 a 1.6 ab 0.7 b 3.4 a 4.0 a 2.1 a 2.6 a 2.0 a 1.4 a 1.2 a 1.3 a 1.1 a 24.4 b 31.8 a 18.9 b
180–200 2.4 a 2.1 a 0.7 b 2.8 a 2.4 a 2.5 a 3.0 a 1.4 b 1.6 ab 0.7 a 1.1 a 0.8 a 20.2 b 26.0 a 15.4 c
Layer (cm) pH SOMb (g kg�1) P (mg kg�1) CECc (mmolc kg�1) BSd (%)
2002 2003 2004 2002 2003 2004 2002 2003 2004 2002 2003 2004 2002 2003 2004
0–10 4.2 b 4.8 ab 5.3 a 20.6 a 18.8 a 13.0 b 9.0 b 8.2 b 32.2 a 53.9 a 52.4 a 38.1 b 39.0 b 38.4 b 65.3 a
10–20 4.4 b 4.7 ab 5.2 a 20.2 a 19.2 a 13.0 b 6.6 b 3.0 b 15.0 a 49.7 a 49.3 a 35.9 b 38.4 b 37.0 b 59.6 a
20–40 4.1 b 4.5 ab 4.8 a 16.8 a 17.4 a 10.8 b 5.4 a 1.6 c 4.0 b 43.6 a 50.6 a 31.3 b 32.9 b 33.6 b 48.8 a
40–60 3.9 b 4.1 ab 4.4 a 16.8 a 14.2 a 8.2 b 4.8 a 1.0 c 2.8 b 42.6 a 44.5 a 31.1 b 22.5 a 24.0 a 32.6 a
90–110 4.0 a 4.1 a 4.1 a 13.8 a 11.0 a 6.4 b 4.0 a 1.2 b 1.7 b 33.3 b 40.7 a 24.2 c 27.0 a 21.8 a 21.4 a
180–200 4.1 a 4.2 a 4.2 a 11.8 a 9.2 ab 5.4 b 5.0 a 1.0 b 2.3 b 29.1 b 33.0 a 21.0 c 30.7 a 21.2 a 26.2 a
a For each parameter, values in the same row (different years) in each layer with the same letter do not differ by Tukey test (P < 0.05).b SOM: soil organic matter.c CEC: cation exchange capacity at pH 7.0.d BS: base saturation.
ag
ric
ul
tu
ra
lw
at
er
ma
na
ge
me
nt
89
(2
00
7)
10
5–
11
51
10
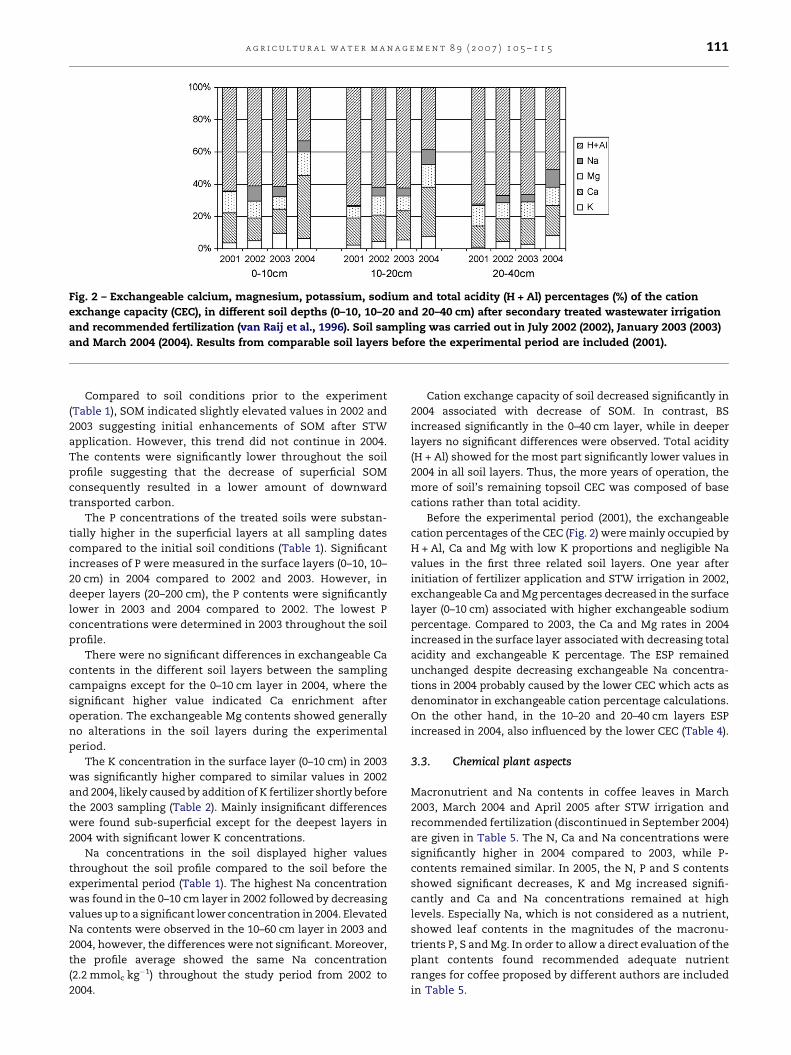
Fig. 2 – Exchangeable calcium, magnesium, potassium, sodium and total acidity (H + Al) percentages (%) of the cation
exchange capacity (CEC), in different soil depths (0–10, 10–20 and 20–40 cm) after secondary treated wastewater irrigation
and recommended fertilization (van Raij et al., 1996). Soil sampling was carried out in July 2002 (2002), January 2003 (2003)
and March 2004 (2004). Results from comparable soil layers before the experimental period are included (2001).
a g r i c u l t u r a l w a t e r m a n a g e m e n t 8 9 ( 2 0 0 7 ) 1 0 5 – 1 1 5 111
Compared to soil conditions prior to the experiment
(Table 1), SOM indicated slightly elevated values in 2002 and
2003 suggesting initial enhancements of SOM after STW
application. However, this trend did not continue in 2004.
The contents were significantly lower throughout the soil
profile suggesting that the decrease of superficial SOM
consequently resulted in a lower amount of downward
transported carbon.
The P concentrations of the treated soils were substan-
tially higher in the superficial layers at all sampling dates
compared to the initial soil conditions (Table 1). Significant
increases of P were measured in the surface layers (0–10, 10–
20 cm) in 2004 compared to 2002 and 2003. However, in
deeper layers (20–200 cm), the P contents were significantly
lower in 2003 and 2004 compared to 2002. The lowest P
concentrations were determined in 2003 throughout the soil
profile.
There were no significant differences in exchangeable Ca
contents in the different soil layers between the sampling
campaigns except for the 0–10 cm layer in 2004, where the
significant higher value indicated Ca enrichment after
operation. The exchangeable Mg contents showed generally
no alterations in the soil layers during the experimental
period.
The K concentration in the surface layer (0–10 cm) in 2003
was significantly higher compared to similar values in 2002
and 2004, likely caused by addition of K fertilizer shortly before
the 2003 sampling (Table 2). Mainly insignificant differences
were found sub-superficial except for the deepest layers in
2004 with significant lower K concentrations.
Na concentrations in the soil displayed higher values
throughout the soil profile compared to the soil before the
experimental period (Table 1). The highest Na concentration
was found in the 0–10 cm layer in 2002 followed by decreasing
values up to a significant lower concentration in 2004. Elevated
Na contents were observed in the 10–60 cm layer in 2003 and
2004, however, the differences were not significant. Moreover,
the profile average showed the same Na concentration
(2.2 mmolc kg�1) throughout the study period from 2002 to
2004.
Cation exchange capacity of soil decreased significantly in
2004 associated with decrease of SOM. In contrast, BS
increased significantly in the 0–40 cm layer, while in deeper
layers no significant differences were observed. Total acidity
(H + Al) showed for the most part significantly lower values in
2004 in all soil layers. Thus, the more years of operation, the
more of soil’s remaining topsoil CEC was composed of base
cations rather than total acidity.
Before the experimental period (2001), the exchangeable
cation percentages of the CEC (Fig. 2) were mainly occupied by
H + Al, Ca and Mg with low K proportions and negligible Na
values in the first three related soil layers. One year after
initiation of fertilizer application and STW irrigation in 2002,
exchangeable Ca and Mg percentages decreased in the surface
layer (0–10 cm) associated with higher exchangeable sodium
percentage. Compared to 2003, the Ca and Mg rates in 2004
increased in the surface layer associated with decreasing total
acidity and exchangeable K percentage. The ESP remained
unchanged despite decreasing exchangeable Na concentra-
tions in 2004 probably caused by the lower CEC which acts as
denominator in exchangeable cation percentage calculations.
On the other hand, in the 10–20 and 20–40 cm layers ESP
increased in 2004, also influenced by the lower CEC (Table 4).
3.3. Chemical plant aspects
Macronutrient and Na contents in coffee leaves in March
2003, March 2004 and April 2005 after STW irrigation and
recommended fertilization (discontinued in September 2004)
are given in Table 5. The N, Ca and Na concentrations were
significantly higher in 2004 compared to 2003, while P-
contents remained similar. In 2005, the N, P and S contents
showed significant decreases, K and Mg increased signifi-
cantly and Ca and Na concentrations remained at high
levels. Especially Na, which is not considered as a nutrient,
showed leaf contents in the magnitudes of the macronu-
trients P, S and Mg. In order to allow a direct evaluation of the
plant contents found recommended adequate nutrient
ranges for coffee proposed by different authors are included
in Table 5.
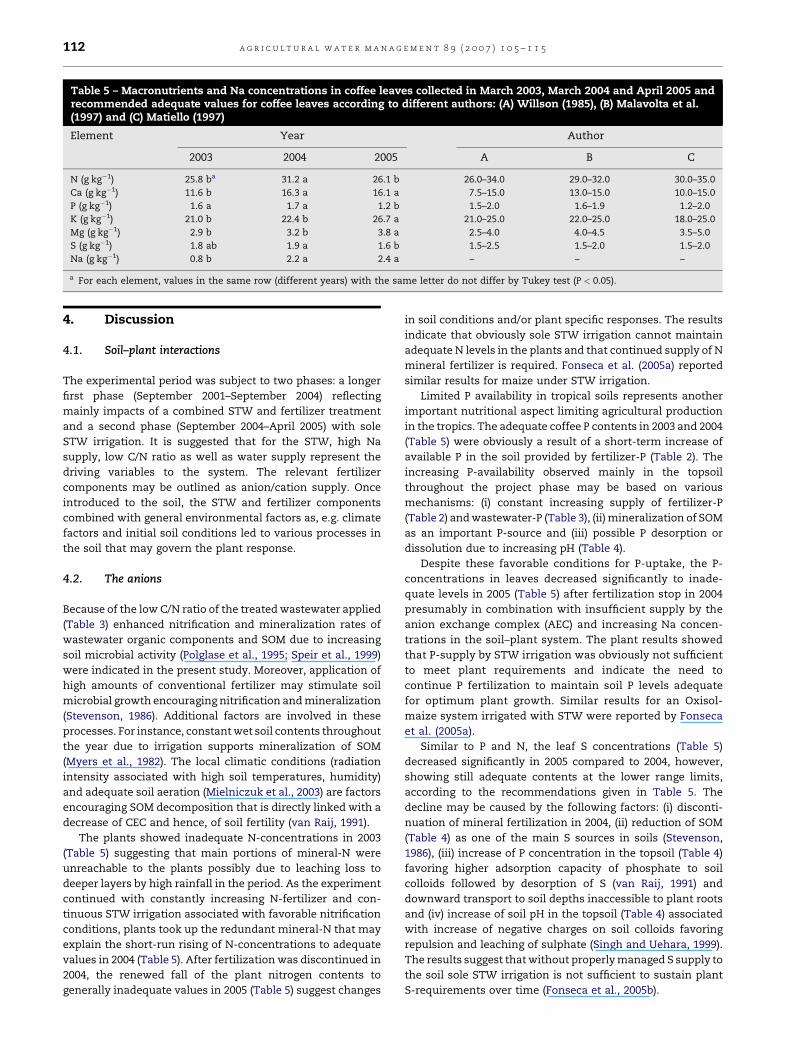
Table 5 – Macronutrients and Na concentrations in coffee leaves collected in March 2003, March 2004 and April 2005 andrecommended adequate values for coffee leaves according to different authors: (A) Willson (1985), (B) Malavolta et al.(1997) and (C) Matiello (1997)
Element Year Author
2003 2004 2005 A B C
N (g kg�1) 25.8 ba 31.2 a 26.1 b 26.0–34.0 29.0–32.0 30.0–35.0
Ca (g kg�1) 11.6 b 16.3 a 16.1 a 7.5–15.0 13.0–15.0 10.0–15.0
P (g kg�1) 1.6 a 1.7 a 1.2 b 1.5–2.0 1.6–1.9 1.2–2.0
K (g kg�1) 21.0 b 22.4 b 26.7 a 21.0–25.0 22.0–25.0 18.0–25.0
Mg (g kg�1) 2.9 b 3.2 b 3.8 a 2.5–4.0 4.0–4.5 3.5–5.0
S (g kg�1) 1.8 ab 1.9 a 1.6 b 1.5–2.5 1.5–2.0 1.5–2.0
Na (g kg�1) 0.8 b 2.2 a 2.4 a – – –
a For each element, values in the same row (different years) with the same letter do not differ by Tukey test (P < 0.05).
a g r i c u l t u r a l w a t e r m a n a g e m e n t 8 9 ( 2 0 0 7 ) 1 0 5 – 1 1 5112
4. Discussion
4.1. Soil–plant interactions
The experimental period was subject to two phases: a longer
first phase (September 2001–September 2004) reflecting
mainly impacts of a combined STW and fertilizer treatment
and a second phase (September 2004–April 2005) with sole
STW irrigation. It is suggested that for the STW, high Na
supply, low C/N ratio as well as water supply represent the
driving variables to the system. The relevant fertilizer
components may be outlined as anion/cation supply. Once
introduced to the soil, the STW and fertilizer components
combined with general environmental factors as, e.g. climate
factors and initial soil conditions led to various processes in
the soil that may govern the plant response.
4.2. The anions
Because of the low C/N ratio of the treated wastewater applied
(Table 3) enhanced nitrification and mineralization rates of
wastewater organic components and SOM due to increasing
soil microbial activity (Polglase et al., 1995; Speir et al., 1999)
were indicated in the present study. Moreover, application of
high amounts of conventional fertilizer may stimulate soil
microbial growth encouraging nitrification and mineralization
(Stevenson, 1986). Additional factors are involved in these
processes. For instance, constant wet soil contents throughout
the year due to irrigation supports mineralization of SOM
(Myers et al., 1982). The local climatic conditions (radiation
intensity associated with high soil temperatures, humidity)
and adequate soil aeration (Mielniczuk et al., 2003) are factors
encouraging SOM decomposition that is directly linked with a
decrease of CEC and hence, of soil fertility (van Raij, 1991).
The plants showed inadequate N-concentrations in 2003
(Table 5) suggesting that main portions of mineral-N were
unreachable to the plants possibly due to leaching loss to
deeper layers by high rainfall in the period. As the experiment
continued with constantly increasing N-fertilizer and con-
tinuous STW irrigation associated with favorable nitrification
conditions, plants took up the redundant mineral-N that may
explain the short-run rising of N-concentrations to adequate
values in 2004 (Table 5). After fertilization was discontinued in
2004, the renewed fall of the plant nitrogen contents to
generally inadequate values in 2005 (Table 5) suggest changes
in soil conditions and/or plant specific responses. The results
indicate that obviously sole STW irrigation cannot maintain
adequate N levels in the plants and that continued supply of N
mineral fertilizer is required. Fonseca et al. (2005a) reported
similar results for maize under STW irrigation.
Limited P availability in tropical soils represents another
important nutritional aspect limiting agricultural production
in the tropics. The adequate coffee P contents in 2003 and 2004
(Table 5) were obviously a result of a short-term increase of
available P in the soil provided by fertilizer-P (Table 2). The
increasing P-availability observed mainly in the topsoil
throughout the project phase may be based on various
mechanisms: (i) constant increasing supply of fertilizer-P
(Table 2) and wastewater-P (Table 3), (ii) mineralization of SOM
as an important P-source and (iii) possible P desorption or
dissolution due to increasing pH (Table 4).
Despite these favorable conditions for P-uptake, the P-
concentrations in leaves decreased significantly to inade-
quate levels in 2005 (Table 5) after fertilization stop in 2004
presumably in combination with insufficient supply by the
anion exchange complex (AEC) and increasing Na concen-
trations in the soil–plant system. The plant results showed
that P-supply by STW irrigation was obviously not sufficient
to meet plant requirements and indicate the need to
continue P fertilization to maintain soil P levels adequate
for optimum plant growth. Similar results for an Oxisol-
maize system irrigated with STW were reported by Fonseca
et al. (2005a).
Similar to P and N, the leaf S concentrations (Table 5)
decreased significantly in 2005 compared to 2004, however,
showing still adequate contents at the lower range limits,
according to the recommendations given in Table 5. The
decline may be caused by the following factors: (i) disconti-
nuation of mineral fertilization in 2004, (ii) reduction of SOM
(Table 4) as one of the main S sources in soils (Stevenson,
1986), (iii) increase of P concentration in the topsoil (Table 4)
favoring higher adsorption capacity of phosphate to soil
colloids followed by desorption of S (van Raij, 1991) and
downward transport to soil depths inaccessible to plant roots
and (iv) increase of soil pH in the topsoil (Table 4) associated
with increase of negative charges on soil colloids favoring
repulsion and leaching of sulphate (Singh and Uehara, 1999).
The results suggest that without properly managed S supply to
the soil sole STW irrigation is not sufficient to sustain plant
S-requirements over time (Fonseca et al., 2005b).
a g r i c u l t u r a l w a t e r m a n a g e m e n t 8 9 ( 2 0 0 7 ) 1 0 5 – 1 1 5 113
Indications of inadequate plant contents may be a result of
both deficient nutrient supply from soil and/or plant internal
responses caused by harmful elements. In this context, the
high Na input via STW reflected by high plant concentrations
at magnitudes comparable to macronutrients may interact
within plant biogeochemical processes through toxic inhibi-
tions of the protein synthesis that can cause inadequate plant
nutrient contents (Marschner, 1995; Subbarao et al., 2003).
These aspects have to be considered for future use of STW
irrigation on tropical agro-systems.
4.3. The cations
The increase of pH in the 0–40 cm layer over time may be
attributed to: (i) high wastewater pH (Stewart et al., 1990), (ii)
high input of HCO3� by STW consuming H+ and (iii) high base
cation inputs by fertilizer and STW elevating concentrations of
base cations in soil to a level where Al3+ and H+ are displaced
from the exchange sites, leaving H+ to complex with anions
(NO3�, SO4
2�) and leach out (Yanai et al., 1996).
The present study showed that the combined STW
irrigation/fertilization approach caused reduction of total
acidity (H + Al) over time (Falkiner and Smith, 1997; Fonseca
et al., 2005b) that is mainly related to decreasing actual acidity
(pH), decreasing SOM concentrations and increasing contents
of base cations (Table 4).
The cations which make up the base saturation (BS) vary in
relative portions depending on the applied amount of
fertilizer/STW components and on the element specific
conditions as, e.g. valence, size/hydration, specific adsorption
and concentration (Loyola Junior and Pavan, 1989; Singh and
Uehara, 1999). Likely originated from high fertilizer amounts
(220 kg ha�1 year�1) rather than from STW (37 kg ha�1 year�1),
Ca represents the most abundant base cation in the soil and
is therefore composing more of BS, especially in the surface
layer (Fig. 2).
On the other hand, the high Na concentration of the STW
(Table 2) resulted in a mean annual input of 607 kg ha�1
obviously causing the higher ESP from 2002 to 2004 compared
to the soil before the experimental period (Fig. 2). Despite the
high and continued addition of Na, the levels of exchangeable
Na decreased in the topsoil over time. However, the profile
average suggested no changes in exchangeable Na levels
throughout the study period. Moreover, the increase in ESP of
the soil (from 2002 to 2004) particularly in the 10–20 and 20–
40 cm layer in 2004 or the constant ESP in the surface layer
despite lower Na contents in 2004 compared to 2003 (Fig. 2)
suggests rather an effect of the decrease in the CEC of the soil
resulting from the decrease in SOM (Table 4). In the equation
used to calculate ESP, exchangeable Na is divided by the CEC.
Nevertheless, it is expected that high input of Na by
continued STW irrigation will increasingly contribute to the
remaining CEC, elevating the risk of soil sodicity over the long
term when cation fertilization is discontinued. The present
study indicated that during the experimental period the
addition of lime and fertilizer could reduce sodification
processes in the topsoil due to Na exchange followed by
increasing exchangeable calcium percentage (ECP) and
exchangeable magnesium percentage (EMP). On the other
hand, the exchanged Na and available soluble Na from STW
are suggested to enhance ESP in deeper layers by soil
migration. Rengasamy and Olsson (1993) pointed out that
dependent on the frequency of irrigation and the quantity of
ameliorates applied exchangeable Na from the surface may be
leached downwards, increasing ESP at depth. Also Woodbury
(1993) reported that supply of Ca increases the soil solution
electrolyte concentration and displaces Na on the exchange
complex going into a soluble form where it may be taken up by
plants or leached. The available Na provided by superficial
exchange as well as by the constant supply of immediately
available soluble Na via STW led to a high intensity of available
Na (intensity factor) (Marschner, 1995; Holford, 1997) and may
explain the significant increase of plant Na contents. After
fertilization was discontinued, Na plant contents increased
(Table 5).
The increasing Ca plant contents occurring at the same
time (Table 5) should rather be considered in the quantitative
than in the intensive dimension which is defined as the
capacity of soil to replace solution Ca or other nutrients as they
are removed by the crop during its life cycle (quantity factor)
(Marschner, 1995; Holford, 1997). Mainly due to fertilization
the high amounts of exchangeable Ca in the solid soil phase
associated with high ECP in the topsoil favored continuous
replenishment of plant available Ca in the soil solution leading
to higher uptake rates followed by excessive plant contents
(Table 5).
Also Mg and K are interacting in these processes because of
relatively high Mg and K supply by liming and fertilization,
respectively. The significant increase of the plant K concen-
trations in 2005 following fertilization stop in 2004 may partly
be explained by a K input of 60 kg ha�1 year�1 by STW
irrigation representing approximately 28% of the total K input
to the soil–plant system. However, antagonistic effects
between K and Na (Marschner, 1995; Malavolta et al., 1997)
were not observed in the present study (Table 5).
In contrast to the decrease of N, P and S plant contents after
discontinuation of fertilization, the concentrations of essen-
tial cations (Ca, Mg and K) remained high in 2005 (Table 5). This
indicated a still sufficient supply due to the enhanced BS
(Table 4) built up over time by previous fertilization and STW
irrigation. However, it is expected to be a rather short-lived
effect, due to a reduction of the essential cation store (Ca, Mg,
K) through the constantly provided Na input and insufficient
supply of essential cations to soil via STW associated with
decrease of SOM and CEC. This suggests the need of continued
fertilizer use to maintain adequate soil conditions. Although
the threshold concentration of irrigation water indicated that
soil properties are obviously not negatively affected it can be
suggested that without additional and adapted fertilizer
supply, sole STW irrigation over time would probably cause
both deterioration of soil conditions and unbalanced nutrient
conditions in the plant.
Thus, the viability of STW irrigation on coffee cultivated
on tropical soils in Brazil depends on the development of
agronomical management strategies including adequate
and adapted mineral fertilization and, simultaneously,
innovative practices to enhance SOM. The latter is crucial
because approximately 70% of CEC in the 0–20 cm layer of
soils in Sao Paulo State (Brazil) is influenced by functional
groups of SOM (van Raij, 1991). Generally, further research
a g r i c u l t u r a l w a t e r m a n a g e m e n t 8 9 ( 2 0 0 7 ) 1 0 5 – 1 1 5114
is needed on the overall subject in order to build a well-
founded basis for the assessment of STW effects on tropical
soils in Brazil.
5. Conclusions
In many studies worldwide, the reuse of treated municipal
wastewater as water and nutrient source in agricultural
irrigation is introduced as an ecological viable alternative
for wastewater destination in the environment (Toze, 2006).
However, under the given circumstances, the present study
indicated that sole STW irrigation resulted in three main
problems which may also apply to other agricultural areas in
Brazil with similar soil and climatic conditions: (i) increasing
soil sodicity risks, (ii) decrease of soil organic matter
accompanied with decreasing CEC and (iii) insufficient and
unbalanced nutrient supply to the soil–plant system.
Undoubtedly, agricultural use of STW represents a viable
method to preserve existing water sources. However, from
the nutritional point of view, we found that sole STW
irrigation was not sufficient to supply adequate levels as
required by coffee and that continued fertilization is needed
to maintain P, N and S levels in the soil for optimum plant
growth. On the other hand, a possible reduction of Ca and K
fertilizer because of the excessive plant concentrations found
would probably impair soil conditions over time due to
adverse Na effects on soil via STW irrigation. It can be
suggested that with insufficient cation supply by fertilizer,
unless otherwise resolved, sodicity will continue causing soil
deteriorations. Hence, continued use of fertilizer is still
required to maintain soil health despite the supposed cations
in the reclaimed water. Thus, recommended agronomical
fertilization should be reconsidered and adapted by including
the interactions found between STW and fertilizer compo-
nents in combined STW/fertilizer approaches. Due to eco-
nomical and ecological reasons future efforts have to be
strengthened to develop innovative management strategies
for the sustainable use of STW in coffee farming and other
cultures in Brazil.
Acknowledgements
Our sincere gratitude is extended to Fundacao de Amparo a
Pesquisa do Estado de Sao Paulo (FAPESP) for supporting this
work by research grants. We also thank SABESP (Companhia
de Saneamento Basico do Estado de Sao Paulo) for logistical
and financial support.
r e f e r e n c e s
Allen, R.G., Pereira, L.S., Raes, D., Smith, M., 1998. Cropevapotranspiration: guidelines for computing crop waterrequirements. Irrigation and Drainage Paper #56. FAO,Rome.
Al Salem, S.A., 1996. Environmental considerations forwastewater reuse in agriculture. Water Sci. Technol. 33(10–11), 345–353.
American Public Health Association (APHA), 1994. StandardMethods for the Examination for Water and Wastewater,18th ed. APHA, Washington.
Ayers, R.S., Westcot, D.S., 1985. Water quality for agriculture.Irrigation and Drainage Paper #29. FAO, Rome.
Biswas, T.K., Higginson, F.R., Shannon, I., 1999. Effluent nutrientmanagement and resource recovery in intensive ruralindustries for the protection of natural waters. Water Sci.Technol. 40 (2), 19–27.
Bond, W.J., 1998. Effluent irrigation—an environmentalchallenge for soil science. Aust. J. Soil Res. 36, 543–555.
Bouwer, H., Chaney, R.L., 1974. Land treatment of wastewater.Adv. Agron. 26, 133–176.
Cameron, K.C., Di, H.J., McLaren, R.G., 1997. Is soil anappropriate dumping ground for our wastes? Aust. J. SoilRes. 35, 995–1035.
Camargo, O.A., Moniz, A.C., Jorge, J.A., Valadares, J.M.A.S., 1986.Metodos de analise quımica, mineralogica e fısica de solosdo Instituto Agronomico de Campinas. Boletim Tecnico#106. Instituto Agronomico, Campinas, Brasil.
Day, A.D., Tucker, T.C., 1959. Production of small grains pastureforage using sewage effluent as a source of irrigation waterand plant nutrients. Agron. J. 51, 569–572.
Falkiner, R.A., Smith, C.J., 1997. Changes in soil chemistry ineffluent-irrigated Pinus radiata and Eucalyptus grandis. Aust. J.Soil Res. 35, 131–147.
Feigin, A., Ravina, I., Shalhevet, J., 1991. Irrigation with TreatedSewage Effluent: Management for EnvironmentalProtection. Springer-Verlag, Berlin.
Fonseca, A.F., Melfi, A.J., Montes, C.R., 2005a. Maize growth andchanges in soil fertility after irrigation with treated sewageeffluent. I. Plant dry matter yield and soil nitrogen andphosphorus availability. Commun. Soil Sci. Plant Anal. 36,1965–1981.
Fonseca, A.F., Melfi, A.J., Montes, C.R., 2005b. Maize growth andchanges in soil fertility after irrigation with treated sewageeffluent. II. Soil acidity, exchangeable cations, and sulfur,boron and heavy metals availability. Commun. Soil Sci.Plant Anal. 36, 1983–2003.
Fonseca, A.F., Melfi, A.J., Monteiro, F.A., Montes, C.R., Almeida,V.V., Herpin, U., 2007. Treated sewage effluent as a source ofwater and nitrogen for Tifton 85 bermudagrass. Agric.Water Manage. 87, 328–336.
Halliwell, D.J., Barlow, K.M., Nash, D.M., 2001. A review of theeffects of wastewater sodium on soil physical propertiesand their implications for irrigation systems. Aust. J. SoilRes. 39, 1259–1267.
Hamoda, M.F., 1987. Effluent quality variations in relation towater reuse for irrigation. J. Environ. Health Sci. A 22,161–187.
Hespanhol, I., 1999. Agua e saneamento basico—uma visaorealista. In: Da Cunha Reboucas, A., Braga, B., Tundisi, J.G.(Eds.), Aguas doces no Brasil. Sociedade Brasileira deCiencia do Solo, Sao Paulo, Brazil, pp. 249–302.
Holford, I.C.R., 1997. Soil phosphorous: its measurement, and itsuptake by plants. Aust. J. Soil Res. 35, 227–239.
Ibrahim, L., 2002. Caracterizacao fısica, quımica, mineralogica emorfologica de uma sequencia de solos em Lins/SP. M.S.Thesis, ESALQ, Universidade de Sao Paulo.
Kayombo, S., Mbwette, T.S.A., Mayo, A.W., Katima, J.H.Y.,Jørgensen, S.E., 2002. Diurnal cycles of variation of physical–chemical parameters in waste stabilization ponds. Ecol.Eng. 18, 287–291.
Loyola Junior, E., Pavan, M.A., 1989. Seletividade de troca decations em solos acidos. R. Bras. Cienc. Solo 13,131–138.
Malavolta, E., Vitti, G.C., Oliveira, S.A., 1997. Avaliacao do estadonutricional das plantas: princıpios e aplicacoes, second ed.Potafos, Piracicaba, Brazil.
a g r i c u l t u r a l w a t e r m a n a g e m e n t 8 9 ( 2 0 0 7 ) 1 0 5 – 1 1 5 115
Marschner, H., 1995. Mineral Nutrition of Higher Plants, seconded. Academic Press, London.
Matiello, J.B.G., 1997. Gosto do meu cafezal. Publicacoes GloboRural.
Matiello, J.B., Santinato, R., Garcia, A.W.R., Almeida, S.R.,Fernandez, D.R. (Eds.), 2002. Cultura de Cafe no Brasil. Novomanual de recommendacoes. Ministerio de Agricultura, dePecuaria e do Abastecimento, SARC/PROCAFE–SPC/DECAF,Fundacao PROCAFE, Rio de Janeiro-RJ, Varginha-MG, Brazil.
Mielniczuk, J., Bayer, C., Vezzani, F.M., Lovato, T., Fernandes,F.F., Debarba, L., 2003. Manejo de solo e culturas e suarelacao com os estoques de carbono e nitrogenio do solo. In:Curi, N., Marques, J.J., Guilherme, L.R.G., Lima, J.M., Lopes,A.S., Alvarez, V.H. (Eds.), Topicos em ciencia do solo.Sociedade Brasileira de Ciencia do Solo, vol. 3, Vicosa, Brazil,pp. 209–248.
Montes, C.R., Fonseca, A.F., Melfi, A.J., Gloaguem, T.V.,Mendonca, F.C., Pivelli, R., Herpin, U., Santos, A.P.R., Forti,M.C., Lucas, Y., Mounier, S., Carvalho, A., Almeida, V.V.,Cardinali, C.G., Steffen, T.M., Monteiro, R.C., 2004.Agricultural use of stabilization pond effluent: a case studyin the city of Lins (SP, Brazil). In: Martin-Neto, L., Miliori,D.M.B.P., da Silva, W.T.C. (Eds.), Humic Substances and Soiland Water Environment. Proceedings of the XIIInternational Meeting of International Humic SubstancesSociety, Sao Pedro (SP), Brazil, EMBRAPA, vol. 1, pp.732–734.
Myers, R.J.K., Campbell, C.A., Weier, K.L., 1982. Quantitativerelationship between net nitrogen mineralization andmoisture content of soils. Can. J. Soil Sci. 62, 111–124.
Oster, J.D., 1994. Irrigation with poor quality water. Agric. WaterManage. 25, 271–297.
Oster, J.D., Shainberg, I., 2001. Soil responses to sodicity andsalinity: challenges and opportunities. Aust. J. Soil Res. 39,1219–1224.
Pescod, M.B., 1992. Wastewater treatment and use inagriculture. Irrigation and Drainage Paper #47. FAO, Rome.
Polglase, P.J., Tompkins, D., Stewart, L.G., Falkiner, R.A., 1995.Mineralization and leaching of nitrogen in an effluent-irrigated pine plantation. J. Environ. Qual. 24, 911–920.
Pollice, A., Lopez, A., Laera, G., Rubino, P., Lonigro, A., 2004.Tertiary filtered municipal wastewater as alternative watersource in agriculture: a field investigation in Southern Italy.Sci. Total Environ. 324 (1–3), 201–210.
Quin, B.F., 1978. Irrigation with sewage effluent. N. Z. J. Agr. 5,30–32.
Quirk, J.P., 1994. Interparticle forces: a basis for theinterpretation of soil physical behavior. Adv. Agron. 53,121–183.
Rengasamy, P., Greene, R.S.B., Ford, G.W., Mehanni, A.H., 1984.Identification of dispersive behaviour and the managementof red–brown earth. Aust. J. Soil Res. 22, 413–431.
Rengasamy, P., Olsson, K.A., 1993. Irrigation and sodicity. Aust.J. Soil Res. 31, 821–837.
SAS System, 1999. SAS Institute Inc., Release 8.02. The SASInstitute, Cary, NC.
Singh, U., Uehara, G., 1999. Electrochemistry of the double layer:principles and applications to soils. In: Sparks, D.L. (Ed.),Soil Physical Chemistry. second ed. CRC Press, Boca Raton,pp. 1–46.
Soil Survey Staff, 1999. Soil taxonomy. In: Agriculture Handbook#436, second ed. USDA-NRCS, Washington.
Speir, T.W., Van Schaik, A.P., Kettles, H.A., Vicent, K.W.,Campbell, D.J., 1999. Soil and stream–water impacts ofsewage effluent irrigation onto steeply sloping land. J.Environ. Qual. 28, 1105–1114.
Stevenson, F.J., 1986. Cycles of Soil: Carbon, Nitrogen,Phosphorus, Sulfur, Micronutrients. John Wiley & Sons,New York.
Stewart, H.T.L., Hopmans, P., Flinn, D.W., 1990. Nutrientaccumulation in trees and soil following irrigation withmunicipal effluent in Australia. Environ. Pollut. 63, 155–177.
Subbarao, G.V., Ito, O., Berry, W.L., Wheeler, R.M., 2003.Sodium—a functional plant nutrient. Crit. Rev. Plant Sci. 22(5), 391–416.
Toze, S., 2006. Reuse of effluent water—benefits and risks. Agric.Water Manage. 80, 147–159.
Van Genuchten, M.T., 1980. A closed-form equation forpredicting the hydraulic conductivity of unsaturated soils.Soil Sci. Soc. Am. J. 44, 892–898.
van Raij, B., 1991. Fertilidade do solo e adubacao. Potafos,Piracicaba.
van Raij, B., Cantarella, H., Quaggio, J.A., Furlani, A.M.C. (Eds.),1996. Recomendacoes de adubacao e calagem para o Estadode Sao Paulo, second ed. Boletim Tecnico #100. InstitutoAgronomico, Campinas, Brazil.
van Raij, B., Andrade, J.C., Cantarella, H., Quaggio, J.A., 2001.Analise quımica para avaliacao da fertilidade de solostropicais. Instituto Agronomico, Campinas, Brazil.
Vazquez-Montiel, O., Horan, N.J., Mara, D.D., 1996. Managementof domestic wastewater for reuse in irrigation. Water Sci.Technol. 33, 355–362.
Willson, K.C., 1985. Mineral nutrition and fertilizer needs. In:Cliford, N.N., Willson, K.C. (Eds.), Coffee Botany,Biochemistry and Production of Beans and Beverage, Part 6.Croom Heml, pp. 135–156.
Woodbury, B.L., 1993. Hydraulic property modification of saline-sodic soils by addition of calcium chloride. M.S. Thesis,Department of Plant and Soil Science, Montana StateUniversity, Bozeman.
Yadav, R.K., Goyal, B., Sharma, R.K., Dubey, S.K., Minhas, P.S.,2002. Post-irrigation impact of domestic sewage effluent oncomposition of soils, crops and ground water—a case study.Environ. Int. 28 (6), 481–486.
Yanai, J., Linehan, D.J., Robinson, D., Young, I.M., Hackett, C.A.,Kyuma, K., Kosaki, T., 1996. Effects of inorganic nitrogenapplication on the dynamics of the soil solutioncomposition in the root zone of maize. Plant Soil 180, 1–9.
Related Documents