applied sciences Article Chemical Composition of White Wines Produced from Different Grape Varieties and Wine Regions in Slovakia Silvia Jakabová 1, * , Martina Fikselová 1 , Andrea Mendelová 1 , Michal Ševˇ cík 2 , Imrich Jakab 2 , Zuzana Alá ˇ cová 1 , Jana Kolaˇ ckovská 1 and Violeta Ivanova-Petropulos 3 Citation: Jakabová, S.; Fikselová, M.; Mendelová, A.; Ševˇ cík, M.; Jakab, I.; Alᡠcová, Z.; Kolaˇ ckovská, J.; Ivanova-Petropulos, V. Chemical Composition of White Wines Produced from Different Grape Varieties and Wine Regions in Slovakia. Appl. Sci. 2021, 11, 11059. https://doi.org/10.3390/ app112211059 Academic Editor: Roxana Elena Ionete Received: 15 October 2021 Accepted: 17 November 2021 Published: 22 November 2021 Publisher’s Note: MDPI stays neutral with regard to jurisdictional claims in published maps and institutional affil- iations. Copyright: © 2021 by the authors. Licensee MDPI, Basel, Switzerland. This article is an open access article distributed under the terms and conditions of the Creative Commons Attribution (CC BY) license (https:// creativecommons.org/licenses/by/ 4.0/). 1 Faculty of Biotechnology and Food Sciences, Institute of Food Sciences, Slovak University of Agriculture in Nitra, Trieda Andreja Hlinku 2, 94976 Nitra, Slovakia; martina.fi[email protected] (M.F.); [email protected] (A.M.); [email protected] (Z.A.); [email protected] (J.K.) 2 Department of Ecology and Environmental Sciences, Faculty of Natural Sciences, Constantine the Philosopher University in Nitra, Trieda Andreja Hlinku 1, 94974 Nitra, Slovakia; [email protected] (M.Š.); [email protected] (I.J.) 3 Faculty of Agriculture, University “Goce Delˇ cev”—Štip, Krste Misirkov 10-A, 2000 Štip, North Macedonia; [email protected] * Correspondence: [email protected] Abstract: In this work, chemical parameters such as sugar (glucose and fructose) content, organic acid (total acids, malic and tartaric acids), total phenolic content and the antioxidant activity of 12 white wines (chardonnay, pinot blanc and pinot gris) from various wine regions in Slovakia were studied in order to identify differences among the varieties and wine-growing regions. The wine samples were examined by Fourier-transform infrared spectroscopy (FTIR) and UV-VIS spectrophotometry (for determination of total polyphenolic content (TPC) and total antioxidant activity (TAA)) methods. Content of alcohol ranged between 11.50% and 13.80% with the mean value 12.52%. Mean content of total acids varied between 4.63 ± 0.09 and 6.63 ± 0.05 g.L -1 , tartaric acid varied between 1.62 ± 0.09 and 2.93 ± 0.03 g L -1 , malic acid was found in the concentrations ranged from 0.07 ± 0.05 and 2.50 ± 0.08 g L -1 and lactic acid was present between 1.53 and 0.01 g L -1 . The content of fructose was, in general, higher in the samples from the Južnoslovenská and Nitrianska wine regions and glucose was higher in the Malokarpatská wine region. Chardonnay wines showed the highest content of total polyphenols and the antioxidant activity in the samples ranged from 51.06 ± 027 to 72.53 ± 0.35% inhibition of DPPH. The PCA analysis based on chemical descriptors distinguished the Nitrianska and Stredoslovenská wine regions. According to similarities among the wine samples, four main classes were formed by cluster analysis. Keywords: white wine; FTIR; UV-VIS spectrophotometry; chemical composition; geographic indication 1. Introduction The primary and secondary plant metabolites play critical roles in the health of humans and could be nutritionally important. Many of these compounds are also considered to be crucial factors for food and beverage quality. Evaluation of food and wine quality and the value for human health is often connected with various physical-chemical and organoleptic properties [1–3]. Wine, as one of the world’s widely consumed beverages, has been proved to have health-promoting effects as a function of metabolites belonging to various different groups of chemicals [1,4]. Various factors affect the quality of wine, including its taste and aroma, such as grape variety, ripening stage, environmental conditions, soil, vine cultivation, as well as wine- making practices applied during wine production [5–10]. The main difference between red and white wine production is the duration of maceration applied. For red wine production, studies are primarily focused on the influence of different maceration times/days on the extraction of grape pigments and tannins [11]. For white wine production, maceration Appl. Sci. 2021, 11, 11059. https://doi.org/10.3390/app112211059 https://www.mdpi.com/journal/applsci

Welcome message from author
This document is posted to help you gain knowledge. Please leave a comment to let me know what you think about it! Share it to your friends and learn new things together.
Transcript
applied sciences
Article
Chemical Composition of White Wines Produced fromDifferent Grape Varieties and Wine Regions in Slovakia
Silvia Jakabová 1,* , Martina Fikselová 1, Andrea Mendelová 1, Michal Ševcík 2, Imrich Jakab 2,Zuzana Alácová 1 , Jana Kolackovská 1 and Violeta Ivanova-Petropulos 3
�����������������
Citation: Jakabová, S.; Fikselová, M.;
Mendelová, A.; Ševcík, M.; Jakab, I.;
Alácová, Z.; Kolackovská, J.;
Ivanova-Petropulos, V. Chemical
Composition of White Wines
Produced from Different Grape
Varieties and Wine Regions in
Slovakia. Appl. Sci. 2021, 11, 11059.
https://doi.org/10.3390/
app112211059
Academic Editor: Roxana
Elena Ionete
Received: 15 October 2021
Accepted: 17 November 2021
Published: 22 November 2021
Publisher’s Note: MDPI stays neutral
with regard to jurisdictional claims in
published maps and institutional affil-
iations.
Copyright: © 2021 by the authors.
Licensee MDPI, Basel, Switzerland.
This article is an open access article
distributed under the terms and
conditions of the Creative Commons
Attribution (CC BY) license (https://
creativecommons.org/licenses/by/
4.0/).
1 Faculty of Biotechnology and Food Sciences, Institute of Food Sciences, Slovak University of Agriculture inNitra, Trieda Andreja Hlinku 2, 94976 Nitra, Slovakia; [email protected] (M.F.);[email protected] (A.M.); [email protected] (Z.A.); [email protected] (J.K.)
2 Department of Ecology and Environmental Sciences, Faculty of Natural Sciences, Constantine thePhilosopher University in Nitra, Trieda Andreja Hlinku 1, 94974 Nitra, Slovakia; [email protected] (M.Š.);[email protected] (I.J.)
3 Faculty of Agriculture, University “Goce Delcev”—Štip, Krste Misirkov 10-A, 2000 Štip, North Macedonia;[email protected]
* Correspondence: [email protected]
Abstract: In this work, chemical parameters such as sugar (glucose and fructose) content, organic acid(total acids, malic and tartaric acids), total phenolic content and the antioxidant activity of 12 whitewines (chardonnay, pinot blanc and pinot gris) from various wine regions in Slovakia were studiedin order to identify differences among the varieties and wine-growing regions. The wine sampleswere examined by Fourier-transform infrared spectroscopy (FTIR) and UV-VIS spectrophotometry(for determination of total polyphenolic content (TPC) and total antioxidant activity (TAA)) methods.Content of alcohol ranged between 11.50% and 13.80% with the mean value 12.52%. Mean content oftotal acids varied between 4.63 ± 0.09 and 6.63 ± 0.05 g.L−1, tartaric acid varied between 1.62 ± 0.09and 2.93 ± 0.03 g L−1, malic acid was found in the concentrations ranged from 0.07 ± 0.05 and2.50 ± 0.08 g L−1 and lactic acid was present between 1.53 and 0.01 g L−1. The content of fructosewas, in general, higher in the samples from the Južnoslovenská and Nitrianska wine regions andglucose was higher in the Malokarpatská wine region. Chardonnay wines showed the highestcontent of total polyphenols and the antioxidant activity in the samples ranged from 51.06 ± 027 to72.53 ± 0.35% inhibition of DPPH. The PCA analysis based on chemical descriptors distinguishedthe Nitrianska and Stredoslovenská wine regions. According to similarities among the wine samples,four main classes were formed by cluster analysis.
Keywords: white wine; FTIR; UV-VIS spectrophotometry; chemical composition; geographic indication
1. Introduction
The primary and secondary plant metabolites play critical roles in the health of humansand could be nutritionally important. Many of these compounds are also considered to becrucial factors for food and beverage quality. Evaluation of food and wine quality and thevalue for human health is often connected with various physical-chemical and organolepticproperties [1–3]. Wine, as one of the world’s widely consumed beverages, has been provedto have health-promoting effects as a function of metabolites belonging to various differentgroups of chemicals [1,4].
Various factors affect the quality of wine, including its taste and aroma, such as grapevariety, ripening stage, environmental conditions, soil, vine cultivation, as well as wine-making practices applied during wine production [5–10]. The main difference between redand white wine production is the duration of maceration applied. For red wine production,studies are primarily focused on the influence of different maceration times/days on theextraction of grape pigments and tannins [11]. For white wine production, maceration
Appl. Sci. 2021, 11, 11059. https://doi.org/10.3390/app112211059 https://www.mdpi.com/journal/applsci
Appl. Sci. 2021, 11, 11059 2 of 13
is kept to a minimum and seldom lasts more than a few hours in order to avoid exten-sive contact with oxygen, which can cause browning of the wine and deterioration of theoverall quality [12]. Usually, the grape juice runs freely from the crushed grapes followedby the immediate addition of SO2 in order to protect enzymatic oxidation. Moreover,wine possesses antioxidant properties which are attributed by the content of biologicallyactive compounds, such as phenolic compounds and organic acids [13,14]. High antioxi-dant activity of the polyphenolic compounds is linked with both free radical scavengingand transition metal chelating properties that contribute to antibacterial, antimutagenic,anti-inflammatory and vasodilatory action [15,16].
Determination of the main chemical composition of wine, including ethanol content,residual sugars, total and volatile acidity, main organic acids, as well as aroma compounds,phenolic compounds and antioxidant properties could be considered as one of the mostimportant parameters that determine the quality of wine. Carbohydrates are primarymetabolites that are used by plants in the process of respiration and as a building materialfor cell wall structure. They are synthesized throughout the process of photosynthesis andtheir content increases as fruits ripen. Main carbohydrates in grapes are glucose and fruc-tose, also known as reductive sugars, with concentrations of 150–250 g L−1 in must. Impactof these components in wines, increase its viscosity, is important qualitative attributes ofwine [17]. In grapes, glucose and fructose are present in almost equal concentrations. Theglucose/fructose ratio is mainly affected by the climate conditions of the region and theyear of harvest and, usually, the ratio decreases during warmer weather and increases incolder weather conditions [6–8]. During fermentation, the glucose/fructose ratio decreasesfrom 0.95 at the beginning to 0.25 towards the end of fermentation since glucose is primarilyfermented because it is used by the yeast. The composition and content of sugars havebeen proposed by Gnilomedova et al. [6] as one of the chemical characteristics that canbe used for verifying the authenticity of the grape origin of various products. In order tocheck the origin of wine and its adulteration, such as unauthorized addition of sucrose, thenuclear magnetic resonance is used [18].
Over the last few years, higher attention has been paid to organic acids, their im-portance and their health benefits. Organic acids are natural components that contributeto the organoleptic (flavour, colour and aroma) and healthy properties (antioxidant andantimicrobial activity) of food [14,19–21]. In wines, organic acids have a major role in thecomposition, the stability and the organoleptic qualities [14,22], as well as contributing topreservative properties’ enhancement in terms of the microbiological and the physicochem-ical stability [23]. The main organic acids in wine are tartaric, malic, citric, lactic, succinicand acetic acids. Over 90% of organic acids in grapes and thus in wine are dedicated tomalic and tartaric acids. As these two acids are the most abundant in grapes, their levelsare often used to determine the date of harvest, since each acid behaves differently duringthe ripening process [24]. Tartaric acid is the main organic acid in grapes and wines thatsignificantly affects the total acidity of wines. Tartaric acid is the dominant organic acidin wines, which plays a significant role in maintaining the chemical stability of the wine,its colour and its taste. The content of tartaric acid decreases during the fermentation as aresult of precipitation in the form of tartaric crystals [25].
The other important chemical parameters which determine wine quality are phenoliccompounds. They strongly contribute to the colour, mouthfeel, astringency and bitternessof the wine [16,26,27]. Phenolic compounds originate from different parts of the grape:(i) grape skins contain anthocyanins, flavan-3-ols, flavonols, dihydroflavonols, hydrox-ycinnamoyl tartaric acids, hydroxybenzoic acids and hydroxystilbenes; (ii) flavan-3-olsand gallic acid are dominant in the seeds; and (iii) hydroxycinnamoyl tartaric acids aremainly present in the juice [28]. The phenolic composition of wines depends on the grapecomposition, on their extraction into the grape juice, and also, on the subsequent reactionsoccurring during the vinification, post-fermentation treatments, and wine aging [12]. Thecontent of phenolic substances in the peel can be up to 2.5%, while their proportion ishigher in red varieties of grape compared to white varieties [29].
Appl. Sci. 2021, 11, 11059 3 of 13
During the last decade many studies have been performed in the analysis of phenoliccompounds in wines, as well as organic acids and sugars. With regard to Slovak whitewines, limited data on the total phenolics and antioxidant properties are available [30–32].By current knowledge, there is no similar survey of white wines in Slovakia that reportssuch a comparison of white wine varieties according to potential chemical descriptors inrelation to geographic origin. Therefore, the objectives of the present work were (1) todetermine the main carbohydrates (glucose and fructose), organic acids (malic, tartaricand lactic) as well as alcohol content, total phenolics and antioxidant activity in whiteSlovak wines from chardonnay, pinot blanc and pinot gris varieties, and (2) to study therelationship between the chemical composition of white wines from various varieties andwine geographic indication, applying Fourier-transform infrared (FTIR) spectroscopy andUV-Vis spectrophotometric (TAA, TPC) methods.
2. Materials and Methods2.1. Chemicals and Reagents
Folin–Ciocalteu phenol reagent (Centralchem, Slovakia), sodium carbonate p.a. (99%;Centralchem, Slovakia), gallic acid (3, 4, 5-trihydroxybenzoic acid monohydrate, 99%;Alfa Aesar Thermo Fisher (Kandel) GmbH, Kandel, Germany) were used for determi-nation of the total polyphenolic content. All the reagents were dissolved in distilledwater. The crucial reagent used for the total antioxidant activity (TAA) measurements was1,1-diphenyl-2-picrylhydrazyl radical (DPPH) (Sigma-Aldrich; Merck KGaA, Darmstadt,Germany) dissolved in methanol p.a. (99.8%; Centralchem, Slovakia). Standard wine forFT-IR analysis (Bruker Optic GmbH, Ettlingen, Germany) was purchased from OK ServisBioPro, Ltd. (Praha, Czech Republic) and deionized water was used for the sample andmobile phase preparation.
2.2. Wine Samples
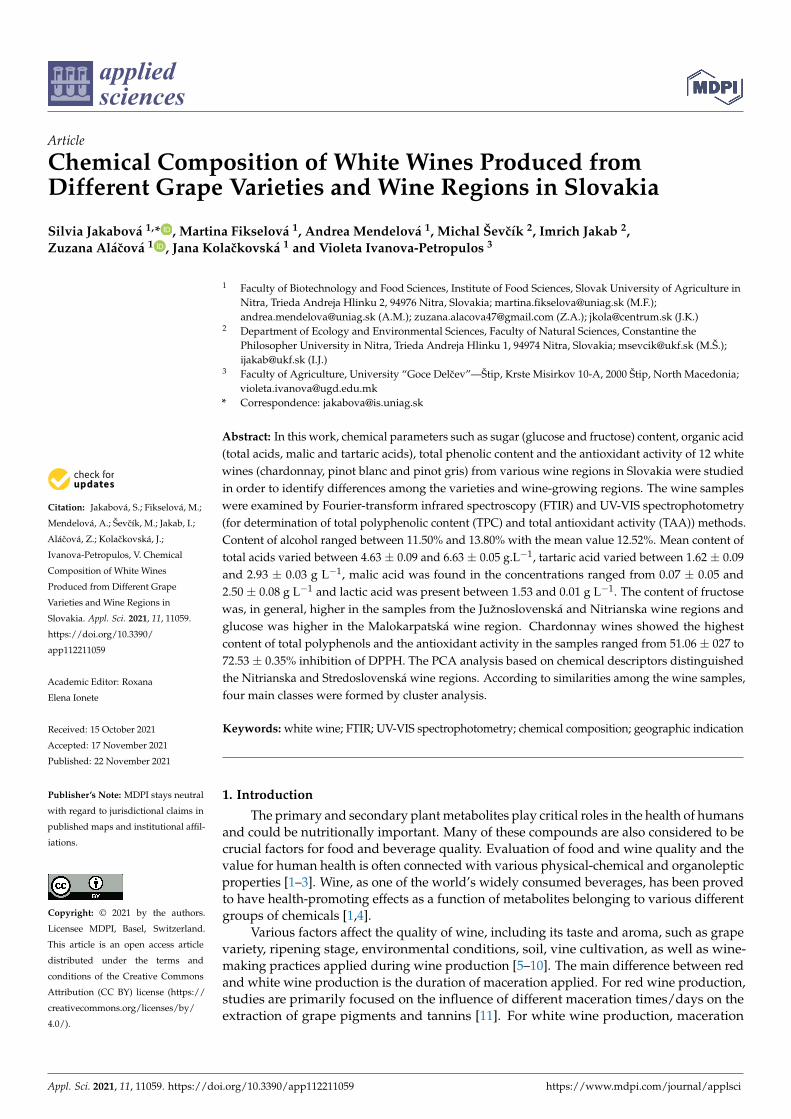
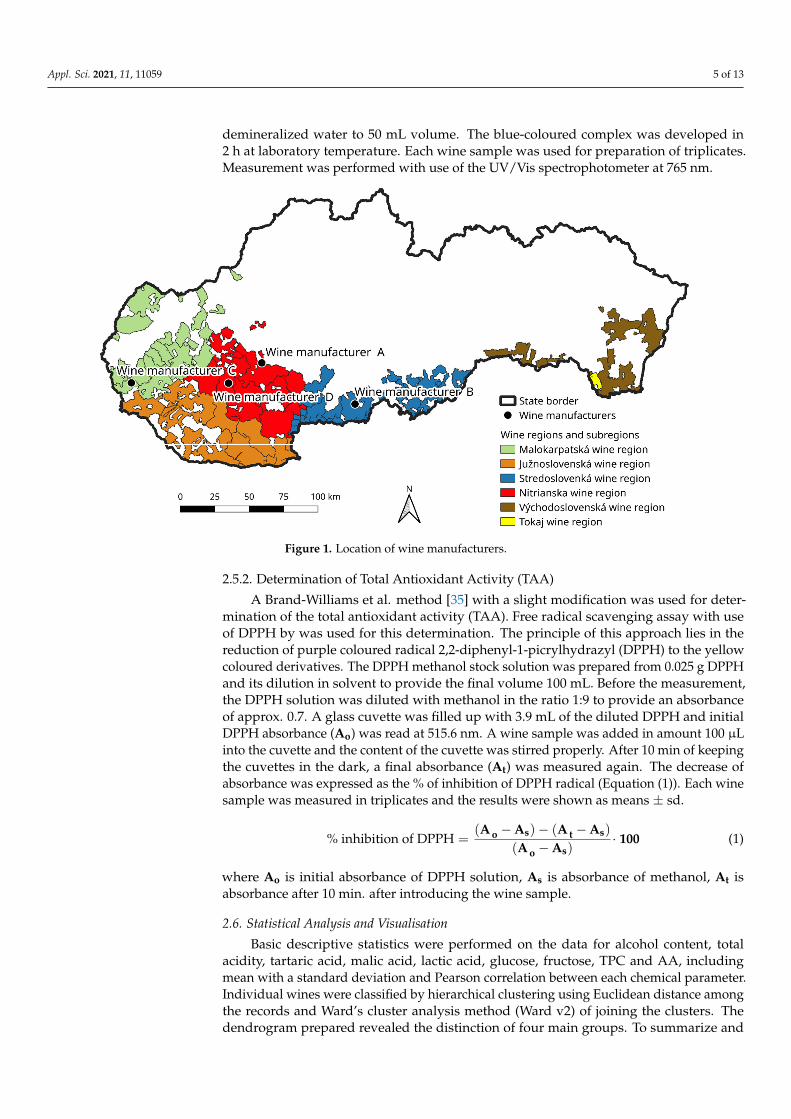
Samples of 12 different white wines, belonging to three grape varieties of chardonnay,pinot blanc and pinot gris, were analysed in this study. Wines were produced from the 2018vintage year; all samples were obtained in June 2020 from wineries as three bottles of thesame batch of each wine variety. All wines (750 mL glass bottles) were collected from fourwine-growing regions in Slovakia, as is shown in Table 1. The wine samples in this studyare described in Table 1. Samples were kept at 4 ◦C before the analysis. All analyses wereperformed in July 2020 in one day. Location of wine manufacturers is shown in Figure 1.
2.3. Sample Preparation
Before analysis, minimal sample preparation was performed, including centrifugationof wine samples for 2 min with a relative centrifugal force 3622. The centrifugate wastransferred into another flask and analysed.
2.4. FTIR Analyses
Determination of the selected chemical parameters (alcohol content, total acids, tar-taric, malic, lactic acids glucose and fructose) in wine samples was performed using theALPHA Bruker Optik GMBH analyser. Fourier transform infrared spectroscopy (FT-IR)with the attenuated total reflect (ATR) measurement procedure was used. The method al-lows simultaneous analysis of different parameters within one measurement. The analyserwas calibrated for wine with use of calibration data from wine measurements, what wasperformed by technical support of OK Servis BioPro, Ltd. Company. The calibration dataconsisted of over 2000 red and white wines. The calibration data containing measurementof calibration spectra and the calibration settings according to the reference values wereprovided by the accredited (DAkkS) Institute Heidger (Osann Monzel, Germany). The rootmean square error of prediction (RMSEP) has been determined. The ranges of calibrationcurves and RMSEP (in the brackets) were as follows: alcohol 0.12–20.48% (0.27); fructose0.1–111.5 g L−1 (0.71); glucose 0.2–125.6 g L−1 (0.87); total acids 2.9–13.5 g L−1 (0.31); malic
Appl. Sci. 2021, 11, 11059 4 of 13
acid 0.1–4.7 g L−1 (0.40); tartaric acid 0.5–5.4 g L−1 (0.43); lactic acid 0.0–4.3 g L−1 (0.31),for Fourier-transform infrared (FTIR) spectroscopy. Before starting the measurement, theflow-through cell of the ALPHA analyser was rinsed with deionized water and a blank(deionized water) was measured. Approximately 20 mL of wine sample was injected intothe flow-through cell, where the sample was heated to 40 ◦C and then measured. The spec-trum was scanned in the wavenumber range between 4000 and 400 cm−1. The instrumentevaluated the sample within 70–100 s and the results for all five parameters were recorded.Precision of the method was checked by analysing the standard wine for analysis (BrukerOptic GmbH, Ettlingen, Germany) with reference values of individual parameters thatwere tested by reference methods (high performance liquid chromatography, pH electrode,titration, density meter).
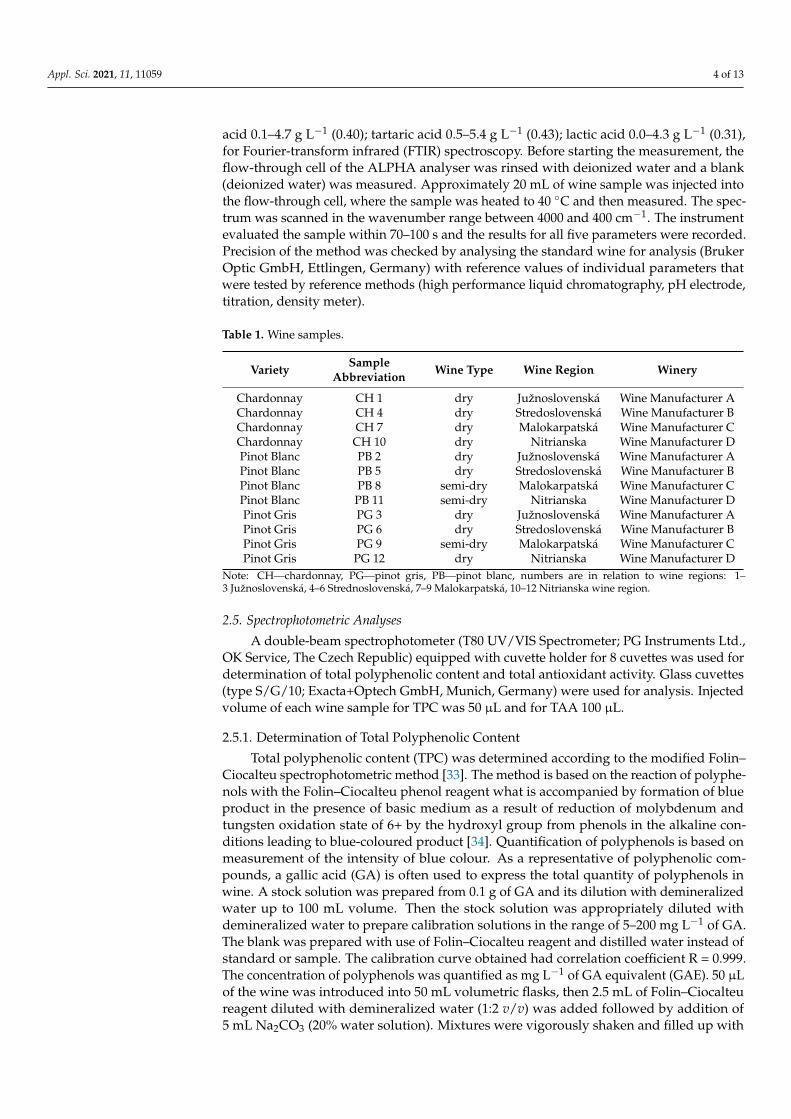
Table 1. Wine samples.
Variety SampleAbbreviation Wine Type Wine Region Winery
Chardonnay CH 1 dry Južnoslovenská Wine Manufacturer AChardonnay CH 4 dry Stredoslovenská Wine Manufacturer BChardonnay CH 7 dry Malokarpatská Wine Manufacturer CChardonnay CH 10 dry Nitrianska Wine Manufacturer DPinot Blanc PB 2 dry Južnoslovenská Wine Manufacturer APinot Blanc PB 5 dry Stredoslovenská Wine Manufacturer BPinot Blanc PB 8 semi-dry Malokarpatská Wine Manufacturer CPinot Blanc PB 11 semi-dry Nitrianska Wine Manufacturer DPinot Gris PG 3 dry Južnoslovenská Wine Manufacturer APinot Gris PG 6 dry Stredoslovenská Wine Manufacturer BPinot Gris PG 9 semi-dry Malokarpatská Wine Manufacturer CPinot Gris PG 12 dry Nitrianska Wine Manufacturer D
Note: CH—chardonnay, PG—pinot gris, PB—pinot blanc, numbers are in relation to wine regions: 1–3 Južnoslovenská, 4–6 Strednoslovenská, 7–9 Malokarpatská, 10–12 Nitrianska wine region.
2.5. Spectrophotometric Analyses
A double-beam spectrophotometer (T80 UV/VIS Spectrometer; PG Instruments Ltd.,OK Service, The Czech Republic) equipped with cuvette holder for 8 cuvettes was used fordetermination of total polyphenolic content and total antioxidant activity. Glass cuvettes(type S/G/10; Exacta+Optech GmbH, Munich, Germany) were used for analysis. Injectedvolume of each wine sample for TPC was 50 µL and for TAA 100 µL.
2.5.1. Determination of Total Polyphenolic Content
Total polyphenolic content (TPC) was determined according to the modified Folin–Ciocalteu spectrophotometric method [33]. The method is based on the reaction of polyphe-nols with the Folin–Ciocalteu phenol reagent what is accompanied by formation of blueproduct in the presence of basic medium as a result of reduction of molybdenum andtungsten oxidation state of 6+ by the hydroxyl group from phenols in the alkaline con-ditions leading to blue-coloured product [34]. Quantification of polyphenols is based onmeasurement of the intensity of blue colour. As a representative of polyphenolic com-pounds, a gallic acid (GA) is often used to express the total quantity of polyphenols inwine. A stock solution was prepared from 0.1 g of GA and its dilution with demineralizedwater up to 100 mL volume. Then the stock solution was appropriately diluted withdemineralized water to prepare calibration solutions in the range of 5–200 mg L−1 of GA.The blank was prepared with use of Folin–Ciocalteu reagent and distilled water instead ofstandard or sample. The calibration curve obtained had correlation coefficient R = 0.999.The concentration of polyphenols was quantified as mg L−1 of GA equivalent (GAE). 50 µLof the wine was introduced into 50 mL volumetric flasks, then 2.5 mL of Folin–Ciocalteureagent diluted with demineralized water (1:2 v/v) was added followed by addition of5 mL Na2CO3 (20% water solution). Mixtures were vigorously shaken and filled up with
Appl. Sci. 2021, 11, 11059 5 of 13
demineralized water to 50 mL volume. The blue-coloured complex was developed in2 h at laboratory temperature. Each wine sample was used for preparation of triplicates.Measurement was performed with use of the UV/Vis spectrophotometer at 765 nm.
Appl. Sci. 2021, 11, x FOR PEER REVIEW 4 of 13
Pinot Gris PG 12 dry Nitrianska Wine Manufacturer D Note: CH—chardonnay, PG—pinot gris, PB—pinot blanc, numbers are in relation to wine regions: 1–3 Južnoslovenská, 4–6 Strednoslovenská, 7–9 Malokarpatská, 10–12 Nitrianska wine region.
Figure 1. Location of wine manufacturers.
2.3. Sample Preparation Before analysis, minimal sample preparation was performed, including
centrifugation of wine samples for 2 min with a relative centrifugal force 3622. The centrifugate was transferred into another flask and analysed.
2.4. FTIR Analyses Determination of the selected chemical parameters (alcohol content, total acids,
tartaric, malic, lactic acids glucose and fructose) in wine samples was performed using the ALPHA Bruker Optik GMBH analyser. Fourier transform infrared spectroscopy (FT-IR) with the attenuated total reflect (ATR) measurement procedure was used. The method allows simultaneous analysis of different parameters within one measurement. The analyser was calibrated for wine with use of calibration data from wine measurements, what was performed by technical support of OK Servis BioPro, Ltd. Company. The calibration data consisted of over 2000 red and white wines. The calibration data containing measurement of calibration spectra and the calibration settings according to the reference values were provided by the accredited (DAkkS) Institute Heidger (Osann Monzel, Germany). The root mean square error of prediction (RMSEP) has been determined. The ranges of calibration curves and RMSEP (in the brackets) were as follows: alcohol 0.12–20.48% (0.27); fructose 0.1–111.5 g L−1 (0.71); glucose 0.2–125.6 g L−1 (0.87); total acids 2.9–13.5 g L−1 (0.31); malic acid 0.1–4.7 g L−1 (0.40); tartaric acid 0.5–5.4 g L−1 (0.43); lactic acid 0.0–4.3 g L−1 (0.31), for Fourier-transform infrared (FTIR) spectroscopy. Before starting the measurement, the flow-through cell of the ALPHA analyser was rinsed
Figure 1. Location of wine manufacturers.
2.5.2. Determination of Total Antioxidant Activity (TAA)
A Brand-Williams et al. method [35] with a slight modification was used for deter-mination of the total antioxidant activity (TAA). Free radical scavenging assay with useof DPPH by was used for this determination. The principle of this approach lies in thereduction of purple coloured radical 2,2-diphenyl-1-picrylhydrazyl (DPPH) to the yellowcoloured derivatives. The DPPH methanol stock solution was prepared from 0.025 g DPPHand its dilution in solvent to provide the final volume 100 mL. Before the measurement,the DPPH solution was diluted with methanol in the ratio 1:9 to provide an absorbanceof approx. 0.7. A glass cuvette was filled up with 3.9 mL of the diluted DPPH and initialDPPH absorbance (Ao) was read at 515.6 nm. A wine sample was added in amount 100 µLinto the cuvette and the content of the cuvette was stirred properly. After 10 min of keepingthe cuvettes in the dark, a final absorbance (At) was measured again. The decrease ofabsorbance was expressed as the % of inhibition of DPPH radical (Equation (1)). Each winesample was measured in triplicates and the results were shown as means ± sd.
% inhibition of DPPH =(A o − As)− (A t − As)
(A o − As)· 100 (1)
where Ao is initial absorbance of DPPH solution, As is absorbance of methanol, At isabsorbance after 10 min. after introducing the wine sample.
2.6. Statistical Analysis and Visualisation
Basic descriptive statistics were performed on the data for alcohol content, totalacidity, tartaric acid, malic acid, lactic acid, glucose, fructose, TPC and AA, includingmean with a standard deviation and Pearson correlation between each chemical parameter.Individual wines were classified by hierarchical clustering using Euclidean distance amongthe records and Ward’s cluster analysis method (Ward v2) of joining the clusters. Thedendrogram prepared revealed the distinction of four main groups. To summarize and
Appl. Sci. 2021, 11, 11059 6 of 13
visualize the variation between the regions we used principal components analysis (PCA)calculated from centred and standardized data. The ANOVA for repeated measurementswas applied for testing differences among the individual chemical parameters in individualwine-growing regions, followed by post hoc comparations using the Tukey HSD method.The results for each wine parameter were standardized and centred based on variety.The differences were tested at the significant level p < 0.05. All statistical analyses wereperformed in the R statistical environment [36].
The Figure 1 was created using QGIS software (3.14.16-Pi, producer: Free SoftwareFoundation, Inc., Boston, MA, USA) [37] to visualize locations of wine manufacturers.
3. Results and Discussion
Table 2 shows the chemical composition of all wines according to the differentgrape varieties (chardonnay, pinot blanc and pinot gris) and the wine regions of origin(Južnoslovenská, Stredoslovenská, Malokarpatská and Nitrianska).
Table 2. Characterization of chemical composition of monovarietal wines.
WineSample Alcohol Total
AcidsTartaric
Acid Malic Acid Lactic Acid Fructose Glucose TPC TAA
[%] [g L−1] [g L−1] [g L−1] [g L−1] [g L−1] [g L−1] [mg L−1 GAE] [% InhibitionDPPH]
CH1 12.23 ± 0.09 6.37 ± 0.05 2.61 ± 0.02 2.50 ± 0.08 0.31 ± 0.06 6.10 ± 0.08 1.33 ± 0.05 403.64 ± 9.41 59.43 ± 0.30PB2 12.50 ± 0.00 6.63 ± 0.05 2.78 ± 0.04 2.43 ± 0.12 0.36 ± 0.06 4.8 ± 0.14 1.03 ± 0.17 283.19 ± 8.03 60.74 ± 0.32PG3 12.40 ± 0.00 5.43 ± 0.05 2.24 ± 0.01 1.87 ± 0.05 0.52 ± 0.08 2.17 ± 0.12 2.40 ± 0.16 307.77 ± 20.47 67.40 ± 0.44CH4 12.20 ± 0.00 5.47 ± 0.05 2.93 ± 0.03 0.07 ± 0.05 1.30 ± 0.02 0.63 ± 0.12 0.30 ± 0.08 329.89 ± 9.41 60.32 ± 1.03PB5 12.37 ± 0.05 5.77 ± 0.05 2.56 ± 0.06 1.03 ± 0.19 0.98 ± 0.08 0.53 ± 0.25 0.23 ± 0.17 379.06 ± 4.92 60.96 ± 0.57PG6 11.90 ± 0.00 5.77 ± 0.05 2.77 ± 0.04 0.77 ± 0.12 0.82 ± 0.03 0.73 ± 0.05 <0.20 268.44 ± 8.03 72.53 ± 0.35CH7 12.70 ± 0.00 5.23 ± 0.05 2.32 ± 0.06 1.50 ± 0.08 0.86 ± 0.08 1.7 ± 0.08 0.83 ± 0.05 339.72 ± 9.41 61.60 ± 0.24PB8 12.20 ± 0.00 5.23 ± 0.05 2.09 ± 0.07 1.10 ± 0.14 1.11 ± 0.04 4.63 ± 0.09 3.33 ± 0.05 312.68 ± 8.03 59.98 ± 0.51PG9 11.50 ± 0.00 5.67 ± 0.05 2.57 ± 0.03 1.17 ± 0.05 0.87 ± 0.05 5.33 ± 0.09 3.03 ± 0.09 256.15 ± 9.41 51.06 ± 0.27
CH10 13.80 ± 0.00 5.10 ±0.001 1.62 ± 0.09 1.00 ± 0.08 1.53 ± 0.03 6.80 ± 0.14 <0.20 396.26 ± 23.41 71.87 ± 0.95
PB11 12.77 ± 0.05 4.93 ± 0.05 2.04 ± 0.08 1.87 ± 0.05 0.14 ± 0.03 6.73 ± 0.09 0.3 ± 0.16 283.19 ± 8.03 52.78 ± 0.47PG12 13.67 ± 0.05 4.63 ± 0.09 1.63 ± 0.06 1.63 ± 0.12 0.85 ± 0.05 1.63 ± 0.09 0.67 ± 0.12 381.51 ± 8.03 66.80 ± 0.66Mean 12.52 5.52 2.35 1.41 0.8 3.48 1.13 328.46 62.12Min 11.50 4.63 1.62 0.07 0.01 0.53 0.01 256.15 51.06Max 13.80 6.63 2.93 2.50 1.53 6.80 3.33 403.64 72.53
Abbreviation of wines: CH—charodnnay, PB—pinot blanc and PG—pinot gris. Numbers are in relation to wine regions: 1–3 Južnoslovenská,4–6 Strednoslovenská, 7–9 Malokarpatská, 10–12 Nitrianska wine region. Results are mean values of three repetitions ± sD (standarddeviation).
3.1. Influence of Variety
Total acid content is defined as the concentration of organic acids in the grape orwine [38]. Total acids in white wine samples varied from 4.63 ± 0.09 to 6.63 ± 0.05 g L−1.
The content of organic acids, tartaric and malic, was studied in white wines asthey are considered as one of the important descriptors of wine. Tartaric acid (2,3-dihydroxybutanedioic acid) is a predominant acid in wines and represents about 50%of total acids in wine [39]. In our wines, the concentration of tartaric acids was similar.
Thus, tartaric acid in chardonnay wines ranged from 1.63 to 2.93 g L−1 (mean:2.37 g L−1). Pinot blanc wines contained tartaric acid in a range of 2.04 to 2.78 g L−1
(mean: 2.37 g L−1) and pinot gris wines presented 1.63–2.77 g L−1 (mean: 2.30 g L−1).During the fermentation and aging process, its concentration decreases as a result of theformation of tartrates.
The content of malic acid is usually highest at the beginning of the alcoholic fermen-tation, and afterwards it converts into lactic acid, spontaneously or in the presence ofmalolactic bacteria, during the malolactic fermentation. During this process, the contentof malic acid decreases and the content of lactic acid increases in wine [40]. In our study,most of the wines contained malic acid in concentrations higher than 1 g L−1, exceptwines CH4 and PG6, which contained 0.07 and 0.77 g L−1, respectively, which means thatmalolactic fermentation was almost completed in these wines. In addition, chardonnaywines contained from 0.07 to 2.50 g L−1 malic acid (average: 1.27 g L−1), in pinot blancmalic acid was present in a range of 1.03–2.43 g L−1 (average: 1.61 g L−1) and in pinot gris
Appl. Sci. 2021, 11, 11059 7 of 13
wines from 0.77–1.87 g L−1 (average: 1.36 g L−1). Ailer [18] reported that content of malicacid in white and rosé wines is usually in the range between 1–3 g L−1. Content of lacticacid was in most cases below 1 g L−1, except wines CH4, PB8 and CH10. The obtainedresults for total acids, tartaric and malic acids in the white Slovak wines were comparableto those reported in the literature for wines from various regions, including Spain, Brazil,Chile, France [41–44].
Glucose and fructose are the main fermentable sugars in wine must. During alcoholicfermentation, yeasts convert most of the glucose and fructose present into alcohol and CO2.Grape musts contain equal amounts of glucose and fructose, and during fermentationglucose is consumed at a higher rate than fructose, which leads to an increased proportionof fructose as fermentation progresses, as was also observed in our wines. In general, allwines contained a higher amount of fructose (on average: 3.81 g L−1 for chardonnay wines;4.17 g L−1 for pinot blanc wines and 2.47 g L−1 for pinot gris wines) compared to glucose(on average: 0.63 g L−1 for chardonnay wines; 1.22 g L−1 for pinot blanc wines and 1.53 gL−1 for pinot gris wines). The higher values for fructose compared to glucose, obtained forthe wine samples, can be explained by the preference of Saccharomyces cerevisiae yeasts toferment glucose, resulting in larger residual amounts of fructose in wines. Restani et al. [45]reported that fructose and glucose levels in high quality wines is low (0.71 ± 0.73 and0.32 ± 0.44 g L−1, respectively), however, in some sweet and sparkling wines fructoseand glucose levels can be much higher. Coelho et al. [46] reported the mean glucose andfructose contents were less than 1.23 and 4.97 g L−1.
Content of alcohol in wines varied between 11.50 and 13.80% with the mean 12.52%.Mean content of alcohol in chardonnay wines was 12.73 ± 0.65%, in pinot blanc 12.46 ± 0.21%and in pinot gris 12.37 ± 0.82%. The highest content of alcohol was observed in chardonnayfrom Nitrianska w.r. and the lowest in pinot gris from Malokarpatská w.r.
White wines typically show lower content of phenolic compounds compared tored ones. The most dominant polyphenols in white wines are hydroxycinnamic acidderivatives, hydroxybenzoic acids, flavonols and flavan-3-ols that are related to winesensorial properties, such as the chromatic characteristics, colour stability, bitterness andastringency [27]. Our wines presented relatively high values of total polyphenols, rangingfrom 329 to 403 mg GAE L−1 for chardonnay, from 283 to 379 mg GAE.L−1 for pinot blancand 256 to 381 mg GAE L−1 for pinot gris wines. The highest content of total polyphenolswas found in chardonnay from the Južnoslovenská wine-growing region (403.64 ± 9.41 mgGAE L−1). In all other chardonnay wine samples, the TPC levels exceeded a content of300 mg GAE L−1. In comparison with the chardonnay wines from Montenegro (TPC226 mg GAE L−1) [47], the content in Slovak chardonnay wines was higher in more than100 mg GAE L−1. Our results are also in agreement with experiments by Bajcan et al. [30]and Céryová et al. [31], who examined the antioxidant activity, total phenolic and flavonoidcontents in monovarietal wines of Welschriesling, chardonnay. According to their results,Slovak white wines were high in polyphenols (average content was 303.2 mg GAE.L−1 inWelschriesling, resp. 355.6 mg GAE L−1 in chardonnay).
Total antioxidant activity presents one of the important characteristics of wine. Ingeneral, a higher level of antioxidants is connected with higher levels of polyphenols. In ourstudy, all wines presented relatively high values for the antioxidant activity, ranged between51.06 and 72.53% of inhibition of DPPH (average: 63.30% for chardonnay, 58.62% for pinotblanc and 64.45 for pinot gris wines). Our results for antioxidant activity were correlatedwith previously published data for white wines [30,31,48]. According to several studies,polyphenolic compounds have shown a different behaviour towards DPPH free radical,both in terms of capacity and rate of scavenging [49,50]. The antioxidant activity of phenoliccompounds is related with their chemical structure. Higher activity has been reportedin the compounds with a high number of hydroxyl groups. The contribution of eachpolyphenol to the antioxidant activity of wines is different, so the activity of wines dependson their phenolic profile. De Quirós et al. [50] examined correlation between the severalpolyphenol compounds and their antioxidant activity. A good positive correlation was
Appl. Sci. 2021, 11, 11059 8 of 13
observed between antioxidant activity and quercetin content, and rutin and procyanidinB1 showed a reasonable correlation (approx. 0.55). No correlation was found betweencaftaric acid, the predominant major phenolic compound in wines. In our study, somewine samples showed different trend connected with high TPC values and lower TAA orlower TPC and higher TAA values, what was confirmed in all three batches of wines. Aphenolic profile and presence of other kinds of antioxidants in wines was not followed.
To quantify the relationship among each of the chemical parameters, Pearson corre-lation was used. Weak positive correlation was found between TPC and TAA (r = 0.33),glucose and fructose content (r = 0.25) and malic acid and fructose (r = 0.47). The highestpositive correlation was observed between total acids and the content of tartaric acid(r = 0.76) due to the fact that most wine acidity is attributed to tartaric acid concentration.High positive correlation was also observed between alcohol content and TPC (r = 0.63) andalcohol content and TAA (r = 0.44). Weak negative correlation was determined betweenthe TPC and tartaric acid (r = −0.39), similar weak negative correlation was observedbetween TAA and fructose (r = −0.36), TAA and glucose (r = −0.39), and TPC and glucose(r = −0.33). High negative correlation was observed between alcohol content and totalacids (r = −0.54) and the highest was negative correlation between alcohol content andtartaric acid (r = −0.8) and between malic acid and lactic acid (r = −0.81).
3.2. Influence of Wine Region
In terms of the geographical origin of wine, certain regions are particularly famousfor their wines. Elemental fingerprinting presents one attempt to measure regionality [51].The other approach is based on sensory properties and volatile components. Wine as acomplex matrix contains volatile and non-volatile components that affect the perceptionof aromas, taste and mouthfeel and, despite the similar chemical characteristics, sensorycharacteristics can be very different. Studies by Heymann et al. [52], King et al. [53] andUrvieta et al. [54] revealed the fact that differentiation of wines of the same variety, but ofdifferent appellations of origin, can be based on sensory properties. Phenolics have alsobeen proposed as chemical markers to establish cultivar authenticity and geographicalorigin of grapes [54,55]. Slovakia, however, the small country, presents a heterogeneousenvironment especially in terms of geological and soil conditions. A reflection of this factcan be found in the chemical composition of grapes cultivated in different wine regions. Theacidic character of wine was chosen as a group distribution of carboxylic acids (includingmalic acid, tartaric acid, lactic acid, etc.) in order to classify South Moravian wines [56].
In our study, the possible influence of wine regions on individual chemical parameterswas also statistically evaluated.
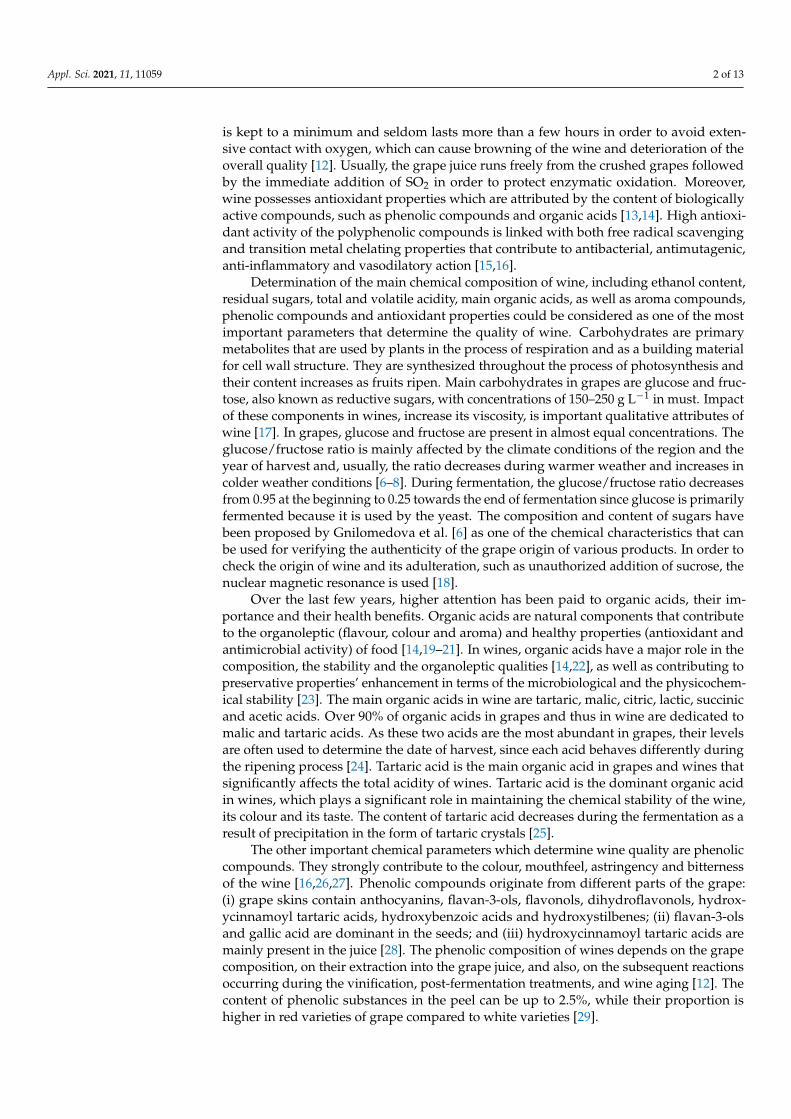
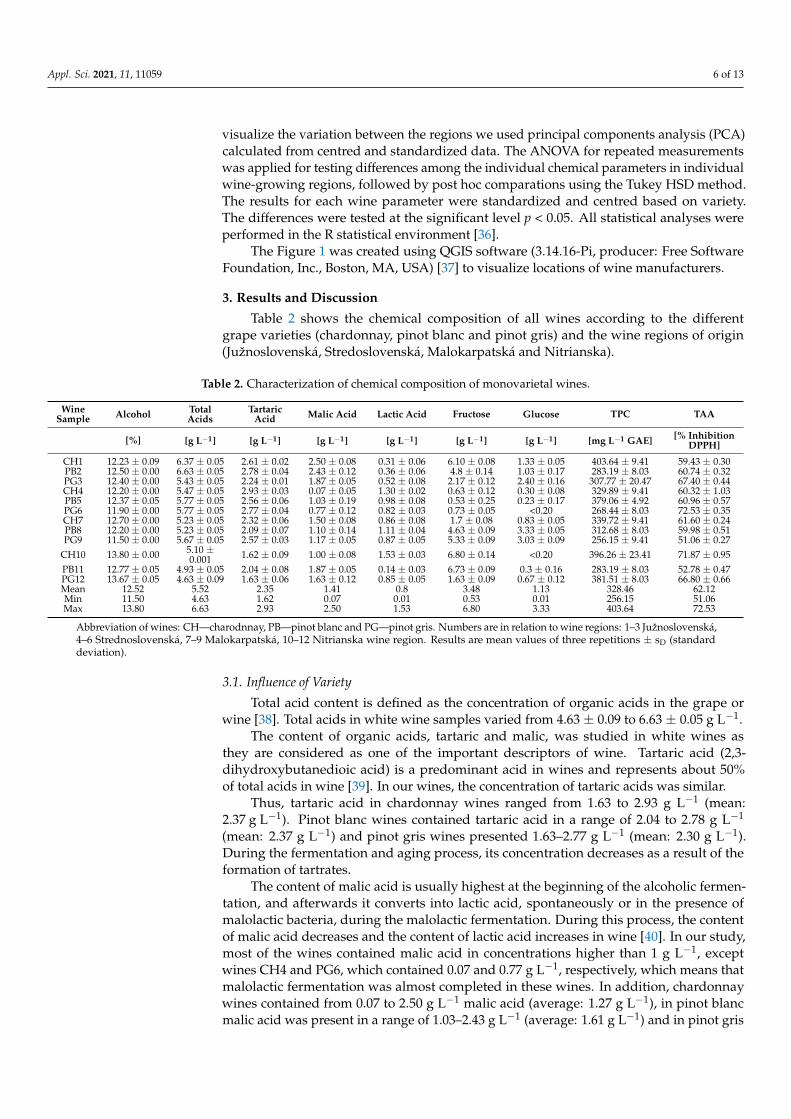
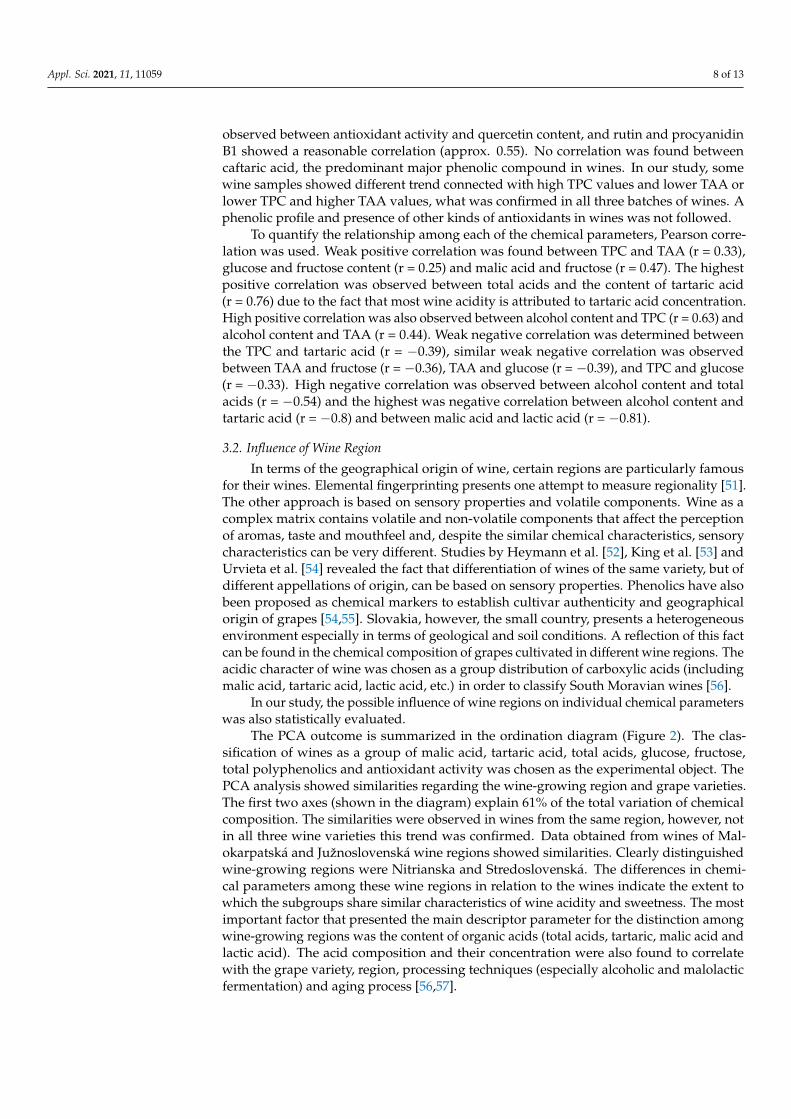
The PCA outcome is summarized in the ordination diagram (Figure 2). The clas-sification of wines as a group of malic acid, tartaric acid, total acids, glucose, fructose,total polyphenolics and antioxidant activity was chosen as the experimental object. ThePCA analysis showed similarities regarding the wine-growing region and grape varieties.The first two axes (shown in the diagram) explain 61% of the total variation of chemicalcomposition. The similarities were observed in wines from the same region, however, notin all three wine varieties this trend was confirmed. Data obtained from wines of Mal-okarpatská and Južnoslovenská wine regions showed similarities. Clearly distinguishedwine-growing regions were Nitrianska and Stredoslovenská. The differences in chemi-cal parameters among these wine regions in relation to the wines indicate the extent towhich the subgroups share similar characteristics of wine acidity and sweetness. The mostimportant factor that presented the main descriptor parameter for the distinction amongwine-growing regions was the content of organic acids (total acids, tartaric, malic acid andlactic acid). The acid composition and their concentration were also found to correlatewith the grape variety, region, processing techniques (especially alcoholic and malolacticfermentation) and aging process [56,57].
Appl. Sci. 2021, 11, 11059 9 of 13
Appl. Sci. 2021, 11, x FOR PEER REVIEW 9 of 13
been proposed as chemical markers to establish cultivar authenticity and geographical origin of grapes [54,55]. Slovakia, however, the small country, presents a heterogeneous environment especially in terms of geological and soil conditions. A reflection of this fact can be found in the chemical composition of grapes cultivated in different wine regions. The acidic character of wine was chosen as a group distribution of carboxylic acids (including malic acid, tartaric acid, lactic acid, etc.) in order to classify South Moravian wines [56].
In our study, the possible influence of wine regions on individual chemical parameters was also statistically evaluated.
The PCA outcome is summarized in the ordination diagram (Figure 2). The classification of wines as a group of malic acid, tartaric acid, total acids, glucose, fructose, total polyphenolics and antioxidant activity was chosen as the experimental object. The PCA analysis showed similarities regarding the wine-growing region and grape varieties. The first two axes (shown in the diagram) explain 61% of the total variation of chemical composition. The similarities were observed in wines from the same region, however, not in all three wine varieties this trend was confirmed. Data obtained from wines of Malokarpatská and Južnoslovenská wine regions showed similarities. Clearly distinguished wine-growing regions were Nitrianska and Stredoslovenská. The differences in chemical parameters among these wine regions in relation to the wines indicate the extent to which the subgroups share similar characteristics of wine acidity and sweetness. The most important factor that presented the main descriptor parameter for the distinction among wine-growing regions was the content of organic acids (total acids, tartaric, malic acid and lactic acid). The acid composition and their concentration were also found to correlate with the grape variety, region, processing techniques (especially alcoholic and malolactic fermentation) and aging process [56,57].
Figure 2. PCA bi-plot of wines with chemical parameters grouped by wine regions.
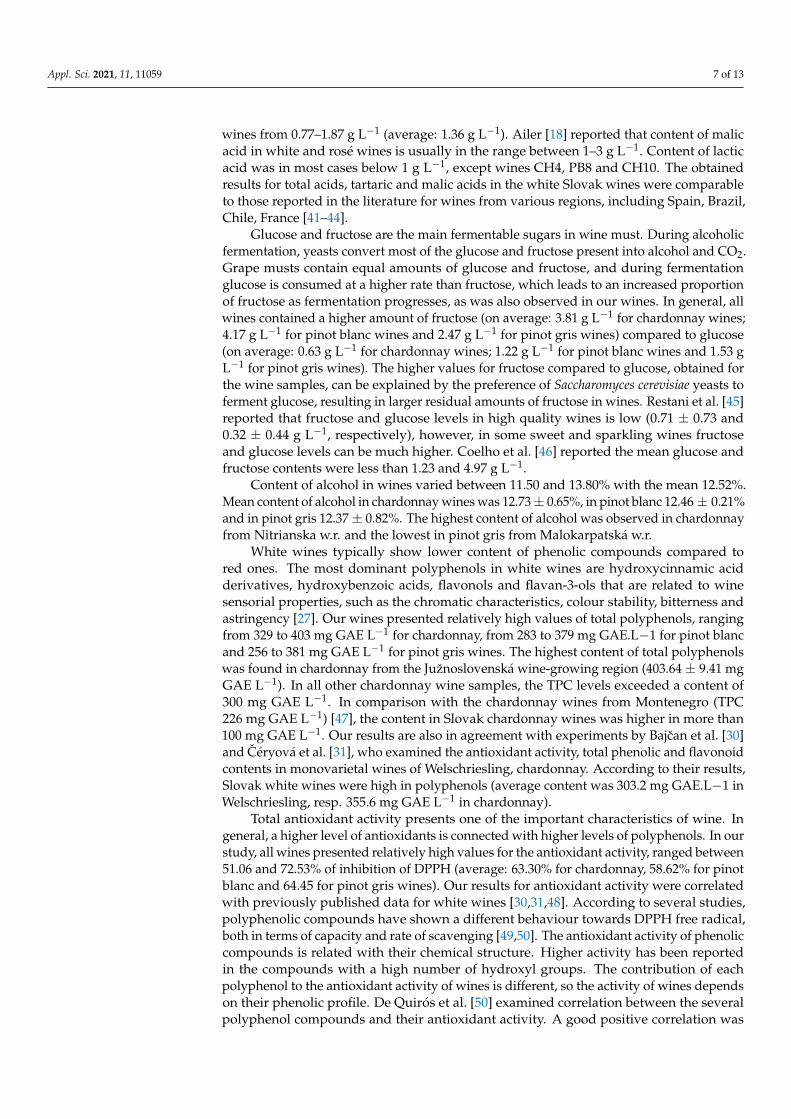
Statistical tests confirmed significant differences in selected chemical parameters in relation to the wine-growing regions (Figure 3). Differences among regions were confirmed in total acids (F3,8 = 6.7, p = 0.0142), caused mainly by differences between the Nitrianska and Južnoslovenská wine regions (t8 = 4.37, p = 0.01). Content of tartaric acid
Figure 2. PCA bi-plot of wines with chemical parameters grouped by wine regions.
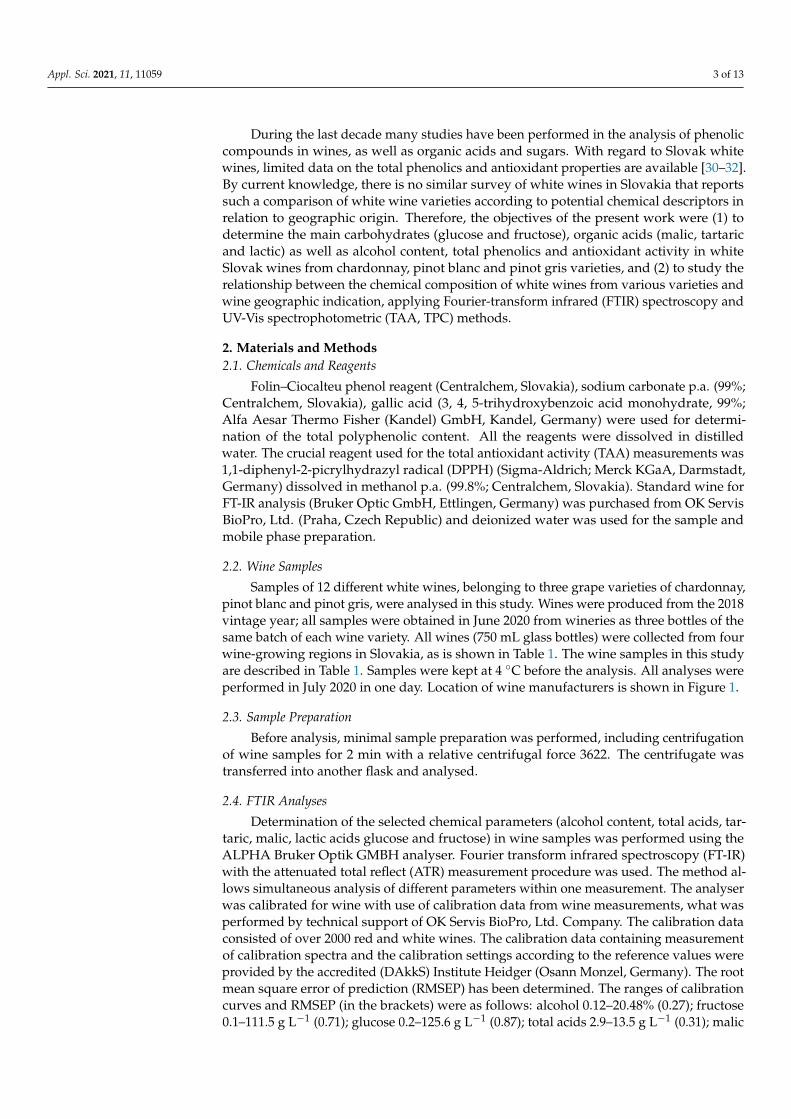
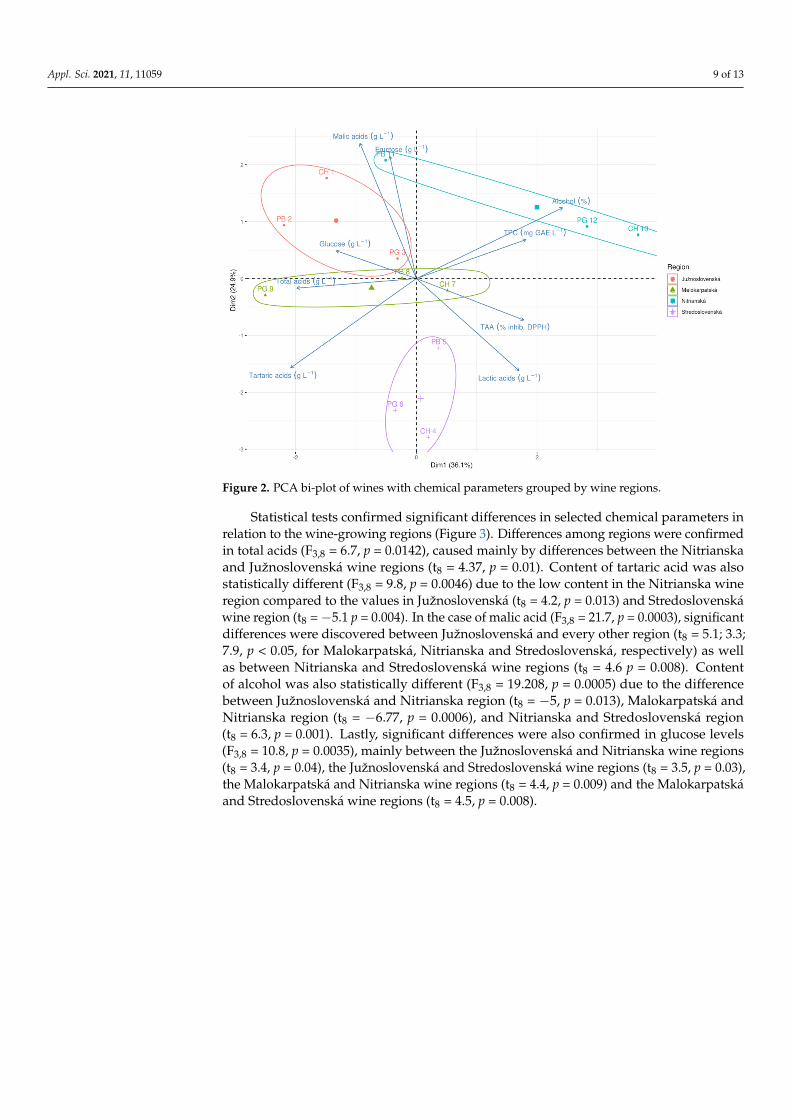
Statistical tests confirmed significant differences in selected chemical parameters inrelation to the wine-growing regions (Figure 3). Differences among regions were confirmedin total acids (F3,8 = 6.7, p = 0.0142), caused mainly by differences between the Nitrianskaand Južnoslovenská wine regions (t8 = 4.37, p = 0.01). Content of tartaric acid was alsostatistically different (F3,8 = 9.8, p = 0.0046) due to the low content in the Nitrianska wineregion compared to the values in Južnoslovenská (t8 = 4.2, p = 0.013) and Stredoslovenskáwine region (t8 = −5.1 p = 0.004). In the case of malic acid (F3,8 = 21.7, p = 0.0003), significantdifferences were discovered between Južnoslovenská and every other region (t8 = 5.1; 3.3;7.9, p < 0.05, for Malokarpatská, Nitrianska and Stredoslovenská, respectively) as wellas between Nitrianska and Stredoslovenská wine regions (t8 = 4.6 p = 0.008). Contentof alcohol was also statistically different (F3,8 = 19.208, p = 0.0005) due to the differencebetween Južnoslovenská and Nitrianska region (t8 = −5, p = 0.013), Malokarpatská andNitrianska region (t8 = −6.77, p = 0.0006), and Nitrianska and Stredoslovenská region(t8 = 6.3, p = 0.001). Lastly, significant differences were also confirmed in glucose levels(F3,8 = 10.8, p = 0.0035), mainly between the Južnoslovenská and Nitrianska wine regions(t8 = 3.4, p = 0.04), the Južnoslovenská and Stredoslovenská wine regions (t8 = 3.5, p = 0.03),the Malokarpatská and Nitrianska wine regions (t8 = 4.4, p = 0.009) and the Malokarpatskáand Stredoslovenská wine regions (t8 = 4.5, p = 0.008).
Appl. Sci. 2021, 11, 11059 10 of 13
Appl. Sci. 2021, 11, x FOR PEER REVIEW 10 of 13
was also statistically different (F3,8 = 9.8, p = 0.0046) due to the low content in the Nitrianska wine region compared to the values in Južnoslovenská (t8 = 4.2, p = 0.013) and Stredoslovenská wine region (t8 = −5.1 p = 0.004). In the case of malic acid (F3,8 = 21.7, p = 0.0003), significant differences were discovered between Južnoslovenská and every other region (t8 = 5.1; 3.3; 7.9, p < 0.05, for Malokarpatská, Nitrianska and Stredoslovenská, respectively) as well as between Nitrianska and Stredoslovenská wine regions (t8 = 4.6 p = 0.008). Content of alcohol was also statistically different (F3,8 = 19.208, p = 0.0005) due to the difference between Južnoslovenská and Nitrianska region (t8 = −5, p = 0.013), Malokarpatská and Nitrianska region (t8 = −6.77, p = 0.0006), and Nitrianska and Stredoslovenská region (t8 = 6.3 p = 0.001). Lastly, significant differences were also confirmed in glucose levels (F3,8 = 10.8, p = 0.0035), mainly between the Južnoslovenská and Nitrianska wine regions (t8 = 3.4, p = 0.04), the Južnoslovenská and Stredoslovenská wine regions (t8 = 3.5, p = 0.03), the Malokarpatská and Nitrianska wine regions (t8 = 4.4, p = 0.009) and the Malokarpatská and Stredoslovenská wine regions (t8 = 4.5, p = 0.008).
Figure 3. Estimated marginal means of scaled data with 95% CI.
4. Conclusions Over the last decades, the study of the plant metabolites of both grapes and wines
has been the subject of many investigations. The importance of the approach used is emphasized since the regional or varietal origin of grapes and wines is needed to be identified. An approach that would allow an easy and reliable chemical identification of wines is still the object of interest. Our study was oriented on chemical composition of wines based on determination of alcohol content, main carbohydrates, organic acids and total phenolics and antioxidant activity. The impact of grape varieties and wine-growing regional conditions on selected chemical characteristics of white wine was studied. Correlations between the parameters was examined, we observed high positive correlation between total acids and tartaric acid content, alcohol and total polyphenols, between TPC and TAA was found a weak positive correlation. Negative correlation was high between tartaric acid and alcohol content and between malic and lactic acid. The results showed differences among the regions based on the above-mentioned chemical components. From the parameters that were used in our evaluation, organic acids, content of alcohol and glucose were found to be the most relevant in the classification of the wines.
Figure 3. Estimated marginal means of scaled data with 95% CI.
4. Conclusions
Over the last decades, the study of the plant metabolites of both grapes and wineshas been the subject of many investigations. The importance of the approach used isemphasized since the regional or varietal origin of grapes and wines is needed to beidentified. An approach that would allow an easy and reliable chemical identification ofwines is still the object of interest. Our study was oriented on chemical composition of winesbased on determination of alcohol content, main carbohydrates, organic acids and totalphenolics and antioxidant activity. The impact of grape varieties and wine-growing regionalconditions on selected chemical characteristics of white wine was studied. Correlationsbetween the parameters was examined, we observed high positive correlation between totalacids and tartaric acid content, alcohol and total polyphenols, between TPC and TAA wasfound a weak positive correlation. Negative correlation was high between tartaric acid andalcohol content and between malic and lactic acid. The results showed differences amongthe regions based on the above-mentioned chemical components. From the parameters thatwere used in our evaluation, organic acids, content of alcohol and glucose were found to bethe most relevant in the classification of the wines. Statistical evaluation of the relationshipamong chemical parameters, wine variety and wine-growing region showed significantdifferences, especially in wines from two regions (the Stredoslovenská and Nitrianskawine regions). The white wines are considered to have lower antioxidant activity andcontent of polyphenols, but in the wines from four Slovak wine regions a high antioxidantactivity was confirmed along with the high content of polyphenols. The content of the plantmetabolites depends on several factors—grapes variety, region, weather, processing—thusevaluation based on chemical parameters is a complex procedure.
Author Contributions: Conceptualization, S.J. and V.I.-P.; data curation, S.J., Z.A., A.M., J.K. andM.Š.; investigation, S.J., I.J. and M.F.; methodology, S.J., A.M. and M.Š.; writing—original draft, S.J.and V.I.-P.; visualization, I.J.; writing—review and editing, M.F. and V.I.-P. All authors have read andagreed to the published version of the manuscript.
Funding: This work was funded by Slovak Research and Development Agency (APVV-19-0180),and by the Ministry of Education, Science, Research and Sport of the Slovak Republic grants (KEGA017/SPU-4/2019 and VEGA 1/0239/21).
Appl. Sci. 2021, 11, 11059 11 of 13
Institutional Review Board Statement: Not applicable.
Informed Consent Statement: Not applicable.
Data Availability Statement: Authors are able to make data available on request through theauthors themselves. For data requests, the contact details of the corresponding author is present inthe affiliation part of the manuscript.
Acknowledgments: We would like to thank to the Central European Exchange Program for Univer-sity Studies, the CEEPUS network CIII-SK-1516-02-2122 entitled BioScience, Food and Health. TheAgroBioTech Research Centre in Slovak Agricultural University in Nitra is greatly acknowledged foranalysing wine samples by FTIR technique.
Conflicts of Interest: The authors declare that there are no conflicts of interest regarding the publica-tion of this paper.
References1. Castaldo, L.; Narváez, A.; Izzo, L.; Graziani, G.; Gaspari, A.; Di Minno, G.; Ritieni, A. Red wine consumption and cardiovascular
health. Molecules 2019, 24, 3626. [CrossRef] [PubMed]2. Jackson, M.G.; Timberlake, C.F.; Bridle, P.; Vallis, L. Red wine quality: Correlations between colour, aroma and flavour and
pigment and other parameters of young Beaujolais. J. Sci. Food Agric. 1978, 29, 715–727. [CrossRef]3. Popovic-Djordjevic, J.; Pejin, B.; Dramicanin, A.; Jovic, S.; Vujovic, D.; Zunic, D.; Ristic, R. Wine Chemical Composition and
Radical Scavenging Activity of Some Cabernet Franc Clones. Curr. Pharm. Biotechnol. 2017, 18, 343–350. [CrossRef]4. González-Domínguez, R.; Sayago, A.; Fernández-Recamales, Á. Metabolomics: An emerging tool for wine characterization
and the investigation of health benefits. In Engineering Tools in the Beverage Industry; Grumezescu, A.M., Holban, A.M., Eds.;Woodhead Publishing: Amsterdam, The Netherlands, 2019; pp. 315–350.
5. Ivanova-Petropulos, V.; Hermosín-Gutiérrez, I.; Boros, B.; Stefova, M.; Stafilov, T.; Vojnoski, B.; Dörnyei, Á.; Kilár, F. Phenoliccompounds and antioxidant activity of Macedonian red wines. J. Food Compos. Anal. 2015, 41, 1–14. [CrossRef]
6. Gnilomedova, N.V.; Anikina, N.S.; Gerzhikova, V.G. Profile of sugars in a grape-wine system as the identifying indicator of theauthenticity of wine products. Foods Raw Mater. 2018, 6, 191. [CrossRef]
7. Pavloušek, P.; Kumšta, M. Profiling of primary metabolites in grapes of interspecific grapevine varieties: Sugars and organicacids. Czech J. Food Sci. 2011, 29, 361–372. [CrossRef]
8. Sabir, A.; Kafkas, E.; Tangolar, S. Distribution of major sugars, acids and total phenols in juice of five grapevine (Vitis spp.)cultivars at different stages of berry development. Span. J. Agric. Res. 2010, 2, 425–433. [CrossRef]
9. Briones-Labarca, V.; Perez-Wom, M.; Habib, G.; Giovagnoli-Vicuña, C.; Cañas-Sarazua, R.; Tabilo-Munizaga, G.; Salazar, F.N.Oenological and Quality Characteristic on Young White Wines (Sauvignon Blanc): Effects of High Hydrostatic Pressure Processing.J. Food Qual. 2017, 2017, e8524073. [CrossRef]
10. Philipp, C.; Eder, P.; Brandes, W.; Patzl-Fischerleitner, E.; Eder, R. The Pear Aroma in the Austrian Pinot Blanc Wine Variety:Evaluation by Means of Sensorial-Analytical-Typograms with regard to Vintage, Wine Styles, and Origin of Wines. J. Food Qual.2018, 2018, e5123280. [CrossRef]
11. Ivanova, V.; Vojnoski, B.; Stefova, M. Effect of winemaking treatment and wine aging on phenolic content in Vranec wines. J. FoodSci. Technol. 2012, 49, 161–172. [CrossRef] [PubMed]
12. Ivanova, V.; Vojnoski, B.; Stefova, M. Effect of the winemaking practices and aging on phenolic content of Smederevka andChardonnay wines. Food Bioprocess Technol. 2011, 4, 1512–1518. [CrossRef]
13. Mitrevska, K.; Grigorakis, S.; Loupassaki, S.; Calokerinos, A.C. Antioxidant activity and polyphenolic content of North Macedo-nian wines. Appl. Sci. 2020, 10, 2010. [CrossRef]
14. Robles, A.; Fabjanowicz, M.; Chmiel, T.; Płotka-Wasylka, J. Determination and identification of organic acids in wine samples.Problems and challenges. TrAC—Trends Anal. Chem. 2019, 120, 115630. [CrossRef]
15. Badhani, B.; Sharma, N.; Kakkar, R. Gallic acid: A versatile antioxidant with promising therapeutic and industrial applications.RSC Adv. 2015, 5, 27540–27557. [CrossRef]
16. Paixão, N.; Perestrelo, R.; Marques, J.C.; Câmara, J.S. Relationship between antioxidant capacity and total phenolic content of red,rosé and white wines. Food Chem. 2007, 105, 204–214. [CrossRef]
17. Ailer, Š.; Valšíková, M.; Jedlicka, J.; Mankovecký, J.; Baron, M. Influence of Sugar and Ethanol Content and Color of Wines On theSensory Evaluation: From Wine Competition “Nemcinany Wine Days” in Slovak Republic (2013–2016). Erwerbs-Obstbau 2020, 62,9–16. [CrossRef]
18. Ailer, Š. Vinárstvo & Somelierstvo (Winery & Sommelier Proficiency), 1st ed.; Baštan: Olomouc, Czech Republic, 2016; p. 216.19. Bae, H.; Yun, S.K.; Yoon, I.K.; Nam, E.Y.; Kwon, J.H.; Jun, J.H. Assessment of organic acid and sugar composition in apricot,
plumcot, plum, and peach during fruit development. J. Appl. Bot. Food Qual. 2014, 87. [CrossRef]20. Carneiro, A.; Couto, J.A.; Mena, C.; Queiroz, J.; Hogg, T. Activity of wine against Campylobacter jejuni. Food Control. 2008, 19,
800–805. [CrossRef]
Appl. Sci. 2021, 11, 11059 12 of 13
21. Daglia, M.; Papetti, A.; Grisoli, P.; Aceti, C.; Dacarro, C.; Gazzani, G. Antibacterial activity of red and white wine against oralstreptococci. J. Agric. Food Chem. 2007, 55, 5038–5042. [CrossRef] [PubMed]
22. do Nascimento Silva, F.L.; Schmidt, E.M.; Messias, C.L.; Eberlin, M.N.; Sawaya, A.C.H.F. Quantitation of organic acids in wineand grapes by direct infusion electrospray ionization mass spectrometry. Anal. Methods. 2015, 7, 53–62. [CrossRef]
23. Ribéreau-Gayon, P.; Glories, Y.; Maujean, A.; Dubourdieu, D. Handbook of Enology, Volume 2: The Chemistry of Wine Stabilization andTreatments; John Wiley & Sons Inc.: Hoboken, NJ, USA, 2021; Volume 2, p. 560.
24. Xu, S.; Zhu, J.; Zhao, Q.; Gao, J.; Zhang, H.; Hu, B. Quality evaluation of Cabernet Sauvignon wines in different vintages by 1Hnuclear magnetic resonance-based metabolomics. Open Chem. 2021, 19, 385–399. [CrossRef]
25. Ivanova-Petropulos, V.; Naceva, Z.; Sándor, V.; Makszin, L.; Deutsch-Nagy, L.; Berkics, B.; Stafilov, T.; Kilár, F. Fast determinationof lactic, succinic, malic, tartaric, shikimic, and citric acids in red Vranec wines by CZE-ESI-QTOF-MS. Electrophoresis 2018, 39,1597–1605. [CrossRef]
26. Pokrývková, J.; Ailer, Š.; Jedlicka, J.; Chlebo, P.; Jurík, L’. The Use of a Targeted Must Oxygenation Method in the Process ofDeveloping the Archival Potential of Natural Wine. Appl. Sci. 2020, 10, 4810. [CrossRef]
27. Pérez-Navarro, J.; Izquierdo-Cañas, P.M.; Mena-Morales, A.; Chacón-Vozmediano, J.L.; Martínez-Gascueña, J.; García-Romero,E.; Hermosín-Gutiérrez, I.; Gómez-Alonso, S. Comprehensive Chemical and Sensory Assessment of Wines Made from WhiteGrapes of Vitis vinifera Cultivars Albillo Dorado and Montonera del Casar: A Comparative Study with Airén. Foods 2020, 9, 1282.[CrossRef] [PubMed]
28. Ivanova-Petropulos, V.; Durakova, S.; Ricci, A.; Parpinello, G.P.; Versari, A. Extraction and evaluation of natural occurringbioactive compounds and change in antioxidant activity during red winemaking. J. Food Sci. Technol. 2016, 53, 2634–2643.[CrossRef] [PubMed]
29. Kacániová, M.; Ailer, Š.; Ivanišová, E.; Miklášová, K. Plody Vitis vinifera v aspektoch zastúpenia niektorých nutricne špecifickýchzložiek a zo spektra ich multiúcelovej využitel’nosti v oblasti spotreby. In Potenciál Úžitkových Záhrad, Vinohradníctvo a DomácaSpotrebitel’ská Sféra, 1st ed.; Regionálna Rozvojová Agentúra pre Rozvoj Dolného Zemplína: Trebišov, Slovakia, 2019; pp. 10–12.
30. Bajcan, D.; Árvay, J.; Vollmannová, A.; Bystrická, J.; Trebichalskỳ, P.; Harangozo, L.; Šimanský, V. Antioxidant properties, totalphenolic and total flavonoid content of the Slovak white wines-Welschriesling and Chardonnay. Potravinárstvo Slovak J. Food Sci.2017, 11, 266–271. [CrossRef]
31. Ceryová, N.; Bajcan, D.; Lidiková, J.; Musilová, J.; Šnirc, M.; Janco, I.; Franková, H.; Bláhová, M. Phenolic content andantioxidant activity of slovak varietal wines of muscat type. J. Microbiol. Biotechnol. Food Sci. 2021, 10, e4292. Available online:https://www.jmbfs.org/wp-content/uploads/2021/04/3802-Article-Text-preprint.pdf (accessed on 10 October 2021). [CrossRef]
32. Staško, A.; Brezová, V.; Mazúr, M.; Certík, M.; Kalinák, M.; Gescheidt, G. A comparative study on the antioxidant properties ofSlovakian and Austrian wines. LWT—Food Sci. Technol. 2008, 41, 2126–2135. [CrossRef]
33. Lachman, J.; Hejtmánková, A.; Dudjak, E.; Fernández, E.; Pivec, V. Content polyphenolic antioxidants and phenolcarboxylicacids in selected parts of yacon. In Vitamins 2003-Prírodní Antioxidanty a Volné Radikály; Horna, A., Ed.; Univerzita Pardubice:Pardubice, Czech Republic, 2003; pp. 89–97.
34. Oscar, S.-V.; Fernando, O.-C.L.; del Pilar, C.-M.M. Total polyphenols content in white wines on a microfluidic flow injectionanalyzer with embedded optical fibers. Food Chem. 2017, 221, 1062–1068. [CrossRef]
35. Brand-Williams, W.; Cuvelier, M.-E.; Berset, C. Use of a free radical method to evaluate antioxidant activity. LWT—Food Sci.Technol. 1995, 28, 25–30. [CrossRef]
36. R Core Team. R: A Language and Environment for Statistical Computing [Internet]; R Foundation for Statistical Computing: Vienna,Austria, 2021. Available online: https://www.R-project.org/ (accessed on 10 October 2021).
37. QGIS. QGIS Geographic Information System. QGIS Association. Available online: http://www.qgis.org./ (accessed on 10 January2021).
38. Boulton, R. The relationships between total acidity, titratable acidity and pH in grape tissue. Vitis 1980, 19, 113–120.39. Regmi, U.; Palma, M.; Barroso, C.G. Direct determination of organic acids in wine and wine-derived products by Fourier
transform infrared (FT-IR) spectroscopy and chemometric techniques. Anal. Chim. Acta. 2012, 732, 137–144. [CrossRef]40. Davis, C.R.; Wibowo, D.; Eschenbruch, R.; Lee, T.H.; Fleet, G.H. Practical Implications of Malolactic Fermentation: A Review. Am.
J. Enol Vitic. 1985, 36, 290–301.41. Jégou, S.; Hoang, D.A.; Salmon, T.; Williams, P.; Oluwa, S.; Vrigneau, C.; Doco, T.; Marchal, R. Effect of grape juice press
fractioning on polysaccharide and oligosaccharide compositions of Pinot meunier and Chardonnay Champagne base wines. FoodChem. 2017, 232, 49–59. [CrossRef]
42. Márquez, K.; Contreras, D.; Salgado, P.; Mardones, C. Production of hydroxyl radicals and their relationship with phenoliccompounds in white wines. Food Chem. 2019, 271, 80–86. [CrossRef] [PubMed]
43. Mato, I.; Suárez-Luque, S.; Huidobro, J.F. Simple determination of main organic acids in grape juice and wine by using capillaryzone electrophoresis with direct UV detection. Food Chem. 2007, 102, 104–112. [CrossRef]
44. Peres, R.G.; Moraes, E.P.; Micke, G.A.; Tonin, F.G.; Tavares, M.F.M.; Rodriguez-Amaya, D.B. Rapid method for the determinationof organic acids in wine by capillary electrophoresis with indirect UV detection. Food Control. 2009, 20, 548–552. [CrossRef]
Appl. Sci. 2021, 11, 11059 13 of 13
45. Restani, P.; Persico, A.; Ballabio, C.; Fuggetta, D.; Moro, E. Simultaneous determination of glycerol, fructose and glucose forquality control of wines. In Proceedings of the XXXth World Congress of Vine and Wine Budapest, Hungary, Budapest, 10–16June 2007. Available online: https://www.researchgate.net/profile/Patrizia-Restani/publication/242526786_SIMULTANEOUS_DETERMINATION_OF_GLYCEROL_FRUCTOSE_AND_GLUCOSE_FOR_QUALITY_CONTROL_OF_WINES/links/56dd5a0208aed3a79eb2ab0d/SIMULTANEOUS-DETERMINATION-OF-GLYCEROL-FRUCTOSE-AND-GLUCOSE-FOR-QUALITY-CONTROL-OF-WINES.pdf (accessed on 10 October 2021).
46. Coelho, E.M.; da Silva Padilha, C.V.; Miskinis, G.A.; de Sá, A.G.B.; Pereira, G.E.; de Azevêdo, L.C.; dos Santos Lima, M.Simultaneous analysis of sugars and organic acids in wine and grape juices by HPLC: Method validation and characterization ofproducts from northeast Brazil. J. Food Compos. Anal. 2018, 66, 160–167. [CrossRef]
47. Šcepanovic, R.P.; Wendelin, S.; Raicevic, D.; Eder, R. Characterization of the phenolic profile of commercial Montenegrin red andwhite wines. Eur. Food Res. Technol. 2019, 245, 2233–2245. [CrossRef]
48. Bednarska, S.; Dabrowa, A.; Kisala, J.; Kasprzyk, I. Antioxidant properties and resveratrol content of Polish Regent wines fromPodkarpacie region. Czech J. Food Sci. 2019, 37, 252–259. [CrossRef]
49. Villaño, D.; Fernández-Pachón, M.S.; Moyá, M.L.; Troncoso, A.M.; García-Parrilla, M.C. Radical scavenging ability of polyphenoliccompounds towards DPPH free radical. Talanta 2007, 71, 230–235. [CrossRef]
50. de Quirós, A.R.B.; Lage-Yusty, M.A.; López-Hernández, J. HPLC-analysis of polyphenolic compounds in Spanish white winesand determination of their antioxidant activity by radical scavenging assay. Food Res. Int. 2009, 42, 1018–1022. [CrossRef]
51. Hopfer, H.; Nelson, J.; Ebeler, S.E.; Heymann, H. Correlating wine quality indicators to chemical and sensory measurements.Molecules 2015, 20, 8453–8483. [CrossRef] [PubMed]
52. Heymann, H.; Robinson, A.L.; Buscema, F.; Stoumen, M.E.; King, E.S.; Hopfer, H.; Boulton, R.B.; Ebeler, S.E. Effect of Region onthe Volatile Composition and Sensory Profiles of Malbec and Cabernet Sauvignon Wines. In V: Advances in Wine Research; ACSPublications: Washington, DC, USA, 2015; pp. 109–122. [CrossRef]
53. King, E.S.; Stoumen, M.; Buscema, F.; Hjelmeland, A.K.; Ebeler, S.E.; Heymann, H.; Boulton, R.B. Regional sensory and chemicalcharacteristics of Malbec wines from Mendoza and California. Food Chem. 2014, 143, 256–267. [CrossRef] [PubMed]
54. Urvieta, R.; Buscema, F.; Bottini, R.; Coste, B.; Fontana, A. Phenolic and sensory profiles discriminate geographical indications forMalbec wines from different regions of Mendoza, Argentina. Food Chem. 2018, 265, 120–127. [CrossRef]
55. Makris, D.P.; Kallithraka, S.; Mamalos, A. Differentiation of young red wines based on cultivar and geographical origin withapplication of chemometrics of principal polyphenolic constituents. Talanta 2006, 70, 1143–1152. [CrossRef]
56. Milovanovic, M.; Žeravík, J.; Oboril, M.; Pelcová, M.; Lacina, K.; Cakar, U.; Petrovic, A.; Glatz, Z.; Skládal, P. A novel method forclassification of wine based on organic acids. Food Chem. 2019, 284, 296–302. [CrossRef] [PubMed]
57. Zheng, Y.-J.; Duan, Y.-T.; Zhang, Y.-F.; Pan, Q.-H.; Li, J.-M.; Huang, W.-D. Determination of Organic Acids in Red Wine and Muston Only One RP-LC-Column Directly After Sample Dilution and Filtration. Chroma 2009, 69, 1391–1395. [CrossRef]
Related Documents