Chemical composition of phytoplankton as the determinant of food quality Dissertation in fulfilment of the requirements of the degree "Dr.rer.nat." of the Faculty of Mathematics and Natural Sciences at Kiel University Submitted by Rong Bi Kiel, 2013

Welcome message from author
This document is posted to help you gain knowledge. Please leave a comment to let me know what you think about it! Share it to your friends and learn new things together.
Transcript
Chemical composition of phytoplankton as the
determinant of food quality
Dissertation
in fulfilment of the requirements of the degree "Dr.rer.nat."
of the Faculty of Mathematics and Natural Sciences
at Kiel University
Submitted by
Rong Bi
Kiel, 2013

First referee: Prof. Dr. Ulrich Sommer Second referee: Prof. Dr. Stefanie Ismar Date of the oral examination: 18.09.2013 Approved for publication: 18.09.2013 Signed: Prof. Dr. Wolfgang J. Duschl, Dean

DEDICATION
To my parents,
and to Changwei
without whom this would
not have been possible.

TABLE OF CONTENT
1
CONTENTS
SUMMARY ......................................................................................................................................... 3 ZUSAMMENFASSUNG ..................................................................................................................... 5 CHAPTER 1 ......................................................................................................................................... 9 GENERAL INTRODUCTION
Trophic transfer across the phytoplankton-zooplankton interface .............................................. 9 Phytoplankton food quality drivers and their effects ................................................................. 11 The performance of zooplankton in response to food quantity and quality .............................. 14 Aim of this study ....................................................................................................................... 16
CHAPTER 2 ....................................................................................................................................... 19 STOICHIOMETRIC RESPONSES OF PHYTOPLANKTON SPECIES TO THE INTERACTIVE EFFECT OF NUTRIENT SUPPLY RATIOS AND GROWTH RATES CHAPTER 3 ....................................................................................................................................... 39 LINKING ELEMENTS TO BIOCHEMICALS: EFFECTS OF NUTRIENT SUPPLY RATIOS AND GROWTH RATES ON FATTY ACID COMPOSITION OF PHYTOPLANKTON SPECIES CHAPTER 4 ....................................................................................................................................... 61 EFFECTS OF FOOD QUANTITY AND FOOD QUALITY ON ELEMENTAL AND BIOCHEMICAL TROPHIC TRANSFER IN MARINE PLANKTON: AN EXPERIMENTAL APPROACH CHAPTER 5 ....................................................................................................................................... 85 EFFECTS OF FOOD QUANTITY AND FOOD QUALITY ON INGESTION RATE AND NUCLEIC ACID CONTENT IN THE CALANOID COPEPOD ACARTIA TONSA CHAPTER 6 ..................................................................................................................................... 101 GENERAL DISCUSSION AND OUTLOOKS
Elements and biochemicals as mutual regulators of food quality ........................................... 101 Effects of N:P supply ratios and growth rates on elemental and biochemical composition of phytoplankton .......................................................................................................................... 102 Effects of food quantity and quality on the performance of copepods .................................... 103 Outlooks .................................................................................................................................. 104
REFERENCES ................................................................................................................................. 107 APPENDIX ...................................................................................................................................... 123 CONTRIBUTIONS OF AUTHORS ................................................................................................ 131 ACKNOWLEDGEMENTS ............................................................................................................. 133 CURRICULUM VITAE .................................................................................................................. 134 DECLARATION ............................................................................................................................. 135

2
SUMMARY
3
SUMMARY
The trophic transfer across phytoplankton-zooplankton interface is crucially important in
aquatic food webs. The factors regulating the trophic transfer efficiency have been widely
studied. There is an increasing awareness of food quality in terms of chemical composition
of phytoplankton as the major control of the phytoplankton-zooplankton interaction via
bottom-up processes. Nutrient availability has broad effects on chemical composition of
phytoplankton. Other factors, e.g., dilution rate in continuous and semicontinuous cultures,
can interact with nutrient supply and affect phytoplankton food quality, hence affecting the
performance of zooplankton.
This study aimed to investigate the effects of nitrogen (N):phosphorus (P) supply ratios
and growth rates (dilution rates) on elemental and biochemical composition of marine
phytoplankton, as well as the effects of food quantity and quality on the trophic transfer of
essential chemicals and the performance of copepods. For this purpose, laboratory
experiments were firstly conducted with three species of marine phytoplankton in
semicontinuous cultures to test the interactive effect of five N:P supply ratios and four
growth rates. Subsequent copepod experiments were performed with one species of marine
copepods (Acartia tonsa) feeding on one phytoplankton species (Rhodomonas sp.), where
the factors of food quantity and quality were crossed.
The experimental works with three species of marine phytoplankton, presented in
CHAPTER 2 and CHAPTER 3, examined the interactive effect of N:P supply ratios and
growth rates on phytoplankton carbon (C):N:P stoichiometry and fatty acid (FA)
composition. Overall, there was a significant positive relationship between N:P biomass
ratios and N:P supply ratios across the entire range of growth rates, and N:P biomass ratios
converged to an intermediate value at higher growth rates (CHAPTER 2). Two
mathematical models were applied to phytoplankton stoichiometry. Based on the results, I
concluded that Ågren’s functions (based upon biochemical assumptions) might explain the
underlying biochemical principle for the Droop model.
Biochemical responses of phytoplankton were discussed in CHAPTER 3. For all species,
the highest saturated and monounsaturated fatty acid (SFA and MUFA) contents were
observed under N deficiency at the lowest growth rate, while polyunsaturated fatty acids
(PUFAs) revealed variable responses to N:P supply ratios and growth rates among the three
species. Total fatty acids (and SFAs and MUFAs) in all species showed significant negative
SUMMARY
4
correlations with N cell quota (QN) under N deficiency, while PUFAs had species-specific
correlations with QN. Thus, I concluded that elemental and biochemical limitations of
phytoplankton food quality should be considered mutually for studying the trophic
interaction between phytoplankton and zooplankton.
The trophic transfer across the phytoplankton-zooplankton interface enters the picture in
CHAPTER 4, where I analyzed the effects of food quantity and stoichiometric food quality
on the trophic transfer of essential elements and biochemicals between phytoplankton and
copepods, as well as the egg production rate of copepods (A. tonsa). The results showed
higher relative gross growth efficiencies for C and nutrient (N and P), as well as higher
relative trophic transfer efficiencies for ω3- (and ω6-) PUFAs and C, under optimized food
conditions (balanced nutrient diets under higher food quantity). In addition, egg production
rate was also higher under optimized food conditions. Thus, I suggested that the trophic
transfer of essential elements and biochemicals across the phytoplankton-zooplankton
interface might predict the performance of consumers and trophic transfers at higher trophic
levels in marine systems.
Further in CHAPTER 5, ingestion rate and nucleic acid content (RNA content and
RNA:DNA ratio) of A. tonsa were investigated in response to food quantity and food quality
(as chemical composition of phytoplankton). Both ingestion rate and nucleic acid content
correlated positively with food concentration and were generally higher on the balanced
nutrient diet. Egg production rate correlated positively with nucleic acid content. Food
quality showed no significant effect on the nucleic acid-egg production relationship. This
result is in agreement with the increasing recognition that RNA-based indices can be used as
good indicators of copepod egg production.
In summary, the results in this thesis highlight the importance of simultaneous
consideration of elemental and biochemical food quality for understanding the trophic
transfer of energy and matter in food webs. Evaluating responses of this mutual regulation
to multiple ambient factors is a necessary step towards the phytoplankton-zooplankton
relationship in more realistic scenarios that will allow in the future the prediction of
zooplankton’s performances in changing aquatic environments.
ZUSAMMENFASSUNG
5
ZUSAMMENFASSUNG
In aquatischen Nahrungsnetzen kommt dem trophischen Transfer über die Phytoplankton-
Zooplankton Schnittstelle eine große Bedeutung zu. Die Faktoren, die die Effizienz des
trophischen Transfers regulieren wurden bereits eingehend untersucht. Der Nahrungsqualität
wird dabei eine zunehmende Bedeutung als Kontrollmechanismus der Phytoplankton-
Zooplankton Interaktion im Rahmen der „Bottom-up“-Prozesse beigemessen. Die
Nährstoffverfügbarkeit hat einen großen Einfluss auf die chemische Zusammensetzung des
Phytoplanktons. Andere Faktoren, wie z.B. die Verdünnungsrate in kontinuielrichen und
semikontinuierichen Kultureb, können mit der Nährstoffzufuhr interagieren und
beeinflussen die Nahrungsqualität des Phytoplanktons und somit auch die Performance des
Zooplanktons.
Ziel dieser Studie ist es die Auswirkungen von Stickstoff (N): Phosphor (P)-
Verhältnissen im Medium und Wachstumsraten (Verdünnungsraten) auf die elementare und
biochemische Zusammensetzung von marinem Phytoplankton zu untersuchen. Zusätzlich
sollen die Effekte der Nahrungsquantität und –qualität auf den trophischen Transfer von
essentiellen Substanzen und auf Fitness der Copepoden analysiert werden. Zu diesem
Zweck wurden zunächst Laborexperimente mit semikontinuierlichen Kulturen von drei
verschiedener Arten des marinen Phytoplanktons durchgeführt um den wechselwirkenden
Effekt von fünf N:P-Verhältnissen und vier Wachstumsraten zu testen. Nachfolgende
Copepoden-Experimente wurden mit einer marinen Copepodenart (Acartia tonsa)
durchgeführt, deren einzige Nahrungsquelle die Phytoplanktonart Rhodomonas sp. war.
Dabei wurden sowohl die Effekte der Nahrungsquantität als auch der Nahrungsqualität in
einem voll faktoriellen Design untersucht.
In Kapitel 2 und 3 werden die wechselwirkenden Effekte der N:P-Verhältnisse im
Nährmedium und der Wachstumsraten auf die (C):N:P-Stöchiometrie und
Fettsäurezusammensetzung der drei getesteten Phytoplanktonarten untersucht. Über die
gesamte Spannweite der getesteten Wachstumsraten wurde eine signifikant positive
Beziehung zwischen den N:P-Verhältnissen der Biomasse und den N:P-Verhältnissen des
Nährmediums festgestellt. Bei höheren Wachstumsraten konvergierte das N:P-Verhältnis im
Phytoplankton zu einem mittleren Level unabhängig vom N:P-Verhältnis im Nährmedium
(Kapitel 2). Anschließend wurden zwei mathematische Modelle auf die Ergebnisse zurr
Phytoplankton-Stöchiometrie angewendet. Anhand dieser Ergebnisse konnte ich
ZUSAMMENFASSUNG
6
schlussfolgern, dass die Ågren-Funktionen (basierend auf biochemischen Annahmen) die
zugrundeliegenden biochemischen Mechanism für das Droop Modell erklären könnten.
In Kapitel 3 werden die Reaktionen der Fettsäurezusamemnsetzung auf die
Kulturbedingungen behandelt. Der höchste Gehalt an gesättigten und einfach ungesättigten
Fettsäuren (SFA und MUFA) wurde für alle Algenarten unter N-Limitierung und der
geringsten Wachstumsrate beobachtet. Der Gehalt an mehrfach ungesättigten Fettsäuren
(PUFAs) hingegen zeigte, in Reaktion auf die verschiedenen N:P-Verhältnisse im
Nährmedium und die Wachstumsraten, unterschiedliche Ausprägungen bei den getesteten
Arten. Der Gesamtfettsäuregehalt, sowie die SFA als auch die MUFA, zeigten unter N-
Limitierung bei allen Arten eine signifikant negative Korrelation mit dem Zellquote des
Stickstoffs (QN). Der PUFA-Gehalt wies artenspezifische Korrelationen zu QN auf. Daraus
konnte ich den Schluss ziehen, dass elementare und biochemische Limitierungen des
Phytoplanktons als Nahrungsquelle gemeinsam betrachtet werden sollten, wenn trophische
Interaktionen zwischen Phytoplankton und Zooplankton untersucht werden.
Der trophische Transfer über die Phytoplankton-Zooplankton-Schnittstelle wird in
Kapitel 4 betrachtet. In diesem Kapitel analysierte ich den Effekt der Nahrungsmenge und
stöchiometrischen Nahrungsqualität auf den trophischen Transfer von essentiellen
Elementen und Fettsäuren zwischen Phytoplankton und Copepoden sowie auf die
Eiproduktionsrate der Copepoden (A. tonsa). Unter optimierten Nahrungsbedingungen
(ausgeglichenes Nährstoffverhältnis und hohe Nahrungsmenge) zeigten sich sowohl höhere
relative Wachstumseffizienzen für Kohlenstoff (C) und die Nährstoffe N und P als auch
höhere relative trophische Transferraten für ω3- (und ω6-) PUFAs und C. Die
Eiproduktionsrate war unter diesen optimalen Ernährungsbedingungen ebenfalls höher.
Folglich nehme ich an, dass der trophische Transfer der essentiellen Elementen und
Fettsäuren über die Phytoplankton-Zooplankton-Schnittstelle sowohl die Leistung der
Konsumenten, als auch den trophischen Transfer zu höheren trophischen Stufen im marinen
System voraussagen kann.
In Kapitel 5 wird die Aufnahmerate und der Nukleinsäuregehalt (RNA-Gehalt und
RNA:DNA-Verhältnis)von A. tonsa als Reaktion auf Nahrungsquantität und
Nahrungsqualität (chemische Zusammensetzung des Phytoplanktons) untersucht. Sowohl
die Aufnahmerate als auch der Nukleinsäuregehalt zeigten eine positive Korrelation mit der
Nahrungskonzentration und waren generell höher bei den ausgeglichenen
Nährstoffverhältnissen. Die Eiproduktionsrate der Copepoden korrelierte positiv mit dem
ZUSAMMENFASSUNG
7
Nukleinsäuregehalt. Die Nährstoffmanipulationen zeigten keinen signifikanten Einfluss auf
das Verhältnis von Nukleinsäure zu Eiproduktionsrate. Dieses Ergebnis ist in
Übereinstimmung mit der zunehmenden akzepeieren Erkenntnis, dass RNA-basierte Indizes
als Indikatoren für die Eiproduktion der Copepoden geeignet sind.
Die Ergebnisse dieser Studie machen deutlich, dass es wichtig ist, die elementare und
biochemische Nahrungsqualität gemeinsam zu betrachten, um den trophischen Transfer von
Energie und Stoffen in Nahrungsnetzen zu verstehen. Es ist ein wichtiger Schritt die
Reaktion dieser gemeinsamen Regulierung von multiplen Umgebungsfaktoren zu evaluieren.
Nur so ist es möglich in Zukunft, die Performance natürlicher Zooplanktongemeinschaften
in den von stetigen Veränderungen geprägten aquatischen Lebensräumen realistisch
vorhersagen zu können.

8
9
CHAPTER 1
General introduction
Trophic transfer across the phytoplankton-zooplankton interface
The trophic interaction between phytoplankton and crustacean zooplankton (zooplankton
hereafter) is of critical importance in marine food webs. This can be attributed to two
reasons. First of all, marine phytoplankton is currently responsible for approximately half of
global primary production (Falkowski and Raven 2007, Finkel et al. 2010), and plays an
enormous role in coupling multiple nutrient cycles in marine ecosystems (Arrigo 2005).
Second, zooplankton occupies a key ecological position, which provides a link between
primary producers and higher trophic levels such as fish (Harris et al. 2000). This link
makes energy and matter in phytoplankton available for higher trophic levels. Therefore,
understanding the regulation of trophic transfer across the phytoplankton-zooplankton
interface is a basic step for further exploring the energy and matter transfer in the whole
food webs.
Food quantity and quality have been considered as crucial factors in regulating the
trophic interaction between phytoplankton and zooplankton via bottom-up processes,
especially with current mounting interest in global change effects on marine phytoplankton
(Sardans et al. 2012). Food quantity is conventionally measured in terms of carbon (C)
absolute concentration, because C:biomass ratios are conservative and C is closely related to
energy content (Sterner and Robinson 1994). Lampert (1977a, b) conducted a series of
seminal studies on the role of food quantity, based on which Sterner and Schulz (1998)
introduced the hypothetical relationship between food quantity and zooplankton growth rate
(Fig. 1-1). Positive responses of zooplankton to food quantity have been reported in several
aspects of zooplankton’s performances such as egg production (e.g., Jónasdóttir 1994,
Gusmão and McKinnon 2009) and ingestion rate (e.g., Frost 1972, Zamora-Terol and Saiz
CHAPTER 1 GENERAL INTRODUCTION
10
2013). In the ocean, food quantity shows spatial and temporal variations, e.g., the limitation
of food quantity for zooplankton in oceanic regions but not for coastal zooplankton (Huntley
and Boyd 1984). This variability suggests that a wide range of food quantity should be
considered in studying marine planktonic trophic transfer.
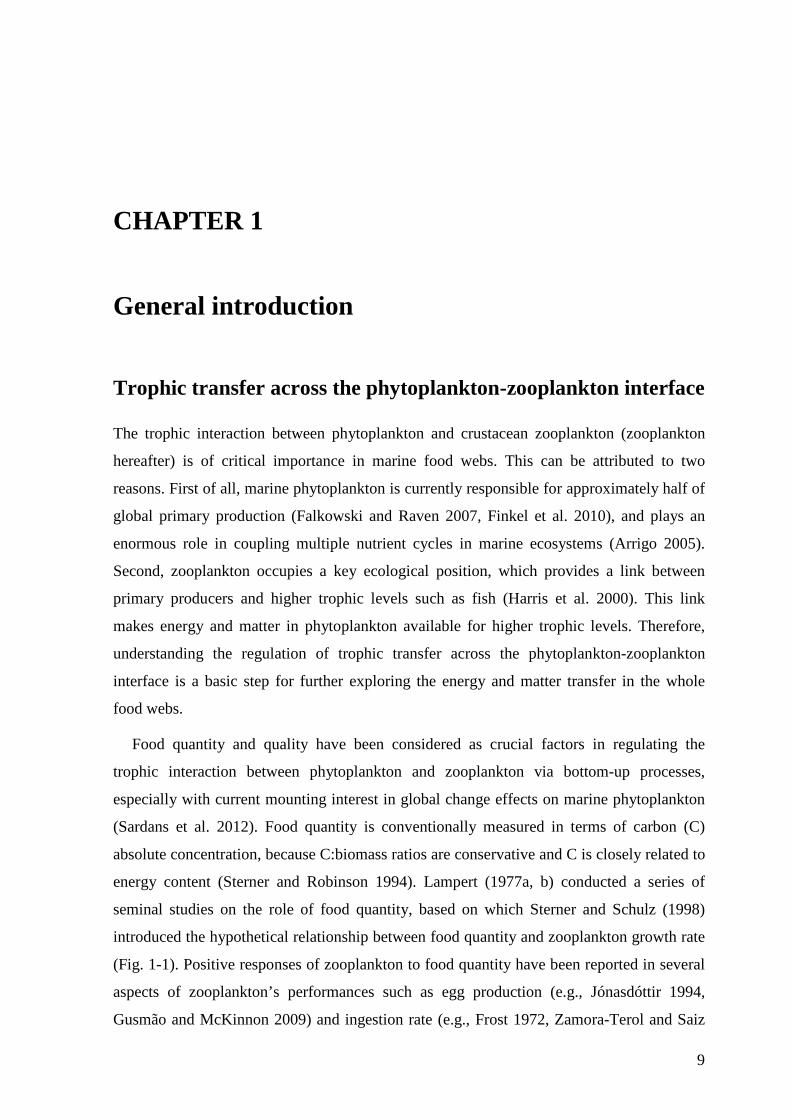
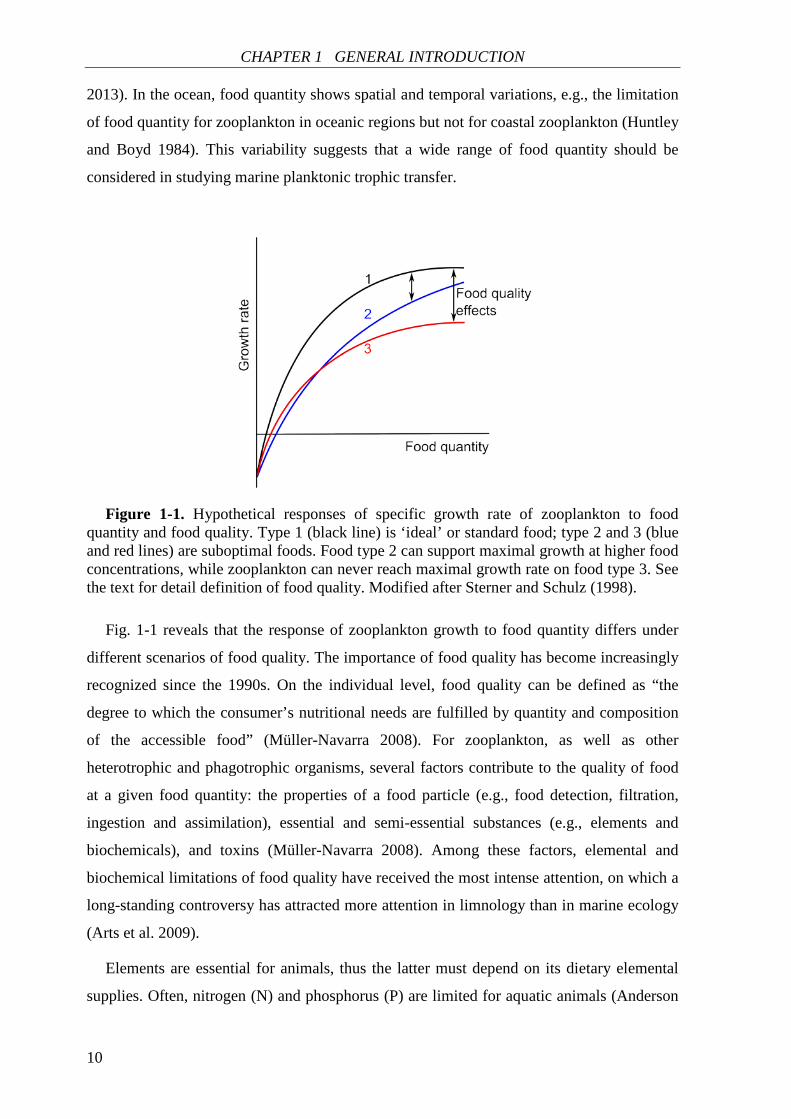
Figure 1-1. Hypothetical responses of specific growth rate of zooplankton to food
quantity and food quality. Type 1 (black line) is ‘ideal’ or standard food; type 2 and 3 (blue and red lines) are suboptimal foods. Food type 2 can support maximal growth at higher food concentrations, while zooplankton can never reach maximal growth rate on food type 3. See the text for detail definition of food quality. Modified after Sterner and Schulz (1998).
Fig. 1-1 reveals that the response of zooplankton growth to food quantity differs under
different scenarios of food quality. The importance of food quality has become increasingly
recognized since the 1990s. On the individual level, food quality can be defined as “the
degree to which the consumer’s nutritional needs are fulfilled by quantity and composition
of the accessible food” (Müller-Navarra 2008). For zooplankton, as well as other
heterotrophic and phagotrophic organisms, several factors contribute to the quality of food
at a given food quantity: the properties of a food particle (e.g., food detection, filtration,
ingestion and assimilation), essential and semi-essential substances (e.g., elements and
biochemicals), and toxins (Müller-Navarra 2008). Among these factors, elemental and
biochemical limitations of food quality have received the most intense attention, on which a
long-standing controversy has attracted more attention in limnology than in marine ecology
(Arts et al. 2009).
Elements are essential for animals, thus the latter must depend on its dietary elemental
supplies. Often, nitrogen (N) and phosphorus (P) are limited for aquatic animals (Anderson
CHAPTER 1 GENERAL INTRODUCTION
11
et al. 2004). Elemental quality of food is frequently expressed as elements in relative terms,
e.g., the relative content of phosphorus (P) (C:P), which is suggested as a key elemental
quality measure for freshwater consumers (Hessen 2008). Biochemical quality of food
includes two categories, macronutrients (e.g., proteins and lipids) and micronutrients (e.g.,
amino acids and fatty acids) (Anderson et al. 2004). Notably, certain fatty acids (FAs), i.e.,
polyunsaturated fatty acids (PUFAs), have attracted particular interest (Müller-Navarra
2008).
So, which factor limits zooplankton most, food quantity or quality, elements or
biochemicals? According to Fig. 1-1 and the definition of food quality, the two aspects (i.e.,
food quantity and quality, and elements and biochemicals) should be considered
simultaneously. In natural conditions, both food quantity and quality range between
limitation and nonlimitation (Sterner and Schulz 1998). More recently, the reciprocal roles
of food quantity and quality have been suggested in the flux of matter and energy in pelagic
food webs (Hessen 2008). However, few scientific efforts have been put to study the
interactive effect of food quantity and quality on the trophic transfer of elements and
biochemicals. As an answer to the well-known debate of elemental versus biochemical food
quality, several researchers have pointed out the importance of a mutual consideration of the
two in phytoplankton food quality (Gulati and DeMott 1997, Boersma et al. 2001,
Gladyshev et al. 2007). However, these studies were all conducted in freshwater ecosystems
and few efforts have been made in marine ecosystems.
Phytoplankton food quality drivers and their effects
Nutrient availability. Nutrient elements are one of three principal resources for life
requirements, alongside space to live, and energy (Moore et al. 2013). Of all elements, C, N
and P are three of the most important components involved not only in biological structural
functions but also in environmental nutrient cycles influenced greatly by biology (Sterner
and Elser 2002). Anthropogenic activities have significantly increased the input of N and P
to the oceans through different supply routes such as atmospheric deposition and fluvial
fluxes (Moore et al. 2013 and references therein). These increases may enhance imbalances
in nutrient supply to phytoplankton, e.g., leading to phytoplankton P limitation caused by
elevated N loading from the atmosphere (Elser et al. 2009).
Responses of phytoplankton elemental composition to N:P supply ratios have been
widely studied in both laboratory and field research. Classic chemostat experiments showed
CHAPTER 1 GENERAL INTRODUCTION
12
a positive relationship between phytoplankton N:P biomass ratios and N:P supply ratios
under certain ranges of N:P supply ratios and growth rates (Rhee 1978, Goldman et al. 1979,
Ahlgren 1985). For example, Rhee (1978) found that N:P biomass ratios of Scenedesmus sp.
matched N:P supply ratios ranging from 5 to 80 (by atoms) at a fixed growth rate. Rhee’s
study suggests that phytoplankton “are what they eat” at a given growth rate studied
(Sterner and Elser 2002). However, this “you are what you eat” model, i.e., nonhomeostatic
nature of phytoplankton stoichiometry, cannot be applied in all circumstances. Goldman et
al. (1979) and Ahlgren (1985) observed a more fixed N:P biomass ratios of algae at higher
growth rates independent of N:P supply ratios. Also, constraints of phytoplankton N:P
stoichiometry are evident in diverse natural aquatic communities (Hall et al. 2005). This
suggests that non-nutrient drivers can modify the plasticity of phytoplankton stoichiometry
induced by nutrient drivers, and this plasticity is originally controlled by species-specific
physiology (Hall 2009). Therefore, taxonomic comparisons of phytoplankton stoichiometric
responses to the interactive effect of nutrient supply and other environmental factors could
be helpful to predict algal succession in the phytoplankton community in changing oceans.
Besides elements, certain biochemicals are essential for zooplankton and thus must be
obtained from food sources. The importance of two micronutrients, FAs and amino acids, in
biochemical quality of phytoplankton has received intense attention (Müller-Navarra 2008),
and responses of phytoplankton FA composition to nutrient availability have been best
investigated. In a recent review, N limitation is explicitly suggested as the single most
critical effect on lipid metabolism in algae (Hu et al. 2008). Generally, nonpolar
glycerolipids, primarily triacylglycerols (TAGs), are accumulated as storage lipids in many
algal species under N limitation (Guschina and Harwood 2009). TAGs mainly comprise
saturated fatty acids (SFAs) and monounsaturated fatty acids (MUFAs), and the latter two
FA groups are suitable energy and carbon sources for the maintenance of basic metabolism
under unfavourable conditions (Roessler 1990).
Compared to SFAs and MUFAs, PUFAs show more important roles in trophic
interactions. This is due to the essentiality of certain PUFAs, e.g., ω3- and ω6-PUFAs, in
zooplankton nutrition. Responses of PUFAs to nutrient supply vary greatly among
phytoplankton species. For example, reduced PUFA contents were observed in the diatom
Thalassiosira weissflogii under both N and P limitations (Klein-Breteler et al. 2005), and in
the green alga Scenedesmus quadricauda and the cyanobacterium Synechococcus sp.
(Ahlgren and Hyenstrand 2003) under N limitation. In contrast, increased PUFA contents
were found in Rhodomonas salina under N limitation (Malzahn et al. 2010) and in S.
CHAPTER 1 GENERAL INTRODUCTION
13
quadricauda and Chlamydomonas globosa under P limitation (Piepho et al. 2012). Two
main reasons can explain these differences. The first reason is concerning FA biosynthesis
such as characteristic biosynthetic pathways (e.g., desaturation of C16:0 to C16:1ω7 in
diatoms) and different responses of desaturation enzymes to nutrient supply (e.g., unique
desaturase enzymes ∆12 and ∆15 in primary producers) (Ahlgren and Hyenstrand 2003,
Kelly and Scheibling 2012 and references therein). Second, physiological functions of
PUFAs are variable. Certain biochemical mechanisms such as the incorporation of PUFAs
to TAGs or phospholipid substitutions have been found to maintain growth in some algal
species under nutrient limitation (Cohen et al. 2000, Van Mooy et al. 2009). This suggests
that taxonomic comparison of PUFA responses would be of critical importance for studying
physiological regulations of FA biosynthesis at the cellular scale, as well as for predicting
responses of phytoplankton species composition at the community level, under variable
nutrient conditions.
The usage of the term nutrient limitation varies greatly in the literature. In a recent
review, Moore et al. (2013) clarified and defined the term nutrient limitation at different
scales of biological and ecological processes. They further defined nutrient deficiency as
“the stoichiometric lack of one element relative to another” (in the medium) and nutrient
stress as “a physiological response to a nutrient shortage”. Thus, the term N (and P)
deficiency will be used to describe low (and high) N:P supply ratios in this thesis. To keep
consistent with the original publication, the description of nutrient conditions in each
citation will be expressed as the same term with those in the corresponding literature.
Growth rate (dilution rate). Besides nutrients, there are abundance of other factors
impacting on phytoplankton food quality, e.g., light intensity, temperature, pCO2, grazing,
and sedimentation (Sterner and Elser 2002, Lewandowska 2011). In contrast to the effect of
nutrients that is responsible for phytoplankton growth, factors such as dilution,
sedimentation, physiological death and grazing result in population loss. The balance
between cellular growth rate and loss rate determines the succession of phytoplankton
species in natural communities (Hecky and Kilham 1988). Classic chemostat experiments
have shown that phytoplankton growth rate and biomass stoichiometry is tightly coupled
(Goldman et al. 1979, Ahlgren 1985). As a main theory of autotroph stoichiometry, the
Droop model relates specific growth rate (µ) of phytoplankton to the intracellular
concentration (cell quota) of the limiting nutrient (Droop 1973, 1983). More recently, Ågren
(2004, 2008) interpreted the relationship between µ and nutrient cell quota from
biochemical considerations. There is a considerable amount of empirical supports for the
CHAPTER 1 GENERAL INTRODUCTION
14
Droop model, while few studies have applied Ågren’s prediction to diverse phytoplankton
species. This results in the lack of knowledge of the relationship between µ and biochemical
composition in phytoplankton.
To summarise, nutrient availability and µ (µ = dilution rate in continuous cultures) are
important in determining elemental and biochemical quality of phytoplankton, as well as
phytoplankton community structure. The effects of these two phytoplankton food quality
drivers can travel up the food chain and thus influence the performance of zooplankton and
organisms at higher trophic levels.
The performance of zooplankton in response to food quantity
and quality
Early experimental studies and models on food quantity and quality effects were mostly
performed with freshwater zooplankton (e.g., Daphnia), and concerned with resulting
effects on zooplankton growth (Sterner and Schulz 1998). Sterner and Schulz’s hypothesis
has been supported by abundant observations, showing positive responses of specific
growth rate of zooplankton to food quantity and quality. However, somatic growth is not the
only conversion of assimilated energy in zooplankton, but there is another utilization of
energy, i.e., egg production (Harris et al. 2000). Therefore, besides somatic growth other
aspects of zooplankton’s performances should be also considered in studying zooplankton
nutrition.
Egg production is suggested as a convenient indicator integrating the influences of
growth limitation during all life cycle of copepods (Runge and Roff 2000). The effect of
food quantity on marine zooplankton egg production has long been studied, showing
increased egg production rates with increasing food quantity until the maximal egg
production rate is reached (Checkley 1980 and references therein). Checkley (1980) also
reported the inhibition of algal N limitation on egg production rate. Based on this finding,
there is an increasing recognition of the importance of elemental and biochemical food
quality in regulating egg production (Mayor et al. 2009, Chen et al. 2012 and references
therein). In contrast to the results of earlier studies, increased egg production rates were also
observed on nutrient limited diets (Augustin and Boersma 2006). This suggests that an
alternative approach instead of simply considering dietary elemental and biochemical
CHAPTER 1 GENERAL INTRODUCTION
15
composition is required to explain contradictory responses of egg production to nutritional
food quality.
Feeding is the main route for energy and matter transfer from lower to higher trophic
levels, and thus quantification of feeding is a key factor in studying trophic interactions
(Båmstedt et al. 2000). Ingestion rate is one of the most common ways to express
zooplankton feeding (Båmstedt et al. 2000). It has been well established that ingestion rates
increase with increasing food concentrations up to a maximal rate, which can be illustrated
by the classic Holling functional response model and alternative types of models
(Gentleman et al. 2003, Wirtz 2012). However, there is no consistent response of ingestion
rates to food quality. Most studies have focused on the effect of food type (different algal
species), resulting in the mixture of several aspects of food quality effects, which makes it
difficult to extract information at each aspect of food quality.
Nucleic acid indices such as RNA content and RNA:DNA ratio have been used to index
copepod growth (e.g., egg production) and physiological condition (e.g., resting stage) (Saiz
et al. 1998, Wagner et al. 1998, Holmborn et al. 2009, Ning et al. 2013). The widespread use
of nucleic acid indices is due to several advantages of this method, e.g., simplicity and
sensitivity, and variety of measuring techniques (Gusmão and McKinnon 2011). While most
experimental studies have focused on the effect of food concentration on the nucleic acid
content of copepods, the effect of food quality has received less attention. Recently,
Gusmão and McKinnon (2011) first reported that food quality (as different algal species)
can affect the relationship between nucleic acid indices and egg production rate. However,
little is known of elemental and biochemical food quality effects on the nucleic acid-egg
production relationship.
Many studies so far are directed toward examining which factor of chemical food quality
(i.e., elements or biochemicals) explains the performance of copepods better. Jónasdóttir
(1994) showed the first evidence of good correlations for both elemental and biochemical
composition of phytoplankton with copepod reproduction. Although such statistical
correlations to some extent might explain the effects of elemental and biochemical food
quality on zooplankton, it is hard to distinguish correlation from causation, and the direct
and indirect effects of food quality. The indirect effects of elemental limitation may include
changes in biochemical composition of phytoplankton (Ravet and Brett 2006). Recently,
Gladyshev et al. (2011) found that the transfer of essential PUFAs from the producers to the
primary consumers was higher than that of bulk C, while nonessential PUFAs showed lower
CHAPTER 1 GENERAL INTRODUCTION
16
transfer efficiency. This provides evidence of trophic transfer efficiency of essential
chemicals as a better indication of zooplankton’s performances.
Zooplankton community is often determined by predominant taxa, which play the main
role as a crucial link between primary producers and higher trophic levels in food webs
(Harris et al. 2000). Copepods dominate the zooplankton community in marine coastal
zones and are the most important prey of fish larvae and other planktivores (Turner 2004,
Vargas et al. 2006). Therefore, a typical calanoid copepod species (Acartia tonsa) is chosen
as model copepods in this thesis to study its responses to variable food supply, which would
be valuable for assessing it ecological roles in planktonic trophic interactions.
Aim of this study
The aim of this study is to investigate the impact of N:P supply ratios and growth rates on
elemental and biochemical composition of marine phytoplankton, as well as the effects of
food quantity and quality on the trophic transfer of essential chemicals and the performance
of copepods. Two series of experiments were conducted under controlled laboratory
conditions. First of all, I conducted phytoplankton experiments to test phytoplankton C:N:P
stoichiometry and FA composition in response to N:P supply ratios and growth rates. The
second series of experiments conducted with copepods focused on the effects of food
quantity and quality on essential chemical trophic transfer and the performance of copepods.
In this thesis, the following four aspects are addressed.
CHAPTER 2. I started in this chapter with stoichiometric responses of phytoplankton to
five N:P supply ratios and four growth rates. I focused on taxonomic comparisons of
phytoplankton C:N:P stoichiometry in response to N:P supply ratios and growth rates, as
well as the application of mathematical models to phytoplankton stoichiometry.
CHAPTER 3. Responses of phytoplankton FA composition were investigated under the
same ranges of N:P supply ratios and growth rates as set in CHAPTER 2. Interspecific
differences in FA responses were considered. In order to test the link between elements and
biochemicals in phytoplankton, I analyzed the relationship between FAs and N (and P)
cellular quotas under N (and P) deficiency.
CHAPTER 4. The interactive effect of food quantity and stoichiometric food quality was
examined on the relative gross growth efficiency for C and nutrient (N and P), as well as the
relative trophic transfer efficiency for ω3- (and ω6-) PUFAs and C. Furthermore, the
nutritional importance of food quantity and quality for higher trophic levels was determined
CHAPTER 1 GENERAL INTRODUCTION
17
by measuring copepod egg production rate. I suspected that trophic transfer of essential
elements and biochemicals might predict reproductive responses of copepods to dietary
nutrient conditions.
CHAPTER 5. I further considered the effects of food quantity and quality on the
performance of copepods. The emphasis in this chapter was on ingestion rate, RNA content
and RNA:DNA ratio. Moreover, the relationship between egg production rate and nucleic
acid indices (the RNA content and RNA:DNA ratio) was studied to test if food quality could
affect the nucleic acid-egg production relationship.

18
19
CHAPTER 2
Stoichiometric responses of phytoplankton species
to the interactive effect of nutrient supply ratios
and growth rates*
Rong Bi**, Carmen Arndt, and Ulrich Sommer
ABSTRACT
Three species of phytoplankton, Rhodomonas sp., Phaeodactylum tricornutum Bohlin,
Isochrysis galbana Parke, were cultivated in semicontinuous culture to analyze the response
of carbon (C):nitrogen (N):phosphorus (P) stoichiometry to the interactive effect of five N:P
supply ratios and four growth rates (dilution rates). The relationship between cellular N and
P quotas and growth rates fits well to both the Droop and Ågren’s functions for all species.
We observed excess uptake of both N and P in the three species. N:P biomass ratios showed
a significant positive relationship with N:P supply ratios across the entire range of growth
rates, and N:P biomass ratios converged to an intermediate value at higher growth rates. The
effect of growth rates on N:P biomass ratios was positive at lower N:P supply ratios, but
negative at higher N:P supply ratios for both Rhodomonas sp. and I. galbana, while for P.
tricornutum this effect was negative at all N:P supply ratios. A significant interactive effect
of N:P supply ratios and growth rates on N:P biomass ratios was found in both Rhodomonas
* Published in Journal of Phycology 48: 539-549 (2012). Text slightly modified.
RB, CA and US, Helmholtz Centre for Ocean Research Kiel (GEOMAR), Düsternbrooker Weg 20, 24105 Kiel, Germany.
** Corresponding author.
CHAPTER 2 PHYTOPLANKTON C:N:P STOICHIOMETRY
20
sp. and P. tricornutum, but not in I. galbana. Our results suggest that Ågren’s functions may
explain the underlying biochemical principle for the Droop model. The parameters in the
Droop and Ågren’s functions can be useful indications of algal succession in phytoplankton
community in changing oceans.
INTRODUCTION
Nitrogen (N) and phosphorus (P) are the most frequent limiting nutrients for primary
production in marine, freshwater and terrestrial ecosystems (Hecky and Kilham 1988,
Vitousek and Howarth 1991, Downing 1997, Elser et al. 2007). Marine phytoplankton,
currently responsible for ca. 50% of global primary production (Falkowski and Raven 2007,
Finkel et al. 2010), is nutrient limited in large parts of the world oceans and throughout the
annual growth season. The ocean’s nutrient-limited zones are expanding because of the
spatial and temporal expansion of ocean surface stratification due to ocean warming and
freshening. In contrast, coastal regions may experience an increase in nutrient supply from
intensified upwelling and nutrient loads from terrestrial sources (Finkel et al. 2010). N:P
concentrations and supply ratios are relatively stable in the open ocean (Redfield ratio, 16:1)
(Redfield 1958, Falkowski 2000), but there is stronger spatial or temporal variability in
coastal seas and in oceanic areas influenced by oxygen minimum zones (Karl et al. 1993,
Cavender-Bares et al. 2001, Twomey and Thompson 2001, Ford et al. 2008, Lam and
Kuypers 2011). Variation in N:P supply ratios may drive a large variability in N:P
stoichiometry of primary producers (Hall 2009). In contrast to the plasticity of
phytoplankton stoichiometry, the stoichiometry of consumers exhibits less variability,
resulting in a mismatch between carbon (C):N:P stoichiometry of primary producers and
consumers (Elser et al. 2000a, Andersen et al. 2004). This ecological imbalance has large
effects on consumers in terms of food quantity and quality, which may ultimately affect top
predators by bottom-up processes (Andersen et al. 2004).
The success of phytoplankton species in natural communities depends on whether the
cellular growth rate exceeds or equals loss rates from dilution, sedimentation, physiological
death, and grazing (Hecky and Kilham 1988). Nutrient limitation of growth rates is
important for both the stoichiometry of phytoplankton biomass and the determination of
phytoplankton community structure (Rhee 1973, Terry et al. 1985b, Sterner and Elser 2002,
Flynn et al. 2010).
CHAPTER 2 PHYTOPLANKTON C:N:P STOICHIOMETRY
21
Models are useful tools to simulate and predict the response of marine phytoplankton to
changing ocean conditions (Sunda et al. 2009). Nutrient-limited growth of phytoplankton
can be described by three models: the Monod model (Monod 1942, 1949); the quota model,
such as Droop’s quota model (Droop 1983); and the mechanistic model based on the
biochemical processes (Flynn 2003). The Monod model describes the steady-state growth
rate of microbes as a function of environmental nutrient concentrations. Thus, its validity is
questioned under nonsteady state conditions, such as batch cultures and field conditions
(Droop 1983). The Droop model is suggested as an alternative quota model (Sommer
1991a). As one of the main theories of autotrophic stoichiometry (Sterner and Elser 2002),
the Droop model relates the specific growth rate of phytoplankton to the intracellular
concentration (cell quota) of the limiting nutrient (Droop 1973, 1983) and has been
successfully applied to a considerable amount of empirical studies. If the cell quota of the
limiting nutrient is related to biomass carbon, this provides a prediction of the limiting
nutrient:C stoichiometry of biomass (Flynn 2008). However, it makes no direct prediction
of the biomass content of a nonlimiting nutrient (e.g., N in the case of P limitation).
According to Loladze and Elser (2011), the elemental composition of autotrophs is
determined by their biochemical composition: constraining protein synthesis rates will result
in a lower N:P biomass ratio, and constraining RNA production rates will lead to a higher
ratio. Based on the assumption that autotrophic growth requires protein (N based) and
protein synthesis requires ribosomes RNA (rRNA) (P based), Ågren (2004) proposed that
cellular N:C ratios increase linearly, while cellular P:C ratios increase quadratically as a
function of growth rates in autotrophs. Ågren’s prediction has been confirmed with one
freshwater alga (Selenastrum minutum) and one tree seedling (Betula pendula), but few
further studies have applied this model to other freshwater or marine phytoplankton species.
A classic chemostat experiment (Rhee 1978) showed the close match between the
nutrient supply ratio and cellular stoichiometry in Scenedesmus sp., indicating the absence
of homeostasis of N:P biomass ratio within the range of nutrient supply ratios studied
(Sterner and Elser 2002). Rhee (1978) also reported excess uptake of N under P limitation
and of P under N limitation in Scenedesmus sp. (luxury consumption) (Sterner and Elser
2002). The capacity of excess uptake is one important cause of stoichiometric variability in
nature (Ågren 2008). The capacity of excess uptake in autotrophs varies both between and
within species, and also between different elements (Ågren 2004, 2008). Thus excess uptake
can also function as a competitive strategy. The nonhomeostatic nature of elemental
composition in phytoplankton can be modified by environmental factors, such as pH,
CHAPTER 2 PHYTOPLANKTON C:N:P STOICHIOMETRY
22
temperature, light, growth rate, as well as the species composition of phytoplankton
communities (Goldman et al. 1979, Ahlgren 1985, Sterner and Hessen 1994). Besides in
unialgal cultures, constraints of primary producer N:P stoichiometry are also evident in
diverse aquatic and terrestrial communities (Hall et al. 2005). To explain the variability of
phytoplankton stoichiometry theoretically, Legović and Cruzado (1997) proposed a model
of phytoplankton growth on multiple nutrients based on Michaelis-Menten-Monod uptake
of nutrients, the Droop function, and Liebig’s law of the minimum. This model was further
analyzed by Klausmeier et al. (2004), showing that phytoplankton stoichiometry matches
the nutrient supply ratio at low growth rates, but becomes less variable at higher growth
rates. Generally, different algal species have similar physiological and compositional
responses to nutrient limitation, such as decreases in photosynthetic pigments, storage of C,
and decreases in protein content (Healey 1973, Shifrin and Sallie 1981, Hecky and Kilham
1988, Larson and Rees 1996, Lynn et al. 2000). However, some algal species do not exhibit
these general responses to nutrient limitation (Van Baalen and Marler 1963, Terry et al.
1985a, Ahlgren and Hyenstrand 2003, Leonardos and Geider 2004). Species-specific
differences in the response to N and P enrichments and N:P ratios are also found in natural
phytoplankton communities (Lagus et al. 2004), but more empirical data are required to
explore the elemental and biochemical principles of the interspecific differences in
responses to the interactive effect of N:P supply ratios and other environmental conditions .
In this study, we focus on taxonomic comparisons of phytoplankton C:N:P stoichiometric
responses to the interactive effect of N:P supply ratios and growth rates, as well as the
application of mathematical models to phytoplankton stoichiometry. We addressed the
following questions: (i) Is the response of cellular N and P contents to growth rates
consistent with the predictions of both the Droop model and Ågren’s functions? (ii) If so,
could the Droop model be explained by the biochemical mechanisms implicit in Ågren’s
functions? (iii) Are there species-specific differences in phytoplankton responses to the
interactive effect of growth rates and N:P supply ratios?
MATERIALS AND METHODS
Experimental setup. The selected algal species are from three different marine
phytoplankton classes: Rhodomonas sp. (Cryptophyceae), Isochrysis galbana
(Prymnesiophyceae) (Parke 1949), and Phaeodactylum tricornutum (Bacillariophyceae).
The culture medium was prepared by enriching sterile filtered seawater (pore size 0.2 µm)
with macronutrients and micronutrients based on the modified Provasoli’s enriched
CHAPTER 2 PHYTOPLANKTON C:N:P STOICHIOMETRY
23
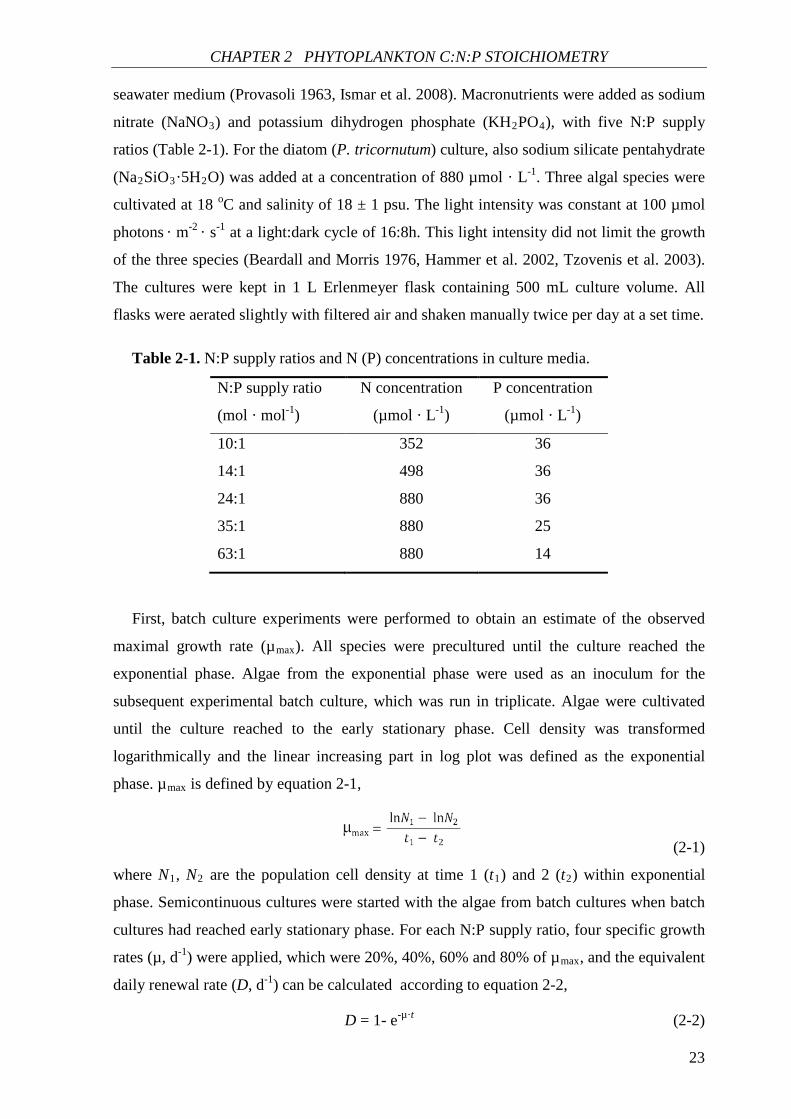
seawater medium (Provasoli 1963, Ismar et al. 2008). Macronutrients were added as sodium
nitrate (NaNO3) and potassium dihydrogen phosphate (KH2PO4), with five N:P supply
ratios (Table 2-1). For the diatom (P. tricornutum) culture, also sodium silicate pentahydrate
(Na2SiO3·5H2O) was added at a concentration of 880 µmol · L-1. Three algal species were
cultivated at 18 oC and salinity of 18 ± 1 psu. The light intensity was constant at 100 µmol
photons · m-2 · s-1 at a light:dark cycle of 16:8h. This light intensity did not limit the growth
of the three species (Beardall and Morris 1976, Hammer et al. 2002, Tzovenis et al. 2003).
The cultures were kept in 1 L Erlenmeyer flask containing 500 mL culture volume. All
flasks were aerated slightly with filtered air and shaken manually twice per day at a set time.
Table 2-1. N:P supply ratios and N (P) concentrations in culture media.
N:P supply ratio
(mol · mol-1)
N concentration
(µmol · L-1)
P concentration
(µmol · L-1)
10:1 352 36
14:1 498 36
24:1 880 36
35:1 880 25
63:1 880 14
First, batch culture experiments were performed to obtain an estimate of the observed
maximal growth rate (µmax). All species were precultured until the culture reached the
exponential phase. Algae from the exponential phase were used as an inoculum for the
subsequent experimental batch culture, which was run in triplicate. Algae were cultivated
until the culture reached to the early stationary phase. Cell density was transformed
logarithmically and the linear increasing part in log plot was defined as the exponential
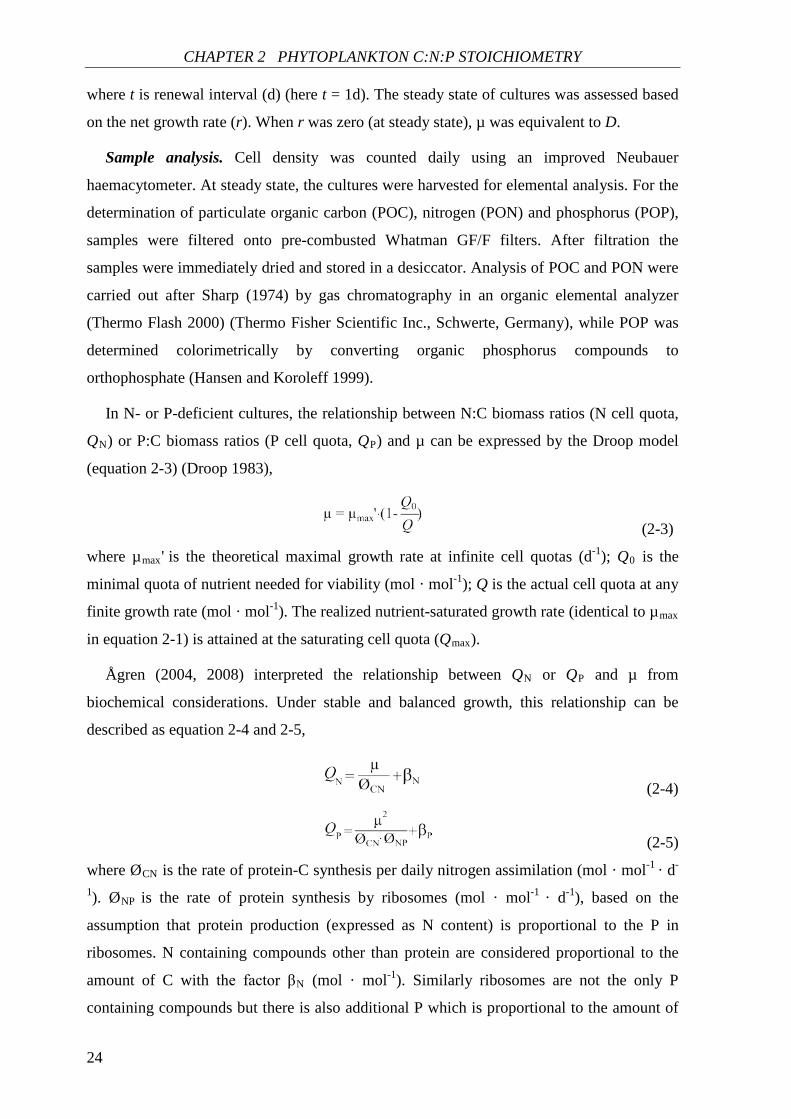
phase. µmax is defined by equation 2-1,
(2-1)
where N1, N2 are the population cell density at time 1 (t1) and 2 (t2) within exponential
phase. Semicontinuous cultures were started with the algae from batch cultures when batch
cultures had reached early stationary phase. For each N:P supply ratio, four specific growth
rates (µ, d-1) were applied, which were 20%, 40%, 60% and 80% of µmax, and the equivalent
daily renewal rate (D, d-1) can be calculated according to equation 2-2,
D = 1- e-µ·t (2-2)
CHAPTER 2 PHYTOPLANKTON C:N:P STOICHIOMETRY
24
where t is renewal interval (d) (here t = 1d). The steady state of cultures was assessed based
on the net growth rate (r). When r was zero (at steady state), µ was equivalent to D.
Sample analysis. Cell density was counted daily using an improved Neubauer
haemacytometer. At steady state, the cultures were harvested for elemental analysis. For the
determination of particulate organic carbon (POC), nitrogen (PON) and phosphorus (POP),
samples were filtered onto pre-combusted Whatman GF/F filters. After filtration the
samples were immediately dried and stored in a desiccator. Analysis of POC and PON were
carried out after Sharp (1974) by gas chromatography in an organic elemental analyzer
(Thermo Flash 2000) (Thermo Fisher Scientific Inc., Schwerte, Germany), while POP was
determined colorimetrically by converting organic phosphorus compounds to
orthophosphate (Hansen and Koroleff 1999).
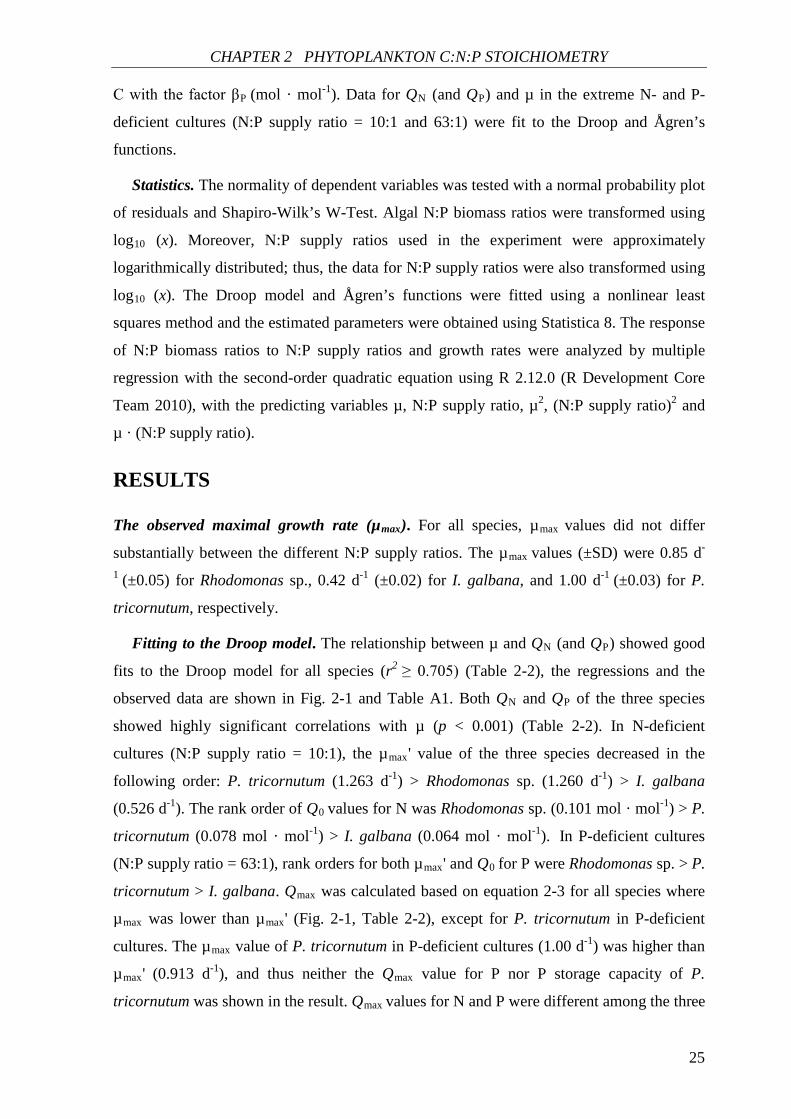
In N- or P-deficient cultures, the relationship between N:C biomass ratios (N cell quota,
QN) or P:C biomass ratios (P cell quota, QP) and µ can be expressed by the Droop model
(equation 2-3) (Droop 1983),
(2-3)
where µmax' is the theoretical maximal growth rate at infinite cell quotas (d-1); Q0 is the
minimal quota of nutrient needed for viability (mol · mol-1); Q is the actual cell quota at any
finite growth rate (mol · mol-1). The realized nutrient-saturated growth rate (identical to µmax
in equation 2-1) is attained at the saturating cell quota (Qmax).
Ågren (2004, 2008) interpreted the relationship between QN or QP and µ from
biochemical considerations. Under stable and balanced growth, this relationship can be
described as equation 2-4 and 2-5,
(2-4)
(2-5)
where ØCN is the rate of protein-C synthesis per daily nitrogen assimilation (mol · mol-1 · d-
1). ØNP is the rate of protein synthesis by ribosomes (mol · mol-1 · d-1), based on the
assumption that protein production (expressed as N content) is proportional to the P in
ribosomes. N containing compounds other than protein are considered proportional to the
amount of C with the factor βN (mol · mol-1). Similarly ribosomes are not the only P
containing compounds but there is also additional P which is proportional to the amount of
CHAPTER 2 PHYTOPLANKTON C:N:P STOICHIOMETRY
25
C with the factor βP (mol · mol-1). Data for QN (and QP) and µ in the extreme N- and P-
deficient cultures (N:P supply ratio = 10:1 and 63:1) were fit to the Droop and Ågren’s
functions.
Statistics. The normality of dependent variables was tested with a normal probability plot
of residuals and Shapiro-Wilk’s W-Test. Algal N:P biomass ratios were transformed using
log10 (x). Moreover, N:P supply ratios used in the experiment were approximately
logarithmically distributed; thus, the data for N:P supply ratios were also transformed using
log10 (x). The Droop model and Ågren’s functions were fitted using a nonlinear least
squares method and the estimated parameters were obtained using Statistica 8. The response
of N:P biomass ratios to N:P supply ratios and growth rates were analyzed by multiple
regression with the second-order quadratic equation using R 2.12.0 (R Development Core
Team 2010), with the predicting variables µ, N:P supply ratio, µ2, (N:P supply ratio)2 and
µ · (N:P supply ratio).
RESULTS
The observed maximal growth rate (µmax). For all species, µmax values did not differ
substantially between the different N:P supply ratios. The µmax values (±SD) were 0.85 d-
1 (±0.05) for Rhodomonas sp., 0.42 d-1 (±0.02) for I. galbana, and 1.00 d-1 (±0.03) for P.
tricornutum, respectively.
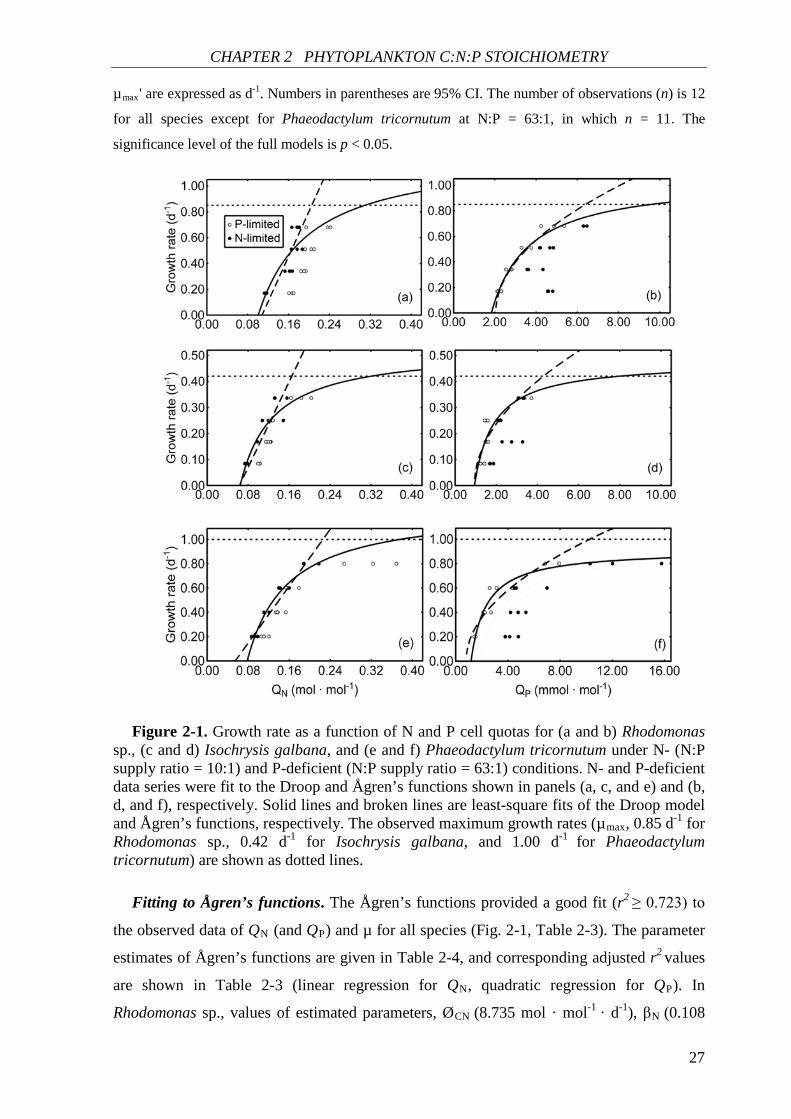
Fitting to the Droop model. The relationship between µ and QN (and QP) showed good
fits to the Droop model for all species (r2 ≥ 0.705) (Table 2-2), the regressions and the
observed data are shown in Fig. 2-1 and Table A1. Both QN and QP of the three species
showed highly significant correlations with µ (p < 0.001) (Table 2-2). In N-deficient
cultures (N:P supply ratio = 10:1), the µmax' value of the three species decreased in the
following order: P. tricornutum (1.263 d-1) > Rhodomonas sp. (1.260 d-1) > I. galbana
(0.526 d-1). The rank order of Q0 values for N was Rhodomonas sp. (0.101 mol · mol-1) > P.
tricornutum (0.078 mol · mol-1) > I. galbana (0.064 mol · mol-1). In P-deficient cultures
(N:P supply ratio = 63:1), rank orders for both µmax' and Q0 for P were Rhodomonas sp. > P.
tricornutum > I. galbana. Qmax was calculated based on equation 2-3 for all species where
µmax was lower than µmax' (Fig. 2-1, Table 2-2), except for P. tricornutum in P-deficient
cultures. The µmax value of P. tricornutum in P-deficient cultures (1.00 d-1) was higher than
µmax' (0.913 d-1), and thus neither the Qmax value for P nor P storage capacity of P.
tricornutum was shown in the result. Qmax values for N and P were different among the three
CHAPTER 2 PHYTOPLANKTON C:N:P STOICHIOMETRY
26
species, with the rank order of P. tricornutum (0.375 mol · mol-1) > I. galbana (0.320
mol · mol-1) > Rhodomonas sp. (0.309 mol · mol-1) for Qmax of N, and Rhodomonas sp.
(9.570 mmol · mol-1) > I. galbana (7.947 mmol · mol-1) for Qmax of P. Cellular N and P
storage capacities could be calculated from values of Q0 and Qmax (Qmax - Q0). Thus the
rank order of N storage capacities in the three species was P. tricornutum (0.297 mol · mol-
1) > I. galbana (0.256 mol · mol-1) > Rhodomonas sp. (0.208 mol · mol-1), and for P storage
capacities the rank order was Rhodomonas sp. (7.742 mmol · mol-1) > I. galbana (7.007
mmol · mol-1).
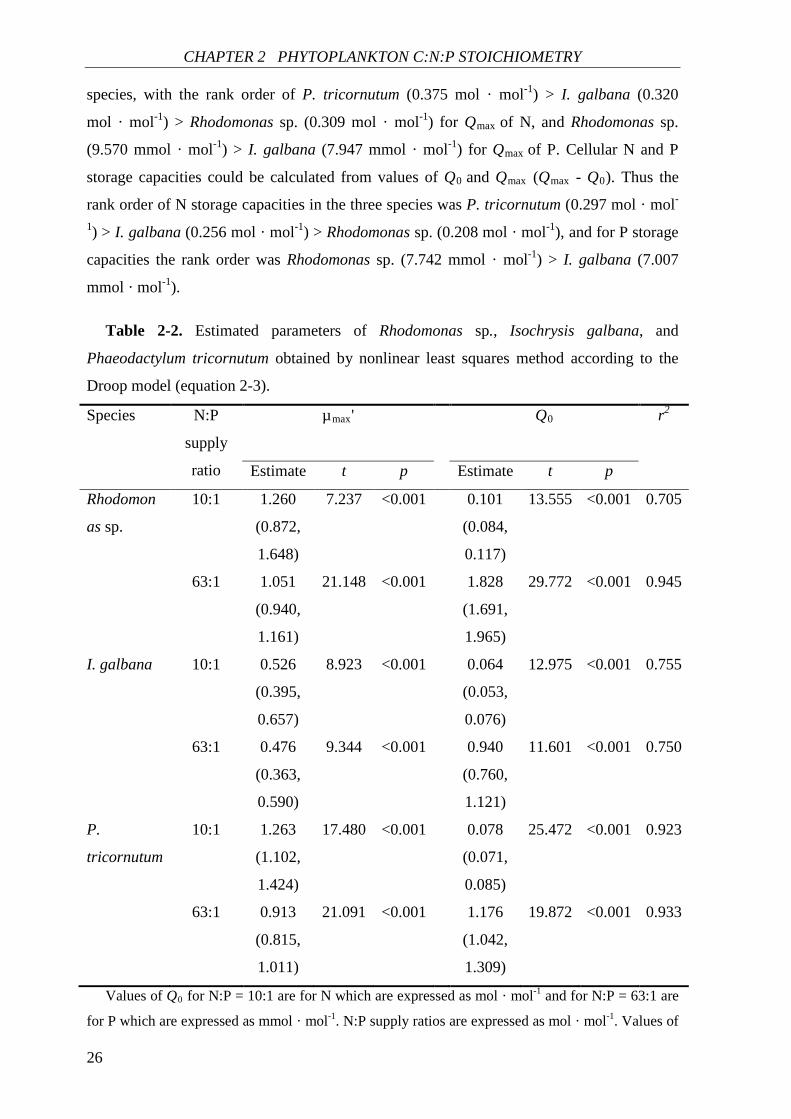
Table 2-2. Estimated parameters of Rhodomonas sp., Isochrysis galbana, and
Phaeodactylum tricornutum obtained by nonlinear least squares method according to the
Droop model (equation 2-3).
Species N:P
supply
ratio
µmax'
Q0 r2
Estimate t p Estimate t p
Rhodomon
as sp.
10:1 1.260
(0.872,
1.648)
7.237 <0.001 0.101
(0.084,
0.117)
13.555 <0.001 0.705
63:1 1.051
(0.940,
1.161)
21.148 <0.001 1.828
(1.691,
1.965)
29.772 <0.001 0.945
I. galbana 10:1 0.526
(0.395,
0.657)
8.923 <0.001 0.064
(0.053,
0.076)
12.975 <0.001 0.755
63:1 0.476
(0.363,
0.590)
9.344 <0.001 0.940
(0.760,
1.121)
11.601 <0.001 0.750
P.
tricornutum
10:1 1.263
(1.102,
1.424)
17.480 <0.001 0.078
(0.071,
0.085)
25.472 <0.001 0.923
63:1 0.913
(0.815,
1.011)
21.091 <0.001 1.176
(1.042,
1.309)
19.872 <0.001 0.933
Values of Q0 for N:P = 10:1 are for N which are expressed as mol · mol-1 and for N:P = 63:1 are
for P which are expressed as mmol · mol-1. N:P supply ratios are expressed as mol · mol-1. Values of
CHAPTER 2 PHYTOPLANKTON C:N:P STOICHIOMETRY
27
µmax' are expressed as d-1. Numbers in parentheses are 95% CI. The number of observations (n) is 12
for all species except for Phaeodactylum tricornutum at N:P = 63:1, in which n = 11. The
significance level of the full models is p < 0.05.
Figure 2-1. Growth rate as a function of N and P cell quotas for (a and b) Rhodomonas sp., (c and d) Isochrysis galbana, and (e and f) Phaeodactylum tricornutum under N- (N:P supply ratio = 10:1) and P-deficient (N:P supply ratio = 63:1) conditions. N- and P-deficient data series were fit to the Droop and Ågren’s functions shown in panels (a, c, and e) and (b, d, and f), respectively. Solid lines and broken lines are least-square fits of the Droop model and Ågren’s functions, respectively. The observed maximum growth rates (µmax, 0.85 d-1 for Rhodomonas sp., 0.42 d-1 for Isochrysis galbana, and 1.00 d-1 for Phaeodactylum tricornutum) are shown as dotted lines.
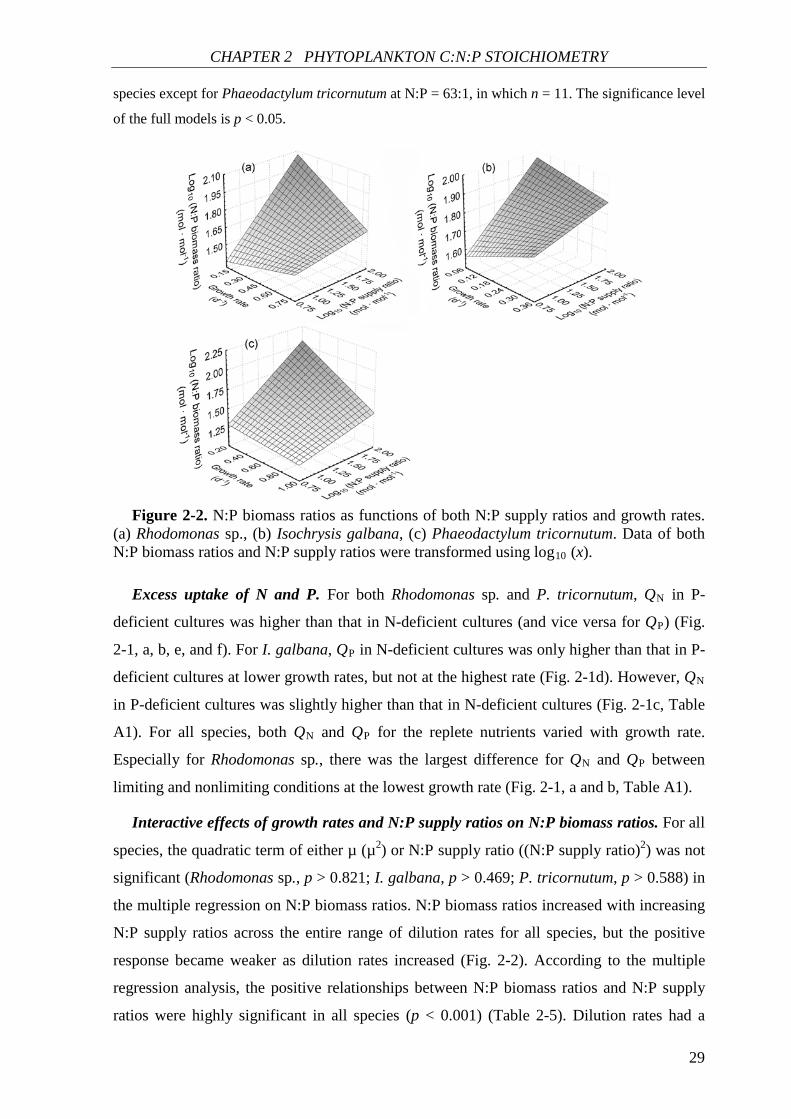
Fitting to Ågren’s functions. The Ågren’s functions provided a good fit (r2 ≥ 0.723) to
the observed data of QN (and QP) and µ for all species (Fig. 2-1, Table 2-3). The parameter
estimates of Ågren’s functions are given in Table 2-4, and corresponding adjusted r2 values
are shown in Table 2-3 (linear regression for QN, quadratic regression for QP). In
Rhodomonas sp., values of estimated parameters, ØCN (8.735 mol · mol-1 · d-1), βN (0.108
CHAPTER 2 PHYTOPLANKTON C:N:P STOICHIOMETRY
28
mol · mol-1) and βP (0.0021 mol · mol-1), were the highest among the three species, while P.
tricornutum had the highest value of ØNP (34.409 mol · mol-1 · d-1). I. galbana had the
lowest values of ØCN (4.104 mol · mol-1 · d-1) and ØNP (16.006 mol · mol-1 · d-1), and P.
tricornutum had the lowest values of βN (0.055 mol · mol-1) and βP (0.0008 mol · mol-1). All
parameters had highly significant effects on the regression (p ≤ 0.001), except βP in P.
tricornutum (p = 0.064).
Table 2-3 shows adjusted r2 values of linear (XC = a + b · µ) and quadratic (XC = a +
b · µ2) (X = N or P) regressions of QN and QP on µ. For QN, the linear regression fit the data
better for both Rhodomonas sp. and I. galbana, and the quadratic regression fit better for QP
in all species.
Table 2-3. Adjusted r2 values for linear and quadratic regression of cell N and P quotas
on the growth rate.
Species Cell N quota Cell P quota
Linear Quadratic Linear Quadratic
Rhodomonas sp. 0.723 (12) 0.570 (12) 0.896 (12) 0.912 (12)
I. galbana 0.747 (12) 0.660 (12) 0.664 (12) 0.787 (12)
P. tricornutum 0.911 (12) 0.925 (12) 0.794 (11) 0.890 (11)
Numbers in parentheses are the number of observations (n). The largest r2 value for N- or P-
deficient cultures is in bold.
Table 2-4. Estimated parameters of Rhodomonas sp., Isochrysis galbana, and
Phaeodactylum tricornutum obtained by nonlinear least squares method according to
Ågren’s functions (equations 2-4 and 2-5).
Species ØCN ØNP βN βP
Estimate p Estimate p Estimate p Estimate p
Rhodom
onas sp.
8.735
(4.928,
12.542)
<0.001 18.139
(14.179,
22.099)
<0.001 0.108
(0.085,
0.131)
<0.001 0.0021
(0.0017,
0.0024)
<0.001
I.
galbana
4.104
(2.419,
5.789)
<0.001 16.006
(10.141,
21.872)
<0.001 0.063
(0.040,
0.086)
<0.001 0.0009
(0.0005,
0.0014)
0.001
P.
tricornut
um
5.859
(4.570,
7.148)
<0.001 34.409
(25.276,
43.542)
<0.001 0.055
(0.034,
0.076)
<0.001 0.0008
(0.0000,
0.0016)
0.064
Values of ØCN and ØNP are expressed as mol · mol-1 · d-1. Values of βN and βP are expressed as
mol · mol-1. Numbers in parentheses are 95% CI. The number of observations (n) is 12 for all
CHAPTER 2 PHYTOPLANKTON C:N:P STOICHIOMETRY
29
species except for Phaeodactylum tricornutum at N:P = 63:1, in which n = 11. The significance level
of the full models is p < 0.05.
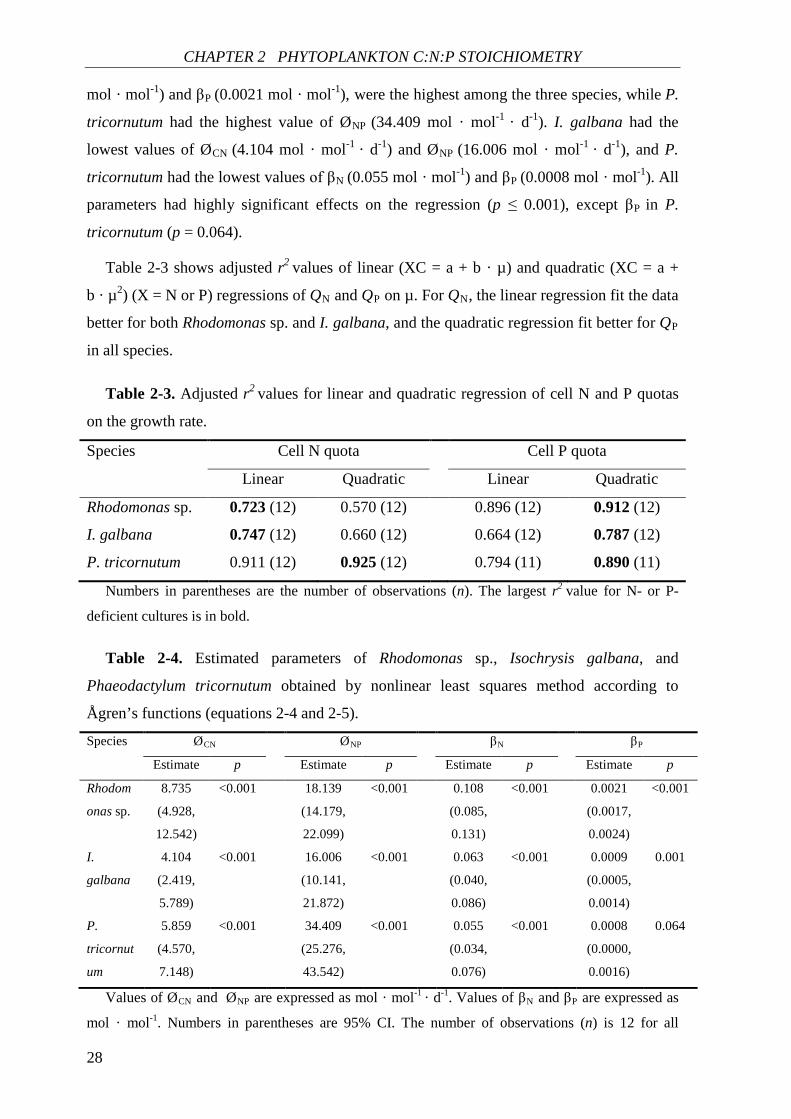
Figure 2-2. N:P biomass ratios as functions of both N:P supply ratios and growth rates.
(a) Rhodomonas sp., (b) Isochrysis galbana, (c) Phaeodactylum tricornutum. Data of both N:P biomass ratios and N:P supply ratios were transformed using log10 (x).
Excess uptake of N and P. For both Rhodomonas sp. and P. tricornutum, QN in P-
deficient cultures was higher than that in N-deficient cultures (and vice versa for QP) (Fig.
2-1, a, b, e, and f). For I. galbana, QP in N-deficient cultures was only higher than that in P-
deficient cultures at lower growth rates, but not at the highest rate (Fig. 2-1d). However, QN
in P-deficient cultures was slightly higher than that in N-deficient cultures (Fig. 2-1c, Table
A1). For all species, both QN and QP for the replete nutrients varied with growth rate.
Especially for Rhodomonas sp., there was the largest difference for QN and QP between
limiting and nonlimiting conditions at the lowest growth rate (Fig. 2-1, a and b, Table A1).
Interactive effects of growth rates and N:P supply ratios on N:P biomass ratios. For all
species, the quadratic term of either µ (µ2) or N:P supply ratio ((N:P supply ratio)2) was not
significant (Rhodomonas sp., p > 0.821; I. galbana, p > 0.469; P. tricornutum, p > 0.588) in
the multiple regression on N:P biomass ratios. N:P biomass ratios increased with increasing
N:P supply ratios across the entire range of dilution rates for all species, but the positive
response became weaker as dilution rates increased (Fig. 2-2). According to the multiple
regression analysis, the positive relationships between N:P biomass ratios and N:P supply
ratios were highly significant in all species (p < 0.001) (Table 2-5). Dilution rates had a
CHAPTER 2 PHYTOPLANKTON C:N:P STOICHIOMETRY
30
positive effect on N:P biomass ratios of both Rhodomonas sp. and I. galbana at low N:P
supply ratios, but the effect became negative with increased N:P supply ratios (Fig. 2-2, a
and b), while for P. tricornutum this effect was negative across the entire range of N:P
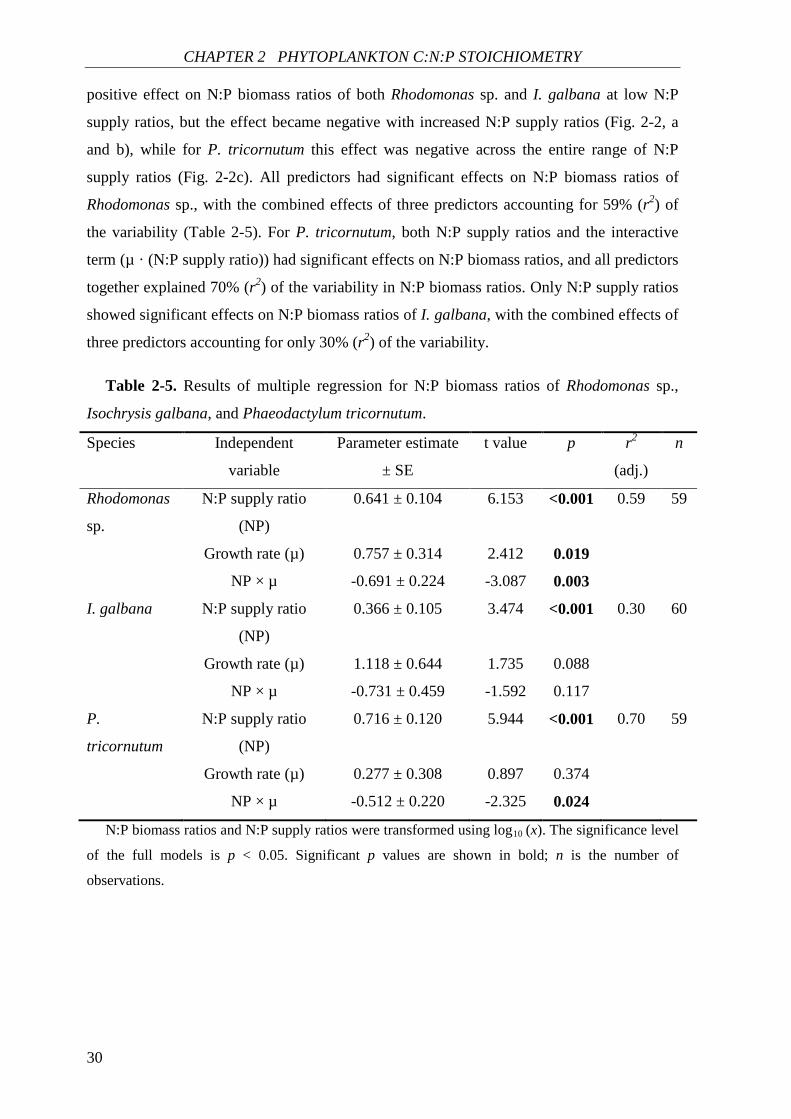
supply ratios (Fig. 2-2c). All predictors had significant effects on N:P biomass ratios of
Rhodomonas sp., with the combined effects of three predictors accounting for 59% (r2) of
the variability (Table 2-5). For P. tricornutum, both N:P supply ratios and the interactive
term (µ · (N:P supply ratio)) had significant effects on N:P biomass ratios, and all predictors
together explained 70% (r2) of the variability in N:P biomass ratios. Only N:P supply ratios
showed significant effects on N:P biomass ratios of I. galbana, with the combined effects of
three predictors accounting for only 30% (r2) of the variability.
Table 2-5. Results of multiple regression for N:P biomass ratios of Rhodomonas sp.,
Isochrysis galbana, and Phaeodactylum tricornutum.
Species Independent
variable
Parameter estimate
± SE
t value p r2
(adj.)
n
Rhodomonas
sp.
N:P supply ratio
(NP)
0.641 ± 0.104 6.153 <0.001 0.59 59
Growth rate (µ) 0.757 ± 0.314 2.412 0.019
NP × µ -0.691 ± 0.224 -3.087 0.003
I. galbana N:P supply ratio
(NP)
0.366 ± 0.105 3.474 <0.001 0.30 60
Growth rate (µ) 1.118 ± 0.644 1.735 0.088
NP × µ -0.731 ± 0.459 -1.592 0.117
P.
tricornutum
N:P supply ratio
(NP)
0.716 ± 0.120 5.944 <0.001 0.70 59
Growth rate (µ) 0.277 ± 0.308 0.897 0.374
NP × µ -0.512 ± 0.220 -2.325 0.024
N:P biomass ratios and N:P supply ratios were transformed using log10 (x). The significance level
of the full models is p < 0.05. Significant p values are shown in bold; n is the number of
observations.
CHAPTER 2 PHYTOPLANKTON C:N:P STOICHIOMETRY
31
DISCUSSION
The observed maximal growth rate (µmax). Our result is consistent with Cherif and
Loreau’s hypothesis (2010) of equal observed (realized) maximal growth rates for all
nutrients. This hypothesis assumes that µmax should be equal in most populations under
multiple nutrient limitation (essential, nonsubstitutable resources), which has been
confirmed by many empirical experiments (Ahlgren 1985, Elrifi and Turpin 1985, Droop
2003, Baek et al. 2008). The µmax is achieved when the cell reaches its production limit, and
therefore it is unrelated to the availability of different resources (Cherif and Loreau 2010).
Fitting to the Droop model. The growth of the three phytoplankton species in both N-
and P-deficient cultures was in accordance with the well-established Droop Model. This
model has been widely used to predict the possible dominant species in various nutrient
regimes of aquatic ecosystems (Spijkerman and Coesel 1996, Fujimoto et al. 1997, Ducobu
et al. 1998, Spijkerman and Coesel 1998, Yamaguchi et al. 2008). In the Droop model, the
parameters (µmax' and Q0) are used as the basis for evaluation of population dynamics. For
example, Ducobu et al. (1998) found that the prediction of the Droop model is in line with
the result of competition experiments of P-limited continuous cultures, showing that the
prochlorophyte Prochlorothrix hollandica is a better competitor for P than the
cyanobacterium Planktothrix agardhii on the basis of ecophysiological parameters, such as
the maximal growth rate, the maximal cell quota for P, and the minimal cell quota for P.
The parameter µmax' is determined by cellular mechanisms, and nutritional and physical
factors operating at realized growth rates (Droop 1973), although µmax' is a mathematical
abstraction (µ for infinite Q) and it is never reached. Thus µmax' may indicate environmental
and physiological effects on phytoplankton. Fujimoto et al. (1997) worked on two blue-
green algae, Microcystis aeruginosa and Phormidium tenue, and they found that µmax'
indicates the fitness of phytoplankton for a given set of environmental conditions. In their
study, µmax' of M. aeruginosa was higher at 30°C and that of P. tenue was higher at 20°C
for both N- and P-limited growth, indicating that M. aeruginosa is better-adapted to high
temperature than P. tenue. This result corresponds to the seasonal algal succession observed
in Lake Kasumigaura, where M. aeruginosa dominates only in summer. In our study, under
N-deficient conditions, the highest µmax' value was found for P. tricornutum and the lowest
value was found for I. galbana, showing that P. tricornutum is best-adapted to N-deficient
conditions among the three species. However, in P-deficient conditions, the highest µmax'
value was found for Rhodomonas sp. and the lowest value was still found for I. galbana,
CHAPTER 2 PHYTOPLANKTON C:N:P STOICHIOMETRY
32
showing that Rhodomonas sp. is best-adapted to P-deficient conditions. Our result suggests
that the variability of N:P supply ratios may lead to shifts in phytoplankton species
composition.
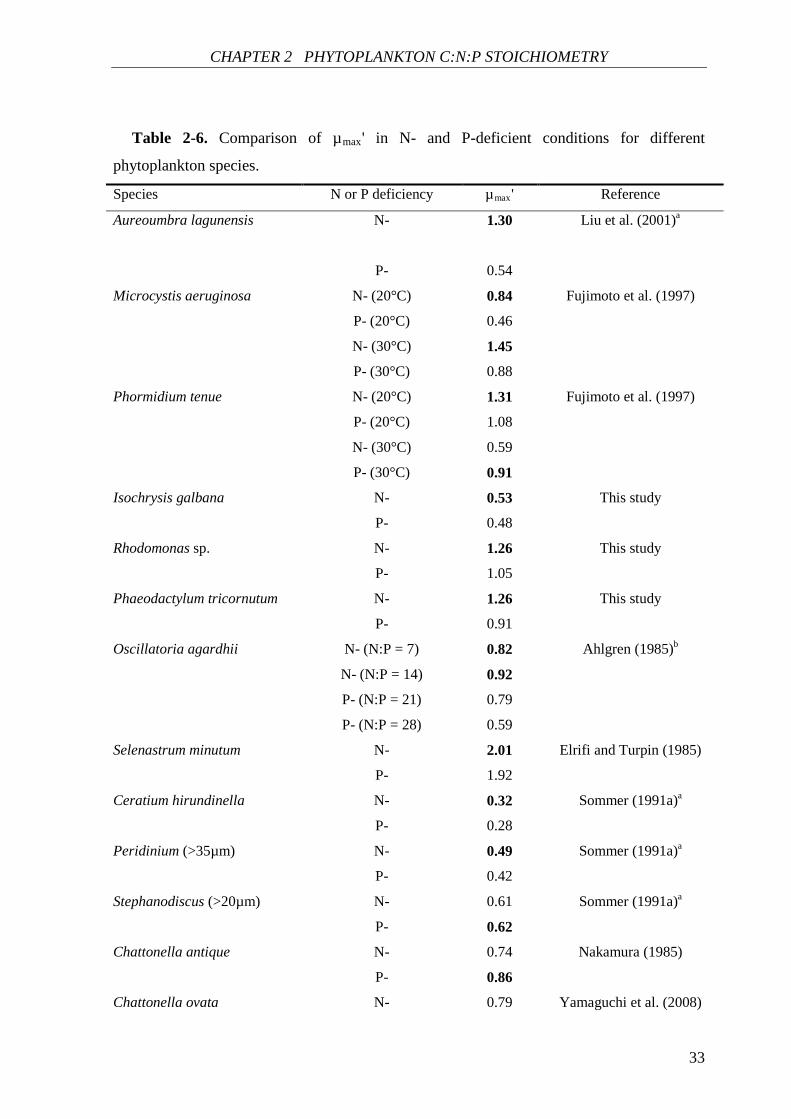
The µmax' value of algal species in N-deficient cultures is higher than the µmax' value of
the same species in P-deficient cultures, which has been found in many previous studies
(Ahlgren 1985, Elrifi and Turpin 1985, Sommer 1991a, Fujimoto et al. 1997, Liu et al. 2001,
Droop 2003), as well as in the present study (Table 2-6). Fujimoto et al. (1997) reported that
the µmax' value of M. aeruginosa was higher for N-limited growth than that for P-limited
growth at both 20°C and 30°C. The µmax' value of P. tenue for N-limited growth was higher
at 20°C, while this value for P-limited growth was higher as temperature increased to 30°C.
In Sommer’s study (1991a), two species Ceratium hirundinella and Peridinium had a higher
µmax' value in N-limited cultures, while for Stephanodiscus the µmax' value was slightly
higher in P-limited cultures. Similarly, in two harmful flagellates Chattonella antiqua and
Chattonella ovata, µmax' values were also higher in P-limited cultures than that in N-limited
cultures (Nakamura 1985, Yamaguchi et al. 2008). The comparison in Table 2-6 shows that
the µmax' value is higher in 12 of 16 cases under N-deficient conditions, while only in four
cases the µmax' value is higher under P-deficient conditions (the chi-square test with Yates’
correction, X2 = 3.06, df = 1, p > 0.05). In N-deficient conditions, P is replete, in this case
most phytoplankton can accumulate P (Flynn 2010). Our study also found a lower N:P
biomass ratio N-deficient cultures (Fig. 2-2). Low N:P biomass ratios can reflect increased
allocation to P-rich rRNA when the growth rate is high (Elser et al. 2000b). Moreover,
many studies have suggested a high correlation between rRNA and growth rate (Binder and
Liu 1998, Worden and Binder 2003). Therefore, P sufficiency may allow a higher allocation
to P-rich rRNA and thus explain the higher µmax' value in N-deficient conditions. In the
present study, we observed a common response of µmax' to nutrient deficiency (a higher
µmax' value in N-deficient conditions); however, this finding remains to be tested in further
studies.
CHAPTER 2 PHYTOPLANKTON C:N:P STOICHIOMETRY
33
Table 2-6. Comparison of µmax' in N- and P-deficient conditions for different
phytoplankton species.
Species N or P deficiency µmax' Reference
Aureoumbra lagunensis
N- 1.30 Liu et al. (2001)a
P- 0.54
Microcystis aeruginosa N- (20°C) 0.84 Fujimoto et al. (1997)
P- (20°C) 0.46
N- (30°C) 1.45
P- (30°C) 0.88
Phormidium tenue N- (20°C) 1.31 Fujimoto et al. (1997)
P- (20°C) 1.08
N- (30°C) 0.59
P- (30°C) 0.91
Isochrysis galbana N- 0.53 This study
P- 0.48
Rhodomonas sp. N- 1.26 This study
P- 1.05
Phaeodactylum tricornutum N- 1.26 This study
P- 0.91
Oscillatoria agardhii N- (N:P = 7) 0.82 Ahlgren (1985)b
N- (N:P = 14) 0.92
P- (N:P = 21) 0.79
P- (N:P = 28) 0.59
Selenastrum minutum N- 2.01 Elrifi and Turpin (1985)
P- 1.92
Ceratium hirundinella N- 0.32 Sommer (1991a)a
P- 0.28
Peridinium (>35µm) N- 0.49 Sommer (1991a)a
P- 0.42
Stephanodiscus (>20µm) N- 0.61 Sommer (1991a)a
P- 0.62
Chattonella antique N- 0.74 Nakamura (1985)
P- 0.86
Chattonella ovata N- 0.79 Yamaguchi et al. (2008)
CHAPTER 2 PHYTOPLANKTON C:N:P STOICHIOMETRY
34
P- 0.86 aValues of µmax' were calculated from the data given in references. bValues of µmax' were
calculated by Droop (2003). Values of µmax' are expressed as d-1. The largest µmax' value in N- or P-
deficient culture for each species is in bold.
Q0 is a useful parameter to apply the Droop model to natural populations of
phytoplankton. Sommer (1991a) compared Q0 values for phytoplankton (separated by a
combined technique of size fractionation and density-gradient fractionation) from Schöhsee
(Northern Germany) with literature Q0 data from freshwater algal cultures. The Schöhsee
Q0 data were within the realistic range of Q0 obtained from literature Q0 data, which
supported the usefulness of the Droop model for field phytoplankton populations. Q0 values
for N and P in freshwater phytoplankton have wide ranges 0.014 to 0.180 mol · mol-1 and
0.2 to 20 mmol · mol-1, respectively (Sommer 1988, 1991a, 1991b). In our study, Q0 values
for both N and P are in the ranges of those in Sommer’s data compilations. Imai et al. (2006)
estimated the warning levels of cell density of red-tide flagellates based on Q0. The Q0
values of C. ovata for both N and P were 20-30% lower than those of C. antique, suggesting
that C. ovata has a competitive advantage over C. antique (Yamaguchi et al. 2008). This
result can explain why C. ovata has become more conspicuous than C. antique in the Seto
Inland Sea, where inorganic nutrient concentrations have decreased recently.
Fitting to Ågren’s functions. The comparison of adjusted r2 values in Table 2-3 is
consistent with predictions of Ågren’s theory (Ågren 2004): the relationship between N cell
quota and growth rate is linear whereas that between P cell quota and growth rate is
quadratic. Based on the observed rates of the catalysing capacity of Rubisco, Ågren (1985b)
postulated a theoretical ØCN of 23.4 mol · mol-1 · d-1. The observed ØCN value (11.817
mol · mol-1 · d-1) for S. minutum (Ågren 2004) is lower than the theoretical ØCN by a factor
of 2. Similarly, the observed ØCN values for the three species in our study are lower than the
theoretical ØCN by a factor of 2 to 5. An estimated value of ØNP is 2.431 mol · mol-1 · d-
1 calculated from the rate of protein synthesis by ribosomes (Sterner and Elser 2002, Ågren
2004), which is lower than the value of ØNP for S. minutum (18.896 mol · mol-1 · d-1) by a
factor of 7 and for the three species in the present study by a factor of 6 to 14. The
parameter βN for S. minutum is 0.041 mol · mol-1, which is slightly lower than the range of
those for Rhodomonas sp., P. tricornutum, and I. galbana. The parameter βP for S. minutum
(0.0014 mol · mol-1) is in the range of that for the three species in our study. Thus our study
shows that estimated parameters of fitting to Ågren’s functions for Rhodomonas sp., P.
tricornutum, and I. galbana are consistent with his observed values for S. minutum.
CHAPTER 2 PHYTOPLANKTON C:N:P STOICHIOMETRY
35
The present study shows an agreement of parameters between the Droop model and
Ågren’s functions: the rank order of Q0 for N was consistent with that of ØCN for the three
species. Also the lowest values of both Q0 for P and ØNP were in I. galbana. Klausmeier et
al. (2008) interpreted the cell quota as consisting of the nutrient used in cellular structure
and machinery (Q0), and the nutrient stored for further growth (cell quota above Q0).
Furthermore, the cellular structural stoichiometry (Q0) is described as two types of
machinery: uptake machinery (representing (transport) proteins and chloroplasts) and
assembly machinery (representing ribosomes) (Klausmeier et al. 2008). In order to interpret
the growth of autotroph biophysically, Ågren suggested to use the rate of protein (N-rich)
assimilate C (ØCN) and the rate of protein synthesis by ribosomes (N-rich but also a major
pool of P) (ØNP) to denote the growth of the organism (Ågren 1985a, Ågren and Bosatta
1998, Ågren 2004). Therefore, the parameters ØCN and ØNP indicate the capacity of
enzymes (for N) and ribosomes (for P) to convert substrates. The agreement of parameters
between the Droop model and Ågren’s functions shows that Ågren’s functions may offer an
explanation of the underlying biochemical principle for the Droop model.
Excess uptake of N and P. The observed QN and QP under nutrient replete conditions
were higher than those under nutrient-deficient conditions, showing the existence of excess
uptake (luxury consumption) in Rhodomonas sp., P. tricornutum, and I. galbana. Ågren
(2004, 2008) compared observed data from several terrestrial plants and one freshwater alga.
He found interspecific differences in the capacity of excess uptake. Excess uptake for N and
P were also different among the three species in the present study (Fig. 2-1). For example, I.
galbana showed a clearly lower excess uptake of P than the other two species. This
observation was consistent with the indication from the parameter µmax': having lowest µmax'
value I. galbana is worst-adapted to the P-deficient condition. Hence, excess uptake of
nutrients could be an indication of competitive advantage. Moreover, we observed the
growth rate dependency of excess uptake in Rhodomonas sp. and P. tricornutum, which has
also been found in previous studies (Elrifi and Turpin 1985, Ågren 2004, 2008). At lower
growth rate, there is a larger span between concentrations of limited and non-limited
nutrients (Ågren 2008), and thus excess uptake is higher. At the highest growth rate, there is
little or no excess uptake (Elrifi and Turpin 1985, Cherif and Loreau 2010). Therefore, a
higher excess uptake at lower growth rates can be an important cause of the larger
variability in autotroph stoichiometry.
Interactive effects of N:P supply ratios and growth rates on N:P biomass ratios.
Several classic chemostat experiments showed that there is a positive relationship between
CHAPTER 2 PHYTOPLANKTON C:N:P STOICHIOMETRY
36
N:P biomass ratios of the three algal species and N:P supply ratios (Rhee 1978, Goldman et
al. 1979, Ahlgren 1985). Goldman et al. (1979) found that N:P biomass ratios of Dunaliella
tertiolecta were positively related to N:P supply ratios at any given growth rates, whereas
N:P biomass ratios converged to an intermediate value at high growth rates, showing the
presence of an optimal ratio required for the maximal growth. A similar result was also
found for the growth of the cyanobacterium Oscillatoria agardhii in chemostat culture
(Ahlgren 1985). The positive relationship between N:P biomass ratios and N:P supply ratios
was highly significant for all species in our study. And the N:P biomass ratio converged
over the range of N:P supply ratios when the growth rate approaches to the highest value. At
lower growth rates, phytoplankton “are what they eat” (Sterner and Elser 2002), with
considerable flexibility of N:P biomass ratios over the range of N:P supply ratios. At higher
growth rates, phytoplankton “eat what they need” with an optimal nutrient uptake ratio,
resulting in the convergence of N:P biomass ratios towards an optimal value independent of
the N:P supply ratio (Klausmeier et al. 2004).
In addition to the similarity in the response of N:P stoichiometry to N:P supply ratios,
there were also interspecific differences in the response of N:P stoichiometry to growth
ratios and the interactive term of growth rates and N:P supply ratios among the three species
in our study. At lower N:P supply ratios (N-deficiency), N:P biomass ratios in P.
tricornutum correlated negatively with growth rates, however this relationship was positive
in both Rhodomonas sp. and I. galbana. Growth rates alone showed significant effects on
Rhodomonas sp., but not on P. tricornutum and I. galbana. Growth rates and N:P supply
ratios together had significant interactive effects on both Rhodomonas sp. and P.
tricornutum, but not on I. galbana.
These findings demonstrate that high dilution rates (loss rates) can explain the limited
flexibility of phytoplankton stoichiometry in natural communities, and there are
interspecific differences in responses to the interactive effect of N:P supply ratios and
growth rates.
CONCLUSIONS
Our results suggest that the response of cellular N and P contents in Rhodomonas sp., P.
tricornutum, and I. galbana to growth rates is consistent with the predictions of both the
Droop model and Ågren’s functions. Ågren’s functions explain this relationship from
biochemical considerations, which can be an approach to explore underlying principle for
CHAPTER 2 PHYTOPLANKTON C:N:P STOICHIOMETRY
37
the Droop model. The estimated parameters for both the Droop model and Ågren’s
functions were consistent with previous studies on freshwater and marine algae, indicating
identical principles to explain the change of elemental and biochemical composition of
algae across freshwater and marine ecosystems. There were species-specific differences in
phytoplankton responses to the interactive effect of N:P supply ratios and growth rates. To
better understand the effect of nutrient limitation on the phytoplankton community, as well
as on the upper consumers in the food web, we suggest further studies should focus on the
response of both elemental and biochemical composition in multiple phytoplankton species
to the interactive effect of nutrient supply ratios and growth rates.
ACKNOWLEDGEMENTS
We wish to thank Bente Gardeler, Cordula Meyer and Thomas Hansen for technical support.
Jennifer Mecking is acknowledged for help with improving the language. We sincerely
appreciate the helpful advice provided by Monika Winder and valuable recommendations
from two anonymous reviewers. This work was partially funded by State Sponsored
Graduate Scholarship Program, China Scholarship Council (CSC), and the NEMO-project
in the program of the future-economy, Schleswig-Holstein-European Regional Development
Fund (ERDF).

38
39
CHAPTER 3
Linking elements to biochemicals: effects of
nutrient supply ratios and growth rates on fatty
acid composition of phytoplankton species*
Rong Bi**, Carmen Arndt, and Ulrich Sommer
ABSTRACT
Three species of phytoplankton, Rhodomonas sp., Isochrysis galbana Parke, and
Phaeodactylum tricornutum Bohlin, were cultivated in semicontinuous cultures to test
responses of fatty acids (FAs) to five nitrogen (N):phosphorus (P) supply ratios and four
growth rates (dilution rates). Characteristic FA profiles were observed for each species
(representing particular algal class), which remained relatively stable across the entire
ranges of N:P supply ratios and growth rates. For all species, significant direct effects of
N:P supply ratios on FAs were found at lower growth rates. For all species, the highest
saturated and monounsaturated fatty acid (SFA and MUFA) contents were observed under
N deficiency at the lowest growth rate, while polyunsaturated fatty acids (PUFAs) revealed
variable responses to N:P supply ratios and growth rates among the three species. Total fatty
acids (and SFAs and MUFAs) showed significant negative correlations with N cell quota
* Under review. Resubmitted to Journal of Phycology.
RB, CA and US, Helmholtz Centre for Ocean Research Kiel (GEOMAR), Düsternbrooker Weg 20, 24105 Kiel, Germany.
** Corresponding author.
CHAPTER 3 FATTY ACIDS IN MARINE PHYTOPLANKTON
40
(QN) under N deficiency in all species, while PUFAs had species-specific correlations with
QN. The result shows that characteristic FA profiles of each algal genus or species underlie
fluctuations according to culture conditions. The significant correlation between FAs and
QN under N deficiency suggests that elemental and biochemical limitations of
phytoplankton should be considered mutually as determinants of food quality for
zooplankton in marine ecosystems.
INTRODUCTION
The transfer of energy and matter across the plant-herbivore interface is of critical
importance in aquatic food webs (Lindeman 1942, Brett and Müller-Navarra 1997). The
factors regulating the trophic transfer efficiency have been widely studied. Of all limiting
factors, elemental and biochemical limitations of phytoplankton have been suggested as
major determinants of food quality for zooplankton (Gulati and DeMott 1997, Sterner and
Schulz 1998, Anderson et al. 2004, Müller-Navarra 2008). Elemental (especially
phosphorus (P)) versus biochemical (especially fatty acids (FAs)) limitation in the diet for
zooplankton is a well-known controversy, which has attracted more attention in limnology
than in marine ecology (Arts et al. 2009). Moreover, several studies have considered these
two limiting factors as mutually non-exclusive mechanisms, especially in freshwater
environments (Gulati and DeMott 1997, Lynn et al. 2000, Boersma et al. 2001, Gladyshev
et al. 2007). Less is known about the interaction between elemental and biochemical
limitations of phytoplankton in marine ecosystems.
Nitrogen (N):P concentrations and supply ratios reveal a strong spatio-temporal
variability in coastal seas and some oceanic areas (Karl et al. 1993, Cavender-Bares et al.
2001, Twomey and Thompson 2001, Ford et al. 2008, Lam and Kuypers 2011). Under a
large variation in N and P supplies, non-homeostasis of phytoplankton N:P stoichiometry
was observed in several classic chemostat experiments (Rhee 1978, Goldman et al. 1979,
Ahlgren 1985), as well as in our previous study (Bi et al. 2012), which analysed how the
intracellular concentrations (cell quota) of N and P (QN and QP) vary in dependence of N:P
supply ratios and specific growth rates (µ). The result in our previous study shows that the
relationship between QN (and QP) and µ can be interpreted from biochemical considerations
(Bi et al. 2012).
FAs are key biochemicals in the regulation of trophic interactions (Müller-Navarra 2008).
FAs as basic constituents of lipids play an important role in cellular membrane functions,
CHAPTER 3 FATTY ACIDS IN MARINE PHYTOPLANKTON
41
energy storage and metabolic processes (Mourente et al. 1990, Roessler 1990, Arts et al.
2009). Certain FAs are essential, because consumers cannot synthesize them or the
synthesis rate is not sufficient to meet the basic biochemical needs of consumers (Arts et al.
2001, Kainz et al. 2004, Kelly and Scheibling 2012). Thus, consumers must obtain essential
FAs from their diet. Several polyunsaturated fatty acids (PUFAs) are essential for a wide
array of animal taxa (Bergé and Barnathan 2005) and have received intense attention, e.g.,
α-linolenic acid (ALA; C18:3ω3), eicosapentaenoic acid (EPA; C20:5ω3) and
docosahexaenoic acid (DHA; C22:6ω3) (Guschina and Harwood 2006, Arts et al. 2009).
The FA composition of phytoplankton is determined by both genotypic and phenotypic
characteristics (Dalsgaard et al. 2003). FAs are well-known taxonomic indicators at the
class but not at the species level. Dalsgaard et al. (2003) compared the patterns of FA
similarities among eight classes of phytoplankton. In their study, the FA composition of
each algal class was obtained by pooling FA data of different species from the same algal
class. Although this comprehensive comparison shows specific FA markers for each algal
class, this method omits the information about potential effects of culture conditions on
phytoplankton FA composition. Laboratory studies have shown quantitative fluctuations of
phytoplankton FA composition in response to one or two environmental factors (e.g.
Piorreck and Pohl 1984, Cohen et al. 1988, Thompson et al. 1990, Ahlgren and Hyenstrand
2003, Piepho et al. 2012). However, little is known about qualitative fluctuations of FA
composition either within or between algal species, especially under combined effects of
environmental conditions (e.g., nutrient supply) and physiological states of phytoplankton
(e.g., growth rate).
Mesocosm experiments conducted in marine (Hopavagen lagoon, Norway), brackish
(Kiel Fjord, Germany) and freshwater (Lake Schöhsee, Germany) systems showed that N:P
supply ratios influenced FA contents in phytoplankton, as well as the ratio between
saturated fatty acids (SFAs), monounsaturated fatty acids (MUFAs) and PUFAs (Brepohl
2005). However, it has been suggested that there is no direct effect of nutrient limitation on
FA synthesis of phytoplankton, but rather a direct impact of limited growth rates caused by
nutrient limitation (Guschina and Harwood 2009, Piepho et al. 2012). Although Ahlgren and
Hyenstrand (2003) reported the interactive effect of N concentrations and growth rates on
freshwater algae, no attempts have been made to simultaneously study responses of FA
composition in marine phytoplankton to wide ranges of N:P supply ratios and growth rates.
CHAPTER 3 FATTY ACIDS IN MARINE PHYTOPLANKTON
42
In addition, the use of different units to quantify FA composition in earlier studies makes
comparisons difficult, and in some cases may even have resulted in seemingly contradictory
findings. The choice of unit depends on the aim of the study. For example, FAs are best
quantified on a per cell basis when focusing on cell physiology, while FA data per unit
biomass (often measured in carbon content) is an ideal approach when considering food
quality of algae for herbivores (Piepho et al. 2012).
In this study, we chose three marine phytoplankton species representing three algal
classes, Rhodomonas sp. (Cryptophyceae), Isochrysis galbana (Prymnesiophyceae) (Parke
1949), and Phaeodactylum tricornutum (Bacillariophyceae). All the three species are widely
used as diets in zooplankton culture because of their high particular FA contents. We tested
responses of FA composition in the three species to five N:P supply ratios and four growth
rates. Semicontinuous cultures were used in this study, because this culture system has been
suggested as a simpler but equally effective alternative to standard continuous cultures, and
thus it has been widely used to control nutritional values of microalgae to feed herbivores
(Ferreira et al. 2011). The results in the present study are mainly presented as FA content
per carbon, because we focus on the important role of FAs in determining food quality of
phytoplankton. FA data are also expressed as a percentage of total fatty acids (TFAs) (FA
proportion, % of TFAs) to compare phytoplankton FA profiles with those in previous
studies. The following questions were addressed: (і) Does the characteristic FA profile of
each species change in response to the large variations of N:P supply ratios and growth rates?
(ii) Is there a direct effect of N:P supply ratios on FA composition at the same growth rate in
all the three species? (ііі) Do FA responses to these two factors vary between the three
species? (iv) Do FAs correlate significantly with QN and QP in all three species?
MATERIALS AND METHODS
Study organisms and culture conditions. For Rhodomonas sp., I. galbana and P.
tricornutum, equivalent spherical diameter (ESD), cellular C, N, and P contents are shown
in Table 3-1. All cultures were set up at 18 oC and a salinity of 18 ± 1 psu in a temperature-
controlled room. The light intensity was constant at 100 µmol photons ⋅ m-2 ⋅ s-1 at a
light:dark cycle of 16:8 h. The culture medium was prepared with sterile filtered natural
seawater from the Kiel Fjord, Baltic Sea (Sterilizing Grade Filter, Sartobran P 0.2 µm)
(Sartorius Stedim Biotech GmbH, Goettingen, Germany) and enrichment nutrient solutions
(macronutrients and micronutrients) based on the modified Provasoli’s culture medium
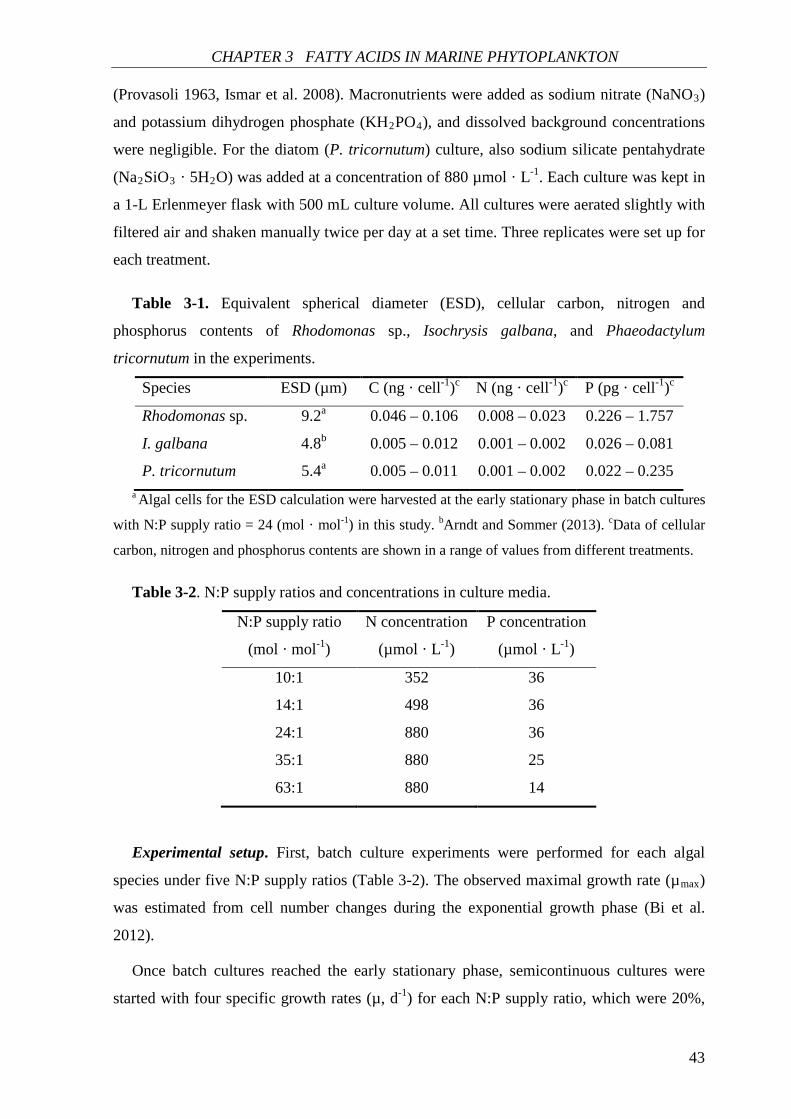
CHAPTER 3 FATTY ACIDS IN MARINE PHYTOPLANKTON
43
(Provasoli 1963, Ismar et al. 2008). Macronutrients were added as sodium nitrate (NaNO3)
and potassium dihydrogen phosphate (KH2PO4), and dissolved background concentrations
were negligible. For the diatom (P. tricornutum) culture, also sodium silicate pentahydrate
(Na2SiO3 · 5H2O) was added at a concentration of 880 µmol · L-1. Each culture was kept in
a 1-L Erlenmeyer flask with 500 mL culture volume. All cultures were aerated slightly with
filtered air and shaken manually twice per day at a set time. Three replicates were set up for
each treatment.
Table 3-1. Equivalent spherical diameter (ESD), cellular carbon, nitrogen and
phosphorus contents of Rhodomonas sp., Isochrysis galbana, and Phaeodactylum
tricornutum in the experiments.
Species ESD (µm) C (ng · cell-1)c N (ng · cell-1)c P (pg · cell-1)c
Rhodomonas sp. 9.2a 0.046 – 0.106 0.008 – 0.023 0.226 – 1.757
I. galbana 4.8b 0.005 – 0.012 0.001 – 0.002 0.026 – 0.081
P. tricornutum 5.4a 0.005 – 0.011 0.001 – 0.002 0.022 – 0.235 a Algal cells for the ESD calculation were harvested at the early stationary phase in batch cultures
with N:P supply ratio = 24 (mol · mol-1) in this study. bArndt and Sommer (2013). cData of cellular
carbon, nitrogen and phosphorus contents are shown in a range of values from different treatments.
Table 3-2. N:P supply ratios and concentrations in culture media.
N:P supply ratio
(mol · mol-1)
N concentration
(µmol · L-1)
P concentration
(µmol · L-1)
10:1 352 36
14:1 498 36
24:1 880 36
35:1 880 25
63:1 880 14
Experimental setup. First, batch culture experiments were performed for each algal
species under five N:P supply ratios (Table 3-2). The observed maximal growth rate (µmax)
was estimated from cell number changes during the exponential growth phase (Bi et al.
2012).
Once batch cultures reached the early stationary phase, semicontinuous cultures were
started with four specific growth rates (µ, d-1) for each N:P supply ratio, which were 20%,
CHAPTER 3 FATTY ACIDS IN MARINE PHYTOPLANKTON
44
40%, 60%, and 80% of µmax. The equivalent daily renewal rate (D, d-1) can be estimated by
D = 1- e-µ·t, where t is renewal interval (d) (here t = 1d). Renewal of the cultures was carried
out at the same hour every day. The steady state in semicontinuous cultures was assessed
based on the net growth rate (r). When r was zero (at steady state), µ was equivalent to D.
Sample analysis. For each treatment replicate, one sample was taken for analysis. To
avoid the effects of diel variations and subsequent variability in the data, sampling was
carried out during the same hour as the daily renewal of the cultures. Algal cell density was
counted daily using an improved Neubauer hemacytometer (Glaswarenfabrik Karl Hecht
GmbH, Rhön, Germany). For chemical analysis, algal cells (1 to 8 mL algal culture,
depending on cell density) were harvested at steady state by filtration on pre-combusted
Whatman GF/F filters (Whatman GmbH, Dassel, Germany). After filtration, samples for
elemental analysis were immediately dried and stored in a desiccator, and samples for FA
analysis were frozen at -80 oC.
The determination of particulate organic carbon (POC) and nitrogen (PON) was carried
out after Sharp (1974) by gas chromatography in an organic elemental analyzer (Thermo
Flash 2000) (Thermo Fisher Scientific Inc., Schwerte, Germany). Particulate organic
phosphorus (POP) was analyzed colorimetrically by converting organic phosphorus
compounds to orthophosphate (Hansen and Koroleff 1999).
FAs were measured as fatty acid methyl esters (FAMEs) using a gas chromatograph
(Trace GC-Ultra) (Thermo Fisher Scientific Inc., Schwerte, Germany) according to the
procedure described in detail in Arndt and Sommer (2013). The FAME mixture C13:0,
C15:0, C17:0, C19:0 and C21:0 was added as internal standard, and tricosanoic acid (C23:0)
added as esterification control. The extracted FAs were dissolved with n-hexane to a final
volume of 100 µL. Sample aliquots (1 µL) were given into the GC by splitless injection
with hydrogen as the carrier gas. Individual FAs were integrated using Chromcard software
(Thermo Fisher Scientific Inc., Schwerte, Germany) and identified with reference to
commercially available standards, Supelco 37 component FAME mixture and Supelco
Menhaden fish oil.
Statistics. Principal coordinates analysis (PCO) was performed to visualize FA
composition (expressed as % of TFAs and µg · mg C-1, respectively) of the three algal
species under the entire range of N:P supply ratios and growth rates. PCO of FA
composition was calculated from the Bray-Curtis similarity resemblance matrix. The raw
data matrix was square root transformed. A vector overlay was applied on the PCO plot to
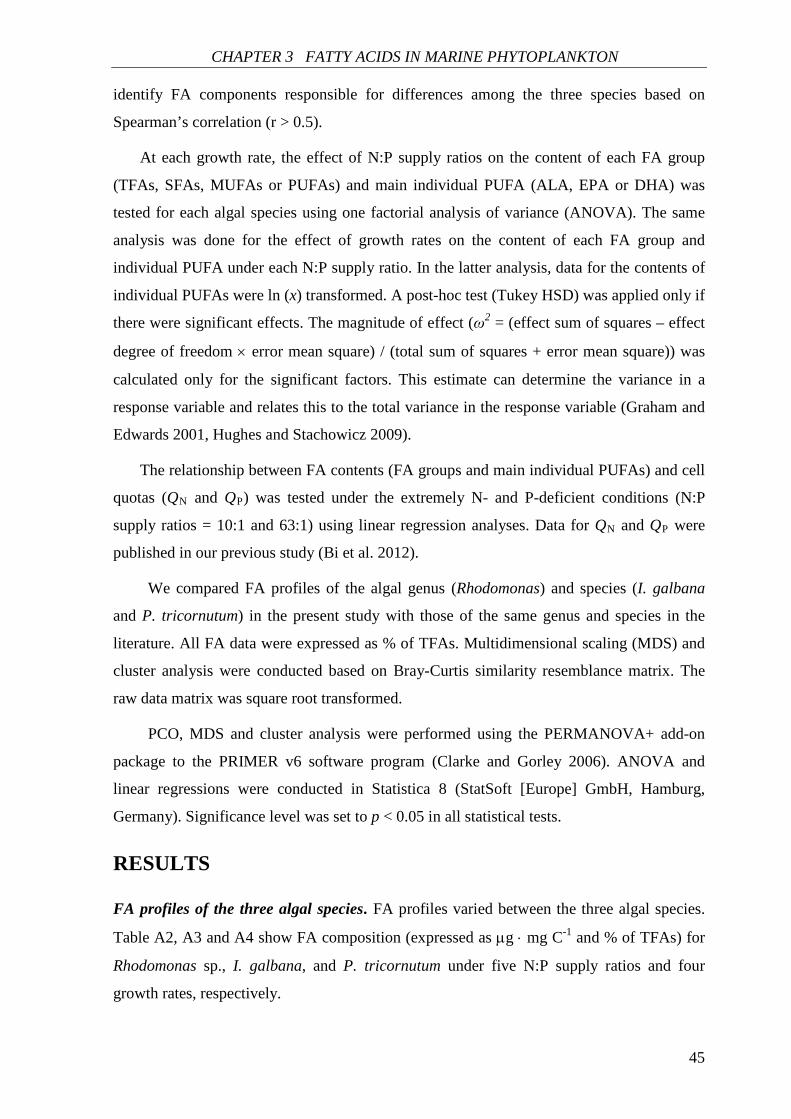
CHAPTER 3 FATTY ACIDS IN MARINE PHYTOPLANKTON
45
identify FA components responsible for differences among the three species based on
Spearman’s correlation (r > 0.5).
At each growth rate, the effect of N:P supply ratios on the content of each FA group
(TFAs, SFAs, MUFAs or PUFAs) and main individual PUFA (ALA, EPA or DHA) was
tested for each algal species using one factorial analysis of variance (ANOVA). The same
analysis was done for the effect of growth rates on the content of each FA group and
individual PUFA under each N:P supply ratio. In the latter analysis, data for the contents of
individual PUFAs were ln (x) transformed. A post-hoc test (Tukey HSD) was applied only if
there were significant effects. The magnitude of effect (ω2 = (effect sum of squares – effect
degree of freedom × error mean square) / (total sum of squares + error mean square)) was
calculated only for the significant factors. This estimate can determine the variance in a
response variable and relates this to the total variance in the response variable (Graham and
Edwards 2001, Hughes and Stachowicz 2009).
The relationship between FA contents (FA groups and main individual PUFAs) and cell
quotas (QN and QP) was tested under the extremely N- and P-deficient conditions (N:P
supply ratios = 10:1 and 63:1) using linear regression analyses. Data for QN and QP were
published in our previous study (Bi et al. 2012).
We compared FA profiles of the algal genus (Rhodomonas) and species (I. galbana
and P. tricornutum) in the present study with those of the same genus and species in the
literature. All FA data were expressed as % of TFAs. Multidimensional scaling (MDS) and
cluster analysis were conducted based on Bray-Curtis similarity resemblance matrix. The
raw data matrix was square root transformed.
PCO, MDS and cluster analysis were performed using the PERMANOVA+ add-on
package to the PRIMER v6 software program (Clarke and Gorley 2006). ANOVA and
linear regressions were conducted in Statistica 8 (StatSoft [Europe] GmbH, Hamburg,
Germany). Significance level was set to p < 0.05 in all statistical tests.
RESULTS
FA profiles of the three algal species. FA profiles varied between the three algal species.
Table A2, A3 and A4 show FA composition (expressed as µg ⋅ mg C-1 and % of TFAs) for
Rhodomonas sp., I. galbana, and P. tricornutum under five N:P supply ratios and four
growth rates, respectively.
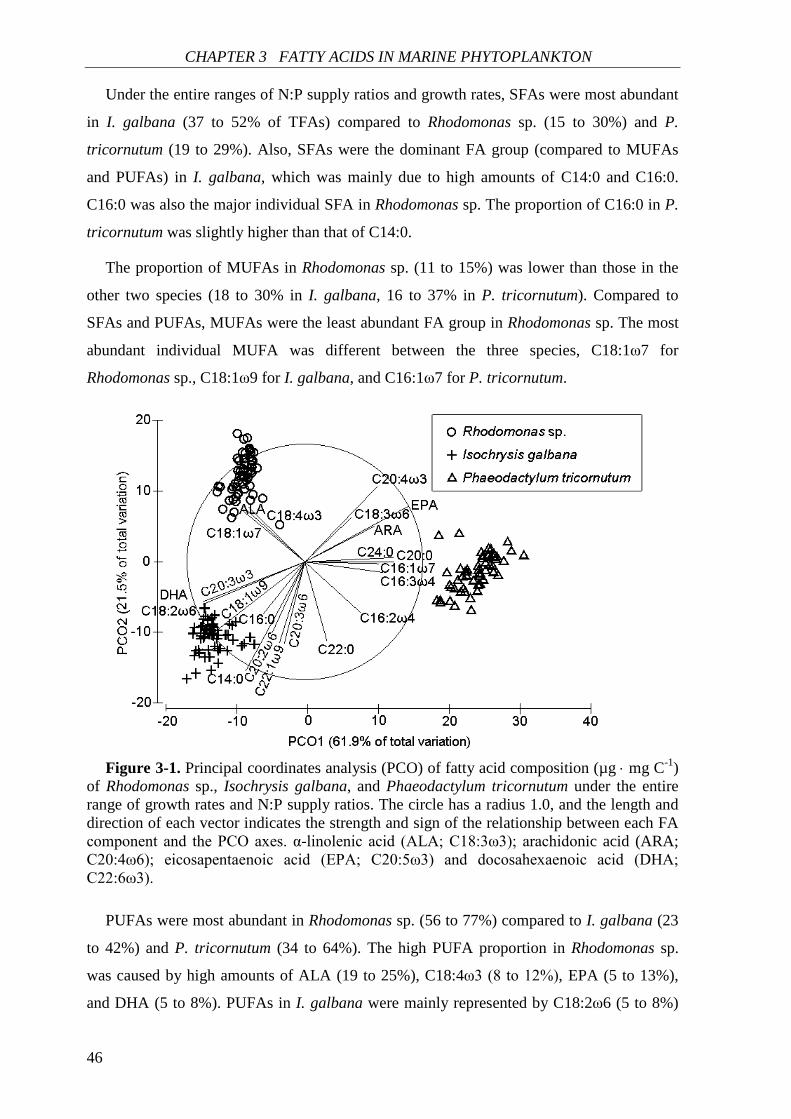
CHAPTER 3 FATTY ACIDS IN MARINE PHYTOPLANKTON
46
Under the entire ranges of N:P supply ratios and growth rates, SFAs were most abundant
in I. galbana (37 to 52% of TFAs) compared to Rhodomonas sp. (15 to 30%) and P.
tricornutum (19 to 29%). Also, SFAs were the dominant FA group (compared to MUFAs
and PUFAs) in I. galbana, which was mainly due to high amounts of C14:0 and C16:0.
C16:0 was also the major individual SFA in Rhodomonas sp. The proportion of C16:0 in P.
tricornutum was slightly higher than that of C14:0.
The proportion of MUFAs in Rhodomonas sp. (11 to 15%) was lower than those in the
other two species (18 to 30% in I. galbana, 16 to 37% in P. tricornutum). Compared to
SFAs and PUFAs, MUFAs were the least abundant FA group in Rhodomonas sp. The most
abundant individual MUFA was different between the three species, C18:1ω7 for
Rhodomonas sp., C18:1ω9 for I. galbana, and C16:1ω7 for P. tricornutum.
Figure 3-1. Principal coordinates analysis (PCO) of fatty acid composition (µg ⋅ mg C-1)
of Rhodomonas sp., Isochrysis galbana, and Phaeodactylum tricornutum under the entire range of growth rates and N:P supply ratios. The circle has a radius 1.0, and the length and direction of each vector indicates the strength and sign of the relationship between each FA component and the PCO axes. α-linolenic acid (ALA; C18:3ω3); arachidonic acid (ARA; C20:4ω6); eicosapentaenoic acid (EPA; C20:5ω3) and docosahexaenoic acid (DHA; C22:6ω3).
PUFAs were most abundant in Rhodomonas sp. (56 to 77%) compared to I. galbana (23
to 42%) and P. tricornutum (34 to 64%). The high PUFA proportion in Rhodomonas sp.
was caused by high amounts of ALA (19 to 25%), C18:4ω3 (8 to 12%), EPA (5 to 13%),
and DHA (5 to 8%). PUFAs in I. galbana were mainly represented by C18:2ω6 (5 to 8%)
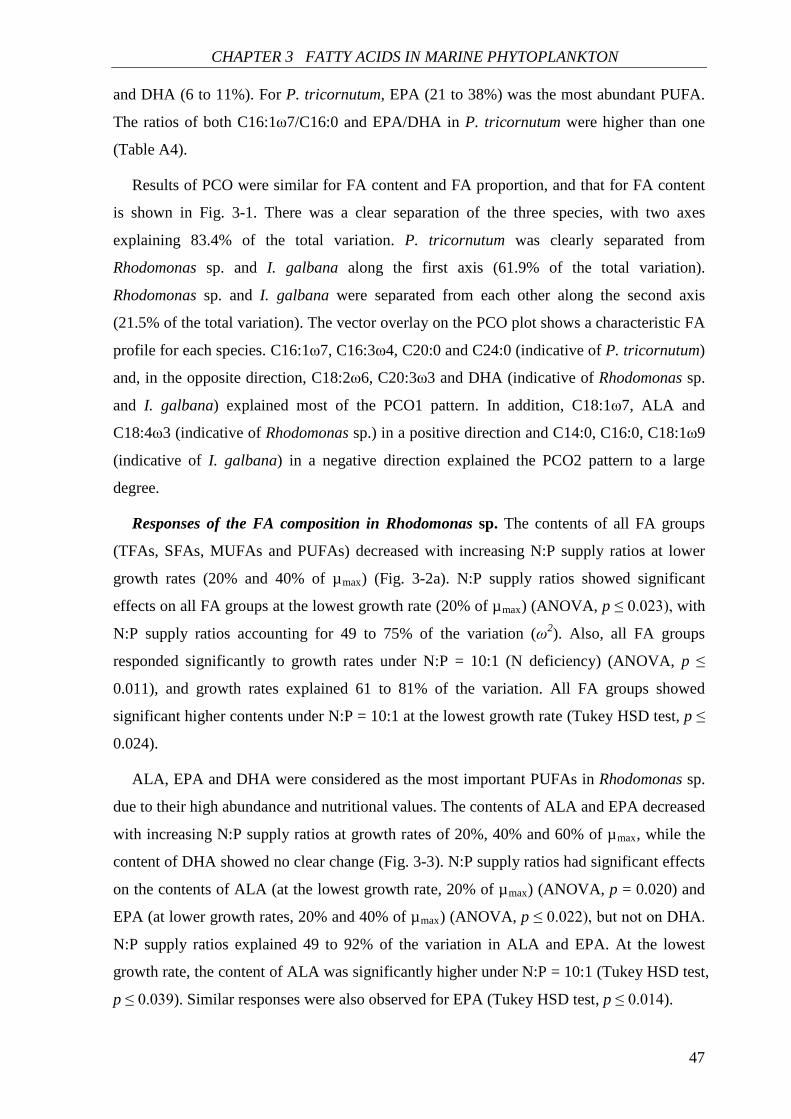
CHAPTER 3 FATTY ACIDS IN MARINE PHYTOPLANKTON
47
and DHA (6 to 11%). For P. tricornutum, EPA (21 to 38%) was the most abundant PUFA.
The ratios of both C16:1ω7/C16:0 and EPA/DHA in P. tricornutum were higher than one
(Table A4).
Results of PCO were similar for FA content and FA proportion, and that for FA content
is shown in Fig. 3-1. There was a clear separation of the three species, with two axes
explaining 83.4% of the total variation. P. tricornutum was clearly separated from
Rhodomonas sp. and I. galbana along the first axis (61.9% of the total variation).
Rhodomonas sp. and I. galbana were separated from each other along the second axis
(21.5% of the total variation). The vector overlay on the PCO plot shows a characteristic FA
profile for each species. C16:1ω7, C16:3ω4, C20:0 and C24:0 (indicative of P. tricornutum)
and, in the opposite direction, C18:2ω6, C20:3ω3 and DHA (indicative of Rhodomonas sp.
and I. galbana) explained most of the PCO1 pattern. In addition, C18:1ω7, ALA and
C18:4ω3 (indicative of Rhodomonas sp.) in a positive direction and C14:0, C16:0, C18:1ω9
(indicative of I. galbana) in a negative direction explained the PCO2 pattern to a large
degree.
Responses of the FA composition in Rhodomonas sp. The contents of all FA groups
(TFAs, SFAs, MUFAs and PUFAs) decreased with increasing N:P supply ratios at lower
growth rates (20% and 40% of µmax) (Fig. 3-2a). N:P supply ratios showed significant
effects on all FA groups at the lowest growth rate (20% of µmax) (ANOVA, p ≤ 0.023), with
N:P supply ratios accounting for 49 to 75% of the variation (ω2). Also, all FA groups
responded significantly to growth rates under N:P = 10:1 (N deficiency) (ANOVA, p ≤
0.011), and growth rates explained 61 to 81% of the variation. All FA groups showed
significant higher contents under N:P = 10:1 at the lowest growth rate (Tukey HSD test, p ≤
0.024).
ALA, EPA and DHA were considered as the most important PUFAs in Rhodomonas sp.
due to their high abundance and nutritional values. The contents of ALA and EPA decreased
with increasing N:P supply ratios at growth rates of 20%, 40% and 60% of µmax, while the
content of DHA showed no clear change (Fig. 3-3). N:P supply ratios had significant effects
on the contents of ALA (at the lowest growth rate, 20% of µmax) (ANOVA, p = 0.020) and
EPA (at lower growth rates, 20% and 40% of µmax) (ANOVA, p ≤ 0.022), but not on DHA.
N:P supply ratios explained 49 to 92% of the variation in ALA and EPA. At the lowest
growth rate, the content of ALA was significantly higher under N:P = 10:1 (Tukey HSD test,
p ≤ 0.039). Similar responses were also observed for EPA (Tukey HSD test, p ≤ 0.014).
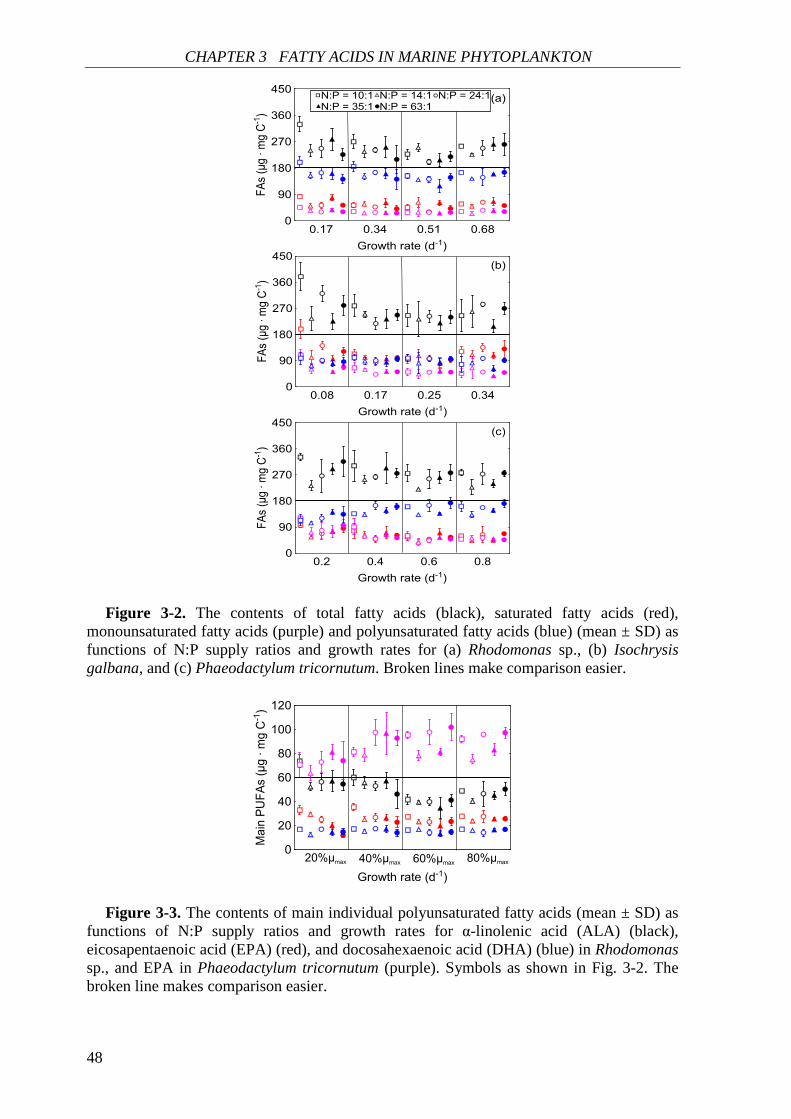
CHAPTER 3 FATTY ACIDS IN MARINE PHYTOPLANKTON
48
Figure 3-2. The contents of total fatty acids (black), saturated fatty acids (red), monounsaturated fatty acids (purple) and polyunsaturated fatty acids (blue) (mean ± SD) as functions of N:P supply ratios and growth rates for (a) Rhodomonas sp., (b) Isochrysis galbana, and (c) Phaeodactylum tricornutum. Broken lines make comparison easier.
Figure 3-3. The contents of main individual polyunsaturated fatty acids (mean ± SD) as functions of N:P supply ratios and growth rates for α-linolenic acid (ALA) (black), eicosapentaenoic acid (EPA) (red), and docosahexaenoic acid (DHA) (blue) in Rhodomonas sp., and EPA in Phaeodactylum tricornutum (purple). Symbols as shown in Fig. 3-2. The broken line makes comparison easier.
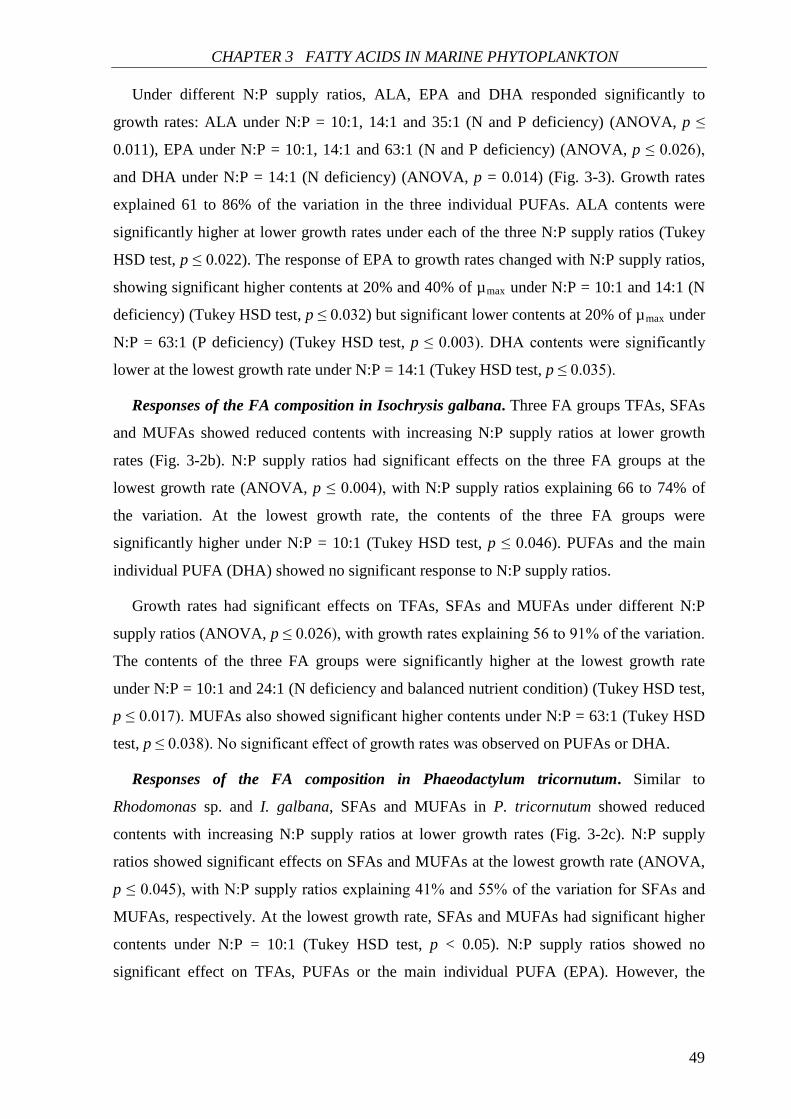
CHAPTER 3 FATTY ACIDS IN MARINE PHYTOPLANKTON
49
Under different N:P supply ratios, ALA, EPA and DHA responded significantly to
growth rates: ALA under N:P = 10:1, 14:1 and 35:1 (N and P deficiency) (ANOVA, p ≤
0.011), EPA under N:P = 10:1, 14:1 and 63:1 (N and P deficiency) (ANOVA, p ≤ 0.026),
and DHA under N:P = 14:1 (N deficiency) (ANOVA, p = 0.014) (Fig. 3-3). Growth rates
explained 61 to 86% of the variation in the three individual PUFAs. ALA contents were
significantly higher at lower growth rates under each of the three N:P supply ratios (Tukey
HSD test, p ≤ 0.022). The response of EPA to growth rates changed with N:P supply ratios,
showing significant higher contents at 20% and 40% of µmax under N:P = 10:1 and 14:1 (N
deficiency) (Tukey HSD test, p ≤ 0.032) but significant lower contents at 20% of µmax under
N:P = 63:1 (P deficiency) (Tukey HSD test, p ≤ 0.003). DHA contents were significantly
lower at the lowest growth rate under N:P = 14:1 (Tukey HSD test, p ≤ 0.035).
Responses of the FA composition in Isochrysis galbana. Three FA groups TFAs, SFAs
and MUFAs showed reduced contents with increasing N:P supply ratios at lower growth
rates (Fig. 3-2b). N:P supply ratios had significant effects on the three FA groups at the
lowest growth rate (ANOVA, p ≤ 0.004), with N:P supply ratios explaining 66 to 74% of
the variation. At the lowest growth rate, the contents of the three FA groups were
significantly higher under N:P = 10:1 (Tukey HSD test, p ≤ 0.046). PUFAs and the main
individual PUFA (DHA) showed no significant response to N:P supply ratios.
Growth rates had significant effects on TFAs, SFAs and MUFAs under different N:P
supply ratios (ANOVA, p ≤ 0.026), with growth rates explaining 56 to 91% of the variation.
The contents of the three FA groups were significantly higher at the lowest growth rate
under N:P = 10:1 and 24:1 (N deficiency and balanced nutrient condition) (Tukey HSD test,
p ≤ 0.017). MUFAs also showed significant higher contents under N:P = 63:1 (Tukey HSD
test, p ≤ 0.038). No significant effect of growth rates was observed on PUFAs or DHA.
Responses of the FA composition in Phaeodactylum tricornutum. Similar to
Rhodomonas sp. and I. galbana, SFAs and MUFAs in P. tricornutum showed reduced
contents with increasing N:P supply ratios at lower growth rates (Fig. 3-2c). N:P supply
ratios showed significant effects on SFAs and MUFAs at the lowest growth rate (ANOVA,
p ≤ 0.045), with N:P supply ratios explaining 41% and 55% of the variation for SFAs and
MUFAs, respectively. At the lowest growth rate, SFAs and MUFAs had significant higher
contents under N:P = 10:1 (Tukey HSD test, p < 0.05). N:P supply ratios showed no
significant effect on TFAs, PUFAs or the main individual PUFA (EPA). However, the
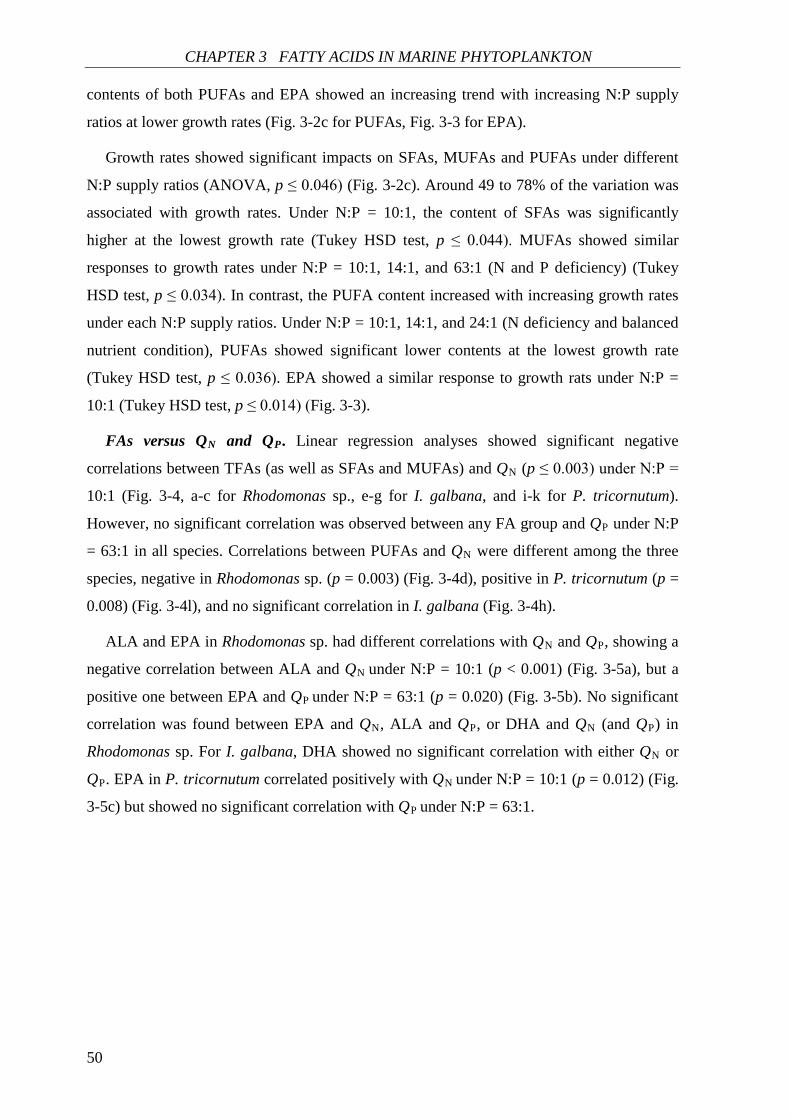
CHAPTER 3 FATTY ACIDS IN MARINE PHYTOPLANKTON
50
contents of both PUFAs and EPA showed an increasing trend with increasing N:P supply
ratios at lower growth rates (Fig. 3-2c for PUFAs, Fig. 3-3 for EPA).
Growth rates showed significant impacts on SFAs, MUFAs and PUFAs under different
N:P supply ratios (ANOVA, p ≤ 0.046) (Fig. 3-2c). Around 49 to 78% of the variation was
associated with growth rates. Under N:P = 10:1, the content of SFAs was significantly
higher at the lowest growth rate (Tukey HSD test, p ≤ 0.044). MUFAs showed similar
responses to growth rates under N:P = 10:1, 14:1, and 63:1 (N and P deficiency) (Tukey
HSD test, p ≤ 0.034). In contrast, the PUFA content increased with increasing growth rates
under each N:P supply ratios. Under N:P = 10:1, 14:1, and 24:1 (N deficiency and balanced
nutrient condition), PUFAs showed significant lower contents at the lowest growth rate
(Tukey HSD test, p ≤ 0.036). EPA showed a similar response to growth rats under N:P =
10:1 (Tukey HSD test, p ≤ 0.014) (Fig. 3-3).
FAs versus QN and QP. Linear regression analyses showed significant negative
correlations between TFAs (as well as SFAs and MUFAs) and QN (p ≤ 0.003) under N:P =
10:1 (Fig. 3-4, a-c for Rhodomonas sp., e-g for I. galbana, and i-k for P. tricornutum).
However, no significant correlation was observed between any FA group and QP under N:P
= 63:1 in all species. Correlations between PUFAs and QN were different among the three
species, negative in Rhodomonas sp. (p = 0.003) (Fig. 3-4d), positive in P. tricornutum (p =
0.008) (Fig. 3-4l), and no significant correlation in I. galbana (Fig. 3-4h).
ALA and EPA in Rhodomonas sp. had different correlations with QN and QP, showing a
negative correlation between ALA and QN under N:P = 10:1 (p < 0.001) (Fig. 3-5a), but a
positive one between EPA and QP under N:P = 63:1 (p = 0.020) (Fig. 3-5b). No significant
correlation was found between EPA and QN, ALA and QP, or DHA and QN (and QP) in
Rhodomonas sp. For I. galbana, DHA showed no significant correlation with either QN or
QP. EPA in P. tricornutum correlated positively with QN under N:P = 10:1 (p = 0.012) (Fig.
3-5c) but showed no significant correlation with QP under N:P = 63:1.
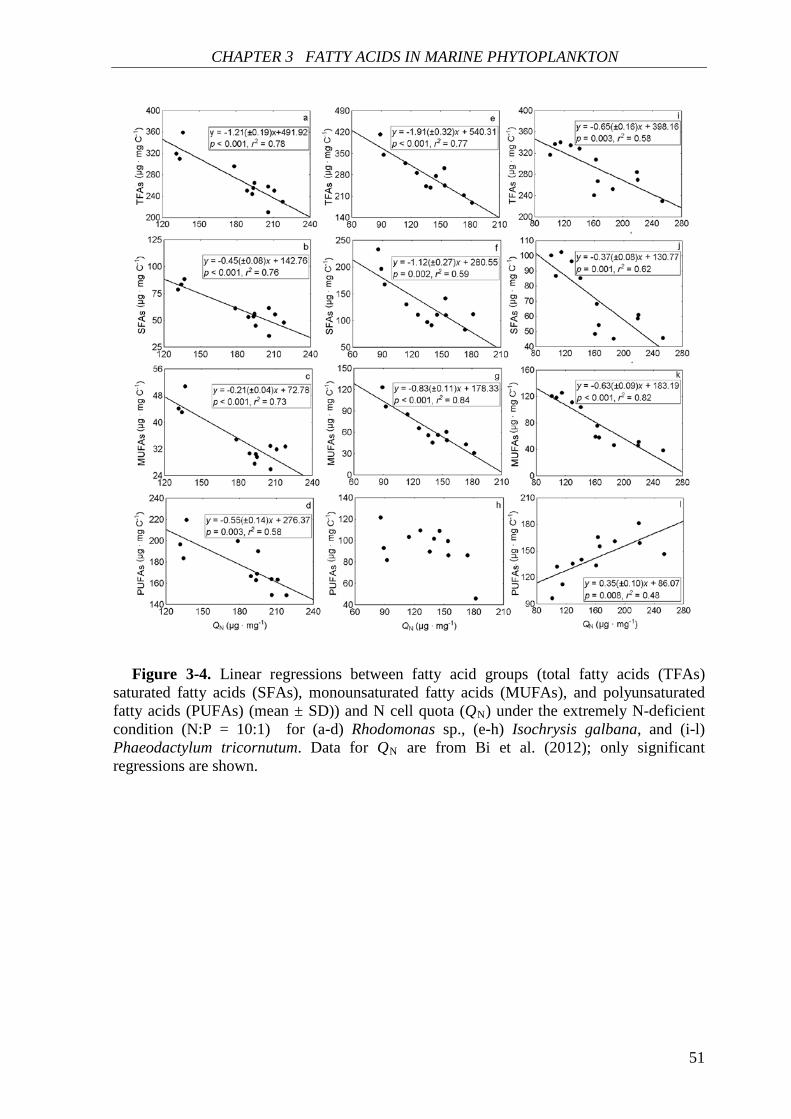
CHAPTER 3 FATTY ACIDS IN MARINE PHYTOPLANKTON
51
Figure 3-4. Linear regressions between fatty acid groups (total fatty acids (TFAs) saturated fatty acids (SFAs), monounsaturated fatty acids (MUFAs), and polyunsaturated fatty acids (PUFAs) (mean ± SD)) and N cell quota (QN) under the extremely N-deficient condition (N:P = 10:1) for (a-d) Rhodomonas sp., (e-h) Isochrysis galbana, and (i-l) Phaeodactylum tricornutum. Data for QN are from Bi et al. (2012); only significant regressions are shown.
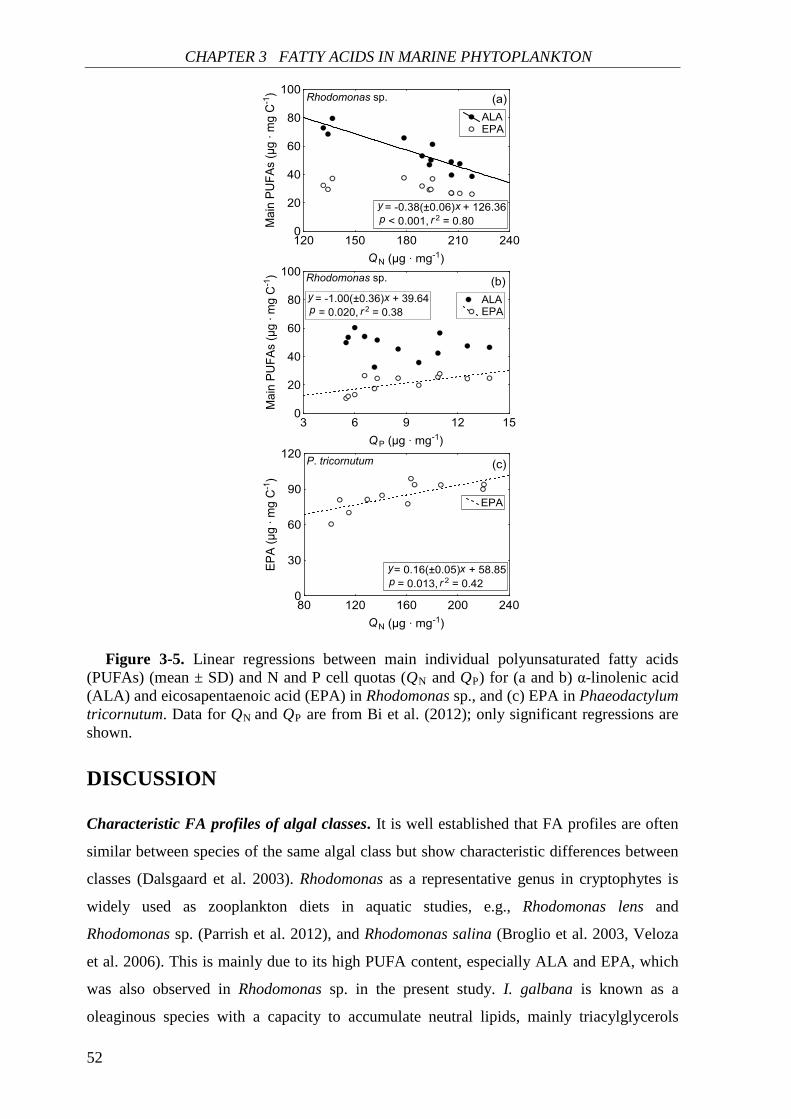
CHAPTER 3 FATTY ACIDS IN MARINE PHYTOPLANKTON
52
Figure 3-5. Linear regressions between main individual polyunsaturated fatty acids (PUFAs) (mean ± SD) and N and P cell quotas (QN and QP) for (a and b) α-linolenic acid (ALA) and eicosapentaenoic acid (EPA) in Rhodomonas sp., and (c) EPA in Phaeodactylum tricornutum. Data for QN and QP are from Bi et al. (2012); only significant regressions are shown.
DISCUSSION
Characteristic FA profiles of algal classes. It is well established that FA profiles are often
similar between species of the same algal class but show characteristic differences between
classes (Dalsgaard et al. 2003). Rhodomonas as a representative genus in cryptophytes is
widely used as zooplankton diets in aquatic studies, e.g., Rhodomonas lens and
Rhodomonas sp. (Parrish et al. 2012), and Rhodomonas salina (Broglio et al. 2003, Veloza
et al. 2006). This is mainly due to its high PUFA content, especially ALA and EPA, which
was also observed in Rhodomonas sp. in the present study. I. galbana is known as a
oleaginous species with a capacity to accumulate neutral lipids, mainly triacylglycerols
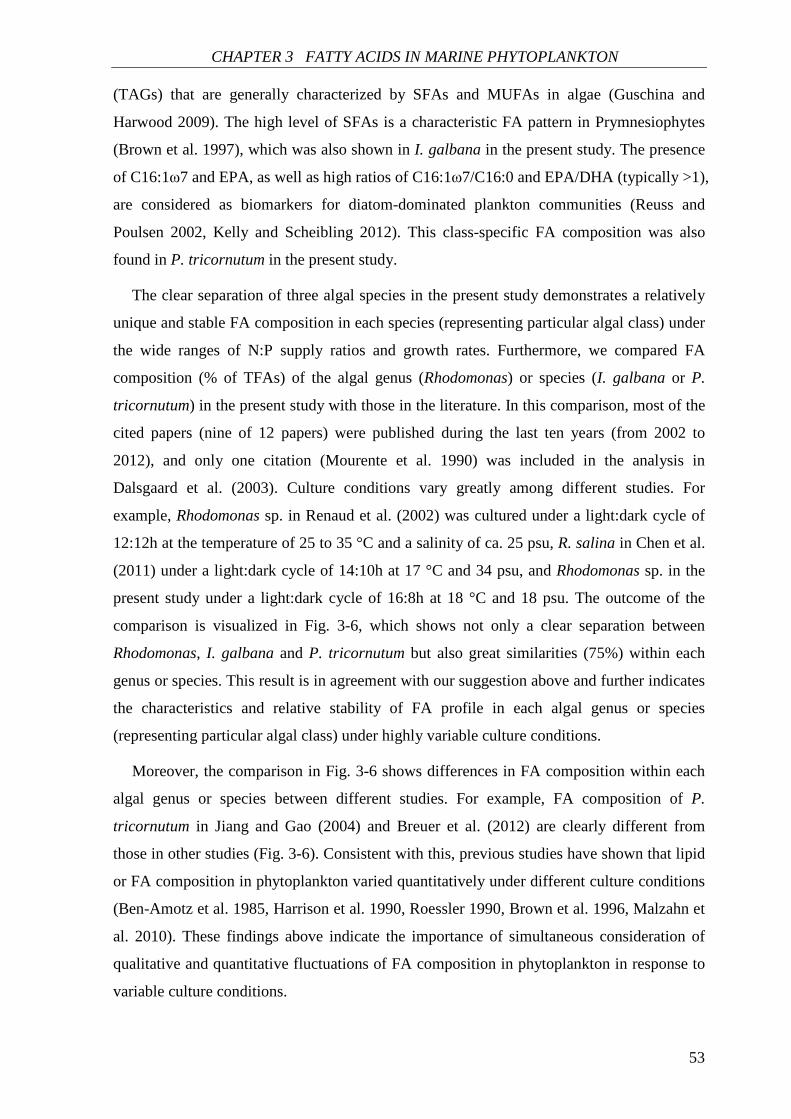
CHAPTER 3 FATTY ACIDS IN MARINE PHYTOPLANKTON
53
(TAGs) that are generally characterized by SFAs and MUFAs in algae (Guschina and
Harwood 2009). The high level of SFAs is a characteristic FA pattern in Prymnesiophytes
(Brown et al. 1997), which was also shown in I. galbana in the present study. The presence
of C16:1ω7 and EPA, as well as high ratios of C16:1ω7/C16:0 and EPA/DHA (typically >1),
are considered as biomarkers for diatom-dominated plankton communities (Reuss and
Poulsen 2002, Kelly and Scheibling 2012). This class-specific FA composition was also
found in P. tricornutum in the present study.
The clear separation of three algal species in the present study demonstrates a relatively
unique and stable FA composition in each species (representing particular algal class) under
the wide ranges of N:P supply ratios and growth rates. Furthermore, we compared FA
composition (% of TFAs) of the algal genus (Rhodomonas) or species (I. galbana or P.
tricornutum) in the present study with those in the literature. In this comparison, most of the
cited papers (nine of 12 papers) were published during the last ten years (from 2002 to
2012), and only one citation (Mourente et al. 1990) was included in the analysis in
Dalsgaard et al. (2003). Culture conditions vary greatly among different studies. For
example, Rhodomonas sp. in Renaud et al. (2002) was cultured under a light:dark cycle of
12:12h at the temperature of 25 to 35 °C and a salinity of ca. 25 psu, R. salina in Chen et al.
(2011) under a light:dark cycle of 14:10h at 17 °C and 34 psu, and Rhodomonas sp. in the
present study under a light:dark cycle of 16:8h at 18 °C and 18 psu. The outcome of the
comparison is visualized in Fig. 3-6, which shows not only a clear separation between
Rhodomonas, I. galbana and P. tricornutum but also great similarities (75%) within each
genus or species. This result is in agreement with our suggestion above and further indicates
the characteristics and relative stability of FA profile in each algal genus or species
(representing particular algal class) under highly variable culture conditions.
Moreover, the comparison in Fig. 3-6 shows differences in FA composition within each
algal genus or species between different studies. For example, FA composition of P.
tricornutum in Jiang and Gao (2004) and Breuer et al. (2012) are clearly different from
those in other studies (Fig. 3-6). Consistent with this, previous studies have shown that lipid
or FA composition in phytoplankton varied quantitatively under different culture conditions
(Ben-Amotz et al. 1985, Harrison et al. 1990, Roessler 1990, Brown et al. 1996, Malzahn et
al. 2010). These findings above indicate the importance of simultaneous consideration of
qualitative and quantitative fluctuations of FA composition in phytoplankton in response to
variable culture conditions.
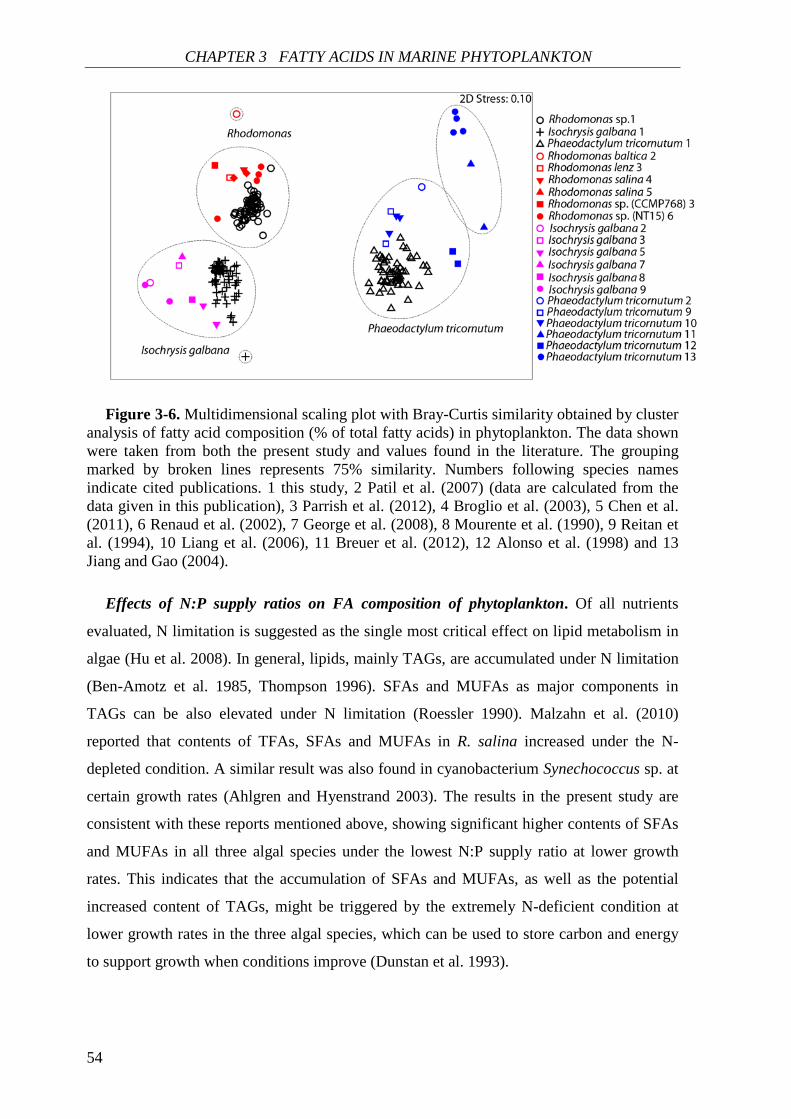
CHAPTER 3 FATTY ACIDS IN MARINE PHYTOPLANKTON
54
Figure 3-6. Multidimensional scaling plot with Bray-Curtis similarity obtained by cluster analysis of fatty acid composition (% of total fatty acids) in phytoplankton. The data shown were taken from both the present study and values found in the literature. The grouping marked by broken lines represents 75% similarity. Numbers following species names indicate cited publications. 1 this study, 2 Patil et al. (2007) (data are calculated from the data given in this publication), 3 Parrish et al. (2012), 4 Broglio et al. (2003), 5 Chen et al. (2011), 6 Renaud et al. (2002), 7 George et al. (2008), 8 Mourente et al. (1990), 9 Reitan et al. (1994), 10 Liang et al. (2006), 11 Breuer et al. (2012), 12 Alonso et al. (1998) and 13 Jiang and Gao (2004).
Effects of N:P supply ratios on FA composition of phytoplankton. Of all nutrients
evaluated, N limitation is suggested as the single most critical effect on lipid metabolism in
algae (Hu et al. 2008). In general, lipids, mainly TAGs, are accumulated under N limitation
(Ben-Amotz et al. 1985, Thompson 1996). SFAs and MUFAs as major components in
TAGs can be also elevated under N limitation (Roessler 1990). Malzahn et al. (2010)
reported that contents of TFAs, SFAs and MUFAs in R. salina increased under the N-
depleted condition. A similar result was also found in cyanobacterium Synechococcus sp. at
certain growth rates (Ahlgren and Hyenstrand 2003). The results in the present study are
consistent with these reports mentioned above, showing significant higher contents of SFAs
and MUFAs in all three algal species under the lowest N:P supply ratio at lower growth
rates. This indicates that the accumulation of SFAs and MUFAs, as well as the potential
increased content of TAGs, might be triggered by the extremely N-deficient condition at
lower growth rates in the three algal species, which can be used to store carbon and energy
to support growth when conditions improve (Dunstan et al. 1993).
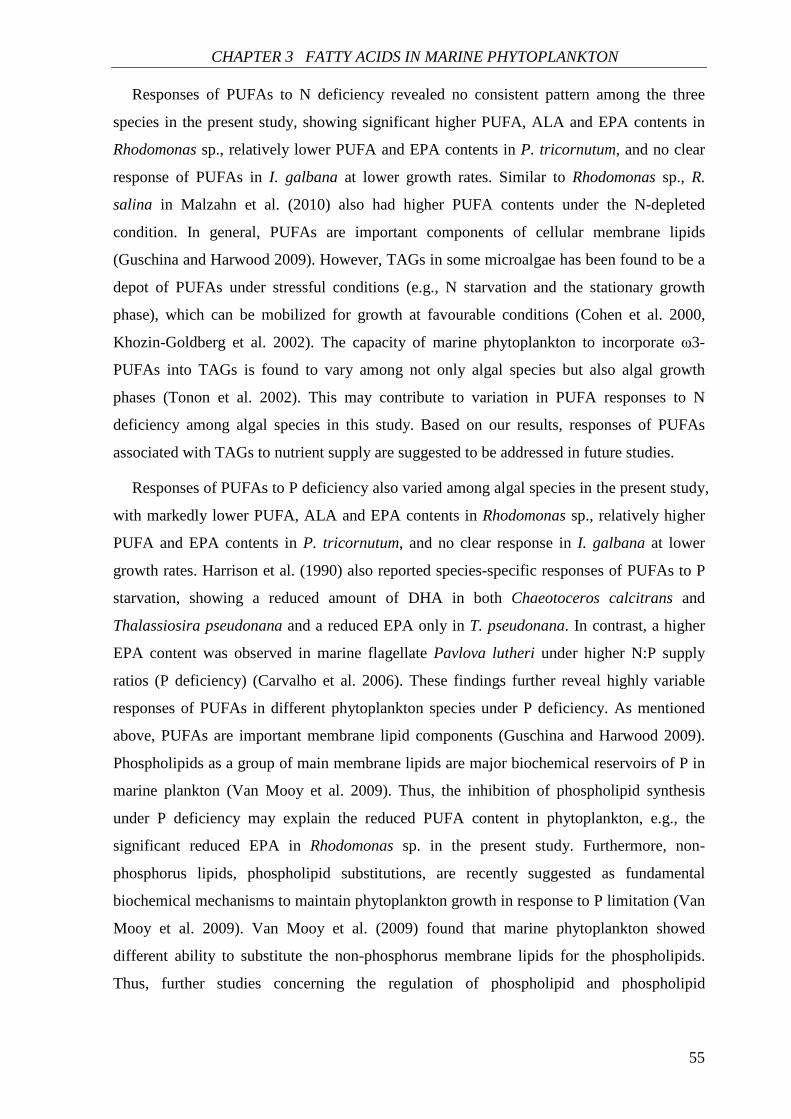
CHAPTER 3 FATTY ACIDS IN MARINE PHYTOPLANKTON
55
Responses of PUFAs to N deficiency revealed no consistent pattern among the three
species in the present study, showing significant higher PUFA, ALA and EPA contents in
Rhodomonas sp., relatively lower PUFA and EPA contents in P. tricornutum, and no clear
response of PUFAs in I. galbana at lower growth rates. Similar to Rhodomonas sp., R.
salina in Malzahn et al. (2010) also had higher PUFA contents under the N-depleted
condition. In general, PUFAs are important components of cellular membrane lipids
(Guschina and Harwood 2009). However, TAGs in some microalgae has been found to be a
depot of PUFAs under stressful conditions (e.g., N starvation and the stationary growth
phase), which can be mobilized for growth at favourable conditions (Cohen et al. 2000,
Khozin-Goldberg et al. 2002). The capacity of marine phytoplankton to incorporate ω3-
PUFAs into TAGs is found to vary among not only algal species but also algal growth
phases (Tonon et al. 2002). This may contribute to variation in PUFA responses to N
deficiency among algal species in this study. Based on our results, responses of PUFAs
associated with TAGs to nutrient supply are suggested to be addressed in future studies.
Responses of PUFAs to P deficiency also varied among algal species in the present study,
with markedly lower PUFA, ALA and EPA contents in Rhodomonas sp., relatively higher
PUFA and EPA contents in P. tricornutum, and no clear response in I. galbana at lower
growth rates. Harrison et al. (1990) also reported species-specific responses of PUFAs to P
starvation, showing a reduced amount of DHA in both Chaeotoceros calcitrans and
Thalassiosira pseudonana and a reduced EPA only in T. pseudonana. In contrast, a higher
EPA content was observed in marine flagellate Pavlova lutheri under higher N:P supply
ratios (P deficiency) (Carvalho et al. 2006). These findings further reveal highly variable
responses of PUFAs in different phytoplankton species under P deficiency. As mentioned
above, PUFAs are important membrane lipid components (Guschina and Harwood 2009).
Phospholipids as a group of main membrane lipids are major biochemical reservoirs of P in
marine plankton (Van Mooy et al. 2009). Thus, the inhibition of phospholipid synthesis
under P deficiency may explain the reduced PUFA content in phytoplankton, e.g., the
significant reduced EPA in Rhodomonas sp. in the present study. Furthermore, non-
phosphorus lipids, phospholipid substitutions, are recently suggested as fundamental
biochemical mechanisms to maintain phytoplankton growth in response to P limitation (Van
Mooy et al. 2009). Van Mooy et al. (2009) found that marine phytoplankton showed
different ability to substitute the non-phosphorus membrane lipids for the phospholipids.
Thus, further studies concerning the regulation of phospholipid and phospholipid
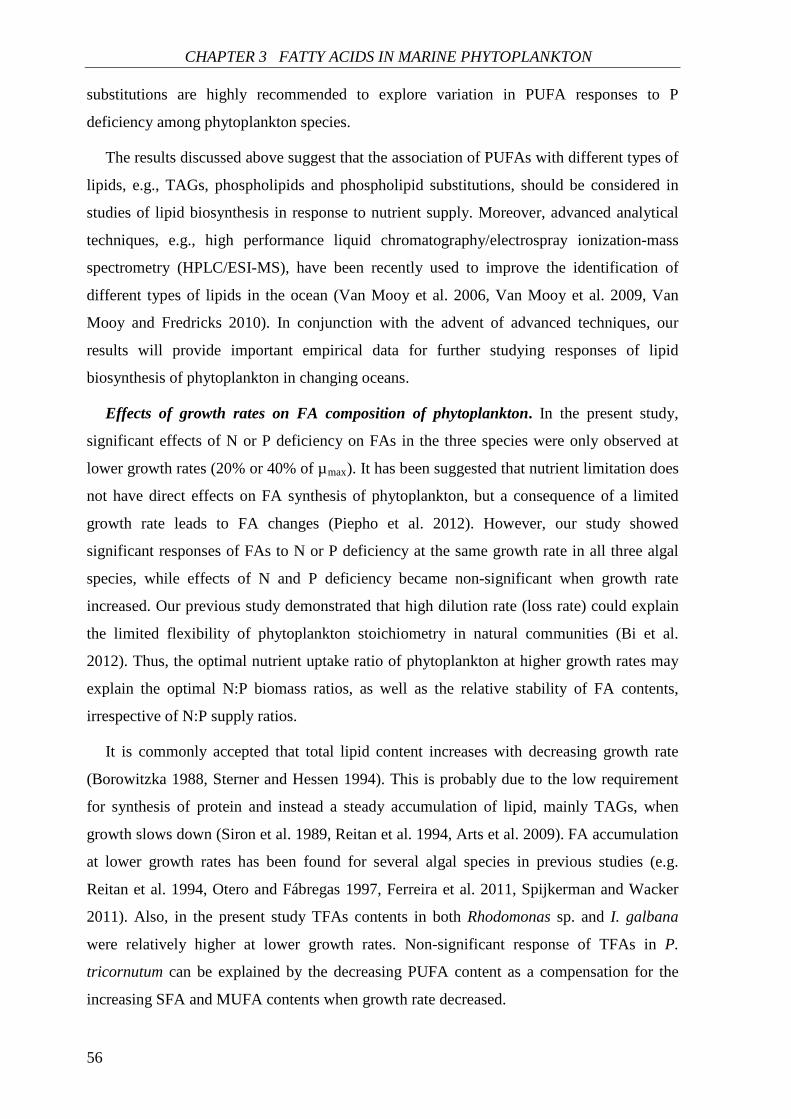
CHAPTER 3 FATTY ACIDS IN MARINE PHYTOPLANKTON
56
substitutions are highly recommended to explore variation in PUFA responses to P
deficiency among phytoplankton species.
The results discussed above suggest that the association of PUFAs with different types of
lipids, e.g., TAGs, phospholipids and phospholipid substitutions, should be considered in
studies of lipid biosynthesis in response to nutrient supply. Moreover, advanced analytical
techniques, e.g., high performance liquid chromatography/electrospray ionization-mass
spectrometry (HPLC/ESI-MS), have been recently used to improve the identification of
different types of lipids in the ocean (Van Mooy et al. 2006, Van Mooy et al. 2009, Van
Mooy and Fredricks 2010). In conjunction with the advent of advanced techniques, our
results will provide important empirical data for further studying responses of lipid
biosynthesis of phytoplankton in changing oceans.
Effects of growth rates on FA composition of phytoplankton. In the present study,
significant effects of N or P deficiency on FAs in the three species were only observed at
lower growth rates (20% or 40% of µmax). It has been suggested that nutrient limitation does
not have direct effects on FA synthesis of phytoplankton, but a consequence of a limited
growth rate leads to FA changes (Piepho et al. 2012). However, our study showed
significant responses of FAs to N or P deficiency at the same growth rate in all three algal
species, while effects of N and P deficiency became non-significant when growth rate
increased. Our previous study demonstrated that high dilution rate (loss rate) could explain
the limited flexibility of phytoplankton stoichiometry in natural communities (Bi et al.
2012). Thus, the optimal nutrient uptake ratio of phytoplankton at higher growth rates may
explain the optimal N:P biomass ratios, as well as the relative stability of FA contents,
irrespective of N:P supply ratios.
It is commonly accepted that total lipid content increases with decreasing growth rate
(Borowitzka 1988, Sterner and Hessen 1994). This is probably due to the low requirement
for synthesis of protein and instead a steady accumulation of lipid, mainly TAGs, when
growth slows down (Siron et al. 1989, Reitan et al. 1994, Arts et al. 2009). FA accumulation
at lower growth rates has been found for several algal species in previous studies (e.g.
Reitan et al. 1994, Otero and Fábregas 1997, Ferreira et al. 2011, Spijkerman and Wacker
2011). Also, in the present study TFAs contents in both Rhodomonas sp. and I. galbana
were relatively higher at lower growth rates. Non-significant response of TFAs in P.
tricornutum can be explained by the decreasing PUFA content as a compensation for the
increasing SFA and MUFA contents when growth rate decreased.
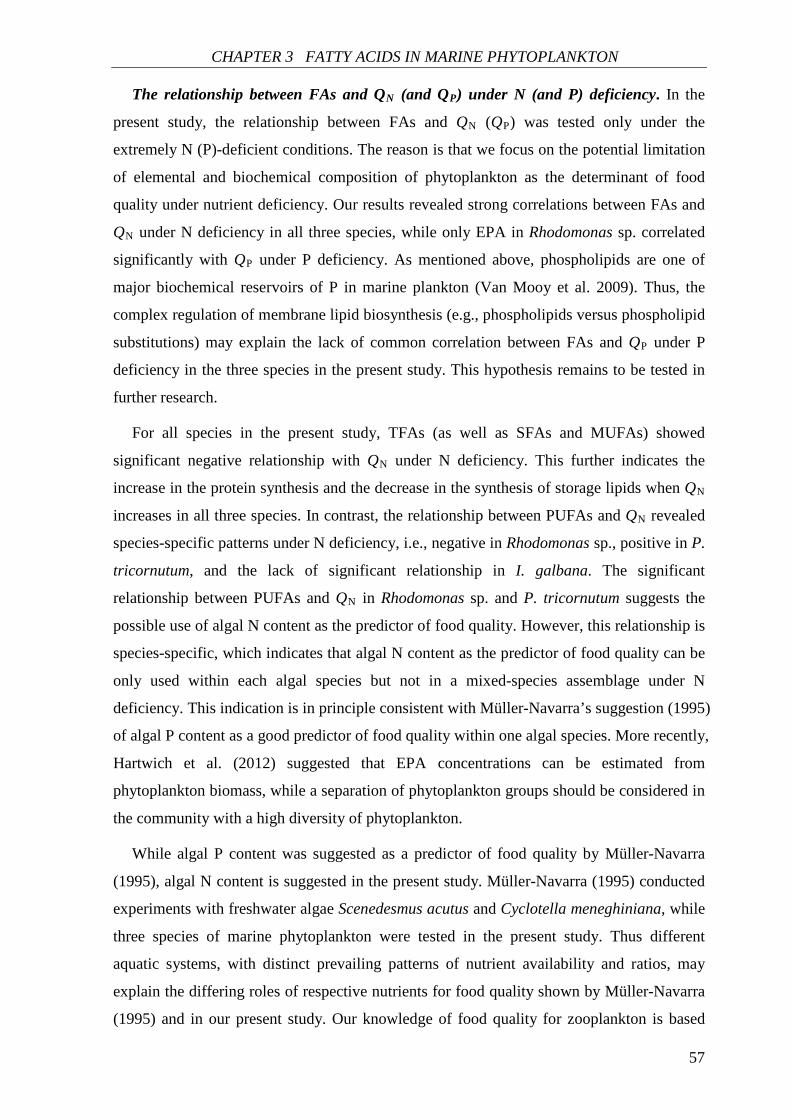
CHAPTER 3 FATTY ACIDS IN MARINE PHYTOPLANKTON
57
The relationship between FAs and QN (and QP) under N (and P) deficiency. In the
present study, the relationship between FAs and QN (QP) was tested only under the
extremely N (P)-deficient conditions. The reason is that we focus on the potential limitation
of elemental and biochemical composition of phytoplankton as the determinant of food
quality under nutrient deficiency. Our results revealed strong correlations between FAs and
QN under N deficiency in all three species, while only EPA in Rhodomonas sp. correlated
significantly with QP under P deficiency. As mentioned above, phospholipids are one of
major biochemical reservoirs of P in marine plankton (Van Mooy et al. 2009). Thus, the
complex regulation of membrane lipid biosynthesis (e.g., phospholipids versus phospholipid
substitutions) may explain the lack of common correlation between FAs and QP under P
deficiency in the three species in the present study. This hypothesis remains to be tested in
further research.
For all species in the present study, TFAs (as well as SFAs and MUFAs) showed
significant negative relationship with QN under N deficiency. This further indicates the
increase in the protein synthesis and the decrease in the synthesis of storage lipids when QN
increases in all three species. In contrast, the relationship between PUFAs and QN revealed
species-specific patterns under N deficiency, i.e., negative in Rhodomonas sp., positive in P.
tricornutum, and the lack of significant relationship in I. galbana. The significant
relationship between PUFAs and QN in Rhodomonas sp. and P. tricornutum suggests the
possible use of algal N content as the predictor of food quality. However, this relationship is
species-specific, which indicates that algal N content as the predictor of food quality can be
only used within each algal species but not in a mixed-species assemblage under N
deficiency. This indication is in principle consistent with Müller-Navarra’s suggestion (1995)
of algal P content as a good predictor of food quality within one algal species. More recently,
Hartwich et al. (2012) suggested that EPA concentrations can be estimated from
phytoplankton biomass, while a separation of phytoplankton groups should be considered in
the community with a high diversity of phytoplankton.
While algal P content was suggested as a predictor of food quality by Müller-Navarra
(1995), algal N content is suggested in the present study. Müller-Navarra (1995) conducted
experiments with freshwater algae Scenedesmus acutus and Cyclotella meneghiniana, while
three species of marine phytoplankton were tested in the present study. Thus different
aquatic systems, with distinct prevailing patterns of nutrient availability and ratios, may
explain the differing roles of respective nutrients for food quality shown by Müller-Navarra
(1995) and in our present study. Our knowledge of food quality for zooplankton is based
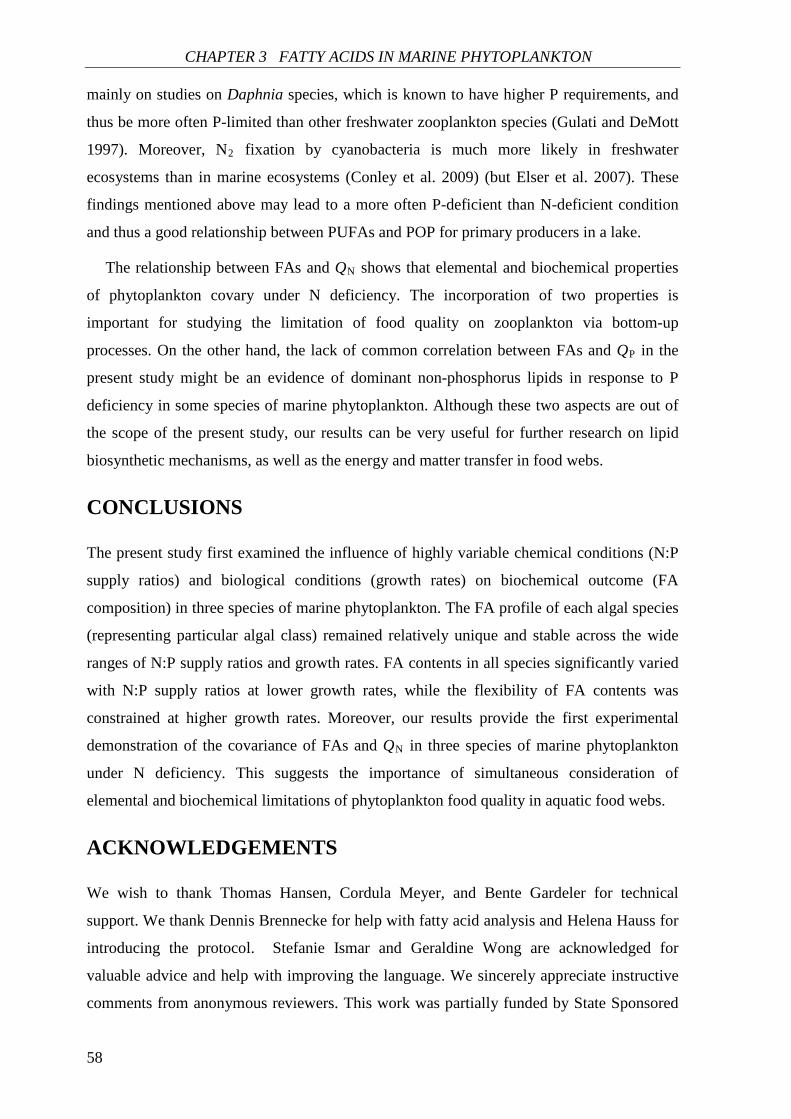
CHAPTER 3 FATTY ACIDS IN MARINE PHYTOPLANKTON
58
mainly on studies on Daphnia species, which is known to have higher P requirements, and
thus be more often P-limited than other freshwater zooplankton species (Gulati and DeMott
1997). Moreover, N2 fixation by cyanobacteria is much more likely in freshwater
ecosystems than in marine ecosystems (Conley et al. 2009) (but Elser et al. 2007). These
findings mentioned above may lead to a more often P-deficient than N-deficient condition
and thus a good relationship between PUFAs and POP for primary producers in a lake.
The relationship between FAs and QN shows that elemental and biochemical properties
of phytoplankton covary under N deficiency. The incorporation of two properties is
important for studying the limitation of food quality on zooplankton via bottom-up
processes. On the other hand, the lack of common correlation between FAs and QP in the
present study might be an evidence of dominant non-phosphorus lipids in response to P
deficiency in some species of marine phytoplankton. Although these two aspects are out of
the scope of the present study, our results can be very useful for further research on lipid
biosynthetic mechanisms, as well as the energy and matter transfer in food webs.
CONCLUSIONS
The present study first examined the influence of highly variable chemical conditions (N:P
supply ratios) and biological conditions (growth rates) on biochemical outcome (FA
composition) in three species of marine phytoplankton. The FA profile of each algal species
(representing particular algal class) remained relatively unique and stable across the wide
ranges of N:P supply ratios and growth rates. FA contents in all species significantly varied
with N:P supply ratios at lower growth rates, while the flexibility of FA contents was
constrained at higher growth rates. Moreover, our results provide the first experimental
demonstration of the covariance of FAs and QN in three species of marine phytoplankton
under N deficiency. This suggests the importance of simultaneous consideration of
elemental and biochemical limitations of phytoplankton food quality in aquatic food webs.
ACKNOWLEDGEMENTS
We wish to thank Thomas Hansen, Cordula Meyer, and Bente Gardeler for technical
support. We thank Dennis Brennecke for help with fatty acid analysis and Helena Hauss for
introducing the protocol. Stefanie Ismar and Geraldine Wong are acknowledged for
valuable advice and help with improving the language. We sincerely appreciate instructive
comments from anonymous reviewers. This work was partially funded by State Sponsored

CHAPTER 3 FATTY ACIDS IN MARINE PHYTOPLANKTON
59
Graduate Scholarship Program, China Scholarship Council (CSC), and the NEMO-project
in the program of the future-economy, Schleswig-Holstein-European Regional Development
Fund (ERDF).

60
61
CHAPTER 4
Effects of food quantity and food quality on
elemental and biochemical trophic transfer in
marine plankton: an experimental approach*
Rong Bi** and Ulrich Sommer
ABSTRACT
We conducted laboratory experiments to examine the effects of food quantity and
stoichiometric food quality on the transfer of elements and essential fatty acids between the
marine phytoplankton Rhodomonas sp. and the calanoid copepod Acartia tonsa, and the
reproductive response of A. tonsa. The relative gross growth efficiency for carbon (C) and X
(KC / KX) (X = nitrogen (N) or phosphorus (P)) responded negatively to algal C:X ratio but
positively to food concentration under nutrient deficient and food quantity limited
conditions. This resulted in higher KC / KN and KC / KP under optimized food conditions
(balanced nutrient diets at high food concentrations). Similar responses were observed for
the relative trophic transfer efficiency of ω3- (and ω6-) polyunsaturated fatty acids (PUFAs)
and C. Egg production rate of A. tonsa responded significantly to food quantity and
stoichiometric food quality, showing higher values under optimized food conditions. These
results suggest both elemental and essential PUFA trophic transfer can well predict copepod
* Under revision. Submitted to Journal of Plankton Research.
RB and US, Helmholtz Centre for Ocean Research Kiel (GEOMAR), Düsternbrooker Weg 20, 24105 Kiel, Germany.
** Corresponding author.
CHAPTER 4 TROPHIC TRANSFER IN MARINE PLANKTON
62
reproduction. Our study indicates the interactive effect of food quantity and stoichiometric
food quality on essential chemical trophic transfer in marine plankton, which may predict
the performance of consumers and trophic transfers at higher trophic levels in marine
systems.
INTRODUCTION
Heterotrophic metazoans regulate their chemical composition more strictly than do
autotrophs, while the latter usually exhibits great flexibility in chemical composition
reflecting ambient conditions (Sterner and Hessen 1994, Sterner and Elser 2002). This
ecological imbalance between food and consumers has great influence on the performance
of consumers, which may ultimately affect the whole aquatic systems (Anderson et al. 2004,
Aubert et al. 2013).
Marine and freshwater phytoplankton is frequently limited by nitrogen (N) and
phosphorus (P) (Hecky and Kilham 1988, Sommer 1996, Elser et al. 2007). More recently,
anthropogenic activities have been reported to induce the imbalance between carbon (C), N
and P in earth’s life system (Peñuelas et al. 2012). As a result, phytoplankton C:N:P
stoichiometry would shift from the Redfield C:N:P ratio (Peñuelas et al. 2012). Nutrient
limitation was found to travel up the food chain (Boersma et al. 2008), and thus the
utilization efficiencies of phytoplankton chemical composition for zooplankton production
have been considered critically in studying the flows of C and nutrients in food webs
(Anderson and Hessen 1995, Kuijper et al. 2004).
The conversion efficiency by which an ingested substance is converted to predator
biomass is defined as the “gross growth efficiency” (GGE) (Sterner and Elser 2002). Both
empirical and modelling studies have demonstrated that GGE of zooplankton varies with
prey algal C:N ratio (Checkley 1980, Kiørboe 1989, Jones et al. 2002, Kuijper et al. 2004,
Anderson et al. 2012) and food concentration (Hamburger and Boētius 1987, Santer and van
den Bosch 1994, Straile 1997, Anderson et al. 2004, Almeda et al. 2010). Furthermore, the
variability of GGE may also be caused by other factors such as temperature, species
composition, and copepod developmental stage (Straile 1997, Almeda et al. 2010). However,
lack of knowledge of the interactive effect of two or more factors on GGE for multiple
nutrients prevents further understanding of GGE regulation in natural conditions.
Besides elements, numerous biochemicals (e.g. certain fatty acids (FAs)) are essential
because they cannot be synthesized de novo by consumers or the synthesis rate is not
CHAPTER 4 TROPHIC TRANSFER IN MARINE PLANKTON
63
sufficient to meet the basic biochemical needs of consumers (Wacker and von Elert 2001).
Thus, phytoplankton biochemicals can be another major determinant of food quality
(Sterner and Schulz 1998, Müller-Navarra et al. 2004, Sommer et al. 2012). Some
polyunsaturated fatty acids (PUFAs), especially ω3- and ω6-PUFAs, are essential for all
animals (Müller-Navarra 2008). Effects of PUFAs on growth and reproduction have been
observed for different copepod species (Jónasdóttir et al. 1995, Müller-Navarra et al. 2000,
Arendt et al. 2005, Chen et al. 2012). However, it is also evident that in some situations the
availability of PUFAs in phytoplankton is high enough for fulfilling zooplankton’s
requirements. In this case, elemental rather than essential FA regulation can predict the
limitation of egg production (Augustin and Boersma 2006, Mayor et al. 2009). Elemental
and biochemical limitations have been considered mutually in regulating phytoplankton
food quality, especially in freshwater environments (Gulati and DeMott 1997, Lynn et al.
2000, Boersma et al. 2001, Gladyshev et al. 2007). This non-exclusive mechanism is
supported by our previous research, which showed significant covariance of elemental (N
cell quota) and biochemical (FAs) composition in three marine phytoplankton species (Bi et
al. unpublished data). Both elemental and biochemical composition of phytoplankton have
shown good correlations with copepod reproduction (Jónasdóttir 1994). However, it is hard
to distinguish correlation from causation, and the direct versus indirect effect of food quality,
because indirect elemental limitation “may include factors such as changes in phytoplankton
cell physical properties and/or biochemical composition” (Ravet and Brett 2006).
Recent research has found that the transfer efficiency of essential PUFAs from the
producers to the primary consumers was about two times higher than that of bulk C, while a
lower transfer efficiency was shown in non-essential PUFAs (Gladyshev et al. 2011). This
suggests that the comparison of trophic transfer efficiencies between essential PUFAs and C
might explain zooplankton performance better than simply comparing FA contents between
phytoplankton and zooplankton.
In the present study, we investigated the interactive effect of food quantity and
stoichiometric food quality on chemical trophic transfer between marine phytoplankton and
zooplankton, and further determined the nutritional importance of these factors by
measuring the egg production rate of zooplankton. Rhodomonas sp. (Cryptophyceae) was
chosen as food source because of its high PUFA contents. We chose the calanoid copepod
Acartia tonsa as model copepod because the adults do not build up large energy storage
pools but rather invest most assimilated energy into egg production (Diekmann et al. 2009),
thus making egg production a relatively fast response to feeding conditions. The objectives
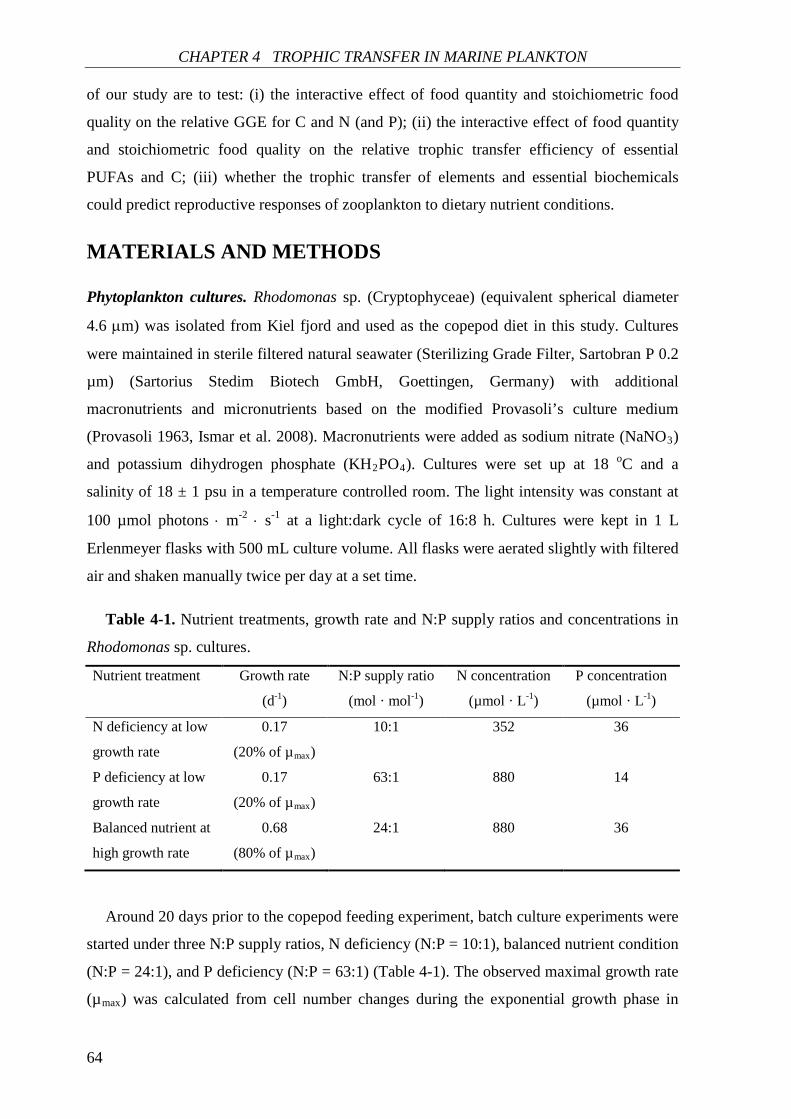
CHAPTER 4 TROPHIC TRANSFER IN MARINE PLANKTON
64
of our study are to test: (i) the interactive effect of food quantity and stoichiometric food
quality on the relative GGE for C and N (and P); (ii) the interactive effect of food quantity
and stoichiometric food quality on the relative trophic transfer efficiency of essential
PUFAs and C; (iii) whether the trophic transfer of elements and essential biochemicals
could predict reproductive responses of zooplankton to dietary nutrient conditions.
MATERIALS AND METHODS
Phytoplankton cultures. Rhodomonas sp. (Cryptophyceae) (equivalent spherical diameter
4.6 µm) was isolated from Kiel fjord and used as the copepod diet in this study. Cultures
were maintained in sterile filtered natural seawater (Sterilizing Grade Filter, Sartobran P 0.2
µm) (Sartorius Stedim Biotech GmbH, Goettingen, Germany) with additional
macronutrients and micronutrients based on the modified Provasoli’s culture medium
(Provasoli 1963, Ismar et al. 2008). Macronutrients were added as sodium nitrate (NaNO3)
and potassium dihydrogen phosphate (KH2PO4). Cultures were set up at 18 oC and a
salinity of 18 ± 1 psu in a temperature controlled room. The light intensity was constant at
100 µmol photons ⋅ m-2 ⋅ s-1 at a light:dark cycle of 16:8 h. Cultures were kept in 1 L
Erlenmeyer flasks with 500 mL culture volume. All flasks were aerated slightly with filtered
air and shaken manually twice per day at a set time.
Table 4-1. Nutrient treatments, growth rate and N:P supply ratios and concentrations in
Rhodomonas sp. cultures.
Nutrient treatment Growth rate
(d-1)
N:P supply ratio
(mol · mol-1)
N concentration
(µmol · L-1)
P concentration
(µmol · L-1)
N deficiency at low
growth rate
0.17
(20% of µmax)
10:1 352 36
P deficiency at low
growth rate
0.17
(20% of µmax)
63:1 880 14
Balanced nutrient at
high growth rate
0.68
(80% of µmax)
24:1 880 36
Around 20 days prior to the copepod feeding experiment, batch culture experiments were
started under three N:P supply ratios, N deficiency (N:P = 10:1), balanced nutrient condition
(N:P = 24:1), and P deficiency (N:P = 63:1) (Table 4-1). The observed maximal growth rate
(µmax) was calculated from cell number changes during the exponential growth phase in
CHAPTER 4 TROPHIC TRANSFER IN MARINE PLANKTON
65
batch cultures (Bi et al. 2012). Once batch cultures reached the early stationary phase,
semicontinuous cultures were started with two different specific growth rates (µ, d-1), 20%
of µmax for N and P deficiency, and 80% of µmax for the balanced nutrient condition (Table
4-1). The equivalent daily renewal rate (D, d-1) can be estimated by D = 1- e-µ·t, where t is
renewal interval (d) (here t = 1d). The steady state in semicontinuous cultures was assessed
based on the net growth rate (r). When r was zero (at steady state), µ was equivalent to D.
These three nutrient treatments were determined according to chemical characteristics of
Rhodomonas sp. observed in our previous studies (Bi et al. 2012 and Bi et al. unpublished
data). On the one hand, the stoichiometric N:P ratio of Rhodomonas sp. showed the
strongest positive response to N:P supply ratios under the lowest growth rate, while N:P
biomass ratios converged to an intermediate value at the highest growth rate (Bi et al. 2012).
On the other hand, a significant higher PUFA content was observed in Rhodomonas sp.
under N deficiency (N:P = 10:1) at the lowest growth rate (Bi et al., unpublished data in
CHAPTER 3).
Algal semicontinuous cultures were grown three times corresponding to the three runs of
copepod chemical response experiments (with different food concentration setup in each
experimental run). Two replicates were set up for each treatment in the first and second
semicontinuous cultures, while the last one was run in triplicate.
Algal cell density was counted daily using an improved Neubauer hemacytometer
(Glaswarenfabrik Karl Hecht GmbH, Rhön, Germany). The culture suspension replaced by
fresh medium every day was collected to feed copepods. Before feeding copepods, algal
suspensions from replicate flasks were pooled. Thus, copepod feeding was not influenced
by variance between the algal culture replicates and copepod replicates were real replicates
receiving identical food.
Copepod cultures. The calanoid copepod, Acartia tonsa, was obtained from the
Department of Biology, Institute for Hydrobiology and Fisheries Science at the University
of Hamburg. A. tonsa eggs were hatched in filtered natural seawater (Sterilizing Grade Filter,
Sartobran P 0.2 µm) (Sartorius Stedim Biotech GmbH, Goettingen, Germany) at 18 oC and
a salinity of 18 ± 1 psu. Copepod cultures were maintained under the same temperature,
salinity and light regime as those used in algal cultures. Before the cohort reached late
copepodite stages (CV or CVI), the culture was fed with Rhodomonas sp. ad libitum.
Copepod chemical response experiment. To examine the effects of food concentration
and food quality on copepod chemical composition, copepod individuals (stage CV or CVI)
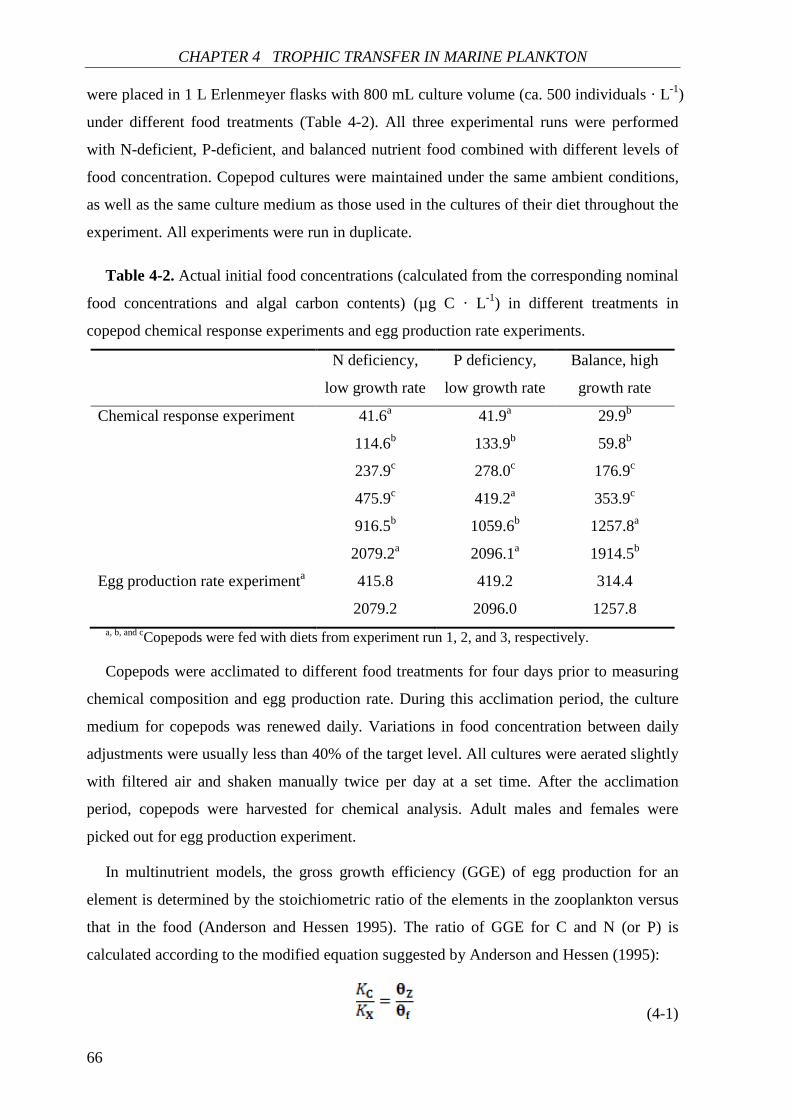
CHAPTER 4 TROPHIC TRANSFER IN MARINE PLANKTON
66
were placed in 1 L Erlenmeyer flasks with 800 mL culture volume (ca. 500 individuals · L-1)
under different food treatments (Table 4-2). All three experimental runs were performed
with N-deficient, P-deficient, and balanced nutrient food combined with different levels of
food concentration. Copepod cultures were maintained under the same ambient conditions,
as well as the same culture medium as those used in the cultures of their diet throughout the
experiment. All experiments were run in duplicate.
Table 4-2. Actual initial food concentrations (calculated from the corresponding nominal
food concentrations and algal carbon contents) (µg C · L-1) in different treatments in
copepod chemical response experiments and egg production rate experiments.
N deficiency,
low growth rate
P deficiency,
low growth rate
Balance, high
growth rate
Chemical response experiment 41.6a 41.9a 29.9b
114.6b 133.9b 59.8b
237.9c 278.0c 176.9c
475.9c 419.2a 353.9c
916.5b 1059.6b 1257.8a
2079.2a 2096.1a 1914.5b
Egg production rate experimenta 415.8 419.2 314.4
2079.2 2096.0 1257.8 a, b, and cCopepods were fed with diets from experiment run 1, 2, and 3, respectively.
Copepods were acclimated to different food treatments for four days prior to measuring
chemical composition and egg production rate. During this acclimation period, the culture
medium for copepods was renewed daily. Variations in food concentration between daily
adjustments were usually less than 40% of the target level. All cultures were aerated slightly
with filtered air and shaken manually twice per day at a set time. After the acclimation
period, copepods were harvested for chemical analysis. Adult males and females were
picked out for egg production experiment.
In multinutrient models, the gross growth efficiency (GGE) of egg production for an
element is determined by the stoichiometric ratio of the elements in the zooplankton versus
that in the food (Anderson and Hessen 1995). The ratio of GGE for C and N (or P) is
calculated according to the modified equation suggested by Anderson and Hessen (1995):
(4-1)
CHAPTER 4 TROPHIC TRANSFER IN MARINE PLANKTON
67
where KC is gross growth efficiency for C. KX is gross growth efficiency for N or P (KN or
KP). For the relative GGE of KC / KN, θZ and θf are the ratios of C and N (mol · mol-1) in
the zooplankton and food biomass, respectively. For the relative GGE of KC / KP, θZ and θf
are the ratios of C and P (mol · mol-1) in the zooplankton and food biomass, respectively.
Egg production experiment. The adults used in egg production experiment were sorted
from two food concentration treatments of the experimental run 1 after the acclimation
period. Five females and two males were placed into a Plexiglass chamber (10 cm in height,
5 cm diameter) with a 250 µm mesh 3 cm above the bottom. Each chamber was placed
within a 500 mL bottle filled with a total of 450 mL culture volume (filtered seawater and
food). This resulted in ca. 137 mL of water inside each chamber. The 250 µm mesh allowed
the eggs but not copepod adults to pass through and thus eliminated the possibility of egg
cannibalism. The food concentration treatments are shown in Table 4-2. Eight or ten
replicates were set up for each food treatment except for the lowest food concentration
treatment under N deficiency, in which there were only five replicates. All cultures were
maintained under the same ambient conditions, as well as the same culture medium as those
used in algal cultures throughout the experiment. After 24h, the eggs in each bottle were
collected with a 40 µm mesh and counted using a Bogorov tray.
Chemical analysis. One sample was taken for analysis from each replicate. Algal cells
(at steady state) and adult copepods (after acclimation period) were harvested by filtration
on pre-combusted Whatman GF/F filters (Whatman GmbH, Dassel, Germany). After
filtration, samples for elemental analysis were immediately dried and stored in a desiccator,
and samples for FA analysis were frozen at -80 oC.
The determination of particulate organic carbon (POC) and nitrogen (PON) was carried
out after Sharp (1974) by gas chromatography in an organic elemental analyzer (Thermo
Flash 2000) (Thermo Fisher Scientific Inc., Schwerte, Germany). Particulate organic
phosphorus (POP) was analyzed colorimetrically by converting organic phosphorus
compounds to orthophosphate (Hansen and Koroleff 1999).
FAs were measured as fatty acid methyl esters (FAMEs) using a gas chromatograph
(Trace GC-Ultra) (Thermo Fisher Scientific Inc., Schwerte, Germany) according to the
procedure described in detail in Arndt and Sommer (2013). The FAME mixture C13:0,
C15:0, C17:0, C19:0 and C21:0 was added as internal standard, and tricosanoic acid (C23:0)
added as esterification control. The extracted FAs were dissolved with n-hexane to a final
volume of 100 µL. Sample aliquots (1 µL) were given into the GC by splitless injection
CHAPTER 4 TROPHIC TRANSFER IN MARINE PLANKTON
68
with hydrogen as the carrier gas. Individual FAs were integrated using Chromcard software
(Thermo Fisher Scientific Inc., Schwerte, Germany) and identified with reference to
commercially available standards, Supelco 37 component FAME mixture and Supelco
Menhaden fish oil.
Statistics. Dependent variables were tested for normality and homogeneity of variances.
A transformation was performed if normality and homogeneity were not fulfilled.
One-factorial analysis of variance (ANOVA) was conducted to test the effects of
experimental run and nutrient treatment on stoichiometric ratios of C:N and C:P, and on the
content of each FA group (total fatty acids (TFAs), saturated fatty acids (SFAs),
monounsaturated fatty acids (MUFAs) or PUFAs) in Rhodomonas sp, respectively. For A.
tonsa, two-factorial ANOVA was used to test the effects of nutrient treatment and food
concentration on stoichiometric C:N and C:P ratios, the contents of four FA groups, and egg
production rates. Data for algal C:P ratio and copepod egg production rate were square root
transformed, and those for copepod stoichiometric ratios and FA group contents were log10
(x) transformed. A post-hoc test (Tukey’s honest significant difference (HSD) test) was
applied only if there were significant effects. The magnitude of effect (ω2 = (effect sum of
squares – effect degree of freedom × error mean square) / (total sum of squares + error mean
square)) was calculated only for the significant factors. This estimate can determine the
variance in a response variable and relates this to the total variance in the response variable
(Graham and Edwards 2001, Hughes and Stachowicz 2009).
The responses of the relative GGE of KC / KX to algal C:X ratio and food concentration
were analyzed by multiple regression with the second-order quadratic equation, with the
predicting variables algal C:X ratio, food concentration, (algal C:X ratio)2, (food
concentration)2, and (algal C:X ratio) · (food concentration). The same analysis was done
for the effects of algal C:X ratio and food concentration on the ratios of ω3- (and ω6-)
PUFA contents between copepods and algae. In all multiple regression analyses, dependent
and independent variables were log10 (x) transformed.
All statistic analyses were conducted in Statistica 8 (StatSoft [Europe] GmbH, Hamburg,
Germany). Significance level was set to p < 0.05 in all statistical tests.
RESULTS
Stoichiometric composition of Rhodomonas sp. Stoichiometric ratios of C:N or C:P in
Rhodomonas sp. showed no significant differences between the three experimental runs
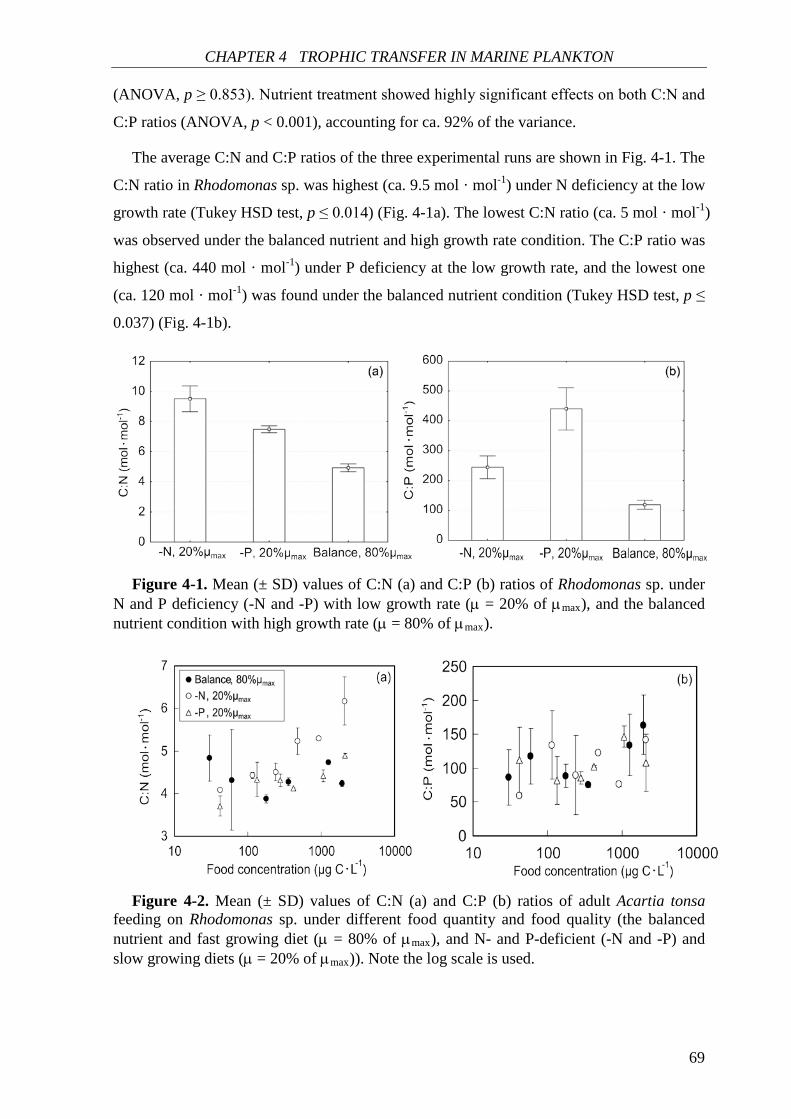
CHAPTER 4 TROPHIC TRANSFER IN MARINE PLANKTON
69
(ANOVA, p ≥ 0.853). Nutrient treatment showed highly significant effects on both C:N and
C:P ratios (ANOVA, p < 0.001), accounting for ca. 92% of the variance.
The average C:N and C:P ratios of the three experimental runs are shown in Fig. 4-1. The
C:N ratio in Rhodomonas sp. was highest (ca. 9.5 mol · mol-1) under N deficiency at the low
growth rate (Tukey HSD test, p ≤ 0.014) (Fig. 4-1a). The lowest C:N ratio (ca. 5 mol · mol-1)
was observed under the balanced nutrient and high growth rate condition. The C:P ratio was
highest (ca. 440 mol · mol-1) under P deficiency at the low growth rate, and the lowest one
(ca. 120 mol · mol-1) was found under the balanced nutrient condition (Tukey HSD test, p ≤
0.037) (Fig. 4-1b).
Figure 4-1. Mean (± SD) values of C:N (a) and C:P (b) ratios of Rhodomonas sp. under
N and P deficiency (-N and -P) with low growth rate (µ = 20% of µmax), and the balanced nutrient condition with high growth rate (µ = 80% of µmax).
Figure 4-2. Mean (± SD) values of C:N (a) and C:P (b) ratios of adult Acartia tonsa
feeding on Rhodomonas sp. under different food quantity and food quality (the balanced nutrient and fast growing diet (µ = 80% of µmax), and N- and P-deficient (-N and -P) and slow growing diets (µ = 20% of µmax)). Note the log scale is used.
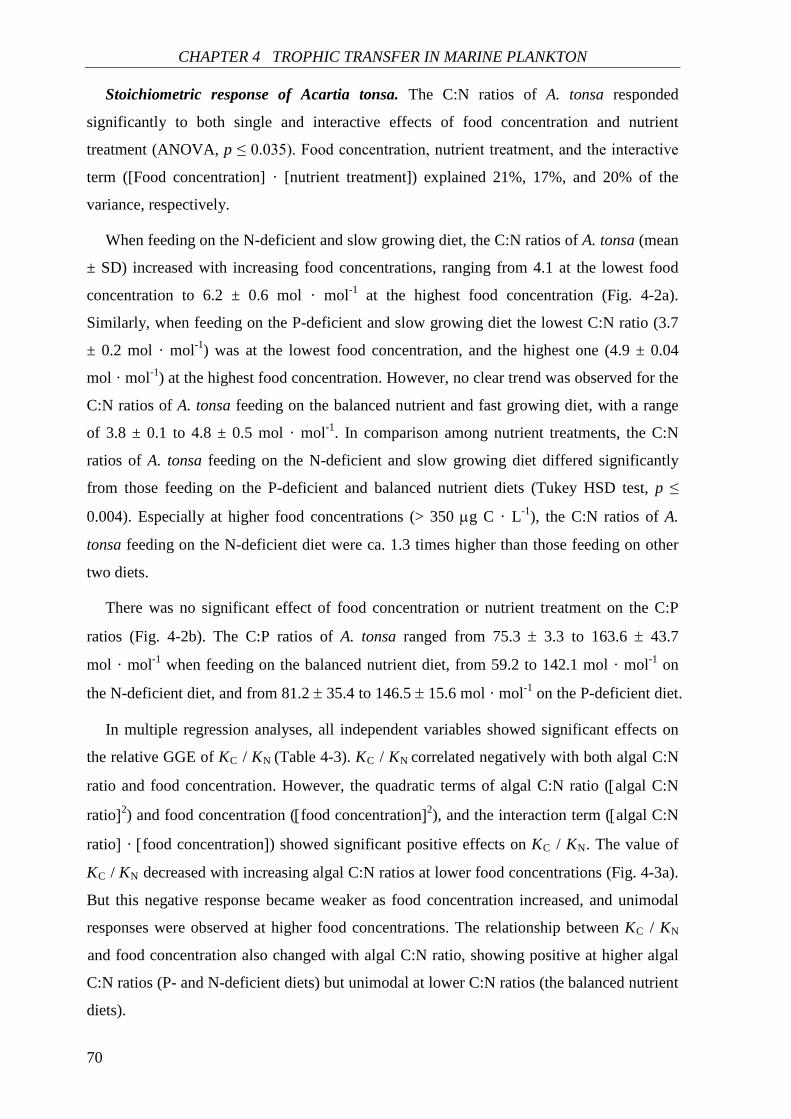
CHAPTER 4 TROPHIC TRANSFER IN MARINE PLANKTON
70
Stoichiometric response of Acartia tonsa. The C:N ratios of A. tonsa responded
significantly to both single and interactive effects of food concentration and nutrient
treatment (ANOVA, p ≤ 0.035). Food concentration, nutrient treatment, and the interactive
term ([Food concentration] · [nutrient treatment]) explained 21%, 17%, and 20% of the
variance, respectively.
When feeding on the N-deficient and slow growing diet, the C:N ratios of A. tonsa (mean
± SD) increased with increasing food concentrations, ranging from 4.1 at the lowest food
concentration to 6.2 ± 0.6 mol · mol-1 at the highest food concentration (Fig. 4-2a).
Similarly, when feeding on the P-deficient and slow growing diet the lowest C:N ratio (3.7
± 0.2 mol · mol-1) was at the lowest food concentration, and the highest one (4.9 ± 0.04
mol · mol-1) at the highest food concentration. However, no clear trend was observed for the
C:N ratios of A. tonsa feeding on the balanced nutrient and fast growing diet, with a range
of 3.8 ± 0.1 to 4.8 ± 0.5 mol · mol-1. In comparison among nutrient treatments, the C:N
ratios of A. tonsa feeding on the N-deficient and slow growing diet differed significantly
from those feeding on the P-deficient and balanced nutrient diets (Tukey HSD test, p ≤
0.004). Especially at higher food concentrations (> 350 µg C · L-1), the C:N ratios of A.
tonsa feeding on the N-deficient diet were ca. 1.3 times higher than those feeding on other
two diets.
There was no significant effect of food concentration or nutrient treatment on the C:P
ratios (Fig. 4-2b). The C:P ratios of A. tonsa ranged from 75.3 ± 3.3 to 163.6 ± 43.7
mol · mol-1 when feeding on the balanced nutrient diet, from 59.2 to 142.1 mol · mol-1 on
the N-deficient diet, and from 81.2 ± 35.4 to 146.5 ± 15.6 mol · mol-1 on the P-deficient diet.
In multiple regression analyses, all independent variables showed significant effects on
the relative GGE of KC / KN (Table 4-3). KC / KN correlated negatively with both algal C:N
ratio and food concentration. However, the quadratic terms of algal C:N ratio ([algal C:N
ratio]2) and food concentration ([food concentration]2), and the interaction term ([algal C:N
ratio] · [food concentration]) showed significant positive effects on KC / KN. The value of
KC / KN decreased with increasing algal C:N ratios at lower food concentrations (Fig. 4-3a).
But this negative response became weaker as food concentration increased, and unimodal
responses were observed at higher food concentrations. The relationship between KC / KN
and food concentration also changed with algal C:N ratio, showing positive at higher algal
C:N ratios (P- and N-deficient diets) but unimodal at lower C:N ratios (the balanced nutrient
diets).
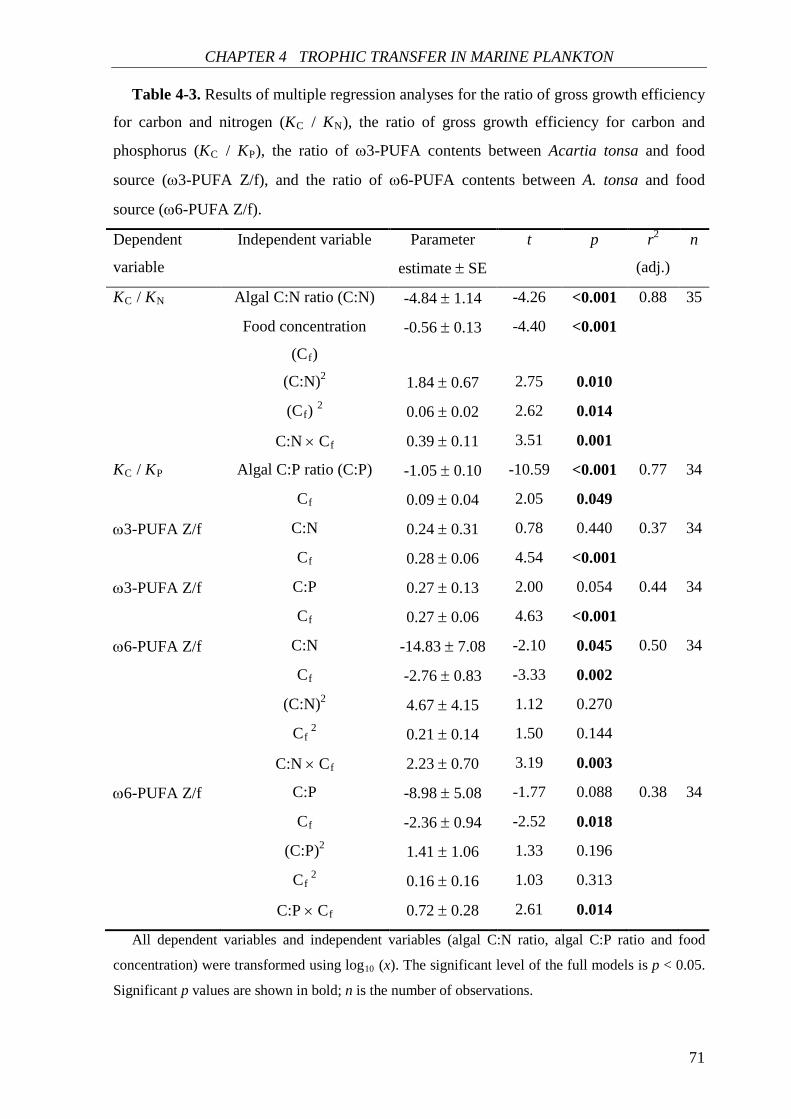
CHAPTER 4 TROPHIC TRANSFER IN MARINE PLANKTON
71
Table 4-3. Results of multiple regression analyses for the ratio of gross growth efficiency
for carbon and nitrogen (KC / KN), the ratio of gross growth efficiency for carbon and
phosphorus (KC / KP), the ratio of ω3-PUFA contents between Acartia tonsa and food
source (ω3-PUFA Z/f), and the ratio of ω6-PUFA contents between A. tonsa and food
source (ω6-PUFA Z/f).
Dependent
variable
Independent variable Parameter
estimate ± SE
t p r2
(adj.)
n
KC / KN Algal C:N ratio (C:N) -4.84 ± 1.14 -4.26 <0.001 0.88 35
Food concentration
(Cf)
-0.56 ± 0.13 -4.40 <0.001
(C:N)2 1.84 ± 0.67 2.75 0.010
(Cf) 2 0.06 ± 0.02 2.62 0.014
C:N × Cf 0.39 ± 0.11 3.51 0.001
KC / KP Algal C:P ratio (C:P) -1.05 ± 0.10 -10.59 <0.001 0.77 34
Cf 0.09 ± 0.04 2.05 0.049
ω3-PUFA Z/f C:N 0.24 ± 0.31 0.78 0.440 0.37 34
Cf 0.28 ± 0.06 4.54 <0.001
ω3-PUFA Z/f C:P 0.27 ± 0.13 2.00 0.054 0.44 34
Cf 0.27 ± 0.06 4.63 <0.001
ω6-PUFA Z/f C:N -14.83 ± 7.08 -2.10 0.045 0.50 34
Cf -2.76 ± 0.83 -3.33 0.002
(C:N)2 4.67 ± 4.15 1.12 0.270
Cf 2 0.21 ± 0.14 1.50 0.144
C:N × Cf 2.23 ± 0.70 3.19 0.003
ω6-PUFA Z/f C:P -8.98 ± 5.08 -1.77 0.088 0.38 34
Cf -2.36 ± 0.94 -2.52 0.018
(C:P)2 1.41 ± 1.06 1.33 0.196
Cf 2 0.16 ± 0.16 1.03 0.313
C:P × Cf 0.72 ± 0.28 2.61 0.014
All dependent variables and independent variables (algal C:N ratio, algal C:P ratio and food
concentration) were transformed using log10 (x). The significant level of the full models is p < 0.05.
Significant p values are shown in bold; n is the number of observations.
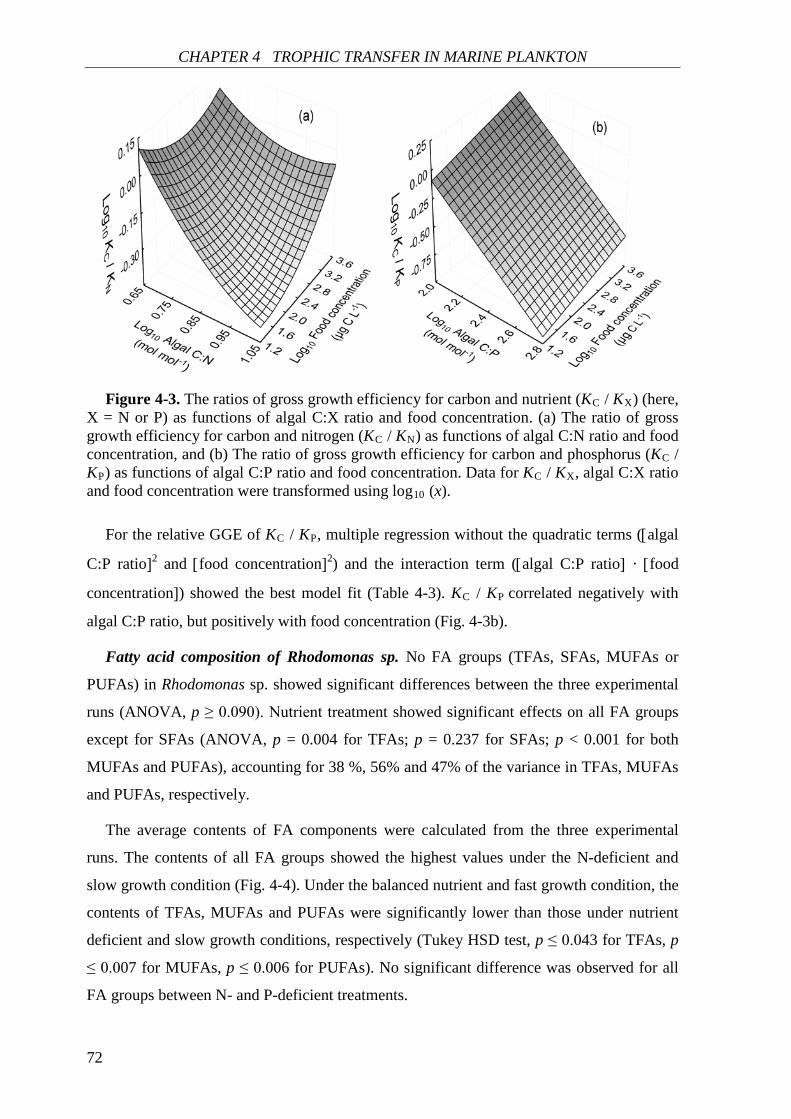
CHAPTER 4 TROPHIC TRANSFER IN MARINE PLANKTON
72
Figure 4-3. The ratios of gross growth efficiency for carbon and nutrient (KC / KX) (here,
X = N or P) as functions of algal C:X ratio and food concentration. (a) The ratio of gross growth efficiency for carbon and nitrogen (KC / KN) as functions of algal C:N ratio and food concentration, and (b) The ratio of gross growth efficiency for carbon and phosphorus (KC / KP) as functions of algal C:P ratio and food concentration. Data for KC / KX, algal C:X ratio and food concentration were transformed using log10 (x).
For the relative GGE of KC / KP, multiple regression without the quadratic terms ([algal
C:P ratio]2 and [food concentration]2) and the interaction term ([algal C:P ratio] · [food
concentration]) showed the best model fit (Table 4-3). KC / KP correlated negatively with
algal C:P ratio, but positively with food concentration (Fig. 4-3b).
Fatty acid composition of Rhodomonas sp. No FA groups (TFAs, SFAs, MUFAs or
PUFAs) in Rhodomonas sp. showed significant differences between the three experimental
runs (ANOVA, p ≥ 0.090). Nutrient treatment showed significant effects on all FA groups
except for SFAs (ANOVA, p = 0.004 for TFAs; p = 0.237 for SFAs; p < 0.001 for both
MUFAs and PUFAs), accounting for 38 %, 56% and 47% of the variance in TFAs, MUFAs
and PUFAs, respectively.
The average contents of FA components were calculated from the three experimental
runs. The contents of all FA groups showed the highest values under the N-deficient and
slow growth condition (Fig. 4-4). Under the balanced nutrient and fast growth condition, the
contents of TFAs, MUFAs and PUFAs were significantly lower than those under nutrient
deficient and slow growth conditions, respectively (Tukey HSD test, p ≤ 0.043 for TFAs, p
≤ 0.007 for MUFAs, p ≤ 0.006 for PUFAs). No significant difference was observed for all
FA groups between N- and P-deficient treatments.
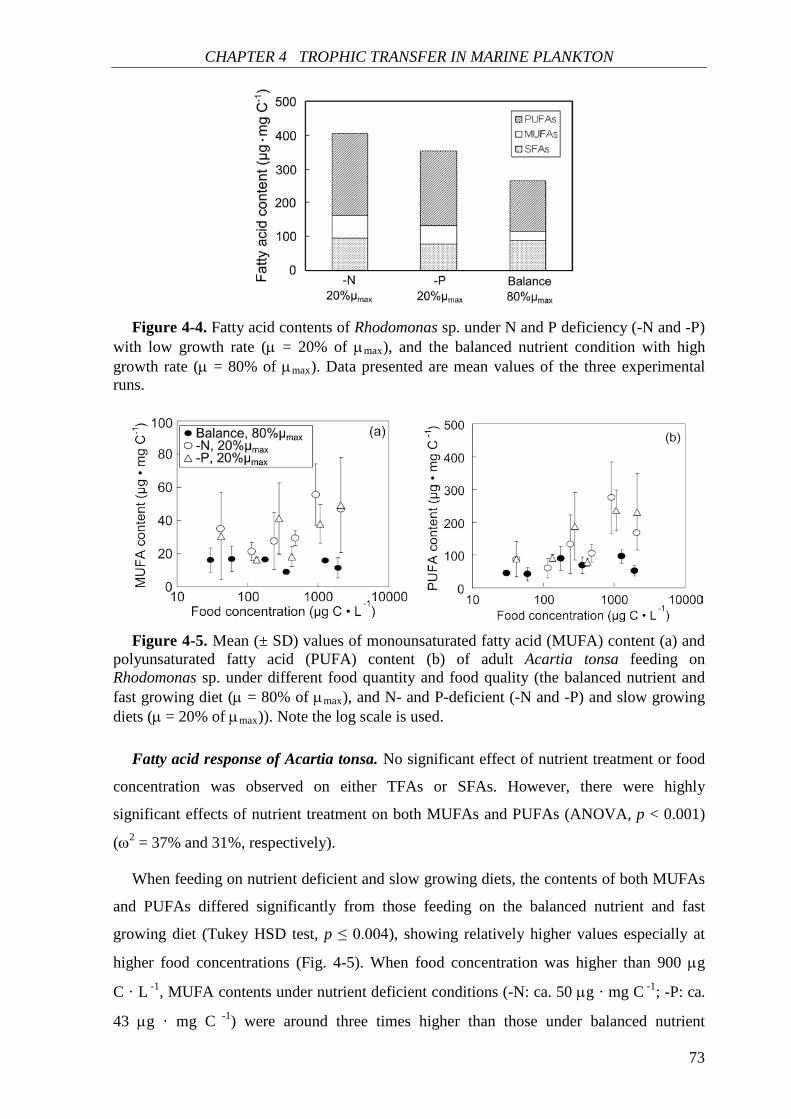
CHAPTER 4 TROPHIC TRANSFER IN MARINE PLANKTON
73
Figure 4-4. Fatty acid contents of Rhodomonas sp. under N and P deficiency (-N and -P)
with low growth rate (µ = 20% of µmax), and the balanced nutrient condition with high growth rate (µ = 80% of µmax). Data presented are mean values of the three experimental runs.
Figure 4-5. Mean (± SD) values of monounsaturated fatty acid (MUFA) content (a) and
polyunsaturated fatty acid (PUFA) content (b) of adult Acartia tonsa feeding on Rhodomonas sp. under different food quantity and food quality (the balanced nutrient and fast growing diet (µ = 80% of µmax), and N- and P-deficient (-N and -P) and slow growing diets (µ = 20% of µmax)). Note the log scale is used.
Fatty acid response of Acartia tonsa. No significant effect of nutrient treatment or food
concentration was observed on either TFAs or SFAs. However, there were highly
significant effects of nutrient treatment on both MUFAs and PUFAs (ANOVA, p < 0.001)
(ω2 = 37% and 31%, respectively).
When feeding on nutrient deficient and slow growing diets, the contents of both MUFAs
and PUFAs differed significantly from those feeding on the balanced nutrient and fast
growing diet (Tukey HSD test, p ≤ 0.004), showing relatively higher values especially at
higher food concentrations (Fig. 4-5). When food concentration was higher than 900 µg
C · L -1, MUFA contents under nutrient deficient conditions (-N: ca. 50 µg · mg C -1; -P: ca.
43 µg · mg C -1) were around three times higher than those under balanced nutrient
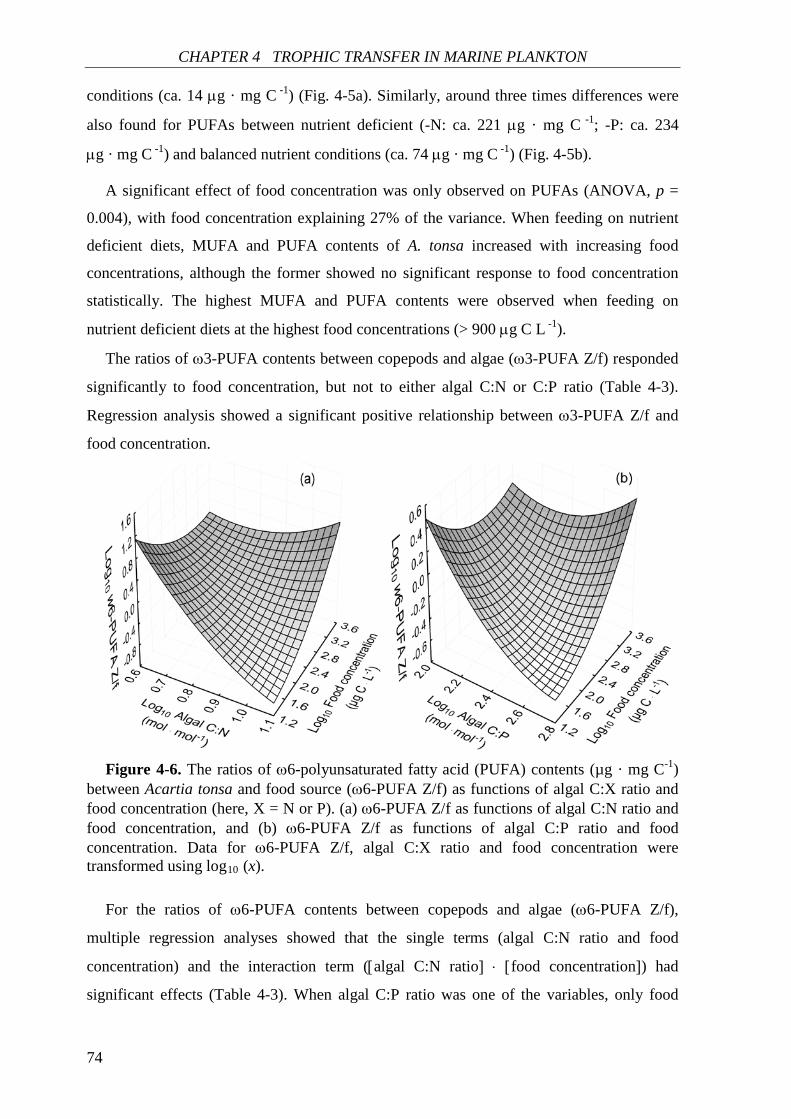
CHAPTER 4 TROPHIC TRANSFER IN MARINE PLANKTON
74
conditions (ca. 14 µg · mg C -1) (Fig. 4-5a). Similarly, around three times differences were
also found for PUFAs between nutrient deficient (-N: ca. 221 µg · mg C -1; -P: ca. 234
µg · mg C -1) and balanced nutrient conditions (ca. 74 µg · mg C -1) (Fig. 4-5b).
A significant effect of food concentration was only observed on PUFAs (ANOVA, p =
0.004), with food concentration explaining 27% of the variance. When feeding on nutrient
deficient diets, MUFA and PUFA contents of A. tonsa increased with increasing food
concentrations, although the former showed no significant response to food concentration
statistically. The highest MUFA and PUFA contents were observed when feeding on
nutrient deficient diets at the highest food concentrations (> 900 µg C L -1).
The ratios of ω3-PUFA contents between copepods and algae (ω3-PUFA Z/f) responded
significantly to food concentration, but not to either algal C:N or C:P ratio (Table 4-3).
Regression analysis showed a significant positive relationship between ω3-PUFA Z/f and
food concentration.
Figure 4-6. The ratios of ω6-polyunsaturated fatty acid (PUFA) contents (µg · mg C-1)
between Acartia tonsa and food source (ω6-PUFA Z/f) as functions of algal C:X ratio and food concentration (here, X = N or P). (a) ω6-PUFA Z/f as functions of algal C:N ratio and food concentration, and (b) ω6-PUFA Z/f as functions of algal C:P ratio and food concentration. Data for ω6-PUFA Z/f, algal C:X ratio and food concentration were transformed using log10 (x).
For the ratios of ω6-PUFA contents between copepods and algae (ω6-PUFA Z/f),
multiple regression analyses showed that the single terms (algal C:N ratio and food
concentration) and the interaction term ([algal C:N ratio] ⋅ [food concentration]) had
significant effects (Table 4-3). When algal C:P ratio was one of the variables, only food
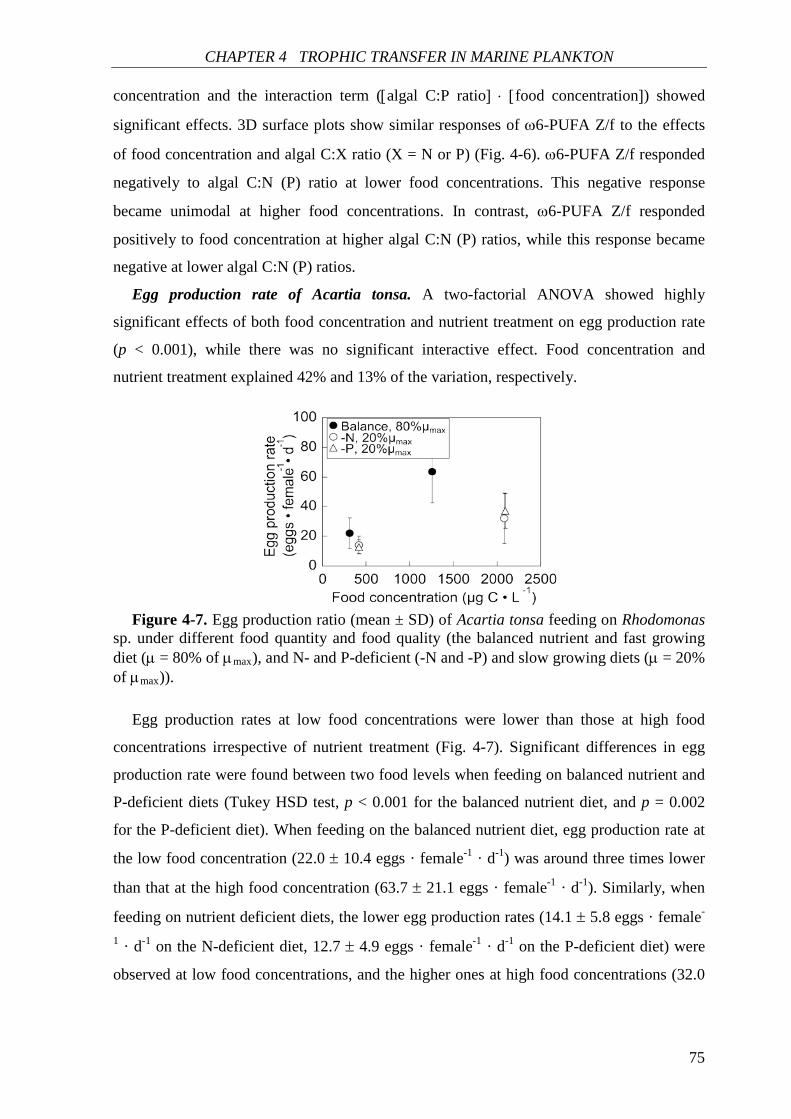
CHAPTER 4 TROPHIC TRANSFER IN MARINE PLANKTON
75
concentration and the interaction term ([algal C:P ratio] ⋅ [food concentration]) showed
significant effects. 3D surface plots show similar responses of ω6-PUFA Z/f to the effects
of food concentration and algal C:X ratio (X = N or P) (Fig. 4-6). ω6-PUFA Z/f responded
negatively to algal C:N (P) ratio at lower food concentrations. This negative response
became unimodal at higher food concentrations. In contrast, ω6-PUFA Z/f responded
positively to food concentration at higher algal C:N (P) ratios, while this response became
negative at lower algal C:N (P) ratios.
Egg production rate of Acartia tonsa. A two-factorial ANOVA showed highly
significant effects of both food concentration and nutrient treatment on egg production rate
(p < 0.001), while there was no significant interactive effect. Food concentration and
nutrient treatment explained 42% and 13% of the variation, respectively.
Figure 4-7. Egg production ratio (mean ± SD) of Acartia tonsa feeding on Rhodomonas
sp. under different food quantity and food quality (the balanced nutrient and fast growing diet (µ = 80% of µmax), and N- and P-deficient (-N and -P) and slow growing diets (µ = 20% of µmax)).
Egg production rates at low food concentrations were lower than those at high food
concentrations irrespective of nutrient treatment (Fig. 4-7). Significant differences in egg
production rate were found between two food levels when feeding on balanced nutrient and
P-deficient diets (Tukey HSD test, p < 0.001 for the balanced nutrient diet, and p = 0.002
for the P-deficient diet). When feeding on the balanced nutrient diet, egg production rate at
the low food concentration (22.0 ± 10.4 eggs · female-1 · d-1) was around three times lower
than that at the high food concentration (63.7 ± 21.1 eggs · female-1 · d-1). Similarly, when
feeding on nutrient deficient diets, the lower egg production rates (14.1 ± 5.8 eggs · female-
1 · d-1 on the N-deficient diet, 12.7 ± 4.9 eggs · female-1 · d-1 on the P-deficient diet) were
observed at low food concentrations, and the higher ones at high food concentrations (32.0
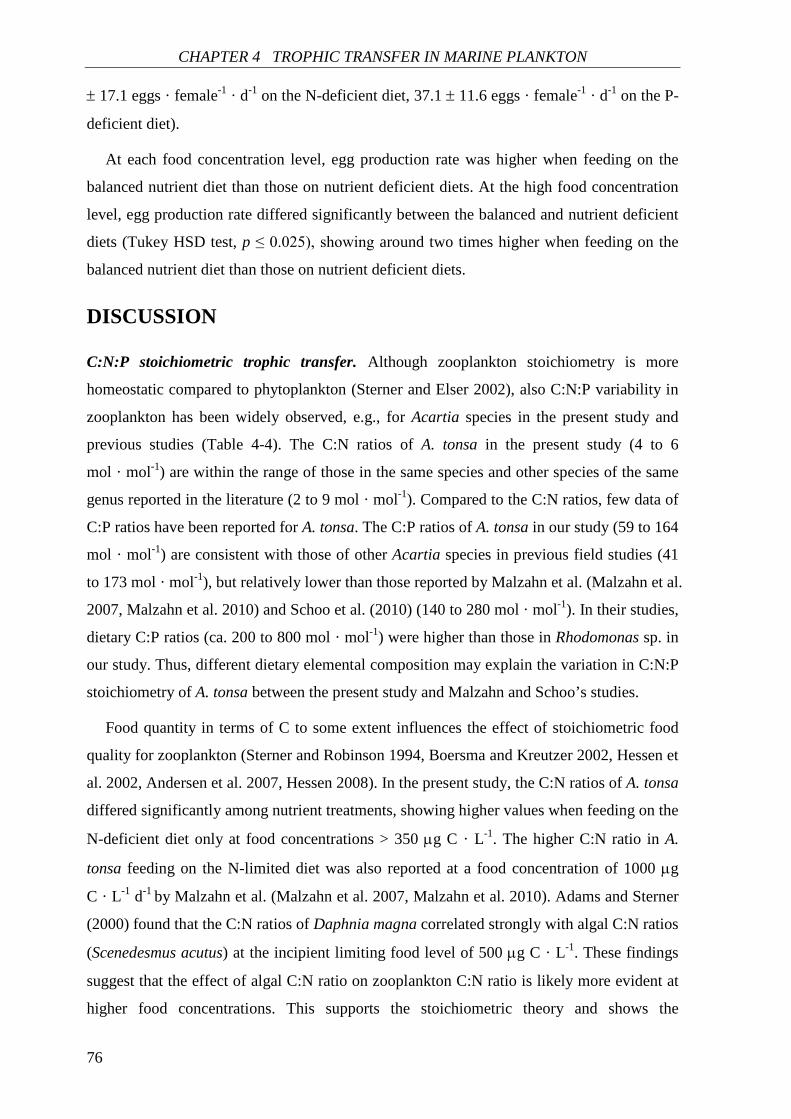
CHAPTER 4 TROPHIC TRANSFER IN MARINE PLANKTON
76
± 17.1 eggs · female-1 · d-1 on the N-deficient diet, 37.1 ± 11.6 eggs · female-1 · d-1 on the P-
deficient diet).
At each food concentration level, egg production rate was higher when feeding on the
balanced nutrient diet than those on nutrient deficient diets. At the high food concentration
level, egg production rate differed significantly between the balanced and nutrient deficient
diets (Tukey HSD test, p ≤ 0.025), showing around two times higher when feeding on the
balanced nutrient diet than those on nutrient deficient diets.
DISCUSSION
C:N:P stoichiometric trophic transfer. Although zooplankton stoichiometry is more
homeostatic compared to phytoplankton (Sterner and Elser 2002), also C:N:P variability in
zooplankton has been widely observed, e.g., for Acartia species in the present study and
previous studies (Table 4-4). The C:N ratios of A. tonsa in the present study (4 to 6
mol · mol-1) are within the range of those in the same species and other species of the same
genus reported in the literature (2 to 9 mol · mol-1). Compared to the C:N ratios, few data of
C:P ratios have been reported for A. tonsa. The C:P ratios of A. tonsa in our study (59 to 164
mol · mol-1) are consistent with those of other Acartia species in previous field studies (41
to 173 mol · mol-1), but relatively lower than those reported by Malzahn et al. (Malzahn et al.
2007, Malzahn et al. 2010) and Schoo et al. (2010) (140 to 280 mol · mol-1). In their studies,
dietary C:P ratios (ca. 200 to 800 mol · mol-1) were higher than those in Rhodomonas sp. in
our study. Thus, different dietary elemental composition may explain the variation in C:N:P
stoichiometry of A. tonsa between the present study and Malzahn and Schoo’s studies.
Food quantity in terms of C to some extent influences the effect of stoichiometric food
quality for zooplankton (Sterner and Robinson 1994, Boersma and Kreutzer 2002, Hessen et
al. 2002, Andersen et al. 2007, Hessen 2008). In the present study, the C:N ratios of A. tonsa
differed significantly among nutrient treatments, showing higher values when feeding on the
N-deficient diet only at food concentrations > 350 µg C · L-1. The higher C:N ratio in A.
tonsa feeding on the N-limited diet was also reported at a food concentration of 1000 µg
C · L-1 d-1 by Malzahn et al. (Malzahn et al. 2007, Malzahn et al. 2010). Adams and Sterner
(2000) found that the C:N ratios of Daphnia magna correlated strongly with algal C:N ratios
(Scenedesmus acutus) at the incipient limiting food level of 500 µg C · L-1. These findings
suggest that the effect of algal C:N ratio on zooplankton C:N ratio is likely more evident at
higher food concentrations. This supports the stoichiometric theory and shows the
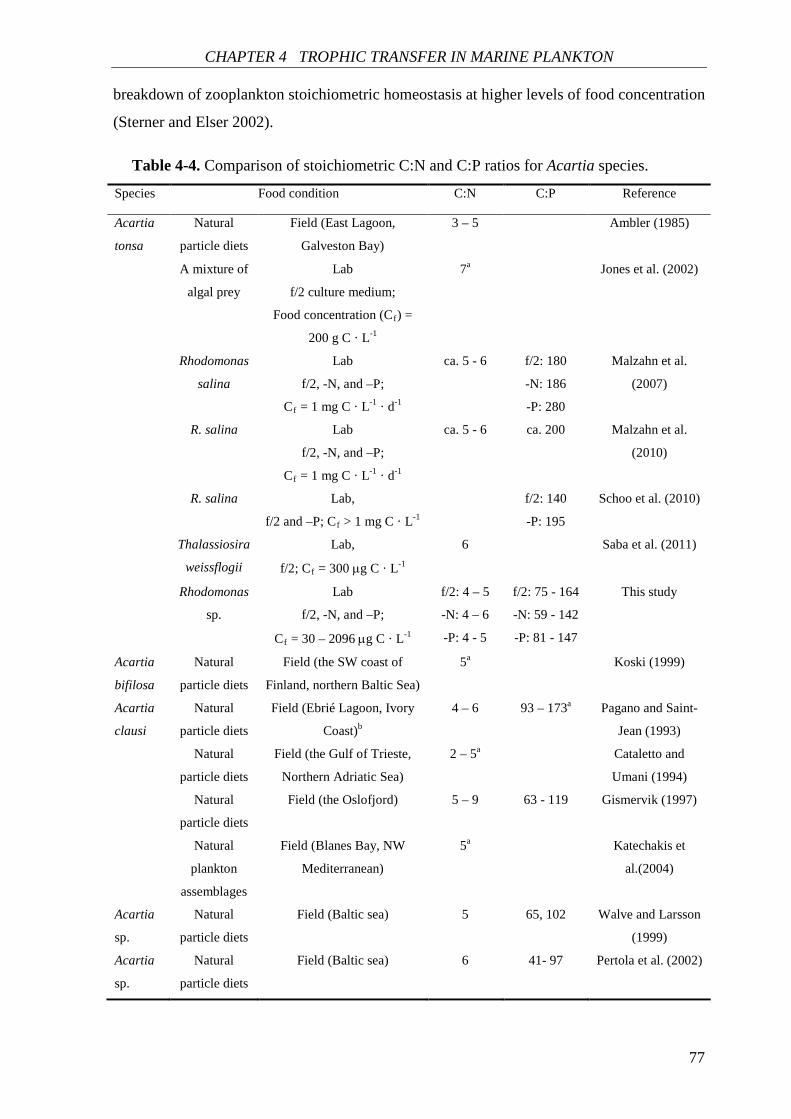
CHAPTER 4 TROPHIC TRANSFER IN MARINE PLANKTON
77
breakdown of zooplankton stoichiometric homeostasis at higher levels of food concentration
(Sterner and Elser 2002).
Table 4-4. Comparison of stoichiometric C:N and C:P ratios for Acartia species.
Species Food condition C:N C:P Reference
Acartia
tonsa
Natural
particle diets
Field (East Lagoon,
Galveston Bay)
3 – 5 Ambler (1985)
A mixture of
algal prey
Lab
f/2 culture medium;
Food concentration (Cf) =
200 g C · L-1
7a Jones et al. (2002)
Rhodomonas
salina
Lab
f/2, -N, and –P;
Cf = 1 mg C · L-1 · d-1
ca. 5 - 6 f/2: 180
-N: 186
-P: 280
Malzahn et al.
(2007)
R. salina Lab
f/2, -N, and –P;
Cf = 1 mg C · L-1 · d-1
ca. 5 - 6 ca. 200 Malzahn et al.
(2010)
R. salina Lab,
f/2 and –P; Cf > 1 mg C · L-1
f/2: 140
-P: 195
Schoo et al. (2010)
Thalassiosira
weissflogii
Lab,
f/2; Cf = 300 µg C · L-1
6 Saba et al. (2011)
Rhodomonas
sp.
Lab
f/2, -N, and –P;
Cf = 30 – 2096 µg C · L-1
f/2: 4 – 5
-N: 4 – 6
-P: 4 - 5
f/2: 75 - 164
-N: 59 - 142
-P: 81 - 147
This study
Acartia
bifilosa
Natural
particle diets
Field (the SW coast of
Finland, northern Baltic Sea)
5a Koski (1999)
Acartia
clausi
Natural
particle diets
Field (Ebrié Lagoon, Ivory
Coast)b
4 – 6 93 – 173a Pagano and Saint-
Jean (1993)
Natural
particle diets
Field (the Gulf of Trieste,
Northern Adriatic Sea)
2 – 5a Cataletto and
Umani (1994)
Natural
particle diets
Field (the Oslofjord) 5 – 9 63 - 119 Gismervik (1997)
Natural
plankton
assemblages
Field (Blanes Bay, NW
Mediterranean)
5a Katechakis et
al.(2004)
Acartia
sp.
Natural
particle diets
Field (Baltic sea) 5 65, 102 Walve and Larsson
(1999)
Acartia
sp.
Natural
particle diets
Field (Baltic sea) 6 41- 97 Pertola et al. (2002)
CHAPTER 4 TROPHIC TRANSFER IN MARINE PLANKTON
78
aValues were calculated from the data given in references. bAcartia clausi was the dominant
species in zooplankton assemblages (70 to 100% of total mesozooplankton densities). C:N and C:P
ratios are expressed as (mol · mol-1). –N: N deficiency; -P: P deficiency.
According to the stoichiometric theory based on Liebig’s “Law of the Minimum”, only
one nutrient is limiting in a given food. Moreover, C is in excess when zooplankton feeding
on high C:nutrient ratio food (Hessen and Anderson 2008). Thus, N (or P) deficiency and
excess C can be determined when A. tonsa feeding on N (or P)-deficient algae in the present
study. As the limiting nutrient is utilized as efficiently as possible (Anderson and Hessen
1995), N (or P) could be used at the maximum GGE for N (or P) by A. tonsa feeding on N
(or P)-deficient algae.
Our results showed that the relative GGE of KC / KN decreased with increasing algal C:N
ratios (ranging from ca. 5 to 9.5 mol · mol-1) under a wide range of food concentration
studied. This supports the prediction of the Dynamic Energy Budget model (Kuijper et al.
2004) and the empirical results (Kiørboe 1989) which suggest a negative response of KC but
a positive response of KN to algal C:N ratio ranging from 5 to 10 mol · mol-1. On the other
hand, the relative GGE of KC / KN increased with increasing food concentrations under
higher algal C:N ratios (N- or P-deficient diets). This suggests that KC is typically high
under high food concentrations in A. tonsa feeding on nutrient limited algae. Contradictory
responses of GGE to food concentration have been observed in previous studies, i.e.
positive (Hamburger and Boētius 1987, Anderson et al. 2004) and negative (Santer and van
den Bosch 1994, Almeda et al. 2010). These differences might be explained by different
food nutrient quality (e.g. in the present study) and other ambient factors (Straile 1997,
Almeda et al. 2010).
Similarly, the relative GGE of KC / KP responded negatively to algal C:P ratios (ranging
from ca. 120 to 440 mol · mol-1) and positively to food concentration in the present study.
Thus, KC and KP may have similar response pattern to algal C:P ratio and food
concentration compared to those of KC and KN to algal C:N ratio and food concentration.
Our results indicate that the responses of KC / KX to algal C:X ratio and food concentration
might to some extent be in similar patterns for different nutrients in the face of
stoichiometric food quality deficiency (i.e. high dietary C:X ratios). However, there are
subtle differences in response patterns for different nutrients. For example, the second-order
quadratic equation fit the response of KC / KN best, while regressions without quadratic
terms and the interactive term fit the response of KC / KP best. Moreover, the responses of
KC / KN and KC / KP to food concentration showed different patterns when A. tonsa feeding
CHAPTER 4 TROPHIC TRANSFER IN MARINE PLANKTON
79
on balanced nutrient diets (low dietary C:N and C:P ratios). Thus, complex responses of the
relative GGE of KC / KX are assumed when there is a “balanced interaction” (indicating
similar chemical composition) (Sterner and Elser 2002) between zooplankton and their diet.
Excess C is evident for A. tonsa when feeding on nutrient limited algae under higher food
concentrations in the present study. Excess C could be allocated to potential fitness-
improving benefits or released as waste (leftover C) in consumers (Hessen and Anderson
2008). In most aquatic invertebrate species, e.g. Daphnia, excess C is commonly stored as
lipids under high food abundance (Hessen and Anderson 2008), which might be a strategy
for A. tonsa to use excess C.
Fatty acid trophic transfer. Our results showed that FA composition of A. tonsa to some
extent reflected that of their food source. Both MUFAs and PUFAs in Rhodomonas sp.
showed highly significant responses to nutrient treatment, with the highest contents under
nutrient deficient conditions. This higher MUFA and PUFA contents under nutrient
deficient treatments were reflected by those in A. tonsa, but only at higher food
concentrations. This finding confirms our prediction above, indicating that excess C is (or
partly) stored as lipid in A. tonsa under high food concentrations.
The correlations between FA composition of zooplankton and their diet have been widely
reported in both freshwater (Brett et al. 2009) and marine (Dalsgaard et al. 2003, Brett et al.
2009) systems. PUFAs in zooplankton have been reported to reflect those of their diet, e.g.,
in six cladoceran species feeding on Cryptomonas sp. (Masclaux et al. 2012), and in A.
tonsa feeding on Rhodonomas salina (Malzahn et al. 2007). However, Malzahn et al. (2010)
found no correlation of FAs between A. tonsa and their diet (R. salina), although there were
large differences in dietary FA contents under different nutrient treatments. Peters et al.
(2006) reported that in Bornholm Basin (Central Baltic Sea), some PUFA components in the
copepod Pseudocalanus acuspes reflected those in seston only in autumn and winter, while
there was a time lag of the reflection in spring and summer. The results of our multiple
regression analyses for the ratios of ω3- (and ω6-) PUFA contents between A. tonsa and
their diet under wide ranges of algal C:N (and C:P) ratio and food concentration showed that
the correlation of essential PUFAs between A. tonsa and their diet was food quantity and
stoichiometric food quality dependent. This is in agreement with the finding in Dalsgaard et
al. (2003), indicating that the applicability of FA trophic markers to higher trophic level
organisms is constrained by environmental conditions, e.g., food concentration and nutrient
treatment (in the present study) and seasonal dependence (Peters et al. 2006).
CHAPTER 4 TROPHIC TRANSFER IN MARINE PLANKTON
80
The ratios of ω3-PUFA contents between zooplankton and their diet have been recently
used to indicate ω3-PUFA trophic transfer efficiency across the phytoplankton–zooplankton
interface (Gladyshev et al. 2011). Gladyshev et al. (2011) found that ratios of ω3-PUFAs to
C in zooplankton were significantly higher than those in phytoplankton. They suggested that
transfer efficiency of essential PUFAs from the producers to the primary consumers was
higher than that of bulk C. In the present study, the high ratios (>1) of ω3- (and ω6-) PUFAs
between A. tonsa and their diet were found at lower algal C:N (and C:P) ratios (balanced
nutrient diets), as well as at higher food concentrations. This finding suggests that the
relatively high trophic transfer efficiency of ω3- (and ω6-) PUFAs is evident only when
copepods feeding on balanced nutrient food irrespective of food concentration or at high
food concentrations irrespective of stoichiometric food quality.
Moreover, we note that the relative trophic transfer efficiency of essential PUFAs
compared to that of C is food quantity and stoichiometric food quality dependent. The
positive relationship between ω3- (and ω6-) PUFAs transfer efficiency and food
concentration is consistent with the result in the classic study (Lee et al. 1971), indicating
that dietary PUFAs are more efficiently assimilated by zooplankton at higher food
concentrations. On the other hand, the relatively low ω6-PUFA transfer efficiency
compared to that of C at high algal C:N (or C:P) ratios (N- or P-deficient diets) under low
food concentrations confirms the suggestions in previous studies (Kainz et al. 2004, Müller-
Navarra et al. 2004, Brett et al. 2006), that for certain PUFAs, especially essential PUFAs,
the trophic transfer efficiency decreases with increasing N or P deficiency in aquatic
environments. However, the significant interactive effect of algal C:N (and C:P) ratio and
food concentration suggests likely complex regulations of ω6-PUFA trophic transfer when
copepods and their diet are in the face of a balanced or imbalanced interaction under a wide
range of food concentration.
Reproductive response. Both food concentration and nutrient treatment had significant
effects on the egg production of A. tonsa, resulting in a strong variation in egg production
rate (13 to 64 eggs · female-1 · d-1) in the present study. Kleppel et al. (1998) compared the
egg production of A. tonsa published in the literature. They also found a strong variation in
the egg production rate, ranging from 16.2 to 85.3 eggs · female-1 · d-1 at the temperature
range of <2.0 to 30 °C. More recently, Gusmão and McKinnon (2009) reviewed the egg
production rate of A. tonsa from different studies. They found that the maximum egg
production rates (the asymptotic values in the sigmoid function) varied between 40.3 and
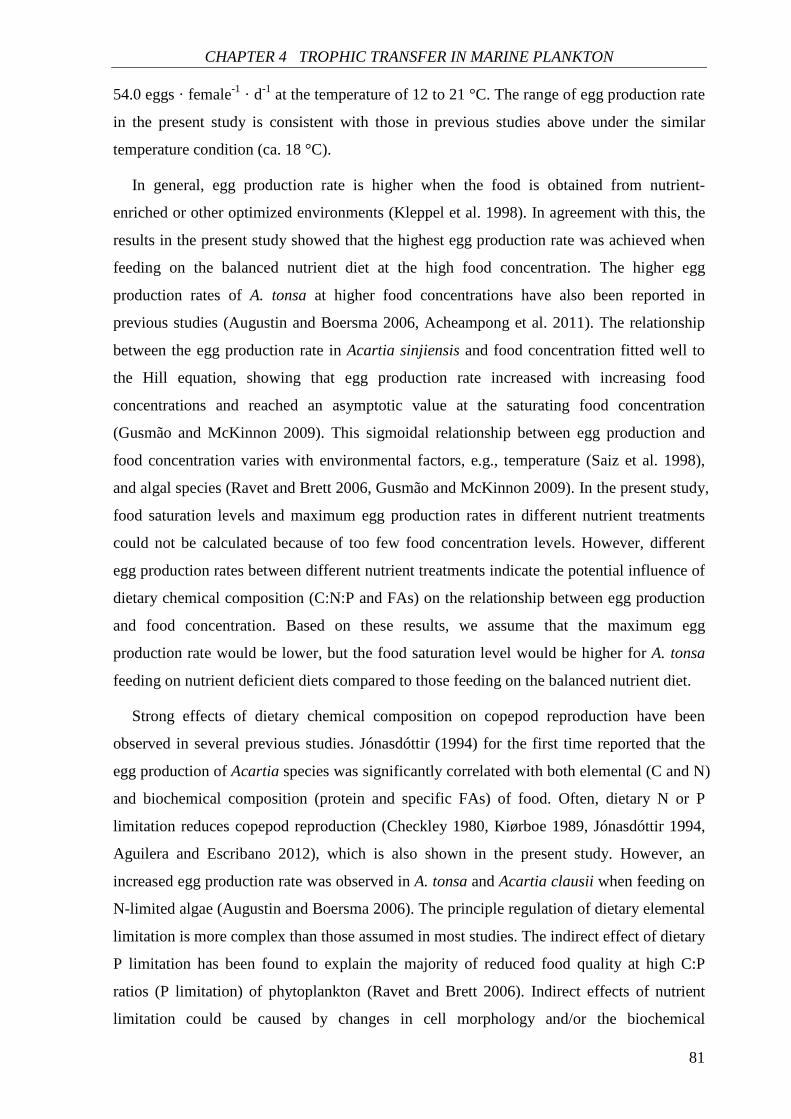
CHAPTER 4 TROPHIC TRANSFER IN MARINE PLANKTON
81
54.0 eggs · female-1 · d-1 at the temperature of 12 to 21 °C. The range of egg production rate
in the present study is consistent with those in previous studies above under the similar
temperature condition (ca. 18 °C).
In general, egg production rate is higher when the food is obtained from nutrient-
enriched or other optimized environments (Kleppel et al. 1998). In agreement with this, the
results in the present study showed that the highest egg production rate was achieved when
feeding on the balanced nutrient diet at the high food concentration. The higher egg
production rates of A. tonsa at higher food concentrations have also been reported in
previous studies (Augustin and Boersma 2006, Acheampong et al. 2011). The relationship
between the egg production rate in Acartia sinjiensis and food concentration fitted well to
the Hill equation, showing that egg production rate increased with increasing food
concentrations and reached an asymptotic value at the saturating food concentration
(Gusmão and McKinnon 2009). This sigmoidal relationship between egg production and
food concentration varies with environmental factors, e.g., temperature (Saiz et al. 1998),
and algal species (Ravet and Brett 2006, Gusmão and McKinnon 2009). In the present study,
food saturation levels and maximum egg production rates in different nutrient treatments
could not be calculated because of too few food concentration levels. However, different
egg production rates between different nutrient treatments indicate the potential influence of
dietary chemical composition (C:N:P and FAs) on the relationship between egg production
and food concentration. Based on these results, we assume that the maximum egg
production rate would be lower, but the food saturation level would be higher for A. tonsa
feeding on nutrient deficient diets compared to those feeding on the balanced nutrient diet.
Strong effects of dietary chemical composition on copepod reproduction have been
observed in several previous studies. Jónasdóttir (1994) for the first time reported that the
egg production of Acartia species was significantly correlated with both elemental (C and N)
and biochemical composition (protein and specific FAs) of food. Often, dietary N or P
limitation reduces copepod reproduction (Checkley 1980, Kiørboe 1989, Jónasdóttir 1994,
Aguilera and Escribano 2012), which is also shown in the present study. However, an
increased egg production rate was observed in A. tonsa and Acartia clausii when feeding on
N-limited algae (Augustin and Boersma 2006). The principle regulation of dietary elemental
limitation is more complex than those assumed in most studies. The indirect effect of dietary
P limitation has been found to explain the majority of reduced food quality at high C:P
ratios (P limitation) of phytoplankton (Ravet and Brett 2006). Indirect effects of nutrient
limitation could be caused by changes in cell morphology and/or the biochemical
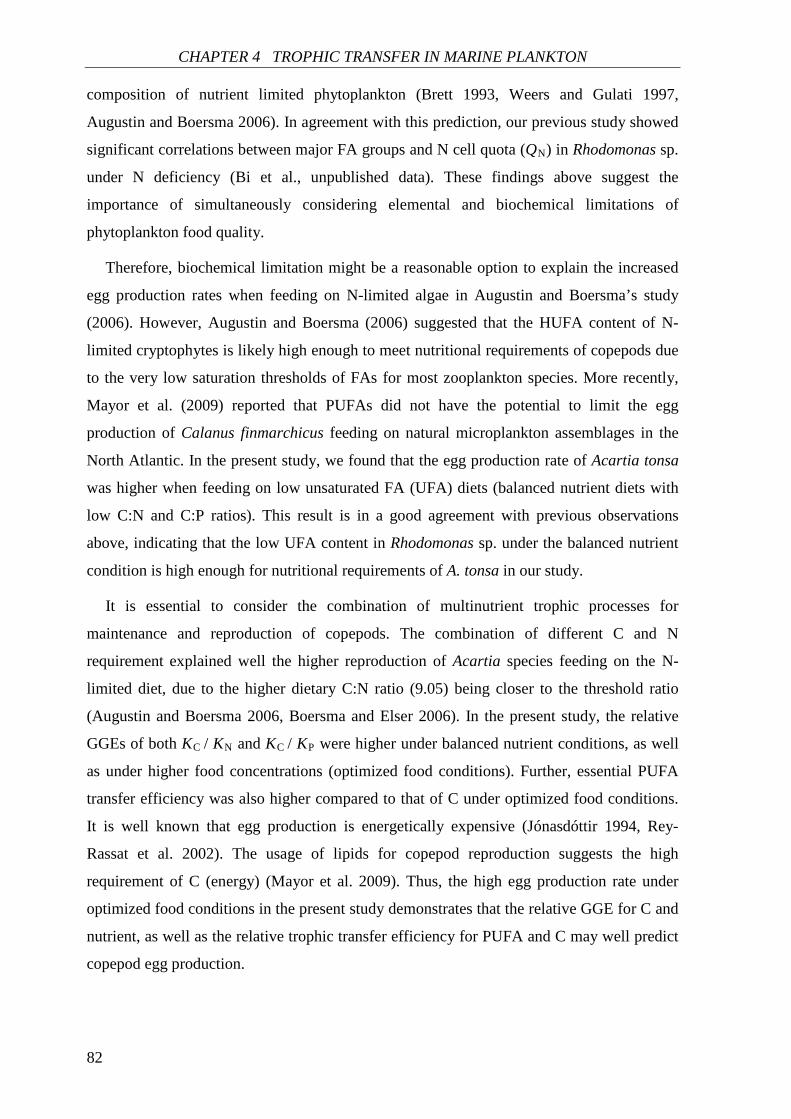
CHAPTER 4 TROPHIC TRANSFER IN MARINE PLANKTON
82
composition of nutrient limited phytoplankton (Brett 1993, Weers and Gulati 1997,
Augustin and Boersma 2006). In agreement with this prediction, our previous study showed
significant correlations between major FA groups and N cell quota (QN) in Rhodomonas sp.
under N deficiency (Bi et al., unpublished data). These findings above suggest the
importance of simultaneously considering elemental and biochemical limitations of
phytoplankton food quality.
Therefore, biochemical limitation might be a reasonable option to explain the increased
egg production rates when feeding on N-limited algae in Augustin and Boersma’s study
(2006). However, Augustin and Boersma (2006) suggested that the HUFA content of N-
limited cryptophytes is likely high enough to meet nutritional requirements of copepods due
to the very low saturation thresholds of FAs for most zooplankton species. More recently,
Mayor et al. (2009) reported that PUFAs did not have the potential to limit the egg
production of Calanus finmarchicus feeding on natural microplankton assemblages in the
North Atlantic. In the present study, we found that the egg production rate of Acartia tonsa
was higher when feeding on low unsaturated FA (UFA) diets (balanced nutrient diets with
low C:N and C:P ratios). This result is in a good agreement with previous observations
above, indicating that the low UFA content in Rhodomonas sp. under the balanced nutrient
condition is high enough for nutritional requirements of A. tonsa in our study.
It is essential to consider the combination of multinutrient trophic processes for
maintenance and reproduction of copepods. The combination of different C and N
requirement explained well the higher reproduction of Acartia species feeding on the N-
limited diet, due to the higher dietary C:N ratio (9.05) being closer to the threshold ratio
(Augustin and Boersma 2006, Boersma and Elser 2006). In the present study, the relative
GGEs of both KC / KN and KC / KP were higher under balanced nutrient conditions, as well
as under higher food concentrations (optimized food conditions). Further, essential PUFA
transfer efficiency was also higher compared to that of C under optimized food conditions.
It is well known that egg production is energetically expensive (Jónasdóttir 1994, Rey-
Rassat et al. 2002). The usage of lipids for copepod reproduction suggests the high
requirement of C (energy) (Mayor et al. 2009). Thus, the high egg production rate under
optimized food conditions in the present study demonstrates that the relative GGE for C and
nutrient, as well as the relative trophic transfer efficiency for PUFA and C may well predict
copepod egg production.
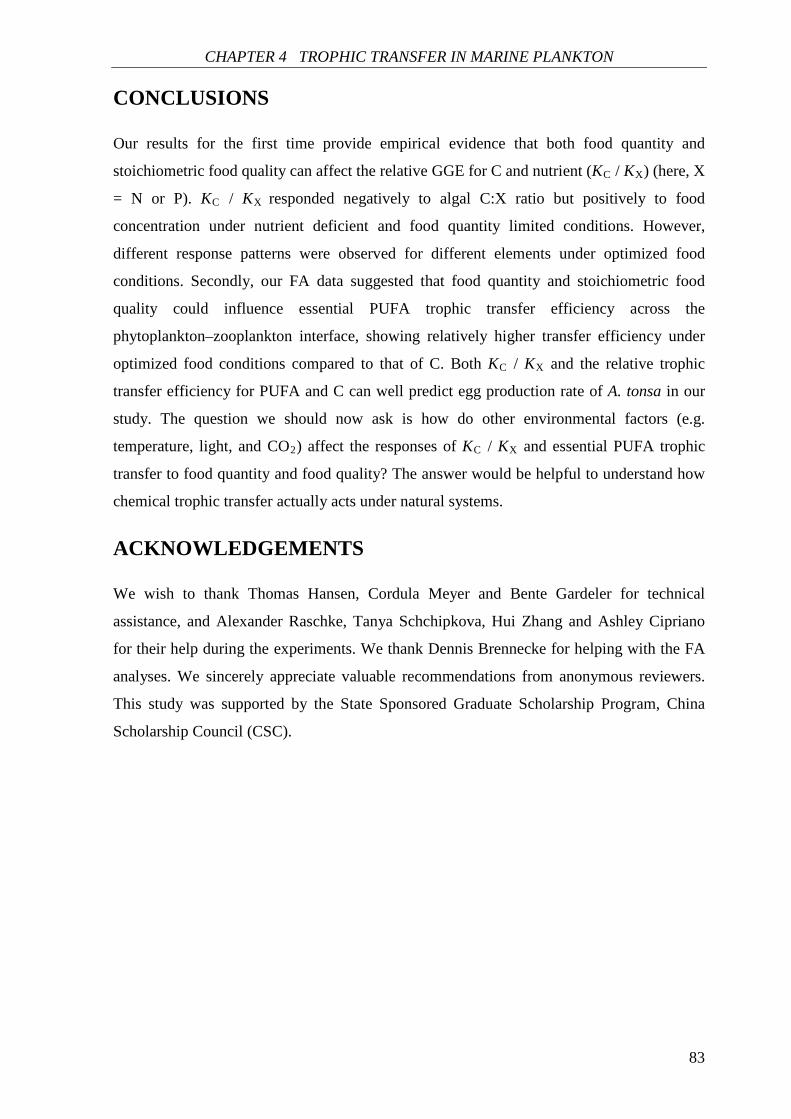
CHAPTER 4 TROPHIC TRANSFER IN MARINE PLANKTON
83
CONCLUSIONS
Our results for the first time provide empirical evidence that both food quantity and
stoichiometric food quality can affect the relative GGE for C and nutrient (KC / KX) (here, X
= N or P). KC / KX responded negatively to algal C:X ratio but positively to food
concentration under nutrient deficient and food quantity limited conditions. However,
different response patterns were observed for different elements under optimized food
conditions. Secondly, our FA data suggested that food quantity and stoichiometric food
quality could influence essential PUFA trophic transfer efficiency across the
phytoplankton–zooplankton interface, showing relatively higher transfer efficiency under
optimized food conditions compared to that of C. Both KC / KX and the relative trophic
transfer efficiency for PUFA and C can well predict egg production rate of A. tonsa in our
study. The question we should now ask is how do other environmental factors (e.g.
temperature, light, and CO2) affect the responses of KC / KX and essential PUFA trophic
transfer to food quantity and food quality? The answer would be helpful to understand how
chemical trophic transfer actually acts under natural systems.
ACKNOWLEDGEMENTS
We wish to thank Thomas Hansen, Cordula Meyer and Bente Gardeler for technical
assistance, and Alexander Raschke, Tanya Schchipkova, Hui Zhang and Ashley Cipriano
for their help during the experiments. We thank Dennis Brennecke for helping with the FA
analyses. We sincerely appreciate valuable recommendations from anonymous reviewers.
This study was supported by the State Sponsored Graduate Scholarship Program, China
Scholarship Council (CSC).

84
85
CHAPTER 5
Effects of food quantity and food quality on
ingestion rate and nucleic acid content in the
calanoid copepod Acartia tonsa*
Rong Bi and Ulrich Sommer
ABSTRACT
Laboratory experiments were conducted to evaluate the effects of food quantity and food
quality (as chemical composition of phytoplankton) on ingestion rate and nucleic acid
content (RNA content and RNA:DNA ratio) in the calanoid copepod Acartia tonsa. The
functional response of ingestion rates fitted well to the Holling model (type III) on the
balanced nutrient and nitrogen (N)-deficient diets. Compared to ingestion rates on the
balanced nutrient diet, ingestion rates for carbon, N, total fatty acids, and ω3-
polyunsaturated fatty acids (PUFAs) on the N-deficient diet were higher at lower food
concentrations but became lower at higher food concentrations. Ingestion rates for ω6-
PUFAs were consistently higher on the N-deficient diet independent of food concentration,
suggesting that it was not a good index of food quality in this study. Nucleic acid contents
correlated positively with food concentration in each food quality treatment, and were
slightly higher on the balanced nutrient diet. Egg production rate correlated positively with
* Unpublished manuscript.
RB and US, Helmholtz Centre for Ocean Research Kiel (GEOMAR), Düsternbrooker Weg 20, 24105 Kiel, Germany.
CHAPTER 5 INGESTION AND NUCLEIC ACID IN COPEPODS
86
nucleic acid content, while food quality showed no significant effect on the nucleic acid-egg
production relationship. This result is in agreement with the increasing recognition that
RNA-based indices can be used as good indicators of copepod egg production.
INTRODUCTION
Copepods are the most abundant zooplankton in the oceans (Verity and Smetacek 1996). As
an important link between primary producers and organisms at higher trophic levels,
copepods occupy a key ecological position in marine systems (Harris et al. 2000). Thus, the
assessment of copepod performances is essential for understanding the transfer of energy
and matter in pelagic food webs, especially in face to prevalent natural and human-induced
perturbation in the oceans.
Feeding is the main route for energy and matter transfer from lower to higher trophic
levels, and thus quantification of feeding is a key factor in studying trophic interactions
(Båmstedt et al. 2000). It has been well established that ingestion rates increase with
increasing food concentrations up to a maximal rate, which can be illustrated by the classic
Holling functional response and alternative types of models as reviewed by Gentleman et al.
(2003). However, there is no consistent response of ingestion rates to food quality, which
might be explained by various characteristics of food quality such as chemical composition
and shape and size of food particles. For this reason, although the effect of food type on
ingestion rates has been widely studied (e.g., Støttrup and Jensen 1990, Tirelli and Mayzaud
2005, Liu et al. 2010), little is known about how chemical quality of food affects ingestion
rates of copepods and the food quantity-ingestion relationship. There is evidence that the
effect of food quality on ingestion rates varies greatly even within copepod species. For
example, the asymptotic maximum value of ingestion rate of Acartia tonsa in Besiktepe and
Dam (2002) was ca. 16 times higher than that in Thor and Wendt (2010). In both studies, A.
tonsa was fed on the same algal species (Dunaliella tertiolecta). This suggests that chemical
quality of food may contribute the bulk of the variation in ingestion rates.
The RNA content and RNA:DNA ratio have been used as indices of copepod growth and
physiological condition (Saiz et al. 1998, Wagner et al. 1998, Holmborn et al. 2009, Ning et
al. 2013). Compared to tranditional methods used for assessing copepod growth (e.g., the
egg production method) and metabolic activity (e.g., enzymatic methods), estimation of
nucleic acid indices has several advantages such as simplicity, sensitivity, and variety of
techniques (Gusmão and McKinnon 2011). Food quantity has been frequently considered in
CHAPTER 5 INGESTION AND NUCLEIC ACID IN COPEPODS
87
previous studies investigating the use of nucleic acid content as an index of egg production
(or growth) in copepods (Gusmão and McKinnon 2011 and references therein), while the
effect of food quality has received less attention. Saiz et al. (1998) suggested that the
relationship between RNA content and growth rate (estimated as egg production rate)
should be uniform for a particular copepod species independent of food quality and previous
food history. However, a recent study has reported that food quality (as different algal
species) can affect the nucleic acid-egg production relationship in copepods (Gusmão and
McKinnon 2011). As mentioned above, food quality comprises various aspects. Thus,
despite the known effect of food type recently reported by Gusmão and McKinnon (2011),
there is still no information about the effect of chemical quality of food on the nucleic acid-
egg production relationship.
In the present study, we investigated the interactive effect of food quantity and quality on
ingestion rates and nucleic acid contents (RNA content and RNA:DNA ratio) in the calanoid
copepod A. tonsa, and further determined the nucleic acid-egg production relationship in
response to food quality. Food quality in this study is expressed as elemental (carbon (C):
nitrogen (N):phosphorus (P) stoichiometry) and biochemical (fatty acids (FAs)) composition
of phytoplankton. Rhodomonas sp. (Cryptophyceae) was chosen as food source due to its
high polyunsaturated fatty acid (PUFA) contents. A. tonsa was chosen as the model copepod
because the adults do not build up large energy storage pools but rather invest most
assimilated energy into egg production (Diekmann et al. 2009), thus making egg production
a relatively fast response to feeding conditions. The objectives of our study are to test: (i)
the interactive effect of food quantity and quality on ingestion rates of copepods (C-, N-,
total fatty acids (TFAs)-, ω3- (and ω6-) PUFAs-specific ingestion rates); (ii) the interactive
effect of food quantity and quality on nucleic acid content (RNA content and RNA:DNA
ratio) of copepods; (iii) whether food quality could affect the nucleic acid-egg production
relationship.
MATERIALS AND METHODS
Phytoplankton cultures. Rhodomonas sp. (Cryptophyceae) (equivalent spherical diameter
4.6 µm) was isolated from Kiel fjord and used as the copepod diet in this study. Cultures
were maintained in sterile filtered natural seawater from the Kiel fjord, Baltic Sea
(Sterilizing Grade Filter, Sartobran P 0.2 µm) (Sartorius Stedim Biotech GmbH, Goettingen,
Germany) with additional macronutrients and micronutrients based on the modified
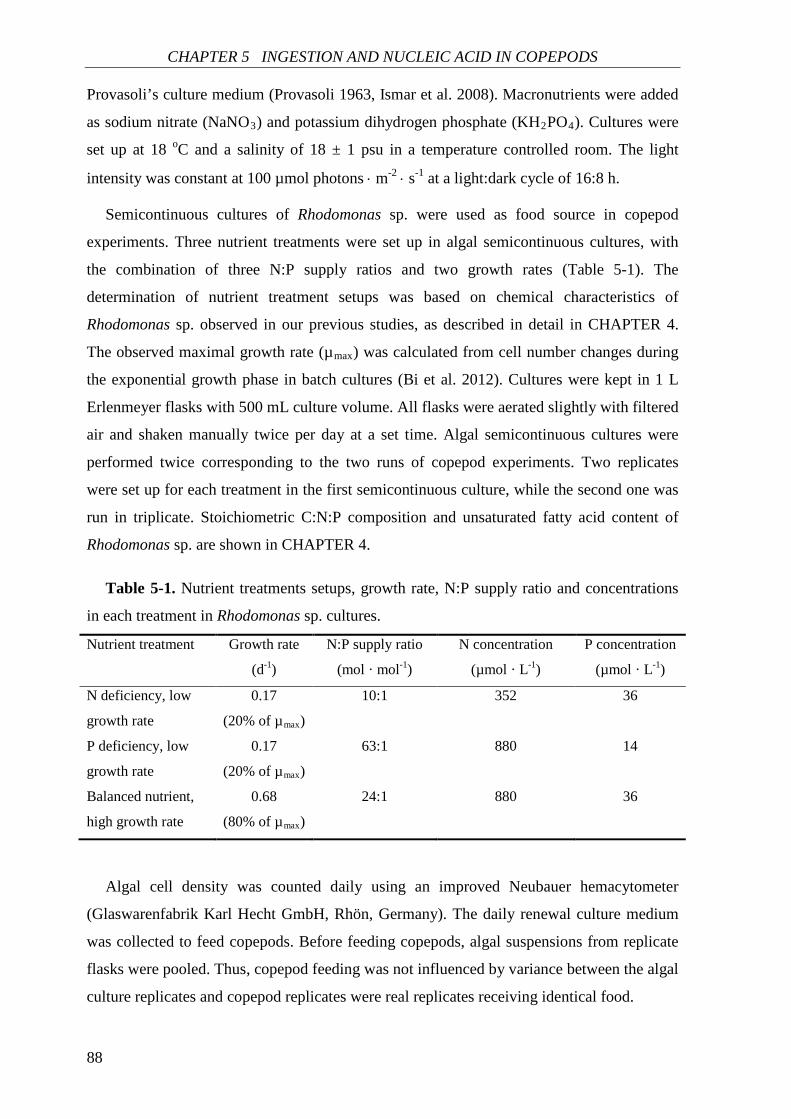
CHAPTER 5 INGESTION AND NUCLEIC ACID IN COPEPODS
88
Provasoli’s culture medium (Provasoli 1963, Ismar et al. 2008). Macronutrients were added
as sodium nitrate (NaNO3) and potassium dihydrogen phosphate (KH2PO4). Cultures were
set up at 18 oC and a salinity of 18 ± 1 psu in a temperature controlled room. The light
intensity was constant at 100 µmol photons ⋅ m-2 ⋅ s-1 at a light:dark cycle of 16:8 h.
Semicontinuous cultures of Rhodomonas sp. were used as food source in copepod
experiments. Three nutrient treatments were set up in algal semicontinuous cultures, with
the combination of three N:P supply ratios and two growth rates (Table 5-1). The
determination of nutrient treatment setups was based on chemical characteristics of
Rhodomonas sp. observed in our previous studies, as described in detail in CHAPTER 4.
The observed maximal growth rate (µmax) was calculated from cell number changes during
the exponential growth phase in batch cultures (Bi et al. 2012). Cultures were kept in 1 L
Erlenmeyer flasks with 500 mL culture volume. All flasks were aerated slightly with filtered
air and shaken manually twice per day at a set time. Algal semicontinuous cultures were
performed twice corresponding to the two runs of copepod experiments. Two replicates
were set up for each treatment in the first semicontinuous culture, while the second one was
run in triplicate. Stoichiometric C:N:P composition and unsaturated fatty acid content of
Rhodomonas sp. are shown in CHAPTER 4.
Table 5-1. Nutrient treatments setups, growth rate, N:P supply ratio and concentrations
in each treatment in Rhodomonas sp. cultures.
Nutrient treatment Growth rate
(d-1)
N:P supply ratio
(mol · mol-1)
N concentration
(µmol · L-1)
P concentration
(µmol · L-1)
N deficiency, low
growth rate
0.17
(20% of µmax)
10:1 352 36
P deficiency, low
growth rate
0.17
(20% of µmax)
63:1 880 14
Balanced nutrient,
high growth rate
0.68
(80% of µmax)
24:1 880 36
Algal cell density was counted daily using an improved Neubauer hemacytometer
(Glaswarenfabrik Karl Hecht GmbH, Rhön, Germany). The daily renewal culture medium
was collected to feed copepods. Before feeding copepods, algal suspensions from replicate
flasks were pooled. Thus, copepod feeding was not influenced by variance between the algal
culture replicates and copepod replicates were real replicates receiving identical food.
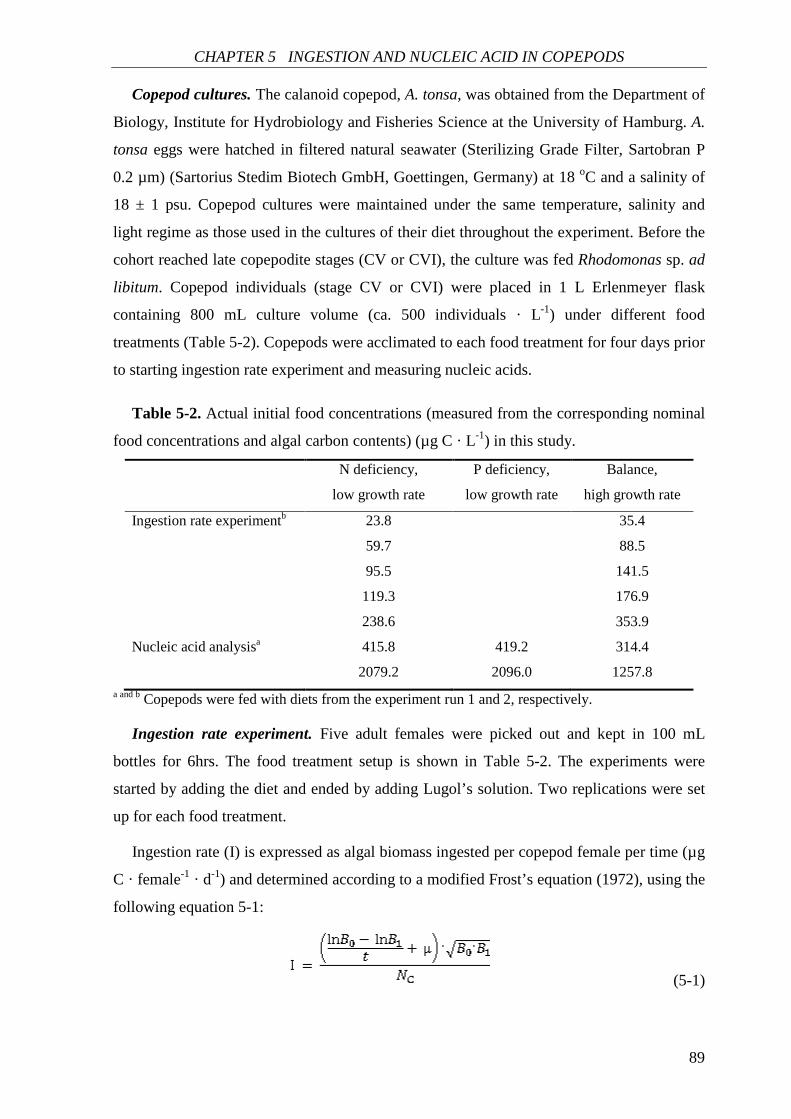
CHAPTER 5 INGESTION AND NUCLEIC ACID IN COPEPODS
89
Copepod cultures. The calanoid copepod, A. tonsa, was obtained from the Department of
Biology, Institute for Hydrobiology and Fisheries Science at the University of Hamburg. A.
tonsa eggs were hatched in filtered natural seawater (Sterilizing Grade Filter, Sartobran P
0.2 µm) (Sartorius Stedim Biotech GmbH, Goettingen, Germany) at 18 oC and a salinity of
18 ± 1 psu. Copepod cultures were maintained under the same temperature, salinity and
light regime as those used in the cultures of their diet throughout the experiment. Before the
cohort reached late copepodite stages (CV or CVI), the culture was fed Rhodomonas sp. ad
libitum. Copepod individuals (stage CV or CVI) were placed in 1 L Erlenmeyer flask
containing 800 mL culture volume (ca. 500 individuals · L-1) under different food
treatments (Table 5-2). Copepods were acclimated to each food treatment for four days prior
to starting ingestion rate experiment and measuring nucleic acids.
Table 5-2. Actual initial food concentrations (measured from the corresponding nominal
food concentrations and algal carbon contents) (µg C · L-1) in this study.
N deficiency,
low growth rate
P deficiency,
low growth rate
Balance,
high growth rate
Ingestion rate experimentb 23.8 35.4
59.7 88.5
95.5 141.5
119.3 176.9
238.6 353.9
Nucleic acid analysisa 415.8 419.2 314.4
2079.2 2096.0 1257.8 a and b Copepods were fed with diets from the experiment run 1 and 2, respectively.
Ingestion rate experiment. Five adult females were picked out and kept in 100 mL
bottles for 6hrs. The food treatment setup is shown in Table 5-2. The experiments were
started by adding the diet and ended by adding Lugol’s solution. Two replications were set
up for each food treatment.
Ingestion rate (I) is expressed as algal biomass ingested per copepod female per time (µg
C · female-1 · d-1) and determined according to a modified Frost’s equation (1972), using the
following equation 5-1:
(5-1)
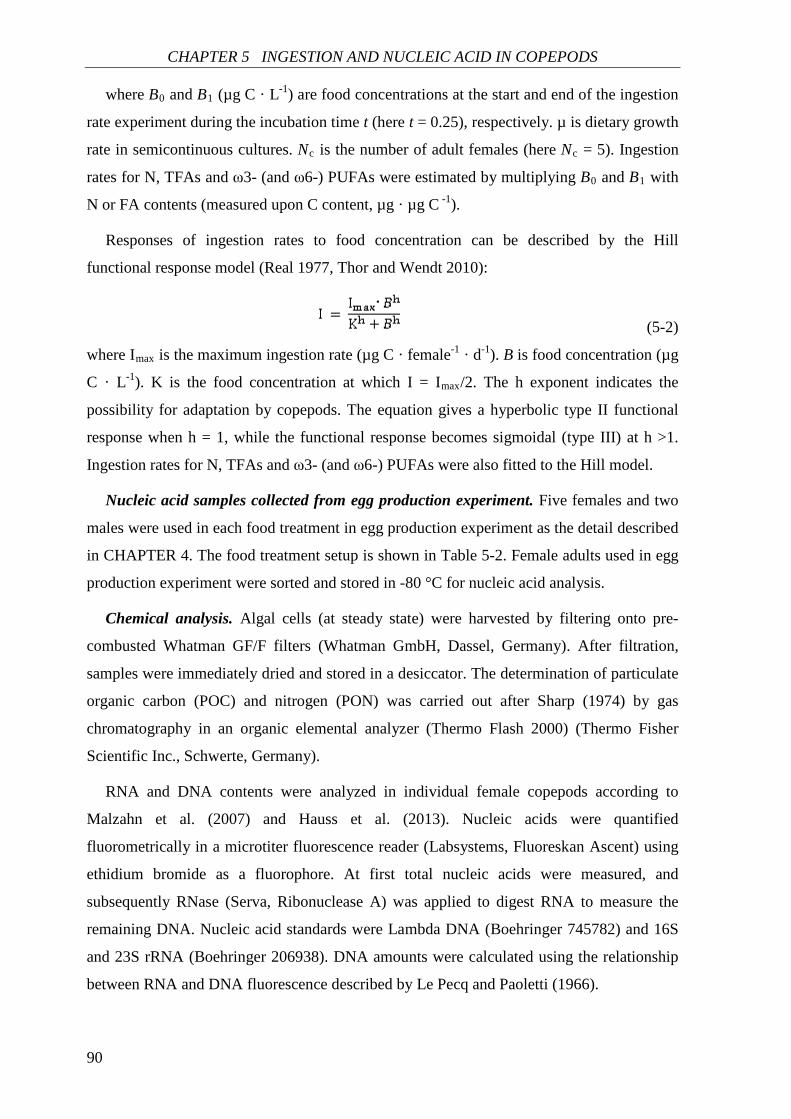
CHAPTER 5 INGESTION AND NUCLEIC ACID IN COPEPODS
90
where B0 and B1 (µg C · L-1) are food concentrations at the start and end of the ingestion
rate experiment during the incubation time t (here t = 0.25), respectively. µ is dietary growth
rate in semicontinuous cultures. Nc is the number of adult females (here Nc = 5). Ingestion
rates for N, TFAs and ω3- (and ω6-) PUFAs were estimated by multiplying B0 and B1 with
N or FA contents (measured upon C content, µg · µg C -1).
Responses of ingestion rates to food concentration can be described by the Hill
functional response model (Real 1977, Thor and Wendt 2010):
(5-2)
where Imax is the maximum ingestion rate (µg C · female-1 · d-1). B is food concentration (µg
C · L-1). K is the food concentration at which I = Imax/2. The h exponent indicates the
possibility for adaptation by copepods. The equation gives a hyperbolic type II functional
response when h = 1, while the functional response becomes sigmoidal (type III) at h >1.
Ingestion rates for N, TFAs and ω3- (and ω6-) PUFAs were also fitted to the Hill model.
Nucleic acid samples collected from egg production experiment. Five females and two
males were used in each food treatment in egg production experiment as the detail described
in CHAPTER 4. The food treatment setup is shown in Table 5-2. Female adults used in egg
production experiment were sorted and stored in -80 °C for nucleic acid analysis.
Chemical analysis. Algal cells (at steady state) were harvested by filtering onto pre-
combusted Whatman GF/F filters (Whatman GmbH, Dassel, Germany). After filtration,
samples were immediately dried and stored in a desiccator. The determination of particulate
organic carbon (POC) and nitrogen (PON) was carried out after Sharp (1974) by gas
chromatography in an organic elemental analyzer (Thermo Flash 2000) (Thermo Fisher
Scientific Inc., Schwerte, Germany).
RNA and DNA contents were analyzed in individual female copepods according to
Malzahn et al. (2007) and Hauss et al. (2013). Nucleic acids were quantified
fluorometrically in a microtiter fluorescence reader (Labsystems, Fluoreskan Ascent) using
ethidium bromide as a fluorophore. At first total nucleic acids were measured, and
subsequently RNase (Serva, Ribonuclease A) was applied to digest RNA to measure the
remaining DNA. Nucleic acid standards were Lambda DNA (Boehringer 745782) and 16S
and 23S rRNA (Boehringer 206938). DNA amounts were calculated using the relationship
between RNA and DNA fluorescence described by Le Pecq and Paoletti (1966).
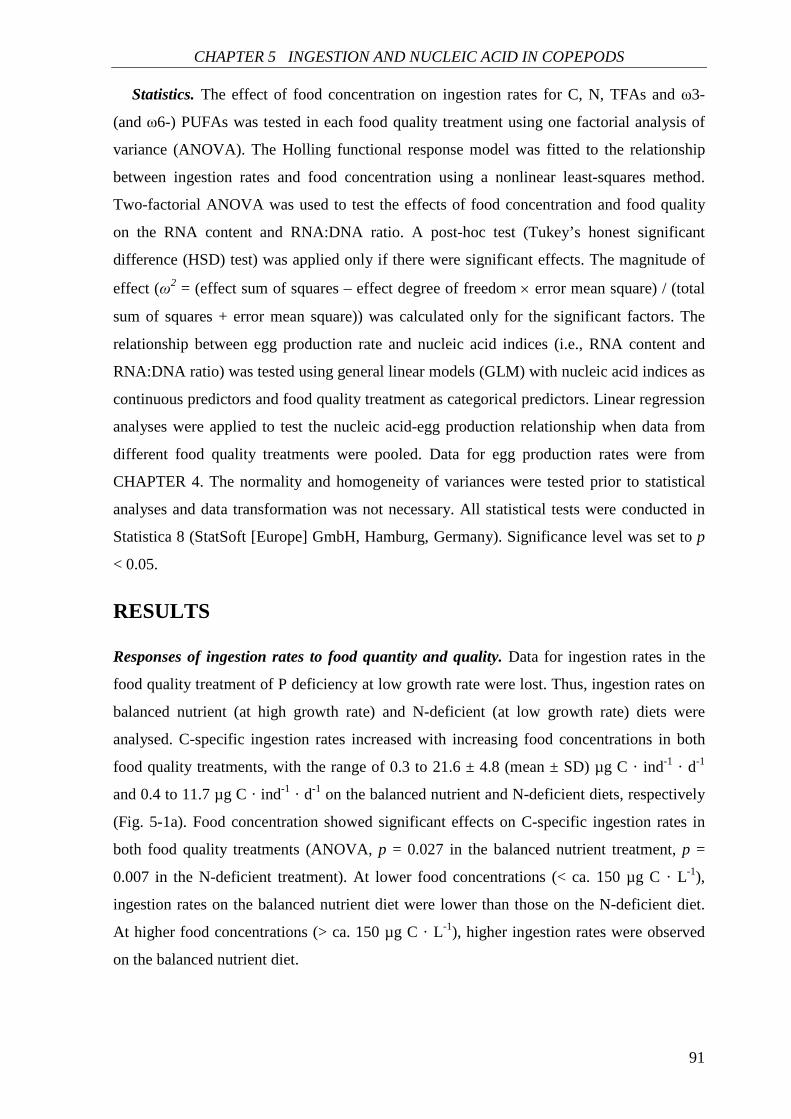
CHAPTER 5 INGESTION AND NUCLEIC ACID IN COPEPODS
91
Statistics. The effect of food concentration on ingestion rates for C, N, TFAs and ω3-
(and ω6-) PUFAs was tested in each food quality treatment using one factorial analysis of
variance (ANOVA). The Holling functional response model was fitted to the relationship
between ingestion rates and food concentration using a nonlinear least-squares method.
Two-factorial ANOVA was used to test the effects of food concentration and food quality
on the RNA content and RNA:DNA ratio. A post-hoc test (Tukey’s honest significant
difference (HSD) test) was applied only if there were significant effects. The magnitude of
effect (ω2 = (effect sum of squares – effect degree of freedom × error mean square) / (total
sum of squares + error mean square)) was calculated only for the significant factors. The
relationship between egg production rate and nucleic acid indices (i.e., RNA content and
RNA:DNA ratio) was tested using general linear models (GLM) with nucleic acid indices as
continuous predictors and food quality treatment as categorical predictors. Linear regression
analyses were applied to test the nucleic acid-egg production relationship when data from
different food quality treatments were pooled. Data for egg production rates were from
CHAPTER 4. The normality and homogeneity of variances were tested prior to statistical
analyses and data transformation was not necessary. All statistical tests were conducted in
Statistica 8 (StatSoft [Europe] GmbH, Hamburg, Germany). Significance level was set to p
< 0.05.
RESULTS
Responses of ingestion rates to food quantity and quality. Data for ingestion rates in the
food quality treatment of P deficiency at low growth rate were lost. Thus, ingestion rates on
balanced nutrient (at high growth rate) and N-deficient (at low growth rate) diets were
analysed. C-specific ingestion rates increased with increasing food concentrations in both
food quality treatments, with the range of 0.3 to 21.6 ± 4.8 (mean ± SD) µg C · ind-1 · d-1
and 0.4 to 11.7 µg C · ind-1 · d-1 on the balanced nutrient and N-deficient diets, respectively
(Fig. 5-1a). Food concentration showed significant effects on C-specific ingestion rates in
both food quality treatments (ANOVA, p = 0.027 in the balanced nutrient treatment, p =
0.007 in the N-deficient treatment). At lower food concentrations (< ca. 150 µg C · L-1),
ingestion rates on the balanced nutrient diet were lower than those on the N-deficient diet.
At higher food concentrations (> ca. 150 µg C · L-1), higher ingestion rates were observed
on the balanced nutrient diet.
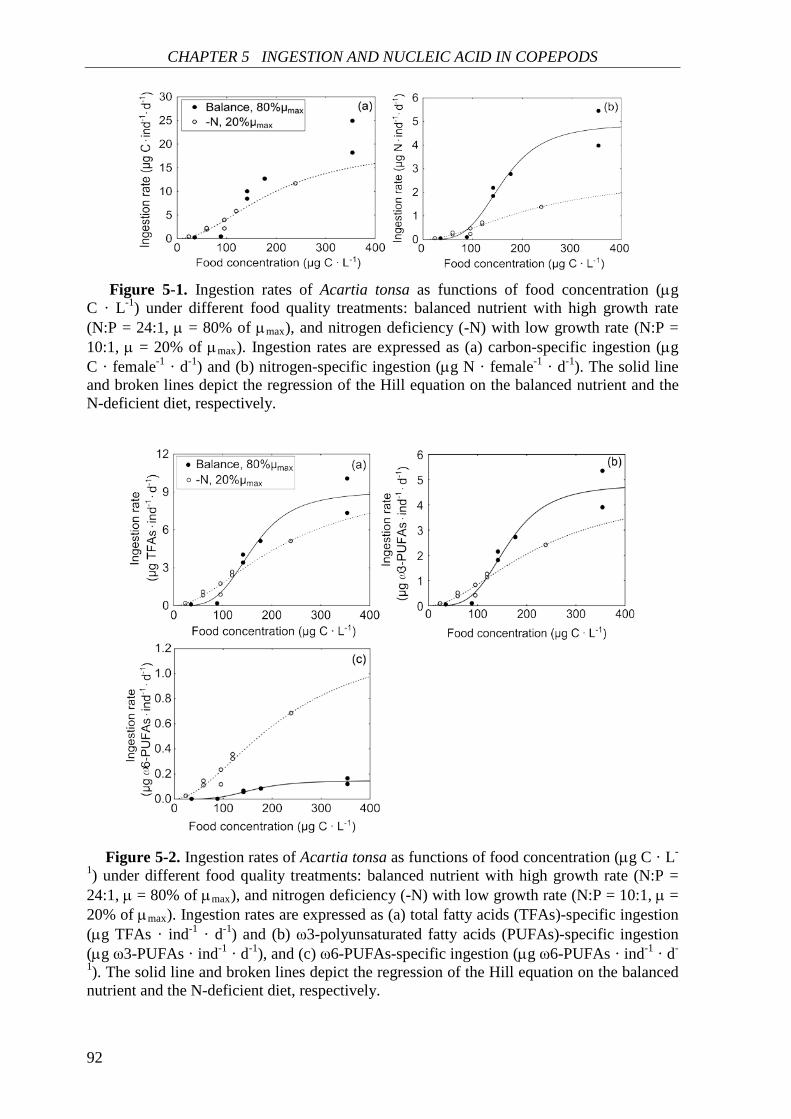
CHAPTER 5 INGESTION AND NUCLEIC ACID IN COPEPODS
92
Figure 5-1. Ingestion rates of Acartia tonsa as functions of food concentration (µg
C · L-1) under different food quality treatments: balanced nutrient with high growth rate (N:P = 24:1, µ = 80% of µmax), and nitrogen deficiency (-N) with low growth rate (N:P = 10:1, µ = 20% of µmax). Ingestion rates are expressed as (a) carbon-specific ingestion (µg C · female-1 · d-1) and (b) nitrogen-specific ingestion (µg N · female-1 · d-1). The solid line and broken lines depict the regression of the Hill equation on the balanced nutrient and the N-deficient diet, respectively.
Figure 5-2. Ingestion rates of Acartia tonsa as functions of food concentration (µg C · L-
1) under different food quality treatments: balanced nutrient with high growth rate (N:P = 24:1, µ = 80% of µmax), and nitrogen deficiency (-N) with low growth rate (N:P = 10:1, µ = 20% of µmax). Ingestion rates are expressed as (a) total fatty acids (TFAs)-specific ingestion (µg TFAs · ind-1 · d-1) and (b) ω3-polyunsaturated fatty acids (PUFAs)-specific ingestion (µg ω3-PUFAs · ind-1 · d-1), and (c) ω6-PUFAs-specific ingestion (µg ω6-PUFAs · ind-1 · d-
1). The solid line and broken lines depict the regression of the Hill equation on the balanced nutrient and the N-deficient diet, respectively.
CHAPTER 5 INGESTION AND NUCLEIC ACID IN COPEPODS
93
Table 5-3. Estimated parameters (±SE) obtained by nonlinear least-square regression of
ingestion rates versus food concentration (µg C · L-1) according to the Hill equation under
two food quality treatments: balanced nutrient with high growth rate (N:P = 24:1, µ = 80%
of µmax), and nitrogen deficiency (-N) with low growth rate (N:P = 10:1, µ = 20% of µmax).
Specific ingestion Food quality treatment Imax K h
Carbon (C) Balance a - - -
-N 19.9±12.4 198.1±133.7 2.0±0.8
Nitrogen (N) Balance 4.9±0.6* 161.1±14.9* 3.9±1.7
-N 2.7±2.5 230.8±237.1 1.8±0.8
TFAs Balance 9.1±1.1* 161.1±14.9* 3.9±1.7
-N 10.0±9.4 230.8±237.0 1.8±0.8
ω3-PUFAs Balance 4.8±0.6* 161.1±14.9* 3.9±1.7
-N 4.7±4.5 231.0±238.0 1.8±0.8
ω6-PUFAs Balance 0.1±0.02* 161.1±14.9* 3.9±1.7
-N 1.3±1.3 230.8±237.8 1.8±0.8 aThe relationship of C-specific ingestion and food concentration on the balanced nutrient diet
could not follow the Hill model due to the presence of multi-collinearity. The parameter Imax and
ingestion rates are expressed as µg C · ind-1 · d-1 for C-specific ingestion, µg N · ind-1 · d-1 for N-
specific ingestion, µg TFAs · ind-1 · d-1 for TFAs-specific ingestion, and µg ω3- (and ω6-)
PUFAs · ind-1 · d-1 for ω3- (and ω6-) PUFAs-specific ingestion, respectively. The parameter K is
expressed as µg C · L-1 for C-specific ingestion, µg N · L-1 for N-specific ingestion, µg TFAs · L-1
for TFAs-specific ingestion, and µg ω3- (and ω6-) PUFAs · L-1 for ω3- (and ω6-) PUFAs-specific
ingestion, respectively. Asterisk marks significant estimates (p < 0.05); the number of observations
(n) is 8 in both food quality treatments.
A. tonsa also ingested different concentrations of N, TFAs, and ω3- (and ω6-) PUFAs
under different food concentrations in both food quality treatments (ANOVA, p < 0.05) (N-
specific ingestion (Fig. 5-1b) and FAs-specific ingestion (Fig. 5-2)). Ingestion rates for N
and FAs increased with increasing food concentrations in both food quality treatments. In
each food quality treatment, ingestion rates for N, TFAs and ω3-PUFAs were lower on the
balanced nutrient diet than those on the N-deficient diet at lower food concentrations (< ca.
60 µg C · L-1 for N-specific ingestion (Fig. 5-1b) and < ca. 120 µg C · L-1 for TFAs- and
ω3-PUFAs-specific ingestion (Fig. 5-2, a and b)), but ingestion rates became higher on the
balanced nutrient diet at higher food concentrations. ω6-PUFAs-specific ingestion were
higher on the N-deficient diet across the entire range of food concentration (Fig. 5-2c).
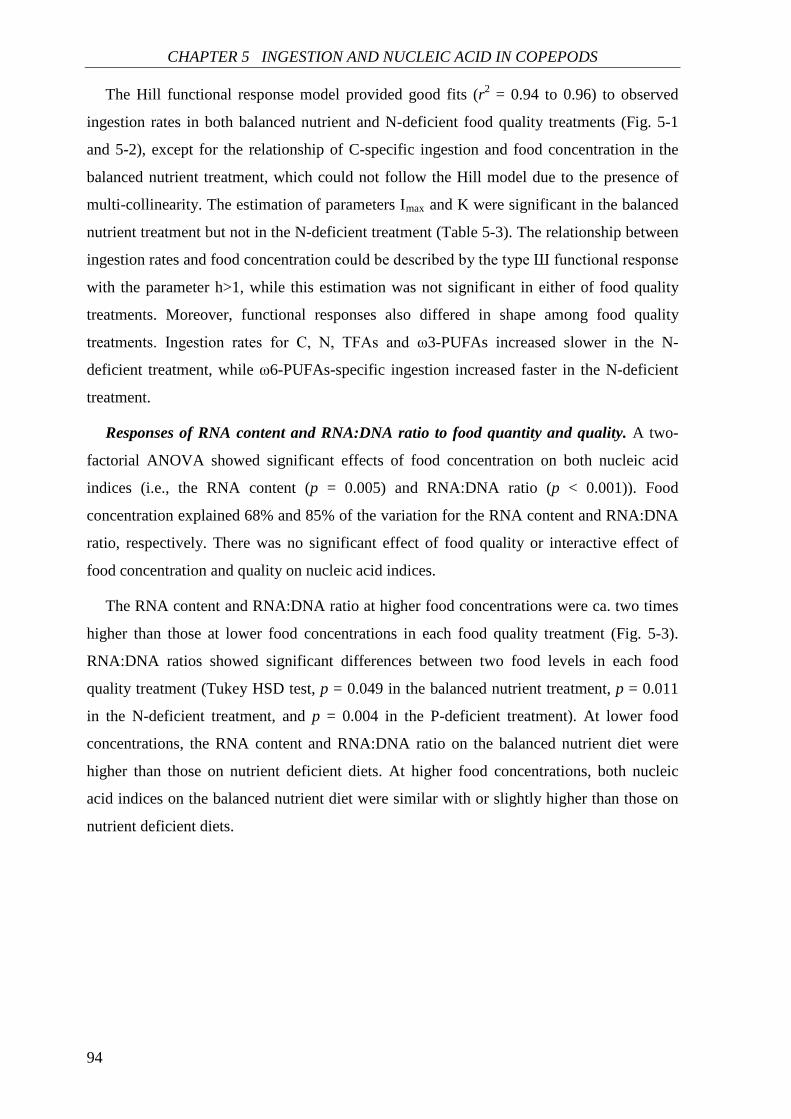
CHAPTER 5 INGESTION AND NUCLEIC ACID IN COPEPODS
94
The Hill functional response model provided good fits (r2 = 0.94 to 0.96) to observed
ingestion rates in both balanced nutrient and N-deficient food quality treatments (Fig. 5-1
and 5-2), except for the relationship of C-specific ingestion and food concentration in the
balanced nutrient treatment, which could not follow the Hill model due to the presence of
multi-collinearity. The estimation of parameters Imax and K were significant in the balanced
nutrient treatment but not in the N-deficient treatment (Table 5-3). The relationship between
ingestion rates and food concentration could be described by the type Ш functional response
with the parameter h>1, while this estimation was not significant in either of food quality
treatments. Moreover, functional responses also differed in shape among food quality
treatments. Ingestion rates for C, N, TFAs and ω3-PUFAs increased slower in the N-
deficient treatment, while ω6-PUFAs-specific ingestion increased faster in the N-deficient
treatment.
Responses of RNA content and RNA:DNA ratio to food quantity and quality. A two-
factorial ANOVA showed significant effects of food concentration on both nucleic acid
indices (i.e., the RNA content (p = 0.005) and RNA:DNA ratio (p < 0.001)). Food
concentration explained 68% and 85% of the variation for the RNA content and RNA:DNA
ratio, respectively. There was no significant effect of food quality or interactive effect of
food concentration and quality on nucleic acid indices.
The RNA content and RNA:DNA ratio at higher food concentrations were ca. two times
higher than those at lower food concentrations in each food quality treatment (Fig. 5-3).
RNA:DNA ratios showed significant differences between two food levels in each food
quality treatment (Tukey HSD test, p = 0.049 in the balanced nutrient treatment, p = 0.011
in the N-deficient treatment, and p = 0.004 in the P-deficient treatment). At lower food
concentrations, the RNA content and RNA:DNA ratio on the balanced nutrient diet were
higher than those on nutrient deficient diets. At higher food concentrations, both nucleic
acid indices on the balanced nutrient diet were similar with or slightly higher than those on
nutrient deficient diets.
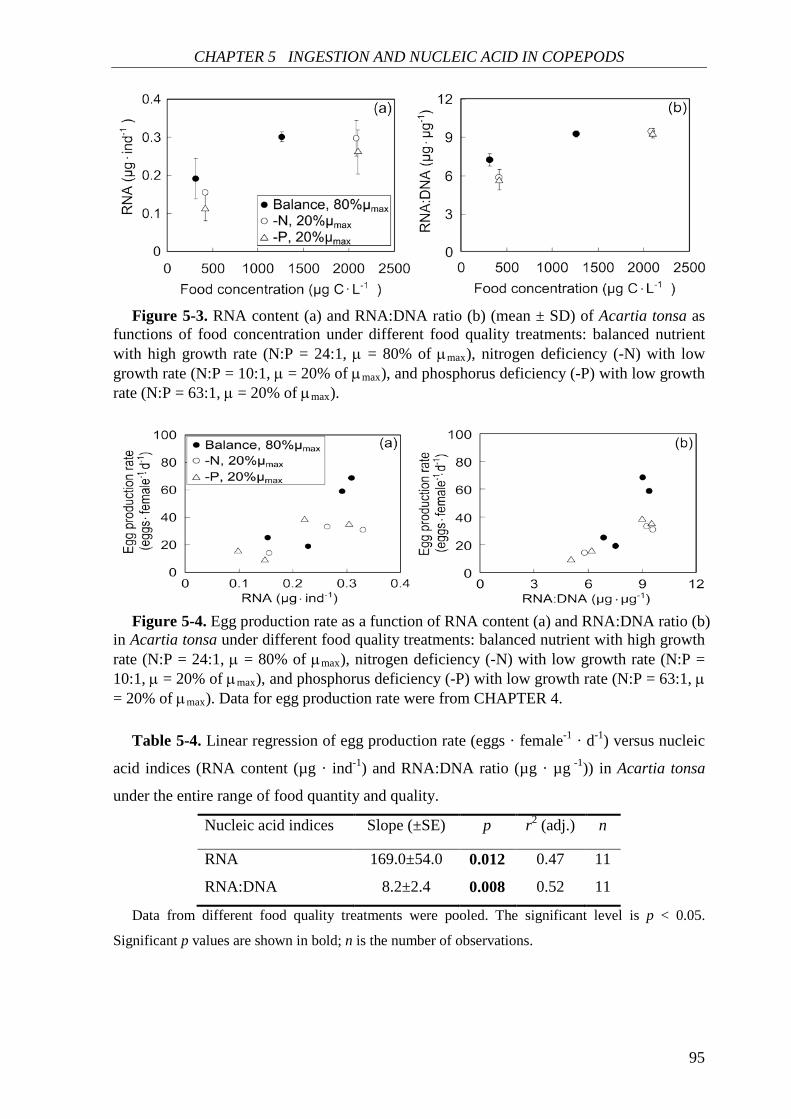
CHAPTER 5 INGESTION AND NUCLEIC ACID IN COPEPODS
95
Figure 5-3. RNA content (a) and RNA:DNA ratio (b) (mean ± SD) of Acartia tonsa as
functions of food concentration under different food quality treatments: balanced nutrient with high growth rate (N:P = 24:1, µ = 80% of µmax), nitrogen deficiency (-N) with low growth rate (N:P = 10:1, µ = 20% of µmax), and phosphorus deficiency (-P) with low growth rate (N:P = 63:1, µ = 20% of µmax).
Figure 5-4. Egg production rate as a function of RNA content (a) and RNA:DNA ratio (b)
in Acartia tonsa under different food quality treatments: balanced nutrient with high growth rate (N:P = 24:1, µ = 80% of µmax), nitrogen deficiency (-N) with low growth rate (N:P = 10:1, µ = 20% of µmax), and phosphorus deficiency (-P) with low growth rate (N:P = 63:1, µ = 20% of µmax). Data for egg production rate were from CHAPTER 4.
Table 5-4. Linear regression of egg production rate (eggs · female-1 · d-1) versus nucleic
acid indices (RNA content (µg · ind-1) and RNA:DNA ratio (µg · µg -1)) in Acartia tonsa
under the entire range of food quantity and quality.
Nucleic acid indices Slope (±SE) p r2 (adj.) n
RNA 169.0±54.0 0.012 0.47 11
RNA:DNA 8.2±2.4 0.008 0.52 11
Data from different food quality treatments were pooled. The significant level is p < 0.05.
Significant p values are shown in bold; n is the number of observations.
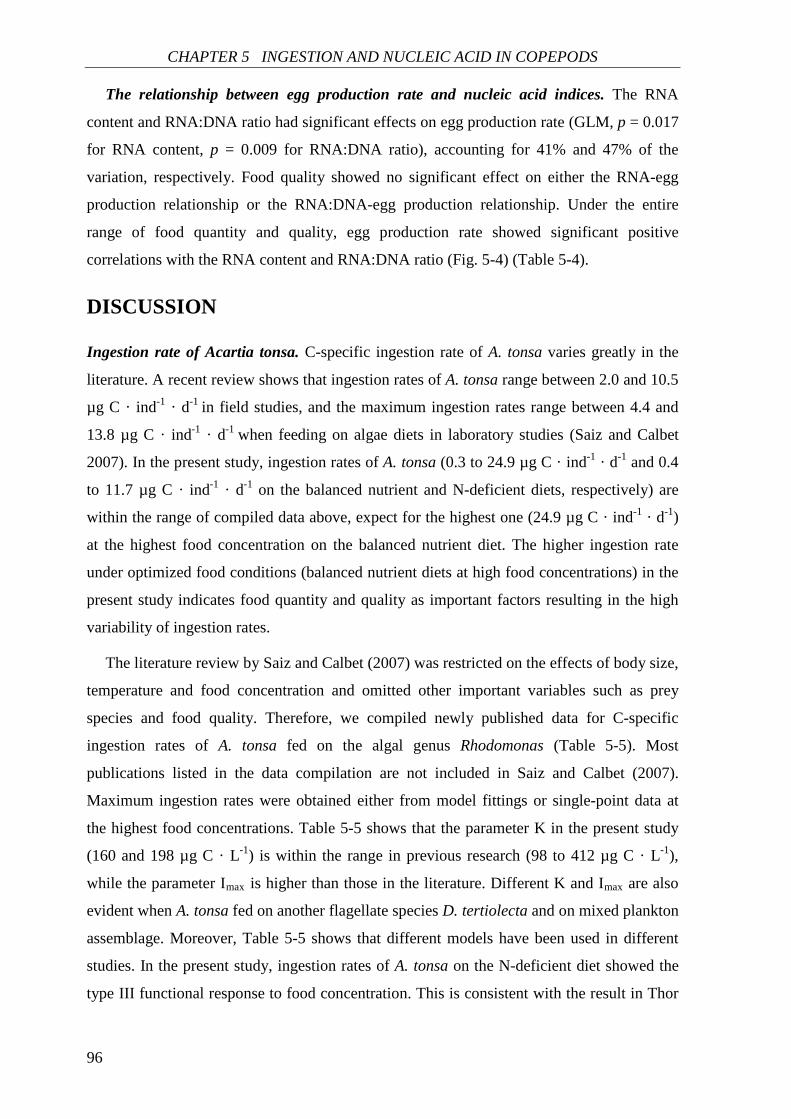
CHAPTER 5 INGESTION AND NUCLEIC ACID IN COPEPODS
96
The relationship between egg production rate and nucleic acid indices. The RNA
content and RNA:DNA ratio had significant effects on egg production rate (GLM, p = 0.017
for RNA content, p = 0.009 for RNA:DNA ratio), accounting for 41% and 47% of the
variation, respectively. Food quality showed no significant effect on either the RNA-egg
production relationship or the RNA:DNA-egg production relationship. Under the entire
range of food quantity and quality, egg production rate showed significant positive
correlations with the RNA content and RNA:DNA ratio (Fig. 5-4) (Table 5-4).
DISCUSSION
Ingestion rate of Acartia tonsa. C-specific ingestion rate of A. tonsa varies greatly in the
literature. A recent review shows that ingestion rates of A. tonsa range between 2.0 and 10.5
µg C · ind-1 · d-1 in field studies, and the maximum ingestion rates range between 4.4 and
13.8 µg C · ind-1 · d-1 when feeding on algae diets in laboratory studies (Saiz and Calbet
2007). In the present study, ingestion rates of A. tonsa (0.3 to 24.9 µg C · ind-1 · d-1 and 0.4
to 11.7 µg C · ind-1 · d-1 on the balanced nutrient and N-deficient diets, respectively) are
within the range of compiled data above, expect for the highest one (24.9 µg C · ind-1 · d-1)
at the highest food concentration on the balanced nutrient diet. The higher ingestion rate
under optimized food conditions (balanced nutrient diets at high food concentrations) in the
present study indicates food quantity and quality as important factors resulting in the high
variability of ingestion rates.
The literature review by Saiz and Calbet (2007) was restricted on the effects of body size,
temperature and food concentration and omitted other important variables such as prey
species and food quality. Therefore, we compiled newly published data for C-specific
ingestion rates of A. tonsa fed on the algal genus Rhodomonas (Table 5-5). Most
publications listed in the data compilation are not included in Saiz and Calbet (2007).
Maximum ingestion rates were obtained either from model fittings or single-point data at
the highest food concentrations. Table 5-5 shows that the parameter K in the present study
(160 and 198 µg C · L-1) is within the range in previous research (98 to 412 µg C · L-1),
while the parameter Imax is higher than those in the literature. Different K and Imax are also
evident when A. tonsa fed on another flagellate species D. tertiolecta and on mixed plankton
assemblage. Moreover, Table 5-5 shows that different models have been used in different
studies. In the present study, ingestion rates of A. tonsa on the N-deficient diet showed the
type III functional response to food concentration. This is consistent with the result in Thor
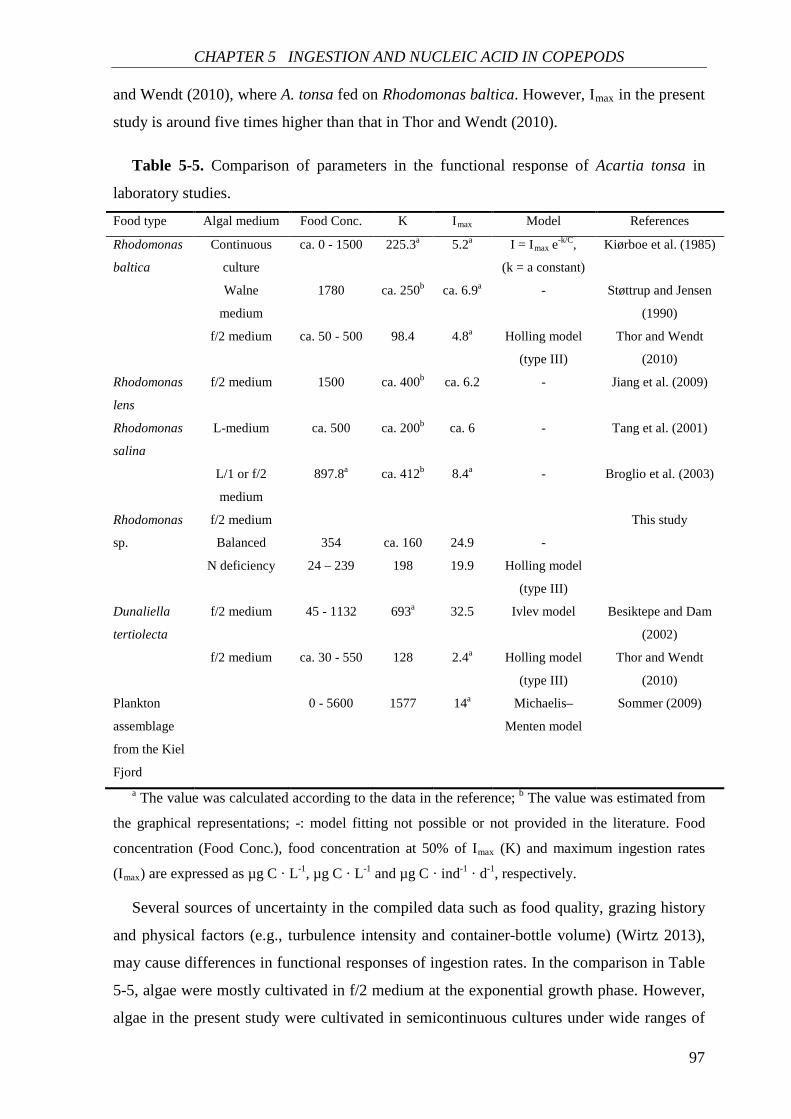
CHAPTER 5 INGESTION AND NUCLEIC ACID IN COPEPODS
97
and Wendt (2010), where A. tonsa fed on Rhodomonas baltica. However, Imax in the present
study is around five times higher than that in Thor and Wendt (2010).
Table 5-5. Comparison of parameters in the functional response of Acartia tonsa in
laboratory studies.
Food type Algal medium Food Conc. K Imax Model References
Rhodomonas
baltica
Continuous
culture
ca. 0 - 1500 225.3a 5.2a I = Imax e-k/C,
(k = a constant)
Kiørboe et al. (1985)
Walne
medium
1780 ca. 250b ca. 6.9a - Støttrup and Jensen
(1990)
f/2 medium ca. 50 - 500 98.4 4.8a Holling model
(type III)
Thor and Wendt
(2010)
Rhodomonas
lens
f/2 medium 1500 ca. 400b ca. 6.2 - Jiang et al. (2009)
Rhodomonas
salina
L-medium ca. 500 ca. 200b ca. 6 - Tang et al. (2001)
L/1 or f/2
medium
897.8a ca. 412b 8.4a - Broglio et al. (2003)
Rhodomonas
sp.
f/2 medium
Balanced
N deficiency
354
24 – 239
ca. 160
198
24.9
19.9
-
Holling model
(type III)
This study
Dunaliella
tertiolecta
f/2 medium 45 - 1132 693a 32.5 Ivlev model Besiktepe and Dam
(2002)
f/2 medium ca. 30 - 550 128 2.4a Holling model
(type III)
Thor and Wendt
(2010)
Plankton
assemblage
from the Kiel
Fjord
0 - 5600 1577 14a Michaelis–
Menten model
Sommer (2009)
a The value was calculated according to the data in the reference; b The value was estimated from
the graphical representations; -: model fitting not possible or not provided in the literature. Food
concentration (Food Conc.), food concentration at 50% of Imax (K) and maximum ingestion rates
(Imax) are expressed as µg C · L-1, µg C · L-1 and µg C · ind-1 · d-1, respectively.
Several sources of uncertainty in the compiled data such as food quality, grazing history
and physical factors (e.g., turbulence intensity and container-bottle volume) (Wirtz 2013),
may cause differences in functional responses of ingestion rates. In the comparison in Table
5-5, algae were mostly cultivated in f/2 medium at the exponential growth phase. However,
algae in the present study were cultivated in semicontinuous cultures under wide ranges of
CHAPTER 5 INGESTION AND NUCLEIC ACID IN COPEPODS
98
N:P supply ratios and growth rates. Previous chapters in this thesis have showed that N:P
supply ratios and growth rates can influence elemental and biochemical food quality of
Rhodomonas sp., which might explain different functional responses of ingestion rates
between the present study and previous research.
Responses of ingestion rates to food quantity and quality. Previous research has shown
different feeding responses of zooplankton to food quality. Some studies showed reduced
feeding of herbivores on nutrient limited algae at certain food concentrations, e.g., for
Daphnia obtusa on the P-limited Scenedesmus acutus at food concentrations 450 to 1800 µg
C · L-1 (Sterner et al. 1993), and for A. tonsa and A. clausii on the N-depleted Rhodomonas
sp. at the food concentration of 250 µg C · L-1 (Augustin and Boersma 2006). Similarly,
ingestion rates of A. tonsa in the present study were lower on the N-deficient algae at higher
food concentrations (> 150 µg C · L-1). However, at lower food concentrations (< 150 µg
C · L-1), ingestion rates of A. tonsa were higher on the N-deficient diet in the present study.
Such an increase in ingestion rates on nutrient limited diets has been also found in Daphnia
magna (Plath and Boersma 2001), and in A. tonsa and A. clausii (Augustin and Boersma
2006) at the food concentration of 500 µg C · L-1. This increase in feeding rate is referred to
as compensatory feeding that compensates for shortages of dietary essential compounds
(Fink and Von Elert 2006).
Several parameters have been considered critically in studying responses of herbivores
feeding to food quality. For example, ingestion rate was related to gut transit time to
examine the effect of food quality on feeding strategies of copepods (e.g., Tirelli and
Mayzaud 2005). It is suggested that predators may respond to low quality of food in two
opposite ways: decreasing throughput of ingested material to allow more time for food
digestion, or increasing throughput and the ingestion of the limiting nutrients (Mitra and
Flynn 2005). Moreover, food quantity may also interact with food quality. This complicated
regulation of food quantity and quality on feeding responses has recently discussed in a
modelling study (Suzuki-Ohno et al. 2012). This model shows that variable feeding
responses can be attributed to stoichiometric characteristics, digestive traits of herbivores,
and the assimilability of a given food. In the present study, the effects of food quantity and
food quality (as chemical composition of phytoplankton) were evaluated, but other
parameters such as gut transit time were not accounted for. Nevertheless, the present study
shows variable responses of ingestion rates in A. tonsa to food quantity and quality, which
contributes to the studies of feeding strategies of copepods under different food conditions.
CHAPTER 5 INGESTION AND NUCLEIC ACID IN COPEPODS
99
The limitation of ingestion rates as an indicator of egg production rates. Ingestion rate
is commonly used to indicate metabolic activity (Runge and Roff 2000). Recently, ingested
PUFAs have been suggested as indicators of food quality for egg production (Chen et al.
2012). In CHAPTER 4, egg production rates of A. tonsa were higher when feeding on the
balanced nutrient diet at food concentrations of 250 to 2500 µg C · L-1. In the present
chapter, higher ingestion rates for C, N, TFAs and ω3-PUFAs were also observed when
feeding on the balanced nutrient diet at higher food concentrations (> ca. 150 µg C · L-1).
However, ingestion rates for ω6-PUFAs were lower on the balanced nutrient diet, which
was probably caused by lower ω6-PUFA contents in the balanced nutrient diet rather than a
lower metabolic activity of copepods. Moreover, opposite responses of ingestion rates and
egg production rates to food quality were reported for both A. tonsa and A. clausii (at the
food concentration of 250 C · L-1), showing lower ingestion rates for C but higher egg
production rates when copepods fed on the N-depleted diet (Augustin and Boersma 2006).
These findings show the limitation of not only ingested elements (e.g., C) but also certain
PUFAs (e.g., ω6-PUFAs) as indicators of food quality for egg production.
Reponses of nucleic acid contents to food quantity and quality. In the present study, the
RNA content and RNA:DNA ratio of A. tonsa were higher at higher food concentrations (ca.
1000 to 2000 µg C · L-1) in each food quality treatment. This result is consistent with those
in previous research (reviewed by Gusmão and McKinnon 2011). Furthermore, hyperbolic
functional responses of RNA content and RNA:DNA ratio were recently observed in
Acartia bifilosa under different food concentrations (0 to 1200 µg C · L-1) (Holmborn et al.
2009). In their study, the RNA content and RNA:DNA ratio increased with increasing food
concentrations under non-saturating food concentrations (0 to 200 µg C · L-1), while both
response variables showed slight decreases at the highest food concentration (1200 µg C · L-
1) compared to the second highest one (600 µg C · L-1). However, the present study had too
few food concentration treatments to make precise correlations between nucleic acid indices
and food concentration.
The present study shows that the RNA content and RNA:DNA ratio in A. tonsa were
higher on the balanced nutrient diet at food concentrations of ca. 300 to 400 µg C · L-1. At
similar food concentrations (ca. 400 µg C · L-1), Malzahn and Boersma (2012) found that P-
limited prey (Rhodomonas salina) significantly reduced RNA:DNA ratios in A. tonsa. In
CHAPTER 4, the relative gross growth efficiency for C and N (and P), as well as the
relative trophic transfer efficiency of ω3- (and ω6-) PUFAs and C, were higher on the
balanced nutrient diet. Thus, the results in the present study and in Malzahn and Boersma
CHAPTER 5 INGESTION AND NUCLEIC ACID IN COPEPODS
100
(2012) support the prediction in CHAPTER 4 that the trophic transfer of elements and
essential biochemicals may predict the performance of consumers (in this case, RNA
contents and RNA:DNA ratios).
Nucleic acid contents of A. tonsa were measured at two food concentration levels in the
present study, which precludes the possibility to predict maximum RNA-based indices and
corresponding food saturation levels. This disadvantage makes it difficult to explain the
similarity of RNA content or RNA:DNA ratio between food quality treatments at higher
food concentrations. Further work is recommended to study the effect of food quality on
RNA-based indices in copepods under a wider range of food concentration.
RNA-based indices of egg production. In the present study, food quality in terms of
chemical composition of phytoplankton showed no significant effect on the relationship
between egg production and nucleic acid indices (the RNA content and RNA:DNA ratio).
This result agrees in theory with Saiz et al. (1998), who hypothesized that the slope of the
relationship between RNA content and growth rate (estimated as egg production rate)
should be uniform for a particular copepod species independent of (nutritional) food quality
and previous food history.
Overall, the RNA content and RNA:DNA ratio in the present study showed significant
positive correlations with egg production rate under the entire ranges of food quantity and
quality. This is in agreement with the increasing recognition that RNA-based indices can be
good indicators of copepod egg production (Saiz et al. 1998, Gorokhova 2003, Holmborn
and Gorokhova 2008).
ACKNOWLEDGEMENTS
We wish to thank Thomas Hansen and Cordula Meyer for technical assistance, and
Alexander Raschke and Tanya Schchipkova for their help during the experiments. For the
nucleic acid analyses, we are grateful to Catriona Clemmensen for providing access to the
laboratory facility, Carmen Arndt for help with the measurement, and Helena Hauss for
helpful advice. This study was supported by the State Sponsored Graduate Scholarship
Program, China Scholarship Council (CSC).
101
CHAPTER 6
General discussion and outlooks
Elements and biochemicals as mutual regulators of food quality
Overall, this thesis has for the first time provided empirical evidence that elemental and
biochemical limitation of phytoplankton food quality shows a mutually non-exclusive
regulation in the trophic transfer across the phytoplankton-copepods interface. This result
agrees with the recent suggestion of Winfried Lampert, who wrote “we are now on the way
to a concept incorporating both groups of resources as limiting factors” (Arts et al. 2009),
where “both groups of resources” indicates inorganic nutrient stoichiometry and essential
fatty acids.
From the stoichiometric viewpoint, the Droop model has been successfully applied to
numerous empirical data and the results in this thesis (CHAPTER 2). From biochemical
considerations, this thesis has first successfully applied Ågren’s functions to marine
phytoplankton species (CHAPTER 2). Further analyses in CHAPTER 2 have shown the
agreement of parameters between the Droop and Ågren’s functions, which indicates a
potential incorporation of elemental and biochemical food quality in marine phytoplankton.
This indication has been confirmed by the results in CHAPTER 3, showing the covariance
of nitrogen (N) cell quota (QN) and fatty acid (FA) contents under N deficiency. Therefore,
the studies in CHAPTER 2 and CHAPTER 3 are the first step to explore the mutual
regulation of elemental and biochemical food quality in the trophic interaction between
phytoplankton and copepods.
Both elemental and biochemical composition of phytoplankton have previously shown
good correlations with copepod reproduction (Jónasdóttir 1994). In CHAPTER 4, via a
different approach rather than simply comparing statistical correlations I have found that the
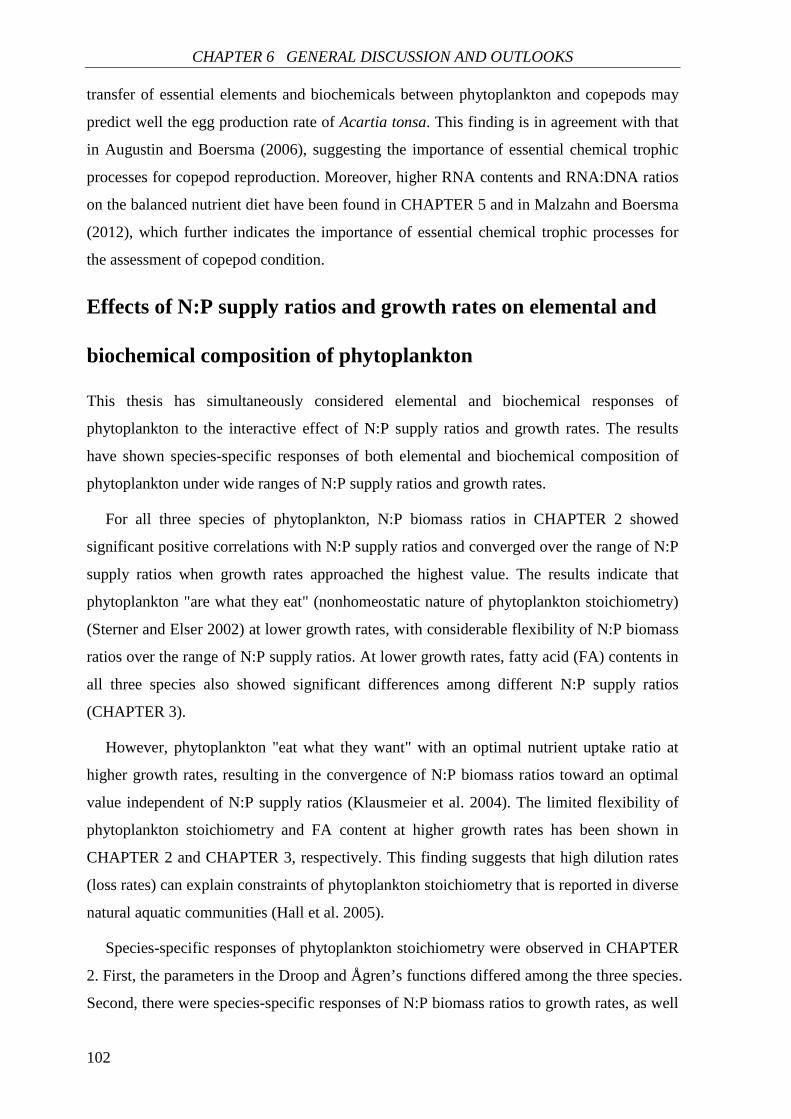
CHAPTER 6 GENERAL DISCUSSION AND OUTLOOKS
102
transfer of essential elements and biochemicals between phytoplankton and copepods may
predict well the egg production rate of Acartia tonsa. This finding is in agreement with that
in Augustin and Boersma (2006), suggesting the importance of essential chemical trophic
processes for copepod reproduction. Moreover, higher RNA contents and RNA:DNA ratios
on the balanced nutrient diet have been found in CHAPTER 5 and in Malzahn and Boersma
(2012), which further indicates the importance of essential chemical trophic processes for
the assessment of copepod condition.
Effects of N:P supply ratios and growth rates on elemental and
biochemical composition of phytoplankton
This thesis has simultaneously considered elemental and biochemical responses of
phytoplankton to the interactive effect of N:P supply ratios and growth rates. The results
have shown species-specific responses of both elemental and biochemical composition of
phytoplankton under wide ranges of N:P supply ratios and growth rates.
For all three species of phytoplankton, N:P biomass ratios in CHAPTER 2 showed
significant positive correlations with N:P supply ratios and converged over the range of N:P
supply ratios when growth rates approached the highest value. The results indicate that
phytoplankton "are what they eat" (nonhomeostatic nature of phytoplankton stoichiometry)
(Sterner and Elser 2002) at lower growth rates, with considerable flexibility of N:P biomass
ratios over the range of N:P supply ratios. At lower growth rates, fatty acid (FA) contents in
all three species also showed significant differences among different N:P supply ratios
(CHAPTER 3).
However, phytoplankton "eat what they want" with an optimal nutrient uptake ratio at
higher growth rates, resulting in the convergence of N:P biomass ratios toward an optimal
value independent of N:P supply ratios (Klausmeier et al. 2004). The limited flexibility of
phytoplankton stoichiometry and FA content at higher growth rates has been shown in
CHAPTER 2 and CHAPTER 3, respectively. This finding suggests that high dilution rates
(loss rates) can explain constraints of phytoplankton stoichiometry that is reported in diverse
natural aquatic communities (Hall et al. 2005).
Species-specific responses of phytoplankton stoichiometry were observed in CHAPTER
2. First, the parameters in the Droop and Ågren’s functions differed among the three species.
Second, there were species-specific responses of N:P biomass ratios to growth rates, as well
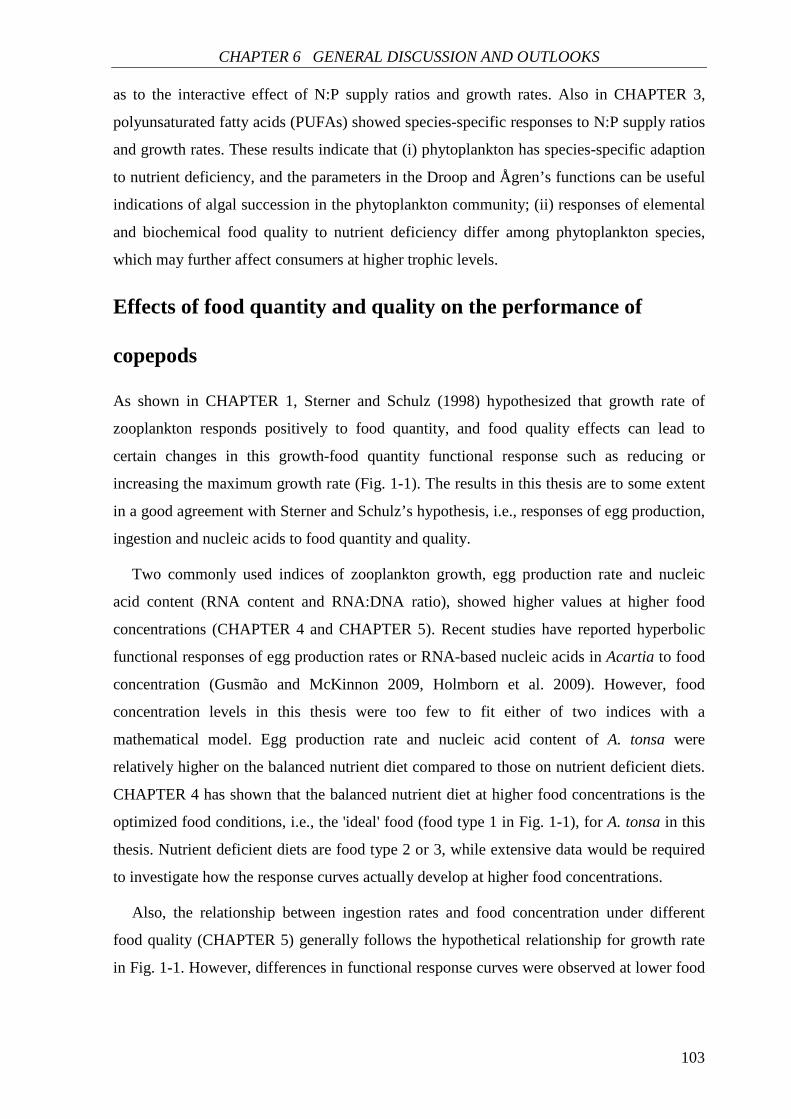
CHAPTER 6 GENERAL DISCUSSION AND OUTLOOKS
103
as to the interactive effect of N:P supply ratios and growth rates. Also in CHAPTER 3,
polyunsaturated fatty acids (PUFAs) showed species-specific responses to N:P supply ratios
and growth rates. These results indicate that (i) phytoplankton has species-specific adaption
to nutrient deficiency, and the parameters in the Droop and Ågren’s functions can be useful
indications of algal succession in the phytoplankton community; (ii) responses of elemental
and biochemical food quality to nutrient deficiency differ among phytoplankton species,
which may further affect consumers at higher trophic levels.
Effects of food quantity and quality on the performance of
copepods
As shown in CHAPTER 1, Sterner and Schulz (1998) hypothesized that growth rate of
zooplankton responds positively to food quantity, and food quality effects can lead to
certain changes in this growth-food quantity functional response such as reducing or
increasing the maximum growth rate (Fig. 1-1). The results in this thesis are to some extent
in a good agreement with Sterner and Schulz’s hypothesis, i.e., responses of egg production,
ingestion and nucleic acids to food quantity and quality.
Two commonly used indices of zooplankton growth, egg production rate and nucleic
acid content (RNA content and RNA:DNA ratio), showed higher values at higher food
concentrations (CHAPTER 4 and CHAPTER 5). Recent studies have reported hyperbolic
functional responses of egg production rates or RNA-based nucleic acids in Acartia to food
concentration (Gusmão and McKinnon 2009, Holmborn et al. 2009). However, food
concentration levels in this thesis were too few to fit either of two indices with a
mathematical model. Egg production rate and nucleic acid content of A. tonsa were
relatively higher on the balanced nutrient diet compared to those on nutrient deficient diets.
CHAPTER 4 has shown that the balanced nutrient diet at higher food concentrations is the
optimized food conditions, i.e., the 'ideal' food (food type 1 in Fig. 1-1), for A. tonsa in this
thesis. Nutrient deficient diets are food type 2 or 3, while extensive data would be required
to investigate how the response curves actually develop at higher food concentrations.
Also, the relationship between ingestion rates and food concentration under different
food quality (CHAPTER 5) generally follows the hypothetical relationship for growth rate
in Fig. 1-1. However, differences in functional response curves were observed at lower food
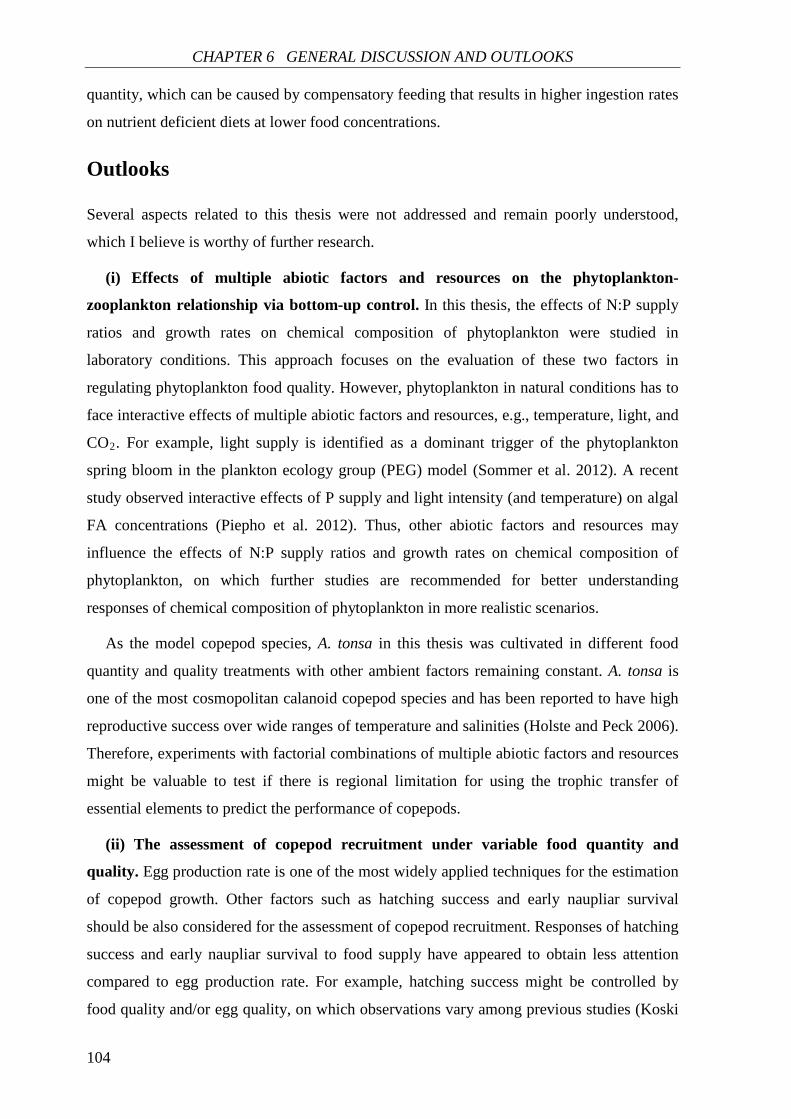
CHAPTER 6 GENERAL DISCUSSION AND OUTLOOKS
104
quantity, which can be caused by compensatory feeding that results in higher ingestion rates
on nutrient deficient diets at lower food concentrations.
Outlooks
Several aspects related to this thesis were not addressed and remain poorly understood,
which I believe is worthy of further research.
(i) Effects of multiple abiotic factors and resources on the phytoplankton-
zooplankton relationship via bottom-up control. In this thesis, the effects of N:P supply
ratios and growth rates on chemical composition of phytoplankton were studied in
laboratory conditions. This approach focuses on the evaluation of these two factors in
regulating phytoplankton food quality. However, phytoplankton in natural conditions has to
face interactive effects of multiple abiotic factors and resources, e.g., temperature, light, and
CO2. For example, light supply is identified as a dominant trigger of the phytoplankton
spring bloom in the plankton ecology group (PEG) model (Sommer et al. 2012). A recent
study observed interactive effects of P supply and light intensity (and temperature) on algal
FA concentrations (Piepho et al. 2012). Thus, other abiotic factors and resources may
influence the effects of N:P supply ratios and growth rates on chemical composition of
phytoplankton, on which further studies are recommended for better understanding
responses of chemical composition of phytoplankton in more realistic scenarios.
As the model copepod species, A. tonsa in this thesis was cultivated in different food
quantity and quality treatments with other ambient factors remaining constant. A. tonsa is
one of the most cosmopolitan calanoid copepod species and has been reported to have high
reproductive success over wide ranges of temperature and salinities (Holste and Peck 2006).
Therefore, experiments with factorial combinations of multiple abiotic factors and resources
might be valuable to test if there is regional limitation for using the trophic transfer of
essential elements to predict the performance of copepods.
(ii) The assessment of copepod recruitment under variable food quantity and
quality. Egg production rate is one of the most widely applied techniques for the estimation
of copepod growth. Other factors such as hatching success and early naupliar survival
should be also considered for the assessment of copepod recruitment. Responses of hatching
success and early naupliar survival to food supply have appeared to obtain less attention
compared to egg production rate. For example, hatching success might be controlled by
food quality and/or egg quality, on which observations vary among previous studies (Koski
CHAPTER 6 GENERAL DISCUSSION AND OUTLOOKS
105
et al. 2012 and references therein). The transfer of essential chemicals (e.g., N, P, and
PUFAs) from food via female to egg is suggested to be investigated under wide enough
ranges of food quantity and quality in further studies, which would be helpful to explore the
regulation of copepod recruitment.
(iii) Taxon-specific responses of phytoplankton and zooplankton. This thesis has
considered taxonomic comparison of phytoplankton C:N:P stoichiometry and FA
composition in response to N:P supply ratios and growth rates, but only one copepod
species has been included in studying the phytoplankton-copepods relationship. As shown
in previous research and this thesis, there are species-specific responses in phytoplankton to
various ambient factors. Moreover, taxonomy and trophic position have been suggested as
the determinant of the FA composition of zooplankton, and differences in the latter could
affect both food web structure and function (Persson and Vrede 2006). Therefore,
understanding taxon-specific responses of phytoplankton and zooplankton would be critical
to predict changes in trophic interactions between phytoplankton and zooplankton, as well
as among higher trophic levels in aquatic ecosystems.

106
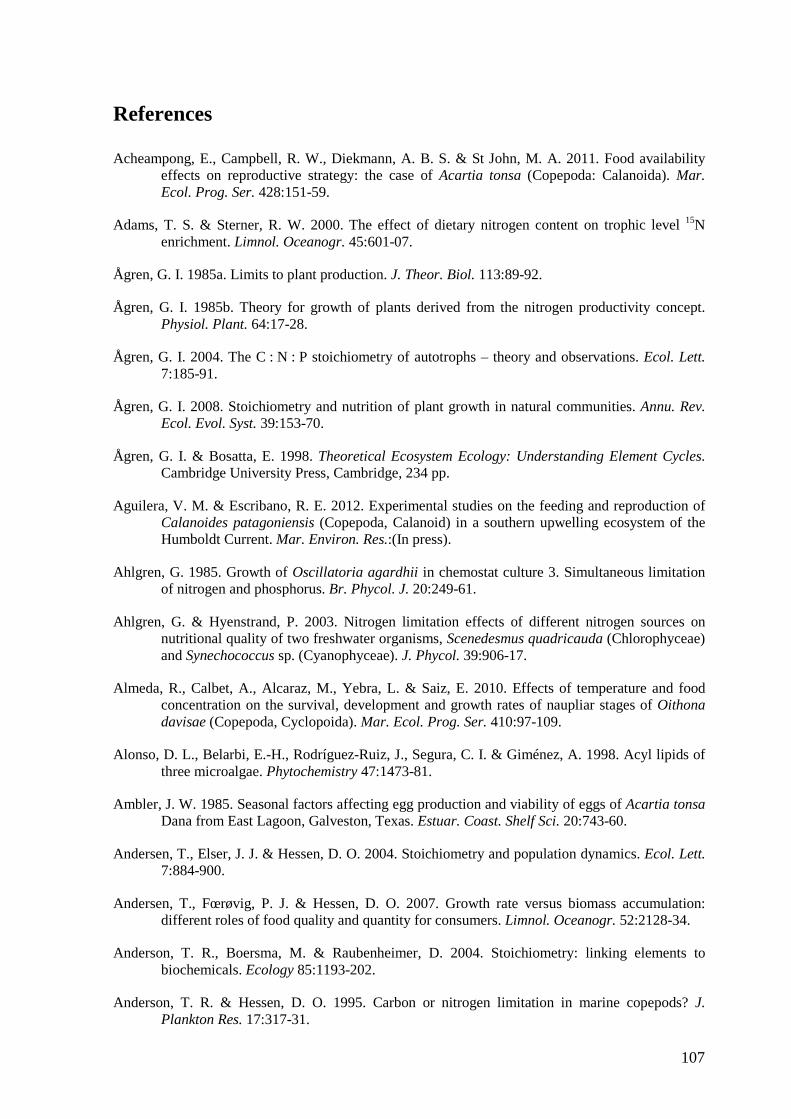
107
References
Acheampong, E., Campbell, R. W., Diekmann, A. B. S. & St John, M. A. 2011. Food availability effects on reproductive strategy: the case of Acartia tonsa (Copepoda: Calanoida). Mar. Ecol. Prog. Ser. 428:151-59.
Adams, T. S. & Sterner, R. W. 2000. The effect of dietary nitrogen content on trophic level 15N enrichment. Limnol. Oceanogr. 45:601-07.
Ågren, G. I. 1985a. Limits to plant production. J. Theor. Biol. 113:89-92.
Ågren, G. I. 1985b. Theory for growth of plants derived from the nitrogen productivity concept. Physiol. Plant. 64:17-28.
Ågren, G. I. 2004. The C : N : P stoichiometry of autotrophs – theory and observations. Ecol. Lett. 7:185-91.
Ågren, G. I. 2008. Stoichiometry and nutrition of plant growth in natural communities. Annu. Rev. Ecol. Evol. Syst. 39:153-70.
Ågren, G. I. & Bosatta, E. 1998. Theoretical Ecosystem Ecology: Understanding Element Cycles. Cambridge University Press, Cambridge, 234 pp.
Aguilera, V. M. & Escribano, R. E. 2012. Experimental studies on the feeding and reproduction of Calanoides patagoniensis (Copepoda, Calanoid) in a southern upwelling ecosystem of the Humboldt Current. Mar. Environ. Res.:(In press).
Ahlgren, G. 1985. Growth of Oscillatoria agardhii in chemostat culture 3. Simultaneous limitation of nitrogen and phosphorus. Br. Phycol. J. 20:249-61.
Ahlgren, G. & Hyenstrand, P. 2003. Nitrogen limitation effects of different nitrogen sources on nutritional quality of two freshwater organisms, Scenedesmus quadricauda (Chlorophyceae) and Synechococcus sp. (Cyanophyceae). J. Phycol. 39:906-17.
Almeda, R., Calbet, A., Alcaraz, M., Yebra, L. & Saiz, E. 2010. Effects of temperature and food concentration on the survival, development and growth rates of naupliar stages of Oithona davisae (Copepoda, Cyclopoida). Mar. Ecol. Prog. Ser. 410:97-109.
Alonso, D. L., Belarbi, E.-H., Rodríguez-Ruiz, J., Segura, C. I. & Giménez, A. 1998. Acyl lipids of three microalgae. Phytochemistry 47:1473-81.
Ambler, J. W. 1985. Seasonal factors affecting egg production and viability of eggs of Acartia tonsa Dana from East Lagoon, Galveston, Texas. Estuar. Coast. Shelf Sci. 20:743-60.
Andersen, T., Elser, J. J. & Hessen, D. O. 2004. Stoichiometry and population dynamics. Ecol. Lett. 7:884-900.
Andersen, T., Fœrøvig, P. J. & Hessen, D. O. 2007. Growth rate versus biomass accumulation: different roles of food quality and quantity for consumers. Limnol. Oceanogr. 52:2128-34.
Anderson, T. R., Boersma, M. & Raubenheimer, D. 2004. Stoichiometry: linking elements to biochemicals. Ecology 85:1193-202.
Anderson, T. R. & Hessen, D. O. 1995. Carbon or nitrogen limitation in marine copepods? J. Plankton Res. 17:317-31.
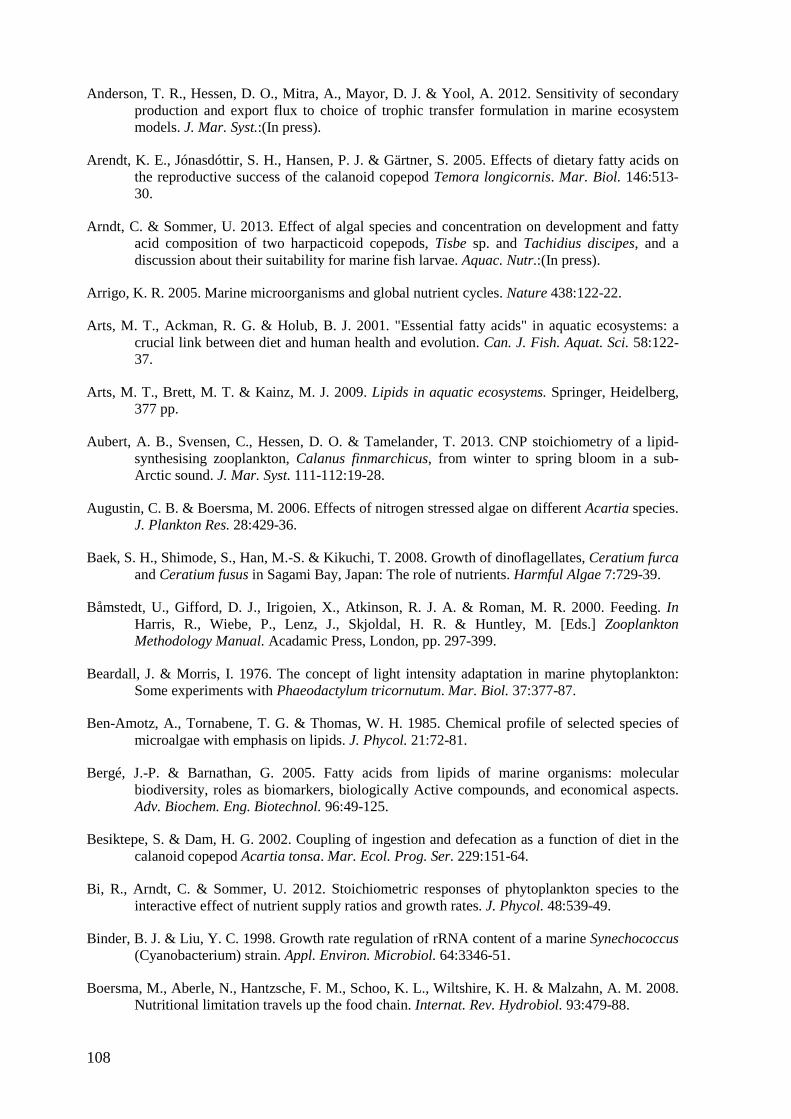
108
Anderson, T. R., Hessen, D. O., Mitra, A., Mayor, D. J. & Yool, A. 2012. Sensitivity of secondary production and export flux to choice of trophic transfer formulation in marine ecosystem models. J. Mar. Syst.:(In press).
Arendt, K. E., Jónasdóttir, S. H., Hansen, P. J. & Gärtner, S. 2005. Effects of dietary fatty acids on the reproductive success of the calanoid copepod Temora longicornis. Mar. Biol. 146:513-30.
Arndt, C. & Sommer, U. 2013. Effect of algal species and concentration on development and fatty acid composition of two harpacticoid copepods, Tisbe sp. and Tachidius discipes, and a discussion about their suitability for marine fish larvae. Aquac. Nutr.:(In press).
Arrigo, K. R. 2005. Marine microorganisms and global nutrient cycles. Nature 438:122-22.
Arts, M. T., Ackman, R. G. & Holub, B. J. 2001. "Essential fatty acids" in aquatic ecosystems: a crucial link between diet and human health and evolution. Can. J. Fish. Aquat. Sci. 58:122-37.
Arts, M. T., Brett, M. T. & Kainz, M. J. 2009. Lipids in aquatic ecosystems. Springer, Heidelberg, 377 pp.
Aubert, A. B., Svensen, C., Hessen, D. O. & Tamelander, T. 2013. CNP stoichiometry of a lipid-synthesising zooplankton, Calanus finmarchicus, from winter to spring bloom in a sub-Arctic sound. J. Mar. Syst. 111-112:19-28.
Augustin, C. B. & Boersma, M. 2006. Effects of nitrogen stressed algae on different Acartia species. J. Plankton Res. 28:429-36.
Baek, S. H., Shimode, S., Han, M.-S. & Kikuchi, T. 2008. Growth of dinoflagellates, Ceratium furca and Ceratium fusus in Sagami Bay, Japan: The role of nutrients. Harmful Algae 7:729-39.
Båmstedt, U., Gifford, D. J., Irigoien, X., Atkinson, R. J. A. & Roman, M. R. 2000. Feeding. In Harris, R., Wiebe, P., Lenz, J., Skjoldal, H. R. & Huntley, M. [Eds.] Zooplankton Methodology Manual. Acadamic Press, London, pp. 297-399.
Beardall, J. & Morris, I. 1976. The concept of light intensity adaptation in marine phytoplankton: Some experiments with Phaeodactylum tricornutum. Mar. Biol. 37:377-87.
Ben-Amotz, A., Tornabene, T. G. & Thomas, W. H. 1985. Chemical profile of selected species of microalgae with emphasis on lipids. J. Phycol. 21:72-81.
Bergé, J.-P. & Barnathan, G. 2005. Fatty acids from lipids of marine organisms: molecular biodiversity, roles as biomarkers, biologically Active compounds, and economical aspects. Adv. Biochem. Eng. Biotechnol. 96:49-125.
Besiktepe, S. & Dam, H. G. 2002. Coupling of ingestion and defecation as a function of diet in the calanoid copepod Acartia tonsa. Mar. Ecol. Prog. Ser. 229:151-64.
Bi, R., Arndt, C. & Sommer, U. 2012. Stoichiometric responses of phytoplankton species to the interactive effect of nutrient supply ratios and growth rates. J. Phycol. 48:539-49.
Binder, B. J. & Liu, Y. C. 1998. Growth rate regulation of rRNA content of a marine Synechococcus (Cyanobacterium) strain. Appl. Environ. Microbiol. 64:3346-51.
Boersma, M., Aberle, N., Hantzsche, F. M., Schoo, K. L., Wiltshire, K. H. & Malzahn, A. M. 2008. Nutritional limitation travels up the food chain. Internat. Rev. Hydrobiol. 93:479-88.
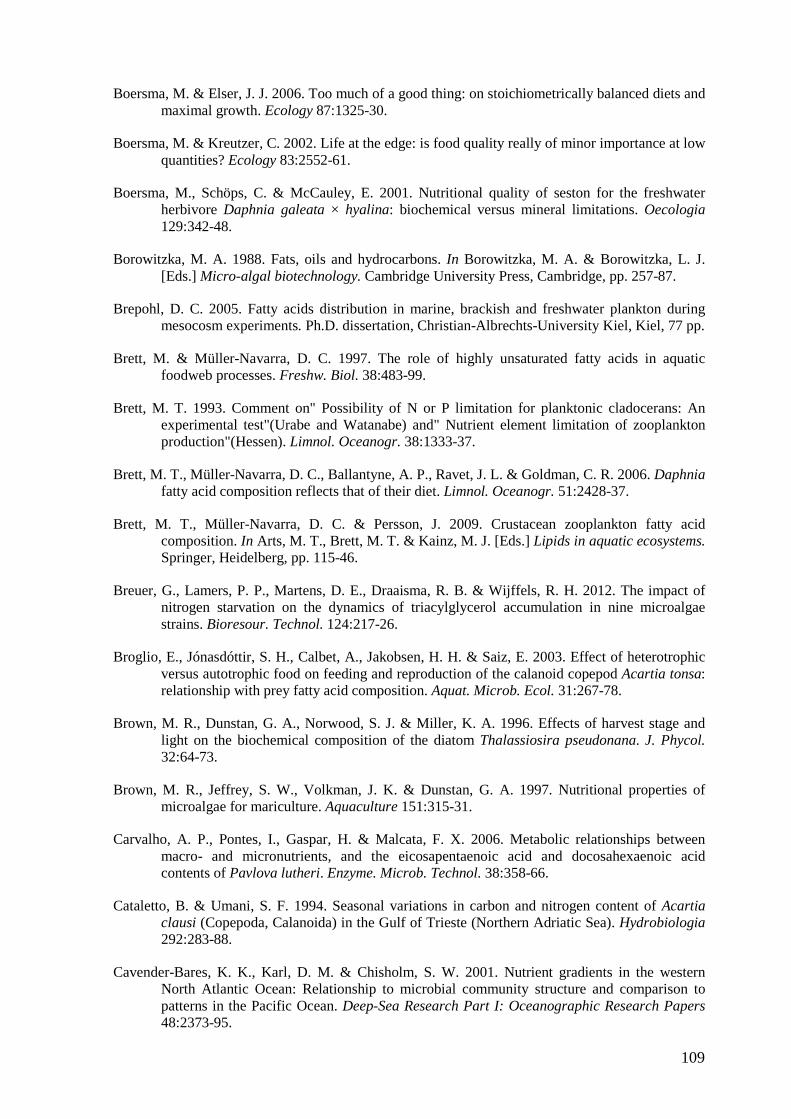
109
Boersma, M. & Elser, J. J. 2006. Too much of a good thing: on stoichiometrically balanced diets and maximal growth. Ecology 87:1325-30.
Boersma, M. & Kreutzer, C. 2002. Life at the edge: is food quality really of minor importance at low quantities? Ecology 83:2552-61.
Boersma, M., Schöps, C. & McCauley, E. 2001. Nutritional quality of seston for the freshwater herbivore Daphnia galeata × hyalina: biochemical versus mineral limitations. Oecologia 129:342-48.
Borowitzka, M. A. 1988. Fats, oils and hydrocarbons. In Borowitzka, M. A. & Borowitzka, L. J. [Eds.] Micro-algal biotechnology. Cambridge University Press, Cambridge, pp. 257-87.
Brepohl, D. C. 2005. Fatty acids distribution in marine, brackish and freshwater plankton during mesocosm experiments. Ph.D. dissertation, Christian-Albrechts-University Kiel, Kiel, 77 pp.
Brett, M. & Müller-Navarra, D. C. 1997. The role of highly unsaturated fatty acids in aquatic foodweb processes. Freshw. Biol. 38:483-99.
Brett, M. T. 1993. Comment on" Possibility of N or P limitation for planktonic cladocerans: An experimental test"(Urabe and Watanabe) and" Nutrient element limitation of zooplankton production"(Hessen). Limnol. Oceanogr. 38:1333-37.
Brett, M. T., Müller-Navarra, D. C., Ballantyne, A. P., Ravet, J. L. & Goldman, C. R. 2006. Daphnia fatty acid composition reflects that of their diet. Limnol. Oceanogr. 51:2428-37.
Brett, M. T., Müller-Navarra, D. C. & Persson, J. 2009. Crustacean zooplankton fatty acid composition. In Arts, M. T., Brett, M. T. & Kainz, M. J. [Eds.] Lipids in aquatic ecosystems. Springer, Heidelberg, pp. 115-46.
Breuer, G., Lamers, P. P., Martens, D. E., Draaisma, R. B. & Wijffels, R. H. 2012. The impact of nitrogen starvation on the dynamics of triacylglycerol accumulation in nine microalgae strains. Bioresour. Technol. 124:217-26.
Broglio, E., Jónasdóttir, S. H., Calbet, A., Jakobsen, H. H. & Saiz, E. 2003. Effect of heterotrophic versus autotrophic food on feeding and reproduction of the calanoid copepod Acartia tonsa: relationship with prey fatty acid composition. Aquat. Microb. Ecol. 31:267-78.
Brown, M. R., Dunstan, G. A., Norwood, S. J. & Miller, K. A. 1996. Effects of harvest stage and light on the biochemical composition of the diatom Thalassiosira pseudonana. J. Phycol. 32:64-73.
Brown, M. R., Jeffrey, S. W., Volkman, J. K. & Dunstan, G. A. 1997. Nutritional properties of microalgae for mariculture. Aquaculture 151:315-31.
Carvalho, A. P., Pontes, I., Gaspar, H. & Malcata, F. X. 2006. Metabolic relationships between macro- and micronutrients, and the eicosapentaenoic acid and docosahexaenoic acid contents of Pavlova lutheri. Enzyme. Microb. Technol. 38:358-66.
Cataletto, B. & Umani, S. F. 1994. Seasonal variations in carbon and nitrogen content of Acartia clausi (Copepoda, Calanoida) in the Gulf of Trieste (Northern Adriatic Sea). Hydrobiologia 292:283-88.
Cavender-Bares, K. K., Karl, D. M. & Chisholm, S. W. 2001. Nutrient gradients in the western North Atlantic Ocean: Relationship to microbial community structure and comparison to patterns in the Pacific Ocean. Deep-Sea Research Part I: Oceanographic Research Papers 48:2373-95.
110
Checkley, D. M. 1980. The egg production of a marine planktonic copepod in relation to its food supply: Laboratory studies. Limnol. Oceanogr. 25:430-46.
Chen, M. R., Liu, H. B. & Chen, B. Z. 2012. Effects of dietary essential fatty acids on reproduction rates of a subtropical calanoid copepod, Acartia erythraea. Mar. Ecol. Prog. Ser. 455:95-110.
Chen, X., Wakeham, S. G. & Fisher, N. S. 2011. Influence of iron on fatty acid and sterol composition of marine phytoplankton and copepod consumers. Limnol. Oceanogr. 56:716-24.
Cherif, M. & Loreau, M. 2010. Towards a more biologically realistic use of Droop's equations to model growth under multiple nutrient limitation. Oikos 119:897-907.
Clarke, K. & Gorley, R. 2006. PRIMER v6: User manual/tutorial. PRIMER-E, Plymouth, 190 pp.
Cohen, Z., Khozin-Goldberg, I., Adlerstein, D. & Bigogno, C. 2000. The role of triacylglycerol as a reservoir of polyunsaturated fatty acids for the rapid production of chloroplastic lipids in certain microalgae. Biochem. Soc. Trans. 28:740-43.
Cohen, Z., Vonshak, A. & Richmond, A. 1988. Effect of environmental conditions on fatty acid composition of the red alga Porphyridium cruentum: correlation to growth rate. J. Phycol. 24:328-32.
Conley, D. J., Paerl, H. W., Howarth, R. W., Boesch, D. F., Seitzinger, S. P., Havens, K. E., Lancelot, C. & Likens, G. E. 2009. Controlling eutrophication: nitrogen and phosphorus. Science 323:1014-15.
Dalsgaard, J., St. John, M., Kattner, G., Müller-Navarra, D. & Hagen, W. 2003. Fatty acid trophic markers in the pelagic marine environment. Adv. Mar. Biol. 46:225-340.
Diekmann, A. B. S., Peck, M. A., Holste, L., St John, M. A. & Campbell, R. W. 2009. Variation in diatom biochemical composition during a simulated bloom and its effect on copepod production. J. Plankton Res. 31:1391-405.
Downing, J. A. 1997. Marine nitrogen: Phosphorus stoichiometry and the global N:P cycle. Biogeochemistry 37:237-52.
Droop, M. R. 1973. Some thoughts on nutrient limitation in algae. J. Phycol. 9:264-72.
Droop, M. R. 1983. 25 years of algal growth kinetics. Bot. Mar. 26:99-112.
Droop, M. R. 2003. In defence of the Cell Quota model of micro-algal growth. J. Plankton Res. 25:103-07.
Ducobu, H., Huisman, J., Jonker, R. R. & Mur, L. R. 1998. Competition between a prochlorophyte and a cyanobacterium under various phosphorus regimes: comparison with the droop model. J. Phycol. 34:467-76.
Dunstan, G. A., Volkman, J. K., Barrett, S. M. & Garland, C. D. 1993. Changes in the lipid composition and maximisation of the polyunsaturated fatty acid content of three microalgae grown in mass culture. J. Appl. Phycol. 5:71-83.
Elrifi, I. R. & Turpin, D. H. 1985. Steady-state luxury consumption and the concept of optimum nutrient ratios: A study with phosphate and nitrate limited Selenastrum minutum (Chlorophyta). J. Phycol. 21:592-602.
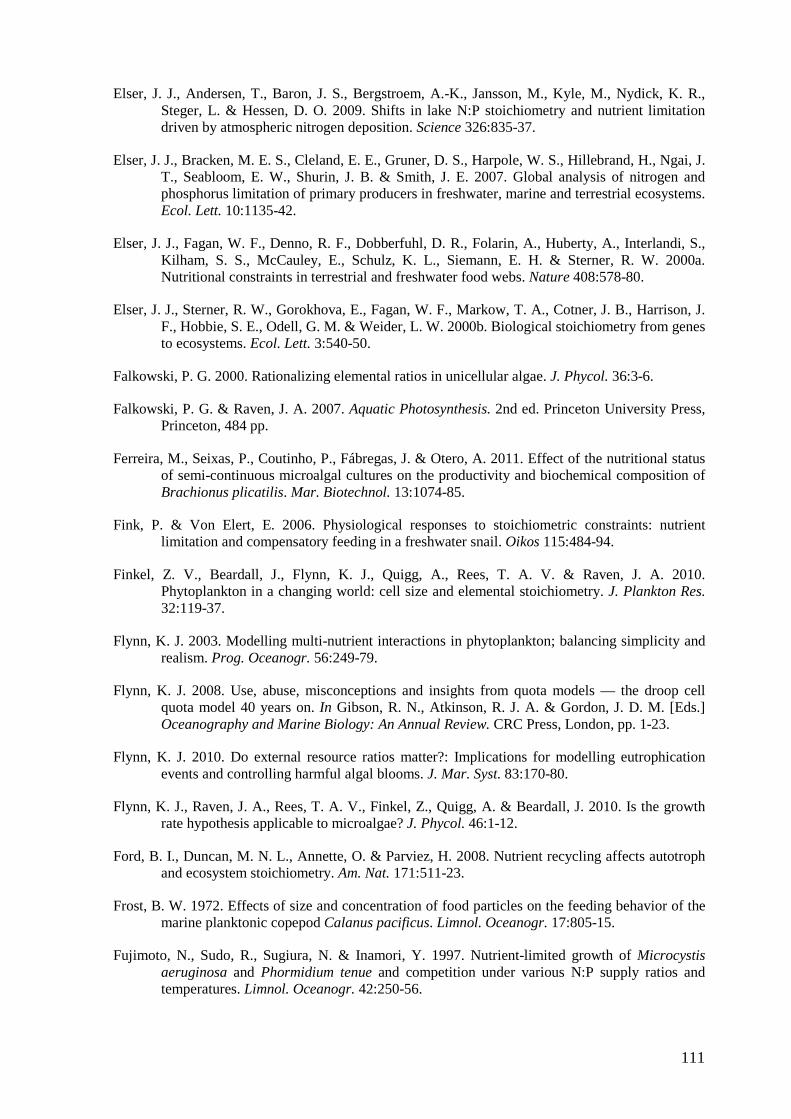
111
Elser, J. J., Andersen, T., Baron, J. S., Bergstroem, A.-K., Jansson, M., Kyle, M., Nydick, K. R., Steger, L. & Hessen, D. O. 2009. Shifts in lake N:P stoichiometry and nutrient limitation driven by atmospheric nitrogen deposition. Science 326:835-37.
Elser, J. J., Bracken, M. E. S., Cleland, E. E., Gruner, D. S., Harpole, W. S., Hillebrand, H., Ngai, J. T., Seabloom, E. W., Shurin, J. B. & Smith, J. E. 2007. Global analysis of nitrogen and phosphorus limitation of primary producers in freshwater, marine and terrestrial ecosystems. Ecol. Lett. 10:1135-42.
Elser, J. J., Fagan, W. F., Denno, R. F., Dobberfuhl, D. R., Folarin, A., Huberty, A., Interlandi, S., Kilham, S. S., McCauley, E., Schulz, K. L., Siemann, E. H. & Sterner, R. W. 2000a. Nutritional constraints in terrestrial and freshwater food webs. Nature 408:578-80.
Elser, J. J., Sterner, R. W., Gorokhova, E., Fagan, W. F., Markow, T. A., Cotner, J. B., Harrison, J. F., Hobbie, S. E., Odell, G. M. & Weider, L. W. 2000b. Biological stoichiometry from genes to ecosystems. Ecol. Lett. 3:540-50.
Falkowski, P. G. 2000. Rationalizing elemental ratios in unicellular algae. J. Phycol. 36:3-6.
Falkowski, P. G. & Raven, J. A. 2007. Aquatic Photosynthesis. 2nd ed. Princeton University Press, Princeton, 484 pp.
Ferreira, M., Seixas, P., Coutinho, P., Fábregas, J. & Otero, A. 2011. Effect of the nutritional status of semi-continuous microalgal cultures on the productivity and biochemical composition of Brachionus plicatilis. Mar. Biotechnol. 13:1074-85.
Fink, P. & Von Elert, E. 2006. Physiological responses to stoichiometric constraints: nutrient limitation and compensatory feeding in a freshwater snail. Oikos 115:484-94.
Finkel, Z. V., Beardall, J., Flynn, K. J., Quigg, A., Rees, T. A. V. & Raven, J. A. 2010. Phytoplankton in a changing world: cell size and elemental stoichiometry. J. Plankton Res. 32:119-37.
Flynn, K. J. 2003. Modelling multi-nutrient interactions in phytoplankton; balancing simplicity and realism. Prog. Oceanogr. 56:249-79.
Flynn, K. J. 2008. Use, abuse, misconceptions and insights from quota models — the droop cell quota model 40 years on. In Gibson, R. N., Atkinson, R. J. A. & Gordon, J. D. M. [Eds.] Oceanography and Marine Biology: An Annual Review. CRC Press, London, pp. 1-23.
Flynn, K. J. 2010. Do external resource ratios matter?: Implications for modelling eutrophication events and controlling harmful algal blooms. J. Mar. Syst. 83:170-80.
Flynn, K. J., Raven, J. A., Rees, T. A. V., Finkel, Z., Quigg, A. & Beardall, J. 2010. Is the growth rate hypothesis applicable to microalgae? J. Phycol. 46:1-12.
Ford, B. I., Duncan, M. N. L., Annette, O. & Parviez, H. 2008. Nutrient recycling affects autotroph and ecosystem stoichiometry. Am. Nat. 171:511-23.
Frost, B. W. 1972. Effects of size and concentration of food particles on the feeding behavior of the marine planktonic copepod Calanus pacificus. Limnol. Oceanogr. 17:805-15.
Fujimoto, N., Sudo, R., Sugiura, N. & Inamori, Y. 1997. Nutrient-limited growth of Microcystis aeruginosa and Phormidium tenue and competition under various N:P supply ratios and temperatures. Limnol. Oceanogr. 42:250-56.
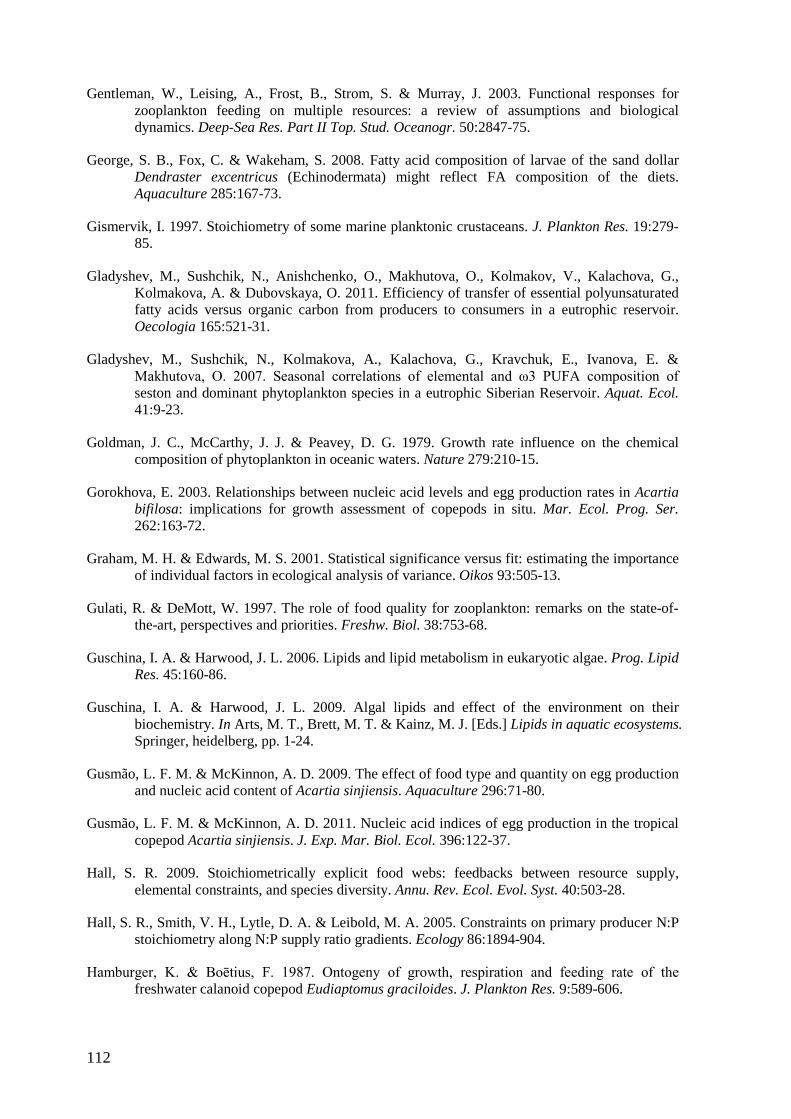
112
Gentleman, W., Leising, A., Frost, B., Strom, S. & Murray, J. 2003. Functional responses for zooplankton feeding on multiple resources: a review of assumptions and biological dynamics. Deep-Sea Res. Part II Top. Stud. Oceanogr. 50:2847-75.
George, S. B., Fox, C. & Wakeham, S. 2008. Fatty acid composition of larvae of the sand dollar Dendraster excentricus (Echinodermata) might reflect FA composition of the diets. Aquaculture 285:167-73.
Gismervik, I. 1997. Stoichiometry of some marine planktonic crustaceans. J. Plankton Res. 19:279-85.
Gladyshev, M., Sushchik, N., Anishchenko, O., Makhutova, O., Kolmakov, V., Kalachova, G., Kolmakova, A. & Dubovskaya, O. 2011. Efficiency of transfer of essential polyunsaturated fatty acids versus organic carbon from producers to consumers in a eutrophic reservoir. Oecologia 165:521-31.
Gladyshev, M., Sushchik, N., Kolmakova, A., Kalachova, G., Kravchuk, E., Ivanova, E. & Makhutova, O. 2007. Seasonal correlations of elemental and ω3 PUFA composition of seston and dominant phytoplankton species in a eutrophic Siberian Reservoir. Aquat. Ecol. 41:9-23.
Goldman, J. C., McCarthy, J. J. & Peavey, D. G. 1979. Growth rate influence on the chemical composition of phytoplankton in oceanic waters. Nature 279:210-15.
Gorokhova, E. 2003. Relationships between nucleic acid levels and egg production rates in Acartia bifilosa: implications for growth assessment of copepods in situ. Mar. Ecol. Prog. Ser. 262:163-72.
Graham, M. H. & Edwards, M. S. 2001. Statistical significance versus fit: estimating the importance of individual factors in ecological analysis of variance. Oikos 93:505-13.
Gulati, R. & DeMott, W. 1997. The role of food quality for zooplankton: remarks on the state-of-the-art, perspectives and priorities. Freshw. Biol. 38:753-68.
Guschina, I. A. & Harwood, J. L. 2006. Lipids and lipid metabolism in eukaryotic algae. Prog. Lipid Res. 45:160-86.
Guschina, I. A. & Harwood, J. L. 2009. Algal lipids and effect of the environment on their biochemistry. In Arts, M. T., Brett, M. T. & Kainz, M. J. [Eds.] Lipids in aquatic ecosystems. Springer, heidelberg, pp. 1-24.
Gusmão, L. F. M. & McKinnon, A. D. 2009. The effect of food type and quantity on egg production and nucleic acid content of Acartia sinjiensis. Aquaculture 296:71-80.
Gusmão, L. F. M. & McKinnon, A. D. 2011. Nucleic acid indices of egg production in the tropical copepod Acartia sinjiensis. J. Exp. Mar. Biol. Ecol. 396:122-37.
Hall, S. R. 2009. Stoichiometrically explicit food webs: feedbacks between resource supply, elemental constraints, and species diversity. Annu. Rev. Ecol. Evol. Syst. 40:503-28.
Hall, S. R., Smith, V. H., Lytle, D. A. & Leibold, M. A. 2005. Constraints on primary producer N:P stoichiometry along N:P supply ratio gradients. Ecology 86:1894-904.
Hamburger, K. & Boētius, F. 1987. Ontogeny of growth, respiration and feeding rate of the freshwater calanoid copepod Eudiaptomus graciloides. J. Plankton Res. 9:589-606.
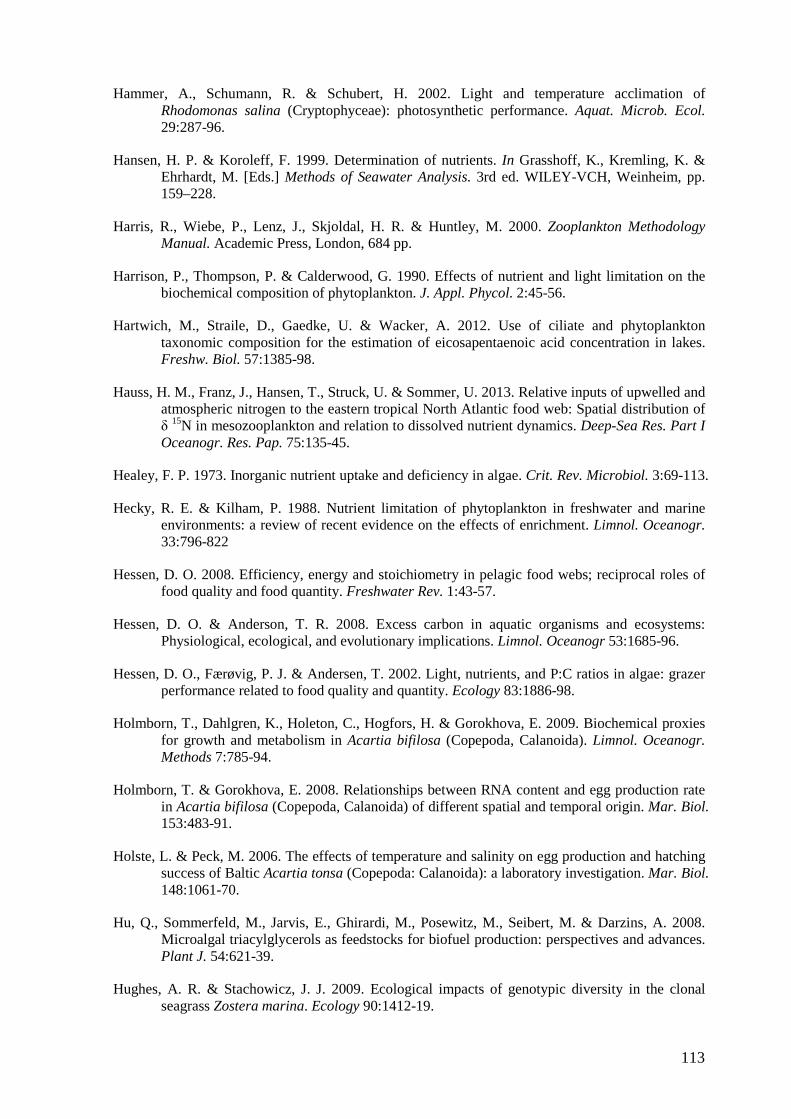
113
Hammer, A., Schumann, R. & Schubert, H. 2002. Light and temperature acclimation of Rhodomonas salina (Cryptophyceae): photosynthetic performance. Aquat. Microb. Ecol. 29:287-96.
Hansen, H. P. & Koroleff, F. 1999. Determination of nutrients. In Grasshoff, K., Kremling, K. & Ehrhardt, M. [Eds.] Methods of Seawater Analysis. 3rd ed. WILEY-VCH, Weinheim, pp. 159–228.
Harris, R., Wiebe, P., Lenz, J., Skjoldal, H. R. & Huntley, M. 2000. Zooplankton Methodology Manual. Academic Press, London, 684 pp.
Harrison, P., Thompson, P. & Calderwood, G. 1990. Effects of nutrient and light limitation on the biochemical composition of phytoplankton. J. Appl. Phycol. 2:45-56.
Hartwich, M., Straile, D., Gaedke, U. & Wacker, A. 2012. Use of ciliate and phytoplankton taxonomic composition for the estimation of eicosapentaenoic acid concentration in lakes. Freshw. Biol. 57:1385-98.
Hauss, H. M., Franz, J., Hansen, T., Struck, U. & Sommer, U. 2013. Relative inputs of upwelled and atmospheric nitrogen to the eastern tropical North Atlantic food web: Spatial distribution of δ 15N in mesozooplankton and relation to dissolved nutrient dynamics. Deep-Sea Res. Part I Oceanogr. Res. Pap. 75:135-45.
Healey, F. P. 1973. Inorganic nutrient uptake and deficiency in algae. Crit. Rev. Microbiol. 3:69-113.
Hecky, R. E. & Kilham, P. 1988. Nutrient limitation of phytoplankton in freshwater and marine environments: a review of recent evidence on the effects of enrichment. Limnol. Oceanogr. 33:796-822
Hessen, D. O. 2008. Efficiency, energy and stoichiometry in pelagic food webs; reciprocal roles of food quality and food quantity. Freshwater Rev. 1:43-57.
Hessen, D. O. & Anderson, T. R. 2008. Excess carbon in aquatic organisms and ecosystems: Physiological, ecological, and evolutionary implications. Limnol. Oceanogr 53:1685-96.
Hessen, D. O., Færøvig, P. J. & Andersen, T. 2002. Light, nutrients, and P:C ratios in algae: grazer performance related to food quality and quantity. Ecology 83:1886-98.
Holmborn, T., Dahlgren, K., Holeton, C., Hogfors, H. & Gorokhova, E. 2009. Biochemical proxies for growth and metabolism in Acartia bifilosa (Copepoda, Calanoida). Limnol. Oceanogr. Methods 7:785-94.
Holmborn, T. & Gorokhova, E. 2008. Relationships between RNA content and egg production rate in Acartia bifilosa (Copepoda, Calanoida) of different spatial and temporal origin. Mar. Biol. 153:483-91.
Holste, L. & Peck, M. 2006. The effects of temperature and salinity on egg production and hatching success of Baltic Acartia tonsa (Copepoda: Calanoida): a laboratory investigation. Mar. Biol. 148:1061-70.
Hu, Q., Sommerfeld, M., Jarvis, E., Ghirardi, M., Posewitz, M., Seibert, M. & Darzins, A. 2008. Microalgal triacylglycerols as feedstocks for biofuel production: perspectives and advances. Plant J. 54:621-39.
Hughes, A. R. & Stachowicz, J. J. 2009. Ecological impacts of genotypic diversity in the clonal seagrass Zostera marina. Ecology 90:1412-19.
114
Huntley, M. & Boyd, C. 1984. Food-limited growth of marine zooplankton. American Naturalist:455-78.
Imai, I., Yamaguchi, M. & Hori, Y. 2006. Eutrophication and occurrences of harmful algal blooms in the Seto Inland Sea, Japan. Plankton Benthos Res. 1:71-84.
Ismar, S. M. H., Hansen, T. & Sommer, U. 2008. Effect of food concentration and type of diet on Acartia survival and naupliar development. Mar. Biol. 154:335-43.
Jiang, H. & Gao, K. 2004. Effects of lowering temperature during culture on the production of polyunsaturated fatty acids in the marine diatom Phaeodactylum tricornutum (Bacillariophyceae). J. Phycol. 40:651-54.
Jiang, X., Tang, Y. Z., Lonsdale, D. J. & Gobler, C. J. 2009. Deleterious consequences of a red tide dinoflagellate Cochlodinium polykrikoides for the calanoid copepod Acartia tonsa. Mar. Ecol. Prog. Ser. 390:105-16.
Jónasdóttir, S. H. 1994. Effects of food quality on the reproductive success of Acartia tonsa and Acartia hudsonica: laboratory observations. Mar. Biol. 121:67-81.
Jónasdóttir, S. H., Fields, D. & Pantoja, S. 1995. Copepod egg production in Long Island Sound, USA, as a function of the chemical composition of seston. Mar. Ecol. Prog. Ser. 119:87-98.
Jones, R. H., Flynn, K. J. & Anderson, T. R. 2002. Effect of food quality on carbon and nitrogen growth efficiency in the copepod Acartia tonsa. Mar. Ecol. Prog. Ser. 235:147-56.
Kainz, M., Arts, M. T. & Mazumder, A. 2004. Essential fatty acids in the planktonic food web and their ecological role for higher trophic levels. Limnol. Oceanogr. 49:1784-93.
Karl, D. M., Tien, G., Dore, J. & Winn, C. D. 1993. Total dissolved nitrogen and phosphorus concentrations at US-JGOFS station ALOHA: Redfield reconciliation. Mar. Chem. 41:203-08.
Katechakis, A., Stibor, H., Sommer, U. & Hansen, T. 2004. Feeding selectivities and food niche separation of Acartia clausi, Penilia avirostris (Crustacea) and Doliolum denticulatum (Thaliacea) in Blanes Bay (Catalan Sea, NW Mediterranean). J. Plankton Res. 26:589-603.
Kelly, J. R. & Scheibling, R. E. 2012. Fatty acids as dietary tracers in benthic food webs. Mar. Ecol. Prog. Ser. 446:1-22.
Khozin-Goldberg, I., Bigogno, C., Shrestha, P. & Cohen, Z. 2002. Nitrogen starvation induces the accumulation of arachidonic acid in the freshwater green Alga Parietochloris incisa (Trebuxiophyceae). J. Phycol. 38:991-94.
Kiørboe, T. 1989. Phytoplankton growth rate and nitrogen content: implications for feeding and fecundity in a herbivorous copepod. Mar. Ecol. Prog. Ser. 55:229-34.
Kiørboe, T., Møhlenberg, F. & Hamburger, K. 1985. Bioenergetics of the planktonic copepod Acartia tonsa: relation between feeding, egg production and respiration, and composition of specific dynamic action. Mar. Ecol. Prog. Ser. 26:85-97.
Klausmeier, C. A., Litchman, E., Daufresne, T. & Levin, S. A. 2008. Phytoplankton stoichiometry. Ecol. Res. 23:479-85.
Klausmeier, C. A., Litchman, E. & Levin, S. A. 2004. Phytoplankton growth and stoichiometry under multiple nutrient limitation. Limnol. Oceanogr. 49:1463-70.
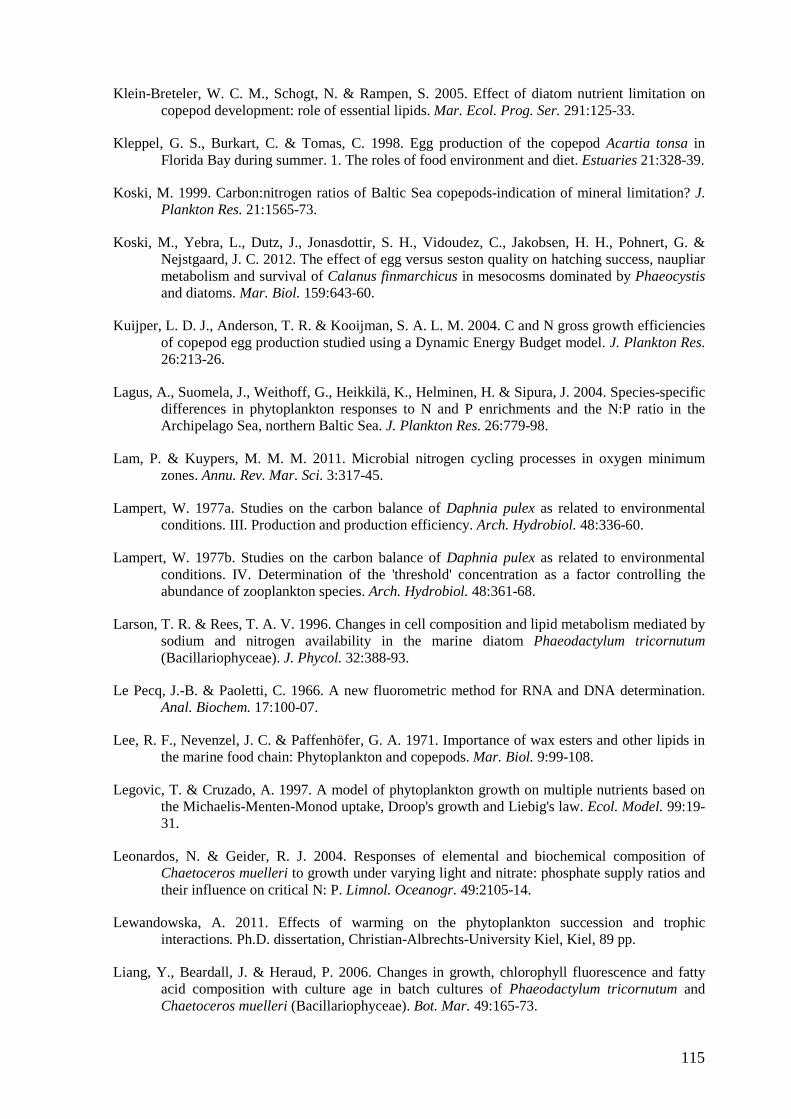
115
Klein-Breteler, W. C. M., Schogt, N. & Rampen, S. 2005. Effect of diatom nutrient limitation on copepod development: role of essential lipids. Mar. Ecol. Prog. Ser. 291:125-33.
Kleppel, G. S., Burkart, C. & Tomas, C. 1998. Egg production of the copepod Acartia tonsa in Florida Bay during summer. 1. The roles of food environment and diet. Estuaries 21:328-39.
Koski, M. 1999. Carbon:nitrogen ratios of Baltic Sea copepods-indication of mineral limitation? J. Plankton Res. 21:1565-73.
Koski, M., Yebra, L., Dutz, J., Jonasdottir, S. H., Vidoudez, C., Jakobsen, H. H., Pohnert, G. & Nejstgaard, J. C. 2012. The effect of egg versus seston quality on hatching success, naupliar metabolism and survival of Calanus finmarchicus in mesocosms dominated by Phaeocystis and diatoms. Mar. Biol. 159:643-60.
Kuijper, L. D. J., Anderson, T. R. & Kooijman, S. A. L. M. 2004. C and N gross growth efficiencies of copepod egg production studied using a Dynamic Energy Budget model. J. Plankton Res. 26:213-26.
Lagus, A., Suomela, J., Weithoff, G., Heikkilä, K., Helminen, H. & Sipura, J. 2004. Species-specific differences in phytoplankton responses to N and P enrichments and the N:P ratio in the Archipelago Sea, northern Baltic Sea. J. Plankton Res. 26:779-98.
Lam, P. & Kuypers, M. M. M. 2011. Microbial nitrogen cycling processes in oxygen minimum zones. Annu. Rev. Mar. Sci. 3:317-45.
Lampert, W. 1977a. Studies on the carbon balance of Daphnia pulex as related to environmental conditions. III. Production and production efficiency. Arch. Hydrobiol. 48:336-60.
Lampert, W. 1977b. Studies on the carbon balance of Daphnia pulex as related to environmental conditions. IV. Determination of the 'threshold' concentration as a factor controlling the abundance of zooplankton species. Arch. Hydrobiol. 48:361-68.
Larson, T. R. & Rees, T. A. V. 1996. Changes in cell composition and lipid metabolism mediated by sodium and nitrogen availability in the marine diatom Phaeodactylum tricornutum (Bacillariophyceae). J. Phycol. 32:388-93.
Le Pecq, J.-B. & Paoletti, C. 1966. A new fluorometric method for RNA and DNA determination. Anal. Biochem. 17:100-07.
Lee, R. F., Nevenzel, J. C. & Paffenhöfer, G. A. 1971. Importance of wax esters and other lipids in the marine food chain: Phytoplankton and copepods. Mar. Biol. 9:99-108.
Legovic, T. & Cruzado, A. 1997. A model of phytoplankton growth on multiple nutrients based on the Michaelis-Menten-Monod uptake, Droop's growth and Liebig's law. Ecol. Model. 99:19-31.
Leonardos, N. & Geider, R. J. 2004. Responses of elemental and biochemical composition of Chaetoceros muelleri to growth under varying light and nitrate: phosphate supply ratios and their influence on critical N: P. Limnol. Oceanogr. 49:2105-14.
Lewandowska, A. 2011. Effects of warming on the phytoplankton succession and trophic interactions. Ph.D. dissertation, Christian-Albrechts-University Kiel, Kiel, 89 pp.
Liang, Y., Beardall, J. & Heraud, P. 2006. Changes in growth, chlorophyll fluorescence and fatty acid composition with culture age in batch cultures of Phaeodactylum tricornutum and Chaetoceros muelleri (Bacillariophyceae). Bot. Mar. 49:165-73.
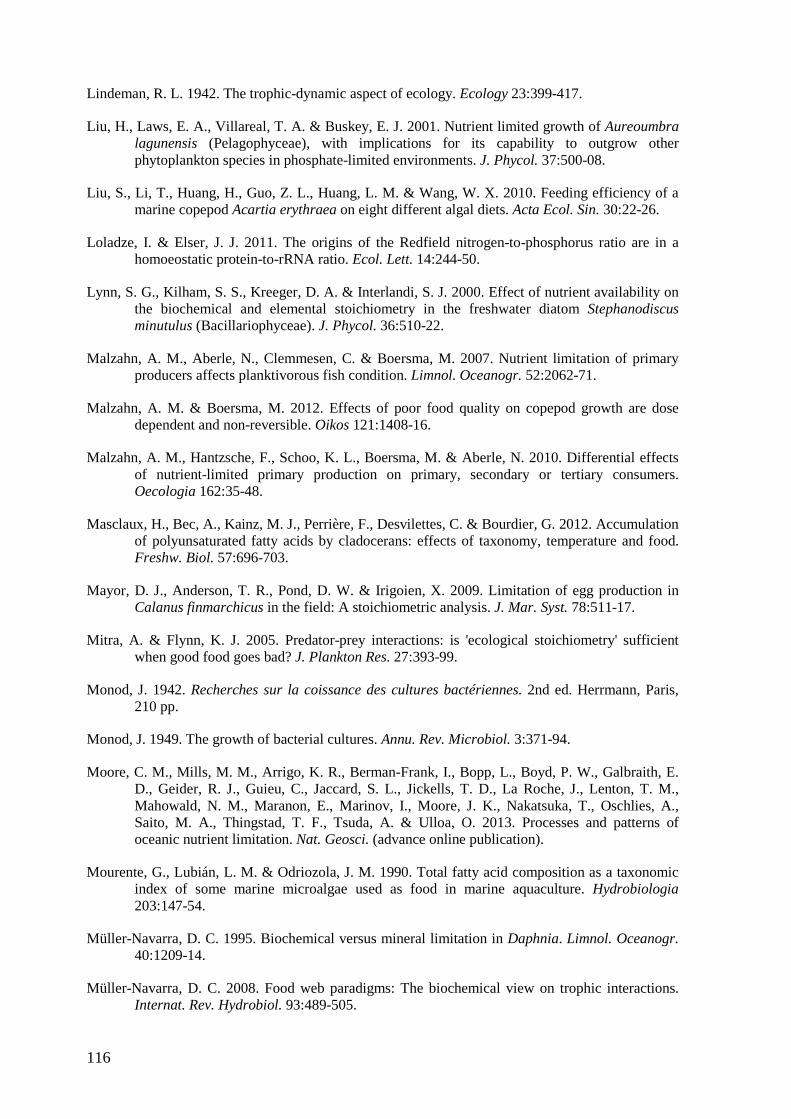
116
Lindeman, R. L. 1942. The trophic-dynamic aspect of ecology. Ecology 23:399-417.
Liu, H., Laws, E. A., Villareal, T. A. & Buskey, E. J. 2001. Nutrient limited growth of Aureoumbra lagunensis (Pelagophyceae), with implications for its capability to outgrow other phytoplankton species in phosphate-limited environments. J. Phycol. 37:500-08.
Liu, S., Li, T., Huang, H., Guo, Z. L., Huang, L. M. & Wang, W. X. 2010. Feeding efficiency of a marine copepod Acartia erythraea on eight different algal diets. Acta Ecol. Sin. 30:22-26.
Loladze, I. & Elser, J. J. 2011. The origins of the Redfield nitrogen-to-phosphorus ratio are in a homoeostatic protein-to-rRNA ratio. Ecol. Lett. 14:244-50.
Lynn, S. G., Kilham, S. S., Kreeger, D. A. & Interlandi, S. J. 2000. Effect of nutrient availability on the biochemical and elemental stoichiometry in the freshwater diatom Stephanodiscus minutulus (Bacillariophyceae). J. Phycol. 36:510-22.
Malzahn, A. M., Aberle, N., Clemmesen, C. & Boersma, M. 2007. Nutrient limitation of primary producers affects planktivorous fish condition. Limnol. Oceanogr. 52:2062-71.
Malzahn, A. M. & Boersma, M. 2012. Effects of poor food quality on copepod growth are dose dependent and non-reversible. Oikos 121:1408-16.
Malzahn, A. M., Hantzsche, F., Schoo, K. L., Boersma, M. & Aberle, N. 2010. Differential effects of nutrient-limited primary production on primary, secondary or tertiary consumers. Oecologia 162:35-48.
Masclaux, H., Bec, A., Kainz, M. J., Perrière, F., Desvilettes, C. & Bourdier, G. 2012. Accumulation of polyunsaturated fatty acids by cladocerans: effects of taxonomy, temperature and food. Freshw. Biol. 57:696-703.
Mayor, D. J., Anderson, T. R., Pond, D. W. & Irigoien, X. 2009. Limitation of egg production in Calanus finmarchicus in the field: A stoichiometric analysis. J. Mar. Syst. 78:511-17.
Mitra, A. & Flynn, K. J. 2005. Predator-prey interactions: is 'ecological stoichiometry' sufficient when good food goes bad? J. Plankton Res. 27:393-99.
Monod, J. 1942. Recherches sur la coissance des cultures bactériennes. 2nd ed. Herrmann, Paris, 210 pp.
Monod, J. 1949. The growth of bacterial cultures. Annu. Rev. Microbiol. 3:371-94.
Moore, C. M., Mills, M. M., Arrigo, K. R., Berman-Frank, I., Bopp, L., Boyd, P. W., Galbraith, E. D., Geider, R. J., Guieu, C., Jaccard, S. L., Jickells, T. D., La Roche, J., Lenton, T. M., Mahowald, N. M., Maranon, E., Marinov, I., Moore, J. K., Nakatsuka, T., Oschlies, A., Saito, M. A., Thingstad, T. F., Tsuda, A. & Ulloa, O. 2013. Processes and patterns of oceanic nutrient limitation. Nat. Geosci. (advance online publication).
Mourente, G., Lubián, L. M. & Odriozola, J. M. 1990. Total fatty acid composition as a taxonomic index of some marine microalgae used as food in marine aquaculture. Hydrobiologia 203:147-54.
Müller-Navarra, D. C. 1995. Biochemical versus mineral limitation in Daphnia. Limnol. Oceanogr. 40:1209-14.
Müller-Navarra, D. C. 2008. Food web paradigms: The biochemical view on trophic interactions. Internat. Rev. Hydrobiol. 93:489-505.
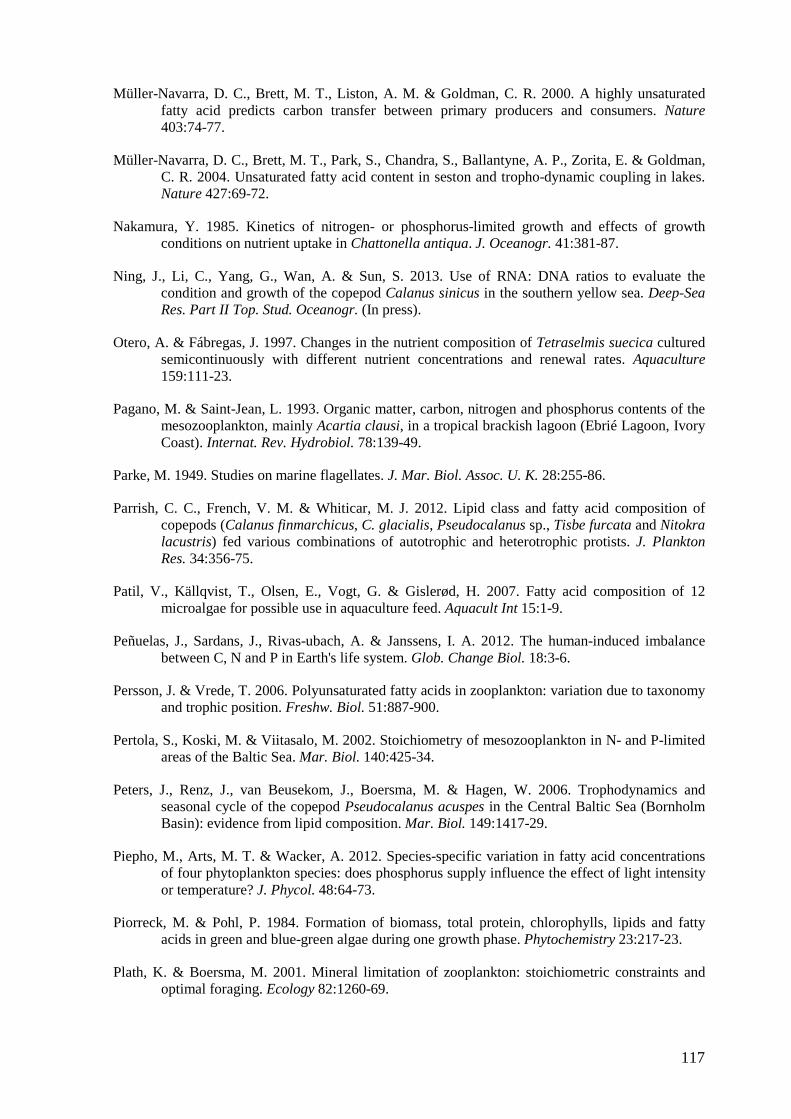
117
Müller-Navarra, D. C., Brett, M. T., Liston, A. M. & Goldman, C. R. 2000. A highly unsaturated fatty acid predicts carbon transfer between primary producers and consumers. Nature 403:74-77.
Müller-Navarra, D. C., Brett, M. T., Park, S., Chandra, S., Ballantyne, A. P., Zorita, E. & Goldman, C. R. 2004. Unsaturated fatty acid content in seston and tropho-dynamic coupling in lakes. Nature 427:69-72.
Nakamura, Y. 1985. Kinetics of nitrogen- or phosphorus-limited growth and effects of growth conditions on nutrient uptake in Chattonella antiqua. J. Oceanogr. 41:381-87.
Ning, J., Li, C., Yang, G., Wan, A. & Sun, S. 2013. Use of RNA: DNA ratios to evaluate the condition and growth of the copepod Calanus sinicus in the southern yellow sea. Deep-Sea Res. Part II Top. Stud. Oceanogr. (In press).
Otero, A. & Fábregas, J. 1997. Changes in the nutrient composition of Tetraselmis suecica cultured semicontinuously with different nutrient concentrations and renewal rates. Aquaculture 159:111-23.
Pagano, M. & Saint-Jean, L. 1993. Organic matter, carbon, nitrogen and phosphorus contents of the mesozooplankton, mainly Acartia clausi, in a tropical brackish lagoon (Ebrié Lagoon, Ivory Coast). Internat. Rev. Hydrobiol. 78:139-49.
Parke, M. 1949. Studies on marine flagellates. J. Mar. Biol. Assoc. U. K. 28:255-86.
Parrish, C. C., French, V. M. & Whiticar, M. J. 2012. Lipid class and fatty acid composition of copepods (Calanus finmarchicus, C. glacialis, Pseudocalanus sp., Tisbe furcata and Nitokra lacustris) fed various combinations of autotrophic and heterotrophic protists. J. Plankton Res. 34:356-75.
Patil, V., Källqvist, T., Olsen, E., Vogt, G. & Gislerød, H. 2007. Fatty acid composition of 12 microalgae for possible use in aquaculture feed. Aquacult Int 15:1-9.
Peñuelas, J., Sardans, J., Rivas-ubach, A. & Janssens, I. A. 2012. The human-induced imbalance between C, N and P in Earth's life system. Glob. Change Biol. 18:3-6.
Persson, J. & Vrede, T. 2006. Polyunsaturated fatty acids in zooplankton: variation due to taxonomy and trophic position. Freshw. Biol. 51:887-900.
Pertola, S., Koski, M. & Viitasalo, M. 2002. Stoichiometry of mesozooplankton in N- and P-limited areas of the Baltic Sea. Mar. Biol. 140:425-34.
Peters, J., Renz, J., van Beusekom, J., Boersma, M. & Hagen, W. 2006. Trophodynamics and seasonal cycle of the copepod Pseudocalanus acuspes in the Central Baltic Sea (Bornholm Basin): evidence from lipid composition. Mar. Biol. 149:1417-29.
Piepho, M., Arts, M. T. & Wacker, A. 2012. Species-specific variation in fatty acid concentrations of four phytoplankton species: does phosphorus supply influence the effect of light intensity or temperature? J. Phycol. 48:64-73.
Piorreck, M. & Pohl, P. 1984. Formation of biomass, total protein, chlorophylls, lipids and fatty acids in green and blue-green algae during one growth phase. Phytochemistry 23:217-23.
Plath, K. & Boersma, M. 2001. Mineral limitation of zooplankton: stoichiometric constraints and optimal foraging. Ecology 82:1260-69.
118
Provasoli, L. 1963. Growing marine seaweeds. In De Virville, A. D. & Feldmann, J. [Eds.] Proc. 4th Internatl. Seaweed Symp. Pergamon Press, Oxford, pp. 9-17.
R Development Core Team 2010. R: A language and environment for statistical computing. Available at: http://www.R-project.org.
Ravet, J. L. & Brett, M. T. 2006. Phytoplankton essential fatty acid and phosphorus content constraints on Daphnia somatic growth and reproduction. Limnol. Oceanogr. 51:2438-52.
Real, L. A. 1977. The kinetics of functional response. American Naturalist:289-300.
Redfield, A. C. 1958. The biological control of chemical factors in the environment. Am. Sci. 64:205-21.
Reitan, K., Jose, R. R. & Yngvar, O. 1994. Effect of nutrient limitation on fatty acid and lipid content of marine microalgae. J. Phycol. 30:972-79.
Renaud, S. M., Thinh, L.-V., Lambrinidis, G. & Parry, D. L. 2002. Effect of temperature on growth, chemical composition and fatty acid composition of tropical Australian microalgae grown in batch cultures. Aquaculture 211:195-214.
Reuss, N. R. & Poulsen, L. P. 2002. Evaluation of fatty acids as biomarkers for a natural plankton community. A field study of a spring bloom and a post-bloom period off West Greenland. Mar. Biol. 141:423-34.
Rey-Rassat, C., Irigoien, X., Harris, R. & Carlotti, F. 2002. Energetic cost of gonad development in Calanus finmarchicus and C. helgolandicus. Mar. Ecol. Prog. Ser. 238:301-06.
Rhee, G. Y. 1973. A continuous culture study of phosphate uptake, growth rate and polyphosphate in Scenedesmus sp. J. Phycol. 9:495-506.
Rhee, G. Y. 1978. Effects of N:P atomic ratios and nitrate limitation on algal growth, cell composition, and nitrate uptake. Limnol. Oceanogr. 23:10-25.
Roessler, P. G. 1990. Environmental control of glycerolipid metabolism in microalgae: commercial implications and future research directions. J. Phycol. 26:393-99.
Runge, J. A. & Roff, J. C. 2000. The measurement of growth and reproductive rates. In Harris, R., Wiebe, P., Lenz, J., Skjoldal, H. R. & Huntley, M. [Eds.] Zooplankton Methodology Manual. Acadamic Press, London, pp. 401-54.
Saba, G. K., Steinberg, D. K. & Bronk, D. A. 2011. The relative importance of sloppy feeding, excretion, and fecal pellet leaching in the release of dissolved carbon and nitrogen by Acartia tonsa copepods. J. Exp. Mar. Biol. Ecol. 404:47-56.
Saiz, E. & Calbet, A. 2007. Scaling of feeding in marine calanoid copepods. Limnol. Oceanogr. 52:668-75.
Saiz, E., Calbet, A., Fara, A. & Berdalet, E. 1998. RNA content of copepods as a tool for determining adult growth rates in the field. Limnol. Oceanogr. 43:465-70.
Santer, B. & van den Bosch, F. 1994. Herbivorous nutrition of Cyclops vicinus: the effect of a pure algal diet on feeding, development, reproduction and life cycle. J. Plankton Res. 16:171-95.
Sardans, J., Rivas-Ubach, A. & Penuelas, J. 2012. The C:N:P stoichiometry of organisms and ecosystems in a changing world: A review and perspectives. Perspectives in Plant Ecology Evolution and Systematics 14:33-47.
119
Schoo, K. L., Aberle, N., Malzahn, A. M. & Boersma, M. 2010. Does the nutrient stoichiometry of primary producers affect the secondary consumer Pleurobrachia pileus? Aquat. Ecol. 44:233-42.
Sharp, J. 1974. Improved analysis for particulate organic carbon and nitrogen from seawater. Limnol. Oceanogr. 19:984-89.
Shifrin, N. & Sallie, W. C. 1981. Phytoplankton lipids: interspecific differences and effects of nitrate, silicate and light-dark cycles. J. Phycol. 17:374-84.
Siron, R., Giusti, G. & Berland, B. 1989. Changes in the fatty acid composition of Phaeodactylum tricornutum and Dunaliella tertiolecta during growth and under phosphorus deficiency. Mar. Ecol. Prog. Ser. 55:95-100.
Sommer, U. 1988. Does nutrient competition among phytoplankton occur in situ? Verh. Internat. Verein. Limnol. 23:707-12.
Sommer, U. 1991a. The application of the Droop-model of nutrient limitation to natural phytoplankton. Verh. Internat. Verein. Limnol. 24:791-94.
Sommer, U. 1991b. A comparison of the Droop and the Monod models of nutrient limited growth applied to natural populations of phytoplankton. Funct. Ecol. 5:535-44.
Sommer, U. 1996. Plankton ecology: the past two decades of progress. Naturwissenschaften 83:293-301.
Sommer, U. 2009. Copepod growth and diatoms: insensitivity of Acartia tonsa to the composition of semi-natural plankton mixtures manipulated by silicon:nitrogen ratios in mesocosms. Oecologia 159:207-15.
Sommer, U., Adrian, R., De Senerpont Domis, L., Elser, J. J., Gaedke, U., Ibelings, B., Jeppesen, E., Lürling, M., Molinero, J. C., Mooij, W. M., van Donk, E. & Winder, M. 2012. Beyond the Plankton Ecology Group (PEG) Model: Mechanisms driving plankton succession. Annu. Rev. Ecol. Evol. Syst. 43:429-48.
Spijkerman, E. & Coesel, P. F. M. 1996. Competition for phosphorus among planktonic desmid species in continuous-flow culture. J. Phycol. 32:939-48.
Spijkerman, E. & Coesel, P. F. M. 1998. Different response mechanisms of two planktonic desmid species (Chlorophyceae) to a single saturating addition of phosphate. J. Phycol. 34:438-45.
Spijkerman, E. & Wacker, A. 2011. Interactions between P-limitation and different C conditions on the fatty acid composition of an extremophile microalga. Extremophiles 15:597-609.
Sterner, R. W. & Schulz, K. 1998. Zooplankton nutrition: recent progress and a reality check. Aquat. Ecol. 32:261-79.
Sterner, R. W. & Elser, J. J. 2002. Ecological stoichiometry: The biology of elements from molecules to the biosphere. Princeton University Press, Princeton, 439 pp.
Sterner, R. W., Hagemeier, D. D. & Smith, W. L. 1993. Phytoplankton nutrient limitation and food quality for Daphnia. Limnol. Oceanogr. 38:857-71.
Sterner, R. W. & Hessen, D. O. 1994. Algal nutrient limitation and the nutrition of aquatic herbivores. Annu. Rev. Ecol. Syst. 25:1-29.
120
Sterner, R. W. & Robinson, J. L. 1994. Thresholds for growth in Daphina magna with high and low phophorus diets. Limnol. Oceanogr. 39:1228-32.
Støttrup, J. G. & Jensen, J. 1990. Influence of algal diet on feeding and egg-production of the calanoid copepod Acartia tonsa Dana. J. Exp. Mar. Biol. Ecol. 141:87-105.
Straile, D. 1997. Gross growth efficiencies of protozoan and metazoan zooplankton and their dependence on food concentration, predator-prey weight ratio, and taxonomic group. Limnol. Oceanogr. 42:1375-85.
Sunda, W. G., Shertzer, K. W. & Hardison, D. R. 2009. Ammonium uptake and growth models in marine diatoms: Monod and Droop revisited. Mar. Ecol. Prog. Ser. 386:29-41.
Suzuki-Ohno, Y., Kawata, M. & Urabe, J. 2012. Optimal feeding under stoichiometric constraints: a model of compensatory feeding with functional response. Oikos 121:569-78.
Tang, K. W., Jakobsen, H. H. & Visser, A. W. 2001. Phaeocystis globosa (Prymnesiophyceae) and the planktonic food web: feeding, growth, and trophic interactions among grazers. Limnol. Oceanogr. 46:1860-70.
Terry, K. L., Hirata, J. & Laws, E. A. 1985a. Light-, nitrogen-, and phosphorus-limited growth of Phaeodactylum tricornutum Bohlin strain TFX-1: Chemical composition, carbon partitioning, and the diel periodicity of physiological processes. J. Exp. Mar. Biol. Ecol. 86:85-100.
Terry, K. L., Laws, E. A. & J., B. D. 1985b. Growth rate variation in the N:P requirement ratio of phytoplankton. J. Phycol. 21:323-29.
Thompson, G. A. 1996. Lipids and membrane function in green algae. Biochim. Biophys. Acta, Lipids and lipid metabolism 1302:17-45.
Thompson, P. A., Harrison, P. J. & Whyte, J. N. C. 1990. Influence of irradiance on the fatty acid composition of phytoplankton. J. Phycol. 26:278-88.
Thor, P. & Wendt, I. 2010. Functional response of carbon absorption efficiency in the pelagic calanoid copepod Acartia tonsa Dana. Limnol. Oceanogr. 55:1779-89.
Tirelli, V. & Mayzaud, P. 2005. Relationship between functional response and gut transit time in the calanoid copepod Acartia clausi: role of food quantity and quality. J. Plankton Res. 27:557-68.
Tonon, T., Harvey, D., Larson, T. R. & Graham, I. A. 2002. Long chain polyunsaturated fatty acid production and partitioning to triacylglycerols in four microalgae. Phytochemistry 61:15-24.
Turner, J. T. 2004. The importance of small planktonic copepods and their roles in pelagic marine food webs. Zool. Stud 43:255-66.
Twomey, L. & Thompson, P. 2001. Nutrient limitation of phytoplankton in a seasonally open bar-built estuary: Wilson Inlet, Western Australia. J. Phycol. 37:16-29.
Tzovenis, I., De Pauw, N. & Sorgeloos, P. 2003. Optimisation of T-ISO biomass production rich in essential fatty acids: I. Effect of different light regimes on growth and biomass production. Aquaculture 216:203-22.
Van Baalen, C. & Marler, J. E. 1963. Characteristics of marine blue-green algae with uric acid as nitrogen source. J. Gen. Microbiol. 32:457-63.
121
Van Mooy, B. A. S. & Fredricks, H. F. 2010. Bacterial and eukaryotic intact polar lipids in the eastern subtropical South Pacific: Water-column distribution, planktonic sources, and fatty acid composition. Geochim. Cosmochim. Ac. 74:6499-516.
Van Mooy, B. A. S., Fredricks, H. F., Pedler, B. E., Dyhrman, S. T., Karl, D. M., Koblizek, M., Lomas, M. W., Mincer, T. J., Moore, L. R., Moutin, T., Rappe, M. S. & Webb, E. A. 2009. Phytoplankton in the ocean use non-phosphorus lipids in response to phosphorus scarcity. Nature 458:69-72.
Van Mooy, B. A. S., Rocap, G., Fredricks, H. F., Evans, C. T. & Devol, A. H. 2006. Sulfolipids dramatically decrease phosphorus demand by picocyanobacteria in oligotrophic marine environments. Proc. Natl. Acad. Sci. U. S. A. 103:8607-12.
Vargas, C. A., Escribano, R. n. & Poulet, S. 2006. Phytoplankton food quality determines time windows for successful zooplankton reproductive pulses. Ecology 87:2992-99.
Veloza, A., Chu, F.-L. & Tang, K. 2006. Trophic modification of essential fatty acids by heterotrophic protists and its effects on the fatty acid composition of the copepod Acartia tonsa. Mar. Biol. 148:779-88.
Verity, P. G. & Smetacek, V. 1996. Organism life cycles, predation, and the structure of marine pelagic ecosystems. Mar. Ecol. Prog. Ser. 130:277-93.
Vitousek, P. M. & Howarth, R. W. 1991. Nitrogen limitation on land and in the sea: How can it occur? Biogeochemistry 13:87-115.
Wacker, A. & von Elert, E. 2001. Polyunsaturated fatty acids: Evidence for non-substitutable biochemical resources in Daphnia galeata. Ecology 82:2507-20.
Wagner, M., Durbin, E. & Buckley, L. 1998. RNA: DNA ratios as indicators of nutritional condition in the copepod Calanus finmarchicus. Mar. Ecol. Prog. Ser. 162:173-81.
Walve, J. & Larsson, U. 1999. Carbon, nitrogen and phosphorus stoichiometry of crustacean zooplankton in the Baltic Sea: implications for nutrient recycling. J. Plankton Res. 21:2309-21.
Weers, P. M. M. & Gulati, R. D. 1997. Growth and reproduction of Daphnia galeata in response to changes in fatty acids, phosphorus, and nitrogen in Chlamydomonas reinhardtii. Limnol. Oceanogr. 42:1584-89.
Wirtz, K. W. 2012. Intermittency in processing explains the diversity and shape of functional grazing responses. Oecologia 169:879-94.
Wirtz, K. W. 2013. How fast can plankton feed? Maximum ingestion rate scales with digestive surface area. J. Plankton Res. 35:33-48.
Worden, A. Z. & Binder, B. J. 2003. Growth regulation of rRNA content in Prochlorococcus and Synechococcus (marine cyanobacteria) measured by whole-cell hybridization of rRNA-targeted peptide nucleic acids. J. Phycol. 39:527-34.
Yamaguchi, H., Sakamoto, S. & Yamaguchi, M. 2008. Nutrition and growth kinetics in nitrogen- and phosphorus-limited cultures of the novel red tide flagellate Chattonella ovata (Raphidophyceae). Harmful Algae 7:26-32.
Zamora-Terol, S. & Saiz, E. 2013. Effects of food concentration on egg production and feeding rates of the cyclopoid copepod Oithona davisae. Limnol. Oceanogr. 58:376-87.

122
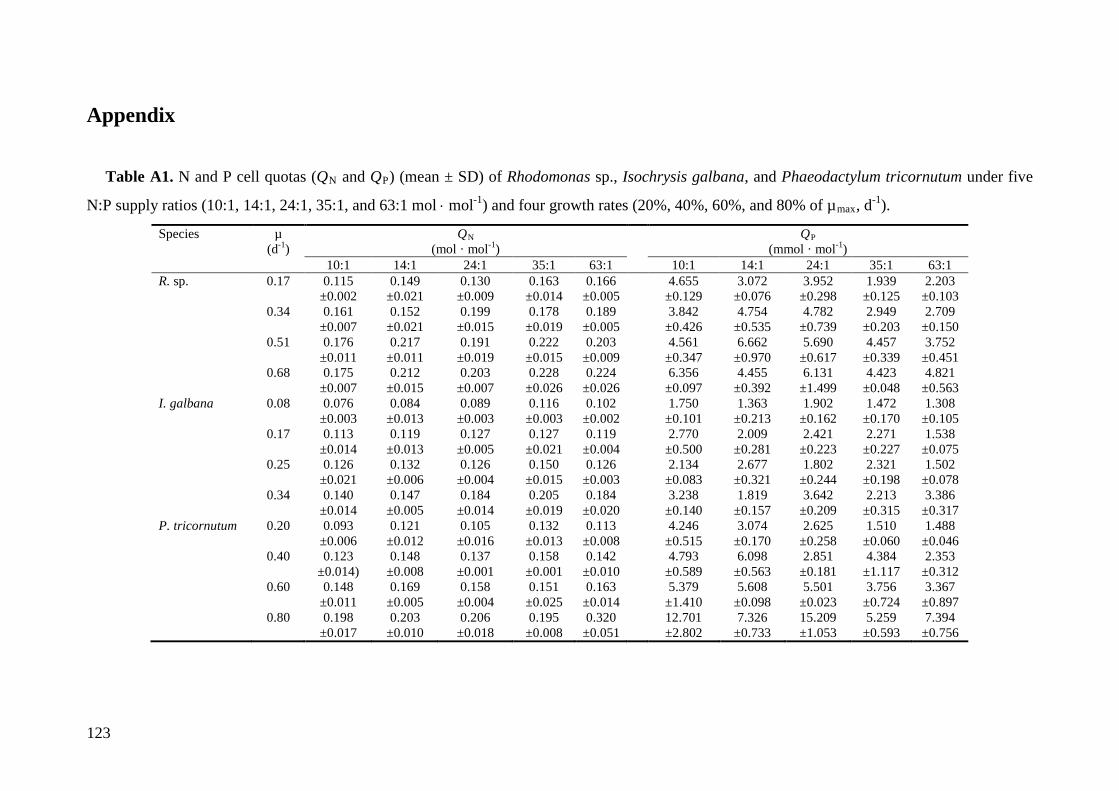
123
Appendix
Table A1. N and P cell quotas (QN and QP) (mean ± SD) of Rhodomonas sp., Isochrysis galbana, and Phaeodactylum tricornutum under five
N:P supply ratios (10:1, 14:1, 24:1, 35:1, and 63:1 mol ⋅ mol-1) and four growth rates (20%, 40%, 60%, and 80% of µmax, d-1).
Species µ (d-1)
QN (mol · mol-1)
QP (mmol · mol-1)
10:1 14:1 24:1 35:1 63:1 10:1 14:1 24:1 35:1 63:1 R. sp. 0.17 0.115
±0.002 0.149
±0.021 0.130
±0.009 0.163
±0.014 0.166
±0.005 4.655
±0.129 3.072
±0.076 3.952
±0.298 1.939
±0.125 2.203
±0.103 0.34 0.161
±0.007 0.152
±0.021 0.199
±0.015 0.178
±0.019 0.189
±0.005 3.842
±0.426 4.754
±0.535 4.782
±0.739 2.949
±0.203 2.709
±0.150 0.51 0.176
±0.011 0.217
±0.011 0.191
±0.019 0.222
±0.015 0.203
±0.009 4.561
±0.347 6.662
±0.970 5.690
±0.617 4.457
±0.339 3.752
±0.451 0.68 0.175
±0.007 0.212
±0.015 0.203
±0.007 0.228
±0.026 0.224
±0.026 6.356
±0.097 4.455
±0.392 6.131
±1.499 4.423
±0.048 4.821
±0.563 I. galbana 0.08 0.076
±0.003 0.084
±0.013 0.089
±0.003 0.116
±0.003 0.102
±0.002 1.750
±0.101 1.363
±0.213 1.902
±0.162 1.472
±0.170 1.308
±0.105 0.17 0.113
±0.014 0.119
±0.013 0.127
±0.005 0.127
±0.021 0.119
±0.004 2.770
±0.500 2.009
±0.281 2.421
±0.223 2.271
±0.227 1.538
±0.075 0.25 0.126
±0.021 0.132
±0.006 0.126
±0.004 0.150
±0.015 0.126
±0.003 2.134
±0.083 2.677
±0.321 1.802
±0.244 2.321
±0.198 1.502
±0.078 0.34 0.140
±0.014 0.147
±0.005 0.184
±0.014 0.205
±0.019 0.184
±0.020 3.238
±0.140 1.819
±0.157 3.642
±0.209 2.213
±0.315 3.386
±0.317 P. tricornutum 0.20 0.093
±0.006 0.121
±0.012 0.105
±0.016 0.132
±0.013 0.113
±0.008 4.246
±0.515 3.074
±0.170 2.625
±0.258 1.510
±0.060 1.488
±0.046 0.40 0.123
±0.014) 0.148
±0.008 0.137
±0.001 0.158
±0.001 0.142
±0.010 4.793
±0.589 6.098
±0.563 2.851
±0.181 4.384
±1.117 2.353
±0.312 0.60 0.148
±0.011 0.169
±0.005 0.158
±0.004 0.151
±0.025 0.163
±0.014 5.379
±1.410 5.608
±0.098 5.501
±0.023 3.756
±0.724 3.367
±0.897 0.80 0.198
±0.017 0.203
±0.010 0.206
±0.018 0.195
±0.008 0.320
±0.051 12.701
±2.802 7.326
±0.733 15.209 ±1.053
5.259 ±0.593
7.394 ±0.756

124
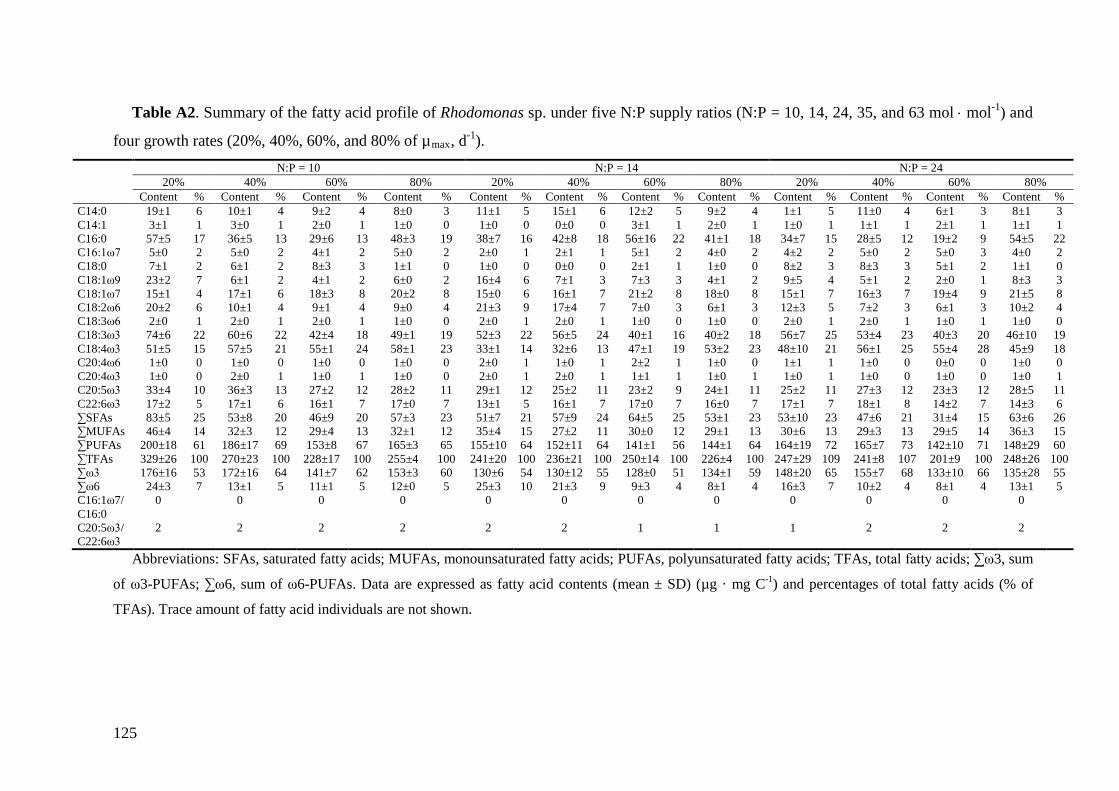
125
Table A2. Summary of the fatty acid profile of Rhodomonas sp. under five N:P supply ratios (N:P = 10, 14, 24, 35, and 63 mol ⋅ mol-1) and
four growth rates (20%, 40%, 60%, and 80% of µmax, d-1). N:P = 10 N:P = 14 N:P = 24 20% 40% 60% 80% 20% 40% 60% 80% 20% 40% 60% 80% Content % Content % Content % Content % Content % Content % Content % Content % Content % Content % Content % Content % C14:0 19±1 6 10±1 4 9±2 4 8±0 3 11±1 5 15±1 6 12±2 5 9±2 4 1±1 5 11±0 4 6±1 3 8±1 3 C14:1 3±1 1 3±0 1 2±0 1 1±0 0 1±0 0 0±0 0 3±1 1 2±0 1 1±0 1 1±1 1 2±1 1 1±1 1 C16:0 57±5 17 36±5 13 29±6 13 48±3 19 38±7 16 42±8 18 56±16 22 41±1 18 34±7 15 28±5 12 19±2 9 54±5 22 C16:1ω7 5±0 2 5±0 2 4±1 2 5±0 2 2±0 1 2±1 1 5±1 2 4±0 2 4±2 2 5±0 2 5±0 3 4±0 2 C18:0 7±1 2 6±1 2 8±3 3 1±1 0 1±0 0 0±0 0 2±1 1 1±0 0 8±2 3 8±3 3 5±1 2 1±1 0 C18:1ω9 23±2 7 6±1 2 4±1 2 6±0 2 16±4 6 7±1 3 7±3 3 4±1 2 9±5 4 5±1 2 2±0 1 8±3 3 C18:1ω7 15±1 4 17±1 6 18±3 8 20±2 8 15±0 6 16±1 7 21±2 8 18±0 8 15±1 7 16±3 7 19±4 9 21±5 8 C18:2ω6 20±2 6 10±1 4 9±1 4 9±0 4 21±3 9 17±4 7 7±0 3 6±1 3 12±3 5 7±2 3 6±1 3 10±2 4 C18:3ω6 2±0 1 2±0 1 2±0 1 1±0 0 2±0 1 2±0 1 1±0 0 1±0 0 2±0 1 2±0 1 1±0 1 1±0 0 C18:3ω3 74±6 22 60±6 22 42±4 18 49±1 19 52±3 22 56±5 24 40±1 16 40±2 18 56±7 25 53±4 23 40±3 20 46±10 19 C18:4ω3 51±5 15 57±5 21 55±1 24 58±1 23 33±1 14 32±6 13 47±1 19 53±2 23 48±10 21 56±1 25 55±4 28 45±9 18 C20:4ω6 1±0 0 1±0 0 1±0 0 1±0 0 2±0 1 1±0 1 2±2 1 1±0 0 1±1 1 1±0 0 0±0 0 1±0 0 C20:4ω3 1±0 0 2±0 1 1±0 1 1±0 0 2±0 1 2±0 1 1±1 1 1±0 1 1±0 1 1±0 0 1±0 0 1±0 1 C20:5ω3 33±4 10 36±3 13 27±2 12 28±2 11 29±1 12 25±2 11 23±2 9 24±1 11 25±2 11 27±3 12 23±3 12 28±5 11 C22:6ω3 17±2 5 17±1 6 16±1 7 17±0 7 13±1 5 16±1 7 17±0 7 16±0 7 17±1 7 18±1 8 14±2 7 14±3 6 ∑SFAs 83±5 25 53±8 20 46±9 20 57±3 23 51±7 21 57±9 24 64±5 25 53±1 23 53±10 23 47±6 21 31±4 15 63±6 26 ∑MUFAs 46±4 14 32±3 12 29±4 13 32±1 12 35±4 15 27±2 11 30±0 12 29±1 13 30±6 13 29±3 13 29±5 14 36±3 15 ∑PUFAs 200±18 61 186±17 69 153±8 67 165±3 65 155±10 64 152±11 64 141±1 56 144±1 64 164±19 72 165±7 73 142±10 71 148±29 60 ∑TFAs 329±26 100 270±23 100 228±17 100 255±4 100 241±20 100 236±21 100 250±14 100 226±4 100 247±29 109 241±8 107 201±9 100 248±26 100 ∑ω3 176±16 53 172±16 64 141±7 62 153±3 60 130±6 54 130±12 55 128±0 51 134±1 59 148±20 65 155±7 68 133±10 66 135±28 55 ∑ω6 24±3 7 13±1 5 11±1 5 12±0 5 25±3 10 21±3 9 9±3 4 8±1 4 16±3 7 10±2 4 8±1 4 13±1 5 C16:1ω7/ C16:0
0 0 0 0 0 0 0 0 0 0 0 0
C20:5ω3/ C22:6ω3
2 2 2 2 2 2 1 1 1 2 2 2
Abbreviations: SFAs, saturated fatty acids; MUFAs, monounsaturated fatty acids; PUFAs, polyunsaturated fatty acids; TFAs, total fatty acids; ∑ω3, sum
of ω3-PUFAs; ∑ω6, sum of ω6-PUFAs. Data are expressed as fatty acid contents (mean ± SD) (µg · mg C-1) and percentages of total fatty acids (% of
TFAs). Trace amount of fatty acid individuals are not shown.
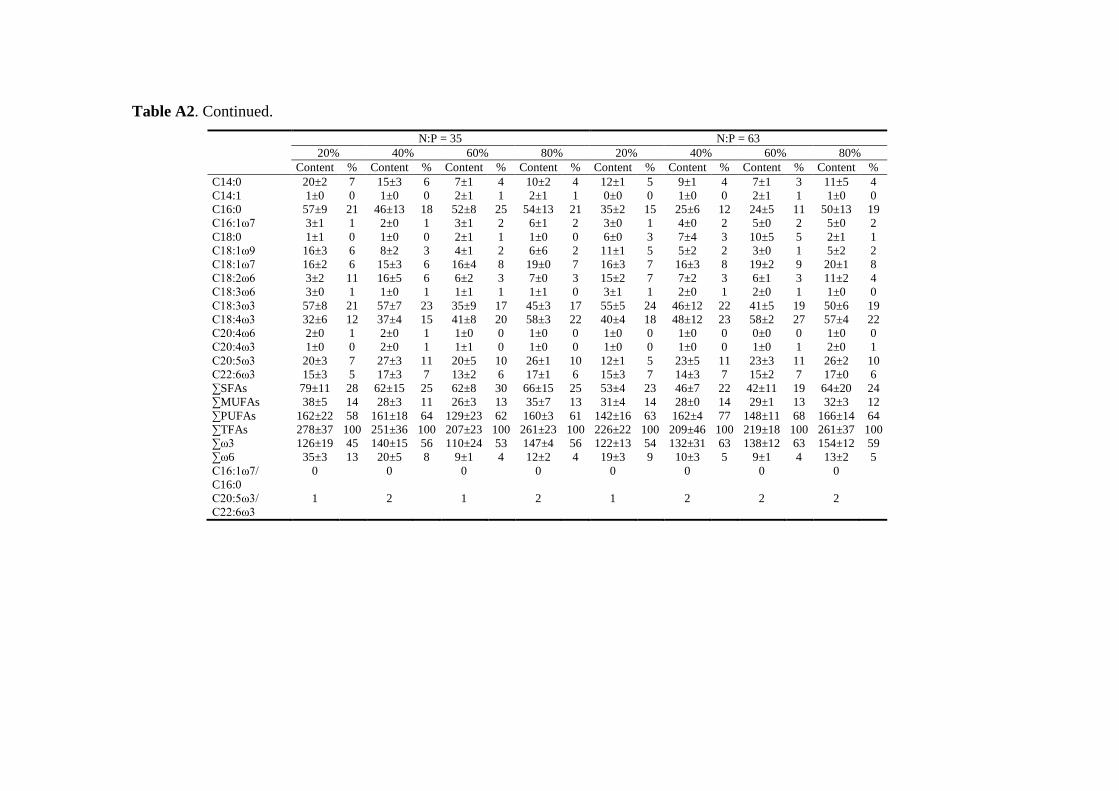
Table A2. Continued. N:P = 35 N:P = 63
20% 40% 60% 80% 20% 40% 60% 80% Content % Content % Content % Content % Content % Content % Content % Content % C14:0 20±2 7 15±3 6 7±1 4 10±2 4 12±1 5 9±1 4 7±1 3 11±5 4 C14:1 1±0 0 1±0 0 2±1 1 2±1 1 0±0 0 1±0 0 2±1 1 1±0 0 C16:0 57±9 21 46±13 18 52±8 25 54±13 21 35±2 15 25±6 12 24±5 11 50±13 19 C16:1ω7 3±1 1 2±0 1 3±1 2 6±1 2 3±0 1 4±0 2 5±0 2 5±0 2 C18:0 1±1 0 1±0 0 2±1 1 1±0 0 6±0 3 7±4 3 10±5 5 2±1 1 C18:1ω9 16±3 6 8±2 3 4±1 2 6±6 2 11±1 5 5±2 2 3±0 1 5±2 2 C18:1ω7 16±2 6 15±3 6 16±4 8 19±0 7 16±3 7 16±3 8 19±2 9 20±1 8 C18:2ω6 3±2 11 16±5 6 6±2 3 7±0 3 15±2 7 7±2 3 6±1 3 11±2 4 C18:3ω6 3±0 1 1±0 1 1±1 1 1±1 0 3±1 1 2±0 1 2±0 1 1±0 0 C18:3ω3 57±8 21 57±7 23 35±9 17 45±3 17 55±5 24 46±12 22 41±5 19 50±6 19 C18:4ω3 32±6 12 37±4 15 41±8 20 58±3 22 40±4 18 48±12 23 58±2 27 57±4 22 C20:4ω6 2±0 1 2±0 1 1±0 0 1±0 0 1±0 0 1±0 0 0±0 0 1±0 0 C20:4ω3 1±0 0 2±0 1 1±1 0 1±0 0 1±0 0 1±0 0 1±0 1 2±0 1 C20:5ω3 20±3 7 27±3 11 20±5 10 26±1 10 12±1 5 23±5 11 23±3 11 26±2 10 C22:6ω3 15±3 5 17±3 7 13±2 6 17±1 6 15±3 7 14±3 7 15±2 7 17±0 6 ∑SFAs 79±11 28 62±15 25 62±8 30 66±15 25 53±4 23 46±7 22 42±11 19 64±20 24 ∑MUFAs 38±5 14 28±3 11 26±3 13 35±7 13 31±4 14 28±0 14 29±1 13 32±3 12 ∑PUFAs 162±22 58 161±18 64 129±23 62 160±3 61 142±16 63 162±4 77 148±11 68 166±14 64 ∑TFAs 278±37 100 251±36 100 207±23 100 261±23 100 226±22 100 209±46 100 219±18 100 261±37 100 ∑ω3 126±19 45 140±15 56 110±24 53 147±4 56 122±13 54 132±31 63 138±12 63 154±12 59 ∑ω6 35±3 13 20±5 8 9±1 4 12±2 4 19±3 9 10±3 5 9±1 4 13±2 5 C16:1ω7/ C16:0
0 0 0 0 0 0 0 0
C20:5ω3/ C22:6ω3
1 2 1 2 1 2 2 2
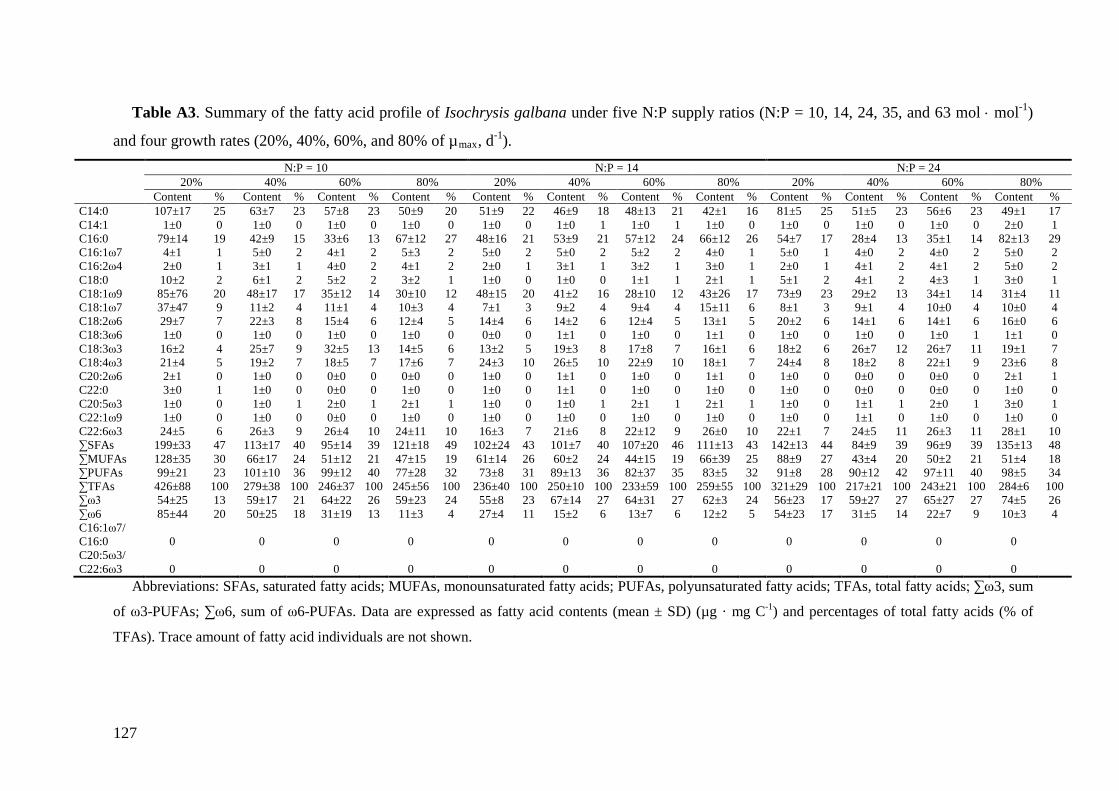
127
Table A3. Summary of the fatty acid profile of Isochrysis galbana under five N:P supply ratios (N:P = 10, 14, 24, 35, and 63 mol ⋅ mol-1)
and four growth rates (20%, 40%, 60%, and 80% of µmax, d-1). N:P = 10 N:P = 14 N:P = 24 20% 40% 60% 80% 20% 40% 60% 80% 20% 40% 60% 80% Content % Content % Content % Content % Content % Content % Content % Content % Content % Content % Content % Content % C14:0 107±17 25 63±7 23 57±8 23 50±9 20 51±9 22 46±9 18 48±13 21 42±1 16 81±5 25 51±5 23 56±6 23 49±1 17 C14:1 1±0 0 1±0 0 1±0 0 1±0 0 1±0 0 1±0 1 1±0 1 1±0 0 1±0 0 1±0 0 1±0 0 2±0 1 C16:0 79±14 19 42±9 15 33±6 13 67±12 27 48±16 21 53±9 21 57±12 24 66±12 26 54±7 17 28±4 13 35±1 14 82±13 29 C16:1ω7 4±1 1 5±0 2 4±1 2 5±3 2 5±0 2 5±0 2 5±2 2 4±0 1 5±0 1 4±0 2 4±0 2 5±0 2 C16:2ω4 2±0 1 3±1 1 4±0 2 4±1 2 2±0 1 3±1 1 3±2 1 3±0 1 2±0 1 4±1 2 4±1 2 5±0 2 C18:0 10±2 2 6±1 2 5±2 2 3±2 1 1±0 0 1±0 0 1±1 1 2±1 1 5±1 2 4±1 2 4±3 1 3±0 1 C18:1ω9 85±76 20 48±17 17 35±12 14 30±10 12 48±15 20 41±2 16 28±10 12 43±26 17 73±9 23 29±2 13 34±1 14 31±4 11 C18:1ω7 37±47 9 11±2 4 11±1 4 10±3 4 7±1 3 9±2 4 9±4 4 15±11 6 8±1 3 9±1 4 10±0 4 10±0 4 C18:2ω6 29±7 7 22±3 8 15±4 6 12±4 5 14±4 6 14±2 6 12±4 5 13±1 5 20±2 6 14±1 6 14±1 6 16±0 6 C18:3ω6 1±0 0 1±0 0 1±0 0 1±0 0 0±0 0 1±1 0 1±0 0 1±1 0 1±0 0 1±0 0 1±0 1 1±1 0 C18:3ω3 16±2 4 25±7 9 32±5 13 14±5 6 13±2 5 19±3 8 17±8 7 16±1 6 18±2 6 26±7 12 26±7 11 19±1 7 C18:4ω3 21±4 5 19±2 7 18±5 7 17±6 7 24±3 10 26±5 10 22±9 10 18±1 7 24±4 8 18±2 8 22±1 9 23±6 8 C20:2ω6 2±1 0 1±0 0 0±0 0 0±0 0 1±0 0 1±1 0 1±0 0 1±1 0 1±0 0 0±0 0 0±0 0 2±1 1 C22:0 3±0 1 1±0 0 0±0 0 1±0 0 1±0 0 1±1 0 1±0 0 1±0 0 1±0 0 0±0 0 0±0 0 1±0 0 C20:5ω3 1±0 0 1±0 1 2±0 1 2±1 1 1±0 0 1±0 1 2±1 1 2±1 1 1±0 0 1±1 1 2±0 1 3±0 1 C22:1ω9 1±0 0 1±0 0 0±0 0 1±0 0 1±0 0 1±0 0 1±0 0 1±0 0 1±0 0 1±1 0 1±0 0 1±0 0 C22:6ω3 24±5 6 26±3 9 26±4 10 24±11 10 16±3 7 21±6 8 22±12 9 26±0 10 22±1 7 24±5 11 26±3 11 28±1 10 ∑SFAs 199±33 47 113±17 40 95±14 39 121±18 49 102±24 43 101±7 40 107±20 46 111±13 43 142±13 44 84±9 39 96±9 39 135±13 48 ∑MUFAs 128±35 30 66±17 24 51±12 21 47±15 19 61±14 26 60±2 24 44±15 19 66±39 25 88±9 27 43±4 20 50±2 21 51±4 18 ∑PUFAs 99±21 23 101±10 36 99±12 40 77±28 32 73±8 31 89±13 36 82±37 35 83±5 32 91±8 28 90±12 42 97±11 40 98±5 34 ∑TFAs 426±88 100 279±38 100 246±37 100 245±56 100 236±40 100 250±10 100 233±59 100 259±55 100 321±29 100 217±21 100 243±21 100 284±6 100 ∑ω3 54±25 13 59±17 21 64±22 26 59±23 24 55±8 23 67±14 27 64±31 27 62±3 24 56±23 17 59±27 27 65±27 27 74±5 26 ∑ω6 85±44 20 50±25 18 31±19 13 11±3 4 27±4 11 15±2 6 13±7 6 12±2 5 54±23 17 31±5 14 22±7 9 10±3 4 C16:1ω7/ C16:0 0 0 0 0 0 0 0 0 0 0 0 0 C20:5ω3/ C22:6ω3 0 0 0 0 0 0 0 0 0 0 0 0
Abbreviations: SFAs, saturated fatty acids; MUFAs, monounsaturated fatty acids; PUFAs, polyunsaturated fatty acids; TFAs, total fatty acids; ∑ω3, sum
of ω3-PUFAs; ∑ω6, sum of ω6-PUFAs. Data are expressed as fatty acid contents (mean ± SD) (µg · mg C-1) and percentages of total fatty acids (% of
TFAs). Trace amount of fatty acid individuals are not shown.
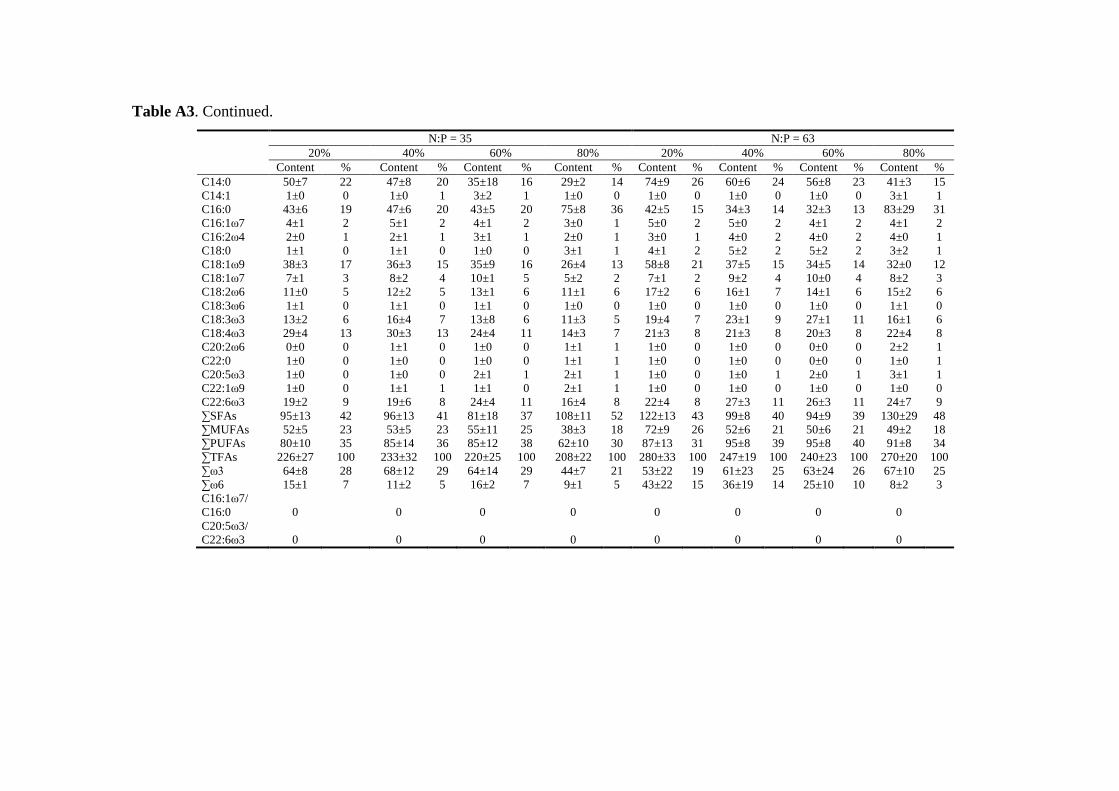
Table A3. Continued. N:P = 35 N:P = 63
20% 40% 60% 80% 20% 40% 60% 80% Content % Content % Content % Content % Content % Content % Content % Content % C14:0 50±7 22 47±8 20 35±18 16 29±2 14 74±9 26 60±6 24 56±8 23 41±3 15 C14:1 1±0 0 1±0 1 3±2 1 1±0 0 1±0 0 1±0 0 1±0 0 3±1 1 C16:0 43±6 19 47±6 20 43±5 20 75±8 36 42±5 15 34±3 14 32±3 13 83±29 31 C16:1ω7 4±1 2 5±1 2 4±1 2 3±0 1 5±0 2 5±0 2 4±1 2 4±1 2 C16:2ω4 2±0 1 2±1 1 3±1 1 2±0 1 3±0 1 4±0 2 4±0 2 4±0 1 C18:0 1±1 0 1±1 0 1±0 0 3±1 1 4±1 2 5±2 2 5±2 2 3±2 1 C18:1ω9 38±3 17 36±3 15 35±9 16 26±4 13 58±8 21 37±5 15 34±5 14 32±0 12 C18:1ω7 7±1 3 8±2 4 10±1 5 5±2 2 7±1 2 9±2 4 10±0 4 8±2 3 C18:2ω6 11±0 5 12±2 5 13±1 6 11±1 6 17±2 6 16±1 7 14±1 6 15±2 6 C18:3ω6 1±1 0 1±1 0 1±1 0 1±0 0 1±0 0 1±0 0 1±0 0 1±1 0 C18:3ω3 13±2 6 16±4 7 13±8 6 11±3 5 19±4 7 23±1 9 27±1 11 16±1 6 C18:4ω3 29±4 13 30±3 13 24±4 11 14±3 7 21±3 8 21±3 8 20±3 8 22±4 8 C20:2ω6 0±0 0 1±1 0 1±0 0 1±1 1 1±0 0 1±0 0 0±0 0 2±2 1 C22:0 1±0 0 1±0 0 1±0 0 1±1 1 1±0 0 1±0 0 0±0 0 1±0 1 C20:5ω3 1±0 0 1±0 0 2±1 1 2±1 1 1±0 0 1±0 1 2±0 1 3±1 1 C22:1ω9 1±0 0 1±1 1 1±1 0 2±1 1 1±0 0 1±0 0 1±0 0 1±0 0 C22:6ω3 19±2 9 19±6 8 24±4 11 16±4 8 22±4 8 27±3 11 26±3 11 24±7 9 ∑SFAs 95±13 42 96±13 41 81±18 37 108±11 52 122±13 43 99±8 40 94±9 39 130±29 48 ∑MUFAs 52±5 23 53±5 23 55±11 25 38±3 18 72±9 26 52±6 21 50±6 21 49±2 18 ∑PUFAs 80±10 35 85±14 36 85±12 38 62±10 30 87±13 31 95±8 39 95±8 40 91±8 34 ∑TFAs 226±27 100 233±32 100 220±25 100 208±22 100 280±33 100 247±19 100 240±23 100 270±20 100 ∑ω3 64±8 28 68±12 29 64±14 29 44±7 21 53±22 19 61±23 25 63±24 26 67±10 25 ∑ω6 15±1 7 11±2 5 16±2 7 9±1 5 43±22 15 36±19 14 25±10 10 8±2 3 C16:1ω7/ C16:0 0 0 0 0 0 0 0 0 C20:5ω3/ C22:6ω3 0 0 0 0 0 0 0 0
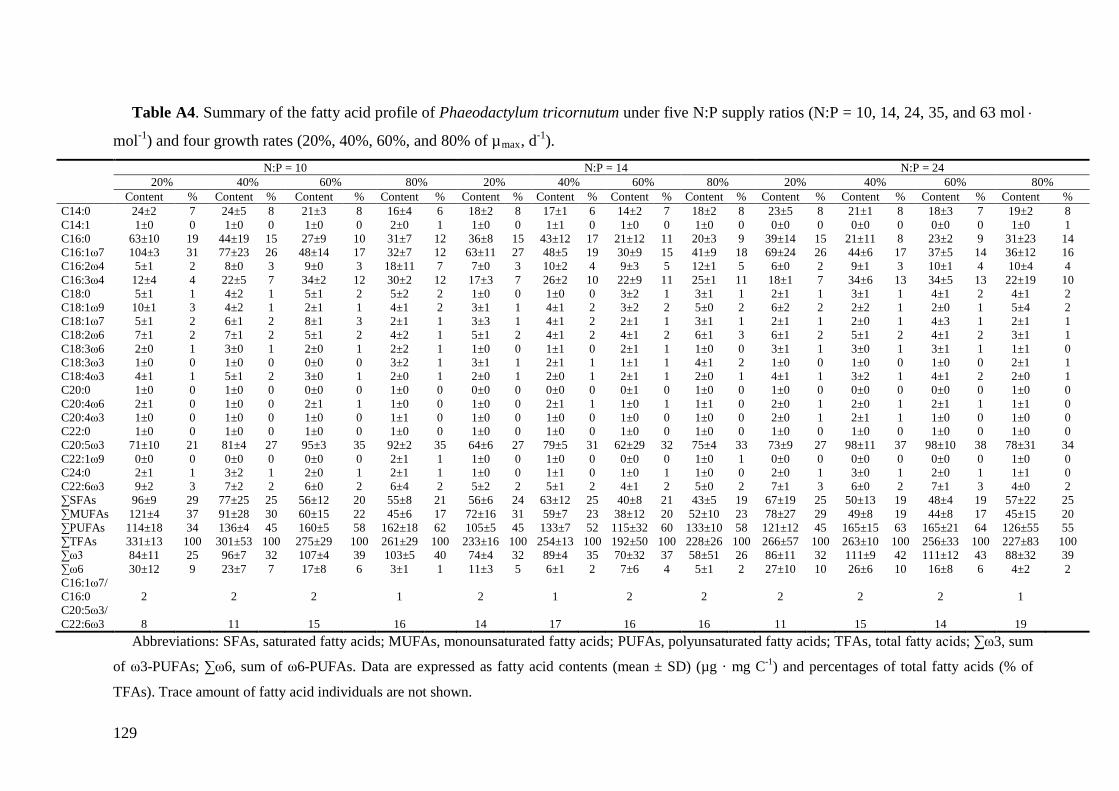
129
Table A4. Summary of the fatty acid profile of Phaeodactylum tricornutum under five N:P supply ratios (N:P = 10, 14, 24, 35, and 63 mol ⋅
mol-1) and four growth rates (20%, 40%, 60%, and 80% of µmax, d-1). N:P = 10 N:P = 14 N:P = 24 20% 40% 60% 80% 20% 40% 60% 80% 20% 40% 60% 80% Content % Content % Content % Content % Content % Content % Content % Content % Content % Content % Content % Content % C14:0 24±2 7 24±5 8 21±3 8 16±4 6 18±2 8 17±1 6 14±2 7 18±2 8 23±5 8 21±1 8 18±3 7 19±2 8 C14:1 1±0 0 1±0 0 1±0 0 2±0 1 1±0 0 1±1 0 1±0 0 1±0 0 0±0 0 0±0 0 0±0 0 1±0 1 C16:0 63±10 19 44±19 15 27±9 10 31±7 12 36±8 15 43±12 17 21±12 11 20±3 9 39±14 15 21±11 8 23±2 9 31±23 14 C16:1ω7 104±3 31 77±23 26 48±14 17 32±7 12 63±11 27 48±5 19 30±9 15 41±9 18 69±24 26 44±6 17 37±5 14 36±12 16 C16:2ω4 5±1 2 8±0 3 9±0 3 18±11 7 7±0 3 10±2 4 9±3 5 12±1 5 6±0 2 9±1 3 10±1 4 10±4 4 C16:3ω4 12±4 4 22±5 7 34±2 12 30±2 12 17±3 7 26±2 10 22±9 11 25±1 11 18±1 7 34±6 13 34±5 13 22±19 10 C18:0 5±1 1 4±2 1 5±1 2 5±2 2 1±0 0 1±0 0 3±2 1 3±1 1 2±1 1 3±1 1 4±1 2 4±1 2 C18:1ω9 10±1 3 4±2 1 2±1 1 4±1 2 3±1 1 4±1 2 3±2 2 5±0 2 6±2 2 2±2 1 2±0 1 5±4 2 C18:1ω7 5±1 2 6±1 2 8±1 3 2±1 1 3±3 1 4±1 2 2±1 1 3±1 1 2±1 1 2±0 1 4±3 1 2±1 1 C18:2ω6 7±1 2 7±1 2 5±1 2 4±2 1 5±1 2 4±1 2 4±1 2 6±1 3 6±1 2 5±1 2 4±1 2 3±1 1 C18:3ω6 2±0 1 3±0 1 2±0 1 2±2 1 1±0 0 1±1 0 2±1 1 1±0 0 3±1 1 3±0 1 3±1 1 1±1 0 C18:3ω3 1±0 0 1±0 0 0±0 0 3±2 1 3±1 1 2±1 1 1±1 1 4±1 2 1±0 0 1±0 0 1±0 0 2±1 1 C18:4ω3 4±1 1 5±1 2 3±0 1 2±0 1 2±0 1 2±0 1 2±1 1 2±0 1 4±1 1 3±2 1 4±1 2 2±0 1 C20:0 1±0 0 1±0 0 0±0 0 1±0 0 0±0 0 0±0 0 0±1 0 1±0 0 1±0 0 0±0 0 0±0 0 1±0 0 C20:4ω6 2±1 0 1±0 0 2±1 1 1±0 0 1±0 0 2±1 1 1±0 1 1±1 0 2±0 1 2±0 1 2±1 1 1±1 0 C20:4ω3 1±0 0 1±0 0 1±0 0 1±1 0 1±0 0 1±0 0 1±0 0 1±0 0 2±0 1 2±1 1 1±0 0 1±0 0 C22:0 1±0 0 1±0 0 1±0 0 1±0 0 1±0 0 1±0 0 1±0 0 1±0 0 1±0 0 1±0 0 1±0 0 1±0 0 C20:5ω3 71±10 21 81±4 27 95±3 35 92±2 35 64±6 27 79±5 31 62±29 32 75±4 33 73±9 27 98±11 37 98±10 38 78±31 34 C22:1ω9 0±0 0 0±0 0 0±0 0 2±1 1 1±0 0 1±0 0 0±0 0 1±0 1 0±0 0 0±0 0 0±0 0 1±0 0 C24:0 2±1 1 3±2 1 2±0 1 2±1 1 1±0 0 1±1 0 1±0 1 1±0 0 2±0 1 3±0 1 2±0 1 1±1 0 C22:6ω3 9±2 3 7±2 2 6±0 2 6±4 2 5±2 2 5±1 2 4±1 2 5±0 2 7±1 3 6±0 2 7±1 3 4±0 2 ∑SFAs 96±9 29 77±25 25 56±12 20 55±8 21 56±6 24 63±12 25 40±8 21 43±5 19 67±19 25 50±13 19 48±4 19 57±22 25 ∑MUFAs 121±4 37 91±28 30 60±15 22 45±6 17 72±16 31 59±7 23 38±12 20 52±10 23 78±27 29 49±8 19 44±8 17 45±15 20 ∑PUFAs 114±18 34 136±4 45 160±5 58 162±18 62 105±5 45 133±7 52 115±32 60 133±10 58 121±12 45 165±15 63 165±21 64 126±55 55 ∑TFAs 331±13 100 301±53 100 275±29 100 261±29 100 233±16 100 254±13 100 192±50 100 228±26 100 266±57 100 263±10 100 256±33 100 227±83 100 ∑ω3 84±11 25 96±7 32 107±4 39 103±5 40 74±4 32 89±4 35 70±32 37 58±51 26 86±11 32 111±9 42 111±12 43 88±32 39 ∑ω6 30±12 9 23±7 7 17±8 6 3±1 1 11±3 5 6±1 2 7±6 4 5±1 2 27±10 10 26±6 10 16±8 6 4±2 2 C16:1ω7/ C16:0 2 2 2 1 2 1 2 2 2 2 2 1 C20:5ω3/ C22:6ω3 8 11 15 16 14 17 16 16 11 15 14 19
Abbreviations: SFAs, saturated fatty acids; MUFAs, monounsaturated fatty acids; PUFAs, polyunsaturated fatty acids; TFAs, total fatty acids; ∑ω3, sum
of ω3-PUFAs; ∑ω6, sum of ω6-PUFAs. Data are expressed as fatty acid contents (mean ± SD) (µg · mg C-1) and percentages of total fatty acids (% of
TFAs). Trace amount of fatty acid individuals are not shown.
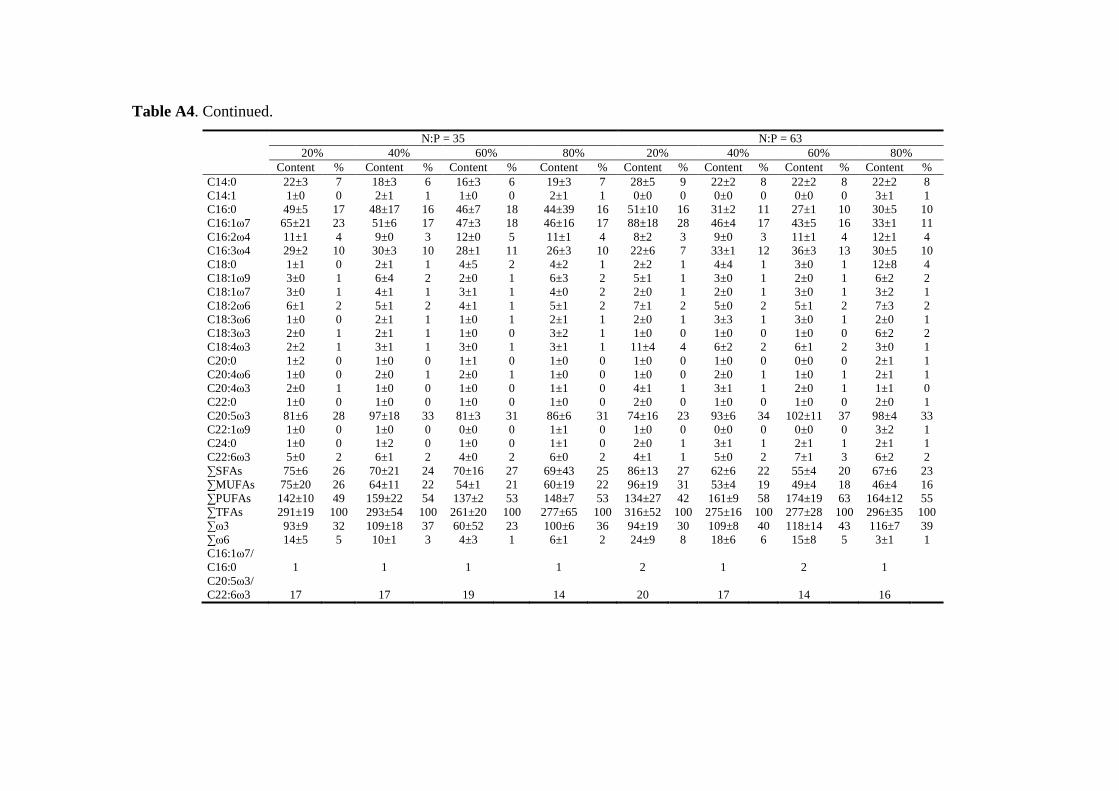
Table A4. Continued. N:P = 35 N:P = 63
20% 40% 60% 80% 20% 40% 60% 80% Content % Content % Content % Content % Content % Content % Content % Content % C14:0 22±3 7 18±3 6 16±3 6 19±3 7 28±5 9 22±2 8 22±2 8 22±2 8 C14:1 1±0 0 2±1 1 1±0 0 2±1 1 0±0 0 0±0 0 0±0 0 3±1 1 C16:0 49±5 17 48±17 16 46±7 18 44±39 16 51±10 16 31±2 11 27±1 10 30±5 10 C16:1ω7 65±21 23 51±6 17 47±3 18 46±16 17 88±18 28 46±4 17 43±5 16 33±1 11 C16:2ω4 11±1 4 9±0 3 12±0 5 11±1 4 8±2 3 9±0 3 11±1 4 12±1 4 C16:3ω4 29±2 10 30±3 10 28±1 11 26±3 10 22±6 7 33±1 12 36±3 13 30±5 10 C18:0 1±1 0 2±1 1 4±5 2 4±2 1 2±2 1 4±4 1 3±0 1 12±8 4 C18:1ω9 3±0 1 6±4 2 2±0 1 6±3 2 5±1 1 3±0 1 2±0 1 6±2 2 C18:1ω7 3±0 1 4±1 1 3±1 1 4±0 2 2±0 1 2±0 1 3±0 1 3±2 1 C18:2ω6 6±1 2 5±1 2 4±1 1 5±1 2 7±1 2 5±0 2 5±1 2 7±3 2 C18:3ω6 1±0 0 2±1 1 1±0 1 2±1 1 2±0 1 3±3 1 3±0 1 2±0 1 C18:3ω3 2±0 1 2±1 1 1±0 0 3±2 1 1±0 0 1±0 0 1±0 0 6±2 2 C18:4ω3 2±2 1 3±1 1 3±0 1 3±1 1 11±4 4 6±2 2 6±1 2 3±0 1 C20:0 1±2 0 1±0 0 1±1 0 1±0 0 1±0 0 1±0 0 0±0 0 2±1 1 C20:4ω6 1±0 0 2±0 1 2±0 1 1±0 0 1±0 0 2±0 1 1±0 1 2±1 1 C20:4ω3 2±0 1 1±0 0 1±0 0 1±1 0 4±1 1 3±1 1 2±0 1 1±1 0 C22:0 1±0 0 1±0 0 1±0 0 1±0 0 2±0 0 1±0 0 1±0 0 2±0 1 C20:5ω3 81±6 28 97±18 33 81±3 31 86±6 31 74±16 23 93±6 34 102±11 37 98±4 33 C22:1ω9 1±0 0 1±0 0 0±0 0 1±1 0 1±0 0 0±0 0 0±0 0 3±2 1 C24:0 1±0 0 1±2 0 1±0 0 1±1 0 2±0 1 3±1 1 2±1 1 2±1 1 C22:6ω3 5±0 2 6±1 2 4±0 2 6±0 2 4±1 1 5±0 2 7±1 3 6±2 2 ∑SFAs 75±6 26 70±21 24 70±16 27 69±43 25 86±13 27 62±6 22 55±4 20 67±6 23 ∑MUFAs 75±20 26 64±11 22 54±1 21 60±19 22 96±19 31 53±4 19 49±4 18 46±4 16 ∑PUFAs 142±10 49 159±22 54 137±2 53 148±7 53 134±27 42 161±9 58 174±19 63 164±12 55 ∑TFAs 291±19 100 293±54 100 261±20 100 277±65 100 316±52 100 275±16 100 277±28 100 296±35 100 ∑ω3 93±9 32 109±18 37 60±52 23 100±6 36 94±19 30 109±8 40 118±14 43 116±7 39 ∑ω6 14±5 5 10±1 3 4±3 1 6±1 2 24±9 8 18±6 6 15±8 5 3±1 1 C16:1ω7/ C16:0 1 1 1 1 2 1 2 1 C20:5ω3/ C22:6ω3 17 17 19 14 20 17 14 16
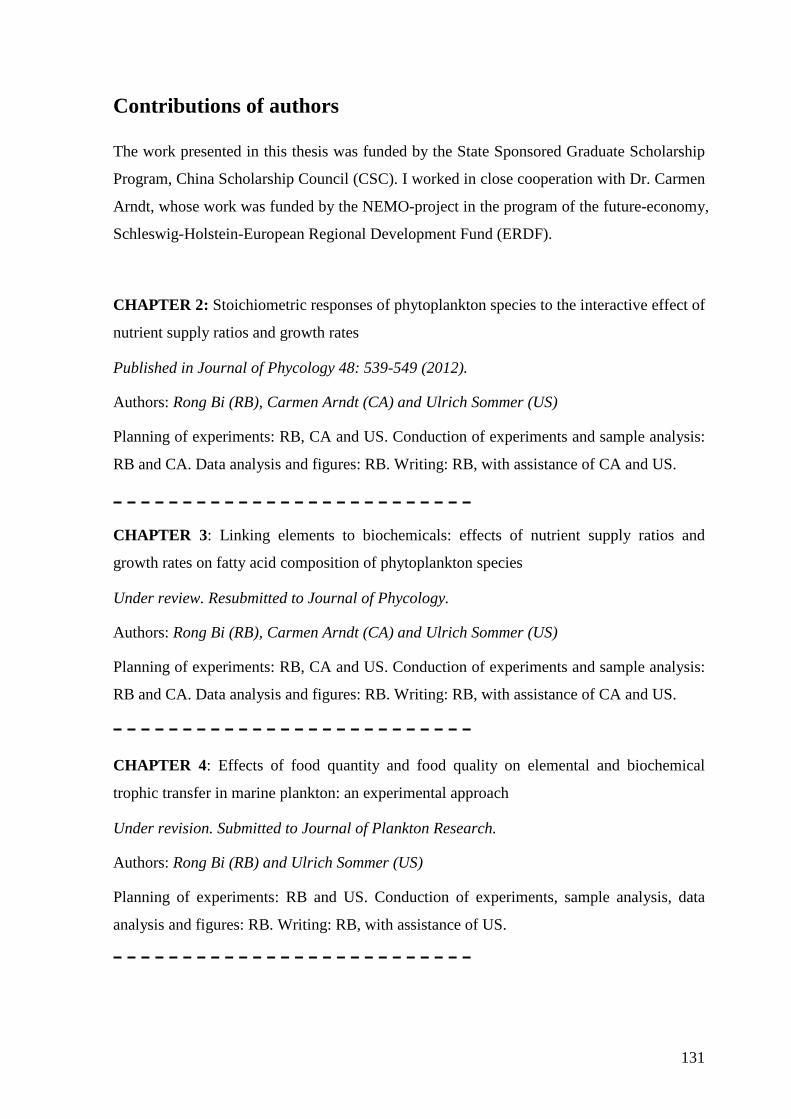
131
Contributions of authors
The work presented in this thesis was funded by the State Sponsored Graduate Scholarship
Program, China Scholarship Council (CSC). I worked in close cooperation with Dr. Carmen
Arndt, whose work was funded by the NEMO-project in the program of the future-economy,
Schleswig-Holstein-European Regional Development Fund (ERDF).
CHAPTER 2: Stoichiometric responses of phytoplankton species to the interactive effect of
nutrient supply ratios and growth rates
Published in Journal of Phycology 48: 539-549 (2012).
Authors: Rong Bi (RB), Carmen Arndt (CA) and Ulrich Sommer (US)
Planning of experiments: RB, CA and US. Conduction of experiments and sample analysis:
RB and CA. Data analysis and figures: RB. Writing: RB, with assistance of CA and US.
CHAPTER 3: Linking elements to biochemicals: effects of nutrient supply ratios and
growth rates on fatty acid composition of phytoplankton species
Under review. Resubmitted to Journal of Phycology.
Authors: Rong Bi (RB), Carmen Arndt (CA) and Ulrich Sommer (US)
Planning of experiments: RB, CA and US. Conduction of experiments and sample analysis:
RB and CA. Data analysis and figures: RB. Writing: RB, with assistance of CA and US.
CHAPTER 4: Effects of food quantity and food quality on elemental and biochemical
trophic transfer in marine plankton: an experimental approach
Under revision. Submitted to Journal of Plankton Research.
Authors: Rong Bi (RB) and Ulrich Sommer (US)
Planning of experiments: RB and US. Conduction of experiments, sample analysis, data
analysis and figures: RB. Writing: RB, with assistance of US.
132
CHAPTER 5: Effects of food quantity and food quality on ingestion rate and nucleic acid
content in the calanoid copepod Acartia tonsa
Unpublished manuscript.
Authors: Rong Bi (RB) and Ulrich Sommer (US)
Planning of experiments: RB and US. Conduction of experiments, sample analysis, data
analysis and figures: RB. Writing: RB, with assistance of US.
133
Acknowledgements
Many thanks to:
My supervisor: Ulrich Sommer;
My committee members: Arne Körtzinger, Stefanie Ismar and Frank Melzner;
My closest collaborator: Carmen Arndt;
My colleagues from the EÖN department, past and present: Monika Winder, Dennis Rossoll, Gabriele Barth, Birte Matthiessen, Helena Hauss, Aleksandra Lewandowska, Jamileh Javid, Kalista Peter, Lena Eggers, Carolin Paul, Vera de Schryver, Jessica Garzke, Agnes Mittermayr, and Juan Carlos Molinero;
The lab manager and technicians: Thomas Hansen, Cordula Meyer, and Bente Gardeler;
My student assistants: Alexander Raschke, Tanya Schchipkova, Dennis Brennecke, Hui Zhang and Ashley Cipriano;
My friends: Antje Viebke and Klaus Viebke;
My family: my parents and parents in law; my husband: Changwei; and my little boy: Mingming;
My source of financial support: the State Sponsored Graduate Scholarship Program, China Scholarship Council (CSC).
134
Curriculum Vitae
Personal data
Name: Rong Bi
Date of birth: 15.04.1983
Place of birth: Rongcheng, P.R. China
Nationality: Chinese
Education
2009 - 2013: PhD student at the Helmholtz Centre for Ocean Research Kiel (GEOMAR), Kiel, Germany
2007 - 2008: Master student in Sino-German Master Program in Marine Science, at the Leibniz Institute of Marine Sciences, Kiel, Germany
2006 - 2009: Master of Science in Marine Ecology, Ocean University of China, Qingdao, P.R. China
2002 - 2006: Bachelor of Engineering in Biotechnology, Qingdao University of Science and Technology, Qingdao, P.R. China
Publications
Bi, R. & Sommer, U. Effects of food quantity and food quality on elemental and biochemical trophic transfer in marine plankton: an experimental approach. Journal of Plankton Research. (Under revision)
Bi, R., Arndt, C. & Sommer, U. Linking elements to biochemicals: effects of nutrient supply ratios and growth rates on fatty acid composition of phytoplankton species. Journal of Phycology. (Under review, resubmitted)
Bi, R., Wang, Y., Wang, R.J., Li, W. & Tang, X.X. Effects of anthracene on the interactions between Platymonas helgolandica var. tsingtaoensis and heterosigma akashiwo in laboratory cultures. Journal of Ocean University of China. (Accepted)
Bi, R., Arndt, C. & Sommer, U. 2012. Stoichiometric responses of phytoplankton species to the interactive effect of nutrient supply ratios and growth rates. Journal of Phycology. 48: 539-549.
Wang, G.Q., Bi, R., Nan, C.R. & Tang, X.X. 2010. The study of pH changes during the growth of three species of red tide microalgae and pH tolerance of them. Marine Environmental Science. 29: 679-682. (In Chinese with English abstract)
Bi, R., Wang, Y., Xiao, H., Li, W. & Tang, X.X. 2010. The effect of CO2 enhancement on the population competition between Alexandrium tamarense and Nitzschia closterium Ehr. Marine Environmental Science. 29: 667-670. (In Chinese with English abstract)
135
Declaration
The content and design of this thesis, apart from the supervisor’s guidance, is my own work.
The thesis has not been submitted either partially or wholly as a part of a doctoral degree to
another examining body. The thesis has not been published or submitted for publication,
while one chapter (CHAPTER 2) has been published in a scientific journal (Journal of
Phycology) and two chapters (CHAPTER 3 and CHAPTER 4) have been submitted to
scientific journals (Journal of Phycology and Journal of Plankton Research, respectively) for
peer review. The thesis has been prepared respecting the Rules of Good Scientific Practice
of the German Research Foundation.
Kiel
Rong Bi
Related Documents

![Effect of Freshwater Influx on Phytoplankton in the ... · phytoplankton pigment composition and functionality in response to ecosystem changes in the southeastern US estuaries [10],](https://static.cupdf.com/doc/110x72/5fc8002d998e1c47571eefeb/effect-of-freshwater-influx-on-phytoplankton-in-the-phytoplankton-pigment-composition.jpg)