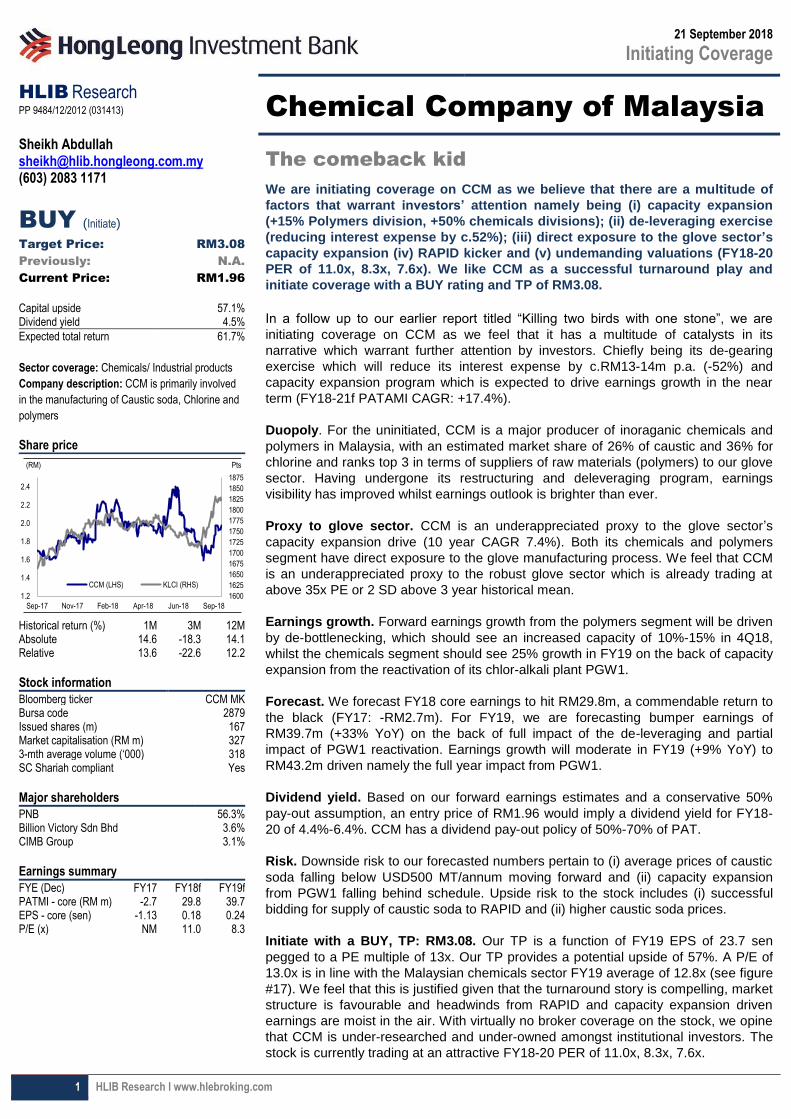
1 HLIB Research l www.hlebroking.com 21 September 2018 Initiating Coverage HLIB Research PP 9484/12/2012 (031413) Chemical Company of Malaysia Sheikh Abdullah [email protected] (603) 2083 1171 BUY (Initiate) Target Price: RM3.08 Previously: N.A. Current Price: RM1.96 Capital upside 57.1% Dividend yield 4.5% Expected total return 61.7% Sector coverage: Chemicals/ Industrial products Company description: CCM is primarily involved in the manufacturing of Caustic soda, Chlorine and polymers Share price Historical return (%) 1M 3M 12M Absolute 14.6 -18.3 14.1 Relative 13.6 -22.6 12.2 Stock information Bloomberg ticker CCM MK Bursa code 2879 Issued shares (m) 167 Market capitalisation (RM m) 327 3-mth average volume (‘000) 318 SC Shariah compliant Yes Major shareholders PNB 56.3% Billion Victory Sdn Bhd 3.6% CIMB Group 3.1% Earnings summary FYE (Dec) FY17 FY18f FY19f PATMI - core (RM m) -2.7 29.8 39.7 EPS - core (sen) -1.13 0.18 0.24 P/E (x) NM 11.0 8.3 The comeback kid We are initiating coverage on CCM as we believe that there are a multitude of factors that warrant investors’ attention namely being (i) capacity expansion (+15% Polymers division, +50% chemicals divisions); (ii) de-leveraging exercise (reducing interest expense by c.52%); (iii) direct exposure to the glove sector’s capacity expansion (iv) RAPID kicker and (v) undemanding valuations (FY18-20 PER of 11.0x, 8.3x, 7.6x). We like CCM as a successful turnaround play and initiate coverage with a BUY rating and TP of RM3.08. In a follow up to our earlier report titled “Killing two birds with one stone”, we are initiating coverage on CCM as we feel that it has a multitude of catalysts in its narrative which warrant further attention by investors. Chiefly being its de-gearing exercise which will reduce its interest expense by c.RM13-14m p.a. (-52%) and capacity expansion program which is expected to drive earnings growth in the near term (FY18-21f PATAMI CAGR: +17.4%). Duopoly. For the uninitiated, CCM is a major producer of inoraganic chemicals and polymers in Malaysia, with an estimated market share of 26% of caustic and 36% for chlorine and ranks top 3 in terms of suppliers of raw materials (polymers) to our glove sector. Having undergone its restructuring and deleveraging program, earnings visibility has improved whilst earnings outlook is brighter than ever. Proxy to glove sector. CCM is an underappreciated proxy to the glove sector’s capacity expansion drive (10 year CAGR 7.4%). Both its chemicals and polymers segment have direct exposure to the glove manufacturing process. We feel that CCM is an underappreciated proxy to the robust glove sector which is already trading at above 35x PE or 2 SD above 3 year historical mean. Earnings growth. Forward earnings growth from the polymers segment will be driven by de-bottlenecking, which should see an increased capacity of 10%-15% in 4Q18, whilst the chemicals segment should see 25% growth in FY19 on the back of capacity expansion from the reactivation of its chlor-alkali plant PGW1. Forecast. We forecast FY18 core earnings to hit RM29.8m, a commendable return to the black (FY17: -RM2.7m). For FY19, we are forecasting bumper earnings of RM39.7m (+33% YoY) on the back of full impact of the de-leveraging and partial impact of PGW1 reactivation. Earnings growth will moderate in FY19 (+9% YoY) to RM43.2m driven namely the full year impact from PGW1. Dividend yield. Based on our forward earnings estimates and a conservative 50% pay-out assumption, an entry price of RM1.96 would imply a dividend yield for FY18- 20 of 4.4%-6.4%. CCM has a dividend pay-out policy of 50%-70% of PAT. Risk. Downside risk to our forecasted numbers pertain to (i) average prices of caustic soda falling below USD500 MT/annum moving forward and (ii) capacity expansion from PGW1 falling behind schedule. Upside risk to the stock includes (i) successful bidding for supply of caustic soda to RAPID and (ii) higher caustic soda prices. Initiate with a BUY, TP: RM3.08. Our TP is a function of FY19 EPS of 23.7 sen pegged to a PE multiple of 13x. Our TP provides a potential upside of 57%. A P/E of 13.0x is in line with the Malaysian chemicals sector FY19 average of 12.8x (see figure #17). We feel that this is justified given that the turnaround story is compelling, market structure is favourable and headwinds from RAPID and capacity expansion driven earnings are moist in the air. With virtually no broker coverage on the stock, we opine that CCM is under-researched and under-owned amongst institutional investors. The stock is currently trading at an attractive FY18-20 PER of 11.0x, 8.3x, 7.6x. 1600 1625 1650 1675 1700 1725 1750 1775 1800 1825 1850 1875 1.2 1.4 1.6 1.8 2.0 2.2 2.4 Sep-17 Nov-17 Feb-18 Apr-18 Jun-18 Sep-18 Pts (RM) CCM (LHS) KLCI (RHS)

Welcome message from author
This document is posted to help you gain knowledge. Please leave a comment to let me know what you think about it! Share it to your friends and learn new things together.
Transcript
1 HLIB Research l www.hlebroking.com
21 September 2018
Initiating Coverage
HLIB Research PP 9484/12/2012 (031413)
Chemical Company of Malaysia
Sheikh Abdullah [email protected] (603) 2083 1171
BUY (Initiate)
Target Price: RM3.08
Previously: N.A.
Current Price: RM1.96
Capital upside 57.1% Dividend yield 4.5%
Expected total return 61.7%
Sector coverage: Chemicals/ Industrial products
Company description: CCM is primarily involved
in the manufacturing of Caustic soda, Chlorine and
polymers
Share price
Historical return (%) 1M 3M 12M Absolute 14.6 -18.3 14.1 Relative 13.6 -22.6 12.2
Stock information
Bloomberg ticker CCM MK Bursa code 2879 Issued shares (m) 167 Market capitalisation (RM m) 327 3-mth average volume (‘000) 318 SC Shariah compliant Yes
Major shareholders
PNB 56.3% Billion Victory Sdn Bhd 3.6% CIMB Group 3.1%
Earnings summary
FYE (Dec) FY17 FY18f FY19f PATMI - core (RM m) -2.7 29.8 39.7 EPS - core (sen) -1.13 0.18 0.24 P/E (x) NM 11.0 8.3
The comeback kid
We are initiating coverage on CCM as we believe that there are a multitude of
factors that warrant investors’ attention namely being (i) capacity expansion
(+15% Polymers division, +50% chemicals divisions); (ii) de-leveraging exercise
(reducing interest expense by c.52%); (iii) direct exposure to the glove sector’s
capacity expansion (iv) RAPID kicker and (v) undemanding valuations (FY18-20
PER of 11.0x, 8.3x, 7.6x). We like CCM as a successful turnaround play and
initiate coverage with a BUY rating and TP of RM3.08.
In a follow up to our earlier report titled “Killing two birds with one stone”, we are
initiating coverage on CCM as we feel that it has a multitude of catalysts in its
narrative which warrant further attention by investors. Chiefly being its de-gearing
exercise which will reduce its interest expense by c.RM13-14m p.a. (-52%) and
capacity expansion program which is expected to drive earnings growth in the near
term (FY18-21f PATAMI CAGR: +17.4%).
Duopoly. For the uninitiated, CCM is a major producer of inoraganic chemicals and
polymers in Malaysia, with an estimated market share of 26% of caustic and 36% for
chlorine and ranks top 3 in terms of suppliers of raw materials (polymers) to our glove
sector. Having undergone its restructuring and deleveraging program, earnings
visibility has improved whilst earnings outlook is brighter than ever.
Proxy to glove sector. CCM is an underappreciated proxy to the glove sector’s
capacity expansion drive (10 year CAGR 7.4%). Both its chemicals and polymers
segment have direct exposure to the glove manufacturing process. We feel that CCM
is an underappreciated proxy to the robust glove sector which is already trading at
above 35x PE or 2 SD above 3 year historical mean.
Earnings growth. Forward earnings growth from the polymers segment will be driven
by de-bottlenecking, which should see an increased capacity of 10%-15% in 4Q18,
whilst the chemicals segment should see 25% growth in FY19 on the back of capacity
expansion from the reactivation of its chlor-alkali plant PGW1.
Forecast. We forecast FY18 core earnings to hit RM29.8m, a commendable return to
the black (FY17: -RM2.7m). For FY19, we are forecasting bumper earnings of
RM39.7m (+33% YoY) on the back of full impact of the de-leveraging and partial
impact of PGW1 reactivation. Earnings growth will moderate in FY19 (+9% YoY) to
RM43.2m driven namely the full year impact from PGW1.
Dividend yield. Based on our forward earnings estimates and a conservative 50%
pay-out assumption, an entry price of RM1.96 would imply a dividend yield for FY18-
20 of 4.4%-6.4%. CCM has a dividend pay-out policy of 50%-70% of PAT.
Risk. Downside risk to our forecasted numbers pertain to (i) average prices of caustic
soda falling below USD500 MT/annum moving forward and (ii) capacity expansion
from PGW1 falling behind schedule. Upside risk to the stock includes (i) successful
bidding for supply of caustic soda to RAPID and (ii) higher caustic soda prices.
Initiate with a BUY, TP: RM3.08. Our TP is a function of FY19 EPS of 23.7 sen
pegged to a PE multiple of 13x. Our TP provides a potential upside of 57%. A P/E of
13.0x is in line with the Malaysian chemicals sector FY19 average of 12.8x (see figure
#17). We feel that this is justified given that the turnaround story is compelling, market
structure is favourable and headwinds from RAPID and capacity expansion driven
earnings are moist in the air. With virtually no broker coverage on the stock, we opine
that CCM is under-researched and under-owned amongst institutional investors. The
stock is currently trading at an attractive FY18-20 PER of 11.0x, 8.3x, 7.6x.
1600
1625
1650
1675
1700
1725
1750
1775
1800
1825
1850
1875
1.2
1.4
1.6
1.8
2.0
2.2
2.4
Sep-17 Nov-17 Feb-18 Apr-18 Jun-18 Sep-18
Pts(RM)
CCM (LHS) KLCI (RHS)
Chemical Company of Malaysia l Initiating Coverage
2 HLIB Research l www.hlebroking.com
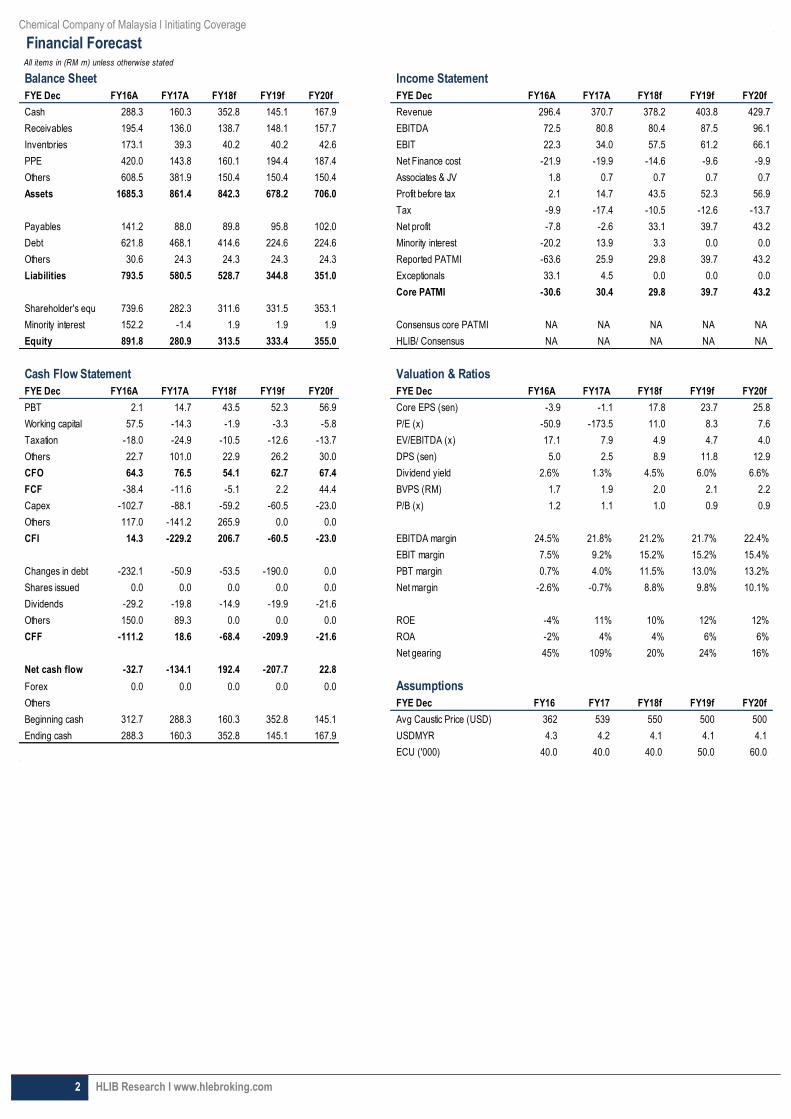
Financial ForecastAll items in (RM m) unless otherwise stated
Balance Sheet Income Statement
FYE Dec FY16A FY17A FY18f FY19f FY20f FYE Dec FY16A FY17A FY18f FY19f FY20f
Cash 288.3 160.3 352.8 145.1 167.9 Revenue 296.4 370.7 378.2 403.8 429.7
Receivables 195.4 136.0 138.7 148.1 157.7 EBITDA 72.5 80.8 80.4 87.5 96.1
Inventories 173.1 39.3 40.2 40.2 42.6 EBIT 22.3 34.0 57.5 61.2 66.1
PPE 420.0 143.8 160.1 194.4 187.4 Net Finance cost -21.9 -19.9 -14.6 -9.6 -9.9
Others 608.5 381.9 150.4 150.4 150.4 Associates & JV 1.8 0.7 0.7 0.7 0.7
Assets 1685.3 861.4 842.3 678.2 706.0 Profit before tax 2.1 14.7 43.5 52.3 56.9
Tax -9.9 -17.4 -10.5 -12.6 -13.7
Payables 141.2 88.0 89.8 95.8 102.0 Net profit -7.8 -2.6 33.1 39.7 43.2
Debt 621.8 468.1 414.6 224.6 224.6 Minority interest -20.2 13.9 3.3 0.0 0.0
Others 30.6 24.3 24.3 24.3 24.3 Reported PATMI -63.6 25.9 29.8 39.7 43.2
Liabilities 793.5 580.5 528.7 344.8 351.0 Exceptionals 33.1 4.5 0.0 0.0 0.0
Core PATMI -30.6 30.4 29.8 39.7 43.2
Shareholder's equity 739.6 282.3 311.6 331.5 353.1
Minority interest 152.2 -1.4 1.9 1.9 1.9 Consensus core PATMI NA NA NA NA NA
Equity 891.8 280.9 313.5 333.4 355.0 HLIB/ Consensus NA NA NA NA NA
Cash Flow Statement Valuation & Ratios
FYE Dec FY16A FY17A FY18f FY19f FY20f FYE Dec FY16A FY17A FY18f FY19f FY20f
PBT 2.1 14.7 43.5 52.3 56.9 Core EPS (sen) -3.9 -1.1 17.8 23.7 25.8
Working capital 57.5 -14.3 -1.9 -3.3 -5.8 P/E (x) -50.9 -173.5 11.0 8.3 7.6
Taxation -18.0 -24.9 -10.5 -12.6 -13.7 EV/EBITDA (x) 17.1 7.9 4.9 4.7 4.0
Others 22.7 101.0 22.9 26.2 30.0 DPS (sen) 5.0 2.5 8.9 11.8 12.9
CFO 64.3 76.5 54.1 62.7 67.4 Dividend yield 2.6% 1.3% 4.5% 6.0% 6.6%
FCF -38.4 -11.6 -5.1 2.2 44.4 BVPS (RM) 1.7 1.9 2.0 2.1 2.2
Capex -102.7 -88.1 -59.2 -60.5 -23.0 P/B (x) 1.2 1.1 1.0 0.9 0.9
Others 117.0 -141.2 265.9 0.0 0.0
CFI 14.3 -229.2 206.7 -60.5 -23.0 EBITDA margin 24.5% 21.8% 21.2% 21.7% 22.4%
EBIT margin 7.5% 9.2% 15.2% 15.2% 15.4%
Changes in debt -232.1 -50.9 -53.5 -190.0 0.0 PBT margin 0.7% 4.0% 11.5% 13.0% 13.2%
Shares issued 0.0 0.0 0.0 0.0 0.0 Net margin -2.6% -0.7% 8.8% 9.8% 10.1%
Dividends -29.2 -19.8 -14.9 -19.9 -21.6
Others 150.0 89.3 0.0 0.0 0.0 ROE -4% 11% 10% 12% 12%
CFF -111.2 18.6 -68.4 -209.9 -21.6 ROA -2% 4% 4% 6% 6%
Net gearing 45% 109% 20% 24% 16%
Net cash flow -32.7 -134.1 192.4 -207.7 22.8
Forex 0.0 0.0 0.0 0.0 0.0 Assumptions
Others FYE Dec FY16 FY17 FY18f FY19f FY20f
Beginning cash 312.7 288.3 160.3 352.8 145.1 Avg Caustic Price (USD) 362 539 550 500 500
Ending cash 288.3 160.3 352.8 145.1 167.9 USDMYR 4.3 4.2 4.1 4.1 4.1
ECU ('000) 40.0 40.0 40.0 50.0 60.0
Chemical Company of Malaysia l Initiating Coverage
3 HLIB Research l www.hlebroking.com
Background
Over 5 decades of expertise. Chemical Company of Malaysia Bhd (“CCM”) has been involved in
the chemicals business since 1963, providing the nation with the necessary building blocks for
industrialization. The chlor alkali market in Malaysia is essentially a duopoly with the main
manufacturers being CCM and Batu Kawan (not-rated) (via its subsidiary Malay Sino Bhd), with
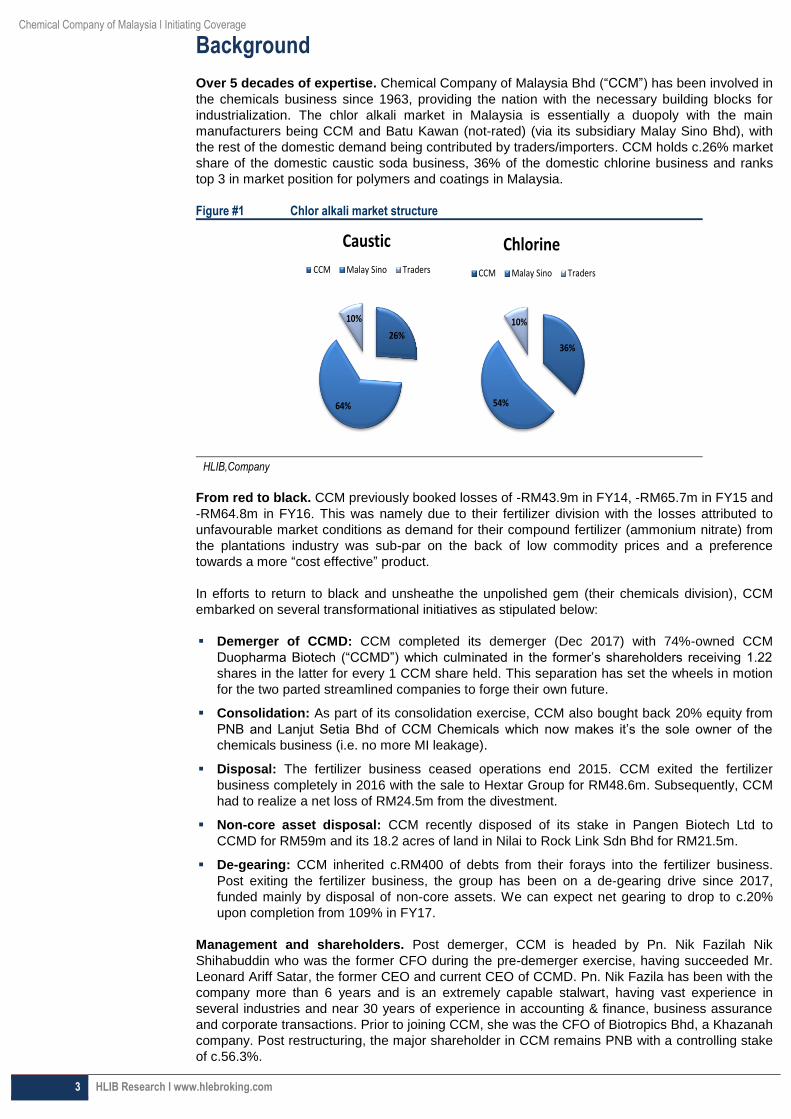
the rest of the domestic demand being contributed by traders/importers. CCM holds c.26% market
share of the domestic caustic soda business, 36% of the domestic chlorine business and ranks
top 3 in market position for polymers and coatings in Malaysia.
Figure #1 Chlor alkali market structure
HLIB,Company
From red to black. CCM previously booked losses of -RM43.9m in FY14, -RM65.7m in FY15 and
-RM64.8m in FY16. This was namely due to their fertilizer division with the losses attributed to
unfavourable market conditions as demand for their compound fertilizer (ammonium nitrate) from
the plantations industry was sub-par on the back of low commodity prices and a preference
towards a more “cost effective” product.
In efforts to return to black and unsheathe the unpolished gem (their chemicals division), CCM
embarked on several transformational initiatives as stipulated below:
Demerger of CCMD: CCM completed its demerger (Dec 2017) with 74%-owned CCM
Duopharma Biotech (“CCMD”) which culminated in the former’s shareholders receiving 1.22
shares in the latter for every 1 CCM share held. This separation has set the wheels in motion
for the two parted streamlined companies to forge their own future.
Consolidation: As part of its consolidation exercise, CCM also bought back 20% equity from
PNB and Lanjut Setia Bhd of CCM Chemicals which now makes it’s the sole owner of the
chemicals business (i.e. no more MI leakage).
Disposal: The fertilizer business ceased operations end 2015. CCM exited the fertilizer
business completely in 2016 with the sale to Hextar Group for RM48.6m. Subsequently, CCM
had to realize a net loss of RM24.5m from the divestment.
Non-core asset disposal: CCM recently disposed of its stake in Pangen Biotech Ltd to
CCMD for RM59m and its 18.2 acres of land in Nilai to Rock Link Sdn Bhd for RM21.5m.
De-gearing: CCM inherited c.RM400 of debts from their forays into the fertilizer business.
Post exiting the fertilizer business, the group has been on a de-gearing drive since 2017,
funded mainly by disposal of non-core assets. We can expect net gearing to drop to c.20%
upon completion from 109% in FY17.
Management and shareholders. Post demerger, CCM is headed by Pn. Nik Fazilah Nik
Shihabuddin who was the former CFO during the pre-demerger exercise, having succeeded Mr.
Leonard Ariff Satar, the former CEO and current CEO of CCMD. Pn. Nik Fazila has been with the
company more than 6 years and is an extremely capable stalwart, having vast experience in
several industries and near 30 years of experience in accounting & finance, business assurance
and corporate transactions. Prior to joining CCM, she was the CFO of Biotropics Bhd, a Khazanah
company. Post restructuring, the major shareholder in CCM remains PNB with a controlling stake
of c.56.3%.
36%
54%
10%
Chlorine
CCM Malay Sino Traders
26%
64%
10%
Caustic
CCM Malay Sino Traders
Chemical Company of Malaysia l Initiating Coverage
4 HLIB Research l www.hlebroking.com
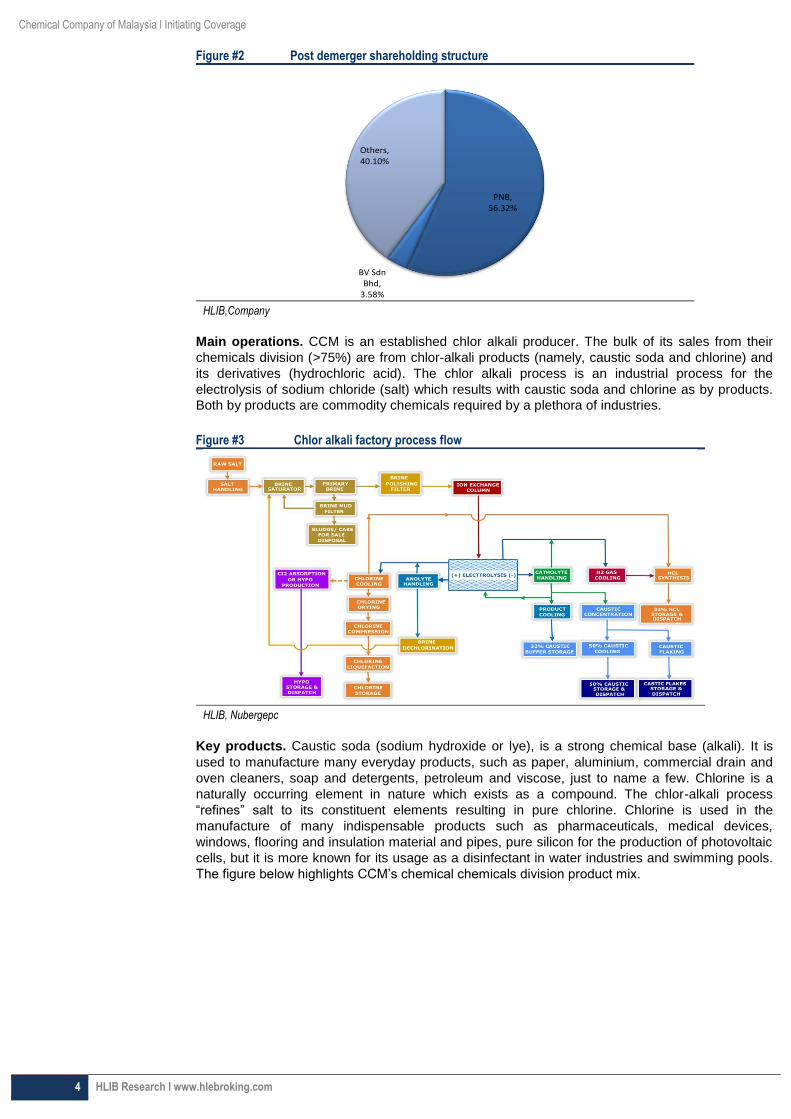
Figure #2 Post demerger shareholding structure
HLIB,Company
Main operations. CCM is an established chlor alkali producer. The bulk of its sales from their
chemicals division (>75%) are from chlor-alkali products (namely, caustic soda and chlorine) and
its derivatives (hydrochloric acid). The chlor alkali process is an industrial process for the
electrolysis of sodium chloride (salt) which results with caustic soda and chlorine as by products.
Both by products are commodity chemicals required by a plethora of industries.
Figure #3 Chlor alkali factory process flow
HLIB, Nubergepc
Key products. Caustic soda (sodium hydroxide or lye), is a strong chemical base (alkali). It is
used to manufacture many everyday products, such as paper, aluminium, commercial drain and
oven cleaners, soap and detergents, petroleum and viscose, just to name a few. Chlorine is a
naturally occurring element in nature which exists as a compound. The chlor-alkali process
“refines” salt to its constituent elements resulting in pure chlorine. Chlorine is used in the
manufacture of many indispensable products such as pharmaceuticals, medical devices,
windows, flooring and insulation material and pipes, pure silicon for the production of photovoltaic
cells, but it is more known for its usage as a disinfectant in water industries and swimming pools.
The figure below highlights CCM’s chemical chemicals division product mix.
PNB, 56.32%
BV Sdn Bhd,
3.58%
Others, 40.10%
Chemical Company of Malaysia l Initiating Coverage
5 HLIB Research l www.hlebroking.com
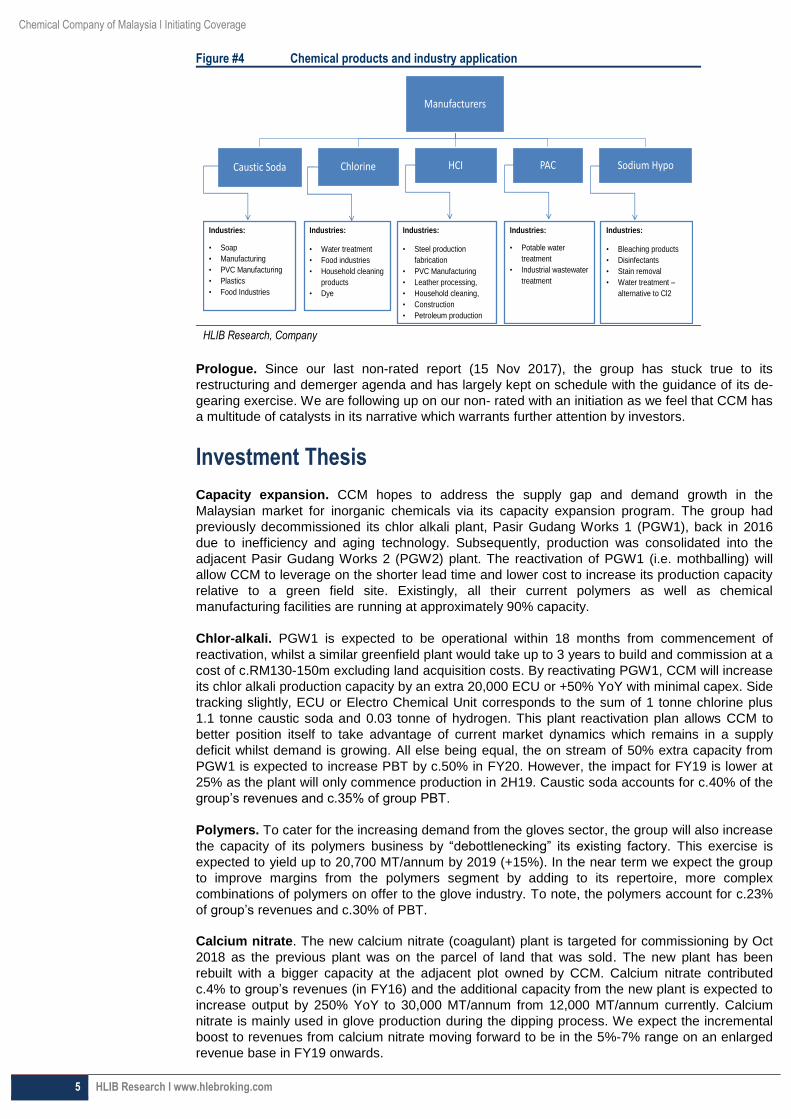
Figure #4 Chemical products and industry application
HLIB Research, Company
Prologue. Since our last non-rated report (15 Nov 2017), the group has stuck true to its
restructuring and demerger agenda and has largely kept on schedule with the guidance of its de-
gearing exercise. We are following up on our non- rated with an initiation as we feel that CCM has
a multitude of catalysts in its narrative which warrants further attention by investors.
Investment Thesis
Capacity expansion. CCM hopes to address the supply gap and demand growth in the
Malaysian market for inorganic chemicals via its capacity expansion program. The group had
previously decommissioned its chlor alkali plant, Pasir Gudang Works 1 (PGW1), back in 2016
due to inefficiency and aging technology. Subsequently, production was consolidated into the
adjacent Pasir Gudang Works 2 (PGW2) plant. The reactivation of PGW1 (i.e. mothballing) will
allow CCM to leverage on the shorter lead time and lower cost to increase its production capacity
relative to a green field site. Existingly, all their current polymers as well as chemical
manufacturing facilities are running at approximately 90% capacity.
Chlor-alkali. PGW1 is expected to be operational within 18 months from commencement of
reactivation, whilst a similar greenfield plant would take up to 3 years to build and commission at a
cost of c.RM130-150m excluding land acquisition costs. By reactivating PGW1, CCM will increase
its chlor alkali production capacity by an extra 20,000 ECU or +50% YoY with minimal capex. Side
tracking slightly, ECU or Electro Chemical Unit corresponds to the sum of 1 tonne chlorine plus
1.1 tonne caustic soda and 0.03 tonne of hydrogen. This plant reactivation plan allows CCM to
better position itself to take advantage of current market dynamics which remains in a supply
deficit whilst demand is growing. All else being equal, the on stream of 50% extra capacity from
PGW1 is expected to increase PBT by c.50% in FY20. However, the impact for FY19 is lower at
25% as the plant will only commence production in 2H19. Caustic soda accounts for c.40% of the
group’s revenues and c.35% of group PBT.
Polymers. To cater for the increasing demand from the gloves sector, the group will also increase
the capacity of its polymers business by “debottlenecking” its existing factory. This exercise is
expected to yield up to 20,700 MT/annum by 2019 (+15%). In the near term we expect the group
to improve margins from the polymers segment by adding to its repertoire, more complex
combinations of polymers on offer to the glove industry. To note, the polymers account for c.23%
of group’s revenues and c.30% of PBT.
Calcium nitrate. The new calcium nitrate (coagulant) plant is targeted for commissioning by Oct
2018 as the previous plant was on the parcel of land that was sold. The new plant has been
rebuilt with a bigger capacity at the adjacent plot owned by CCM. Calcium nitrate contributed
c.4% to group’s revenues (in FY16) and the additional capacity from the new plant is expected to
increase output by 250% YoY to 30,000 MT/annum from 12,000 MT/annum currently. Calcium
nitrate is mainly used in glove production during the dipping process. We expect the incremental
boost to revenues from calcium nitrate moving forward to be in the 5%-7% range on an enlarged
revenue base in FY19 onwards.
Industries:
• Soap
• Manufacturing
• PVC Manufacturing
• Plastics
• Food Industries
Industries:
• Water treatment
• Food industries
• Household cleaning
products
• Dye
Industries:
• Steel production
fabrication
• PVC Manufacturing
• Leather processing,
• Household cleaning,
• Construction
• Petroleum production
Industries:
• Bleaching products
• Disinfectants
• Stain removal
• Water treatment –
alternative to Cl2
Industries:
• Potable water
treatment
• Industrial wastewater
treatment
Manufacturers
Caustic Soda Chlorine HCI PAC Sodium Hypo

Chemical Company of Malaysia l Initiating Coverage
6 HLIB Research l www.hlebroking.com
Figure #5 Malaysia – net importer of caustic soda
HLIB,Company
The market is short. There is a supply deficit in the inorganic chemicals market in Malaysia, with
caustic soda and hydrochloric acid (HCL) being short due to the growing needs of our various
domestic industries. Caustic soda has a supply gap of 142,000 MT/ annum or 33.8% of total
estimated demand whilst HCL has a supply gap of 43,000 MT/annum or 14.3% of total estimated
demand, which at this juncture, is being filled by traders and importers (see figure #5 and #6).
Figure #6 Malaysia – net importer of Caustic soda
HLIB,Company
Supply gap to widen. In view of Petronas’s RAPID (refinery and petrochemical integrated
development) commencing operations by 1H19, we expect the demand for caustic soda to
increase substantially. In oil & gas refining, caustic soda is used in the extraction of sulphur,
sulphur compounds and acids. We understand that the oncoming demand from RAPID alone is
c.156,000 MT/annum of caustic soda liquid. We estimate that at a price of USD500/MT, the
market value of RAPID’s demand for caustic soda annually at full ramp up is c.USD40m
(RM160m). This increase is expected to widen the supply gap from 142,000 MT/annum to
298,000 MT/annum (+101% YoY, with a market value of USD75m), without taking into account
organic growth of existing industries.
HCL. The current supply gap for hydrochloric acid (HCL) is 43,000MT p.a. and is expected to
widen with the commissioning of Altech Chemicals Ltd’s (listed on the ASX) high purity aluminium
plant and SDP Global Ltd’s super absorbent polymer plant (a subsidiary of Sanyo Chemical
Industries Ltd, listed in Japan) in 2019. In view of these MNC’s setting up a manufacturing base in
Johor, it has been touted that the supply gap is expected to widen by 9,000MT/annum (+21%
YoY) to 52,000MT/year from 2019 onwards.
43
210
47
0
50
100
150
200
250
300
350
HCL
MT/Year
CCM
MS
Imports
142
204
84
0
50
100
150
200
250
300
350
400
450
500
Caustic soda
MT/Year
CCM
MS
Imports

Chemical Company of Malaysia l Initiating Coverage
7 HLIB Research l www.hlebroking.com
Figure #7 Caustic Supply Deficit to Widen (Liquid)
HLIB, Company
Industry Analysis
Recent caustic price crash. In recent months, the prices of caustic soda has traced down
towards the base level of 2017 at USD391 as at end July 2018 from a high of USD754/MT in Dec
2017. We understand that this phenomenon is a function of several factors: (i) the recent re-
embargo and trade sanctions to the Middle East, which has seen a shift in cargo destined to the
Middle East being dumped in Asia resulting in a short term increase in supply and (ii) Indonesian
major producers having high inventories of caustic as they have built up inventories for 2 major
rayon facilities in Indonesia - which were supposed to start operation in July but have since been
delayed to Sept, resulting in some dumping and (iii) curbs on the alumina industry in China in
tandem with their pollution reduction policy saw many alumina refineries shutting down. Caustic
soda is a major input material in the production of alumina. As such, Chinese caustic producers
are also re-routing their production to the ASEAN market which is short.
Figure #8 3 year historical - Asia caustic soda prices
HLIB, Bloomberg
Consolation. We do expect the prices to recover in the near term due to competition from Middle
Eastern suppliers easing as we understand that traders are seeing lower export allocation. This is
believed to be on the back of the commencement of the Al Taweelah Alumina refinery (UAE)
which will produce approximately 2m tonnes of alumina p.a. (c.85kg of caustic soda used to refine
1MT of alumina, first batch of alumina to be delivered by 1H19). The expected price recovery of
caustic soda should also be driven by the commencement of 2 rayon plants (manufactured fibre
made from regenerated cellulose fibre) in Indonesia in 4Q18. Lastly, demand (and price recovery)
for caustic soda will also be driven by progressive demand from RAPID beginning 2019.
39,000
78,000
156,000
-
50,000
100,000
150,000
200,000
250,000
300,000
350,000
2017
2018
2019
2020
2021
Caustic Soda supplyshortage
MT/
annu
m
Pengerangdemand
Present deficit
0
100
200
300
400
500
600
700
800
3/4/2015 3/4/2016 3/4/2017 3/4/2018
USD
/MT
POLICSSA Index POLICSNA Index
Chemical Company of Malaysia l Initiating Coverage
8 HLIB Research l www.hlebroking.com
Global capacity outlook. We understand that Chinese caustic soda producers are affected by
the environmental inspections, thus keeping operating rates of Chinese chlor-alkali producers
below optimal capacity. President Xi Jinping’s eco drive has made environmental inspections a
standard requirement, which means that moving forward production curbs due to failing
environmental requirements are the new norm. It is estimated China accounts for c.55% of global
production capacity, which according to IHS Markit, global production capacity is c.90m MT with a
utilization rate of >80%. Furthermore, the global market was also hit by closures in Europe
attributed to the end-2017 deadline to phase out mercury cell production. This resulted in an
estimated loss of c.1m dry metric tonnes (DMT)/year in capacity from plant shut downs, turning
Europe into a net importer moving forward. We understand that c.400-450 USD/DMT is the break-
even price for Chinese producers as such these levels should serve as a floor price for the Asian
market.
Lower cost producer. Electricity is the main feedstock of a chlor-alkali plant. Given Malaysia’s
lower cost of electricity relative to China, the former is a lower cost producer - ex the scale (cost of
electricity in China according to CEIC is 0.9 RMB/Kwh or 54sen/Kwh vs. Malaysia’s 38sen/Kwh).
All the above factors should bode well for an expected price recovery in the near term.
Furthermore, we believe that the caustic prices from Bloomberg (POLICCSEA Index) do not fully
reflect the actual pricing in the domestic Malaysian market. We are of the opinion that due to the
oligopolistic market structure and shortage in the Malaysian market, long term off takers from
CCM are more likely to be price takers. We are also inclined to believe that the POLICCSEA
Index prices serve as a good guideline but it is not gospel. With regard to caustic supply from
traders (importers) “hurting the market”, we opine that their lack continuity and scale given that
they are subjected to trade allocations from international producers as well as market share
encroachment by the duopoly, makes them negligible to CCM’s operations.
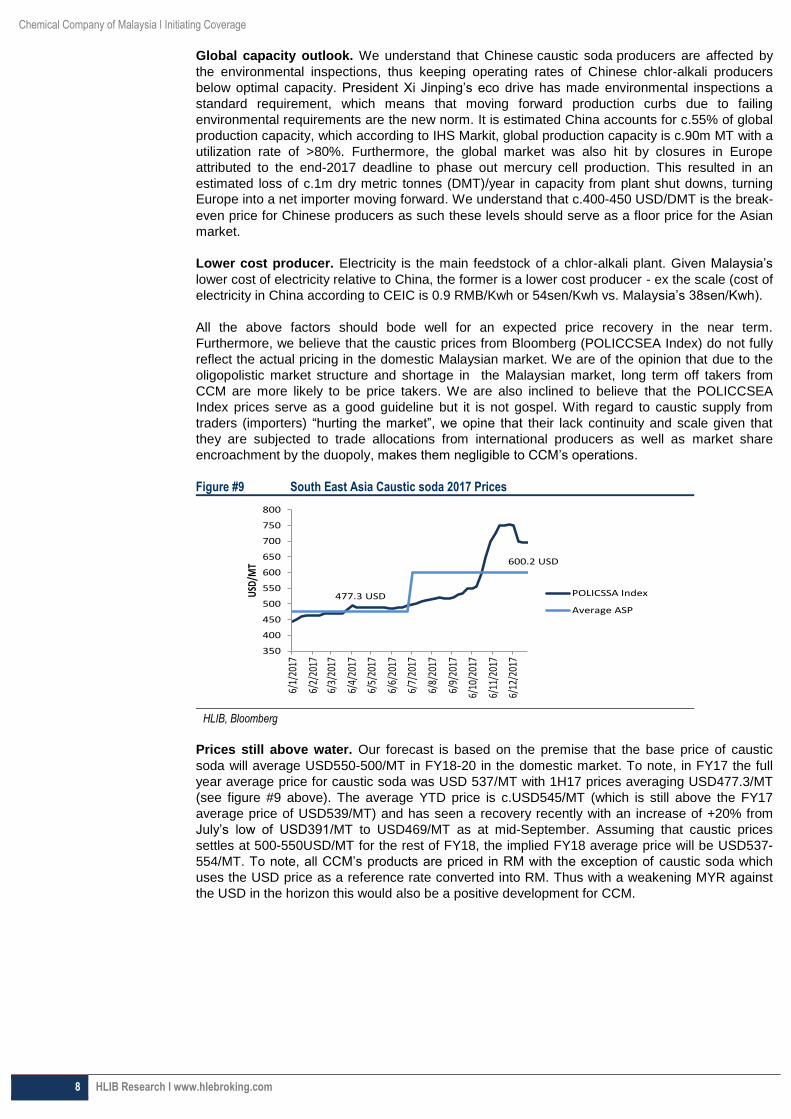
Figure #9 South East Asia Caustic soda 2017 Prices
HLIB, Bloomberg
Prices still above water. Our forecast is based on the premise that the base price of caustic
soda will average USD550-500/MT in FY18-20 in the domestic market. To note, in FY17 the full
year average price for caustic soda was USD 537/MT with 1H17 prices averaging USD477.3/MT
(see figure #9 above). The average YTD price is c.USD545/MT (which is still above the FY17
average price of USD539/MT) and has seen a recovery recently with an increase of +20% from
July’s low of USD391/MT to USD469/MT as at mid-September. Assuming that caustic prices
settles at 500-550USD/MT for the rest of FY18, the implied FY18 average price will be USD537-
554/MT. To note, all CCM’s products are priced in RM with the exception of caustic soda which
uses the USD price as a reference rate converted into RM. Thus with a weakening MYR against
the USD in the horizon this would also be a positive development for CCM.
477.3 USD
600.2 USD
350
400
450
500
550
600
650
700
750
800
6/1/
2017
6/2/
2017
6/3/
2017
6/4/
2017
6/5/
2017
6/6/
2017
6/7/
2017
6/8/
2017
6/9/
2017
6/10
/201
7
6/11
/201
7
6/12
/201
7
USD
/MT
POLICSSA Index
Average ASP
Chemical Company of Malaysia l Initiating Coverage
9 HLIB Research l www.hlebroking.com
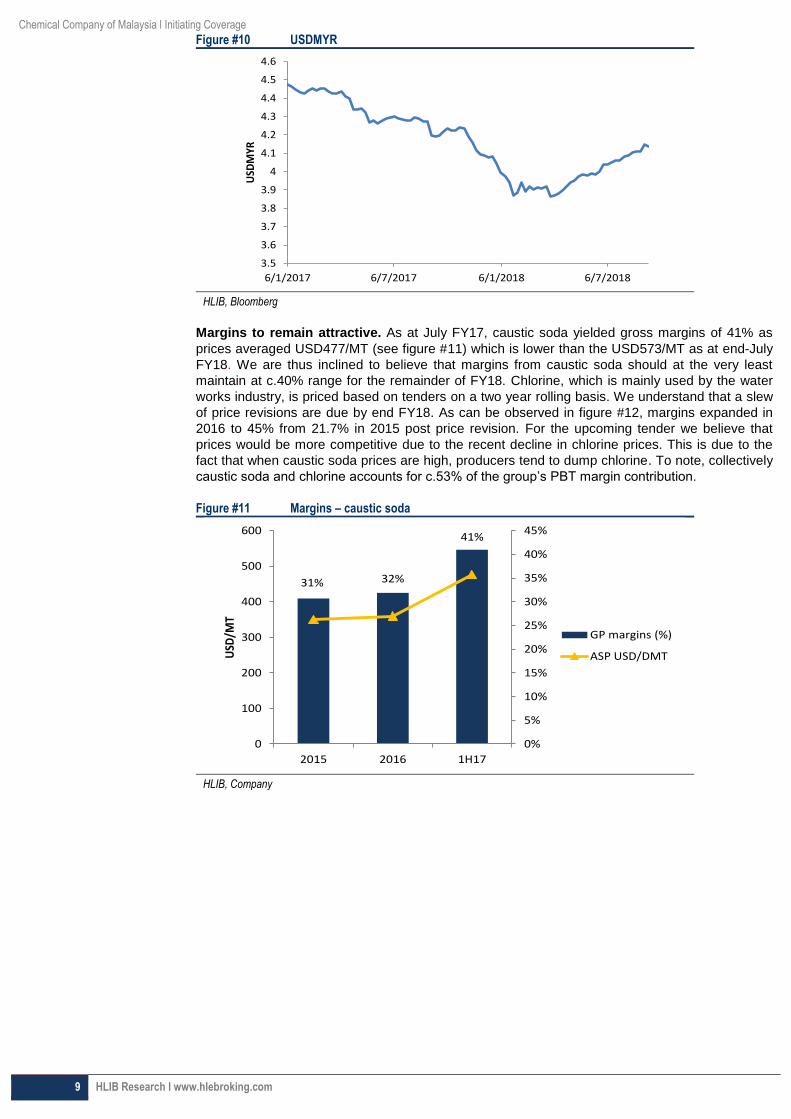
Figure #10 USDMYR
HLIB, Bloomberg
Margins to remain attractive. As at July FY17, caustic soda yielded gross margins of 41% as
prices averaged USD477/MT (see figure #11) which is lower than the USD573/MT as at end-July
FY18. We are thus inclined to believe that margins from caustic soda should at the very least
maintain at c.40% range for the remainder of FY18. Chlorine, which is mainly used by the water
works industry, is priced based on tenders on a two year rolling basis. We understand that a slew
of price revisions are due by end FY18. As can be observed in figure #12, margins expanded in
2016 to 45% from 21.7% in 2015 post price revision. For the upcoming tender we believe that
prices would be more competitive due to the recent decline in chlorine prices. This is due to the
fact that when caustic soda prices are high, producers tend to dump chlorine. To note, collectively
caustic soda and chlorine accounts for c.53% of the group’s PBT margin contribution.
Figure #11 Margins – caustic soda
HLIB, Company
3.5
3.6
3.7
3.8
3.9
4
4.1
4.2
4.3
4.4
4.5
4.6
6/1/2017 6/7/2017 6/1/2018 6/7/2018
USD
MYR
31% 32%
41%
0%
5%
10%
15%
20%
25%
30%
35%
40%
45%
0
100
200
300
400
500
600
2015 2016 1H17
USD
/MT
GP margins (%)
ASP USD/DMT
Chemical Company of Malaysia l Initiating Coverage
10 HLIB Research l www.hlebroking.com
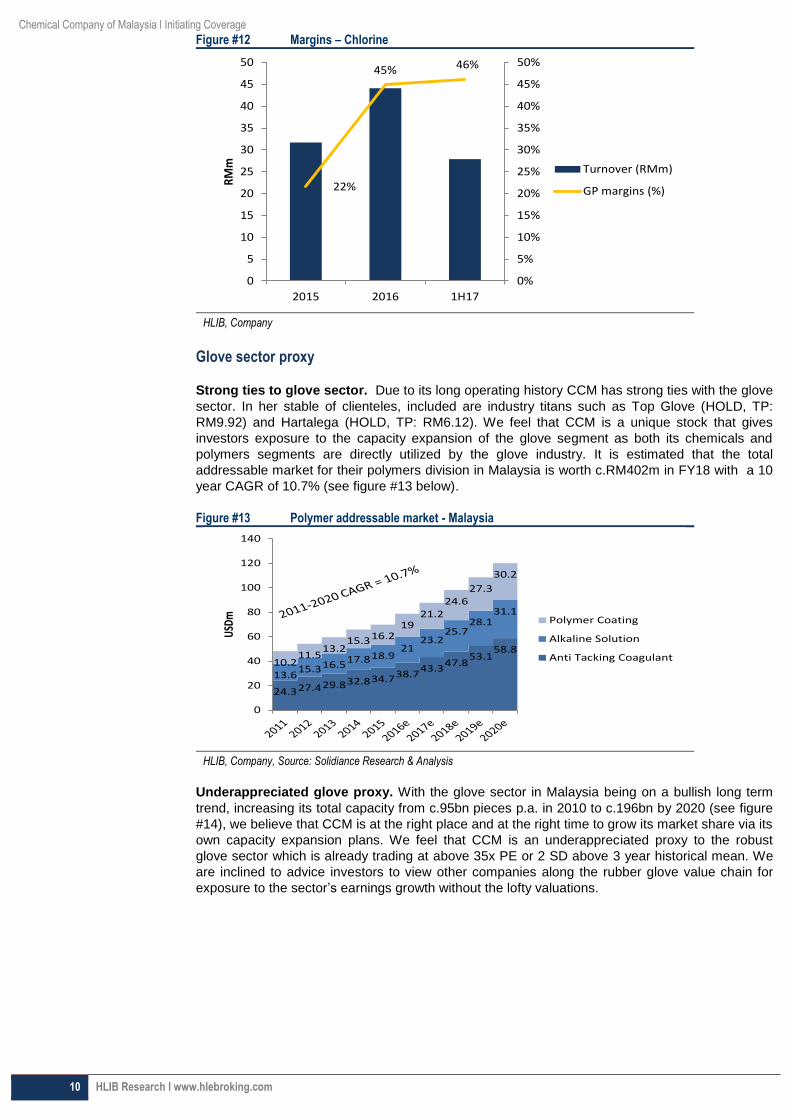
Figure #12 Margins – Chlorine
HLIB, Company
Glove sector proxy
Strong ties to glove sector. Due to its long operating history CCM has strong ties with the glove
sector. In her stable of clienteles, included are industry titans such as Top Glove (HOLD, TP:
RM9.92) and Hartalega (HOLD, TP: RM6.12). We feel that CCM is a unique stock that gives
investors exposure to the capacity expansion of the glove segment as both its chemicals and
polymers segments are directly utilized by the glove industry. It is estimated that the total
addressable market for their polymers division in Malaysia is worth c.RM402m in FY18 with a 10
year CAGR of 10.7% (see figure #13 below).
Figure #13 Polymer addressable market - Malaysia
HLIB, Company, Source: Solidiance Research & Analysis
Underappreciated glove proxy. With the glove sector in Malaysia being on a bullish long term
trend, increasing its total capacity from c.95bn pieces p.a. in 2010 to c.196bn by 2020 (see figure
#14), we believe that CCM is at the right place and at the right time to grow its market share via its
own capacity expansion plans. We feel that CCM is an underappreciated proxy to the robust
glove sector which is already trading at above 35x PE or 2 SD above 3 year historical mean. We
are inclined to advice investors to view other companies along the rubber glove value chain for
exposure to the sector’s earnings growth without the lofty valuations.
22%
45% 46%
0%
5%
10%
15%
20%
25%
30%
35%
40%
45%
50%
0
5
10
15
20
25
30
35
40
45
50
2015 2016 1H17
RM
m Turnover (RMm)
GP margins (%)
24.327.429.832.834.738.743.3
47.853.1
58.8
13.615.316.5
17.818.921
23.225.7
28.131.1
10.211.5
13.215.316.2
1921.2
24.627.3
30.2
0
20
40
60
80
100
120
140
USD
m Polymer Coating
Alkaline Solution
Anti Tacking Coagulant
Chemical Company of Malaysia l Initiating Coverage
11 HLIB Research l www.hlebroking.com
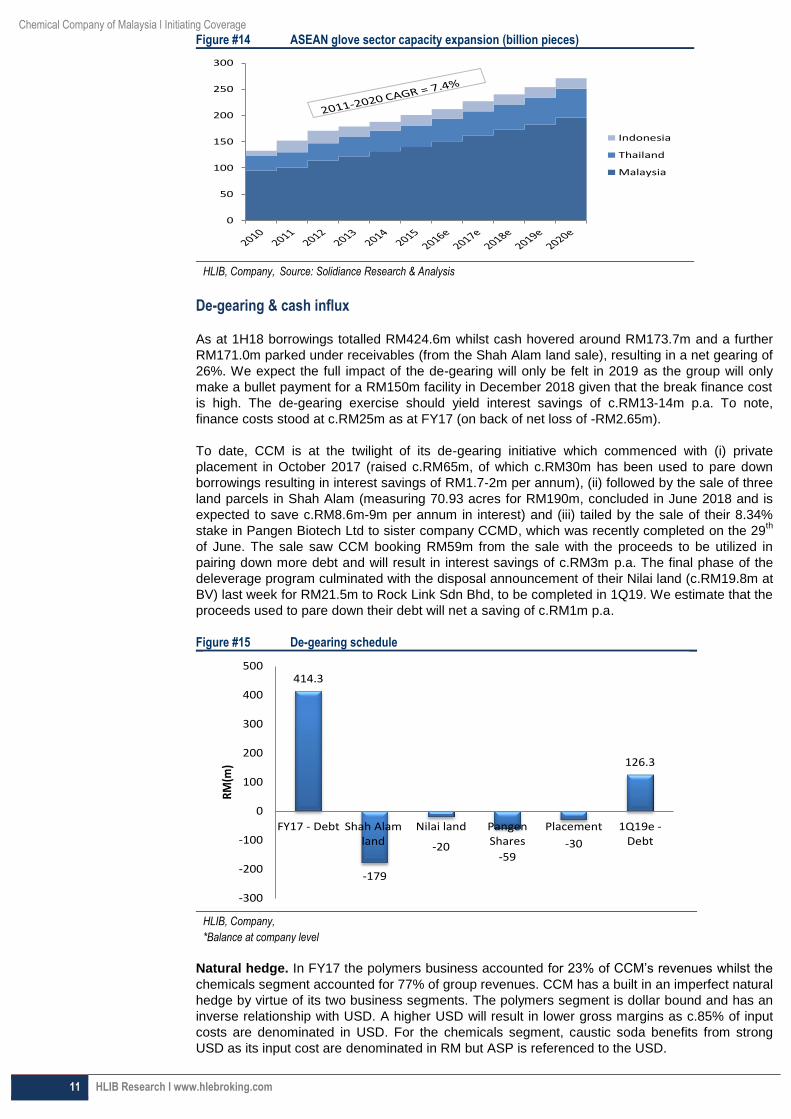
Figure #14 ASEAN glove sector capacity expansion (billion pieces)
HLIB, Company, Source: Solidiance Research & Analysis
De-gearing & cash influx
As at 1H18 borrowings totalled RM424.6m whilst cash hovered around RM173.7m and a further
RM171.0m parked under receivables (from the Shah Alam land sale), resulting in a net gearing of
26%. We expect the full impact of the de-gearing will only be felt in 2019 as the group will only
make a bullet payment for a RM150m facility in December 2018 given that the break finance cost
is high. The de-gearing exercise should yield interest savings of c.RM13-14m p.a. To note,
finance costs stood at c.RM25m as at FY17 (on back of net loss of -RM2.65m).
To date, CCM is at the twilight of its de-gearing initiative which commenced with (i) private
placement in October 2017 (raised c.RM65m, of which c.RM30m has been used to pare down
borrowings resulting in interest savings of RM1.7-2m per annum), (ii) followed by the sale of three
land parcels in Shah Alam (measuring 70.93 acres for RM190m, concluded in June 2018 and is
expected to save c.RM8.6m-9m per annum in interest) and (iii) tailed by the sale of their 8.34%
stake in Pangen Biotech Ltd to sister company CCMD, which was recently completed on the 29th
of June. The sale saw CCM booking RM59m from the sale with the proceeds to be utilized in
pairing down more debt and will result in interest savings of c.RM3m p.a. The final phase of the
deleverage program culminated with the disposal announcement of their Nilai land (c.RM19.8m at
BV) last week for RM21.5m to Rock Link Sdn Bhd, to be completed in 1Q19. We estimate that the
proceeds used to pare down their debt will net a saving of c.RM1m p.a.
Figure #15 De-gearing schedule
HLIB, Company, *Balance at company level
Natural hedge. In FY17 the polymers business accounted for 23% of CCM’s revenues whilst the
chemicals segment accounted for 77% of group revenues. CCM has a built in an imperfect natural
hedge by virtue of its two business segments. The polymers segment is dollar bound and has an
inverse relationship with USD. A higher USD will result in lower gross margins as c.85% of input
costs are denominated in USD. For the chemicals segment, caustic soda benefits from strong
USD as its input cost are denominated in RM but ASP is referenced to the USD.
0
50
100
150
200
250
300
Indonesia
Thailand
Malaysia
414.3
-179
-20-59
-30
126.3
-300
-200
-100
0
100
200
300
400
500
FY17 - Debt Shah Alamland
Nilai land PangenShares
Placement 1Q19e -Debt
RM
(m)
Chemical Company of Malaysia l Initiating Coverage
12 HLIB Research l www.hlebroking.com
Financials
Profitability & earnings growth. We forecast CCM’s core earnings to hit RM29.8m in FY18, a
commendable return to the black. On a pre-demerger basis, CCM on continuing operations was
loss making (FY17 LAT: -RM2.65m). On the chemicals division, we expect the earnings to expand
in 2H19 onwards from (i) the reactivation of PGW1 and (ii) the commencement of RAPID.
However for conservative purposes, we have not included the impact of RAPID’s contribution into
our forecast. For the polymers division, we expect higher contribution on back of capacity
expansion of the glove sector (estimated 8%-10% growth p.a.), whilst capacity from the de-bottle
necking exercise will aid in topline growth by 10%-15% moving forward.
RAPID. We believe that CCM and Malay Sino (a subsidiary of Batu Kawan) are in pole position to
share the volume to supply RAPID. Upon full ramp up, which is anticipated by 2021, RAPID will
utilize an estimated 156,000 MT of caustic soda liquid p.a. We estimate that the incremental
demand from RAPID will be c. 38,000MT in FY19, 76,000MT in FY20 and 156,000 MT in FY21.
Assuming that CCM clinches the contract to supply RAPID at a price of USD500/MT (at 50% of
the volume) we can expect a top-line 5 year revenue CAGR of 10.7% vs. forecasted 3.7% (which
is based purely on capacity expansion). This would result in a 5 year GP CAGR of 6.6% (vs.
4.5%), which is slightly muted on the back of lower trading margins (assumed to be c.8%).
Capex & OCF. Capex in is expected to amount to c.RM60-70m in FY19 in preparation for PGW1
restarting production. We do not discount further major capex down the road as CCM’s balance
sheet returns back to health with a net gearing position of 20%-24% in FY18-19. As at 1H18 CCM
generated RM21.3m in net operating cash flows against a core PATAMI of RM22.5m. We expect
their strong operating cash flow to support their dividend commitment moving forward.
Cost structure. Collectively, we estimate that depreciation, overheads and raw materials account
for c.70%-80% of total costs. For the polymers division c.85% of cost of sales are raw materials
whilst for the chemicals division of which chlor-alkali products account for c.75% of revenues,
electricity accounts for c.55%-60%, salt c.20%-25% and water c. 7%-8% of cost of sales.
1H18 results commentary. Revenue grew 15.6% YoY to RM200.4m on the back of improvement
from both chemical (+20.2%) and polymer (+14.7%) divisions underpinned by improved volumes
and higher ASP. This resulted in GP margins improving by 2.3ppts YoY to 27.5%. The group’s
effective tax rate as at 1H18 was 43% due to (i) non-deductible expenses at group level and (ii)
RPGT of RM9.2m which was booked in the 2Q18. Core PATAMI grew by +600% YoY to
RM22.5m (from RM3.2m) reflecting the group’s transformational initiatives and the resultant
efficiency gains as well as lower depreciation charges (-48.8%) on the back of the demerger and
a low base in 1H17.
2H18 outlook. We expect the velocity of revenues and earnings to mirror the recent trajectory of
caustic soda prices (beginning in May 2018) for 3Q on the back of the lower caustic and chlorine
ASP. To note 3Q17 prices averaged USD518/MT vs. an expected 3Q18 450 USD/MT (assuming
that caustic prices recover to 450-500 levels in the near term). We are inclined to remain on the
conservative side, our estimated 1H18 core PATAMI already makes up more than 60% of our full
year forecast.
Chemical Company of Malaysia l Initiating Coverage
13 HLIB Research l www.hlebroking.com
Valuation & Recommendation
We believe that CCM warrants greater attention from investors on the back of her restructuring
and de-gearing which has unsheathed a gem. The stock has a sleuth of catalysts to drive her
forward, namely (i) capacity expansion at both division (ii) direct exposure to the glove sector’s
expansion (iii) RAPID kicker (iv) decent dividend yield and (iv) undemanding valuations on the
back of returning to profitability.
We initiate with a BUY call and TP of RM3.08, implying an upside potential of 57.1%. Our TP
is a function of FY19 EPS of 23.7 sen pegged to a P/E multiple of 13x. The applied PE of 13.0x is
inline with the Malaysian chemicals sector FY19 average of 12.8x (see figure #17). We feel that
this is justified given that the turnaround story is compelling, market structure favourable and
headwinds from RAPID and capacity expansion driven earnings moist in the air. With virtually no
broker coverage on the stock, we opine that CCM is under-researched and under-owned amongst
institutional investors. The stock is currently trading at FY18-20 PER of 11.0x, 8.3x, 7.6x.
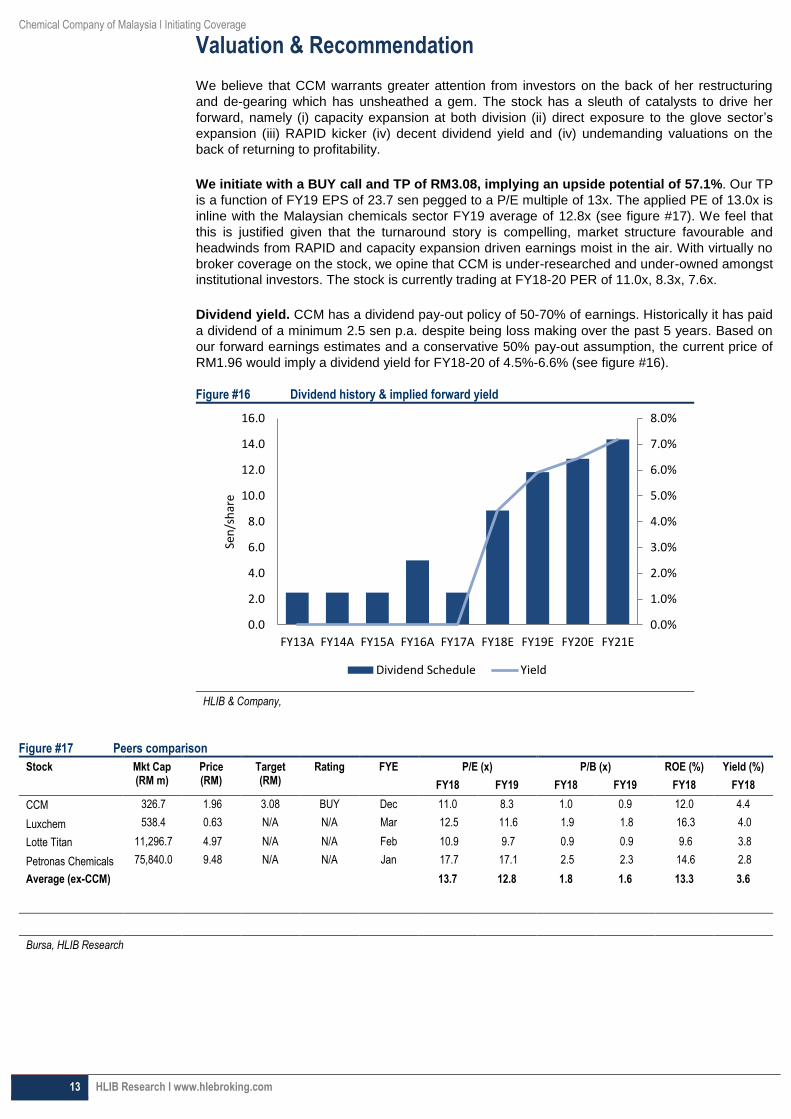
Dividend yield. CCM has a dividend pay-out policy of 50-70% of earnings. Historically it has paid
a dividend of a minimum 2.5 sen p.a. despite being loss making over the past 5 years. Based on
our forward earnings estimates and a conservative 50% pay-out assumption, the current price of
RM1.96 would imply a dividend yield for FY18-20 of 4.5%-6.6% (see figure #16).
Figure #16 Dividend history & implied forward yield
HLIB & Company,
Figure #17 Peers comparison
Stock Mkt Cap (RM m)
Price (RM)
Target (RM)
Rating FYE P/E (x) P/B (x) ROE (%) Yield (%)
FY18 FY19 FY18 FY19 FY18 FY18
CCM 326.7 1.96 3.08 BUY Dec 11.0 8.3 1.0 0.9 12.0 4.4
Luxchem 538.4 0.63 N/A N/A Mar 12.5 11.6 1.9 1.8 16.3 4.0
Lotte Titan 11,296.7 4.97 N/A N/A Feb 10.9 9.7 0.9 0.9 9.6 3.8
Petronas Chemicals 75,840.0 9.48 N/A N/A Jan 17.7 17.1 2.5 2.3 14.6 2.8
Average (ex-CCM) 13.7 12.8 1.8 1.6 13.3 3.6
Bursa, HLIB Research
0.0%
1.0%
2.0%
3.0%
4.0%
5.0%
6.0%
7.0%
8.0%
0.0
2.0
4.0
6.0
8.0
10.0
12.0
14.0
16.0
FY13A FY14A FY15A FY16A FY17A FY18E FY19E FY20E FY21E
Sen
/sh
are
Dividend Schedule Yield
Hong Leong Investment Bank Berhad (10209-W)
14 HLIB Research l www.hlebroking.com
Disclaimer The information contained in this report is based on data obtained from sources believed to be reliable. However, the data and/or sources have not been independently verified and as such, no representation, express or implied, are made as to the accuracy, adequacy, completeness or reliability of the info or opinions in the report.
Accordingly, neither Hong Leong Investment Bank Berhad nor any of its related companies and associates nor person connected to it accept any liability whatsoever for any direct, indirect or consequential losses (including loss of profits) or damages that may arise from the use or reliance on the info or opinions in this publication.
Any information, opinions or recommendations contained herein are subject to change at any time without prior notice. Hong Leong Investment Bank Berhad has no obligation to update its opinion or the information in this report.
Investors are advised to make their own independent evaluation of the info contained in this report and seek independent financial, legal or other advice regarding the appropriateness of investing in any securites or the investment strategies discussed or recommended in this report. Nothing in this report constitutes investment, legal, accounting or tax advice or a representation that any investment or strategy is suitable or appropriate to your individual circumstances or otherwise represent a personal recommndation to you.
Under no circumstances should this report be considered as an offer to sell or a solicitation of any offer to buy any securities referred to herein.
Hong Leong Investment Bank Berhad and its related companies, their associates, directors, connected parties and/or employeees may, from time to time, own, have positions or be materially interested in any securities mentioned herein or any securites related thereto, and may further act as market maker or have assumed underwriting commitment or deal with such securities and provide advisory, investment or other services for or do business with any companies or entities mentioned in this report. In reviewing the report, investors should be aware that any or all of the foregoing among other things, may give rise to real or potential conflict of interests.
This research report is being supplied to you on a strictly confidential basis solely for your information and is made strictly on the basis that it will remain confidential. All materials presented in this report, unless specifically indicated otherwise, is under copyright to Hong Leong Investment Bank Berhad. This research report and its contents may not be reproduced, stored in a retrieval system, redistributed, transmitted or passed on, direclty or indirectly, to any person or published in whole or in part, or altered in any way, for any purpose.
This report may provide the addresses of, or contain hyperlinks to, websites. Hong Leong Investment Bank Berhad takes no responsibility for the content contained therein. Such addresses or hyperlinks (including addresses or hyperlinks to Hong Leong Investment Bank Berhad own website material) are provided solely for your convenience. The information and the content of the linked site do not in any way form part of this report. Accessing such website or following such link through the report or Hong Leong Investment Bank Berhad website shall be at your own risk. 1. As of 21 September 2018, Hong Leong Investment Bank Berhad has proprietary interest in the following securities covered in this report: (a) -. 2. As of 21 September 2018, the analyst(s) whose name(s) appears on the front page, who prepared this report, has interest in the following securities covered in this report: (a) -.
Published & printed by: Hong Leong Investment Bank Berhad (10209-W) Level 28, Menara Hong Leong, No. 6, Jalan Damanlela, Bukit Damansara, 50490 Kuala Lumpur Tel: (603) 2083 1800 Fax: (603) 2083 1766
Stock rating definitions
BUY Expected absolute return of +10% or more over the next 12-months.
HOLD Expected absolute return of -10% to +15% over the next 12-months.
SELL Expected absolute return of -10% or less over the next 12-months.
UNDER REVIEW Rating on the stock is temporarily under review which may or may not result to a change from the previous rating.
NOT RATED Stock is not or no longer within regular coverage.
Sector rating definitions
OVERWEIGHT Sector expected to outperform the market over the next -12 months.
NEUTRAL Sector expected to perform in-line with the market over the next -12 months.
UNDERWEIGHT Sector expected to underperform the market over the next -12 months.
Related Documents