Utah State University Utah State University DigitalCommons@USU DigitalCommons@USU All Graduate Theses and Dissertations Graduate Studies 5-2012 Chemical Characterization of Meat Related to Animal Diet Chemical Characterization of Meat Related to Animal Diet Rossarin Tansawat Utah State University Follow this and additional works at: https://digitalcommons.usu.edu/etd Part of the Dietetics and Clinical Nutrition Commons Recommended Citation Recommended Citation Tansawat, Rossarin, "Chemical Characterization of Meat Related to Animal Diet" (2012). All Graduate Theses and Dissertations. 1339. https://digitalcommons.usu.edu/etd/1339 This Dissertation is brought to you for free and open access by the Graduate Studies at DigitalCommons@USU. It has been accepted for inclusion in All Graduate Theses and Dissertations by an authorized administrator of DigitalCommons@USU. For more information, please contact [email protected].

Welcome message from author
This document is posted to help you gain knowledge. Please leave a comment to let me know what you think about it! Share it to your friends and learn new things together.
Transcript

Utah State University Utah State University
DigitalCommons@USU DigitalCommons@USU
All Graduate Theses and Dissertations Graduate Studies
5-2012
Chemical Characterization of Meat Related to Animal Diet Chemical Characterization of Meat Related to Animal Diet
Rossarin Tansawat Utah State University
Follow this and additional works at: https://digitalcommons.usu.edu/etd
Part of the Dietetics and Clinical Nutrition Commons
Recommended Citation Recommended Citation Tansawat, Rossarin, "Chemical Characterization of Meat Related to Animal Diet" (2012). All Graduate Theses and Dissertations. 1339. https://digitalcommons.usu.edu/etd/1339
This Dissertation is brought to you for free and open access by the Graduate Studies at DigitalCommons@USU. It has been accepted for inclusion in All Graduate Theses and Dissertations by an authorized administrator of DigitalCommons@USU. For more information, please contact [email protected].

CHEMICAL CHARACTERIZATION OF MEAT RELATED TO ANIMAL DIET
by
Rossarin Tansawat
A dissertation submitted in partial fulfillment of the requirements for the degree
of
DOCTOR OF PHILOSOPHY
in
Nutrition, Dietetics, and Food Sciences
Approved: ________________________________ ________________________________ Daren P. Cornforth Robert E. Ward Major Professor Committee Member ________________________________ ________________________________ Silvana Martini Korry J. Hintze Committee Member Committee Member ________________________________ ________________________________ Jennifer W. MacAdam Mark R. McLellan Committee Member Vice President for Research and Dean of the School of Graduate Studies
UTAH STATE UNIVERSITY Logan, UT
2012

ii
Copyright © Rossarin Tansawat 2012
All Rights Reserved

iii
ABSTRACT
Chemical Characterization of Meat Related to Animal Diet
by
Rossarin Tansawat, Doctor of Philosophy
Utah State University, 2012
Major Professor: Dr. Daren P. Cornforth Department: Nutrition, Dietetics, and Food Sciences
There is currently much interest in the comparative health benefits of various
meat products, including pasture-fed beef. However, little is known about the specific
pasture-finishing diets (mixed forages, alfalfa, or sainfoin, compared to grain) on meat
quality, consumer preferences, and human health. Thus, additional information is needed
to better understand and develop new animal feeding regimes for optimum animal
growth, meat flavor, and meat nutritional quality. The objective of the current study was
to examine how animal diets, including secondary metabolites in the diet, affect meat
chemical characteristics, meat quality, and nutritional value. In study 1 (Chapter 3),
grain- vs. pasture-fed beef rib steaks were evaluated. Ribs from pasture-fed animals had a
much lower fat content (P < 0.01), which was its main positive nutritional attribute.
Pasture-fed beef had more (P < 0.05) omega-3 polyunsaturated fatty acids (PUFAs) and
conjugated linoleic acid (CLA) than grain-fed beef, but was only a moderately good
source of PUFA, compared to salmon. Pasture-fed beef had higher antioxidant capacity

iv
and lower measures of oxidation (P < 0.05). Pasture and grain diets influenced the
volatile profile of cooked meat. Flavor descriptors barny, gamey, and grassy were
associated with pasture feeding, and were uniquely shown in this study to be positively
correlated with specific aroma volatiles benzaldehyde, toluene, dimethyl sulfone, 3-
heptanone, 2-ethyl-1-hexanol, and hexadecanoic acid methyl ester (P < 0.05). In study 2
(Chapter 4), the effects of legume pasture-finishing of beef cattle on meat quality were
evaluated, comparing alfalfa pasture (containing saponins) versus sainfoin pasture
(containing tannins). No strong differences (P > 0.05) were found between the two
legume diets in all meat characteristics, indicating that sainfoin was similar to alfalfa as a
cattle forage. Similar (P > 0.05) low TBA values after 12 d of storage at 2 °C were
obtained from both diets, comparable to pasture-fed beef from study 1. This verified the
prolonged retail shelf life benefit of forage-fed beef, compared to grain-fed beef.
In study 3 (Chapter 5), lambs fed four different diets, plain/control (P), tannins-
rich diet (T), saponins-rich diet (S), or choice of them (C), were evaluated on
metabolomics profiles using GC/MS technique. Forty metabolites were detected (30
named and 10 unknown). A principal component analysis (PCA) plot showed a clear
separation of P, T, and S diet treatments while the C diet was overlapped with S and P
diets, indicating that S or P diets were preferred while the T diet was avoided. In
summary, the effects of ruminant diets on meat characteristics depended on the type and
concentration of plant secondary compounds (PSC), especially the PSC levels contained
in the pastures.
(171 pages)
v
PUBLIC ABSTRACT
Chemical Characterization of Meat Related to Animal Diet
Rossarin Tansawat
There is currently much interest in increasing health benefits from consuming nutritious food, including beef. Plant secondary compounds (PSC) such as tannins or saponins in various forages have an influence on animal nutrition and health, depending on the type of PSC and the amount consumed. However, relatively little is known about effects of PSC on meat color, flavor, and nutritional value. Thus, additional information is needed to better understand and to develop new animal feeding regimes for optimum animal growth, meat flavor, and meat nutritional quality.
In the first study, grain- vs. pasture-fed beef rib steaks were evaluated. The objective was to examine meat characteristics as affected by cattle diet; and to examine the relationship between meat volatiles during heating with meat sensory profile, as determined in a separate study. Ribs from pasture-fed animals had much lower fat content, more omega-3 polyunsaturated fatty acids and conjugated linoleic acid than grain-fed beef. Pasture-fed beef also had lower measures of oxidation during retail storage and higher antioxidant capacity. Both diets also influenced the chemical volatile profiles of cooked meat and were distinctively associated with consumer sensory descriptors. Grain beef had higher levels of hexanal, 1-octen-3-ol, 2,3-octandione, and 2,6-bis (1,1-dimethylethyl)-4-ethyl-phenol, uniquely associated with umami and juicy flavors. In the second study, beef finished with two pasture-finishing models, tall fescue-alfalfa (containing PSC saponins) vs. tall fescue-sainfoin (containing PSC tannins), were compared. Meat characteristics were not different between the two legume diets, indicating that sainfoin was comparable to alfalfa as a cattle forage. However, more information is needed regarding rate of weight gain and other production factors for cattle finished on sainfoin pastures.
Metabolomics is the study of the complete set of small molecules produced in a tissue such as muscle during metabolism of carbohydrates, lipids, peptides, or nucleotides. There is limited information about metabolomics of meat animals, i.e., how diet affects the genetic machinery and meat chemistry. In a third study, lambs (infected with red stomach worm larvae) were fed different purified PSC’s to determine possible anti-parasitic effects (companion study) and metabolomics profile in lamb loin muscle using a gas chromatography/mass spectroscopy technique. Diet treatments included dried beet pulp supplemented with tannins or saponins, given in single ration or as choice of them. Carbohydrate metabolites were higher in animals fed tannin diets. Cholesterol levels were lower in saponin groups, in agreement with many previous studies reporting cholesterol lowering activity of saponins in mammals.

vi
ACKNOWLEDGMENTS
I would like to thank the National Cattlemen’s Beef Association Beef Check-off
Program and the United States Department of Agriculture for their financial support. I am
especially grateful for my advisor, Dr. Daren Cornforth, for his invaluable support
throughout this entire process. I wish to express my sincere thanks to Dr. Robert Ward,
my co-advisor, for his help and guidance to complete the project. I place on record my
deep-felt gratitude to the other members of my committee, Dr. Silvana Martini, Dr. Korry
Hintze, and Dr. Jennifer MacAdam, for much good and useful advice. I would like to also
thank Dr. Juan Villalba, Daniela Brogna, Brody Maughan, and Dick Whittier for their
help in animal management and supplying the meat samples for this project. Thanks to
the Utah State University Department of Nutrition, Dietetics, and Food Sciences, Dr.
Michael Lefevre and Nancie Hergert in the USU Center for Integrated Biosystems, and
the USU NDFS Food Analysis class of 2010 for providing necessary equipment,
facilities, and assistance. Many thanks also go to Curtis Maughan for performing the
sensory analysis and Michael Young for his expertise on the GS-MS.
I would like to give my sincere thanks to all of my friends and colleagues for
being so encouraging and helping to motivate me. Finally, a very special mention goes to
my family in Thailand. I would not have been able to complete my studies without the
love and support from you.
Rossarin Tansawat

vii
CONTENTS
Page ABSTRACT....................................................................................................................... iii PUBLIC ABSTRACT ........................................................................................................ v ACKNOWLEDGMENTS ................................................................................................. vi LIST OF TABLES.............................................................................................................. x LIST OF FIGURES .........................................................................................................xiii LIST OF SYMBOLS, NOTATION, DEFINITIONS....................................................... xv CHAPTER 1 INTRODUCTION .................................................................................................. 1
Hypothesis......................................................................................................... 2 Objectives ......................................................................................................... 2 References......................................................................................................... 3
2 LITERATURE REVIEW ....................................................................................... 4
Animal Diets ..................................................................................................... 4 Plant Secondary Compounds ............................................................................ 5 Essential Fatty Acids......................................................................................... 8 Conjugated Linoleic Acids ............................................................................. 11 Lipid Oxidation in Meat.................................................................................. 13 Myoglobin Oxidation in Meat ........................................................................ 15 Antioxidants in Meat....................................................................................... 17 Beef Volatiles.................................................................................................. 23 Metabolomics.................................................................................................. 24 References....................................................................................................... 28
3 CHEMICAL CHARACTERIZATION OF PASTURE-
AND GRAIN-FED BEEF RELATED TO MEAT QUALITY AND FLAVOR ATTRIBUTES......................................................... 44
Abstract ........................................................................................................... 44 Introduction..................................................................................................... 45
viii
Materials and Methods.................................................................................... 47
Meat samples ............................................................................................ 47 Chemical analyses..................................................................................... 48 Sensory evaluation .................................................................................... 55 Statistical analysis ..................................................................................... 56
Results............................................................................................................. 57 Discussion ....................................................................................................... 67 Conclusions..................................................................................................... 72 References....................................................................................................... 73
4 COMPARISON OF ALFALFA- VERSUS SAINFOIN-
FINISHING DIET ON BEEF CHEMICAL CHARACTERISTICS AND HEADSPACE VOLATILES ...................................................................... 82
Abstract ........................................................................................................... 82 Introduction..................................................................................................... 83 Materials and Methods.................................................................................... 86
Meat samples ............................................................................................ 86 Chemical analyses..................................................................................... 87 Statistical analysis ..................................................................................... 91
Results............................................................................................................. 92 Discussion ....................................................................................................... 98 Conclusions................................................................................................... 100 References..................................................................................................... 101
5 METABOLOMIC ANALYSIS OF LAMB MUSCLE AS
AFFECTED BY TANNIN OR SAPONIN SUPPLEMENTED DIET OF ANIMALS INFECTED WITH RED STOMACH WORM LARVAE (HAEMONCHUS CONTORTUS)........................................ 106
Abstract ......................................................................................................... 106 Introduction................................................................................................... 107 Materials and Methods.................................................................................. 109
Animal and dietary treatment.................................................................. 109 Metabolomics measurements.................................................................. 111 Statistical analysis ................................................................................... 113
Results and Discussion ................................................................................. 113 Conclusions................................................................................................... 118
ix
References..................................................................................................... 119 6 OVERALL SUMMARY .................................................................................... 124 APPENDICES ................................................................................................................ 128
APPENDIX A Statistics for Chapter 3 .................................................................... 129 APPENDIX B Statistics for Chapter 4 .................................................................... 135 APPENDIX C Statistics for Chapter 5 .................................................................... 141 APPENDIX D Reprint Permissions......................................................................... 145
CURRICULUM VITAE................................................................................................. 152

x
LIST OF TABLES Table Page 2-1 Classification of an estimated range of plant secondary compounds ..................... 6 2-2 Flavors and aromas associated with volatile compounds in beef ......................... 25 3-1 Characteristics of steaks obtained from grain- and pasture-fed
animals .................................................................................................................. 57 3-2 Fatty acid composition of beef samples per 85 g (3 oz) serving .......................... 63 3-3 Volatile profile of muscle from beef fed with grain or pasture diets.................... 64 3-4 Pearson correlation coefficients (r) among means of volatiles with
sensory intensity.................................................................................................... 66 3-5 Omega-3 fatty acids in 85 g serving of grain- or pasture-fed beef,
as % of recommended by the International Society for the Study of Fatty Acids and Lipids...................................................................................... 69
3-6 Conjugated linoleic acid (CLA) in 85 g serving of grain- or
pasture-fed beef, as % of level associated with reduced incidence of breast cancer in postmenopausal women.......................................................... 70
4-1 Characteristics of steaks obtained from alfalfa- and sainfoin-fed
animals .................................................................................................................. 92 4-2 Fat content, pH, metmyoglobin reducing activity (MRA),
thiobarbituric acid assay (TBA), and ferric reducing antioxidant power (FRAP) of alfalfa- and sainfoin-fed beef ................................................... 95
5-1 Metabolites from lamb muscles fed four different diets ..................................... 116 A1 Type 3 tests of fixed effects (ANOVA) for Hunter color
measurements (Lightness, L*) ............................................................................ 130 A2 Type 3 tests of fixed effects (ANOVA) for Hunter color
measurements (Redness, a*) ............................................................................... 130 A3 Type 3 tests of fixed effects (ANOVA) for Hunter color
measurements (Yellowness, b*) ......................................................................... 130
xi
A4 Differences of least squares means for Hunter color measurements
(Lightness, L*) .................................................................................................... 130 A5 Differences of least squares means for Hunter color measurements
(Redness, a*)....................................................................................................... 131 A6 Differences of least squares means for Hunter color measurements
(Yellowness, b*) ................................................................................................. 131 A7 ANOVA for hydrophilic ORAC......................................................................... 131
A8 ANOVA for lipophilic ORAC ............................................................................ 132 A9 Type 3 tests of fixed effects (ANOVA) for TBA ............................................... 132 A10 Differences of least squares means for TBA ...................................................... 132 A11 Statistics for fatty acid composition of muscle from beef fed with
grain or pasture diets ........................................................................................... 133 A12 Statistics for headspace volatiles of muscle from beef fed with
grain or pasture diets ........................................................................................... 134 B1 Type 3 tests of fixed effects (ANOVA) for Hunter color
measurements (Lightness, L*) ............................................................................ 136 B2 Type 3 tests of fixed effects (ANOVA) for Hunter color
measurements (Redness, a*) ............................................................................... 136 B3 Type 3 tests of fixed effects (ANOVA) for Hunter color
measurements (Yellowness, b*) ......................................................................... 136 B4 Differences of least squares means for Hunter color measurements
(Lightness, L*) .................................................................................................... 136 B5 Differences of least squares means for Hunter color measurements
(Redness, a*)....................................................................................................... 137 B6 Differences of least squares means for Hunter color measurements
(Yellowness, b*) ................................................................................................. 137 B7 ANOVA for fat content ...................................................................................... 137

xii
B8 ANOVA for pH................................................................................................... 138 B9 ANOVA for MRA .............................................................................................. 138 B10 Type 3 tests of fixed effects (ANOVA) for TBA ............................................... 138 B11 Differences of least squares means for TBA ...................................................... 138 B12 ANOVA for FRAP ............................................................................................. 138 B13 Statistics for fatty acid composition of muscle from beef fed with
alfalfa or sainfoin diets........................................................................................ 139 B14 Statistics for headspace volatiles of muscle from beef fed with
alfalfa or sainfoin diets........................................................................................ 140

xiii
LIST OF FIGURES Figure Page 2-1 Condensed tannin polymer ..................................................................................... 7 2-2 Chemical structures of common saponin aglycones found in
legumes ................................................................................................................... 8 2-3 Biosynthesis of long-chain fatty acids from omega-3 and omega-6
fatty acids .............................................................................................................. 10 2-4 Biosynthesis of eicosanoids from arachidonic acid .............................................. 11 2-5 Biochemical pathways for the bio-hydrogenation of linoleic and
linolenic acids in the rumen .................................................................................. 12 2-6 The general schematic diagram for the three steps of autoxidation:
Initiation, Propagation, and Termination .............................................................. 14 2-7 TBARS assay reactions......................................................................................... 16 2-8 Myoglobin, heme porphyrin, and myoglobin pigments in fresh
meat....................................................................................................................... 16 2-9 Schematic hierarchy of the relationship between the different
“omics”, from genomics to functional genomics (transcriptomics), proteomics, and finally to expression of small molecules (metabolomics) ..................................................................................................... 28
3-1 Effect of storage time (day) on grain- and pasture-fed beef color
stability at 2 °C...................................................................................................... 59 3-2 Antioxidant status (ORAC values) and lipid oxidation (TBA
values) measurements of beef obtained from grain and pasture-fed animals .................................................................................................................. 60
3-3 Fatty acid chemical composition for meat samples obtained from
animals fed with grain- and pasture-based diet..................................................... 62 3-4 Ratio to surrogate of headspace volatile compounds from beef fed
with grain or pasture diets..................................................................................... 65

xiv
3-5 Principal component analysis (PCA) of volatile compounds in grain-fed and pasture-fed beef samples heated to 60 °C for 30 min..................... 66
4-1 Pasture design ....................................................................................................... 87 4-2 Effect of storage time (day) on alfalfa- and sainfoin-fed beef color
stability at 2 °C...................................................................................................... 94 4-3 Fatty acid chemical composition (mg/g meat) for meat samples
obtained from animals fed with alfalfa- and sainfoin-based diet.......................... 96 4-4 Ratio to surrogate of headspace volatile compounds from beef fed
with alfalfa- or sainfoin-based diets...................................................................... 97 5-1 Principle component analysis of animals arranged by metabolites
found in lamb muscle fed various diets .............................................................. 115 C1 Box and whisker plots of normalization levels of carbohydrates
(sugar and sugar alcohols) of lambs fed different diets ...................................... 142 C2 Box and whisker plots of normalization levels of lipids of lambs
fed different diets ................................................................................................ 143 C3 Box and whisker plots of normalization levels of vitamin and
mineral of lambs fed different diets .................................................................... 143 C4 Box and whisker plots of normalization levels of other small
molecules of lambs fed different diets ................................................................ 144
xv
LIST OF SYMBOLS, NOTATION, DEFINITIONS %KPH % Kidney, pelvic, and heart fat
a* Redness
AA Arachidonic acid
AMDIS Automated Mass Spectral Deconvolution and Identification System
ANOVA Analysis of variance
AOAC The Association of Official Agricultural Chemists
AUC Area under curve
b* Yellowness
BF Back fat thickness
C Choice diet
CAT Catalase
CLA Conjugated linoleic acid
COX Cyclooxygenase
CT Condensed tannin
DHA Docosahexaenoic acid
dMb Deoxymyoglobin
DPPH 2,2-diphenyl-1- picrylhydrazyl radical scavenging capacity assay
EEF Ether-extract fat
EFA Essential fatty acids
EPA Eicosapentaenoic acid
FA Fatty acid
FAMEs Fatty acid methyl esters
FEC Faecal egg counts
FRAP Ferric reducing antioxidant power
GC Gas chromatography
GC-FID Gas chromatography with flame ionization detection
GC-MS Gas chromatography - Mass spectrometry

xvi
GPx Glutathione peroxidase
GSH Reduced glutathione
GSSG Oxidized glutathione
GT Glutathione
HW Hanging weight
HydrORAC Hydrophilic ORAC
L* Lightness
L3 Third larval stage
LC-PUFA long chain polyunsaturates
LD Longissimus dorsi
LipORAC Lipophilic ORAC
LOX Lipoxygenase
LRI Linear retention indexes
LSD Least significant different
LT Leukotriene
Mb Myoglobin
MbO2 Oxymyoglobin
MDA Malondialdehyde
MetMb/MMb Metmyoglobin
MRA Metmyoglobin reducing activity
MS Mass spectrometry
MSTFA N-methyl-N-trimethylsilyl-trifluoroacetamide
MUFA Monounsaturated fatty acid
NIST The National Institute of Standards and Technology
NMR Nuclear magnetic resonance
ORAC Oxygen radical absorbance capacity
P Plain/Control diet
PC Principal component
PCA Principal component analysis
xvii
PG Prostaglandin
ppm mg /1000 g
PSC Plant secondary compounds
PTFE Polytetrafluoroethylene
PUFA Polyunsaturated fatty acid
PVC Polyvinyl chloride
r Pearson correlation coefficients
RDA Recommended Dietary Allowance
RDI Recommended Daily Intake
REA Ribeye area
ROOH Lipid peroxides
S Saponin-rich diet
SAS Statistical Analysis Software
SFA Saturated fatty acid
SOD Superoxide dismutase
SPME Solid phase micro-extraction
T Tannin-rich diet
TBA Thiobarbituric acid assay
TBARS Thiobarbituric acid reacting substances
TE Trolox equivalents
TEAC Trolox equivalent antioxidant capacity
TMS Trimethylsilyl
TVA trans-Vaccenic acid
TX Thromboxane
USDA The United States Department of Agriculture
ω-3 Omega-3 fatty acid
ω-6 Omega-6 fatty acid

CHAPTER 1
INTRODUCTION
Good health starts with good food. But, where does good food begin, and what
exactly is good food? Most people would agree that in addition to good taste, good food
is nutritious. Currently, there is much interest in increasing the health benefits of meat
from pasture-fed ruminants. Several studies have revealed health benefits of pasture-fed
beef over grain-fed beef (McCluskey et al., 2005; Knight et al., 2003). These reports
have demonstrated a relationship between the animal diet, meat nutritional properties,
and human health.
In spite of the attention given to pasture versus grain feeding of livestock, more
information is needed regarding effects of plant secondary compounds (PSC) in various
forages related to meat quality as well as human health. Plant secondary compounds
include toxins produced by plants as deterrents to attack by insects or grazing animals.
However, consumption of toxic PSC’s can sometimes have positive impact on animal
nutrition and health, depending on the type of PSC and the amount consumed (Vasta et
al., 2008). For example, some tannins enhance animal nutrition by their capability to link
to dietary proteins, thus protecting the protein from degradation by rumen bacteria
(Lisonbee et al., 2009), and saponins reportedly have cholesterol lowering activity in
mammals (Guclu-Ustundag & Mazza, 2007). Therefore, it would be of high interest to
evaluate characteristics of meat obtained from the enrichment these PSCs in the feed.
Realini et al. (2005) were the first to detect positive effect of ergot-alkaloid
containing in tall-fescue in carcass subcutaneous adipose tissues from beef cattle fed with

2
wild-type tall fescue. In their study, sensory panel evaluations show higher chewiness and
lower juiciness of 14-day aged steaks from cattle fed nil-ergot as opposed to endophyte-
infected tall fescue. Overall, however, there is limited data about the linkage among
plants, herbivore diets, meat quality, consumer preferences, and human health. Thus,
additional information as regards these relationships is needed to understand and develop
new animal feeding regimes for optimum animal growth, meat flavor, and meat
nutritional quality.
Hypothesis Animal diets, including secondary metabolites in the diet, have an effect on meat
chemical characteristics, meat quality, and nutritional value of meat as a food.
Objectives
1. To examine how meat characteristics are affected by cattle diet; specifically the
effect of pasture- versus grain-finishing on beef rib steak composition, and the
relationship between meat volatiles (chemical assay) with meat flavor profiles
(sensory evaluation).
2. To determine the effects on meat quality of a cattle finishing regime consisting of
alfalfa-grass mix (bloating legume containing secondary metabolite saponins)
versus sainfoin-grass mix (non-bloating legume containing secondary metabolite
tannins).
3. To evaluate the effects of a confinement diet of dried beet pulp supplemented
with tannins (purified extract of Quebracho), or saponins (extract of Quillaja

3
saponaria), when given in single ration or as choice of them, on lamb rib muscle
metabolomics profile, compared to a control diet (beet pulp only).
References Guclu-Ustundag, O. & Mazza, G. (2007). Saponins: properties, applications and
processing. Critical Reviews in Food Science and Nutrition, 47, 231-258.
Knight, T.W., Knowles, S., Death, A.F., West, J., Agnew, M., Morris, C.A. & Purchas,
R.W. (2003). Factors affecting the variation in fatty acid concentrations in lean
beef from grass-fed cattle in New Zealand and the implications for human health.
New Zealand Journal of Agricultural Research, 46:2, 83-95.
Lisonbee, L.D., Villalba, J.J. & Provenza, F.D. (2009). Effects of tannin on selection by
sheep of forages containing alkaloids, tannins and saponins. Journal of the
Science of Food and Agriculture, 89:15, 2668-2677.
McCluskey, J.J., Wahl, T.I., Quan, L. & Wandschneider, P.R. (2005). U.S. Grass-fed
beef: marketing and health benefits. Journal of Food Distribution Research, 36:3,
1-8.
Realini, C.E., Duckett, S.K., Hill, N.S., Hoveland, C.S., Lyon, B.G., Sackmann, J.R. &
Gillis, M.H. (2005). Effect of endophyte type on carcass traits, meat quality, and
fatty acid composition of beef cattle grazing tall fescue. Journal of Animal
Science, 83, 430-439.
Vasta, V., Nudda, A., Cannas, A., Lanza, M. & Priolo, A. (2008). Alternative feed
resources and their effects on the quality of meat and milk from small ruminants.
Animal Feed Science and Technology, 147:1-3, 223-246.

4
CHAPTER 2
LITERATURE REVIEW
Animal Diets In the United States, cattle are typically raised on pasture from birth in the spring
until autumn (7 - 9 months). During the winter months, cattle are fed hay, then finished
for 90 - 120 days with a high energy grain-based diet (i.e. corn, barley, and soy)
supplemented with small amounts of hay until slaughter. Cattle finished with grain
("grain-fed" or "corn-fed" beef) produce high-fat carcasses with a high degree of
marbling, associated with high palatability, and preferred by the majority of consumers.
Currently, however, there is much interest in meat from pasture-finished
ruminants, which appeals to health-conscious consumers (McCluskey et al., 2005)
because it is leaner (lower fat content) and has lower caloric levels as compared to grain-
fed beef. Pasture-fed beef also has higher levels of polyunsaturated fatty acids (PUFA)
including the omega-3 fatty acids (Eriksson & Pickova, 2007; Ponnampalam et al., 2006;
Gatellier et al., 2005; French et al., 2000), and conjugated linoleic acid (CLA; Poulson et
al., 2004; French et al., 2000). Conversely, diet affects the flavor of the resultant meat,
and off-flavors were related to the meat derived from pasture-fed animals (Mandell et al.,
1998; Larick et al., 1987; Melton et al., 1982).
Pastures used for livestock feeding include grass such as tall fescue, and legumes.
Legumes are highly nutritious (high protein) due to their ability of nitrogen fixation.
However, some legumes, for example alfalfa and clover, can sometimes cause frothy
bloat in ruminants (Berg et al., 2000; Majak et al., 1995), leading to animals’ death. As a

5
result, non-bloating legumes, i.e. cicer milkvetch, sainfoin and bird's foot trefoil, or
legume-grass mixtures system are used for livestock feeding to manage the bloating
problem.
Plant Secondary Compounds
Plant secondary compounds (PSC), also called as plant secondary metabolites, are
a diverse group of molecules that constitute the “plant defense system” and are not
involved in the primary biochemical pathways of cell growth and reproduction (Wallace,
2004). PSC are increasingly recognized as important in animal health, welfare, and
nutrition (Villalba et al., 2011). The effective dose of PSC depends on their
concentrations, which differs among plant species and parts of the plants. Forages with
low concentrations are beneficial, but excessive consumption can detrimentally affect
herbivores health. The classification of PSC based on their chemical structure (with and
without nitrogen) and the estimated numbers of PSC from natural products that have been
found are shown in Table 2-1. In this study, we mainly focused on the characteristics of
meat obtained from animals fed with two PSCs, tannins and saponins.
Tannins Tannins are non-nitrogen containing phenolic PSC. According to their structures,
tannins can be divided in two groups; 1) hydrolyzable tannins and 2) non-hydrolyzable
tannins or condensed tannins (Haslam, 1989). Hydrolyzable tannins are the low
molecular weight (ranging from 500 to over 3,000) phenolic compounds occurring
universally in various plants. Chemically, they are composed of the esters of phenolic

6
Table 2-1 Classification of an estimated range of plant secondary compounds Plant secondary compounds No. of natural products
With Nitrogen
Alkaloids 12,000
Non-protein amino acids 600
Amines 100
Cyanogenic glycosides 100
Glucosinolates 100
Without Nitrogen
Terpenoids
Monoterpenes 1,000
Sesquiterpenes 3,000
Diterpenes 2,000
Triterpenes, Tetraterpenes, Saponins, Steroids 4,000
Phenolics (including tannins)
Flavonoids 2,000
Polyacetylenes 1,000
Polyketides 750
Phenylpropanes 1,000
(Adapted from: Acamovic & Brooker, 2005)
acids and a polyol, which is usually glucose. When heating hydrolysable tannins with
hydrochloric or sulfuric acids, the yields are gallic or ellagic acids (polyphenolic tannic
acid derivatives). Condensed tannins are polymers formed by the condensation of flavans
that do not contain sugar residues. There are different types of condensed tannins such as
the proanthocyanidins, prodelphinidins, profisetinidins, proguibourtinidins or
prorobinetidins. Condensed tannins have high molecular weight (up to 20,000 for

7
proanthocyanidins) and are the most abundant in woody plants. The structure of
condensed tannins is shown in Fig. 2-1.
Saponins Saponins are PSC consisting of one or more hydrophilic glycoside moieties
combined with a polycyclic aglycone (Hostettmann & Manton, 1995;
http://www.ansci.cornell.edu/plants/toxicagents/saponin.html). The aglycone part
(glycoside-free portion), which is also called sapogenins, can be either a steroid (C27) or
triterpene (C30). The common saponin aglycones found in legumes are shown in Fig. 2-
2. Saponins have a soapy characteristic due to their surfactant properties. The foaming
ability of saponins is caused by the combination of a fat-soluble (nonpolar) sapogenin
and a water-soluble sugar side chain.
R = H; Procyanididn R = OH; Prodelphinidin
(Source: Barbehenn & Constabel, 2011) Figure 2-1 Condensed tannin polymer.

8
(Source: Huhman & Sumner, 2002)
Figure 2-2 Chemical structures of common saponin aglycones found in legumes. Essential Fatty Acids
Essential fatty acids (EFA) are fatty acids that humans must acquire by dietary
intake because they are vital for normal metabolism but we cannot synthesize them
(Goodhart & Shils, 1980). There are two EFAs needed for humans, α-linolenic acid
(omega-3 fatty acid) and linoleic acid (omega-6 fatty acid).
Omega-3 polyunsaturated fatty acids (ω-3 PUFAs) are commonly found in
marine fish and seed oils such as flax seeds. Omega-3 fatty acids are essential for normal
growth and development and may play an important role in the prevention and treatment
of coronary artery disease, hypertension, arthritis, other inflammatory and autoimmune
disorders, and cancer (Simopoulos, 1991). After consumption of ω-3 PUFAs, mammals
9
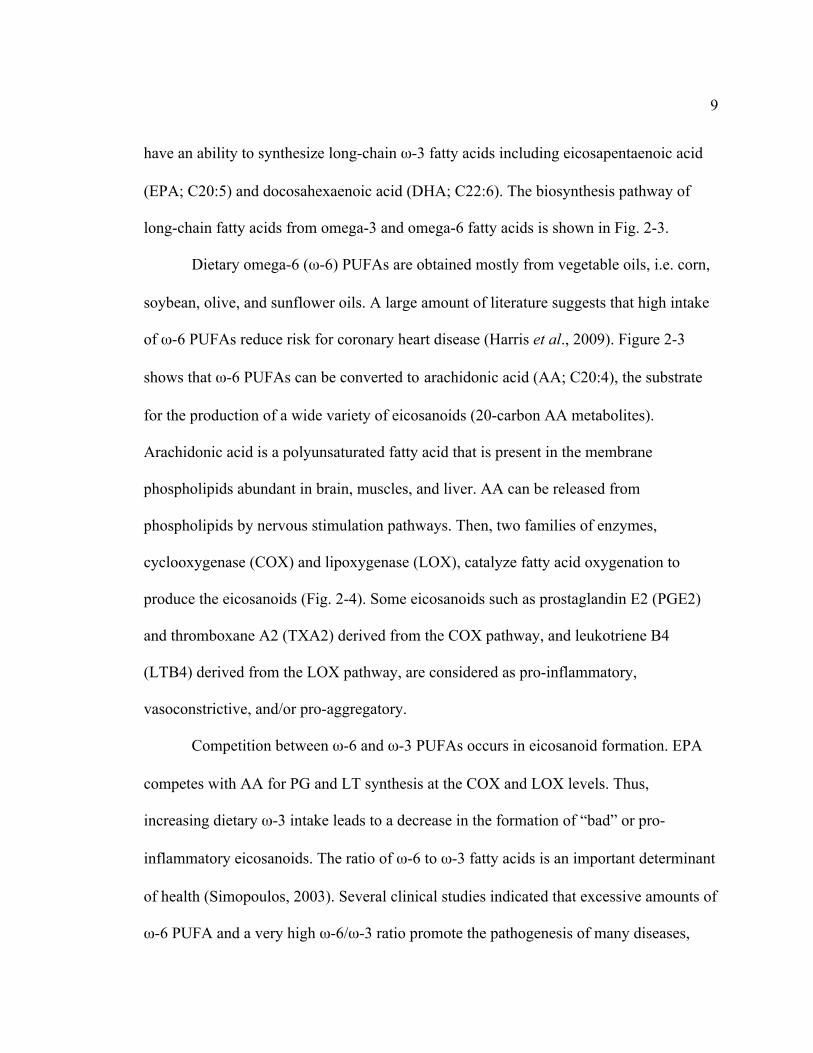
have an ability to synthesize long-chain ω-3 fatty acids including eicosapentaenoic acid
(EPA; C20:5) and docosahexaenoic acid (DHA; C22:6). The biosynthesis pathway of
long-chain fatty acids from omega-3 and omega-6 fatty acids is shown in Fig. 2-3.
Dietary omega-6 (ω-6) PUFAs are obtained mostly from vegetable oils, i.e. corn,
soybean, olive, and sunflower oils. A large amount of literature suggests that high intake
of ω-6 PUFAs reduce risk for coronary heart disease (Harris et al., 2009). Figure 2-3
shows that ω-6 PUFAs can be converted to arachidonic acid (AA; C20:4), the substrate
for the production of a wide variety of eicosanoids (20-carbon AA metabolites).
Arachidonic acid is a polyunsaturated fatty acid that is present in the membrane
phospholipids abundant in brain, muscles, and liver. AA can be released from
phospholipids by nervous stimulation pathways. Then, two families of enzymes,
cyclooxygenase (COX) and lipoxygenase (LOX), catalyze fatty acid oxygenation to
produce the eicosanoids (Fig. 2-4). Some eicosanoids such as prostaglandin E2 (PGE2)
and thromboxane A2 (TXA2) derived from the COX pathway, and leukotriene B4
(LTB4) derived from the LOX pathway, are considered as pro-inflammatory,
vasoconstrictive, and/or pro-aggregatory.
Competition between ω-6 and ω-3 PUFAs occurs in eicosanoid formation. EPA
competes with AA for PG and LT synthesis at the COX and LOX levels. Thus,
increasing dietary ω-3 intake leads to a decrease in the formation of “bad” or pro-
inflammatory eicosanoids. The ratio of ω-6 to ω-3 fatty acids is an important determinant
of health (Simopoulos, 2003). Several clinical studies indicated that excessive amounts of
ω-6 PUFA and a very high ω-6/ω-3 ratio promote the pathogenesis of many diseases,

10
including cardiovascular disease, cancer, and inflammatory and autoimmune diseases,
whereas increased levels of ω-3 PUFA (a lower ω-6/ω-3 ratio), exert suppressive effects
(Simopoulos, 2004; de Lorgeril & Salen, 2003).
(Source: Koletzko et al., 2011)
Figure 2-3 Biosynthesis of long-chain fatty acids from omega-3 and omega-6 fatty acids.

11
(Source: Calder, 2010)
Figure 2-4 Biosynthesis of eicosanoids from arachidonic acid. COX, cyclooxygenase; HETE, hydroxyeicosatetraenoic acid; HpETE, hydroperoxyeicosatetraenoic acid; LOX, lipoxygenase; LT, leukotriene; LX, lipoxin; oxoETE, oxoeicosatetraenoic acid; PG, prostaglandin; TX, thromboxane.
Conjugated Linoleic Acids
Conjugated linoleic acids (CLA) are a group of isomers of linoleic acid (C18:2)
found mainly in the meat and dairy products derived from ruminants (Daley et al., 2010).
Of the many isomers identified, the cis-9, trans-11 CLA isomer is the main isomer
accounting for up to 80 - 90% of the total CLA in ruminant products (Nuernberg et al.,

12
2002). The positive health effects of CLA are the reduction in body fat accretion and
altered nutrient partitioning, anti-diabetic effects, reduction in the development of
atherosclerosis, enhanced bone mineralization, and modulation of the immune system
(Bauman et al., 1999).
CLA can occur from two natural sources; 1) bacterial bio-hydrogenation of
PUFAs in the rumen, and 2) desaturation of trans-fatty acids in the adipose tissue and
mammary gland of ruminants (Griinari et al., 2000; Sehat et al., 1999).
(Source: Bauman et al., 2003)
Figure 2-5 Biochemical pathways for the bio-hydrogenation of linoleic and linolenic acids in the rumen. Rumen bacteria involved in bio-hydrogenation have been classified into two groups, A and B, based on their metabolic pathways, with both groups required to be present in order to obtain complete biohydrogenation of PUFAs.

13
Linoleic and linolenic acids are the major substrates for microbial bio-
hydrogenation (Bauman et al., 2003) by an anaerobic rumen bacterium Butyrivibrio
fibrisolvens (Kepler et al., 1966), which is highly dependent on rumen pH (Pariza et al.,
2000). Figure 2-5 illustrates the biochemical pathways for the bio-hydrogenation of
linoleic and linolenic acids in the rumen. De novo synthesis of CLA occurs by the bio-
hydrogenation of linoleic acid via trans-vaccenic acid (TVA) as an intermediate.
Turpeinen et al. (2002) reported a linear relationship between CLA synthesis and TVA
content. CLA synthesis increased with the increase of TVA concentration in the diet.
Lipid Oxidation in Meat
Lipid oxidation (also termed peroxidation or autoxidation; the spontaneous
reaction of a compound with molecular oxygen at room temperature) is a major cause of
quality deterioration of stored meat and meat products (Min & Ahn, 2005; Ladikos &
Lougovois, 1990). Lipid oxidation is related to flavor deterioration (development of
rancidity or warmed-over flavor), loss of color (redness), loss of nutritional value,
functional property changes, or the formation of toxic compounds, all of which affect
consumer acceptance of the meat (Addis, 1986; Frankel, 1984). Lipid oxidation is a free
radical chain reaction or autoxidation that consists of three steps: 1) Initiation, the
formation of free radicals; 2) Propagation, the free-radical chain reactions; and 3)
Termination, the formation of non-radical products (Fig. 2-6).
Reactive oxygen species (ROS), such as superoxide (O2•-), hydroperoxyl radical
(OH2•), hydrogen peroxide (H2O2), and hydroxyl radical (•OH), are the major initiators
of the chain reaction. Unsaturated fatty acid moieties are the important lipids involved in

14
oxidation. The main unsaturated fatty acids comprising the lipids of animal tissues are
oleic, linoleic, linolenic, and arachidonic (Ladikos & Lougovois, 1990). The other factors
rather than degree of unsaturation that could affect the development of lipid oxidation in
meat are the processing and storage conditions of meat, the antioxidants and additives, or
the pro-oxidants such as free iron. Soluble (free) iron has been considered a major
catalyst for the initiation step of lipid oxidation. In meat, iron sources include hemoglobin
& myoglobin, iron-containing enzymes, and transferrin (Min & Ahn, 2005).
1.) Initiation
RH + Initiator → R• + H•
2.) Propagation
R• + O2 → ROO•
ROO• + RH → ROOH + R•
3.) Termination
R• + R• → RR
R• + ROO• → ROOR
ROO• + ROO• → ROOR + O2
Figure 2-6 The general schematic diagram for the three steps of autoxidation: Initiation, Propagation, and Termination. RH = unsaturated lipid; R• = lipid free radical; H• = hydrogen free radical; ROO• = peroxy free radical; ROOH = lipid hydroperoxide; RR = lipid dimer; ROOR = lipid peroxide.
15
Measurement of lipid oxidation Lipid oxidation in meat can be measured by either direct or indirect approaches of
free radicals. For the direct measurements, free radicals can be detected and characterized
by electron spin resonance or spin trapping methods. Markers of free radicals can be
indirectly measured by several methods such as iodine value, peroxide value,
thiobarbituric acid reacting substances (TBARS), high-performance liquid
chromatography with fluorometric detection, or gas chromatography. The thiobarbituric
acid (TBA) assay is the most widely employed due to its simplicity for measuring
autoxidation of fats and oils in foods. The assay of TBARS measures malondialdehyde
(MDA) present in the sample, which is generated from lipid hydroperoxides. The basic
principle of this method is the reaction of 1 molecule of MDA and 2 molecules of TBA to
form an MDA-TBA complex (pink to red color), which can be quantified by
spectrophotometric absorbance at 532 nm (Fig. 2-7).
Myoglobin Oxidation in Meat
Myoglobin (Mb) is an iron- and oxygen-binding protein found in the muscle
tissue. Mb contains the heme porphyrin, which has a single iron molecule at its center
(Fig. 2-8). There are three myoglobin pigments important in the fresh meat systems:
deoxymyoglobin (dMb), oxymyoglobin (MbO2), and metmyoglobin (MetMb). The redox
state of the iron atom determines the color of the meat. Fresh cut beef has the native meat
pigment form of dMb (no oxygen bound; purple color). When the fresh beef is exposed to
oxygen, oxygen will bind to the heme iron of myoglobin forming MbO2, which has bright
red color. The iron of both dMb and MbO2 is in the reduced state (ferrous, Fe2+). As meat

16
ages, it turns brown as the Mb is converted to MetMb and Fe2+ is oxidized to Fe3+
(ferric), resulting in rejection of fresh retail beef by consumers. MetMb acts as a catalyst
of lipid oxidation, and lipid peroxidation increases the rate of MetMb formation, so their
levels were closely correlated (Anton et al., 1996).
(Sources: Paul, H. An Introduction to reactive oxygen species: Measurement of ROS in cells, BioTek Instruments, Inc. Available at http://www.biotek.com/assets/tech_resources/ROS_White_Paper.pdf)
Figure 2-7 TBARS assay reactions. TBA = thiobarbituric acid; MDA = malondialdehyde.
Deoxymyoglobin (Fe2+)
Oxymyoglobin (Fe2+- O2)
Metmyoglobin (Fe3+)
(Sources: http://upload.wikimedia.org/wikipedia/commons/b/be/Heme_b.svg) Figure 2-8 From left; myoglobin, heme porphyrin, and myoglobin pigments in fresh meat.
17
Metmyoglobin reducing activity
Metmyoglobin reducing activity (MRA) is a measurement of the ability of muscle
samples to reduce MetMb. Hutchins et al. (1967) reported a significant positive
correlation between lipid oxidation and MetMb concentration, and a significant negative
correlation between MetMb concentration and MRA. Bekhit & Faustman (2005), in their
review “Metmyoglobin Reducing Activity,” summarized factors affecting MRA into 2
categories: 1) enzymatic, and 2) non-enzymatic systems. Factors affecting enzymatic
oxidation/reduction include lipid oxidation, oxygen level, storage time, temperature, pH,
light, ions and pro-oxidant chemicals, availability of nucleotides such as
NADH/NADPH, or exercise and diet. Factors affecting non-enzymatic metmyoglobin
reduction include the presence of EDTA, ascorbic acid, vitamin E, or bacteria.
MRA in meat can be measured by one of these following assays; MetMb reducing
activity (Stewart et al., 1965), reduction of nitrite oxide MetMb (Watts et al., 1966),
aerobic reducing ability (Ledward, 1972), total reducing activity (Lee et al., 1981),
reduction of 2,6-dichlorophenol indophenol (Rossi-Fanelli et al., 1957), methylene blue
MetMb reductase activity (Echevarne et al., 1990), or MetMb reductase activity (Reddy
& Carpenter, 1991).
Antioxidants in Meat
An antioxidant is a molecule capable of inhibiting the oxidation of other
molecules. Antioxidant compounds can be incorporated in beef muscle through dietary
delivery and protect tissues against oxidation from reactive oxygen species, resulting in
improved color stability, stabilized fatty acids in meat, and extended storage life.
18
Antioxidant defenses in meat include non-enzymatic hydrophilic and lipophilic soluble
compounds such as vitamin E, vitamin C, carotenoids, ubiquinols, polyphenols, cellular
thiols, or antioxidant enzymes such as superoxide dismutase (SOD), catalase (CAT) and
glutathione peroxidase (GPx), which operate to counteract the action of pro-oxidants in
muscle tissues (Descalzo & Sancho, 2008). Concentrations of endogenous antioxidants
depend on animal species, muscle type and diet. Pasture diet conferred an improved
overall antioxidant status in fresh beef when compared to grain finished diets (Descalzo
et al., 2005, 2007; Gatellier et al., 2004). Meat obtained from pasture-finished animals is
particularly rich in natural antioxidants such as vitamin A, C and E or phytochemicals
such as carotenoids and flavonoids (Daley et al., 2010; Wood & Enser, 1997), as well as
cancer fighting antioxidants such as glutathione (GT) and SOD (Daley et al., 2010),
compared to grain-fed meat.
Antioxidant vitamins
Vitamin E is a fat-soluble vitamin with powerful antioxidant activity. The most
bio-potent isoform of vitamin E is α-tocopherol (Pryor, 1996). Vitamin E, α-tocopherol,
improves the quality of meat by its pronounced color stabilizing effect, as well as
delaying lipid oxidation, thus prolonging retail display life (Descalzo & Sancho, 2008;
Faustman et al., 1998; Wood & Enser, 1997). The mechanism of action is the rapid
oxidation of α-tocopherol in membranes, in preference to other membrane lipids (about
104 times faster than the propagation of membrane lipids). Therefore, membrane lipids
are spared from oxidation, retarding oxymyoglobin oxidation and meat decoloration
(Morrisey et al., 2000; Faustman et al., 1998). Alpha-tocopherol also inhibits fatty acid

19
oxidation in meats, when incorporated into the living muscle, thus protecting the tissue at
the onset of the lipid oxidation, and slowing oxidation of membrane phospholipids during
meat storage (Descalzo & Sancho, 2008). Dietary vitamin E supplementation of livestock
increases concentrations of α-tocopherol within cell membranes (Ashgar et al., 1991;
Monahan et al., 1990). Liu et al. (1995) reported a review from cumulative experiments
that steers fed 500 IU/ daily of vitamin E for 126 day could assuredly benefit the
domestic retail market by extending color display life of meat. In addition, many studies
report that ruminants finished with forage had higher α-tocopherol levels in their tissues,
compared to muscles from concentrated-fed animals (Fuente et al., 2009; Insani et al.,
2008; Descalzo et al., 2005; Muramoto et al., 2005; Gatellier et al., 2004; Realini et al.,
2004b; Lanari et al., 2002; Yang et al., 2002).
Carotenoids are tetra-terpenoid organic pigments that are naturally occurring in
the chloroplasts and chromoplasts of higher plants. β-Carotene is a fat-soluble compound
that is thought to act as a biological antioxidant, specifically a quencher of singlet oxygen
that protects against lipid oxidation occurring in highly unsaturated fatty acids in cellular
membranes (Witt et al., 1992). β-Carotene cooperates with tocopherols in the radical
scavenging capacity within the interior of lipid membranes (Tsuchihashi et al., 1995).
Muramoto et al. (2003) showed that dietary β-carotene supplementation in cattle
extended the acceptable color muscle shelf life by 1.5 - 3 days (P < 0.001). Incorporation
of β-carotene from diet into muscle showed a high variability among experiments,
depending on dietary delivery, muscle type, and the individual animal uptake capacity
(Descalzo & Sancho, 2008). Cattle produced under extensive grass-based production

20
systems generally have more yellow carcass fat of derived from dietary carotenoids,
compared to concentrate-finished cattle (Daley et al., 2010), associated with a healthier
fatty acid profile and a higher antioxidant content (Dunne et al., 2009). Pasture-fed
animals were found to incorporate significantly higher amounts of β-carotene into muscle
tissues as compared to grain-fed animals (Insani et al., 2008; Descalzo et al., 2005;
Muramoto et al., 2003, 2005; Yang et al., 2002).
Vitamin C or L-ascorbic acid is a hydrophilic reducing agent, which inhibits
myoglobin oxidation and brown color development in beef (Sanchez-Escalante et al.,
2001). Ascorbic acid is commonly added to post-mortem raw ground beef to improve
redness retention and extend shelf life during retail display. Descalzo et al. (2005)
measured the level of vitamin C in fresh beef from pasture- and grain-fed animals and
found that pasture-fed animals had higher content of vitamin C when compared to grain-
fed beef. There were 21.98 - 25.30 µg/g of ascorbic acid for meat from pasture versus
15.92 - 17.39 µg/g for grain-fed animals, which is lower than the concentrations added to
improve meat stability (500 - 1000 µg/g, Realini et al., 2004a). Nevertheless, King et al.
(1995) reported that meat from broilers finished with L-ascorbic acid for 24 h prior to
slaughter did not improve the lipid oxidation status (TBARS values) as compared to
control (P > 0.05).
Antioxidant enzymes
Antioxidant enzymes constitute the primary mechanism for protecting cells from
oxidative damage in vivo (Halliwell & Gutteridge, 1989). The most important antioxidant
enzymes in muscle are superoxide dismutase (SOD), catalase (CAT) and glutathione

21
peroxidase (GPx), which are an intracellular barrier against free radicals in fresh meat
(Descalzo & Sancho, 2008). SOD and CAT are coupled enzymes that work together.
SOD scavenges superoxide anions by forming hydrogen peroxide (O + 2H2O → H2O2)
and CAT decomposes the hydrogen peroxide by: H2O2 → 2H2O + O2. GPx is an
antioxidant enzyme which function is to reduce organic peroxides and free hydrogen
peroxide to water. The reduced form of glutathione (GSH) can decompose both H2O2 or
lipid peroxides (ROOH) to oxidized glutathione (GSSG) by GPx catalysis (2GSH + H2O2
→ GSSG + 2H2O; 2GSH + ROOH → GSSG + ROH + H2O).
Researchers demonstrated diverse results of antioxidant activity in beef as
affected by diets. Misra & Fridovich (1972) reported that meat from pasture-fed animals
had higher SOD activity than meat from grain-fed animals. The same tendency was also
shown by Gatellier et al. (2004), Mercier et al. (2004), Descalzo et al. (2007), and Insani
et al. (2008). Gatellier et al. (2004) found that a pasture diet considerably increased SOD
activity in Longissimus dorsi muscle of Charolais cows as compared to a mixed diet (P <
0.001). However, they also showed that lower activities of CAT and GPx were produced
in meat from pasture-fed than meat from mixed-diet cattle (P < 0.001). Mercier et al.
(2004) demonstrated significantly higher (P < 0.001) SOD and GPx levels in meat from
cattle fed pasture over mixed-diet meat, but the CAT level was not significantly different
between diet groups. Descalzo et al. (2007) also stated that pasture-fed meat had
significantly higher SOD activity than meat from grain-fed animals (P < 0.05), but the
CAT and GPx activities were similar in both diet treatments. However, Insani et al.
(2008) reported that SOD activity tended to be higher (but not significantly, P > 0.10) in

22
meat from cattle fed a pasture diet (13.6 units/mg protein) compared to the grain diet (9.8
units/mg protein). Yet, significant difference (P < 0.05) in CAT and GPx activities were
also reported. CAT levels were significantly higher in meat from forage-fed than meat
from animals fed a concentrate diet (11.3 vs. 8.9 units/mg), whereas grain-fed meat had a
significantly higher GPx level as compared to pasture-fed meat (12.3 vs. 22.3 units/mg
protein).
Measurement of total antioxidant activity in meat
The antioxidant activity is the capability of a compound (composition) to inhibit
oxidative degradation, e.g. lipid peroxidation. Several antioxidant assessment methods
are available; for example, ferric reducing antioxidant power (FRAP), trolox equivalent
antioxidant capacity (TEAC), 2,2-diphenyl-1- picrylhydrazyl radical scavenging capacity
assay (DPPH), and oxygen radical absorbance capacity (ORAC) have been used to
evaluate antioxidant activities in fresh beef. However, the results varied among different
techniques. Gatellier et al. (2004) used the benzoate hydroxylation test to measure OH•
scavenging activities and found that OH• scavenging activities were more pronounced in
meat from mixed diets than from pasture-fed animals (P < 0.001). The authors also
applied the TEAC test against ABTS•+ [2,2-azin-obis-(3-ethylbenzothiazoline-6-
sulphonic acid)] radical cation to the same meat samples and found that there were no
significant effects between diet treatments. Descalzo et al. (2007) applied FRAP and
TEAC assays to measure the antioxidant activities in fresh meat. They reported that beef
from pasture-fed animals presented higher reducing potential than meat from grain-fed
animals (P < 0.05) using the FRAP test, but no differences were found between diet

23
groups in the TEAC assay. Wu et al. (2008) developed the ORAC assay to determine
antioxidant activity in meat products and found that hydrophilic ORAC did not differ
among forage-finished (alfalfa, pearl millet and naturalize pasture) and high concentrate
finished animals (P < 0.05). However, higher levels (P < 0.01) of lipophilic ORAC were
found in beef extract from alfalfa and pearl millet-finished steers, compared to samples
from cattle finished on naturalized pasture or high concentrate diets.
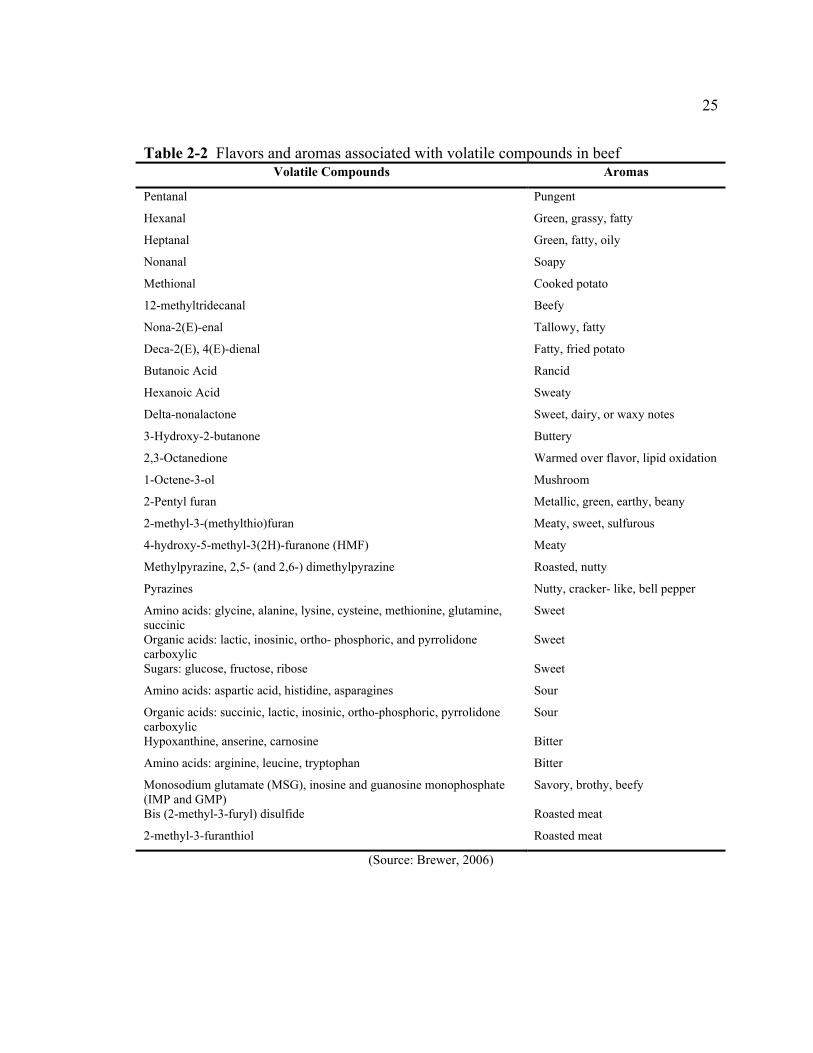
Beef Volatiles
Flavors and aromas associated with beef are generally those that develop when
heat is applied, depended on the amounts and proportions of precursor compounds
present. A variety of volatiles occur during heating, i.e., acids, alcohols, aldehydes,
aromatic compounds, esters, ethers, furans, hydrocarbons, ketones, lactones, pyrazines,
pyridines, pyrroles, sulfides, thiazoles, and thiophenes (Shahidi, 1994). Proteins,
carbohydrates, and lipids play primary roles in beef flavor development (Mottram, 1998;
Spanier & Miller, 1993). The characteristic flavor of cooked meat derives from thermally
induced reactions, principally generated by the Maillard reaction and the degradation of
lipids (Mottram, 1998; Bailey, 1983). Maillard reactions occur when carbohydrates
(glucose) give off furans, which then react with sulfur-containing amino acid cysteine
(Umano et al., 1995), resulting in roasted meat aromas (Brewer, 2006). Amino acids and
peptides can produce compounds such as ammonia, aldehydes and amino ketones.
Nucleotides produce furanones, which are associated with meaty flavor (Spanier &
Miller, 1993). The oxidation of unsaturated fatty acids generates intermediate
hydroperoxides that finally results in aldehydes, unsaturated alcohols, ketones, and
24
lactones (Mottram, 1998). Aldehydes generally possess meaty and tallow odors (Rowe,
2002). Phospholipids in muscle tissue consist of a high proportion of unsaturated fatty
acids that are susceptible to oxidation. Example of flavors and aromas associated with
volatile compounds in beef are shown in Table 2-2.
Beef aromas could be influenced by heat, animal breed, aging time, muscle type,
enhancement such as brine injection, and animal diet. Ruminant diets were reported to
have an effect on beef flavors in many studies and positive sensory evaluation is usually
higher in meat from animals given a grain-finishing diet in the period before harvest. For
instance, Melton’s review (1990) found that high-energy grain diets produced more
acceptable and intense flavor in meats than low-energy pasture diets. Hedrick et al.
(1980) demonstrated that meat from steers grazed on fescue pasture has a grassy and
bitter flavor.
Metabolomics
Metabolomics is the study of the complete set of small-molecule metabolites
(metabolome) produced within a biological organism (cells, body fluids, tissues). Stated
another way, it is a survey of the unique chemical fingerprints in the body, which are the
end products of its gene expression. Metabolites measuring by metabolomic analysis are
the intermediates and products of metabolism such as peptides (i.e., cofactors, signaling
molecules), nucleotides, carbohydrates, and lipids.
Regarding the “-omics” cascade going from genotype to phenotype,
metabolomics is the last -omics among the functional genomics technologies (de Hoog &
Mann, 2004; Fig. 2-9). Since the polymorphisms in gene, transcription, and protein levels
25
Table 2-2 Flavors and aromas associated with volatile compounds in beef Volatile Compounds Aromas
Pentanal Pungent
Hexanal Green, grassy, fatty
Heptanal Green, fatty, oily
Nonanal Soapy
Methional Cooked potato
12-methyltridecanal Beefy
Nona-2(E)-enal Tallowy, fatty
Deca-2(E), 4(E)-dienal Fatty, fried potato
Butanoic Acid Rancid
Hexanoic Acid Sweaty
Delta-nonalactone Sweet, dairy, or waxy notes
3-Hydroxy-2-butanone Buttery
2,3-Octanedione Warmed over flavor, lipid oxidation
1-Octene-3-ol Mushroom
2-Pentyl furan Metallic, green, earthy, beany
2-methyl-3-(methylthio)furan Meaty, sweet, sulfurous
4-hydroxy-5-methyl-3(2H)-furanone (HMF) Meaty
Methylpyrazine, 2,5- (and 2,6-) dimethylpyrazine Roasted, nutty
Pyrazines Nutty, cracker- like, bell pepper
Amino acids: glycine, alanine, lysine, cysteine, methionine, glutamine, succinic
Sweet
Organic acids: lactic, inosinic, ortho- phosphoric, and pyrrolidone carboxylic
Sweet
Sugars: glucose, fructose, ribose Sweet
Amino acids: aspartic acid, histidine, asparagines Sour
Organic acids: succinic, lactic, inosinic, ortho-phosphoric, pyrrolidone carboxylic
Sour
Hypoxanthine, anserine, carnosine Bitter
Amino acids: arginine, leucine, tryptophan Bitter
Monosodium glutamate (MSG), inosine and guanosine monophosphate (IMP and GMP)
Savory, brothy, beefy
Bis (2-methyl-3-furyl) disulfide Roasted meat
2-methyl-3-furanthiol Roasted meat
(Source: Brewer, 2006)

26
can be influenced by the environment, i.e. diet, which affects the end results of cell
metabolism, metabolomics is considered to be a better characterization of the phenotype
of an organism than other -omic sciences. The analysis of comprehensive metabolomic
profiles will help to achieve an integrated understanding of the genetic capabilities of an
organism. Metabolomic techniques contribute to several life sciences including nutrition,
pharmacology, and medicine. For example, metabolomics may be used as a tool to
understand metabolic disorders such as diabetes and obesity (Griffin & Nicholls, 2006),
as a clinical application in oncology (Spratlin et al., 2009), as a tool to develop new drugs
(Shyur & Yang, 2008; Wishart, 2008a; Kell, 2006), or as a tool for nutraceutical
evaluation (Fujimura et al., 2011; Balderas et al., 2010). Moreover, metabolomics
analysis techniques are also applied to individually personalized diets (German et al.,
2003, 2004) or medicines (Kaddurah-Daouk et al., 2008), which are a novel current trend
in life sciences.
Metabolomics analysis techniques
Several analytical techniques are used for metabolomics, including direct-
injection mass spectrometry analysis (Dettmer et al., 2007; Dunn, 2005) i.e. fourier
transform ion cyclotron resonance (FTICR-MS) and time of flight mass spectrometers
(TOF-MS), high-performance and ultra-performance liquid chromatography combined
with mass spectrometry (HPLC-MS and UPLC-MS; Nordstrom et al., 2006), liquid
chromatography-mass spectrometry (LC-MS; Lu et al., 2008), gas chromatography-mass
spectrometry (GC-MS; Styczynski et al., 2007; Jonsson et al., 2005; Fiehn et al., 2000),
microfluidic-capillary electrophoresis (Kraly et al., 2009), and nuclear magnetic

27
resonance (NMR) spectroscopy (Wishart, 2008b; Viant et al., 2003). Among these
procedures, GC-MS is a suitable technique for comprehensive analysis because it
combines high separation efficiency with versatile, selective and sensitive mass detection
(Koek et al., 2011).
Nevertheless, Van der Werf et al. (2005) reported that many polar metabolites are
thermally labile or are not volatile at all at the temperatures required for their separation
by GC-MS. Hence, the analysis of polar metabolites usually requires chemical
derivatization of functional groups to reduce polarity and provide volatility and thermal
stability prior to analysis (Dettmer et al., 2007; Dunn, 2005). Active hydrogens in
functional groups, such as -COOH, -OH, -NH, and -SH can be derivatized by alkylation,
acylation, or silylation (Dettmer et al., 2007). Koek et al. (2011) stated that “silylation
reagents are the most versatile and universally applicable derivatization reagents, which
are most suitable for comprehensive metabolomics GC-MS analysis.” There are two
stages of derivatization by silylation. First, carbonyl functional groups of polar
metabolites are converted to oximes (R1R2C=NOH; where R1 and R2 could be hydrogen
atoms, alkyl groups, aryl groups, or any combination thereof) with an oximation reagent,
followed by the formation of trimethylsilyl (TMS) ethers, TMS esters, TMS sulfides, or
TMS amines with silylating reagents (typically N-methyl-N-trimethylsilyl-
trifluoroacetamide; MSTFA). Silyl derivatives show a better thermal stability and higher
volatility, and they produce more distinct MS spectra than their un-derivatized precursors
(Dettmer et al., 2007).

28
(Source: de Hoog & Mann, 2004) Figure 2-9 Schematic hierarchy of the relationship between the different “omics”, from genomics to functional genomics (transcriptomics), proteomics, and finally to expression of small molecules (metabolomics).
Metabolomics data are typically presented in either quantitative or chemometric
schemes. For the chemometric methods, multivariate data analysis such as principal
component analysis (PCA) is commonly employed for the data overview to obtain an
overall metabolomics pattern of the model.
References Acamovic, T & Brooker, J.D. (2005). Biochemistry of plant secondary metabolites and
their effects in animals. Proceedings of the Nutrition Society, 64, 403-412.
Addis, P.B. (1986). Occurrence of lipid peroxidation products in foods. Food and
Chemical Toxicology, 24, 1021-1030.
Anton, M., Gatellier, P. & Renerre, M. (1996). Meat color and lipid oxidation. Meat

29
Focus International, 5, 159-160.
Ashgar, A., Gray, J.I., Booren, A.M., Gomaa, E.A., Abouzied, M.M., Miller, E.R. &
Buckle, D.J. (1991). Effects of supranutritional dietary vitamin E levels on
subcellular deposition of a-tocopherol in the muscle and on pork quality. Journal
of the Science of Food and Agriculture, 57:1, 31-41.
Bailey, M.E. (1983). The Maillard Reaction and Meat Flavor. ACS Symposium Series
Vol. 215, Chapter 11, 169-184. Washington DC: American Chemistry Society.
Balderas, C., Villaseñor, A., García, A., Rupérez, F. J., Ibañez, E., Señorans, J., Guerrero-
Fernández, J., González-Casado, I., Gracia-Bouthelier, R. & Barbas, C. (2010).
Metabolomic approach to the nutraceutical effect of rosemary extract plus ω-3
PUFAs in diabetic children with capillary electrophoresis. Journal of
Pharmaceutical and Biomedical Analysis, 53:5, 1298-1304.
Barbehenn, R.V. & Constabel, C.P. (2011). Tannins in plant-herbivore interactions.
Phytochemistry, 72:13, 1551-1565.
Bauman, D.E., Baumgard, L.H., Corl, B.A. & Griinari, J.M. (1999). Biosyntheisis of
conjugated linoleic acid in ruminants. Proceeding of the American Society of
Animal Science, 1-15.
Bauman, D.E., Perfield, J.W., de Veth, M.J. & Lock, A.L. (2003). New perspectives on
lipid digestion and metabolism in ruminants. Proceeding of the Cornell Nutrition
Conference, Department of Animal Science, Cornell University, 175-189.
Bekhit, A.E.D. & Faustman, C. (2005). Metmyoglobin reducing activity. Meat Science,
71:3, 407-439.
30
Berg, B.P., Majak, W., McAllister, T.A., Hall, J.W., McCartney, D., Coulman, B.E.,
Goplen, B.P., Acharya, S.N., Tait, R.M. & Cheng, K.J. (2000). Bloat in cattle
grazing alfalfa cultivars selected for a low initial rate of digestion: A review.
Canadian Journal of Plant Science, 80:3, 493-502.
Brewer, M.S. (2006). The Chemistry of Beef Flavor -Executive Summary. Centennial,
CO: National Cattlemen’s Beef Association.
Calder, P.C. (2010). Omega-3 fatty acids and inflammatory processes. Nutrients, 2:3,
355-374.
Daley, C.A., Abbott, A., Doyle, P.S., Nader, G.A. & Larson, S. (2010). A review of fatty
acid profiles and antioxidant content in grass-fed and grain-fed beef. Nutrition
Journal, 9:10, 1-12.
de Hoog, C.L. & Mann, M. (2004). Proteomics. Annual Review of Genomics and Human
Genetics, 5, 267-293.
de Lorgeril, M. & Salen, P. (2003). Dietary prevention of coronary heart disease: Focus
on omega-6/omega-3 essential fatty acid balance. World Review of Nutrition &
Dietetics, 92, 57-73.
Descalzo, A.M. & Sancho, A.M. (2008). A review of natural antioxidants and their
effects on oxidative status, odor and quality of fresh beef produced in Argentina.
Meat Science, 79:3, 423-436.
Descalzo, A.M., Insani, E.M., Biolatto, A., Sancho, A.M., García, P.T., Pensel, N.A. &
Josifovich, J.A. (2005). Influence of pasture or grain-based diets supplemented

31
with vitamin E on antioxidant/oxidative balance of Argentine beef. Meat Science,
70:1, 35-44.
Descalzo, A.M., Rossetti, L., Grigioni, G., Irurueta, M., Sancho, A.M., Carrete, J. &
Pensel, N.A. (2007). Antioxidant status and odour profile in fresh beef from
pasture or grain-fed cattle. Meat Science, 75:2, 299-307.
Dettmer, K., Aronov, P.A., & Hammock, B.D. (2007). Mass spectrometry-based
metabolomics. Mass Spectrometry Reviews, 26:1, 51-78.
Dunn, W.B. (2005). Metabolomics: Current analytical platforms and methodologies.
Trends in Analytical Chemistry, 24:4, 285-294.
Dunne, P.G., Monahan, F.J., O’Mara, F.P. & Moloney, A.P. (2009). Color of bovine
subcutaneous adipose tissue: A review of contributory factors, associations with
carcass and meat quality and its potential utility in authentication of dietary
history. Meat Science, 81:1, 28-45.
Echevarne, C., Renerre, M., & Labas, R. (1990). Metmyoglobin reductase activity in
bovine muscles. Meat Science, 27:2, 161-172.
Eriksson, S.F. & Pickova, J. (2007). Fatty acids and tocopherol levels in M-Longissimus
dorsi of beef cattle in Sweden - A comparison between seasonal diets. Meat
Science, 76:4, 746-754.
Faustman, C., Chan, W.K., Schaefer, D.M. & Havens, A. (1998). Beef color update: The
role for vitamin E. Journal of Animal Science, 76:4, 1019-1026.
Fiehn, O., Kopka, J., Dormann, P., Altmann, T., Trethewey, R. N. & Willmitzer, L.
(2000). Metabolite profiling for plant functional genomics. Nature Biology, 18,
32
1157-1161.
Frankel, E. N. (1984). Recent advances in the chemistry of the rancidity of fats. In:
Recent Advances in the Chemistry of Meat. (edited by A.J. Bailey). The Royal
Society of Chemistry, Special Publication, 47, 87-118.
French, P., Stanton, C., Lawless, F., O'Riordan, E.G., Monahan, F.J., Caffrey, P.J. &
Moloney, A.P. (2000). Fatty acid composition, including conjugated linoleic acid,
of intramuscular fat from steers offered grazed grass, grass silage, or concentrate-
based diets. Journal of Animal Science, 78:11, 2849-2855.
Fuente, J.D., Diaz, M.T., Alvarez, I., Oliver, M.A., Furnols, M.F., Sanudo, C., Campo,
M.M., Montossi, F., Nute, G.R. & Caneque, V. (2009). Fatty acid and vitamin E
composition of intramuscular fat in cattle reared in different production systems.
Meat Science, 82:3, 331-337.
Fujimura, Y., Kurihara, K., Ida, M, Kosaka, R., Miura, D., Wariishi, H., Maeda-
Yamamoto, M., Nesumi, A., Saito, T., Kanda, T., Yamada, K. & Tachibana, H.
(2011). Metabolomics-driven nutraceutical evaluation of diverse green tea
cultivars. PLoS ONE, 6:8, e23426.
Gatellier, P., Mercier, Y. & Renerre, M. (2004). Effect of diet finishing mode (pasture or
mixed diet) on antioxidant status of Charolais bovine meat. Meat Science, 67:3,
385-394.
Gatellier, P., Mercier, Y., Juin, H. & Renerre, M. (2005). Effect of finishing mode
(pasture- or mixed-diet) on lipid composition, color stability and lipid oxidation in
meat from Charolais cattle. Meat Science, 69:1, 175-186.

33
German, J.B., Bauman, D.E., Burrin, D.G., Failla, M.L., Freake, H.C., King, J.C., Klein,
S., Milner, J.A., Pelto, G.H., Rasmussen, K.M. & Zeisel, S.H. (2004).
Metabolomics in the opening decade of the 21st century: Building the roads to
individualized health. Journal of Nutrition, 134:10, 2729-2732.
German, J.B., Roberts, M.A. & Watkins, S.M. (2003). Personal metabolomics as a next
generation nutritional assessment. Journal of Nutrition, 133:12, 4260-4266.
Goodhart, R.S. & Shils, M.E. (1980). Modern Nutrition in Health and Disease 6th edn.
Philadelphia, PA: Lea and Febinger.
Griffin, J.L., & Nicholls, A.W. (2006). Metabolomics as a functional genomic tool for
understanding lipid dysfunction in diabetes, obesity and related disorders.
Pharmacogenomics, 7:7, 1095-1107.
Griinari, J.M., Corl, B.A., Lacy, S.H., Chouinard, P.Y., Nurmela, K.V. & Bauman, D.E.
(2000). Conjugated linoleic acid is synthesized endogenoulsy in lactating dairy
cows by delta-9 desaturase. Journal of Nutrition, 130, 2285-2291
Halliwell, B. & Gutteridge, J.M.C. (1989). Free Radicals in Biology and Medicine, 2nd
edn. Oxford, UK: Clarendon Press.
Harris, W.S., Mozaffarian, D., Rimm, E., Kris-Etherton, P., Rudel, L.L., Appel, L.J.,
Engler, M.M., Engler, M.B. & Sacks, F. (2009). Omega-6 fatty acids and risk for
cardiovascular disease, Circulation, 119, 902-907.
Haslam, E. (1989). Plant polyphenols, Cambridge University Press, Cambridge, UK.
Hedrick, H.B., Bailey, M.E., Krouse, N.J., Dupuy, H.P. & Legendre, M.G. (1980).
Relationship between volatile compounds in fat from forage and grain fed beef

34
and sensory characteristics of steaks and roasts. Proceeding: European Meeting
Meat Research Workers, 307-310.
Hostettmann, K.A. & Manton, A. (1995). Saponins. In: Chemistry and Pharmacology of
Natural Products, Cambridge, UK: Cambridge University Press.
Huhman, D.V. & Sumner, L.W. (2002). Metabolic profiling of saponins in Medicago
sativa and Medicago truncatula using HPLC coupled to an electrospray ion-trap
mass spectrometer. Phytochemistry, 59, 347-360.
Hutchins, B.K., Liu, T.H.P. & Watts, B.M. (1967). Effect of additives and refrigeration
on reducing activity, metmyoglobin and malonaldehyde in raw ground beef.
Journal of Food Science, 32:2, 214-217.
Insani, E.M., Eyherabide, A., Grigioni, G., Sancho, A.M., Pensel, N.A. & Descalzo, A.M.
(2008). Oxidative stability and its relationship with natural antioxidants during
refrigerated retail display of beef produced in Argentina. Meat Science, 79:3, 444-
452.
Jonsson, P., Johansson, A.I., Gullberg, J., Trygg, J., A, J., Grung, B., Marklund, S.,
Sjöström, M., Antti, H. & Moritz, T. (2005). High-throughput data analysis for
detecting and identifying differences between samples in GC/ MS-based
metabolomic analyses. Analytical Chemistry, 77, 5635-5642.
Kaddurah-Daouk, R., Kristal, B.S. & Weinshilboum, R.M. (2008). Metabolomics: A
global biochemical approach to drug response and disease. Annual Review of
Pharmacology and Toxicology, 48, 653-683.
Kell, D.B. (2006). Systems biology, metabolic modelling and metabolomics in drug
35
discovery and development. Drug Discovery Today, 11:23-24, 1085-1092.
Kepler, C.R., Hirons, K.P., McNeill, J.J. & Tove, S.B. (1966). Intermediates and products
of the biohydrogenation of linoleic acid by Butyrivibrio fibrisolvens. Journal of
Biological Chemistry, 241, 1350-1354.
King, A.J., Uijttenboogaart, T.G. & de Vries, A.W. (1995). α-Tocopherol, β-carotene and
ascorbic acid as antioxidants in stored poultry muscle. Journal of Food Science,
60:5, 1009-1012.
Koek, M.M., Jellema, R.H., Van der Greef, J., Tas, A.C. & Hankemeier, T. (2011).
Quantitative metabolomics based on gas chromatography mass spectrometry:
Status and perspectives. Metabolomics, 7:3, 307-328.
Koletzko, K., Lattka, E., Zeilinger, S., Illig, T. & Steer, C. (2011). Genetic variants of the
fatty acid desaturase gene cluster predict amounts of red blood cell
docosahexaenoic and other polyunsaturated fatty acids in pregnant women:
findings from the avon longitudinal study of parents and children. The American
Journal of Clinical Nutrition, 93:1, 211-219.
Kraly, J.R., Holcomb, R.E., Guan, Q. & Henry, C.S. (2009). Review: Microfluidic
applications in metabolomics and metabolic profiling. Analytica Chimica Acta,
653:1, 23-35.
Ladikos, D. & Lougovois, V. (1990). Lipid oxidation in muscle foods: A review. Food
Chemistry, 35:4, 295-314.
Lanari, M.C., Brewster, M., Yang, A. & Tume R.K. (2002). Pasture and grain finishing
affect the color stability of beef. Journal of Food Science, 67:7, 2467-2473.
36
Larick, D.K., Hedrick, H.B., Bailey, M.E., Williams, J.E., Hancock, D.L., Garner, G.B.
& Morrow, R.E. (1987). Flavor constituents of beef as influenced by forage-
feeding and grain-feeding. Journal of Food Science, 52:2, 245-251.
Ledward, D.A. (1972). Metmyoglobin reduction and formation in beef during aerobic
storage at 1 °C. Journal of Food Science, 37:4, 634-635.
Lee, M., Cassens, R.G. & Fennema, O.R. (1981). Effect of metal ions on residual nitrite.
Journal of Food Processing and Preservation, 5:4, 191-205.
Liu, Q., Lanari, M.C. & Schaefer, D.M. (1995). A review of dietary vitamin E
supplementation for improvement of beef quality. Journal of Animal Science,
73:3, 3131-3140.
Lu, W., Bennett, B.D. & Rabinowitz, J.D. (2008). Analytical strategies for LC-MS-based
targeted metabolomics. Journal of Chromatography B, 871:2, 236-242.
Majak, W., Hall, J.W. & McCaughey, W.P. (1995). Pasture management strategies for
reducing the risk of legume bloat in cattle. Journal of Animal Science, 73:5, 1493-
1498.
Mandell, I.B., Buchanan-Smith, J.G. & Campbell, C.P. (1998). Effects of forage vs grain
feeding on carcass characteristics, fatty acid composition, and beef quality in
limousin-cross steers when time on feed is controlled. Journal of Animal Science,
76:10, 2619-2630.
McCluskey, J.J., Wahl, T.I., Quan, L. & Wandschneider, P.R. (2005). U.S. Grass-fed
beef: Marketing and health benefits. Journal of Food Distribution Research, 36:3,
1-8.

37
Melton, S.L. (1990). Effects of feeds on flavor of red meat: A review. Journal of Animal
Science, 68:12, 4421-4435.
Melton, S.L., Amiri, M., Davis, G.W. & Backus, W.R. (1982). Flavor and chemical
characteristics of ground-beef from grass-finished, forage-grain-finished and
grain-finished steers. Journal of Animal Science, 55:1, 77-87.
Mercier, Y., Gatellier, P. & Renerre, M. (2004). Lipid and protein oxidation in vitro, and
antioxidant potential in meat from Charolais cows finished on pasture or mixed
diet. Meat Science, 66:2, 467-473.
Min, B. & Ahn, D.U. (2005). Mechanism of lipid peroxidation in meat and meat products
-A review. Food Science and Biotechnology, 14:1, 152-163.
Misra, H.P. & Fridovich, I. (1972). The role of superoxide anion in the autooxidation of
epinephrine and a simple assay for superoxide dismutase. The Journal of
Biological Chemistry, 247:10, 3170-3175.
Monahan, F.J., Buckley, D.J., Morrissey, P.A., Lynch, P.B. & Gray, J.I. (1990). Effect of
dietary α-tocopherol supplementation on α-tocopherol levels in porcine tissues
and on susceptibility to lipid peroxidation. Food Science and Nutrition, 42:4, 203-
212.
Morrisey, P.A., Buckley, D.J. & Galvin, K. (2000). Vitamin E and the oxidative stability
of pork and poultry. In: Antioxidants in muscle foods (edited by Eric Decker,
Cameron Faustman, & Clemente J. Lo ́pez-Bote). Pp. 263-287. New York City,
NY: John Wiley & Sons Inc.

38
Mottram, D.S. (1998). Flavor formation in meat and meat products: a review. Food
Chemistry, 62:4, 415-424.
Muramoto, T., Higashiyama, M. & Kondo, T. (2005). Effect of pasture finishing on beef
quality of japanese shorthorn steers. Asian-Australasian Journal of Animal
Sciences, 18:3, 420-426.
Muramoto, T., Nakanishi, N., Shibata, M. & Aikawa, K. (2003). Effect of dietary β-
carotene supplementation on beef color stability during display of two muscles
from Japanese Black steers. Meat Science, 63:1, 39-42.
Nordstrom, A., O’Maille, G., Qin, C. & Siuzdak, G. (2006). Nonlinear data alignment for
UPLC-MS and HPLC-MS based metabolomics: Quantitative analysis of
endogenous and exogenous metabolites in human serum. Analytical Chemistry,
78, 3289-3295.
Nuernberg, K., Nuernberg, G., Ender, K., Lorenz, S., Winkler, K., Rickert, R. &
Steinhart, H. (2002). Omega-3 fatty acids and conjugated linoleic acids of
longissimus muscle in beef cattle. European Journal of Lipid Science Technology,
104, 463-471.
Pariza, M.W., Park, Y. & Cook, M.E. (2000). Mechanisms of action of conjugated
linoleic acid: evidence and speculation. Proceedings for the Society of
Experimental Biology and Medicine, 32, 853-858.
Ponnampalam, E.N., Mann, N.J. & Sinclair, A.J. (2006). Effect of feeding systems on
omega-3 fatty acids, conjugated linoleic acid and trans fatty acids in Australian

39
beef cuts: potential impact on human health. Asia Pacific Journal of Clinical
Nutrition, 15:1, 21-29.
Poulson, C.S., Dhiman, T.R., Ure, A.L., Cornforth, D. & Olson, K. C. (2004).
Conjugated linoleic acid content of beef from cattle fed diets containing high
grain, CLA, or raised on forages. Livestock Production Science, 91:1-2, 117-128.
Pryor, W.A. (1996). Vitamin E and carotenoid abstracts - 1994 studies of lipid-soluble
antioxidants. LaGrange, IL: VERIS.
Realini, C.E., Duckett, S.K. & Windham, W.R. (2004a). Effect of vitamin C addition to
ground beef from grass-fed or grain-fed sources on color and lipid stability, and
prediction of fatty acid composition by near-infrared reflectance analysis. Meat
Science, 68:1, 35-43.
Realini, C.E., Duckett, S.K., Brito, G.W., Dalla Rizza, M. & De Mattos, D. (2004b).
Effect of pasture vs. concentrate feeding with or without antioxidants on carcass
characteristics, fatty acid composition, and quality of Uruguayan beef. Meat
Sicence, 66:3, 567-577.
Reddy, I.M. & Carpenter, C.E. (1991). Determination of metmyoglobin reductase activity
in bovine skeletal muscles. Journal of Food Science, 56:5, 1161-1164.
Rossi-Fanelli, A., Antonini, E. & Mondovi, B. (1957). Enzymic reduction of
ferrimyoglobin. Archives of Biochemistry and Biophysics, 68, 341-354.
Rowe, D. (2002). High impact aroma chemicals. Part 2: the good, the bad, and the ugly.
Perfumer and Flavorist, 27, 24-29.
Sanchez-Escalante, A., Djenane, D., Torrescano, G., Beltran, J.A. & Roncales, P. (2001).

40
The effects of ascorbic acid, taurine, carnosine and rosemary powder on color and
lipid stability of beef patties packaged in modified atmosphere. Meat Science,
58:4, 421-429.
Sehat, N., Rickert, R.R., Mossoba, M.M., Dramer, J.K.G., Yurawecz, M.P., Roach,
J.A.G., Adlof, R.O., Morehouse, K.M., Fritsche, J., Eulitz, K.D., Steinhart, H. &
Ku, K. (1999). Improved separation of conjugated fatty acid methyl esters by
silver ion-high- performance liquid chromatography. Lipids, 34, 407-413.
Shahidi, F. (1994). Flavor of meat and meat products - an overview. In: Flavor of Meat
and Meat Products. Pp. 1-3, London, UK.: Blackie Academic and Professional.
Shyur, L.F. & Yang, N.S. (2008). Metabolomics for phytomedicine research and drug
development. Current Opinion in Chemical Biology, 12:1, 66-71.
Simopoulos, A.P. (1991). Omega-3 fatty acids in health and disease and in growth and
development. The American Journal of Clinical Nutrition, 54, 438-463.
Simopoulos, A.P. (2003). Importance of the ratio of omega-6/omega-3 essential fatty
acids: evolutionary aspects. World Review of Nutrition & Dietetics, 92, 1-22.
Simopoulos, A.P. (2004) Omega-6/Omega-3 Essential Fatty Acid Ratio and Chronic
Diseases. Food Reviews International, 20:1, 77-90.
Spanier, A.M. & Miller, J.A. (1993). Role of Proteins and Peptides in Meat Flavor. In
Food Flavor and Safety, ACS Symposium Series No. 528, Chapter 6, Pp. 78-97.
Washington DC: American Chemistry Society.
Spratlin, J.L., Serkova, N.J. & Eckhardt, S.G. (2009). Clinical applications of
metabolomics in oncology: A review. Clinical Cancer Research, 15, 431-440.
41
Stewart, M.R., Hutchins, B.K., Zipser, M.W. & Watts, B.M. (1965). Enzymatic reduction
of metmyoglobin by ground beef. Journal of Food Science, 30:3, 487-491.
Styczynski, M.P., Moxley, J.F., Tong, L.V., Walther, J.L., Jensen, K.L. &
Stephanopoulos, G.N. (2007). Systematic identification of conserved metabolites
in GC/MS data for metabolomics and biomarker discovery. Analytical Chemistry,
79, 966-973.
Tsuchihashi, H., Kigoshi, M., Iwatsuki, M. & Niki, E. (1995). Action of b-carotene as
antioxidant against lipid peroxidation. Archives of Biochemistry & Biophysics,
323:1, 137-147.
Turpeinen, A.M., Mutanen, M., Aro, A.S.I., Basu, S.P.D. & Griinar, J.M. (2002).
Bioconversion of vaccenic acid to conjugated linoleic acid in humans. American
Journal of Clinical Nutrition, 76, 504-510.
Umano, K., Hagi, Y., Nakahara, K., Shyoji, A. & Shibamoto, T. (1995). Volatile
chemicals formed in the headspace of a heated D-glucose/L-cysteine maillard
model system. Journal of Agricultural and Food Chemistry, 43, 2212-2218.
Van der Werf, M.J., Jellema, R.H. & Hankemeier, T. (2005). Microbial metabolomics:
replacing trial-and-error by the unbiased selection and ranking of targets. Journal
of Industrial Microbiology and Biotechnology, 32, 234-252.
Viant, M.R., Rosenblum, E.S. & Tjeerdema, R.S. (2003). NMR-based metabolomics: A
powerful approach for characterizing the effects of environmental stressors on
organism health. Environmental Science & Technology, 37:21, 4982-4989.

42
Villalba, J.J., Provenza, F.D., Clemensen, A.K., Larsen, R. & Juhnke, J. (2011).
Preference for diverse pastures by sheep in response to intraruminal
administrations of tannins, saponins and alkaloids. Grass and Forage Science, 66,
224-236.
Wallace, R.J. (2004). Antimicrobial properties of plant secondary metabolites.
Proceedings of the Nutrition Society, 63, 621-629.
Watts, B.M., Kendrick, J., Zipser, M.W., Hutchins, B. & Saleh, B. (1966). Enzymatic
reducing pathways in meat. Journal of Food Science, 31:6, 855-862.
Wishart, D.S. (2008a). Applications of Metabolomics in Drug Discovery and
Development. Drugs in R&D, 9:5, 307-322.
Wishart, D.S. (2008b). Quantitative metabolomics using NMR. Trends in Analytical
Chemistry, 27:3, 228-237.
Witt, E.H., Reznick , A.Z., Viguie , C.A. & Packer, L. (1992). Exercise, oxidative
damage and effects of antioxidant manipulation. Journal of Nutrition, 122:3, 766-
773.
Wood, J.D. & Enser, M. (1997). Factors influencing fatty acids in meat and the role of
antioxidants in improving meat quality. British Journal of Nutrition, 78:1, S49-
60.
Wu, C., Duckett, S.K., Neel, J.P.S., Fontenot, J.P. & Clapham, W.M. (2008). Influence of
finishing on hydrophilic and lipophilic oxygen radical absorbance capacity
(ORAC) in beef. Meat Science, 80:3, 662-667.

43
Yang, A., Lanari, M.C., Brewster, M. & Tume, R.K. (2002). Lipid stability and meat
color of beef from pasture- and grain-fed cattle with or without vitamin E
supplement. Meat Science, 60:1, 41-50.
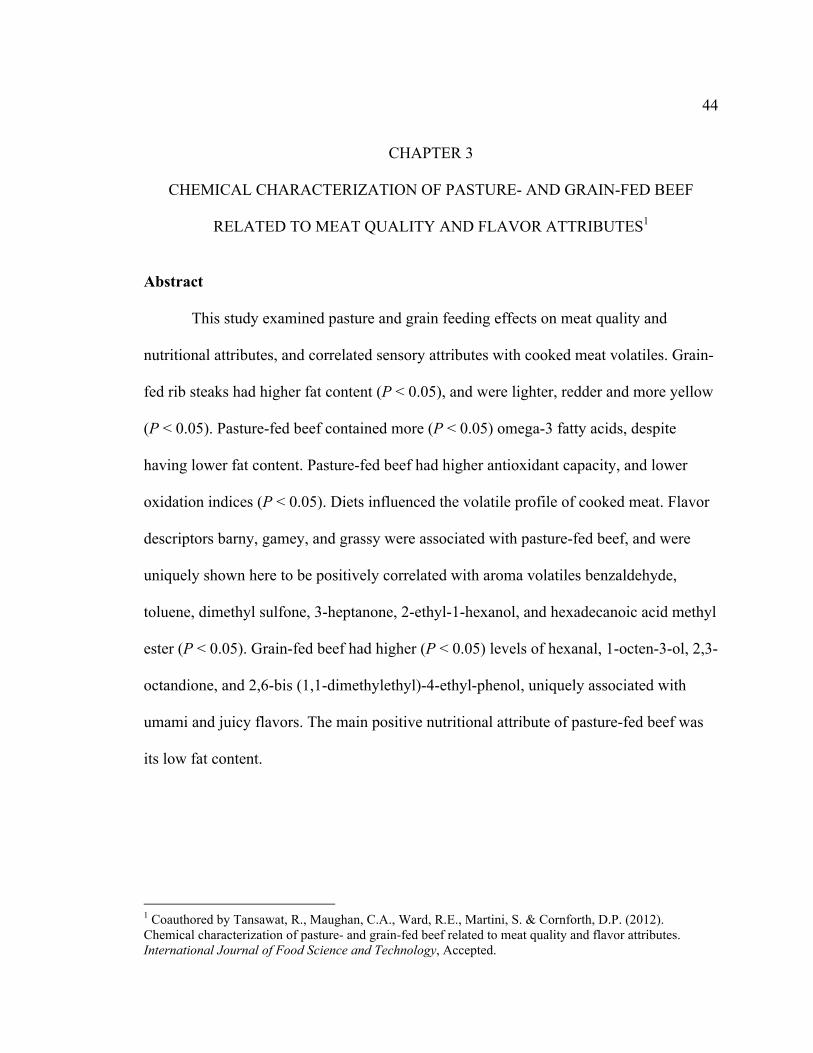
44
CHAPTER 3
CHEMICAL CHARACTERIZATION OF PASTURE- AND GRAIN-FED BEEF
RELATED TO MEAT QUALITY AND FLAVOR ATTRIBUTES1 Abstract
This study examined pasture and grain feeding effects on meat quality and
nutritional attributes, and correlated sensory attributes with cooked meat volatiles. Grain-
fed rib steaks had higher fat content (P < 0.05), and were lighter, redder and more yellow
(P < 0.05). Pasture-fed beef contained more (P < 0.05) omega-3 fatty acids, despite
having lower fat content. Pasture-fed beef had higher antioxidant capacity, and lower
oxidation indices (P < 0.05). Diets influenced the volatile profile of cooked meat. Flavor
descriptors barny, gamey, and grassy were associated with pasture-fed beef, and were
uniquely shown here to be positively correlated with aroma volatiles benzaldehyde,
toluene, dimethyl sulfone, 3-heptanone, 2-ethyl-1-hexanol, and hexadecanoic acid methyl
ester (P < 0.05). Grain-fed beef had higher (P < 0.05) levels of hexanal, 1-octen-3-ol, 2,3-
octandione, and 2,6-bis (1,1-dimethylethyl)-4-ethyl-phenol, uniquely associated with
umami and juicy flavors. The main positive nutritional attribute of pasture-fed beef was
its low fat content.
1 Coauthored by Tansawat, R., Maughan, C.A., Ward, R.E., Martini, S. & Cornforth, D.P. (2012). Chemical characterization of pasture- and grain-fed beef related to meat quality and flavor attributes. International Journal of Food Science and Technology, Accepted.

45
Introduction
Current interest in meat from pasture-fed ruminants stems from their appeal to
health-conscious consumers (McCluskey et al., 2005). Animal feeding plays an important
role in ruminant derived muscle foods since it affects the overall quality of meat
(Descalzo & Sancho, 2008). Ruminants with high pasture intake result in meat with a
higher content of polyunsaturated fatty acids (PUFA; Melton et al., 1982; Yang et al.,
2002), and increased PUFA to saturated fatty acid (SFA) ratio (French et al., 2000).
PUFAs slow the development of some human diseases such as cancer, obesity and
cardiovascular diseases (Riediger et al., 2009); so, increasing the proportion of PUFA in
meat by means of animal diet is now recommended by some as a healthy alternative to
grain-fed beef (Gatellier et al., 2004). Ruminant fats have also been found to be the
largest natural source of conjugated linoleic acid (CLA; Chin et al., 1994). CLA is
reported to be a potential anti-carcinogenic and anti-atherogenic substance (French et al.,
2000). Pasture feeding can raise the concentration of CLA in beef compared with beef
from animals fed typical high-grain diets (French et al., 2000; Poulson et al., 2004).
Meat derived from pasture feeding is associated with a higher antioxidant
potential (Gatellier et al., 2004; Descalzo & Sancho, 2008). Meat from pasture-fed
animals is rich in natural antioxidants such as vitamins from group A, C, and E and
phytochemicals such as carotenoids and flavonoids (Wood & Enser, 1997; Daly et al.,
1999), which help protect against lipid oxidation. The antioxidant content of the meat can
be increased through dietary delivery and/or endogenous production and therefore protect
tissues against oxidation from reactive oxygen species. Lipid oxidation results in the

46
production of free radicals, which are promoters of myoglobin oxidation and lead to the
formation of rancid odors and off-flavors (Greene & Cumuze, 1982). Pasture-finished
cattle present some potential advantages over grain-finish due to the fact that antioxidant
protection compensates for the high pro-oxidant potential of PUFA’s (Mercier et al.,
2004).
Herbivore diets affect the palatability of meat and off-flavors are associated with
the meat of pasture-fed cattle (Larick et al., 1987; Mandell et al., 1998). The fatty acid
composition may affect flavors in meat from cattle finished on pasture (Melton et al.,
1982). Priolo et al. (2001) reported that branched-chain fatty acids and 3-methyl-indole
(skatole) were involved in the unpleasant pastoral flavor in sheep; however, it is less
important in beef because of the lack of the branched-chain fatty acids. They also
reported that the oxidation products of linolenic acid and its derivates, which are derived
substantially from pasture, played an important role in the off-flavor of beef.
Diterpenoids are the major volatiles in beef samples. Diterpenoids are positively
correlated with “gamey/stale” off-flavor in beef fat associated with pasture compared to
grain finishing (Larick et al., 1987; Maruri & Larick, 1992). The diterpenoid phyt-1-ene
in beef subcutaneous fat is positively correlated to “gamey” flavor while negatively
correlated with desirable “roasted” flavor (Maruri & Larick, 1992).
There is still relatively little known about animal diet effects on meat headspace
volatiles during cooking, and their relationship to meat sensory properties. Thus, the
objectives of this study were to examine the effect of diet (pasture or grain) on meat
characteristics and headspace volatiles during heating. Measured meat characteristics

47
included fat content, pH, color change as a function of storage, degree of oxidation
(thiobarbituric acid assay; TBA), antioxidant capacity by oxygen radical absorbance
capacity (ORAC), and fatty acid composition, including essential fatty acids and CLA.
Cooked meat headspace volatile compounds were also measured. Sensory panel
evaluation of cooked meat flavor intensity was previously reported on the same samples,
using a new beef flavor lexicon of 18 flavor descriptors (Maughan et al., 2012).
Headspace volatiles data in the present study were then correlated with sensory flavor
profile data from the previous study, to evaluate relationships between diet, headspace
volatiles, and meat flavor.
Materials and Methods Meat samples
Primal ribs (Longissimus dorsi muscles) were used for the analysis. Primal ribs of
pasture-fed cattle (n = 3) were purchased from James Ranch, CO; while rib sections of
grain-fed cattle (n = 3) were obtained from USU's Animal Science Farm. The grain-fed
animals were Black Angus bred, while the pasture-fed animals were Red Angus sired
with a mix of Hereford and Angus dams. The pasture-fed animals were 24 - 27 months
old and had a hanging weight between 318 - 360 kg. Their diets were supplemented with
alfalfa hay during the winter, and they were finished for 110 - 120 d exclusively on
irrigated mountain pasture (a variety of plants, including orchard grass, brome, fescue,
and clover). The grain-fed animals were 19 - 20 months old, had an ad libitum finish diet
for 110 - 120 d consisting of 60% corn silage, 30% flaked barley, and 10% alfalfa, and
were also 320 - 345 kg in hanging weight. The left and right rib sections were used from

48
each animal. All of the cattle were steers except the animal labeled Grain #1, which was a
heifer. Carcass yield (hanging weight, ribeye area, and backfat thickness at the 12 - 13th
rib) and quality grade (marbling score) measurements were recorded for each animal after
slaughter. Primal ribs from each animal were vacuum packed after harvest, shipped to the
Department of Nutrition, Dietetics, and Food Sciences at USU and immediately frozen at
-20 °C until use. The pouches (25 x 35 cm; Koch, Kansas City, MO) used for packaging
were of 3-mil thickness (0.75-gauge nylon, 2.25-gauge polyethylene) with an oxygen
permeability of 0.6 cm3/100 m2/24 h at 0 °C and a water vapor transmission rate of 0.6
g/100 m2/24 h at 38 °C and 100% relative humidity.
Carcass yield and quality grade measurements were recorded for each animal
after slaughter. Carcass yield grade measurements were hanging weight, ribeye area
(REA), and backfat thickness (BF) at the 12-13th rib. Carcass quality grade measurements
were the marbling score of the ribeye muscle (Longissimus dorsi), taken at the 12-13th
rib. All carcasses were “A” maturity (<30 months animal age).
Chemical analyses Fat content
Ether-extractable fat content of center lean steak (ribs 9-10th) was done by AOAC
solvent extraction method 24.005 (Williams, 1984), using petroleum ether as the solvent.
A 3-4 g sample was added into a pre-weighed small disposable aluminum foil dish.
Sample and dish were then accurately weighed. Sand was added, mixed and spread on
bottom of dish with a small glass rod. Next, sample (including dish, sand, and glass rod)
were left in the oven at 125 °C for 1.5 h. After that, sample (including dish, sand, and

49
glass rods) were inserted into the extraction thimble and placed in Soxhlet extraction
apparatus (Labconco®, Kansas City, MO). Solvent (50 mL petroleum ether) was filled in
reclaiming beakers and the beakers were then sealed to the apparatus for extraction. The
extraction started by boiling the solvent, at that time, using cold water flowing through
the condenser. Extractions were continued for 4 h at a condensation rate of 5-6 drops per
sec. Subsequently, thimbles were removed, dried in the oven, cooled in a desiccators, and
weighed again. Weigh loss of the samples were determined and calculated as percent fat.
pH
Raw steak pH was measured on 10 g of sample that were finely chopped, diluted
to 100 ml in distilled water, allowed to equilibrate at room temperature for 30 min and
then filtered. Filtrate pH was measured, using a Fisher Accumet pH meter model 610 A
(Fisher Scientific Inc, Salt Lake City, UT), equipped with a combination pH electrode
calibrated immediately before use to pH 4.0 and 7.0.
Hunter color measurements
Frozen primal ribs were cut using a band saw into steaks (1.9 cm thick), placed in
a foam tray and over-wrapped with polyvinyl chloride (PVC) and stored in the dark at 2
°C until color readings were taken. Gas permeability of PVC film (Koch, Kansas City,
MO, USA) was as follows: O2 permeability = 8400 cm3/(24 h x m2 x atm) at 23 °C; water
vapor transmission = 83 g/(24 h x m2) at 23 °C and 50% relative humidity.
Meat color was determined instrumentally using a HunterLab Miniscan portable
colorimeter (Hunter Associates Laboratory, Inc., Reston, VA) with a 5 mm diameter
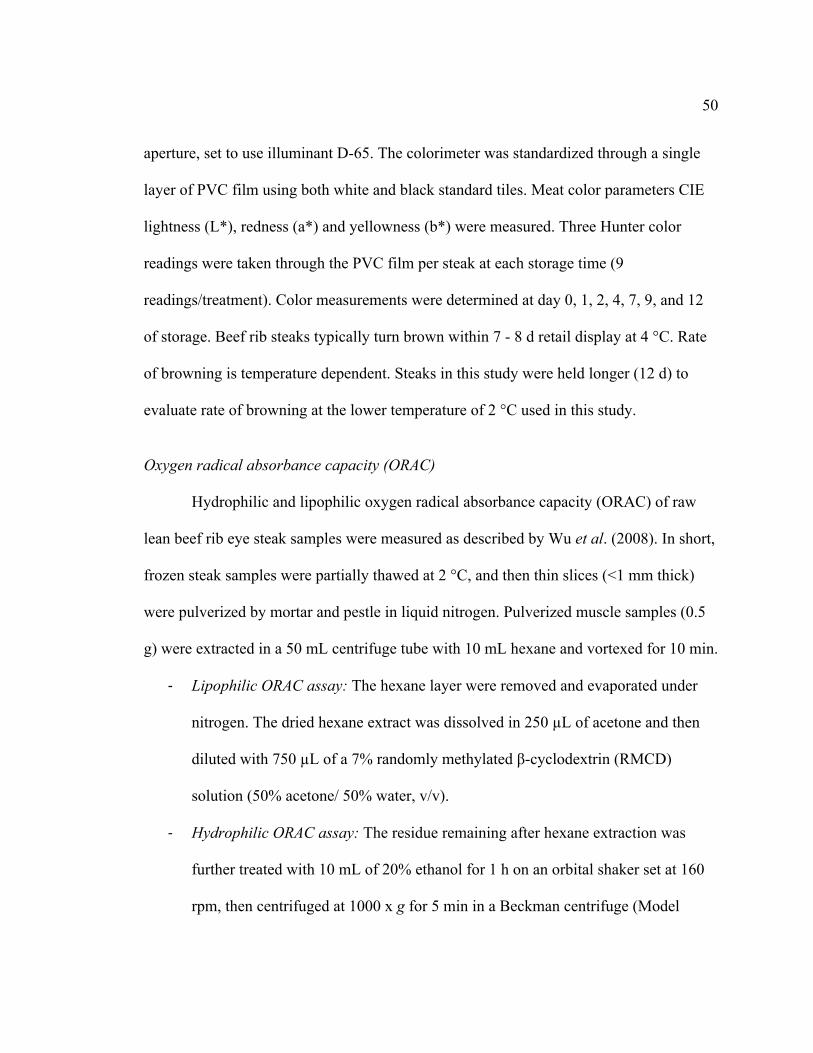
50
aperture, set to use illuminant D-65. The colorimeter was standardized through a single
layer of PVC film using both white and black standard tiles. Meat color parameters CIE
lightness (L*), redness (a*) and yellowness (b*) were measured. Three Hunter color
readings were taken through the PVC film per steak at each storage time (9
readings/treatment). Color measurements were determined at day 0, 1, 2, 4, 7, 9, and 12
of storage. Beef rib steaks typically turn brown within 7 - 8 d retail display at 4 °C. Rate
of browning is temperature dependent. Steaks in this study were held longer (12 d) to
evaluate rate of browning at the lower temperature of 2 °C used in this study.
Oxygen radical absorbance capacity (ORAC)
Hydrophilic and lipophilic oxygen radical absorbance capacity (ORAC) of raw
lean beef rib eye steak samples were measured as described by Wu et al. (2008). In short,
frozen steak samples were partially thawed at 2 °C, and then thin slices (<1 mm thick)
were pulverized by mortar and pestle in liquid nitrogen. Pulverized muscle samples (0.5
g) were extracted in a 50 mL centrifuge tube with 10 mL hexane and vortexed for 10 min.
-‐ Lipophilic ORAC assay: The hexane layer were removed and evaporated under
nitrogen. The dried hexane extract was dissolved in 250 µL of acetone and then
diluted with 750 µL of a 7% randomly methylated β-cyclodextrin (RMCD)
solution (50% acetone/ 50% water, v/v).
-‐ Hydrophilic ORAC assay: The residue remaining after hexane extraction was
further treated with 10 mL of 20% ethanol for 1 h on an orbital shaker set at 160
rpm, then centrifuged at 1000 x g for 5 min in a Beckman centrifuge (Model

51
F0850/ Allegra X-22 Series, Palo Alto, CA). The supernatant then was diluted 10
-fold with phosphate buffer (pH 7.4).
An aliquot (25 µL) of hydrophilic and lipophilic extract or Trolox calibration
solutions (6.25, 12.5, 25, 50, 100 mM), or blank (phosphate buffer for hydrophilic assay
and 7% RMCD for lipophilic assay) were added to each well of the 96-well
polypropylene micro-titer plate (Corning Life Sciences, Wilkes Barre, PA), followed by
fluorescein (0.004 mM; 150 µL) and then incubated at 37 °C for 30 min before addition
of peroxyl generator [25 µL AAPH solution: azo-bis (2-amidinopropane)
dihydrochloride; 153 mM]. The microplate reader was programmed to record
fluorescence with an excitation reading of 485 nm and an emission wavelength of 520 nm
at 1 min intervals for 1 h using a fluorometer (Infinite M200, Tecan®, Durham, NC). The
final hydrophilic and lipophilic ORAC values were calculated by using a linear
regression model (Y = aX + b) between Trolox concentration (µM) and the net area under
the fluorescein decay curve. Data were expressed as micromoles of Trolox equivalents
(TE) per g of beef sample. The area under curve (AUC) was calculated using the
Magellan 6 program (version 6.5, 2008; Tecan®, Durham, NC). Three replications with
duplicate readings were done for each sample.
Thiobarbituric acid assay (TBA)
Each steak was placed in a foam tray and over-wrapped with PVC film and stored
at 2 °C. Thiobarbituric acid reactive substances (TBARS) were determined at day 0 and
12 of storage in duplicate for each steak (3 steaks per treatment). TBA assay was

52
performed as described by Buege & Aust (1978). Samples (0.5 g) were mixed with 2.5
mL of 0.375% TBA - 15% TCA - 0.25 N HCl stock solution. The mixture was heated for
10 min in a boiling water bath to develop a pink color, cooled with tap water, then
centrifuged at 3200 x g for 25 min in a Beckman centrifuge. The supernatant was
measured at 532 nm using a UV 2100 U spectrophotometer (Shimadzu Co., Kyoto,
Japan). TBA values were calculated as mg of malonaldehyde/1000 g of meat (ppm
TBARS).
Fatty acid chemical composition
Fatty acid methyl esters (FAMEs) were prepared by direct transesterification
using the method of O’Fallon et al. (2007) with slight modifications. Frozen steaks were
sliced into thin strips (<1.5mm thickness) with a razor blade and approximately 1 g of
lean tissue was placed into a screw cap vial along with 100 µL of surrogate standard
(C23:0 methyl ester; 5.0 mg/mL in chloroform; Sigma-Aldrich, St. Louis, MO). Next,
700 µL of 10 N KOH in water was added along with 6.3 mL of MeOH. The tubes were
subjected to vigorous hand shaking and place in a shaking water bath at 55 °C for 1.5 h.
Every 20 min the tubes were shaken by hand for 5 s. Subsequently, the tubes were cooled
to room temperature and 580 µL of 24 N H2SO4 was added. The tubes were shaken
vigorously by hand to mix contents, and again placed in the shaking bath for 1.5 h at 55
°C with hand mixing at 20 min intervals. After the incubation the tubes were cooled, 3
mL of hexane was added and vortexed for 5 min. Next, the tubes were centrifuged at
1,000 × g for 5 min and the top layer was transferred to a gas chromatography (GC) vial.
53
The FAMEs were analyzed by gas chromatography with flame ionization
detection (GC-FID) using a Shimadzu GC 2010. The GC was equipped with an HP-88
column (100 m × 0.25 mm × 0.20 µm; Agilent Technologies, Palo Alto, CA). The
injector was fitted with a Siltek deactivated split/splitless liner packed with glass wool
(Restek, Bellefonte, PA) and held at 250 °C. Hydrogen was used as the carrier gas at a
head pressure of 206.7 kPa with a linear column flow rate of 41.0 mL/min. One µL of
sample was injected at a 30:1 split ratio and the oven will program as follows: initial
column temperature 35 °C hold 2 min, ramp at 40 °C/min to 175 °C hold for 4 min, ramp
at 3.5 °C/min to 240 °C hold for 24 min. The FID was operated at 250 °C. Air was
supplied at 400 mL/min and hydrogen at 39 mL/min. Fatty acids were identified by
similarity to retention time to GC reference standards (Nu-Chek Prep, Inc, Elysian, MN).
The standards were also used to generate response factors to adjust for injector and
detector discrimination and to insure linearity of detector response. Fatty acid profiles
were expressed as percentage in fresh meat.
Headspace volatile analysis
Headspace volatiles of beef were analyzed according to the method of Vasta et al.
(2010). A sample of the frozen Longissimus dorsi muscle of each animal was trimmed of
external fat and sliced (thickness <1 mm) and three replications per animal were done.
Six grams of raw sliced meat was placed in a 20-mL glass vial and capped with a
polytetrafluoroethylene (PTFE) septum. For the extraction of headspace volatile
compounds a solid phase micro-extraction (SPME) technique was used. A surrogate
standard, 1,2 dichlorobenzene (2 µL; 52.7 µmol), was added to the vial containing the
54
sample. The vial was then placed in a heat bath set at 60 °C for 10 min. A 2 cm-50/30
DVB/CarboxenTM/PDMS fiber (Supelco, Bellefonte, PA) was exposed to the headspace
over the sample at 60 °C for 30 min to adsorb the volatiles. The fiber was then removed
from the vial and immediately inserted into the GC (GCMS-QP 2010S, Shimadzu Co.,
Kyoto, Japan). The injector was held at 250 °C and fitted with a 0.75 mm SPME inlet
liner (Supelco, Bellefonte, PA). Splitless injection was used with a sampling time of 1
min. Helium was used as carrier gas with a flow rate of 1.0 mL/min. Volatile compounds
were separated using an Agilent DB-5ms column (30 m x 0.250 mm x 0.25 mm; Agilent
Technologies, Santa Clara, CA). The GC oven temperature program was as follows: 40
°C for 2.4 min; ramp to 325 °C at a rate of 6 °C/min, with a total program time of 43.16
min. The GC/MS interface was heated at 290 °C. The acquisition was performed in
electron impact mode (70 eV) at 5 microscans/s, with a mass range 33-350 m/z.
Data files obtained from the GC-MS were exported in the netCDF format and
analyzed with the public Automated Mass Spectral Deconvolution and Identification
System (AMDIS; version 2.62, 1999-2000) developed by the National Institute of
Standards and Technology (NIST). Deconvoluted mass spectra were submitted to the
online analysis tool Spectconnect (www.spectconnect.mit.edu) for the systematic
detection of analytes that were conserved across samples. Analytes resulting from this
analysis were identified by a library search against the NIST Mass Spectral Library
(version 2.0, 2005), and by comparison with linear retention indexes (LRI). The LRI
were established by injection of standard n-alkanes from 7 to 40 carbons (Supelco,

55
Bellefonte, PA). Parent peak intensities were normalized to the surrogate standard in each
run prior to statistical analysis. Data were expressed as ratio to surrogate.
Sensory evaluation
Sensory evaluation was previously done as described by Maughan et al. (2012).
In short, frozen ribeye steaks (L. dorsi muscles) were cut to a thickness of 2.54 cm and
thawed for 24 h before cooking. Samples were prepared following the guidelines from
the American Meat Science Association (1995). Steaks were cooked on electric griddles
at 163 °C to an internal temperature of 70 °C, measured at the center of the steak by an
AquaTuff 35200 digital thermometer (Atkins Technical Inc, Gainesville, FL, USA)
equipped with a fast-responding micro-needle probe. Steaks were then cut into 2.54 cm
cubes and placed in covered aluminum dishes, and served hot to the panelists. A sensory
descriptive panel (n = 12) was recruited and selected from the local community to
develop a flavor lexicon for meats. Cooked rib steak samples were evaluated for flavor
intensity of 18 attributes (5 basic tastes plus astringent, barny, bloody, brothy, browned,
gamey, grassy, juicy, fatty, livery, metallic, oxidized, roast beef), on a 15-point scale,
where 1 = no flavor; and 15 = very high intensity, for the attribute under consideration.
Panelists tasted and evaluated each sample individually using water and unsalted crackers
to clean their palettes between samples. The samples were presented in random order
with 3-digit blinding codes under red colored lights to minimize bias. After tasting all
samples, panelists waited for 15 min before tasting a replicate of the samples in a new
randomized order.

56
Statistical analysis The experiment was designed with 2 diet treatments (pasture or grain), and
measurements were made on rib steaks from 3 animals per treatment. Sample size was
small (n = 3/diet), in consideration of the relatively large number of analyses to conduct.
Thus, relatively large treatment differences in measured parameters were required to
achieve significance at the 95% level. Nonetheless, finishing diet (pasture or grain)
significantly affected numerous meat characteristics in this study.
Measurement of the fat content, raw meat color, ORAC values, fatty acid profile,
and headspace volatiles were done in triplicate for each sample. TBA values were done in
duplicate for each sample. Sensory evaluation of steaks as affected by diet was previously
reported (Maughan et al., 2012). Statistical Analysis Software (SAS) version 9.1 (SAS
Institute, Inc., Cary, NC) was used for analysis of variance (ANOVA) to identify
statistically significant differences between diet treatments at the 95% confidence level.
Complete randomized design with the proc glm function was used for fat content, ORAC
values, fatty acid profile, and headspace volatile experiments. Comparison of the means
was made based on P-values (α = 0.05) using the least significant different (LSD)
adjustment to obtain differences of least means squares. Repeated measures design with
the proc mixed function, using Tukey adjustment to obtain differences of least means
squares, was used for raw meat color and TBA experiments. Principle component
analysis (PCA) using proc factor was used for headspace volatile analysis. Pearson
correlation coefficients (r) between mean headspace volatiles (peak intensities
normalized to the surrogate standard in each run; n = 6), and sensory attributes (1 - 15
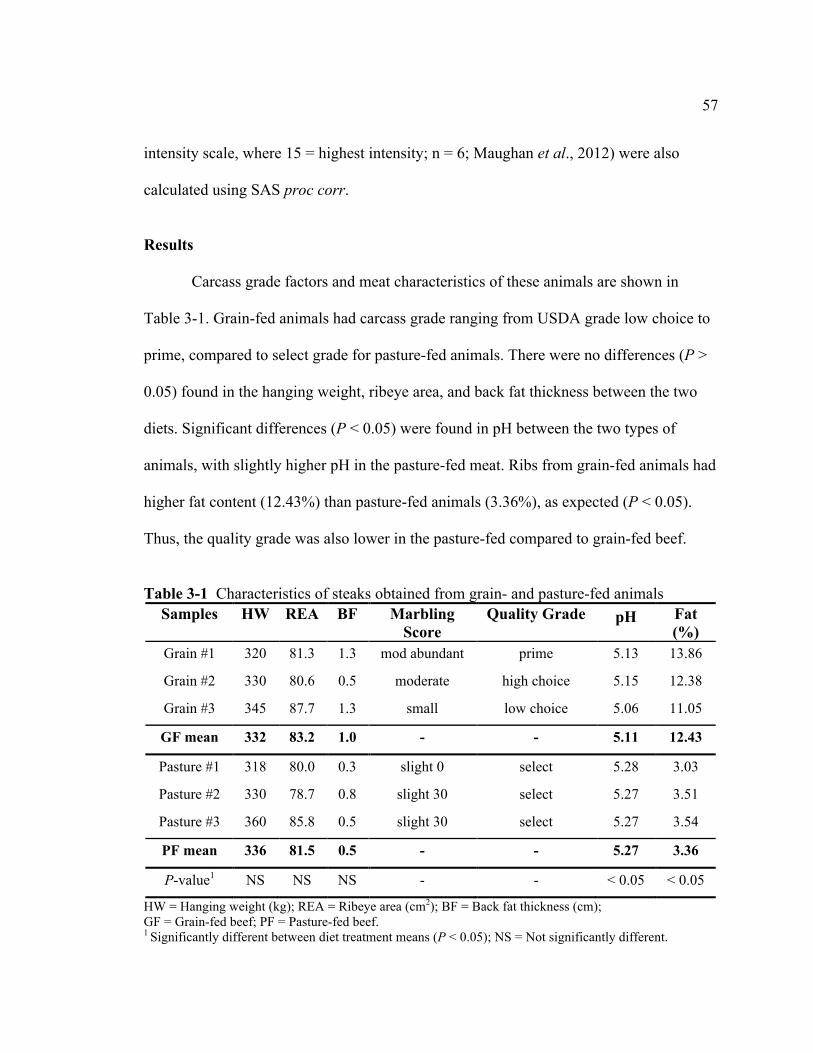
57
intensity scale, where 15 = highest intensity; n = 6; Maughan et al., 2012) were also
calculated using SAS proc corr.
Results
Carcass grade factors and meat characteristics of these animals are shown in
Table 3-1. Grain-fed animals had carcass grade ranging from USDA grade low choice to
prime, compared to select grade for pasture-fed animals. There were no differences (P >
0.05) found in the hanging weight, ribeye area, and back fat thickness between the two
diets. Significant differences (P < 0.05) were found in pH between the two types of
animals, with slightly higher pH in the pasture-fed meat. Ribs from grain-fed animals had
higher fat content (12.43%) than pasture-fed animals (3.36%), as expected (P < 0.05).
Thus, the quality grade was also lower in the pasture-fed compared to grain-fed beef.
Table 3-1 Characteristics of steaks obtained from grain- and pasture-fed animals
Samples
HW
REA
BF
Marbling Score
Quality Grade
pH
Fat (%)
Grain #1 320 81.3 1.3 mod abundant prime 5.13 13.86
Grain #2 330 80.6 0.5 moderate high choice 5.15 12.38
Grain #3 345 87.7 1.3 small low choice 5.06 11.05
GF mean 332 83.2 1.0 - - 5.11 12.43
Pasture #1 318 80.0 0.3 slight 0 select 5.28 3.03
Pasture #2 330 78.7 0.8 slight 30 select 5.27 3.51
Pasture #3 360 85.8 0.5 slight 30 select 5.27 3.54
PF mean 336 81.5 0.5 - - 5.27 3.36
P-value1 NS NS NS - - < 0.05 < 0.05
HW = Hanging weight (kg); REA = Ribeye area (cm2); BF = Back fat thickness (cm); GF = Grain-fed beef; PF = Pasture-fed beef. 1 Significantly different between diet treatment means (P < 0.05); NS = Not significantly different.
58
Significant differences were also observed in steak appearance and color. Raw
steaks from pasture-fed animals were darker (P < 0.001) in color with less red (P < 0.05)
and yellow hue (P < 0.01; Fig. 3-1; see Appendix Table A1-A3 for detailed statistics).
Mean lightness values, pooled over storage time were different (P < 0.001; 34.03 and
28.77 for grain vs. pasture, respectively). In this study, the interactions of diet treatment
and storage time were also significantly different at day 0 time point, as indicated by the
asterisk (*; Fig. 3-1A; Appendix Table A4). The main effect of diet treatment (pooled
over all time points; days) significantly affected (P < 0.05) redness values. Similarly, the
main effect of time (pooled among diet treatments) significantly affected (P < 0.05)
redness values. However, at any given day, there was no significant interaction effect on
redness values between diet treatment and storage time (Fig. 3-1B; Appendix Table A5).
The main effect of diet treatments and storage time also affected yellowness values (P <
0.05). However, the interaction between diet treatment and storage time only significantly
affected yellowness values on day 1 of storage (P < 0.05; Fig. 3-1C; Appendix Table
A6). Rib steaks in retail display typically turn brown after 5-7 days. The longer red color
stability of steaks in this study (12 days) was probably due lower storage temperature
than typical retail display (2 versus 4 °C, respectively) under dark conditions.
The antioxidant capacity of steaks from the two groups was compared. There was
a higher capacity in steaks from the pasture-fed animals in the hydrophilic fraction, but
not the lipophilic fraction (Fig. 3-2A; Appendix Table A7-A8). Interestingly, the
difference in antioxidant capacity was reflected in the occurrence of lipid oxidation over
twelve days of storage. While there were no differences in lipid oxidation on steaks

59
Figure 3-1 Effect of storage time (day) on grain- and pasture-fed beef color stability at 2 °C. A: Lightness (L*); B: Redness (a*); C: Yellowness (b*). Significant differences (P < 0.05) between diet treatments at each storage time point were indicated by an asterisk (*). Error bars = SD.
0
10
20
30
40
50
0 2 4 6 8 10 12 14
Lig
htne
ss (L
*)
Days
Grain
Pasture
* A
0
5
10
15
20
0 2 4 6 8 10 12 14
Red
ness
(a*)
Days
B
0
5
10
15
20
0 2 4 6 8 10 12 14
Yello
wne
ss (b
*)
Days
* C
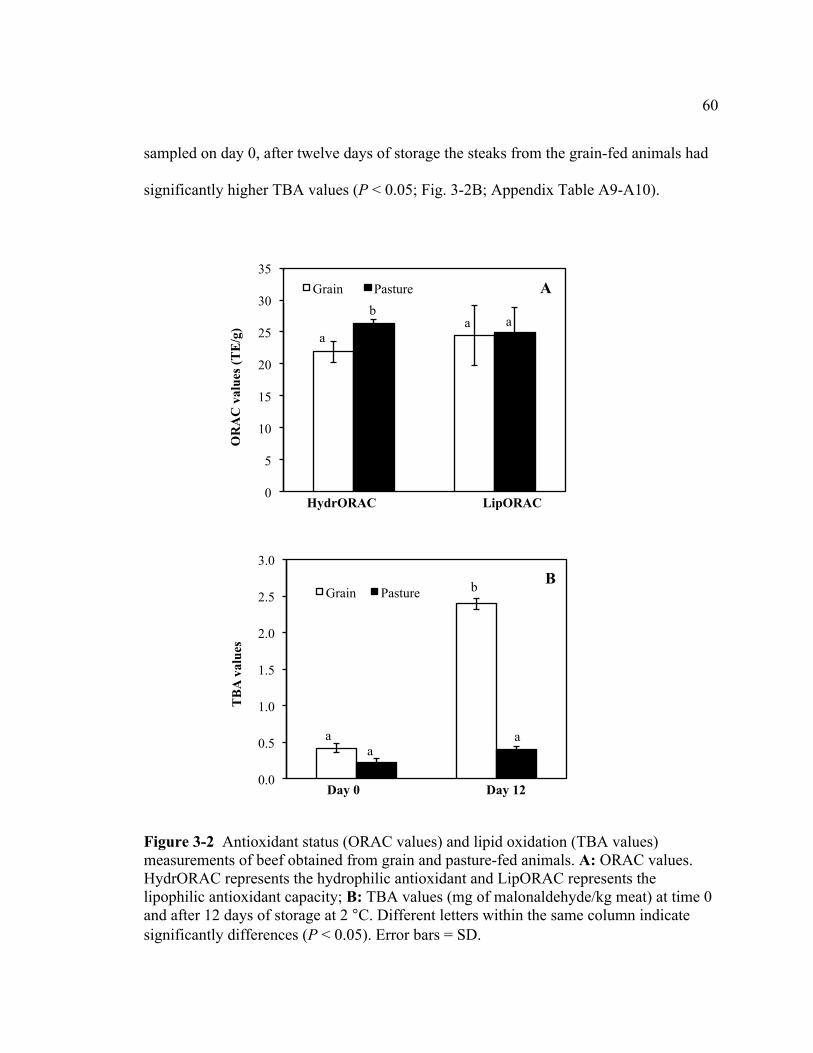
60
sampled on day 0, after twelve days of storage the steaks from the grain-fed animals had
significantly higher TBA values (P < 0.05; Fig. 3-2B; Appendix Table A9-A10).
Figure 3-2 Antioxidant status (ORAC values) and lipid oxidation (TBA values) measurements of beef obtained from grain and pasture-fed animals. A: ORAC values. HydrORAC represents the hydrophilic antioxidant and LipORAC represents the lipophilic antioxidant capacity; B: TBA values (mg of malonaldehyde/kg meat) at time 0 and after 12 days of storage at 2 °C. Different letters within the same column indicate significantly differences (P < 0.05). Error bars = SD.
0
5
10
15
20
25
30
35
OR
AC
val
ues (
TE
/g)
HydrORAC LipORAC
Grain Pasture b
a a a
A
0.0
0.5
1.0
1.5
2.0
2.5
3.0
TB
A v
alue
s
Day 0 Day 12
Grain Pasture
a a
b
a
B
61
Twenty-nine fatty acids were detected in the beef samples with a minimum
percentage cutoff of 0.02%. The thirteen most abundant fatty acids are shown graphically
in Fig. 3-3 (Appendix Table A11), and these make up approximately 96% of the total
fatty acids. From the figure it is clear that the pasture-fed beef had significantly higher
percentage of polyunsaturated fatty acids (PUFAs; P < 0.05), including conjugated
linoleic acid (CLA; P < 0.01). As a preliminary analysis, individual fatty acids were
presented as a percentage of the total fatty acids. On a percentage basis, the pasture-fed
beef contained a greater percentage of long chain polyunsaturates (LC-PUFA) than the
grain-fed beef including arachadonic acid (20:4n6), eicosapentaentoic acid (20:5n3) and
docosapentaenoic acid (22:5n3) where as a significantly lower amount of palmitic
(C16:0) and oleic (C18:1n9c) fatty acids were found in these same samples.
To estimate the absolute amount of different fatty acid classes, a value was
calculated based on an 85 g (3 oz) serving and the data are presented in Table 3-2. The
grain-fed beef had significantly more saturated and monounsaturated fatty acids, but the
PUFA levels did not differ. When the two classes of essential fatty acids are considered,
values for omega-6 fatty acids were not different, but there were significantly more total
omega-3 and LC omega-3 fatty acids in the pasture-fed beef samples. As a result, the
omega-6 to omega-3 ratio was significantly lower in the pasture-fed beef.
To investigate how the different animal diets potentially affect sensory properties
of the meat, the volatiles were measured after heating the samples to 60 °C. Using SPME,
twenty-five different volatile compounds were detected in the headspace of these samples
and the data is shown in Table 3-3 (Appendix Table A12). The values are semi-

62
Figure 3-3 Fatty acid chemical composition for meat samples obtained from animals fed with grain- and pasture-based diet. Asterisk (*) indicates significantly differences in fatty acid percentage between diet treatments (P < 0.05). Error bars = SD.
quantitative as they represent the ratio of the area of the dominant ion to that of the
surrogate standard.
Across the two diets there were ten volatiles that were different and these are
shown according to magnitude in Fig. 3-4. Four of the ten compounds were more
abundant in the grain-fed beef including hexenal, 1-octen-3-ol, 2,3-octanedione, and 2,6-
bis (1,1-dimethylethyl)-4-ethyl-phenol. Six of the ten compounds were higher in the
pasture-fed beef, including dimethyl sulfone, toluene, 3-heptanone, hexadecanoic acid
0.0
5.0
10.0
15.0
20.0
25.0
30.0
35.0
40.0
45.0
50.0 Pe
rcen
t
Grain Pasture *
*
* * * * *
*
*

63
methyl ester, benzaldehyde and 2-ethyl-1-hexanol. The volatiles that differed between
samples are visualized graphically using principle components analysis (PCA) in Fig. 3-5
to better understand the effect of the dietary treatments and to relate them to the sensory
descriptors associated with each sample. Principal component 1 accounted for 77.71% of
the variability, while the principal component 2 accounted for 11.06% of the variability.
It is clear from the graph that samples obtained from grain-fed animals are characterized
by a headspace rich in hexanal, 2,6-bis (1,1-dimethylethyl)-4-ethyl-phenol, 2,3-
octanedione, and 1-octen-3-ol; while the meat obtained from pasture-fed animals is
characterized by a headspace rich in benzaldehyde, toluene, dimethyl sulfone, 3-
heptanone, hexadecanoic acid, methyl ester and 2-ethyl-1-hexanol. Using these same
samples in a trained descriptive sensory panel, we previously found that animal diets
were significantly associated with specific flavor terms (Maughan et al., 2012).
Table 3-2 Fatty acid composition of beef samples per 85 g (3 oz) serving1
Fatty acid Grain-fed (n = 3)
Pasture-fed (n = 3) P-value2
Saturates g 3.6 ± 0.4 1.0 ± 0.1 < 0.01
Monounsaturates3 g 3.8 ± 0.3 0.9 ± 0.1 < 0.01
Polyunsaturates g 0.5 ± 0.1 0.4 ± 0.1 NS
Omega-6 g 0.5 ± 0.1 0.3 ± 0.1 NS
Long chain ω-6 g 0.20 ± 0.06 0.11 ± 0.02 NS
Omega-3 mg 60 ± 10 130 ± 30 < 0.05
Long chain ω-3 mg 40 ± 10 80 ± 20 < 0.05
ω-6: ω-3 ratio 6.9 ± 0.5 2.0 ± 0.1 < 0.01 1 Concentration values were calculated for each animal as the product of the total fat content and the percentage of individual fatty acids. The fatty acid portion of the total fat was calculated to be approximately 75.0% for the grain-fed beef and 75.3% for the pasture-fed beef based on the average fatty acid molecular weight. 2 NS = Not significantly different. 3 Includes vaccenic acid.

64
Table 3-3 Volatile profile of muscle from beef fed with grain or pasture diets LRI
Compounds
Grain-fed
(n = 3) Pasture-fed
(n = 3) P-value 1
707 2-Butanone, 3-hydroxy- 14.13 ± 4.20 17.61± 7.90 NS
770 Toluene 0.21 ± 0.04 1.11 ± 0.47 < 0.05
764 1-Pentanol 0.66 ± 0.19 0.48 ± 0.06 NS
789 Butanoic acid 0.47 ± 0.42 0.34 ± 0.20 NS
787 Hexanal 2.10 ± 0.31 0.68 ± 0.19 < 0.01
786 2,3-Butanediol 6.61 ± 1.48 8.25 ± 3.31 NS
867 Hexanoic acid, methyl ester 0.54 ± 0.21 0.36 ± 0.23 NS
871 1-Hexanol 0.30 ± 0.09 0.34 ± 0.01 NS
890 3-Heptanone 0.00 ± 0.00 0.64 ± 0.18 < 0.01
898 Heptanal 0.42 ± 0.09 0.37 ± 0.12 NS
918 Butyrolactone 2.19 ± 0.85 2.07 ± 0.99 NS
926 Dimethyl sulfone 0.42 ± 0.31 2.25 ± 0.33 < 0.01
960 Benzaldehyde 0.18 ± 0.03 0.31 ± 0.06 < 0.05
966 Octanal 0.76 ± 0.19 0.63 ± 0.19 NS
983 1-Octen-3-ol 1.99 ± 0.24 1.17 ± 0.10 < 0.05
993 2,3-Octanedione 0.73 ± 0.17 0.12 ± 0.11 < 0.01
1028 2-Ethyl-1-hexanol 0.10 ± 0.09 54.23 ± 29.91 < 0.05
1069 1-Octanol 0.67 ± 0.25 0.83 ± 0.14 NS
1103 Nonanal 2.49 ± 0.37 2.40 ± 0.86 NS
1183 Octanoic Acid 0.15 ± 0.01 0.11 ± 0.04 NS
1205 Decanal 0.12 ± 0.05 0.07 ± 0.03 NS
1221 Undecane, 2,8-dimethyl- 0.21 ± 0.04 0.18 ± 0.10 NS
1651 2-Ethylhexyl 2-ethylhexanoate 0.80 ± 1.23 0.37 ± 0.18 NS
1760
Phenol, 2,6-bis (1,1-dimethylethyl)-4-ethyl-
0.56 ± 0.10
0.03 ± 0.04
< 0.01
1870 Hexadecanoic acid, methyl ester 0.12 ± 0.11 0.37 ± 0.01 < 0.05 1 Significantly different between diet treatment means in the same row (P < 0.05); NS = Not significantly different.

65
In Table 3-4, correlation coefficients are shown for volatile and sensory attributes
that were different (P < 0.05) in the ANOVA analysis. Toluene, benzaldehyde, and 2-
ethyl-1-hexanol were higher in pasture-fed beef (Table 3-3) but there were no significant
correlations between these compounds and any specific flavors. Hexanal and 2,6-bis (1,1-
dimethylethyl)-4-ethyl-phenol were higher in grain-fed beef, and negatively correlated
with barny (P < 0.01) and bitter (P < 0.001) flavors. 3-heptanone was higher in pasture-
fed beef, and positively correlated with barny and bitter flavors (P < 0.01). Dimethyl
sulfone was higher in the pasture-fed steaks, and positively correlated with barny flavor
(P < 0.001). 1-Octen-3-ol was higher in grain-fed samples, and positively correlated with
umami flavor (P < 0.01). 2,3-Octanedione was also higher in grain-fed beef, and
negatively correlated with barny flavor (P < 0.01). Hexadecanoic acid methyl ester was
higher in pasture-fed steaks, and positively correlated with bitter flavor (P < 0.01).
Figure 3-4 Ratio to surrogate of headspace volatile compounds from beef fed with grain or pasture diets. Error bars = SD.

66
Figure 3-5 Principal component analysis (PCA) of volatile compounds in grain-fed and pasture-fed beef samples heated to 60 °C for 30 min.
Table 3-4 Pearson correlation coefficients (r) among means of volatiles with sensory intensity. In this table, only volatile and sensory attributes that were different between diets (P < 0.05) in the ANOVA analysis are shown Barny Bitter Gamey Grassy Juicy Umami
Toluene 0.89 0.75 0.37 0.75 -0.34 -0.72
Hexanal -0.95 * -0.98 ** -0.80 -0.61 0.56 0.69
3-Heptanone 0.95 * 0.94 * 0.79 0.57 -0.38 -0.68
Dimethyl sulfone 0.97 ** 0.90 0.62 0.75 -0.55 -0.81
Benzaldehyde 0.89 0.71 0.39 0.80 -0.41 -0.80
1-Octen-3-ol -0.84 -0.74 -0.65 -0.91 0.85 0.92 *
2,3-Octanedione -0.93 * -0.84 -0.72 -0.74 0.54 0.85
2-Ethyl-1-hexanol 0.83 0.89 0.85 0.35 -0.22 -0.50
2,6-bis (1,1-Dimethylethyl)-4-ethyl- phenol
-0.97 *
-0.99 **
-0.80
-0.59
0.48
0.69
Hexadecanoic acid, methyl ester 0.90 0.94 * 0.67 0.61 -0.48 -0.57
* P < 0.01; ** P < 0.001.

67
Discussion In the present study, pasture-fed beef was significantly darker than grain-fed
samples (Fig. 3-1). This is in agreement with Hoving-Bolin et al. (1999), who reported
that pasture-fed beef had darker color and lower L* values than grain-fed beef. The
increase in redness of grain-fed beef at day 1 was likely due to bloom development of
steaks newly exposed to oxygen in the oxygen permeable PVC film overwrap. Pasture-
fed beef meat is typically darker than grain-fed beef, and bloom development was not as
pronounced. Panel evaluation of the same steaks (Maughan et al., 2012) showed that
grain-fed beef was juicier (P < 0.05) and preferred by consumers over pasture-fed beef
(7.05 and 6.08, respectively, on a 9-point scale, where 6 = slightly liked and 7 =
moderately liked).
It has been demonstrated that PUFAs, which contain double bonds, undergo more
rapid oxidation than SFA (Leyton et al., 1987). Thus, theoretically, pasture-fed beef
should be more easily oxidized than grain-fed beef. Interestingly, lower TBA values (P <
0.05) were found in beef from pasture-fed than grain-fed animals after 12 d storage at
retail conditions (Fig. 3-2B). This outcome might be associated with significantly higher
antioxidant levels (ORAC values) found in pasture-fed beef (Fig. 3-2A) that protect
against the oxidation reactions occurring in the meat. These properties would benefit in
prolonging meat storage shelf life.
Our results indicated that ribs from pasture-fed animals had lower (P < 0.05) fat
content than grain-fed animals, yet are higher in the relative percentage of
monounsaturated fatty acids (MUFA; includes vaccenic acid) and polyunsaturated fatty

68
acids (PUFA; Table 3-2, Fig. 3-3). An increase in omega-3 fatty acids in steaks from
pasture-fed cattle has previously been reported, resulting in a lower omega-6 to omega-3
ratio in intramuscular fat (French et al., 2000; Gatellier et al., 2005; Ponnampalam et al.,
2006). Excessive amounts of omega-6 PUFA and a very high omega-6/omega-3 ratio are
thought to promote the development of many diseases, including cardiovascular disease,
cancer, and inflammatory and autoimmune diseases, whereas increased levels of omega-3
PUFA (a low omega-6 to omega-3 ratio) exert suppressive effects (Simopoulos, 2002).
An omega-6 to omega-3 ratio >4 is a risk factor in cancers and coronary heart disease,
especially the formation of blood clots leading to a heart attack (Simopoulos, 2002). Yet,
the current ratio in the American diet is estimated to be approximately 10:1 (Blasbalg et
al., 2011). Therefore, it is important to maintain balance in the diet between omega-3 and
omega-6 PUFA since these substances work together to promote health.
There is no official recommended daily allowance (RDA) for LC omega-6 or LC
omega-3 fatty acids in the human diet. However, the International Society for the Study
of Fatty Acids and Lipids (ISSFAL, 2012) suggests an intake of 500 mg/d omega-3 fatty
acids (http://www.mollersomega3.com/c-77-Recommended-omega-3-intake.aspx).
Consumption of a serving of pasture-fed beef improves the daily omega-6 to omega-3
ratio (Daley et al., 2010), but not as effectively as a serving of fish or flaxseeds. In this
study, the amount of omega-3 fatty acids provided by an 85 g serving of pasture or grain
fed beef as % of ISSFAL recommendations were calculated (Table 3-5). Pasture-fed beef
only supplied a fraction of omega-3 PUFA, compared to oily fish such as salmon.
Consumption of an 85 g serving of pasture-fed beef contained 83.3 mg of omega-3 fatty

69
acids or 16.7% of the ISSFAL recommended level. For comparison, 85 g of cooked
salmon contains ~1,830 mg omega-3 fatty acids or ~366% of the ISSFAL recommended
level (Table 3-5).
Epidemiological studies of CLA to cancer and heart diseases in humans are very
limited and sometimes contradictory (Gebauer et al., 2011). Only one large case-control
human study has shown a positive effect of dietary CLA to reduce incidence of breast
cancer in postmenopausal women (Aro et al., 2000). CLA intake by the control group
(without cancer) in this study was 132 mg CLA/d. Using this value as 100%, an 85 g/d
serving of pasture- or grain-fed beef in this study, or salmon had only 9.77%, 5.98%, and
1.14%, respectively, of putative effective CLA level (Table 3-6).
Animal diet also influenced the volatile profile in the meat as demonstrated by the
headspace analysis (Table 3-3, Fig. 3-4). Steaks from grain-fed beef had higher (P <
0.05) levels of hexanal, 1-octen-3-ol, 2,3-octandione, and 2,6-bis (1,1-dimethylethyl)-4-
ethyl-phenol. Hexanal is a dominant volatile aldehyde product of fat oxidation (Brunton
Table 3-5 Omega-3 fatty acids (FA) in 85 g serving of grain- or pasture-fed beef, as % of recommended by the International Society for the Study of Fatty Acids and Lipids (ISSFAL)*
Treatment
Ether-Extract Fat (%)
FA (% EEF)
FA (g/100 g
meat)
ω-3 FA (% total FA)
ω-3 FA (mg/3 oz. serving)
ω-3 ISSFAL*
(mg/d)
% ω-3/ 85 g
serving Grain-fed 12.43 75.2 ** 9.34 0.4 31.8 500 6.4
Pasture-fed 3.36 75.2 2.52 3.9 83.8 500 16.7
Salmon - - - - 1,830 *** 500 366.0
* ISSFAL recommended level for ω-3 fatty acids = 500 mg/d (http://www.mollersomega3.com/c-77-Recommended-omega-3-intake.aspx). ** Based on fatty class composition of beef L. dorsi muscle (Insausti et al., 2004). *** Salmon, Atlantic farmed (Kris et al., 2003).
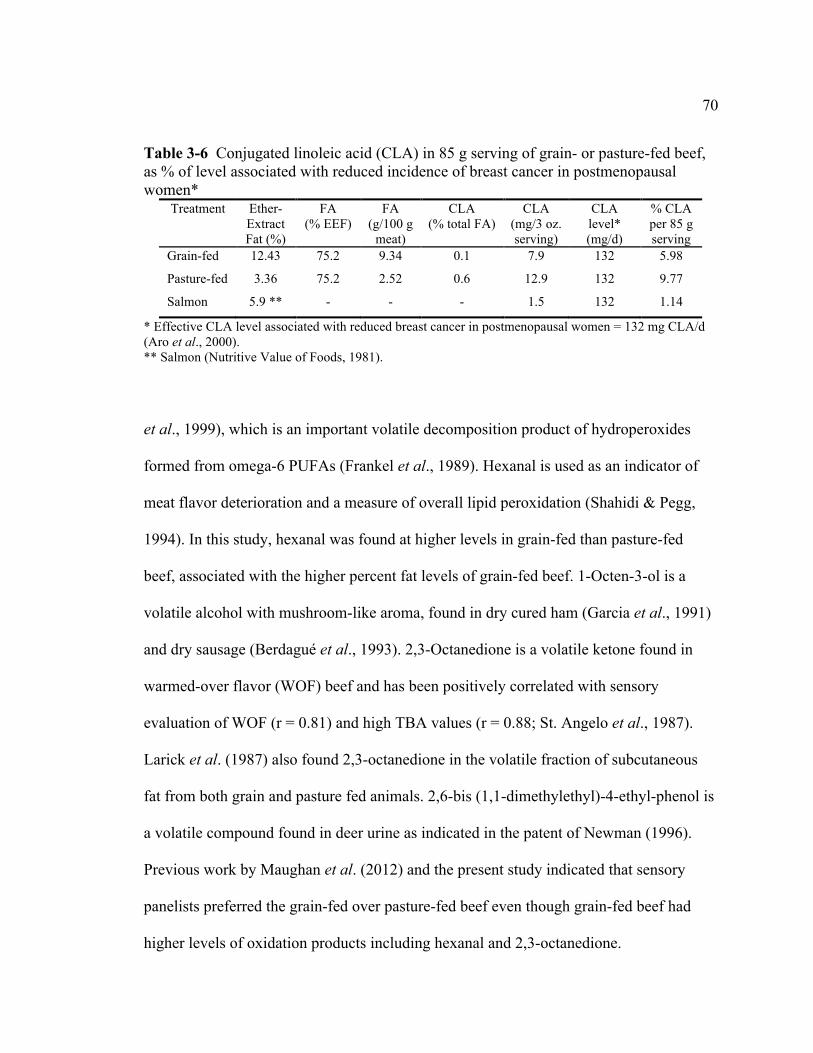
70
Table 3-6 Conjugated linoleic acid (CLA) in 85 g serving of grain- or pasture-fed beef, as % of level associated with reduced incidence of breast cancer in postmenopausal women*
Treatment
Ether-Extract Fat (%)
FA (% EEF)
FA (g/100 g
meat)
CLA (% total FA)
CLA (mg/3 oz. serving)
CLA level* (mg/d)
% CLA per 85 g serving
Grain-fed 12.43 75.2 9.34 0.1 7.9 132 5.98
Pasture-fed 3.36 75.2 2.52 0.6 12.9 132 9.77
Salmon 5.9 ** - - - 1.5 132 1.14
* Effective CLA level associated with reduced breast cancer in postmenopausal women = 132 mg CLA/d (Aro et al., 2000). ** Salmon (Nutritive Value of Foods, 1981).
et al., 1999), which is an important volatile decomposition product of hydroperoxides
formed from omega-6 PUFAs (Frankel et al., 1989). Hexanal is used as an indicator of
meat flavor deterioration and a measure of overall lipid peroxidation (Shahidi & Pegg,
1994). In this study, hexanal was found at higher levels in grain-fed than pasture-fed
beef, associated with the higher percent fat levels of grain-fed beef. 1-Octen-3-ol is a
volatile alcohol with mushroom-like aroma, found in dry cured ham (Garcia et al., 1991)
and dry sausage (Berdagué et al., 1993). 2,3-Octanedione is a volatile ketone found in
warmed-over flavor (WOF) beef and has been positively correlated with sensory
evaluation of WOF (r = 0.81) and high TBA values (r = 0.88; St. Angelo et al., 1987).
Larick et al. (1987) also found 2,3-octanedione in the volatile fraction of subcutaneous
fat from both grain and pasture fed animals. 2,6-bis (1,1-dimethylethyl)-4-ethyl-phenol is
a volatile compound found in deer urine as indicated in the patent of Newman (1996).
Previous work by Maughan et al. (2012) and the present study indicated that sensory
panelists preferred the grain-fed over pasture-fed beef even though grain-fed beef had
higher levels of oxidation products including hexanal and 2,3-octanedione.

71
Dimethyl sulfone, toluene, 3-heptanone, hexadecanoic acid methyl ester,
benzaldehyde, and 2-ethyl-1-hexanol were the volatiles found more abundant in the
pasture-fed beef (P < 0.05). Dimethyl sulfone (methylsulfonylmethane) is a volatile
sulfur compound found in roast beef (Mussinan & Katz, 1973). Min et al. (1977)
confirmed the presence of toluene in roast beef extracts, and they speculated that the
occurrence of such compounds could be due to the thermal degradation of amino acids or
the breakdown of co-extracted lipid species, such as trans-2-trans-4-decadienal. 3-
heptanone is a volatile ketone found in irradiated cooked sausage (Ahn et al., 1999) and
alligator meat (Baek & Cadwallader, 2006), where it is thought to contribute to the
undesirable odor and flavor meat from older alligator. Hexadecanoic acid methyl ester is
a volatile component found in dry-cured ham (Berdagué et al., 1991) and dry fermented
sausage (Ansorena et al., 2000). Mottram & Edwards (1983) reported the significantly
higher benzaldehyde levels in lean meat than in the fatty triglyceride and phospholipid
fractions, explaining some of the changes in roast beef aroma after removal of the lipid
fraction. 2-ethyl-1-hexanol is by far the most abundant compound in pasture fed beef
samples (Fig. 3-4). It is a fatty alcohol with plasticizer properties. This compound was
previously found in duck meat (Wu & Liou, 1992) and pork myofibrillar protein (Benito
et al., 2005). However, recent research shows that it is a contaminant derived from
packaging material (Rivas-Cañedo et al., 2009). In the present study, beef primal ribs
were vacuum packaged and frozen (-20 °C for 2-3 months prior to analysis). The vacuum
bags for the Colorado pasture-fed beef ribs were obtained from a different supplier than

72
the Utah grain-fed beef. This procedural difference may account for the greater levels of
2-ethyl-1-hexanol derived from packaging in pasture-fed samples.
Comparison between the headspace volatiles and flavor profiles shown in the
PCA graph (Fig. 3-5) and the correlation coefficients (Table 3-4) indicated that negative
attributes such as barny and bitter were higher in pasture-fed beef (P < 0.05), and were
associated with higher levels of 3-heptanone or dimethyl sulfone. On the other hand, the
positive attributes such as umami in grain-fed steaks was correlated with 1-octen-3-ol. St.
Angelo et al. (1988) also identified hexanal, and 2,3-octanedione in meats, among other
compounds. Brewer et al. (2008) also identified hexanal, 3-hydroxy-2-butanone, 1-octen-
3-ol, butanoic acid, and nonanal. These authors also suggested that the livery off-flavor in
the meat was positively correlated with pentanal, hexanal, 3-hydroxy-2-butanone, and
hexanoic acid while rancid off-flavor was correlated with pentanal and 2-phenyl furan
and not correlated with hexanal. However, further research needs to be done in this area
to confirm these relationships.
Conclusions
Animal diet affected many chemical characteristics of beef, including the volatile
profiles in cooked meat. Rib steaks from pasture-fed animals had darker color (P < 0.05)
and lower fat content (P < 0.05), with higher MUFA and PUFA ratio (P < 0.05),
compared to grain-fed beef. Rib steaks from pasture-fed beef also had higher hydrophilic
ORAC values (P < 0.05), and lower TBA values (P < 0.05) after 12 d refrigerated
storage, indicating higher resistance to lipid oxidation during storage, compared to grain-
fed beef. Although sample size was small (n = 3 animals/diet), mean differences between

73
diet treatments were relatively large, and statistically different between diets at the 95 -
99% confidence level.
Pasture and grain diets influenced the volatile profile of cooked meat. Flavor
descriptors barny, gamey, and grassy were associated with pasture feeding, and were
uniquely shown in this study to be positively correlated with aroma volatiles
benzaldehyde, toluene, dimethyl sulfone, 3-heptanone, 2-ethyl-1-hexanol, and
hexadecanoic acid methyl ester (P < 0.05). Grain-fed beef had higher (P < 0.05) levels of
hexanal, 1-octen-3-ol, 2,3-octandione, and 2,6-bis (1,1-dimethylethyl)-4-ethyl-phenol,
uniquely associated with umami and juicy flavors. Pasture-fed beef had higher levels of
omega-3 fatty acids than grain-fed beef, but was only a moderate source of omega-3 fatty
acids, compared to salmon. The main positive nutritional attribute of pasture-fed beef was
the ~75% reduction in fat calories per serving, compared to grain-fed beef. Hence,
pasture-fed beef would have health benefits in people at risk for chronic diseases, i.e.,
cardiovascular disease or anyone who wants to lose weight.
References Ahn, D.U., Olson, D.G., Jo, C., Love, J. & Jin, S.K. (1999). Volatiles production and
lipid oxidation in irradiated cooked sausage as related to packaging and storage.
Journal of Food Science, 64:2, 226-229.
American Meat Science Association. (1995). Research Guidelines for Cookery, Sensory
Evaluation, and Instrumental Tenderness Measurements of Fresh Meat. American
Meat Science Association in cooperation with National Live Stock and Meat
Board. Chicago, IL: Meat Science Association.
74
Ansorena, D., Astiasarán, I. & Bello, J. (2000). Influence of the simultaneous addition of
the protease flavorzyme and the lipase novozym 677BG on dry fermented sausage
compounds extracted by SDE and analyzed by GC-MS. Journal Agriculture Food
Chemistry, 48:6, 2395-2400.
Aro, A., Männistö, S., Salminen, I, Ovaskainen, M., Kataja, V & Uusitupa, M. (2000).
Inverse association between dietary and serum conjugated linoleic acid and risk of
breast cancer in postmenopausal women. Nutrition and Cancer, 38:2, 151-157.
Baek, H.H. & Cadwallader, K.R. (2006). Aroma volatiles in cooked alligator meat.
Journal of Food Science, 62:2, 321-325.
Benito, M.J., Núñez, F., Córdoba, M.G., Martín, A. & Córdoba, J.J. (2005). Generation
of non-protein nitrogen and volatile compounds by Penicillium chrysogenum
Pg222 activity on pork myofibrillar proteins. Food Microbiology, 22:6, 513-519.
Berdagué, J.L., Denoyer, C., Le Quere, J.L. & Semon, E. (1991). Volatile components of
dry-cured ham. Journal Agriculture Food Chemistry, 39:7, 1257-1261.
Berdagué, J.L., Monteil, P., Montel, M.C. & Talon R. (1993). Effects of starter cultures
on the formation of flavor compounds in dry sausage. Meat Science, 35:3, 275-
287.
Blasbalg, T.L., Hibbeln, J.R., Ramsden, C.E., Majchrzak, S.F. & Rawlings, R.R. (2011).
Changes in consumption of omega-3 and omega-6 fatty acids in the United States
during the 20th century. The American Journal of Clinical Nutrition, 93:5, 950-
962.

75
Brewer, M.S., Stetzer, A.J., Cadwallader, K., Singh, T.K. & Mckeith, F.K. (2008). Effect
of enhancement and ageing on flavor and volatile compounds in various beef
muscles. Meat Science, 79:1, 13-19.
Brunton, N.P., Cronin, D.A., Monahan, F.J. & Durcan, R. (1999). A comparison of solid-
phase microextraction (SPME) fibres for measurement of hexanal and pentanal in
cooked turkey. Food Chemistry, 68:3, 339-345.
Buege, J.A. & Aust, S.D. (1978). Microsomal lipid peroxidation. Methods Enzymol, 52,
302-310.
Chin, S.F., Storkson, J., Albright, K. & Pariza, M.W. (1994). Growth-performance of rats
fed conjugated dienoic isomers of linoleic-acid (CLA) during gestation and
lactation. Faseb Journal, 8:4, A456-A456.
Daley, C.A., Abbott, A., Doyle, P.S., Nader, G.A. & Larson, S. (2010). A review of fatty
acid profiles and antioxidant content in grass-fed and grain-fed beef. Nutritiol
Journal, 9, 1-12.
Daly, C.C., Young, O.A., Graafhuis, A.E. & Moorhead, S.M. (1999). Some effects of diet
on beef and fat attributes. New Zealand Journal of Agricultural Research, 42,
338-347.
Descalzo, A.M. & Sancho, A.M. (2008). A review of natural antioxidants and their
effects on oxidative status, odor and quality of fresh beef produced in Argentina.
Meat Science, 79:3, 423-436.

76
Frankel, E.N., Hu, M.L. & Tappel, A.L. (1989). Rapid headspace gas chromatography of
hexanal as a measure of lipid peroxidation in biological samples, Lipids, 24:11,
976-981.
French, P., Stanton, C., Lawless, F., O'Riordan, E.G., Monahan, F.J., Caffrey, P.J. &
Moloney, A.P. (2000). Fatty acid composition, including conjugated linoleic acid,
of intramuscular fat from steers offered grazed grass, grass silage, or concentrate-
based diets. Journal of Animal Science, 78:11, 2849-2855.
Garcia, C., Berdagué, J.J., Antequera, T., López-Bote, C., Córdoba, J.J. & Ventanas, J.
(1991). Volatile components of dry cured Iberian ham. Food Chemistry, 41:1, 23-
32.
Gatellier, P., Mercier, Y. & Renerre, M. (2004). Effect of diet finishing mode (pasture or
mixed diet) on antioxidant status of Charolais bovine meat. Meat Science, 67:3,
385-394.
Gatellier, P., Mercier, Y., Juin, H. & Renerre, M. (2005). Effect of finishing mode
(pasture- or mixed-diet) on lipid composition, color stability and lipid oxidation in
meat from Charolais cattle. Meat Science, 69:1, 175-186.
Gebauer, S.K., Chardigny, J., Jakobsen, M.U., Lamarche, B., Lock, A.L., Proctor, S.D. &
Baer, D.J. (2011). Effects of ruminant trans fatty acids on cardiovascular disease
and cancer: A comprehensive review of epidemiological, clinical, and
mechanistic studies. Advance in Nutrition, 2, 332-354.

77
Greene, B.E. & Cumuze, T.H. (1982). Relationship between TBA numbers and
inexperienced panelists’assessments of oxidized flavor in cooked beef. Journal of
Food Science, 47:1, 52-54.
Hoving-Bolink, A.H., Hanekamp, W.J.A. & Walstra, P. (1999). Effects of diet on
carcass, meat and eating quality of once-bred Piemontese x Friesian heifers.
Livestock Production Science, 57:3, 267-272.
Insausti, K., Beriain, M.J., Alzueta, M.J., Carr, T.R. & Purroy, A. (2004). Lipid
composition of the intramuscular fat of beef from Spanish cattle breeds stored
under modified atmosphere. Meat Science, 66:3, 639-646.
ISSFAL. (2012). International Society for the Study of Fatty Acids and Lipids.
http://www.mollersomega3.com/c-77-Recommended-omega-3-intake.aspx,
accessed 06/19/2012.
Kris-Etherton, P.M., Harris, W.S. & Lawrence, J. (2003). Fish consumption, fish oil,
omega-3 fatty acids, and cardiovascular disease. Arteriosclerosis, Thrombosis,
and Vascular Biology, 23, e20-e30.
Larick, D.K., Hedrick, H.B., Bailey, M.E., Williams, J.E., Hancock, D.L., Garner, G.B.
& Morrow, R.E. (1987). Flavor constituents of beef as influenced by forage-
feeding and grain-feeding. Journal of Food Science, 52:2, 245-251.
Leyton, J., Drury, P.J. & Crawford, M.A. (1987). Differential oxidation of saturated and
unsaturated fatty acids in vivo in the rat. British Journal of Nutrition, 57:3, 383-
393.
78
Mandell, I.B., Buchanan-Smith, J.G. & Campbell, C.P. (1998). Effects of forage vs grain
feeding on carcass characteristics, fatty acid composition, and beef quality in
limousin-cross steers when time on feed is controlled. Journal of Animal Science,
76:10, 2619-2630.
Maruri, J.L. & Larick, D.K. (1992). Volatile concentration and flavor of beef as
influenced by diet. Journal of Food Science, 57:6, 1275-1281.
Maughan, C., Tansawat, R., Cornforth, D., Ward, R. & Martini, S. (2012). Development
of a beef flavor lexicon and its application to compare the flavor profile and
consumer acceptance of rib steaks from grass- or grain-fed cattle. Meat Science,
90:1, 116-121.
McCluskey, J.J., Wahl, T.I., Quan, L. & Wandschneider, P.R. (2005). U.S. Grass-fed
beef: marketing and health benefits. Journal of Food Distribution Research, 36:3,
1-8.
Melton, S.L., Amiri, M., Davis, G.W. & Backus, W.R. (1982). Flavor and chemical
characteristics of ground-beef from grass-finished, forage-grain-finished and
grain-finished steers. Journal of Animal Science, 55:1, 77-87.
Mercier, Y., Gatellier, P. & Renerre, M. (2004). Lipid and protein oxidation in vitro, and
antioxidant potential in meat from Charolais cows finished on pasture or mixed
diet. Meat Science, 66:2, 467-473.
Min, D.B.S., Ina, K., Peterson, R.J. & Chang, S.S. (1977). The alkyl- benzenes in roast
beef. Journal of Food Science, 42:2, 503-505.
Mottram, D.S. & Edwards, R.A. (1983). The role of triglycerides and phospholipids in

79
the aroma of cooked beef. Journal of the Science of Food and Agriculture, 34:5,
517-522.
Mussinan, C.J. & Katz, I. (1973). Isolation and identification of some sulfur chemicals
present in two model systems approximating cooked meat. Journal Agriculture
and Food Chemistry, 21:1, 43-45.
Newman, A.E. (1996). Method of processing big game scent. USA Patent number
5,565,111. Patent date: Oct 15.
Nutritive Value of Foods. (1981). Nutritive value of the edible part of foods: Fish,
shellfish, meat, and poultry. Pp. 9, Washington DC: United States Department of
Agriculture.
O'Fallon, J.V., Busboom, J.R., Nelson, M.L. & Gaskins, C.T. (2007). A direct method for
fatty acid methyl ester synthesis: application to wet meat tissues, oils, and
feedstuffs. Journal of Animal Science, 85:6, 1511-1521.
Ponnampalam, E.N., Mann, N.J. & Sinclair, A.J. (2006). Effect of feeding systems on
omega-3 fatty acids, conjugated linoleic acid and trans fatty acids in Australian
beef cuts: Potential impact on human health. Asia Pacific Journal of Clinical
Nutrition, 15:1, 21-29.
Poulson, C.S., Dhiman, T.R., Ure, A.L., Cornforth, D. & Olson, K.C. (2004). Conjugated
linoleic acid content of beef from cattle fed diets containing high grain, CLA, or
raised on forages. Livestock Production Science, 91:1-2, 117-128.
Priolo, A., Micol, D. & Agabriel, J. (2001). Effects of grass feeding systems on ruminant
meat color and flavor. A review. Animal Research, 50:3, 185-200.
80
Riediger, N.D., Othman, R.A., Suh, M. & Moghadasian, M.H. (2009). A systemic review
of the roles of n-3 fatty acids in health and disease. Journal of the American
Dietetic Association, 109:4, 668-679.
Rivas-Cañedo, A., Fernández-García, E. & Nuñez, M. (2009). Volatile compounds in
fresh meats subjected to high pressure processing: Effect of the packaging
material. Meat Science, 81:2, 321-328.
Shahidi, F. & Pegg, R.B. (1994). Hexanal as an indicator of meat flavor deterioration.
Journal of Food Lipids, 1:3, 177-186.
Simopoulos, A.P. (2002). The importance of the ratio of omega-6/omega-3 essential fatty
acids. Biomedicine and Pharmacotherapy, 56:8, 365-379.
St. Angelo, A.J., Dupuy, H.P. & Flick Jr., G.J. (1988). Investigation of fish oil quality by
direct capillary gas chromatography. Journal of Food Quality, 10:6, 393-405.
St. Angelo, A.J., Vercellotti, J.R., Legendre, M.G., Vinneit, C.H., Kuan, J.W., James Jr.,
C. & Dupuy, H.P. (1987). Chemical and instrumental analyses of warmed-over
flavor in beef. Journal of Food Science, 52:5, 1163-1168.
Vasta, V., Jeronimo, E., Brogna, D.M.R., Dentinho, M.T.P., Biondi, L., Santos-Silva, J.,
Priolo, A. & Bessa, R.J.B. (2010). The effect of grape seed extract or Cistus
ladanifer L. on muscle volatile compounds of lambs fed dehydrated lucerne
supplemented with oil. Food Chemistry, 119:4, 1339-1345.
Williams, S. (1984). Official Methods of analysis of the Association of Official
Analytical Chemists, 14th edn. Arlington, VA: Association of Official Analytical
Chemists, Inc.

81
Wood, J.D. & Enser, M. (1997). Factors influencing fatty acids in meat and the role of
antioxidants in improving meat quality. British Journal of Nutrition, 78:1, S49-
60.
Wu, C., Duckett, S.K., Neel, J.P.S., Fontenot, J.P. & Clapham, W.M. (2008). Influence
of finishing systems on hydrophilic and lipophilic oxygen radical absorbance
capacity (ORAC) in beef. Meat Science, 80:3, 662-667.
Wu, C.M. & Liou, S.E. (1992). Volatile components of water-boiled duck meat and
Cantonese style roasted duck. Journal Agriculture and Food Chemistry, 40:5,
838-841.
Yang, A., Lanari, M.C., Brewster, M. & Tume, R.K. (2002). Lipid stability and meat
color of beef from pasture- and grain-fed cattle with or without vitamin E
supplement. Meat Science, 60:1, 41-50.
82
CHAPTER 4
COMPARISON OF ALFALFA- VERSUS SAINFOIN-FINISHING DIET
ON BEEF CHEMICAL CHARACTERISTICS AND HEADSPACE VOLATILES1 Abstract
In the western U.S., alfalfa (legume) and mixed grasses are the two predominant
livestock forages. Unlike alfalfa, sainfoin is a non-bloating, drought tolerant legume with
high nutritional value for ruminant feeding. Additionally, among the grasses, tall fescue
is fast growing and nutritious to livestock, but produces an ergot alkaloid toxin when
infected by fungi, slowing cattle growth. Sainfoin is a legume containing tannins, which
can bind and inactivate ergotamine when both plants are consumed by ruminants. Our
collaborators are examining the possibility that mixed fescue-sainfoin pasture allows
cattle to grow faster than on fescue alone. The objective of this study is to determine the
effects of sainfoin versus alfalfa pasture on meat quality and aroma profiles. The meat
quality parameters included quality grade, % fat, color stability, MRA (resistance to
browning), TBA (resistance to lipid oxidation), FRAP (antioxidant capacity), fatty acid
composition, and aroma profile in the headspace of heated meat. Beef carcasses from
both diet treatments (n = 3/treatment) were very lean (select or standard quality grade),
with 4 – 6% fat content. There were no differences between two legume-fed diets in
lightness and redness (P > 0.05). Similarly, no diet differences were found in muscle
MRA, TBA, FRAP, or fatty acid analyses (P > 0.05). For headspace analysis, there were
45 compounds detected. However, nonanoic and decanoic acids were the only 2 out of 45
1 Coauthored by Tansawat, R., Ward, R.E., Martini, S. & Cornforth, D.P.

83
compounds different between diet treatments (P < 0.05). In terms of meat chemical
characteristics and volatile profiles, sainfoin pasture was comparable to alfalfa as a cattle
forage. Thus, further studies are justified to evaluate the economics of sainfoin in cattle
finishing diets compared to alfalfa.
Introduction
Currently, there are several studies showing nutritional health benefits of pasture-
fed beef over grain-fed beef (Daley et al., 2010), which has stimulated much interest
among health-conscious consumers. Still, there is much to learn about the effect of
different type of pasture feedings on meat quality. Tall fescue [Schedonorus phoenix
(Scop.) Holub] is one of the most important cool-season forage grasses due to its fast
growth rate and nutritional value to livestock, occupying approximately 5.5 million acres
in the United States (Lacefield et al., 2003). Tall fescue is well-adapted to a wide range
of soil and climatic conditions, so it is a versatile plant used for animal feed. However,
excessive consumption of tall fescue can be toxic to livestock. Tall fescues can be
infected with an endophytic fungus (Neotyphodium coenophialum), which produces
secondary metabolites (alkaloids) that help protect the plant against insects and parasitic
soil nematodes. Some ergopeptine alkaloids, especially ergovaline, are toxic for cattle
because they act as a vasoconstrictor (Schnitzius et al., 2001).
Legumes are plants in the family Fabaceae (or Leguminosae) with nitrogen
fixation ability in a symbiotic relationship with Rhizobium bacteria found in the soil.
Within nodules formed on legume roots, nitrogen gas from the atmosphere is converted
into ammonia, which is then assimilated into amino acids (the building blocks of

84
proteins). Hence, legume seed and foliage have higher protein content than non-legume
crops, which is desirable for livestock feed. Nonetheless, legumes can sometimes cause
frothy bloat in cattle, possibly due to the toxic effects of secondary metabolite saponins
(Lindahl et al., 1957), particularly from legumes such as alfalfa (Medicago sativa) and
clover (Trifolium). Thick foam is developed on top of the rumen liquid, preventing cattle
from exhaling fermentation gases, which may lead to abdominal distension, inhibiting
respiration and heart function, sometimes causing the animal's death.
Non-bloating legumes such as sainfoin (Onobrychis viciifolia), birdsfoot trefoil
(Lotus corniculatus), and cicer milkvetch (Astragalus cicer) are legume forages that do
not cause bloat in cattle. Sainfoin and birdsfoot trefoil contain the secondary metabolites
tannins in the form of condensed tannins (CT) structure. Tannins are generally considered
anti-quality factors for livestock because they bind irreversibly with proteins and inhibit
intake and impede protein utilization. On the other hand, some CT can enhance nutrition
by providing high-quality protein to the small intestine by binding to degradable protein
in the rumen, making the protein unavailable for digestion and absorption until it reaches
the small intestine (Lisonbee et al., 2009). The association between plant proteins and CT
from these two plants is stable and insoluble at rumen pH (6.5 to 7.0). At the pH of the
abomasum (2.5 to 3.0), some CT-protein complexes are unstable, allowing plant amino
acids to become available for absorption in the higher pH (8.0 - 9.0) of the small intestine
of the cattle (Mangan, 1988). MacAdam et al. (2011), Waghorn (2008), and Min et al.
(2003) reported the potential of birdsfoot trefoil to produce high average daily gain in
cattle; however, Waghorn (2008) and Min et al. (2003) gave details that, unlike CT in

85
birdsfoot trefoil, CT in sainfoin has not been shown to be beneficial to improve livestock
production by this pathway. Yet, Theodoridou et al. (2010) showed that feeding sainfoin
to ruminants can be used to alter the form of excreted N; therefore, potentially reduce
environmental N pollution without negatively affect the amount of N retention, which is
beneficial in ruminant nutrition.
Legume-grass mixtures are also used to improve animal and pasture productivity
as well as managing bloat. Tannins have the potential to interact with other plant
secondary compounds such as alkaloids and saponins, neutralizing their negative effects.
Lisonbee et al. (2009) showed that lambs receiving intraruminal infusions of tannins
increased their consumption of the high-saponin variety of alfalfa and the high-alkaloid
variety of tall fescue relative to lambs not infused with tannins (controls). Owens et al.
(2012) demonstrated that sheep fed a tannin-containing legume (birdsfoot trefoil) for 30
min subsequently consumed greater amounts of endophyte-infected tall fescue than sheep
supplemented with high-saponin alfalfa. The objective of this study is to determine the
effects of alfalfa (a bloat-causing legume containing the secondary metabolite saponins)
versus sainfoin (a non-bloat-causing legume containing the secondary metabolite tannins)
on meat quality including color stability, and metmyoglobin reducing activity (MRA),
lipid oxidation and antioxidant status, fatty acid composition, and headspace volatile
profiles. Legume-grass mixtures (alfalfa or sainfoin mixed with tall fescue) were used in
this study.
86
Materials and Methods Meat samples
The study was conducted at the Utah State University Intermountain Irrigated
Pasture Project farm in Lewiston, UT, as part of a collaborative project with Dr. Juan
Villalba. Mr. Brody Maughan was our collaborator responsible for animal management.
In short, three blocks, each 9 acres in size, were divided into two 4.5-acre plots
containing three 1.5-acre strips. Pastures, including alfalfa (Medicago sativa variety
Vernal), sainfoin (Onobrychis viciifolia variety Shoshone), and tall fescue (Festuca
arundinacea variety Kentucky-31) were seeded in these three 1.5-acre strips as shown in
Figure 4-1.
Eight cattle were assigned to each plot, and animals within each plot had free
access to the grass, legume and grass-legume mix throughout the day. All plots provided
ad libitum forage to cattle (usually about 20 - 25 lbs of feed per head per day) for 90 -
110 days before animal harvest. One animal was randomly selected from each plot for
chemical analysis of muscle; thus, six animals in total were used in this study (3
animals/diet treatment). At slaughter, cattle were 22 - 24 months old with 220 - 277 kg
hanging carcass weights. All animals were steers, with the exception of one alfalfa-fed
heifer.
Animals were slaughtered at the USU South Farm abattoir (Wellsville, UT). The
ribs of each animal were then vacuum packaged after harvest and shipped to the
Department of Nutrition, Dietetics, and Food Sciences at USU. Muscle was immediately
frozen at -20 °C until use. Primal ribs (Longissimus dorsi muscles) of three alfalfa- and

87
Alfalfa
Alfalfa +
Tall Fescue
Tall Fescue
Sainfoin
Sainfoin +
Tall fescue
Tall Fescue
Figure 4-1 Pasture design.
three sainfoin-fed cattle were used for the analyses. Carcass quality and yield grade
measurements were obtained for each animal after harvest. Carcass quality grade factors
included marbling score of the ribeye muscle (Longissimus dorsi), taken at the 12 - 13th
rib, and carcass maturity score, indicated by degree of ossification the ventral processes
of the thoracic vertebrae and ribs. Carcass yield grade measurements included hot carcass
weight, back fat thickness (BF) and ribeye area (REA) at the 12 - 13th rib, and internal fat
(% kidney, pelvic, and heart fat; %KPH) as a percent of carcass weight.
Chemical analyses Fat content
Ether-extractable fat content of uncooked rib steaks was done by the solvent
extraction method (Williams, 1984), using petroleum ether as the solvent. See details in
Materials and Methods, Chapter 3.
88
pH
Raw beef pH was measured on 10 g finely chopped meat, diluted to 100 mL in
distilled water, allowed to equilibrate at room temperature for 30 min and then filtered.
Filtrate pH was measured, using a Fisher Accumet pH meter model 610 A (Fisher
Scientific Inc, Salt Lake City, UT), equipped with a combination pH electrode calibrated
immediately before use to pH 4.0 and 7.0.
Hunter color measurements
Each ribeye steak (1.9 cm thick) was placed in a Styrofoam tray and over-
wrapped with oxygen-permeable polyvinyl chloride (PVC) and stored at 2 °C. Color
measurements were determined at days 0, 1, 2, 4, 7, 9, and 12 of storage. Meat color was
determined instrumentally using a HunterLab Miniscan portable colorimeter (Hunter
Associates Laboratory, Inc., Reston, VA) with a 5 mm diameter aperture, set to use
illuminant D-65. The colorimeter was standardized through a single layer of PVC film
using both white and black standard tiles. Meat color parameters lightness (L*), redness
(a*) and yellowness (b*) were measured. Triplicate readings were made on non-
overlapping areas of the sample and values were then averaged.
Metmyoglobin Reducing Activity (MRA) test
MRA was measured as described by Mancini et al. (2008). A 3 cm x 3 cm x 2 cm
sample of muscle tissue that did not contain any visible fat or connective tissue was
removed. Beef samples were submerged in 0.3% NaNO2 solution for 20 min at room
temperature to induce metmyoglobin (MMb) formation. Beef samples were then removed

89
from the beaker and blotted to remove excess solution. The desired surface of beef was
then placed in an impermeable bag and vacuum packaged. Reflectance spectra were
recorded at the meat surface using a HunterLab Miniscan portable colorimeter (Reston,
VA) with a 5 mm diameter aperture, set to use illuminant D-65. The initial amount of
MMb formed on the surface was instrumentally determined. Percentage of MMb formed
after the oxidizing treatment was determined by calculating the (K/S)572 ÷ (K/S)525 ratio.
After that, beef samples were placed in an impermeable bag, vacuum packaged, and
incubated at 30 °C to allow MMb reduction. Samples were rescanned after 2 h to
determine the amount of MMb remaining. The metmyoglobin reducing activity (% of
MMb reduced) was calculated by the following equation:
MRA (% of MMb reduced) = [(Initial %MMb − Final %MMb) ÷ Initial %MMb] × 100. Thiobarbituric acid assay (TBA)
Each steak was placed in a foam tray and over-wrapped with PVC film and stored
at 2 °C. Thiobarbituric acid reactive substances (TBARS) were determined at days 0 and
12 of storage. The TBA assay was performed as described by Buege & Aust (1978). See
details in Materials and Methods, Chapter 3.
Ferric reducing antioxidant power (FRAP) test
FRAP was measured as described by Benzie & Strain (1996). FRAP reagent was
prepared by adding 200 mL acetate buffer (300 mM; pH 3.6), 20 mL TPTZ solution (10
mM of 2,4,6-tri [2-pyridyl]-s-triazine), 20 mL FeCl3 solution (20 mM), and 24 mL
distilled water together. In a cuvette, 30 µL distilled water and 1 mL of FRAP reagent

90
were mixed thoroughly. The solution was then incubated in the 37 °C water bath for 4
min and measured at absorbance 593 nm using a UV 2100 U spectrophotometer
(Shimadzu Co., Kyoto, Japan). A blank solution was also run along with the standards.
Each sample and standard value was corrected by subtraction of the absorbance of the
water blank. Linear regression for the standards was constructed (absorbance against
concentration). The FRAP values were calculated by using the regression equation. Data
were expressed as mM Fe(II)/L of sample.
Fatty acid chemical composition
Fatty acids were analyzed using the method developed by O’Fallon et al. (2007).
Steaks were sliced into thin strips (< 1.5 mm thickness) with a razor blade and
approximately 1 g of lean tissue was placed into 16 x 125 mm screw-cap Pyrex culture
tubes, using 1 mL of C17:1 as an internal standard (0.2826 mg/mL of C17:1 per 1 mL of
MeOH). Fatty acid methyl esters (FAMEs) were synthesized by adding a 0.7 mL of 10 N
KOH in water, followed by a 5.3 mL of MeOH into the tubes. After that, the tubes were
incubated in a 55 °C water bath for 1.5 h, with vigorous hand-shaking for 5 s every 20
min to dissolve and hydrolyze the tissues. Tubes were then cooled in a cold water bath
and 0.58 mL of aqueous 24 N H2SO4 was added. Consequently, samples were incubated
again in a water bath at 55 °C for 1.5 h, with vigorous hand-shaking for 5 s every 20 min.
After FAMEs synthesis, tubes were cooled again in a cold water bath. Two milliliters of
hexane was added and tubes were centrifuged at 500 rpm, 4 °C, for 5 min. The upper
supernatant, containing FAMEs, was placed into GC vials and store at -20°C until
analysis. The FAMEs were analyzed by gas chromatography with flame ionization
91
detection (GC-FID) as described in Chapter 3. Fatty acid profiles were expressed as
mg/100 g of fresh meat.
Headspace volatile analysis
The volatile profile of heated meat was determined as described by Vasta et al.
(2010). Meat samples (6 g) were sliced and placed in closed rubber-capped vials.
Samples were then heated at 70 °C for 10 min and fiber (2 cm-50/30
DVB/CarboxenTM/PDMS; Supelco, Bellefonte, PA) was exposed to the headspace over
the sample at 70 °C for 30 min to adsorb the volatiles. A 2 µL aliquot of 1,2
dichlorobenzene (52.7 µmol) was added as a surrogate to each vial containing a beef
sample. Data were expressed as the ratio of volatile to surrogate. See details in Materials
and Methods, Chapter 3.
Statistical analysis
The experiment was designed with 2 diet treatments (alfalfa- vs. sainfoin-fed) and
measurements were made on steaks from 3 animals per treatment. The measurements of
fat content, pH, TBA, MRA, FRAP, fatty acid composition, and headspace volatile
analyses were done in triplicate for each treatment. Hunter color measurement was done
in duplicate for each sample. Statistical Analysis Software (SAS) version 9.1 (SAS
Institute, Inc., Cary, NC) was used for analysis of variance (ANOVA) to identify
statistically significant differences between samples at the 95% confidence level.
Comparison of the means was made based on P-values (α = 0.05) using the least
significant different (LSD) adjustment to obtain differences of least means squares.

92
Complete randomized design with the proc glm function was used for MRA, FRAP, fatty
acid profiles, and headspace volatile experiments. Repeated measures design with the
proc mixed function, using Tukey adjustment to obtain differences of least means
squares, was used for raw meat color and TBA experiments.
Results
Carcass characteristics including yield and quality grade are shown in Table 4-1.
There was no different (P > 0.05) in HW, REA, BF, and % KPH between beef rib
samples from cattle on the sainfoin treatment and animals finished on alfalfa pasture. The
marbling score was “slight” in all of the alfalfa-raised animals, corresponding to USDA
“select” quality grade. Two cattle on the sainfoin treatment had lower marbling score of
“traces”, corresponding to USDA “standard” quality grade.
Table 4-1 Characteristics of steaks obtained from alfalfa- and sainfoin-fed animals
Samples
HW
REA
BF
KPH
Marbling Score
USDA Grade
Sex
Alfalfa #1 99.7 56.1 0.5 2.0 Slight 90 Select + Heifer
Alfalfa #3 111.1 70.3 0.4 2.0 Slight 40 Select - Steer
Alfalfa #5 114.3 66.5 0.3 2.0 Slight 40 Select - Steer
Alfafla mean 108.4 67.3 0.4 2.0 - - -
Sainfoin #2 104.8 55.5 0.4 2.0 Slight 10 Select - Steer
Sainfoin #4 125.6 70.3 0.3 1.5 Traces Standard + Steer
Sainfoin #6 115.2 72.3 0.1 1.5 Traces Standard + Steer
Sainfoin mean 115.2 66.0 0.3 1.7 - - -
P-value1 NS NS NS NS - - -
HW = Hanging Weight (kg); REA = Rib Eye Area (cm2); BF = Back Fat thickness (cm); KPH = kidney, pelvic, and heart fat (% of carcass weight). 1 Significantly different between diet treatment means (P < 0.05); NS = Not significantly different.

93
Figure 4-2 shows that meat color stability was strongly affected by time of
storage. Typically, fresh beef steaks in PVC package (80% oxygen) have bright red color
with a* ~ 16 and L* ~ 45 (0 - 100 scale; 0 = completely black, 100 = completely white),
while b* is low (~15). Yellowness (b*) is the component of brownness that can change in
the aged beef, which can go up to >25 (John et al., 2005). In this study, lightness (L*)
was increased (P < 0.001) while redness (a*) and yellowness (b*) values were decreased
over 12 d storage at 2 °C (P < 0.0001 and P = 0.001, respectively). There were no
differences between the two legume-fed diets in lightness (P < 0.05) and redness (P <
0.05) descriptors. Yellowness was significantly lower in alfalfa-fed treatment (P < 0.01),
but there was no significant interaction effect on b* values between diet treatment and
storage time at any given day (see Appendix Table B1-B6 for detailed statistics).
Fat content of rib steaks were not different (P > 0.05) between alfalfa and sainfoin
diet treatments (Table 4-2; Appendix Table B7). Mean rib muscle pH was also similar
between forage treatments (P > 0.05; Appendix Table B8). MRA is another parameter
that was conducted to measure meat discoloration by measuring the resistance of
myoglobin to nitrite-induced oxidation. There were not any changes in % of MMb
reduced in meat samples between diet treatments (P < 0.05; Appendix Table B9). Rate of
lipid oxidation in ribs was determined by TBA reactivity. TBA values, compared
between diet treatments, were similar (P > 0.05) in both initial and final storage time
points (day 0 and day 12; Appendix Table B10-B11). Moreover, TBA values of meat
from the two diets were the same after 12 d storage at 2 °C (P > 0.05), which was
comparable to the TBA results from grain- vs. grass fed beef experiment that was
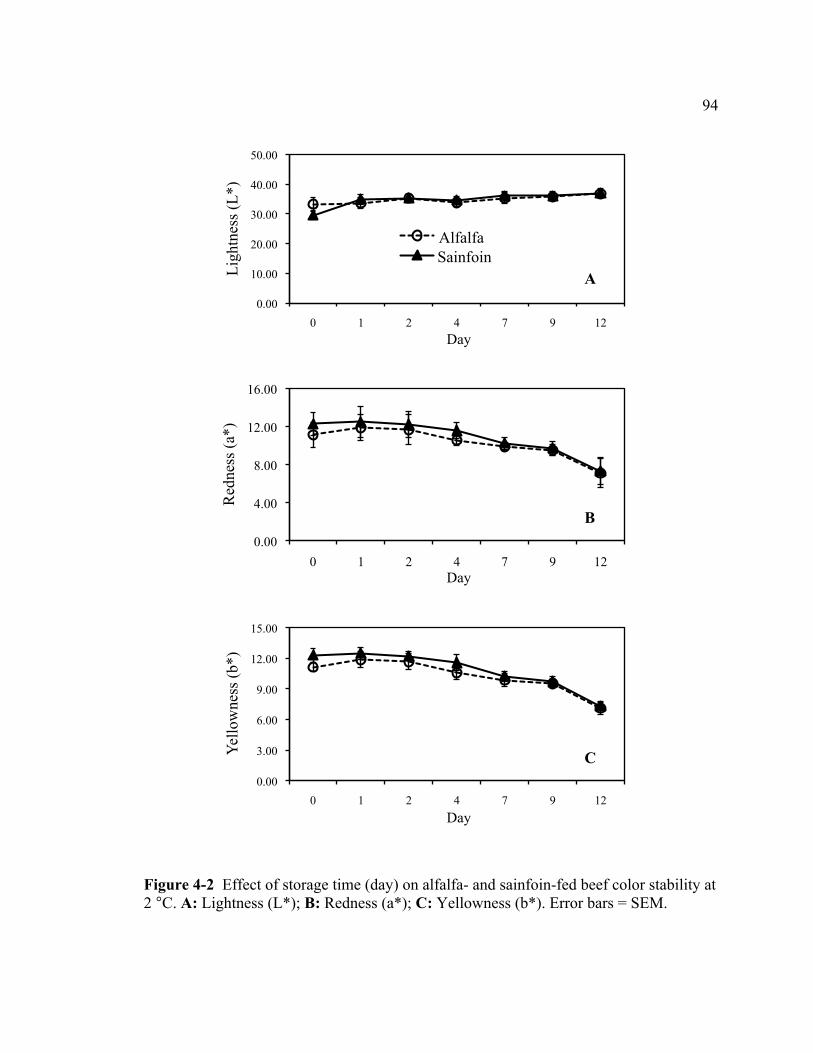
94
Figure 4-2 Effect of storage time (day) on alfalfa- and sainfoin-fed beef color stability at 2 °C. A: Lightness (L*); B: Redness (a*); C: Yellowness (b*). Error bars = SEM.
0.00
10.00
20.00
30.00
40.00
50.00
0 1 2 4 7 9 12
Ligh
tnes
s (L*
)
Day
Alfalfa Sainfoin
A
0.00
4.00
8.00
12.00
16.00
0 1 2 4 7 9 12
Red
ness
(a*)
Day
B
0.00
3.00
6.00
9.00
12.00
15.00
0 1 2 4 7 9 12
Yello
wne
ss (b
*)
Day
C

95
Table 4-2 Fat content, pH, metmyoglobin reducing activity (MRA), thiobarbituric acid assay (TBA), and ferric reducing antioxidant power (FRAP) of alfalfa- and sainfoin-fed beef
TBA Treatment
Fat (%)
pH
MRA (%MMb1) Day 0 Day 12
FRAP [Mm Fe(II)]
Alfalfa-fed (n=3) 6.07 ± 1.54 5.14 ± 0.14 75.47 ± 1.30 0.15 ± 0.04 0.24 ± 0.05 0.0755 ± 0.0075 Sainfoin-fed (n=3) 4.43 ± 1.47 5.10 ± 0.06 72.85 ± 1.32 0.23 ± 0.25 0.33 ± 0.09 0.0677 ± 0.0065
P-value 0.25 0.62 0.07 0.87 0.08 0.23 1 % MMb = % of Metmyoglobin reduced.
discussed in Chapter 3. Antioxidant capacity of steaks was also evaluated, using FRAP
test. There were no significant differences found between the two pasture treatments (P >
0.05; Appendix Table B12).
With regards to fatty acid composition, the thirteen most abundant fatty acids are
shown graphically in Figure 4-3. The amount of myristic acid (C14:0), palmitic acid
(C16:0), stearic acid (C18:0), vaccenic acid (C18:1n7t), and linolenic acid (C18:3n3)
were numerically higher in alfalfa-fed than in sainfoin-fed animals, but not different at a
significance level of α = 0.05 (Appendix Table B13).
Volatile compounds were measured above the headspace of heated meat at 70 °C
to study the favorable and unfavorable effects of diet treatments on sensory properties of
the meat. Feeding different legumes did not have a strong effect on the meat volatiles.
There were 45 volatiles detected across the two diet treatments, but only 2 volatiles that
were significantly affected by diets (P < 0.05; Figure 4-4; Appendix Table B14). Ratio of
the area of nonanoic and decanoic acids to surrogate standard were significantly higher in
meat from alfalfa-fed than from sainfoin-fed animals (P < 0.05).

96
Figure 4-3 Fatty acid chemical composition (mg/g meat) for meat samples obtained from animals fed with alfalfa- and sainfoin-based diet. Error bars = SEM.
0.00
1.00
2.00
3.00
4.00
5.00
6.00
7.00
8.00
9.00
mg/
g m
eat
Alfalfa Sainfoin
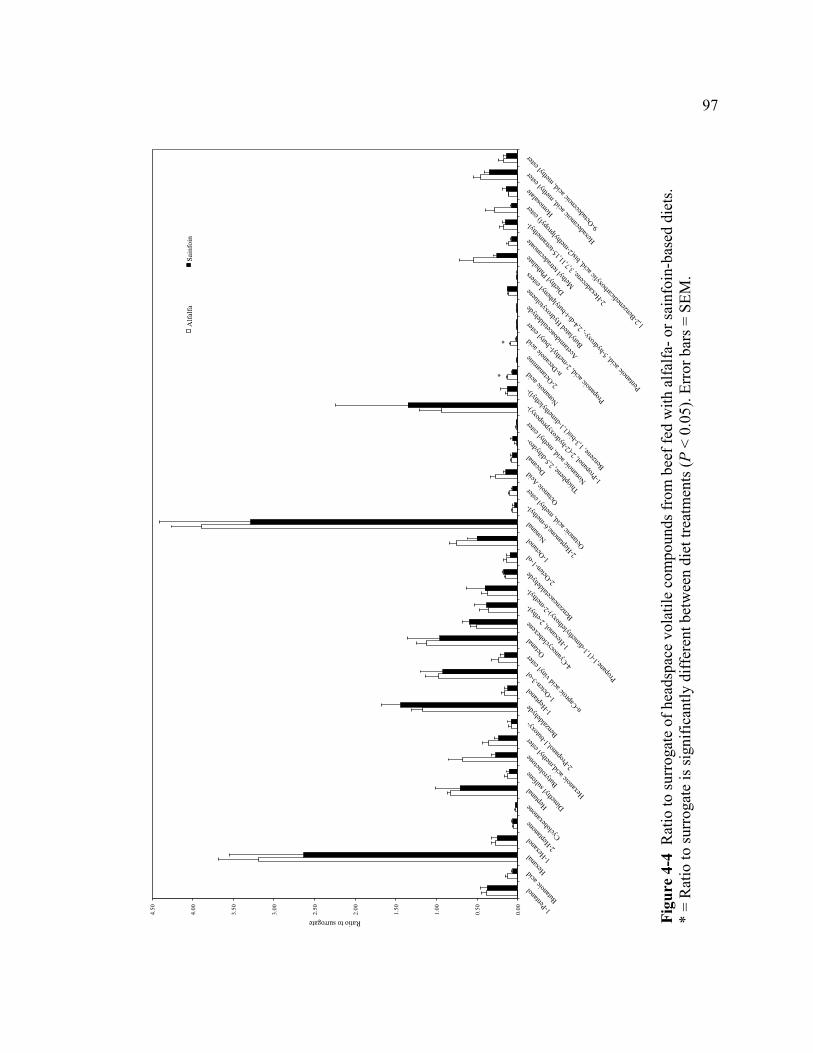
97
0.00
0.50
1.00
1.50
2.00
2.50
3.00
3.50
4.00
4.50
1-Pen
tanol
Butano
ic aci
d Hexan
al 1-Hex
anol
2-Hep
tanon
e
Cycloh
exan
one Hep
tanal
Dimeth
yl sul
fone
Butyrol
acton
e
Hexan
oic ac
id,meth
yl est
er
2-Prop
anol,
1-buto
xy-
Benzal
dehy
de
1-Hep
tanol
1-Octe
n-3-ol
n-Cap
roic a
cid vi
nyl e
ster Octa
nal
4-Cya
nocy
clohe
xene
1-Hex
anol,
2-eth
yl-
Propan
e,1-(1
,1-dim
ethyle
thoxy
)-2-m
ethyl-
Benzen
eaceta
ldehy
de
2-Octe
n-1-ol
1-Octa
nol Non
anal
2-Hep
tanon
e,6-m
ethyl-
Octano
ic aci
d, meth
yl est
er
Octano
ic Acid
Decana
l
Thioph
ene,
2,5-di
hydro
-
Nonan
oic ac
id, m
ethyl
ester
1-Prop
anol,
2-(2-
hydro
xypro
poxy
)-
Benzen
e, 1,3
-bis(1
,1-dim
ethyle
thyl)-
Nonan
oic ac
id
2-Octa
namine
n-Deca
noic
acid
Propan
oic ac
id, 2-
methyl-
,butyl
ester
Acetam
idoace
talde
hyde
Butylat
ed H
ydrox
ytolue
ne
Pentan
oic ac
id, 5-
hydro
xy-, 2
,4-di-
t-buty
lphen
yl est
ers
Diethy
l Phth
alate
Methyl
tetrad
ecano
ate
2-Hex
adece
ne, 3
,7,11
,15-te
trameth
yl-
1,2-B
enzen
edica
rboxy
lic ac
id, bi
s(2-m
ethylp
ropyl)
ester
Hom
osalat
e
Hexad
ecano
ic aci
d, meth
yl est
er
9-Octa
decen
oic ac
id, m
ethyl
ester
Ratio to surrogate
Alfa
lfa
Sain
foin
*
*
Figu
re 4
-4 R
atio
to su
rrog
ate
of h
eads
pace
vol
atile
com
poun
ds fr
om b
eef f
ed w
ith a
lfalfa
- or s
ainf
oin-
base
d di
ets.
* =
Rat
io to
surr
ogat
e is
sign
ifica
ntly
diff
eren
t bet
wee
n di
et tr
eatm
ents
(P <
0.0
5). E
rror
bar
s = S
EM.

98
Discussion
Sainfoin is a non-bloating legume with high nutritional value for livestock
feeding. In this study, chemical analyses of meat from alfalfa- versus sainfoin-fed cattle
were generally not significant different (P > 0.05), in terms of color stability, resistance
to browning (MRA), resistance to lipid oxidation (TBA), antioxidant capacity (FRAP),
fatty acid composition, and volatile profile. Hence, it can be suggested that tannin-
containing sainfoin was equivalent to saponin-containing alfalfa pasture as a cattle forage
in a legume-grass mixed system. According to data from Chapter 3, similar low TBA
values after 12 d of storage at retail conditions (2 °C) were obtained from ribs from cattle
fed a pasture-mixed diet (a variety of plants, including orchard grass, brome, fescue, and
clover) as compared to animals fed alfalfa-tall fescue and sainfoin-tall fescue fed in this
study. There were no differences (P > 0.05) in lipid oxidation on steaks sampled at day 0
and after 12 d storage in both experiments (pasture-fed: day 0 = 0.22 vs. day 12 = 0.60;
alfalfa-fed: day 0 = 0.15 vs. day 12 = 0.24; sainfoin-fed: day 0 = 0.23 vs. day 12 = 0.33).
TBA numbers greater than 1.00 are commonly associated with rancid flavor/odor
(Greene & Cumuze, 1981), but all TBA values from both experiments were less than 1
even after 12 d storage. Therefore, this study confirmed that pasture diets, including
legumes and grasses, have longer storage shelf life than beef from typical grain-finishing
diet.
In the assay for headspace volatiles of heated meat, only 2 out of 45 detected
volatiles were significantly different between diet treatments. Nonanoic and decanoic
acids were higher in alfalfa-fed beef (P < 0.05). Nonanoic and decanoic acids are
99
volatiles found in charbroiling and frying hamburger meat (Rogge et al., 1991) and dry-
cured ham (Martín et al., 2006; Andrés et al., 2002; Berdagué et al., 1991; Garcia et al.,
1991). Several volatiles that were associated with gamey, bitter, barny, and grassy flavors
in Chapter 3 were also found in this study (in both alfalfa- and sainfoin-fed) including
dimethyl sulfone, benzaldehyde, 2-ethyl-1-hexanol, and hexadecanoic acid.
Maughan (2011) conducted descriptive sensory profiling and consumer test for
meat obtained from the same animals (ribeye steak, L. dorsi muscles). For descriptive
analysis, 12 panelists were recruited from the local community and trained to identify and
quantify the flavor characteristics of the meat obtained from cattle fed alfalfa or sainfoin
diets [Panelists’ screening and training was performed as described in Maughan et al.
(2012)], and a lexicon of 18 meat flavor descriptors (astringent, barny, bitter, bloody,
brothy, browned, gamey, grassy, juicy, fatty, livery, metallic, oxidized/warmed-over
flavor, roast beef, salty, sour, sweet, and umami) was used on a 15-point scale (1 = no
flavor and 15 = very high flavor intensity) for of each attribute. No significant differences
(α = 0.05) were found in the flavor characteristics of meats obtained from cattle fed
different legume diets for all flavor descriptors. A consumer test was also performed on
the same rib steak samples, with 120 panelists and utilizing a 9-point hedonic scale (1 =
dislike extremely, 9 = like extremely). No significant differences were also obtained in
the acceptability of meat from both diets with values of 6.71 for alfalfa treatment and
6.96 for sainfoin treatment, where a score of 6 = like slightly, and 7 = like moderately.
A contributing factor to the similarity in chemical characterization and sensory
evaluation of rib steaks in this study might be due to an unexpected problem with live
100
animal grazing management during the finishing period; specifically, the cattle in the
sainfoin pasture treatment probably did not accumulate as much sainfoin-derived tannins
as called for in the experimental design, because over-grazing of sainfoin in period 1,
resulted in less sainfoin being available as forage later in the summer.
There were three grazing periods (Period 1: from May 20th to June 21st; Period 2:
from July 8th to August 5th; Period 3: from August 17th to September 7th), with 12
animals/pasture in Period 1. However, the yields of sainfoin in Periods 2 and 3 decreased
substantially from the beginning to the end of each Period, probably for the reason that
animals grazed more heavily on sainfoin than grass, probably because of its greater
nutritional quality and flavor, compared to grass. Consequently, 4 animals/plot had to be
removed before the start of Period 3, in order to make more forage available per animal.
With this change in animal number, average daily gains of cattle increased during Period
3, but were still below the gains achieved during Period 1 (the period with the greatest
forage yields). Nevertheless, sainfoin consumption increased during Period 3 compared
to Period 2 in the sainfoin pasture treatment, and meat from these animals was found to
be not different in chemical characteristics or flavor, compared to meat from alfalfa-
based pasture.
Conclusions
Meat quality and acceptability of pasture-finished cattle on sainfoin appears
comparable to meat from animals finished on alfalfa-based pasture. Meat quality, in
terms of color stability, resistance to browning, resistance to lipid oxidation, antioxidant
status, fatty acid composition, and aroma profiles was similar between the two diet
101
treatments, indicating that sainfoin pasture was comparable to alfalfa as a cattle forage.
The benefits of sainfoin is that it is drought-tolerant, high in protein, does not cause bloat
in cattle, and its tannins can inactivate ergotamine toxicity when sainfoin and tall fescue
are consumed together by ruminants. However, in this study, sainfoin forage yield was
decreased during the latter stages of the finishing period. Thus, more information is
needed regarding rate of weight gain and other production factors for cattle finished on
sainfoin pastures compared to alfalfa.
References Andrés, A.I., Cava, R. & Ruiz, J. (2002). Monitoring volatile compounds during dry-
cured ham ripening by solid-phase microextraction coupled to a new direct-
extraction device. Journal of Chromatography A, 963:1-2, 83-88.
Benzie, I.F. & Strain, J.J. (1996). Ferric reducing ability of plasma (FRAP) as a measure
of antioxidant power: The FRAP assay. Analytical Biochemistry, 239, 70-76.
Berdagué, J.L., Denoyer, C., Quere, J.L. & Semon, E. (1991). Volatile components of
dry-cured ham. Journal of Agricultural and Food Chemistry, 39, 1257-1261.
Buege, J.A., & Aust, S.D. (1978). Microsomal lipid peroxidation. Methods Enzymol, 52,
302-310.
Daley, C.A., Abbott, A., Doyle, P.S., Nader, G.A. & Larson, S. (2010). A review of fatty
acid profiles and antioxidant content in grass-fed and grain-fed beef. Nutrition
Journal, 9:10, 1-12.
102
Garcia, C., Berdagué, J.J., Antequera, T., López-Bote, C., Córdoba, J.J. & Ventanas, J.
(1991). Volatile components of dry cured Iberian ham. Food Chemistry, 41:1, 23-
32.
Greene, B.E. & Cumuze, T.H. (1981). Relationship between TBA numbers and
inexperienced panelists’ assessment of oxidized flavor in cooked beef. Journal of
Food Science, 47, 52-58.
John, L., Cornforth, D.P., Carpenter, C.E., Sorheim, O., Pettee, B.C. & Whittier, D.R.
(2005). Color and thiobarbituric acid values of cooked top sirloin steaks packaged
in modified atmospheres of 80% oxygen, or 0.4% carbon monoxide, or vacuum.
Meat Science, 69:3, 441-449.
Lacefield, G.D., Henning, J.C. & Phillips, T.D. (2003). Tall fescue. Cooperative
Extension Publication AGR-59. Lexington, KY: Kentucky Agricultural
Experiment Station, University of Kentucky.
Lindhal, I.L., Davis, R.E., Terttell, R.T., Whilmore, G.E., Shalkop, W.T., Dougherty,
R.W., Thompson, C.R., Van Atta, G.R., Bickoff, E.M., Walter, E.D., Livingstone,
A.G., Guggolz, J., Wilson, R.H., Sideman, M.B. & DeEds, F. (1957). Alfalfa
saponins, studies on their chemical, pharmacological and physiological properties
in relation to ruminant bloat. In USDA Technical Bulletins No. 1161, Washington,
D.C., USA.
Lisonbee, L.D., Villalba, J.J. & Provenza, F.D. (2009). Effects of tannin on selection by
sheep of forages containing alkaloids, tannins and saponins. Journal of the
Science of Food and Agriculture, 89:15, 2668-2677.

103
MacAdam, J.W., Ward, R.E., Griggs, T.C., Min, B.R. & Aiken, G.E. (2011). Case Study:
Average daily gain and blood fatty acid composition of cattle grazing the
nonbloating legumes birdsfoot trefoil and cicer milkvetch in the Mountain West.
Professional Animal Scientist, 27:6, 574-583.
Mancini, R.A., Seyfert, M. & Hunt, M.C. (2008). Effects of data expression, sample
location, and oxygen partial pressure on initial nitric oxide metmyoglobin
formation and metmyoglobin-reducing-activity measurement in beef muscle.
Meat Science, 79:2, 244-51.
Mangan, J.L. (1988). Nutritional effects of tannins in animal feeds. Nutrition research
reviews, 1, 209-232.
Martín, A., Córdoba, J.J., Aranda, E., Córdoba, M.G. & Asensio, M.A. (2006).
Contribution of a selected fungal population to the volatile compounds on dry-
cured ham. Journal of Food Microbiology, 110:1, 8-18.
Maughan, C.A. (2011). Development of a beef flavor lexicon and its application to
compare flavor profiles and consumer acceptance of grain- and pasture- finished
cattle. Unpublished master's thesis. Utah State University, Logan, UT.
Maughan, C., Tansawat, R., Cornforth, D., Ward, R. & Martini. S. (2012). Development
of a beef flavor lexicon and its application to compare the flavor profile and
consumer acceptance of rib steaks from grass- or grain-fed cattle. Meat Science,
90:1, 116-121.

104
Min, B.R., Barry, T.N., Attwood, G.T. & McNabb, W.C. (2003). The effect of condensed
tannins on the nutrition and health of ruminants fed fresh temperate forages: a
review. Animal Feed Science and Technology, 106, 3-19.
O'Fallon, J.V., Busboom, J.R., Nelson, M.L. & Gaskins, C.T. (2007). A direct method for
fatty acid methyl ester synthesis: application to wet meat tissues, oils, and
feedstuffs. Journal of Animal Science, 85:6, 1511-1521.
Owens, J., Provenza, F.D., Wiedmeier, R.D. & Villalba, J.K. (2012). Influence of
saponins and tannins on intake and nutrient digestion of alkaloid-containing
foods. Journal of the Science of Food and Agriculture, In press.
Rogge, W.F., Hildemann, L.M., Marurek, M.A. & Cass, G. (1991). Sources of fine
organic aerosol. 1. Charbroilers and meat cooking operations. Environmental
Science & Technology, 25, 1112-1125.
Schnitzius, J.M., Hill, N.S., Thompson, C.S. & Craig, A.M. (2001). Semiquantitative
determination of ergot alkaloids in seed, straw, and digesta samples using a
competitive enzyme-linked immunosorbent assay. Journal of veterinary
diagnostic investigation, 13:3, 230-237.
Theodoridou, K., Aufrèrea, J., Andueza, D., Pourrat, J., Le Morvan, A., Stringano, E.,
Mueller-Harvey, I. & Baumont. R. 2010. Effects of condensed tannins in fresh
sainfoin (Onobrychis viciifolia) on in vivo and in situ digestion in sheep. Animal
Feed Science and Technology, 160, 23-38.
Vasta, V., Jeronimo, E., Brogna, D.M.R., Dentinho, M.T.P., Biondi, L., Santos-Silva, J.,
Priolo, A. & Bessa, R.J.B. (2010). The effect of grape seed extract or Cistus
105
ladanifer L. on muscle volatile compounds of lambs fed dehydrated lucerne
supplemented with oil. Food Chemistry, 119:4, 1339-1345.
Waghorn, G. (2008). Beneficial and detrimental effects of dietary condensed tannins for
sustainable sheep and goat production – Progress and challenges. Animal Feed
Science and Technology, 147, 116-139.
Williams, S. (1984). Official Methods of Analysis of the Association of Official
Analytical Chemists, 14th edn. Arlington, VA: Association of Official Analytical
Chemists, Inc.

106
CHAPTER 5
METABOLOMIC ANALYSIS OF LAMB MUSCLE AS AFFECTED BY
TANNIN OR SAPONIN SUPPLEMENTED DIET OF ANIMALS INFECTED WITH
RED STOMACH WORM LARVAE (HAEMONCHUS CONTORTUS)1
Abstract
Parasite infection is a major cause for reduced productivity in livestock.
Currently, plant secondary compounds (PSC), especially tannins and saponins, are
increasingly used as chemical feed additives for anti-parasitic properties. However, more
information is needed about how diets drive the genetic machinery and affect the body
chemistry of herbivores. The objective of this study was to evaluate the effects of a diet
containing tannins (T) or a diet containing saponins (S) when given in single ration or as
choice of them (C), on lamb metabolomics profile, using a GC/MS technique, compared
to a plain/control diet (P). There were 40 metabolites detected in total (30 named and 10
unknown). Principal component analysis showed a clear separation of the P, T, and S
treatments, while C diets were separated in to two groups related to the P and S diets,
respectively. Carbohydrate metabolites were mostly increased in the T diet (P < 0.05). T
and S diets significantly reduced C10:0 and C17:0 fatty acids in muscle. Cholesterol
levels were lower (P < 0.05) in the S than T diet. No differences were found among
amino acids metabolites (P > 0.05). Vitamin E and phosphoric acid were higher (P <
0.05) in the P and T diets, respectively. Differences were also detected in other small
molecules such as cresol, isocarbostyril, phthalate, and acetamide.
1 Coauthored by Tansawat, R., Cornforth, D.P. & Ward, R.E.

107
Introduction
Helminth (parasitic worm) infections are a major cause of reduced productivity in
livestock (Githiori et al., 2006). Currently, increasing awareness of hazards associated
with the use of antibiotic and chemical feed additives has accelerated investigations into
plants and their extracts as feed additives (Wallace, 2004). Plant secondary compounds
(PSC), a diverse group of molecules that constitute the plant defense system, are not
required for the primary biochemical pathways of cell growth and reproduction (Wallace,
2004), and are increasingly recognized as important for animal health, welfare, and
nutrition (Villalba et al., 2011). Research has revealed animal acceptability of some PSC
as well as pros and cons of these compounds. The effective dose of PSC depends on their
biochemistry. Forages with low concentrations can be beneficial, but excessive
consumption can detrimentally affect herbivores intake or health. Many of the studies
demonstrated an anti-parasitic effect of PSC in mammals. Tannins and saponins are
classes of PSC that have been identified and used in livestock productivity and health as
alternatives to chemical feed additives (Provenza & Villalba, 2010; Rochfort et al.,
2008).
Tannins are naturally occurring water-soluble plant polyphenols with the
capability to bind and precipitate proteins (Spencer et al., 1988). At appropriate
concentrations, some tannins improve nutrient utilization (Barry et al., 2001), alleviate
bloat (Min & Hart, 2003), and reduce internal parasites (Athanasiadou et al., 2000;
Scalbert, 1991). Tannin-rich plants have attracted most attention for their effect on
internal nematodes in ruminants (Hoste et al., 2006; Nguyen et al., 2005). Condensed

108
tannins extracted from various forages can markedly decrease the viability of the larval
stages of several nematodes in sheep and goats by interfering with parasite egg hatching
and development to infective stage larvae (Brunet & Hoste, 2006; Min & Hart, 2003).
Saponins are a class of PSC found in natural sources, particularly in some plant
species. Their structure includes one or more hydrophilic glycoside moieties combined
with a lipophilic triterpene derivative (Hostettmann & Manton, 1995). Saponins have
been widely used in animal nutrition to reduce methanogenesis in the rumen (Patra &
Saxena, 2010). Moreover, saponins have pronounced anti-protozoal activity due to their
ability to bond to cholesterol present in protozoa membranes (Makkar et al., 1998), thus
reducing the predation of protozoa on rumen bacteria. Saponin-containing plants were
reported to have toxic effects on protozoa in vitro (Makkar et al., 1998; Newbold et al.,
1997). Also, they were evaluated for effects against rodent nematode L3 (infective larvae;
Fakae et al., 2000) and were suspected to be an active compound against gastrointestinal
parasite nematodes (Ibrahim, 1992) and cestodes (Julien et al., 1985).
A previous study, done by our collaborators (Copani et al., 2012), with use of the
same animals as the present study, verified anti-parasitic properties of tannins and
saponins in lambs by the reduction of faecal egg counts (FEC). Lambs fed with a diet
containing 8% quebracho tannins and 1.5% of saponins from quillaja bark had a
reduction in FEC of 51.6% and 38,8%, respectively, relative to animals receiving a diet
without PSC. However, more information is needed about how diets containing PSC’s
drive genetic machinery and affect body chemistry. This information can be obtained by
the study of metabolomics. Few metabolomic studies have evaluated the effect of PSC
109
consumption in ruminants, especially when they were infected with parasites. Iason &
Villalba (2006) suggested that since foraging choices are limited by the ability of animals
to experience the consequences of their behaviors and associate particular cues in foods
with their specific effects in the body, animals must at least “sample” plants that contain
PSC. Thus, the objective of this study was to evaluate the effects of a diet containing
Quebracho tannins, or a diet containing Quillaja saponaria saponins, when given in
single ration or as choice, on animal metabolomics profiles. Metabolomics analysis was
conducted using GC/MS techniques combined with multivariate data analysis to
distinguish four different diet treatments; 1) control diet, 2) tannin-rich diet, 3) saponin-
rich diet, and 4) choice diet.
Materials and Methods Animal and dietary treatment
The study was conducted at the Utah State University Intermountain Irrigated
Pasture Project farm, at Lewiston, UT, as part of a collaborative project with Dr. Juan
Villalba and Daniela Brogna. Twenty-eight 2-month-old commercial Finn-Columbia-
Polypay-Suffolk crossbred lambs were placed randomly in individual pens and assigned
to four dietary groups (7 animals per treatment) as follows:
1) Control/Plain diet (P) consisted of beet pulp + 1.5% vegetable oil.
2) Tannin-rich diet (T) consisted of P diet + 8% tannins (27 kg beet pulp + 2.4 kg
tannins).
3) Saponin-rich diet (S) consisted of P diet + 1.5% saponins (29 kg beet pulp +
0.45 kg saponins).

110
4) Choice diet (C); animals had free access for a choice of T or S diets. All lambs
had access to fresh potable water and trace mineral salt blocks.
Extracted Quebracho tannins were supplied by Industria Argentina ATO,
UNITAN SAICA, Buenos Aires, Argentina. Saponins were obtained from Sigma
Chemical Co. (St. Louis, MO USA; product no. S-7900), extracted from Quillaja
saponaria bark. Experimental diets were prepared every 2 days in a batch of 30 kg.
Animals were handled according to the following experimental design: at day 0,
lambs were weighed and drenched with a combination of anti-parasitic agents of Pyrantel
Pamoate (Stronid® T) 25 mg/kg + Albendazole (Valbazen®) 7.5 mg/kg; from day 0 to 10,
animals were fed a diet consisting of alfalfa pellets ad libitum and 300 g of rolled barley
per head per day; at day 10, faecal samples of each animal were taken to assess FEC.
From day 10 to day 22 lambs were familiarized with the experimental diets (adaption
period); at day 23 each animal was infected orally with a normal syringe containing 30
ml of water solution with a single dose of 5,000 Haemonchus contortus L3 (third larval
stage); from day 23 to 49, the animals were kept on a diet of ad libitum alfalfa pellets. At
day 49 FEC was assessed again but the level of infestation was inappropriate because the
number of eggs in faeces was lower than the expected level for an infection. Thus,
animals were re-infested again at day 50 by similar procedure but using a higher single
dose of 8,000 Haemonchus contortus L3. After the second larval infestation, animals
were kept on an ad libitum of alfalfa pellets diet until day 73. From day 73 to 85, animals
received the experimental diets. After the experimental period, lambs received ad libitum
alfalfa pellets again until slaughter.

111
Lambs were slaughtered at the USU South Farm abattoir (Wellsville, UT) by
Dick Whittier. After harvest, carcasses were refrigerated at 4°C for 24 h before being
shipped to the meat lab, Department of Nutrition, Dietetics, and Food Sciences at Utah
State University (Logan, UT, USA). The longissimus dorsi muscle was taken,
immediately vacuum-packaged, and frozen at -20 °C until the analysis (~ 4 weeks).
Metabolomics measurements
Metabololites of lamb were analyzed using the method developed by Shakya et
al. (2009), with modification. Lamb muscle samples (~2 g) were snap-frozen in liquid
nitrogen and pulverized with mortar and pestle to preserve the metabolic state. Then 100
mg tissue powder was transferred to a test tube with a screw cap and extracted with 900
µL methanol. Samples were vortexed for 1 min and sonicated in a heated water bath
ultrasonicator set to 70 °C (Fisher Scientific Model FS60, Pittsburgh, PA) for 5 min.
Debris was removed by centrifugation at 5000 g (IEC Multi RF, Thermo Electron
Corporation, Asheville, NC) and the supernatant was then dried in a vacuum oven
(Thermo Electron Corporation, Marietta, OH). After that, samples were re-suspended in
100 µL pyridine containing 20 mg/mL of O-methoxyamine hydrochloride. Tricosane
(C23:0; 5 mg/mL in chloroform) was added as an internal standard. The solution was
vortexed for 1 min and incubated at 30 °C for 1.5 h. Next, a 50 µL of N-methyl-N-
trimethylsilyltrifluoroacetamide (MSTFA) containing 1% trimethylchlorosilane was
added for silylation. The mixture was again vortexed for 1 min and incubated at 37 °C for
30 min. Subsequently, samples were clarified by quick centrifugation and transferred to
100 µL-vial inserts (Agilent Technologies Inc, Santa Clara, CA, catalog no. 5183-2085).

112
Separation was performed by GC/MS (GCMS-QP 2010S, Shimadzu Co., Kyoto,
Japan) with use of an RXI-17SilMS column (35 m x 0.25 mm, film thickness = 0.25 µm).
One microliter of the derivatized sample was injected splitless by an AOC-5000 Auto
Injector (Shimadzu Co., Kyoto, Japan) with a sampling time of 1 min. Inlet temperature
was 270 °C. Helium was used as the carrier gas (1 mL/min). The initial GC oven
temperature program was 60 °C and held for 5 min. Then, temperature was ramped at the
rate of 10 °C/min to final temperature of 300 °C, which was held again for 5 min. The
total program time was 34 min. The GC/MS interface was set at 250 °C, the ion source
temperature being 200 °C. The GC/MS interface was heated at 290 °C. The acquisition
was performed in electron impact mode (70 eV) at the rate of 0.5 s-1, with a mass range of
50-600 m/z. Data files obtained from the GC-MS were exported in the netCDF format.
Peak picking and deconvolution were performed using the public Automated Mass
Spectral Deconvolution and Identification System (AMDIS; version 2.62, 1999-2000)
developed by the National Institute of Standards and Technology (NIST). Deconvoluted
mass spectra were submitted to the online analysis tool Spectconnect
(www.spectconnect.mit.edu) for the systematic detection of possible metabolites that
were conserved across samples. Metabolites resulting from this analysis were identified
by a database search against the NIST Mass Spectral (version 2.0, 2005) and Fiehn
(Agilent Technologies Inc, Santa Clara, CA) libraries, and by comparison with linear
retention indices (LRI). The LRI were established by injection of standard n-alkanes from
7 to 40 carbons (Supelco, Bellefonte, PA). Parent peak intensities were normalized to the

113
surrogate standard in each run prior to statistical analysis. Data were expressed as ratio to
surrogate.
Statistical analysis
The experiment was designed with 4 diet treatments (P, T, S, or C) and
measurements were made on 7 animals per treatment. Individual animals were considered
experimental units. Statistical Analysis Software (SAS) version 9.3 (SAS Institute, Inc.,
Cary, NC) was used for multivariate data analysis. First, principal components analysis
(PCA) was performed using proc factor. All named metabolites were examined by the
PCA. Next, the same metabolites detected with different LRI were pooled together.
Analysis of variance (ANOVA), using a complete randomized design with proc glm to
identify statistically significant differences between diet treatments at the 95% confidence
level. For significance testing, multiple comparisons were calculated by the least
significant different (LSD) test to obtain differences among mean values based on P-
values at α = 0.05.
Results and Discussion
PCA was conducted to examine a possible separation and overview the
metabolomics pattern of the four different diet treatments using all metabolites detected
by the GC/MS technique. Fig. 5-1 shows a plot of the principal component (PC) scores
for the most important PCs (PC1 vs. PC2). The first two PCs account for 42.14% of the
total variation (PC1 = 28.72% and PC2 = 13.42%). The PCA plot shows a clear
separation of P, T, and S treatments. Part of the separation based on the PC1 is not

114
obvious, but fairly distinct between T and C treatments. The PC2 is separating according
to whether lambs received PSC or not. The metabolites with positive coefficients for the
second principal component are from the P diet, whereas metabolites with negative
coefficients are from the T and S diets. The C diet is separated into 2 groups; one group is
related to the P diet and another group is placed close to the S diet. Accordingly, it may
be that the animals showed a preference for saponins over tannins when they had free
access for a choice of T or S diets. This is in an agreement with the previous study by
Copani et al. (2012), using the same animals, which reported that lambs preferred
saponins. Among the C diet treatments, animals ate significantly more saponin-
containing food (58 g/kg) compared to 18 g/kg of tannin-containing food (P < 0.05)
during parasitic infection, even the S diet showed less effect on parasitic lowering activity
than the T diet in this study.
There were 40 metabolites in total detected by GC/MS (30 named and 10
unknown). Thirty metabolites were group together for carbohydrates, lipids, amino acids,
vitamins and minerals, nucleotides, and other small molecules as shown in Table 5-1.
Fifteen out of thirty metabolites were found to be significantly different among diet
treatments (P < 0.05; see more data of graphically statistics in Appendix C).
Carbohydrate metabolites including sugars and sugar alcohols tended to be
significantly higher in tannin-rich diet than other diet treatments. Ribose, fructose,
glucose, as well as sorbitol were highest in T (P < 0.05). It could possibly be explained
by the structure of condensed tannins (CT). According to their structure as shown in
Chapter 2 (Fig. 2-1), there are more hydroxy groups (-OH) in CT structures as compared
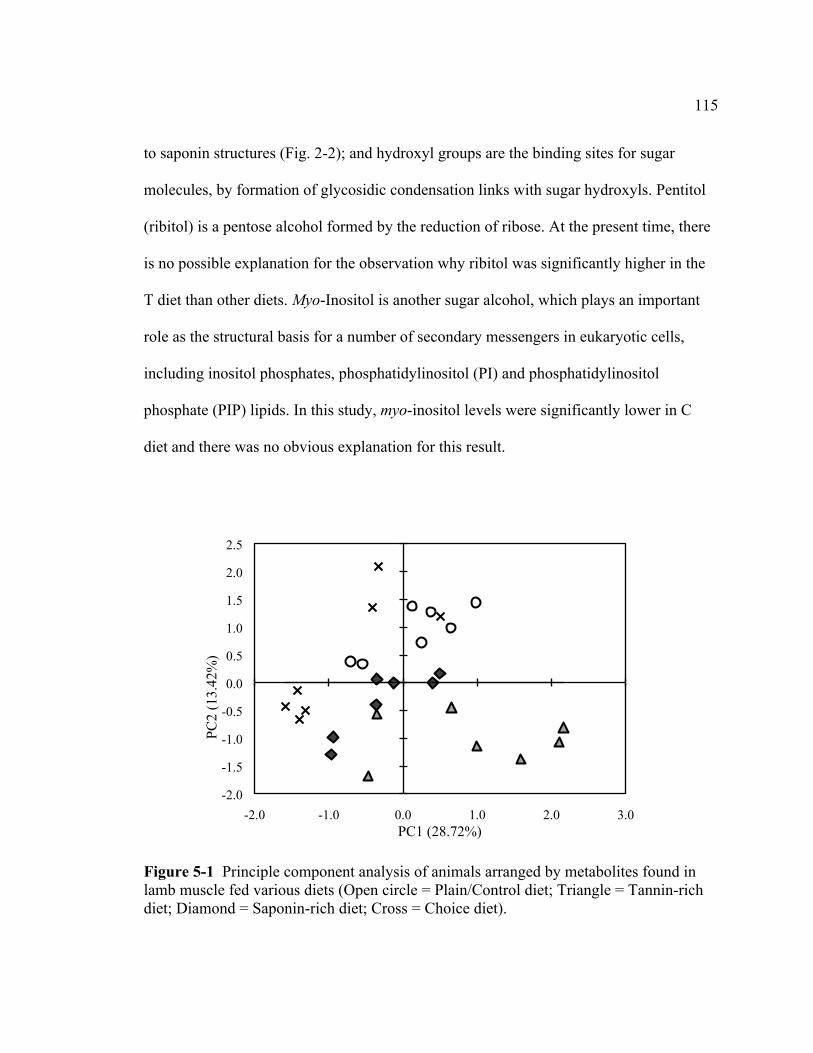
115
to saponin structures (Fig. 2-2); and hydroxyl groups are the binding sites for sugar
molecules, by formation of glycosidic condensation links with sugar hydroxyls. Pentitol
(ribitol) is a pentose alcohol formed by the reduction of ribose. At the present time, there
is no possible explanation for the observation why ribitol was significantly higher in the
T diet than other diets. Myo-Inositol is another sugar alcohol, which plays an important
role as the structural basis for a number of secondary messengers in eukaryotic cells,
including inositol phosphates, phosphatidylinositol (PI) and phosphatidylinositol
phosphate (PIP) lipids. In this study, myo-inositol levels were significantly lower in C
diet and there was no obvious explanation for this result.
Figure 5-1 Principle component analysis of animals arranged by metabolites found in lamb muscle fed various diets (Open circle = Plain/Control diet; Triangle = Tannin-rich diet; Diamond = Saponin-rich diet; Cross = Choice diet).
-2.0
-1.5
-1.0
-0.5
0.0
0.5
1.0
1.5
2.0
2.5
-2.0 -1.0 0.0 1.0 2.0 3.0
PC2
(13.
42%
)
PC1 (28.72%)

116
Table 5-1 Metabolites from lamb muscles fed four different diets Ratio to Surrogate Metabolites
P T S C P-value
Carbohydrate Sugar Ribose 0.0029 b 0.0326 a 0.0015 b 0.0019 b <0.01 Fructose 0.3201 ab 0.5797 a 0.1752 b 0.1436 b 0.02 Glucose 3.6080 ab 4.7198 a 2.1202 bc 1.3991 c 0.02 Mannose 0.7645 0.7073 0.4790 0.3366 NS Sorbose 0.0568 0.0774 0.0313 0.0191 NS Galactose 0.2208 0.1408 0.1094 0.1366 NS Sugar Alcohol Sorbitol 0.0177 b 0.0600 a 0.0050 b 0.0025 b 0.01 Pentitol (Ribitol) 0.2534 a 0.1109 b 0.0924 b 0.1094 b 0.03 myo-Inositol 2.7766 a 2.6926 a 2.3029 a 1.1029 b <0.01 Lipid Fatty acid Acetic acid (C2:0) 0.0202 0.0150 0.0172 0.0113 NS Propanoic acid (Propionic, C3:0) 0.0612 0.0458 0.0358 0.0334 NS Butyric acid (Butanoic acid, C4:0) 0.1543 0.1002 0.1137 0.1013 NS Capric acid (Decanoic acid, C10:0) 0.0940 ab 0.0528 b 0.0791 b 0.1226 a 0.02 Lauric acid (Dodecanoic acid, C12:0) 0.0175 0.0173 0.0163 0.0188 NS Palmitic acid (Hexadecanoic acid, C16:0) 0.0855 0.0947 0.1093 0.0970 NS Margaric acid (Heptadecanoic acid, C17:0) 0.0085 b 0.0006 c 0.0026 c 0.0126 a <0.01 Stearic acid (Octadecanoic acid, C18:0) 0.1538 0.1480 0.1603 0.1582 NS Behenic acid (Docosanoic acid, C22:0) 0.0007 a 0.0007 a 0.0008 a 0.0001 b <0.01 Glycerolipid Glycerol 6.4810 4.6089 5.2215 4.5998 NS Sterol Cholesterol 1.7582 ab 1.9482 a 1.6879 b 1.4013 c <0.01 Amino Acid Glycine 0.0065 0.0055 0.0064 0.0064 NS Phenylalanine 0.0013 0.0014 0.0016 0.0013 NS Tryptophan 0.0025 0.0027 0.0029 0.0032 NS Vitamin and Mineral Vitamin Nicotinamide (Vitamin B3) 0.0854 0.0408 0.0723 0.0646 NS Vitamin E 0.0013 a 0.0003 b 0.0005 b 0.0007 ab 0.02 Mineral Phosphoric acid 0.8549 bc 2.7964 a 1.6968 ab 0.1509 c 0.01 Nucleotide Pyrimidine 0.0002 0.0002 0.0004 0.0004 NS Other small molecules Hydroxy toluene (Cresol) 0.0220 b 0.0268 a 0.0273 a 0.0211 b <0.01 Isocarbostyril 0.0012 ab 0.0007 b 0.0014 a 0.0017 a 0.01 Phthalate 0.0495 a 0.0199 b 0.0202 b 0.0589 a <0.01 Acetamide 0.0054 a 0.0029 b 0.0054 a 0.0064 a <0.01
P = Plain/Control diet; T = Tannin-rich diet; S = Saponin-rich diet; C = Choice diet. Values in rows with different letters are significantly different (P < 0.05); NS = Not significant different.
117
Fatty acids in ruminants come from fat or muscle tissues, de novo synthesize in
the body, or absorption from the diet with help of rumen bacteria (bio-hydrogenation).
Oil, and perhaps excess glucose from beet pulp, fed in this study was able to be stored as
fat in the body. Decanoic acid (C10:0), heptadecanoic acid (C17:0), and docosanoic acid
(C22:0) were the fatty acid metabolites found significantly different among diets (P <
0.05). Tannin and saponin diets significantly reduced C10:0 and C17:0 fatty acids in
muscle tissue. Cholesterol levels in muscle were significantly lower in the S diet,
compared to the T diet (1.69 versus 1.95 ratio relative to surrogate). There are a large
number of studies that also reported the cholesterol lowering activity of saponins in
mammals (Guclu-Ustundag & Mazza, 2007; Gurfinkel & Rao, 2003; Kim et al., 2003;
Potter et al., 1993; Sidhu & Oakenfull, 1986). Sidhu & Oakenfull (1986) stated that the
cholesterol-reducing effect was attributed to the ability of saponins to form insoluble
complexes (micelles) with sterols such as cholesterol and bile acids.
There were no differences (P > 0.05) among amino acid metabolites found in
lamb muscle, as affected by diet treatments. For vitamins and minerals, significant
differences were obtained among diet treatments for vitamin E and phosphoric acid.
However, there is no obvious explanation for higher α-tocopherol and phosphoric acid (P
< 0.05) in muscles from lambs fed P and T diets, respectively. However, since both
cholesterol and vitamin E are fat-soluble, perhaps saponins formed mixed micelles with
both cholesterol and vitamin E, causing lower tissue levels of both cholesterol and
vitamin E.

118
Several other small molecules were also detected in lamb muscle. One interesting
marker that was significantly increased (P < 0.05) was hydroxytoluene or cresol from
animals in the T and S diet treatments. Cresol is an aromatic phenolic compound found in
many foods and in wood. Further work is needed to confirm and explain the higher levels
of cresol found in animals fed T and S diets in this study. Isocarbostyril is a plant alkaloid
with reported anti-tumor properties (Evidente & Kornienko, 2009), which was higher (P
< 0.05) in S and C diet treatments. Again, further work is needed to confirm and explain
this observation. Phthalate levels were significantly different among diets. Phthalate is an
environmental contamination metabolite found in plastics and cosmetic products (Hoppin
et al., 2002), and also found in the urine of mammals, including humans (Blount et al.,
2000). No explanation is apparent for the observation that phthalate levels were lower (P
< 0.05) in muscle of animals fed T and S diets in this study. Finally, acetamide
metabolites were found to be significantly different among diets, and were lower in
muscle from lambs fed the T diet. Acetamide was probably a residue of the silylating
reagent MSTFA; but it is discussed here because acetamide is also an anti-helminthic
drug metabolite (Koch et al., 1979). Thus, acetamide was possibly a metabolite of
Albendazole that was applied to the lambs earlier in the experiment.
Conclusions
Metabolomics is a powerful tool to measure many of the low molecular weight,
water-soluble metabolites in the same sample, which is very useful in life sciences. Using
the metabolomics approach, the effects of tannin- and saponin-containing diets versus
control (plain) diet in lamb infected with red stomach worm larvae Haemonchus

119
contortus could be differentiated by the use of GC/MS combined with multivariate data
analysis (PCA). This technique helped us to determine animal feeding behavior, i.e., the
type of diet lambs chose to heal themselves when infected with nematode parasites.
However, further study with use of more than one metabolomics technique is necessary
to verify the results reported here, especially the possible effect of saponins diet to lower
lamb muscle cholesterol levels, compared to animals on the tannins diet.
References Athanasiadou, S., Kyriazakis, I., Jackson, F. & Coop, R.L. (2000). Effects of short-term
exposure to condensed tannins on adult Trichostrongylus colubriformis.
Veterinary Record, 146, 728-732.
Barry, T.N., McNeill, D.M. & McNabb, W.C. (2001). Plant secondary compounds; their
impact on nutritive value and upon animal production. In: Proceedings of the XIX
International Grassland Conference, Pp. 445-452. Sao Paulo, Brazil.
Blount, B.C., Silva, M.J., Caudill, S.P., Needham, L.L., Pirkle, J.L., Sampson, E.J.,
Lucier, G.W., Jackson, R.J. & Brock, J.W. (2000). Levels of seven urinary
phthalate metabolites in a human reference population. Environmental Health
Perspectives, 108:10, 979-982.
Brunet, S. & Hoste, H. (2006). Monomers of condensed tannins affect the larval
exsheathment of parasitic nematodes of ruminants. Journal of Agricultural and
Food Chemistry, 54:20, 7481-7487.

120
Copani, G, Hall, J.O., Miller, J., Priolo, A. & Villalba, J.J. (2012). Plant secondary
compounds as complementary resources: Are they always complementary?
Oecologia, Submitted.
Evidente, A. & Kornienko, A. (2009). Anticancer evaluation of structurally diverse
Amaryllidaceae alkaloids and their synthetic derivatives. Phytochemistry Reviews,
8, 449-459.
Fakae, B.B., Harrison, L.J.S. & Sewell, M.M.H. (2000). The intensity and duration of
primary Heligmosomoides polygyrus infection in TO mice modify acquired
immunity to secondary challenge. Journal of Helminthology, 74, 225-231.
Githiori, J.B., Athanasiadou, S. & Thamsborg, S.M. (2006). Use of plants in novel
approaches for control of gastrointestinal helminths in livestock with emphasis on
small ruminants. Veterinary Parasitology, 139:4, 308-320.
Guclu-Ustundag, O. & Mazza, G. (2007). Saponins: properties, applications and
processing. Critical Reviews in Food Science and Nutrition, 47, 231-258.
Gurfinkel, D.M. & Rao A.V. (2003). Soyasaponins: The relationship between chemical
structure and colon anticarcinogenic activity. Nutrition and Cancer, 47, 24-33.
Hoppin, J.A., Brock, J.W., Davis, B.J. & Baird, D.D. (2002). Reproducibility of urinary
phthalate metabolites in first morning urine samples. Environmental Health
Perspectives, 110:5, 515-518.
Hoste, H., Jackson, F., Athanasiadou, S, Thamsborg, S.M. & Hoskin, S.O. (2006). The
effects of tannin-rich plants on parasitic nematodes in ruminants. Trend in
Parasitology, 22:6, 253-261.
121
Hostettmann, K.A. & Manton, A. (1995). Saponins. In: Chemistry and Pharmacology of
Natural Products. Cambridge, UK: Cambridge University Press.
Iason, G.R. & Villalba J.J. (2006). Behavioral strategies of mammal herbivores against
plant secondary metabolites: the avoidance - tolerance continuum. Journal of
Chemical Ecology, 32, 1115-1132.
Ibrahim, A.M. (1992). Anthelmintic aactivity of some Sudanese anthelmintic plants.
Phytotherapy Research, 6, 155-157.
Julien, J., Gasquet, M., Maillard, C., Balansard, G. & Timon-David, P. (1985). Extracts
of the ivy plant, Hedera helix, and their anthelminthic activity on liver flukes.
Plant Medica, 3, 205-208.
Kim, S.W., Park, S.K., Kang, S.I., Kang, H.C., Oh, H.J., Bae, C.Y. & Bae, D.H. (2003).
Hypocholesterolemic property of Yucca schidigera and Quillaja saponaria
extracts in human body. Archives of Pharmacal Research, 26, 1042-1046.
Koch, R.L., Chrystal, E.J.T., Beaulieu Jr., B.B. & Goldman, P. (1979). Acetamide-a
metabolite of metronidazole formed by the intestinal flora. Biochemical
Pharmacology, 18:24, 3611-3615.
Makkar, H.P.S., Sen, S., Blummel, M. & Becker, K. (1998). Effects of fractions
containing saponins from Yucca schidigera, Quillaja saponaria and Acacia
auriculoformis on rumen fermentation. Journal of Agricultural and Food
Chemistry, 46, 4324-4328.
Min, B.R. & Hart, S.P. (2003). Tannins for suppression of internal parasites. Journal of
Animal Science, 81, E102-E109.

122
Newbold, C.J., El Hassan, S.M., Wang, J., Ortega, M.E. & Wallace, R.J. (1997).
Influence of foliage from African multipurpose trees on activity of rumen
protozoa and bacteria. British Journal of Nutrition, 78, 237-249.
Nguyen, T.M., Binh, D.V. & Orskov, E.R. (2005). Effect of foliages containing
condensed tannins and on gastrointestinal parasites. Animal Feed Science and
Technology, 121, 77-87.
Patra, A.K. & Saxena, J.A. (2010). New perspective on the use of plant secondary
metabolites to inhibit methanogenesis in the rumen. Phytochemistry, 71, 1198-
1222.
Potter, S.M., Jimenez-Flores, R., Pollack, J., Lone, T.A. & Berber-Jimenez, M.D. (1993).
Protein-saponin interaction and its influence on blood lipids. Journal of
Agricultural and Food Chemistry, 41, 1287-1291.
Provenza, F.D. & Villalba, J.J. (2010). The role of natural plant products in modulating
the immune system: An adaptable approach for combating disease in grazing
animals. Small Ruminant Research, 89, 131-139.
Rochfort, S., Parker A.J. & Dunshea F.R. (2008). Review: Plant bioactives for ruminant
health and productivity. Photochemistry, 69, 299-322.
Scalbert, A. (1991). Antimicrobial properties of tannins. Phytochemistry, 30:12, 3875-
3883.
Shakya, A., Cooksey, R., Cox, J.E., Wang, V., McClain, D.A. & Tantin, D. (2009). Oct1
loss of function induces a coordinate metabolic shift that opposes tumorigenicity.
Nature Cell Biology, 11:3, 320-327.

123
Sidhu, G.S. & Oakenfull, D.G. (1986). A mechanism for the hypocholesterolaemic
activity of saponins. British Journal of Nutrition, 55, 643-649.
Spencer, C.M., Cai, Y., Martin, R., Gaffney, S.H., Goulding, P.N., Magnolato, D., Lillcy,
T.H. & Haslam, E. (1988). Polyphenol complexation: Some thoughts and
observations. Phytochemistry, 27, 2397-2409.
Villalba, J.J., Provenza, F.D., Clemensen, A.K., Larsen, R. & Juhnke, J. (2011).
Preference for diverse pastures by sheep in response to intraruminal
administrations of tannins, saponins and alkaloids. Grass and Forage Science, 66,
224-236.
Wallace, R.J. (2004). Antimicrobial properties of plant secondary metabolites.
Proceedings of the Nutrition Society, 63, 621-629.

124
CHAPTER 6
OVERALL SUMMARY
Animal diets affected many chemical characteristics of meat including fat content,
color stability, antioxidant status and resistance to lipid oxidation, fatty acid composition,
volatile profiles, as well as specific metabolites in muscle tissues. In this study, the main
nutritional health benefits of meat obtained from pasture-finished cattle, including grass
or legume-based pastures, was its low fat content. Fatty acid composition of pasture-
finished beef was improved, with higher MUFA and PUFA ratio as compared to
traditional grain-fed beef. But is the pasture-fed beef a good source of PUFA and CLA or
not, when compared to other foods? A new aspect of this study was to evaluate PUFA
and CLA levels of pasture-fed beef compared to salmon. Salmon and other fatty fishes
were found to be very rich PUFA sources. By comparison to salmon, pasture-fed beef is
just a moderate source of omega-3 fatty acids (16.7% compared to 366% of
recommended level ω-3 fatty acids in an 85 g serving). There is no consensus among
nutritionists regarding CLA levels that provide human health benefits. However, one
Finnish case-control epidemiological study reported that a CLA level of 132 mg/d was
associated with reduced breast cancer in postmenopausal women, compared to 126 mg
CLA/d in patients with breast cancer. If 132 mg/d is used as the benchmark CLA level,
then pasture- or grain-fed beef in this study provided only 9.77% and 5.98% of
recommended CLA levels in an 85 g serving, respectively.
Another new and valuable aspect of this research compared to previous studies
was to use principal component analysis to link beef flavor attributes with specific

125
headspace volatile compounds. Six volatiles were higher in the headspace of heated
pasture-fed beef, including dimethyl sulfone, toluene, 3-heptanone, hexadecanoic acid
methyl ester, benzaldehyde, and 2-ethyl-1-hexanol, and they were uniquely associated
with gamey, barny, bitter, and grassy flavors. In terms of retail sales, pasture-finished
beef had a prolonged shelf life (at least 14 d at retail storage conditions) due to resistance
to lipid oxidation, and these results were consistent for many experimental trials.
In the second experiment of this study, no strong differences found between the
two legume diet treatments, sainfoin-tall fescue or alfalfa tall-fescue, in various meat
characteristics (color stability, resistance to browning, resistance to lipid oxidation and
antioxidation status, fatty acid composition, and headspace volatile profiles). Nonanoic
and decanoic acids were the only 2 out of 45 compounds different between legume diets.
Thus, meat quality was similar between the two diet treatments indicating that sainfoin-
tall fescue mixtures were comparable to alfalfa-tall fescue mixtures as a pasture-finishing
diet before cattle harvest. However, a contributing factor to the similarity in chemical
characterization and sensory evaluation of rib steaks in this study was an unexpected
problem with live animal grazing management during the finishing period. Animals in
the sainfoin pasture treatment probably did not accumulate as much sainfoin-derived
tannins due to over-grazing of sainfoin in early summer, resulting in less sainfoin
available as forage later in the summer. Therefore, the practical aspects (pasture yield,
growth rate) of finishing cattle on sainfoin versus alfalfa pasture needs further study
before any firm conclusions can be drawn regarding feasibility of finishing cattle on
sainfoin pastures.
126
In the third experiment of this study, forty metabolites (30 named and 10
unknown) were detected by metabolomics analysis with use of a GC/MS technique to
characterize lamb meat as affected by a beet pulp diet containing tannins (T) or saponins
(S) when given in single ration or as choice (C) as compared to a plain/control diet (P).
This is the first study to use metabolomic techniques to evaluate possible dietary effects
on small molecule composition of meat from domestic ruminants. The identified
metabolites consisted of carbohydrates (sugar and sugar alcohols), lipids including
glycerolipids and cholesterol, amino acids, vitamins and phosphoric acid, and other small
molecules such as cresol and phthalate. Fifteen metabolites were found to be significantly
different among diet treatments. Cholesterol levels in muscle were significantly lower in
the S diet, compared to the T diet. Principal component analysis plot clearly showed a
separation pattern of P, T, and S diet treatments. For animals in the C group that had free
access to all diets, P and S diets were preferred while the T diet was avoided.
In summary, the effects of ruminant diets on meat characteristic depended on the
type and concentration of plant secondary compounds (PSC), especially the levels of PSC
contained in the pastures. In feeding experiment 2 (legume pasture-finishing with
sainfoin (tannins) or alfalfa (saponins,) the concentration of PSC’s were apparently not
high enough to affect meat characteristics. However, in experiment 3, where lambs were
confinement-fed a beet pulp diet supplemented with purified tannin and saponin extracts,
meat characteristics were significantly affected. Between experiments 2 and 3, several
factors were different, including species (beef versus lamb), feeding regime (pasture
versus confinement), and analysis methods (metabolomics assay in the lamb confinement

127
feeding study. Hence, further metabolomic studies are recommended for pasture-feeding
trials, to better understand effects of plant secondary compounds on meat characteristics
and quality.

128
APPENDICES
129
APPENDIX A
Statistics for Chapter 3

130
Table A1 Type 3 tests of fixed effects (ANOVA) for Hunter color measurements (Lightness, L*)
Effect Num DF Den DF F Value Pr > F Diet 1 28 53.44 <.0001 Day 6 28 0.43 0.8494 Diet*Day 6 28 0.56 0.7602
Table A2 Type 3 tests of fixed effects (ANOVA) for Hunter color measurements (Redness, a*)
Effect Num DF Den DF F Value Pr > F Diet 1 28 4.43 0.0444 Day 6 28 4.08 0.0046 Diet*Day 6 28 0.56 0.7583
Table A3 Type 3 tests of fixed effects (ANOVA) for Hunter color measurements (Yellowness, b*)
Effect Num DF Den DF F Value Pr > F Diet 1 28 22.48 <.0001 Day 6 28 2.24 0.0684 Diet*Day 6 28 2.44 0.0504
Table A4 Differences of least squares means for Hunter color measurements (Lightness, L*)
Effect Diet Day Diet Day Estimate SE DF t
Value Pr > |t| Adj Adj P Diet*Day grain 0 pasture 0 7.4467 1.9007 28 3.92 0.0005 Tukey 0.0275
Diet*Day grain 1 pasture 1 3.9467 1.9007 28 2.08 0.0471 Tukey 0.7098
Diet*Day grain 2 pasture 2 6.6900 1.9007 28 3.52 0.0015 Tukey 0.0684
Diet*Day grain 4 pasture 4 4.8333 1.9007 28 2.54 0.0168 Tukey 0.4162
Diet*Day grain 7 pasture 7 4.1400 1.9007 28 2.18 0.0380 Tukey 0.6462
Diet*Day grain 12 pasture 12 5.7900 1.9007 28 3.05 0.0050 Tukey 0.1803
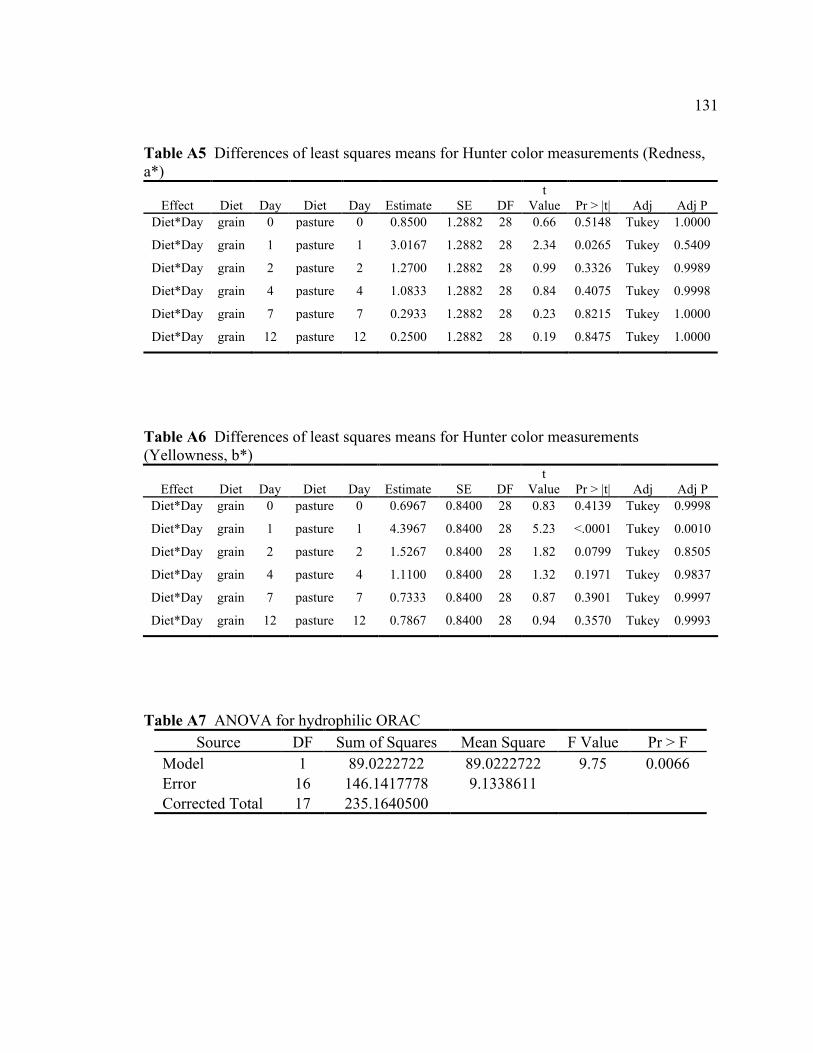
131
Table A5 Differences of least squares means for Hunter color measurements (Redness, a*)
Effect Diet Day Diet Day Estimate SE DF t
Value Pr > |t| Adj Adj P Diet*Day grain 0 pasture 0 0.8500 1.2882 28 0.66 0.5148 Tukey 1.0000
Diet*Day grain 1 pasture 1 3.0167 1.2882 28 2.34 0.0265 Tukey 0.5409
Diet*Day grain 2 pasture 2 1.2700 1.2882 28 0.99 0.3326 Tukey 0.9989
Diet*Day grain 4 pasture 4 1.0833 1.2882 28 0.84 0.4075 Tukey 0.9998
Diet*Day grain 7 pasture 7 0.2933 1.2882 28 0.23 0.8215 Tukey 1.0000
Diet*Day grain 12 pasture 12 0.2500 1.2882 28 0.19 0.8475 Tukey 1.0000
Table A6 Differences of least squares means for Hunter color measurements (Yellowness, b*)
Effect Diet Day Diet Day Estimate SE DF t
Value Pr > |t| Adj Adj P Diet*Day grain 0 pasture 0 0.6967 0.8400 28 0.83 0.4139 Tukey 0.9998
Diet*Day grain 1 pasture 1 4.3967 0.8400 28 5.23 <.0001 Tukey 0.0010
Diet*Day grain 2 pasture 2 1.5267 0.8400 28 1.82 0.0799 Tukey 0.8505
Diet*Day grain 4 pasture 4 1.1100 0.8400 28 1.32 0.1971 Tukey 0.9837
Diet*Day grain 7 pasture 7 0.7333 0.8400 28 0.87 0.3901 Tukey 0.9997
Diet*Day grain 12 pasture 12 0.7867 0.8400 28 0.94 0.3570 Tukey 0.9993
Table A7 ANOVA for hydrophilic ORAC Source DF Sum of Squares Mean Square F Value Pr > F
Model 1 89.0222722 89.0222722 9.75 0.0066 Error 16 146.1417778 9.1338611 Corrected Total 17 235.1640500

132
Table A8 ANOVA for lipophilic ORAC Source DF Sum of Squares Mean Square F Value Pr > F
Model 1 1.596089 1.596089 0.02 0.8785 Error 16 1057.986022 66.124126 Corrected Total 17 1059.582111
Table A9 Type 3 tests of fixed effects (ANOVA) for TBA Effect Num DF Den DF F Value Pr > F
Diet 1 28 53.44 <.0001 Day 6 28 0.43 0.8494 Diet*Day 6 28 0.56 0.7602
Table A10 Differences of least squares means for TBA
Effect Diet Day Diet Day Estimate SE DF t
Value Pr > |t| Adj Adj P Diet*Day grain 0 pasture 0 7.4467 1.9007 28 3.92 0.0005 Tukey 0.0275
Diet*Day grain 12 pasture 12 5.7900 1.9007 28 3.05 0.0050 Tukey 0.1803
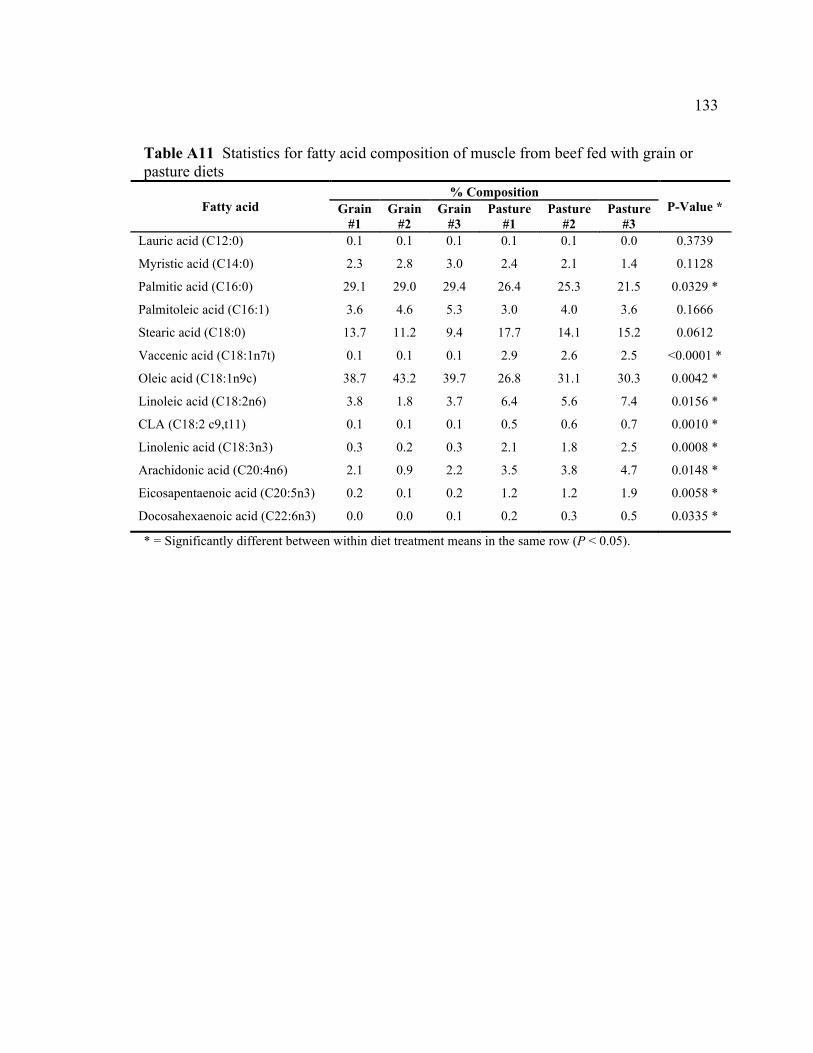
133
Table A11 Statistics for fatty acid composition of muscle from beef fed with grain or pasture diets
% Composition Fatty acid
Grain
#1 Grain
#2 Grain
#3 Pasture
#1 Pasture
#2 Pasture
#3 P-Value *
Lauric acid (C12:0) 0.1 0.1 0.1 0.1 0.1 0.0 0.3739
Myristic acid (C14:0) 2.3 2.8 3.0 2.4 2.1 1.4 0.1128
Palmitic acid (C16:0) 29.1 29.0 29.4 26.4 25.3 21.5 0.0329 *
Palmitoleic acid (C16:1) 3.6 4.6 5.3 3.0 4.0 3.6 0.1666
Stearic acid (C18:0) 13.7 11.2 9.4 17.7 14.1 15.2 0.0612
Vaccenic acid (C18:1n7t) 0.1 0.1 0.1 2.9 2.6 2.5 <0.0001 *
Oleic acid (C18:1n9c) 38.7 43.2 39.7 26.8 31.1 30.3 0.0042 *
Linoleic acid (C18:2n6) 3.8 1.8 3.7 6.4 5.6 7.4 0.0156 *
CLA (C18:2 c9,t11) 0.1 0.1 0.1 0.5 0.6 0.7 0.0010 *
Linolenic acid (C18:3n3) 0.3 0.2 0.3 2.1 1.8 2.5 0.0008 *
Arachidonic acid (C20:4n6) 2.1 0.9 2.2 3.5 3.8 4.7 0.0148 *
Eicosapentaenoic acid (C20:5n3) 0.2 0.1 0.2 1.2 1.2 1.9 0.0058 *
Docosahexaenoic acid (C22:6n3) 0.0 0.0 0.1 0.2 0.3 0.5 0.0335 *
* = Significantly different between within diet treatment means in the same row (P < 0.05).
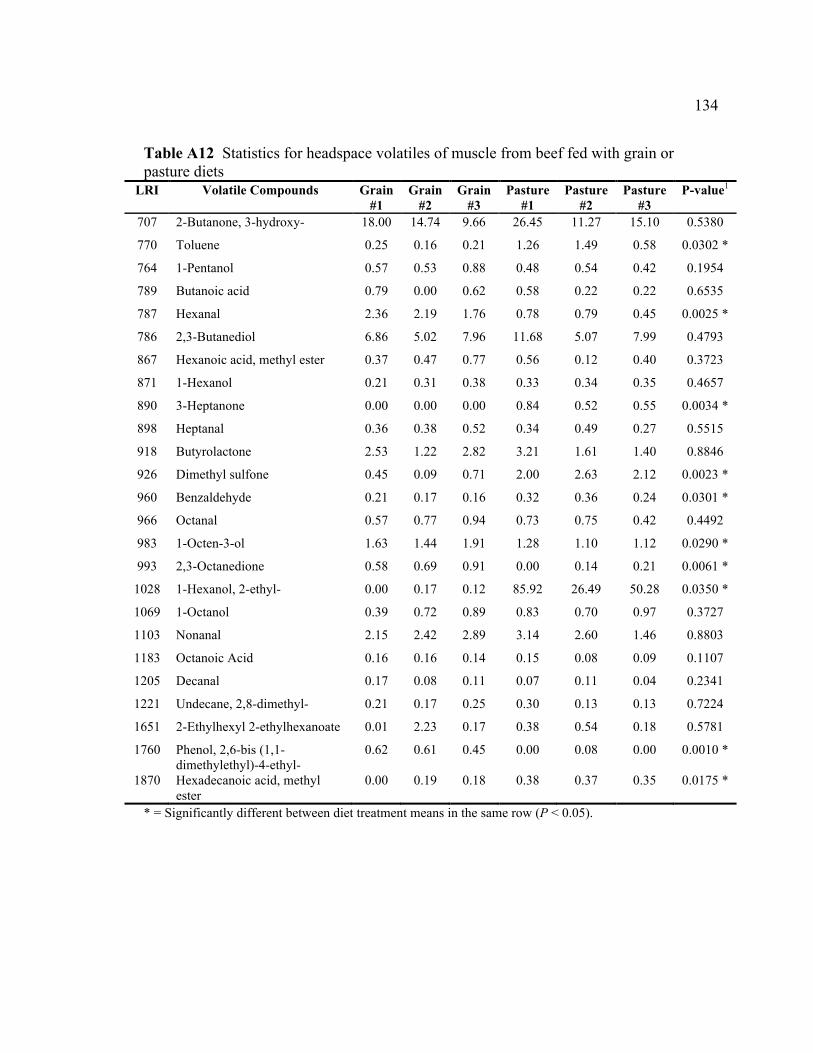
134
Table A12 Statistics for headspace volatiles of muscle from beef fed with grain or pasture diets
LRI
Volatile Compounds
Grain #1
Grain #2
Grain #3
Pasture #1
Pasture #2
Pasture #3
P-value1
707 2-Butanone, 3-hydroxy- 18.00 14.74 9.66 26.45 11.27 15.10 0.5380
770 Toluene 0.25 0.16 0.21 1.26 1.49 0.58 0.0302 *
764 1-Pentanol 0.57 0.53 0.88 0.48 0.54 0.42 0.1954
789 Butanoic acid 0.79 0.00 0.62 0.58 0.22 0.22 0.6535
787 Hexanal 2.36 2.19 1.76 0.78 0.79 0.45 0.0025 *
786 2,3-Butanediol 6.86 5.02 7.96 11.68 5.07 7.99 0.4793
867 Hexanoic acid, methyl ester 0.37 0.47 0.77 0.56 0.12 0.40 0.3723
871 1-Hexanol 0.21 0.31 0.38 0.33 0.34 0.35 0.4657
890 3-Heptanone 0.00 0.00 0.00 0.84 0.52 0.55 0.0034 *
898 Heptanal 0.36 0.38 0.52 0.34 0.49 0.27 0.5515
918 Butyrolactone 2.53 1.22 2.82 3.21 1.61 1.40 0.8846
926 Dimethyl sulfone 0.45 0.09 0.71 2.00 2.63 2.12 0.0023 *
960 Benzaldehyde 0.21 0.17 0.16 0.32 0.36 0.24 0.0301 *
966 Octanal 0.57 0.77 0.94 0.73 0.75 0.42 0.4492
983 1-Octen-3-ol 1.63 1.44 1.91 1.28 1.10 1.12 0.0290 *
993 2,3-Octanedione 0.58 0.69 0.91 0.00 0.14 0.21 0.0061 *
1028 1-Hexanol, 2-ethyl- 0.00 0.17 0.12 85.92 26.49 50.28 0.0350 *
1069 1-Octanol 0.39 0.72 0.89 0.83 0.70 0.97 0.3727
1103 Nonanal 2.15 2.42 2.89 3.14 2.60 1.46 0.8803
1183 Octanoic Acid 0.16 0.16 0.14 0.15 0.08 0.09 0.1107
1205 Decanal 0.17 0.08 0.11 0.07 0.11 0.04 0.2341
1221 Undecane, 2,8-dimethyl- 0.21 0.17 0.25 0.30 0.13 0.13 0.7224
1651 2-Ethylhexyl 2-ethylhexanoate 0.01 2.23 0.17 0.38 0.54 0.18 0.5781
1760
Phenol, 2,6-bis (1,1-dimethylethyl)-4-ethyl-
0.62
0.61
0.45
0.00
0.08
0.00
0.0010 *
1870
Hexadecanoic acid, methyl ester
0.00
0.19
0.18
0.38
0.37
0.35
0.0175 *
* = Significantly different between diet treatment means in the same row (P < 0.05).
135
APPENDIX B
Statistics for Chapter 4

136
Table B1 Type 3 tests of fixed effects (ANOVA) for Hunter color measurements (Lightness, L*)
Effect Num DF Den DF F Value Pr > F Diet 1 70 1.88 0.1748 Day 6 70 4.69 0.0005 Diet*Day 6 70 1.78 0.1161
Table B2 Type 3 tests of fixed effects (ANOVA) for Hunter color measurements (Redness, a*)
Effect Num DF Den DF F Value Pr > F Diet 1 70 1.80 0.1835 Day 6 70 9.22 <.0001 Diet*Day 6 70 0.11 0.9955
Table B3 Type 3 tests of fixed effects (ANOVA) for Hunter color measurements (Yellowness, b*)
Effect Num DF Den DF F Value Pr > F Diet 1 70 10.31 0.0020 Day 6 70 4.56 0.0006 Diet*Day 6 70 0.31 0.9288
Table B4 Differences of least squares means for Hunter color measurements (Lightness, L*)
Effect Diet Day Diet Day Estimate SE DF t
Value Pr > |t| Adj Adj P Diet*Day alfalfa 0 sainfoin 0 5.2667 1.5195 70 3.47 0.0009 Tukey 0.0511
Diet*Day alfalfa 1 sainfoin 1 -0.7067 1.5195 70 -0.47 0.6433 Tukey 1.0000
Diet*Day alfalfa 2 sainfoin 2 0.4883 1.5195 70 0.32 0.7489 Tukey 1.0000
Diet*Day alfalfa 4 sainfoin 4 -0.3917 1.5195 70 -0.26 0.7973 Tukey 1.0000
Diet*Day alfalfa 7 sainfoin 7 0.3283 1.5195 70 0.22 0.8296 Tukey 1.0000
Diet*Day alfalfa 9 sainfoin 9 0.03667 1.5195 70 0.02 0.9808 Tukey 1.0000
Diet*Day alfalfa 12 sainfoin 12 0.4900 1.5195 70 0.32 0.7481 Tukey 1.0000
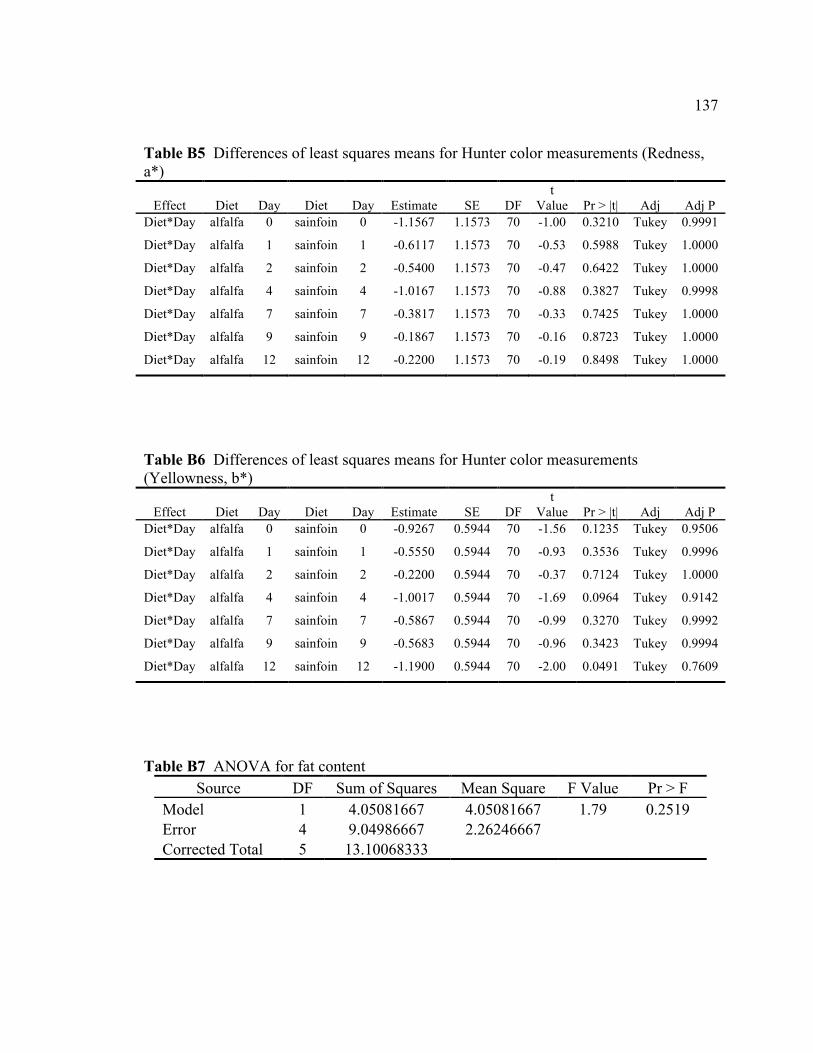
137
Table B5 Differences of least squares means for Hunter color measurements (Redness, a*)
Effect Diet Day Diet Day Estimate SE DF t
Value Pr > |t| Adj Adj P Diet*Day alfalfa 0 sainfoin 0 -1.1567 1.1573 70 -1.00 0.3210 Tukey 0.9991
Diet*Day alfalfa 1 sainfoin 1 -0.6117 1.1573 70 -0.53 0.5988 Tukey 1.0000
Diet*Day alfalfa 2 sainfoin 2 -0.5400 1.1573 70 -0.47 0.6422 Tukey 1.0000
Diet*Day alfalfa 4 sainfoin 4 -1.0167 1.1573 70 -0.88 0.3827 Tukey 0.9998
Diet*Day alfalfa 7 sainfoin 7 -0.3817 1.1573 70 -0.33 0.7425 Tukey 1.0000
Diet*Day alfalfa 9 sainfoin 9 -0.1867 1.1573 70 -0.16 0.8723 Tukey 1.0000
Diet*Day alfalfa 12 sainfoin 12 -0.2200 1.1573 70 -0.19 0.8498 Tukey 1.0000
Table B6 Differences of least squares means for Hunter color measurements (Yellowness, b*)
Effect Diet Day Diet Day Estimate SE DF t
Value Pr > |t| Adj Adj P Diet*Day alfalfa 0 sainfoin 0 -0.9267 0.5944 70 -1.56 0.1235 Tukey 0.9506
Diet*Day alfalfa 1 sainfoin 1 -0.5550 0.5944 70 -0.93 0.3536 Tukey 0.9996
Diet*Day alfalfa 2 sainfoin 2 -0.2200 0.5944 70 -0.37 0.7124 Tukey 1.0000
Diet*Day alfalfa 4 sainfoin 4 -1.0017 0.5944 70 -1.69 0.0964 Tukey 0.9142
Diet*Day alfalfa 7 sainfoin 7 -0.5867 0.5944 70 -0.99 0.3270 Tukey 0.9992
Diet*Day alfalfa 9 sainfoin 9 -0.5683 0.5944 70 -0.96 0.3423 Tukey 0.9994
Diet*Day alfalfa 12 sainfoin 12 -1.1900 0.5944 70 -2.00 0.0491 Tukey 0.7609
Table B7 ANOVA for fat content Source DF Sum of Squares Mean Square F Value Pr > F
Model 1 4.05081667 4.05081667 1.79 0.2519 Error 4 9.04986667 2.26246667 Corrected Total 5 13.10068333
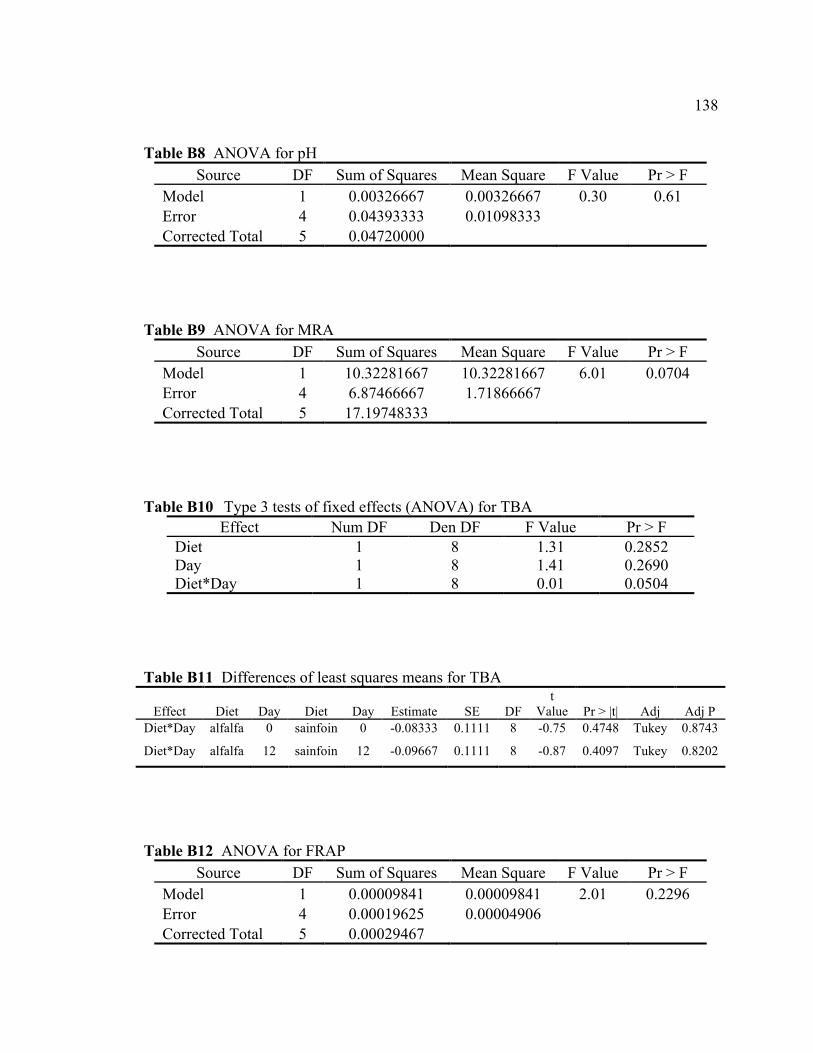
138
Table B8 ANOVA for pH Source DF Sum of Squares Mean Square F Value Pr > F
Model 1 0.00326667 0.00326667 0.30 0.61 Error 4 0.04393333 0.01098333 Corrected Total 5 0.04720000
Table B9 ANOVA for MRA
Source DF Sum of Squares Mean Square F Value Pr > F Model 1 10.32281667 10.32281667 6.01 0.0704 Error 4 6.87466667 1.71866667 Corrected Total 5 17.19748333
Table B10 Type 3 tests of fixed effects (ANOVA) for TBA Effect Num DF Den DF F Value Pr > F
Diet 1 8 1.31 0.2852 Day 1 8 1.41 0.2690 Diet*Day 1 8 0.01 0.0504
Table B11 Differences of least squares means for TBA
Effect Diet Day Diet Day Estimate SE DF t
Value Pr > |t| Adj Adj P Diet*Day alfalfa 0 sainfoin 0 -0.08333 0.1111 8 -0.75 0.4748 Tukey 0.8743
Diet*Day alfalfa 12 sainfoin 12 -0.09667 0.1111 8 -0.87 0.4097 Tukey 0.8202
Table B12 ANOVA for FRAP
Source DF Sum of Squares Mean Square F Value Pr > F Model 1 0.00009841 0.00009841 2.01 0.2296 Error 4 0.00019625 0.00004906 Corrected Total 5 0.00029467
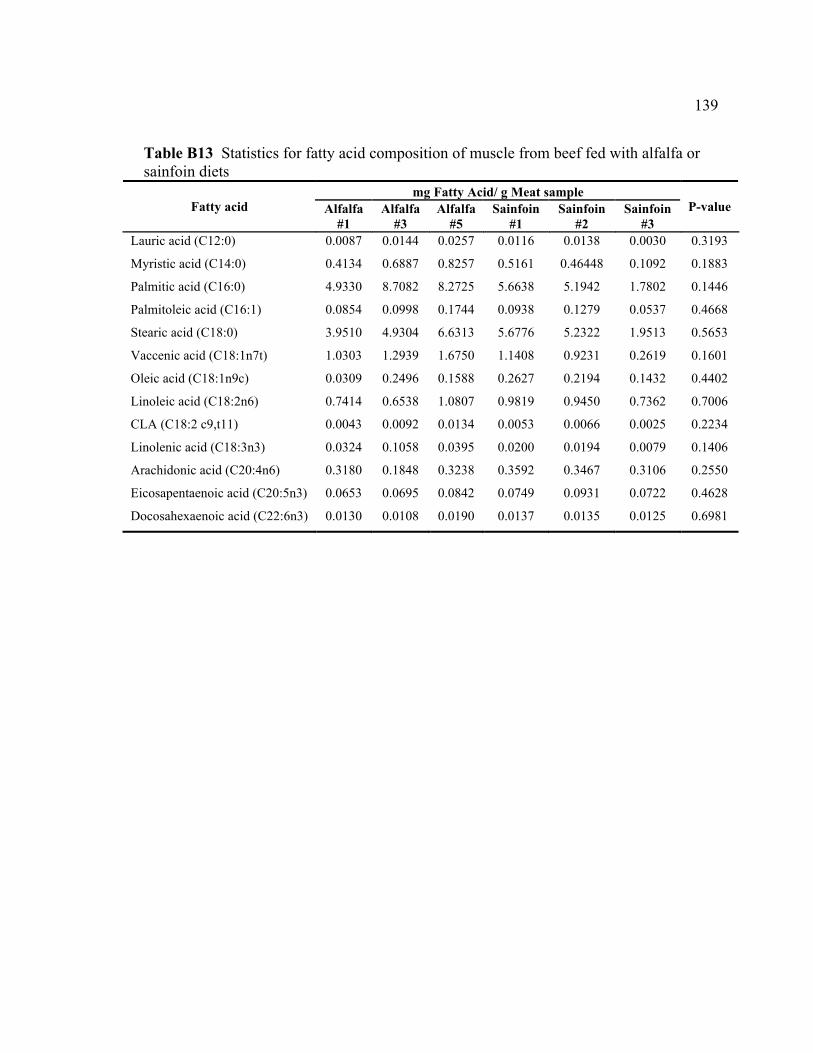
139
Table B13 Statistics for fatty acid composition of muscle from beef fed with alfalfa or sainfoin diets
mg Fatty Acid/ g Meat sample Fatty acid
Alfalfa
#1 Alfalfa
#3 Alfalfa
#5 Sainfoin
#1 Sainfoin
#2 Sainfoin
#3 P-value
Lauric acid (C12:0) 0.0087 0.0144 0.0257 0.0116 0.0138 0.0030 0.3193
Myristic acid (C14:0) 0.4134 0.6887 0.8257 0.5161 0.46448 0.1092 0.1883
Palmitic acid (C16:0) 4.9330 8.7082 8.2725 5.6638 5.1942 1.7802 0.1446
Palmitoleic acid (C16:1) 0.0854 0.0998 0.1744 0.0938 0.1279 0.0537 0.4668
Stearic acid (C18:0) 3.9510 4.9304 6.6313 5.6776 5.2322 1.9513 0.5653
Vaccenic acid (C18:1n7t) 1.0303 1.2939 1.6750 1.1408 0.9231 0.2619 0.1601
Oleic acid (C18:1n9c) 0.0309 0.2496 0.1588 0.2627 0.2194 0.1432 0.4402
Linoleic acid (C18:2n6) 0.7414 0.6538 1.0807 0.9819 0.9450 0.7362 0.7006
CLA (C18:2 c9,t11) 0.0043 0.0092 0.0134 0.0053 0.0066 0.0025 0.2234
Linolenic acid (C18:3n3) 0.0324 0.1058 0.0395 0.0200 0.0194 0.0079 0.1406
Arachidonic acid (C20:4n6) 0.3180 0.1848 0.3238 0.3592 0.3467 0.3106 0.2550
Eicosapentaenoic acid (C20:5n3) 0.0653 0.0695 0.0842 0.0749 0.0931 0.0722 0.4628
Docosahexaenoic acid (C22:6n3) 0.0130 0.0108 0.0190 0.0137 0.0135 0.0125 0.6981

140
* = Significantly different between diet treatment means in the same row (P < 0.05).
Table B14 Statistics for headspace volatiles of muscle from beef fed with alfalfa or sainfoin diets
LRI
Volatile Compounds
Alfalfa #1
Alfalfa #3
Alfalfa #5
Sainfoin #2
Sainfoin #4
Sainfoin #6
P-value
765.6 1-Pentanol 0.40 0.27 0.47 0.35 0.53 0.24 0.95 789.7 Butanoic acid 0.17 0.09 0.12 0.05 0.05 0.08 0.05 792.8 Hexanal 2.94 2.50 4.13 4.22 2.62 1.06 0.62 864.0 1-Hexanol 0.25 0.21 0.36 0.26 0.37 0.12 0.81 885.0 2-Heptanone 0.05 0.03 0.08 0.06 0.09 0.03 0.68 888.6 Cyclohexanone 0.03 0.04 0.02 0.02 0.02 0.03 0.60 897.6 Heptanal 0.87 0.73 0.86 1.19 0.78 0.16 0.72 911.3 Dimethyl sulfone 0.09 0.18 0.12 0.09 0.16 0.06 0.58 916.1 Butyrolactone 0.57 0.45 1.02 0.25 0.37 0.20 0.09 921.4 Hexanoic acid,methyl ester 0.24 0.32 0.51 0.23 0.32 0.16 0.27 938.7 2-Propanol,1-butoxy- 0.08 0.01 0.13 0.16 0.01 0.08 0.90 957.9 Benzaldehyde 1.35 1.25 0.90 1.73 1.63 0.96 0.38 969.2 1-Heptanol 0.15 0.11 0.23 0.16 0.16 0.04 0.44 978.2 1-Octen-3-ol 0.83 0.78 1.30 0.84 1.43 0.49 0.88 982.5 n-Caproic acid vinyl ester 0.20 0.10 0.41 0.20 0.22 0.06 0.51
1001.0 Octanal 1.37 0.93 1.06 1.50 1.18 0.19 0.72 1015.2 4-Cyanocyclohexene 0.46 0.41 0.65 0.44 0.62 0.72 0.46 1027.8 1-Hexanol, 2-ethyl- 0.59 0.19 0.29 0.66 0.18 0.30 0.89 1029.5 Propane,1-(1,1-dimethylethoxy)-2-methyl- 0.50 0.36 0.26 0.82 0.32 0.06 0.91 1041.8 Benzeneacetaldehyde 0.13 0.18 0.13 0.20 0.13 0.18 0.45 1066.4 2-Octen-1-ol 0.09 0.07 0.23 0.07 0.18 0.03 0.59 1069.7 1-Octanol 0.91 0.60 0.73 0.64 0.60 0.26 0.18 1103.1 Nonanal 4.30 3.15 4.22 4.72 4.07 1.07 0.64 1109.4 2-Heptanone,6-methyl- 0.04 0.04 0.10 0.07 0.00 0.04 0.44 1122.0 Octanoic acid, methyl ester 0.08 0.09 0.12 0.07 0.08 0.04 0.12 1167.5 Octanoic Acid 0.17 0.26 0.38 0.11 0.20 0.12 0.13 1205.5 Decanal 0.04 0.07 0.10 0.08 0.10 0.02 0.88 1212.5 Thiophene, 2,5-dihydro- 0.01 0.00 0.05 0.04 0.02 0.12 0.30 1222.0 Nonanoic acid, methyl ester 0.03 0.00 0.02 0.02 0.01 0.02 0.75 1238.0 1-Propanol, 2-(2-hydroxypropoxy)- 1.13 0.38 1.29 3.11 0.19 0.74 0.68 1250.0 Benzene, 1,3-bis(1,1-dimethylethyl)- 0.13 0.16 0.09 0.28 0.09 0.01 0.98 1263.2 Nonanoic acid 0.10 0.12 0.14 0.08 0.04 0.08 0.03 * 1301.4 2-Octanamine 0.02 0.01 0.01 0.01 0.00 0.00 0.10 1360.2 n-Decanoic acid 0.07 0.08 0.12 0.00 0.04 0.00 0.03 * 1374.4 Propanoic acid, 2-methyl-,butyl ester 0.01 0.01 0.00 0.01 0.01 0.01 0.49 1418.7 Acetamidoacetaldehyde 0.01 0.01 0.01 0.01 0.01 0.01 0.78 1505.0 Butylated Hydroxytoluene 0.13 0.09 0.10 0.13 0.12 0.13 0.17 1506.1
Pentanoic acid, 5-hydroxy-, 2,4-di-t-butylphenyl esters
0.01
0.00
0.01
0.01
0.01
0.01
0.51
1586.7 Diethyl Phthalate 0.83 0.55 0.26 0.33 0.24 0.20 0.15 1723.2 Methyl tetradecanoate 0.14 0.06 0.12 0.07 0.06 0.10 0.31 1843.4 2-Hexadecene, 3,7,11,15-tetramethyl- 0.09 0.25 0.18 0.10 0.21 0.14 0.75 1859.6
1,2-Benzenedicarboxylic acid, bis(2-methylpropyl) ester
0.46
0.30
0.09
0.09
0.08
0.07
0.13
1893.5 Homosalate 0.11 0.09 0.12 0.05 0.20 0.18 0.48 1924.3 Hexadecanoic acid, methyl ester 0.59 0.33 0.46 0.28 0.30 0.46 0.30 2095.1 9-Octadecenoic acid, methyl ester 0.28 0.05 0.19 0.12 0.09 0.20 0.65

141
APPENDIX C
Statistics for Chapter 5

142
Ribose Fructose
N
orm
aliz
ed In
tens
ity
Glucose Sorbitol
N
orm
aliz
ed In
tens
ity
Ribitol myo-Inositol
N
orm
aliz
ed In
tens
ity
Figure C1 Box and whisker plots of normalization levels of carbohydrates (sugar and sugar alcohols) of lambs fed different diets. The top and bottom of the box represent the 75th and 25th percentiles. The whiskers indicate the maximum and minimum points. P = Plain/Control diet; T = Tannin-rich diet; S = Saponin-rich diet; C = Choice diet.
1 ANOVA 3
The GLM Procedure
1 ANOVA 3
The GLM Procedure
26
3
0.00
0.02
0.04
0.06
gcms
C P S T
diet
Distribution of gcms
1 ANOVA 3
The GLM Procedure
1 ANOVA 3
The GLM Procedure
0.0
0.2
0.4
0.6
0.8
1.0
metabolite
C P S T
diet
Distribution of metabolite
1 ANOVA 3
The GLM Procedure
1 ANOVA 3
The GLM Procedure
0
2
4
6
metabolite
C P S T
diet
Distribution of metabolite
1 ANOVA 3
The GLM Procedure
1 ANOVA 3
The GLM Procedure
26
0.000
0.025
0.050
0.075
0.100
0.125
metabolite
C P S T
diet
Distribution of metabolite
1 ANOVA 3
The GLM Procedure
1 ANOVA 3
The GLM Procedure
0.0
0.1
0.2
0.3
0.4
metabolite
C P S T
diet
Distribution of metabolite
1 ANOVA 3
The GLM Procedure
1 ANOVA 3
The GLM Procedure
0
1
2
3
4
metabolite
C P S T
diet
Distribution of metabolite

143
Nor
mal
ized
Inte
nsity
C22:0 Cholesterol
N
orm
aliz
ed In
tens
ity
Figure C2 Box and whisker plots of normalization levels of lipids of lambs fed different diets. The top and bottom of the box represent the 75th and 25th percentiles. The whiskers indicate the maximum and minimum points. P = Plain/Control diet; T = Tannin-rich diet; S = Saponin-rich diet; C = Choice diet.
Vitamin E Phosphoric acid
N
orm
aliz
ed In
tens
ity
Figure C3 Box and whisker plots of normalization levels of vitamin and mineral of lambs fed different diets. The top and bottom of the box represent the 75th and 25th percentiles. The whiskers indicate the maximum and minimum points. P = Plain/Control diet; T = Tannin-rich diet; S = Saponin-rich diet; C = Choice diet.
1 ANOVA 3
The GLM Procedure
1 ANOVA 3
The GLM Procedure
0.00
0.05
0.10
0.15
0.20
metabolite
C P S T
diet
Distribution of metabolite
1 ANOVA 3
The GLM Procedure
1 ANOVA 3
The GLM Procedure
12
0.0000
0.0025
0.0050
0.0075
0.0100
0.0125
0.0150
metabolite
C P S T
diet
Distribution of metabolite
1 ANOVA 3
The GLM Procedure
1 ANOVA 3
The GLM Procedure
26
0.0000
0.0002
0.0004
0.0006
0.0008
0.0010
metabolite
C P S T
diet
Distribution of metabolite
1 ANOVA 3
The GLM Procedure
1 ANOVA 3
The GLM Procedure
1.2
1.4
1.6
1.8
2.0
2.2
metabolite
C P S T
diet
Distribution of metabolite
1 ANOVA 3
The GLM Procedure
1 ANOVA 3
The GLM Procedure
0.0000
0.0005
0.0010
0.0015
metabolite
C P S T
diet
Distribution of metabolite
1 ANOVA 3
The GLM Procedure
1 ANOVA 3
The GLM Procedure
0
1
2
3
4
5
metabolite
C P S T
diet
Distribution of metabolite

144
Cresol Isocarbostyril
Nor
mal
ized
Inte
nsity
Phthalate Acetamide
N
orm
aliz
ed In
tens
ity
Figure C4 Box and whisker plots of normalization levels of other small molecules of lambs fed different diets. The top and bottom of the box represent the 75th and 25th percentiles. The whiskers indicate the maximum and minimum points. P = Plain/Control diet; T = Tannin-rich diet; S = Saponin-rich diet; C = Choice diet.
1 ANOVA 3
The GLM Procedure
1 ANOVA 3
The GLM Procedure
0.020
0.022
0.024
0.026
0.028
metabolite
C P S T
diet
Distribution of metabolite
1 ANOVA 3
The GLM Procedure
1 ANOVA 3
The GLM Procedure
0.0000
0.0005
0.0010
0.0015
0.0020
0.0025
metabolite
C P S T
diet
Distribution of metabolite
1 ANOVA 3
The GLM Procedure
1 ANOVA 3
The GLM Procedure
10.02
0.04
0.06
0.08
0.10
metabolite
C P S T
diet
Distribution of metabolite
1 ANOVA 3
The GLM Procedure
1 ANOVA 3
The GLM Procedure
0.000
0.002
0.004
0.006
0.008
metabolite
C P S T
diet
Distribution of metabolite

145
APPENDIX D
Reprint Permissions
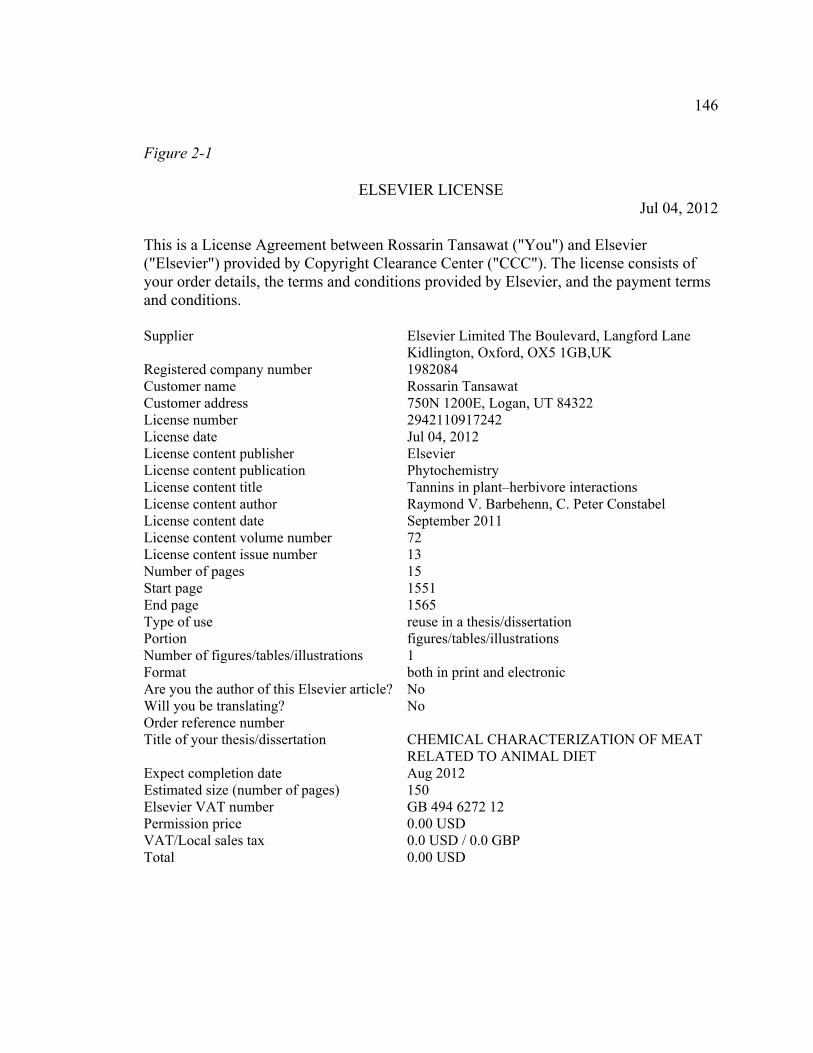
146
Figure 2-1
ELSEVIER LICENSE Jul 04, 2012
This is a License Agreement between Rossarin Tansawat ("You") and Elsevier ("Elsevier") provided by Copyright Clearance Center ("CCC"). The license consists of your order details, the terms and conditions provided by Elsevier, and the payment terms and conditions. Supplier Elsevier Limited The Boulevard, Langford Lane
Kidlington, Oxford, OX5 1GB,UK Registered company number 1982084 Customer name Rossarin Tansawat Customer address 750N 1200E, Logan, UT 84322 License number 2942110917242 License date Jul 04, 2012 License content publisher Elsevier License content publication Phytochemistry License content title Tannins in plant–herbivore interactions License content author Raymond V. Barbehenn, C. Peter Constabel License content date September 2011 License content volume number 72 License content issue number 13 Number of pages 15 Start page 1551 End page 1565 Type of use reuse in a thesis/dissertation Portion figures/tables/illustrations Number of figures/tables/illustrations 1 Format both in print and electronic Are you the author of this Elsevier article? No Will you be translating? No Order reference number Title of your thesis/dissertation CHEMICAL CHARACTERIZATION OF MEAT
RELATED TO ANIMAL DIET Expect completion date Aug 2012 Estimated size (number of pages) 150 Elsevier VAT number GB 494 6272 12 Permission price 0.00 USD VAT/Local sales tax 0.0 USD / 0.0 GBP Total 0.00 USD

147
Figure 2-2
ELSEVIER LICENSE Jul 04, 2012
This is a License Agreement between Rossarin Tansawat ("You") and Elsevier ("Elsevier") provided by Copyright Clearance Center ("CCC"). The license consists of your order details, the terms and conditions provided by Elsevier, and the payment terms and conditions. Supplier Elsevier Limited The Boulevard, Langford Lane
Kidlington, Oxford, OX5 1GB,UK Registered company number 1982084 Customer name Rossarin Tansawat Customer address 750N 1200E, Logan, UT 84322 License number 2942151388696 License date Jul 04, 2012 License content publisher Elsevier License content publication Phytochemistry License content title Metabolic profiling of saponins in Medicago sativa
and Medicago truncatulausing HPLC coupled to an electrospray ion-trap mass spectrometer
License content author David V Huhman, Lloyd W Sumner License content date February 2002 License content volume number 59 License content issue number 3 Number of pages 14 Start page 347 End page 360 Type of use reuse in a thesis/dissertation Intended publisher of new work other Portion figures/tables/illustrations Number of figures/tables/illustrations 1 Format both in print and electronic Are you the author of this Elsevier article? No Will you be translating? No Order reference number Title of your thesis/dissertation CHEMICAL CHARACTERIZATION OF MEAT
RELATED TO ANIMAL DIET Expect completion date Aug 2012 Estimated size (number of pages) 150 Elsevier VAT number GB 494 6272 12 Permission price 0.00 USD VAT/Local sales tax 0.0 USD / 0.0 GBP Total 0.00 USD
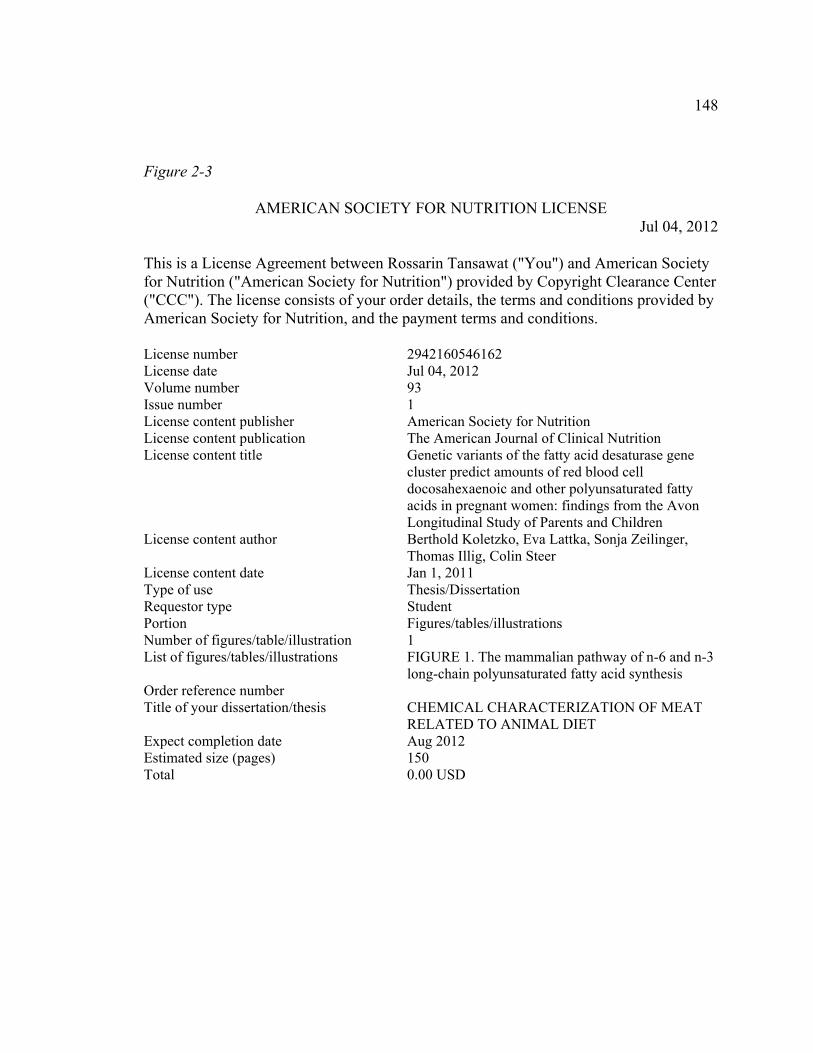
148
Figure 2-3
AMERICAN SOCIETY FOR NUTRITION LICENSE Jul 04, 2012
This is a License Agreement between Rossarin Tansawat ("You") and American Society for Nutrition ("American Society for Nutrition") provided by Copyright Clearance Center ("CCC"). The license consists of your order details, the terms and conditions provided by American Society for Nutrition, and the payment terms and conditions. License number 2942160546162 License date Jul 04, 2012 Volume number 93 Issue number 1 License content publisher American Society for Nutrition License content publication The American Journal of Clinical Nutrition License content title Genetic variants of the fatty acid desaturase gene
cluster predict amounts of red blood cell docosahexaenoic and other polyunsaturated fatty acids in pregnant women: findings from the Avon Longitudinal Study of Parents and Children
License content author Berthold Koletzko, Eva Lattka, Sonja Zeilinger, Thomas Illig, Colin Steer
License content date Jan 1, 2011 Type of use Thesis/Dissertation Requestor type Student Portion Figures/tables/illustrations Number of figures/table/illustration 1 List of figures/tables/illustrations FIGURE 1. The mammalian pathway of n-6 and n-3
long-chain polyunsaturated fatty acid synthesis Order reference number Title of your dissertation/thesis CHEMICAL CHARACTERIZATION OF MEAT
RELATED TO ANIMAL DIET Expect completion date Aug 2012 Estimated size (pages) 150 Total 0.00 USD
149
Figure 2-4 Jul 05, 2012
Dear Dr. Tansawat, Thank you very much for your email and inquiry. Please note that MDPI is a Open Access publisher and under the Creative Commons Attribution License (http://creativecommons.org/licenses/by/3.0/). MDPI does not hold the copyright or the right to re-license the published material. Please note that you should inquire with the original copyright holder (usually the original Publisher or the original authors), if this material can be further re-used. If there are any other questions or suggestions you have, please feel free to let us know. Kind regards, Leo Jiang Editor Nutrients (http://www.mdpi.com/journal/nutrients/)
Creative Commons Attribution 3.0 Unported (CC BY 3.0)
You are free: to Share – to copy, distribution and transmit the work to Remix – to adapt the work to make commercial use of work Under the following conditions: Attribution – You must attribute the work in the manner specified by the author or
licensor (but not in any way that suggests that they endorse you or your use of the work) With the understanding that:
Waiver – Any of the above conditions can be waived if you get permission from the copyright holder. Other Rights – In no way are any of the following rights affected by the license: -‐ Your fair dealing or fair use rights, or other applicable copyright exceptions and
limitations; -‐ The author's moral rights; -‐ Rights other persons may have either in the work itself or in how the work is
used, such as publicity or privacy rights. Notice – For any reuse or distribution, you must make clear to others the license terms of this work. The best way to do this is with a link to this web page.

150
Figure 2-5 Jul 05, 2012
Hi Rossarin, You have my permission to use the figure per your request below. I will be presenting a lecture at the Annual FASS meeting in Phoenix on Developing Research Ideas and Approaches in the Graduate Student Symposium. Stop by and introduce yourself if you get a chance. Best wishes on your Thesis Defense Dale E. Bauman [email protected] Figure 2-7
Jul 08, 2012 Rossarin, You certainly have my permission to use this figure as part of your dissertation. The citation you propose is fine as well. Good luck with the defense. Sincerely, Paul Held PhD Laboratory Manager BioTek Instruments, Inc.

151
Figure 2-9
Copyright Clearance Center Order Date: 07/05/2012 Annual review of genomics and human genetics Order detail ID 62586643 Order license ID 2942731220464 ISSN 1545-293x Publication type e-Journal Publisher ANNUAL REVIEWS Permission status Granted Permission type Republish or display content Type of use Republish in a thesis/dissertation Requestor type Academic institution Format Print, Electronic Portion image/photo Number of images/photos requested 1 Title or numeric reference of the portion(s) de Hoog, C.L. & Mann, M. (2004). Proteomics. In
Annual Review of Genomics and Human Genetics, 5, 267-293. Figure 1 Schematic of the relationship between the different “omics” disciplines in relation to the flow of information from genome through transcript to protein and small molecule. Moving from genomics to proteomics, the complexity increases dramatically whereas the maturity of the technology decreases.
Editor of portion(s) N/A Author of portion(s) de Hoog, C.L. & Mann, M. Volume of serial or monograph 5 Page range of portion C-1 Publication date of portion May 21, 2004 Rights for Main product Duration of use 0-5 years Creation of copies for the disabled no With minor editing privileges no For distribution to Worldwide In the following language(s) Original language of publication With incidental promotional use no Lifetime unit quantity of new product 0 to 499 Made available in the following markets Education The requesting person/organization Rossarin Tansawat/ Utah State University Order reference number Author/Editor Rossarin Tansawat The standard identifier Dissertation
152
The proposed price 0 Title CHEMICAL CHARACTERIZATION OF MEAT
RELATED TO ANIMAL DIET Publisher Utah State University Expected publication date Aug 2012 Estimated size (pages) 150
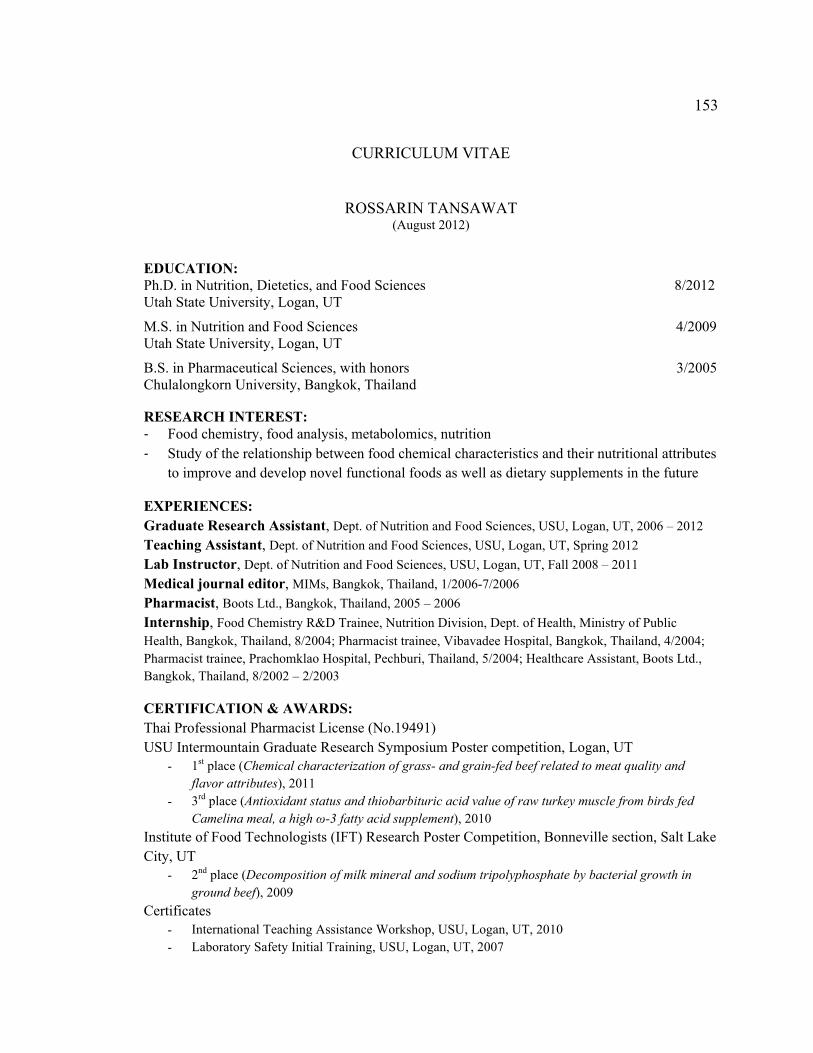
153
CURRICULUM VITAE
ROSSARIN TANSAWAT (August 2012)
EDUCATION: Ph.D. in Nutrition, Dietetics, and Food Sciences 8/2012 Utah State University, Logan, UT
M.S. in Nutrition and Food Sciences 4/2009 Utah State University, Logan, UT
B.S. in Pharmaceutical Sciences, with honors 3/2005 Chulalongkorn University, Bangkok, Thailand RESEARCH INTEREST: -‐ Food chemistry, food analysis, metabolomics, nutrition -‐ Study of the relationship between food chemical characteristics and their nutritional attributes
to improve and develop novel functional foods as well as dietary supplements in the future
EXPERIENCES: Graduate Research Assistant, Dept. of Nutrition and Food Sciences, USU, Logan, UT, 2006 – 2012 Teaching Assistant, Dept. of Nutrition and Food Sciences, USU, Logan, UT, Spring 2012 Lab Instructor, Dept. of Nutrition and Food Sciences, USU, Logan, UT, Fall 2008 – 2011 Medical journal editor, MIMs, Bangkok, Thailand, 1/2006-7/2006 Pharmacist, Boots Ltd., Bangkok, Thailand, 2005 – 2006 Internship, Food Chemistry R&D Trainee, Nutrition Division, Dept. of Health, Ministry of Public Health, Bangkok, Thailand, 8/2004; Pharmacist trainee, Vibavadee Hospital, Bangkok, Thailand, 4/2004; Pharmacist trainee, Prachomklao Hospital, Pechburi, Thailand, 5/2004; Healthcare Assistant, Boots Ltd., Bangkok, Thailand, 8/2002 – 2/2003
CERTIFICATION & AWARDS: Thai Professional Pharmacist License (No.19491) USU Intermountain Graduate Research Symposium Poster competition, Logan, UT
- 1st place (Chemical characterization of grass- and grain-fed beef related to meat quality and flavor attributes), 2011
- 3rd place (Antioxidant status and thiobarbituric acid value of raw turkey muscle from birds fed Camelina meal, a high ω-3 fatty acid supplement), 2010
Institute of Food Technologists (IFT) Research Poster Competition, Bonneville section, Salt Lake City, UT
- 2nd place (Decomposition of milk mineral and sodium tripolyphosphate by bacterial growth in ground beef), 2009
Certificates - International Teaching Assistance Workshop, USU, Logan, UT, 2010 - Laboratory Safety Initial Training, USU, Logan, UT, 2007

154
- Australian National Chemistry Quiz Award, Bangkok, Thailand, 1999 – 2000 Gandhi scholarship recipient ($4,000), USU, Logan, UT, 2008
PUBLICATIONS: Maughan, C., Tansawat, R., Cornforth, D.P., Ward, R.E. & Martini, S. (2012). Development of a beef flavor lexicon
and its application to compare the flavor profile and consumer acceptance of rib steaks from grass- or grain-fed cattle. Meat Science, 90:1, 116-121.
Tansawat, R., Maughan, C., Ward, R.E., Martini, S. & Cornforth, D.P. (2012). Chemical characterization of pasture- and grain-fed beef related to meat quality and flavor attributes. International Journal of Food Science and Technology, Accepted.
Brogna, D.M.R., Tansawat, R., Cornforth, D.P., Ward, R.E., Vasta, M.V., Luciano, G., Priolo, A. & Villalba, J.J. (2012). Effect of beet pulp diet containing tannin or saponin extract offered singly or together (free choice) on lamb meat quality. Journal of Agricultural and Food Chemistry, Submitted.
Maughan, B., Tansawat, R., Maughan, C., Provenza, F.D., Villalbe, J.J., Ward, R.E, & Martini, S. & Cornforth, D.P. (2012). Importance of sainfoin or alfalfa chemical diversity on grazing behavior and meat characteristics. Journal of Animal Science, Submitted.
PRESENTATIONS & ABSTRACTS: Tansawat, R., Ward, R.E., Martini, S. & Cornforth, D.P. (2012). Sainfoin is equivalent to alfalfa as a beef cattle forage.
Intermountain Student Poster Competition, Utah State University, Logan, UT, April 5. Tansawat, R., Ward, R.E., Martini, S. & Cornforth, D.P. (2011). Chemical characterization of grass- and grain-fed beef
related to meat quality and flavor attributes. Reciprocal Meat Conference, American Meat Science Association, Kansas State University, Manhattan, KS, June 19.
Tansawat, R., Ward, R.E., Martini, S. & Cornforth, D.P. (2011). Chemical characterization of grass- and grain-fed beef related to meat quality and flavor attributes. IFT Bonneville Section Suppliers Night Poster Competition, Salt Lake City, UT, April 5.
Tansawat, R., Ward, R.E., Martini, S. & Cornforth, D.P. (2011). Chemical characterization of grass- and grain-fed beef related to meat quality and flavor attributes. Intermountain Student Poster Competition, Utah State University, Logan, UT, March 31. (1st place)
Tansawat, R., Cornforth, D.P., Ward, R.E. & Frame, D.P. (2010). Antioxidant status and thiobarbituric acid value of raw turkey muscle from birds fed Camelina meal, a high ω-3 fatty acid supplement. Institute of Food Technologists National Meeting, Chicago, IL, July 19.
Tansawat, R., Cornforth, D.P., Ward, R.E. & Frame, D.P. (2010). Antioxidant status and thiobarbituric acid value of raw turkey muscle from birds fed Camelina meal, a high ω-3 fatty acid supplement. Intermountain Student Poster Competition, Utah State University, Logan, UT, March 30. (3rd place)
Tansawat, R. & Cornforth, D.P. (2009). Iron binding by milk mineral - A possible antioxidant and anti-microbial mechanism. Reciprocal Meat Conference, American Meat Science Association, University of Arkansas, Rogers, AK, June 23.
Tansawat, R. & Cornforth, D.P. (2009). Decomposition of milk mineral and sodium tripolyphosphate by bacterial growth in ground beef. Institute of Food Technologists National Meeting, Anaheim, CA, June 9.
Tansawat, R. & Cornforth, D.P. (2009). Decomposition of milk mineral and sodium tripolyphosphate by bacterial growth in ground beef. IFT Bonneville Section Suppliers Night Poster Competition, Salt Lake City, UT, April 7. (2nd place)
TECHNICAL SKILLS: Laboratory: GC-MS/GC-FID based analysis, Spectrophotometer, Fluorometer, Aseptic & basic microbial techniques Computer: Microsoft Offices (Excel, Word, PowerPoint), SAS, SPSS Statistics: Experimental design, ANOVA, ANCOVA, General Linear Models, Regression, Factor analysis MEMBERSHIPS & ACTIVITIES: Utah State University (USU) Alumni Association, 2009 – present Institute of Food Technologists (IFT), 2007 – present USU student representative, IFT College Bowl Competition, 2007 – 2009 USU Food Science Club, 2006 – present Thai Pharmacy Council, 2005 – present
Related Documents