CHEMICAL CHARACTERISTICS AND TEMPORAL TRENDS IN EIGHT STREAMS OF THE CATSKILL MOUNTAINS, NEW YORK PETER S. MURDOCH ~and JOHN L. STODDARD 2 t U.S. Geological Survey, Water Resources Division, P.O. Box 1669, Albany, New York I2201, U.S.A. 2 ManTech Enviromental Technology, Inc., U.S. EPA Enviromental Research Laboratory, 200 SW 35th Street, Corvallis, Oregon 97333, U.S.A. (Received August 12, 1991, revised May 19, 1992) Abstract. Discharge to concentration relationships for eight streams studied by the U.S. Geological Survey (USGS) as part of the U.S. Environmental Protection Agency's (U.S. EPA) Long-Term Monitoring Project (1983-89) indicate acidification of some streams by H2SO4 and HNO 3 in atmospheric deposition and by organic acids in soils. Concentrations of major ions in precipitation were similar to those reported at other sites in the northeastern United States. Average concentrations of SO42 and NO3- were similar among streams, but base cation concentrations differed widely, and these differences paralleled the differences in acid neutralizing capacity (ANC). Baseflow ANC is not a reliable predictor of stream acidity at high flow; some streams with high baseflow ANC (> 150 txeq L -~) declined to near zero ANC at high flow, and one stream with low baseflow ANC (< 50 ~eq L -1) did not approach zero ANC as flow increased. Episodic decreases in ANC and pH during peak flows were associated with increased concentrations of NO 3- and dissolved organic carbon (DOC). Aluminum concentrations exceeding 300 ~xg L -~ were observed during peak flows in headwater streams of the Neversink River and Rondout Creek. Seasonal Kendall Tau tests for temporal trends indicate that SO42- concentrations in streamwater generally decreased and NO 3- concentrations increased during the period 1983-1989. Combined acid anion concentrations (SO42- + NO3- ) were generally unchanged throughout the period of record, indicating both that the status of these streams with respect to acidic deposition is unchanged, and that NO 3 is gradually replacing SO42- as the dominant acid anion in the Catskill streams. 1. Introduction The effects of acidic deposition on lake and stream chemistry in the eastern United States have been analyzed extensively (for example, Driscoll and Newton, 1985; Hemond and Eshleman, 1984). Most research has been conducted primarily in specific watersheds and has focused on the mechanisms that control the acidification process (Peters and Murdoch, 1985; Hemond and Eshleman, 1984; Likens et al., 1977). Recently, however, regional surface water surveys have been conducted to assess the extent of the effects documented in the site specific research programs (Haines and Akielaszek, 1983; Arnold et al., 1985; Lynch and Dise, 1985; Linthurst et al., 1986, Kaufmann et al., 1988; Bricker and Rice, 1989). For example, streamwater quality in 56 basins in Shenandoah National Park, Virginia, was shown to be correlated with bedrock type (Lynch and Dise, 1985), and the relative uniformity of stream chemistry among basins with similar bedrock types allowed the prediction of acidity in nearby unmonitored streams from the bedrock type in the watershed. Streams of the Catskill Mountains in southeastern New York are noted for trout fishing; they also feed six reservoirs in the New York City water supply system (Figure 1). Stream chemistry data collected during the fall of 1982 by the U.S. Water, Air, and Soil Pollution 67: 367-395, 1993. 1993 Kluwer Academic Publishers. Printed in the Netherlands.

Welcome message from author
This document is posted to help you gain knowledge. Please leave a comment to let me know what you think about it! Share it to your friends and learn new things together.
Transcript
CHEMICAL CHARACTERISTICS AND TEMPORAL TRENDS IN
EIGHT STREAMS OF THE CATSKILL M O U N T A I N S , NEW YORK
PETER S. M U R D O C H ~ and JOHN L. S T O D D A R D 2
t U.S. Geological Survey, Water Resources Division, P.O. Box 1669, Albany, New York I2201, U.S.A. 2 ManTech Enviromental Technology, Inc., U.S. EPA Enviromental Research Laboratory, 200 S W 35th
Street, Corvallis, Oregon 97333, U.S.A.
(Received August 12, 1991, revised May 19, 1992)
Abstract. Discharge to concentration relationships for eight streams studied by the U.S. Geological Survey (USGS) as part of the U.S. Environmental Protection Agency's (U.S. EPA) Long-Term Monitoring Project (1983-89) indicate acidification of some streams by H2SO 4 and HNO 3 in atmospheric deposition and by organic acids in soils. Concentrations of major ions in precipitation were similar to those reported at other sites in the northeastern United States. Average concentrations of SO42 and NO3- were similar among streams, but base cation concentrations differed widely, and these differences paralleled the differences in acid neutralizing capacity (ANC). Baseflow ANC is not a reliable predictor of stream acidity at high flow; some streams with high baseflow ANC (> 150 txeq L -~) declined to near zero ANC at high flow, and one stream with low baseflow ANC (< 50 ~eq L -1) did not approach zero ANC as flow increased. Episodic decreases in ANC and pH during peak flows were associated with increased concentrations of NO 3- and dissolved organic carbon (DOC). Aluminum concentrations exceeding 300 ~xg L -~ were observed during peak flows in headwater streams of the Neversink River and Rondout Creek. Seasonal Kendall Tau tests for temporal trends indicate that SO42- concentrations in streamwater generally decreased and NO 3- concentrations increased during the period 1983-1989. Combined acid anion concentrations (SO42- + NO3- ) were generally unchanged throughout the period of record, indicating both that the status of these streams with respect to acidic deposition is unchanged, and that NO 3 is gradually replacing SO42- as the dominant acid anion in the Catskill streams.
1. Introduction
The effects of acidic deposition on lake and stream chemistry in the eastern United States have been analyzed extensively (for example, Driscoll and Newton, 1985; Hemond and Eshleman, 1984). Most research has been conducted primarily in specific watersheds and has focused on the mechanisms that control the acidification process (Peters and Murdoch, 1985; Hemond and Eshleman, 1984; Likens et al., 1977). Recently, however, regional surface water surveys have been conducted to assess the extent of the effects documented in the site specific research programs (Haines and Akielaszek, 1983; Arnold et al., 1985; Lynch and Dise, 1985; Linthurst et al., 1986, Kaufmann et al., 1988; Bricker and Rice, 1989). For example, streamwater quality in 56 basins in Shenandoah National Park, Virginia, was shown to be correlated with bedrock type (Lynch and Dise, 1985), and the relative uniformity of stream chemistry among basins with similar bedrock types allowed the prediction of acidity in nearby unmonitored streams from the bedrock type in the watershed.
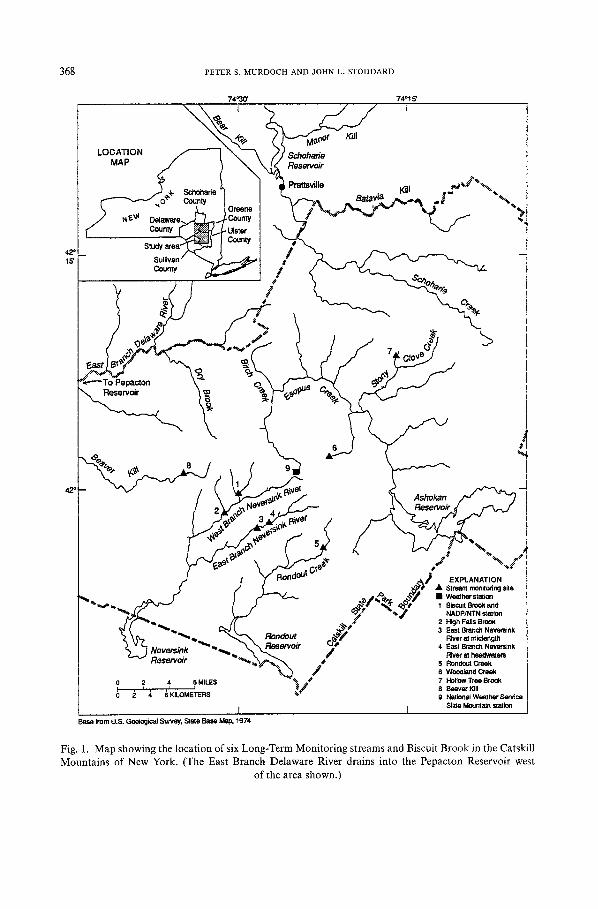
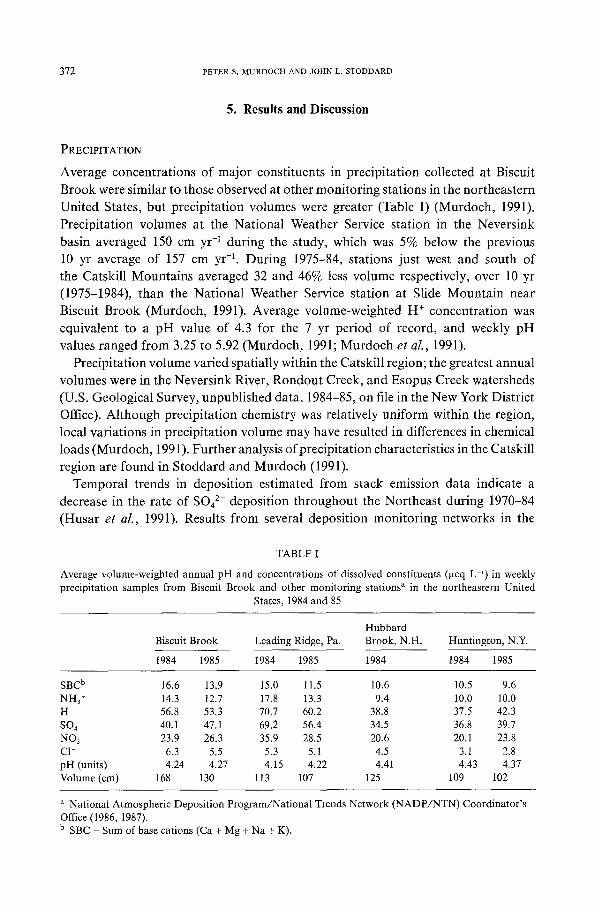
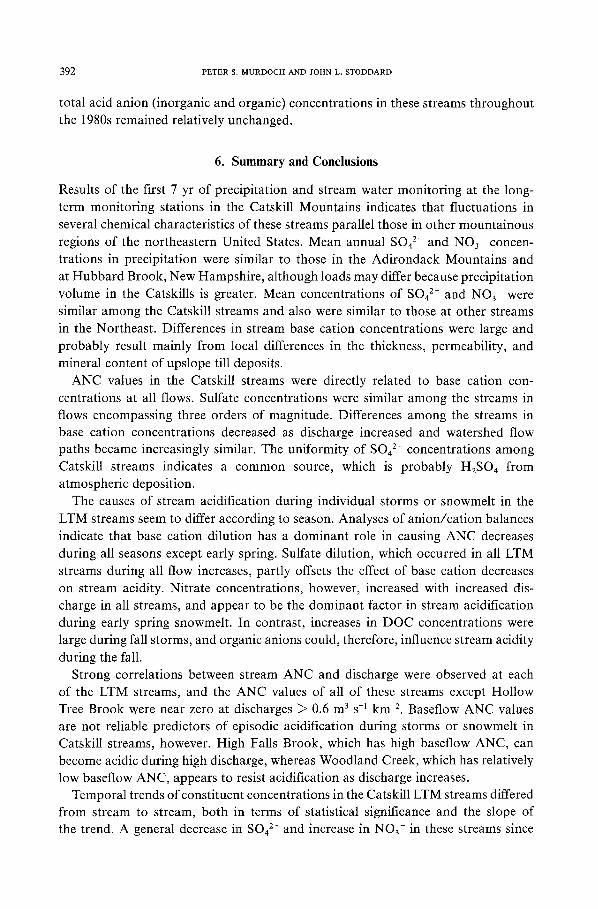
Streams of the Catskill Mountains in southeastern New York are noted for trout fishing; they also feed six reservoirs in the New York City water supply system (Figure 1). Stream chemistry data collected during the fall of 1982 by the U.S.
Water, Air, and Soil Pollution 67: 367-395, 1993. �9 1993 Kluwer Academic Publishers. Printed in the Netherlands.
368 PETER S. M U R D O C H A N D J O H N L. S T O D D A R D
42" 15"
74=30 .
LOCATION ~ ~ " - - ~
., " ~ ~ Greene
r [ ~ t ~ U l s t e f ' ~ ~ [ Coumy
County
74=15'
Reservoir
"~I Prattsville Kill ~'~"#t~'~%'
~ _ BataVia ~,~," *"
1 ~ 1 . i ' . <,,~1 > t i / ' f S ,
4 2 "
%
r
kn"~ ~'~ ' ~ # " I " - / / RondOUL - ,~ [ A ~ '~ EXPLANATION
J :..@# a, Stream monitoring site , . . _ _ r' f , ~ =. . , .%~ _~' = w . = , . . . ~ i o .
~ .~ 2 High Falls Brook # T ~ ' - . . . _ ~.d( ~ , ~ , = , , . = .~ ,~
" ~ Neversink "~.~.. ~ ,~ ,Rese rvo t r %'# 4 Eas tB ranchN~ tnk
# s wo~=. a e e , 0 2 4 8 MILES '~ #' 7 Hollow Tree Brook [ , r l i ~ 8 ~ e t Kill 0 2 4 6 K LOMETERS ~ 9 N~tlenai We~Itler Set.ice
[ [ Slide Mountain stalion
kcse ~'om U.S. Geological Survey, St~e Base Map, 1974
Fig. 1. Map showing the location of six Long-Term Monitoring streams and Biscuit Brook in the Catskill Mountains of New York. (The East Branch Delaware River drains into the Pepacton Reservoir west
of the area shown.)
CHEMISTRY AND TRENDS IN CATSKILL LTM STREAMS 369
Geological Survey (USGS) indicate a wide range of baseflow ANC in Catskill streams; several streams were poorly buffered and thus were sensitive to acidic deposition (ANC = 150 ~eq L-Z). The Catskill area has a relatively uniform bedrock compo- sition; therefore, bedrock type alone could not account for the observed differences in water quality among the streams.
As a continuation of its 1982 monitoring program, the USGS, in cooperation with U.S. EPA, has established the Long-Term Monitoring (LTM) Project at seven
stream monitoring stations in the central Catskill Mountains. The USGS also established a station in the headwaters of the West Branch Neversink River for the continuous monitoring of streamwater quality and discharge at Biscuit Brook. ANC values at base flow in these streams ranged from 220 ixeq L -I to zero. Monitoring included discharge measurements and water quality sampling over a range of flows in each season. This paper describes the status of acidification of Biscuit Brook and the Catskill LTM streams and presents temporal trends in stream acidity during the 1980s. Data used in this paper were collected from August 1983 through June 1990.
2. Physical Setting
The stations are in the headwaters of Esopus Creek (Hollow Tree Brook and Woodland Creek), Rondout Creek, Beaverkill, and the Neversink River (Biscuit Brook, High Falls Brook, and the mid- and upper reaches of the East Branch Neversink River) and drain the highest elevations of the central Catskills. A precipitation monitoring station for the collection of precipitation volume data and weekly weffall chemistry data was established as part of the combined National Atmospheric Deposition Program/National Trends Network (NADP/NTN) in September 1983, in the Biscuit Brook watershed, which is centrally located within the stream network (Figure 1). The watersheds of the eight sampling stations were 100% forested and contained minimal human activity, except the High Falls Brook watershed, where selective logging took place in 25% of the area during 1985-89. Land use in the LTM watersheds did not change during the study.
The Catskill region typically has moderately cool summers and cold winters. Average annual air temperature is 5 ~ Annual precipitation ranges from 90 to 100 cm yr -1 at low elevations in the northern Catskills to 150 to 160 cm yr -1 at high elevations in the central and southern Catskills (Stoddard and Murdoeh, 1991). Snowfall at the Slide Mountain weather station in the headwaters of the Neversink River averages 18% of the total precipitation (17.3 em yr -1 as snow) (National Oceanic and Atmospheric Administration, 1974-85). The region receives precipi- tation from coastal storms, frontal systems from the west, and local thunderstorms. Heavy dew is common during the summer.
All streams in the region are underlain by Devonian bedrock that consists of flat-lying, interbedded sandstones, shales, and conglomerates that were deposited as a massive westward flowing delta (Rich, 1934). The bedrock is a moderate to

370 PETER S. M U R D O C H A N D J O H N L. S T O D D A R D
poor aquifer and is relatively unreactive chemically (Parker et al., 1964). The bedrock consists primarily of quartz (78% of the detrital fraction); metamorphic rock fragments constitute about 16% of the detrital fraction (Ethridge, 1977). Till from continental and alpine glaciation overlies all basins, but the thickness varies locally. Detailed information on bedrock and surficial geology of the region is given in Murdoch and Barnes (in press) and Stoddard and Murdoch (1991).
Catskill soils are primarily Inceptisols, which have a low SO42- adsorption capacity and moderate to high acidity. Results of recent soil surveys of the Esopus and Schoharie basins suggest a mean soil pH of 4.4 (based on an average H + con- centration) and a moderate to low mean cation exchange capacity of 5.67 meq 100 g-I (Ceraso et al., 1986).
3. Sampling Methods
The discharge and water quality of seven streams representing a range of baseflow ANC values, referred to hereafter as the LTM streams (Figure 1), were measured 9 to 12 times yearly beginning in August 1983. Continuous monitoring of stream discharge and weekly water sampling also began at the same timc at Biscuit Brook. More frequent sampling was done at Biscuit Brook during selected high-flow pe- riods throughout the period of record.
All streams were sampled for major ions, dissolved A1, and DOC concentrations in accordance with the sampling protocol of the National Acid Precipitation Assessment Program (NAPAP) (U.S. Environmental Protection Agency, 1989) and USGS methods for sampling waters of low ionic strength (Murdoch, 1991). Instantaneous dischargc measurements were made with each sampling, in accordance with USGS methods (Rantz, 1982). A detailed discussion of sampling methods for the Catskill LTM project is presented in Murdoch (1991).
Stream water was collected manually in Teflon TM bottles and processed in the field for laboratory analysis. Samples were filtered through 0.1 ~m polycarbonatc filters for all constituents until October 1988, after which samples were filtered through 0.4 ~m polycarbonate filters for major ions and 0.1 ~m polycarbonate filters for A1. Filter-pore size for A1 was changed to 0.2 ~m and for other ions from 0.4 ~m polycarbonate to 0.4 ~m cellulose acetate filters in October 1989 to be consistent with the U.S. EPA Episodic Response Project (ERP), of which the LTM streams were a part. Data collected after October 1989 were not used in the analysis of temporal trends because the cffect of changes in filter pore size on constituent concentrations was unknown. The filter changes made in 1988 (above) were confirmed to have no effect on the results used herein, however (U.S. Geological Survey, 1990, unpublished data; Newell and Morrison, this volume). Samples were analyzed for SO42-, NO3-, and C1- concentrations by ion chromatography, and for base cations (Ca 2§ Mg 2+, Na § and K § by inductively coupled plasma (ICP) and atomic absorption spectrometry (AA) techniques. Aluminum conccntrations were determined by direct coupled plasma and AA techniques, and DOC con-
CHEMISTRY A N D T R E N D S IN CATSKILL LTM STREAMS 371
centration by wet oxidation and infrared spectrometry (Fishman and Friedman, 1985). ANC was measured by Gran plot titration, and pH was measured by a low ionic strength electrode. Specific conductance was measured by a Wheatstone bridge. Weekly precipitation samples were analyzed for pH and specific conductance in the field and shipped to the Illinois State Water Survey Laboratory in Champaign, Illinois, for major ion analysis.
All reported laboratory analyses met U.S. EPA's quality assurance program guidelines, which included analysis of blind audit, duplicate, split, and blank samples throughout the study (U.S. EPA, 1991). Analyses were checked for charge balance and for balance between measured and calculated conductance; samples deviating by more than 10% were reanalyzed. A complete description of quality control procedures and results is presented in U.S. EPA (1991) and Peck et al. (1988).
4. Statistical Methods
Trends in the concentrations of ANC, pH, 8042-, NO~-, and the sum of Ca 2+ + Mg 2+ were detected through a modified Seasonal Kendall Tau (SKT) test (Hirsch et al., 1982). The SKT test is a nonparametric test based on ranks, which avoids restrictions that require the data to be normally distributed and the variances to be homogeneous. Because it is based on ranks, the SKT test is relatively robust with respect to outliers. For the Catskill LTM streams and Biscuit Brook, the SKT test was applied to data grouped by month, then tested for trends within each group. In this way, only observations collected in the same month were compared with one another. The results of tests within groups were then combined to yield an overall trend test. Slopes of the resulting trends were estimated by a slope estimator developed by Sen (1968) and modified to include seasonal effects by Hirsch et
al. (1982). The slope estimator computes differences between all sequential pairs of observations in a given group (month, in this study) for all groups of data and uses the median of these differences as the slope of the trend. The SKT test has been identified as the most powerful nonparametric technique for identifying trends in water quality data (Loftis et al., 1989).
The SKT test has been further modified to account for serial correlation (Hirsch and Slack, 1984) and stream discharge (Alley, 1988). Concentration data for several constituents from the Catskill LTM streams and Biscuit Brook were tested for correlation with various transformations of stream discharg e (Johnson et al., 1969), and if the correlation coefficients were statistically significant (p = 0.05), transformed discharge was added as an exogenous variable to the SKT test, as suggested by Alley (1988). If no equation correlating stream concentration with discharge was significant, the stream concentration alone was used in the SKT test. This SKT test, modified to accommodate serial correlation (Hirsch and Slack, 1984), was used on data from Biscuit Brook, the only site at which serial correlation was significant.
372 PETER S. M U R D O C H A N D J O H N L. S T O D D A R D
5. Results and Discussion
PRECIPITATION
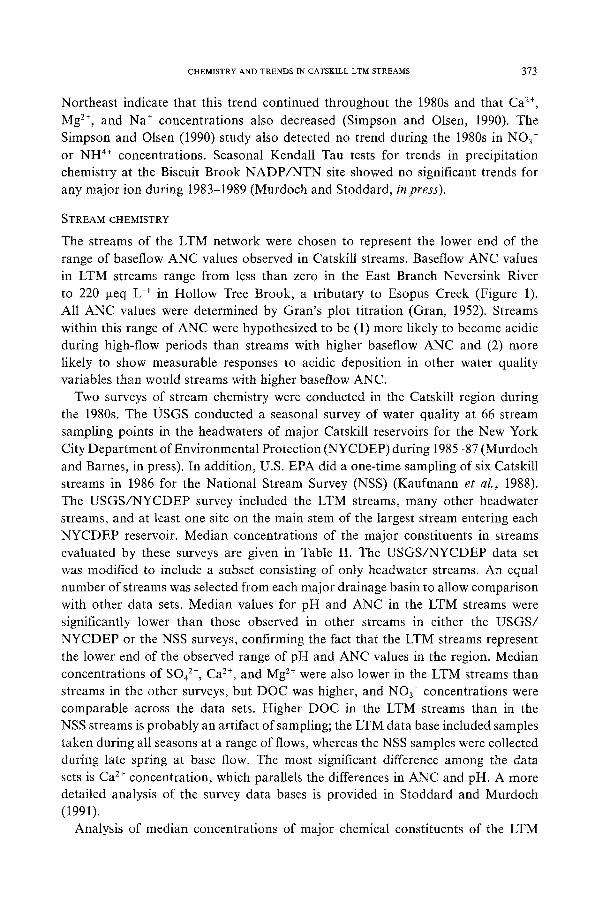
Average concentrations of major constituents in precipitation collected at Biscuit
Brook were similar to those observed at other monitoring stations in the northeastern
United States, but precipitation volumes were greater (Table I) (Murdoch, 1991).
Precipitation volumes at the National Weather Service station in the Neversink
basin averaged 150 cm yr -1 during the study, which was 5% below the previous
10 yr average of 157 cm yr -1. During 1975-84, stations just west and south of the Catskill Mountains averaged 32 and 46% less volume respectively, over 10 yr
(1975-1984), than the National Weather Service station at Slide Mountain near
Biscuit Brook (Murdoch, 1991). Average volume-weighted H § concentration was
equivalent to a pH value of 4.3 for the 7 yr period of record, and weekly pH
values ranged from 3.25 to 5.92 (Murdoch, 1991; Murdoch et al., 1991).
Precipitation volume varied spatially within the Catskill region; the greatest annual
volumes were in the Neversink River, Rondout Creek, and Esopus Creek watersheds
(U.S. Geological Survey, unpublished data, 1984-85, on file in the New York District
Office). Although precipitation chemistry was relatively uniform within the region,
local variations in precipitation volume may have resulted in differences in chemical
loads (Murdoch, 1991). Further analysis of precipitation characteristics in the Catskill
region are found in Stoddard and Murdoch (1991). Temporal trends in deposition estimated from stack emission data indicate a
decrease in the rate of SO42- deposition throughout the Northeast during 1970-84
(Husar et al., 1991). Results from several deposition monitoring networks in the
TABLE I
Average volume-weighted annual pH and concentrations of dissolved constituents (Iseq L z) in weekly precipitation samples from Biscuit Brook and other monitoring stations a in the northeastern United
States, 1984 and 85
Hubbard Biscuit Brook Leading Ridge, Pa. Brook, N.H. Huntington, N.Y.
1984 1985 1984 1985 1984 1984 1985
SBC b 16.6 13.9 15.0 11.5 10.6 10.5 9.6 NH3 § 14.3 12.7 17.8 13.3 9.4 10.0 10.0 H 56.8 53.3 70.7 60.2 38.8 37.5 42.3 SO4 40.1 47.1 69.2 56.4 34.5 36.8 39.7 NO3 23.9 26.3 35.9 28.5 20.6 20.1 23.8 C1- 6.3 5.5 5.3 5.1 4.5 3.1 2.8 pH (units) 4.24 4.27 4.15 4.22 4.41 4.43 4.37 Volume (cm) 168 130 113 107 125 109 102
a National Atmospheric Deposition Program/National Trends Network (NADP/NTN) Coordinator's Office (1986, 1987). b SBC - - Sum of base cations (Ca + Mg + Na + K).
CHEMISTRY AND TRENDS IN CATSKILL LTM STREAMS 373
Northeast indicate that this trend continued throughout the 1980s and that Ca 2+,
Mg 2+, and Na + concentrations also decreased (Simpson and Olsen, 1990). The Simpson and Olsen (1990) study also detected no trend during the 1980s in NO 3-
or NH 4+ concentrations. Seasonal Kendall Tau tests for trends in precipitation chemistry at the Biscuit Brook N A D P / N T N site showed no significant trends for any major ion during 1983-1989 (Murdoch and Stoddard, in press).
S T R E A M c H E M I S T R Y
The streams of the LTM network were chosen to represent the lower end of the range of baseflow ANC values observed in Catskill streams. Baseflow ANC values in LTM streams range from less than zero in the East Branch Neversink River to 220 txeq L -1 in Hollow Tree Brook, a tributary to Esopus Creek (Figure 1). All ANC values were determined by Gran's plot titration (Gran, 1952). Streams within this range of ANC were hypothesized to be (1) more likely to become acidic during high-flow periods than streams with higher baseflow ANC and (2) more likely to show measurable responses to acidic deposition in other water quality variables than would streams with higher baseflow ANC.
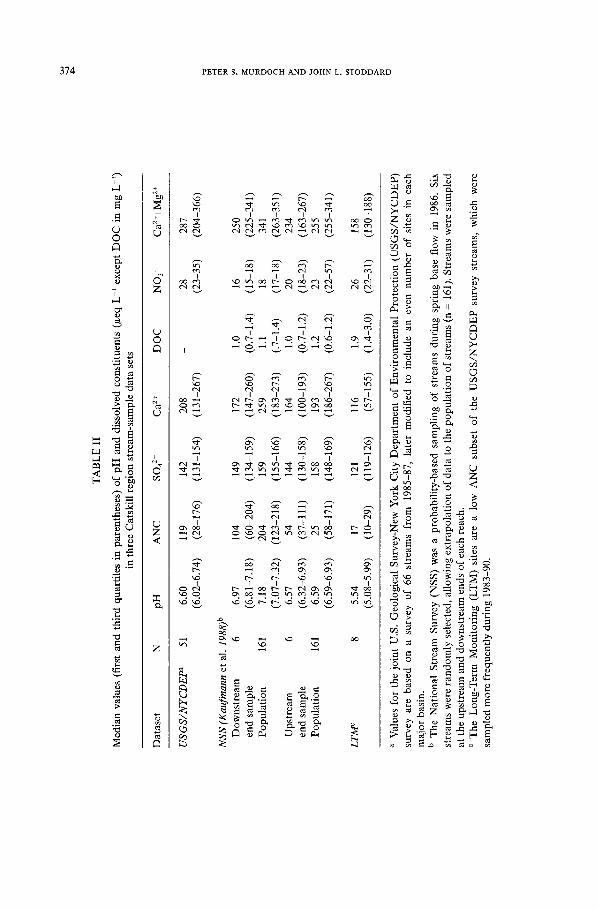
Two surveys of stream chemistry were conducted in the Catskill region during the 1980s. The USGS conducted a seasonal survey of water quality at 66 stream sampling points in the headwaters of major Catskill reservoirs for the New York City Department of Environmental Protection (NYCDEP) during 1985-87 (Murdoch and Barnes, in press). In addition, U.S. EPA did a one-time sampling of six Catskill streams in 1986 for the National Stream Survey (NSS) (Kaufmann et al., 1988). The USGS/NYCDEP survey included the LTM streams, many other headwater streams, and at least one site on the main stem of the largest stream entering each NYCDEP reservoir. Median concentrations of the major constituents in streams evaluated by these surveys are given in Table II. The USGS/NYCDEP data set was modified to include a subset consisting of only headwater streams. An equal number of streams was selected from each major drainage basin to allow comparison with other data sets. Median values for pH and ANC in the LTM streams were significantly lower than those observed in other streams in either the USGS/ NYCDEP or the NSS surveys, confirming the fact that the LTM streams represent the lower end of the observed range of pH and ANC values in the region. Median concentrations of SO42-, Ca 2+, and Mg 2+ were also lower in the LTM streams than streams in the other surveys, but DOC was higher, and NO 3- concentrations were comparable across the data sets. Higher DOC in the LTM streams than in the NSS streams is probably an artifact of sampling; the LTM data base included samples taken during all seasons at a range of flows, whereas the NSS samples were collected during late spring at base flow. The most significant difference among the data sets is Ca 2+ concentration, which parallels the differences in ANC and pH. A more detailed analysis of the survey data bases is provided in Stoddard and Murdoch (1991).
Analysis of median concentrations of major chemical constituents of the LTM
TA
BL
E I
I
Med
ian
valu
es (
firs
t an
d t
hird
qua
rtil
es i
n pa
rent
hese
s) o
f p
H a
nd
dis
solv
ed c
onst
itue
nts
(~eq
L -~
exc
ept
DO
C i
n m
g L
-~)
in t
hree
Cat
skil
l re
gion
str
eam
-sam
ple
data
set
s
Dat
aset
N
p
H
AN
C
SO42
- C
a 2+
DO
C
NO
3-
Ca2
++
Mg
2+
US
GS
/NY
CD
EP
a
51
6.60
11
9 14
2 20
8 -
28
287
(6.0
2-6.
74)
(28-
176)
(1
31-1
54)
(131
-267
) (2
3-35
) (2
04-3
66)
NS
S
(Ka
ufm
an
n e
t al
. 19
88) b
Dow
nstr
eam
6
end
sam
ple
Pop
ulat
ion
161
Ups
trea
m
6 en
d sa
mpl
e P
opul
atio
n 16
1
LT
M c
8
6.97
10
4 14
9 17
2 1.
0 16
25
0 (6
.81-
7.18
) (6
0-20
4)
(134
-159
) (1
47-2
60)
(0.7
-1.4
) (1
5-18
) (2
25-3
41)
7.18
20
4 15
9 25
9 1.
1 18
34
1 (7
.07-
7.32
) (1
23-2
18)
(155
-166
) (1
83-2
73)
(.7-
1.4)
(1
7-18
) (2
63-3
51)
6.57
54
14
4 16
4 1.
0 20
23
4 (6
.32-
6.93
) (3
7-11
1)
(130
-158
) (1
00-1
93)
(0.7
-1.2
) (1
8-23
) (1
63-2
67)
6.59
25
15
8 19
3 1.
2 23
25
5 (6
.59-
6.93
) (5
8-17
1)
(148
-169
) (1
86-2
67)
(0.6
-1.2
) (2
2-57
) (2
55-3
41)
5.54
17
12
1 11
6 1.
9 26
15
8 (5
.08-
5.99
) (1
0-29
) (1
19-1
26)
(57-
155)
(1
.4-3
.0)
(22-
31)
(130
-188
)
a V
alue
s fo
r th
e jo
int
U.S
. G
eolo
gica
l S
urve
y-N
ew Y
ork
Cit
y D
epar
tmen
t o
f E
nvir
onm
enta
l P
rote
ctio
n (U
SG
S/N
YC
DE
P)
surv
ey a
re b
ased
on
a su
rvey
of
66 s
trea
ms
from
19
85-8
7,
late
r m
odif
ied
to i
nclu
de a
n ev
en n
umbe
r o
f si
tes
in e
ach
maj
or b
asin
. b
The
Nat
iona
l S
trea
m S
urve
y (N
SS)
was
a p
roba
bili
ty-b
ased
sam
plin
g o
f st
ream
s du
ring
spr
ing
base
flo
w i
n 19
86.
Six
stre
ams
wer
e ra
ndom
ly s
elec
ted,
all
owin
g ex
trap
olat
ion
of
data
to
the
popu
lati
on o
f st
ream
s (n
= 1
61).
Str
eam
s w
ere
sam
pled
at
the
ups
trea
m a
nd d
owns
trea
m e
nds
of
each
rea
ch.
c T
he L
ong-
Ter
m M
onit
orin
g (L
TM
) si
tes
are
a lo
w A
NC
sub
set
of
the
US
GS
/NY
CD
EP
sur
vey
stre
ams,
whi
ch w
ere
sam
pled
mor
e fr
eque
ntly
dur
ing
1983
-90.
TA
BL
E I
lI
Med
ian
valu
es (
firs
t an
d th
ird
quar
tile
s in
par
enth
eses
) of
dis
solv
ed c
onst
itue
nts
(~eq
L -~
exc
ept
pH i
n un
its
and
DO
C
in m
g L
-s)
in s
trea
mw
ater
sam
ples
fro
m s
even
Cat
skil
l st
ream
s in
the
Lon
g-T
erm
Mon
itor
ing
netw
ork,
198
3-89
Str
eam
a N
pH
A
NC
b 80
42-
Ca 2
+ D
OC
c N
O~
Ca2
++M
g 2+
Hol
low
Tre
e B
rook
81
6.
89
154
152
259
1,0
44.0
33
1 (6
.6-7
.0)
(132
-180
) (1
29-1
44)
(192
-247
) (0
.9-1
.3)
(40-
54)
(313
-368
) H
igh
Fal
ls B
rook
62
6.
76
95.8
13
7 21
8 1.
6 26
.4
267
(6.3
-6.9
) (5
7-13
6)
(131
-144
) (1
30-1
45)
(1.1
-2.6
) (1
9-33
) (2
36-3
00)
Bea
verk
ill
69
6.73
10
7 13
5 23
3 1.
5 30
.0
279
(6.6
-6.9
) (8
0-13
5)
(128
-141
) (8
0-10
0)
(1.3
-2.1
) (2
4-45
) (2
55-2
98)
Woo
dlan
d C
reek
46
6.
36
28
122
115
1.0
35.1
18
8 (6
,3-6
.5)
(24-
36)
(119
-125
) (2
46-2
94)
(0.9
-1.4
) (2
7-45
) (1
77-1
95)
Bis
cuit
Bro
ok
100
6.14
25
.0
137
140
1.8
23.5
19
1 (5
.85-
6.37
) (1
4-34
) (1
31-1
44)
(130
-145
) (1
.4-2
.6)
(16-
34)
(173
-202
) R
ondo
ut C
reek
10
1 5.
34
2.5
124
91
1.2
29.9
14
6 (5
.0-5
.7)
(-2-
10)
(120
-132
) (1
10-1
24)
(1.0
-2.0
) (2
2-42
) (1
26-1
57)
Ea
st B
ranc
h N
ever
sink
H
eadw
ater
s 37
4.
92
7.5
121
69.9
1.
9 27
.4
118
(4.8
-5.0
) (-
16--
2.5)
(1
16-1
29)
(215
-251
) (1
.6-2
.8)
(14-
35)
(109
-132
) M
id-l
engt
h 83
5.
05
-5.0
12
3 75
1.
8 24
.9
127
(4.9
-5.3
) (-
12-0
) (1
17-1
31)
(65-
75)
(1.2
-2.7
) (1
6-31
) (1
18-1
36)
a S
trea
m l
ocat
ions
sho
wn
in F
igur
e 1.
b
Aci
d N
eutr
aliz
ing
Cap
acit
y (A
NC
).
e D
isso
lved
Org
anic
Car
bon
(DO
C).
t/i

376 PETER S. MURDOCH AND JOHN L. STODDARD
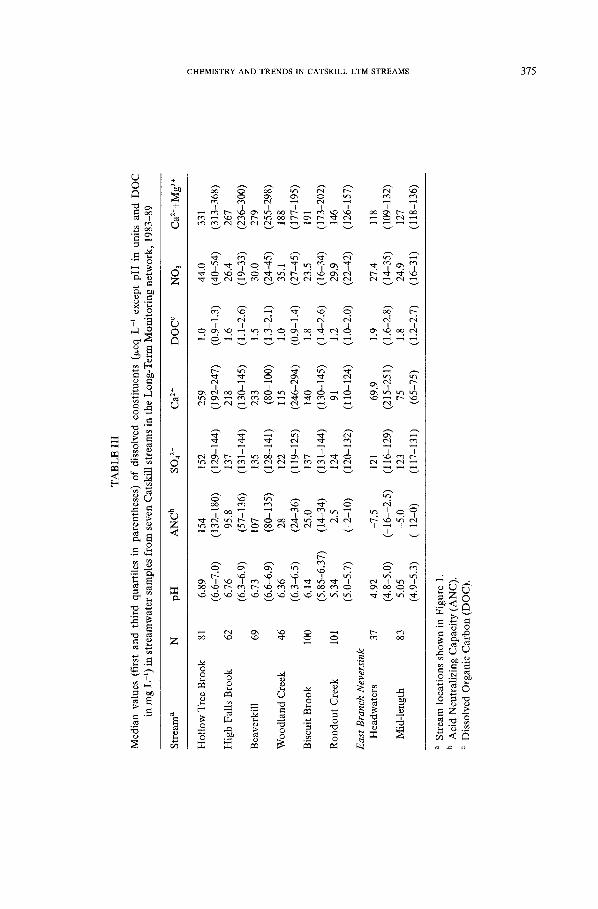
streams (Table III) indicate three major characteristics: 1. Concentrations of Ca 2§ and, to a lesser extent, Mg 2+, differed markedly among
the streams. 2. ANC and pH values differed markedly among the streams and generally followed
the pattern of Ca 2+ concentrations. 3. Concentrations of all other constituents were relatively uniform among the
streams. Calcium and Mg 2+ concentrations were twice as high in the stream with the
highest baseflow ANC concentration (Hollow Tree Brook) as in the stream with the lowest baseflow ANC concentration (East Branch Neversink), but SO42- concentrations in Hollow Tree Brook were only 12% higher. Sodium concentra- tions were low and similar among the LTM streams, which indicates that con- tamination by road salt is not serious at these sites (Murdoch and Barnes, in press). An analysis of variances of mean concentrations indicates that the minor differences in SO42- and NO3- concentrations among the streams are not statistically significant. A similar analysis of Ca 2+, Mg 2+, and ANC concentrations indicates statistically significant differences (p < 0.05). Therefore, differences in stream acidity among the LTM and the regional survey streams are correlated with the differences in the concentration of base cations and not with the differences in mineral acid con- centrations.
S O U R C E S OF A C I D I T Y
Several explanations for the presence of strong acids in streams and lakes of low ionic strength have been presented in the literature since the late 1970s. The major source of strong acids is atmospheric deposition of H2SO4, HNO3, and other S and nitrous oxide compounds (National Research Council, 1983). The roles of several other acidification processes have been discussed, including within-watershed oxi- dation of S and N compounds, the decay of organic materials, and the maturation of forests (Rosenqvist, 1978; Krug and Frink, 1983; Driscoll and Newton, 1986; Aber et al., 1989). For example, increased NO3- concentrations in some streams are theorized to result from a decrease in the rate of biological N uptake relative to deposition as the surrounding forest matures (Aber et al., 1989). Forested land owned by the State of New York, which includes most of the watersheds of the LTM streams, have not been logged since the turn of the century (Kudish, 1985).
These forests are therefore predominantly mature and probably have relatively low rates of N uptake. Results of monitoring stream chemistry in the LTM streams indicate that H2SO4, HNO3, and organic acids all contribute to stream acidity in the Catskills.
Weathering of S bearing minerals in the Catskill region was considered as a possible source of stream SO42- in the LTM streams. Pyrite has been observed in bedrock outcrops several kilometers to the east and south of the study area (Way, 1972). Sulfide distribution within a geologic facies is generally irregular, however, and depends on the distribution of organic materials in the sediment

CHEMISTRY AND TRENDS IN CATSKILL LTM STREAMS 377
L T M s T R E A M S
2 0 0 1 ' ' ' ~ I ' ' ' I ' ~ ' I ' ' ~ i ' ' ~ I ' ' ' t ~ ~ ' I ' ' '
. . . . W o o d l a n d C r e e k
S U L F A T E .~ . . . . . . . . . H o l l o w T r e e B r o o k
: : - - R o n d o u t C r e e k
~. 150 c,}
>< 121 uJ 0 1 0 0
z
Z
~~ t o~ 01 ,
i t -t ........ :!i .................................... ..,.: ......... ".",-.-.- ...... -.:..,--. ...... :
t~ A, "" �9 / " - . i " i " ."'" NITFIATE II "! V ~. .-"'1 ~ .. / 1 % " ' " . . . . . . . . . . . . . . . . . . . . "."Z,;~ . " , ' ~ / , ~ ~ ~ / " " i "! ~ . . . . ~ " ~ ~ ' " " ...... "-. .~ "v "
I l I
200
n-
..%
t.u 1 5 0 Q. 69
<:
,o, 1 0 0
o.9.
. Z
~: 50 IJJ O Z O O
1 9 8 3 1 9 8 4 1 9 8 5 1 9 8 6 1 9 8 7 1 9 8 8 1 9 8 9 1 9 9 0
Fig. 2. Temporal plot of SO42- and NO 3 concentrations (l~eq L -l) in Long-Term Monitoring streams.
3 7 8 P E T E R S. M U R D O C H A N D J O H N L . S T O D D A R D
r
z
B I S C U I T B R O O K
7 - - , , , , , , , , ' ' l ' ' ' ' ' i ' ' ' ' ' / ' ' ' ' ' ' ' ' '
',,! li,,, rr p H
2 0 0 I ~ t t I ' I I I ' '
k u ~ 0 5 Z O O ~ o~ ~
0 ~ ~ ~ I ~ ~ , t ~ r
10 I 1 I I I I l
Q Q 8
z m 6
w l . u
0 1 9 8 4 1 9 8 5 1 9 8 6 1 9 8 7 1 9 8 8 1 9 8 9 1 9 9 0
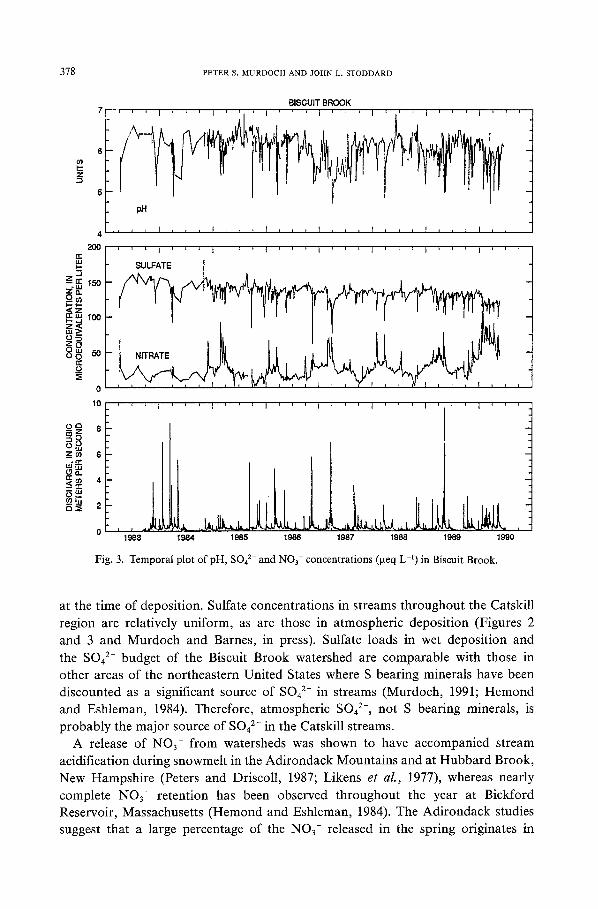
Fig. 3. Temporal plot ofpH, SO4 2- and NO 3- concentrations (l~eq L -~) in Biscuit Brook.
at the time of deposition. Sulfate concentrations in streams throughout the Catskill region are relatively uniform, as are those in atmospheric deposition (Figures 2 and 3 and Murdoch and Barnes, in press). Sulfate loads in wet deposition and the SO42- budget of the Biscuit Brook watershed are comparable with those in other areas of the northeastern United States where S bearing minerals have been discounted as a significant source of SO42- in streams (Murdoch, 1991; Hemond and Eshleman, 1984). Therefore, atmospheric SO42-, not S bearing minerals, is probably the major source of SO42- in the Catskill streams.
A release of NO3- from watersheds was shown to have accompanied stream acidification during snowmelt in the Adirondack Mountains and at Hubbard Brook, New Hampshire (Peters and Driscoll, 1987; Likens et al., 1977), whereas nearly complete NO3- retention has been observed throughout the year at Bickford Reservoir, Massachusetts (Hemond and Eshleman, 1984). The Adirondack studies suggest that a large percentage of the NO3- released in the spring originates in
CHEMISTRY A N D T R E N D S IN CATSKILL LTM STREAMS 379
the forest floor through mineralization of nitrogenous compounds followed by nitrification (Rascher et al., 1987).
Nitrate concentrations commonly exceed 20 ~eq L-' in Catskill streams during all seasons except early fall (Figures 2 and 3); therefore, N O 3- is a major factor in the acid-base balance of Catskill streams. The Catskill LTM streams and Biscuit Brook showed increased N O 3- concentrations above baseflow values during the spring and fall high flows, but the magnitude of the increase was greater during the spring than during the fall. Concentrations above 65 txeq L -1 were observed during fall storms on Rondout Creek and Biscuit Brook. Peak values ranging from 40 to 118 ~eq L -1 were observed during snowmelt in the other LTM streams and were similar to peak values observed in Adirondack streams during snowmelt in 1984 and 1985 (Peters and Driscoll, 1987). In contrast, early fall baseflow con- centrations of NO3- in the Catskill LTM streams were often below 20 Iseq L -1.
Like SO42-, N O 3- concentrations were similar among Catskill streams at baseflow and during peak flows (Murdoch et aL, 1991). Chemical input-output budgets for Biscuit Brook indicate less N O 3- leaving than entering the watershed, the likely result of biological uptake (Murdoch, 1991). As with SO42-, these data suggest that the source of s t r eam N O 3- is primarily atmospheric.
THE ROSE OF DOC
The high concentrations of DOC and low pH of Catskill LTM streams at high flows suggest a relationship between stream acidity and DOC from soils (e.g., McDowell and Likens, 1988). Concentrations of DOC in the LTM streams ranged from 1 to 2 mg L -1 at baseflow, whereas peak values at high flows ranged from 2.8 mg L -1 in Woodland Creek to 9 mg L -1 in the East Branch of the Neversink River. Several methods have been used to estimate the equivalent acidity, or charge density, of DOC. Values of equivalent acidity for DOC have ranged from 4 to 5 ~eq mg -1 DOC for Adirondack lakes (Cronan and Aiken, 1985) to 8.4 ixeq mg -~ DOC for lakes in the Catskill /Pocono (Pennsylvania) region (Linthurst et al., 1986) to 10.5 t~eq mg -1 DOC for sites in Ontario, Canada (Oliver et aL, 1983).
Although few studies have been able to measure the charge density of DOC directly, charge density can be estimated if the DOC contribution to stream acidity is assumed to represent the anion deficit. Anion deficit (in txeq L -~) can be calculated a s ;
[H +] + 2[Ca 2+] + 2[Mg 2+] + [Na +] + [K +] + 2[Fe 2+] + n[A1 n+] - 2[SO4 2-] -
- [NO3-] - [CI-] - [HCO3-]
where concentrations are in ~xmol L -1. This method assumes that ion deficits are not the result of analytical error and that the charge associated with A1 and Fe values can be determined. Iron concentrations in Catskill streams are negligible and thus can be ignored. Aluminum concentrations, however, can be substantial. The charge on A1 (represented as n in the anion deficit equation) varies with pH
3 8 0 PETER S. MURDOCH AND JOHN L. STODDARD
1
6- �9
d
~
o ~
(D
c- O
~ c-
<~
t 7 5
1 5 0
1 2 5
1 0 0
y = - 5 . 4 + .Ox
r 2 = 0 . 2 9
t I i I t
0 o 0 (~
7 5 Oo o Oo~176 ~ % o ~ o ^ o o 8 20 Cb ~,
5 0 o ~ ~ o ~ o o ~ Q , o ~ ~ - ~ 2 , O0 u O~ 0 -- ,~---- u
lo 00o o ,
? o o o 2 5 ~ o ~ " ~ o -
0 ~ ' ~ O o ~ o
o o
- 2 5 - - ~ L v ~-0 ~ oo ~ ~ O % ~ o o ~
- ' 5 0 ~ ~ -
- 7 5 0
I ~ I ~ I t I i I T I
1 2 3 4 5 6
Dissolved Organic Carbon
t I ~ I ,
7 8 9
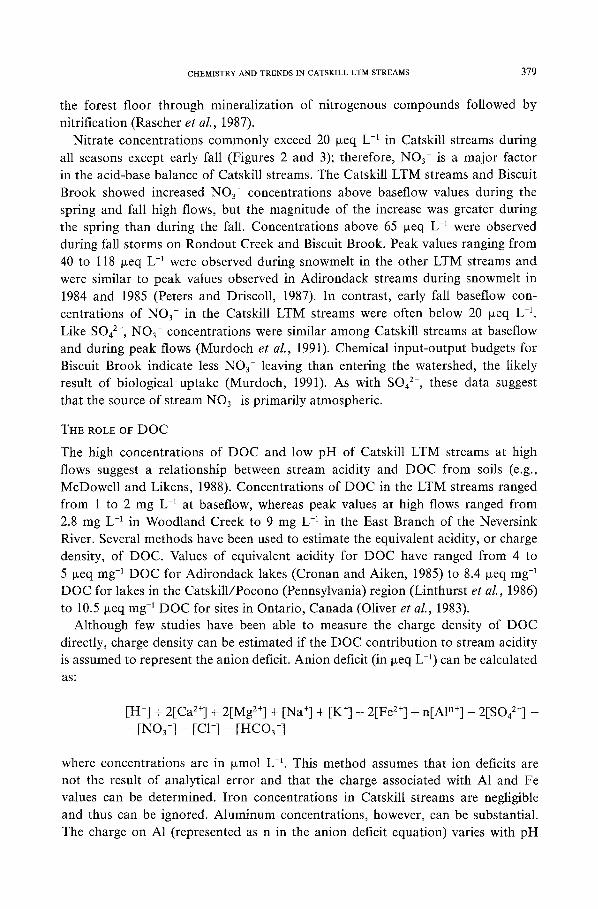
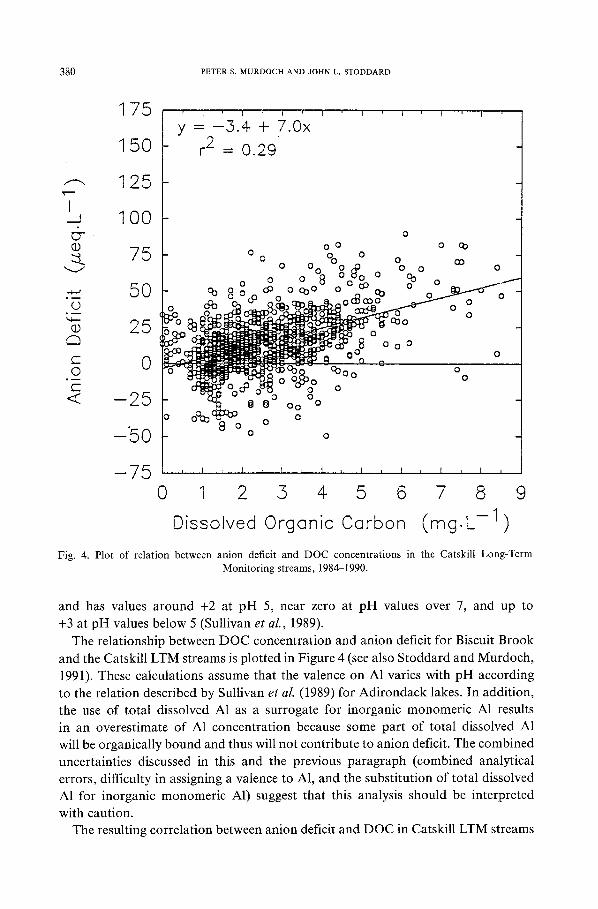
( gL -1) Fig. 4. Plot of relation between anion deficit and DOC concentrations in the Catskill Long-Term
Monitoring streams, 1984-1990.
and has values around +2 at pH 5, near zero at p H values over 7, and up to
+3 at pH values below 5 (Sullivan et al . , 1989). The relationship between DOC concentration and anion deficit for Biscuit Brook
and the Catskill LTM streams is plotted in Figure 4 (see also Stoddard and Murdoch, 1991). These calculations assume that the valence on A1 varies with pH according to the relation described by Sullivan et al. (1989) for Adirondack lakes. In addition, the use of total dissolved A1 as a surrogate for inorganic monomeric A1 results in an overestimate of A1 concentration because some part of total dissolved A1 will be organically bound and thus will not contribute to anion deficit. The combined uncertainties discussed in this and the previous paragraph (combined analytical errors, difficulty in assigning a valence to A1, and the substitution of total dissolved A1 for inorganic monomeric A1) suggest that this analysis should be interpreted
with caution. The resulting correlation between anion deficit and DOC in Catskill LTM streams
CHEMISTRY AND TRENDS IN CATSKILL LTM STREAMS 381
(Figure 4) is statistically significant but has a high variance ( r 2 = 0.29; p 2 0.0001). The slope of the regression indicates a charge density of 7 ~eq mg -1 of DOC, a value that is within the range of charge densities determined in studies described earlier. Estimated median contributions of organic anion to acidity, based on median DOC and acid anion concentrations, were about 18 iseq L -1 in Biscuit Brook and 15 txeq L -1 in the Catskill LTM streams; both values represent 7 to 8% of the total acid anion concentrations. At high flows, the DOC concentrations increased substantially, and the concentrations of organic acids were also likely to increase. The uncertainties in the anion deficit calculation are most marked at high flows, however, as a result of high concentrations of total dissolved A1 and low con- centrations of most other ions. Whether organic acidity is a simple function of DOC concentration under high-flow conditions is impossible to determine, and no definitive conclusions can be made about organic acidity at high flows other than that organic acid concentrations are likely to be higher at high flows than at baseflow. Organic acid anions could play a larger role during high-flow episodes than indicated by their central tendency.
RELATION BETWEEN STREAM CHEMISTRY AND DISCHARGE
The relationship between 8 0 4 2 - concentration and stream discharge per unit area was relatively uniform among the LTM streams (Figure 5); all LTM streams had similar SOa 2 concentrations at flows encompassing three orders of magnitude. The slightly elevated SO42- concentrations in streams with high baseflow ANC and the lowest SO42- concentrations in the most acidic stream (East Branch Neversink River) (Table III) indicate that watersheds with high ANC streams at baseflow either have a large storage of atmospheric SO42- from previous years, when deposition was greater, or have a small local source of SO42-. In either case, the percent difference among streams is negligible.
Base cation concentrations differed widely from stream to stream at low discharges but became increasingly similar as unit discharge increased (Figure 5). An exception is Woodland Creek, in which base cation concentration remained relatively stable over a range of flows. Streams with high base cation concentrations at low discharges, such as High Falls Brook, showed a greater decrease in base cation concentrations as discharges increased than did streams with a lower base cation concentration. The smallest decrease in base cation concentrations with increased discharge was in the East Branch Neversink, the most acidic stream studied (total decrease of 15 txeq L-I). The differences in cation concentrations among the streams indicate differences in the groundwater source of cations in each watershed during basefiow. The increased similarity among base cation concentrations during high discharge is probably due to the influx of shallow soil flow and precipitation, which are large contributors to streamflow during storms. Shallow soil flow and direct precipitation cause stream waters to become increasingly similar as water tables rise and the flow paths of water become similar among all watersheds.
The relationships between pH, or ANC, and discharge of the Catskill LTM streams

382 P E T E R S. M U R D O C H A N D J O H N L. S T O D D A R D
20O n " LU
. J n,. w 175
Z ul
~ 150
5 o
125 _o
: Z
10o g
z 75
o z 0
50 0.0001
i , , , , i , i I
A . S U L F A T E
V
X Woodland Creek A Hollow Tree Brook O Rondout Creek r'l Beaver Kill V East Branch Neversink Jr Biscuit Brook Q East Branch Headwaters O High Fails Brook
0.001
' ' ' ' ''"I ' ' ' ' ''"l ' ' ' ' ''"I ' ' ' ' ' ' "
r l ~
+~o ,,
, .
| + V V
...}..
, , , ,,,,I , , , , ,,,,I n , . . . . . . I . . . . ,
0.01 0.1 I 10
DISCHARGE, tN CUBIC METERS PER SECOND PER SQUARE KILOMETER
480 LU
~: ,~0 W
380 Z
~< 330 .m
0 LU
O 280 o
_Z 230 .
Z o
180
F- Z
130 Z O o 8O
0.0001
. . . . . . . . I . . . . . . . . I . . . . . . . . l . . . . . . . . I
�9 B A S E C A T I O N S . A
0 ~ ^ ^ A
v v ~
0.001 0.01 0.1 1
DISCHARGE, IN CUBIC METERS PER SECOND PER SQUARE KILOMETER
J 1 I i I ~ I I
+ .
t ~ i q l
10
Fig. 5. Plot of (a) SO42- concentration and (b) base cation concentration in samples from the Catskill Long-Term Monitoring streams in relation to stream discharge, 1984-90.
CHEMISTRY AND TRENDS IN CATSKILL LTM STREAMS 383
7.5
5
Z 6 . 5
N
O
5.5 o N N z o
4.5
z o z 0 3.5 o 0.0~1
i ~ t , ~ L l ~ I
A . pH
V
i ~ , , i 1 , 1 1
oa.~. ~ § ~ + o
~ ; ~ u ~ ~ + + o ~ v | " ' ~ ~ ~ (y + + +
V
0.001 0.01 0.1 1 DISCHARGE, IN CUBIC METERS PER SECOND PER SQUARE KILOMETER
10
240 5 r r
~. 200
z =. 160
O 120 LIJ o=
o S0
z .
z _O 40 I-
I - 0 o z O -40 o 0.0~01
L i ~ i J i l l I [ i ~ i i i i i I i i ~ i , 1 1 1 1 i
B. ACID-NEUTRALIZING CAPACITY ' i _ ~
X r.1-~ud 0~_ ko
v o ,o p cy + . . . . . . . . , . . . . . . . . . . . . . . ,o 0.001 0.01 0.1 1
DISCHARGE, IN CUBIC METERS PER SECOND PER SQUARE KILOMETER
i i ~ i t l l I i i i i i
X W o o d l a n d C r e e k
Zl Hollow T r e e B r o o k
O R o n d o u t C r e e k
[ ] Beaver Kill V East Branch N o v e r s i n k
�9 "1- Biscuit B r o o k
(~) East B r a n c h H o a d w a t e m
O High F a l l s B r o o k
+ +
V v, v , , , 10
Fig. 6. Plot of (a) p H and (b) A N C in relation to discharge at the Catskill Long-Term Moni tor ing streams, 1984-90.
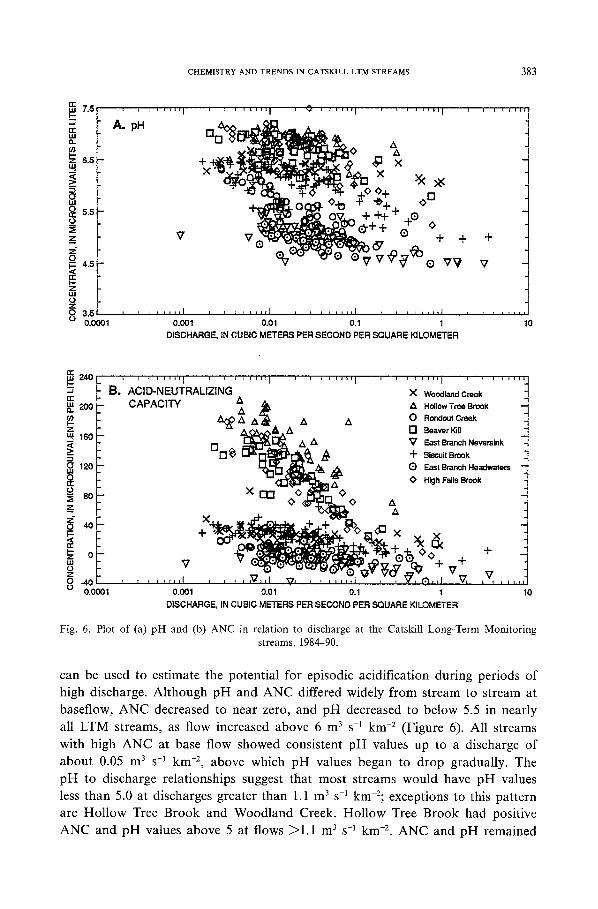
can be used to estimate the potential for episodic acidification during periods of high discharge. Although pH and ANC differed widely f rom stream to stream at baseflow, ANC decreased to near zero, and pH decreased to below 5.5 in nearly all LTM streams, as flow increased above 6 m 3 s -1 km -2 (Figure 6). All streams
with high ANC at base flow showed consistent p H values up to a discharge of about 0.05 m 3 s -1 km -2, above which p H values began to drop gradually. The pH to discharge relationships suggest that most streams would have p H values less than 5.0 at discharges greater than 1.1 m 3 s -1 kin-2; exceptions to this pattern are Hollow Tree Brook and Woodland Creek. Hollow Tree Brook had positive ANC and p H values above 5 at flows >1.1 m 3 s -[ km -2. ANC and pH remained
384 PETER S. M U R D O C H AND JOHN L. STODDARD
relatively constant across the entire range of flows at Woodland Creek. The comparison of data from the Catskill LTM streams indicates that baseflow
sampling of streams can be inadequate for assessment of long-term susceptibility of these streams to acidification. The contrast between the flow response at Woodland
Creek (low baseflow ANC but not acidic at high flow) and High Falls Brook (high
baseflow ANC and acidic [ANC = 0] at high flow) indicates that baseflow ANC alone cannot be used in the Catskill region as an index of susceptibility to acidification (Figure 6). A monitoring program for long-term trends in streamwater chemistry,
therefore, would require sampling over a wide range of flow conditions.
CAUSES OF EPISODIC ACIDIFICATION IN THE LTM STREAMS
The causes of episodic acidification in Catskill streams vary from year to year
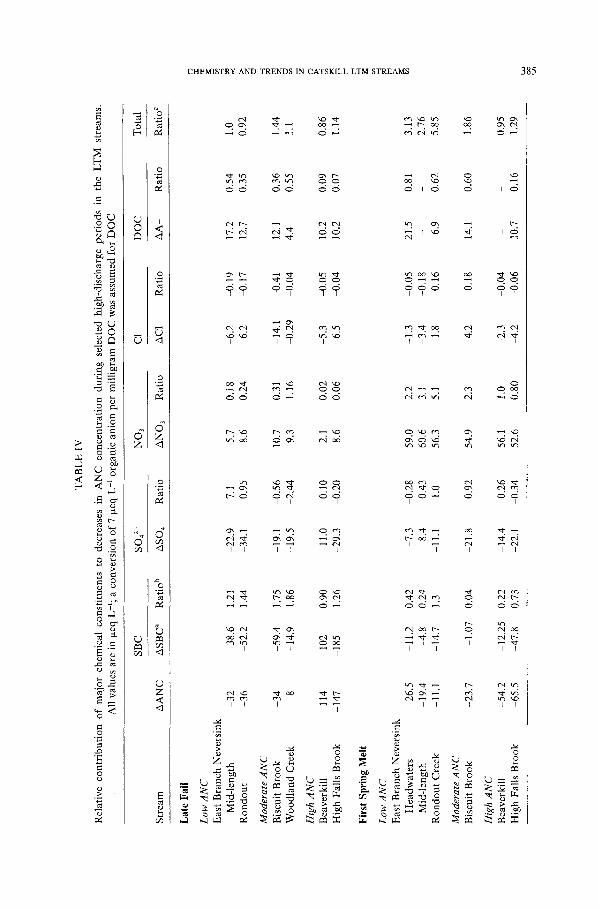
and from season to season. Water samples were collected at the LTM streams during several high flows over the period of record, during which several short-term episodes of acidification occurred. The relative contributions of major chemical constituents to decreases in ANC in streamwater were analyzed for each of four types of
acidification episodes through methods described by Molot et al. (1989 and Table IV). The four episodes represent (1) a late fall rainstorm, (2) the first snowmelt
of early spring, (3) a mid-winter snowmelt period, and (4) an early summer rainstorm. A sample taken at the lowest discharge during the six weeks prior to the episode was assumed to represent the constituent concentrations before each episode, and the concentration during the storm or snowmelt episode was considered to be that associated with the lowest ANC value recorded during the episode period. Com-
putations of change in constituent concentrations were made as follows:
where
AANC
ASBC ASO4 ANO3 AAI A A -
= ANC (episode) - ANC (pre-episode) = SBC (episode) - SBC (pre-episode) = SO4 (pre-episode) - SO4 (episode) = NO3 (pre-episode) - NO3 (episode) = A1 (episode) - A1 (pre-episode)
= A- (we-episode) - A- (episode)
SBC is the sum of base cation concentrations (Ca 2+ + Mg 2+ + Na + + K+),
and A- is organic anion concentration. In this analysis, positive values represent contributions to decreases in ANC,
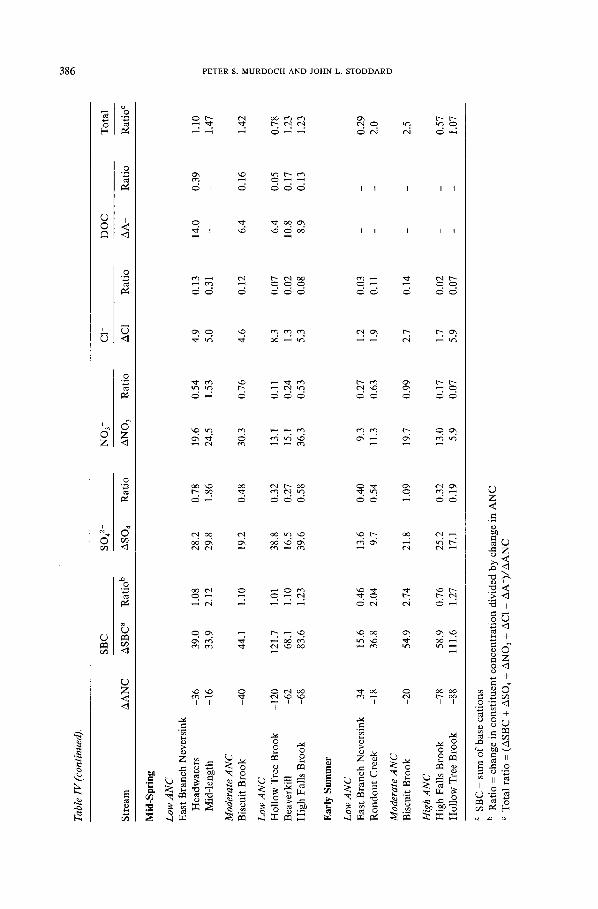
and negative values represent contributions to increases in ANC (Molot et aL, 1989). The relative contribution of each constituent to ANC decreases during acidic episodes was then determined as the ratio of the change in constituent concentration (A)
to the change in ANC (Table IV). Ammonium concentrations are negligible in pristine Catskill streams and are
not a significant contributor to the charge balance (Murdoch, 1991). Aluminum and DOC concentrations are significant, however, and the charge density associated
TA
BL
E I
V
Rel
ativ
e co
ntr
ibu
tio
n o
f m
ajo
r ch
emic
al
con
stit
uen
ts t
o de
crea
ses
in
AN
C
con
cen
trat
ion
d
uri
ng
se
lect
ed
high
-dis
char
ge p
erio
ds
in t
he
LT
M
stre
ams.
A
ll va
lues
are
in
p.eq
L-t
; a
con
ver
sio
n o
f 7
~eq
L -1
org
anic
an
ion
per
mil
ligr
am D
OC
was
ass
um
ed f
or
DO
C
SB
C
SO4 2
- N
O 3
C
I-
DO
C
To
tal
Str
eam
A
AN
C
AS
BC
a R
atio
b
AS
O 4
Rat
io
AN
O 3
R
atio
A
C1
Rat
io
AA
- R
atio
R
atio
c
Lat
e F
all
Lo
w A
NC
E
ast
Bra
nch
Nev
ersi
nk
Mid
-len
gth
32
-38.
6 1.
21
-22.
9 7.
1 5.
7 0.
18
-6.2
-0
.19
17.2
0.
54
1,0
Ro
nd
ou
t -3
6
-52
.2
1.44
-3
4.1
0.95
8.
6 0.
24
6.2
0.17
12
.7
0.35
0.
92
Mod
erat
e A
NC
B
iscu
it B
roo
k
-34
59
.4
1.75
19
.1
0.56
10
.7
0.31
14
.1
-0.4
1 12
.1
0.36
1,
44
Wo
od
lan
d C
reek
8
-14.
9 1.
86
-19.
5 2.
44
9.3
1.16
-0
.29
-0
.04
4.
4 0.
55
1.1
Hig
h A
NC
B
eave
rkil
l 11
4 -1
02
0.
90
-11.
0 0.
10
2.1
0.02
-5
.3
0.05
10
.2
0.09
0.
86
Hig
h F
alls
Bro
ok
-1
47
185
1.26
-2
9.3
-0.2
0 8.
6 0.
06
-6.5
-0
.04
10
.2
0.07
1.
14
Fir
st S
prin
g M
elt
Lo
w A
NC
E
ast
Bra
nch
Nev
ersi
nk
Hea
dw
ater
s 26
.5
-11
.2
0.42
-7
.3
0.28
59
.0
2.2
-1.3
0,
05
21.5
0.
81
3.13
M
id-l
engt
h -1
9.4
-4.8
0.
24
8.4
-0.4
3 60
,6
3.1
3.4
-0.1
8 -
- 2.
76
Ro
nd
ou
t C
reek
-1
1.1
-14
.7
1.3
-11.
1 1.
0 56
.3
5.1
1.8
0.16
6.
9 0.
62
5.85
Mod
erat
e A
NC
B
iscu
it B
roo
k
-23.
7 -1
.07
0.04
21
.8
0.92
54
.9
2.3
4.2
0.18
14
.1
0.60
1.
86
Hig
h A
NC
B
eave
rkil
l -5
4.2
12
.25
0.22
-1
4.4
-0
.26
56.1
1.
0 -2
.3
-0.0
4
- -
0.95
H
igh
Fal
ls B
roo
k
-65.
5 -4
7.8
0.73
-2
2.1
-0,3
4 52
.6
0.80
-4
.2
-0.0
6
10.7
0.
16
1.29
Tabl
e IV
(co
ntin
ued)
.
Str
eam
A
AN
C
SB
C
AS
BC
a R
atio
b
8042
- N
O 3
- C
1
ASO
4 R
atio
A
NO
3 R
atio
A
C1
0.54
1.
53
0.76
0.11
0.
24
0.53
0.27
0.
63
0.99
0.17
0.
07
4.9
5.0
4.6
8.3
1.3
5.3
1.2
1.9
2.7
1.7
5.9
Rat
io
Mid
-Sp
rin
g
Low
AN
C
Eas
t B
ran
ch N
ever
sin
k
Hea
dw
ater
s -3
6
39.0
1.
08
28.2
0.
78
Mid
-len
gth
-16
33
.9
2.12
29
.8
1.86
Mod
erat
e A
NC
B
iscu
it B
roo
k
40
44.1
1.
10
19.2
0.
48
Low
AN
C
Ho
llo
w T
ree
Bro
ok
-1
20
121.
7 1.
01
38.8
0.
32
Bea
verk
ill
-62
68
.1
1.10
16
.5
0.27
H
igh
Fal
ls B
roo
k
-68
83.6
1.
23
39.6
0.
58
Ear
ly S
um
mer
Low
AN
C
Eas
t B
ran
ch N
ever
sin
k
34
15.6
0.
46
13.6
0.
40
Ro
nd
ou
t C
reek
-1
8 36
.8
2.04
9.
7 0.
54
Mod
erat
e A
NC
B
iscu
it B
roo
k
-20
54
.9
2.74
21
.8
1.09
Hig
h A
NC
H
igh
Fal
ls B
roo
k
-78
58.9
0.
76
25.2
0.
32
Ho
llo
w T
ree
Bro
ok
-8
8
111.
6 1.
27
17.1
0.
19
a S
BC
-
sum
of
base
cat
ions
b
Rat
io -
ch
ange
in
con
stit
uen
t co
nce
ntr
atio
n d
ivid
ed b
y c
han
ge
in A
NC
c
Tot
al r
atio
= (
AS
BC
+ A
SO4
+ A
NO
3 +
AC
1 +
AA
-)/A
xAN
C
19.6
24
.5
30.3
13.1
15
.1
36.3
9.3
11.3
19.7
13.0
5.
9
0.13
0.
31
0.12
0.07
0.
02
0.O
8
0.03
0.
11
0.14
0.02
0.
07
DO
C
To
tal
AA
- R
atio
R
atio
e
14.0
6.4
6.4
10.8
8.
9
0.39
0.16
0.05
0.
17
0.13
1.10
1.
47
1.42
0.78
1.
23
1.23
0.29
2.
0
2.5
0.57
1.
07
CHEMISTRY AND TRENDS IN CATSKILL LTM STREAMS 387
with each is variable. As a first approximation, the effect of A1 on the charge balance was assumed to be incorporated in the ANC values measured by the Gran titration, and the charge contribution from DOC was assumed to be 7 geq mg -1
DOC (see "Role of DOC", earlier). Decreases in ANC during each of the episodes were greatest in streams with
the highest baseflow ANC, which also had the greatest total dissolved solids (TDS). Base cation dilution was the most significant factor in the decreases in ANC for all streams during all episodes except the first snowmelt period. Changes in base cation concentrations were greatest in the streams with the highest baseflow ANC and paralleled the magnitude of ANC decreases among streams. The similarity of the ratio of base cation dilution to ANC decrease among streams during all four episodes indicates, however, that base cation dilution has a similar effect on ANC across the spectrum of streams and seasons observed.
The dilution of SO42- in all streams during all observed episodes indicates that H2SO 4 is not in and of itself an acidifying factor during episodes. The magnitude of the dilution was similar among the streams; thus, because of differences in ANC decreases among streams, the ratio of change in S O 4 2- t o change in ANC was greater in streams with low and moderate baseflow ANC than in streams with high baseflow ANC. The dilution of SO42- was less than that of base cations during all episodes except the first spring melt, and thus only partly offset the effect of base cation dilution on decreases in ANC during the episodes.
Nitrate concentrations increased with increased flow during all episodes at all streams, although the magnitude of the NO3- increase and the relative contribution to ANC decreases varied significantly from episode to episode. Increases in NO3- concentrations were generally similar among streams during each episode and, again, because of large differences in ANC decreases, the ratio of NO3- increase to ANC decrease was greater in the acidic and moderately acidic streams than in the buffered streams. The greatest ANC decreases that were associated with increases in NO3- concentrations occurred during the first spring melt, when NO3- concentrations increased by more than 50 fxeq L -1 in all streams. During this episode, base cation dilution became a secondary factor relative to NO3- increases, even in streams with the highest baseflow ANC. During late spring episodes, when the snowpack was largely depleted of acids accumulated during deposition, the relative contribution of changes in NO3- concentration to ANC decreases was less than that for base cation dilution. The ANC balance for the first spring episode also contrasts sharply to that for the fall episode, when a larger ANC depression was accompanied by relatively minor increases in NO3- and large decreases in base cation concentrations.
This analysis indicates that ANC decreases in Catskill streams are controlled primarily by dilution of base cations during the fall and early summer and by increases in NO3- during the initial spring snowmelt. The relative contribution of acid-anion increases and dilution are similar during the late spring snowmelt episode. ANC depressions in streams with high total dissolved solids (TDS) and ANC at baseflow are associated with cation dilution in all but the early spring, whereas

3 8 8 PETER S. MURDOCH AND JOHN L. STODDARD
TABLE V
Ratios of the change in total constituent concentration to change in ANC in the Long-Term Monitoring streams, and Biscuit Brook based on inclusion and exclusion of A1 and organic acids in the electroneutrality
balance. Stream locations are shown in Figure 1
With With With Without With With DOC DOC, A12§ A1 E+ AP +, DOC, and without without or without and A1 E+ AF + D 0 C DOC D 0 C AP +
Late Fall
East Branch Neversink Mid-length 0.30 0.90 -0.12 0.48 -0.42 -0.003
Rondout Creek 0.15 0.85 -0.15 0.57 -0.48 -0.2 Biscuit Brook 0.95 1.36 0.67 1,08 0.46 0.74 Beaverkill 0.81 0.84 0.74 0.77 0.72 0.80 High Falls Brook 1.07 1.13 1.02 1.05 0.99 1.04
Early Spring
East Branch Neversink Headwaters 2.14 2.96 1.50 2.32 1.09 1.73 Mid-length 1.12 2.76 1.12 2.76 0.30 0.30
Rondout Creek 2.45 5.72 0.93 5.23 0.34 0.82 Biscuit Brook 1.37 1.73 0.91 1.26 0.73 1.20 Beaverkill 0.87 0.87 0.95 0.83 0.83 High Falls Brook 1.21 1.26 1.08 1.13 1.06 1.19
streams with lower ANC and TDS are more affected by changes in other constituents. All streams, regardless of baseflow ANC, undergo significant acidification during the spring as s t ream N O 3- concentrations increase.
The roles of A1 and organic acids are difficult to ascertain because information on A1 speciation and the pKa values for the organic acids is lacking. The ratio of changes in concentration of all constituents to changes in ANC should equal 1, if all constituents that affect ANC are included in the balance equation and the charge attributed to each constituent is correct. In this first approximation, which included organic anions but not A1 as contributors to the change in ANC, this ratio was variable among streams and among episodes. As an example, during the fall storm episode the ratio was generally near 1, whereas it was significantly greater than 1 during the first spring melt; this indicates either an overestimation of factors that decrease ANC or an underestimation of factors that increase ANC during first spring melt. Ratios of changes in all constituents to changes in ANC for these two episodes were recalculated for several equations that include or exclude the effect of A1 and organic acids, and with an assumed charge density of 2 + or 3 + for A1; results are given in Table V. Ratios closest to unity for the fall episode are as provided in Table IV, except for Biscuit Brook, which had a better balance if A1 and organic acids were both excluded from the calculation. Ratios for the spring episode were generally closest to unity if A1 was included as A12+ and organic
CHEMISTRY AND TRENDS IN CATSKILL LTM STREAMS 389
acids were excluded from the calculation. Exceptions were the headwaters of the East Branch Neversink, for which A1 as AP + provided the best balance, and High Falls Brook, for which AP + gave a slightly better result than A12+. The change in A1 concentration for High Falls Brook was insignificant compared to changes in other constituents, and analytical errors could easily account for the difference. Adding or excluding A1 and organic acids in the balance calculations made little difference in streams with high baseflow ANC, where changes in both were small in comparison to changes in NO3- and base cation concentrations. In the headwaters of the East Branch Neversink, however, an increase in A1 concentrations of 295 txg L -1 was recorded during the spring episode, and pH values at peak discharge were below 4.4. Thus, the average charge on the A1 present was probably closer to +3 than +2. These results support similar findings by Sullivan et al. (1989) for Adirondack lakes and suggest that the role of organic acids and A1 in the ANC balance for acidic episodes differs from fall to spring. The results also indicate that the charge for total dissolved A1 varies with season and stream pH.
T E M P O R A L T R E N D S IN S T R E A M - W A T E R C H E M I S T R Y
SKT trend tests were run on data from each of the seven LTM stream stations and on Biscuit Brook. Seven years of data (1983-89) were used to calculate trends
in ANC, pH, DOC, NO3- , SO42-, sum of 8042 -~- NO3-, the ratio of NO 3- to
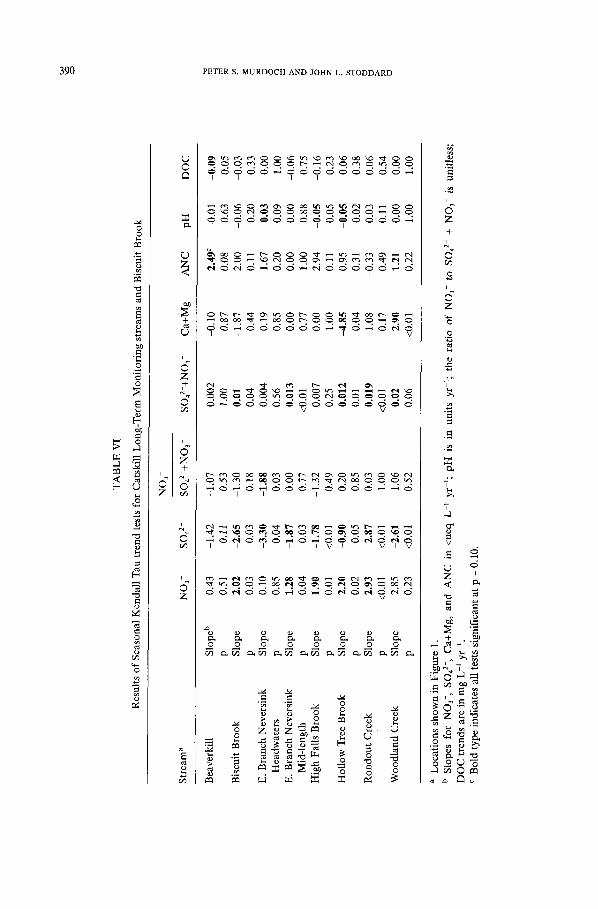
SO4 2- + NO3- , and Ca 2+ + Mg. Results of all trend tests (slopes and significance levels) are shown in Table VI. The records for these streams are relatively short, and the trend test results in Table VI should, therefore, be interpreted with caution. Although the trends discussed here are all statistically significant for the period of record, they do not necessarily represent long-term trends (e.g., decades). To place the current trends in a long-term context requires comparison of their magnitude with that of longer records from other locations, and with those for related variables such as rates of acidic deposition.
Five of the eight stream stations exhibited significant upward trends in N O 3-
concen t ra t ion ; slopes range from 1.3 txeq L -1 yr -~ to almost 3 ~xeq L -~ yr -~. Seven streams exhibited significant downward trends in SO42- concentration; slopes range from -0.9 ~xeq L -1 yr -1 to -3.3 ~eq L -1 yr -I. Examination of the slopes of both significant and nonsignificant trend tests yield additional information; for example, the trends at all eight streams exhibited positive slopes for NO 3- and negative slopes for SO42-. Although not all these slopes are statistically significant, they suggest that the trends in these two ions might be regionally applicable and that longer data records (and therefore larger sample sizes) could reveal significant trends for both variables at all sites. Trends in the sum of N O 3- and SO42- concentrations are significant at only one site (downward); this suggests that the status of the Catskill streams with respect to acidic deposition was unchanged throughout the 1980s. Trends in the ratio of NO 3- to the sum of SO42- + N O 3- (five significant upward trends; all 8 slopes are positive) indicate the increasing effect of NO3- relative to SO42- in these streams. When combined, tests for trend in SO42- + N O 3- and
TA
BL
E V
I
Res
ults
of
Sea
sona
l K
enda
ll T
au t
rend
tes
ts f
or C
atsk
ill
Lo
ng
-Ter
m M
onit
orin
g st
ream
s an
d B
iscu
it B
rook
NO
3-
Str
eam
a N
O3-
50
42-
SO42
-+N
O3
- SO
42-+
NO
3 -
Ca+
Mg
A
NC
p
H
DO
C
Bea
verk
ill
Slo
pe b
0.43
-1
.42
-1.0
7 0.
002
-0.1
0 2.
49 c
-0.0
1 0.
09
p 0.
51
0.11
0.
53
1.00
0.
87
0.08
0.
63
0.05
B
iscu
it B
rook
S
lope
2.
02
-2.6
5 -1
.30
0.01
-1
.87
2.00
-0
.06
-0.0
3 p
0.03
0.
03
0.18
0.
04
0.44
0.
11
0.20
0.
33
E.
Bra
nch
Nev
ersi
nk
Slo
pe
0.10
3.
30
-1.8
8 0.
004
0.19
1.
67
0.03
0.
00
Hea
dwat
ers
p 0.
85
0.04
0.
03
0.56
0.
85
0.20
0.
09
1.00
E
. B
ranc
h N
ever
sink
S
lope
1.
28
-1.8
7 0.
00
0.01
3 0.
00
0.00
0.
00
-0.0
6 M
id-l
engt
h p
0.04
0.
03
0.77
<0
.01
0.77
1.
00
0.88
0.
75
Hig
h F
alls
Bro
ok
Slo
pe
1.90
-1
.78
-1.3
2 0.
007
0.00
2.
94
0.05
-0
.16
p 0.
01
<0.0
1 0.
49
0.25
1.
00
0.11
0.
05
0.23
H
ollo
w T
ree
Bro
ok
Slo
pe
2.20
-0
.90
0.20
0.
012
-4.8
5 0.
95
-0.0
5 0.
06
p 0.
02
0.05
0.
85
0.01
0,
04
0.31
0.
02
0.38
R
on
do
ut
Cre
ek
Slo
pe
2.93
2.
87
0.03
0.
019
-1.0
8 -0
.33
-0.0
3 0.
06
p <0
.01
<0.0
1 1.
00
<0.0
1 0.
17
0.49
0.
11
0.54
W
oodl
and
Cre
ek
Slo
pe
2.85
2.
61
1.06
0.
02
2.90
1.
21
0.00
0.
00
p 0.
23
<0.0
1 0.
52
0.06
<0
.01
0.22
1.
00
1.00
~q
O
> Z .r-
�9
> ~7
a L
ocat
ions
sho
wn
in F
igur
e 1.
b
Slo
pes
for
NO
3- ,
SO42
-, C
a+M
g,
and
AN
C
in <
ueq
L -1
yr-
1; p
H
is i
n un
its
yr-l
; th
e ra
tio
of N
O 3
- to
SO
42-
+ N
O3-
is
unit
less
; D
OC
tre
nds
are
in m
g L
-I y
r -~.
c
Bol
d ty
pe i
ndic
ates
all
tes
ts s
igni
fica
nt a
t p
= 0.
10.
CHEMISTRY AND TRENDS IN CATSKILL LTM STREAMS 391
the ratio of N O 3- t o SO42- -I- N O 3- suggest that N O 3- could eventually replace SO4 z- as the dominant acid anion in Catskill streams.
Trends in the remaining variables (Ca 2+ + Mg z+, ANC, pH, and DOC) are less clear cut than those for N O 3- and SO42-. The SKT results suggest that base cation concentrations in Catskill streams might be decreasing. One of the eight streams showed a significant downward trend in Ca 2+ + Mg 2§ concentration, and one showed
an upward trend. Examination of all trend tests reveals a slight tendency toward decreases in Ca 2+ + Mg; four of the six steams with non-zero slopes for Ca 2+ +
Mg 2+ exhibited negative slopes. In other parts of the northeastern United States, for example, Vermont, (Stoddard and Kellogg, this volume) and New Hampshire (Driscoll et al., 1989), base cation concentrations in surface waters are clearly decreasing. These trends have been attributed to (1) decreases in S deposition, which can result in decreased cation export from soils (Galloway et al., 1983), and (2) decreases in base cation deposition. The Catskills could differ significantly from other areas in the Northeast because strong upward trends in streamwater N O 3- are present. Because the increasing N O 3- trends cause acid anion concentrations in Catskill streams to remain relatively unchanged, decreases in soil cation exchange are less likely than in Vermont and New Hampshire, and thus changes in stream
Ca 2+ + Mg 2+ concentrations would also be less likely than in areas where only downward trends in SO42- are present.
The SKT results also suggest a regional downward trend in pH. At two of the eight stations downward trends in pH were significant, and an upward trend occurred at only one stream. When significant and nonsignificant tests are considered together, five of the eight streams underwent decreases in pH, and one showed a pH increase; two streams had zero slope for pH. In general, the pH trends are consistent with the trends in Ca 2+ + Mg. ANC trends indicated no clear pattern; only two trends were significant and both were upward. Of the eight ANC slopes, one was downward and six were upward. The lack of significant ANC trends is puzzling and not entirely consistent with the pH and cation trends. One possible complicating factor in the ANC trends is our inability to determine how inorganic monomeric A1 (All) concentrations are changing, as AIi has an influence on Gran ANC measurements (Sullivan et al., 1989; Munson and Gherini, 1991). Data on total dissolved A1 concentrations at the Catskill LTM sites are available, but no trends over the period of record were determined. Changes in total dissolved A1 concentration will not necessarily accompany changes in inorganic monomeric A1 concentration because the latter is often only a small fraction of the dissolved A1 concentration, especially at baseflow (e.g., Kaufmann et al., 1988). If A1 i concentrations in Catskill streams were changing, the combined effect on ANC of decreasing Ca 2+ + Mg 2§ decreasing SO42 , increasing NO3- , and changing A1 could be complex. No pattern for regional changes in ANC emerges from the trend tests presented here.
Only one DOC trend is significant (downward); one of the trend slopes was positive, and five are negative. No regional pattern can therefore be inferred. Trend results for the sum of SO42- and NO3- and the lack of DOC trends suggest that
392 PETER S. M U R D O C H AND JOHN L. STODDARD
total acid anion (inorganic and organic) concentrations in these streams throughout the 1980s remained relatively unchanged.
6. Summary and Conclusions
Results of the first 7 yr of precipitation and stream water monitoring at the long- term monitoring stations in the Catskill Mountains indicates that fluctuations in several chemical characteristics of these streams parallel those in other mountainous regions of the northeastern United States. Mean annual SO4 2- and NO3- concen- trations in precipitation were similar to those in the Adirondack Mountains and at Hubbard Brook, New Hampshire, although loads may differ because precipitation volume in the Catskills is greater. Mean concentrations of SO4 2- and NO3- were similar among the Catskill streams and also were similar to those at other streams in the Northeast. Differences in stream base cation concentrations were large and probably result mainly from local differences in the thickness, permeability, and mineral content of upslope till deposits.
ANC values in the Catskill streams were directly related to base cation con- centrations at all flows. Sulfate concentrations were similar among the streams in flows encompassing three orders of magnitude. Differences among the streams in base cation concentrations decreased as discharge increased and watershed flow paths became increasingly similar. The uniformity of SO4 2- concentrations among Catskill streams indicates a common source, which is probably HzSO 4 from atmospheric deposition.
The causes of stream acidification during individual storms or snowmelt in the LTM streams seem to differ according to season. Analyses of anion/cation balances indicate that base cation dilution has a dominant role in causing ANC decreases during all seasons except early spring. Sulfate dilution, which occurred in all LTM streams during all flow increases, partly offsets the effect of base cation decreases on stream acidity. Nitrate concentrations, however, increased with increased dis- charge in all streams, and appear to be the dominant factor in stream acidification during early spring snowmelt. In contrast, increases in DOC concentrations were large during fall storms, and organic anions could, therefore, influence stream acidity
during the fall. Strong correlations between stream ANC and discharge were observed at each
of the LTM streams, and the ANC values of all of these streams except Hollow Tree Brook were near zero at discharges > 0.6 m 3 s -1 km -2. Baseflow ANC values are not reliable predictors of episodic acidification during storms or snowmelt in Catskill streams, however. High Falls Brook, which has high baseflow ANC, can become acidic during high discharge, whereas Woodland Creek, which has relatively low baseflow ANC, appears to resist acidification as discharge increases.
Temporal trends of constituent concentrations in the Catskill LTM streams differed from stream to stream, both in terms of statistical significance and the slope of the trend. A general decrease in SO4 z- and increase in NO3- in these streams since
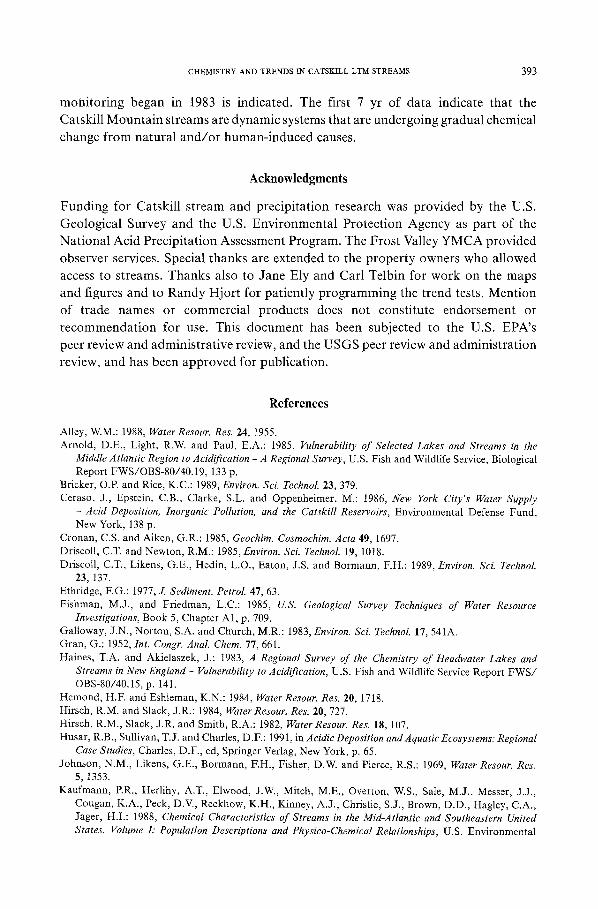
CHEMISTRY AND TRENDS IN CATSKILL LTM STREAMS 393
monitoring began in 1983 is indicated. The first 7 yr of data indicate that the Catskill Mountain streams are dynamic systems that are undergoing gradual chemical change from natural and/or human-induced causes.
Acknowledgments
Funding for Catskill stream and precipitation research was provided by the U.S. Geological Survey and the U.S. Environmental Protection Agency as part of the National Acid Precipitation Assessment Program. The Frost Valley YMCA provided observer services. Special thanks are extended to the property owners who allowed access to streams. Thanks also to Jane Ely and Carl Telbin for work on the maps and figures and to Randy Hjort for patiently programming the trend tests. Mention of trade names or commercial products does not constitute endorsement or recommendation for use. This document has been subjected to the U.S. EPA's peer review and administrative review, and the USGS peer review and administration review, and has been approved for publication.
References
Alley, W.M.: 1988, Water Resour. Res. 24, 1955. Arnold, D.E., Light, R.W. and Paul, E.A.: 1985, Vulnerability of Selected Lakes and Streams in the
Middle Atlantic Region to Acidification - A Regional Survey, U.S. Fish and Wildlife Service, Biological Report FWS/OBS-80/40.19, 133 p.
Bricker, O.E and Rice, K.C.: 1989, Environ. Sci. Technol. 23, 379. Ceraso, J., Epstein, C.B., Clarke, S.L. and Oppenheimer, M.: 1986, New York City's Water Supply
- Acid Deposition, Inorganic Pollution, and the Catskill Reservoirs, Environmental Defense Fund, New York, 138 p.
Cronan, C.S. and Aiken, G.R.: 1985, Geochim. Cosmochim. Acta 49, 1697. Driscoll, C.T. and Newton, R.M.: 1985, Environ. Sci. Technol. 19, 1018. Driscoll, C.T., Likens, G.E., Hedin, L.O., Eaton, J.S. and Bormann, F.H.: 1989, Environ. Sci. Technol.
23, 137. Ethridge, F.G.: 1977, J. Sediment. Petrol. 47, 63. Fishman, M.J., and Friedman, L.C.: 1985, U.S. Geological Survey Techniques of Water Resource
Investigations, Book 5, Chapter A1, p. 709. Galloway, J.N., Norton, S.A. and Church, M.R.: 1983, Environ. Sci. Technol. 17, 541A. Gran, G.: 1952, Int. Congr. Anal Chem. 77, 661. Haines, T.A. and Akielaszek, J.: 1983, A Regional Survey of the Chemistry of Headwater Lakes and
Streams in New England - Vulnerability to Acidification, U.S. Fish and Wildlife Service Report FWS/ OBS-80/40.15, p. 141.
Hemond, H.F. and Eshleman, K.N.: 1984, Water Resour. Res. 20, 1718. Hirsch, R.M. and Slack, J.R.: 1984, Water Resour. Res. 20, 727. Hirsch, R.M., Slack, J.R. and Smith, R.A.: 1982, WaterResour. Res. 18, 107. Husar, R.B., Sullivan, T.J. and Charles, D.F.: 1991, inAcidic Deposition and Aquatic Ecosystems: Regional
Case Studies, Charles, D.F., ed, Springer Verlag, New York, p. 65. Johnson, N.M., Likens, G.E., Bormann, F.H., Fisher, D.W. and Pierce, R.S.: 1969, Water Resour. Res.
5, 1353. Kaufmann, ER., Herlihy, A.T., Elwood, J.W., Mitch, M.E., Overton, W.S., Sale, M.J., Messer, J.J.,
Cougan, K.A., Peck, D.V., Reckhow, K.H., Kinney, A.J., Christie, S.J., Brown, D.D., Hagley, C.A., Jager, H.I.: 1988, Chemical Characteristics of Streams in the Mid-Atlantic and Southeastern United States. Volume I: Population Descriptions and Physico-Chemieal Relationships, U.S. Environmental
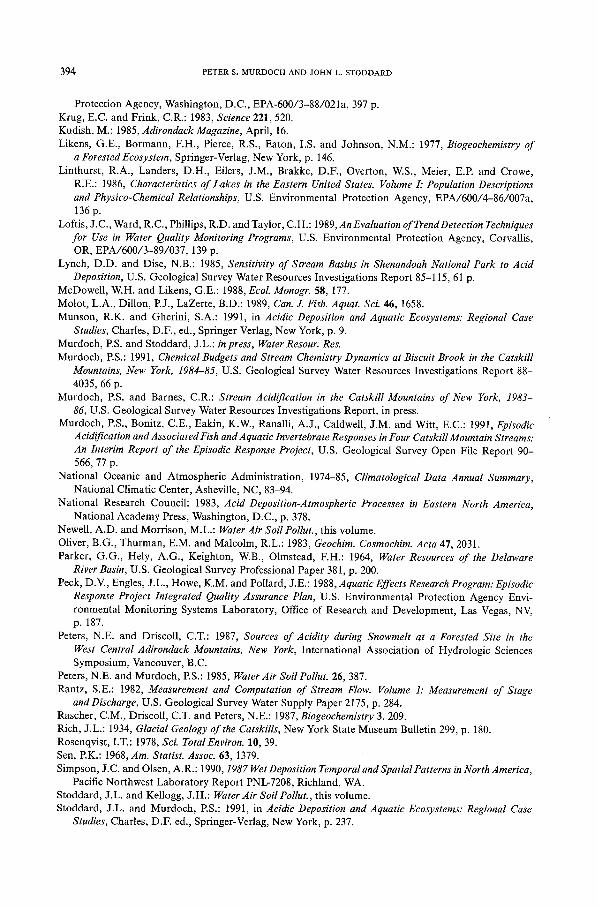
394 PETER S. M U R D O C H AND JOHN L. STODDARD
Protection Agency, Washington, D.C., EPA-600/3-88/021a, 397 p. Krug, E.C. and Frink, C.R.: 1983, Science 221,520. Kudish, M.: 1985, Adirondack Magazine, April, 16. Likens, G.E., Bormann, F.H., Pierce, R.S., Eaton, I.S. and Johnson, N.M.: 1977, Biogeoehemistry of
a Forested Ecosystem, Springer-Verlag, New York, p. 146. Linthurst, R.A., Landers, D.H., Eilers, J.M., Brakke, D.F., Overton, W.S., Meier, E.P. and Crowe,
R.E.: 1986, Characteristics of Lakes in the Eastern United States. Volume I: Population Descriptions and Physico-Chemical Relationships, U.S. Environmental Protection Agency, EPA/600/4-86/007a, 136p.
Loftis, J.C., Ward, R.C., Phillips, R.D. and Taylor, C.H.: 1989, An Evaluation of TrendDetection Techniques for Use in Water Quality Monitoring Programs, U.S. Environmental Protection Agency, Corvallis, OR, EPA/600/3-89/037, 139 p.
Lynch, D.D. and Disc, N.B.: 1985, Sensitivity of Stream Basins in Shenandoah National Park to Acid Deposition, U.S. Geological Survey Water Resources Investigations Report 85-115, 61 p.
McDowell, W.H. and Likens, G.E.: 1988, Ecol. Monogr. 58, 177. Molot, L.A., Dillon, EJ., LaZerte, B.D.: 1989, Can. J. Fish. Aquat. Sci. 46, 1658. Munson, R.K. and Gherini, S.A.: 1991, in Acidic Deposition and Aquatic Ecosystems: Regional Case
Studies, Charles, D.F., ed., Springer Verlag, New York, p. 9. Murdoch, ES. and Stoddard, J.L.: in press, Water Resour. Res. Murdoch, ES.: 1991, Chemical Budgets and Stream Chemistry Dynamics at Biscuit Brook in the Catskill
Mountains, New York, 1984-85, U.S. Geological Survey Water Resources Investigations Report 88- 4035, 66 p.
Murdoch, ES. and Barnes, C.R.: Stream Acidification in the Catskill Mountains of New York, 1983- 86, U.S. Geological Survey Water Resources Investigations Report, in press.
Murdoch, ES., Bonitz, C.E., Eakin, K.W., Ranalli, A.J., Caldwell, J.M. and Witt, E.C.: 1991, Episodic Acidification and Associated Fish and Aquatic Invertebrate Responses in Four Catskill Mountain Streams: An Interim Report of the Episodic Response Project, U.S. Geological Survey Open File Report 90- 566, 77 p.
National Oceanic and Atmospheric Administration, 1974-85, Climatological Data Annual Summary, National Climatic Center, Asheville, NC, 83-94.
National Research Council: 1983, Acid Deposition-Atmospheric Processes in Eastern North America, National Academy Press, Washington, D.C., p. 378.
Newell, A.D. and Morrison, M.L.: Water Air Soil Pollut., this volume. Oliver, B.G., Thurman, E.M. and Malcolm, R.L.: 1983, Geochim. Cosmochim. Acta 47, 2031. Parker, G.G., Hely, A.G., Keighton, W.B., Olmstead, F.H.: 1964, Water Resources of the Delaware
River Basin, U.S. Geologieal Survey Professional Paper 381, p. 200. Peck, D.V., Engles, J.L., Howe, K.M. and Pollard, J.E.: 1988, Aquatic Effects Research Program: Episodic
Response Project Integrated Quality Assurance Plan, U.S. Environmental Protection Agency Envi- ronmental Monitoring Systems Laboratory, Office of Research and Development, Las Vegas, NV, p. 187.
Peters, N.E. and Driscoll, C.T.: 1987, Sources of Acidity during Snowmelt at a Forested Site in the West Central Adirondack Mountains, New York, International Association of Hydrologic Sciences Symposium, Vancouver, B.C.
Peters, N.E. and Murdoch, ES.: 1985, WaterAir SoilPollut. 26, 387. Rantz, S.E.: 1982, Measurement and Computation of Stream Flow. Volume 1: Measurement of Stage
and Discharge, U.S. Geological Survey Water Supply Paper 2175, p. 284. Rascher, C.M., Driscoll, C.T. and Peters, N.E.: 1987, Biogeochemistry 3, 209. Rich, J.L.: 1934, Glacial Geology of the Catskills, New York State Museum Bulletin 299, p. 180. Rosenqvist, I.T.: 1978, Sci. TotalEnviron. 10, 39. Sen, EK.: 1968, Am. Statist. Assoc. 63, 1379. Simpson, J.C. and Olsen, A.R.: 1990, 1987 Wet Deposition Temporal and Spatial Patterns in North America,
Pacific Northwest Laboratory Report PNL-7208, Richland, WA. Stoddard, J.L. and Kellogg, J.H.: Water Air Soil Pollut., this volume. Stoddard, J.L. and Murdoeh, ES.: 1991, in Acidic Deposition and Aquatic Ecosystems: Regional Case
Studies, Charles, D.E ed., Springer-Verlag, New York, p. 237.

CHEMISTRY AND TRENDS IN CATSKILL LTM STREAMS 395
Sullivan, T.J., Driscoll, C.T., Gherini, S.A., Munson, R.K., Cook, R.B., Charles, D.F. and Yatsko, C.E: 1989, Nature 338, 408.
U.S. EPA: 1989, Handbook of Methods for Acid Deposition Studies: Field Methods for Surface Water Chemistry, U.S. EPA Environmental Monitoring Systems Laboratory, Las Vegas, NV, EPA/600/ 4-89/020.
U.S. EPA: 1991, Data User's Guide to the U.S. EPA Long-Term Monitoring Project: Quality Assurance Plan and Data Dictionary, U.S. EPA Environmental Research Laboratory, Corvallis, OR, EPA/ 600/3-91/072, p. 106.
Way, J.H.: 1972, A More Detailed Discussion of the Depositional Environmental Analysis-Middle and Upper Devonian Sedimentary Rocks, Catskill Mountain Area, New York, Rensselaer Polytechnic Institute, Troy, NY, Ph.D. dissertation, p. 145.
Related Documents