Microchim. Acta 143, 123–137 (2003) DOI 10.1007/s00604-003-0065-6 Original Paper Chemical and Biological Sensors Based on Electrochemical Detection Using Conducting Electroactive Polymers Sean Brahim 1 , Ann M. Wilson 2;3 , Dyer Narinesingh 3 , Emmanuel Iwuoha 4 , and Anthony Guiseppi-Elie 1;2; 1 Departments of Chemical Engineering and The Center for Bioelectronics, Biosensors and Biochips (C3B), Virginia Commonwealth University, School of Engineering, P.O. Box 843038, 601 West Main Street, Richmond, Virginia 23284-3038, USA 2 ABTECH Scientific, Inc., 911 East Leigh Street, Richmond, Virginia 23219, USA 3 Department of Chemistry, University of the West Indies, St. Augustine, Republic of Trinidad and Tobago 4 Department of Chemistry, University of the Western Cape, Bellville, CapeTown, South Africa Received May 18, 2003; accepted June 12, 2003; published online November 17, 2003 # Springer-Verlag 2003 Abstract. The electrochemical behavior of compo- sites of conducting electroactive polyaniline (PAn) and polypyrrole (PPy) formulated within cross-linked hydrogel networks was investigated by cyclic voltam- metry and electrochemical impedance spectroscopy (EIS). Composite PAn gels displayed similar anodic charge density compared to the pristine conducting polymer (80 mC=cm 2 and 84 mC=cm 2 , respectively), suggesting a similar degree of electroactivity between the two systems. Composite gels of PAn displayed fast cation transport with K þ diffusivity (D appt ¼ 5.31 10 7 cm 2 s 1 ) that were three orders of magni- tude larger than that of pristine PAn (D appt ¼ 3.12 10 10 cm 2 s 1 ), while PPy composite gels showed similar ferrocene anion diffusivity (D appt ¼ 7.05 10 5 cm 2 s 1 ) compared to electropolymerized PPy (D appt ¼ 6.54 10 5 cm 2 s 1 ). The electrochemi- cal interactions between CYP2D6, a cytochrome P450 isoenzyme, and fluoxetine mediated by electro- active polyaniline films on glassy carbon electrodes (GCEs) were investigated. Cyclic voltammograms indicate that PAn is an effective mediator of CYP2D6 activity under anaerobic conditions. An analytical interrogation methodology based on small-amplitude, pulsed DC was developed and incorporated into the Electroconductive Polymer Sensor Interrogation Sys- tem (EPSIS). Polypyrrole membranes were rendered biospecific by either copolymerization of pyrrole (Py) with 4-(1-pyrrolyl) butyric acid (4PyBA), followed by direct conjugation with 5-(biotinamido)pentyl amine (5BPA), or by reacting 4PyBA with 5BPA to form pyrrolyl-biotin conjugates. The biotinylated PPy was made responsive to glucose or urea by exploiting strong biotin-streptavidin binding to either strepta- vidin-glucose oxidase or biotin-urease conjugates. These bioactive conducting polymer membranes were demonstrated as conductimetric glucose and urea bio- sensing layers using the EPSIS. The rate of conductiv- ity of the bioactive PPy membranes was observed to double upon increasing glucose concentration from 100 mM (4 10 6 S cm 1 s 1 ) to 600 mM (9 10 6 S cm 1 s 1 ). Key words: Electroconductive; hydrogel; polyaniline; polypyr- role; electroactive polymers; polymer composites; cyclic voltam- metry; electrochemical impedance spectroscopy; EPSIS. The recent emphasis on materials science and chem- istry has opened new approaches to analytical sensing, Author for correspondence. E-mail: [email protected]

Welcome message from author
This document is posted to help you gain knowledge. Please leave a comment to let me know what you think about it! Share it to your friends and learn new things together.
Transcript
Microchim. Acta 143, 123–137 (2003)
DOI 10.1007/s00604-003-0065-6
Original Paper
Chemical and Biological Sensors Based on ElectrochemicalDetection Using Conducting Electroactive Polymers
Sean Brahim1, Ann M. Wilson2;3, Dyer Narinesingh3, Emmanuel Iwuoha4,
and Anthony Guiseppi-Elie1;2;�
1 Departments of Chemical Engineering and The Center for Bioelectronics, Biosensors and Biochips (C3B),
Virginia Commonwealth University, School of Engineering, P.O. Box 843038, 601 West Main Street, Richmond,
Virginia 23284-3038, USA2 ABTECH Scientific, Inc., 911 East Leigh Street, Richmond, Virginia 23219, USA3 Department of Chemistry, University of the West Indies, St. Augustine, Republic of Trinidad and Tobago4 Department of Chemistry, University of the Western Cape, Bellville, CapeTown, South Africa
Received May 18, 2003; accepted June 12, 2003; published online November 17, 2003
# Springer-Verlag 2003
Abstract. The electrochemical behavior of compo-
sites of conducting electroactive polyaniline (PAn)
and polypyrrole (PPy) formulated within cross-linked
hydrogel networks was investigated by cyclic voltam-
metry and electrochemical impedance spectroscopy
(EIS). Composite PAn gels displayed similar anodic
charge density compared to the pristine conducting
polymer (80 mC=cm2 and 84 mC=cm2, respectively),
suggesting a similar degree of electroactivity between
the two systems. Composite gels of PAn displayed
fast cation transport with Kþ diffusivity (Dappt¼5.31�10�7 cm2s�1) that were three orders of magni-
tude larger than that of pristine PAn (Dappt¼3.12�10� 10 cm2s�1), while PPy composite gels
showed similar ferrocene anion diffusivity (Dappt¼7.05�10�5 cm2s�1) compared to electropolymerized
PPy (Dappt¼ 6.54�10�5 cm2s�1). The electrochemi-
cal interactions between CYP2D6, a cytochrome
P450 isoenzyme, and fluoxetine mediated by electro-
active polyaniline films on glassy carbon electrodes
(GCEs) were investigated. Cyclic voltammograms
indicate that PAn is an effective mediator of CYP2D6
activity under anaerobic conditions. An analytical
interrogation methodology based on small-amplitude,
pulsed DC was developed and incorporated into the
Electroconductive Polymer Sensor Interrogation Sys-
tem (EPSIS). Polypyrrole membranes were rendered
biospecific by either copolymerization of pyrrole (Py)
with 4-(1-pyrrolyl) butyric acid (4PyBA), followed by
direct conjugation with 5-(biotinamido)pentyl amine
(5BPA), or by reacting 4PyBA with 5BPA to form
pyrrolyl-biotin conjugates. The biotinylated PPy was
made responsive to glucose or urea by exploiting
strong biotin-streptavidin binding to either strepta-
vidin-glucose oxidase or biotin-urease conjugates.
These bioactive conducting polymer membranes were
demonstrated as conductimetric glucose and urea bio-
sensing layers using the EPSIS. The rate of conductiv-
ity of the bioactive PPy membranes was observed
to double upon increasing glucose concentration
from 100mM (4�10�6 S cm�1 s�1) to 600mM (9�10�6 S cm�1 s�1).
Key words: Electroconductive; hydrogel; polyaniline; polypyr-
role; electroactive polymers; polymer composites; cyclic voltam-
metry; electrochemical impedance spectroscopy; EPSIS.
The recent emphasis on materials science and chem-
istry has opened new approaches to analytical sensing,� Author for correspondence. E-mail: [email protected]
influencing the design of sensors, particularly those
using electrochemical or spectroscopic transduction
methods. Two groups of materials that have received
widespread applications research have been conduct-
ing electroactive polymers (CEPs) and hydrogels.
Conducting electroactive polymers (CEPs) are
advanced materials with tremendous prospects for
use in numerous applications such as sensors, actuator
components in microsurgical tools, controlled drug
delivery systems, corrective implantable aids, life-like
prosthetic limbs, actuators and artificial muscles [1].
Since the early 1990s, CEPs have been extensively
reported to function as thin films for batteries, sensors,
ion-selective electrodes and solid-state devices [2–6].
Of all the presently available CEPs, polypyrrole (PPy)
is generally considered to be the most promising for
the development of advanced sensor devices. This is
because of its good electrical conductivity, good
environmental stability, relative ease of synthesis [2,
7] and the potential for co-polymerization without
compromise of electroactivity. Polyaniline (PAn) has
also received considerable attention as a CEP because
of its unique conduction mechanism and environmen-
tal stability. It has been used primarily as a sensing
material for vapors such as methanol, ethanol, ace-
tone, benzene, etc. [8, 9].
Another interesting class of polymer that has gen-
erated much research and investigation is hydrogels.
One of the attractive features of these materials is that
they can be readily tailored to respond to specific
environmental stimuli such as pH, temperature and
ionic strength [10]. They may also possess high levels
of hydration, a very desirable property if the polymer
is to function as a matrix for biomolecule immobiliza-
tion. Several research groups have examined the
utility of hydrogels as sensors, by themselves or
chemically modified. Hydrogels have been employed
as the sensing layer in amperometric [11], potentio-
metric [12], conductimetric [13], and fibre-optic sen-
sors [14].
Over the last few years, special attention has been
given to the use of conducting polymeric composites
as a fabricating material for sensor devices [15]. Con-
ducting polymer composites or blends have been fab-
ricated by combining polypyrrole and=or polyaniline
with a host of polymers such as poly(vinyl chloride)
[16], polycarbonate [17], poly(vinyl alcohol) [18],
polyamides and imides [19], poly(ether ketone) [20],
nafion [21], and rubber [22]. Each of these efforts has
significantly modified the physical and mechanical
properties of the conducting polymer component and
has rendered them suitable for application in different
devices. Several research groups have investigated the
composites formed from CEPs and hydrogels for sen-
sing and controlled delivery applications. Wallace
et al. [23, 24] synthesized conducting polymer com-
posites of PPy and PAn with polyacrylamide and PPy
with poly(methylmethacrylate), demonstrating these
materials as controlled delivery devices. Dharwan
et al. [25] reported on the synthesis of a polyaniline-
(acrylonitrile-butadiene-styrene) composite membrane
as a sensor material for aqueous ammonia. Park and
Park [26] investigated the electrical properties of the
conducting composite poly(methylmethacrylate-co-
pyrrolylmethylstyrene)-g-polypyrrole. Guiseppi-Elie
et al. [27–30] synthesized bioactive composites of
polypyrrole- and polyaniline-containing poly(2-
hydroxyethyl methacrylate) hydrogels. These materi-
als were demonstrated as the sensing layer of stable
biosensors for clinically important analytes, and for
the electrostimulated release of bioactive peptides,
respectively.
In the present work, we report on the electrochemi-
cal characterization of electroconductive polypyrrole
and polyaniline co-polymers and hydrogel compo-
sites, and compare their electrochemical behavior to
the pristine CEPs. These copolymers and composites
allow the formation of polymer–biopolymer assem-
blies that serve as bio-smart materials, capable of
electrochemical response to biological stimuli. We
also describe a novel sensor technology platform,
the Electroconductive Polymer Sensor Interrogation
System (EPSIS). This instrument incorporates a
patented analytical methodology for sensor interroga-
tion of conducting electroactive polymer membranes
grown on microfabricated interdigitated microsensor
electrodes. The capability of the EPSIS sensor tech-
nology is demonstrated with PPy-based conducti-
metric glucose and urea biosensors.
Experimental
Materials
The monomer, 2-hydroxyethyl methacrylate 2-(HEMA), and
the prepolymers poly(ethylene glycol)(200) monomethacrylate
(PEG 200MMA) and poly-(2-hydroxyethyl methacrylate) (pHEMA)
were obtained from Polysciences, Inc., Warrington, PA. The cross-
linker, tetraethyleneglycol diacrylate (TEGDA), inhibitor remover
columns, aniline monomer (An) and dimer dianiline (DAn), pyrrole
(Py), photoinitiator dimethoxyphenyl acetophenone (DMPA), 3-
aminopropyltrimethoxysilane (�-APS), 3-methacryloxypropyltri-
124 S. Brahim et al.
methoxysilane (�-MPS), and N-[tris(hydroxymethyl)methyl] acryl-
amide (HMMA) were all obtained from Aldrich Co. (Milwaukee,
WI). The prepolymer methoxy-PEG(5000)-epoxide was obtained
from Shearwater Polymers, Inc. (Huntsville, AL). The potassium
salt of 1-(3-methacryloxy)propylsulfonate, the dopant for the com-
posite gels, was obtained from Sigma Chemical Co. (St. Louis,
MO). The N-hydroxy succinimide ester of biotin (sulfo-NHS-LC-
Biotin), 1,3-diisopropylcarbodiimide (DIPC), N-hydroxysulfosuccin-
imide (sulfo-NHS) and 5-(biotinamindo) pentyl amine (5BPA)
were obtained from Pierce and were used as received. Platinizing
solution of chloroplatinic acid (<5.0% w=v) and lead acetate
(<0.1% w=v) (YSI 3140) was purchased from YSI, Inc. (Yellow
Springs, OH). All other reagents used, including poly(styrenesul-
fonic acid) (PSS) (MW¼ 200,000), the dopant for pristine conduct-
ing electroactive polymers, and sodium dodecylbenzenesulfonate
(DBS), were of analytical reagent grade (Aldrich Co.) and used
without further purification. Prior to formulation, HEMA, HMMA,
and TEGDA were each passed over inhibitor remover columns to
remove the polymerization inhibitor, hydroquinone monomethyl
ether (MEHQ). The working electrodes used for electrochemical
characterization studies were either planar gold electrodes (PMEs)
(part number PME Au 118; 1.0 cm�1.8 cm) or microlithographi-
cally fabricated interdigitated microsensor electrodes (IMEs) (part
number IME 1050.5-M-Pt-U) that were purchased from ABTECH
Scientific Inc. (Richmond, VA). Each IME borosilicate glass chip
consisted of a pair of opposing electrodes comprising 10mm wide
platinum digits that were ca. 5 mm long and separated by 10mm
wide free spaces. There were 50 digits on each electrode bus that
established a tortuous path of 49.60 cm of exposed glass surface
between the digits.
Surface Preparation and Functionalization of Electrodes
The PMEs and IMEs were washed in boiling trichloroethylene,
followed by boiling acetone, 3 minutes in each solvent, then ultra-
sonically washed in isopropanol followed by distilled water. This
was followed by treatment at 60 �C for 10 seconds with a solution
comprising a 1:1:5 volume ratio of aqueous ammonia (0.1 M),
hydrogen peroxide (20% volume) and distilled water (RCA-clean).
The electrodes were then ultrasonically rinsed in deionised (DI)
water. An electroactive window that was 0.425 cm in diameter was
defined on each PME and IME using adhesive backed polyimide
tape. The windowed Au PME electrodes were then modified with
4-aminothiophenol and the primary amine subsequently derivatized
with methoxy-PEG(5000)-epoxide by reaction at 110 �C for
10 min. The exposed glass of the interdigit spaces of the windowed
IMEs were surface-modified with 3-aminmopropyltrimethoxy
silane followed by surface derivatization with methoxy-PEG
(5000)-epoxide. These surface modifications were done to prevent=minimize subsequent hydrogel disbondment from the electro-
des upon immersion and repeated redox cycling in aqueous
solution.
Formulation of Electroconductive Hydrogels
A typical electroconductive gel formulation contained the mono-
mers and prepolymers in the ratio shown in Table 1. To each 5 g
batch of this formulation was added 20% by weight of DI water
(1 g) and ethylene glycol (1 g) as mixed solvent. The acrylate
monomers HEMA and TEGDA, along with the respective electro-
active monomer (Py or An and DAn), were first mixed together
with the other components and used as the receiving mixture to
dissolve the photoinitiator. An appropriate quantity (typically 3mL)
of the formulated gel-monomer mixture was then applied to the
window, and a thin film was cast over the working electrode area
by spin coating at ca. 3000 r.p.m for 5 seconds. The mixture was
immediately irradiated with U.V. light (366 nm, 2.3 watts=cm2,
Spectroline Model 330844) for 30 minutes under an inert argon
atmosphere to effect polymerization of the hydrogel component.
For hydrogel composites of polyaniline, the conducting electroac-
tive component of the composite membrane was grown within the
interstitial spaces of the pre-formed hydrogel network by two
techniques: oxidative chemical polymerization and oxidative elec-
tropolymerization. Chemical oxidation of aniline was effected by
exposure of the aniline-impregnated hydrogels to 0.10 M FeCl3(ca. 25mL, pH 1.4) at 20 �C for 1 h. Electropolymerized polyani-
line hydrogels were prepared by potentiostatic electropolymeriza-
tion (þ0.70 V vs. Ag=AgCl, 3 M Cl�) of the entrapped monomer
from deaerated 1.0 M An, 0.01 M DAn, and 2.0 M HCl held at
20 �C. The film was allowed to grow on the electrodes such that a
fully contiguous membrane was formed. Finally, a mixed mode
technique combining the above two approaches was also used to
prepare composite gels. In this scheme, electroactive aniline mono-
mer within the pre-formed hydrogel membrane was exposed to
FeCl3 prior to electropolymerization. With each technique, un-
polymerized monomer was removed by sequential washing for
30 min in each of 100% ethanol, 75%, 50%, 25% ethanol-water
mixtures, and finally in DI water.
The composition of the electroconductive PPy–hydrogel that
was selected (Table 1) corresponded to the formulation used in
the construction of amperometric biosensors [28]. This formulation
consisted of the monomers HEMA:TEGDA:Py in a ratio of
85:10:05 mol%. Immediately following UV-initiated polymeriza-
tion of the hydrophilic hydrogel network, the electrode-supported
membrane was immersed into 3 mL of a deaerated phosphate
buffered KCl solution (0.1 M NaH2PO4 containing 0.1 M KCl,
pH 7.2) that was saturated with pyrrole monomer (ca. 0.4 M).
The polypyrrole component of the composite membrane was
deposited within the interstitial spaces of the pre-formed hydrogel
network by potentiostatic electropolymerization (þ0.85 V vs.
Ag=AgCl, 3 M Cl�) for 100 seconds. This resulted in a typical
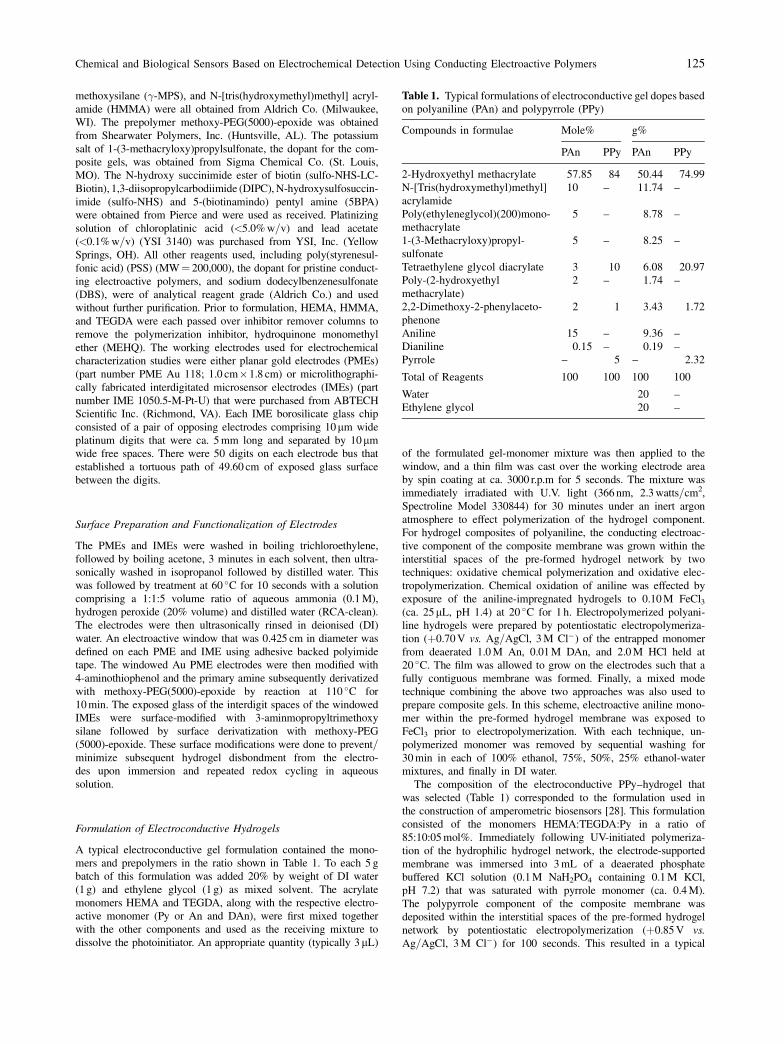
Table 1. Typical formulations of electroconductive gel dopes based
on polyaniline (PAn) and polypyrrole (PPy)
Compounds in formulae Mole% g%
PAn PPy PAn PPy
2-Hydroxyethyl methacrylate 57.85 84 50.44 74.99
N-[Tris(hydroxymethyl)methyl]
acrylamide
10 – 11.74 –
Poly(ethyleneglycol)(200)mono-
methacrylate
5 – 8.78 –
1-(3-Methacryloxy)propyl-
sulfonate
5 – 8.25 –
Tetraethylene glycol diacrylate 3 10 6.08 20.97
Poly-(2-hydroxyethyl
methacrylate)
2 – 1.74 –
2,2-Dimethoxy-2-phenylaceto-
phenone
2 1 3.43 1.72
Aniline 15 – 9.36 –
Dianiline 0.15 – 0.19 –
Pyrrole – 5 – 2.32
Total of Reagents 100 100 100 100
Water 20 –
Ethylene glycol 20 –
Chemical and Biological Sensors Based on Electrochemical Detection Using Conducting Electroactive Polymers 125
polymerization charge of ca. 90�10�3 C. The electrodes were
then rinsed with phosphate buffer (0.1 M, pH 7.0) to remove any
residual monomer.
Synthesis of 4-(1-Pyrrolyl) Butyric Acid (4PyBA)
4-(1-pyrrolyl) butyric acid (4PyBA) was synthesized using proce-
dures analogous to the methods of Kakushima [31] and Ryder [32].
Briefly, succinic anhydride (9.75 g, 97%) was added at room tem-
perature to a suspension of AlCl3 (28.0 g) in 400 mL dichloroethane
(dry). The mixture was stirred at room temperature for 20 minutes.
A solution of phenylsulfonylpyrrole (20 g, 98%) in 50 mL of
dichloroethane was added, and the mixture was stirred for 4 h at
room temperature. The reaction was quenched with about 500 g ice
and the product extracted 3 times with dichloromethane. The
dichloromethane extract was washed once with water, and the sol-
vent was removed using a rotary evaporator. Recrystallization from
dichloromethane gave the product of 4-(1-(phenylsulfonyl)-3-pyrro-
lyl)-oxobutyric acid (27.12 g). A mixture of zinc granules (300 g)
and mercuric chloride (5.0 g) in 100 mL water with 4.0 mL HCl
added was shaken at room temperature for 10 minutes. The super-
natant was decanted. To this solid was added 40 mL water, 100 mL
12 N HCl, 250 mL toluene and 20.0 g 4-(1-(phenylsulfonyl)-3-pyr-
rolyl)-oxobutyric acid. The mixture was refluxed for 36 hours during
which time 4�20 mL 12 N HCl was added. After cooling, the
organic layer was separated, and the aqueous layer was washed 3
times with toluene. The combined organic extract was evaporated to
dryness to give a solid of 4-(1-(phenylsulfonyl)-3-pyrrolyl)-butyric
acid. Under N2, the solid was stirred in a solution of 100 mL metha-
nol and 100 mL 5 N NaOH at 21 �C for 24 h and at 75 �C (bathing
temperature) for 4 h. After cooling, it was acidified with dilute HCl
to pH 5–6 and extracted with dichloromethane four times. The
combined organic extract was washed once with water. Removal
of solvent and recrystallization in dichloromethane gave a final
product of 2.9 g. mp 92–94 �C; FT-IR (KBr) 2964 (br), 1717 (br),
3400, 3075, 2915, 1466, 1353, 1293, 1246, 1210, 1177, 1082, 1058,
916, 784, 602 cm�1; lH NMR (300 MHz, CDCl3) � 8.1 (1 H, br,
NH), 7.3 (1 H, s, CO2H), 6.76 (1 H, d, H 5, pyrrole), 6.6 (1 H, d, H 4,
pyrrole), 6.13 (1 H, s, H 2, pyrrole), 2.62 (2 H, t, C4 H) 2.4 (2 H, m,
C2 H), 1.93 (2 H, quintet, C3 H).
Bioimmobilization
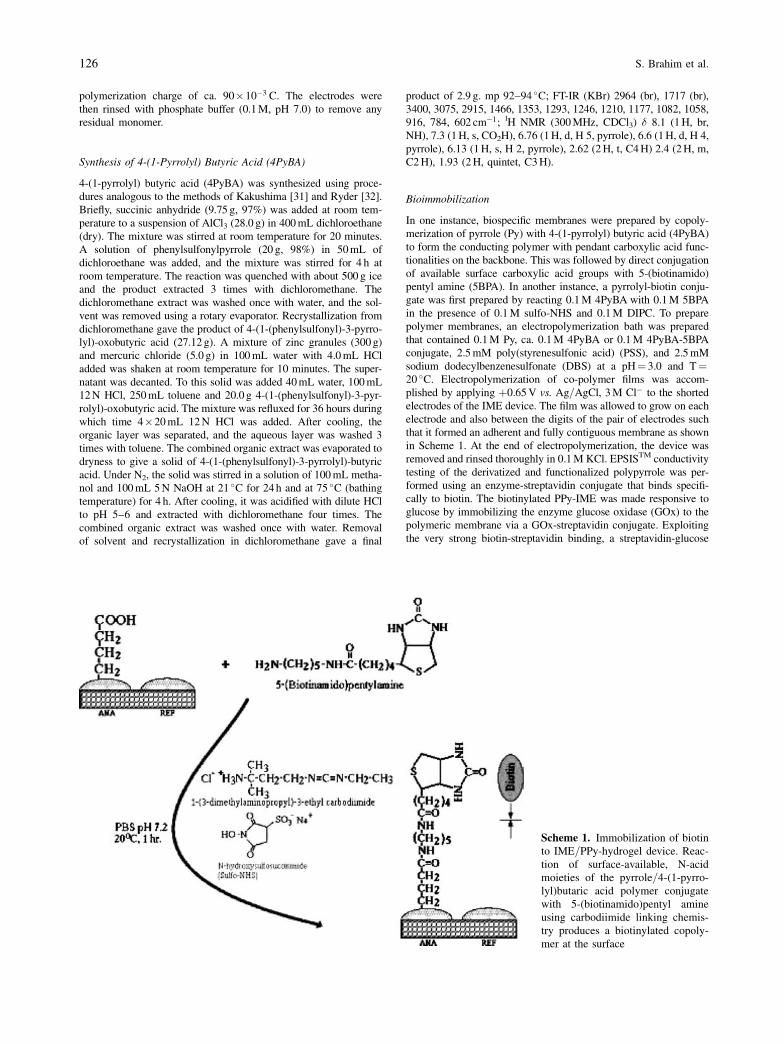
In one instance, biospecific membranes were prepared by copoly-
merization of pyrrole (Py) with 4-(1-pyrrolyl) butyric acid (4PyBA)
to form the conducting polymer with pendant carboxylic acid func-
tionalities on the backbone. This was followed by direct conjugation
of available surface carboxylic acid groups with 5-(biotinamido)
pentyl amine (5BPA). In another instance, a pyrrolyl-biotin conju-
gate was first prepared by reacting 0.1 M 4PyBA with 0.1 M 5BPA
in the presence of 0.1 M sulfo-NHS and 0.1 M DIPC. To prepare
polymer membranes, an electropolymerization bath was prepared
that contained 0.1 M Py, ca. 0.1 M 4PyBA or 0.1 M 4PyBA-5BPA
conjugate, 2.5 mM poly(styrenesulfonic acid) (PSS), and 2.5 mM
sodium dodecylbenzenesulfonate (DBS) at a pH¼ 3.0 and T¼20 �C. Electropolymerization of co-polymer films was accom-
plished by applying þ0.65 V vs. Ag=AgCl, 3 M Cl� to the shorted
electrodes of the IME device. The film was allowed to grow on each
electrode and also between the digits of the pair of electrodes such
that it formed an adherent and fully contiguous membrane as shown
in Scheme 1. At the end of electropolymerization, the device was
removed and rinsed thoroughly in 0.1 M KCl. EPSISTM conductivity
testing of the derivatized and functionalized polypyrrole was per-
formed using an enzyme-streptavidin conjugate that binds specifi-
cally to biotin. The biotinylated PPy-IME was made responsive to
glucose by immobilizing the enzyme glucose oxidase (GOx) to the
polymeric membrane via a GOx-streptavidin conjugate. Exploiting
the very strong biotin-streptavidin binding, a streptavidin-glucose
Scheme 1. Immobilization of biotin
to IME=PPy-hydrogel device. Reac-
tion of surface-available, N-acid
moieties of the pyrrole=4-(1-pyrro-
lyl)butaric acid polymer conjugate
with 5-(biotinamido)pentyl amine
using carbodiimide linking chemis-
try produces a biotinylated copoly-
mer at the surface
126 S. Brahim et al.
oxidase conjugate (1 mg mL�1) was allowed to couple to the bio-
tinylated surface of the polymer membrane in phosphate buffer-
ed saline, pH 7.2, at 15� for 1 h. Alternatively, streptavidin
(1 mg mL�1) was allowed to couple to the biotinylated surface of
the PPy-membrane under identical conditions, followed by subse-
quent coupling of a biotin-urease conjugate that was prepared as
described previously [33]. The response of the resulting PPy-based
conductimetric biosensors to glucose and urea, respectively, was
determined using EPSIS.
Characterization of Polymer, Copolymer and Polymer
Composite Membranes
For all electrochemical characterization studies (cyclic voltammetry,
EIS and EPSIS) composite membranes of the electroconductive
hydrogels were prepared as outlined above on cleaned microlitho-
graphically fabricated interdigitated microsensor electrodes (IMEs)
and=or gold planar metal electrodes (PMEs). Prior to polymer mem-
brane deposition, the digits of the IME (1050.5-M-Pt-U) were plat-
inized via controlled potential coulometry using a current density of
21 mA=cm2 (49 mC). The set-up for three-electrode electrochemis-
try consisted of a Perkin-Elmer Princeton Applied Research Model
273 Potentiostat=Galvanostat linked to a Gateway PC and controlled
by Perkin-Elmer PAR M272 software. Cyclic voltammetry, ampero-
metry, electrochemical polymerization and coulometry were per-
formed in a standard three-electrode cell with a miniature Ag=AgCl, 3 M Cl� reference electrode (RE 803; ABTECH Scientific,
Inc., Richmond, VA) and a platinum mesh counter electrode. Three-
electrode electrochemical impedance spectra (10 mVamplitude; sine
wave; 1 mHz–60 kHz; 20� 1 �C) were obtained using a Perkin-
Elmer PAR Model 273 Potentiostat=Galvanostat coupled with
a Solartron Schlumberger 1250 Frequency Response Analyzer
(FRA). The FRA was used in single-sine mode to cover the range
1 Hz–60 kHz, and the Model 273 was used in multi-sine mode to
cover the range 1 mHz–1 Hz. The Perkin-Elmer PAR M398 soft-
ware was used for data capture, data merging and analysis. Two-
point electrical resistance measurements of the polymer membranes
were made using a Keithley Model 2000 Multimeter. The EPSIS
(Electroconductive Polymer Sensor Interrogation System) was used
to characterize the biologically modulated changes in conductivity
of the conducting polymer films. EPSIS employs a unique and
patented [34] interrogation method specifically developed for
obtaining the conductimetric signal amplification derived from
electroconductive polymer transducers [35]. This method is most
effectively performed on electroconductive polymer transducers
formed from interdigitated microsensor electrodes (IME) onto
which are coated the chemically sensitive electroconductive poly-
mer membranes.
Results and Discussion
Cyclic Voltammetry
Cyclic voltammograms (CVs) were obtained for both
electropolymerized pristine conducting polymers and
the electroconductive composite membrane compris-
ing polyaniline and=or polypyrrole electropolymer-
ized within the UV polymerized p(HEMA)-based
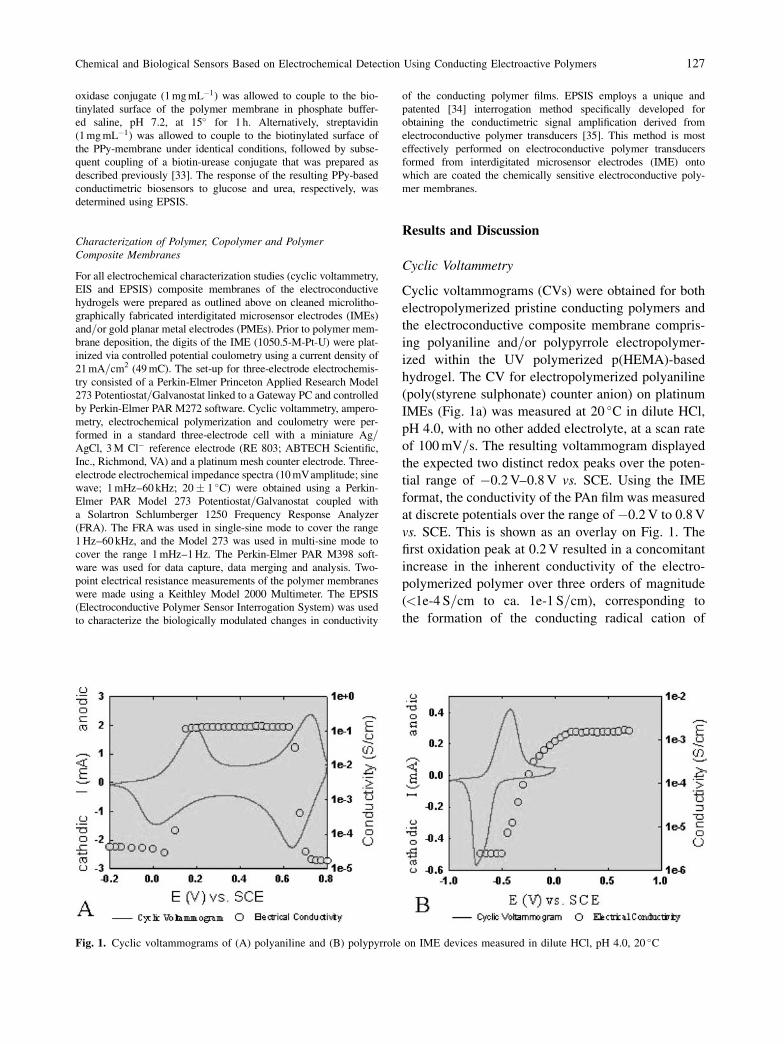
hydrogel. The CV for electropolymerized polyaniline
(poly(styrene sulphonate) counter anion) on platinum
IMEs (Fig. 1a) was measured at 20 �C in dilute HCl,
pH 4.0, with no other added electrolyte, at a scan rate
of 100 mV=s. The resulting voltammogram displayed
the expected two distinct redox peaks over the poten-
tial range of �0.2 V–0.8 V vs. SCE. Using the IME
format, the conductivity of the PAn film was measured
at discrete potentials over the range of �0.2 V to 0.8 V
vs. SCE. This is shown as an overlay on Fig. 1. The
first oxidation peak at 0.2 V resulted in a concomitant
increase in the inherent conductivity of the electro-
polymerized polymer over three orders of magnitude
(<1e-4 S=cm to ca. 1e-1 S=cm), corresponding to
the formation of the conducting radical cation of
Fig. 1. Cyclic voltammograms of (A) polyaniline and (B) polypyrrole on IME devices measured in dilute HCl, pH 4.0, 20 �C
Chemical and Biological Sensors Based on Electrochemical Detection Using Conducting Electroactive Polymers 127
imino-1,4-phenylene (–NH�þA�C6H4–). The second
oxidation peak occurred at around 0.7 V, and this
redox phenomenon was associated with a decrease
in polymer conductivity back to initial low values
approaching 1e-5 S=cm, corresponding to the forma-
tion of the non-conducting pernigraniline (–N¼C6H4¼NC6H4–). On the cathodic half wave, the
corresponding reduction potential peaks occurred at
0.65 V and 0 V, respectively. The formal potential
E�0, associated with each pair of redox peaks, was
determined to be 0.12 V (corresponding to the first
redox pair) and 0.68 V (corresponding to the second
redox pair). The peak separation between anodic and
cathodic peak potentials (�Ep) was smaller for the
second redox couple, ca. 0.05 V, compared to 0.2 V
for the first redox couple. It is noteworthy that using
the interdigitated microsensor electrode (IME) chip
format, the conductivity displayed sharp transitions
coincident with the E�0 of these redox reactions. This
has been previously shown as a maximum between
the redox transitions [36].
The CV for electropolymerized polypyrrole, doped
with poly(styrene sulphonate), on a platinum IME was
also measured at 20 �C in dilute HCl, pH 4.0, at a scan
rate of 100 mV=s. The resulting voltammogram (Fig.
1b) displayed the characteristic two distinct redox
peaks over the potential range of �1.0 V to 1.0 V vs.
SCE. The absence of electroactivity over positive
potentials, typical of voltammograms of polypyrrole
doped with Cl�, was due to the nature of the dopant
anion incorporated into the film, as well as the choice
of solvent. The oxidation peak occurred at around
�0.45 V, which resulted in a concomitant sharp
increase in the inherent conductivity of the electropo-
lymerized polymer over three orders of magnitude
(near 1e-6 S=cm to >1e-3 S=cm). On the cathodic
half wave, the corresponding reduction peak occurred
at ca. �0.75 V, with a subsequent return to the elec-
trically insulating form of polypyrrole as shown by the
sharp reduction in conductivity. Like the polyaniline
conductivity profile, the conductivity transitions
observed for polypyrrole measured using the IME
chip format were similarly very sharp and coincident
with the E�0 of the characteristic redox reaction. The
formal potential, E�0, was determined to be �0.60 V.
The peak separation between anodic and cathodic
peak potentials (�Ep) was 0.3 V. The current ratio,
Ipc=Ipa, was ca. 1.5 at the scan rate investigated, sug-
gesting that the cathodic reaction is more facile than
the anodic reaction under these experimental condi-
tions. That is, the reduction of the PPyjPSS film,
which involves ingress of cations from solution into
the film to establish electroneutrality, is more electro-
chemically feasible and occurs more readily than the
alternate egress of cations into solution, which char-
acterizes the oxidation of the PPyjPSS film.
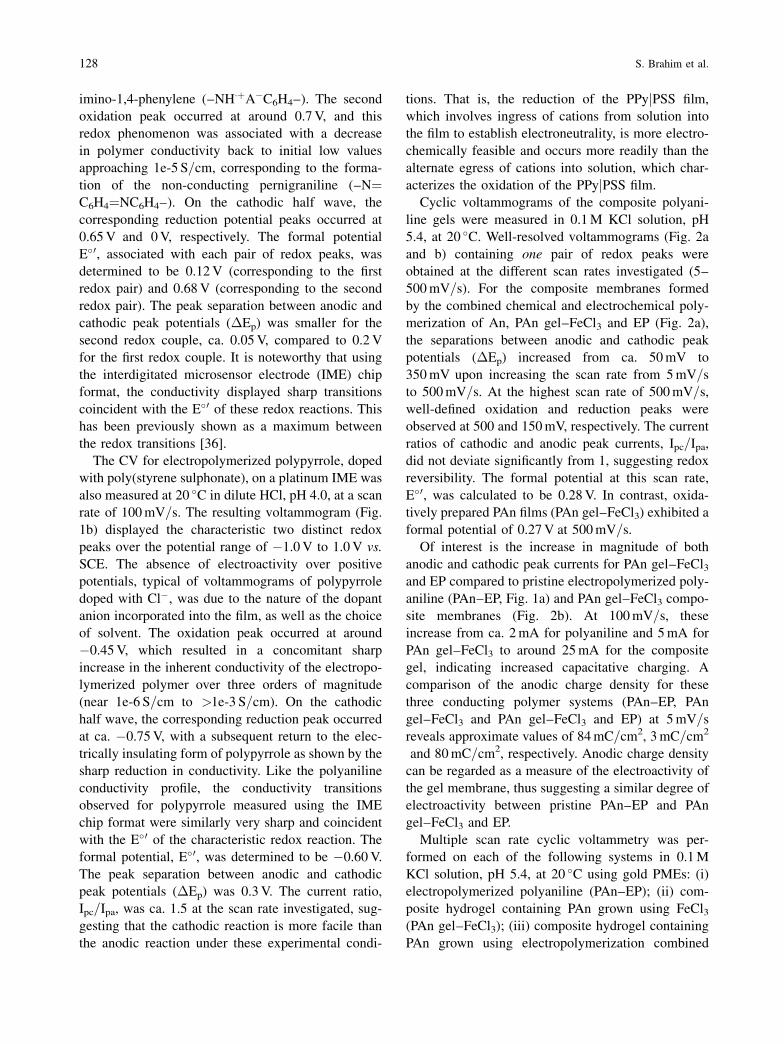
Cyclic voltammograms of the composite polyani-
line gels were measured in 0.1 M KCl solution, pH
5.4, at 20 �C. Well-resolved voltammograms (Fig. 2a
and b) containing one pair of redox peaks were
obtained at the different scan rates investigated (5–
500 mV=s). For the composite membranes formed
by the combined chemical and electrochemical poly-
merization of An, PAn gel–FeCl3 and EP (Fig. 2a),
the separations between anodic and cathodic peak
potentials (�Ep) increased from ca. 50 mV to
350 mV upon increasing the scan rate from 5 mV=s
to 500 mV=s. At the highest scan rate of 500 mV=s,
well-defined oxidation and reduction peaks were
observed at 500 and 150 mV, respectively. The current
ratios of cathodic and anodic peak currents, Ipc=Ipa,
did not deviate significantly from 1, suggesting redox
reversibility. The formal potential at this scan rate,
E�0, was calculated to be 0.28 V. In contrast, oxida-
tively prepared PAn films (PAn gel–FeCl3) exhibited a
formal potential of 0.27 V at 500 mV=s.
Of interest is the increase in magnitude of both
anodic and cathodic peak currents for PAn gel–FeCl3and EP compared to pristine electropolymerized poly-
aniline (PAn–EP, Fig. 1a) and PAn gel–FeCl3 compo-
site membranes (Fig. 2b). At 100 mV=s, these
increase from ca. 2 mA for polyaniline and 5 mA for
PAn gel–FeCl3 to around 25 mA for the composite
gel, indicating increased capacitative charging. A
comparison of the anodic charge density for these
three conducting polymer systems (PAn–EP, PAn
gel–FeCl3 and PAn gel–FeCl3 and EP) at 5 mV=s
reveals approximate values of 84 mC=cm2, 3 mC=cm2
and 80 mC=cm2, respectively. Anodic charge density
can be regarded as a measure of the electroactivity of
the gel membrane, thus suggesting a similar degree of
electroactivity between pristine PAn–EP and PAn
gel–FeCl3 and EP.
Multiple scan rate cyclic voltammetry was per-
formed on each of the following systems in 0.1 M
KCl solution, pH 5.4, at 20 �C using gold PMEs: (i)
electropolymerized polyaniline (PAn–EP); (ii) com-
posite hydrogel containing PAn grown using FeCl3(PAn gel–FeCl3); (iii) composite hydrogel containing
PAn grown using electropolymerization combined
128 S. Brahim et al.
with FeCl3 (PAn gel–FeCl3–EP). From these scans,
approximate apparent diffusion coefficients for the Kþ
cation were determined for each polymer system
using the Randles-Sevcik equation:
ip ¼ 2:686�105 n3=2CoxD1=2v1=2A
Developed for solution species under semi-infinite lin-
ear diffusion conditions, this equation provides only
an indication of the differences in diffusion coeffi-
cients when applied to surface-confined polymer
films. Analysis of the peak anodic and cathodic cur-
rents (Ip) as a function of scan rate (v1=2) revealed the
diffusivity (D) for Kþ that was 5.31�10�7 cm2s�1 in
PAn gel–FeCl3–EP, 3.12�10�8 cm2s�1 in PAn gel–
FeCl3, and 3.12�10�10 cm2s�1 in PAn–EP. Table 2
summarizes the apparent diffusion coefficients, Dappt,
obtained for these different materials and compared to
that of ferrocene monocarboxylic acid obtained under
similar conditions at a bare or unmodified planar gold
electrode. Thus, the electroconductive gels containing
PAn prepared by the mixed-mode technique showed
the fastest rate of cation transport of all the mem-
branes and was three orders of magnitude larger than
that of electropolymerized PAn. However, this apparent
diffusion coefficient was one order of magnitude less
Fig. 2. Cyclic voltammograms of electroconductive polyaniline hydrogels (A) synthesized by the mixed mode technique: PAn gel–FeCl3–
EP and (B) by chemical oxidation: PAn gel–FeCl3 and (C) electroconductive polypyrrole hydrogels: PPy gel–EP on IME devices measured
in 0.1 M KCl solution, pH 5.4, 20 �C (PAn gel–FeCl3–EP and PAn gel–FeCl3) and 0.1 M phosphate buffered KCl, pH 7.4, 25 �C (PPy
gel–EP)
Table 2. Apparent diffusion coefficients (Dappt) for ferrocene
monocarboxylate at different electrode surfaces
‘‘Material’’ Apparent diffusion
coefficient (Dappt)=cm2s�1
Au 3.70�10�6
Pt 3.46�10�5
AujPAn–EP 3.12�10�10
AujPAn gel–FeCl3 3.12�10�8
AujPAn gel–FeCl3–EP 5.31�10�7
PtjPPy–EP 6.54�10�5
PtjPPy gel–EP 7.05�10�5
Chemical and Biological Sensors Based on Electrochemical Detection Using Conducting Electroactive Polymers 129
than solution phase ferrocene monocarboxylic acid.
This confirms that electroconductive hydrogel compo-
sites offer faster redox switching speeds compared to
the pure electroactive polymers because of the signif-
icant hydration levels contributed by the hydrogel
component.
Cyclic voltammograms of the composite electro-
conductive hydrogel after electropolymerization of
incorporated pyrrole monomer at þ0.85 V vs.
Ag=AgCl for 100 s showed retained electroactivity
(Fig. 2c). Anodic and cathodic peak potential separa-
tions were observed to increase with scan rate, from
0.18 V at 10 mV=s up to 0.34 V at 100 mV=s, similar
to the �Ep for pristine electropolymerized polypyr-
role at 100 mV=s. The current ratios, Ipc=Ipa, averaged
around 1.4 over the four scan rates investigated sug-
gesting that, like the electropolymerized polypyrrole,
the cathodic reaction is more facile than the anodic
reaction for the electroconductive gel. Likewise, the
formal potential (E�0) of the composite shifted to more
negative values, �0.40 to �0.47 V, upon increasing
the scan rate to 100 mV=s. The overall impact of com-
posite formation is to force the cathodic reaction to
more negative potentials suggesting less facile egress
of anions or ingress of cations under the swollen con-
ditions of the hydrogel composite.
Multiple scan rate cyclic voltammetry was per-
formed on platinum PMEs coated with the following
membranes: (i) uncoated platinum (Pt); (ii) electropo-
lymerized polypyrrole (PPy–EP); (iii) electroconduc-
tive PPy gel (PPy gel–EP) in 0.1 M PBKCl solution,
pH 7.0 at 25 �C containing 15 mM ferrocene mono-
carboxylic acid. From these scans the apparent
diffusion coefficients for the ferrocene anion were
determined for each system as before and summarized
in Table 2. Using the peak cathodic currents, the diffu-
sivity (D) for ferrocene anion was calculated to
be 3.46�10�5 cm2s�1 at the bare Pt electrode,
6.54�10�5 cm2s�1 in pristine PPy (PPy–EP), and
7.05�10�5 cm2s�1 in PPy gel–EP. Thus the rate of
diffusion of the ferrocene carboxylate anion is ob-
served to double at platinum electrodes coated with
the electroconductive PPy gel membrane compared to
bare, unmodified electrodes.
Electrochemical Impedance Spectroscopy
Both the ‘blank’ hydrogel without any PAn and elec-
troconductive PAn–hydrogel were grown on platinum
IMEs, immersed in deaerated 0.10 M KCl at 20 �C
and subjected to frequency-dependent impedimetric
analyses at three different inquiring or offset poten-
tials; �300 mV, 215 mV and 800 mV. These potentials
were selected to interrogate the composite hydrogel
under fully reducing, intermediate redox, and fully
oxidizing electrochemical states, respectively. EIS
interrogation was performed over the frequency range
of 0.10 mHz to 100 kHz using a sine wave voltage
pattern of 10 mV peak voltage. The two electrodes
of the interdigitated array served as working and aux-
iliary electrodes, respectively, while the reference
electrode (Ag=AgCl, 3 M Cl�) was placed in the elec-
trolyte and in close proximity to the hydrogel surface.
Figure 3a shows a Bode plot of the impedance (mag-
nitude and phase) of polyaniline-free hydrogel coated
IMEs. There was almost complete superpositioning of
the impedance magnitude, jZj, at all potentials and
across the entire frequency range interrogated. Sweep-
ing over the frequency range from low (0.1 mHz) to
high (100 kHz) was accompanied by an inherent
decrease in network impedance by ca. 4 orders of
magnitude. The impedance upon approaching DC
was in all cases ca. 1 MOhm. Interrogating the hydro-
gel at the three potentials did not cause the phase
profiles to deviate significantly from each other, with
a minimum phase angle occurring near 100 Hz for all.
With the electroconductive PAn gel coated IME,
the resulting Bode plot of network impedance (mag-
nitude and phase, Fig. 3b) showed distinct profiles
depending on the inquiring potential. At �300 mV,
the profile of impedance magnitude, jZj, resembled
that for the blank hydrogel at the same potential, with
a slight reduction in impedance magnitude at frequen-
cies approaching DC. The corresponding phase plot
also resembled that for the blank hydrogel with a
phase angle minimum near 100 Hz, but there was also
the appearance of a second inflexion point around
10 kHz. At this potential, the polyaniline component
of the composite gel is fully reduced and hence elec-
trically insulating, contributing to the observed high
network impedance magnitude. Upon increasing the
offset potential to 215 mV, there was a dramatic
reduction in network impedance magnitude (>2
orders of magnitude) over the low to medium fre-
quency interrogation range compared to the profile
obtained at �300 mV. At this oxidizing potential,
there was frequency independence of network impe-
dance magnitude over the entire range investigated
and frequency independence of network phase angle
up to 1 kHz. At 800 mV, there was still further
130 S. Brahim et al.
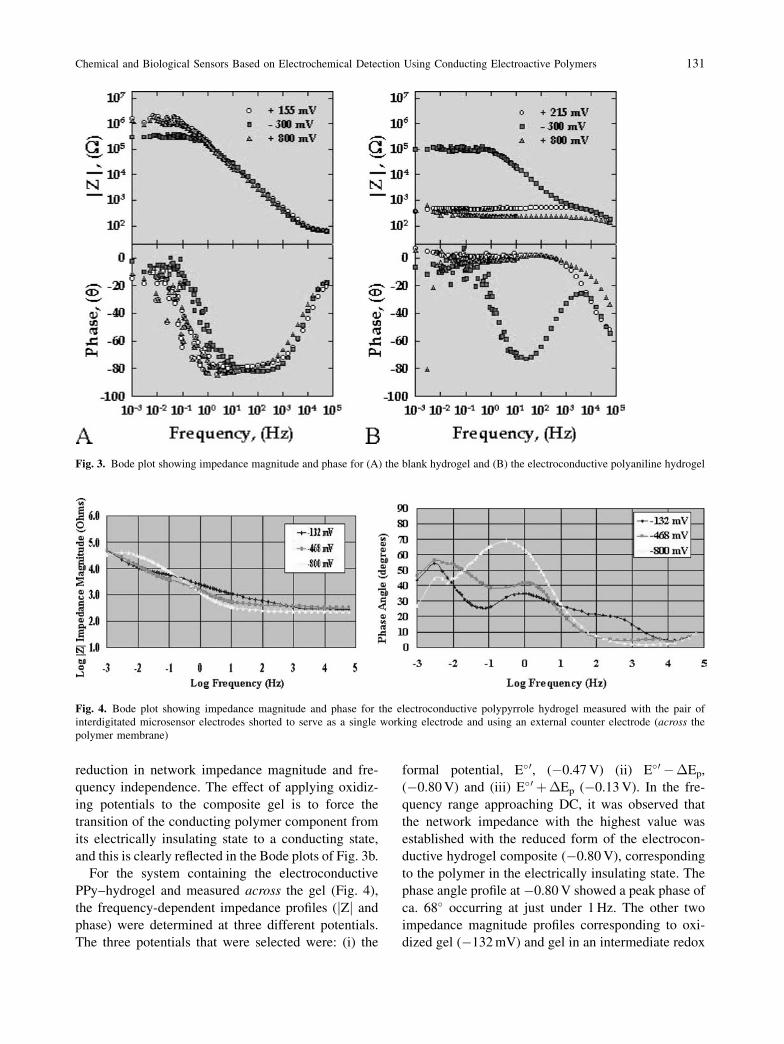
reduction in network impedance magnitude and fre-
quency independence. The effect of applying oxidiz-
ing potentials to the composite gel is to force the
transition of the conducting polymer component from
its electrically insulating state to a conducting state,
and this is clearly reflected in the Bode plots of Fig. 3b.
For the system containing the electroconductive
PPy–hydrogel and measured across the gel (Fig. 4),
the frequency-dependent impedance profiles (jZj and
phase) were determined at three different potentials.
The three potentials that were selected were: (i) the
formal potential, E�0, (�0.47 V) (ii) E�0 ��Ep,
(�0.80 V) and (iii) E�0 þ�Ep (�0.13 V). In the fre-
quency range approaching DC, it was observed that
the network impedance with the highest value was
established with the reduced form of the electrocon-
ductive hydrogel composite (�0.80 V), corresponding
to the polymer in the electrically insulating state. The
phase angle profile at �0.80 V showed a peak phase of
ca. 68� occurring at just under 1 Hz. The other two
impedance magnitude profiles corresponding to oxi-
dized gel (�132 mV) and gel in an intermediate redox
Fig. 3. Bode plot showing impedance magnitude and phase for (A) the blank hydrogel and (B) the electroconductive polyaniline hydrogel
Fig. 4. Bode plot showing impedance magnitude and phase for the electroconductive polypyrrole hydrogel measured with the pair of
interdigitated microsensor electrodes shorted to serve as a single working electrode and using an external counter electrode (across the
polymer membrane)
Chemical and Biological Sensors Based on Electrochemical Detection Using Conducting Electroactive Polymers 131
state (�468 mV) displayed similar network impedance
values in this frequency range. Between the frequency
range 0.1–1000 Hz, however, the oxidized form of the
electroconductive PPy–hydrogel exhibited the highest
network impedance, with the intermediate redox state
having network impedance magnitudes between the
oxidized and reduced forms of the gel. The phase angle
plots obtained for oxidized and intermediate redox
states of electroconductive PPy–gel both showed peak
phase angles of 35� and 42� respectively at ca. 1 Hz.
Thus it can be concluded that the network impe-
dance varies with the nature of the electroconductive
gel and its redox state. Network impedance near the
DC region and low-to-mid frequency range is
observed to be lowest with the electroconductive
polyaniline in the oxidized state, where frequency
independence is observed.
Polyaniline-Based CYP2D6 Biosensors
Fluoxetine hydrochloride (Prozac+), a selective sero-
tonin re-uptake inhibitor (SSRI), is currently an effec-
tive and widely prescribed drug routinely dispensed to
adults and children for the treatment of major depres-
sive disorders [36]. Multiple cytochrome P450 isoen-
zymes, including CYP2D6, are responsible for the
conversion of fluoxetine to norfluoxetine; norfluo-
xetine’s potency and selectivity as a serotonin uptake
blocker are essentially equivalent to fluoxetine’s. The
electrochemical interactions between CYP2D6 and
fluoxetine mediated by electroactive polyaniline films
on glassy carbon electrodes (GCEs) were investigated.
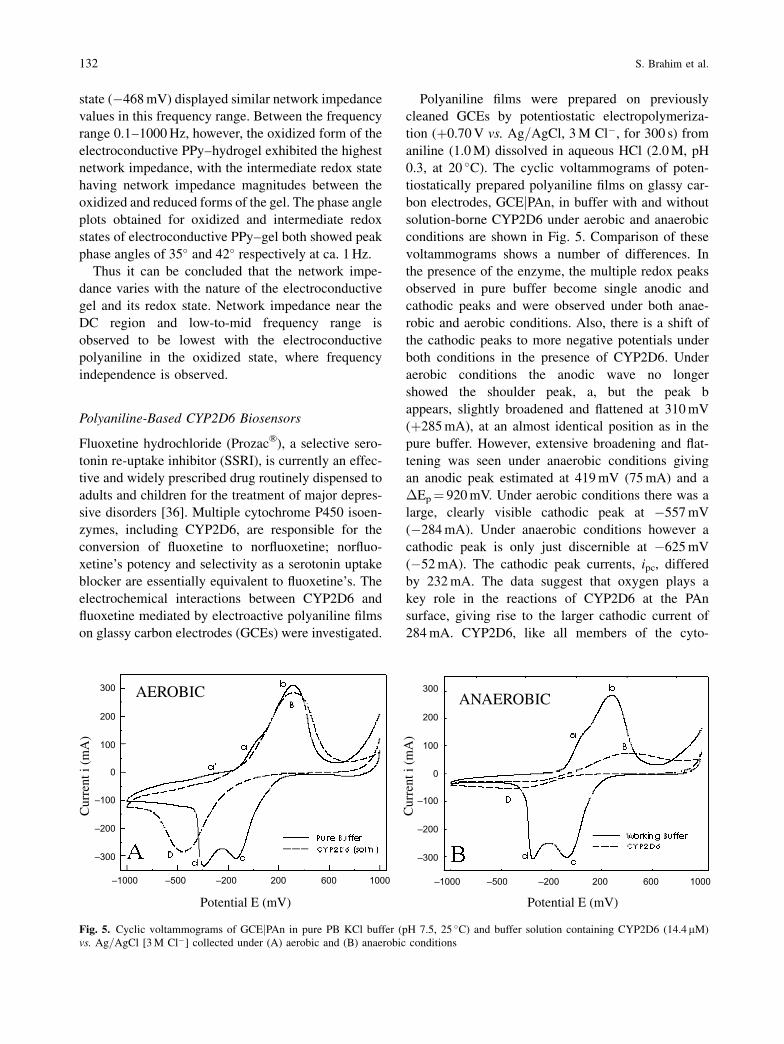
Polyaniline films were prepared on previously
cleaned GCEs by potentiostatic electropolymeriza-
tion (þ0.70 V vs. Ag=AgCl, 3 M Cl�, for 300 s) from
aniline (1.0 M) dissolved in aqueous HCl (2.0 M, pH
0.3, at 20 �C). The cyclic voltammograms of poten-
tiostatically prepared polyaniline films on glassy car-
bon electrodes, GCEjPAn, in buffer with and without
solution-borne CYP2D6 under aerobic and anaerobic
conditions are shown in Fig. 5. Comparison of these
voltammograms shows a number of differences. In
the presence of the enzyme, the multiple redox peaks
observed in pure buffer become single anodic and
cathodic peaks and were observed under both anae-
robic and aerobic conditions. Also, there is a shift of
the cathodic peaks to more negative potentials under
both conditions in the presence of CYP2D6. Under
aerobic conditions the anodic wave no longer
showed the shoulder peak, a, but the peak b
appears, slightly broadened and flattened at 310 mV
(þ285 mA), at an almost identical position as in the
pure buffer. However, extensive broadening and flat-
tening was seen under anaerobic conditions giving
an anodic peak estimated at 419 mV (75 mA) and a
�Ep¼ 920 mV. Under aerobic conditions there was a
large, clearly visible cathodic peak at �557 mV
(�284 mA). Under anaerobic conditions however a
cathodic peak is only just discernible at �625 mV
(�52 mA). The cathodic peak currents, ipc, differed
by 232 mA. The data suggest that oxygen plays a
key role in the reactions of CYP2D6 at the PAn
surface, giving rise to the larger cathodic current of
284 mA. CYP2D6, like all members of the cyto-
Fig. 5. Cyclic voltammograms of GCEjPAn in pure PB KCl buffer (pH 7.5, 25 �C) and buffer solution containing CYP2D6 (14.4 mM)
vs. Ag=AgCl [3 M Cl�] collected under (A) aerobic and (B) anaerobic conditions
132 S. Brahim et al.
chrome P450 superfamily of enzymes, is primarily a
monooxygenase [37]. It takes up first one electron
and then another in the presence of oxygen and
sequentially binds the substrate to the iron protopor-
phyrin IX group [38]. The complex then undergoes a
series of cyclic oxidation-reduction reactions even-
tually resulting in the functionalization of the sub-
strate, making it more polar, and the regeneration of
the unbound CYP enzyme.
Characterization of the Biosensor
in Solution-Borne Pure CYP2D6
in the Presence of Fluoxetine
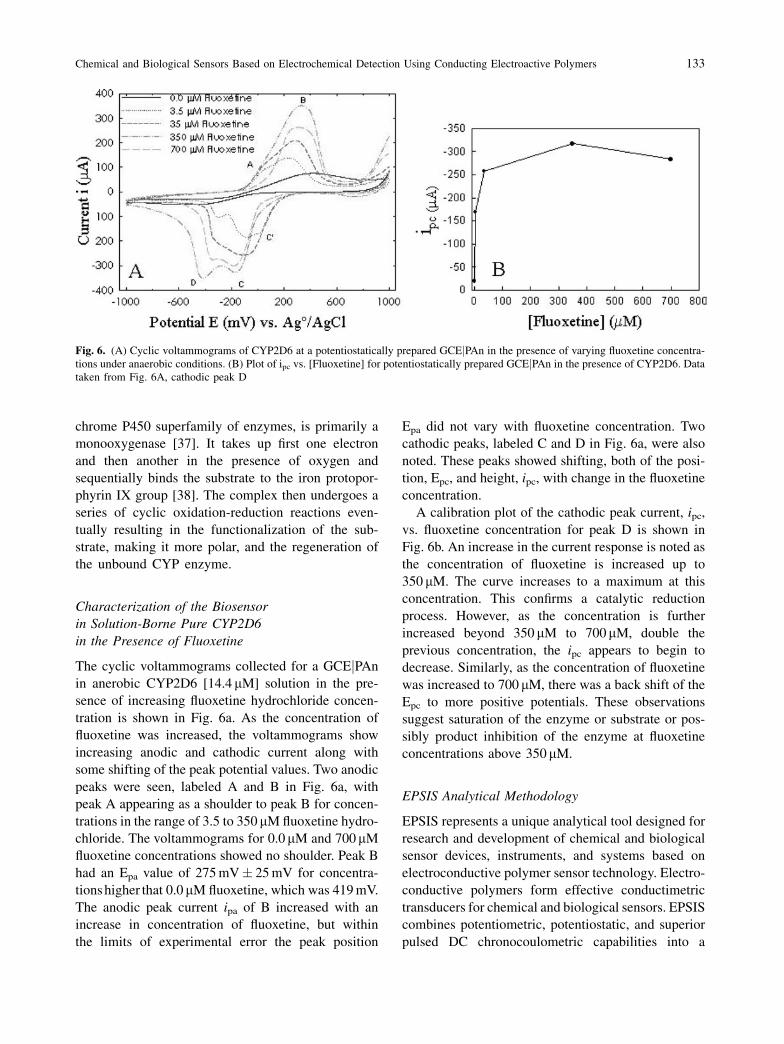
The cyclic voltammograms collected for a GCEjPAn
in anerobic CYP2D6 [14.4 mM] solution in the pre-
sence of increasing fluoxetine hydrochloride concen-
tration is shown in Fig. 6a. As the concentration of
fluoxetine was increased, the voltammograms show
increasing anodic and cathodic current along with
some shifting of the peak potential values. Two anodic
peaks were seen, labeled A and B in Fig. 6a, with
peak A appearing as a shoulder to peak B for concen-
trations in the range of 3.5 to 350mM fluoxetine hydro-
chloride. The voltammograms for 0.0mM and 700mM
fluoxetine concentrations showed no shoulder. Peak B
had an Epa value of 275 mV� 25 mV for concentra-
tions higher that 0.0mM fluoxetine, which was 419 mV.
The anodic peak current ipa of B increased with an
increase in concentration of fluoxetine, but within
the limits of experimental error the peak position
Epa did not vary with fluoxetine concentration. Two
cathodic peaks, labeled C and D in Fig. 6a, were also
noted. These peaks showed shifting, both of the posi-
tion, Epc, and height, ipc, with change in the fluoxetine
concentration.
A calibration plot of the cathodic peak current, ipc,
vs. fluoxetine concentration for peak D is shown in
Fig. 6b. An increase in the current response is noted as
the concentration of fluoxetine is increased up to
350 mM. The curve increases to a maximum at this
concentration. This confirms a catalytic reduction
process. However, as the concentration is further
increased beyond 350 mM to 700mM, double the
previous concentration, the ipc appears to begin to
decrease. Similarly, as the concentration of fluoxetine
was increased to 700 mM, there was a back shift of the
Epc to more positive potentials. These observations
suggest saturation of the enzyme or substrate or pos-
sibly product inhibition of the enzyme at fluoxetine
concentrations above 350mM.
EPSIS Analytical Methodology
EPSIS represents a unique analytical tool designed for
research and development of chemical and biological
sensor devices, instruments, and systems based on
electroconductive polymer sensor technology. Electro-
conductive polymers form effective conductimetric
transducers for chemical and biological sensors. EPSIS
combines potentiometric, potentiostatic, and superior
pulsed DC chronocoulometric capabilities into a
Fig. 6. (A) Cyclic voltammograms of CYP2D6 at a potentiostatically prepared GCEjPAn in the presence of varying fluoxetine concentra-
tions under anaerobic conditions. (B) Plot of ipc vs. [Fluoxetine] for potentiostatically prepared GCEjPAn in the presence of CYP2D6. Data
taken from Fig. 6A, cathodic peak D
Chemical and Biological Sensors Based on Electrochemical Detection Using Conducting Electroactive Polymers 133
powerful and versatile analytical detection and mea-
surement method that is unique to the determination
of conductimetric chemical and biological sensor
responses of electroconductive polymers. The EPSIS
analytical method involves three distinct phases:
(i) Pre-Initialization – An Undisturbed Open Circuit
Potential Measurement. This step measures, stores
and presents to the screen the interfacial potential
of the electroconductive transducer in its electro-
lyte or test environment. This measurement is
made of the complete polymer film relative to a
reversible Ag�=AgCl, Cl� electrode that also con-
tacts the electrolyte. The unperturbed open circuit
potential is diagnostic of the redox state of the
device and conveys information about the integrity
of the transducer.
(ii) Initialization – A Conditioning Electrolysis.
EPSIS applies a user-specified potential to the
electroconductive polymer transducer for a user-
specified duration or a user-specified limiting
current. Electroconductive polymer transducers
possess redox active sites that are present in vary-
ing amounts of oxidized and reduced forms. By
applying an initialization potential, EPSIS fixes
the initial redox composition of the transducer,
thereby also fixing its initial electrical conductiv-
ity and sensitivity toward biologically induced
redox changes.
(iii) Interrogation – A Nonpertubating Measurement
of the Time Dependence of the Electrical Con-
ductivity of the Transducer. Interrogation is itself
broken into a sequence of events designed to
reveal the time dependence of the electrical con-
ductivity of the transducer as it responds to
biologically induced redox changes. These four
events include the application of a non-pertubat-
ing but interrogating voltage pulse of 10–50 mV
applied between the fingers of the IME device;
measurement of subsequent transducer conduc-
tivity by integration of its current such that the
measured charge is directly proportional to the
transducer’s conductivity during the pulse peri-
od; a float period whereby the potential is com-
pletely withdrawn from the fingers of the device
and the device is allowed to spontaneously
respond to biologically induced redox changes;
and re-measurement of the open circuit potential,
which then becomes the basis for the application
of the subsequent voltage pulse. The three phases
of pre-initialization, initialization, and interroga-
tion are illustrated schematically in Fig. 7.
The four sensor interrogation steps of Pulse Appli-
cation, Conductivity Measurement, Float Period, and
Open Circuit Potential Measurement are repeated for
a user-defined number of cycles to produce a sensor
response curve. Each set of four such steps produces
a single datum point of conductivity and open circuit
potential data. Several such points obtained over a
period of time produce a response curve. The re-
sponse curve captures the change in conductivity of
the transducer as a function of time following initi-
alization.
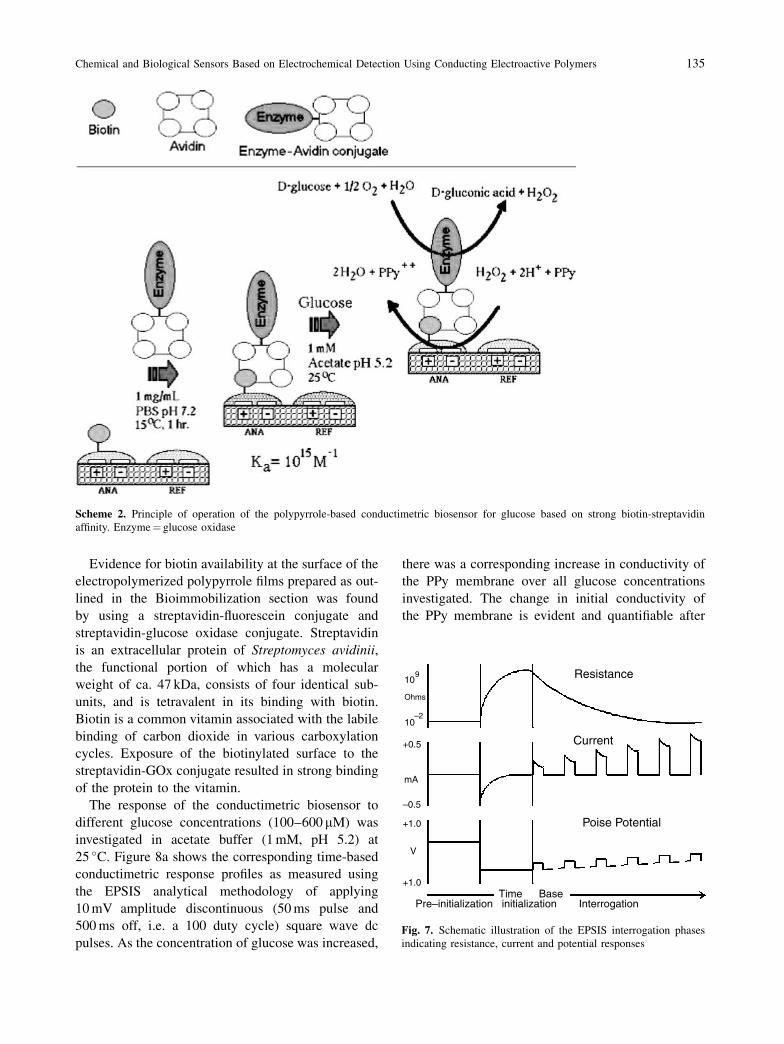
Conductimetric Glucose and Urea
Biosensors Using the EPSIS
A general purpose H2O2-sensitive, conductimetric
transducer makes it possible to develop a wide range
of oxidoreductase enzyme biosensors such as those
based on glucose oxidase (GOx). A PPy-based, con-
ductimetric bio-transducer that is sensitive to H2O2,
one of the enzymatic products of the glucose-GOx
oxidation reaction, can be readily configured into an
immunosensor by conferring the transducer with the
specificity of biotin and exploiting strong biotin-strep-
tavidin binding in various bioassays. The EPSIS
method provides a convenient approach and the
EPSIS instrument a convenient platform for the devel-
opment of biospecific oxidoreductase enzyme biosen-
sors and for the fabrication of oxidoreductase labeled
immunosensors. We demonstrate the design, fabrica-
tion, and operation of a polypyrrole-based conduc-
timetric biosensor for glucose using the EPSIS
methodology. The principle of operation of the bio-
sensor is based on two phenomena: (i) the very strong
binding (affinity) between biotin and streptavidin,
which covalently immobilizes the GOx enzyme to
the PPy-IME substrate and confers glucose-sensitiv-
ity, and (ii) the oxidation of polypyrrole by enzy-
matically-generated H2O2, shown coupled in the
following equations:
�-D-Glucoseþ O2 �!GOx
gluconolactoneþ H2O2
H2O2 þ 2HþCl� þ PPy�! 2H2Oþ ðPPyþþ � 2Cl�Þ
The H2O2 causes oxidation of PPy resulting in a con-
comitant and stoichiometric change in inherent con-
ductivity which is recorded by the EPSIS instrument.
The above mechanisms are illustrated in Scheme 2.
134 S. Brahim et al.
Evidence for biotin availability at the surface of the
electropolymerized polypyrrole films prepared as out-
lined in the Bioimmobilization section was found
by using a streptavidin-fluorescein conjugate and
streptavidin-glucose oxidase conjugate. Streptavidin
is an extracellular protein of Streptomyces avidinii,
the functional portion of which has a molecular
weight of ca. 47 kDa, consists of four identical sub-
units, and is tetravalent in its binding with biotin.
Biotin is a common vitamin associated with the labile
binding of carbon dioxide in various carboxylation
cycles. Exposure of the biotinylated surface to the
streptavidin-GOx conjugate resulted in strong binding
of the protein to the vitamin.
The response of the conductimetric biosensor to
different glucose concentrations (100–600mM) was
investigated in acetate buffer (1 mM, pH 5.2) at
25 �C. Figure 8a shows the corresponding time-based
conductimetric response profiles as measured using
the EPSIS analytical methodology of applying
10 mV amplitude discontinuous (50 ms pulse and
500 ms off, i.e. a 100 duty cycle) square wave dc
pulses. As the concentration of glucose was increased,
there was a corresponding increase in conductivity of
the PPy membrane over all glucose concentrations
investigated. The change in initial conductivity of
the PPy membrane is evident and quantifiable after
Fig. 7. Schematic illustration of the EPSIS interrogation phases
indicating resistance, current and potential responses
Scheme 2. Principle of operation of the polypyrrole-based conductimetric biosensor for glucose based on strong biotin-streptavidin
affinity. Enzyme¼ glucose oxidase
Chemical and Biological Sensors Based on Electrochemical Detection Using Conducting Electroactive Polymers 135
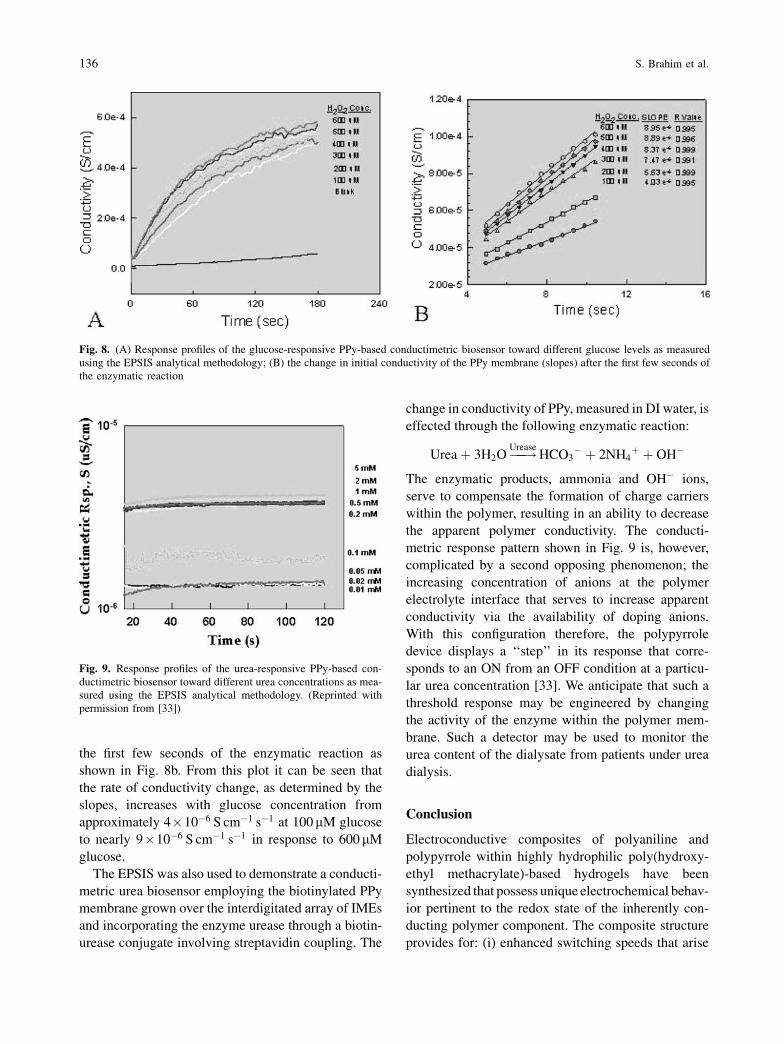
the first few seconds of the enzymatic reaction as
shown in Fig. 8b. From this plot it can be seen that
the rate of conductivity change, as determined by the
slopes, increases with glucose concentration from
approximately 4�10�6 S cm�1 s�1 at 100mM glucose
to nearly 9�10�6 S cm�1 s�1 in response to 600mM
glucose.
The EPSIS was also used to demonstrate a conducti-
metric urea biosensor employing the biotinylated PPy
membrane grown over the interdigitated array of IMEs
and incorporating the enzyme urease through a biotin-
urease conjugate involving streptavidin coupling. The
change in conductivity of PPy, measured in DI water, is
effected through the following enzymatic reaction:
Ureaþ 3H2O���!UreaseHCO3
� þ 2NH4þ þ OH�
The enzymatic products, ammonia and OH� ions,
serve to compensate the formation of charge carriers
within the polymer, resulting in an ability to decrease
the apparent polymer conductivity. The conducti-
metric response pattern shown in Fig. 9 is, however,
complicated by a second opposing phenomenon; the
increasing concentration of anions at the polymer
electrolyte interface that serves to increase apparent
conductivity via the availability of doping anions.
With this configuration therefore, the polypyrrole
device displays a ‘‘step’’ in its response that corre-
sponds to an ON from an OFF condition at a particu-
lar urea concentration [33]. We anticipate that such a
threshold response may be engineered by changing
the activity of the enzyme within the polymer mem-
brane. Such a detector may be used to monitor the
urea content of the dialysate from patients under urea
dialysis.
Conclusion
Electroconductive composites of polyaniline and
polypyrrole within highly hydrophilic poly(hydroxy-
ethyl methacrylate)-based hydrogels have been
synthesized that possess unique electrochemical behav-
ior pertinent to the redox state of the inherently con-
ducting polymer component. The composite structure
provides for: (i) enhanced switching speeds that arise
Fig. 9. Response profiles of the urea-responsive PPy-based con-
ductimetric biosensor toward different urea concentrations as mea-
sured using the EPSIS analytical methodology. (Reprinted with
permission from [33])
Fig. 8. (A) Response profiles of the glucose-responsive PPy-based conductimetric biosensor toward different glucose levels as measured
using the EPSIS analytical methodology; (B) the change in initial conductivity of the PPy membrane (slopes) after the first few seconds of
the enzymatic reaction
136 S. Brahim et al.
from the larger apparent diffusion coefficients of ions
into and out of the membrane, and (ii) stabilization of
the bioactive recognition molecule. A novel electro-
conductive polymer sensor technology, EPSIS, was
demonstrated using bioactive membranes of functiona-
lized PPy incorporated into a conductimetric transduc-
tion mode. The analytical system was demonstrated for
glucose and urea detection.
Acknowledgements. The authors acknowledge the support of the
Virginia Center for Innovative Technology (CIT BIO-99-010) to
the VCU Center for Bioelectronics, Biosensors and Biochips (C3B).
References
[1] Huang G. T. Technol. Rev. 2003, December–January, 32
[2] Skotheim T. A.; Elsenbaumer R.; Reynolds J. (Eds.) (1998)
Handbook of Conducting Polymers. Marcel Dekker, NewYork
[3] Wallace G. G.; Spinks G.; Teasdale P. R. (1997) Conductive
Electroactive Polymers. Technomic, New York
[4] Gerard M.; Chaubey A.; Malhotra B. D. Biosens. Bioelectron.
2002, 17, 345
[5] Angelopoulos M. IBM J. Res. Dev. 2001, 45, 57
[6] Osada Y.; DeRossi D. E. D. (2000) Polymer Sensors and
Actuators. In: Bailey R. A.; Persaud K. C. (Eds.) Springer,
Berlin Heidelberg New York Tokyo, p. 149
[7] Kiess H. G. (Ed.) (1992) Conjugated Conducting Polymers.
Springer, Berlin Heidelberg New York Tokyo
[8] Koul S.; Dharwan S. K.; Chandra S.; Chandra R. Indian J.
Chem. 1997, 36A, 901
[9] Rebattet L.; Genies E.; Allegraud J.; Pineri M. J. J.; Escoubers
M. Polym. Adv. Technol. 1993, 4, 32
[10] Lowman A. M.; Peppas N. A. (1999) Encyclopedia of Con-
trolled Drug Delivery. In: Mathiowitz E. (Ed.) John Wiley &
Sons, New York, p. 397
[11] Arica Y. H.; Hasirci V. N. Biomaterials 1987, 8, 489
[12] Crosfet V. V.; Erdosy M.; Johnson T. A.; Buck R. P.; Ash R. B.;
Neumann M. R. Anal. Chem. 1995, 67, 1647
[13] Sheppard N. F. Jr.; Lesho M. J.; McNally P.; Francomacaro
A. S. Sens. Actuators B 1995, 28, 95
[14] Li L.; Walt D. R. Anal. Chem. 1995, 67, 3746
[15] Ruschau G. R.; Newnham R. E.; Runt J.; Smith B. E. Sens.
Actuators B 1989, 20, 269
[16] Niwa O.; Hikita M.; Tamamura T. Macromol. Chem. Rapid
Commun. 1985, 6, 375
[17] Wang H. L.; Toppare L.; Frenandez J. E. Macromolecules
1990, 23, 1053
[18] Lindsey S. E.; Street G. B. Synth. Met. 1985, 10, 67
[19] Selampinar F.; Akbulut U.; Yalchin T.; Suzer S.; Toppare L.
Synth. Met. 1994, 62, 201
[20] Selampinar F.; Akbulut U.; Yildiz E.; Gungor A.; Toppare L.
Synth. Met. 1997, 89, 111
[21] Endres F.; Schwitzgebel G. Synth. Met. 1997, 88, 73
[22] Bardet M.; Guinaudeu M.; Bourgeoisat C.; Cherin H. Synth.
Met. 1991, 41–43, 359
[23] Small C. J.; Too C. O.; Wallace G. G. Polym. Gels Netw. 1997,
5, 251
[24] Nikpour M.; Chaouk H.; Mau A.; Chung D. J.; Wallace G.
Synth. Met. 1999, 99, 121
[25] Koul S.; Chandra R.; Dharwan S. K. Sens. Actuators B 2001,
75, 151
[26] Park Y.; Park S. B. Synth. Met. 2002, 128, 229
[27] Brahim S.; Narinesingh D.; Guiseppi-Elie A. Biosens. Bio-
electron. 2002, 17, 53
[28] Brahim S.; Narinesingh D.; Guiseppi-Elie A. Anal. Chim.
Acta 2001, 448, 27
[29] Brahim S.; Maharajh D.; Narinesingh D.; Guiseppi-Elie A.
Anal. Lett. 2002, 35, 797
[30] Guiseppi-Elie A.; Wilson A. M.; Sudjak A. (1998) Tailored
Polymeric Materials for Controlled Drug Delivery. In:
Shalaby S.; Shalaby S. (Eds.) American Chemical Society,
Washington D.C.
[31] Kakushima M.; Hamel P.; Frenette R.; Rokach J. J. Org.
Chem. 1983, 48, 3214
[32] Ryder K. S.; Schweiger L. F.; Glidle A.; Cooper J. F. J. Mat.
Chem. 2000, 10, 1785
[33] Guiseppi-Elie A.; Tour J. M.; Allara D. L.; Sheppard N. F. Jr.
Mat. Res. Soc. Symp. Proc. 1996, 413, 439
[34] Guiseppi-Elie A. (1998) U.S. Patent 5,766,934
[35] Guiseppi-Elie A. (1994) U.S. Patent 5,352,574
[36] Zhuang L.; Zhou Q.; Lu J. J. Electroanal. Chem. 2000, 493,
135
[37] Stachulski A. V.; Lennard M. S. J. Chem. Ed. 2002, 77(3), 349
[38] Franklin M. R. (1991) In Methods of Enzymology, Vol 206. In:
Waterman M. R.; Johnson E. F. (Eds.) Academic Press Inc.,
NY, pp. 559–576
Chemical and Biological Sensors Based on Electrochemical Detection Using Conducting Electroactive Polymers 137
Related Documents