Chem 355 Lab Manual Fall, 2005 Minnesota State University Moorhead Department of Chemistry Dr. Craig P. Jasperse Phone: 477-2230 Email: [email protected] Website: www.mnstate.edu/jasperse

Welcome message from author
This document is posted to help you gain knowledge. Please leave a comment to let me know what you think about it! Share it to your friends and learn new things together.
Transcript
Chem 355Lab Manual
Fall, 2005Minnesota State University Moorhead
Department of Chemistry
Dr. Craig P. JaspersePhone: 477-2230
Email: [email protected]: www.mnstate.edu/jasperse
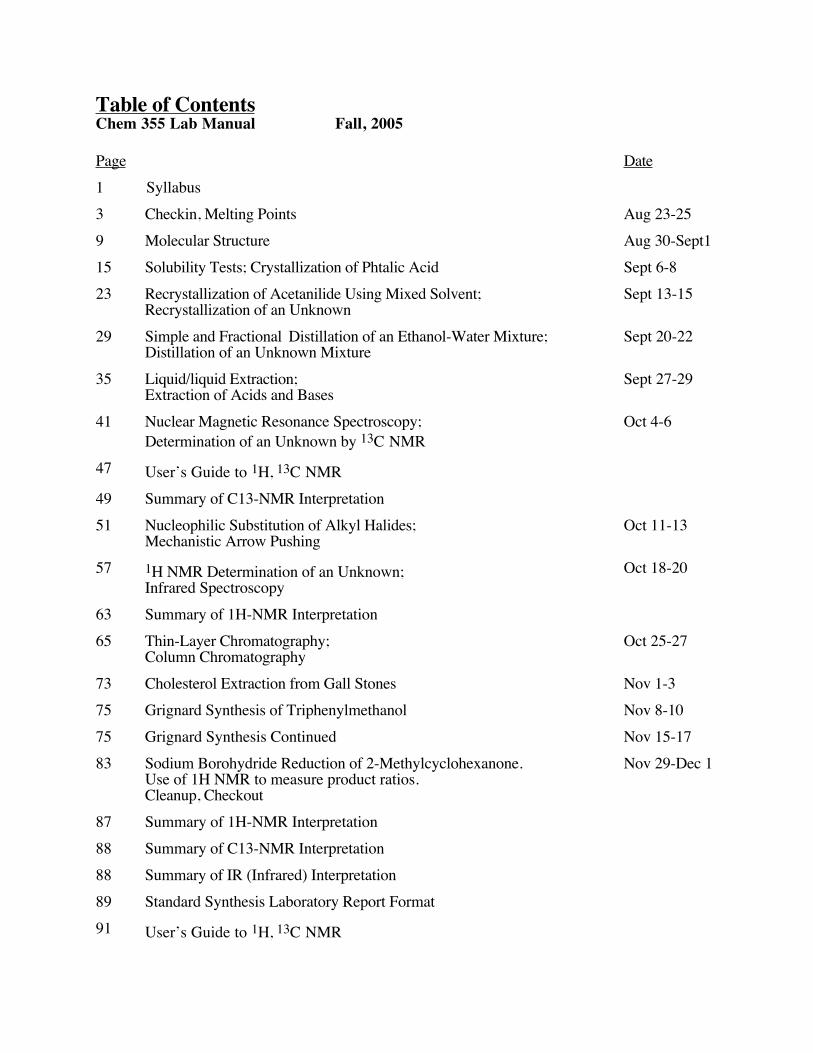
Table of ContentsChem 355 Lab Manual Fall, 2005
Page Date1 Syllabus3 Checkin, Melting Points Aug 23-259 Molecular Structure Aug 30-Sept115 Solubility Tests; Crystallization of Phtalic Acid Sept 6-823 Recrystallization of Acetanilide Using Mixed Solvent;
Recrystallization of an UnknownSept 13-15
29 Simple and Fractional Distillation of an Ethanol-Water Mixture;Distillation of an Unknown Mixture
Sept 20-22
35 Liquid/liquid Extraction;Extraction of Acids and Bases
Sept 27-29
41 Nuclear Magnetic Resonance Spectroscopy; Determination of an Unknown by 13C NMR
Oct 4-6
47 User’s Guide to 1H, 13C NMR49 Summary of C13-NMR Interpretation51 Nucleophilic Substitution of Alkyl Halides;
Mechanistic Arrow PushingOct 11-13
57 1H NMR Determination of an Unknown;Infrared Spectroscopy
Oct 18-20
63 Summary of 1H-NMR Interpretation65 Thin-Layer Chromatography;
Column ChromatographyOct 25-27
73 Cholesterol Extraction from Gall Stones Nov 1-375 Grignard Synthesis of Triphenylmethanol Nov 8-1075 Grignard Synthesis Continued Nov 15-1783 Sodium Borohydride Reduction of 2-Methylcyclohexanone.
Use of 1H NMR to measure product ratios. Cleanup, Checkout
Nov 29-Dec 1
87 Summary of 1H-NMR Interpretation88 Summary of C13-NMR Interpretation88 Summary of IR (Infrared) Interpretation89 Standard Synthesis Laboratory Report Format91 User’s Guide to 1H, 13C NMR
Chem 355 Syllabus 1
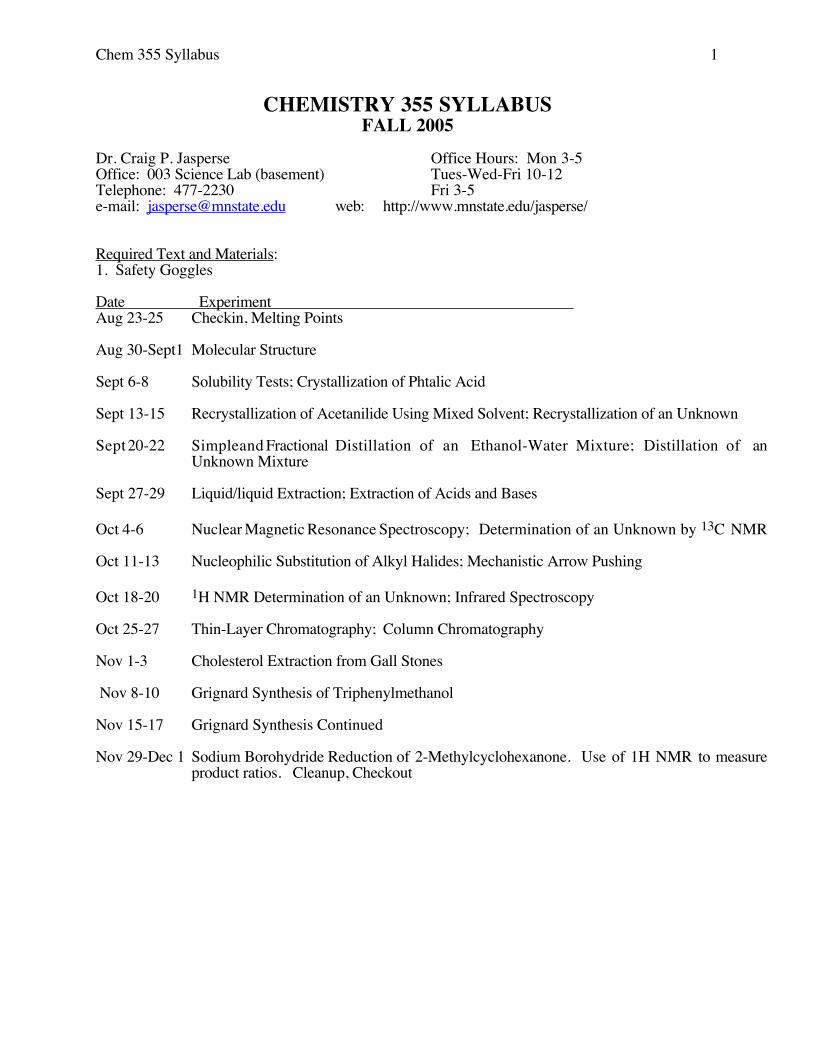
CHEMISTRY 355 SYLLABUSFALL 2005
Dr. Craig P. Jasperse Office Hours: Mon 3-5Office: 003 Science Lab (basement) Tues-Wed-Fri 10-12Telephone: 477-2230 Fri 3-5e-mail: [email protected] web: http://www.mnstate.edu/jasperse/
Required Text and Materials:1. Safety Goggles
Date Experiment Aug 23-25 Checkin, Melting Points
Aug 30-Sept1 Molecular Structure
Sept 6-8 Solubility Tests; Crystallization of Phtalic Acid
Sept 13-15 Recrystallization of Acetanilide Using Mixed Solvent; Recrystallization of an Unknown
Sept 20-22 Simple and Fractional Distillation of an Ethanol-Water Mixture; Distillation of anUnknown Mixture
Sept 27-29 Liquid/liquid Extraction; Extraction of Acids and Bases
Oct 4-6 Nuclear Magnetic Resonance Spectroscopy; Determination of an Unknown by 13C NMR
Oct 11-13 Nucleophilic Substitution of Alkyl Halides; Mechanistic Arrow Pushing
Oct 18-20 1H NMR Determination of an Unknown; Infrared Spectroscopy
Oct 25-27 Thin-Layer Chromatography; Column Chromatography
Nov 1-3 Cholesterol Extraction from Gall Stones
Nov 8-10 Grignard Synthesis of Triphenylmethanol
Nov 15-17 Grignard Synthesis Continued
Nov 29-Dec 1 Sodium Borohydride Reduction of 2-Methylcyclohexanone. Use of 1H NMR to measureproduct ratios. Cleanup, Checkout
Chem 355 Syllabus 2
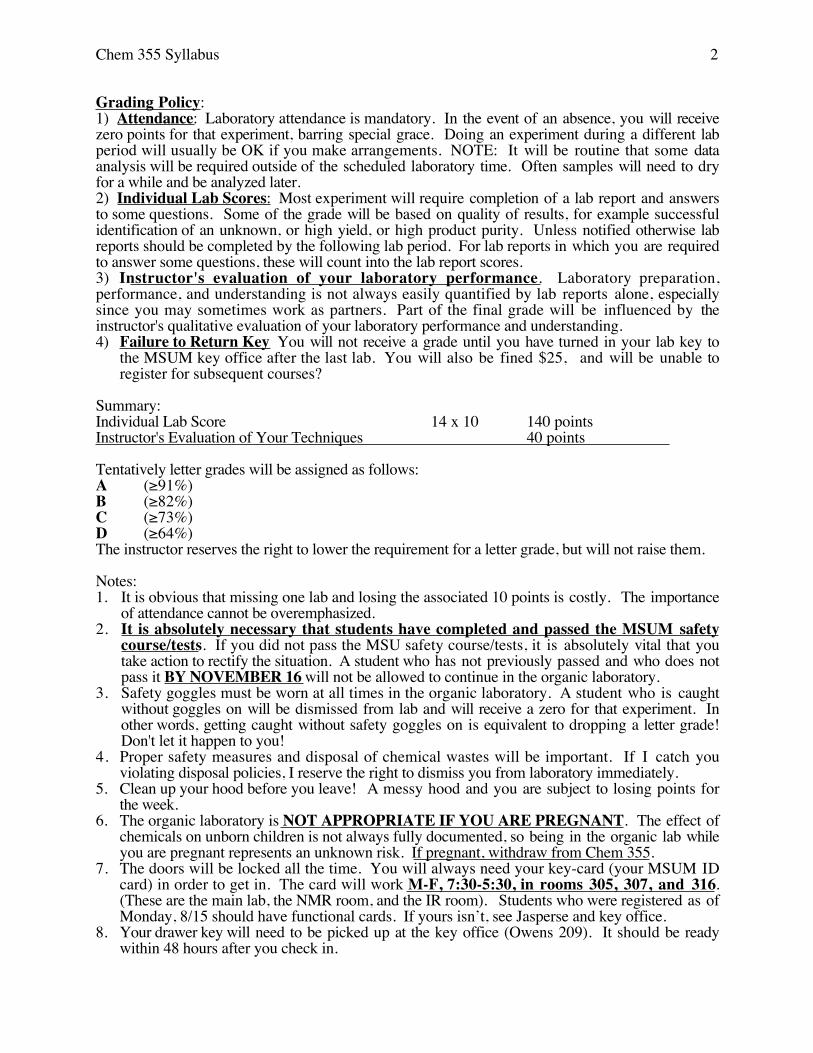
Grading Policy: 1) Attendance: Laboratory attendance is mandatory. In the event of an absence, you will receivezero points for that experiment, barring special grace. Doing an experiment during a different labperiod will usually be OK if you make arrangements. NOTE: It will be routine that some dataanalysis will be required outside of the scheduled laboratory time. Often samples will need to dryfor a while and be analyzed later. 2) Individual Lab Scores: Most experiment will require completion of a lab report and answersto some questions. Some of the grade will be based on quality of results, for example successfulidentification of an unknown, or high yield, or high product purity. Unless notified otherwise labreports should be completed by the following lab period. For lab reports in which you are requiredto answer some questions, these will count into the lab report scores. 3) Instructor's evaluation of your laboratory performance. Laboratory preparation,performance, and understanding is not always easily quantified by lab reports alone, especiallysince you may sometimes work as partners. Part of the final grade will be influenced by theinstructor's qualitative evaluation of your laboratory performance and understanding. 4) Failure to Return Key You will not receive a grade until you have turned in your lab key to
the MSUM key office after the last lab. You will also be fined $25, and will be unable toregister for subsequent courses?
Summary: Individual Lab Score 14 x 10 140 pointsInstructor's Evaluation of Your Techniques 40 points
Tentatively letter grades will be assigned as follows: A (≥91%)B (≥82%) C (≥73%)D (≥64%)The instructor reserves the right to lower the requirement for a letter grade, but will not raise them.
Notes: 1. It is obvious that missing one lab and losing the associated 10 points is costly. The importance
of attendance cannot be overemphasized.2. It is absolutely necessary that students have completed and passed the MSUM safety
course/tests. If you did not pass the MSU safety course/tests, it is absolutely vital that youtake action to rectify the situation. A student who has not previously passed and who does notpass it BY NOVEMBER 16 will not be allowed to continue in the organic laboratory.
3. Safety goggles must be worn at all times in the organic laboratory. A student who is caughtwithout goggles on will be dismissed from lab and will receive a zero for that experiment. Inother words, getting caught without safety goggles on is equivalent to dropping a letter grade!Don't let it happen to you!
4. Proper safety measures and disposal of chemical wastes will be important. If I catch youviolating disposal policies, I reserve the right to dismiss you from laboratory immediately.
5. Clean up your hood before you leave! A messy hood and you are subject to losing points forthe week.
6. The organic laboratory is NOT APPROPRIATE IF YOU ARE PREGNANT. The effect ofchemicals on unborn children is not always fully documented, so being in the organic lab whileyou are pregnant represents an unknown risk. If pregnant, withdraw from Chem 355.
7. The doors will be locked all the time. You will always need your key-card (your MSUM IDcard) in order to get in. The card will work M-F, 7:30-5:30, in rooms 305, 307, and 316.(These are the main lab, the NMR room, and the IR room). Students who were registered as ofMonday, 8/15 should have functional cards. If yours isn’t, see Jasperse and key office.
8. Your drawer key will need to be picked up at the key office (Owens 209). It should be readywithin 48 hours after you check in.
Melting Range 3
Melting Range Background Information The melting range of a pure solid organic is the temperature range atwhich the solid is in equilibrium with its liquid. As heat is added to a solid, the solid eventuallychanges to a liquid. This occurs as molecules acquire enough energy to overcome theintermolecular forces previously binding them together in an orderly crystalline lattice. Meltingdoes not occur instantaneously, because molecules must absorb the energy and then physicallybreak the binding forces. Typically the outside of a crystal will melt faster than the inside, becauseit takes time for heat to penetrate. (Imagine an ice cube melting from the outside in, and not doingso instantly…)
The melting range of a compound is one of the characteristic properties of a pure solid. Themelting range is defined as the span of temperature from the point at which the crystals first beginto liquefy to the point at which the entire sample is liquid. Most pure organics melt over a narrowtemperature range of 1-2ºC, if heated slowly enough. Impure samples will normally have meltingranges that are both larger (>1ºC) and begin lower.
Taking the melting range of a sample is useful for two reasons:1. Identification of an unknown sample (compare it’s observed melting range with that of
known compounds)2. Assessment of sample purity for a known substance. By comparing observed range for
an actual sample to the known range for a pure sample, you can tell whether your actualsample is pure or contaminated (the range is depressed and broadened)
The presence of impurity has two effects on a substance’s melting range:1. Melting range depression (lower end of the range drops)2. Melting range broadening (the range simply increases. Often the low end drops a lot,
the high end less so or sometimes not much at all.) A melting range of 5º or moreindicates that a compound is impure.
Why? The reason for this depression/broadening is that contaminants disrupt the consistencyand organization of the crystal lattice at the molecular level. Contaminants don’t “fit” correctlyinto what would be the normal pure lattice. How does this manifest itself?
1. The disruption weakens the lattice, so that the lattice can be broken down more easily;the weakened structure melts more easily at reduced temperature (depression).
2. Disruption of the lattice makes it non-uniform. At the molecular level, the moleculesclosest to the impurities melt fastest. Further away from the impurities, the crystal latticeis relatively undisturbed and therefore melts at or nearer the normal temperature.
Miscellaneous notes on melting range depression/broadening: 1. Only “soluble” impurities, which are incorporated into the crystal structure at
the molecular level, cause depression and broadening. An insoluble piece of metal or woodionic salt crystal has negligible effect, because only a few organic molecules will be incontact and will be affected.
2. At the chemical level, it is impossible to “raise” the melting point of an alreadypure substance. It’s melting point can be depressed by contamination, but not raised.Practical: If the melting point for an unknown sample is observed to be in between that oftwo candidates whose pure mp’s are known, the unknown can’t actually be equal to thelower-melting candidate. (Short of the rapid-heating effect, see later.) Most likely theunknown sample is an impure version of the higher melting candidate. For example:suppose an unknown sample X melts at 148-152º, and is thought to be either candidate A(known range is 141-142º) or B (known range is 161-162º). Sample X cannot becandidate A, but it can be an impure and thus depressed version of candidate B.
Melting Range 4
3. Often contaminated solids are purified by recrystallization. If the resultingmelting range is unchanged, the original sample probably was pure to begin with. But ifthe resulting melting point gets higher, the original sample was obviously impure.
4. When crystals are isolated by filtration from a solvent, it is important to allowcomplete drying/evaporation of the solvent in order to get a good melting range. Residualsolvent functions as a contaminant and will depress/broaden the melting range for a crystal.
5. When two chemicals are mixed, the resulting melting point is not the average ofthe two mp’s. It is always depressed from the melting point of the major component in themixture. This is true even if the impurity is higher melting (when pure) than the majorcomponent. For example, if a chemical that normally melts at 130º is contaminated by asmall amount of material that when pure melts at 200º, the resulting mixture will not meltbetween 130º and 200º. Rather, the melting point of the major component will bedepressed, and the observed melting range will begin lower than 130º.
6. Even when two chemicals with exactly the same melting point when pure aremixed, the resulting melting point is depressed.
Mixed Melting PointsThat mixtures have depressed melting points, even when both components have
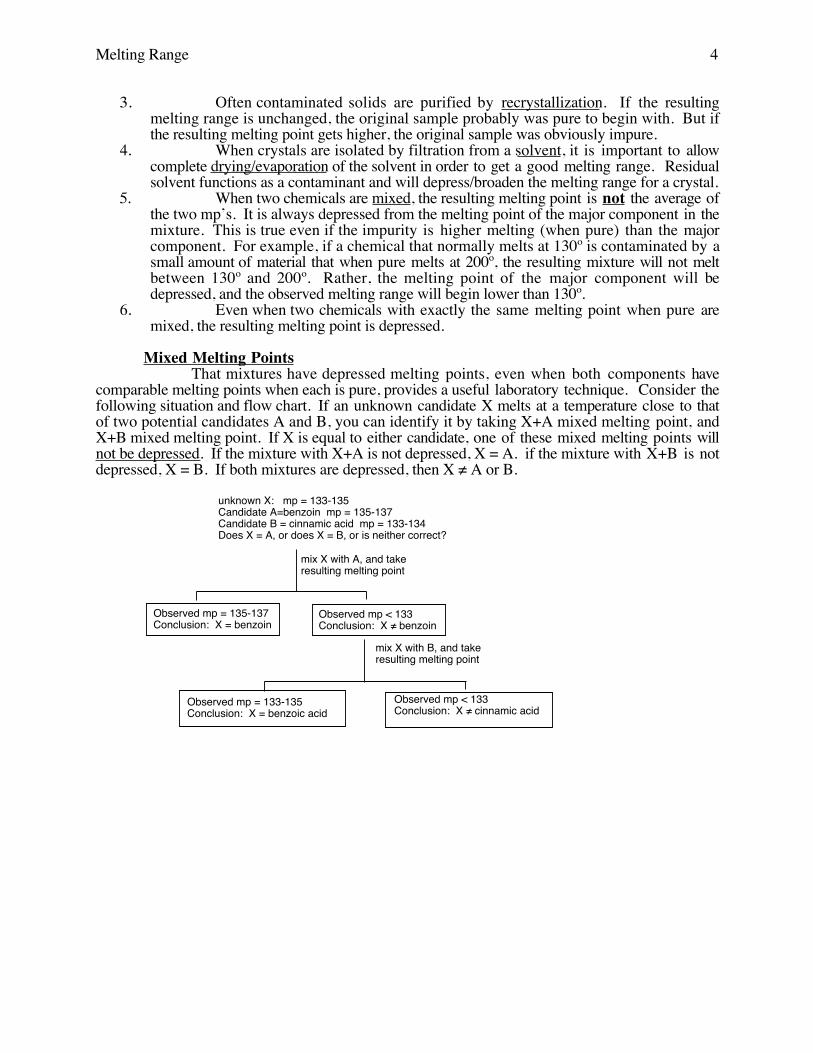
comparable melting points when each is pure, provides a useful laboratory technique. Consider thefollowing situation and flow chart. If an unknown candidate X melts at a temperature close to thatof two potential candidates A and B, you can identify it by taking X+A mixed melting point, andX+B mixed melting point. If X is equal to either candidate, one of these mixed melting points willnot be depressed. If the mixture with X+A is not depressed, X = A. if the mixture with X+B is notdepressed, X = B. If both mixtures are depressed, then X ≠ A or B.
unknown X: mp = 133-135Candidate A=benzoin mp = 135-137Candidate B = cinnamic acid mp = 133-134Does X = A, or does X = B, or is neither correct?
mix X with A, and take resulting melting point
Observed mp = 135-137Conclusion: X = benzoin
Observed mp < 133Conclusion: X ≠ benzoin
mix X with B, and take resulting melting point
Observed mp = 133-135Conclusion: X = benzoic acid
Observed mp < 133Conclusion: X ≠ cinnamic acid
Melting Range 5
The Rate of Heating, and Some Practical TipsIt takes time for a crystal to absorb heat and to melt, from the outside in. Just as when you
place an ice-cube into a liquid that is >0º, it doesn’t melt instantly. To get maximal accuracy intaking a melting range, heating should proceed at only 1º/minute! This is the standard heating ratewhen publishing melting ranges in scientific journals. This is also inconveniently slow, especially ifyou don’t know where your sample is likely to melt (as when examining an unknown).
• Q: What happens if I heat too fast? A: Your melting range will be too broad, but this timeon the high end! If a sample should melt at 130-131º, but you are heating fast, it will stillprobable begin to melt at about 130º, but the full sample won’t have time to absorb heat andfinish melting by 131º. Instead, the heating device may have warmed well above 131ºbefore the interior liquefies, so the observed range may appear to be 130-136º. Both themagnitude of the range and the high end of the range may be misleading.
• For doing routine samples, it is appropriate to be warming at 5 degrees per minute aroundthe temperature at which melting occurs. This broadens the range somewhat, but not badly.And it keeps the melting point experiment from taking forever.
• Practical tip 1: If the approximate temperature at which your sample should melt is known,the sample can be quickly heated to within 10-15º of its melting point. Then the heating ratecan be slowed to 2-4º per minute until the sample melts. For example, if you know yourmaterial should melt around 180º, but you are just trying to check the purity, you can heatrapidly until you are up to 165º or so, and only when you are getting close turn the heatingrate down.
• Practical tip 2: If you have no clue where your sample will melt, it’s common to heatrapidly to get a ballpark estimate of where melting will occur. 60º? 140º? 240º? If it turnsout to be 240º and you heated only cautiously from the beginning, it will take a looooongtime to get to the measurement. By heating rapidly, you can get an “orientation meltingpoint” quickly, and then repeat with more care for a more precise reading. Often you don’teven need to prepare a fresh sample, because after cooling the melted sample oftenrecrystallizes.
• Practical tip 3: Heat transfer problems are minimized if the sample is ground finely. If theparticles are too coarse, they do not pack as well, causing air pockets that slow heat transfer.Because the thermometer keeps heating while the sample is melting rather slowly, the highend of your range will be inflated.
• Practical tip 4: Loading too much sample makes it harder for the interior to get heated andmelted. Because the thermometer keeps heating while the sample is melting rather slowly,the high end of your range will be inflated.
“Sagging”Sometimes slight changes, such as shrinking and sagging, occur in the crystalline structure
of the sample before melting occurs. The temperature at the bottom end of the melting rangecorresponds to the first appearance of liquid within the sample mixture; if the crystals arechanging their appearance, but you don’t yet see any actual liquid, you should not record this as thelower end of the melting range yet.
Melting Range 6
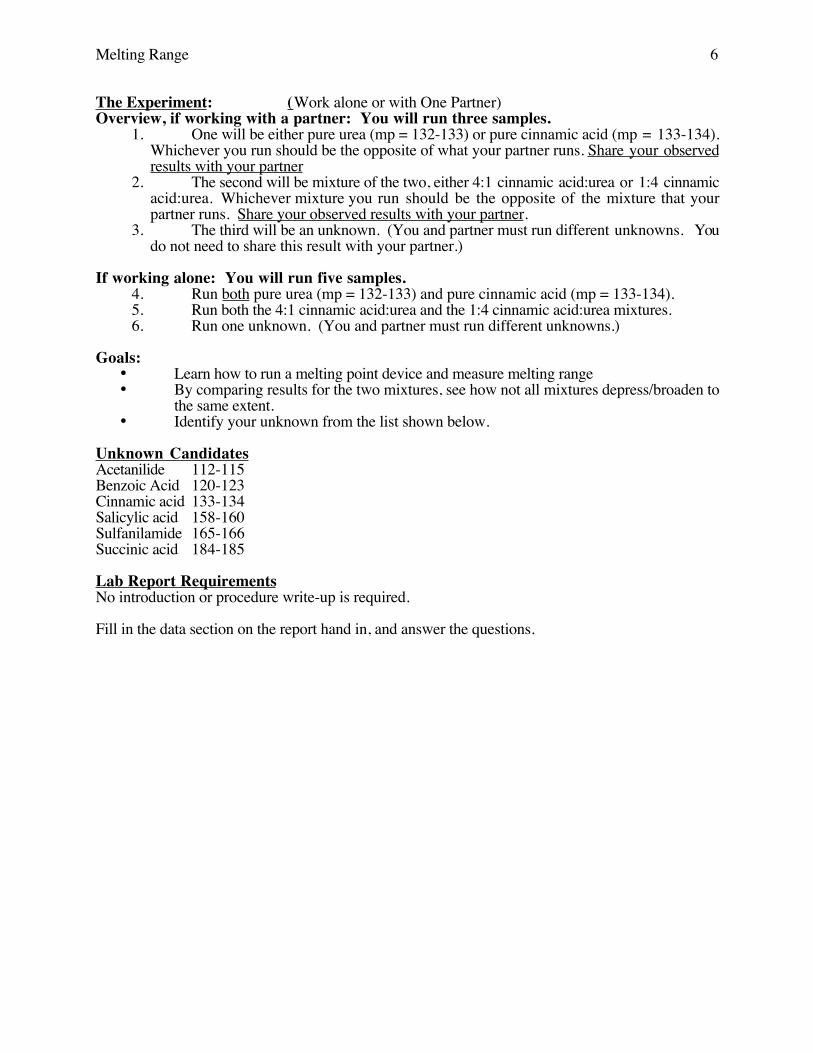
The Experiment: (Work alone or with One Partner)Overview, if working with a partner: You will run three samples.
1. One will be either pure urea (mp = 132-133) or pure cinnamic acid (mp = 133-134).Whichever you run should be the opposite of what your partner runs. Share your observedresults with your partner
2. The second will be mixture of the two, either 4:1 cinnamic acid:urea or 1:4 cinnamicacid:urea. Whichever mixture you run should be the opposite of the mixture that yourpartner runs. Share your observed results with your partner.
3. The third will be an unknown. (You and partner must run different unknowns. Youdo not need to share this result with your partner.)
If working alone: You will run five samples. 4. Run both pure urea (mp = 132-133) and pure cinnamic acid (mp = 133-134).5. Run both the 4:1 cinnamic acid:urea and the 1:4 cinnamic acid:urea mixtures.6. Run one unknown. (You and partner must run different unknowns.)
Goals:• Learn how to run a melting point device and measure melting range• By comparing results for the two mixtures, see how not all mixtures depress/broaden to
the same extent. • Identify your unknown from the list shown below.
Unknown CandidatesAcetanilide 112-115Benzoic Acid 120-123Cinnamic acid 133-134Salicylic acid 158-160Sulfanilamide 165-166Succinic acid 184-185
Lab Report RequirementsNo introduction or procedure write-up is required.
Fill in the data section on the report hand in, and answer the questions.
Melting Range 7
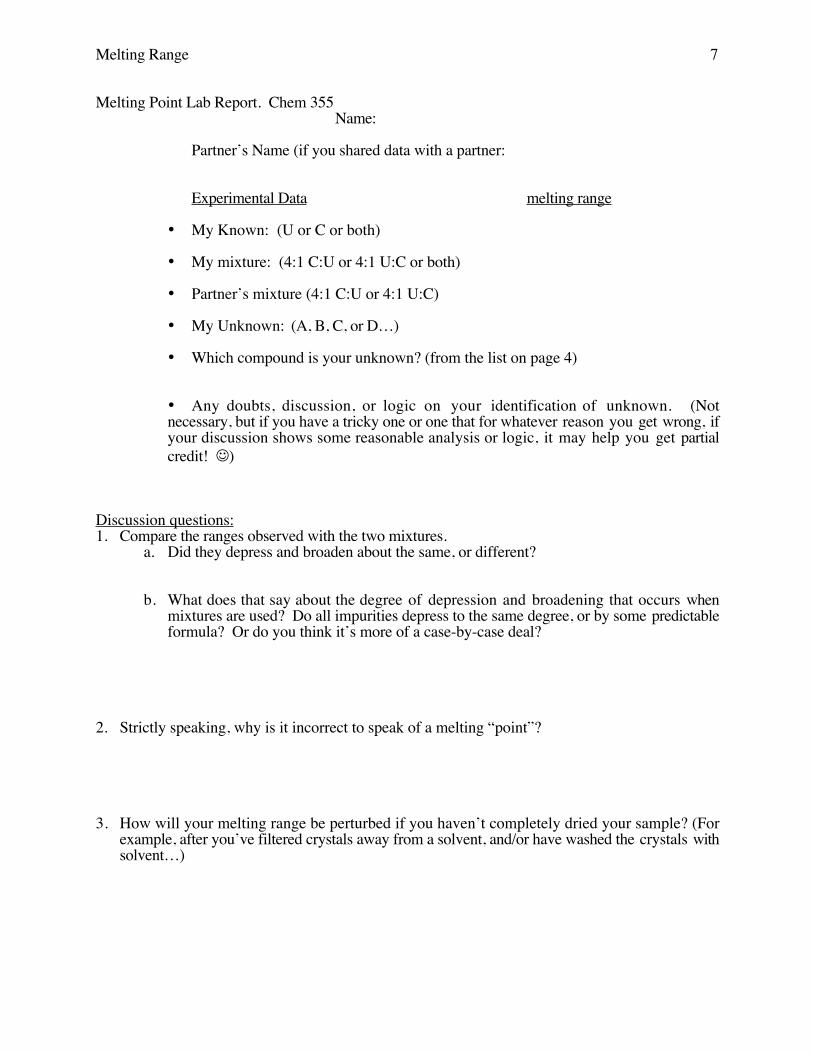
Melting Point Lab Report. Chem 355Name:
Partner’s Name (if you shared data with a partner:
Experimental Data melting range
• My Known: (U or C or both)
• My mixture: (4:1 C:U or 4:1 U:C or both)
• Partner’s mixture (4:1 C:U or 4:1 U:C)
• My Unknown: (A, B, C, or D…)
• Which compound is your unknown? (from the list on page 4)
• Any doubts, discussion, or logic on your identification of unknown. (Notnecessary, but if you have a tricky one or one that for whatever reason you get wrong, ifyour discussion shows some reasonable analysis or logic, it may help you get partialcredit! )
Discussion questions:1. Compare the ranges observed with the two mixtures.
a. Did they depress and broaden about the same, or different?
b. What does that say about the degree of depression and broadening that occurs whenmixtures are used? Do all impurities depress to the same degree, or by some predictableformula? Or do you think it’s more of a case-by-case deal?
2. Strictly speaking, why is it incorrect to speak of a melting “point”?
3. How will your melting range be perturbed if you haven’t completely dried your sample? (Forexample, after you’ve filtered crystals away from a solvent, and/or have washed the crystals withsolvent…)
Melting Range 8
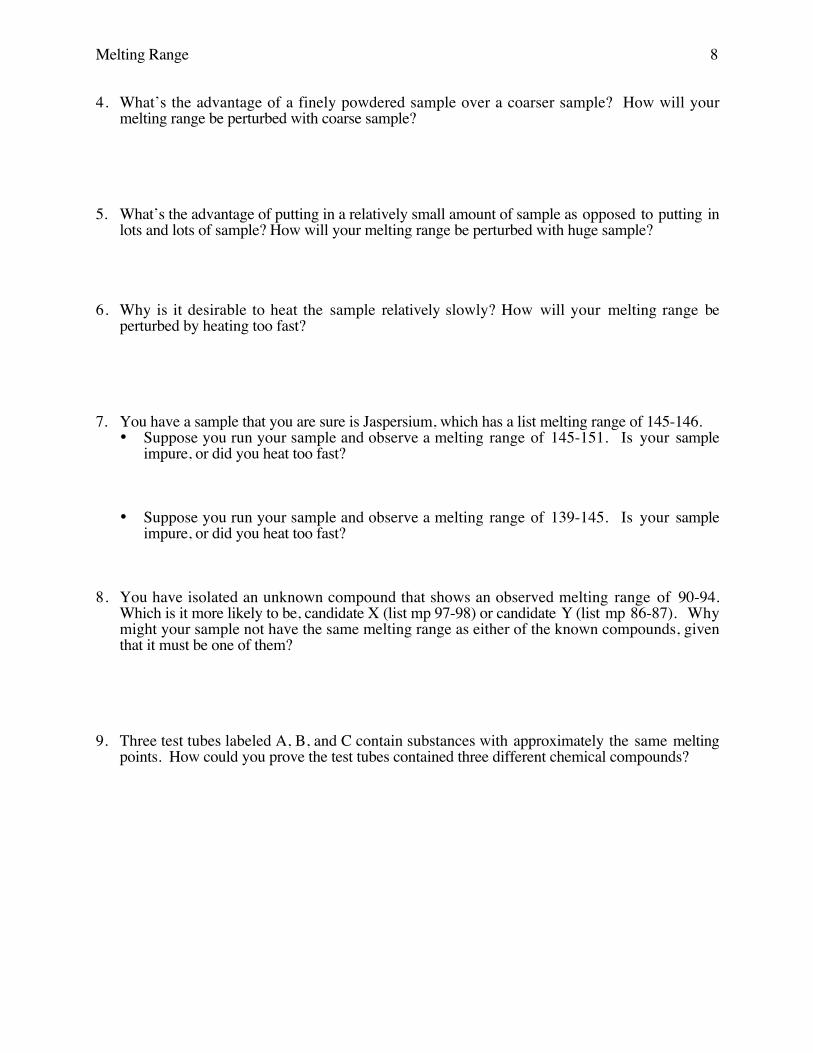
4. What’s the advantage of a finely powdered sample over a coarser sample? How will yourmelting range be perturbed with coarse sample?
5. What’s the advantage of putting in a relatively small amount of sample as opposed to putting inlots and lots of sample? How will your melting range be perturbed with huge sample?
6. Why is it desirable to heat the sample relatively slowly? How will your melting range beperturbed by heating too fast?
7. You have a sample that you are sure is Jaspersium, which has a list melting range of 145-146. • Suppose you run your sample and observe a melting range of 145-151. Is your sample
impure, or did you heat too fast?
• Suppose you run your sample and observe a melting range of 139-145. Is your sampleimpure, or did you heat too fast?
8. You have isolated an unknown compound that shows an observed melting range of 90-94.Which is it more likely to be, candidate X (list mp 97-98) or candidate Y (list mp 86-87). Whymight your sample not have the same melting range as either of the known compounds, giventhat it must be one of them?
9. Three test tubes labeled A, B, and C contain substances with approximately the same meltingpoints. How could you prove the test tubes contained three different chemical compounds?
Molecular Structure 9
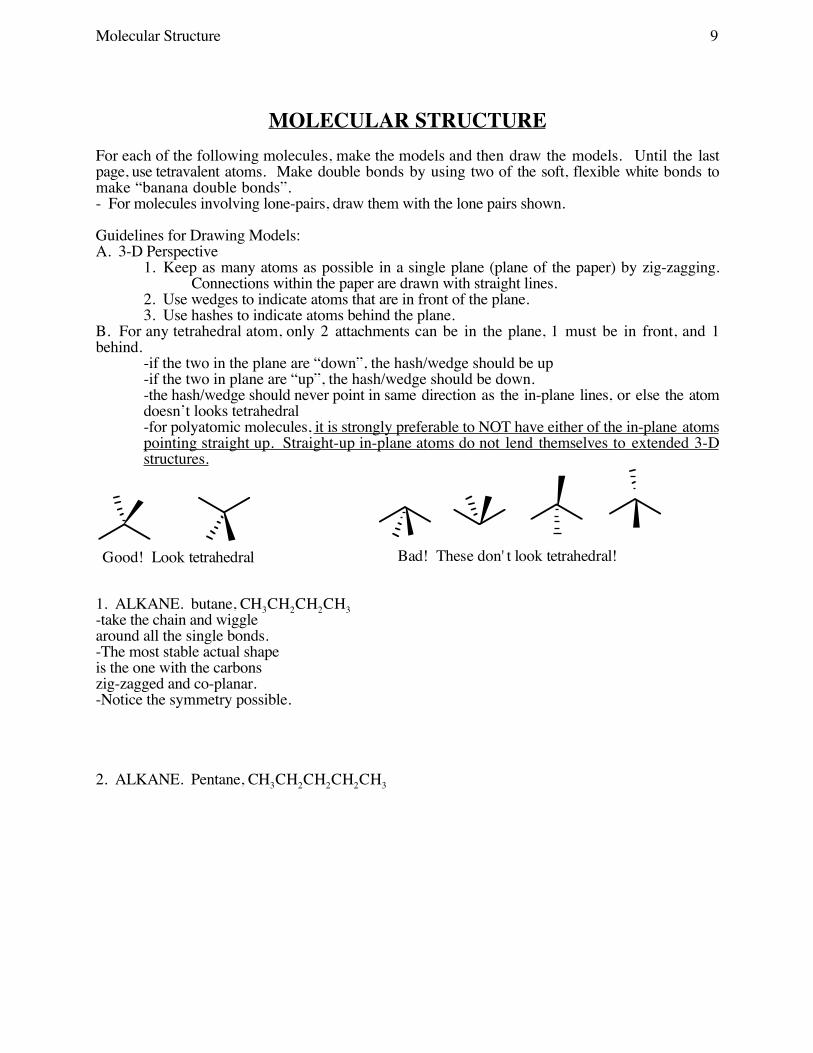
MOLECULAR STRUCTUREFor each of the following molecules, make the models and then draw the models. Until the lastpage, use tetravalent atoms. Make double bonds by using two of the soft, flexible white bonds tomake “banana double bonds”. - For molecules involving lone-pairs, draw them with the lone pairs shown.
Guidelines for Drawing Models:A. 3-D Perspective
1. Keep as many atoms as possible in a single plane (plane of the paper) by zig-zagging. Connections within the paper are drawn with straight lines.
2. Use wedges to indicate atoms that are in front of the plane.3. Use hashes to indicate atoms behind the plane.
B. For any tetrahedral atom, only 2 attachments can be in the plane, 1 must be in front, and 1behind.
-if the two in the plane are “down”, the hash/wedge should be up-if the two in plane are “up”, the hash/wedge should be down.-the hash/wedge should never point in same direction as the in-plane lines, or else the atomdoesn’t looks tetrahedral-for polyatomic molecules, it is strongly preferable to NOT have either of the in-plane atomspointing straight up. Straight-up in-plane atoms do not lend themselves to extended 3-Dstructures.
Bad! These don' t look tetrahedral!Good! Look tetrahedral
1. ALKANE. butane, CH3CH2CH2CH3-take the chain and wigglearound all the single bonds.-The most stable actual shapeis the one with the carbonszig-zagged and co-planar. -Notice the symmetry possible.
2. ALKANE. Pentane, CH3CH2CH2CH2CH3
Molecular Structure 10
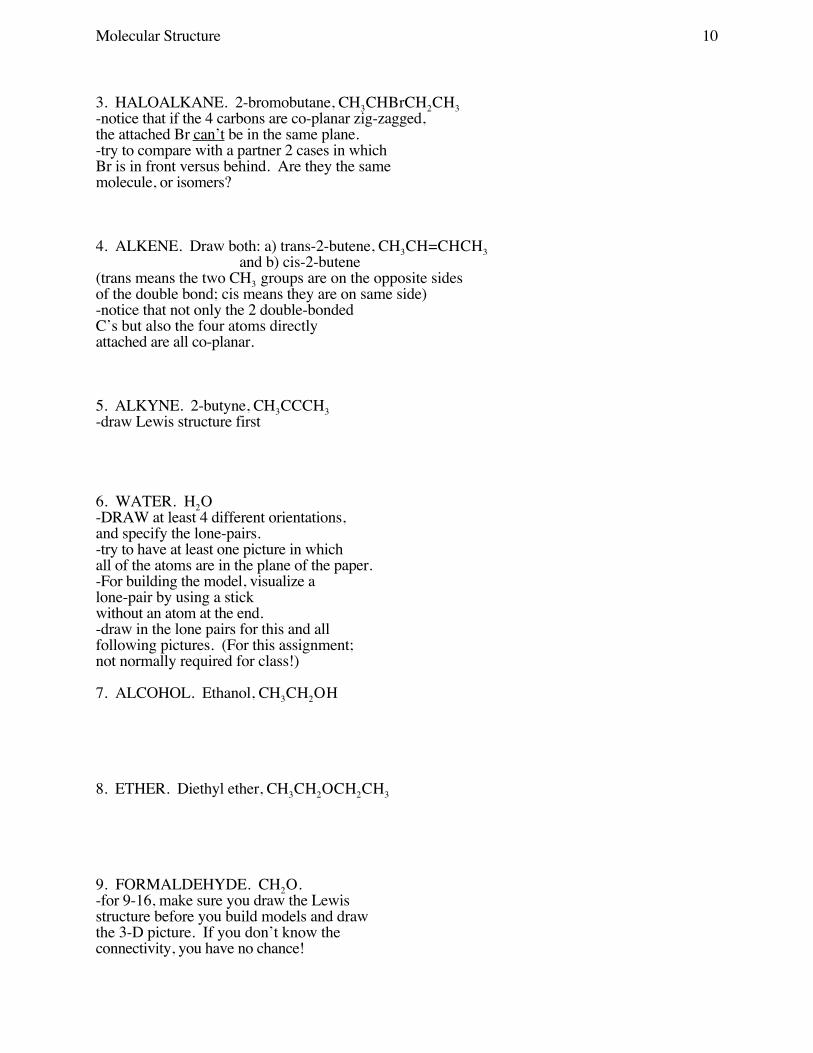
3. HALOALKANE. 2-bromobutane, CH3CHBrCH2CH3-notice that if the 4 carbons are co-planar zig-zagged,the attached Br can’t be in the same plane.-try to compare with a partner 2 cases in whichBr is in front versus behind. Are they the samemolecule, or isomers?
4. ALKENE. Draw both: a) trans-2-butene, CH3CH=CHCH3and b) cis-2-butene
(trans means the two CH3 groups are on the opposite sidesof the double bond; cis means they are on same side)-notice that not only the 2 double-bondedC’s but also the four atoms directlyattached are all co-planar.
5. ALKYNE. 2-butyne, CH3CCCH3-draw Lewis structure first
6. WATER. H2O-DRAW at least 4 different orientations,and specify the lone-pairs. -try to have at least one picture in whichall of the atoms are in the plane of the paper. -For building the model, visualize alone-pair by using a stickwithout an atom at the end.-draw in the lone pairs for this and allfollowing pictures. (For this assignment;not normally required for class!)
7. ALCOHOL. Ethanol, CH3CH2OH
8. ETHER. Diethyl ether, CH3CH2OCH2CH3
9. FORMALDEHYDE. CH2O. -for 9-16, make sure you draw the Lewisstructure before you build models and drawthe 3-D picture. If you don’t know theconnectivity, you have no chance!

Molecular Structure 11
10. ALDEHYDE. CH3CH2CHO.
11. KETONE. CH3CH2C(O)CH2CH3.
12. ACID. CH3CH2CO2H.
13. ESTER. CH3CH2CO2CH3.
14. AMMONIA. NH3
15. AMINE. (CH3CH2)2NH
16. AMIDE CH3CONH2. -FACT: contrary to what you wouldguess, the nitrogen is trigonal planarrather than tetrahedral. Draw accordingly!-by remaining planar, the nitrogen doesnot hybridize all of its p-orbitals. One p orbitalis left for orbital overlap/conjugation/resonancewith the pi bond.-because lone-pair is not hybridized, don’t 3-Dillustrate it-the fact that amides are planar is crucial tobiochemistry. The organization ofproteins/peptides/enzymes is completelydependent on the planarity of amide nitrogens. Without it we would all be dead!

Molecular Structure 12
17. CYCLIC COMPOUNDSA. Cyclopropane (CH2)3-notice how hard this is, how the bonds“bend”, etc.. Real cyclopropane experiencesreal “ring strain” based on the impossibilityof achieving 109˚ bond angles.
B. Cyclohexane (CH2)6-Don’t bother to draw! Too tough! But do build the model.1) notice that the 6 carbons do not easily remain coplanar. By puckering, ideal 109˚ bond anglescan be achieved.2) In the best model, 3 H’s point straight down, 3 H’s point straight up, and 6 H’s essentiallyextend almost horizontally. The “horizontal” H’s are called “equatorial” and the “vertical” H’sare called “axial”.3) Try to put colored balls into the “axial” positions. Then try to manipulate the model so that the“axial” atoms become “equatorial”, and the “equatorial” atoms become “axial”.-ask instructor to come over and give you cyclohexane spiel
18. Things that can’t be completely drawn “3-D”. 2-methylbutane, CH3CH2CH(CH3)2-notice that not all 5 of the carbons can be coplanar. Structures like this can’t be illustratedcompletely or easily. What you should do is simply draw “CH3” as being out-of-plane, but don’ttry to illustrate the “3-D-ness” of that carbon. Ask instructor for confirmation.
Molecular Structure 13
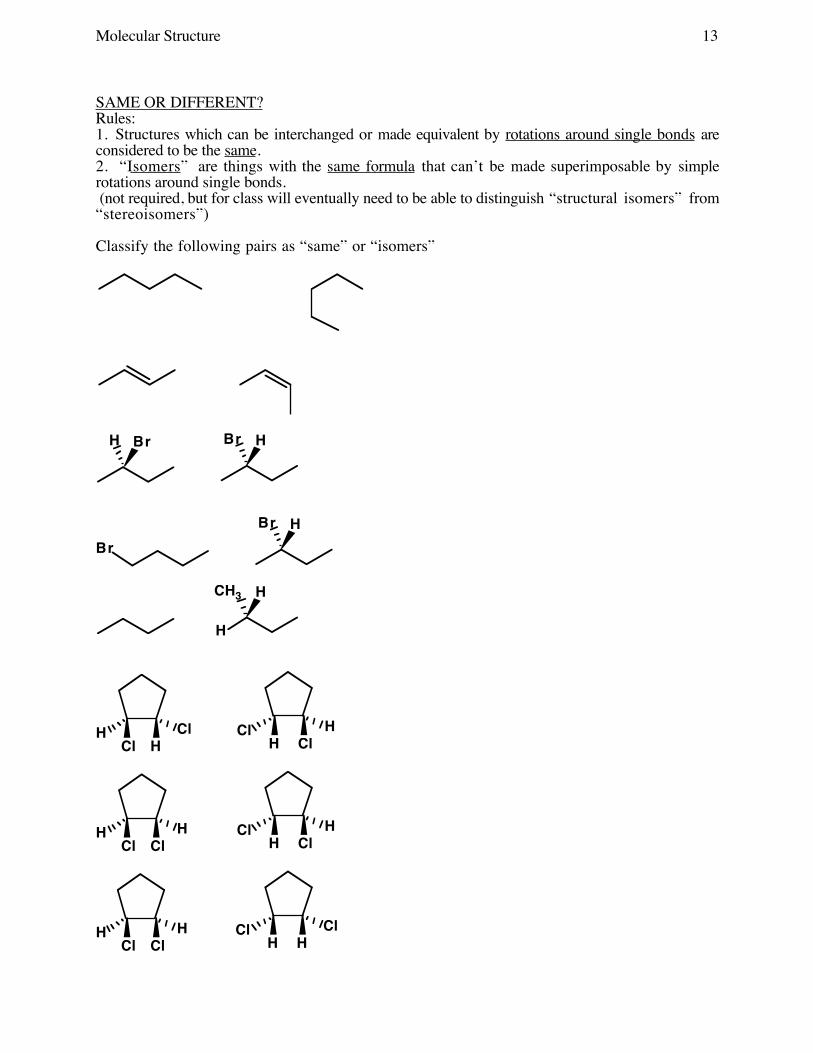
SAME OR DIFFERENT?Rules:1. Structures which can be interchanged or made equivalent by rotations around single bonds areconsidered to be the same.2. “Isomers” are things with the same formula that can’t be made superimposable by simplerotations around single bonds. (not required, but for class will eventually need to be able to distinguish “structural isomers” from“stereoisomers”)
Classify the following pairs as “same” or “isomers”
BrH HBr
BrHBr
H
HCH3
Cl HH Cl
H ClCl H
Cl ClH H
H ClCl H
Cl ClH H
H HCl Cl

Molecular Structure 14
Orbitals and Pi-BondsThe models you have built so far have used tetrahedral atoms and two flexible “banana bonds” formaking double bonds. From a molecular orbital perspective, it is often more useful to consider adouble bond as consisting of a straight sigma bond and a pi-bond made from the overlap of 2parallel, non-hybridized p-orbitals.
1 pi bond2 p-orbitals
+
Make a model of ethene, CH2=CH2, using trigonal atoms rather than tetrahedral atoms. Thetrigonal atoms all have holes in the middle. Poke sticks through the middle to represent p-orbitals.
1. Draw the molecule with the atoms in the plane of the paper (ignore the p-orbitals at first). Thendraw in the p-orbitals as well. -Notice: Are the p-orbitals in the plane of the paper? Do you like this picture? (It is expected tolook yucky so that you appreciate why you normally draw double bonds as in pictures 2 or 3!)
2. Draw the molecule with the carbons and the p-orbitals in the plane of the paper. Then add thefour hydrogens. -notice: are the atoms in the plane of the paper?
3. Redraw the molecule with the atoms in the plane of the paper, but don’t draw the p-orbitals.
Comment: Ordinarily, picture 3 is considered the best when you aren’t emphasizing p-orbitals orthe pi-bond.
However, if you are trying to illustrate p-orbitals and pi-bonds, picture 2 is considered easierthan picture 1.
Recrystallization I 15
Chem 355 Jasperse RECRYSTALLIZATION
Background:Impurities often contaminate organic compounds, whether they have been synthesized in the
laboratory or isolated from natural sources. Recrystallization is the most important method forremoving impurities from solid organic compounds. It is suitable for both small scale (<0.5 g) andlarge scale (>100g) work. The basic recrystallization plan is to dissolve an impure solid in ahot solvent, then cool the solution so that the desired molecules recrystallize while theimpurities remain in solution. Subsequent filtration separates the solid crystal from the liquidsolvent.
The dependence of solubility on temperature is key. Solubility of sample in solvent willalways be higher at high temperature, but will decrease at low temperature. A solvent that can fullydissolve a solid while hot may thus become saturated as the temperature is reduced, resulting incrystal formation. Soluble impurities stay in solution because they are not concentrated enough tosaturate the solution. However, even when the solvent is cold, at least some (if not all) of the desiredcompound will remain dissolved and will be lost during filtration.
The choice of solvent for a recrystallization is crucial. For a successful recrystallization thedissolving power of the solvent must be “mediocre”, neither too good nor too bad. Why?
• If the solvent is too good, then even when the solvent is cold the sample will remain dissolvedand you won’t be able to harvest any crystals.
• If the solvent is too bad, then even when the solvent is hot it still won’t be able to dissolve thesample, and the impurities won’t be freed from the original sample.
• An effective solvent must be mediocre, good enough to dissolve the sample at hightemperature (so that the impurities are freed), but weak enough so that at least some of yoursample crystallizes out after cooling (so that you get at least some yield harvested.)
Necessary sources of mass loss: The yield for a recrystallization can never be 100%. Whynot? Because while the chilled solvent is saturated and should release some crystals, at least some ofyour desired material will remain dissolved in the cold solvent and will be lost when the crystals andsolvent are separated. The primary necessary source of mass loss is to the solvent. Obviouslyadditional mass will be lost to physical handling, and some of the lost mass is simply the impuritiesthat you wanted to lose. (But normally the mass of impurities is only a few percent or less.)
Unnecessary sources of mass loss: While losing mass to the solvent is inevitable, unnecessarylosses to solvent are common and should be avoided. Some unnecessary losses to solvent resultfrom the following:
• Using too much solvent. The more solvent that you use, the more sample will remain in thesolvent even after cooling.
• Inadequate warming. If you don’t warm your solvent to boiling temperature, you will notbenefit from it’s maximum dissolving ability, and will need to use extra solvent to make upfor it. The unnecessary extra solvent will retain additional sample even after cooling.
• Inadequate cooling. If you don’t cool below room temperature, for example, more samplewill remain dissolved than if you cool to 0ºC.
• Excessive washing by solvent. Not only surface impurities but also some crystal will be lostwhen you wash your crystals. (There is usually some sort of happy medium required,because some rinsing is usually required).
• Choosing a poor solvent in the first place. If your solvent is too good, even after cooling itwill still retain much or all of the sample.
Ideal: Use a Minimum of Hot Solvent so that you are at the Saturated/Dissolved
Borderline at the Boiling Point. In order to maximize your purity, you’d like to use enoughsolvent to dissolve the crystals and keep the impurities in solution even after cooling. In order tomaximize your yield, you’d like to minimize the amount of solvent used so that as little as possiblesample remains in solution after cooling. The best way to accomplish both goals is to use enoughsolvent so that it can dissolve everything while hot, but to use no more than the minimum required soas to maximize yield after cooling. The minimum required is when your solution is just barely at thesaturation point while boiling hot. Use just enough solvent so that the material is just barely soluble,or is just a little cloudy to show that it’s just barely saturated.

Recrystallization I 16
Three Ways To Achieve Just-Barely-Saturated/Just-Barely-Dissolved Borderline. In allcases, heat to boiling.
• Add more hot solvent (if solubility is too low)• Boil solvent away (if solubility is too high)• Add ‘bad solvent’ (if solubility is too high) that will reduce the solubility
Mixed Solvents Often it’s difficult to find a single solvent that is appropriately “mediocre”.Frequently it’s easier to work with a solvent mixture, in which you use a good solvent and a badsolvent. In this process, the good solvent is able to dissolve the sample. As a solvent with poordissolving properties is added, the overall dissolving power of the solvent gets worse and worse.Eventually, the saturation point should be reached. This is often the most convenient way to dorecrystallizations. Use hot good solvent to get things dissolved, then add hot bad solvent untilsaturation is reached, then cool and filter.
• The most common “mixed solvent” combination involves an alcohol as the “goodsolvent” and water as the “bad solvent”. This is effective because many organics arehydrophobic. By adding water, you can rapidly reduce their solubility.
• When mixed solvents are used, it is essential that both are cosoluble with each other.Trying to add water as the “bad solvent” to a hydrocarbon solvent like hexane or toluenefails, because the water simply forms a separate layer and doesn’t actually do anything.
Choosing a Solvent As discussed previously, you don’t want too good a solvent (line B) or toobad a solvent (line C). And you’d like a solvent with as sharp as possible a dependence of solubilityon temperature (line A), so that it’s pretty soluble hot but not very soluble cold. Trial and errorexperimentation is often required for finding a suitable solvent. Like-dissolves-like considerationscan sometimes provide helpful guidance as to which solvents might be too good, or which might behopelessly bad. For somewhat polar molecules containing oxygen or nitrogen atoms, ethanol/watermixed solvents are frequently a fine choice. The boiling point of the solvent is also worth
considering. A relatively high boiling point is good because itallows a large temperature differential between boiling hot solventand the chilled solvent. Diethyl ether, for example, boils at only35ºC, so the solubility of a sample isn’t likely to drop as much uponcooling from 35ºC to 0ºC as if water is used, where the hot/colddifference could be 100ºC. On the other hand, you don’t want touse a solvent whose boiling point is so high that the sample willsimply melt when the solvent is heated to boiling. It’s also easier todry the crystals if the solvent isn’t too high boiling, so that itevaporates easily and won’t depress the melting range.
Summary of the four criteria for selecting a recrystallizing solvent: 1. compound being purified must be insoluble in the solvent at room temperature2. compound must be soluble in the boiling solvent3. solvent’s boiling point must be lower than the compound’s melting point4. an abundant quantity of crystals must be recoverable from the cool solvent
line A
line B
line C
Temperature
solu
bility
Recrystallization I 17
Crystallization Summary1. Choosing the Solvent. “Like dissolves like.” Some common solvents are
water, methanol, ethanol, ligroin, and toluene. When you use a solvent pair,dissolve the solute in the better solvent and add the poorer solvent to the hotsolution until saturation occurs. Some common solvent pairs are ethanol-water, diethyl ether-ligroin, toluene-ligroin, and t-butyl methyl ether-hexane.
2. Dissolving the solute. To the crushed or ground solute in an Erlenmeyerflask, add solvent, add a boiling stick, and heat the mixture to boiling. Addmore solvent as necessary to obtain a hot, saturated solution. (Do not use abeaker, because the large mouth allows solvent evaporation to be too fast anduncontrolled.)
3. Filtering suspended solids (if necessary). If it is necessary to removesuspended solids, dilute the hot solution slightly to prevent crystallization fromoccurring during filtration. Filter the hot solution. Add solvent ifcrystallization begins in the funnel. Concentrate the filtrate to obtain asaturated solution.
4. Crystallizing the solute. Let the hot saturated solution cool spontaneously toroom temperature. Do not disturb the solution. Slow cooling gives the bestcrystals. Cooling while clamped in the air, or while standing on a watch glassthat is resting on your round-bottomed flask holder is a good way to do it. Puta watch glass or inverted beaker over the top of your flask so that solventdoesn’t evaporate away while still hot. Then cool it in ice. If crystallizationdoes not occur, scratch the insides of the container, add seed crystals, or formany solvents add ice chip(s).
5. Collecting and washing the crystals. Collect the crystals using a Hirschfunnel (<0.2 grams) or a Buchner funnel (>0.2 g), a filter flask, and aspiratorsuction. Place a filter paper on the surface, wet the filter paper with solvent,and apply suction to make sure the paper seals. Break the vacuum, addcrystals and liquid, and apply vacuum. After solvent disappears, breakvacuum, add cold wash solvent, apply vacuum, and repeat until crystals areclean and filtrate comes through clear. The wash solvent is normally either asmall amount of an ice-cold portion of the main recrystallization solvent, or elsea somewhat “worse” solvent (although it shouldn’t normally be a totally“bad” solvent). For example, if 80% ethanol/water is used for arecrystallization, it would be common to wash with 60% ethanol/water toavoid dissolving much crystal.
6. Drying the product. Aspirate the sample for as long as is convenient. Pressthe product on the filter to remove solvent. Then remove it from the filter,squeeze it between sheets of filter paper to remove more solvent, and spread iton a watch glass to dry
7. Analyzing the product. Take a melting point of the final product. But sinceincomplete drying will contaminate the crystal and depress the melting point, itis normally best to wait for 15 hours or more before doing so.
Recrystallization I 18
PART 1: Macroscale Recrystallization of Phthalic Acid from Water
Weight out about 1 g of pthalic acid. (Record exact mass). Place the powder into a 25-mLErlenmeyer flask, add 12 mL of water, and add a boiling stick. (The stick facilitates even boiling andprevents “bumping” explosions). Heat on a hot plate until the water begins to boil gently. (Avoid ahard boil. If much of your solvent boils away, the sample will either not dissolve in the first place orwill not be able to remain dissolved). Once the solution has reached the boiling point and the samplehas dissolved, remove it from the hot plate and move it onto a watch glass suspended on a round-bottomed flask holder (cork ring or rubber ring). (Two convenient ways to transfer a hot flask is toeither hold it with tongs, or else to get a wet paper towel and transfer it by hand.) Remove the boilingstick and cover the top of the flask with an inverted 50-mL beaker. (This is to prevent further hotsolvent from evaporating away.) The reason you don’t want to put your flask on the bench top isthat heat transfer will be too fast and it will cool too quickly, resulting in inferior and less purecrystals. Allow the flask to cool until it is no longer hot to the touch. (10 minutes.) Then place it inan ice bath so that it gets as cold as possible and the smallest necessary amount of desired productstays in solution. (5 minutes).
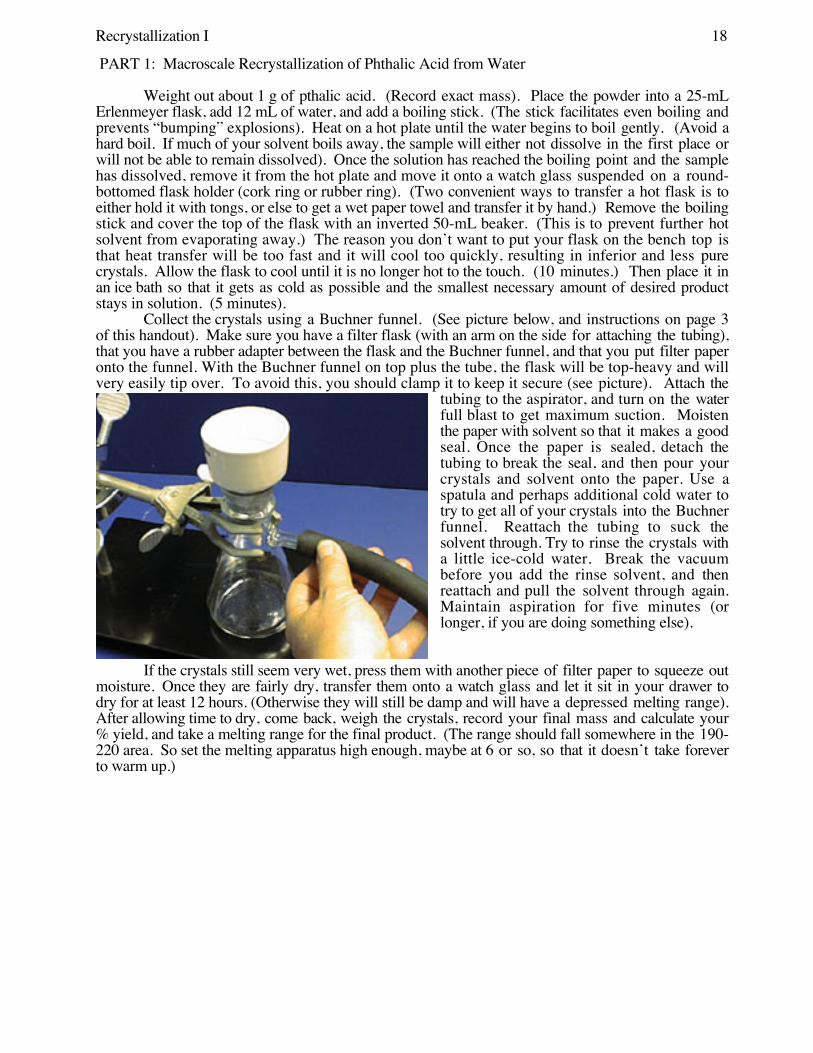
Collect the crystals using a Buchner funnel. (See picture below, and instructions on page 3of this handout). Make sure you have a filter flask (with an arm on the side for attaching the tubing),that you have a rubber adapter between the flask and the Buchner funnel, and that you put filter paperonto the funnel. With the Buchner funnel on top plus the tube, the flask will be top-heavy and willvery easily tip over. To avoid this, you should clamp it to keep it secure (see picture). Attach the
tubing to the aspirator, and turn on the waterfull blast to get maximum suction. Moistenthe paper with solvent so that it makes a goodseal. Once the paper is sealed, detach thetubing to break the seal, and then pour yourcrystals and solvent onto the paper. Use aspatula and perhaps additional cold water totry to get all of your crystals into the Buchnerfunnel. Reattach the tubing to suck thesolvent through. Try to rinse the crystals witha little ice-cold water. Break the vacuumbefore you add the rinse solvent, and thenreattach and pull the solvent through again.Maintain aspiration for five minutes (orlonger, if you are doing something else).
If the crystals still seem very wet, press them with another piece of filter paper to squeeze outmoisture. Once they are fairly dry, transfer them onto a watch glass and let it sit in your drawer todry for at least 12 hours. (Otherwise they will still be damp and will have a depressed melting range).After allowing time to dry, come back, weigh the crystals, record your final mass and calculate your% yield, and take a melting range for the final product. (The range should fall somewhere in the 190-220 area. So set the melting apparatus high enough, maybe at 6 or so, so that it doesn’t take foreverto warm up.)
Recrystallization I 19
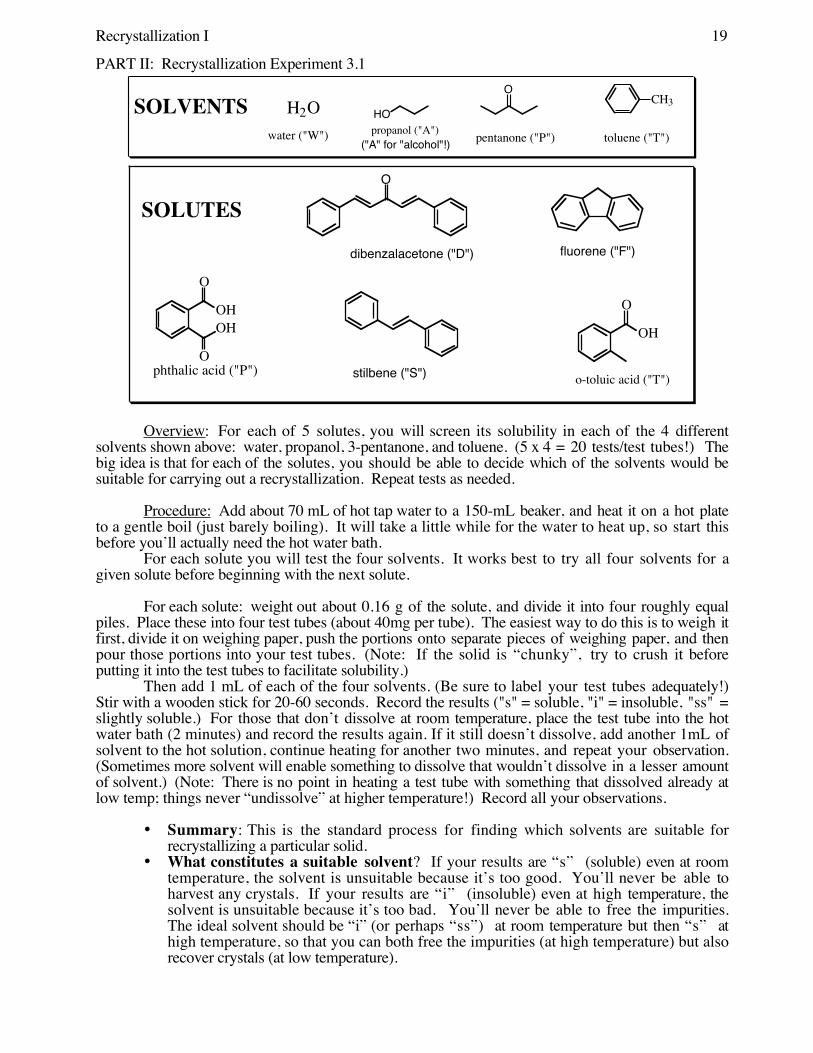
PART II: Recrystallization Experiment 3.1
HOCH3
O
water ("W") propanol ("A") pentanone ("P") toluene ("T")
SOLVENTS H2O
("A" for "alcohol"!)
OHOH
O
OOH
O
phthalic acid ("P")o-toluic acid ("T")stilbene ("S")
fluorene ("F")
O
dibenzalacetone ("D")
SOLUTES
Overview: For each of 5 solutes, you will screen its solubility in each of the 4 differentsolvents shown above: water, propanol, 3-pentanone, and toluene. (5 x 4 = 20 tests/test tubes!) Thebig idea is that for each of the solutes, you should be able to decide which of the solvents would besuitable for carrying out a recrystallization. Repeat tests as needed.
Procedure: Add about 70 mL of hot tap water to a 150-mL beaker, and heat it on a hot plateto a gentle boil (just barely boiling). It will take a little while for the water to heat up, so start thisbefore you’ll actually need the hot water bath.
For each solute you will test the four solvents. It works best to try all four solvents for agiven solute before beginning with the next solute.
For each solute: weight out about 0.16 g of the solute, and divide it into four roughly equalpiles. Place these into four test tubes (about 40mg per tube). The easiest way to do this is to weigh itfirst, divide it on weighing paper, push the portions onto separate pieces of weighing paper, and thenpour those portions into your test tubes. (Note: If the solid is “chunky”, try to crush it beforeputting it into the test tubes to facilitate solubility.)
Then add 1 mL of each of the four solvents. (Be sure to label your test tubes adequately!)Stir with a wooden stick for 20-60 seconds. Record the results ("s" = soluble, "i" = insoluble, "ss" =slightly soluble.) For those that don’t dissolve at room temperature, place the test tube into the hotwater bath (2 minutes) and record the results again. If it still doesn’t dissolve, add another 1mL ofsolvent to the hot solution, continue heating for another two minutes, and repeat your observation.(Sometimes more solvent will enable something to dissolve that wouldn’t dissolve in a lesser amountof solvent.) (Note: There is no point in heating a test tube with something that dissolved already atlow temp; things never “undissolve” at higher temperature!) Record all your observations.
• Summary: This is the standard process for finding which solvents are suitable forrecrystallizing a particular solid.
• What constitutes a suitable solvent? If your results are “s” (soluble) even at roomtemperature, the solvent is unsuitable because it’s too good. You’ll never be able toharvest any crystals. If your results are “i” (insoluble) even at high temperature, thesolvent is unsuitable because it’s too bad. You’ll never be able to free the impurities.The ideal solvent should be “i” (or perhaps “ss”) at room temperature but then “s” athigh temperature, so that you can both free the impurities (at high temperature) but alsorecover crystals (at low temperature).

Recrystallization I 20

Recrystallization I 21
RECRYSTALLIZATION REPORT Name:
Report requirements (Part 1): 1. Report your initial mass, your mass recovery, and your % yield.
2. Report your dry melting range.
3. Explain very briefly why dissolving and then reforming crystals can improve their purity.
4. Explain very briefly why recrystallization can never result in 100% mass recovery (even ifyou used perfectly pure material).
5. Explain very briefly why mass recovery is greater if you cool to 0˚C rather than merely room temperature.
6. Explain very briefly why mass recovery is reduced if you use an excess amount of boilingsolvent.
7. Explain very briefly why washing product crystals with excessive amounts of solvent,especially warm solvent, can result in reduced mass recovery.
8. Given: • The solubility of X at 100ºC in water is 18.0 g/100 mL water. • The solubility of X at 0ºC in water is 3.6 g/100 mL water.
How many mL of boiling water would be required to dissolve 25g of X? If that solution wasthen cooled down to 0ºC, how many grams of X could then crystallize out? What would be themaximum yield recovery for X?
9. An ideal recrystallization solvent is able to fully dissolve a solute only when hot, but not whencold.
• Why is a solvent that can dissolve the solute even when it is cold useless forrecrystallizations?
• Why is a solvent that can’t dissolve the solute even when hot useless for recrystallizations?
Recrystallization I 22
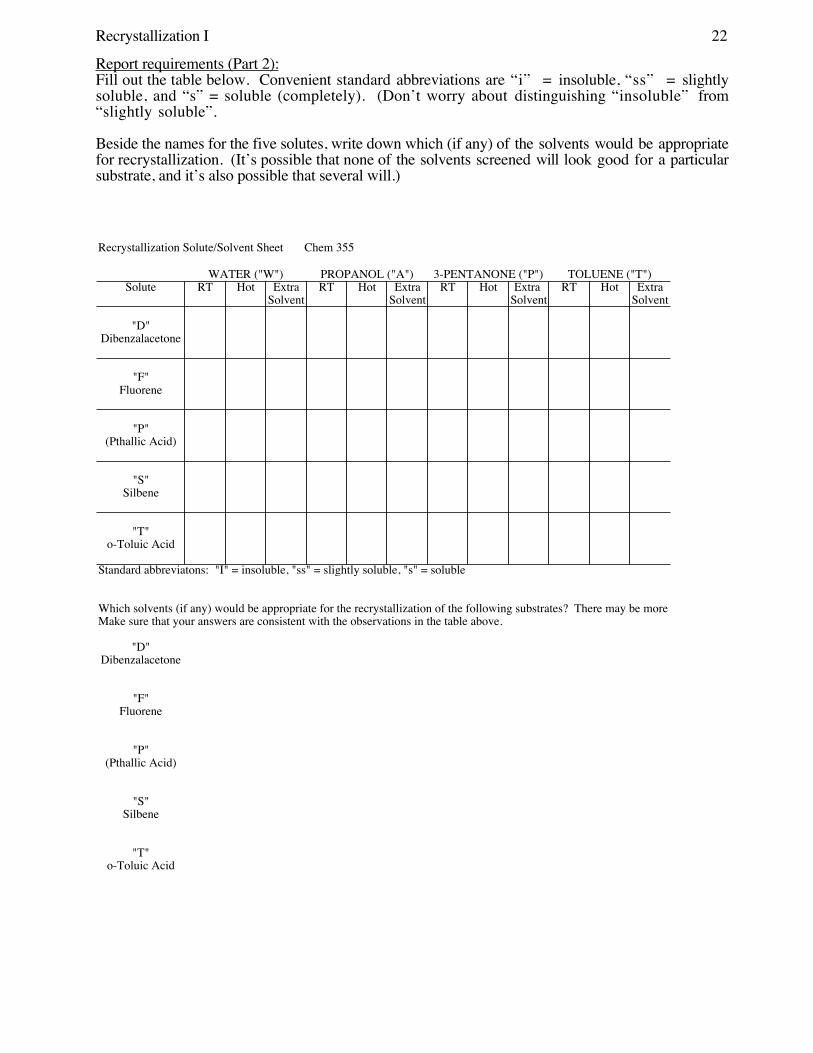
Recrystallization Solute/Solvent Sheet Chem 355
WATER ("W") PROPANOL ("A") 3-PENTANONE ("P") TOLUENE ("T")Solute RT Hot Extra RT Hot Extra RT Hot Extra RT Hot Extra
Solvent Solvent Solvent Solvent
"D"Dibenzalacetone
"F"Fluorene
"P"(Pthallic Acid)
"S"Silbene
"T"o-Toluic Acid
Standard abbreviatons: "I" = insoluble, "ss" = slightly soluble, "s" = soluble
Which solvents (if any) would be appropriate for the recrystallization of the following substrates? There may be more than one. Make sure that your answers are consistent with the observations in the table above.
"D"Dibenzalacetone
"F"Fluorene
"P"(Pthallic Acid)
"S"Silbene
"T"o-Toluic Acid
Report requirements (Part 2): Fill out the table below. Convenient standard abbreviations are “i” = insoluble, “ss” = slightlysoluble, and “s” = soluble (completely). (Don’t worry about distinguishing “insoluble” from“slightly soluble”.
Beside the names for the five solutes, write down which (if any) of the solvents would be appropriatefor recrystallization. (It’s possible that none of the solvents screened will look good for a particularsubstrate, and it’s also possible that several will.)
Recrystallization II 23
Chem 355 Jasperse RECRYSTALLIZATION-Week 2
1. Mixed Solvent Recrystallization of Acetanilide2. Mixed Solvent Recrystallization of Dibenzylacetone
3. Recrystallization of an UnknownBackgroundReview: Recrystallization is an important technique for purifying organic solids. Thecontaminated solid is dissolved in a minimum of hot solvent, then cooled. The amount of solventthat is used should be just enough so that the solvent is just barely saturated or almost saturatedwhen it is boiling hot. Upon cooling the solubility decreases, and crystal formation can occur. Thenew crystals are purer than the original because impurities are left in the solvent. Slow, gradualcooling is best for formation of pure crystals. Filtration then provides purified material. Somemass loss always occurs, because the solvent holds not only the impurities but also some of thedesired material as well. Additional unnecessary mass loss can occur if you use too much solvent,don’t heat your solution to boiling in the process of dissolving your sample, if you don’t cooladequately, or if you wash your product crystals excessively. An appropriate solvent needs to havemediocre dissolving power: strong enough to dissolve the sample when boiling hot, but not able todissolve too much of the sample when cold.
General Mixed Solvent Procedure, Concept: Often it’s difficult to find a single solvent withappropriate dissolving power. Further, it’s often difficult to decide exactly how much of the solventis ideal. Frequently the use of mixed solvents is a practical and convenient solution.
In the usual mixed solvent recrystallization procedure, dissolve your sample in a sufficientquantity of your “better” solvent by heating it up to the boiling point. A 4 mL/1 g ratio is thedefault starting guess. Add more solvent if necessary, or boil some off if you judge it’s obviouslyway more than needed. Then add “bad” solvent (usually hot water), until either you reach a visible“saturation” point (the “lucky” situation, where you can see crystals or slight cloudinessbeginning to form) or until you have a 1:1 solvent ratio. Let cool so as to grow more crystals andharvest by filtration.
When mixed solvents are used, it is essential that they be co-soluble. Otherwise the badsolvent will simply create a second layer, but the sample can remain soluble in the original layer.
Ethanol/water combinations are commonly used because ethanol has good dissolving abilityfor many organics, but is also infinitely co-soluble with water. Addition of water can rapidly anddramatically reduce the solubility of many organics and thus induce crystallization. While organicmixtures are also frequently useful, the difference in character between two organics is rarely asdramatic as the difference between water and an organic solvent.
Difficult Crystallizations: Sometimes crystallization is slow or difficult. Crystallization muststart on some nucleation center. (Crystals grow when molecules “fit” onto some preexistingsurface.) Sometimes this will happen spontaneously, but sometimes it is difficult. The formationof “supersaturated” solutions, in which the solvent holds more sample than it could if equilibriumexisted, are routine. Some common techniques for initiating crystallization include:
• Seeding the saturated solution with some of the desired sample that is already in solid form. • Scratching the insides of your flask with a rough glass rod. (By scratching the surface of
your glass, you can get a rough edge which may coincidentally serve as a crystallizationsurface.)
• Using old, scratched up flasks!• Leaving a boiling stick, preferably broken off so it has rough shards sticking out at the end. • Adding an ice chip. (The surface is often rather rough, and can serve as a nucleation site.
In addition, because the surface is pure water, the solvent composition near the ice chip isnot representative of the bulk solvent distribution. Being water-rich, solubility may beespecially poor resulting in crystal initiation. The ice chip serves to provide a local area ofextremely “bad solvent”.)
• Wait a long time!• Find a better solvent!
Recrystallization II 24
Crystallization Summary1. Choosing the Solvent. “Like dissolves like.” Some common solvents
are water, methanol, ethanol, ligroin, and toluene. When you use a solventpair, dissolve the solute in the better solvent and add the poorer solvent tothe hot solution until saturation occurs. Some common solvent pairs areethanol-water, diethyl ether-ligroin, toluene-ligroin, and t-butyl methylether-hexane.
2. Dissolving the solute. To the crushed or ground solute in an Erlenmeyerflask, add solvent, add a boiling stick, and heat the mixture to boiling.Add more solvent as necessary to obtain a hot, saturated solution. (Donot use a beaker, because the large mouth allows solvent evaporation tobe too fast and uncontrolled.)
3. Filtering suspended solids (if necessary). If it is necessary to removesuspended solids, dilute the hot solution slightly to prevent crystallizationfrom occurring during filtration. Filter the hot solution. Add solvent ifcrystallization begins in the funnel. Concentrate the filtrate to obtain asaturated solution.
4 . Crystallizing the solute. Let the hot saturated solution coolspontaneously to room temperature. Do not disturb the solution. Slowcooling gives the best crystals. Cooling while clamped in the air, or whilestanding on a watch glass that is resting on your round-bottomed flaskholder is a good way to do it. Put a watch glass or inverted beaker overthe top of your flask so that solvent doesn’t evaporate away while still hot. Then cool it in ice. If crystallization does not occur, scratch the insides ofthe container, add seed crystals, or for many solvents add ice chip(s).
5. Collecting and washing the crystals. Collect the crystals using a Hirschfunnel (<0.2 grams) or a Buchner funnel (>0.2 g), a filter flask, andaspirator suction. Place a filter paper on the surface, wet the filter paperwith solvent, and apply suction to make sure the paper seals. Break thevacuum, add crystals and liquid, and apply vacuum. After solventdisappears, break vacuum, add cold wash solvent, apply vacuum, andrepeat until crystals are clean and filtrate comes through clear. The washsolvent is normally either a small amount of an ice-cold portion of themain recrystallization solvent, or else a somewhat “worse” solvent(although it shouldn’t normally be a totally “bad” solvent). For example,if 80% ethanol/water is used for a recrystallization, it would be common towash with 60% ethanol/water to avoid dissolving much crystal.
6. Drying the product. Aspirate the sample for as long as is convenient.Press the product on the filter to remove solvent. Then remove it fromthe filter, squeeze it between sheets of filter paper to remove more solvent,and spread it on a watch glass to dry
7. Analyzing the product. Take a melting point of the final product. Butsince incomplete drying will contaminate the crystal and depress themelting point, it is normally best to wait for 15 hours or more beforedoing so.
Recrystallization II 25
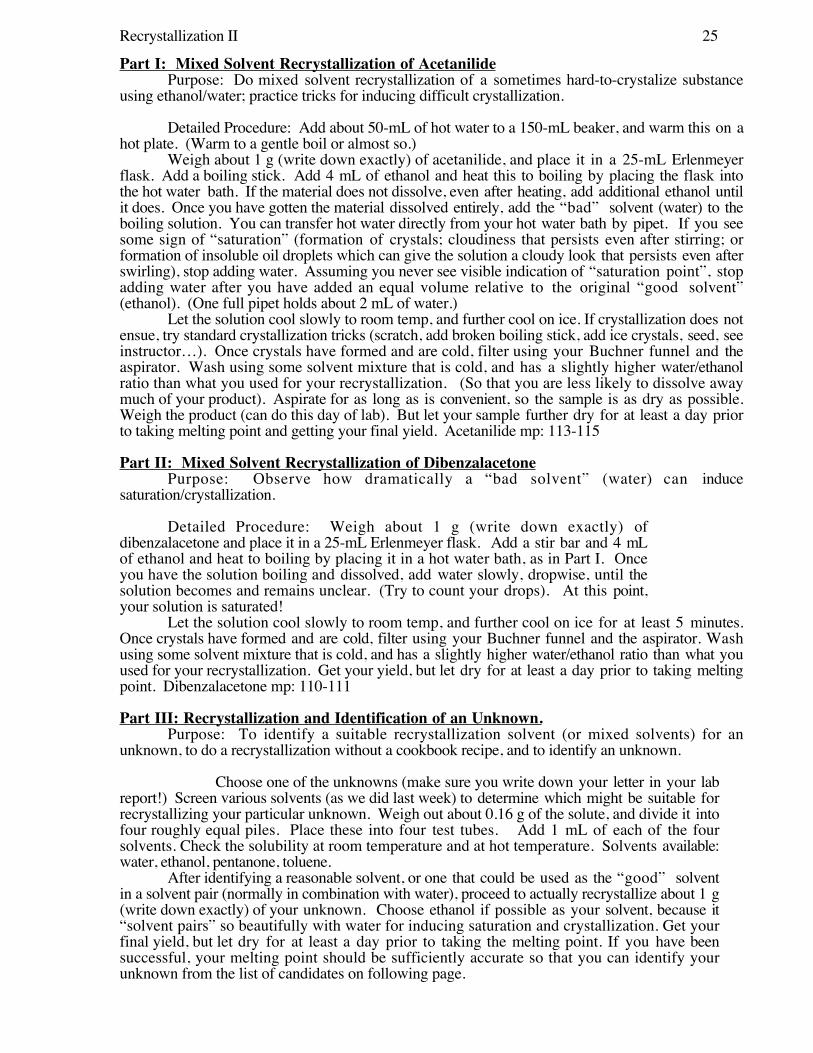
Part I: Mixed Solvent Recrystallization of AcetanilidePurpose: Do mixed solvent recrystallization of a sometimes hard-to-crystalize substance
using ethanol/water; practice tricks for inducing difficult crystallization.
Detailed Procedure: Add about 50-mL of hot water to a 150-mL beaker, and warm this on ahot plate. (Warm to a gentle boil or almost so.)
Weigh about 1 g (write down exactly) of acetanilide, and place it in a 25-mL Erlenmeyerflask. Add a boiling stick. Add 4 mL of ethanol and heat this to boiling by placing the flask intothe hot water bath. If the material does not dissolve, even after heating, add additional ethanol untilit does. Once you have gotten the material dissolved entirely, add the “bad” solvent (water) to theboiling solution. You can transfer hot water directly from your hot water bath by pipet. If you seesome sign of “saturation” (formation of crystals; cloudiness that persists even after stirring; orformation of insoluble oil droplets which can give the solution a cloudy look that persists even afterswirling), stop adding water. Assuming you never see visible indication of “saturation point”, stopadding water after you have added an equal volume relative to the original “good solvent”(ethanol). (One full pipet holds about 2 mL of water.)
Let the solution cool slowly to room temp, and further cool on ice. If crystallization does notensue, try standard crystallization tricks (scratch, add broken boiling stick, add ice crystals, seed, seeinstructor…). Once crystals have formed and are cold, filter using your Buchner funnel and theaspirator. Wash using some solvent mixture that is cold, and has a slightly higher water/ethanolratio than what you used for your recrystallization. (So that you are less likely to dissolve awaymuch of your product). Aspirate for as long as is convenient, so the sample is as dry as possible.Weigh the product (can do this day of lab). But let your sample further dry for at least a day priorto taking melting point and getting your final yield. Acetanilide mp: 113-115
Part II: Mixed Solvent Recrystallization of DibenzalacetonePurpose: Observe how dramatically a “bad solvent” (water) can induce
saturation/crystallization.
Detailed Procedure: Weigh about 1 g (write down exactly) ofdibenzalacetone and place it in a 25-mL Erlenmeyer flask. Add a stir bar and 4 mLof ethanol and heat to boiling by placing it in a hot water bath, as in Part I. Onceyou have the solution boiling and dissolved, add water slowly, dropwise, until thesolution becomes and remains unclear. (Try to count your drops). At this point,your solution is saturated!
Let the solution cool slowly to room temp, and further cool on ice for at least 5 minutes.Once crystals have formed and are cold, filter using your Buchner funnel and the aspirator. Washusing some solvent mixture that is cold, and has a slightly higher water/ethanol ratio than what youused for your recrystallization. Get your yield, but let dry for at least a day prior to taking meltingpoint. Dibenzalacetone mp: 110-111 Part III: Recrystallization and Identification of an Unknown.
Purpose: To identify a suitable recrystallization solvent (or mixed solvents) for anunknown, to do a recrystallization without a cookbook recipe, and to identify an unknown.
Choose one of the unknowns (make sure you write down your letter in your labreport!) Screen various solvents (as we did last week) to determine which might be suitable forrecrystallizing your particular unknown. Weigh out about 0.16 g of the solute, and divide it intofour roughly equal piles. Place these into four test tubes. Add 1 mL of each of the foursolvents. Check the solubility at room temperature and at hot temperature. Solvents available:water, ethanol, pentanone, toluene.
After identifying a reasonable solvent, or one that could be used as the “good” solventin a solvent pair (normally in combination with water), proceed to actually recrystallize about 1 g(write down exactly) of your unknown. Choose ethanol if possible as your solvent, because it“solvent pairs” so beautifully with water for inducing saturation and crystallization. Get yourfinal yield, but let dry for at least a day prior to taking the melting point. If you have beensuccessful, your melting point should be sufficiently accurate so that you can identify yourunknown from the list of candidates on following page.

Recrystallization II 26
HOCH3
O
water ("W") ethanol ("E") pentanone ("P") toluene ("T")
SOLVENTS H2O
Recrystallization Unknown Candidates:methyl 3-nitrobenzoate 78-80 cinnamic acid 133-134
1-naphthol 95-96 3-nitrobenzoic acid 140-142
1,4-di-t-butyl-2,5-dimethoxybenzene
104-105 4-nitroaniline 148-150
trans-Stilbene 121-122 triphenylmethanol 160-165
NH
O O CH3
ON+O
O- OH
O CH3
OCH3
O
OH
O
N+O
O-OHN+O O-
NH2
OH
O
Triphenylmethanol4-Nitroaniline
3-Nitrobenzoic acid
cinnamic acidtrans-stilbene
dibenzalacetone
1,4-di-t-butyl-2,5-dimethoxybenzene
1-NaphtholMethyl 3-NitrobenzoateAcetanilide
Recrystallization Unknown Candidates
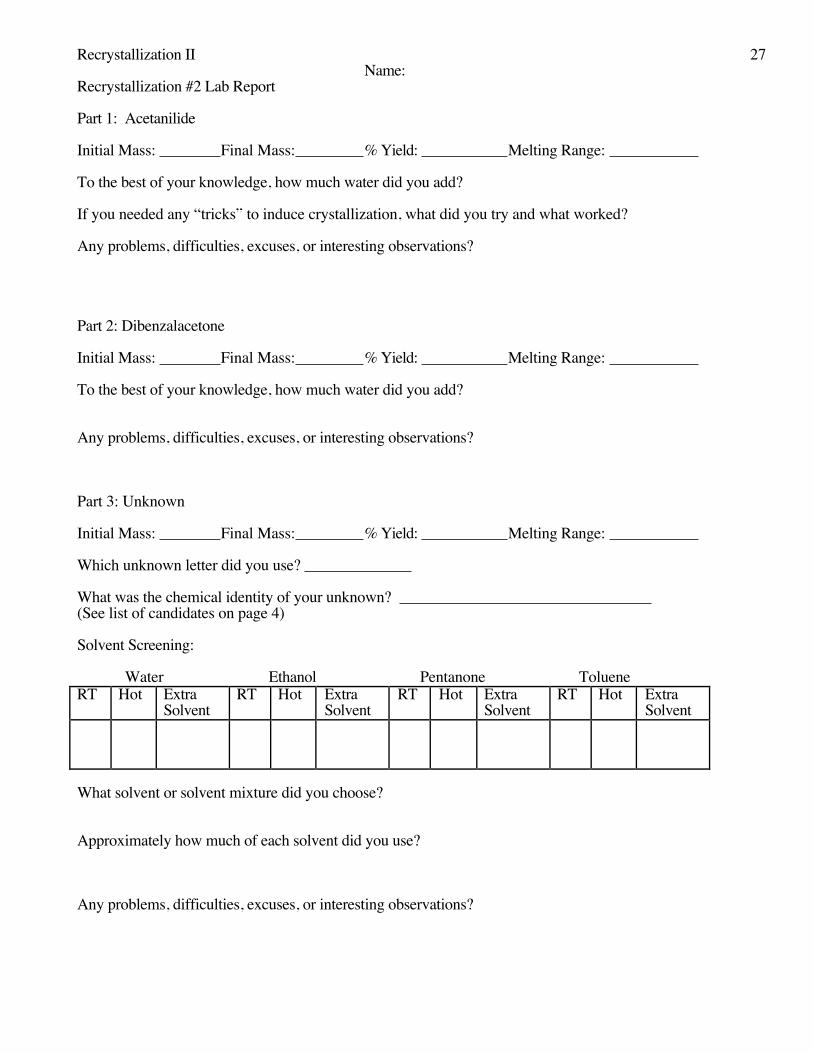
Recrystallization II 27 Name: Recrystallization #2 Lab Report
Part 1: Acetanilide
Initial Mass: Final Mass: % Yield: Melting Range:
To the best of your knowledge, how much water did you add?
If you needed any “tricks” to induce crystallization, what did you try and what worked?
Any problems, difficulties, excuses, or interesting observations?
Part 2: Dibenzalacetone
Initial Mass: Final Mass: % Yield: Melting Range:
To the best of your knowledge, how much water did you add?
Any problems, difficulties, excuses, or interesting observations?
Part 3: Unknown
Initial Mass: Final Mass: % Yield: Melting Range:
Which unknown letter did you use?
What was the chemical identity of your unknown? (See list of candidates on page 4)
Solvent Screening:
Water Ethanol Pentanone TolueneRT Hot Extra
SolventRT Hot Extra
SolventRT Hot Extra
SolventRT Hot Extra
Solvent
What solvent or solvent mixture did you choose?
Approximately how much of each solvent did you use?
Any problems, difficulties, excuses, or interesting observations?

Recrystallization II 28
Distillation 29
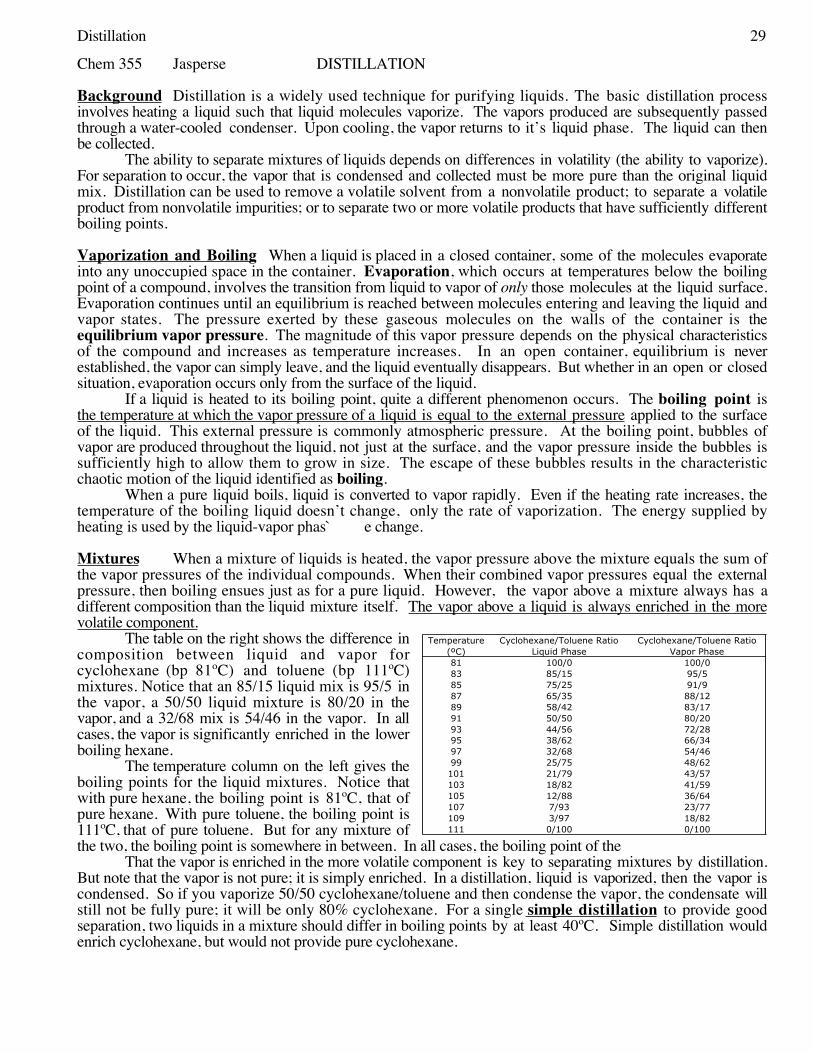
Temperature Cyclohexane/Toluene Ratio Cyclohexane/Toluene Ratio(ºC) Liquid Phase Vapor Phase81 100/0 100/083 85/15 95/585 75/25 91/987 65/35 88/1289 58/42 83/1791 50/50 80/2093 44/56 72/2895 38/62 66/3497 32/68 54/4699 25/75 48/62101 21/79 43/57103 18/82 41/59105 12/88 36/64107 7/93 23/77109 3/97 18/82111 0/100 0/100
Chem 355 Jasperse DISTILLATION
Background Distillation is a widely used technique for purifying liquids. The basic distillation processinvolves heating a liquid such that liquid molecules vaporize. The vapors produced are subsequently passedthrough a water-cooled condenser. Upon cooling, the vapor returns to it’s liquid phase. The liquid can thenbe collected.
The ability to separate mixtures of liquids depends on differences in volatility (the ability to vaporize).For separation to occur, the vapor that is condensed and collected must be more pure than the original liquidmix. Distillation can be used to remove a volatile solvent from a nonvolatile product; to separate a volatileproduct from nonvolatile impurities; or to separate two or more volatile products that have sufficiently differentboiling points.
Vaporization and Boiling When a liquid is placed in a closed container, some of the molecules evaporateinto any unoccupied space in the container. Evaporation, which occurs at temperatures below the boilingpoint of a compound, involves the transition from liquid to vapor of only those molecules at the liquid surface.Evaporation continues until an equilibrium is reached between molecules entering and leaving the liquid andvapor states. The pressure exerted by these gaseous molecules on the walls of the container is theequilibrium vapor pressure. The magnitude of this vapor pressure depends on the physical characteristicsof the compound and increases as temperature increases. In an open container, equilibrium is neverestablished, the vapor can simply leave, and the liquid eventually disappears. But whether in an open or closedsituation, evaporation occurs only from the surface of the liquid.
If a liquid is heated to its boiling point, quite a different phenomenon occurs. The boiling point isthe temperature at which the vapor pressure of a liquid is equal to the external pressure applied to the surfaceof the liquid. This external pressure is commonly atmospheric pressure. At the boiling point, bubbles ofvapor are produced throughout the liquid, not just at the surface, and the vapor pressure inside the bubbles issufficiently high to allow them to grow in size. The escape of these bubbles results in the characteristicchaotic motion of the liquid identified as boiling.
When a pure liquid boils, liquid is converted to vapor rapidly. Even if the heating rate increases, thetemperature of the boiling liquid doesn’t change, only the rate of vaporization. The energy supplied byheating is used by the liquid-vapor phas` e change.
Mixtures When a mixture of liquids is heated, the vapor pressure above the mixture equals the sum ofthe vapor pressures of the individual compounds. When their combined vapor pressures equal the externalpressure, then boiling ensues just as for a pure liquid. However, the vapor above a mixture always has adifferent composition than the liquid mixture itself. The vapor above a liquid is always enriched in the morevolatile component.
The table on the right shows the difference incomposition between liquid and vapor forcyclohexane (bp 81ºC) and toluene (bp 111ºC)mixtures. Notice that an 85/15 liquid mix is 95/5 inthe vapor, a 50/50 liquid mixture is 80/20 in thevapor, and a 32/68 mix is 54/46 in the vapor. In allcases, the vapor is significantly enriched in the lowerboiling hexane.
The temperature column on the left gives theboiling points for the liquid mixtures. Notice thatwith pure hexane, the boiling point is 81ºC, that ofpure hexane. With pure toluene, the boiling point is111ºC, that of pure toluene. But for any mixture ofthe two, the boiling point is somewhere in between. In all cases, the boiling point of the
That the vapor is enriched in the more volatile component is key to separating mixtures by distillation.But note that the vapor is not pure; it is simply enriched. In a distillation, liquid is vaporized, then the vapor iscondensed. So if you vaporize 50/50 cyclohexane/toluene and then condense the vapor, the condensate willstill not be fully pure; it will be only 80% cyclohexane. For a single simple distillation to provide goodseparation, two liquids in a mixture should differ in boiling points by at least 40ºC. Simple distillation wouldenrich cyclohexane, but would not provide pure cyclohexane.

Distillation 30
Fractional Distillation But consider what might happen if you did a series of vaporization-concentration cycles on a cyclohexane/toluene mixture. If you start with a 50/50 liquid mix, the vapor will be80/20. If you condense some of that 80/20 vapor, the vapor above an 80/20 liquid mix would in turn be 93/7.If you condense that vapor, you will have 93/7 liquid. But the vapor above that liquid will in turn be >98/2pure in cyclohexane. If you then condense that vapor, the resulting condensate will be quite pure incyclohexane. Thus by doing four distillations, you could have relatively pure cyclohexane.
This kind of sequence of multiple distillations is involved in a process called “fractionaldistillation”. A fractional distillation apparatus includes a column placed in between the boiling pot and thecondenser. The fractionating column is filled with packing material with high surface area (typically glassbeats or metal wire.) The vapors generated in the pot rise up the fractionating column and encounter coolersurfaces, upon which they condense. The condensed liquid is then reheated by rising hot vapors andrevaporize. This process of condensation and revaporization may occur again and again as the vapors rise upthe column. These composition changes are reflected by a decrease in boiling temperature as the mixturemoves up the fractioning column. If the condensation-revaporization is repeated a sufficient number of times,the vapors of the more volatile compound reach the top of the column in a pure form. As these vapors moveinto the condenser, the compound condenses and is collected as a purified liquid.
Purification of the high-boiling component: As the more volatile component is being selectivelyremoved, the residual liquid is increasingly enriched in the less volatile component. Thus, a separation of thetwo compounds is achieved.
However, as the more volatile compound is removed, and the composition of the residual liquidbecomes enriched in the less volatile compound, the boiling temperature of the residual liquid also creeps up.If a cyclohexane/toluene mixture is originally 50/50, then the liquid boils at 91ºC. But as the cyclohexane isremoved, the boiling temperature of the liquid gets higher and higher. (And it gets harder to purify the lower-boiling fraction.) After a while, all of the low-boiling material is removed. At this point, the only material thatcan climb all the way up the fractionating column is the low boiling component, and you can distill it over aswell. By changing collectors, you can thus isolate both the more volatile and less volatile components inreasonable purity.
Technical Aspects• The fractionating column must be positioned vertically so that condensed liquid can percolate down
through the rising hot vapors. This percolation promotes equilibration/heat exchange between theliquid and vapor phases, a condition that allows the column to operate at maximum efficiency andprovide an optimum separation.
• A crucial factor is the distillation rate. In order to get the maximum number ofvaporization/condensation cycles and maximum purification, fractional distillation must be conductedslowly. A one drop per second rate is recommended for best results. Slow, gradual distillationessentially allows the best equilibration and heat transfer. If you heat too fast, vapors may notcondense as quickly as desired, and may waste some of the column.
• Packing material is also crucial. High surface area packing material provides surface on whichcondensation can occur. The more easily vapor can condense, the more distillation cycles you get.
Miscellaneous• At reduced pressure, liquids boil at lower temperatures. (The external pressure is less, so it’s easier to
build up enough vapor pressure to escape.) High-boiling liquids are often distilled under vacuum. • Simple distillation is useful when there are large differences in boiling point (>40ºC.) Often organic
solvents will be much more volatile than the target samples, so simple distillation is useful for rapidremoval of the solvent. Simple distillation is faster than fractional. But fractional is much morepowerful for more difficult separations.
• The temperature of the vapor is a direct reflection of it’s composition. • When the temperature of the vapor is changing, it’s because the composition of the vapor is changing.• The vapor temperature and composition of the vapor is almost constantly changing because the
composition of the residual liquid is continuously getting depleted in the more volatile component.• In a distillation curve, there will always be middle portion reflecting mixtures. For a typical
purification, three separate collections would be made: the initial relatively horizontal portion(reflecting relatively pure volatile component); a middle portion which would be thrown away(reflecting mixtures not worth saving); and a subsequent relatively high-boiling horizontal portion(reflecting relatively pure less volatile component.)
Distillation 31
Part I: Simple Distillation of Cyclohexane/TolueneSetup:
1. Attach a large metal ring to one of the vertical rods on your rack2. Rest your small heating mantle (the smaller of the two devices in your bottom cabinet with gray wells)
on your metal ring, making sure that the plug-in cord for the mantle can reach one of the “Powermite”outlets. (Not a direct electrical outlet. Since the mantle has no power adjuster, if you plug it into thewall you will have full power and no control. The Powermite provides a dial that you can use toregulate the electricity going into your heating mantle and can thus regulate your heat.)
3. Securely clamp a 100-mL round-bottomed flask above this (find flask in your kit). (The neck of theflask has a “lip”; try to have your clamps below this, so that the “lip” has no chance of slippingthrough.)
4. Add a 3-way connecting tube (#10 in your kit map). 5. To the almost horizontal branch, attach a condensing tube (#12 in your kit map). Use a Keck clip to
hold the joints snug.6. Raise the entire array high enough and place a 100-mL graduated cylinder underneath the end of the
condensing tube to collect the distillate. Make sure your 100-mL flask, on which the rest of the arrayrests, is very securely clamped! It should be able to hold everything up even without the support of theheating mantle. In turn, make sure that the heating mantle is also securely clamped.
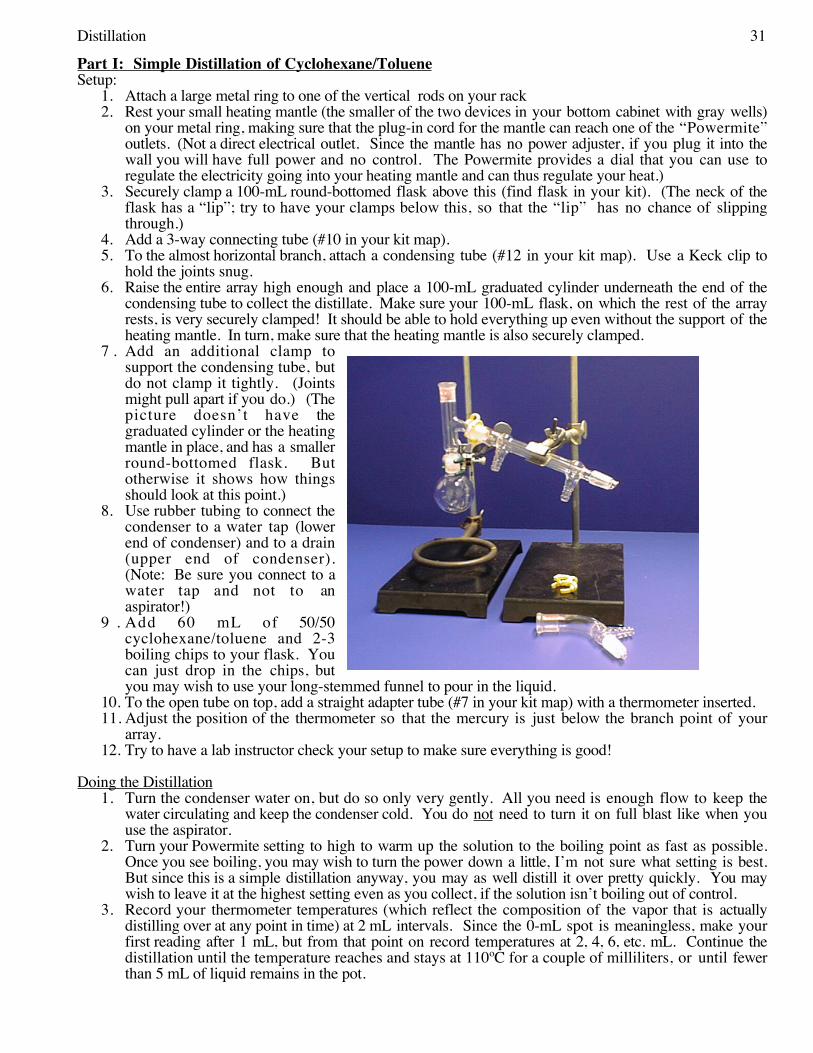
7 . Add an additional clamp tosupport the condensing tube, butdo not clamp it tightly. (Jointsmight pull apart if you do.) (Thepicture doesn’t have thegraduated cylinder or the heatingmantle in place, and has a smallerround-bottomed flask. Butotherwise it shows how thingsshould look at this point.)
8. Use rubber tubing to connect thecondenser to a water tap (lowerend of condenser) and to a drain(upper end of condenser).(Note: Be sure you connect to awater tap and not to anaspirator!)
9 . Add 60 mL of 50/50cyclohexane/toluene and 2-3boiling chips to your flask. Youcan just drop in the chips, butyou may wish to use your long-stemmed funnel to pour in the liquid.
10. To the open tube on top, add a straight adapter tube (#7 in your kit map) with a thermometer inserted. 11. Adjust the position of the thermometer so that the mercury is just below the branch point of your
array.12. Try to have a lab instructor check your setup to make sure everything is good!
Doing the Distillation1. Turn the condenser water on, but do so only very gently. All you need is enough flow to keep the
water circulating and keep the condenser cold. You do not need to turn it on full blast like when youuse the aspirator.
2. Turn your Powermite setting to high to warm up the solution to the boiling point as fast as possible.Once you see boiling, you may wish to turn the power down a little, I’m not sure what setting is best.But since this is a simple distillation anyway, you may as well distill it over pretty quickly. You maywish to leave it at the highest setting even as you collect, if the solution isn’t boiling out of control.
3. Record your thermometer temperatures (which reflect the composition of the vapor that is actuallydistilling over at any point in time) at 2 mL intervals. Since the 0-mL spot is meaningless, make yourfirst reading after 1 mL, but from that point on record temperatures at 2, 4, 6, etc. mL. Continue thedistillation until the temperature reaches and stays at 110ºC for a couple of milliliters, or until fewerthan 5 mL of liquid remains in the pot.
Distillation 32
4. Turn off the heater and lower the heating mantel away from the flask to allow cooling. Allow the flaskto cool for a few minutes.
Part II: Fractional Distillation of Cyclohexane/TolueneSetup
1. Again use 60-mL of 50/50 mL toluene, just like you did in your first distillation. Do this in the same100-mL flask, after pouring out whatever residual liquid remained from the first experiment.
2. Have 2-3 boiling chips present. 3. Your setup for the fractional distillation will be very similar to what you did previously, except for the
following changes:• You will insert a steel-wool packed distilling column (#13 in your kit map) in between your flask
and your three-way connecting tube. (You do not need to clean out your condensing tube, youcan use the exact same “top half” glassware from your previous setup, even if it is slightlycontaminated by a little distillate.)
• Because of the height of the fractionating column, you can probably rest your heating mantle onthe bench top, or close to it, and still have enough height to fit your graduated cylinder to collectdrops
Doing the Distillation1. Proceed as above, with the following adjustments:
a. Once some sample begins to distill, turn your power down significantly so that the drop rate issteady and not too fast. (Slow fractional distillation gives better separation). An ideal droprate is one drop per second or less. It’s especially important that the solution climb throughthe packing relatively slowly at the beginning. I’m not sure, but perhaps try a power setting ofaround 3 on your Powermite to begin?
b. This time record temperatures at 1-mL increments, again beginning at 1-mL. c. Continue the distillation until the temperature reaches and stays at around110ºC for a couple of
milliliters, or until fewer than 5 mL of liquid remains in the pot.
Distillation 33
Name:
Distillation Lab Report
1. Plot your temperature (y-axis) versus mL collected (x-axis). Plot both distillations on the same graph.Since little of the action takes place near room temperature, have the low end of your y-axis be 80ºC, witha high end of your y-axis 111ºC. You may prepare your graph on computer (Kaleidagraph workswell…), but I will also accept hand-drawn graphs. Either staple your graph to this sheet or else generateyour graph on the other side of this sheet for handing in your lab report.
2. Why is the vertical change in the fractional distillation so much sharper than in the simple distillation? (Inother words, why does it jump from say 85ºC to 105ºC over such a smaller number of mL with fractionalthan with simple distillation? And why does it wait longer to creep up over, say, 90ºC?)
3. Give a brief discussion of how simple and fractional distillation differ. What is the difference? Why?When and why would you choose fractional distillation? Would there be any circumstances in whichyou’d choose simple distillation?
4. For the simple distillation, compare your vapor temperatures at 2 mL, 16 mL, and 30 mL. Why is thetemperature different at these different times? Does the temperature also change like that in the fractionaldistillation?
5. Why is better separation of two liquids achieved by slow rather than fast distillation? (Particularly in thecase of fractional distillation?)
6. Explain why a lot of packing material with a lot of surface area is helpful for an effective fractionatingcolumn? In our case, you had steel wool in your column. What would be worse if you didn’t have thesteel wool present?
7. What effect does doing a distillation under reduced pressure have? For a particular sample, will theboiling point be unchanged, go up, or go down if you try to distill it under a reduced pressure/vacuum typesituation?
8. If you wanted to collect material that was relatively pure cyclohexane from your fractional distillation,which section would you save? (For example, the first 5 mL? First 10 mL?) If you wanted to collectmaterial that was relatively pure toluene, which section would you save?

Distillation 34
Liquid/liquid Extraction 35
LIQUID/LIQUID SEPARATION: EXTRACTION OF ACIDS OR BASES FROM NEUTRALORGANICS
Background Extraction is one of humankind’s oldest chemical operations. The preparation of acup of coffee or tea involves the extraction of flavor and odor components from dried vegetablematter with hot water. Many other substances, flavors and spices and perfumes and medicines,have been extracted from plants for centuries (quinine, morphine, menthol…). Many undesirabledrugs are also isolated by extraction (cocaine from coca leaves). Extraction, like recrystallization, isbased on solubility factors.
The most common and simple separation in organic chemistry involves the separation ofneutral organics from ionic compounds, whether the ionic compound is an inorganic salt (NaCl) oris an ionized version of the organic. The two most commonly ionized organic families arecarboxylic acids, which are ionized by deprotonation to their carboxylate RCO2- form, or basicamines, which are ionized by protonation to their ammonium RNH3+ form.
Neutrals and ionics are easily separated because ionics are preferably soluble in water ratherthan in organic solvents, whereas neutral organics are preferably soluble in organic solvents ratherthan in water. The following three separations are thus common:
1. A neutral/ionic mixture is shaken with ether and water. • The neutral goes into the ether layer.• The ionic goes into the water layer.
2. A neutral/carboxylic acid mixture is shaken with ether and NaOH/water.• The neutral goes into the ether layer. • The carboxylic acid is deprotonated by NaOH to its carboxylate form (RCO2-), which
goes into the water layer.3. A neutral/amine mixture is shaken with ether and HCl/water.
• The neutral goes into the ether layer. • The basic amine is protonated by HCl to its ammonium form (RNH3+), which goes into
the water layer.
Once a chemical is separated from its original mixture, it must still be isolated from solvent. 1. Isolating a neutral from ether solvent:
• Dry The ether will contain not only the neutral solute, but also some water. Thewater is absorbed by a chemical drying agent (usually sodium sulfate or magnesiumsulfate or calcium chloride).
• Filter The drying agent is then usually removed by filtration.• Concentrate The solvent is then removed by simple distillation, leaving the desired
neutral as the residue. The simple distillation is usually done via a “rotary evaporator”.
2. Isolating a neutral carboxylic acid from the NaOH/water layer:• Acidify/Neutralize HCl is added to acidify the water. In the process the
carboxylate anion RCO2- is protonated and converted back to its neutral form RCO2H.• Filter or Extract Because the acid is now neutral, its solubility in water will be
low. If it crystallizes, you can filter it. If it comes out of the water as an oil, you canextract it in ether!
3. Isolating a neutral amine from the HCl/water layer:• Basify/Neutralize NaOH is added to basify the water. In the process the
ammonium cation RNH3+ is deprotonated and converted back to its neutral formRNH2.
• Filter or Extract Because the amine is now neutral, its solubility in water willbe low. If it crystallizes, you can filter it. If it comes out of the water as an oil, you canextract it in ether!

Liquid/liquid Extraction 36
Partition Coefficients and Multiple ExtractionsIn the presence of two solvents (ether and water in our case), each specific chemical has a
characteristic “partition coefficient”, with the following formula: Partition coefficient = solubility in ether/solubility in water.
The partition coefficient basically tells you what fraction of the material will partition into eachsolvent layer. If the value is 4:1, that means 80% will partition into the ether layer, and 20% willpartition into the water layer.
• Ideally, the distribution will be either zero (all stays in water) or infinity (totally in ether). • This is not often the case. Frequently some of the neutral organic material will be lost to the
water layer, and sometimes some of the ionic material will go into the ether layer. In eithercase, either the yield and/or the purity will not be 100%.
To improve extraction efficiency, often two (or more) extractions may be appropriate.• Example 1: Suppose you are trying to get all of your organic material into the
organic phase, but the partition coefficient for your desired neutral organic is only 4:1. Ifyou do one separation, you should have 80% of the material in the ether extract, and 20% ofthe material in the water phase. By extracting the water again with more ether, you shouldget 80% of the remaining 20% that was in the water, i.e. you should get another 16% outinto the ether, and now only 4% of the neutral should remain in the water. A third etherextraction of the water should take out 80% of the remaining 4%, thus leaving less than 1%of your material left in the water layer. Combine all the ether extracts, dry/concentrate, andyou should get 99% yield.
• Example 2: Suppose you are trying to use aqueous base to extract a carboxylic acidfrom a neutral organic, but only 90% of the acid goes into the NaOH/water and 10%stays in the ether. If you do only one separation, your neutral organic will still becontaminated by the residual 10% of acid. But if you do a second extraction withNaOH/water, 90% of that 10% will be extracted as well, and now only 1% of the acid willremain in the ether layer to contaminate your neutral.
The process of extracting from a particular phase, to either make sure you get all the targetorganic out (example 1) or to make sure you remove all of an undesired contaminant (example 2) isoften referred to as “washing”. In example 2, the carboxylic acid was “washed out” of the etherlayer by a couple of NaOH/water “washes”.
To determine how many “extractions” are required to achieve a target minimum of non-extracted material, use yx, where “y” is the fraction that survives a particular extraction, and “x” isthe number of extractions. (In example 1, yx = 0.203 = 0.008 = 0.8%.)
Choice of Organic Solvent1. Low Boiling Point Since you normally have to distill off your solvent at the end, a low-
boiling solvent that can be simply distilled away quickly and rapidly is very desirable.2. Good Dissolving Ability for Organics Obviously you’d like your organic solvent to
have much better dissolving ability for organics than does water. Sometimes the nature ofthe solute dictates which solvents are acceptable.
3. Low Miscibility with Water You’d like relatively water to dissolve into the organicphase, and vice versa.
4. Higher or Lower Density Than Water, Depending on Extraction PurposeTypically when multiple extractions/washes are used, it is desirable to have the
“extraction solvent” be denser than the solvent that is “being washed”. • If you are going to “wash” the organic solvent several times with water (example
2), it is technically convenient if the organic layer floats on the water layer. This is truefor ether.
• If you are going to “wash” the water layer several times to make sure you get allyour organic material into the organic phase, it is more convenient to use a solvent that ismore dense than water, so that the water will float on the organic solvent and you canpour the organic solvent out the bottom. This is not true for ether, so it isn’t thatconvenient for multiple washes/extractions from water. Dichloromethane, which ismore dense than water, is frequently u s e d instead for doing multiplewashes/extraction from a water layer.
5. Safe, Cheap, Unreactive…
Liquid/liquid Extraction 37
LIQUID/LIQUID SEPARATION: EXTRACTION OF ACIDS OR BASES FROMNEUTRAL ORGANICS
Carboxylic acid unknown options (Part 1): benzoic acid (mp 123) or 2-chlorobenzoic acid (mp141)Amine unknown options (Part 2): 4-chloroaniline (mp 68-71) or ethyl 4-aminobenzoate (mp 90)Neutral options (same choices for both Part 1 and Part 2): 1,4-dimethoxybenzene (mp 57),naphthalene (mp 82), dibenzalacetone (mp 110-111), or benzoin (137)
For flow chart, use “N” for neutral, “RCO2H” for protonated carboxylic acid, “RCO2-” for ioniccarboxylate salt, “RNH2” for neutral amine, and “RNH3+” for ionic ammonium salt.
Part 1: Separation of a Neutral from a Carboxylic Acid.Setup:
1. Attach your small metal ring to one of the vertical rods on your rack2. Get your separatory funnel and a glass stopper out of your organic kit. Rest the separatory
funnel into the ring. 3. Make sure the stopcock is closed!
Procedure:Phase 1: Separating the two Chemicals into Two Liquid Phases. Extracting the Acid.
1. Weight out about 2 g (record exact weight) of a 50/50 mixture (by weight) of N/RCO2H.(In other words, the mixture consists of 1 gram of neutral and one gram of acid). Pour thesolid mix into your separatory funnel.
2. Add 20 mL of diethyl ether (“ether”). If the mixture doesn’t dissolve, add enough ether tofully dissolve it.
3. Add 10 mL of 3M NaOH to the separatory funnel, stop it, shake vigorously, vent, and allowthe layers to separate. (Purpose: to convert the neutral acid into carboxylate anion, whichshould then go into the aqueous layer rather than staying in the ether layer).
4. Label a 50-mL Erlenmeyer flask as “Flask 1” with your Sharpie pen, and a 150 mL beakeras “waste”.
5. Get a couple of pieces of pH paper or litmus paper.6. Drain off the aqueous layer into Flask 1. Pass a stick of pH paper into the draining stream
to confirm that it is basic. (Be sure you have removed the stopper from your separatoryfunnel first.) (Note: it is better to have a little water stay in the ether layer than to have someof the ether layer go into the aqueous.)
7. Add an additional 5 mL of 3M NaOH to the separatory funnel, shake the mixture as before,let it settle, and again drain the aqueous layer into Flask 1.
8. Save Flask 1, the contents of which you will process a little later.
Phase 2: Isolating the Neutral Organic from the Ether Phase.9. Add 15 mL of “brine” (saturated aqueous solution of sodium chloride) to the separatory
funnel, shake the mixture thoroughly, allow the layers to separate, and drain off the aqueouslayer into the “waste” beaker. The contents can be poured down the drain. (Purpose: thebrine reduces the solubility of water in the ether, so the ether will be less wet.)
10. Carefully pour the ether layer into a 125-mL Erlenmeyer flask (labeled “Flask 2”) from thetop of the separatory funnel, taking care to minimize transfer of water droplets.
11. Rinse the separatory funnel with an additional 5-mL of ether, and add that rinse to Flask 2.12. Add sodium sulfate to Flask 2 and swirl. The amount required depends on how much water
is in the mixture. Typically one full scoopula of sodium sulfate should suffice, butfrequently additional drying agent is required. If the solution is dry, the liquid should lookvery clear and not cloudy extract until it no longer clumps together. If all of the moisturehas been absorbed, there should be at least some fine granular “non-clumpy” sodiumsulfate granules left, and the solution should be clear. (Purpose: the sodium sulfate isintended to absorb any water that is in the ether solution.)
13. Pre-weigh a 50-mL round-bottomed flask, and then clamp it onto a vertical rod.14. Take your long stem funnel and push a little glass wool into the neck. A little bit will
suffice. A pipet is often helpful for pushing it in a little bit.
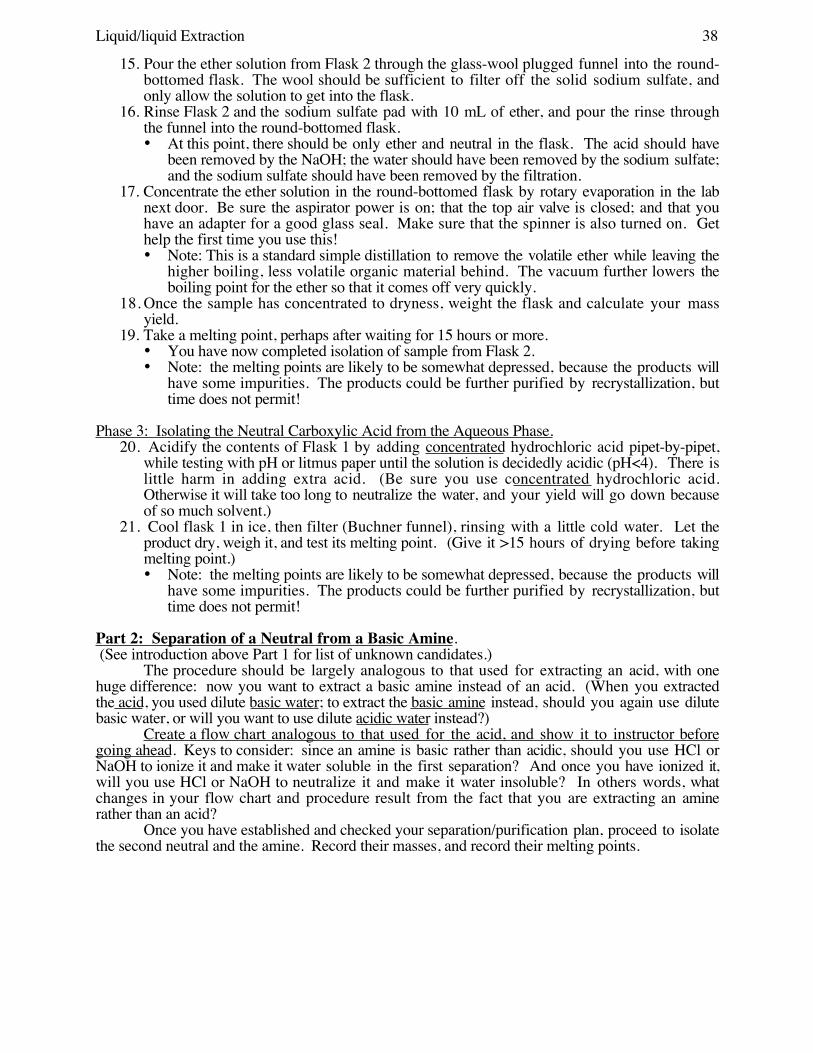
Liquid/liquid Extraction 38
15. Pour the ether solution from Flask 2 through the glass-wool plugged funnel into the round-bottomed flask. The wool should be sufficient to filter off the solid sodium sulfate, andonly allow the solution to get into the flask.
16. Rinse Flask 2 and the sodium sulfate pad with 10 mL of ether, and pour the rinse throughthe funnel into the round-bottomed flask. • At this point, there should be only ether and neutral in the flask. The acid should have
been removed by the NaOH; the water should have been removed by the sodium sulfate;and the sodium sulfate should have been removed by the filtration.
17. Concentrate the ether solution in the round-bottomed flask by rotary evaporation in the labnext door. Be sure the aspirator power is on; that the top air valve is closed; and that youhave an adapter for a good glass seal. Make sure that the spinner is also turned on. Gethelp the first time you use this! • Note: This is a standard simple distillation to remove the volatile ether while leaving the
higher boiling, less volatile organic material behind. The vacuum further lowers theboiling point for the ether so that it comes off very quickly.
18. Once the sample has concentrated to dryness, weight the flask and calculate your massyield.
19. Take a melting point, perhaps after waiting for 15 hours or more. • You have now completed isolation of sample from Flask 2.• Note: the melting points are likely to be somewhat depressed, because the products will
have some impurities. The products could be further purified by recrystallization, buttime does not permit!
Phase 3: Isolating the Neutral Carboxylic Acid from the Aqueous Phase.20. Acidify the contents of Flask 1 by adding concentrated hydrochloric acid pipet-by-pipet,
while testing with pH or litmus paper until the solution is decidedly acidic (pH<4). There islittle harm in adding extra acid. (Be sure you use concentrated hydrochloric acid.Otherwise it will take too long to neutralize the water, and your yield will go down becauseof so much solvent.)
21. Cool flask 1 in ice, then filter (Buchner funnel), rinsing with a little cold water. Let theproduct dry, weigh it, and test its melting point. (Give it >15 hours of drying before takingmelting point.)• Note: the melting points are likely to be somewhat depressed, because the products will
have some impurities. The products could be further purified by recrystallization, buttime does not permit!
Part 2: Separation of a Neutral from a Basic Amine. (See introduction above Part 1 for list of unknown candidates.)
The procedure should be largely analogous to that used for extracting an acid, with onehuge difference: now you want to extract a basic amine instead of an acid. (When you extractedthe acid, you used dilute basic water; to extract the basic amine instead, should you again use dilutebasic water, or will you want to use dilute acidic water instead?)
Create a flow chart analogous to that used for the acid, and show it to instructor beforegoing ahead. Keys to consider: since an amine is basic rather than acidic, should you use HCl orNaOH to ionize it and make it water soluble in the first separation? And once you have ionized it,will you use HCl or NaOH to neutralize it and make it water insoluble? In others words, whatchanges in your flow chart and procedure result from the fact that you are extracting an aminerather than an acid?
Once you have established and checked your separation/purification plan, proceed to isolatethe second neutral and the amine. Record their masses, and record their melting points.
Liquid/liquid Extraction 39
Name: Extraction/Acid-Base/Separatory Funnel Lab Report
1. Yields, Melting Ranges, and Identification:Part 1:
Neutral: isolated yield (in grams) melting range: Identity:
Carboxylic Acid: isolated yield (in grams) melting range: Identity:
Part 2:
Neutral: isolated yield (in grams) melting range: Identity:
Amine: isolated yield (in grams) melting range: Identity:
2. Complete the flow chart for Part 1 (opposite side). Use “N” for the neutral, “RCO2H” forthe acid in it’s neutral form, and “RCO2-“ for the carboxylate anion form.
3. Include an analogous flow chart for Part 2 (opposite side), with any adjustments required due tostarting with a basic amine rather than an acid. Use “N” for the neutral, “RNH2” for neutralamine, and “RNH3+” for ionic ammonium salt.
4. Why is it necessary to remove the stopper from a separatory funnel when draining the liquidthrough the stopcock?
5. The pKas of chemicals HX and HY are 5 and 7 respectively. The pKa of carbonic acid H2CO3is 6. If you made up an ether solution of chemicals HX and HY in a separatory funnel, and thenadded an aqueous solution of sodium bicarbonate NaHCO3 to that separatory funnel, wouldboth HX and HY stay in the ether layer? Or would either or both of them transfer into theaqueous layer? If one goes into the water layer, will it be in it’s neutral HX/HY form, or in it’sdeprotonated anionic form?
HX: ether layer or water layer?
If in the water layer, in HX or X- form?
HY: ether layer or water layer?
If in water layer, in HY or Y- form?
6. Suppose you have an organic sample X that is somewhat soluble in water, even though it issomewhat more soluble in dichlromethane or ether solvents. But if you do a single extraction,you get only 60% of your material to transfer from the water to the organic layer.
• How many “washes” would it take to extract over 90% of your organic material extracted fromthe water layer?
• In this case, would it be better to extract with dichloromethane or with ether?
7. Suppose you have an organic sample X that is contaminated with an impurity. When you washwith an aqueous phase, X stays exclusively in the organic phase, and most (about 80%) but notall of the impurity washes out into the water phase. How many aqueous extracts should you doso that less than 1% of your impurity remains in the organic layer? Will it be more convenientto use ether or dichloromethane as your organic solvent?
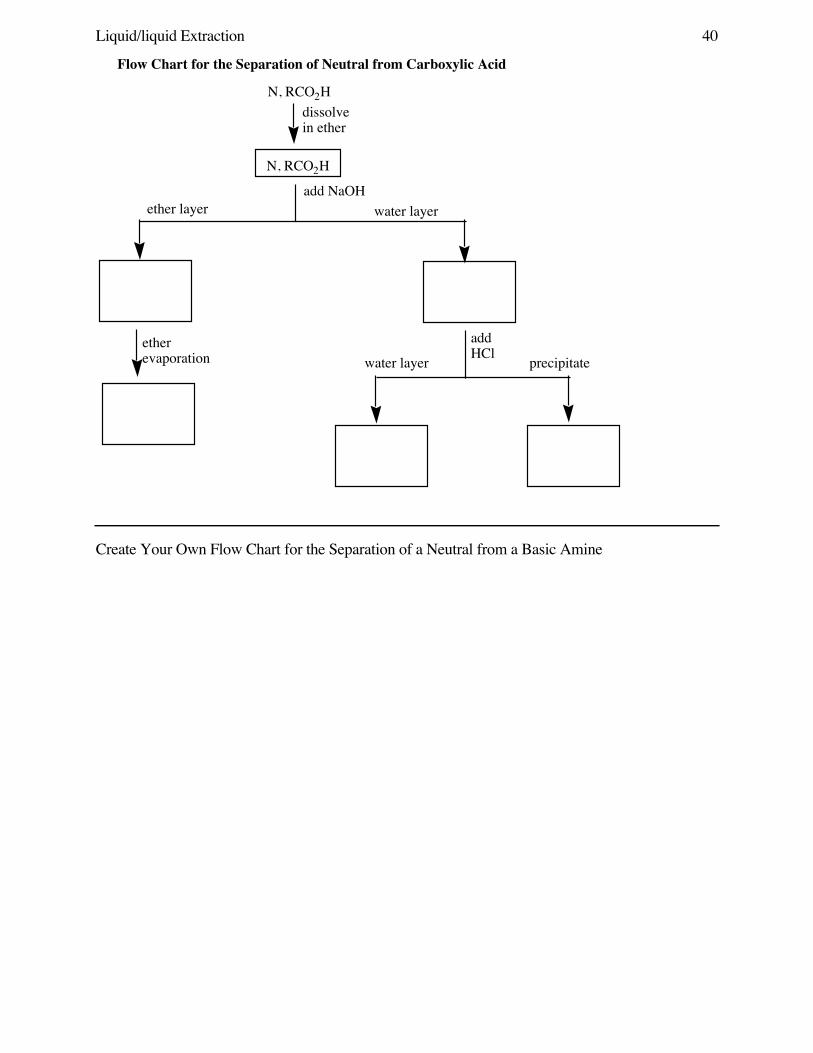
Liquid/liquid Extraction 40
etherevaporation precipitatewater layer
add HCl
water layerether layeradd NaOH
N, RCO2H
dissolve in ether
N, RCO2H
Flow Chart for the Separation of Neutral from Carboxylic Acid
Create Your Own Flow Chart for the Separation of a Neutral from a Basic Amine

C-13 NMR 41
Chem 355 Jasperse C-13 NMR
I. Introduction to Spectroscopy Spectroscopy involves gaining information from theabsorption, emission, or reflection of light from a sample. There are many other examples ofspectroscopy in our experience, but three familiar real-life examples include:
1. X-rays. Dense bone absorbs x-ray radiation. 2. Grocery store scanners. A monochromatic laser is either absorbed (black bar) or reflected
(white bar). The simple black-or-white lines with their yes-or-no absorption-or-reflectionresponse essentially produces a binary code, from which products and prices can bedetermined.
3. Stop lights. A lens is adjusted at timed intervals to enable emission of either green, red, oryellow light.
In organic chemistry, the most important type of spectroscopy is “NMR” (“Nuclear MagneticResonance” spectroscopy). NMR spectroscopy is routinely used for chemical analysis, whetherthat be to identify the structure of an unknown, to assess the purity of a product, or to determineratios of isomers. This week we will use carbon-13 NMR; in two weeks we will use hydrogenNMR. Both of these will be used later in the year, especially during second semester lab. Duringsecond semester lecture, we will revisit NMR and spend time and a test on interpretation of NMRs.Magnetic Resonance Imagine (“MRI”) is an important hospital application of NMR. (The namewas changed from NMR to MRI because some patients were afraid of the word “nuclear”inNMR!)
II. General Aspects of Spectroscopy Physics The fundamental principles of chemicalspectroscopy are illustrated below. Spectroscopy involves having quantized energy levels. You arefamiliar with the concept of quantized energy levels for electrons (1s, 2s, 2p, 3s, 3d etc.) andelectron spins (spin up or spin down, but other things are also quantized (vibrational energies,rotational energies…).
Given that there is an exact energy gap between two quantized energy states, a photon ofprecise energy must be absorbed in order to excite a molecule from the ground state. When anexcited state relaxes back to the ground state, that same photon is released. By measuring the exactfrequencies of photons that are either absorbed or emitted, we can measure ∆E. The quantity ofphotons can tell us about how much material is absorbing or emitting.
The chemist must then be able to interpret what the frequencies of the photons mean interms of chemical structure.
X
hv energy
"exites"
X
falls down
"relaxes"
X
General Picture of Energetics and Spectroscopy
1. Quantized Energy Gaps2. When a photon with exactly the right energy/frequency/wavelength is absorbed, a sample gets "excited" from its "ground state" to an "excited state"3. When an exited state "relaxes" back to its ground state, the same ∆E is involved, and a photon with the same energy/frequency/wavelength is released
∆E = hv∆E = hv

C-13 NMR 42
III. NMR Physics Certain nuclei (not all) have quantized “nuclear spins”. Beingcharged objects that spin, a result is that they magnetic. (A circular flow of charge or electricityalways produces a magnetic field, according to the “right hand rule” of electromagnetism.) Nucleithat have quantized spin states are referred to as “NMR active”. Just as electrons have quantizedspin states (spin up or spin down), NMR-active nuclei also have quantized spin states, spin up orspin down.
Some NMR-active nuclei: H-1, C-13, N-15, F-19, P-31, Si-29, Se-79, Sn-119Some NMR-inactive nuclei: C-12, N-14, O-16
The list of NMR inactive nuclei is somewhat unfortunate for organic chemistry! We arelargely interested in the chemistry of carbon and the 2n d row elements, but unfortunately thedominant isotopes for carbon, nitrogen, and oxygen are all NMR inactive! Fortunately at leastcarbon-13 is active. Although only 1% of carbons are C-13, that’s still enough to give us usefulinformation. Hydrogen is also NMR active, and can give us a lot of information (in two weeks…).
In the presence of an applied magnetic field, nuclear magnets can align with (spin down, α)or against (spin up, β) the field. The energy gap between these spin states is quantized, anddepends on the strength of the magnetic field. (As with a bar magnet, the stronger the field, thegreater the preference for the magnet to line up correctly…). To “excite” a nucleus from the morestable α state to the less stable β state, radiation with the correct photon frequency is required.When an excited nucleus relaxes back to the α state, a photon with that same frequency is emitted.Since magnetic field strength determines ∆E, and ∆E determines v, the magnetic field thusdetermines the frequency of the radiation absorbed or emitted.
∆E = hvα,β
β
α
zeroIncreasing Magnetic Field, Ho
Energy
1. Spin states are equal in energy in the absence of magnetic field2. As the magnetic field increases, the difference between the two increases3. Since field determines ∆E, and ∆E determines v, the magnetic field thus determines the frequency of the radiation absorbed or emitted when nuclei get exited or relax
When an external magnetic field is applied, will all nuclei have the same ∆E and the samephoton frequency? No!
1. Different nuclei (H-1 versus C-13) have very different ∆E. Thus an MRI can easilyidentify whether a particular nuclei is or is not present.
2. In different chemical environments, the same nucleus will have different ∆E.
The second point is the key to 13C NMR. Although the external magnetic field (applied bythe spectrometer) may be the same, different carbons in a molecule experience or “feel” differencemagnetic fields. This is due to the magnetic fields produced by local electrons and by other nuclei(because moving electrons function as “electron magnets” and moving nuclei function as “nuclearmagnets”). The magnetic influence of local electrons and nuclei can reinforce or partiallycounteract the external field, so that every different carbon “feels” a different Hactual.
Hactual = Happlied + Helectrons + Hnuclei Hactual ∝∆E ∝ v

C-13 NMR 43
IV. The Actual Experiment The actual steps in the experiment include:1. Prepare the sample. For C-13, put in 5 drops of sample before diluting. For H-1, put in 2
drops of sample.2. Insert the sample into the magnetic field. 3. “Lock” the magnet: (So that the magnetic field doesn’t drift during the experiment)4. “Shim” or “Tune” the magnetic field: Try to make it consistent from top to bottom, front
to back, left to right. (This is very important for getting sharp lines).5. Blast the sample with radiation to excite the nuclei. Rather than dialing through the different
frequencies, a broad range of frequencies is applied so that all the carbon nuclei can getexcited at the same time. After briefly blasting, the radiation is turned off.
6. Listen to the signals (actually in the radio frequency!) as the excited nuclei relax and releasephotons. (Many different signals with different frequencies are released simultaneously,each with it’s own wave…)
7. Repeat the irradiate-then-listen sequence a number of times to build up the weak signal.8. “Fourier Transform” (mathematical operation) to deconvolute the complex signal pattern
resulting from the many overlapping frequencies. The Fourier Transform enables thecomputer to identify all the individual photon frequencies that summed up to give the totalsignal. An imperfect analogy would be to have every possible radio station broadcasting atthe same time; then the Fourier Transform would essentially be able to identify and pick outeach station one at a time and make sense of it.
Note: Many of these operations are best done by a computer. (The Fourier Transform especially!)Each of these steps also involves a number of software commands. So that you can acquire dataand focus on chemical interpretation of the data, rather than being totally distracted by learning a lotof software commands, I have largely programmed the computer so that it can do most of this byitself. When it needs some input from the user, it will normally prompt you for input.
V. Interpreting C-13 NMR While the physics of what happens is interesting, for themost part you the chemist will be engaged in interpreting the data that comes out at the end. This istrue for the use of many instruments in science and health care. You need to learn some basicoperational skills so that you can use the instrument safely and accurately. But being able tointerpret the data is really what you need to be able to do at the end.
Summary of C-13 NMR Interpretation: 1. Count how many lines you have. This will tell you how many types of
carbons you have. (Symmetry equivalent carbons can at times cause the number oflines to be less than the number of carbons in your structure.)
2. Check diagnostic frequency windows (“chemical shift windows”) of the linesto provide yes-or-no answers regarding the presence or absence of keyfunctional groups in your molecule.
1. Number of Lines and Number of Symmetry-Unique Carbonsa. Each “unique”carbon gives a separate line.
• This is due to having different electronic environments, and because spinningelectrons create magnetic fields that counteract or reinforce the applied field.
b. Symmetry duplicates give the same line. • If due to molecular symmetry two carbons have exactly the same chemical
environment, naturally they will absorb and emit exactly the same photonfrequency, and give exactly the same line in the spectrum.
OHOH
OH
BrBr Br
How Many Lines per Structure?(Mark any symmetry duplicates)
A B
C D E F

C-13 NMR 44
2 . “Chemical Shifts” of the Lines (This reflects the energies or photonfrequencies/wavelengths associated with the lines.)
220-160 C=O carbonyl carbons, sp2 hybridized160-100 C alkene or aromatic carbons, sp2 hybridized100-50 C-O oxygen-bearing carbons, single bonds only, sp3 hybridized50-0 C alkyl carbons, no oxygens attached, sp3 hybridized
a. Notice that sp2 hybridized carbons come above 100, sp3 hybridized come belowb. Notice that oxygenated carbons come higher than non-oxygenated analogs. An sp3-
hybridized carbon with an oxygen comes higher than without, just as an sp2-hybridized carbon comes higher with oxygen than without
c. How do I process and use what I see from my Chemical Shifts?• Check each of the four zones. Each one gives you a yes or no
answer about the presence of absence of the featured group. • Check 220-160. Do I have any carbonyl carbons or not? Easy yes or no
question. • Check 160-100. Do I have any alkene/aromatic carbons? Yes or no! If I do,
then how many? If I have two, I probably have an alkene! If I have four to six, Iprobably have a benzene!
• Check 100-50. Do I have an oxygenated sp3 carbon? Yes or no! Alcohols andesters will normally have one carbon in the 100-50 zone. Ethers will have two.
• Check 50-0. I’ll almost always have some lines there! But how many shouldtell me how many types of non-oxygenated sp3 carbons I have.
3. Signal Height/Size When we get to 1H-NMR, signal size will be very important. For13C-NMR it isn’t that crucial. There is considerable variance in height. But there are twopatterns that can be somewhat helpful.
a. Carbons without any attached H’s are short. This is common for carbonyls(aldehydes are the only carbonyl carbons that have hydrogens attached) and forsubstituted carbons in a benzene ring.
b. Symmetry duplication multiplies signal height (if you have two copies of a carbon,the line will probably be taller than normal!)
4 . Subtracting the Solvent Lines: Don’t Count the Triplet at 77 The sample isalways diluted in a solvent. We will routinely use CDCl3. When you use CDCl3, it hascarbons too! They give a 3-line “triplet” signal at 77, which is often kind of short (no H’sattached.) Ignore this signal! Don’t count it as three more unique carbons in yourmolecule! Don’t conclude that you have three oxygenated sp3 carbons!
5 . Subtracting the Reference Line: Don’t Count the Line at 0 A reference chemical[(CH3)4Si] is normally included that gets used to define where “zero” is. This zero markeris present all the time, but is not part of your actual molecule. Ignore this signal! Don’tcount the zero marker as an additional sp3 carbon!
6. How do I know what’s a real line, from a carbon in my compound from animpurity that I should ignore? No simple way! With experience you can often tell,but there is no automatic way to know. For today, if in doubt ask the instructor! Theinstructor will confirm which lines you should or shouldn’t consider in doing your analysis
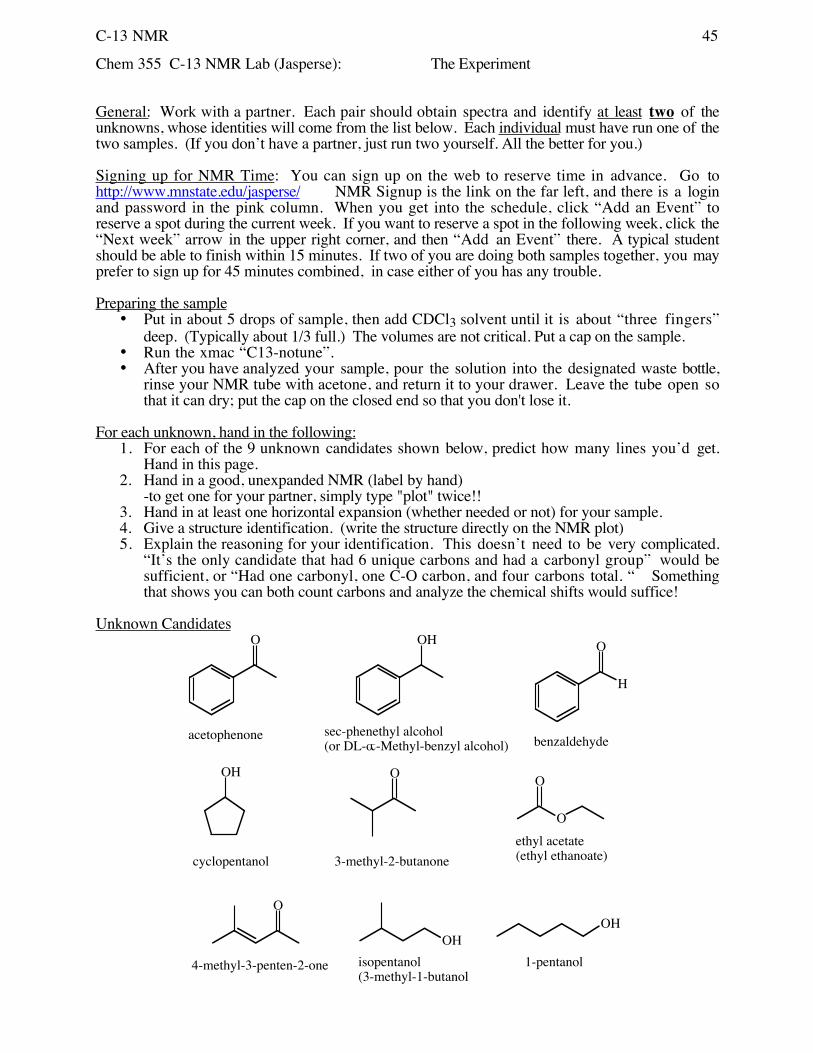
C-13 NMR 45
Chem 355 C-13 NMR Lab (Jasperse): The Experiment
General: Work with a partner. Each pair should obtain spectra and identify at least two of theunknowns, whose identities will come from the list below. Each individual must have run one of thetwo samples. (If you don’t have a partner, just run two yourself. All the better for you.)
Signing up for NMR Time: You can sign up on the web to reserve time in advance. Go tohttp://www.mnstate.edu/jasperse/ NMR Signup is the link on the far left, and there is a loginand password in the pink column. When you get into the schedule, click “Add an Event” toreserve a spot during the current week. If you want to reserve a spot in the following week, click the“Next week” arrow in the upper right corner, and then “Add an Event” there. A typical studentshould be able to finish within 15 minutes. If two of you are doing both samples together, you mayprefer to sign up for 45 minutes combined, in case either of you has any trouble. Preparing the sample
• Put in about 5 drops of sample, then add CDCl3 solvent until it is about “three fingers”deep. (Typically about 1/3 full.) The volumes are not critical. Put a cap on the sample.
• Run the xmac “C13-notune”.• After you have analyzed your sample, pour the solution into the designated waste bottle,
rinse your NMR tube with acetone, and return it to your drawer. Leave the tube open sothat it can dry; put the cap on the closed end so that you don't lose it.
For each unknown, hand in the following:1. For each of the 9 unknown candidates shown below, predict how many lines you’d get.
Hand in this page. 2. Hand in a good, unexpanded NMR (label by hand)
-to get one for your partner, simply type "plot" twice!!3. Hand in at least one horizontal expansion (whether needed or not) for your sample.4. Give a structure identification. (write the structure directly on the NMR plot)5. Explain the reasoning for your identification. This doesn’t need to be very complicated.
“It’s the only candidate that had 6 unique carbons and had a carbonyl group” would besufficient, or “Had one carbonyl, one C-O carbon, and four carbons total. “ Somethingthat shows you can both count carbons and analyze the chemical shifts would suffice!
Unknown CandidatesO
OH
OH O
O
O
O
OH
H
O
OH
1-pentanol4-methyl-3-penten-2-one
ethyl acetate(ethyl ethanoate)3-methyl-2-butanone
isopentanol(3-methyl-1-butanol
acetophenone sec-phenethyl alcohol(or DL-œ-Methyl-benzyl alcohol)
cyclopentanol
benzaldehyde
C-13 NMR 46
Running the Experiment, and What is the Instrument Actually Doing?The overall experiment involves the following major steps:
1. Login to the Computer, Load the XWinNMR Program2. Sample insertion3. Calling up Standard Parameters. These include “acquisition parameters” (what experiment
to run, how to run it at the instrumental level, how to tune the magnet if at all), how many“scans” to take, how to process the data once acquired, and how to plot the spectrum oncethe computer has it
4. Lock on Deuterium. A deuterium reference nucleus is required in the nucleus. Theinstrument determines the actual frequency of your photons by comparing them to thedeuterium reference.
5. Tune the magnet. Inconsistencies in the magnetic field lead to line broadening. If not allnuclei experience the same magnetic field, their ∆E’s will vary unnecessarily, and thus theirphoton frequencies, and thus the lines will be be wider. A well-tuned magnet is crucial togetting sharp spectra. The magnetic field tends to “drift” over time, and even sample tosample, so frequent tuning is necessary. Unfortunately the tuning often takes severalminutes.
6. Acquire the raw data. The energy gap in NMR is in the radio frequency. To find whichfrequencies are absorbing/emitting, the instrument does not simply dial through all of thepossible frequencies, the way that we do with a radio dialing through all the stations.Instead, the instrument irradiates all frequencies simultaneously, so as to simultaneously“excite” all the carbons at once. The irradiation then stops, after which the “excited”carbons “relax” to their ground state, and release their photons with specific frequencies.A detector “listens” to these signals. The signal is very weak, however. In order to buildup signal, multiple “scans” are taken, each one consisting of an excite (irradiate)-relax(listen with detector) cycle. In today’s experiment, 64 “scans” are taken and the raw signalis then averaged. This takes several minutes.
7. Process the raw data. Since each radio signal is a wave, the total signal “heard” by thedetector consists of multiple radio waves superimposed on each other. Just as a human earcan recognize one “sound” amongst a multitude of sounds, so can the computer. Byconducting a “Fourier Transform”, the computer is able to deconvolute the complex rawsignal and identify the specific frequencies involved. The spectrum is also phased so thatthe baseline looks level.
8. Plot
"lock" Locks the magnetic field on the deuterium signal of the CDCl3. To watch thisprocess, highlight "windows" on the top, and then click "lockdisplay" signal under the heading
"tune" The electronics that define the magnetic field are adjusted to make it homogeneous.Inhomogeneity in the magnetic field leads to line broadening and line shortening, which lead todiminished resolution and signal/noise.
"copy all" Copies all of the settings needed for the experiment to be executed, for the data to beprocessed, and for the spectrum to be plotted.
"rga" "Receiver Gain Automation". Optimized a signal amplifier.
"zg" "Zero go". The sample is actually scanned and the raw data is acquired.
"efp" "Exponential Multiplier-Fourier Transform-Phase" The incomprehensible rawdata is submitted to a complex mathematical treatment resulting in a meaningful, chemically sensibleNMR spectrum!
"apk" "Automatic Phase Korrection"(Bruker is a German company!) The spectrum isphased in order to give a flat baseline.
"abs" "Automatic Baseline Set" Sets a mark that enables automatic integration of proton spectra.

NMR User’s Guide 47
User’s Guide to 1H, 1 3C NMR• Note: the default mouse button is the left button. Always use the left one unless told
otherwise.• For help, see Dr. Jasperse, Hagen 411-I.
1. Logina. double click on jasperse icon (or type in “jasperse” )
(Research Users: You should use your boss's login.)b. Password "chem355" (need underline in between)c. double click on "xwinnmr"
2. Sample Insertion/Lock/Tunea. remove cap from spectrometer if needed, and then click LIFT ON/OFF key on upper
lefthand corner of SCM keyboard (to right of computer) to lift lock sampleb. place your sample in sample holder, adjust position using depth gage, and place in
spectrometer [DO NOT PUT SAMPLE IN WITHOUT THE SAMPLE HOLDER!YOU WILL BREAK YOUR SAMPLE AND WRECK THE INSTRUMENT!]
c. click LIFT ON/OFF key on SCM keyboard to lower sample 3. Acquiring the spectrum
a. type "xmac"• a listing of suggestions will come up• at present, all of these assume CDCl3 as solvent• instructors/researchers, these can be easily customized for you needs. See
Jasperseb. select the experiment of interest, normally ah1-tune or c13-tune or c13-notune
• Note: if you are going to run both 1H and 13C on the same sample, you don'tneed to tune twice. Run "ah1-tune" first for hydrogen, then "c13-notune"
c. when asked for file name information, type your name into the name box andd. type "chem355" into the "user" box. e. click SAVEf. click COPY ALL when the box comes up
• The computer will now do everything for you: read in the correct parameters, lock, tune ifspecified, adjust the receiver gain, acquire the spectrum, phase the spectrum, and store thephasing information for automatic integration.
g. When “ns = 8 (or 128)” box pops up, hit return to accept default, or else entersomething different for the number of scans
h. wait patiently until either an "xmac:finished" or "abs finished" message appears• Hopefully this whole process will take less than 5 minutes for proton or less than 8
minutes for a carbon spectrum. If 8 minutes have passed and still incomplete, seeJasperse...
i. click on the icon (upper right corner of the icon group) to adjust the vertical scaleof the viewed spectrum. (For example, if your baseline looks flat, this will fix it!)
4. Plota. click PLOT iconb. hit return in response to any boxes that appearc. To do horizontal expansions, manual integrations or vertical expansions, see
instructions on page 2. 5. Exiting:
a. Replace your sample with the default sample, as described in part 3. b. Type “lock cdcl3”c. type "exit"d. Say OK if it asks you anything about closing thingse. put cursor outside of any boxes into the blue area, then press the right mouse button,
click Logout and click Yes.
NMR User’s Guide 48
1. Plotting Horizontal Expansionsa. Make sure that the cursor is somewhere on the spectrum.b. Click the left mouse button. You will now get a doubled arrow.c. Move the doubled arrow to the left end of the area you want to expand and click the center
mouse button do define the left boundary.d. Move the doubled arrow to the right end of the area you want to expand and again click the
center mouse button to define the right boundary.e. click PLOT icon
f. To get back to the full expansion, click the icong. To get out of the "doubled arrow" mode, click the left mouse button
2. Manual Integrationa. click INTEGRATEb. define the regions of interest (see horizontal expansion instructions above)c. click RETURN and save your integral regions
• Sometimes you may wish to improve the “flatness” of the integral, or you may wish toassign calibration values of your own choosing. Do the following:
d. put the arrow within the region of your integral, and click the left mouse button. Theintegral under consideration will then get a star by it.
e. click CALIBRATE and respond accordinglyf. adjust the BIAS in order to get the left side of the integral levelg. then adjust the SLOPE to get the right side of the integral level
3. Reducing the noise in noisy, dilute 13C spectra. "Power Spectrum" . [Do not use for 1H spectra!]
a. After getting the normal spectrum, type "ps" b. click on the icon (upper right corner of the icon group) to adjust the vertical scale of
the viewed spectrum.c. click PLOT icon
• Note: The "ps" command can make plots look prettier, by de-emphasizing noise. It doesso by squaring all signals, however, so it will also de-emphasize small peaks that are real.In addition, by changing the relative sizes of peaks, it is incompatible with integration.
4. Vertical Expansions a. Type "cy" and increase or decrease the default value as you see fit. Doubling will double
the printed heights, tripling will triple the printed heights, etc. • At default, cy=14, and is set so that the tallest peak in the spectrum will be 14cm tall. Thus,
if you are wanting to expand a peak that is too tall, you need to multiply the cy as needed.
5. Manual Phasing a. click PHASEb. Click BIGGESTc. Click PHO, and keep finger held downd. -drag, to adjust phase of biggest, marked peake. Click PH1, and keep finger held downf. -drag, to adjust phase of peaks distant from biggestg. click RETURNh. type "abs" if you want integrations to be automatically printed as a result
6. Printing Titlesa. type “setti” (for “set title”) b. delete existing title and type in new onec. click save d. click quit e. type “title” f. choose yes
C13-NMR Interpretation 49
C13-NMR Interpretation1. Count how many lines you have. This will tell you how many types of carbons you have.
(Symmetry equivalent carbons can at times cause the number of lines to be less than the number ofcarbons in your structure.)
a. Each “unique”carbon gives a separate line.b. Symmetry duplicates give the same line.c. If there are more carbons in your formula than there are lines in your spectrum, it means you have
symmetry.
2. Check diagnostic frequency windows (“chemical shift windows”) of the lines to provide yes-or-noanswers regarding the presence or absence of key functional groups in your molecule.
220-160 C=O carbonyl carbons, sp2 hybridized160-100 C alkene or aromatic carbons, sp2 hybridized100-50 C-O oxygen-bearing carbons, single bonds only, sp3 hybridized50-0 C alkyl carbons, no oxygens attached, sp3 hybridized
3. Check Splitting. C13 NMR’s are often acquired as “decoupled” spectra, in which each carbon signalappears as a singlet. This is the way our laboratory C13 NMR’s come out. However, at the cost of extratime it is also possible to get “coupled” C13 NMR’s with splitting. These splitting values are veryuseful, and follow the N+1/N-1 rules (the number of lines is one greater than the number of attachedH’s).
Quartert (q) CH3Triplet (t) CH2Doublet (d) CHSinglet (s) C (no attached hydrogens).
4. Signal Height/Sizea. Carbons without any attached H’s are short. This is common for carbonyls (aldehydes are the
only carbonyl carbons that have hydrogens attached) and for substituted carbons in a benzene ring. b. Symmetry duplication multiplies signal height (if you have two copies of a carbon, the line will
probably be taller than normal!)
5. Aromatics, Symmetry, and C-13 Signals. Most aromatics have symmetry, and both the number ofaromatic lines and the splitting of the aromatic lines can be indicative of the substitution pattern on abenzene. Mono- and para-disubstituted benzenes have symmetry.
4 liness, d, d, d Monosubstituted benzene. (Has symmetry).4 liness, s, d, d Para-disubstituted benzene. (Has symmetry). 6 liness, s, d, d, d, d Ortho- or meta-disubstituted benzene. (Has no symmetry).

C13-NMR Interpretation 50
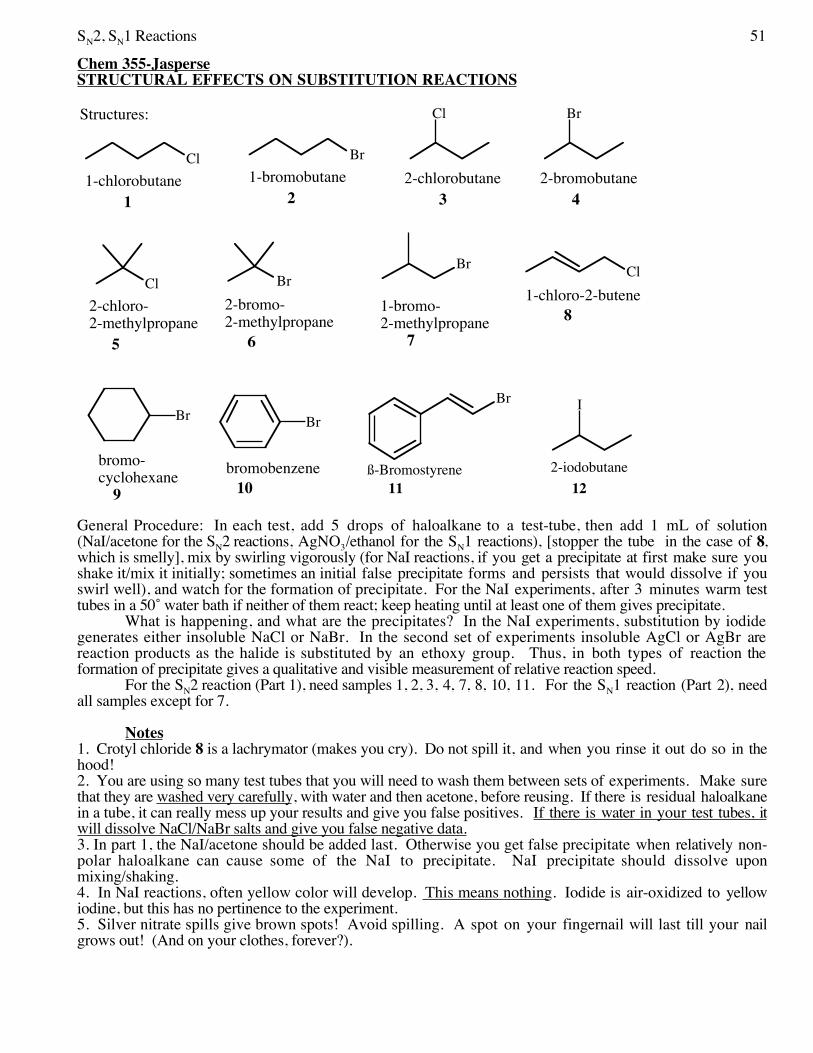
SN2, SN1 Reactions 51
Chem 355-JasperseSTRUCTURAL EFFECTS ON SUBSTITUTION REACTIONS
IBr
Cl Br
Cl Br
Cl BrBr Cl
Br Br
Structures:
1-chlorobutane1 2
1-bromobutane 2-chlorobutane 2-bromobutane3 4
2-chloro-2-methylpropane
2-bromo-2-methylpropane
5 6
1-bromo-2-methylpropane
78
1-chloro-2-butene
bromo-cyclohexane bromobenzene9 10 11 12
2-iodobutaneß-Bromostyrene
General Procedure: In each test, add 5 drops of haloalkane to a test-tube, then add 1 mL of solution(NaI/acetone for the SN2 reactions, AgNO3/ethanol for the SN1 reactions), [stopper the tube in the case of 8,which is smelly], mix by swirling vigorously (for NaI reactions, if you get a precipitate at first make sure youshake it/mix it initially; sometimes an initial false precipitate forms and persists that would dissolve if youswirl well), and watch for the formation of precipitate. For the NaI experiments, after 3 minutes warm testtubes in a 50˚ water bath if neither of them react; keep heating until at least one of them gives precipitate.
What is happening, and what are the precipitates? In the NaI experiments, substitution by iodidegenerates either insoluble NaCl or NaBr. In the second set of experiments insoluble AgCl or AgBr arereaction products as the halide is substituted by an ethoxy group. Thus, in both types of reaction theformation of precipitate gives a qualitative and visible measurement of relative reaction speed.
For the SN2 reaction (Part 1), need samples 1, 2, 3, 4, 7, 8, 10, 11. For the SN1 reaction (Part 2), needall samples except for 7.
Notes1. Crotyl chloride 8 is a lachrymator (makes you cry). Do not spill it, and when you rinse it out do so in thehood! 2. You are using so many test tubes that you will need to wash them between sets of experiments. Make surethat they are washed very carefully, with water and then acetone, before reusing. If there is residual haloalkanein a tube, it can really mess up your results and give you false positives. If there is water in your test tubes, itwill dissolve NaCl/NaBr salts and give you false negative data. 3. In part 1, the NaI/acetone should be added last. Otherwise you get false precipitate when relatively non-polar haloalkane can cause some of the NaI to precipitate. NaI precipitate should dissolve uponmixing/shaking. 4. In NaI reactions, often yellow color will develop. This means nothing. Iodide is air-oxidized to yellowiodine, but this has no pertinence to the experiment. 5. Silver nitrate spills give brown spots! Avoid spilling. A spot on your fingernail will last till your nailgrows out! (And on your clothes, forever?).

SN2, SN1 Reactions 52
Some Arrow-Pushing Guidelines1. Arrows follow electron movement.
2. Some rules for the appearance of arrows• The arrow must begin from the electron source. There are two sources:
a. An atom (which must have a lone pair to give)b. A bond pair (an old bond that breaks)
• An arrow must always point directly to an atom, because when electrons move,they always go to some new atom.
3. Ignore any Spectator Atoms. Any metal atom is always a “spectator”• When you have a metal spectator atom, realize that the non-metal next to it must
have negative charge
4. Draw all H’s on any Atom Whose Bonding Changes
5. Draw all lone-pairs on any Atom whose bonding changes
6. KEY ON BOND CHANGES. Any two-electron bond that changes (either made orbroken) must have an arrow to illustrate:• where it came from (new bond made) or• an arrow showing where it goes to (old bond broken)
7. Watch for Formal Charges and Changes in Formal Charge• If an atom’s charge gets more positive ⇒ it’s donating/losing an electron pair ⇒
arrow must emanate from that atom or one of it’s associated bonds. There aretwo “more positive” transactions:
• When an anion becomes neutral. In this case, an arrow will emanate fromthe atom. The atom has donated a lone pair which becomes a bond pair.
• When a neutral atom becomes cationic. In this case, the atom will be losing abond pair, so the arrow should emanate from the bond rather than from theatom.
• If an atom’s charge gets more negative ⇒ it’s accepting an electron pair ⇒ anarrow must point to that atom. Ordinarily the arrow will have started from a bondand will point to the atom.
8. When bonds change, but Formal Charge Doesn’t Change, A “Substitution” isInvolved• Often an atom gives up an old bond and replaces it with a new bond. This is
“substitution”.• In this case, there will be an incoming arrow pointing directly at the atom (to
illustrate formation of the new bond), and an outgoing arrow emanating from theold bond that breaks

SN2, SN1 Reactions 53
Chem 355-Jasperse Name: STRUCTURAL EFFECTS ON SUBSTITUTION REACTIONS
Part 1: The S N 2 Reaction (NaI/acetone)Report your observations, based on quantity of precipitate formation per time. Do you get instantprecipitation? Does it take minutes for much precipitate to build up? Do you need to heat in order to getmuch precipitate? After comparing, rank the relative reactivity of the competing substrates.
1. Leaving Group: Br vs Cl Run 1 vs 2, and 3 vs 4
2. Primary/Secondary/Tertiary: Run 2 vs 4, 1 vs 3 (Also, make a prediction: Should 6 be fastest or slowest,compared to 2 and 4?)
3. Double bonds part 1: Alkyl vs. Allylic: Run 1 vs 8
4. Compare 2 vs 8. This is an apples/oranges comparison; which is more important, the leaving group or theallylic double bond effect?
5. Double bonds part 2: Alkyl vs. Alkenyl (“vinyl”) or Aryl. Run 2 vs 11 vs. 10 (look for just one winner,neither of two losers should react at all).
6. Steric effects: Run 2 vs 7-notice that both are primary, so why should there be any difference between them?
7. Temperature. Did heating samples sometimes lead to reactions that didn’t go at room temperature?
Part 2: The S N 1 Reaction (AgNO 3 /ethanol)1. Leaving Group: I vs. Br vs Cl Run 12 vs 3 vs 4; also run 5 vs 6
2. Primary/Secondary/Tertiary: Run 1 vs 3 vs 5; and run 2 vs 4 vs 6
3. Double bonds part 1: Alkyl vs. Allylic: Run 1 vs 8
4. Double bonds part 2: Alkyl vs. Alkenyl (“vinyl”)/Aryl. Run 9 vs 10
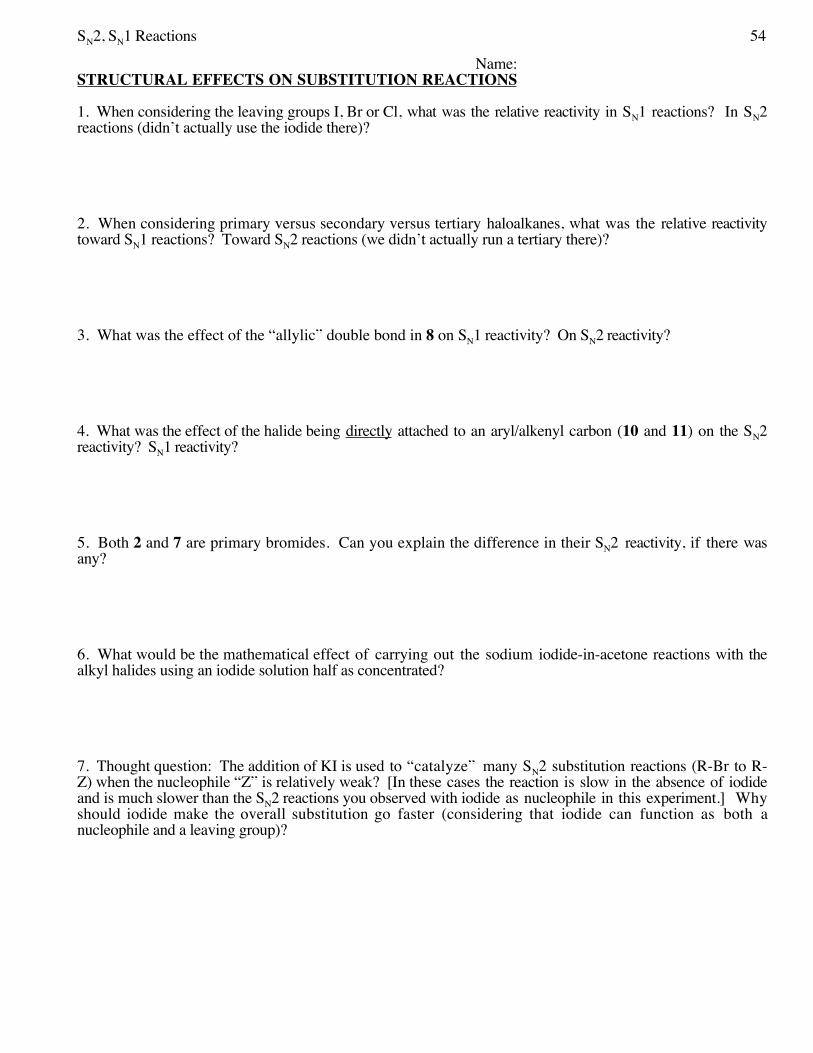
SN2, SN1 Reactions 54
Name: STRUCTURAL EFFECTS ON SUBSTITUTION REACTIONS
1. When considering the leaving groups I, Br or Cl, what was the relative reactivity in SN1 reactions? In SN2reactions (didn’t actually use the iodide there)?
2. When considering primary versus secondary versus tertiary haloalkanes, what was the relative reactivitytoward SN1 reactions? Toward SN2 reactions (we didn’t actually run a tertiary there)?
3. What was the effect of the “allylic” double bond in 8 on SN1 reactivity? On SN2 reactivity?
4. What was the effect of the halide being directly attached to an aryl/alkenyl carbon (10 and 11) on the SN2reactivity? SN1 reactivity?
5. Both 2 and 7 are primary bromides. Can you explain the difference in their SN2 reactivity, if there wasany?
6. What would be the mathematical effect of carrying out the sodium iodide-in-acetone reactions with thealkyl halides using an iodide solution half as concentrated?
7. Thought question: The addition of KI is used to “catalyze” many SN2 substitution reactions (R-Br to R-Z) when the nucleophile “Z” is relatively weak? [In these cases the reaction is slow in the absence of iodideand is much slower than the SN2 reactions you observed with iodide as nucleophile in this experiment.] Whyshould iodide make the overall substitution go faster (considering that iodide can function as both anucleophile and a leaving group)?
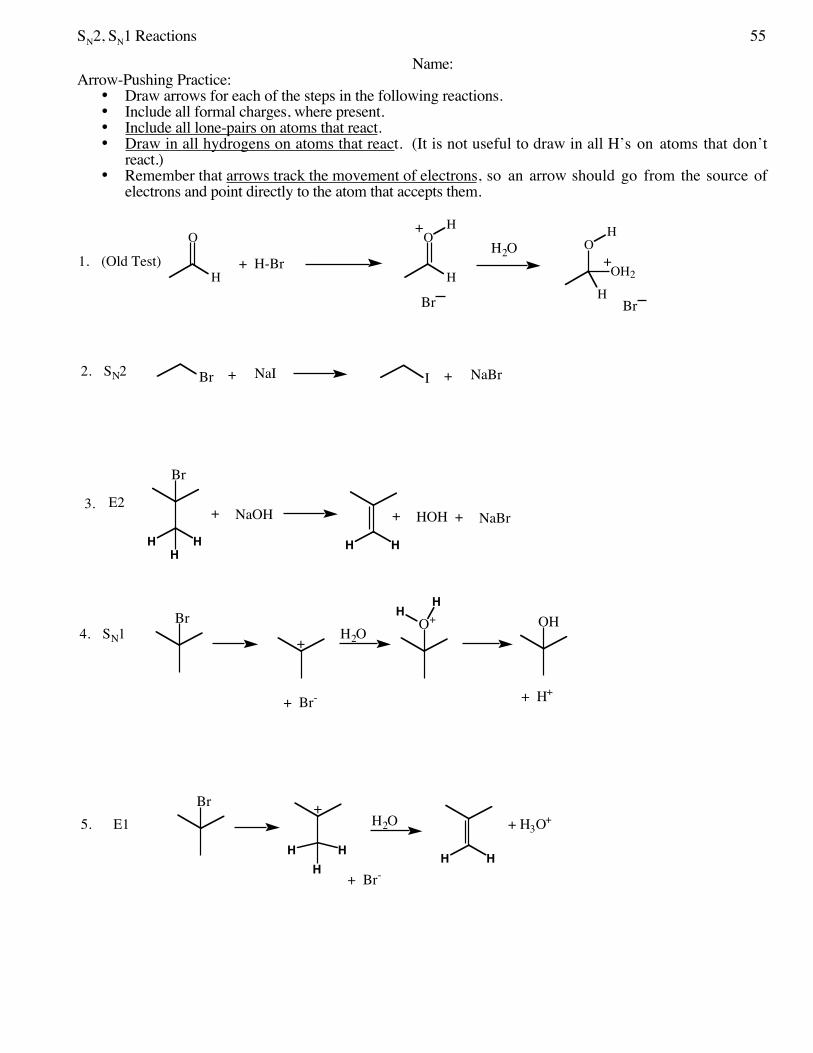
SN2, SN1 Reactions 55
Name: Arrow-Pushing Practice:
• Draw arrows for each of the steps in the following reactions.• Include all formal charges, where present.• Include all lone-pairs on atoms that react. • Draw in all hydrogens on atoms that react. (It is not useful to draw in all H’s on atoms that don’t
react.)• Remember that arrows track the movement of electrons, so an arrow should go from the source of
electrons and point directly to the atom that accepts them.
Br
H H
Br
E2
OHBrSN1
E1
NaI I+ NaBr+SN2
HH
H
+ NaOH + HOH + NaBr
O+
+
+ Br-
H2O
+ H+
HH
Br +
+ Br-
H2O
H H
+ H3O+
H HH
H
O
H
OH
OH2
OH
HBr
+
+
Br
H2O+ H-Br(Old Test)1.
2.
3.
4.
5.

SN2, SN1 Reactions 56
H-NMR Interpretation 57
Chem 355 Jasperse 1H-NMR
Introduction to 1H-NMR Spectroscopy Hydrogen NMR spectroscopy is considerably morecomplex than 13C-NMR. The interpretation is more difficult. However, the extra complexity provides extrainformation that is unavailable from carbon NMR. In interpreting carbon NMR, we basically focused on onlytwo things, how many carbon lines were present, and where they were located (chemical shifts). Both of theseare also central to hydrogen NMR, but two additional factors, “integration” and “splitting”, are also useful.
The four facets of 1H NMR spectroscopy can be summarized as follows:1. The number of signal sets ⇒ the number of symmetry-unique hydrogen types2 . The chemical shifts (frequency) of each signal se t ⇒ the chemical
environment/hybridization/functional groups3. The integration of each signal set ⇒ how many hydrogen atoms cause a signal.
• 3H ⇒ CH3 group• 2H ⇒ CH2 group• 1H ⇒ CH or OH group
4. The splitting of each signal set ⇒ information about what is connected to a given carbon• N lines ⇒ N-1 “neighbor” H’s (when working from spectrum to structure)• N neighbors ⇒ N+1 lines (when you know what a structure is, and you’re trying to predict
what it’s spectrum should look like)
Summary of Steps in 1H NMR Interpretation: (Not all will be needed to get the Answers Today)3. Count how many signal sets you have. This will tell you how many types of hydrogen-
bearing carbons you have. (Hydrogens attached to symmetry-equivalent carbons will give equivalentsignals)
4 . Check diagnostic “chemical shift” windows of the lines to provide yes-or-no answersregarding the presence or absence of key functional groups in your molecule.
5. Check the integration of each signal set.• 3H ⇒ CH3 group 2H ⇒ CH2 group 1H ⇒ CH or OH group
6. Check the splitting of each signal set.• For a signal set with N lines ⇒ N-1 hydrogens will be attached to carbons directly connected
to the carbon of the signal set
I. Number of Signal Sets1. Nonequivalent H’s have different chemical environments and give different signals2. Symmetry-equivalent H’s have the same chemical environment and give the same signal
• Thus the number of signal sets tells you how many different types of hydrogens are present3. Ways for the number of signal sets to differ from the number of carbons:
a. Symmetry duplication: two (or more) carbons give only one type of hydrogen and one signal setb. Hydrogen-free Carbons: No attached H, no H signal! (Carbonyl carbons rarely have H’s…)c. OH Groups: OH as well as CH’s give hydrogen signalsd. CH2 H’s are NONEQUIVALENT in Two “Cis/Trans” Cases:
• When there is a chiral center in the molecule. In 2-bromobutane, one of the CH2 H’s on C-3is cis to the bromine, the other is trans. The cis and trans H’s will give different signals.
• In Alkenes. In propene (CH3CH=CH2), one of the CH2 H’s is cis to the methyl, the other istrans. They are in different environments and would give different signals.
4. On an achiral molecule (alkenes excepted), hydrogens on a given carbon will be equivalent. • all three H’s on a CH3 group will be equivalent• both H’s on a CH2 group will be equivalent.
5. Strategy Keys: a. If possible, determine how many signal sets you have in a spectrum. (Useful when working from
spectrum to structure).b. For a particular structure, determine how many signal sets you should have. (Useful when
matching unknown candidate structures with actual spectra, as in today’s lab.)c. End-Check: Check that the number of signal sets in your spectrum matches with the
structure you believe you actually have! If not, structure needs correction!

H-NMR Interpretation 58
II. “Chemical Shifts” of the Signal Sets
9’s (9.0-10.0) Aldehyde sp2 hybridized C-H’s
7’s (6.5-8.4) Aromatic sp2 hybridized C-H’s
5’s (4.8-6.8) Alkene sp2 hybridized C-H’s
3’s (2.8-4.5) Oxygenated sp3 hybridized C-H’s (halogenated and nitrogenatedalkyl C-H’s will also come in this window, although no candidatesfor today’s lab). Oxygenated sp3–carbons are routinely present for thefollowing functional groups that contain oxygen single bonds:• alcohols,• ethers, or• esters
2’s (1.8-2.8) Allylic sp3 hybridized C-H’s (sp3 hybridized C-H’s that has a double bondattached to the sp3 hybridized C). Allylic signals routinely appear when one ofthe following double-bonded functional groups is present:• carbonyls, (ketones, esters, aldehydes, acids, amides)• alkenes, or• aromatics
1’s (0.7-2.0) sp3 hybridized C-H’s, with no attached Functional Groups• Note: Many molecules with non-functional alkyl portions will give a lot of
signal in this area.
0-12 (anywhere!) Alcohol/Acid O-H hydrogens (N-H hydrogens likewise)• alcohols,• carboxylic acids
How do I process and use what I see from my Chemical Shifts?1. Recognize OH’s..
• An OH can come anywhere, and can easily cause you to make a mistaken conclusion abouta feature group. For example, if you have an OH and it comes in the 2’s, and youconclude that you have an allylic C-H, that might send you down a bad blind alley. Or ifyou have an OH that appears in the 5’s, you might falsely deduce that you have an alkene,etc.. Thus it is really helpful to recognize OH’s when they appear so that they don’tconfuse you.
• Two recognition factors for OH signals:1. They always integrate for 1H, never for 2H or 3H2. They normally appear as singlets, normally somewhat broad. C-H signals tend to be sharper,
and any C-H signal that integrates for one will have significant splitting. The only way to have a1H that doesn’t split is for it to be an OH.
3. If you have an OH signal, of course you will also have some C-H signals in the 3’s area.
2. Check each of the zones. Each one gives you a yes or no answer about the presence of absence ofthe featured group.
o Do I have something in the 9’s? If yes ⇒ aldehydeo Do I have something in the 7’s? (Other than a solvent singlet…)? If yes ⇒
aromatico Do I have something in the 5’s? If yes ⇒ alkeneo Do I have something in the 3’s? If yes ⇒ alcohol, ether, or estero Do I have something in the 2’s? If yes ⇒ ketone, aromatic, or alkeneo Do I have something in the 1’s? If yes ⇒ some nonfunctional alkyl carbons
3. End-Check: Check that the functional groups indicated by your chemical shift informationmatch with the structure you believe you actually have! If not, structure needs correction!
H-NMR Interpretation 59
Miscellaneous Chemical Shifts Notes7. The regions are somewhat approximate, and have some spillover. But it’s useful to basically talks
about the “1’s”, “2’s”, “3’s”, etc. to discuss the major windows. Even though somethingmight actually come at 4.2, it’s still useful to refer to that as appearing in the “3’s” group andmake conclusions accordingly. I’ll still refer to something as coming in the “1’s” group even if itcomes at 0.8.
8. Notice that sp2 hybridized C-H’s come above 5, sp3 hybridized C-H’s come below9. Notice that oxygenated C-H’s come higher than non-oxygenated analogs. An sp3-hybridized C-
H’s with an attached oxygen comes higher than without (3’s versus 1’s), just as an sp2-hybridizedC-H’s comes higher with an attached oxygen (10’s) than without (5’s, 7’s)
10. The above windows are sufficient for this week’s lab. In future, and for more complex molecules,there are more complex ways for a C-H to come in some of the above window. For example, ansp3-hybridized C-H with two attached oxygens can come in the 5’s, or an sp3-hybridized C-H thatis doubly allylic (for example, two attached carbonyls) can come in the 3’s. But for beginning,none of our C-H’s will be impacted by more than one attached functional group at a time.
11. OH’s are real wildcards because they can come anywhere, and can easily get you confused.
III. Integration In C-13 NMR we didn’t really use the heights or sizes of the signal in any quantitativeway. However, the sizes of H-NMR signal sets are very useful and informative.
1. All hydrogens give an equal amount of signal2. When there is symmetry duplication of a hydrogen, the resulting signal will be multiplied accordingly!3. The key is not the signal height, but rather the signal area. 4. The signal area is measured by “integration lines”. Make sure to differentiate integration marks, and
what they mean, from signal lines themselves. 5. Relative areas directly correlate ratios of H’s6. These must be simple whole-number ratios (2:1, 3:1, 3:2, etc..)
• Convert the “computer” ratios to simple whole-number ratios• Round off freely! The computer isn’t normally very precise, easily 10% errors
7. Clean sets involving equivalent H’s give clean, symmetric signal sets:a. 1H ⇒ CH or OHb. 2H ⇒ CH2c. 3H ⇒ CH3d. 6H ⇒ 2 equivalent CH3 groups
8. Unsymmetrical messy sets involving overlapping signal sets: (these will routinely not look nice andsymmetric…)
a. 3H ⇒ OH overlapping a CH2b. 4H ⇒ two overlapping but not exactly equivalent CH2 groups; or a CH3 overlapping an OH
or CHc. 5H ⇒ common in the 7’s, for 5 overlapping arene H’s; also common in the 1’s, when a CH3
and CH2 overlap9. Unfortunately having signal sets overlap is all too common
How do I process and use what I see from my Integrations?1. Distinguish “Clean” Signal Sets from Overlapping Signal Sets
o Clean ones look symmetric, overlapping sets do not
2. For the Clean sets, the integration tells you what kind of group you havea. 1H ⇒ CH or OH (methine or hydroxyl group)b. 2H ⇒ CH2 (methylene group)c. 3H ⇒ CH3 (methyl group)d. 6H ⇒ 2 equivalent CH3 groups
3. End-Check: Check that the “groups” your integration shows match with the structure youbelieve you actually have! If not, your structure needs to be corrected!
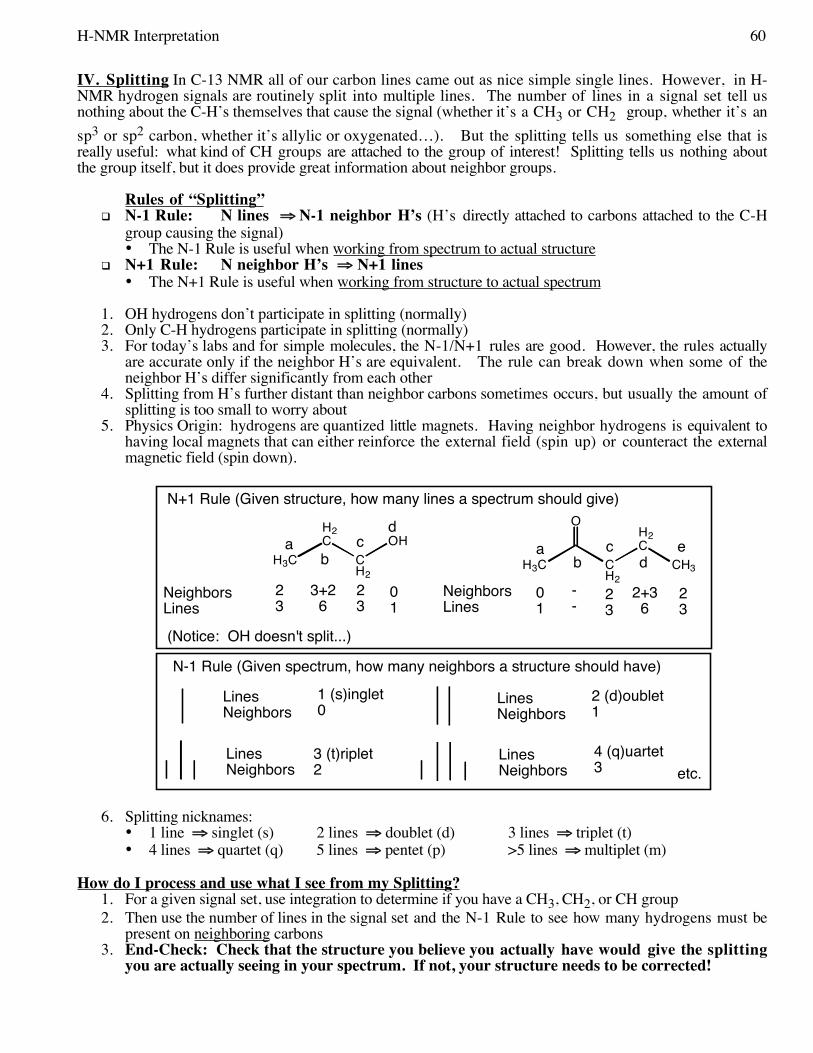
H-NMR Interpretation 60
IV. Splitting In C-13 NMR all of our carbon lines came out as nice simple single lines. However, in H-NMR hydrogen signals are routinely split into multiple lines. The number of lines in a signal set tell usnothing about the C-H’s themselves that cause the signal (whether it’s a CH3 or CH2 group, whether it’s ansp3 or sp2 carbon, whether it’s allylic or oxygenated…). But the splitting tells us something else that isreally useful: what kind of CH groups are attached to the group of interest! Splitting tells us nothing aboutthe group itself, but it does provide great information about neighbor groups.
Rules of “Splitting” N-1 Rule: N lines ⇒ N-1 neighbor H’s (H’s directly attached to carbons attached to the C-H
group causing the signal)• The N-1 Rule is useful when working from spectrum to actual structure
N+1 Rule: N neighbor H’s ⇒ N+1 lines• The N+1 Rule is useful when working from structure to actual spectrum
1. OH hydrogens don’t participate in splitting (normally)2. Only C-H hydrogens participate in splitting (normally)3. For today’s labs and for simple molecules, the N-1/N+1 rules are good. However, the rules actually
are accurate only if the neighbor H’s are equivalent. The rule can break down when some of theneighbor H’s differ significantly from each other
4. Splitting from H’s further distant than neighbor carbons sometimes occurs, but usually the amount ofsplitting is too small to worry about
5. Physics Origin: hydrogens are quantized little magnets. Having neighbor hydrogens is equivalent tohaving local magnets that can either reinforce the external field (spin up) or counteract the externalmagnetic field (spin down).
H3C
H2C
CH2
OHab
cd
NeighborsLines
23
3+2 6
23
H3C CH2
H2C
CH3
O
eab
cd
NeighborsLines
01
--
23
23
2+3 6
01
(Notice: OH doesn't split...)
LinesNeighbors
1 (s)inglet0
LinesNeighbors
2 (d)oublet1
LinesNeighbors
4 (q)uartet3
LinesNeighbors
3 (t)riplet 2
N+1 Rule (Given structure, how many lines a spectrum should give)
N-1 Rule (Given spectrum, how many neighbors a structure should have)
etc.
6. Splitting nicknames: • 1 line ⇒ singlet (s) 2 lines ⇒ doublet (d) 3 lines ⇒ triplet (t)• 4 lines ⇒ quartet (q) 5 lines ⇒ pentet (p) >5 lines ⇒ multiplet (m)
How do I process and use what I see from my Splitting?1. For a given signal set, use integration to determine if you have a CH3, CH2, or CH group2. Then use the number of lines in the signal set and the N-1 Rule to see how many hydrogens must be
present on neighboring carbons3. End-Check: Check that the structure you believe you actually have would give the splitting
you are actually seeing in your spectrum. If not, your structure needs to be corrected!
H-NMR Interpretation 61
V. Standard Summary Report There is a standard summary report format for H-NMR’s whichaddresses chemical shift, integration, and splitting. Normally an interpretation/correlation with the actualstructure is also included.
Ex: CH3OCH2CH2CH2C(O)CH3 (I’ll number the carbons from left to right…)
Standard report format (approximate chemical shift range, integration, splitting, andinterpretation of which signal correlates to which group in the structure…)
3’s, 3H, s (CH3-1)3’s, 2H, t (CH2-2)1’s, 2H, p (CH2-3)2’s, 2H, t (CH2-4)2’s, 3H, s (CH3-6)
VI. Miscellaneous1 . Subtracting the Solvent Lines: Don’t Count the Singlet at 7.26 The sample is
always diluted in a solvent. We will routinely use CDCl3, specifically because it has no H’s!However, it is not totally pure, and usually is contaminated by a small amount of CHCl3, which gives asignal at 7.26. Ignore this signal!
2. Subtracting the Reference Line: Don’t Count the Line at 0 A reference chemical [(CH3)4Si]is normally included that gets used to define where “zero” is. This zero marker is present all the time,but is not part of your actual molecule. Ignore this signal!
3. Subtracting the Water Line: Often a little moisture will be in the solution, probably because itgets into the CDCl3 solvent bottle. This will often appear somewhere around 1.6, but it often driftsdepending on hydrogen-bonding factors. Ignore this signal!
4. Subtracting the Acetone Line? Sometimes students will have washed their NMR tube withacetone, but not all the acetone will have had a chance to evaporate. If residual acetone is present, it willgive a singlet at 2.15. Unfortunately this is about the same place where other methyl groups that areconnected to carbonyls come. One hint that a 2.15 line is acetone and not actually part of yourmolecule is if it integrates funny, i.e. is either too big or too small to integrate correctly. One other hintis to ask the instructor!
5. How do I know what’s a real signal versus a signal arising from an impurity that I shouldignore? For today, if in doubt ask the instructor! The instructor will confirm which lines youshould or shouldn’t consider in doing your analysis. However, one useful recognition tip is ifsomething integrates badly. Integrals are supposed to be nice whole-number ratios (1:1, 2:1, 3:2, etc.).So if something integrates at a 0.1:1 ratio compared to the next smallest signal set, it’s likely just animpurity.
6. Beware of Overlapping. Overlapping is most routine in the benzene area (7’s), and also in the alkylarea (1’s), but happens elsewhere as well. OH signals also often overlap other signals.
VII. Review + Summary1. Count how many signal sets you have.2. Check “chemical shift” windows of the lines to provide yes-or-no answers regarding the presence
or absence of key functional groups in your molecule.3. Check the integration of each signal set.
• 3H ⇒ CH3 group2H ⇒ CH2 group 1H ⇒ CH or OH group4. Check the splitting of each signal set.
• N lines ⇒ N-1 neighbor hydrogens Beware of misinterpreting overlapping signals Beware being confused by signal sets caused by solvents or impurities5. End-Check: Check that the structure you believe you actually have would give the number
of signal sets you have, the chemical shifts you have, the integrations you have, and thesplittings that you have. If not, your structure needs to be corrected!
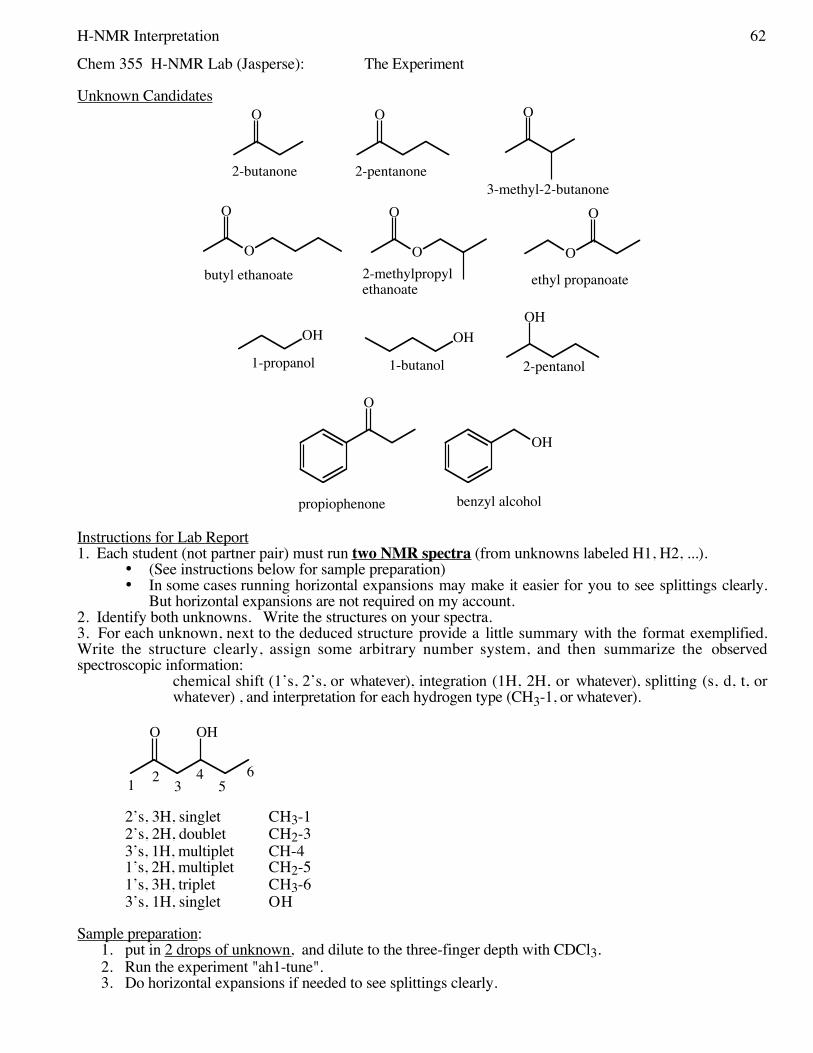
H-NMR Interpretation 62
Chem 355 H-NMR Lab (Jasperse): The Experiment
Unknown Candidates
O
OH
O O
O
O
O
O
O
O
OH OHOH
O
2-pentanone2-butanone
2-pentanol1-butanol1-propanol
2-methylpropyl ethanoate
butyl ethanoate
3-methyl-2-butanone
ethyl propanoate
propiophenone benzyl alcohol
Instructions for Lab Report1. Each student (not partner pair) must run two NMR spectra (from unknowns labeled H1, H2, ...).
• (See instructions below for sample preparation)• In some cases running horizontal expansions may make it easier for you to see splittings clearly.
But horizontal expansions are not required on my account. 2. Identify both unknowns. Write the structures on your spectra. 3. For each unknown, next to the deduced structure provide a little summary with the format exemplified.Write the structure clearly, assign some arbitrary number system, and then summarize the observedspectroscopic information:
chemical shift (1’s, 2’s, or whatever), integration (1H, 2H, or whatever), splitting (s, d, t, orwhatever) , and interpretation for each hydrogen type (CH3-1, or whatever).
O OH
65
4321
2’s, 3H, singlet CH3-12’s, 2H, doublet CH2-33’s, 1H, multiplet CH-41’s, 2H, multiplet CH2-51’s, 3H, triplet CH3-63’s, 1H, singlet OH
Sample preparation: 1. put in 2 drops of unknown, and dilute to the three-finger depth with CDCl3. 2. Run the experiment "ah1-tune". 3. Do horizontal expansions if needed to see splittings clearly.
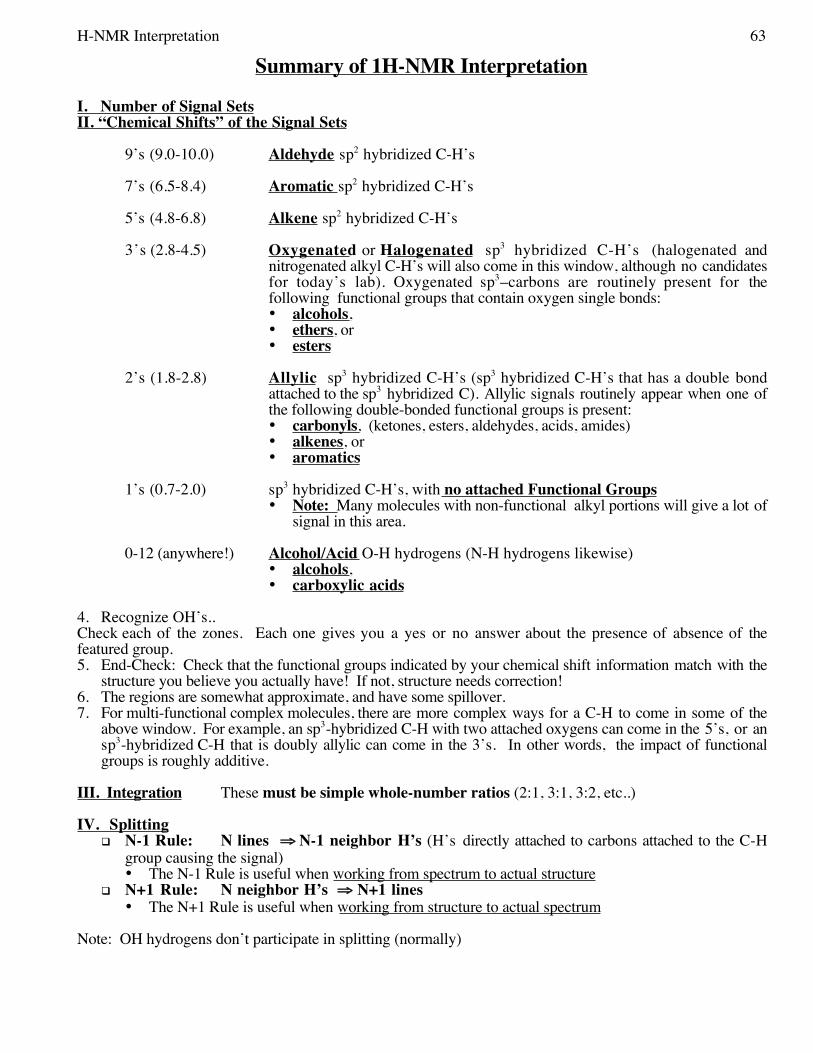
H-NMR Interpretation 63
Summary of 1H-NMR Interpretation
I. Number of Signal SetsII. “Chemical Shifts” of the Signal Sets
9’s (9.0-10.0) Aldehyde sp2 hybridized C-H’s
7’s (6.5-8.4) Aromatic sp2 hybridized C-H’s
5’s (4.8-6.8) Alkene sp2 hybridized C-H’s
3’s (2.8-4.5) Oxygenated or Halogenated sp3 hybridized C-H’s (halogenated andnitrogenated alkyl C-H’s will also come in this window, although no candidatesfor today’s lab). Oxygenated sp3–carbons are routinely present for thefollowing functional groups that contain oxygen single bonds:• alcohols,• ethers, or• esters
2’s (1.8-2.8) Allylic sp3 hybridized C-H’s (sp3 hybridized C-H’s that has a double bondattached to the sp3 hybridized C). Allylic signals routinely appear when one ofthe following double-bonded functional groups is present:• carbonyls, (ketones, esters, aldehydes, acids, amides)• alkenes, or• aromatics
1’s (0.7-2.0) sp3 hybridized C-H’s, with no attached Functional Groups• Note: Many molecules with non-functional alkyl portions will give a lot of
signal in this area.
0-12 (anywhere!) Alcohol/Acid O-H hydrogens (N-H hydrogens likewise)• alcohols,• carboxylic acids
4. Recognize OH’s.. Check each of the zones. Each one gives you a yes or no answer about the presence of absence of thefeatured group. 5. End-Check: Check that the functional groups indicated by your chemical shift information match with the
structure you believe you actually have! If not, structure needs correction!6. The regions are somewhat approximate, and have some spillover. 7. For multi-functional complex molecules, there are more complex ways for a C-H to come in some of the
above window. For example, an sp3-hybridized C-H with two attached oxygens can come in the 5’s, or ansp3-hybridized C-H that is doubly allylic can come in the 3’s. In other words, the impact of functionalgroups is roughly additive.
III. Integration These must be simple whole-number ratios (2:1, 3:1, 3:2, etc..)
IV. Splitting N-1 Rule: N lines ⇒ N-1 neighbor H’s (H’s directly attached to carbons attached to the C-H
group causing the signal)• The N-1 Rule is useful when working from spectrum to actual structure
N+1 Rule: N neighbor H’s ⇒ N+1 lines• The N+1 Rule is useful when working from structure to actual spectrum
Note: OH hydrogens don’t participate in splitting (normally)

H-NMR Interpretation 64
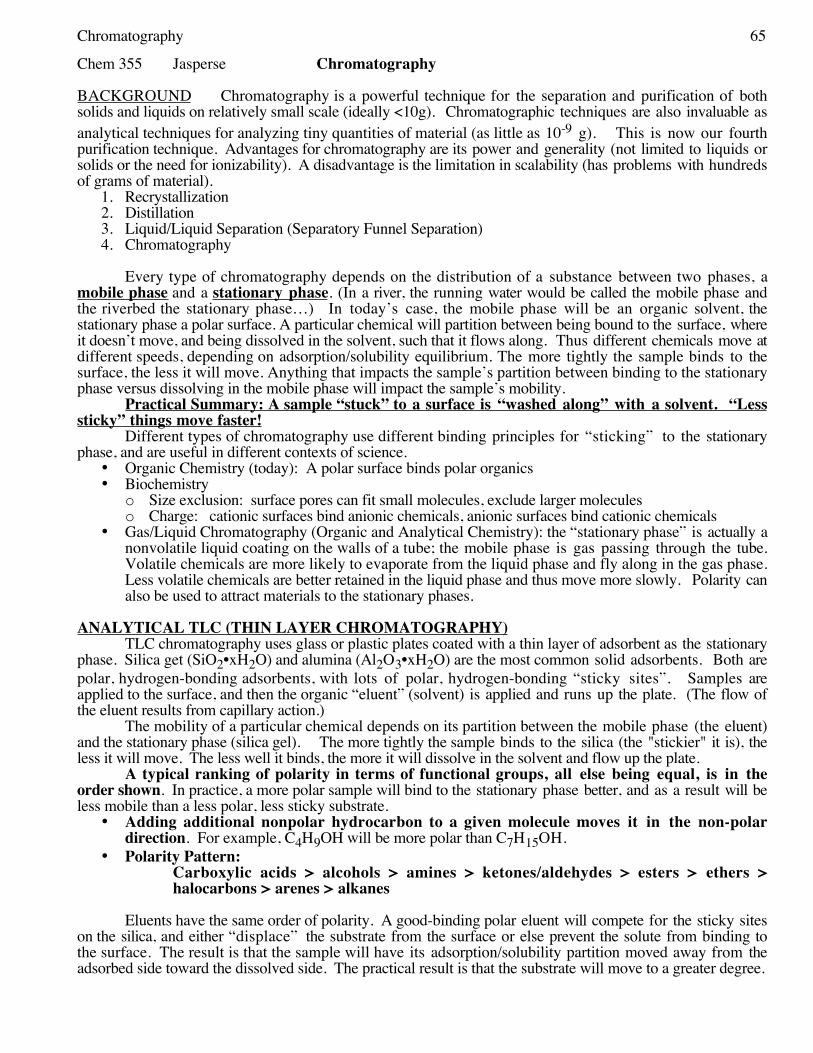
Chromatography 65
Chem 355 Jasperse Chromatography
BACKGROUND Chromatography is a powerful technique for the separation and purification of bothsolids and liquids on relatively small scale (ideally <10g). Chromatographic techniques are also invaluable asanalytical techniques for analyzing tiny quantities of material (as little as 10-9 g). This is now our fourthpurification technique. Advantages for chromatography are its power and generality (not limited to liquids orsolids or the need for ionizability). A disadvantage is the limitation in scalability (has problems with hundredsof grams of material).
1. Recrystallization2. Distillation3. Liquid/Liquid Separation (Separatory Funnel Separation)4. Chromatography
Every type of chromatography depends on the distribution of a substance between two phases, amobile phase and a stationary phase. (In a river, the running water would be called the mobile phase andthe riverbed the stationary phase…) In today’s case, the mobile phase will be an organic solvent, thestationary phase a polar surface. A particular chemical will partition between being bound to the surface, whereit doesn’t move, and being dissolved in the solvent, such that it flows along. Thus different chemicals move atdifferent speeds, depending on adsorption/solubility equilibrium. The more tightly the sample binds to thesurface, the less it will move. Anything that impacts the sample’s partition between binding to the stationaryphase versus dissolving in the mobile phase will impact the sample’s mobility.
Practical Summary: A sample “stuck” to a surface is “washed along” with a solvent. “Lesssticky” things move faster!
Different types of chromatography use different binding principles for “sticking” to the stationaryphase, and are useful in different contexts of science.
• Organic Chemistry (today): A polar surface binds polar organics• Biochemistry
o Size exclusion: surface pores can fit small molecules, exclude larger moleculeso Charge: cationic surfaces bind anionic chemicals, anionic surfaces bind cationic chemicals
• Gas/Liquid Chromatography (Organic and Analytical Chemistry): the “stationary phase” is actually anonvolatile liquid coating on the walls of a tube; the mobile phase is gas passing through the tube.Volatile chemicals are more likely to evaporate from the liquid phase and fly along in the gas phase.Less volatile chemicals are better retained in the liquid phase and thus move more slowly. Polarity canalso be used to attract materials to the stationary phases.
ANALYTICAL TLC (THIN LAYER CHROMATOGRAPHY)TLC chromatography uses glass or plastic plates coated with a thin layer of adsorbent as the stationary
phase. Silica get (SiO2•xH2O) and alumina (Al2O3•xH2O) are the most common solid adsorbents. Both arepolar, hydrogen-bonding adsorbents, with lots of polar, hydrogen-bonding “sticky sites”. Samples areapplied to the surface, and then the organic “eluent” (solvent) is applied and runs up the plate. (The flow ofthe eluent results from capillary action.)
The mobility of a particular chemical depends on its partition between the mobile phase (the eluent)and the stationary phase (silica gel). The more tightly the sample binds to the silica (the "stickier" it is), theless it will move. The less well it binds, the more it will dissolve in the solvent and flow up the plate.
A typical ranking of polarity in terms of functional groups, all else being equal, is in theorder shown. In practice, a more polar sample will bind to the stationary phase better, and as a result will beless mobile than a less polar, less sticky substrate.
• Adding additional nonpolar hydrocarbon to a given molecule moves it in the non-polardirection. For example, C4H9OH will be more polar than C7H15OH.
• Polarity Pattern:Carboxylic acids > alcohols > amines > ketones/aldehydes > esters > ethers >halocarbons > arenes > alkanes
Eluents have the same order of polarity. A good-binding polar eluent will compete for the sticky siteson the silica, and either “displace” the substrate from the surface or else prevent the solute from binding tothe surface. The result is that the sample will have its adsorption/solubility partition moved away from theadsorbed side toward the dissolved side. The practical result is that the substrate will move to a greater degree.
Chromatography 66
Movement is quantified by "Rf" (Response f actor) values: distance the chemical travels divided by thedistance that the eluent travels. For a given surface, substrate, and eluent, the Rf is characteristic and is usefulfor identification. For a series of substrates, their relative Rf‘s reflect their relative polarities.
Visualizing the samples is crucial, since most organics are colorless. UV (ultraviolet light) or a chemicalcolorizing dip will be used. (UV is ideal, but is only applicable to molecules with extensive systems of sp2atoms that are able to absorb UV light.)
Summary: For silica gel surfaces, which are polar, the following relationships are true:
1. When two substrates are run under identical conditions, the more polar substrate will have thelower Rf; the less polar substrate will have the higher Rf
2. When the same substrate is run under two different solvent conditions, any substrate will have ahigher Rf with the more polar eluent, and a lower Rf with the less polar eluent.
COLUMN CHROMATOGRAPHYWhile TLC is useful as an analytical tool, chromatography can also be used as a purification
technique. But to separate larger than analytical quantities of chemical, a larger amount of solid surfacematerial must also be used, and larger volumes of solvents must also be used.
The general idea is that if sufficient quantities of solvent are used, solutes will eventually “wash off”of the surface. The differential mobilities of different compounds allow them to come off at different speeds.Individual collection of the different fractions, followed by reconcentration, enables isolation of purecompounds from initial mixtures.
In practice solvent polarity “ramping” is commonly used. In this technique, a relatively nonpolarsolvent is used first, which is only able to selectively wash off mobile, nonpolar substrates, while leaving polarsubstrates behind (“stuck” to the solid surface). Then a more polar solvent is applied which is able toselectively wash off the more polar substrate. In today’s lab we will do a very abrupt increase in solventpolarity to make things go faster. But often this is done more gradually.
Pressure is frequently used to push solvent through more quickly and speed up the process. We willuse modest pressure in today’s experiment.
In today’s experiment, the samples will be colored, so it will be relatively easy to see what ishappening. Most ordinary organics are colorless. When colorless organics, a series of different solventfractions are collected in test tubes or flasks. Then the same visualization techniques that are used for TLC areapplied to determine which fractions actually have chemicals present.
In this experiment, a small-scale chromatographic separation of non-polar ferrocene (mp 172-174˚)and relatively polar acetylferrocene (mp 85-86˚) will be attempted. For the structures for these interestingiron-based chemicals, see p. 175. They have been chosen for the experiment specifically because, unlike mostorganics, they are colored. So their visible color will enable you to see the separation and chemical movementas it happens. The solid surface will be silica; the nonpolar solvent will be “petroleum ether” (a misnomer, itis a mixture of low-boiling alkane isomers); and the polar solvent will be 50/50 diethyl ether/petroleum ether.
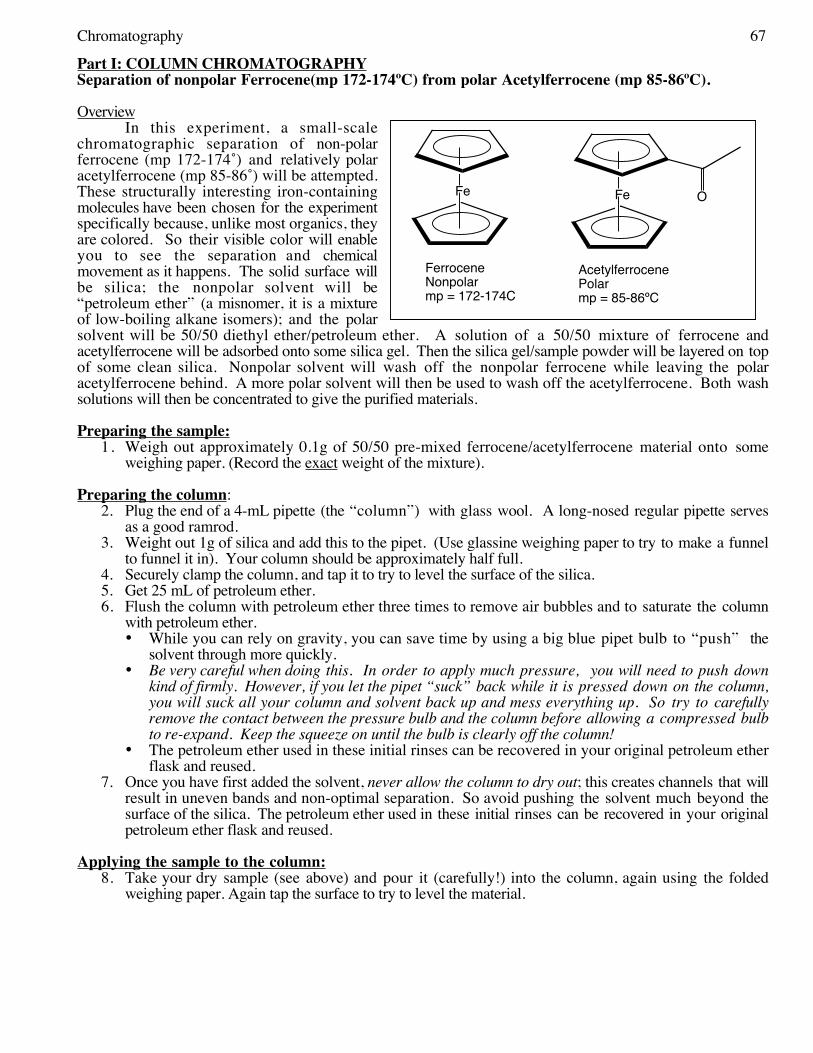
Chromatography 67
Fe Fe O
FerroceneNonpolarmp = 172-174C
AcetylferrocenePolarmp = 85-86ºC
Part I: COLUMN CHROMATOGRAPHYSeparation of nonpolar Ferrocene(mp 172-174ºC) from polar Acetylferrocene (mp 85-86ºC).
OverviewIn this experiment, a small-scale
chromatographic separation of non-polarferrocene (mp 172-174˚) and relatively polaracetylferrocene (mp 85-86˚) will be attempted.These structurally interesting iron-containingmolecules have been chosen for the experimentspecifically because, unlike most organics, theyare colored. So their visible color will enableyou to see the separation and chemicalmovement as it happens. The solid surface willbe silica; the nonpolar solvent will be“petroleum ether” (a misnomer, it is a mixtureof low-boiling alkane isomers); and the polarsolvent will be 50/50 diethyl ether/petroleum ether. A solution of a 50/50 mixture of ferrocene andacetylferrocene will be adsorbed onto some silica gel. Then the silica gel/sample powder will be layered on topof some clean silica. Nonpolar solvent will wash off the nonpolar ferrocene while leaving the polaracetylferrocene behind. A more polar solvent will then be used to wash off the acetylferrocene. Both washsolutions will then be concentrated to give the purified materials.
Preparing the sample:1. Weigh out approximately 0.1g of 50/50 pre-mixed ferrocene/acetylferrocene material onto some
weighing paper. (Record the exact weight of the mixture).
Preparing the column:2. Plug the end of a 4-mL pipette (the “column”) with glass wool. A long-nosed regular pipette serves
as a good ramrod. 3. Weight out 1g of silica and add this to the pipet. (Use glassine weighing paper to try to make a funnel
to funnel it in). Your column should be approximately half full. 4. Securely clamp the column, and tap it to try to level the surface of the silica.5. Get 25 mL of petroleum ether. 6. Flush the column with petroleum ether three times to remove air bubbles and to saturate the column
with petroleum ether. • While you can rely on gravity, you can save time by using a big blue pipet bulb to “push” the
solvent through more quickly. • Be very careful when doing this. In order to apply much pressure, you will need to push down
kind of firmly. However, if you let the pipet “suck” back while it is pressed down on the column,you will suck all your column and solvent back up and mess everything up. So try to carefullyremove the contact between the pressure bulb and the column before allowing a compressed bulbto re-expand. Keep the squeeze on until the bulb is clearly off the column!
• The petroleum ether used in these initial rinses can be recovered in your original petroleum etherflask and reused.
7. Once you have first added the solvent, never allow the column to dry out; this creates channels that willresult in uneven bands and non-optimal separation. So avoid pushing the solvent much beyond thesurface of the silica. The petroleum ether used in these initial rinses can be recovered in your originalpetroleum ether flask and reused.
Applying the sample to the column:8. Take your dry sample (see above) and pour it (carefully!) into the column, again using the folded
weighing paper. Again tap the surface to try to level the material.
Chromatography 68
Eluting the Nonpolar Substrate:9. Select three large test tubes10. Mark them as Tubes 1-3.11. Pre-weight Tubes 1 and 3.12. Use 15 mL of petroleum ether to wash the mobile, nonpolar substrate off from your column. Collect
the yellow solution in Tube 1. • By the end of the 15 mL, the bottom of the column should be almost white, the drops coming off
relatively colorless, and the orange polar material should remain at the top of the column.13. However, to ensure that the nonpolar ferrocene is completely removed, use an additional 10 mL of
petroleum ether to further wash the column. Collect these 10 mL in Tube 2. Since there should belittle or no solute in this fraction, it can be thrown away after the experiment.
14. If the rotovap is free, transfer the solution from Tube 1 into a pre-weighed round-bottomed flask anduse the rotovap to concentrate the solution. If the rotovap is too busy, you may prefer to concentrateyour solution by simply placing Tube 1 into a hot-water bath and simply boil off the petroleum ether.The petroleum ether is quite volatile, so allowing it to stand in your drawer for a day or more willprobably also allow completely dry material.
15. Determine your mass yield for your ferrocene.16. Take a melting point for your ferrocene.
Eluting the Polar Substrate:17. Following step 4 above, use 15 mL of the more polar 50/50 diethyl ether/petroleum ether solvent to
wash the more polar acetylferrocene off of the column. Collect the solution in Tube 3. You should beable to see the colored band as it moves through the column.
18. To isolate the polar acetylferrocene, the solution in Tube 3 needs to be reconcentrated. You can againdo this either by rotary evaporation (preweigh your flask!), by boiling Tube 3 in a hot water bath, or byallowing the solution to simply evaporate to dryness.
19. Determine your mass yield for your ferrocene.20. Take a melting point for your ferrocene.
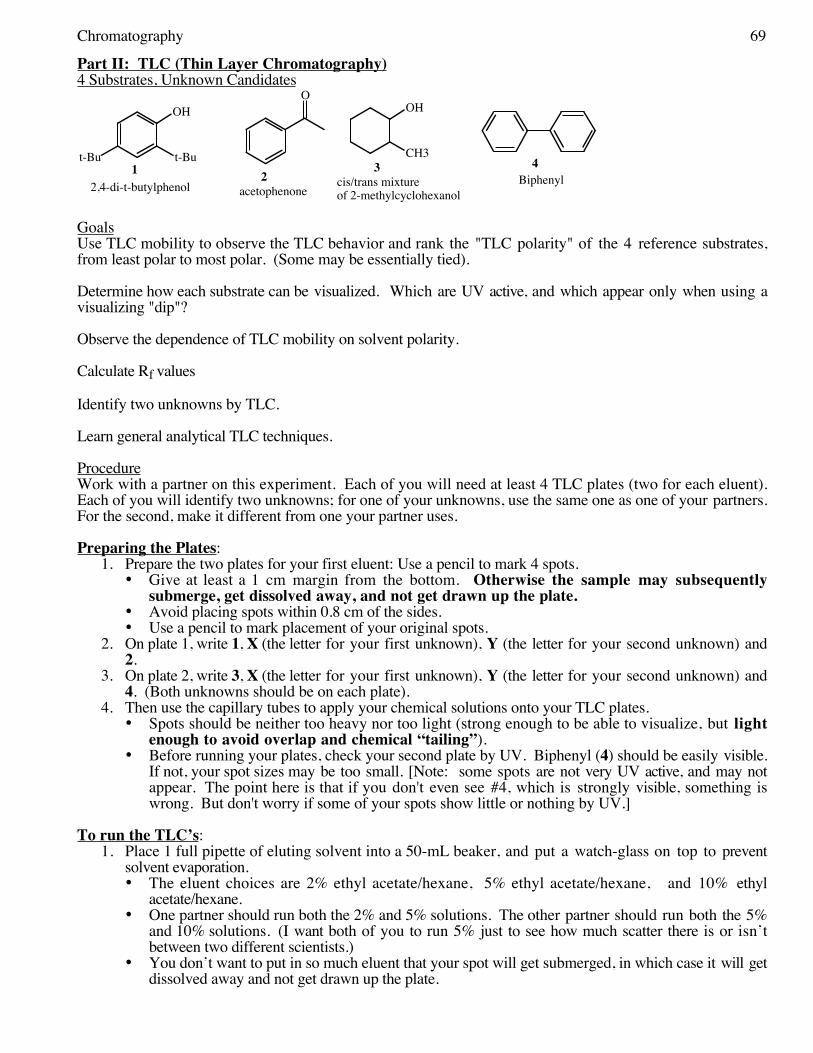
Chromatography 69
Part II: TLC (Thin Layer Chromatography)4 Substrates, Unknown Candidates
t-Bu
OH
t-Bu
OOH
CH3
Biphenyl43
cis/trans mixture of 2-methylcyclohexanolacetophenone
22,4-di-t-butylphenol
1
GoalsUse TLC mobility to observe the TLC behavior and rank the "TLC polarity" of the 4 reference substrates,from least polar to most polar. (Some may be essentially tied).
Determine how each substrate can be visualized. Which are UV active, and which appear only when using avisualizing "dip"?
Observe the dependence of TLC mobility on solvent polarity.
Calculate Rf values
Identify two unknowns by TLC.
Learn general analytical TLC techniques.
ProcedureWork with a partner on this experiment. Each of you will need at least 4 TLC plates (two for each eluent).Each of you will identify two unknowns; for one of your unknowns, use the same one as one of your partners.For the second, make it different from one your partner uses.
Preparing the Plates: 1. Prepare the two plates for your first eluent: Use a pencil to mark 4 spots.
• Give at least a 1 cm margin from the bottom. Otherwise the sample may subsequentlysubmerge, get dissolved away, and not get drawn up the plate.
• Avoid placing spots within 0.8 cm of the sides. • Use a pencil to mark placement of your original spots.
2. On plate 1, write 1, X (the letter for your first unknown), Y (the letter for your second unknown) and2.
3. On plate 2, write 3, X (the letter for your first unknown), Y (the letter for your second unknown) and4. (Both unknowns should be on each plate).
4. Then use the capillary tubes to apply your chemical solutions onto your TLC plates. • Spots should be neither too heavy nor too light (strong enough to be able to visualize, but light
enough to avoid overlap and chemical “tailing”). • Before running your plates, check your second plate by UV. Biphenyl (4) should be easily visible.
If not, your spot sizes may be too small. [Note: some spots are not very UV active, and may notappear. The point here is that if you don't even see #4, which is strongly visible, something iswrong. But don't worry if some of your spots show little or nothing by UV.]
To run the TLC’s:1. Place 1 full pipette of eluting solvent into a 50-mL beaker, and put a watch-glass on top to prevent
solvent evaporation. • The eluent choices are 2% ethyl acetate/hexane, 5% ethyl acetate/hexane, and 10% ethyl
acetate/hexane. • One partner should run both the 2% and 5% solutions. The other partner should run both the 5%
and 10% solutions. (I want both of you to run 5% just to see how much scatter there is or isn’tbetween two different scientists.)
• You don’t want to put in so much eluent that your spot will get submerged, in which case it will getdissolved away and not get drawn up the plate.
Chromatography 70
• Ethyl acetate is an ester. The more ethyl acetate is present in the mixture, the more polar the eluentshould be.
2. Then carefully put your TLC plate(s) into the eluent, and put the watch-glass back on top. The eluentwill creep up the plate.• You can easily put both plates 1 and 2 in at the same time.• Avoid putting plates in crooked, or touching the walls.• You’d like the solvent line on the bottom to be level. • Note: the spots must not be submerged in solvent, or they will simply dissolve and not be drawn
up the plate.3. After the eluent has risen a significant distance, (it shouldn’t actually hit the top), remove the plate(s)
and immediately mark with pencil the top distance that the eluent went. • If it hits the top, your sample can keep creeping up the plate and you will get falsely high Rf’s. • Note: It’s important to keep the cover on your beaker. Otherwise evaporation competes with
elution and you will get falsely high Rf’s.
Eluent choice: You will test two different solvent mixtures, as will your partner. One of you should run boththe 2% and 10% ethyl acetate/hexane solvents; the other should run both the 10% and 40% ethylacetate/hexane solvents. Since each of you will test two solvents, and for each solvent you will need 2 plates,that means each of you will be running 4 plates total. (Or more; you may need to repeat some!)
Visualizing the spots:1. Look at your plates under UV light, and circle with pencil the spots that you can see.
• Spots may seem weaker than before; during the process the sample gets "stretched" out, so thesignal intensity essentially gets diluted.
• Not all samples will give UV spots. 2. After marking the UV active spots, take your plate to the "p-Anisaldehyde Dip" station. (Caution: 5%
sulfuric acid!) • Dip your plate into the solution, using forceps• Try to let the excess liquid drain off• Then dry the plate with a heat gun.
3. Circle the new spots that appear, and record their color. (Some spots may differ in color, and thecolors may have diagnostic value).
Calculate the Rf Values for All Your Spots: This will be the ratio of the distance traveled by your spotrelative to the distance traveled by the solvent. While these can be evaluated with rulers, it’s satisfactory tosimply eyeball it.
• Do not measure relative to the bottom of the plate. Measure relative to where the spot began.
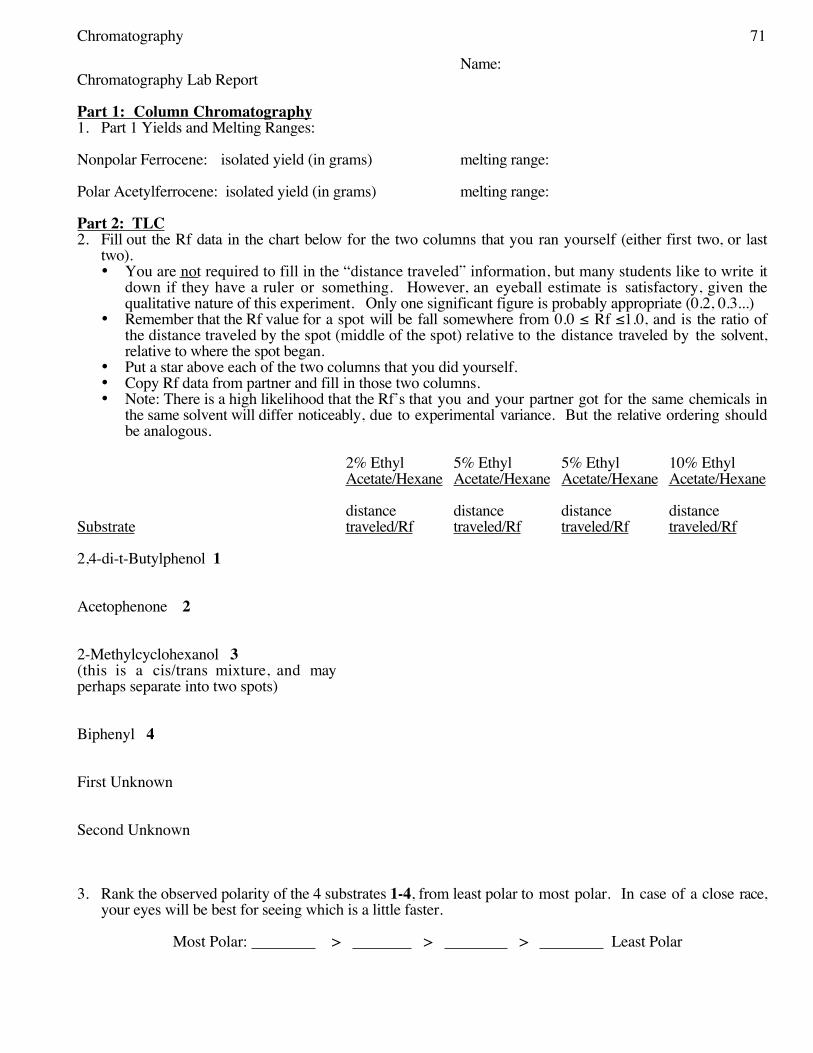
Chromatography 71
Name: Chromatography Lab Report
Part 1: Column Chromatography1. Part 1 Yields and Melting Ranges:
Nonpolar Ferrocene: isolated yield (in grams) melting range:
Polar Acetylferrocene: isolated yield (in grams) melting range:
Part 2: TLC 2. Fill out the Rf data in the chart below for the two columns that you ran yourself (either first two, or last
two). • You are not required to fill in the “distance traveled” information, but many students like to write it
down if they have a ruler or something. However, an eyeball estimate is satisfactory, given thequalitative nature of this experiment. Only one significant figure is probably appropriate (0.2, 0.3...)
• Remember that the Rf value for a spot will be fall somewhere from 0.0 ≤ Rf ≤1.0, and is the ratio ofthe distance traveled by the spot (middle of the spot) relative to the distance traveled by the solvent,relative to where the spot began.
• Put a star above each of the two columns that you did yourself.• Copy Rf data from partner and fill in those two columns.• Note: There is a high likelihood that the Rf’s that you and your partner got for the same chemicals in
the same solvent will differ noticeably, due to experimental variance. But the relative ordering shouldbe analogous.
2% EthylAcetate/Hexane
5% EthylAcetate/Hexane
5% EthylAcetate/Hexane
10% EthylAcetate/Hexane
Substratedistancetraveled/Rf
distancetraveled/Rf
distancetraveled/Rf
distancetraveled/Rf
2,4-di-t-Butylphenol 1
Acetophenone 2
2-Methylcyclohexanol 3(this is a cis/trans mixture, and mayperhaps separate into two spots)
Biphenyl 4
First Unknown
Second Unknown
3. Rank the observed polarity of the 4 substrates 1-4, from least polar to most polar. In case of a close race,your eyes will be best for seeing which is a little faster.
Most Polar: > > > Least Polar
Chromatography 72
4. Identify your two TLC Unknowns:
First Unknown: Letter Identity
Second Unknown: Letter Identity
5. Did increasing the polarity of your eluent increase or decrease your Rf’s?
6. Given that the solid surface is polar, explain why polar substrates have lower Rf values than less polarones.
7. Explain why increasing solvent polarity increases the Rf value for a given substrate.
8. What problem happens if the spot is placed so low on the plate and the eluent pool is so deep that the spotis actually submerged under the solvent?
9. What problem happens if the TLC beaker is left uncovered? Will the resulting Rf be fine, too high, or toolow?
10. In what order, from top to bottom, would you expect to see the spots for naphthalene (C10H8), butyric acid(CH3CH2CH2CO2H), and phenyl acetate (CH3CO2C6H5)?
11. In what order, from top to bottom, would you expect to see the spots for the following:• acetic acid=CH3CO2H• butanal=CH3CH2CH2CHO;• 2-octanone=CH3COCH2CH2CH2CH2CH2CH3• decane=C10H22;• 1-butanol=CH3CH2CH2CH2OH
12. What will be the appearance of a TLC plate if a solvent of too low polarity is used for the development?(Will the spots be somewhere in the middle, way at the bottom, or way at the top of the plate?)
13. What will be the appearance of a TLC plate if a solvent of too high polarity is used for the development?(Will the spots be somewhere in the middle, way at the bottom, or way at the top of the plate?)

Cholesterol 73
Chem 355 Jasperse
Cholesterol from Human Gallstones
In this experiment, cholesterol will be isolated from human gallstones. Cholesterol is anunsaturated alcohol containing 27 carbon atoms. It is a solid (mp = 148-149˚C), and it is insolublein water but soluble in a variety of hot organic solvents.
HOCholesterol
N
N
N
N HHH
H
OO
OHOBilirubin
The gall bladder is attached to the undersurface of the liver just below the rib cage. It retainsbile produced by the liver and feeds it into the upper part of the small intestine as needed fordigestion. Bile consists primarily of bile acids, which are carboxylic acids closely resemblingcholesterol and which aid in the digestion of fats by functioning as emulsifying agents. The gallbladder also harbors free cholesterol. If the concentration of cholesterol in the bile exceeds acertain critical level, it will come out of solution and agglomerate into particles that grow to formgallstones. An amateur geologist given a bottle of gallstones to identify once labeled them a“riverbed conglomerate” -- and indeed they do resemble stones in color, texture, and hardness.They come in a variety of shapes and colors and can be up to an inch in diameter.
As gallstones collect, they irritate the lining of the gall bladder, causing severe pain, nausea,and vomiting. The stones can block the bile duct and at times even lead to fatal complications.Formerly, the only remedy was major surgery. While surgery remains a frequent procedure,gallstones can sometimes be disintegrated in the gall bladder and the entire organ removed througha small incision in the navel. Consequently, it may soon be impossible to obtain whole humangallstones.
In the average human, approximately 200g of cholesterol is concentrated primarily in thespinal cord, brain, and nerve tissue. Insoluble in water and plasma, it is transported in thebloodstream bound to lipoproteins, which are proteins attached to lipids (fats). Recent research hasdivided these lipoproteins, when centrifuged, into two broad classes—high density (HDL) and low-density (LDL) lipoproteins. A relatively high concentration of HDL bound to cholesterol seems tocause no problems and in fact is beneficial, but a high ratio of LDL-cholesterol leads to thedeposition of cholesterol both in the gall bladder (resulting in gallstones) and on the walls of thearteries (causing a plaque that cuts off blood flow and hastens hardening of the arteries orarteriosclerosis).
Mounting evidence points to unsaturated fats such as those found in vegetable oils asfavoring the HDL-cholesterol bond, while LDL-cholesterol formation is speeded by saturated fatssuch as those found in animals. The HDL-cholesterol level goes down with smoking or eatinglarge amounts of sugar. It goes up with regular exercise and with the consumption of moderateamounts of alcohol.
The average American woman at age 75 has a 50% chance of developing gallstones, whilefor a man of the same age the chance is only half as great. Gallstones and coronary heart diseaseare also much more common in overweight people. Almost 70% of the women in certain NativeAmerican tribes get gallstones before the age of 30, whereas only 10% of black women areafflicted. Swedes and Finns have gallstones more often than Americans; the problem is almostunknown among the Masai people of East Africa.
Cholesterol 74
ExperimentSwirl 0.6 g of crushed gallstones in a 25-mL Erlenmeyer flask with about 6mL of 2-
butanone. Add a boiling stick, and heat gently on a hot plate for five minutes until the solid hasdisintegrated and the cholesterol has dissolved (a brown residue, bilirubin, will not dissolve).
Filter the solution while hot to remove the bilirubin, using a Hirsch funnel and a small filterflask (50-, 75-, or 125-mL). The filtration is often difficult, because some of the bilirubin can getthrough. Keys to success: 1) Wet the filter paper with 2-butanone immediately before pouring themixture, and 2) turn the vacuum on immediately before pouring the mixture, so that the filter paperstays in place. Why do these things? A) If you don’t wet the filter paper it will often be knockedout of position and bilirubin will get underneath. B) If you don’t have the vacuum running, thefilter paper will again often lose its place and float up or get knocked out of position as soon as youpour the mixture on. C) If you wet the filter paper too much in advance of your filtration, thevolatile butanone will simply evaporate and you’ll be right back to the dry-filter paper problemsituation A again!
Use some additional hot 2-butanone to rinse your Erlenmeyer and to rinse the Hirschfunnel. If some bilirubin did get through, you’ll need to filter again (and again, etc.) until yourliquid doesn’t have any brown particles in it.
Rinse your Erlenmeyer and your Hirsch funnel with an additional 10 mL of methanol. Heatthe combined cholesterol/butanone/methanol solution back to boiling, and reduce the total volume to≤15 mL (best observed if you are working in a relatively small flask with volume markings on it).Add drops of hot water to the hot solution until you achieve saturation. As soon as you see productcoming out of solution, don’t add any more water. Cool the mixture and filter. Use some 80%methanol/20% water solution to rinse. (This is organic enough to help wash off impurities, but nota good enough solvent to dissolve away much of your yield.) Let dry for at least a day beforetaking final melting point and determining your final % yield.
Lab Report Requirements• Write up your procedure, with full description of what you did and what you observed.• Include you percent yield• Include the melting point for your product cholesterol.
Questions1. Given the structure of cholesterol, explain why it is more soluble in organic solvents than in
water. Explain why the solubility of free cholesterol in the blood stream is so low. 2. Given that cholesterol has 27 carbon atoms, how many hydrogen atoms does it have?
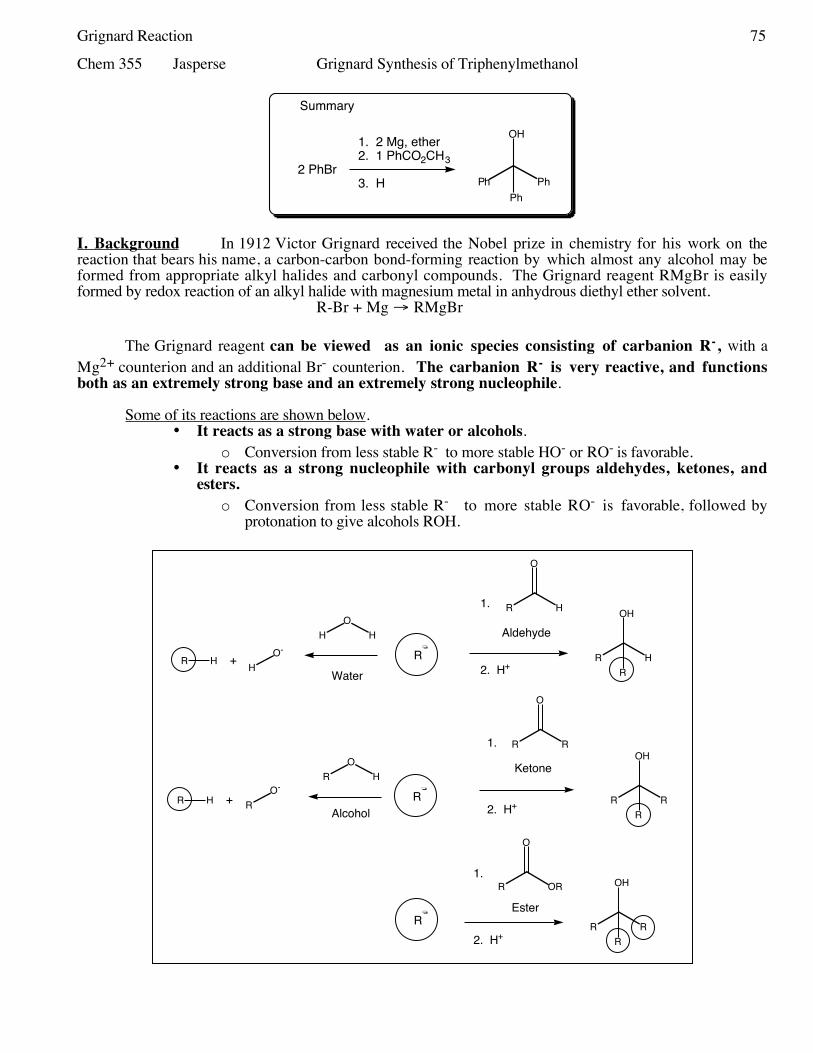
Grignard Reaction 75
Chem 355 Jasperse Grignard Synthesis of Triphenylmethanol
2 PhBr
1. 2 Mg, ether2. 1 PhCO2CH3
3. H Ph Ph
OH
Ph
Summary
I. Background In 1912 Victor Grignard received the Nobel prize in chemistry for his work on thereaction that bears his name, a carbon-carbon bond-forming reaction by which almost any alcohol may beformed from appropriate alkyl halides and carbonyl compounds. The Grignard reagent RMgBr is easilyformed by redox reaction of an alkyl halide with magnesium metal in anhydrous diethyl ether solvent.
R-Br + Mg → RMgBr
The Grignard reagent can be viewed as an ionic species consisting of carbanion R-, with aMg2+ counterion and an additional Br- counterion. The carbanion R- is very reactive, and functionsboth as an extremely strong base and an extremely strong nucleophile.
Some of its reactions are shown below. • It reacts as a strong base with water or alcohols.
o Conversion from less stable R- to more stable HO- or RO- is favorable.
• It reacts as a strong nucleophile with carbonyl groups aldehydes, ketones, andesters.
o Conversion from less stable R- to more stable RO- is favorable, followed by
protonation to give alcohols ROH.
R--
1.
2. H+ R R
OH
R
1.
2. H+R H
OH
R
1.
2. H+R R
OH
R
R H
O
R R
O
R OR
O
RO
H
R H
HO
H
+ HO-
R H + RO-
R--
R--
Water
Alcohol
Aldehyde
Ester
Ketone

Grignard Reaction 76
II. Overview of Our ExperimentOur experiment is shown below. During week one we will generate the Grignard reagent (step one) and reactit with the ester (step two). During the second week we will neutralize the alkoxide (step three), isolate thealcohol, purify the alcohol by recrystallization, and do product analysis.
Br
2
Bromobenzenemw 157 g/mold: 1.49 g/mL
+ 2 Mg
24.3 g/mol
anhydrous
ether
MgBr
2
OCH3
O
1
Methyl Benzoatemw = 136 g/mold: 1.094 g/mL
O-
H+
OH
Triphenylmethanolmw=260.3 g/molmelting range: 164-165
2 PhBr
1. 2 Mg, ether2. 1 PhCO2CH3
3. H Ph Ph
OH
Ph
Summary

Grignard Reaction 77
Ph Br + Mg••
Ph• + Br-+ Mg+•
Ph:- + Br-+ Mg+2
Ph•
Ph-Ph
H2O
Ph-H + HO-
Two Principle Side Products
Note: No Water Allowed!Need water-free solvent and glassware!
Ph OCH3
O
Ph OCH3
O-
PhPh Ph
O
+ CH3O-
Ph:-
Ph Ph
O-
Ph
Unstable, EliminatesVery Rapidly
H+
Ph Ph
OH
PhWeek Two
Stable, SitsAround UntilProton Provided
Step One:Addition
Step Two:Elimination
Step Three:Addition
Step Four:Protonation
Once Ph- is made,
Four Steps:AdditionEliminationAdditionProtonation.
The overall mechanism is illustrated above. The carbanion is generated by electron transfer frommagnesium metal. The reactive carbanion then attacks electrophilic carbonyl to give an anionic intermediate(step one). This unstable intermediate rapidly eliminates a methoxide anion (step two). The resulting ketoneis attacked again (step three). The resulting anion waits patiently until next laboratory period, at which timeacid will be added to protonate the anion (step four).
Byproducts and Potential Problems There are two main byproducts and three problems.1. The first side product is biphenyl, Ph-Ph, which is formed in competition with the Grignard reagent
PhMgBr. Following initial electron transfer, the phenyl radical Ph• can either accept another electronleading to the desired carbanion, or combine with another phenyl radical to make biphenyl.
2. The second side product is benzene (Ph-H), resulting from protonation of the carbanion. Thecarbanion is supremely basic, so if there is any water in the solvent or in the glassware, or if moist air isallowed to enter the reaction mixture, some of the carbanion will be protonated. Great care is thusrequired to ensure “dry”, water-free conditions.
3. The third problem is getting the magnesium to actually do the electron transfers! Puremagnesium is an active metal, so active that any magnesium that has been exposed to air is inevitablycoated with a film of magnesium oxide on its surface. This oxide film blocks the bromobenzene fromactually contacting active magnesium, and thus prevents the requisite electron transfer. For a Grignardreaction to work, it is necessary that fresh active magnesium be exposed. Otherwise no electrontransfer from magnesium to bromobenzene can take place, no carbanion can be formed, and no reactionproceeds. We will use two techniques, iodine activation and physical crushing, to activate our magnesium.

Grignard Reaction 78
III. Procedure: Week OneNote: All equipment and reagents must be dry!
Phase 1: Preparing the Grignard Reagent1. Dig out the following pieces of glassware:
a. 250-mL round-bottomed flaskb. “Claisen” two-branched connecting adapter (piece #9 in your kit)c. reflux condenser (piece #12 in your kit)d. separatory funnel with stoppere. thermometer adapter (piece #7 in your kit)f. drying tube packed with calcium chlorideg. stick the drying tube into the rubber end of the thermometer adapter
2. Clamp the 250-mL round-bottomed flask to a vertical rod. If possible, use a clamp with grips that areeither pure metal or else have non-flammable white coating rather than gray rubber coating. (Rubberclamps will melt and stink when subjected to Bunsen-burner flame!)
3. Light your Bunsen burner and pass the flame over the flask until there is no more steam visible on thesurface of the glass.
4. As soon as the steam is gone from the flask, add the Claisen adapter to the flask and flame dry it as well5. As soon as the steam is gone from both the flask and the adapter, add the reflux condenser to the flask,
and flame dry as best you can. 6. While everything is still hot, attach the thermometer adapter with the drying tube into the top of the reflux
condenser, add the separatory funnel with it’s stopper on into the other arm of the Claisen adapter. • At this point, the interior should be entirely closed from wet air getting in. The separatory
funnel blocks out one side, and any air coming in through the column must pass through thedrying tube.
7. Weigh out about 2 grams of magnesium metal. (Record weight)8. When the glassware is cool enough to handle, add tubing to the condenser so that you can run a slow
stream of tap water through the condenser. Reassemble the array as quickly as possible.9. When the glassware is cool enough to handle, lift out the condenser and pour in the magnesium, then
replace the condenser as soon as possible. 10. Pour 15 mL of ether into the separatory funnel and put stopper back on. 11. Add one small chip of iodine (may ask the instructor to do this…) into the separatory funnel so that the
color turns pink. 12. Drain the ether/iodine solution into the round-bottomed flask.
• The iodine serves two functions. a. The first is as an indicator. The pink color will disappear when the magnesium is activated
and is able to do redox chemistry with bromobenzene. b. The second is as an activator. Iodine is sometimes able to chemically “clean” the surface of
the magnesium so that fresh, active magnesium is exposed so that it can do redox chemistrywith bromobenzene. However, it doesn’t always work!
• Make a mental picture of how much magnesium you have to begin with, so you canremember later on for comparison.
13. Measure out 9.0 mL of bromobenzene in a graduated cylinder. Record the volume as accurately aspossible. Pour this into the separatory funnel and drain this into the round-bottomed flask.
14. If the redox chemistry of the Grignard reaction initiates, the iodine color will go away, the solution willbegin to get hot, there will be some bubbling, and things may become slightly cloudy.
15. If there is no indication of reaction after two minutes, beg the instructor to come over to crush somemagnesium.
16. The instructor will use a glass rod to try to crush some of the pieces of magnesium firmly against thebottom of the flask. This will expose fresh, active magnesium that should be able to initiate the redoxchemistry and the formation of the Grignard reagent. Trying to crush very very hard magnesium piecesinside a glass flask is dangerous, though; it’s easily possible to punch a hole in the glass! So if somebodyis going to poke a hole in your flask, let it be the instructor so he can take the blame rather than doing ityourself!
17. Once the reaction has clearly initiated, get another 25-mL of ether, and pour this into the reaction throughthe separatory funnel. (The dilution minimizes formation of the side-product biphenyl, but the more diluteit is at the beginning, the harder it is to initiate the reaction. Thus we don’t want it too dilute until certainthat initiation has succeeded.)
Grignard Reaction 79
18. The reaction should be so exothermic that it will be self-boiling for some time. If the rate of boilingsubsides, apply a heating mantel (connected to the Variac, not directly to the wall outlet) and apply heat tomaintain a good rate of boiling.
19. Maintain boiling for one hour. • Note: notice how the reflux condenser works. The bottom flask can be boiling hot (which
facilitates maximum reaction rate), but the condenser enables you to liquify and recycle allof the boiling solvent.
• Keep good procedural and observational notes of everything that you see and do!
Phase 2: Things to do during the Grignard Hour…Once the reaction is clearly going, prepare for Phase 3, in which you will add the methyl benzoate esterelectrophile to the carbanion that you are making. And do the calculations that you will eventually need toinclude in your report.
1. Calculate what volume (in mL) it will take to add 5.0 grams of liquid methyl benzoate (density = 1.094g/mL).
2. Calculate the number of moles used for magnesium, bromobenzene, and methyl benzoate.3. Calculate the overall theoretical yield for your final product of next week, triphenylmethanol (mw =
260 g/mol). • To do this, you must first identify which if the three reactants (Mg, PhBr, or PhCO2CH3) is the
limiting reactant• To do this, you must factor in the overall stoichiometry, which is not all 1:1:1:1. (Given your
calculated moles of Mg, how many moles of Ph3COH could you make? Given your calculated molesof PhBr, how many moles of Ph3COH could you make? Given your calculated moles of PhCO2CH3,how many moles of Ph3COH could you make? )
• In calculating theoretical yield for a multistep reaction, theoretically every step will be perfect. (Weknow otherwise, but we’re talking theoretical yield here…) Thus you don’t need to calculate ormeasure quantities for any intermediates. Your limiting reactant and theoretical yield should consideronly original reactants and final product, all things which are easily quantified.
4. After the Grignard solution has reacted for one hour, check to see how much magnesium is left. Anyqualitative estimate of about how much is left? (None? 10%? 50%?) • What implications might this have on your possible yield? Is it necessary for all of your magnesium
to have reacted completely in order to get 100% yield? Or could you get 100% yield even if some ofyour magnesium remains unreacted?
Phase 3: Reacting the Grignard Reagent with the Methyl Benzoate1. After the hour is up, let the reaction cool down (an ice-water bath might help).2. Add 15 mL of ether to your separatory funnel. (Stopcock closed).3. Add 5.0 grams of methyl benzoate to your separatory funnel by syringe. (Remember, you calculated this
volume in Phase 2….) 4. Remove the cold bath (if you have one on), then drain the ester/ether solution into the round-bottomed
flask, slowly so that the reaction doesn’t overheat to much. Try to shake the solution around as much aspossible (hard to do when it’s clamped!) If things start to boil hard, reapply the cold bath. • Record your observations!
5. If everything is added without excessive boiling, try to shake everything up, and give it five minutes or soto continue reacting.
6. If the reaction is still hot, cool it with the ice bath.7. Remove all the glassware from the top of the round-bottomed flask, and stuff in a rubber stopper.
• Note: it is essential that the solution isn’t hot when you do this. If it is, then when it cools it willcreate a vacuum and suck the stopper in…)
• Note: it is essential that the vigorous exothermic reaction is done before you stopper the flask.Otherwise if stirring or further reaction generates enough heat, it will cause the ether to boil and blowthe stopper off!
8. Stash the round-bottomed flask with the chemicals and the stopper into a secure spot in your drawer, andwait till next lab to finish!
IV. Procedure: Week Two1. Record you observations for what your mixture looks like at this point.

Grignard Reaction 80
2. Remove the stopper, and add about 25 grams of ice and 50mL of 2M sulfuric acid• The acid will react exothermically with both the anion and unreacted magnesium. The ice is there
simply to absorb the heat. 3. Swirl well to promote hydrolysis and breakup of the solid clumps. Use a spatula to try to break up the
chunks. 4. In the process, three things should happen:
• The anion should be protonated, giving the neutral organic alcohol product. This should partition intothe organic ether layer.
• Magnsesium salts should be ionic, so they should partition into the aqueous layer.• Unreacted leftover magnesium metal will react with the acid to give molecular hydrogen. That’s what
causes the bubbling. (1 Mg + 2 H+ → Mg2+ + H2 gas)5. Pour the mixture into your separatory funnel. (The magnesium doesn’t need to be totally dissolved…)6. Pour an additional 10 mL of sulfurice acid and 10 mL of ether into your flask, swirl to try to dissolve up
anything left on the walls, and pour into the seperatory funnel. (These need not be measured, just poursome in approximately.)
7. Drain off the bottom aqueous layer into a beaker.8. Add another 20 mL of sulfuric acid into the separatory funnel, shake it up, and drain off the aqueous layer
again. Pour the combined aquous layers into the aqueous waste bottle in the hood.9. Drain the organic layer from the separatory funnel into an Erlenmeyer flask. 10. Add about 5 grams of sodium sulfate to “dry” the ether layer. Add additional scoops if the sodium
sulfate is all clumped up (indicating that there may be too much water for the sodium sulfate to handle). 11. Plug your long-stem funnel with a little glass wool, then pour the solutio12. Pour the ether solution through the glass-wool plugged funnel into a different Erlenmeyer flask. The wool
should be sufficient to filter off the solid sodium sulfate, and only allow the solution to get into the flask.Rinse your original flask and the sodium sulfate with an additional portion of ether.• At this point, your solution should be free of water and of magnesium salts. Other than the ether
solvent itself, you should have nothing but the desired product and organic contaminants.13. Make a TLC plate with five pencil marks for five tracks ready:
a. Authentic biphenyl b. Authentic methyl benzoate c. Crude mixtured. Purified mixture e. Post-crystallization solvent
14. Take a capillary droplet from your mixture, and put it on the “crude mixture” spot. Take droplets fromthe authentic biphenyl and methyl benzoate bottles in the hood and apply them as well. Save the plate untilyou’ve finished purifying the product, at which point you’ll be able to apply your last spot.
15. Add 25 mL of “ligroin” solvent (all hydrocarbons, mostly hexanes, but not pure) to your ether solution.The product is more soluble in ether than in hydrocarbons, so you are essentially adding some “badsolvent” to facilitate a mixed solvent recrystallization.
16. Prepare a little distillation chimney, by connecting a hose to your long-stemmed funnel. Connect the otherend of the hose to the aspirator outlet.
17. Add a boiling stick to your organic solution18. Now heat your solution on a hot plate. Place the funnel over the top of your flask, and run the aspirator.
This will cause the boiling ether to get sucked away.19. Boil the solution down to 25-30 mL or so. (Crystals should start to form before this, depending on your
yield. But if you stop boiling as soon as the first crystals form, you’ll still have too much solvent and willget a low yield.)
20. Remove from heat, and let cool slowly to grow your crystals, first to room temperature and then to 0ºC. 21. Filter your crystals with Buchner funnel and aspirator. 22. Take a droplet from the solvent and put it on the tlc plate in the “post-crystallization solvent” spot23. Take about 0.1 grams of your crystals (needn’t be bone dry) and dissolve in 3 mL of ether. Then take a
capillary and put a droplet of this purified material onto your tlc plate in the “purified” spot.24. Run the tlc in designated solvent (2% ethyl acetate/hexane?), and analyze by UV and the “dip” solution.
• Mark down the results, with the following questions in mind:o Is biphenyl present in the crude mix? In the purified material?o Is methyl benzoate present in the crude mix? In the purified material?o Did recrystallization purify the material at all? o Did crystallization get all of the product out of the solvent?
25. Take a melting range on your final product. (Should melt above 150º, so heat accordingly)26. Get your final mass.
Grignard Reaction 81
Lab Report Requirements and Format: The following layout is standard for a “synthesis reaction” report.Provide the parts and information in the sequence specified.
1. Title = Reaction SummaryFor an organic reaction, there is no point in having aWorded Title: The chemical reaction is the best titlesummary of what you did!
2. Listing of all Chemicals Used• This should include all chemicals used, including
solvents. • For each chemical, you should include the actual quantity used and measured. For example, with the
methyl benzoate you measured a volume by syringe, rather than by weighing on a balance. So you shouldlist the volume you actually used rather than just the weight.
• If a person was later to repeat your experiment, they should be able to look at this list and know all thechemicals they’d need to have on hand and in what quantities, in order to complete the experiment.
• In some cases, there may be considerable roundoff (you needn’t keep precise record of the quantity ofsolvent that was used, for example, or of sodium sulfate drying agent…)
• For reactants that might possibly be limiting reactants and might possibly factor into calculation of thetheoretical yield, however, you must include more than just the quantity of chemical used. You shouldalso include a conversion from what you measured into the number of moles used.
3. Calculation of Theoretical Yield• Specify which chemical is the limiting reactant• Given moles of limiting reactant, calculate theoretical moles of product• Given moles of product, calculate theoretical grams of product. • Note: Why do this so early in report?
o First, because it fits in near your mole calculations above. o Second, if calculated in advance, as with most research, you know which chemical is limiting and
thus must be measured most carefully, but you also know which are in excess and thus need not bemeasured with equal precision.
o Third, it’s nice to know approximately how much material is expected, so you can ecognizewhether your actual results are reasonable or way off.
4. Writeup of Actual Procedure.• For this particular experiment, the “procedure” section will be by far the biggest portion of your report.• This should be a concise but detailed description of things, including:
o What you actually did (even if not recommended or not from recipe)o All observations should be included. These include all observed changes, such as:
Changes in color Changes in solubility (formation of precipitate or cloudiness…) Formation of bubbles Changes in temperature (like, reaction became hot…)
o Time and temperature details: Whenever you heat something or cool something, the procedure should specify Specify times. Whether you boiled for 5 minutes or 5 hours matters!
• Writing details: As a record of what actually happened, the report must be written in past tense, notcommand tense. (Rather than “Add this”, should read “I added this”, or “I dropped that…”)
o Use of personal pronouns is accepted in this class. (Teachers in other classes may have differentrequirements). But you are not obligated to avoid references to “I” or “we” in this class.
5. Product Analysis• Any NMR, mp, bp, TLC information. For this report, mp and TLC information must be included.• Final yield and percent yield information.
6. Discussion/Summary. Need not be long, but any conclusions or excuses would go here…
7. Answers to any assigned Questions
2 PhBr
1. 2 Mg, ether2. 1 PhCO2CH3
3. H Ph Ph
OH
Ph
Summary
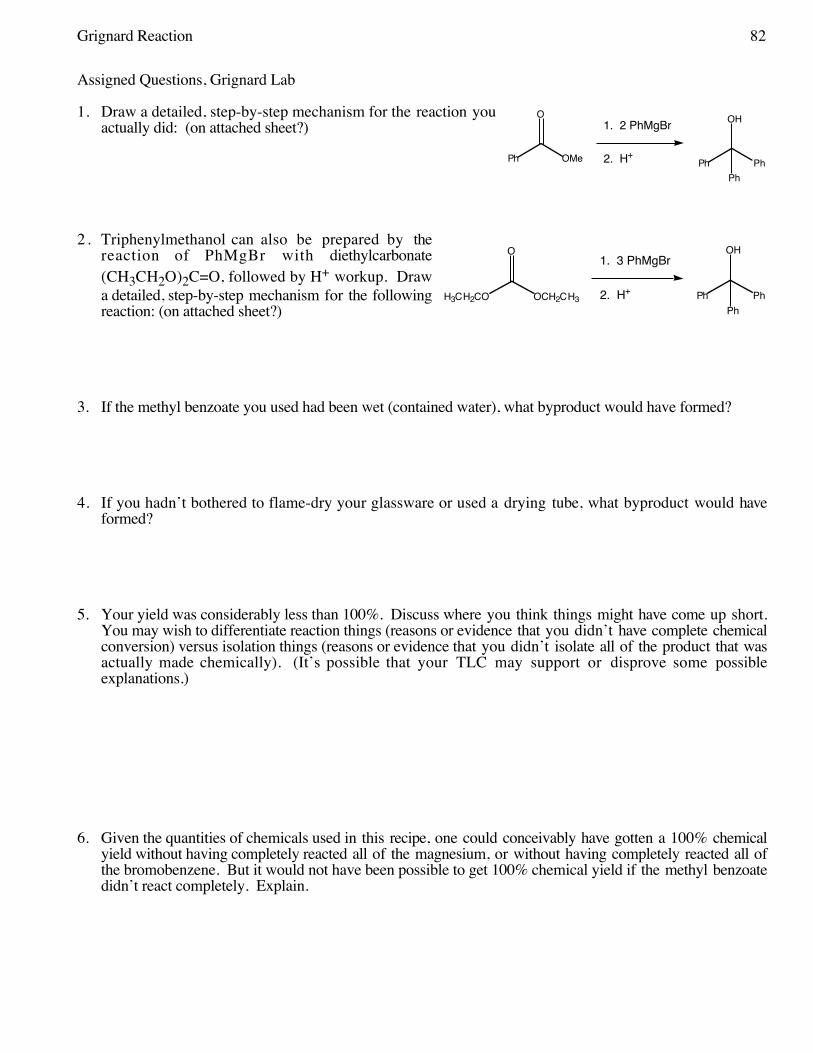
Grignard Reaction 82
Assigned Questions, Grignard Lab
1. Draw a detailed, step-by-step mechanism for the reaction youactually did: (on attached sheet?)
2 . Triphenylmethanol can also be prepared by thereaction of PhMgBr with diethylcarbonate(CH3CH2O)2C=O, followed by H+ workup. Drawa detailed, step-by-step mechanism for the followingreaction: (on attached sheet?)
3. If the methyl benzoate you used had been wet (contained water), what byproduct would have formed?
4. If you hadn’t bothered to flame-dry your glassware or used a drying tube, what byproduct would haveformed?
5. Your yield was considerably less than 100%. Discuss where you think things might have come up short.You may wish to differentiate reaction things (reasons or evidence that you didn’t have complete chemicalconversion) versus isolation things (reasons or evidence that you didn’t isolate all of the product that wasactually made chemically). (It’s possible that your TLC may support or disprove some possibleexplanations.)
6. Given the quantities of chemicals used in this recipe, one could conceivably have gotten a 100% chemicalyield without having completely reacted all of the magnesium, or without having completely reacted all ofthe bromobenzene. But it would not have been possible to get 100% chemical yield if the methyl benzoatedidn’t react completely. Explain.
Ph OMe
O1. 2 PhMgBr
2. H+Ph Ph
OH
Ph
H3CH2CO OCH2CH3
O1. 3 PhMgBr
2. H+ Ph Ph
OH
Ph
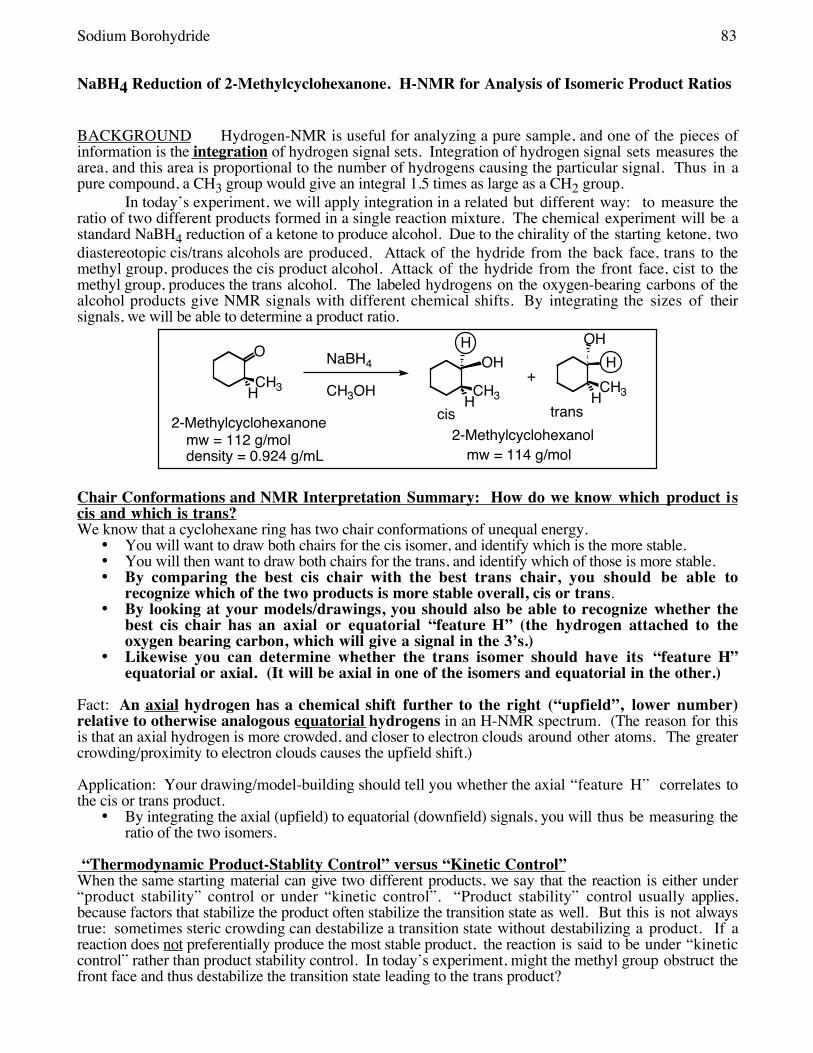
Sodium Borohydride 83
NaBH4 Reduction of 2-Methylcyclohexanone. H-NMR for Analysis of Isomeric Product Ratios
BACKGROUND Hydrogen-NMR is useful for analyzing a pure sample, and one of the pieces ofinformation is the integration of hydrogen signal sets. Integration of hydrogen signal sets measures thearea, and this area is proportional to the number of hydrogens causing the particular signal. Thus in apure compound, a CH3 group would give an integral 1.5 times as large as a CH2 group.
In today’s experiment, we will apply integration in a related but different way: to measure theratio of two different products formed in a single reaction mixture. The chemical experiment will be astandard NaBH4 reduction of a ketone to produce alcohol. Due to the chirality of the starting ketone, twodiastereotopic cis/trans alcohols are produced. Attack of the hydride from the back face, trans to themethyl group, produces the cis product alcohol. Attack of the hydride from the front face, cist to themethyl group, produces the trans alcohol. The labeled hydrogens on the oxygen-bearing carbons of thealcohol products give NMR signals with different chemical shifts. By integrating the sizes of theirsignals, we will be able to determine a product ratio.
O
CH3
OH
CH3
HCH3
H OH
H H H
NaBH4
CH3OH+
cis trans2-Methylcyclohexanone
2-Methylcyclohexanolmw = 112 g/moldensity = 0.924 g/mL mw = 114 g/mol
Chair Conformations and NMR Interpretation Summary: How do we know which product iscis and which is trans?We know that a cyclohexane ring has two chair conformations of unequal energy.
• You will want to draw both chairs for the cis isomer, and identify which is the more stable. • You will then want to draw both chairs for the trans, and identify which of those is more stable. • By comparing the best cis chair with the best trans chair, you should be able to
recognize which of the two products is more stable overall, cis or trans. • By looking at your models/drawings, you should also be able to recognize whether the
best cis chair has an axial or equatorial “feature H” (the hydrogen attached to theoxygen bearing carbon, which will give a signal in the 3’s.)
• Likewise you can determine whether the trans isomer should have its “feature H”equatorial or axial. (It will be axial in one of the isomers and equatorial in the other.)
Fact: An axial hydrogen has a chemical shift further to the right (“upfield”, lower number)relative to otherwise analogous equatorial hydrogens in an H-NMR spectrum. (The reason for thisis that an axial hydrogen is more crowded, and closer to electron clouds around other atoms. The greatercrowding/proximity to electron clouds causes the upfield shift.)
Application: Your drawing/model-building should tell you whether the axial “feature H” correlates tothe cis or trans product.
• By integrating the axial (upfield) to equatorial (downfield) signals, you will thus be measuring theratio of the two isomers.
“Thermodynamic Product-Stablity Control” versus “Kinetic Control”When the same starting material can give two different products, we say that the reaction is either under“product stability” control or under “kinetic control”. “Product stability” control usually applies,because factors that stabilize the product often stabilize the transition state as well. But this is not alwaystrue: sometimes steric crowding can destabilize a transition state without destabilizing a product. If areaction does not preferentially produce the most stable product, the reaction is said to be under “kineticcontrol” rather than product stability control. In today’s experiment, might the methyl group obstruct thefront face and thus destabilize the transition state leading to the trans product?

Sodium Borohydride 84
Experimental Procedure1. To a large test tube, add 4 mL (or two full pipet squirts) of methanol2. Add 0.9 mL of 2-methylcyclohexanone.
• Use density and molecular weight information to calculate how many moles are involved• density = 0.924 g/mL• mw = 112 g/mol)
3. Prepare an ice-water bath in your 150-mL beaker4. Place the test tube into the ice-water bath5. Weigh out 0.15 g of NaBH4 (mw = 38 g/mol)6. Carefully add the NaBH4 to the test-tube. (The NaBH4 is in excess, so if some sticks on the walls of
the tube, it isn’t a problem).7. After the vigorous bubbling subsides, remove the test tube from the icewater and let it stand at room
temperature for 20 minutes.8. Clamp your smallest iron ring to a vertical rod, and insert your separatory funnel9. Pour your test tube solution into the separatory funnel10. Rinse test tube with an additional two pipets of dichloromethane and add this to the separatory funnel11. Add two pipets of tap water, and then two full pipets of 3 M sodium hydroxide solution (purpose: to
decompose the borate salts and move them into the aqueous phase)12. Shake the mixture, then let it settle
• Question: which layer is organic and which is aqueous? If in doubt, add some addition water andwatch to see which layer it falls into, and which layer grows!
13. Drain the dichloromethane layer into a 50-mL Erlenmeyer flask14. Wash the aqueous layer in the sep funnel with an additional pipet of dichloromethane, let settle, and
drain the organic layer into the Erlenmeyer flask.15. Repeat the last step again.16. Add a large scoop of anhydrous sodium sulfate to the Erlenmeyer flask to “dry” your organic
solvent. If the sodium sulfate all clumps, add more until at least some does not clump up. 17. Pre-weigh a 50-mL round-bottomed flask, and then clamp it onto a vertical rod.18. Take your long stem funnel and push a little glass wool into the neck.19. Pour the organic solution from the Erlenmeyer through the funnel into the round-bottomed flask.
The wool should be sufficient to filter off the solid sodium sulfate, and only allow the solution to getinto the flask.
20. Rinse the Erlenmeyer with additional dichloromethane, and pour the rinse through the funnel into theround-bottomed flask.
21. At this point, there should be only dichloromethane and alcohol products in your flask.22. Concentrate the organic solution by rotary evaporation. Be sure the aspirator power is on; that the top
air valve is closed; and that you have an adapter for a good glass seal. Make sure that the spinner isalso turned on.
23. Once the sample has concentrated to a residual oil, weight the flask and calculate your mass yield.24. Prepare and run an NMR.
Model Building (Can share this groups of students.)1. Build a model of both cis and trans 2-methylcyclohexanol.2. Chair-flip both3. For the cis isomer, which chair if more stable? 4. In the more stable cis chair, is the “feature hydrogen” axial or equatorial?5. For the trans isomer, which chair is more stable?6. In the more stable trans chair, is the “feature hydrogen” axial or equatorial?7. Which is more stable, the best cis chair or the best trans chair?8. Draw your best cis and best trans chairs.
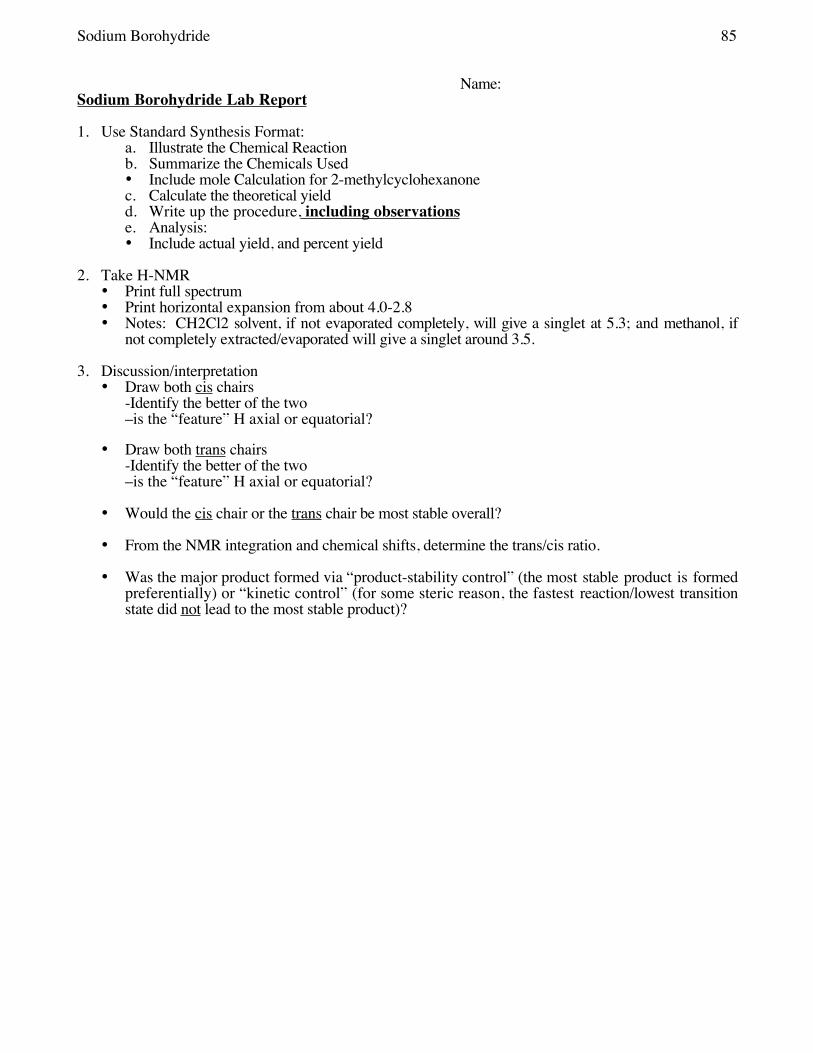
Sodium Borohydride 85
Name: Sodium Borohydride Lab Report
1. Use Standard Synthesis Format:a. Illustrate the Chemical Reactionb. Summarize the Chemicals Used• Include mole Calculation for 2-methylcyclohexanonec. Calculate the theoretical yieldd. Write up the procedure, including observationse. Analysis: • Include actual yield, and percent yield
2. Take H-NMR• Print full spectrum• Print horizontal expansion from about 4.0-2.8• Notes: CH2Cl2 solvent, if not evaporated completely, will give a singlet at 5.3; and methanol, if
not completely extracted/evaporated will give a singlet around 3.5.
3. Discussion/interpretation• Draw both cis chairs
-Identify the better of the two–is the “feature” H axial or equatorial?
• Draw both trans chairs-Identify the better of the two–is the “feature” H axial or equatorial?
• Would the cis chair or the trans chair be most stable overall?
• From the NMR integration and chemical shifts, determine the trans/cis ratio.
• Was the major product formed via “product-stability control” (the most stable product is formedpreferentially) or “kinetic control” (for some steric reason, the fastest reaction/lowest transitionstate did not lead to the most stable product)?

Sodium Borohydride 86
H-NMR Interpretation 87
Summary of 1H-NMR Interpretation
I. Number of Signal SetsII. “Chemical Shifts” of the Signal Sets
9’s (9.0-10.0) Aldehyde sp2 hybridized C-H’s
7’s (6.5-8.4) Aromatic sp2 hybridized C-H’s
5’s (4.8-6.8) Alkene sp2 hybridized C-H’s
3’s (2.8-4.5) Oxygenated or Halogenated sp3 hybridized C-H’s (halogenated andnitrogenated alkyl C-H’s will also come in this window, although nocandidates for today’s lab). Oxygenated sp3–carbons are routinely present forthe following functional groups that contain oxygen single bonds:• alcohols,• ethers, or• esters
2’s (1.8-2.8) Allylic sp3 hybridized C-H’s (sp3 hybridized C-H’s that has a double bondattached to the sp3 hybridized C). Allylic signals routinely appear when one ofthe following double-bonded functional groups is present:• carbonyls, (ketones, esters, aldehydes, acids, amides)• alkenes, or• aromatics
1’s (0.7-2.0) sp3 hybridized C-H’s, with no attached Functional Groups• Note: Many molecules with non-functional alkyl portions will give a lot
of signal in this area.
0-12 (anywhere!) Alcohol/Acid O-H hydrogens (N-H hydrogens likewise)• alcohols,• carboxylic acids
8. Recognize OH’s.. Check each of the zones. Each one gives you a yes or no answer about the presence of absence of thefeatured group. 9. End-Check: Check that the functional groups indicated by your chemical shift information match with
the structure you believe you actually have! If not, structure needs correction!10. The regions are somewhat approximate, and have some spillover. 11. For multi-functional complex molecules, there are more complex ways for a C-H to come in some of the
above window. For example, an sp3-hybridized C-H with two attached oxygens can come in the 5’s, oran sp3-hybridized C-H that is doubly allylic can come in the 3’s. In other words, the impact offunctional groups is roughly additive.
III. Integration These must be simple whole-number ratios (2:1, 3:1, 3:2, etc..)
IV. Splitting N-1 Rule: N lines ⇒ N-1 neighbor H’s (H’s directly attached to carbons attached to the C-H
group causing the signal)• The N-1 Rule is useful when working from spectrum to actual structure
N+1 Rule: N neighbor H’s ⇒ N+1 lines• The N+1 Rule is useful when working from structure to actual spectrum
Note: OH hydrogens don’t participate in splitting (normally)
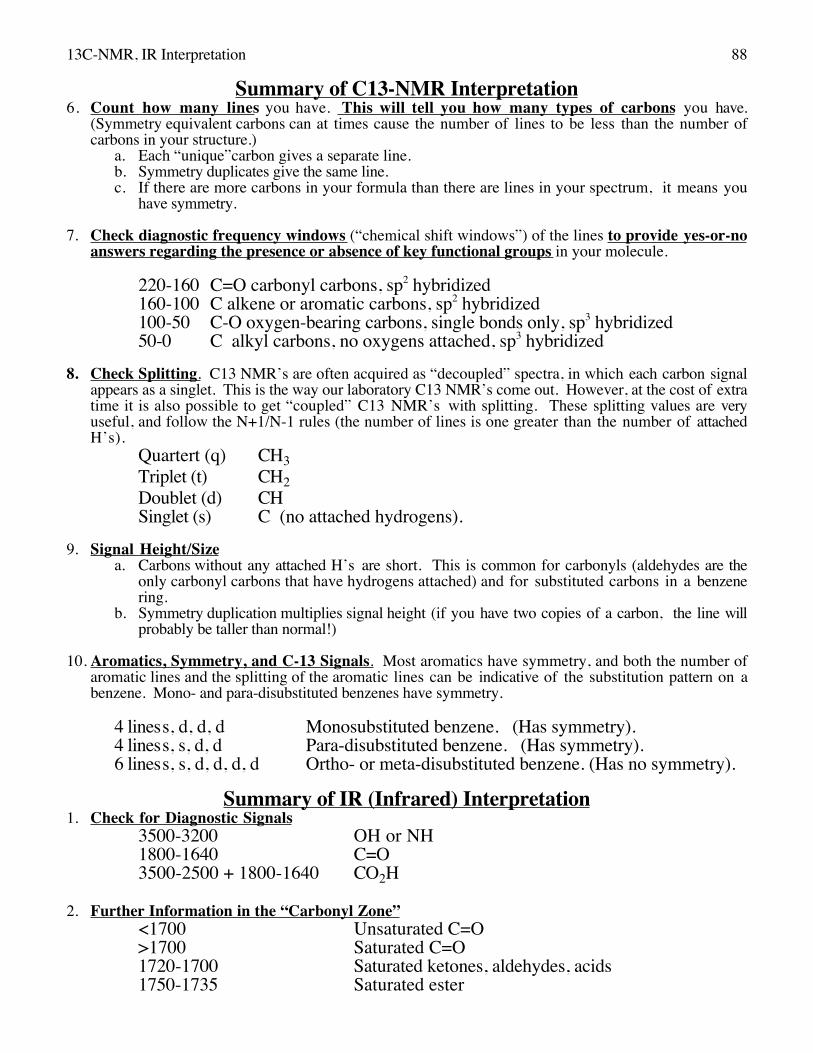
13C-NMR, IR Interpretation 88
Summary of C13-NMR Interpretation6. Count how many lines you have. This will tell you how many types of carbons you have.
(Symmetry equivalent carbons can at times cause the number of lines to be less than the number ofcarbons in your structure.)
a. Each “unique”carbon gives a separate line.b. Symmetry duplicates give the same line.c. If there are more carbons in your formula than there are lines in your spectrum, it means you
have symmetry.
7. Check diagnostic frequency windows (“chemical shift windows”) of the lines to provide yes-or-noanswers regarding the presence or absence of key functional groups in your molecule.
220-160 C=O carbonyl carbons, sp2 hybridized160-100 C alkene or aromatic carbons, sp2 hybridized100-50 C-O oxygen-bearing carbons, single bonds only, sp3 hybridized50-0 C alkyl carbons, no oxygens attached, sp3 hybridized
8. Check Splitting. C13 NMR’s are often acquired as “decoupled” spectra, in which each carbon signalappears as a singlet. This is the way our laboratory C13 NMR’s come out. However, at the cost of extratime it is also possible to get “coupled” C13 NMR’s with splitting. These splitting values are veryuseful, and follow the N+1/N-1 rules (the number of lines is one greater than the number of attachedH’s).
Quartert (q) CH3Triplet (t) CH2Doublet (d) CHSinglet (s) C (no attached hydrogens).
9. Signal Height/Sizea. Carbons without any attached H’s are short. This is common for carbonyls (aldehydes are the
only carbonyl carbons that have hydrogens attached) and for substituted carbons in a benzenering.
b. Symmetry duplication multiplies signal height (if you have two copies of a carbon, the line willprobably be taller than normal!)
10. Aromatics, Symmetry, and C-13 Signals. Most aromatics have symmetry, and both the number ofaromatic lines and the splitting of the aromatic lines can be indicative of the substitution pattern on abenzene. Mono- and para-disubstituted benzenes have symmetry.
4 liness, d, d, d Monosubstituted benzene. (Has symmetry).4 liness, s, d, d Para-disubstituted benzene. (Has symmetry). 6 liness, s, d, d, d, d Ortho- or meta-disubstituted benzene. (Has no symmetry).
Summary of IR (Infrared) Interpretation1. Check for Diagnostic Signals
3500-3200 OH or NH1800-1640 C=O3500-2500 + 1800-1640 CO2H
2. Further Information in the “Carbonyl Zone”<1700 Unsaturated C=O>1700 Saturated C=O1720-1700 Saturated ketones, aldehydes, acids1750-1735 Saturated ester

Standard Synthesis Laboratory Report Format 89
Standard Synthesis Laboratory Report Format: The following layout is standard for a “synthesisreaction” report. Provide the parts and information in the sequence specified.
1. Title = Reaction SummaryFor an organic reaction, there is no point in having aWorded Title: The chemical reaction is the best titlesummary of what you did!
2. Listing of all Chemicals Used• This should include all chemicals used, including
solvents. • For each chemical, you should include the actual quantity used and measured. For example, with the
methyl benzoate you measured a volume by syringe, rather than by weighing on a balance. So youshould list the volume you actually used rather than just the weight.
• For reactants that might possibly be limiting reactants and might possibly factor into calculation of thetheoretical yield, you must include more than just the quantity of chemical used. You should also includea conversion from what you measured into the number of moles used.
• In some cases, there may be considerable roundoff (you needn’t keep precise record of the quantity ofsolvent that was used, for example, or of sodium sulfate drying agent…)
• If a person was later to repeat your experiment, they should be able to look at this list and know all thechemicals they’d need to have on hand and in what quantities, in order to complete the experiment.
3. Calculation of Theoretical Yield• Specify which chemical is the limiting reactant• Given moles of limiting reactant, calculate theoretical moles of product• Given moles of product, calculate theoretical grams of product. • Note: Why do this so early in report?
o First, because it fits in near your mole calculations above. o Second, if calculated in advance. as with most research, you know which chemical is limiting and
thus must be measured most carefully, but you also know which are in excess and thus need notbe measured with equal precision.
o Third, it’s nice to know approximately how much material is expected, so you can recognizewhether your actual results are reasonable or problematic.
4. Writeup of Actual Procedure.• For this particular experiment, the “procedure” section will be by far the biggest portion of your report.• This should be a concise but detailed description of things, including:
o What you actually did (even if not recommended or not from recipe)o All observations should be included. These include all observed changes, such as:
Changes in color Changes in solubility (formation of precipitate or cloudiness…) Changes in temperature (like, reaction became hot…) Formation of bubbles
o Time and temperature details: Whenever you heat something or cool something, the procedure should specify Specify times. Whether you boiled for 5 minutes or 5 hours matters!
• Writing details: As a record of what actually happened, the report must be written in past tense, notcommand tense. (Rather than “Add this”, should read “I added this”, or “I dropped that…”)
o Use of personal pronouns is accepted in this class. You may use “I” or “we” to simplifywriting.
5. Product Analysis• Any NMR, mp, bp, TLC information. For this report, mp and TLC information must be included.• Final yield and percent yield information.
6. Discussion/Summary. Need not be long, but any conclusions or excuses would go here…
7. Answers to any assigned Questions
2 PhBr
1. 2 Mg, ether2. 1 PhCO2CH3
3. H Ph Ph
OH
Ph
Summary

Standard Synthesis Laboratory Report Format 90
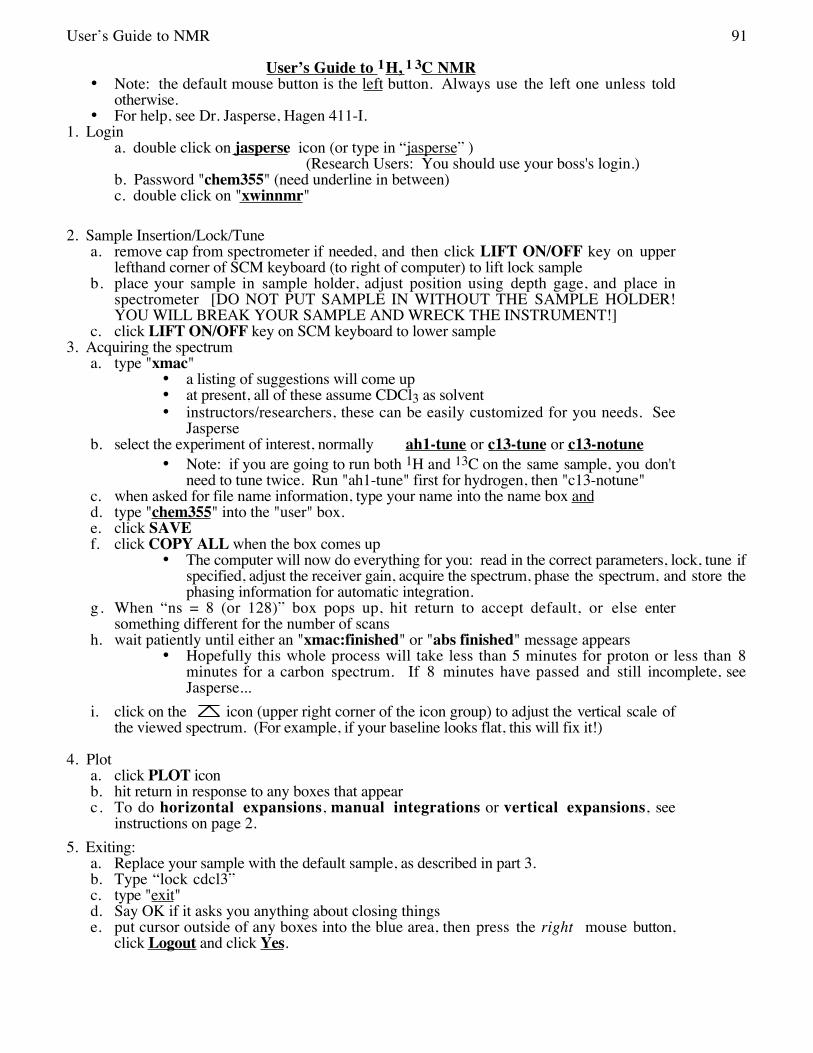
User’s Guide to NMR 91
User’s Guide to 1H, 1 3C NMR• Note: the default mouse button is the left button. Always use the left one unless told
otherwise.• For help, see Dr. Jasperse, Hagen 411-I.
1. Logina. double click on jasperse icon (or type in “jasperse” )
(Research Users: You should use your boss's login.)b. Password "chem355" (need underline in between)c. double click on "xwinnmr"
2. Sample Insertion/Lock/Tunea. remove cap from spectrometer if needed, and then click LIFT ON/OFF key on upper
lefthand corner of SCM keyboard (to right of computer) to lift lock sampleb. place your sample in sample holder, adjust position using depth gage, and place in
spectrometer [DO NOT PUT SAMPLE IN WITHOUT THE SAMPLE HOLDER!YOU WILL BREAK YOUR SAMPLE AND WRECK THE INSTRUMENT!]
c. click LIFT ON/OFF key on SCM keyboard to lower sample 3. Acquiring the spectrum
a. type "xmac"• a listing of suggestions will come up• at present, all of these assume CDCl3 as solvent• instructors/researchers, these can be easily customized for you needs. See
Jasperseb. select the experiment of interest, normally ah1-tune or c13-tune or c13-notune
• Note: if you are going to run both 1H and 13C on the same sample, you don'tneed to tune twice. Run "ah1-tune" first for hydrogen, then "c13-notune"
c. when asked for file name information, type your name into the name box andd. type "chem355" into the "user" box. e. click SAVEf. click COPY ALL when the box comes up
• The computer will now do everything for you: read in the correct parameters, lock, tune ifspecified, adjust the receiver gain, acquire the spectrum, phase the spectrum, and store thephasing information for automatic integration.
g. When “ns = 8 (or 128)” box pops up, hit return to accept default, or else entersomething different for the number of scans
h. wait patiently until either an "xmac:finished" or "abs finished" message appears• Hopefully this whole process will take less than 5 minutes for proton or less than 8
minutes for a carbon spectrum. If 8 minutes have passed and still incomplete, seeJasperse...
i. click on the icon (upper right corner of the icon group) to adjust the vertical scale ofthe viewed spectrum. (For example, if your baseline looks flat, this will fix it!)
4. Plota. click PLOT iconb. hit return in response to any boxes that appearc. To do horizontal expansions, manual integrations or vertical expansions, see
instructions on page 2. 5. Exiting:
a. Replace your sample with the default sample, as described in part 3. b. Type “lock cdcl3”c. type "exit"d. Say OK if it asks you anything about closing thingse. put cursor outside of any boxes into the blue area, then press the right mouse button,
click Logout and click Yes.

User’s Guide to NMR 92
1. Plotting Horizontal Expansionsa. Make sure that the cursor is somewhere on the spectrum.b. Click the left mouse button. You will now get a doubled arrow.c. Move the doubled arrow to the left end of the area you want to expand and click the
center mouse button do define the left boundary.d. Move the doubled arrow to the right end of the area you want to expand and again click
the center mouse button to define the right boundary.e. click PLOT icon
f. To get back to the full expansion, click the icong. To get out of the "doubled arrow" mode, click the left mouse button
2. Manual Integrationa. click INTEGRATEb. define the regions of interest (see horizontal expansion instructions above)c. click RETURN and save your integral regions
• Sometimes you may wish to improve the “flatness” of the integral, or you may wishto assign calibration values of your own choosing. Do the following:
d. put the arrow within the region of your integral, and click the left mouse button. Theintegral under consideration will then get a star by it.
e. click CALIBRATE and respond accordinglyf. adjust the BIAS in order to get the left side of the integral levelg. then adjust the SLOPE to get the right side of the integral level
3. Reducing the noise in noisy, dilute 13C spectra. "Power Spectrum" . [Do not use for 1H spectra!]
a. After getting the normal spectrum, type "ps" b. click on the icon (upper right corner of the icon group) to adjust the vertical scale of
the viewed spectrum.c. click PLOT icon
• Note: The "ps" command can make plots look prettier, by de-emphasizing noise. It doesso by squaring all signals, however, so it will also de-emphasize small peaks that are real.In addition, by changing the relative sizes of peaks, it is incompatible with integration.
4. Vertical Expansions a. Type "cy" and increase or decrease the default value as you see fit. Doubling will double
the printed heights, tripling will triple the printed heights, etc. • At default, cy=14, and is set so that the tallest peak in the spectrum will be 14cm tall.
Thus, if you are wanting to expand a peak that is too tall, you need to multiply the cy asneeded.
5. Manual Phasing
a. click PHASEb. Click BIGGESTc. Click PHO, and keep finger held downd. -drag, to adjust phase of biggest, marked peake. Click PH1, and keep finger held downf. -drag, to adjust phase of peaks distant from biggestg. click RETURNh. type "abs" if you want integrations to be automatically printed as a result
6. Printing Titlesa. type “setti” (for “set title”) b. delete existing title and type in new onec. click save d. click quit e. type “title” f. choose yes

User’s Guide to NMR 93
Related Documents