CHARTS GRAPHS DIAGRAMS

Charts, Graphs, Diagrams
Dec 21, 2015
All about Charts, Graphs, Diagrams in educational technology
Welcome message from author
This document is posted to help you gain knowledge. Please leave a comment to let me know what you think about it! Share it to your friends and learn new things together.
Transcript
CHARTSGRAPHS
DIAGRAMS
ETYMOLOGY
DEFINITION
HISTORY
TYPES
ETYMOLOGY
DEFINITION
HISTORY
TYPES
ETYMOLOGY
DEFINITION
HISTORY
TYPES
ADVANTAGES
DISADVANTAGES
ETYMOLOGY
c.1200, from Old French chartre (12c.) "charter, letter, document, covenant," from Latin chartula, literally "little paper," diminutive of charta, carta "paper, document“.
DEFINITION
- Graphical representation of data, in which the data is represented by symbols, such as bars, lines or slices.
- Can represent tabular numeric data, functions or some kinds of qualitative structure and provides different information.

HISTORY
• Many sources credit William Playfair (circa 1780) with inventing the bar chart, however a Frenchman, Nicole Oresme used a bar chart in a 14th century publication, "The Latitude of Forms", to plot velocity of a constantly accelerating object against time.
• Moving on 20 years and we finally get to William Playfair who again utilised bar charts in his publication to show imports/exports of Scotland. This is the first example of numerical data being split into discrete groups and plotted as bars and hence the reason William is credited with the invention of the bar chart.
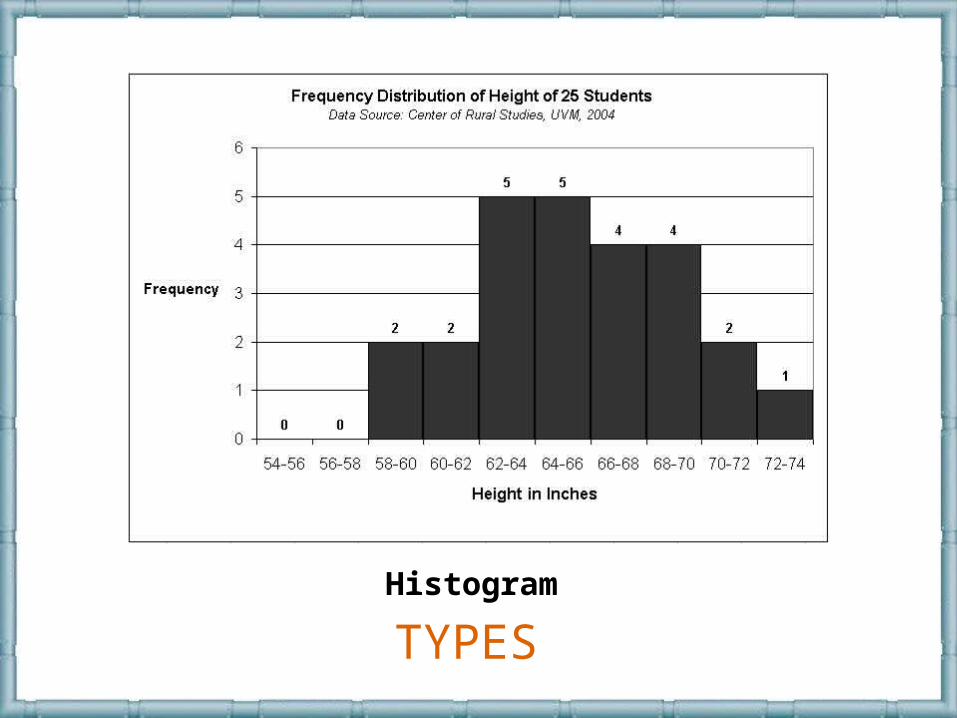
TYPESHistogram
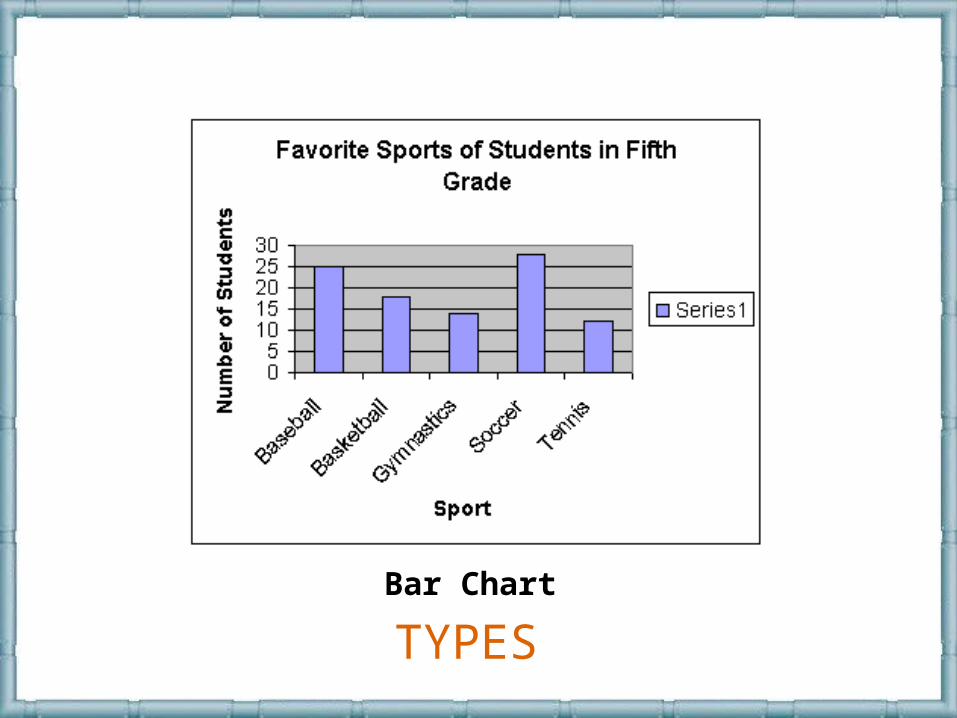
TYPESBar Chart
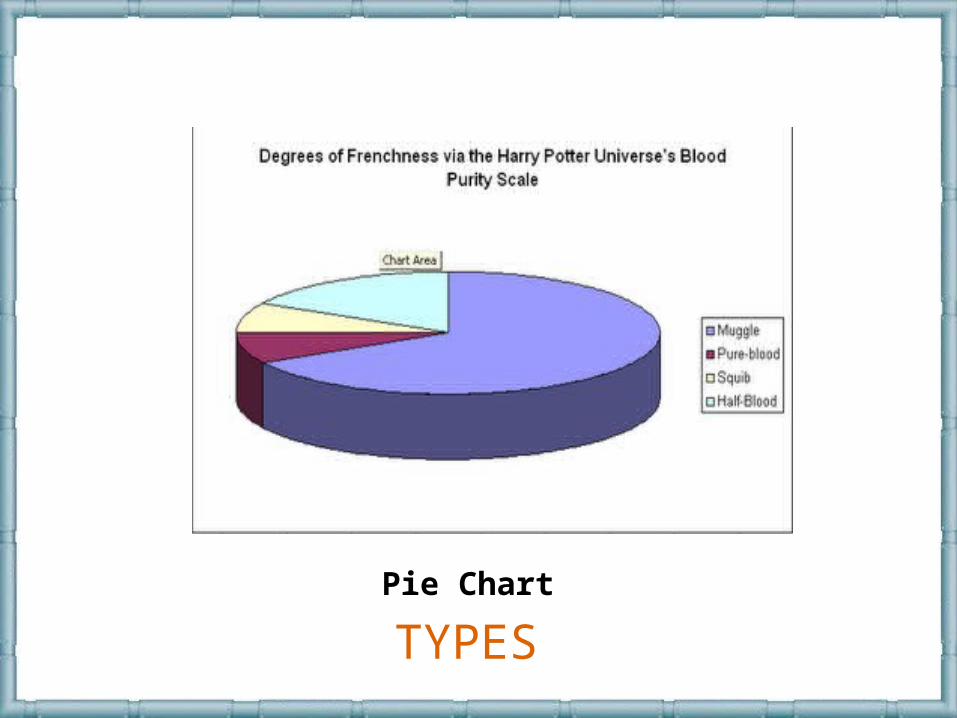
TYPESPie Chart
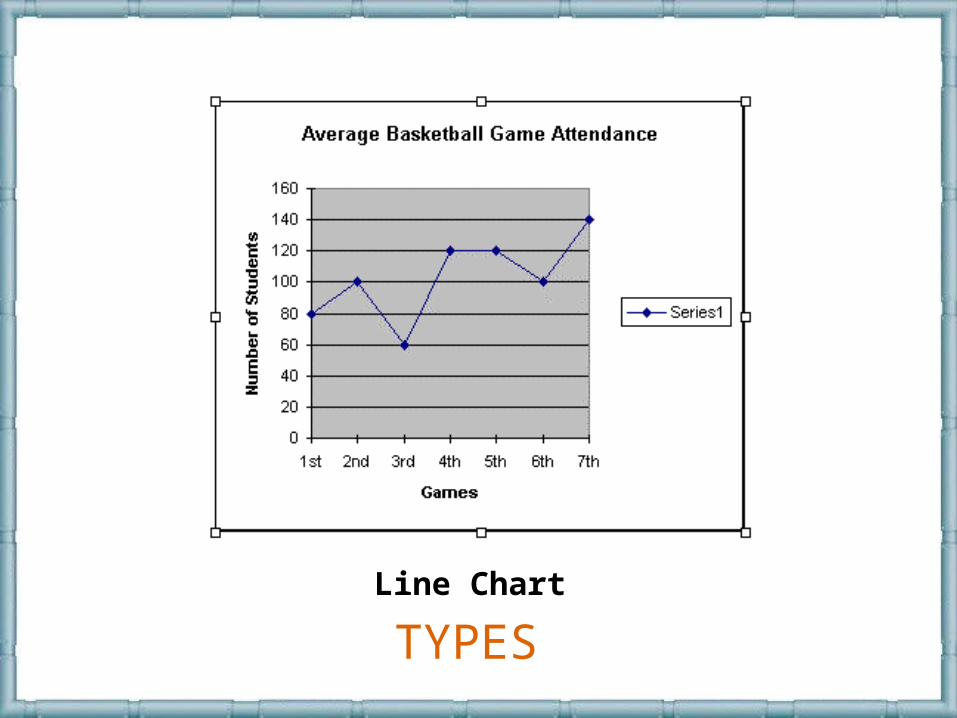
TYPESLine Chart
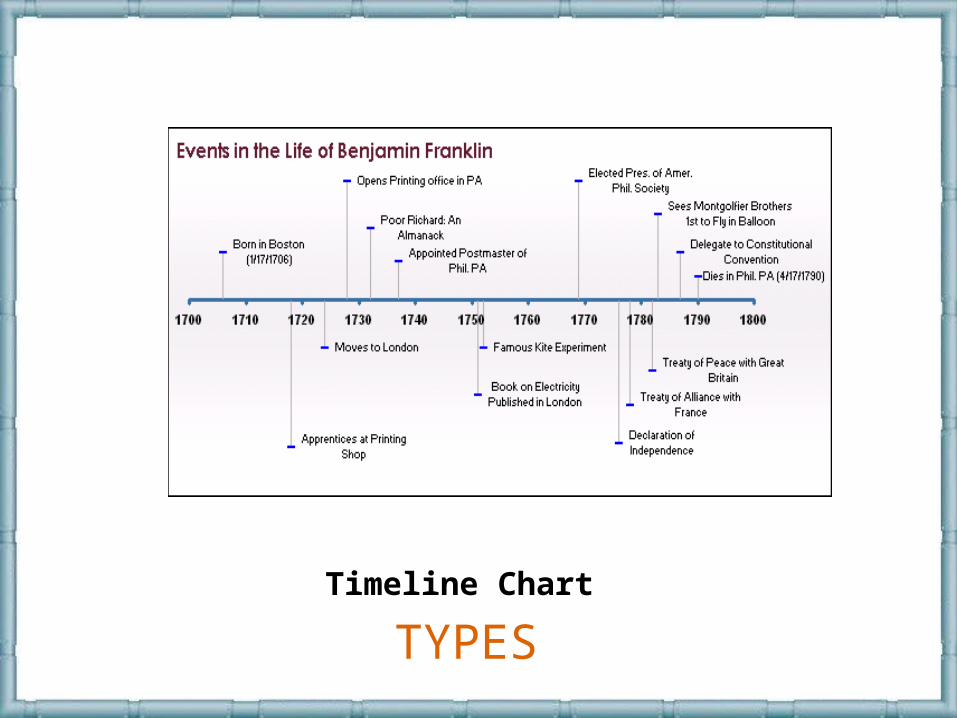
TYPESTimeline Chart
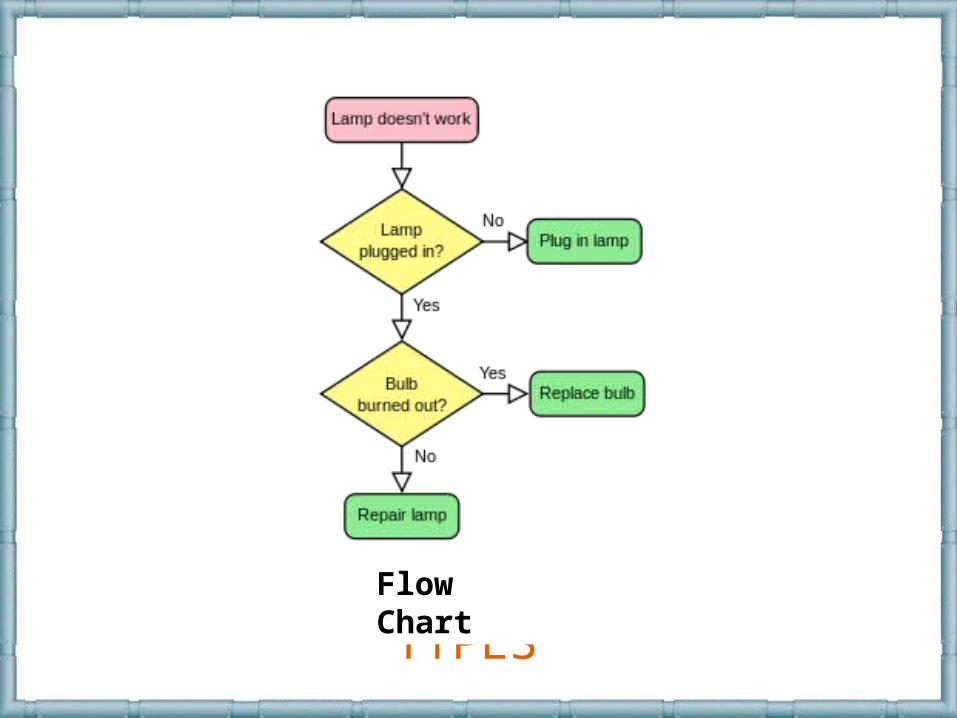
TYPESFlow Chart
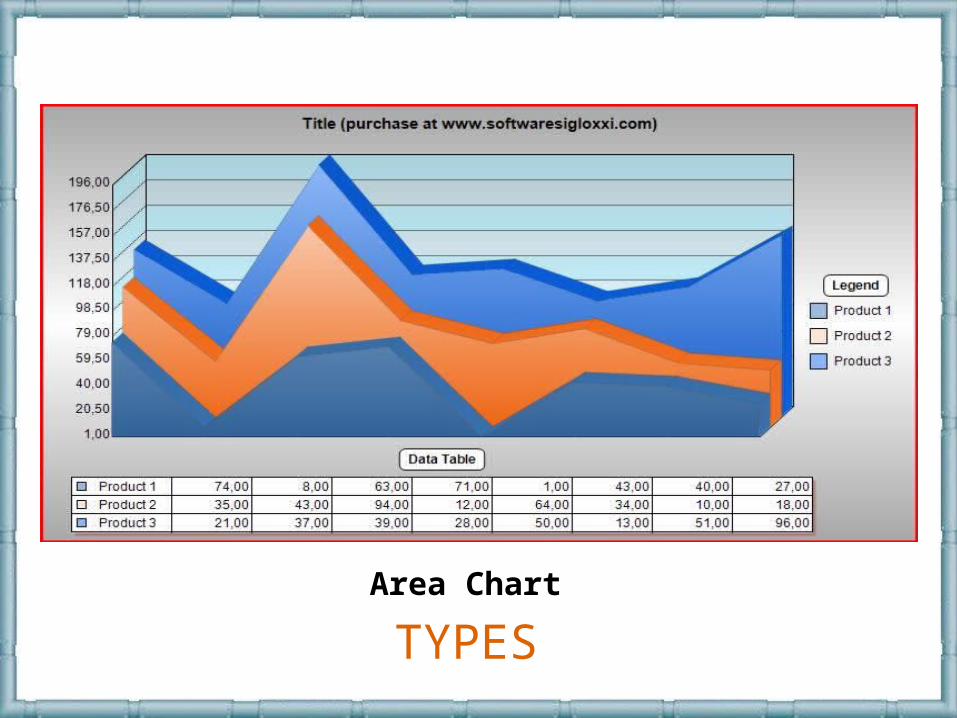
TYPESArea Chart
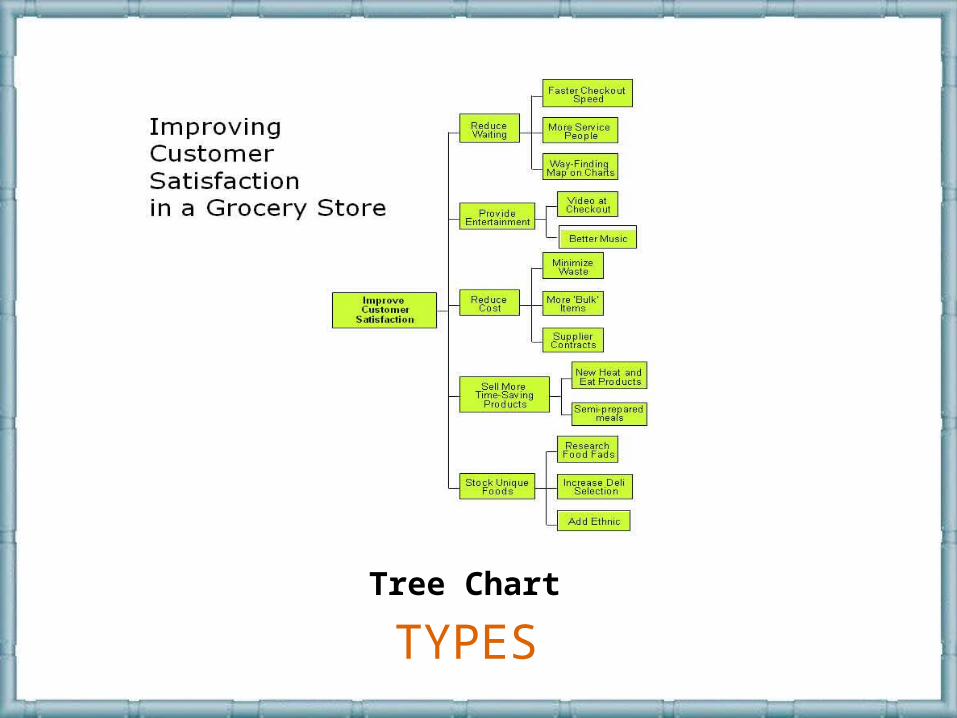
TYPESTree Chart
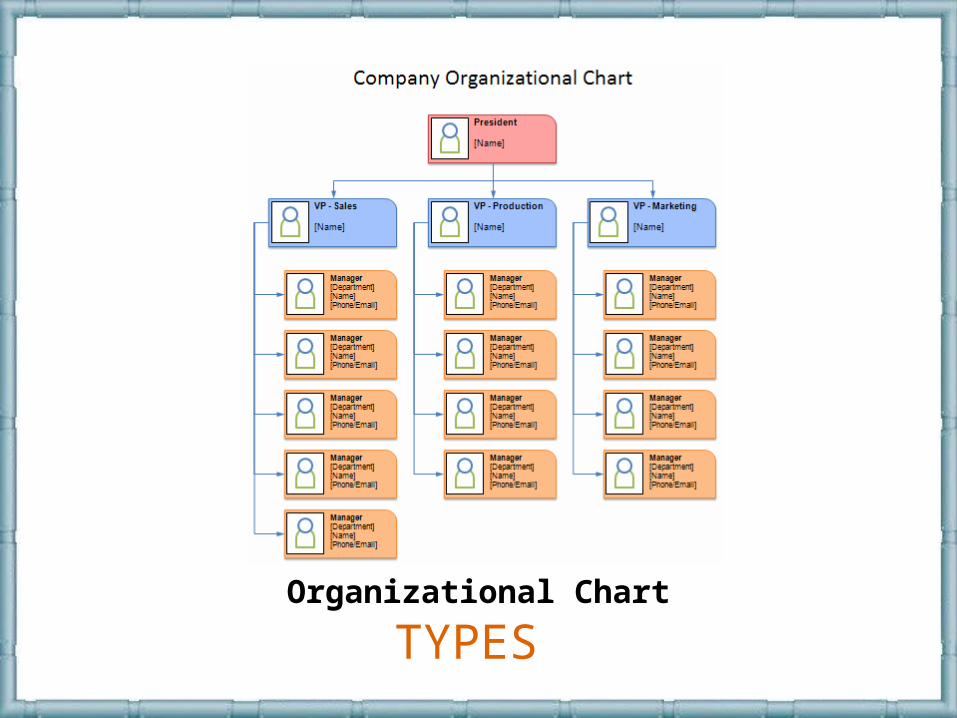
TYPESOrganizational Chart
ETYMOLOGY
1610s, from French diagramme, from Latin diagramma, from Greek
diagramma "geometric figure, that which is marked out by lines," from
diagraphein "mark out by lines, delineate," from dia- "across, out" (see
dia-) + graphein "write, mark, draw" (see -graphy). The verb is 1840, from
the noun.
DEFINITION
- synonym to graph
- a two-dimensional geometric symbolic representation of information according to some visualization technique
• Known to Babylonia in the late third millennium B.C. and to Greek in the 5th century B.C.
• where graduated measurement underlies all statistical diagrams
HISTORY
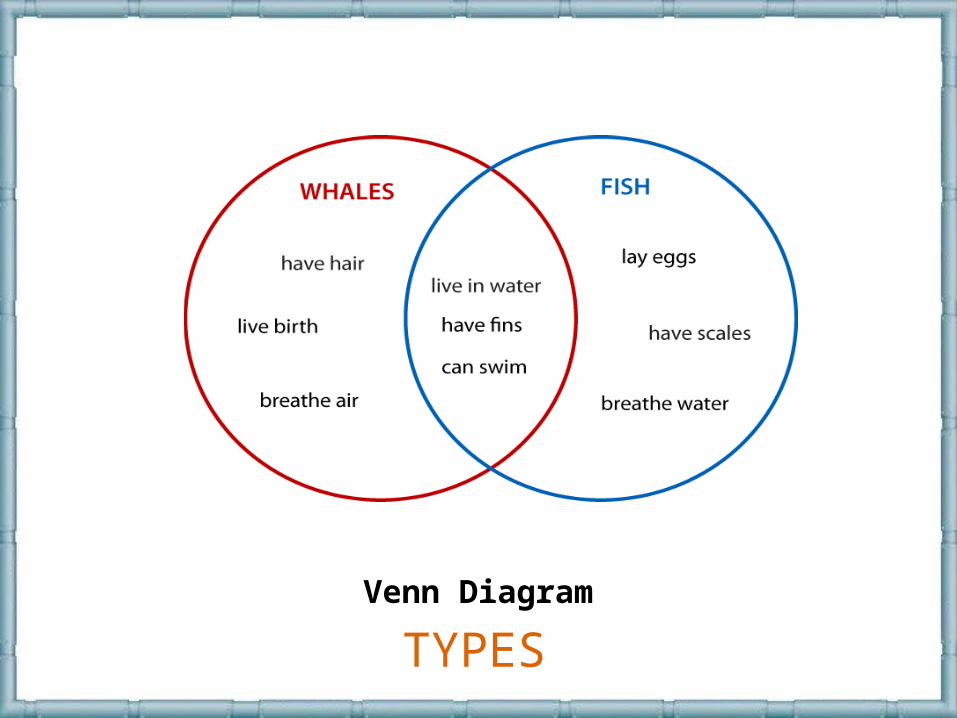
TYPESVenn Diagram
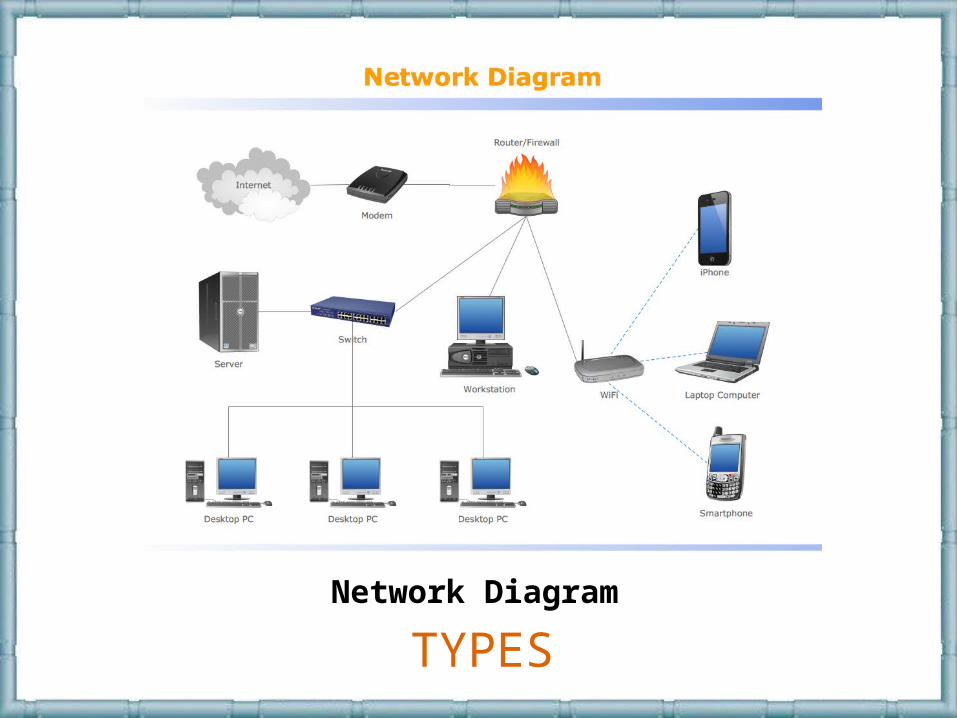
TYPESNetwork Diagram
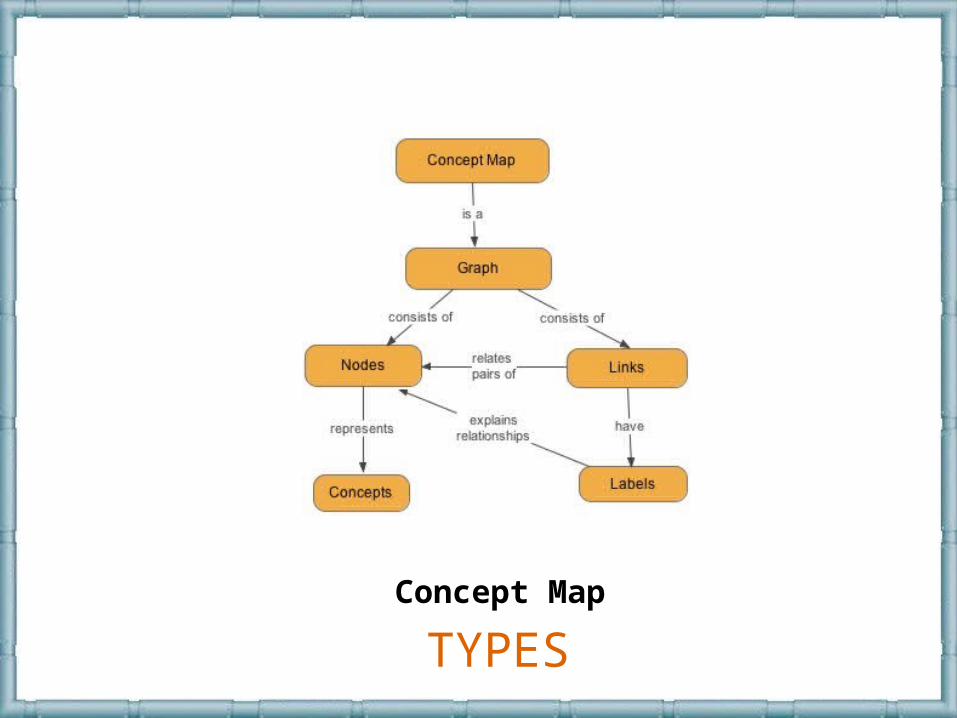
TYPESConcept Map
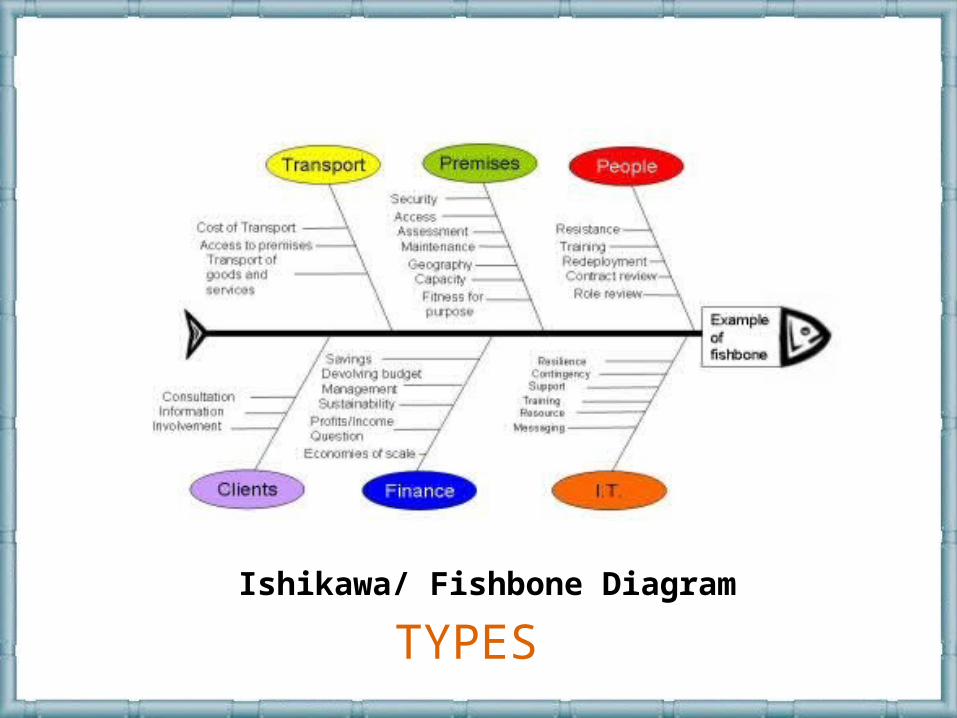
TYPESIshikawa/ Fishbone Diagram
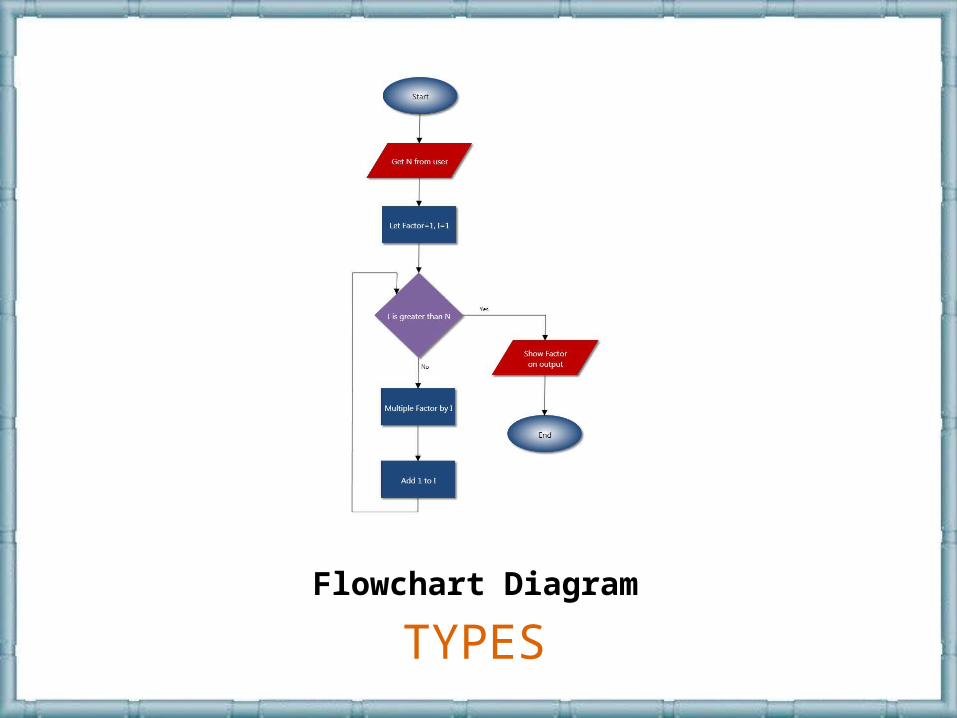
TYPESFlowchart Diagram
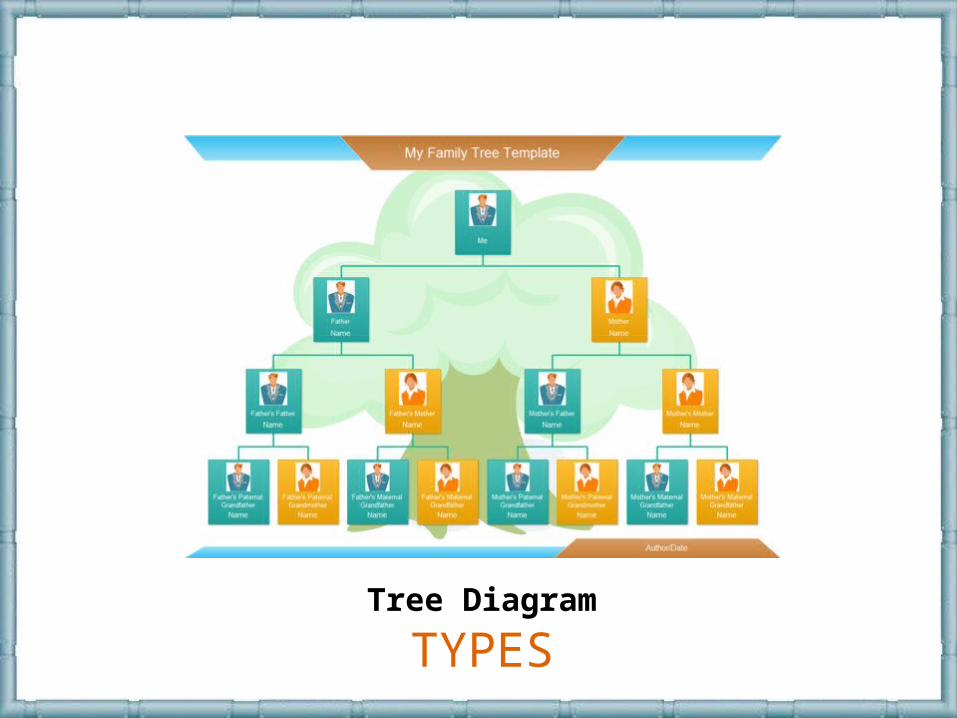
TYPESTree Diagram
ETYMOLOGY
1878, shortening of graphic formula (see graphic). The verb meaning "charted on
a graph" is from 1889. Related: Graphed; graphing.
DEFINITION
Are pictures that help us understand amounts. These amounts are called data.

• In 1765 Joseph Priestley published a timeline type graph upon which he plotted horizontal bars. Although not one of the more usual forms it is still a bar style chart.
HISTORY
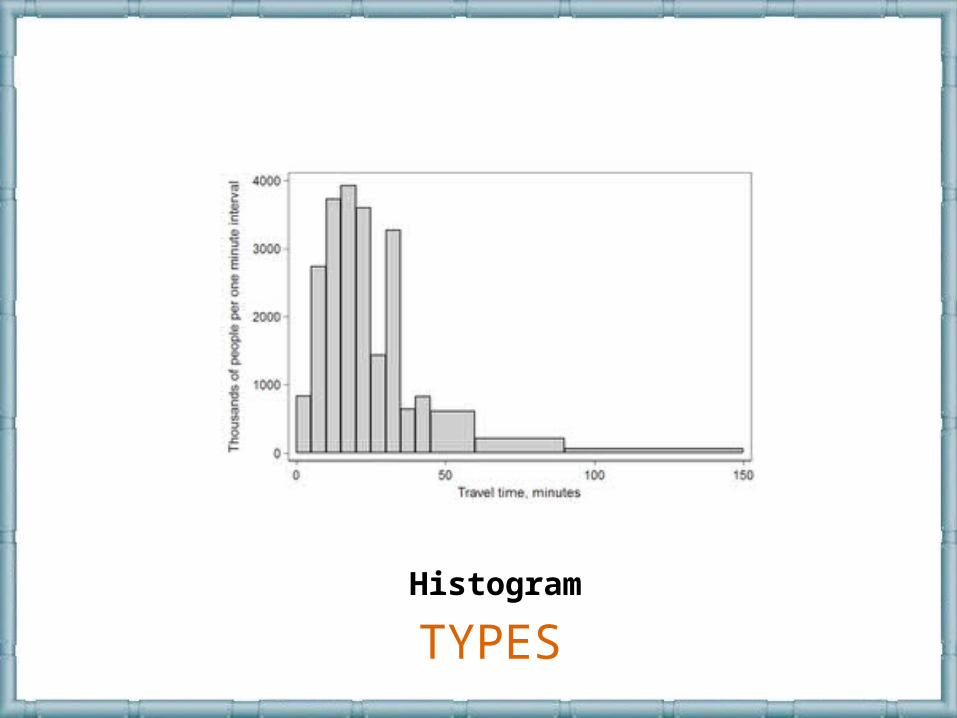
TYPESHistogram
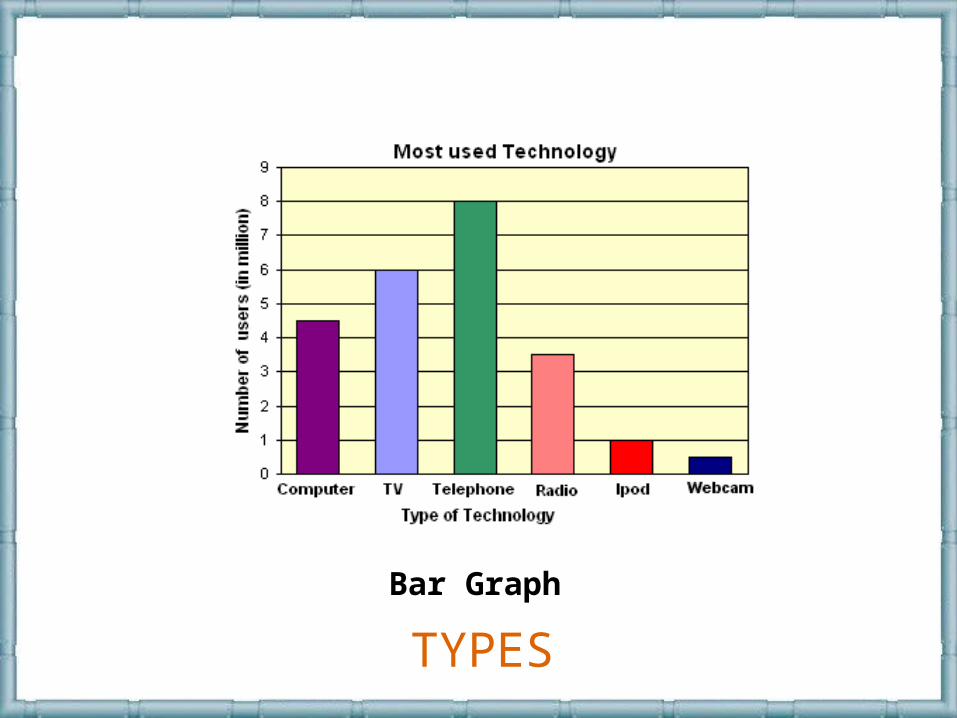
TYPES
Bar Graph
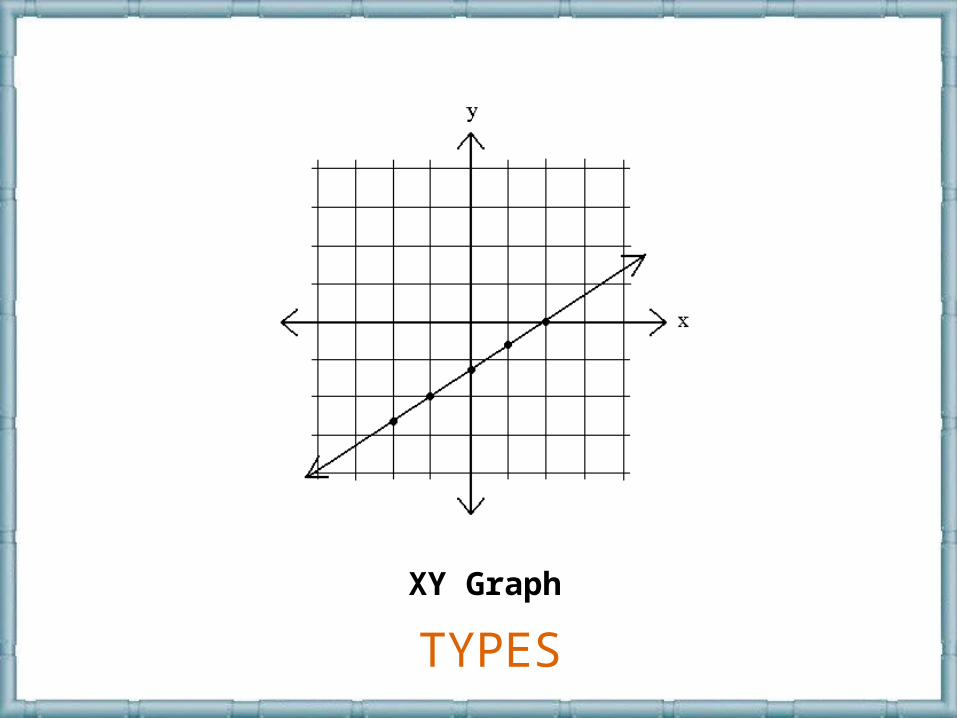
TYPES
XY Graph
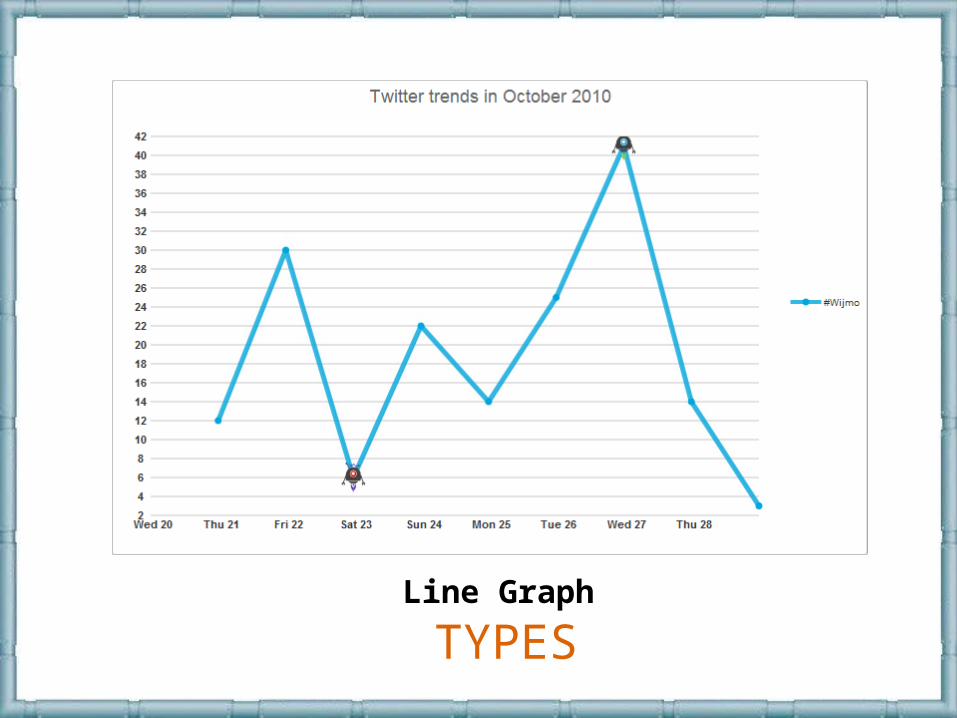
TYPESLine Graph
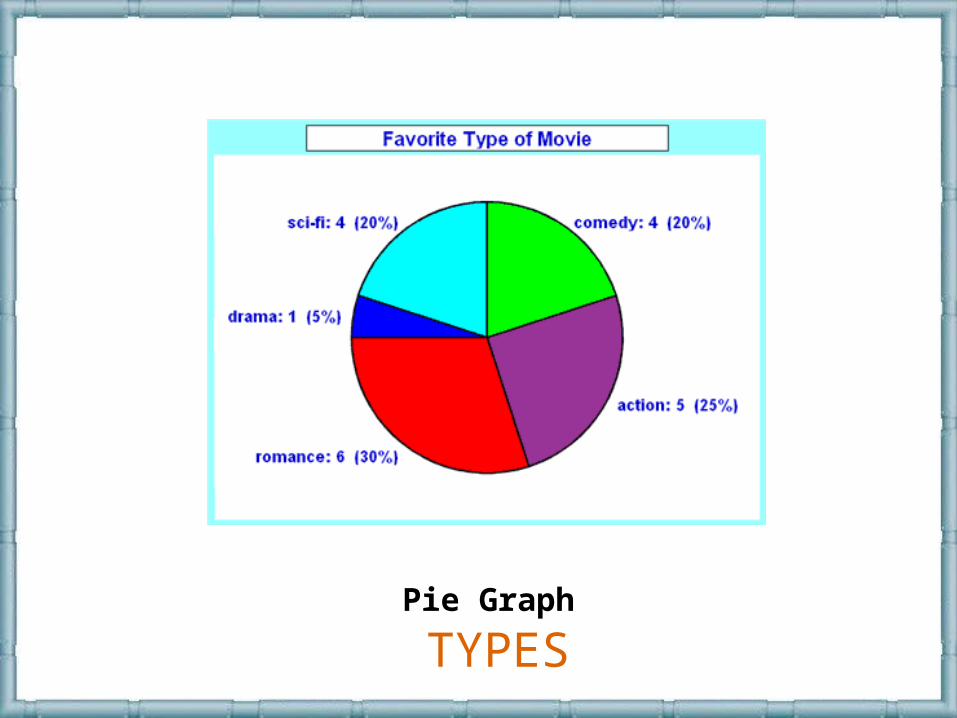
TYPESPie Graph
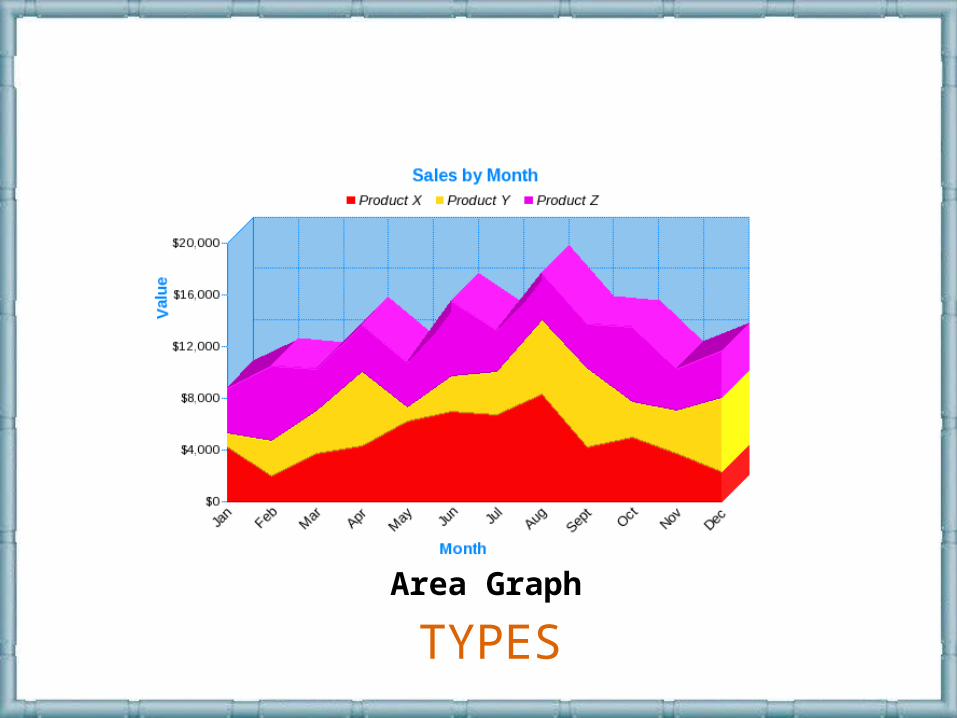
TYPESArea Graph
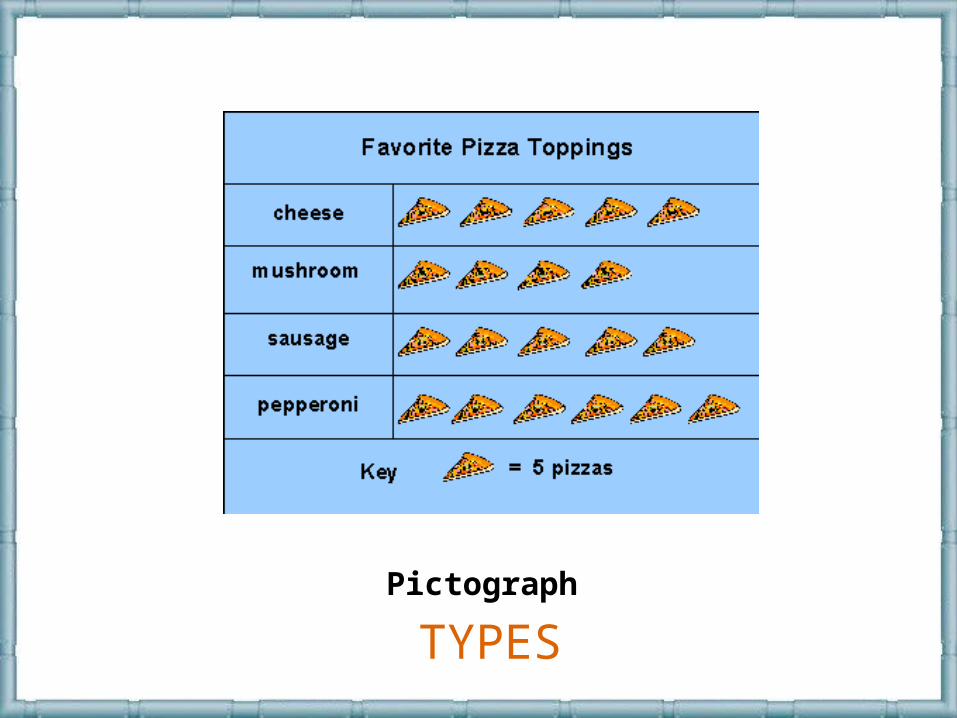
TYPESPictograph
ADVANTAGES
• It makes information visually interesting to the audience.
• Direct emphasis
• Convincin g
• Compact way to convey information
•Picture can say more
•Visualization of concepts
•Maintain attention
DISADVANTAGES
•Lack of precision
•Simplicity
•Time consuming
•Technical in nature
•Costly
REFERENCES
•http://en.wikipedia.org/wiki/Chart•http://en.wikipedia.org/wiki/Diagram•http://www.beaconlearningcenter.com/weblessons/kindsofgraphs/•http://www.etymonline.com/index.php?allowed_in_frame=0&search=graph&searchmode=none•http://www.etymonline.com/index.php?allowed_in_frame=0&search=diagram&searchmode=none•http://www.etymonline.com/index.php?allowed_in_frame=0&search=chart&searchmode=none•http://seeingcomplexity.wordpress.com/2011/02/03/a-short-visual-history-of-charts-and-graphs/•http://www.jpowered.com/graphs-and-charts/bar-chart-history.htm•http://agcj.tamu.edu/howto/GraphicsAdDisad.htm •http://www.ehow.com/list_7189740_benefits-diagrams_.html•http://www.ehow.com/info_8470193_advantages-disadvantage-creating-chart.html
Related Documents


