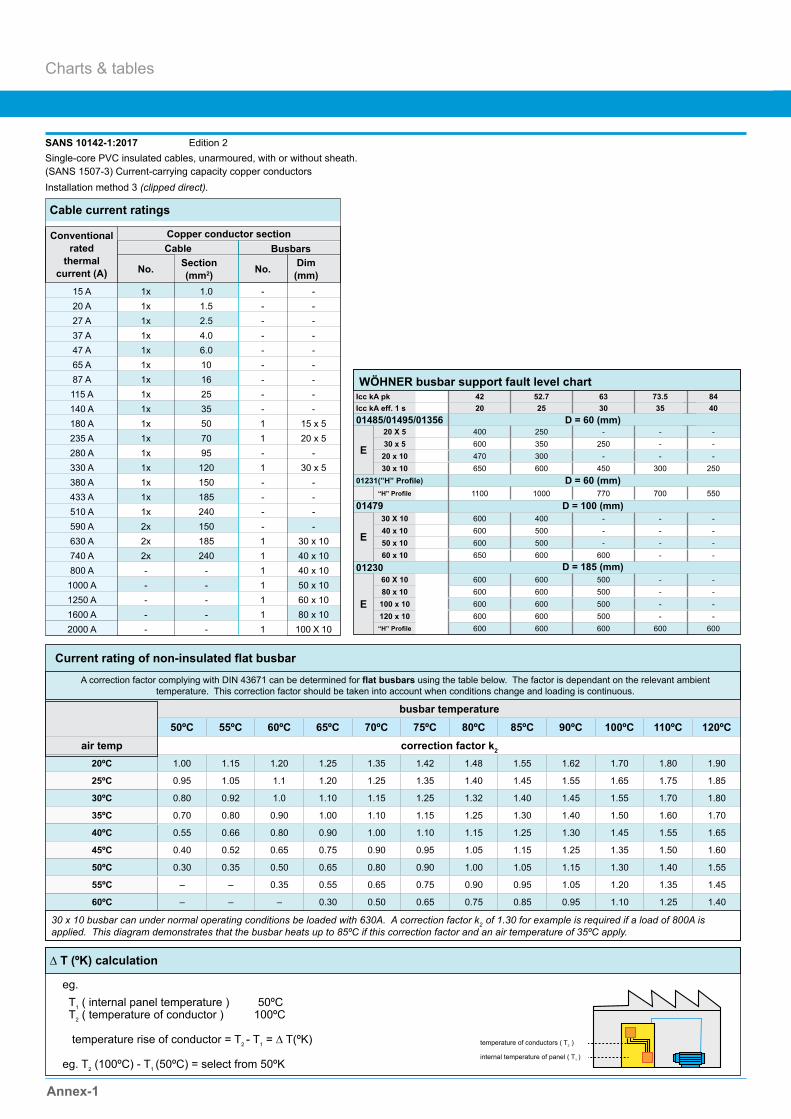
Charts & tables Annex-1 Current rating of non-insulated flat busbar A correction factor complying with DIN 43671 can be determined for flat busbars using the table below. The factor is dependant on the relevant ambient temperature. This correction factor should be taken into account when conditions change and loading is continuous. busbar temperature 50ºC 55ºC 60ºC 65ºC 70ºC 75ºC 80ºC 85ºC 90ºC 100ºC 110ºC 120ºC air temp correction factor k 2 20ºC 1.00 1.15 1.20 1.25 1.35 1.42 1.48 1.55 1.62 1.70 1.80 1.90 25ºC 0.95 1.05 1.1 1.20 1.25 1.35 1.40 1.45 1.55 1.65 1.75 1.85 30ºC 0.80 0.92 1.0 1.10 1.15 1.25 1.32 1.40 1.45 1.55 1.70 1.80 35ºC 0.70 0.80 0.90 1.00 1.10 1.15 1.25 1.30 1.40 1.50 1.60 1.70 40ºC 0.55 0.66 0.80 0.90 1.00 1.10 1.15 1.25 1.30 1.45 1.55 1.65 45ºC 0.40 0.52 0.65 0.75 0.90 0.95 1.05 1.15 1.25 1.35 1.50 1.60 50ºC 0.30 0.35 0.50 0.65 0.80 0.90 1.00 1.05 1.15 1.30 1.40 1.55 55ºC ‒ ‒ 0.35 0.55 0.65 0.75 0.90 0.95 1.05 1.20 1.35 1.45 60ºC ‒ ‒ ‒ 0.30 0.50 0.65 0.75 0.85 0.95 1.10 1.25 1.40 30 x 10 busbar can under normal operating conditions be loaded with 630A. A correction factor k 2 of 1.30 for example is required if a load of 800A is applied. This diagram demonstrates that the busbar heats up to 85ºC if this correction factor and an air temperature of 35ºC apply. Cable current ratings Conventional rated thermal current (A) Copper conductor section Cable Busbars No. Section (mm 2 ) No. Dim (mm) 15 A 1x 1.0 - - 20 A 1x 1.5 - - 27 A 1x 2.5 - - 37 A 1x 4.0 - - 47 A 1x 6.0 - - 65 A 1x 10 - - 87 A 1x 16 - - 115 A 1x 25 - - 140 A 1x 35 - - 180 A 1x 50 1 15 x 5 235 A 1x 70 1 20 x 5 280 A 1x 95 - - 330 A 1x 120 1 30 x 5 380 A 1x 150 - - 433 A 1x 185 - - 510 A 1x 240 - - 590 A 2x 150 - - 630 A 2x 185 1 30 x 10 740 A 2x 240 1 40 x 10 800 A - - 1 40 x 10 1000 A - - 1 50 x 10 1250 A - - 1 60 x 10 1600 A - - 1 80 x 10 2000 A - - 1 100 X 10 eg. T 1 ( internal panel temperature ) 50ºC T 2 ( temperature of conductor ) 100ºC temperature rise of conductor = T 2 - T 1 = ∆ T(ºK) eg. T 2 (100ºC) - T 1 (50ºC) = select from 50ºK ∆ T (ºK) calculation temperature of conductors ( T 2 ) internal temperature of panel ( T 1 ) WÖHNER busbar support fault level chart Icc kA pk 42 52.7 63 73.5 84 Icc kA eff. 1 s 20 25 30 35 40 01485/01495/01356 D = 60 (mm) E 20 X 5 400 250 - - - 30 x 5 600 350 250 - - 20 x 10 470 300 - - - 30 x 10 650 600 450 300 250 D = 60 (mm) 1100 1000 770 700 550 01479 D = 100 (mm) E 30 X 10 600 400 - - - 40 x 10 600 500 - - - 50 x 10 600 500 - - - 60 x 10 650 600 600 - - 01230 D = 185 (mm) E 60 X 10 600 600 500 - - 80 x 10 600 600 500 - - 100 x 10 600 600 500 - - 120 x 10 600 600 500 - - 600 600 600 600 600 SANS 10142-1:2017 Edition 2 Single-core PVC insulated cables, unarmoured, with or without sheath. (SANS 1507-3) Current-carrying capacity copper conductors Installation method 3 (clipped direct).

Welcome message from author
This document is posted to help you gain knowledge. Please leave a comment to let me know what you think about it! Share it to your friends and learn new things together.
Transcript
Charts & tables
Annex-1
Current rating of non-insulated flat busbar
A correction factor complying with DIN 43671 can be determined for flat busbars using the table below. The factor is dependant on the relevant ambient temperature. This correction factor should be taken into account when conditions change and loading is continuous.
busbar temperature50ºC 55ºC 60ºC 65ºC 70ºC 75ºC 80ºC 85ºC 90ºC 100ºC 110ºC 120ºC
air temp correction factor k2
20ºC 1.00 1.15 1.20 1.25 1.35 1.42 1.48 1.55 1.62 1.70 1.80 1.90
25ºC 0.95 1.05 1.1 1.20 1.25 1.35 1.40 1.45 1.55 1.65 1.75 1.85
30ºC 0.80 0.92 1.0 1.10 1.15 1.25 1.32 1.40 1.45 1.55 1.70 1.80
35ºC 0.70 0.80 0.90 1.00 1.10 1.15 1.25 1.30 1.40 1.50 1.60 1.70
40ºC 0.55 0.66 0.80 0.90 1.00 1.10 1.15 1.25 1.30 1.45 1.55 1.65
45ºC 0.40 0.52 0.65 0.75 0.90 0.95 1.05 1.15 1.25 1.35 1.50 1.60
50ºC 0.30 0.35 0.50 0.65 0.80 0.90 1.00 1.05 1.15 1.30 1.40 1.55
55ºC ‒ ‒ 0.35 0.55 0.65 0.75 0.90 0.95 1.05 1.20 1.35 1.45
60ºC ‒ ‒ ‒ 0.30 0.50 0.65 0.75 0.85 0.95 1.10 1.25 1.40
30 x 10 busbar can under normal operating conditions be loaded with 630A. A correction factor k2 of 1.30 for example is required if a load of 800A is applied. This diagram demonstrates that the busbar heats up to 85ºC if this correction factor and an air temperature of 35ºC apply.
Cable current ratings
Conventional rated
thermal current (A)
Copper conductor sectionCable Busbars
No. Section (mm2) No. Dim
(mm)15 A 1x 1.0 - -20 A 1x 1.5 - -27 A 1x 2.5 - -37 A 1x 4.0 - -47 A 1x 6.0 - -65 A 1x 10 - -87 A 1x 16 - -115 A 1x 25 - -140 A 1x 35 - -180 A 1x 50 1 15 x 5235 A 1x 70 1 20 x 5280 A 1x 95 - -330 A 1x 120 1 30 x 5380 A 1x 150 - -433 A 1x 185 - -510 A 1x 240 - -590 A 2x 150 - -630 A 2x 185 1 30 x 10740 A 2x 240 1 40 x 10800 A - - 1 40 x 10
1000 A - - 1 50 x 101250 A - - 1 60 x 101600 A - - 1 80 x 102000 A - - 1 100 X 10
eg. T1 ( internal panel temperature ) 50ºC T2 ( temperature of conductor ) 100ºC temperature rise of conductor = T2 - T1 = ∆ T(ºK)
eg. T2 (100ºC) - T1 (50ºC) = select from 50ºKINTERNALTEMPERATUREOF PANEL (T1)
TEMPERATURE OFCONDUCTORS (T2)
∆ T (ºK) calculation
temperature of conductors ( T2 )
internal temperature of panel ( T1 )
Top 1010 (Top 2/5TN) (1 x 5mm bar per phase)Icc kA pk 74 110 143 165 187Icc kA eff. 1 s 35 50 65 75 85
D = 75 100 125 150 75 100 125 150 75 100 125 150 75 100 125 150 75 100 125 150
E
30 x 5 200 230 260 - 135 155 175 - - - - - - - - - - - - -
40 x 5 230 265 300 - 155 180 200 - - - - - - - - - - - - -
50 x 5 260 300 335 - 175 200 225 - 130 155 170 - - - - - - - - -
60 x 5 290 335 375 - 195 225 250 - 150 170 195 - - - - - - - - -
Top 1010 (Top 2/5TN) (2 x 5mm bars per phase)
E
30 x 5 170 175 175 - 115 115 115 - - - - - - - - - - - - -40 x 5 210 220 220 - 140 145 150 - 100 100 100 - - - - - - - - -50 x 5 250 260 270 - 165 175 180 - 125 135 135 - - - - - - - - -60 x 5 295 310 325 - 195 205 215 - 150 160 165 - - - - - - - - -
Top 1030 (Top 1/10TN) (1 x 10mm bar per phase)
E
30 x 10 400 460 520 550 265 310 350 360 205 240 260 290 170 180 190 190 - - - -
40 x 10 460 530 600 640 310 360 400 420 240 275 310 330 170 210 225 225 - - - -50 x 10 520 560 670 690 350 400 450 475 265 310 345 370 175 220 265 270 - - - -60 x 10 525 560 750 810 390 450 505 520 295 345 390 410 180 235 275 300 - - - -80 x 10 525 560 850 890 440 495 505 600 295 360 410 470 190 240 285 315 - - - -100 x 10 525 560 955 1030 440 495 505 660 295 375 425 480 205 250 305 350 - - - -120 x 10 525 560 1030 1080 440 495 505 720 295 375 425 480 215 265 315 360 - - - -
Top 1040 (Top 2/10TN) (2 x 10mm bars per phase)
E
30 x 10 380 400 425 425 255 275 280 285 190 215 220 220 170 180 190 190 130 155 165 16540 x 10 460 480 500 510 310 330 340 350 220 250 260 270 170 210 225 225 130 170 200 20550 x 10 510 525 540 570 350 380 390 410 235 290 305 315 175 220 265 270 135 175 215 24060 x 10 510 530 545 630 385 440 460 480 245 310 350 370 180 235 275 300 140 180 220 26080 x 10 510 530 545 630 395 450 495 495 255 325 375 420 190 240 285 315 150 190 230 270100 x 10 520 535 555 640 410 470 495 505 275 335 385 425 205 250 305 350 160 200 230 280120 x 10 520 535 560 650 435 490 495 505 285 345 390 435 215 265 315 360 160 200 230 280
Top 1050 (Top 3/10TN) (3 x 10mm bars per phase)
E
30 x 10 490 505 505 505 330 335 340 340 250 260 260 260 220 225 225 225 190 200 200 20040 x 10 580 610 615 615 385 410 410 410 300 310 315 315 260 270 275 275 230 240 240 24050 x 10 585 700 715 715 450 465 470 480 345 360 370 370 300 315 320 320 245 275 280 28060 x 10 780 810 840 850 500 510 520 535 400 420 435 440 325 365 375 380 255 315 330 33580 x 10 900 950 975 1000 500 510 525 535 410 470 495 500 335 385 430 455 260 320 360 400100 x 10 1200 1200 1200 1200 505 515 525 535 420 480 495 500 350 395 440 480 275 330 375 410120 x 10 1200 1200 1200 1200 505 515 525 535 435 485 495 500 360 405 445 480 285 340 380 415
TEKNOMEGA top busbar support fault level chart
WÖHNER busbar support fault level chartIcc kA pk 42 52.7 63 73.5 84Icc kA eff. 1 s 20 25 30 35 4001485/01495/01356 D = 60 (mm)
E
20 X 5 400 250 - - -30 x 5 600 350 250 - -
20 x 10 470 300 - - -30 x 10 650 600 450 300 250
D = 60 (mm)1100 1000 770 700 550
01479 D = 100 (mm)
E
30 X 10 600 400 - - -40 x 10 600 500 - - -50 x 10 600 500 - - -60 x 10 650 600 600 - -
01230 D = 185 (mm)
E
60 X 10 600 600 500 - -80 x 10 600 600 500 - -100 x 10 600 600 500 - -120 x 10 600 600 500 - -
600 600 600 600 600
D = Space between busbar phases E = Spaces between 2 sets of busbar supports
SANS 10142-1:2017 Edition 2 Single-core PVC insulated cables, unarmoured, with or without sheath.(SANS 1507-3) Current-carrying capacity copper conductors Installation method 3 (clipped direct).
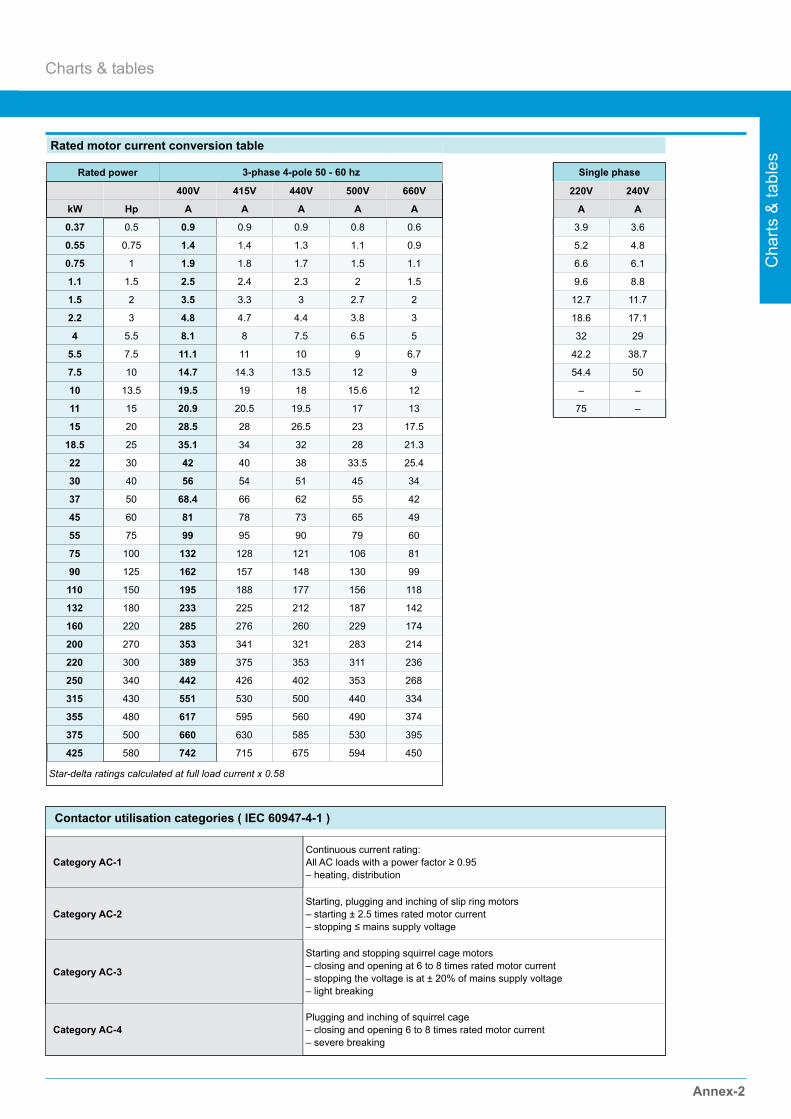
Annex-2
Charts & tables
Cha
rts &
tabl
es
Contactor utilisation categories ( IEC 60947-4-1 )
Category AC-1 Continuous current rating:All AC loads with a power factor ≥ 0.95‒ heating, distribution
Category AC-2 Starting, plugging and inching of slip ring motors‒ starting ± 2.5 times rated motor current‒ stopping ≤ mains supply voltage
Category AC-3
Starting and stopping squirrel cage motors‒ closing and opening at 6 to 8 times rated motor current‒ stopping the voltage is at ± 20% of mains supply voltage‒ light breaking
Category AC-4Plugging and inching of squirrel cage‒ closing and opening 6 to 8 times rated motor current‒ severe breaking
Rated motor current conversion table
Rated power 3-phase 4-pole 50 - 60 hz
400V 415V 440V 500V 660V
kW Hp A A A A A
0.37 0.5 0.9 0.9 0.9 0.8 0.6
0.55 0.75 1.4 1.4 1.3 1.1 0.9
0.75 1 1.9 1.8 1.7 1.5 1.1
1.1 1.5 2.5 2.4 2.3 2 1.5
1.5 2 3.5 3.3 3 2.7 2
2.2 3 4.8 4.7 4.4 3.8 3
4 5.5 8.1 8 7.5 6.5 5
5.5 7.5 11.1 11 10 9 6.7
7.5 10 14.7 14.3 13.5 12 9
10 13.5 19.5 19 18 15.6 12
11 15 20.9 20.5 19.5 17 13
15 20 28.5 28 26.5 23 17.5
18.5 25 35.1 34 32 28 21.3
22 30 42 40 38 33.5 25.4
30 40 56 54 51 45 34
37 50 68.4 66 62 55 42
45 60 81 78 73 65 49
55 75 99 95 90 79 60
75 100 132 128 121 106 81
90 125 162 157 148 130 99
110 150 195 188 177 156 118
132 180 233 225 212 187 142
160 220 285 276 260 229 174
200 270 353 341 321 283 214
220 300 389 375 353 311 236
250 340 442 426 402 353 268
315 430 551 530 500 440 334
355 480 617 595 560 490 374
375 500 660 630 585 530 395
425 580 742 715 675 594 450
Star-delta ratings calculated at full load current x 0.58
Single phase
220V 240V
A A
3.9 3.6
5.2 4.8
6.6 6.1
9.6 8.8
12.7 11.7
18.6 17.1
32 29
42.2 38.7
54.4 50
‒ ‒
75 ‒
Charts & tables
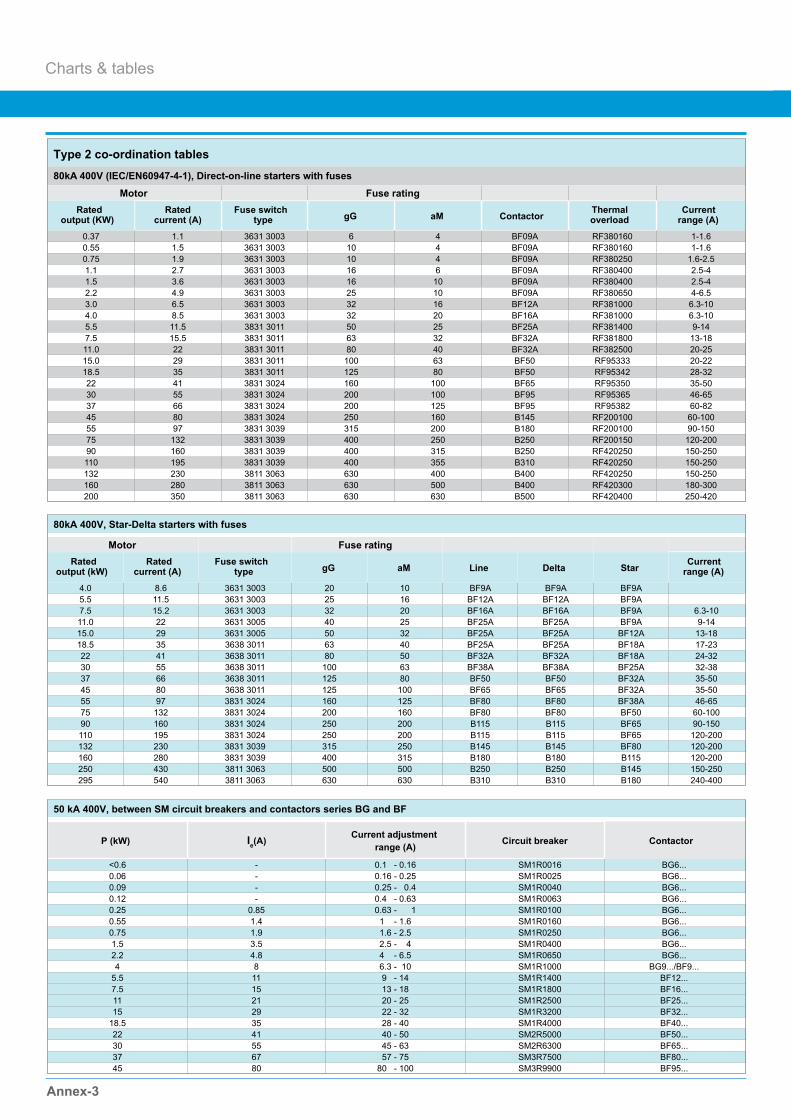
Annex-3
Type 2 co-ordination tables
80kA 400V (IEC/EN60947-4-1), Direct-on-line starters with fuses
Motor Fuse ratingRated
output (KW)Rated
current (A)Fuse switch
type gG aM Contactor Thermaloverload
Currentrange (A)
0.37 1.1 3631 3003 6 4 BF09A RF380160 1-1.60.55 1.5 3631 3003 10 4 BF09A RF380160 1-1.60.75 1.9 3631 3003 10 4 BF09A RF380250 1.6-2.51.1 2.7 3631 3003 16 6 BF09A RF380400 2.5-41.5 3.6 3631 3003 16 10 BF09A RF380400 2.5-42.2 4.9 3631 3003 25 10 BF09A RF380650 4-6.53.0 6.5 3631 3003 32 16 BF12A RF381000 6.3-104.0 8.5 3631 3003 32 20 BF16A RF381000 6.3-105.5 11.5 3831 3011 50 25 BF25A RF381400 9-147.5 15.5 3831 3011 63 32 BF32A RF381800 13-1811.0 22 3831 3011 80 40 BF32A RF382500 20-2515.0 29 3831 3011 100 63 BF50 RF95333 20-2218.5 35 3831 3011 125 80 BF50 RF95342 28-3222 41 3831 3024 160 100 BF65 RF95350 35-5030 55 3831 3024 200 100 BF95 RF95365 46-6537 66 3831 3024 200 125 BF95 RF95382 60-8245 80 3831 3024 250 160 B145 RF200100 60-10055 97 3831 3039 315 200 B180 RF200100 90-15075 132 3831 3039 400 250 B250 RF200150 120-20090 160 3831 3039 400 315 B250 RF420250 150-250110 195 3831 3039 400 355 B310 RF420250 150-250132 230 3811 3063 630 400 B400 RF420250 150-250160 280 3811 3063 630 500 B400 RF420300 180-300200 350 3811 3063 630 630 B500 RF420400 250-420
80kA 400V, Star-Delta starters with fuses
Motor Fuse ratingRated
output (kW)Rated
current (A)Fuse switch
type gG aM Line Delta Star Currentrange (A)
4.0 8.6 3631 3003 20 10 BF9A BF9A BF9A5.5 11.5 3631 3003 25 16 BF12A BF12A BF9A7.5 15.2 3631 3003 32 20 BF16A BF16A BF9A 6.3-1011.0 22 3631 3005 40 25 BF25A BF25A BF9A 9-1415.0 29 3631 3005 50 32 BF25A BF25A BF12A 13-1818.5 35 3638 3011 63 40 BF25A BF25A BF18A 17-2322 41 3638 3011 80 50 BF32A BF32A BF18A 24-3230 55 3638 3011 100 63 BF38A BF38A BF25A 32-3837 66 3638 3011 125 80 BF50 BF50 BF32A 35-5045 80 3638 3011 125 100 BF65 BF65 BF32A 35-5055 97 3831 3024 160 125 BF80 BF80 BF38A 46-6575 132 3831 3024 200 160 BF80 BF80 BF50 60-10090 160 3831 3024 250 200 B115 B115 BF65 90-150110 195 3831 3024 250 200 B115 B115 BF65 120-200132 230 3831 3039 315 250 B145 B145 BF80 120-200160 280 3831 3039 400 315 B180 B180 B115 120-200250 430 3811 3063 500 500 B250 B250 B145 150-250295 540 3811 3063 630 630 B310 B310 B180 240-400
50 kA 400V, between SM circuit breakers and contactors series BG and BF
P (kW) Ie (A) Current adjustment range (A) Circuit breaker Contactor
<0.6 - 0.1 - 0.16 SM1R0016 BG6...0.06 - 0.16 - 0.25 SM1R0025 BG6...0.09 - 0.25 - 0.4 SM1R0040 BG6...0.12 - 0.4 - 0.63 SM1R0063 BG6...0.25 0.85 0.63 - 1 SM1R0100 BG6...0.55 1.4 1 - 1.6 SM1R0160 BG6...0.75 1.9 1.6 - 2.5 SM1R0250 BG6...1.5 3.5 2.5 - 4 SM1R0400 BG6...2.2 4.8 4 - 6.5 SM1R0650 BG6...4 8 6.3 - 10 SM1R1000 BG9.../BF9...
5.5 11 9 - 14 SM1R1400 BF12...7.5 15 13 - 18 SM1R1800 BF16...11 21 20 - 25 SM1R2500 BF25...15 29 22 - 32 SM1R3200 BF32...
18.5 35 28 - 40 SM1R4000 BF40...22 41 40 - 50 SM2R5000 BF50...30 55 45 - 63 SM2R6300 BF65...37 67 57 - 75 SM3R7500 BF80...45 80 80 - 100 SM3R9900 BF95...
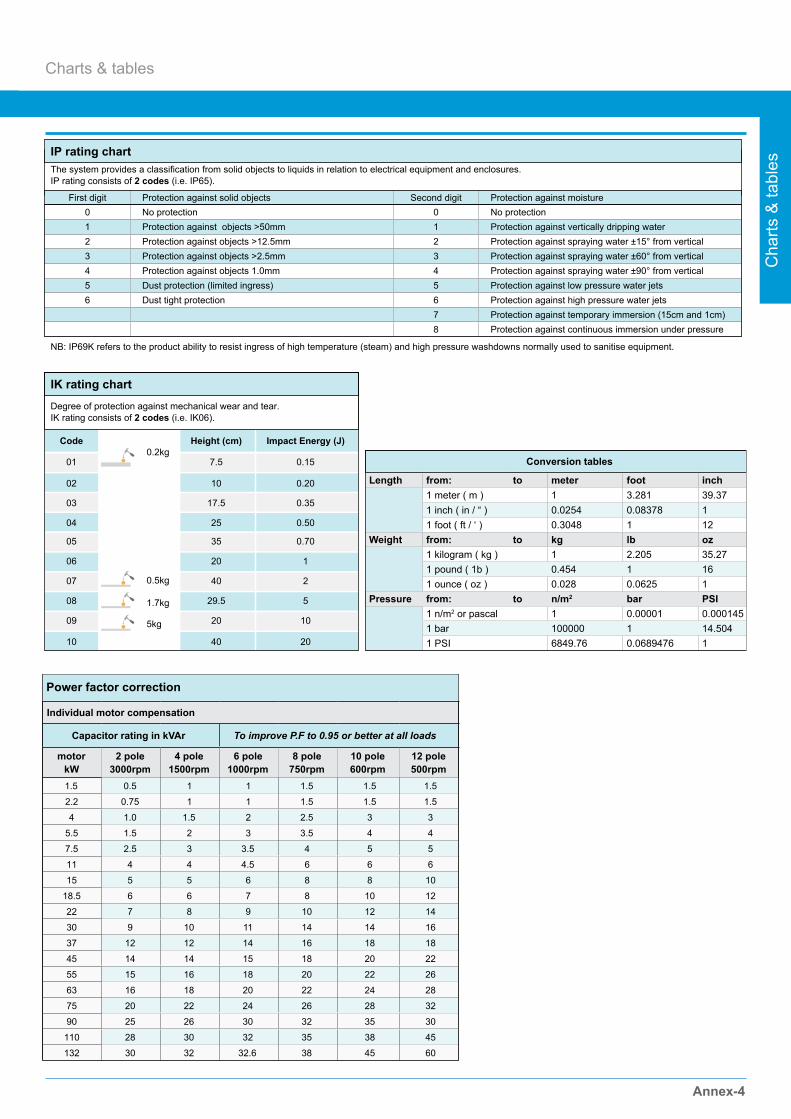
Annex-4
Charts & tables
Cha
rts &
tabl
es
Individual motor compensation
Capacitor rating in kVAr To improve P.F to 0.95 or better at all loads
motorkW
2 pole3000rpm
4 pole1500rpm
6 pole1000rpm
8 pole750rpm
10 pole600rpm
12 pole500rpm
1.5 0.5 1 1 1.5 1.5 1.5
2.2 0.75 1 1 1.5 1.5 1.5
4 1.0 1.5 2 2.5 3 3
5.5 1.5 2 3 3.5 4 4
7.5 2.5 3 3.5 4 5 5
11 4 4 4.5 6 6 6
15 5 5 6 8 8 10
18.5 6 6 7 8 10 12
22 7 8 9 10 12 14
30 9 10 11 14 14 16
37 12 12 14 16 18 18
45 14 14 15 18 20 22
55 15 16 18 20 22 26
63 16 18 20 22 24 28
75 20 22 24 26 28 32
90 25 26 30 32 35 30
110 28 30 32 35 38 45
132 30 32 32.6 38 45 60
Power factor correction
IK rating chart
IK rating consists of 2 codes (i.e. IK06).Degree of protection against mechanical wear and tear.
IP rating chart
IP rating consists of 2 codes (i.e. IP65).The system provides a classification from solid objects to liquids in relation to electrical equipment and enclosures.
NB: IP69K refers to the product ability to resist ingress of high temperature (steam) and high pressure washdowns normally used to sanitise equipment.
Code Height (cm) Impact Energy (J)
010.2kg
0.5kg
1.7kg
5kg
7.5 0.15
02 10 0.20
03 17.5 0.35
04 25 0.50
05 35 0.70
06 20 1
07 40 2
08 29.5 5
09 20
First digit Protection against solid objects Second digit Protection against moisture0 No protection 0 No protection1 Protection against objects >50mm 1 Protection against vertically dripping water2 Protection against objects >12.5mm 2 Protection against spraying water ±15° from vertical3 Protection against objects >2.5mm 3 Protection against spraying water ±60° from vertical4 Protection against objects 1.0mm 4 Protection against spraying water ±90° from vertical5 Dust protection (limited ingress) 5 Protection against low pressure water jets6 Dust tight protection 6 Protection against high pressure water jets
7 Protection against temporary immersion (15cm and 1cm)8 Protection against continuous immersion under pressure
10
10 40 20
Conversion tables
Length from: to meter foot inch1 meter ( m ) 1 3.281 39.371 inch ( in / “ ) 0.0254 0.08378 11 foot ( ft / ‘ ) 0.3048 1 12
Weight from: to kg lb oz1 kilogram ( kg ) 1 2.205 35.271 pound ( 1b ) 0.454 1 161 ounce ( oz ) 0.028 0.0625 1
Pressure from: to n/m2 bar PSI1 n/m2 or pascal 1 0.00001 0.0001451 bar 100000 1 14.5041 PSI 6849.76 0.0689476 1
Charts & tables
Annex-5
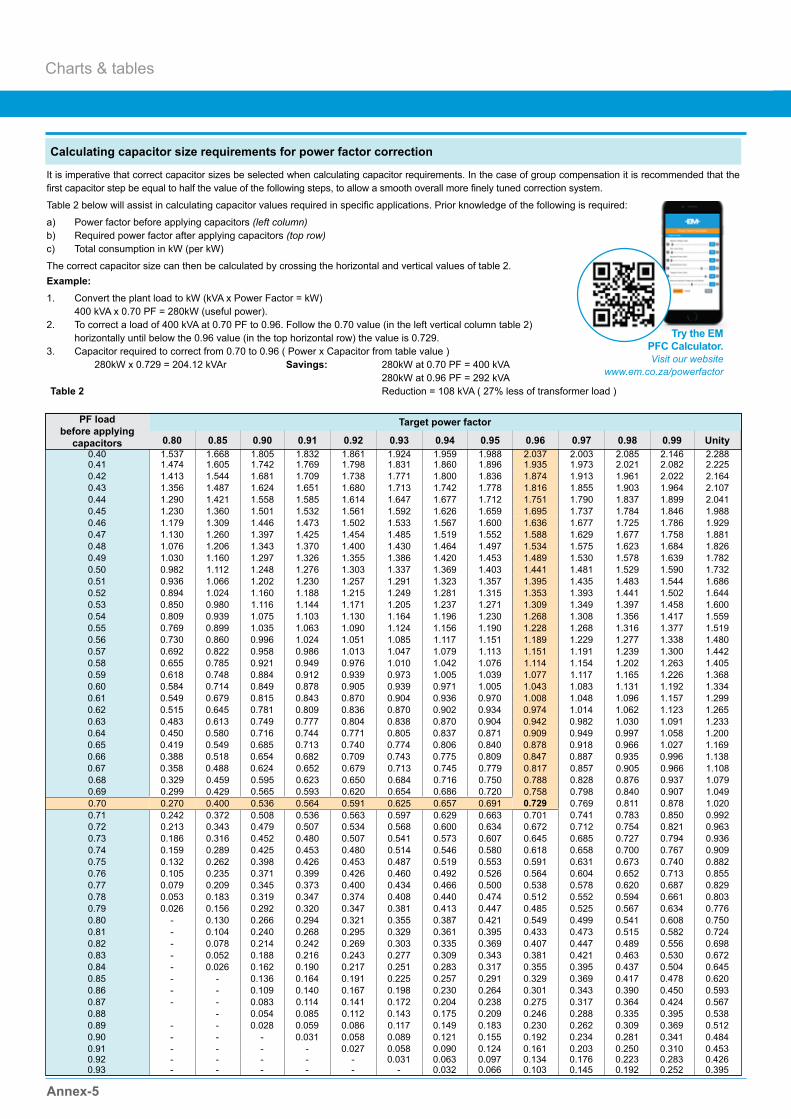
Calculating capacitor size requirements for power factor correction
It is imperative that correct capacitor sizes be selected when calculating capacitor requirements. In the case of group compensation it is recommended that the first capacitor step be equal to half the value of the following steps, to allow a smooth overall more finely tuned correction system.
Table 2 below will assist in calculating capacitor values required in specific applications. Prior knowledge of the following is required:
a) Power factor before applying capacitors (left column)b) Required power factor after applying capacitors (top row)c) Total consumption in kW (per kW)
The correct capacitor size can then be calculated by crossing the horizontal and vertical values of table 2.Example:1. Convert the plant load to kW (kVA x Power Factor = kW) 400 kVA x 0.70 PF = 280kW (useful power).2. To correct a load of 400 kVA at 0.70 PF to 0.96. Follow the 0.70 value (in the left vertical column table 2) horizontally until below the 0.96 value (in the top horizontal row) the value is 0.729.3. Capacitor required to correct from 0.70 to 0.96 ( Power x Capacitor from table value ) 280kW x 0.729 = 204.12 kVAr Savings: 280kW at 0.70 PF = 400 kVA 280kW at 0.96 PF = 292 kVATable 2 Reduction = 108 kVA ( 27% less of transformer load )
PF load before applying
capacitors
Target power factor
0.80 0.85 0.90 0.91 0.92 0.93 0.94 0.95 0.96 0.97 0.98 0.99 Unity0.40 1.537 1.668 1.805 1.832 1.861 1.924 1.959 1.988 2.037 2.003 2.085 2.146 2.2880.41 1.474 1.605 1.742 1.769 1.798 1.831 1.860 1.896 1.935 1.973 2.021 2.082 2.2250.42 1.413 1.544 1.681 1.709 1.738 1.771 1.800 1.836 1.874 1.913 1.961 2.022 2.1640.43 1.356 1.487 1.624 1.651 1.680 1.713 1.742 1.778 1.816 1.855 1.903 1.964 2.1070.44 1.290 1.421 1.558 1.585 1.614 1.647 1.677 1.712 1.751 1.790 1.837 1.899 2.0410.45 1.230 1.360 1.501 1.532 1.561 1.592 1.626 1.659 1.695 1.737 1.784 1.846 1.9880.46 1.179 1.309 1.446 1.473 1.502 1.533 1.567 1.600 1.636 1.677 1.725 1.786 1.9290.47 1.130 1.260 1.397 1.425 1.454 1.485 1.519 1.552 1.588 1.629 1.677 1.758 1.8810.48 1.076 1.206 1.343 1.370 1.400 1.430 1.464 1.497 1.534 1.575 1.623 1.684 1.8260.49 1.030 1.160 1.297 1.326 1.355 1.386 1.420 1.453 1.489 1.530 1.578 1.639 1.7820.50 0.982 1.112 1.248 1.276 1.303 1.337 1.369 1.403 1.441 1.481 1.529 1.590 1.7320.51 0.936 1.066 1.202 1.230 1.257 1.291 1.323 1.357 1.395 1.435 1.483 1.544 1.6860.52 0.894 1.024 1.160 1.188 1.215 1.249 1.281 1.315 1.353 1.393 1.441 1.502 1.6440.53 0.850 0.980 1.116 1.144 1.171 1.205 1.237 1.271 1.309 1.349 1.397 1.458 1.6000.54 0.809 0.939 1.075 1.103 1.130 1.164 1.196 1.230 1.268 1.308 1.356 1.417 1.5590.55 0.769 0.899 1.035 1.063 1.090 1.124 1.156 1.190 1.228 1.268 1.316 1.377 1.5190.56 0.730 0.860 0.996 1.024 1.051 1.085 1.117 1.151 1.189 1.229 1.277 1.338 1.4800.57 0.692 0.822 0.958 0.986 1.013 1.047 1.079 1.113 1.151 1.191 1.239 1.300 1.4420.58 0.655 0.785 0.921 0.949 0.976 1.010 1.042 1.076 1.114 1.154 1.202 1.263 1.4050.59 0.618 0.748 0.884 0.912 0.939 0.973 1.005 1.039 1.077 1.117 1.165 1.226 1.3680.60 0.584 0.714 0.849 0.878 0.905 0.939 0.971 1.005 1.043 1.083 1.131 1.192 1.3340.61 0.549 0.679 0.815 0.843 0.870 0.904 0.936 0.970 1.008 1.048 1.096 1.157 1.2990.62 0.515 0.645 0.781 0.809 0.836 0.870 0.902 0.934 0.974 1.014 1.062 1.123 1.2650.63 0.483 0.613 0.749 0.777 0.804 0.838 0.870 0.904 0.942 0.982 1.030 1.091 1.2330.64 0.450 0.580 0.716 0.744 0.771 0.805 0.837 0.871 0.909 0.949 0.997 1.058 1.2000.65 0.419 0.549 0.685 0.713 0.740 0.774 0.806 0.840 0.878 0.918 0.966 1.027 1.1690.66 0.388 0.518 0.654 0.682 0.709 0.743 0.775 0.809 0.847 0.887 0.935 0.996 1.1380.67 0.358 0.488 0.624 0.652 0.679 0.713 0.745 0.779 0.817 0.857 0.905 0.966 1.1080.68 0.329 0.459 0.595 0.623 0.650 0.684 0.716 0.750 0.788 0.828 0.876 0.937 1.0790.69 0.299 0.429 0.565 0.593 0.620 0.654 0.686 0.720 0.758 0.798 0.840 0.907 1.0490.70 0.270 0.400 0.536 0.564 0.591 0.625 0.657 0.691 0.729 0.769 0.811 0.878 1.0200.71 0.242 0.372 0.508 0.536 0.563 0.597 0.629 0.663 0.701 0.741 0.783 0.850 0.9920.72 0.213 0.343 0.479 0.507 0.534 0.568 0.600 0.634 0.672 0.712 0.754 0.821 0.9630.73 0.186 0.316 0.452 0.480 0.507 0.541 0.573 0.607 0.645 0.685 0.727 0.794 0.9360.74 0.159 0.289 0.425 0.453 0.480 0.514 0.546 0.580 0.618 0.658 0.700 0.767 0.9090.75 0.132 0.262 0.398 0.426 0.453 0.487 0.519 0.553 0.591 0.631 0.673 0.740 0.8820.76 0.105 0.235 0.371 0.399 0.426 0.460 0.492 0.526 0.564 0.604 0.652 0.713 0.8550.77 0.079 0.209 0.345 0.373 0.400 0.434 0.466 0.500 0.538 0.578 0.620 0.687 0.8290.78 0.053 0.183 0.319 0.347 0.374 0.408 0.440 0.474 0.512 0.552 0.594 0.661 0.8030.79 0.026 0.156 0.292 0.320 0.347 0.381 0.413 0.447 0.485 0.525 0.567 0.634 0.7760.80 - 0.130 0.266 0.294 0.321 0.355 0.387 0.421 0.549 0.499 0.541 0.608 0.7500.81 - 0.104 0.240 0.268 0.295 0.329 0.361 0.395 0.433 0.473 0.515 0.582 0.7240.82 - 0.078 0.214 0.242 0.269 0.303 0.335 0.369 0.407 0.447 0.489 0.556 0.6980.83 - 0.052 0.188 0.216 0.243 0.277 0.309 0.343 0.381 0.421 0.463 0.530 0.6720.84 - 0.026 0.162 0.190 0.217 0.251 0.283 0.317 0.355 0.395 0.437 0.504 0.6450.85 - - 0.136 0.164 0.191 0.225 0.257 0.291 0.329 0.369 0.417 0.478 0.6200.86 - - 0.109 0.140 0.167 0.198 0.230 0.264 0.301 0.343 0.390 0.450 0.5930.87 - - 0.083 0.114 0.141 0.172 0.204 0.238 0.275 0.317 0.364 0.424 0.5670.88 - 0.054 0.085 0.112 0.143 0.175 0.209 0.246 0.288 0.335 0.395 0.5380.89 - - 0.028 0.059 0.086 0.117 0.149 0.183 0.230 0.262 0.309 0.369 0.5120.90 - - - 0.031 0.058 0.089 0.121 0.155 0.192 0.234 0.281 0.341 0.4840.91 - - - - 0.027 0.058 0.090 0.124 0.161 0.203 0.250 0.310 0.4530.92 - - - - - 0.031 0.063 0.097 0.134 0.176 0.223 0.283 0.4260.93 - - - - - - 0.032 0.066 0.103 0.145 0.192 0.252 0.395
Try the EM PFC Calculator.Visit our website
www.em.co.za/powerfactor

Annex-6
Charts & tables
Cha
rts &
tabl
es
kVAr at capacitance capacitance current in delta (A) line curent (A)525V 440V 415V 400V total (uF) in delta (uF) 525V 440V 415V 400V 525V 440V 415V 400V
10 9 8 164 82 8 7 7 13 12 1215 13 12 247 123 11 11 10 20 19 1820 18 17 329 164 15 14 14 26 25 2425 22 21 411 206 19 18 17 33 31 3030 27 25 493 247 23 21 21 39 37 3640 36 33 658 329 30 29 28 52 50 4845 40 37 740 370 34 32 31 59 56 5450 44 41 822 411 38 36 34 66 62 6060 53 50 987 493 45 43 41 79 74 7275 67 62 1234 617 57 54 52 98 93 8980 71 66 1316 658 61 57 55 105 99 9590 80 74 1480 740 68 64 62 118 111 107
100 89 83 1645 822 76 71 69 131 124 119120 107 99 1974 987 91 86 83 157 149 143125 111 103 2056 1028 95 89 86 164 155 149150 133 124 2467 1234 114 107 103 197 186 179175 156 145 2879 1439 133 125 121 230 217 209180 160 149 2961 1480 136 129 124 236 223 215200 178 165 3290 1645 152 143 138 262 248 239210 187 174 3454 1727 159 150 145 276 260 251225 200 186 3701 1851 170 161 155 295 278 268240 214 198 3948 1974 182 171 165 315 297 286250 222 207 4112 2056 189 179 172 328 309 298270 240 223 4441 2221 205 193 186 354 334 322275 245 227 4524 2262 208 196 189 361 340 328300 267 248 4935 2467 227 214 207 394 371 358325 289 269 5346 2673 246 232 224 426 402 388330 294 273 5428 2714 250 236 227 433 408 394350 311 289 5757 2879 265 250 241 459 433 418360 320 298 5922 2961 273 257 248 472 446 429375 334 310 6169 3084 284 268 258 492 464 447400 356 331 6580 3290 303 286 275 525 495 477420 374 347 6909 3454 318 300 289 551 520 501425 378 351 6991 3496 322 304 293 558 526 507450 400 372 7402 3701 341 322 310 590 557 537475 423 393 7814 3907 360 339 327 623 588 567480 427 397 7896 3948 364 343 331 630 594 573500 445 413 8225 4112 379 357 344 656 619 596600 534 496 9870 4935 455 429 413 787 743 716700 623 579 11515 5757 530 500 482 919 866 835
10 7 6 6 116 58 6 5 5 5 11 9 9 820 14 12 12 231 116 13 11 10 10 22 18 17 1730 21 19 17 347 173 19 16 15 15 33 28 26 2540 28 25 23 462 231 25 21 20 19 44 37 35 3450 35 31 29 578 289 32 27 25 24 55 46 43 4260 42 37 35 693 347 38 32 30 29 66 55 52 5070 49 44 41 809 404 44 37 35 34 77 65 61 5980 56 50 46 924 462 51 43 40 39 88 74 70 6790 63 56 52 1040 520 57 48 45 44 99 83 78 75100 70 62 58 1155 578 63 53 50 48 110 92 87 84120 84 75 70 1387 693 76 64 60 58 132 111 104 101140 98 87 81 1618 809 89 74 70 68 154 129 122 117160 112 100 93 1849 924 102 85 80 77 176 147 139 134180 126 112 104 2080 1040 114 96 90 87 198 166 156 151200 140 125 116 2311 1155 127 106 100 97 220 184 174 168220 155 137 128 2542 1271 140 117 110 106 242 203 191 184240 169 150 139 2773 1387 152 128 120 116 264 221 209 201260 183 162 151 3004 1502 165 138 130 126 286 240 226 218280 197 175 163 3235 1618 178 149 141 135 308 258 243 235300 211 187 174 3466 1733 190 160 151 145 330 276 261 251320 225 200 186 3697 1849 203 170 161 155 352 295 278 268400 281 250 232 4622 2311 254 213 201 193 440 369 348 335
Capacitor ratings at different voltages
Standard rated capacitor voltage 440V or 525V
Notes: 1. “capacitance total” refers to total calculated capacitance of the delta connected capacitor at rated capacitor voltage 2. “capacitance in delta” refers to calculated capacitance between any two terminals of delta wired capacitor 3. “line current” refers to calculated current at terminals of delta capacitor 4. calculated values may vary in practice due to tolerances allowed in manufacturing standards, and the effect of cables, discharge resistors, etc
Capacitor without reactor Capacitor without reactor Capacitor with reactor Capacitor with reactor
Standard type Standard class Reinforced classS.HS.T 15-25% 25-35% 35-50%
THDU/ THDI < 3% / < 10% < 4% / < 20% < 6% / < 40%
Notes: S.H and S.T are given in kVAS.H: weighted power of harmonic
generators in kVAS.T: power of the transformer HV/LV
Capacitor selection regarding harmonics
Charts & tables
Annex-7
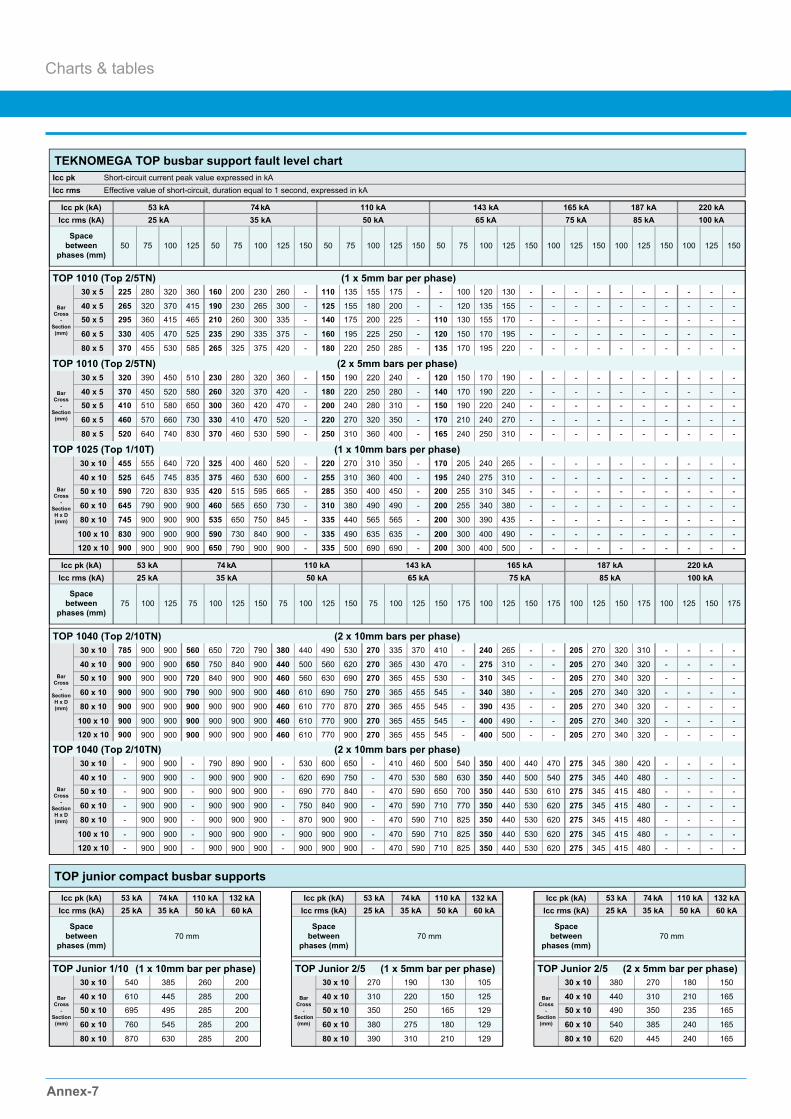
TOP 1010 (Top 2/5TN) (1 x 5mm bar per phase)
Icc pkIcc rms
Short-circuit current peak value expressed in kAEffective value of short-circuit, duration equal to 1 second, expressed in kA
30 x 5 225 280 320 360 160 200 230 260
40 x 5 265 320 370 415 190 230 265 300
50 x 5 295 360 415 465 210 260 300 335
60 x 5 330 405 470 525 235 290 335 375
80 x 5 370 455 530 585 265 325 375 420
-
-
-
-
-
110 135 155 175
125 155 180 200
140 175 200 225
160 195 225 250
180 220 250 285
-
-
-
-
-
- 100 120 130
- 120 135 155
110 130 155 170
120 150 170 195
135 170 195 220
-
-
-
-
-
- -
- -
- -
- -
- -
-
-
-
-
-
- -
- -
- -
- -
- -
-
-
-
-
-
- -
- -
- -
- -
- -
-
-
-
-
-
Icc pk (kA) 53 kA 74 kA 110 kA 143 kA 165 kAIcc rms (kA) 25 kA 35 kA 50 kA 65 kA 75 kA
187 kA85 kA
220 kA100 kA
Spacebetween
phases (mm)50 75 100 125 50 75 100 125 50150 75 100 125 150 50 75 100 125 150 100 125 150 100 125 150 100 125 150
Icc pk (kA) 53 kA 74 kA 110 kA 143 kA 165 kAIcc rms (kA) 25 kA 35 kA 50 kA 65 kA 75 kA
187 kA85 kA
220 kA100 kA
Spacebetween
phases (mm)75 100 125 75 100 125 150 75 125100 150 75 100 125 150 175 100 125 150 175 100 125 150 175 100 125 150 175
Icc pk (kA) 53 kA 74 kA 110 kA 132 kAIcc rms (kA) 25 kA 35 kA 50 kA 60 kA
Spacebetween
phases (mm)70 mm
Icc pk (kA) 53 kA 74 kA 110 kA 132 kAIcc rms (kA) 25 kA 35 kA 50 kA 60 kA
Spacebetween
phases (mm)70 mm
Icc pk (kA) 53 kA 74 kA 110 kA 132 kAIcc rms (kA) 25 kA 35 kA 50 kA 60 kA
Spacebetween
phases (mm)70 mm
TOP 1010 (Top 2/5TN) (2 x 5mm bars per phase)
TEKNOMEGA TOP busbar support fault level chart
TOP junior compact busbar supports
Charts & tables
Annex-7
BarCross
-Section
(mm)
TOP Junior 1/10 (1 x 10mm bar per phase)30 x 10 540 385 260 200
40 x 10 610 445 285 200
50 x 10 695 495 285 200
60 x 10 760 545 285 200
80 x 10 870 630 285 200
BarCross
-Section
(mm)
TOP Junior 2/5 (1 x 5mm bar per phase)30 x 10 270 190 130 105
40 x 10 310 220 150 125
50 x 10 350 250 165 129
60 x 10 380 275 180 129
80 x 10 390 310 210 129
BarCross
-Section
(mm)
TOP Junior 2/5 (2 x 5mm bar per phase)30 x 10 380 270 180 150
40 x 10 440 310 210 165
50 x 10 490 350 235 165
60 x 10 540 385 240 165
80 x 10 620 445 240 165
BarCross
-Section
(mm)
30 x 5 320 390 450 510 230 280 320 360
40 x 5 370 450 520 580 260 320 370 420
50 x 5 410 510 580 650 300 360 420 470
60 x 5 460 570 660 730 330 410 470 520
80 x 5 520 640 740 830 370 460 530 590
-
-
-
-
-
150 190 220 240
180 220 250 280
200 240 280 310
220 270 320 350
250 310 360 400
-
-
-
-
-
120 150 170 190
140 170 190 220
150 190 220 240
170 210 240 270
165 240 250 310
-
-
-
-
-
- -
- -
- -
- -
- -
-
-
-
-
-
- -
- -
- -
- -
- -
-
-
-
-
-
- -
- -
- -
- -
- -
-
-
-
-
-
BarCross
-Section
(mm)
TOP 1025 (Top 1/10T) (1 x 10mm bars per phase)30 x 10 455 555 640 720 325 400 460 520
40 x 10 525 645 745 835 375 460 530 600
50 x 10 590 720 830 935 420 515 595 665
60 x 10 645 790 900 900 460 565 650 730
80 x 10 745 900 900 900 535 650 750 845
-
-
-
-
-
220 270 310 350
255 310 360 400
285 350 400 450
310 380 490 490
335 440 565 565
-
-
-
-
-
170 205 240 265
195 240 275 310
200 255 310 345
200 255 340 380
200 300 390 435
-
-
-
-
-
- -
- -
- -
- -
- -
-
-
-
-
-
- -
- -
- -
- -
- -
-
-
-
-
-
- -
- -
- -
- -
- -
-
-
-
-
-
100 x 10 830 900 900 900 590 730 840 900 - 335 490 635 635 - 200 300 400 490 - - - - - - - - - -
120 x 10 900 900 900 900 650 790 900 900 - 335 500 690 690 - 200 300 400 500 - - - - - - - - - -
BarCross
-SectionH x D(mm)
TOP 1040 (Top 2/10TN) (2 x 10mm bars per phase)30 x 10 785 900 900 560 650 720 790 380
40 x 10 900 900 900 650 750 840 900 44050 x 10 900 900 900 720 840 900 900 460
60 x 10 900 900 900 790 900 900 900 460
80 x 10 900 900 900 900 900 900 900 460
440
500
560
610
610
490 530 270 335
560 620 270 365
630 690 270 365
690 750 270 365
770 870 270 365
370
430
455
455
455
410 - 240 265
470 - 275 310
530 - 310 345
545 - 340 380
545 - 390 435
-
-
-
-
-
- 205
- 205- 205
- 205
- 205
270
270
270
270
270
320 310
340 320
340 320
340 320
340 320
-
-
-
-
-
- -
- -
- -
- -
- -
-
-
-
-
-
100 x 10 900 900 900 900 900 900 900 460 610 770 900 270 365 455 545 - 400 490 - - 205 270 340 320 - - - -
120 x 10 900 900 900 900 900 900 900 460 610 770 900 270 365 455 545 - 400 500 - - 205 270 340 320 - - - -
BarCross
-SectionH x D(mm)
TOP 1040 (Top 2/10TN) (2 x 10mm bars per phase)30 x 10 - 900 900 - 790 890 900 -
40 x 10 - 900 900 - 900 900 900 -
50 x 10 - 900 900 - 900 900 900 -
60 x 10 - 900 900 - 900 900 900 -
80 x 10 - 900 900 - 900 900 900 -
530
620
690
750
870
600 650 - 410
690 750 - 470
770 840 - 470
840 900 - 470
900 900 - 470
460
530
590
590
590
500 540 350 400
580 630 350 440
650 700 350 440
710 770 350 440
710 825 350 440
440
500
530
530
530
470 275
540 275610 275
620 275
620 275
345
345
345
345
345
380 420
440 480
415 480
415 480
415 480
-
-
-
-
-
- -
- -
- -
- -
- -
-
-
-
-
-
100 x 10 - 900 900 - 900 900 900 - 900 900 900 - 470 590 710 825 350 440 530 620 275 345 415 480 - - - -
120 x 10 - 900 900 - 900 900 900 - 900 900 900 - 470 590 710 825 350 440 530 620 275 345 415 480 - - - -
BarCross
-SectionH x D(mm)
Annex-8
Charts & tables
Cha
rts &
tabl
es
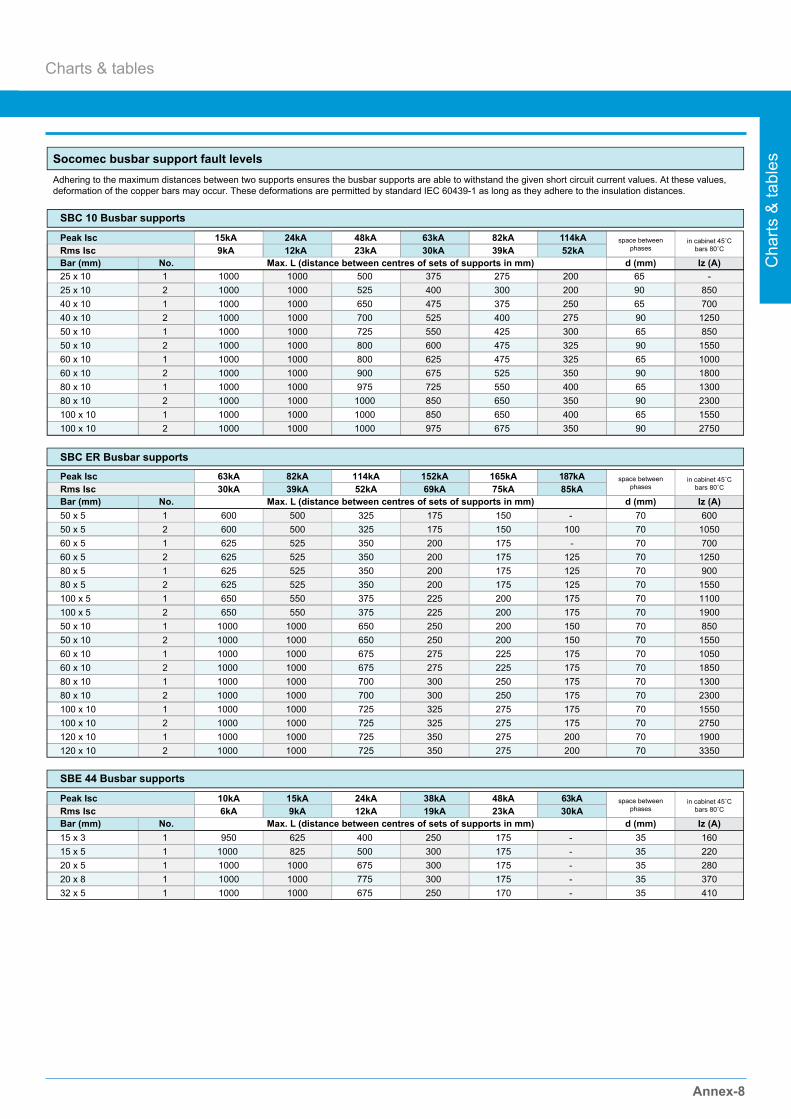
15kA 24kA 48kA 63kA 82kA 114kA9kA 12kA 23kA 30kA 39kA 52kA
Peak Isc Rms Isc Bar (mm) No. Max. L (distance between centres of sets of supports in mm)
space betweenphases
in cabinet 45˚Cbars 80˚C
d (mm) Iz (A)
63kA 82kA 114kA 152kA 165kA 187kA30kA 39kA 52kA 69kA 75kA 85kA
10kA 15kA 24kA 38kA 48kA 63kA6kA 9kA 12kA 19kA 23kA 30kA
Peak Isc Rms Isc Bar (mm) No. Max. L (distance between centres of sets of supports in mm)
space betweenphases
in cabinet 45˚Cbars 80˚C
d (mm) Iz (A)
Peak Isc Rms Isc Bar (mm) No. Max. L (distance between centres of sets of supports in mm)
space betweenphases
in cabinet 45˚Cbars 80˚C
d (mm) Iz (A)
25 x 10 1 1000 500 375 275 200 65 -25 x 10 2 1000 525 400 300 200 90 85040 x 10 1 1000 650 475 375 250 65 70040 x 10 2 1000 700 525 400 275 50 x 10 1 1000 725 550 425 300 50 x 10 2 1000 800 600 475 325 60 x 10 1 1000 800 625 475 325 60 x 10 2 1000 900 675 525 350 80 x 10 1 1000 975 725 550 400 80 x 10 2 1000 1000 850 650 350 100 x 10 1 1000 1000 850 650 400 100 x 10 2 1000
100010001000100010001000100010001000100010001000 1000 975 675 350
906590659065906590
12508501550100018001300230015502750
SBC 10 Busbar supports
50 x 5 1 500 325 175 150 - 70 60050 x 5 2 500 325 175 150 100 70 105060 x 5 1 525 350 200 175 - 70 70060 x 5 2 525 350 200 175 12580 x 5 1 525 350 200 175 12580 x 5 2 525 350 200 175 125100 x 5 1 550 375 225 200 175100 x 5 2 550 375 225 200 17550 x 10 1 1000 650 250 200 15050 x 10 2 1000 650 250 200 15060 x 10 1 1000 675 275 225 17560 x 10 2 1000 675 275 225 17580 x 10 1 1000 700 300 250 17580 x 10 2 1000 700 300 250 175100 x 10 1 1000 725 325 275 175100 x 10 2 1000 725 325 275 175120 x 10 1 1000 725 350 275 200120 x 10 2 1000
600600625625625625650650
1000 1000 1000 1000 1000 1000 1000 1000 1000 1000 725 350 275 200
707070707070707070707070707070
1250900155011001900850155010501850130023001550275019003350
SBC ER Busbar supports
15 x 3 1 950 625 400 250 175 - 16015 x 5 1 1000 825 500 300 175 - 22020 x 5 1 675 300 175 - 28020 x 8 1 775 300 175 - 37032 x 5 1 675 250
1000 10001000 10001000 1000 170 - 410
3535353535
SBE 44 Busbar supports
Adhering to the maximum distances between two supports ensures the busbar supports are able to withstand the given short circuit current values. At these values, deformation of the copper bars may occur. These deformations are permitted by standard IEC 60439-1 as long as they adhere to the insulation distances.
Socomec busbar support fault levels
Charts & tables
Annex-8
Charts & tables
Annex-9
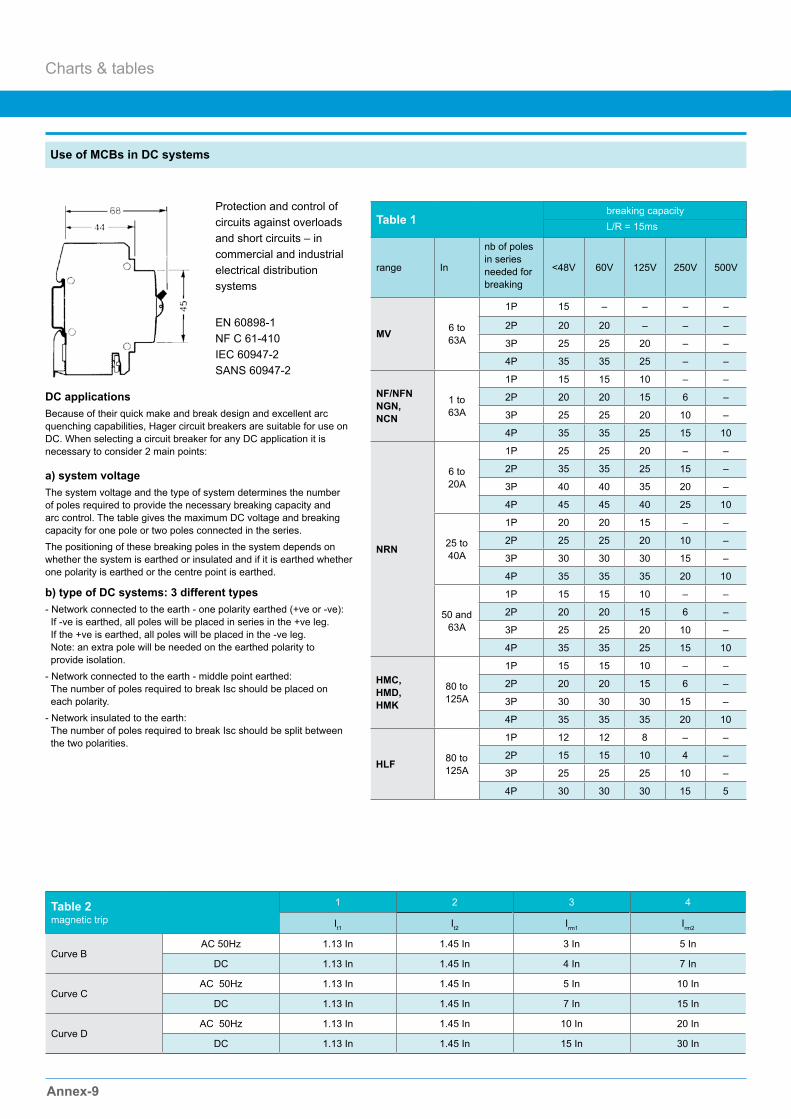
Use of MCBs in DC systems
DC applicationsBecause of their quick make and break design and excellent arc quenching capabilities, Hager circuit breakers are suitable for use on DC. When selecting a circuit breaker for any DC application it is necessary to consider 2 main points:
a) system voltageThe system voltage and the type of system determines the number of poles required to provide the necessary breaking capacity and arc control. The table gives the maximum DC voltage and breaking capacity for one pole or two poles connected in the series.The positioning of these breaking poles in the system depends on whether the system is earthed or insulated and if it is earthed whether one polarity is earthed or the centre point is earthed.
b) type of DC systems: 3 different types- Network connected to the earth - one polarity earthed (+ve or -ve): If -ve is earthed, all poles will be placed in series in the +ve leg. If the +ve is earthed, all poles will be placed in the -ve leg. Note: an extra pole will be needed on the earthed polarity to provide isolation.- Network connected to the earth - middle point earthed: The number of poles required to break Isc should be placed on each polarity.- Network insulated to the earth: The number of poles required to break Isc should be split between the two polarities.
Table 2magnetic trip
1 2 3 4
It1 It2 Irm1 Irm2
Curve BAC 50Hz 1.13 In 1.45 In 3 In 5 In
DC 1.13 In 1.45 In 4 In 7 In
Curve CAC 50Hz 1.13 In 1.45 In 5 In 10 In
DC 1.13 In 1.45 In 7 In 15 In
Curve DAC 50Hz 1.13 In 1.45 In 10 In 20 In
DC 1.13 In 1.45 In 15 In 30 In
Table 1breaking capacity (kA)
L/R = 15ms
range In
nb of poles in series needed for breaking
<48V 60V 125V 250V 500V
MV 6 to 63A
1P 15 – – – –
2P 20 20 – – –
3P 25 25 20 – –
4P 35 35 25 – –
NF/NFNNGN,NCN
1 to 63A
1P 15 15 10 – –
2P 20 20 15 6 –
3P 25 25 20 10 –
4P 35 35 25 15 10
NRN
6 to 20A
1P 25 25 20 – –
2P 35 35 25 15 –
3P 40 40 35 20 –
4P 45 45 40 25 10
25 to 40A
1P 20 20 15 – –
2P 25 25 20 10 –
3P 30 30 30 15 –
4P 35 35 35 20 10
50 and 63A
1P 15 15 10 – –
2P 20 20 15 6 –
3P 25 25 20 10 –
4P 35 35 25 15 10
HMC, HMD,HMK
80 to 125A
1P 15 15 10 – –
2P 20 20 15 6 –
3P 30 30 30 15 –
4P 35 35 35 20 10
HLF 80 to 125A
1P 12 12 8 – –
2P 15 15 10 4 –
3P 25 25 25 10 –
4P 30 30 30 15 5
Protection and control of circuits against overloads and short circuits ‒ in commercial and industrial electrical distribution systems
EN 60898-1NF C 61-410IEC 60947-2SANS 60947-2
breaking capacity L/R = 15ms
Annex-10
Charts & tables
Cha
rts &
tabl
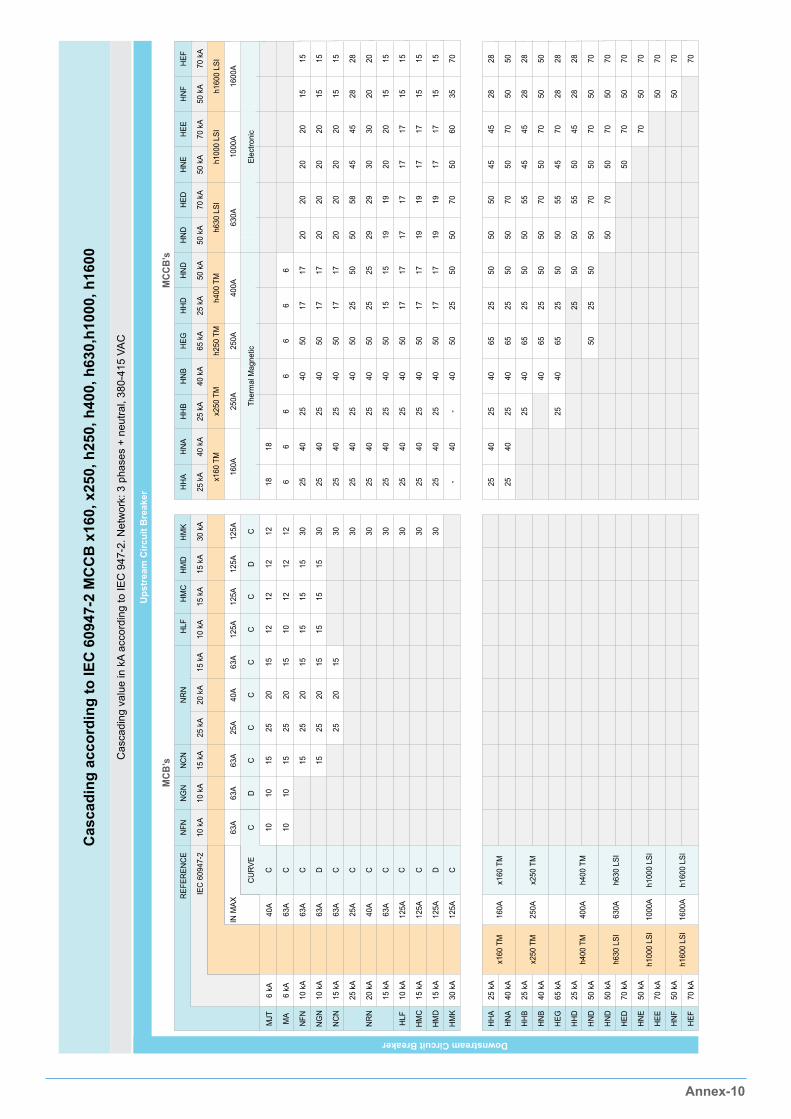
es
Cas
cadi
ng a
ccor
ding
to IE
C 6
0947
-2 M
CC
B x
160,
x25
0, h
250,
h40
0, h
630,
h100
0, h
1600
Cas
cadi
ng v
alue
in k
A ac
cord
ing
to IE
C 9
47-2
. Net
wor
k: 3
pha
ses
+ ne
utra
l, 38
0-41
5 VA
C
Ups
trea
m C
ircui
t Bre
aker
Downstream Circuit Breaker
MCB
’sM
CCB’
sR
EFER
ENC
E
MJT MA
NFN
NG
N
NC
N
HLF
HM
C
HM
D
HH
A
HN
A
HH
B
HN
B
HEG
HH
D
HN
D
HN
D
HN
E
HEE
25 k
A
40 k
A
25 k
A
40 k
A
65 k
A
25 k
A
50 k
A
50 k
A
50 k
A
70 k
A
x160
TM
x250
TM
h400
TM
h630
LSI
h100
0 LS
I
h160
0 LS
I
x160
TM
x250
TM
h400
TM
h630
LSI
h100
0 LS
I
h160
0 LS
I
6 kA
6 kA
10 k
A
10 k
A
15 k
A
15 k
A
10 k
A
15 k
A
15 k
A
1010
1010
15 15 15
25 25 25
2015
1212
1212
1510
1212
12
1515
1515
30
20 20
1525
1515
1515
30 30 30 30 30 30 30 30
20
2515
20
2540 40
25 25 25
40 40 40 40
50 50 65 65 65 65 65
C C C D
NR
N20
kA
25 k
AC CC C C
HED
70 k
A
HN
F50
kA
HEF
70 k
A
NFN
10 k
A
C
NG
N
10 k
A
D
NC
N
15 k
A
C
NR
N
25 k
A
C
HLF
20 k
A
C
15 k
A
C
HM
CH
MD
HM
K
10 k
A
DC
15 k
A15
kA
30 k
A
63A
63A
63A
25A
40A
63A
125A
125A
125A
125A
C
IEC
609
47-2
CU
RVE
IN M
AX
17 17 25 25 25 25 25 25 2550
17 17 50 50 50 50 50 50 50
19 19 50 50 50 50 50 50 50 50
19 19 50 70 55 70 55 55 70 70
17 17 45 50 45 50 45 50 50 50 50
17 17 45 70 45 70 70 45 70 70 70 70
28 50 28 50 28 28 50 50 50 50 50 50
28 50 28 50 28 28 70 70 70 70 70 70 70
HH
A
25 k
A x160
TM
18 6 25 25 25 25 25
40-
4050
2550
5070
5060
- 25 25
40 4025 25 25
40 40 40
25 25
HN
A
40 k
A
x250
TM
18 6 40 40 40 40 40 40
HH
B
25 k
A
6 25 25 25 25 25 25
HN
B
40 k
A
6 40 40 40 40 40 40
HEG
65 k
A
h250
TM
6 50 50 50 50 50 50
h400
TM
HH
D
25 k
A
6 17 17 17 25 25 15
HN
D
50 k
A
h630
LSI
6 17 17 17 50 25 15
HN
D
50 k
A
20 20 20 50 29 19
HED
70 k
A
h100
0 LS
I
20 20 20 58 29 19
HN
E
50 k
A
20 20 20 45 30 20
HM
K30
kA
160A
250A
400A
630A
1000
A
40A
63A
63A
63A
63A
125A
125A
63A
125A
40A
25A
1600
A
125A
D C
2540
2540
5017
1717
1717
20 20 20 20 17HEE
HN
FH
EF
70 k
A50
kA
70 k
A
h160
0 LS
I
45 30
15 15 3515 15 15 15 1528 20
15 15 7015 15 15 15 1528 20
160A
Ther
mal
Mag
netic
Elec
troni
c
250A
250A
400A
630A
1000
A16
00A
C
C
Annex-10
Charts & tables
Annex-11Annex-11
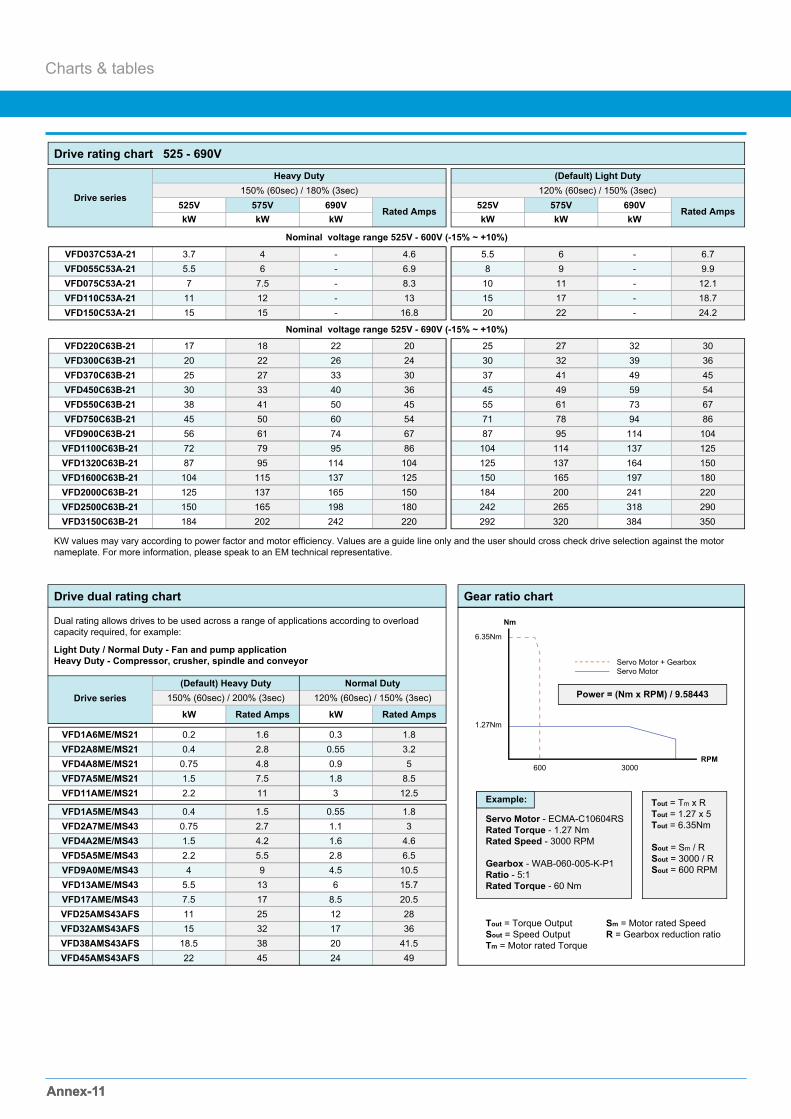
Drive rating chart 525 - 690V
Drive dual rating chart Gear ratio chart
Charts & tables
KW values may vary according to power factor and motor efficiency. Values are a guide line only and the user should cross check drive selection against the motor nameplate. For more information, please speak to an EM technical representative.
Dual rating allows drives to be used across a range of applications according to overload capacity required, for example:
Light Duty / Normal Duty - Fan and pump applicationHeavy Duty - Compressor, crusher, spindle and conveyor
Nominal voltage range 525V - 600V (-15% ~ +10%)
Nominal voltage range 525V - 690V (-15% ~ +10%)
Drive series
Drive series
VFD037C53A-21
Heavy Duty
(Default) Heavy Duty Normal Duty
(Default) Light Duty150% (60sec) / 180% (3sec)
150% (60sec) / 200% (3sec) 120% (60sec) / 150% (3sec)
Servo Motor - ECMA-C10604RSRated Torque - 1.27 NmRated Speed - 3000 RPM
Gearbox - WAB-060-005-K-P1Ratio - 5:1Rated Torque - 60 Nm
Servo Motor + GearboxServo Motor
Tout = Tm x RTout = 1.27 x 5Tout = 6.35Nm
Sout = Sm / RSout = 3000 / RSout = 600 RPM
Tout = Torque OutputSout = Speed OutputTm = Motor rated Torque
Sm = Motor rated SpeedR = Gearbox reduction ratio
Power = (Nm x RPM) / 9.58443
6.35Nm
1.27Nm
600
Example:
3000RPM
Nm
525V 575V 690V Rated Amps
kW Rated Amps kW Rated Amps
525V 575V 690V Rated AmpskW kW kW kW kW kW
3.7 4 - 4.6 5.5 6 - 6.75.5 6 - 6.9 8 9 - 9.97 7.5 - 8.3 10 11 - 12.111 12 - 13 15 17 - 18.715 15 - 16.8 20 22 - 24.2
17 18 22 20 25 27 32 3020 22 26 24 30 32 39 3625 27 33 30 37 41 49 4530 33 40 36 45 49 59 5438 41 50 45 55 61 73 6745 50 60 54 71 78 94 8656 61 74 67 87 95 114 10472 79 95 86 104 114 137 12587 95 114 104 125 137 164 150
104 115 137 125 150 165 197 180125 137 165 150 184 200 241 220150 165 198 180 242 265 318 290184 202 242 220
0.2 1.6 0.3 1.80.4 2.8 0.55 3.2
0.75 4.8 0.9 51.5 7.5 1.8 8.52.2 11 3 12.5
0.4 1.5 0.55 1.80.75 2.7 1.1 31.5 4.2 1.6 4.62.2 5.5 2.8 6.54 9 4.5 10.5
5.5 13 6 15.77.5 17 8.5 20.511 25 12 2815 32 17 36
18.5 38 20 41.522 45 24 49
292 320 384 350
120% (60sec) / 150% (3sec)
VFD055C53A-21VFD075C53A-21VFD110C53A-21VFD150C53A-21
VFD1A6ME/MS21VFD2A8ME/MS21VFD4A8ME/MS21VFD7A5ME/MS21VFD11AME/MS21
VFD1A5ME/MS43VFD2A7ME/MS43VFD4A2ME/MS43VFD5A5ME/MS43VFD9A0ME/MS43VFD13AME/MS43VFD17AME/MS43VFD25AMS43AFSVFD32AMS43AFSVFD38AMS43AFSVFD45AMS43AFS
VFD220C63B-21VFD300C63B-21VFD370C63B-21VFD450C63B-21VFD550C63B-21VFD750C63B-21VFD900C63B-21VFD1100C63B-21VFD1320C63B-21VFD1600C63B-21VFD2000C63B-21VFD2500C63B-21VFD3150C63B-21
Annex-?
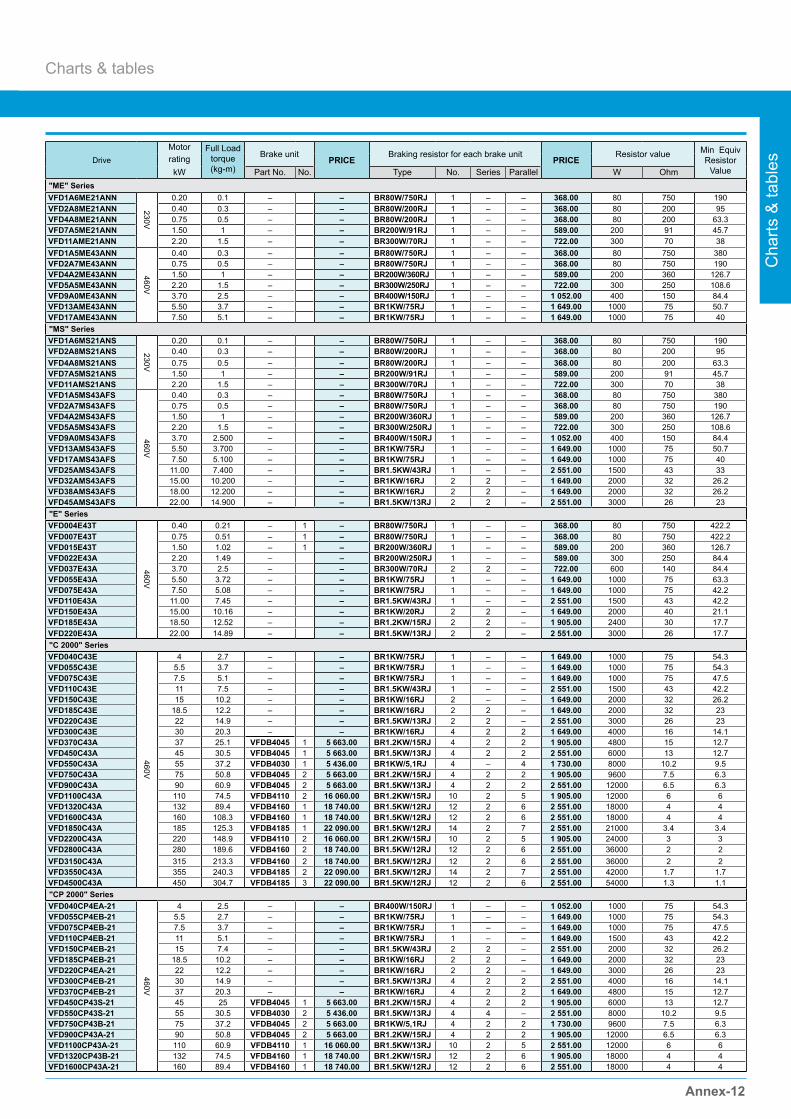
Annex-12
Charts & tables
Cha
rts &
tabl
esDriveMotor Full Load
torque(kg-m)
Brake unitPRICE
Braking resistor for each brake unitPRICE
Resistor value Min EquivResistor
ValueratingkW Part No. No. Type No. Series Parallel W Ohm
"ME" SeriesVFD1A6ME21ANN
230V
0.20 0.1 – – BR80W/750RJ 1 – – 368.00 80 750 190VFD2A8ME21ANN 0.40 0.3 – – BR80W/200RJ 1 – – 368.00 80 200 95VFD4A8ME21ANN 0.75 0.5 – – BR80W/200RJ 1 – – 368.00 80 200 63.3VFD7A5ME21ANN 1.50 1 – – BR200W/91RJ 1 – – 589.00 200 91 45.7VFD11AME21ANN 2.20 1.5 – – BR300W/70RJ 1 – – 722.00 300 70 38VFD1A5ME43ANN
460V
0.40 0.3 – – BR80W/750RJ 1 – – 368.00 80 750 380VFD2A7ME43ANN 0.75 0.5 – – BR80W/750RJ 1 – – 368.00 80 750 190VFD4A2ME43ANN 1.50 1 – – BR200W/360RJ 1 – – 589.00 200 360 126.7VFD5A5ME43ANN 2.20 1.5 – – BR300W/250RJ 1 – – 722.00 300 250 108.6VFD9A0ME43ANN 3.70 2.5 – – BR400W/150RJ 1 – – 1 052.00 400 150 84.4VFD13AME43ANN 5.50 3.7 – – BR1KW/75RJ 1 – – 1 649.00 1000 75 50.7VFD17AME43ANN 7.50 5.1 – – BR1KW/75RJ 1 – – 1 649.00 1000 75 40"MS" SeriesVFD1A6MS21ANS
230V
0.20 0.1 – – BR80W/750RJ 1 – – 368.00 80 750 190VFD2A8MS21ANS 0.40 0.3 – – BR80W/200RJ 1 – – 368.00 80 200 95VFD4A8MS21ANS 0.75 0.5 – – BR80W/200RJ 1 – – 368.00 80 200 63.3VFD7A5MS21ANS 1.50 1 – – BR200W/91RJ 1 – – 589.00 200 91 45.7VFD11AMS21ANS 2.20 1.5 – – BR300W/70RJ 1 – – 722.00 300 70 38VFD1A5MS43AFS
460V
0.40 0.3 – – BR80W/750RJ 1 – – 368.00 80 750 380VFD2A7MS43AFS 0.75 0.5 – – BR80W/750RJ 1 – – 368.00 80 750 190VFD4A2MS43AFS 1.50 1 – – BR200W/360RJ 1 – – 589.00 200 360 126.7VFD5A5MS43AFS 2.20 1.5 – – BR300W/250RJ 1 – – 722.00 300 250 108.6VFD9A0MS43AFS 3.70 2.500 – – BR400W/150RJ 1 – – 1 052.00 400 150 84.4VFD13AMS43AFS 5.50 3.700 – – BR1KW/75RJ 1 – – 1 649.00 1000 75 50.7VFD17AMS43AFS 7.50 5.100 – – BR1KW/75RJ 1 – – 1 649.00 1000 75 40VFD25AMS43AFS 11.00 7.400 – – BR1.5KW/43RJ 1 – – 2 551.00 1500 43 33VFD32AMS43AFS 15.00 10.200 – – BR1KW/16RJ 2 2 – 1 649.00 2000 32 26.2VFD38AMS43AFS 18.00 12.200 – – BR1KW/16RJ 2 2 – 1 649.00 2000 32 26.2VFD45AMS43AFS 22.00 14.900 – – BR1.5KW/13RJ 2 2 – 2 551.00 3000 26 23"E" SeriesVFD004E43T
460V
0.40 0.21 – 1 – BR80W/750RJ 1 – – 368.00 80 750 422.2VFD007E43T 0.75 0.51 – 1 – BR80W/750RJ 1 – – 368.00 80 750 422.2VFD015E43T 1.50 1.02 – 1 – BR200W/360RJ 1 – – 589.00 200 360 126.7VFD022E43A 2.20 1.49 – – BR200W/250RJ 1 – – 589.00 300 250 84.4VFD037E43A 3.70 2.5 – – BR300W/70RJ 2 2 – 722.00 600 140 84.4VFD055E43A 5.50 3.72 – – BR1KW/75RJ 1 – – 1 649.00 1000 75 63.3VFD075E43A 7.50 5.08 – – BR1KW/75RJ 1 – – 1 649.00 1000 75 42.2VFD110E43A 11.00 7.45 – – BR1.5KW/43RJ 1 – – 2 551.00 1500 43 42.2VFD150E43A 15.00 10.16 – – BR1KW/20RJ 2 2 – 1 649.00 2000 40 21.1VFD185E43A 18.50 12.52 – – BR1.2KW/15RJ 2 2 – 1 905.00 2400 30 17.7VFD220E43A 22.00 14.89 – – BR1.5KW/13RJ 2 2 – 2 551.00 3000 26 17.7"C 2000" SeriesVFD040C43E
460V
4 2.7 – – BR1KW/75RJ 1 – – 1 649.00 1000 75 54.3VFD055C43E 5.5 3.7 – – BR1KW/75RJ 1 – – 1 649.00 1000 75 54.3VFD075C43E 7.5 5.1 – – BR1KW/75RJ 1 – – 1 649.00 1000 75 47.5VFD110C43E 11 7.5 – – BR1.5KW/43RJ 1 – – 2 551.00 1500 43 42.2VFD150C43E 15 10.2 – – BR1KW/16RJ 2 – – 1 649.00 2000 32 26.2VFD185C43E 18.5 12.2 – – BR1KW/16RJ 2 2 – 1 649.00 2000 32 23VFD220C43E 22 14.9 – – BR1.5KW/13RJ 2 2 – 2 551.00 3000 26 23VFD300C43E 30 20.3 – – BR1KW/16RJ 4 2 2 1 649.00 4000 16 14.1VFD370C43A 37 25.1 VFDB4045 1 5 663.00 BR1.2KW/15RJ 4 2 2 1 905.00 4800 15 12.7VFD450C43A 45 30.5 VFDB4045 1 5 663.00 BR1.5KW/13RJ 4 2 2 2 551.00 6000 13 12.7VFD550C43A 55 37.2 VFDB4030 1 5 436.00 BR1KW/5,1RJ 4 – 4 1 730.00 8000 10.2 9.5VFD750C43A 75 50.8 VFDB4045 2 5 663.00 BR1.2KW/15RJ 4 2 2 1 905.00 9600 7.5 6.3VFD900C43A 90 60.9 VFDB4045 2 5 663.00 BR1.5KW/13RJ 4 2 2 2 551.00 12000 6.5 6.3VFD1100C43A 110 74.5 VFDB4110 2 16 060.00 BR1.2KW/15RJ 10 2 5 1 905.00 12000 6 6VFD1320C43A 132 89.4 VFDB4160 1 18 740.00 BR1.5KW/12RJ 12 2 6 2 551.00 18000 4 4VFD1600C43A 160 108.3 VFDB4160 1 18 740.00 BR1.5KW/12RJ 12 2 6 2 551.00 18000 4 4VFD1850C43A 185 125.3 VFDB4185 1 22 090.00 BR1.5KW/12RJ 14 2 7 2 551.00 21000 3.4 3.4VFD2200C43A 220 148.9 VFDB4110 2 16 060.00 BR1.2KW/15RJ 10 2 5 1 905.00 24000 3 3VFD2800C43A 280 189.6 VFDB4160 2 18 740.00 BR1.5KW/12RJ 12 2 6 2 551.00 36000 2 2VFD3150C43A 315 213.3 VFDB4160 2 18 740.00 BR1.5KW/12RJ 12 2 6 2 551.00 36000 2 2VFD3550C43A 355 240.3 VFDB4185 2 22 090.00 BR1.5KW/12RJ 14 2 7 2 551.00 42000 1.7 1.7VFD4500C43A 450 304.7 VFDB4185 3 22 090.00 BR1.5KW/12RJ 12 2 6 2 551.00 54000 1.3 1.1"CP 2000" SeriesVFD040CP4EA-21
460V
4 2.5 – – BR400W/150RJ 1 – – 1 052.00 1000 75 54.3VFD055CP4EB-21 5.5 2.7 – – BR1KW/75RJ 1 – – 1 649.00 1000 75 54.3VFD075CP4EB-21 7.5 3.7 – – BR1KW/75RJ 1 – – 1 649.00 1000 75 47.5VFD110CP4EB-21 11 5.1 – – BR1KW/75RJ 1 – – 1 649.00 1500 43 42.2VFD150CP4EB-21 15 7.4 – – BR1.5KW/43RJ 2 2 – 2 551.00 2000 32 26.2VFD185CP4EB-21 18.5 10.2 – – BR1KW/16RJ 2 2 – 1 649.00 2000 32 23VFD220CP4EA-21 22 12.2 – – BR1KW/16RJ 2 2 – 1 649.00 3000 26 23VFD300CP4EB-21 30 14.9 – – BR1.5KW/13RJ 4 2 2 2 551.00 4000 16 14.1VFD370CP4EB-21 37 20.3 – – BR1KW/16RJ 4 2 2 1 649.00 4800 15 12.7VFD450CP43S-21 45 25 VFDB4045 1 5 663.00 BR1.2KW/15RJ 4 2 2 1 905.00 6000 13 12.7VFD550CP43S-21 55 30.5 VFDB4030 2 5 436.00 BR1.5KW/13RJ 4 4 – 2 551.00 8000 10.2 9.5VFD750CP43B-21 75 37.2 VFDB4045 2 5 663.00 BR1KW/5,1RJ 4 2 2 1 730.00 9600 7.5 6.3VFD900CP43A-21 90 50.8 VFDB4045 2 5 663.00 BR1.2KW/15RJ 4 2 2 1 905.00 12000 6.5 6.3VFD1100CP43A-21 110 60.9 VFDB4110 1 16 060.00 BR1.5KW/13RJ 10 2 5 2 551.00 12000 6 6VFD1320CP43B-21 132 74.5 VFDB4160 1 18 740.00 BR1.2KW/15RJ 12 2 6 1 905.00 18000 4 4VFD1600CP43A-21 160 89.4 VFDB4160 1 18 740.00 BR1.5KW/12RJ 12 2 6 2 551.00 18000 4 4
Charts & tables
Annex-13Annex-13
Namur version namur-DIN 19234 ( 2 wire )
Two wire non-amplified DC sensors contain only the oscillator and are adapted to control an electronic amplified threshold circuit. Only a few components are required, guaranteeing maximum operational safety and reliability. The sensor is not susceptible to inductive or capacitive irradiations into the amplifier.
Ideally suited for explosion proof applications connected intrinsically safe amplifiers.
Nominal voltage: 8 VDC ( 7.7 ÷ 9 V ) - Load resistant 1 kΩOutput current: Presence of metal ≤ 1 mA Absence of metal ≤ 3 mA
DC version direct voltage ( 3 wire )
Amplified Dc sensors containing an output amplifier. In addition to the oscillator they are supplied with functions NO or NC in NPN or PNP. As standard this version if sensor is protected against short circuit and against polarity and peaks created by the disconnection of inductive loads.
AC version alternative voltage ( 2 wire )
Two wire amplified AC sensors containing a thyristor output amplifier, in addition to the oscillator the load ( i.e. relay ) is connected in series. Due to this system attention must be paid ( particularly in the low voltage range ) if electronic controls have high resistance inputs, as there is a residual current flow even when in the open state. All AC sensors protected against overvoltage created by the power supply.
Capacitive proximity switches
Capacitive sensors
These are electronic transducers which give output signals when any material ( wood, marble, metals, glass, coffee, fodder, etc. ) affects their sensing part without necessarily entering in contact with them. They have high resistance to knocks and vibrations and can operate in severe ambient conditions since they are completely static. The devices can be supplied with a rapid or delayed intervention.
Reduction factors inductive sensors capacitive sensors Aq37 1 Metals c.a.1 Stainless steel 0.85 Water c.a.1 Brass, bronze 0.55 Plastic c.a.0.5 Aluminium 0.45 Glass c.a.0.5 Copper 0.40 Wood c.a.0.4
Inductive proximity switches

Notes
Related Documents