Charleston Tourism by the Numbers Bing Pan, Ph.D. Office of Tourism Analysis, School of Business, College of Charleston May 21, 2015

Welcome message from author
This document is posted to help you gain knowledge. Please leave a comment to let me know what you think about it! Share it to your friends and learn new things together.
Transcript

Charleston Tourism by the Numbers
Bing Pan, Ph.D. Office of Tourism Analysis, School of Business, College of Charleston
May 21, 2015

Introduction
• Office of Tourism Analysis, School of Business, College of Charleston, has been funded mainly by CACVB and the College of Charleston since 2005
• Dr. Bing Pan, originally from China, received his Ph.D. in Tourism Management from the University of Illinois, was a Post-Doc Fellow at Cornell University, and has worked in the Office since 2005

“We are at a tipping point…” “This city has tipped over…”
--------- Comments from Charleston residents, Post and Courier, June 12, 2014

This is NOT New…
Tourism Impact and Management Study, Charleston, South Carolina, 1978
We need accurate numbers, however estimating tourism numbers is tricky…

The Story of Blind Men and An Elephant
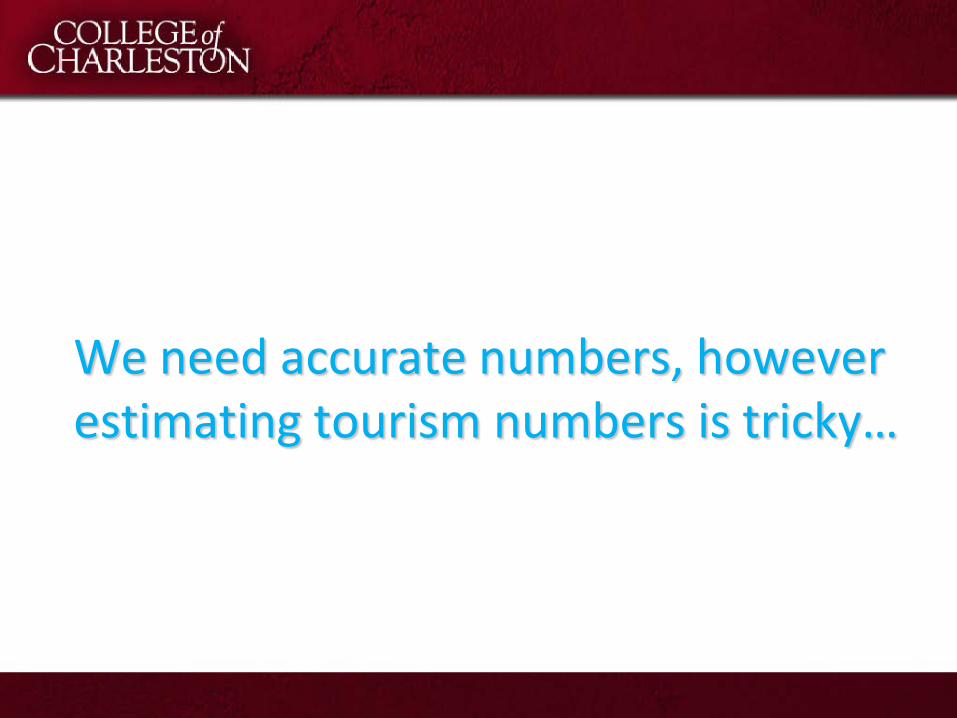
Indicators of the Tourism Industry
• Behavioral Indicators– Foot traffic, attendance at gated events, number of
cars, cruise passenger count, traffic on CVB website• Financial Indicators
– Revenue and taxes• Supply Indicators
– Hotel inventory

Content
• Current tourism stats • Recent history• Comparison with other cities• Data Sources:
– Visitor intercept survey– Household survey – Industrial reports– Star Travel Report (STR)

What is a Charleston visitor?• Due to the tight economic connection in the Charleston-
Berkeley-Dorchester tri-county area, a Charleston visitor is considered any traveler from outside the tri-county area taking a trip to the area, for less than a year, for any purpose other than to be employed in Charleston. These purposes could include business, leisure, or other personal purpose.

Overall Numbers (2014)
• About 5 million annual visitors, 90% stay overnight• $2.6 billion direct spending; $3.3 billion economic
impact• 13% of total Charleston tri-county area’s economy• Generated $309 million in tax dollars• Supports 39K jobs in the area, or 1/13 private jobs in
Charleston
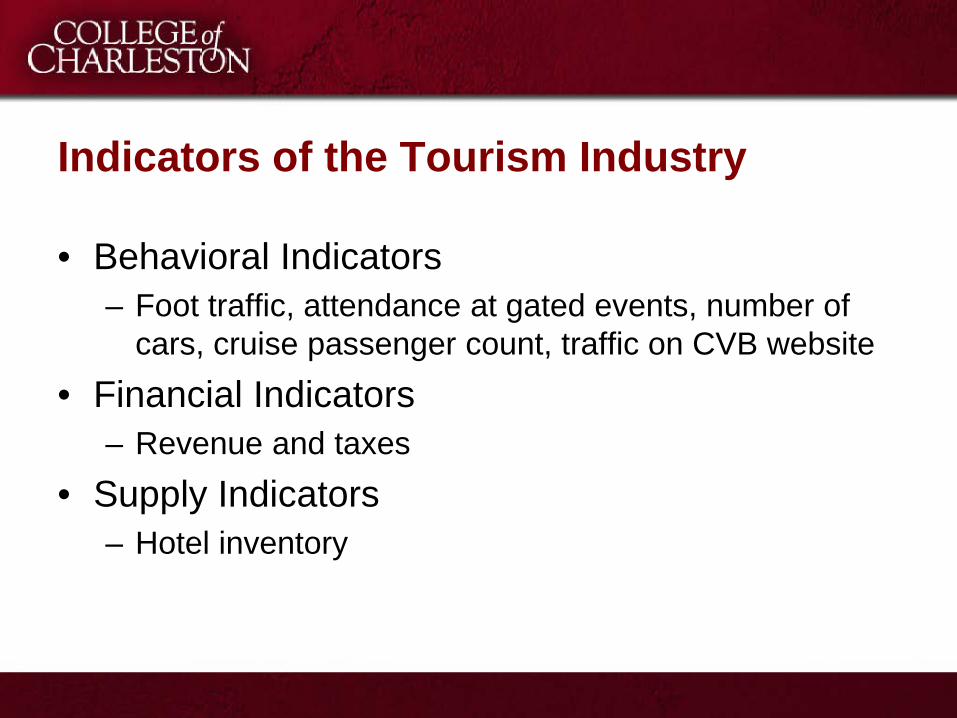
Employment Numbers (2013)
Rank Aggregated IMPLAN Industry Sectors Direct Jobs1 Percent
1 Retail Trade 38,979 11.0%2 Health Care & Social Services 35,388 10.0%3 Professional & Technical Services 33,054 9.3%4 Administrative & Waste Services 31,103 8.8%5 Non-Resident Tourism 27,299 7.7%6 Other Services 26,918 7.6%7 Real Estate & Rental 24,859 7.0%8 Manufacturing 24,247 6.9%9 Construction 21,848 6.2%

Charleston Visitor Demographics, 2014
9% of Visitors are International

Charleston Visitor Demographics, 2014MSA # %New York-Northern New Jersey-Long Island, NY-NJ-PA 36 5.5Boston-Cambridge-Quincy, MA-NH MSA 20 3.1Washington-Arlington-Alexandria, DC-VA-MD-WV MSA 20 3.1Chicago-Naperville-Joliet, IL-IN-WI MSA 18 2.8Charlotte-Gastonia-Concord, NC-SC MSA 15 2.4Columbia, SC MSA 15 2.3Myrtle Beach-Conway-North Myrtle Beach, SC MSA 15 2.2Hilton Head Island-Bluffton-Beaufort, SC MSA 14 2.2Miami-Fort Lauderdale-Pompano Beach, FL MSA 12 1.8Baltimore-Towson, MD MSA 11 1.8Greenville-Mauldin-Easley, SC MSA 11 1.7Minneapolis-St. Paul-Bloomington, MN-WI MSA 10 1.6Raleigh-Cary, NC MSA 9 1.4Seattle-Tacoma-Bellevue, WA MSA 9 1.4Akron, OH MSA 9 1.3Spartanburg, SC MSA 9 1.3Cincinnati-Middletown, OH-KY-IN MSA 8 1.3St. Louis, MO-IL MSA 8 1.3Atlanta-Sandy Springs-Marietta, GA MSA 8 1.3Pittsburgh, PA MSA 8 1.3
Top 20 Origination MSAs

Charleston Visitor Demographics, 2014
1828
52
24 27
5561
116 118
129
63
104
0
20
40
60
80
100
120
140
1 2 3 4 5 6 7 8 9 10 11 12 13
Age of Visitors

Charleston Visitor Demographics, 2014
41.2%
37.5%
6.9%
5.4% 4.8%
0.8%1.9% 1.1% 0.3%
Employment Status
1 2 3 4 5
6 7 8 9
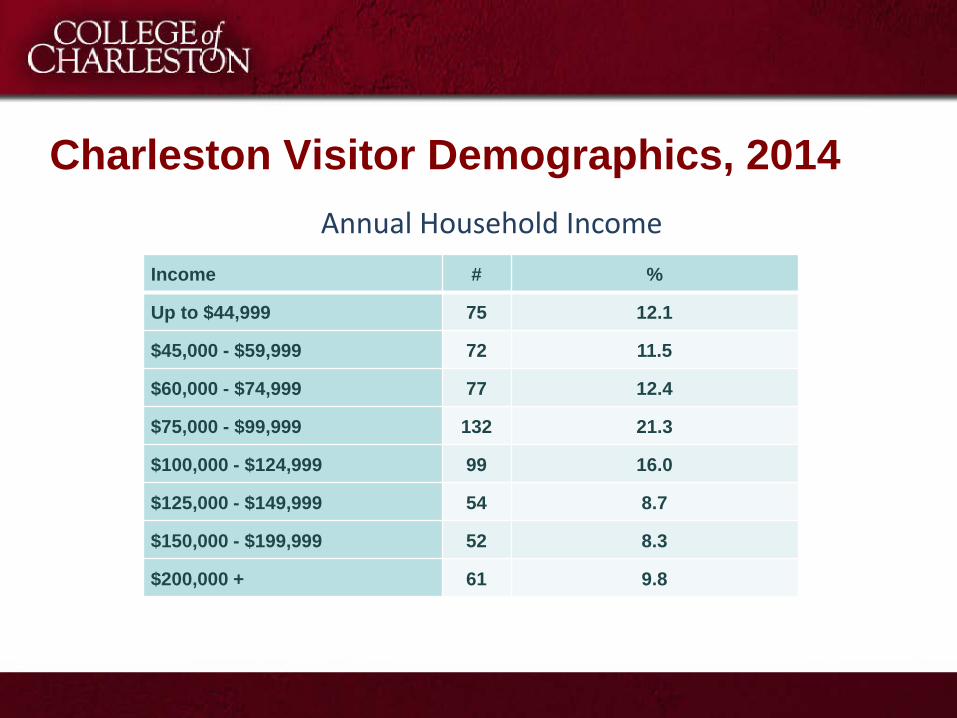
Charleston Visitor Demographics, 2014
Income # %
Up to $44,999 75 12.1
$45,000 - $59,999 72 11.5
$60,000 - $74,999 77 12.4
$75,000 - $99,999 132 21.3
$100,000 - $124,999 99 16.0
$125,000 - $149,999 54 8.7
$150,000 - $199,999 52 8.3
$200,000 + 61 9.8
Annual Household Income

Charleston Visitor Demographics, 2014
Mode of Transportation # %Personal Vehicle 482 65.3Airplane 136 18.4Rental Vehicle 45 6.1Flew to Another City and then Rented a Car* 43 5.8Other 16 2.2Amtrak 7 0.9Cruise Ship 7 0.9Private Boat 3 0.4Chartered Bus 1 0.1
Mode of Transportation
*The major middle cities were Savannah, GA (12); Atlanta, GA (7), Charlotte, NC (6); Myrtle Beach, SC (5); and Baltimore, MD (4).

Number of Events in the City2009 – 2013: 63.0% of Increase
Data Source: Special Event Committee, City of Charleston
254
316 366354
414
0
50
100
150
200
250
300
350
400
450
2009 2010 2011 2012 2013
Series1 Series2
Series3 Series4
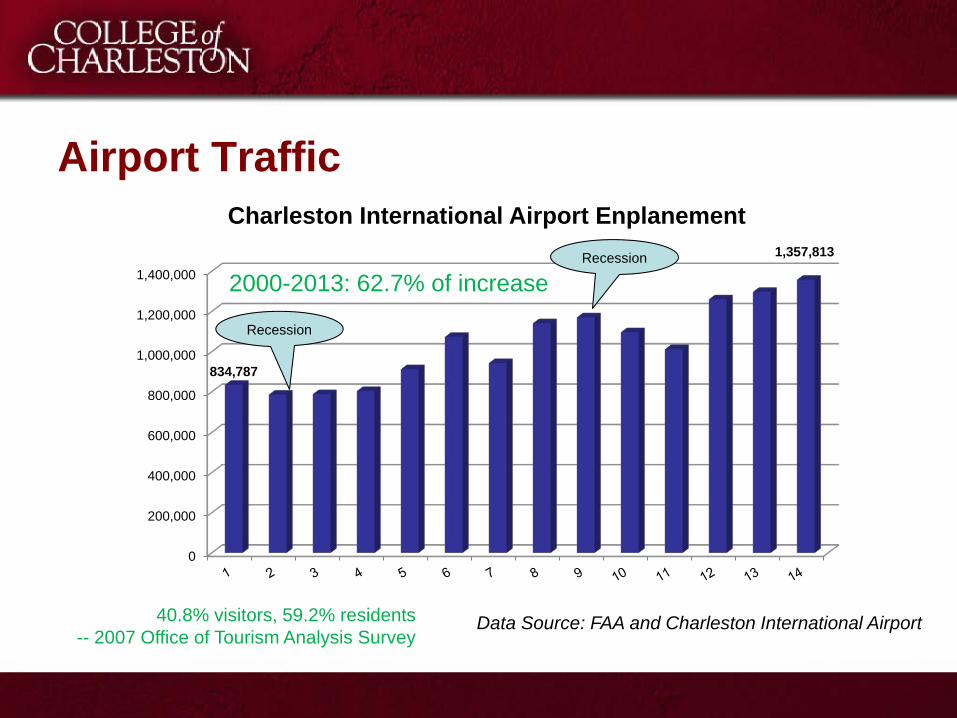
Airport Traffic
0
200,000
400,000
600,000
800,000
1,000,000
1,200,000
1,400,000
834,787
1,357,813
Charleston International Airport Enplanement
Recession
Data Source: FAA and Charleston International Airport
2000-2013: 62.7% of increaseRecession
40.8% visitors, 59.2% residents-- 2007 Office of Tourism Analysis Survey

Cruise Ship Traffic Trends
Data Source: South Carolina Port Authority2000-2013: 546.7% increase in passengers
18
88
29,084
188,082
0
10
20
30
40
50
60
70
80
90
100
0
50,000
100,000
150,000
200,000
250,000
Series1 Series2

Hotel Room Supply Trends
Data Source: Smith Travel Research
2,544 3,569
7,184
909 1,675
4,253
0
2,000
4,000
6,000
8,000
10,000
12,000
14,000
16,000
18,000
20,000Series1 Series2 Series3
Series4 Series5 Series6
Series7

Hotel Room Demand Trends (Roomnights Sold)
Data Source: Smith Travel Research
672,608 1,033,816
235,181 468,412
1,076,660
1,828,873
0
500,000
1,000,000
1,500,000
2,000,000
2,500,000
3,000,000
3,500,000
4,000,000
4,500,000
5,000,000Series1 Series2 Series3
Series4 Series5 Series6
Series7
Recession
Recession
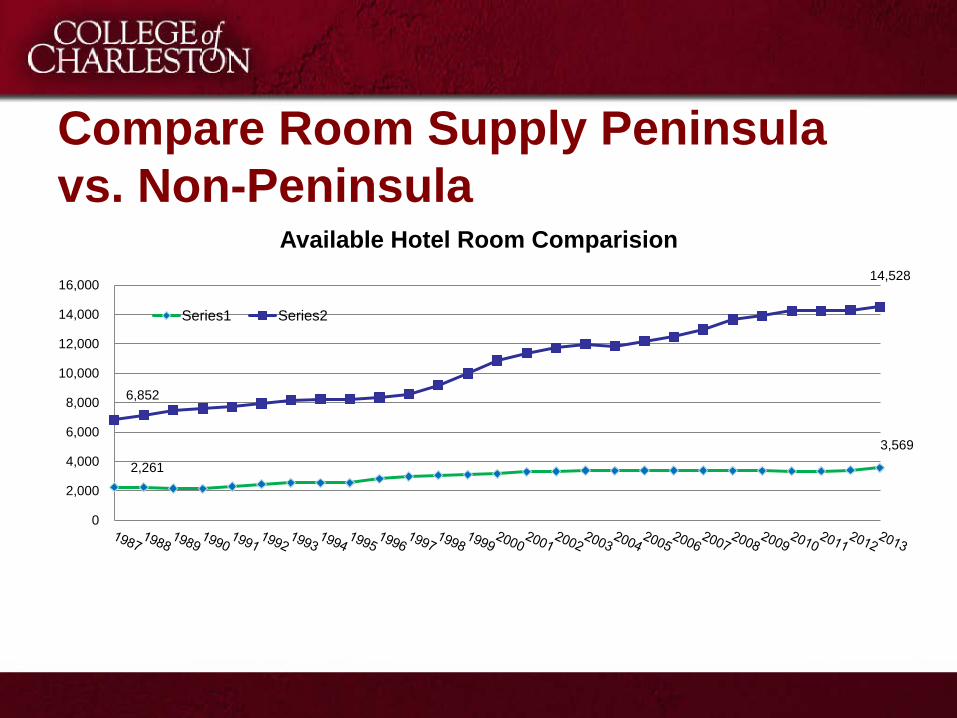
Compare Room Supply Peninsula vs. Non-Peninsula
2,261 3,569
6,852
14,528
0
2,000
4,000
6,000
8,000
10,000
12,000
14,000
16,000
Available Hotel Room Comparision
Series1 Series2
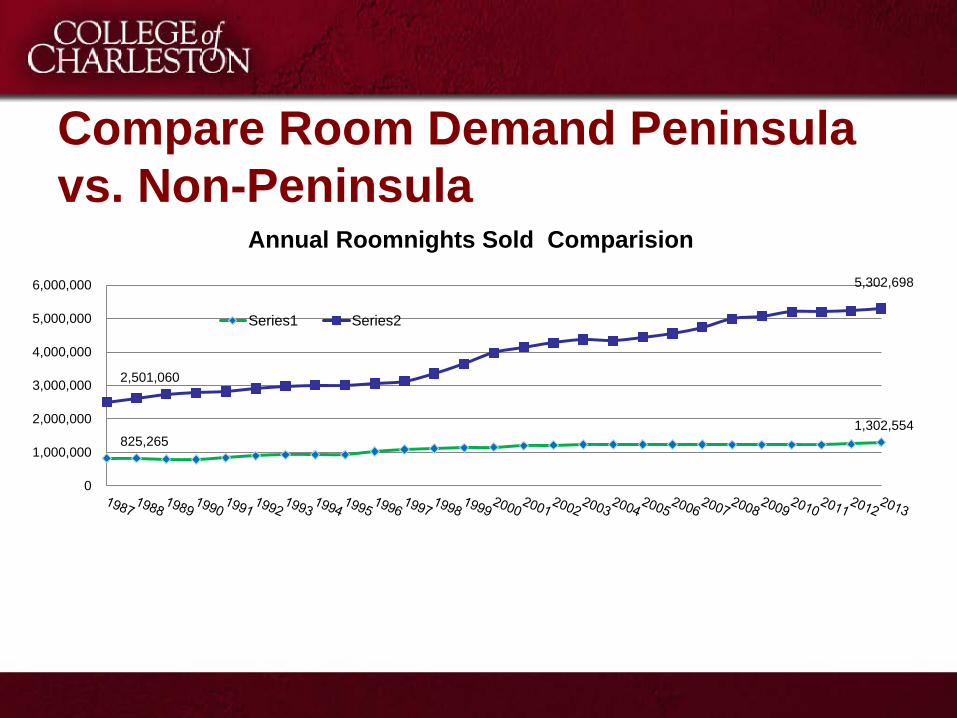
Compare Room Demand Peninsula vs. Non-Peninsula
825,265 1,302,554
2,501,060
5,302,698
0
1,000,000
2,000,000
3,000,000
4,000,000
5,000,000
6,000,000
Annual Roomnights Sold Comparision
Series1 Series2

Peninsula North Charleston
Mt. Pleasant
West Ashley City County Tri-County
Area
Tri-County Non-
PeninsulaNational
Supply 40.3% 87.4% 155.1% 78.2% 56.3% 74.3% 67.9% 76.4% 44.1%
Demand 53.7% 92.3% 157.3% 92.8% 69.9% 84.8% 76.0% 76.4% 38.7%
Hotel Room Supply & Demand Trends, 1994-2013
Data Source: Smith Travel Research

Population Change
Data Source: U.S. Census BureauCity of CHS 1990-2012 21.4%CHS County 1994-2012 19.1%Tri-County 1994-2012 32.6%
United States 1994-2012 20.5%
103,477 116,278 125,583
526,130
697,439
0
100000
200000
300000
400000
500000
600000
700000
800000Series1 Series2 Series3
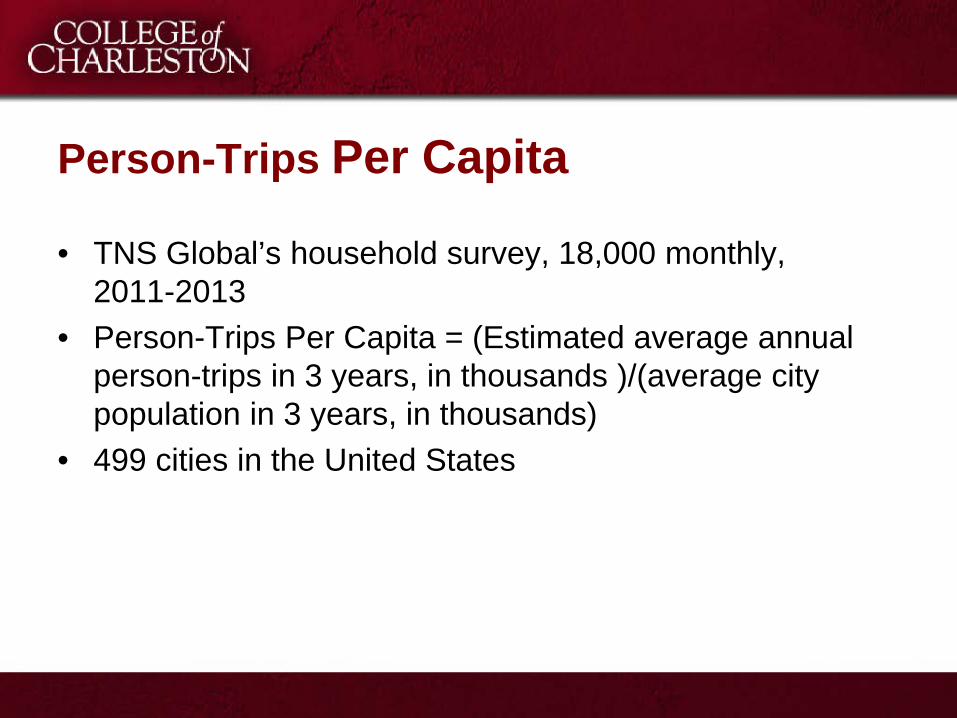
Person-Trips Per Capita
• TNS Global’s household survey, 18,000 monthly, 2011-2013
• Person-Trips Per Capita = (Estimated average annual person-trips in 3 years, in thousands )/(average city population in 3 years, in thousands)
• 499 cities in the United States
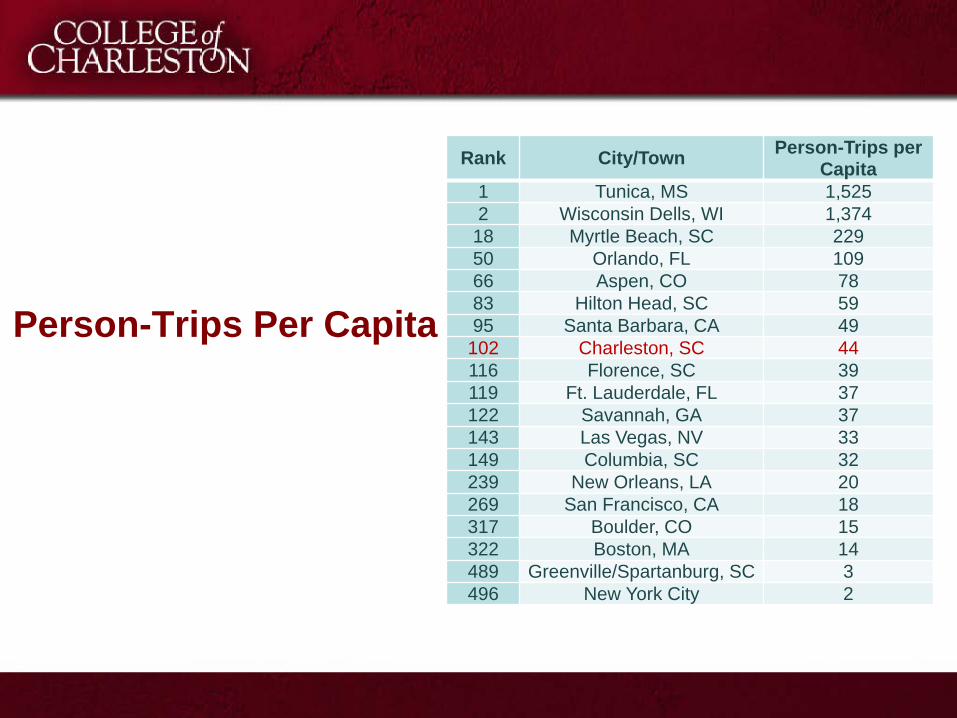
Person-Trips Per Capita
Rank City/Town Person-Trips per Capita
1 Tunica, MS 1,5252 Wisconsin Dells, WI 1,374
18 Myrtle Beach, SC 22950 Orlando, FL 10966 Aspen, CO 7883 Hilton Head, SC 5995 Santa Barbara, CA 49
102 Charleston, SC 44116 Florence, SC 39119 Ft. Lauderdale, FL 37122 Savannah, GA 37143 Las Vegas, NV 33149 Columbia, SC 32239 New Orleans, LA 20269 San Francisco, CA 18317 Boulder, CO 15322 Boston, MA 14489 Greenville/Spartanburg, SC 3496 New York City 2

Comparison with Peer CitiesCity Country
Charleston, SC United StatesSavannah, GA United StatesBoulder, CO United StatesAspen, CO United StatesBoston, MA United StatesNew Orleans, LA United StatesSan Francisco, CA United StatesQuebec City CanadaAmsterdam The NetherlandDublin IrelandGothenburg SwedenMalaga SpainSalzburg AustriaVenice ItalyHamilton Bermuda

Comparison with Downtown of Peer Cities
Country City Hotels Per Square Mile
Hotel Rooms per
Square Mile
Restaurants Per Capita (X1,000)
Hotels Per Capita (X
1,000)
Hotel Rooms Per Capita (X
1,000)
Restaurants Per Square
Mile
United States New Orleans, LA 28.34 5,558.31 120.11 31.12 6,104.42 109.37United States Boulder, CO 27.27 3,981.82 47.83 2.61 380.87 500.00United States Boston, MA 17.56 3,921.37 11.79 0.63 141.17 327.48The NetherlandAmsterdam 61.90 3,849.95 N/A 2.40 148.98 N/AUnited States San Francisco, CA 15.94 2,560.08 5.75 0.73 116.54 126.28Italy Venice 50.53 2,074.15 7.65 2.25 92.35 171.82Canada Quebec City 20.86 1,535.25 N/A N/A N/A 114.39Bermuda Hamilton 7.32 1,173.17 22.22 1.67 267.22 97.56United States Savannah, GA 8.37 834.31 8.00 1.85 184.48 36.19Ireland Dublin 7.94 727.35 N/A N/A N/A N/AUnited States Charleston, SC 5.22 591.15 6.63 1.02 115.83 33.82United States Aspen, CO 6.86 424.57 N/A N/A N/A 41.71Spain Malaga 3.66 330.04 N/A N/A N/A 74.73Sweden Gothenburg N/A N/A N/A N/A N/A N/AAustria Salzburg N/A N/A N/A N/A N/A 46.56
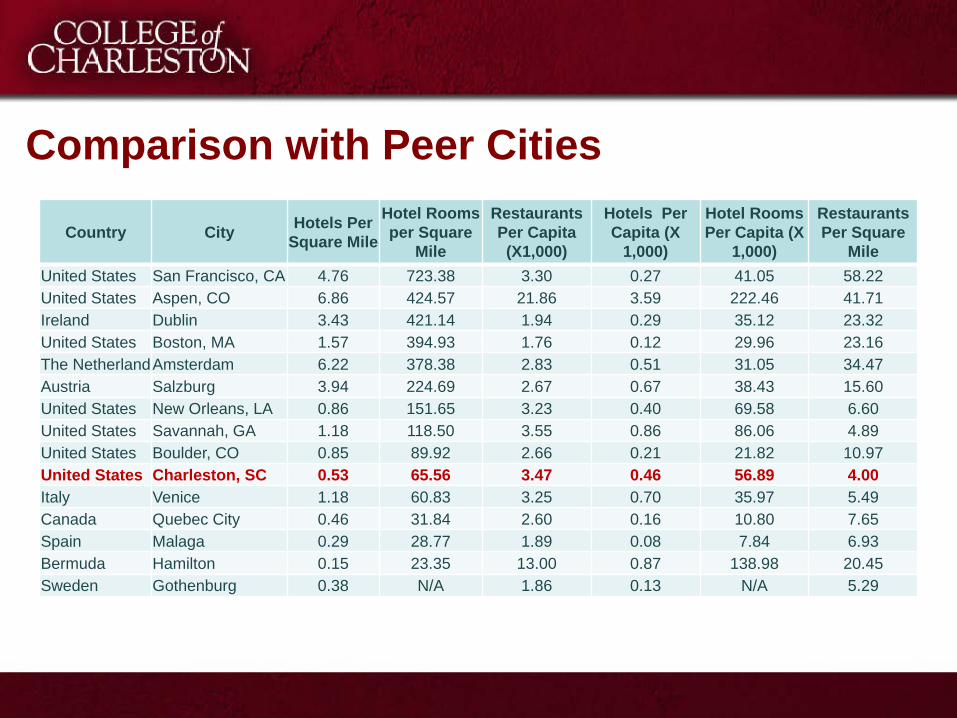
Comparison with Peer Cities
Country City Hotels Per Square Mile
Hotel Rooms per Square
Mile
Restaurants Per Capita (X1,000)
Hotels Per Capita (X
1,000)
Hotel Rooms Per Capita (X
1,000)
Restaurants Per Square
MileUnited States San Francisco, CA 4.76 723.38 3.30 0.27 41.05 58.22United States Aspen, CO 6.86 424.57 21.86 3.59 222.46 41.71Ireland Dublin 3.43 421.14 1.94 0.29 35.12 23.32United States Boston, MA 1.57 394.93 1.76 0.12 29.96 23.16The NetherlandAmsterdam 6.22 378.38 2.83 0.51 31.05 34.47Austria Salzburg 3.94 224.69 2.67 0.67 38.43 15.60United States New Orleans, LA 0.86 151.65 3.23 0.40 69.58 6.60United States Savannah, GA 1.18 118.50 3.55 0.86 86.06 4.89United States Boulder, CO 0.85 89.92 2.66 0.21 21.82 10.97United States Charleston, SC 0.53 65.56 3.47 0.46 56.89 4.00Italy Venice 1.18 60.83 3.25 0.70 35.97 5.49Canada Quebec City 0.46 31.84 2.60 0.16 10.80 7.65Spain Malaga 0.29 28.77 1.89 0.08 7.84 6.93Bermuda Hamilton 0.15 23.35 13.00 0.87 138.98 20.45Sweden Gothenburg 0.38 N/A 1.86 0.13 N/A 5.29
Concluding Remarks
• One of the biggest industries in the Charleston area. Generates $3.3 billion total impact; supports almost 40K jobs.
• The City of Charleston’s visitor volume has higher growth than the national average: roughly 70% increase in visitor volume in the last 20 years; 2.7% annually on average
• The visitor volume in the tri-county area grew more: 76% in the last 20 years, and 2.9% annual growth
• Peninsula had a more controlled growth than the City and the tri-county area due to the City’s successful management
Acknowledgements
• Funding from the Charleston Area Convention and Visitors Bureau• Melinda Patience, Research Coordinator, Office of Tourism
Analysis, College of Charleston
Related Documents