Charles University in Prague Faculty of Social Sciences Institute of Economic Studies BACHELOR THESIS Does Money Guarantee Success in Football? Author: Martin Milenovsk´ y Supervisor: doc. Ing. Tom´ aˇ s Cahl´ ık, CSc. Academic Year: 2014/2015

Welcome message from author
This document is posted to help you gain knowledge. Please leave a comment to let me know what you think about it! Share it to your friends and learn new things together.
Transcript

Charles University in Prague
Faculty of Social SciencesInstitute of Economic Studies
BACHELOR THESIS
Does Money Guarantee Success inFootball?
Author: Martin Milenovsky
Supervisor: doc. Ing. Tomas Cahlık, CSc.
Academic Year: 2014/2015

Declaration of Authorship
The author hereby declares that he compiled this thesis independently, using
only the listed resources and literature.
The author grants to Charles University permission to reproduce and to dis-
tribute copies of this thesis document in whole or in part.
Prague, May 13, 2015 Signature

Acknowledgments
The author of this thesis is sincerely grateful especially to the thesis supervisor
doc. Ing. Tomas Cahlık CSc. for his time, and willingness to take the thesis
under his supervision.
Moreover, the author would like to thank his parents, Marta and Jaroslav,
his aunt, Nazaria, and the rest of the family for moral and financial support
without which the author’s spell at the Charles University in Prague would not
be possible.

Abstract
E�ciency wages theory says that better-paid workers are more productive.
However, in sports it is often neglected as success is still attributed to greater
talent, or luck than simply to a higher wage bill. Dealing with the issue of
wages in sports is one of the most essential topics of sports economics. In the
thesis we confirm that wages are statistically significant in explaining variation
in performance in English, German, Czech, and Slovak top football leagues as
well as in specific Northern American Major League Soccer. We conclude that
the more restrictions and player transfer barriers there are, the smaller the
role of wages is in determining performance. Apart from wages we deal also
with transfer fees and find out that their role is overestimated by media and in
reality their e↵ect is more disruptive than helpful.
JEL Classification Z20, Z21, Z22, J30, J31, J39, L83
Keywords football, wages, wage budgets, transfers, pay-
performance, professor salaries
Author’s e-mail [email protected]
Supervisor’s e-mail [email protected]

Abstrakt
Teoria efektıvnej mzdy hovorı, ze lepsie platenı pracovnıci su aj produktıvnejsı.
Avsak v sporte je casto opomınana, kedze uspech je este stale viac prip-
isovany vacsiemu talentu ci dokonca stastiu ako jednoducho vyssiemu pla-
tovemu rozpoctu. Zaoberanie sa problematikou platov v sporte je jednou z
najzakladnejsıch tem ekonomie sportu. V tejto praci sme potvrdili, ze platy
su statisticky vyznamne pri vysvetlovanı variacie vo vykonnosti futbalovych
klubov v anglickej, nemeckej, ceskej, slovenskej najvyssej sutazi ako aj specifickej
severoamerickej Major League Soccer. Dochadzame k zaveru, ze cım viac
obmedzenı a prestupovych barier v lige je, tym mensia je uloha platov pre
vysvetlenie vysledkov. Okrem platov sme sa zaoberali aj platbami za prestupy
a zistili sme, ze ich uloha je nadhodnotena mediami a v skutocnosti ich e↵ekt
je viac narusajuci ako napomahajuci.
Klasifikacia JEL Z20, Z21, Z22, J30, J31, J39, L83
Klucove slova futbal, platy, platove rozpocty, prestupy,
vztah plat-vykon, platy profesorov
E-mail autora [email protected]
E-mail veduceho prace [email protected]
Contents
List of Tables viii
List of Figures x
Acronyms xi
Thesis Proposal xii
1 Introduction 1
2 Literature Review 4
3 Methodology and Explanation of the Key Terms 7
3.1 Pooled OLS . . . . . . . . . . . . . . . . . . . . . . . . . . . . . 7
3.2 Fixed E↵ects . . . . . . . . . . . . . . . . . . . . . . . . . . . . 8
3.3 Between E↵ects . . . . . . . . . . . . . . . . . . . . . . . . . . . 9
3.4 Random E↵ects . . . . . . . . . . . . . . . . . . . . . . . . . . . 9
3.5 E�ciency Wages Theory . . . . . . . . . . . . . . . . . . . . . . 10
3.6 Success . . . . . . . . . . . . . . . . . . . . . . . . . . . . . . . . 11
3.7 Money . . . . . . . . . . . . . . . . . . . . . . . . . . . . . . . . 12
4 Dataset and Characteristics of Leagues 14
4.1 Dataset . . . . . . . . . . . . . . . . . . . . . . . . . . . . . . . 14
4.2 English Barclay’s Premier League . . . . . . . . . . . . . . . . . 16
4.3 German Bundesliga . . . . . . . . . . . . . . . . . . . . . . . . . 19
4.4 Major League Soccer . . . . . . . . . . . . . . . . . . . . . . . . 21
4.5 Gambrinus Liga . . . . . . . . . . . . . . . . . . . . . . . . . . . 25
4.6 Corgon Liga . . . . . . . . . . . . . . . . . . . . . . . . . . . . . 27
5 Model and Discussion of the Results 32
5.1 General Model . . . . . . . . . . . . . . . . . . . . . . . . . . . 32

Contents vii
5.2 Correlation between Wage Bill Rank and League Rank . . . . . 34
5.3 Pooled OLS . . . . . . . . . . . . . . . . . . . . . . . . . . . . . 35
5.4 Panel Data Estimation Models . . . . . . . . . . . . . . . . . . . 37
5.4.1 Perpoints on WRM . . . . . . . . . . . . . . . . . . . . . 38
5.4.2 Goals on WRM . . . . . . . . . . . . . . . . . . . . . . . 39
5.4.3 Champion on WRM . . . . . . . . . . . . . . . . . . . . 39
5.5 Pay-Performance Models in Particular Leagues . . . . . . . . . . 40
5.5.1 English Premier League . . . . . . . . . . . . . . . . . . 41
5.5.2 German Bundesliga . . . . . . . . . . . . . . . . . . . . . 43
5.5.3 Major League Soccer . . . . . . . . . . . . . . . . . . . . 44
5.5.4 Czech Gambrinus Liga . . . . . . . . . . . . . . . . . . . 45
5.5.5 Slovak Corgon Liga . . . . . . . . . . . . . . . . . . . . . 46
5.5.6 Comparison of leagues . . . . . . . . . . . . . . . . . . . 47
5.6 Shortcomings and Possible Extensions . . . . . . . . . . . . . . 49
6 Connection to Other Industries 51
6.1 University Rankings and Professors’ Pay . . . . . . . . . . . . . 51
7 Conclusion 53
Bibliography 56
A Title of Appendix One I

List of Tables
4.1 League Position vs. Wage Bill Rank Comparison for English
Premier League (EPL) . . . . . . . . . . . . . . . . . . . . . . . 19
4.2 League Position vs. Wage Bill Rank Comparison for German
Bundesliga (GBL) . . . . . . . . . . . . . . . . . . . . . . . . . . 22
4.3 League Position vs. Wage Bill Rank Comparison for Major
League Soccer (MLS) . . . . . . . . . . . . . . . . . . . . . . . . 25
4.4 League Position vs. Wage Bill Rank Comparison for Czech Gam-
brinus Liga (CGL) . . . . . . . . . . . . . . . . . . . . . . . . . . 28
4.5 League Position vs. Wage Bill Rank Comparison for Slovak
Corgon Liga (SCL) . . . . . . . . . . . . . . . . . . . . . . . . . 31
5.1 Means of Variables across Leagues . . . . . . . . . . . . . . . . . 33
5.2 Correlation Coe�cients between Position in League Table and
Payroll Ranking . . . . . . . . . . . . . . . . . . . . . . . . . . . 35
5.3 Pooled OLS Pay-Performance Models . . . . . . . . . . . . . . . 37
5.4 Wage-Points Fixed, Between and Random E↵ects Regressions . 38
5.5 Wage-Goals Fixed, Between, and Random E↵ects Regressions . 39
5.6 Wage-Champion Fixed, Between, and Random E↵ects Regressions 40
5.7 Pay-Performance Models for EPL . . . . . . . . . . . . . . . . . 42
5.8 Prediction Table for EPL . . . . . . . . . . . . . . . . . . . . . . 42
5.9 Pay-Performance Models for GBL . . . . . . . . . . . . . . . . . 43
5.10 Prediction Table for GBL . . . . . . . . . . . . . . . . . . . . . . 44
5.11 Pay-Performance Models for MLS . . . . . . . . . . . . . . . . . 45
5.12 Prediction Table for MLS . . . . . . . . . . . . . . . . . . . . . . 45
5.13 Pay-Performance Models for CGL . . . . . . . . . . . . . . . . . 46
5.14 Prediction Table for CGL . . . . . . . . . . . . . . . . . . . . . . 46
5.15 Pay-Performance Models for SCL . . . . . . . . . . . . . . . . . 47
5.16 Prediction Table for SCL . . . . . . . . . . . . . . . . . . . . . . 47

List of Tables ix
5.17 Wage-Points Model across Leagues . . . . . . . . . . . . . . . . 48

List of Figures
4.1 Lorenz Curve for EPL (2008-2013) . . . . . . . . . . . . . . . . . 17
4.2 Lorenz Curve for GBL (2008-2013) . . . . . . . . . . . . . . . . . 21
4.3 Lorenz Curve for MLS (2009-2013) . . . . . . . . . . . . . . . . . 24
4.4 Lorenz Curve for CGL (2008-2013) . . . . . . . . . . . . . . . . . 26
4.5 Lorenz Curve for SCL (2008-2013) . . . . . . . . . . . . . . . . . 29
6.1 Scatterplot of THE University Ranking against Payscale College
Salary Report . . . . . . . . . . . . . . . . . . . . . . . . . . . . 52

Acronyms
CGL Czech Gambrinus Liga
CCL CONCACAF Champions League
EL Europa League
EPL English Premier League
GBL German Bundesliga
IFFHS International Federation of Football History & Statistics
MLB Major League Baseball
MLS Major League Soccer
NBA National Basketball Association
NFL National Football League
NHL National Hockey League
SCL Slovak Corgon Liga
THE Times Higher Education
UCL UEFA Champions League
UEFA Union of European Football Associations

Bachelor Thesis Proposal
Author Martin Milenovsky
Supervisor doc. Ing. Tomas Cahlık, CSc.
Proposed topic Does Money Guarantee Success in Football?
Topic characteristics After losing 3-1 to Manchester United in 2013, Sam Al-
lardyce, the dogmatic manager of West Ham United, came up with a straight-
forward explanation for footballing performance. “Where you actually finish in
the league depends on the money you’ve spent,” he explained. “It’s a statistical
fact, that.” In my thesis I would like to test whether and to what extent wage
and transfer budgets influence overall league position of professional football
clubs using panel data. Consequently, I would like to compare the results across
di↵erent countries and analyze the reasons of possible di↵erences. In the final
part, I will compare this pay-performance relationship to the one in academic
sphere.
Research Questions 1. Do player wages influence league position of profes-
sional football clubs?
2. Is the pay-performance connection stronger in the best leagues?
3. Do transfer spendings influence standings of professional football clubs?
4. Is this wage-performance connection more significant compared to con-
nection between salaries of professors and their respective university’s ranking?
Methodology The thesis will use econometric analysis of panel data to es-
tablish the model for influence of finances on the performance of professional
football clubs.

Master Thesis Proposal xiii
Outline
1. Introduction
2. Theoretical Background
3. Description of the data
4. The Model
5. Analysis of the results
6. Connection to other industries
7. Conclusion
Core bibliography
1. Dobson, S. and Goddard, J. (2001). The Economics of Football. 1st ed. New York:
Cambridge University Press.
2. Kuper, S. and Szymanski, S. (2009). Soccernomics. 1st ed. New York: Nation Books.
3. Rodrıguez, P., Kesenne, S. and Garcıa, J. (2013). The Econometrics of Sport. 1st ed.
Cheltenham: Edward Elgar Pub. Ltd.
4. Szymanski, S. (2010). Football Economics and Policy. 1st ed. New York: Palgrave
Macmillan.
5. Wooldridge, J. (2002). Econometric Analysis of Cross Section and panel data. 1st ed.
Cambridge, Mass.: MIT Press.
Author Supervisor

Chapter 1
Introduction
Association football1 is world’s most popular game (Encyclopedia Britannica,
2014). Since the establishment of its o�cial rules2 it spread throughout the
world. Nowadays it is o�cially played in 209 countries and territories by 250
million registered players (Dunning, 1999). Since the second half of the 20th
century football started to be more and more professionalised. Players were
giving up their jobs to focus solely on playing the game. The market for labour
of footballers has become a highly-competitive labour market as from the mil-
lions of footballers only a few thousands get the chance to make living by
playing the game. Economic theory tells us that paying of e�ciency wages
is very likely in such an environment, and therefore teams paying the most
should have the players with the best skills which should lead to guaranteed
successes (Rigdon, 2002). Sports market has attracted the attention of labour
economists for several decades. Kahn (2000) states: ”There is no research set-
ting other than sports where we know the name, face, and life history of every
production worker and supervisor in the industry. Total compensation pack-
ages and performance statistics for each individual are widely available and we
have a complete data set of worker-employer matches over the career of each
production worker and supervisor in the industry... creating interesting natural
experiments that o↵er opportunities for analysis.”
In our analysis we decided to focus on pay-performance ratio in 5 selected
leagues. Two of them, EPL and GBL, belong to the world’s most popular com-
petitions and both of them have been the topic of analysis previously. Apart
from these two competitions, we decided to analyse the relationship between
1In Europe known simply as football2The Laws of the Game in 1863

1. Introduction 2
the payrolls and performance in CGL and SCL. These two are not considered
to be among the best European competitions, and therefore almost no research
has been conducted with them. It will be interesting to see how money in-
fluences clubs’ standings in the Czech and Slovak environment compared to
the best European competitions. Finally, we decided to include Major League
Soccer, the top football division in the USA and Canada. This league cannot
compare with GBL or EPL in terms of footballing quality or finances but it has
several specifics typical for other Northern American competitions (National
Hockey League (NHL), National Football League (NFL), National Basketball
Association (NBA), and Major League Baseball (MLB)). The e↵ects of the
specifics on pay-performance relationship are the topic of our interest. These
competitions tend to feature much lower significance of wage budgets in de-
termining sporting performance. Therefore, we will try to find out whether
MLS tends to be more similar to its Northern American cousins or to the top
football divisions in Europe. Apart from wages, transfer fees are another way
how money can influence power of a football team. For EPL and GBL we run
regressions to discover whether and how transfer spendings explains variation
in performance. Finally, we want to compare the results for football with the
connection between wages and performance in the academic sphere to get a
broader view of pay-performance relationship in general.
As mentioned above there has been enough research on pay-performance
relationship. Nevertheless, our thesis is unique for several reasons:
1. We use the most recent data available3
2. We try to pool various football leagues together to get insight about a
general pay-performance relationship in football
3. We do our analysis for SCL and CGL for which to our best knowledge no
similar research has been conducted so far
4. We o↵er three di↵erent ways how to measure performance and run sepa-
rate models for each definition
The thesis is structured as follows: Chapter 2 provides detailed description
of research conducted on pay-performance relationship in general and in sports
environment. The results of the research are mentioned and di↵erences to
our work are highlighted. Chapter 3 o↵ers a brief explanation of E�ciency
3As of January 2015

1. Introduction 3
Wages, a theory which is a crucial concept for our thesis. Moreover, meaning
of the key terms of this thesis “success” and “money” in football environment is
explained. Finally, a very brief introduction of panel data estimation methods
that are used to develop our models is o↵ered. Chapter 4 provides a rather
extensive description of dataset and all the leagues observed. All the details of
this chapter are not necessary for understanding of our results. Nevertheless,
we think they o↵er a possibility to see the results in a deeper context. In
Chapter 5 the models are described and their results interpreted. Firstly, we
run models for pooled data of all leagues using di↵erent panel data methods to
determine whether wages are significant in explaining variation of performance
of football clubs. Secondly, we run regressions including not only wages but also
transfer fees for GBL and EPL to discover their e↵ect. Thirdly, the results for
the individual leagues are compared and we try to o↵er possible explanations
for the di↵erences in the models. Chapter 6 is a short excursion from football
to the academic environment where the correlation between the salaries of
professors and their universities’ ranking is compared with the one for football
players and the results of their teams. Chapter 7 summarizes the findings and
clearly answers the research questions.

Chapter 2
Literature Review
Examination of pay to performance ratio has been an interesting and popular
topic of investigation among researchers for several decades. Their research is
concentrated on industries where human capital is the decisive factor for the
quality of output (e.g. education) as well as on industries where the importance
of human capital is not that obvious (e.g. retail). However, until recently the
area of sport was not paid much attention to. Some of the discoveries indicates
that sport industry can be the one with the strongest influence of salaries on
results.
Hubbard and Palia (1995) examined the connection between CEOs’ pay and
the performance of their respective banks and how this relationship changed in
a deregulated market. They came up with conclusion that the pay-performance
relation was much stronger in deregulated banking markets. Lawler (1990) un-
dertook a multi-industry analysis and found that pay was the main source of
competitive advantage and defined pay strategies that are most likely to in-
crease performance. Zeynep Ton from the MIT Sloan School of Management
devoted his work to examining performance of fast food and retail companies
who usually employ the lowest earning sta↵. He, however, pointed out that the
few companies paying well-above-average wages performs much better relative
to their competitors (Ton, n.d.).
Among sport types, baseball has traditionally been the most often under
scrutiny of economists thanks to the level of attention it gets in the USA and
large amount of statistics available. Wiseman and Chatterjee (2003) revealed
that the e↵ect of team payroll on team results was significant in every season of
2. Literature Review 5
Major League Baseball between 1985 and 2002. Frick, Prinz and Winkelman
(2003) analysed rather extensive data from the major North American leagues.
They found out that the link between payroll and team performance was con-
siderably stronger in American football and ice-hockey than in basketball and
baseball. Albach, Frick and Rahmann (2004) discovered declining influence of
team salaries on teams’ winning percentage and teams’ probability of being
the champion after introducing salary caps in the North American competi-
tions. Lewis (2003) in his popular book Moneyball pointed out that money not
necessarily guaranteed victories in professional baseball. He mapped Oakland
Athletics baseball team which managed to be successful even with a wage bill
as low as 1/4 of their opponents’ respective wage bills. An important bridge
between analysis of pay to performance relationship is Hall, Szymanski, Zim-
balist’s 2002 Testing Causality Between Team Performance and Payroll The
Cases of Major League Baseball and English Soccer. The authors implemented
Granger causality tests and could confirm that the causality ran from wages to
performance for MLB between 1980 and 2000. However, there was enough evi-
dence for the causality from performance to wages. Contrary to the results for
English Premier League between 1985 and 1999 where wages-to-performance
causality was confirmed. They contributed this to the fact that the market
for baseball players is much more restricted compared to football. Szymanski
and Smith (1997) and Szymanski and Kuypers (1999) found a positive rela-
tionship for English leagues between 1950 to 1997. They claimed it confirmed
e�ciency of the player market. This follows from the higher goodness of fit
in the period of less regulation after Bosman law 1 and lower degree of fit in
the previous highly regulated environment. Forrest and Simmons (2000) cov-
ered 4 Northern American sports leagues2 and three major European football
leagues3 in late 1990s. Despite small sample size and little variation in wage
bills they found significant impact of wage bills on team win percentage in all
the American competitions. They also confirmed positive relationship of wages
to team-point ratio in European football leagues even though for Germany
the regression was poorly fitting. They also analysed the elasticities of win
with respect to wage bill. This was similar across the leagues but varying over
time. Finally, Rodrıguez, Kesenne and Garcıa (2013) claim that net transfer
11995 European Court of Justice decision that banned restrictions on foreign EU playerswithin national leagues and allowed players in the EU to move to another club at the end ofa contract without a transfer fee being paid.
2NBA, NFL, NHL, MLB3Top divisions in Italy, Germany, and England)

2. Literature Review 6
spendings is another factor explaining performance in English football (seasons
1992/1993 to 2008/2009). This relationship is, however, weaker than the link
between wages and performance. One of the most comprehensive economic
studies of English football was conducted by Tomkins, Riley and Fulcher in
their 2010 Pay As You Play: The True Price of Success in English Football. In
their extensive research they discovered a significant e↵ect of football coaches
on results, confirmed that between 2004 and 2008, EPL was a monopoly, and
finally they concluded that in order to win EPL you have to be able to pay
at least 89% as much as the most-paying team. Surprisingly, they found out
that the rich clubs use their resources more e�ciently. 55% of wage expendi-
tures goes to the average starting 11 players in the top 5 teams compared to
the 51.7% for the teams finishing between 6th and 17th place, while relegating
squad paid only 47.4% of their wage bills to their starting line-up.
As to address our contribution to this field, our research is focused on EPL,
GBL, MLS, CGL and SCL. To our best knowledge, in the latter two no research
on wage - performance relationship has been done and MLS was also only
rarely the subject of examination even though it is unique with its structure
similar to those of NHL, NFL or NBA. Moreover, our work is based on the
most current data available (2008/2009 to 2012/2013 season4). Therefore, we
are able to compare recent trends in pay-performance relationship in football
to the work of the researchers mentioned above. We will also work with three
di↵erent measures of performance of a football team - number of points, number
of goals scored, and league wins.
4Seasons 2009 to 2013 in case of MLS

Chapter 3
Methodology and Explanation of
the Key Terms
In this chapter we would like to define what money and success actually mean
in football as well as list and describe important theoretical economic and
econometric concepts used in the practical part of the thesis. After finishing
this chapter the reader will be able to understand the steps of the analysis
much more easily. Nevertheless, most of the concepts are widely-known to an
educated reader, and therefore the descriptions will be kept short.
3.1 Pooled OLS
When we a have panel dataset, the entities are observed in regular periods.
If a random sample is drawn at each time period, pooling the observations
gives us independently-pooled cross section. There are several advantages of
such approach. Firstly, the random sample increases which gives us more pre-
cise estimators and more powerful test statistics. When there are suspicions
that populations have various contributions across time periods, dummy vari-
ables for particular period can be added (Wooldridge, 2009). Secondly, OLS
estimator may be used for such a model which looks as follows:
yit = �0 + �1xit + �0d2t + ...�ndnt + vit, t = 1, 2, ...n (3.1)
where
vit = ai + uit (3.2)
3. Methodology and Explanation of the Key Terms 8
is called composite error. The first part of the error, ai is called unobserved
e↵ect or fixed e↵ect and represent individual e↵ects of each entity that do not
vary over time. The latter part, vit, is called idiosyncratic error or time-varying
error.
In order for pooled OLS estimates to be consistent, vit must not be corre-
lated with xit. When pooled OLS is to be unbiased and consistent, ai cannot be
correlated with xit. The key assumption is that there are no unique attributes
of individuals within dataset and that there are no universal e↵ects across time
(Wooldridge, 2009).
3.2 Fixed E↵ects
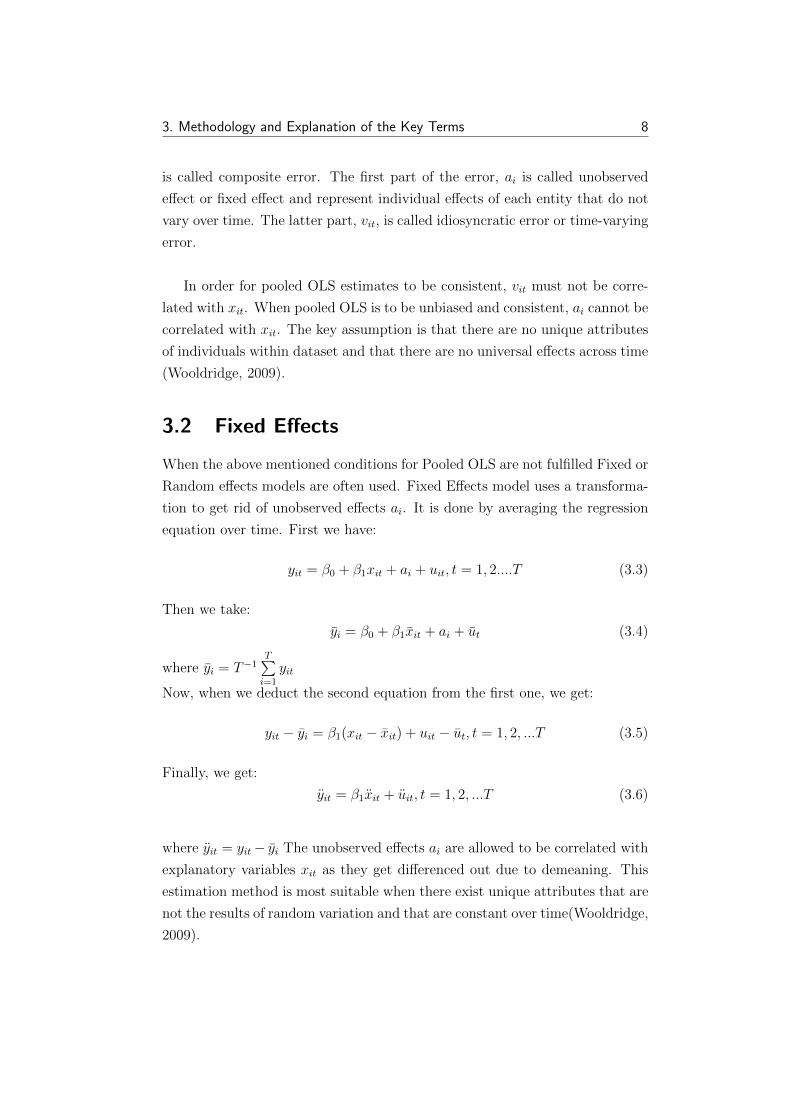
When the above mentioned conditions for Pooled OLS are not fulfilled Fixed or
Random e↵ects models are often used. Fixed E↵ects model uses a transforma-
tion to get rid of unobserved e↵ects ai. It is done by averaging the regression
equation over time. First we have:
yit = �0 + �1xit + ai + uit, t = 1, 2....T (3.3)
Then we take:
yi = �0 + �1xit + ai + ut (3.4)
where yi = T
�1TPi=1
yit
Now, when we deduct the second equation from the first one, we get:
yit � yi = �1(xit � xit) + uit � ut, t = 1, 2, ...T (3.5)
Finally, we get:
yit = �1xit + uit, t = 1, 2, ...T (3.6)
where yit = yit � yi The unobserved e↵ects ai are allowed to be correlated with
explanatory variables xit as they get di↵erenced out due to demeaning. This
estimation method is most suitable when there exist unique attributes that are
not the results of random variation and that are constant over time(Wooldridge,
2009).

3. Methodology and Explanation of the Key Terms 9
3.3 Between E↵ects
Between E↵ects estimator is obtained by regressing the averages of explanatory
variables against averages of the outcome variables. This estimator, contrary
to fixed e↵ects, requires ai to be uncorrelated with explanatory variables in
order to be unbiased. This is also a condition of Random e↵ects model which
is, however, more e�cient in any circumstance. Therefore, we will add this
estimator only for informative reasons (Wooldridge, 2002).
3.4 Random E↵ects
The procedure to obtain Random E↵ects regression equation is actually similar
to the one of Fixed E↵ects. We start with equation 3.3. This time we assume
that Cov(xit,ai)=0 for all explanatory variables and all time periods. We also
know that there is positive serial correlation between composite errors.
Corr(vit, vis) =�
2a
�
2a + �
2u
(3.7)
where �
2a=Var(ai), �2
u=Var(uit)
As there is positive serial correlation, pooled OLS would provide consistent
estimation coe�cients but incorrect standard errors. Therefore, we have to use
Generalised least squares (GLS) estimation. The regression equation looks as
follows:
yit � �yi = �0(1� �) + �1(xit � �xit) + (vit � �ut), t = 1, 2....T (3.8)
where � = 1� [ �2u
�2u+T�2
a]1/2
GLS estimator is an OLS-estimator used on these quasi-demeaned data
weighted by �. One of advantages of Random E↵ects is that it allows for time-
invariant data (Wooldridge, 2009). The key assumption for Random e↵ect
model is that there are unique, time constant characteristics of individuals that
are results of random variation and do not correlate with individual regressors
(Wooldridge, 2002).

3. Methodology and Explanation of the Key Terms 10
3.5 E�ciency Wages Theory
The most important theoretical economic concept for our analysis is the e�-
ciency wages hypothesis from Alfred Marshall. It argues that managers pay
their employees more than market-clearing wages to increase their productiv-
ity1, discourage them from quiting or for the reasons of signalling, and thus
attracting the workers with a higher level of ability. Nevertheless, when work-
ers are paid more than equilibrium wage, unemployment is unevitable (Akerlof
& Yellen, 1986).
Football players’ labour market represents somewhat extreme case of this
market failure. The clubs pay more to their players to motivate them to exert
as much e↵ort as possible. This is streghtened by various performance bonuses.
Players get special rewards for specific number of appearances, goals, assists,
clean sheets etc. Loyalty is the next reason why clubs overpay their squad.
Clubs want to prevent their players to be attracted by higher wages o↵ered
by rival clubs. Especially when it comes to the key players who are hard to
replace. Finally, there is the argument to pay high wages and by doing so
attract the best players possible. This theory relies on the argument that dif-
ferent players have heterogeneous ability and employers cannot screen them.
In this case low paying firms attracts only low-skilled workers meanwhile high
paying firm attracts workers of all categories. Therefore, the ability should
be higher on average in the high paying team (Akerlof & Yellen, 1986). In
football there are, however, possibilities to screen players’ ability. These can
be for example di↵erent statistics such as number of goals, assists, successful-
pass ratio, headers-won ratio etc. Nevertheless, these do not provide perfect
screening as di↵erent players earned these statistics against di↵erent teams in
di↵erent environments. It is di�cult decide whether a striker who scored 20
goals in a season in MLS is better than a striker who scored 10 goals in GBL,
or how many would he score, had he played in EPL. Not to forget, there is
also the issue of unemployment. According to FIFA there is about 38 million
registered players in the world (FIFA.com, 2006). We can consider this number
to be the whole labour market. However, only fraction of the players makes
living by playing football (50 000 according to FifPro (FIFPro World Players’
Union, 2014)) i.e. are employed. Football player market, therefore, represents
1To avoid shirking

3. Methodology and Explanation of the Key Terms 11
an extreme case of highly competitive labour market.
To sum it up, e�ciency wages are almost certainly paid in football players’
labour market. This gives us reasonable background to expect that the better-
paying teams employ players with better abilities which should result in better
performance of such teams.
3.6 Success
In order to understand how money influences success in football, one has to
understand what success in football actually means. Strictly taken only the
first position in the league table can be considered as an ultimate success.
Although only few from thousands of clubs competing against each other can
claim the title, much more of them are considered (or consider themselves) to
be successful. One reason for that is that apart from leagues there are other
competitions such as national cups, league cups, or continental competitions.
Keeping track of them is, however, out of the scope of our data. Another
reason simply is the fact that clubs have more or less reasonable expectations
about their chances in the upcoming season. A small impoverished club can be
considered to be successful even if it finishes in the middle of the league table.
Meanwhile clubs such as Manchester United or Sparta Prague are not satisfied
with anything but the top position. The understanding what success actually
is subjective. Our analysis o↵er three di↵erent measures for success:
1. number of points
2. number of goals
3. championship titles
Firstly, success is measured with the number of points (3 points are awarded
for a victory, 1 points for a draw and 0 points for a loss). Points decide the
ranking in the final table and ultimately they decide who are the winners and
losers. Secondly, for some teams the success might lie in the satisfaction of
their fans. Rodney J. Paul (2003) found that the goals scored make fans more
satisfied than goals conceded make them unsatisfied, and therefore the teams
scoring more goals have usually more satisfied fans. Due to that finding, number
of goals scored will be used as one of the measures of success as well. Thirdly,
we measure success strictly by the fact whether team won the league or not. In

3. Methodology and Explanation of the Key Terms 12
such model only the champion is considered successful and all the other teams
are not - disregarding whether they finish as 2nd or 20th.
3.7 Money
The title of this thesis only vaguely asks about the role of the money in guar-
anteeing success in football. There might be di↵erent interpretations of what
can be meant under the word “money”. One can guess it might be the value of
all the assets i.e club’s total value, or it might be net income which indicates
how clubs are doing in terms of profitability. Nevertheless, apart from psycho-
logical e↵ect there is no reason to believe that a club making profits should be
more successful than its loss-making peers. Much more reasonable is to look at
clubs’ expenses. They indicate how much the clubs actually spend. However,
this accounting item still includes some disruptive elements, such as payments
to suppliers, energy providers, or club’s back o�ce, which do not influence the
pitch performance of the teams directly.
This leads us to the most crucial item - wages. Whatever is said, it is still
the players and coaches who win or lose matches and it is their unique ability
and work that has to be paid for. If the world was perfect, it would be expected
that players would be paid exactly according to their ability and logically the
teams with higher wage budgets, and consequently players with better ability,
would always beat its less-paying counterpart in a head-to-head contest. In the
real world it is often not like that because there are many other factor influenc-
ing performance such as team’s playing form, psychological e↵ects, coaching
and managerial skills, injuries, or even weather2. These aspects are only hard
to account for. Therefore, we will focus solely on the explanatory power of
team’s wages. In the following parts of this thesis you will see that the e↵ect
of wages on performance is almost always significant and the author believes
that this would not be overturned even if additional variables were to be added.
Nevertheless, the coe�cient of determination as well as predictive power of the
models would definitely improve.
Apart from wages, we also analyse the e↵ects of transfer fees for the leagues
for which reliable data are available. Transfer fees are the kind of money that
2Technical teams usually struggle when playing on a muddy field (Downward and Dawson,2000)

3. Methodology and Explanation of the Key Terms 13
is often discussed in media contrary to wages which are most often not publicly
available. Does it pay o↵ to buy players? Theoretically, it should work as the
selling club values its player so much that it is only willing to let him go after
receiving su�cient compensation. Yet, we have to keep in mind that a football
team can field only 11 players at the same time and a new player takes place
of another player who has been with the team for longer period and is much
better incorporated into the playing structure of the team. The new player
could thus disrupt the harmonies that has been evolving within the team for a
longer time period.

Chapter 4
Dataset and Characteristics of
Leagues
This part of thesis is dedicated to providing more detailed information about
the data used for our research as well as particular football leagues which rep-
resent di↵erent environments for testing our models. The selected leagues are
English Barclay’s Premier League (EPL), German Bundesliga (GBL), Northern
American Major League Soccer (MLS), Czech Gambrinus Liga (CGL), and Slo-
vak Corgon Liga (SCL). We chose the period of our interest to be 5 seasons -
2008/2009, 2009/2010, 2010/2011, 2011/2012, and 2012/2013. Meanwhile, we
possessed all the necessary sporting results for the season 2013/2014, we were
not able to obtain the financial data for all the 5 leagues for this season. We
chose EPL and GBL as the representants of the world’s best leagues. MLS was
our choice because it is unique among football leagues due to the elements typ-
ical for the other Northern American professional sport competitions. Finally,
CGL and SCL were singled out because as far as we know, no similar research
has been done with these competitions. Additionally, we are interested whether
SCL and CGL, while being similar in terms of football quality and nominal value
of wages, do di↵er in the process of transforming money into actual results.
4.1 Dataset
For the purposes of this thesis, a new dataset had to be created as we were not
able to find one that would suit our needs. The dataset contains 13 variables
which could be divided into 3 categories:
Descriptive Variables
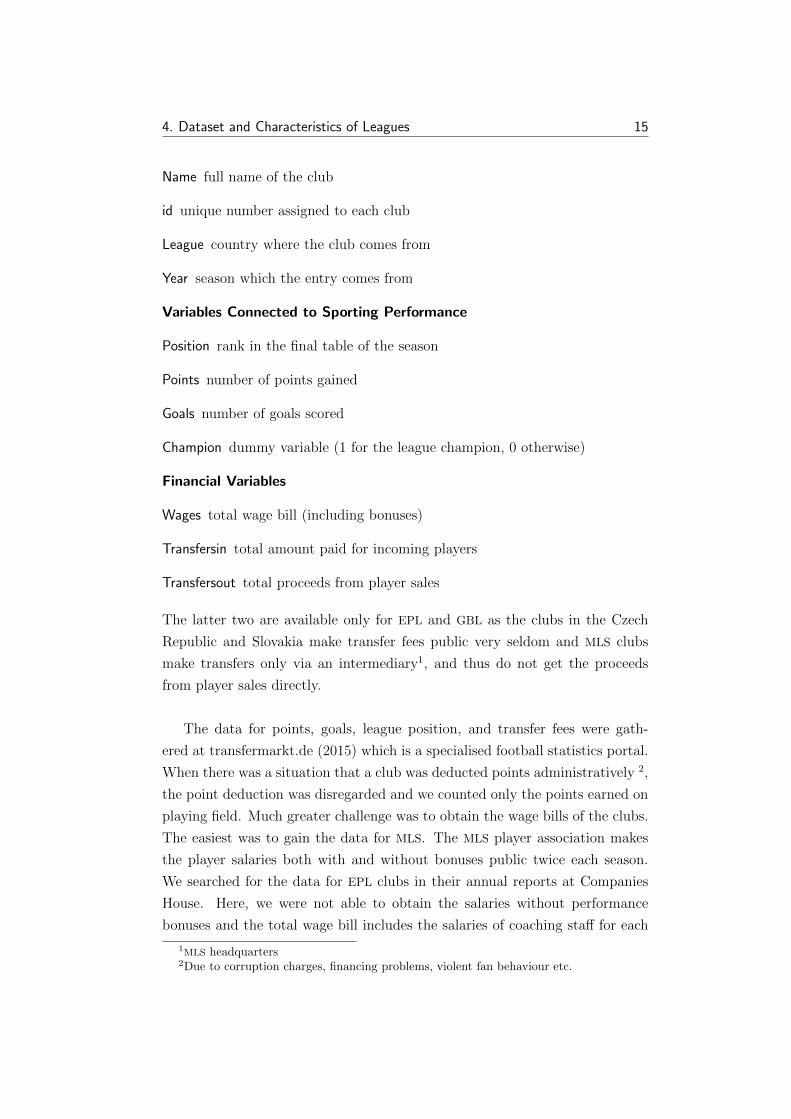
4. Dataset and Characteristics of Leagues 15
Name full name of the club
id unique number assigned to each club
League country where the club comes from
Year season which the entry comes from
Variables Connected to Sporting Performance
Position rank in the final table of the season
Points number of points gained
Goals number of goals scored
Champion dummy variable (1 for the league champion, 0 otherwise)
Financial Variables
Wages total wage bill (including bonuses)
Transfersin total amount paid for incoming players
Transfersout total proceeds from player sales
The latter two are available only for EPL and GBL as the clubs in the Czech
Republic and Slovakia make transfer fees public very seldom and MLS clubs
make transfers only via an intermediary1, and thus do not get the proceeds
from player sales directly.
The data for points, goals, league position, and transfer fees were gath-
ered at transfermarkt.de (2015) which is a specialised football statistics portal.
When there was a situation that a club was deducted points administratively 2,
the point deduction was disregarded and we counted only the points earned on
playing field. Much greater challenge was to obtain the wage bills of the clubs.
The easiest was to gain the data for MLS. The MLS player association makes
the player salaries both with and without bonuses public twice each season.
We searched for the data for EPL clubs in their annual reports at Companies
House. Here, we were not able to obtain the salaries without performance
bonuses and the total wage bill includes the salaries of coaching sta↵ for each
1MLS headquarters2Due to corruption charges, financing problems, violent fan behaviour etc.

4. Dataset and Characteristics of Leagues 16
team as well. The case of GBL was complicated by the absence of a centralised
financial statement register in Germany, as clubs have to disclose their financial
statements only to their regional bureaus and these have no obligation to make
them available on the Internet (Bundesliga, 2013). Nevertheless, the respected
economic newspaper Handelsblatt publishes the information about the wages
after each season. Therefore, we relied upon this source. The situation in the
Czech Republic and Slovakia was very similar to the case of England. Never-
theless, in these two countries the players and coaching sta↵ are o�cially not
employees of the clubs. They are understood as entrepreneurs providing their
services to the clubs (Hospodarske noviny, 2014). Therefore, it seemed that
it would be very di�cult to get the information about the wage bills. How-
ever, after phone and email communication with accounting sta↵ of some of the
clubs3, it was made clear to us to use the services account in the clubs’ income
statements which we obtained from Obchodnı rejstrık and Obchodny register
in the Czech Republic and Slovakia respectively. Even though it includes also
payments to other entities other than players and coaches, the total amount
of these payments is supposed to be negligible compared to the players’and
coaches’ compensation.
4.2 English Barclay’s Premier League
EPL was founded in 1992 as FA Premier League. It was created to increase
revenue from broadcasting rights out of English Football League, which had
been played consecutively since 1888 (premierleague.com, 2013). It consists
of 20 English and Welsh4 clubs and operates on promotion-relegation system
where 3 worst-ranked teams are replaced by the 3 best-ranked teams from the
Football League. Only 5 teams have been able to win the title: Manchester
United (13 times), Arsenal (3), Chelsea (3), Manchester City (2) and Black-
burn Rovers (1) (as of 2014). From legal standpoint it is a corporation in which
the member teams act as shareholders. Each of the teams plays 38 games a
season (one home and one away game against each of the other teams). Teams
are awarded either 3 points or 1 point for a win and a draw respectively. No
points are awarded for a loss. It has been providing supportive environment
for its teams who managed to win four Champions League and two Europa
3AS Trencın, MFK Ruzomberok, AC Sparta Praha4Swansea and Cardi↵ City are located in Wales but are part of English Football Associ-
ation
4. Dataset and Characteristics of Leagues 17
League titles5 since 1992. It has been ranked the best national football league
by IFFHS 4 times since 1992 and since 2009 it has been ranked second best
by both International Federation of Football History & Statistics (IFFHS) and
Union of European Football Associations (UEFA) every year (i↵hs.de, 2014).
Taken from the financial perspective, EPL is sovereign among European
football leagues. In 2012-2013 it generated €3.2 billion of revenues (Jones and
Boon, 2013). When we take all the sports competition in the world, this was
shadowed only by 3 American leagues: NFL, MLB, and NBA6. In terms of
revenue per club it is even in front of NBA on the third position (Jones and
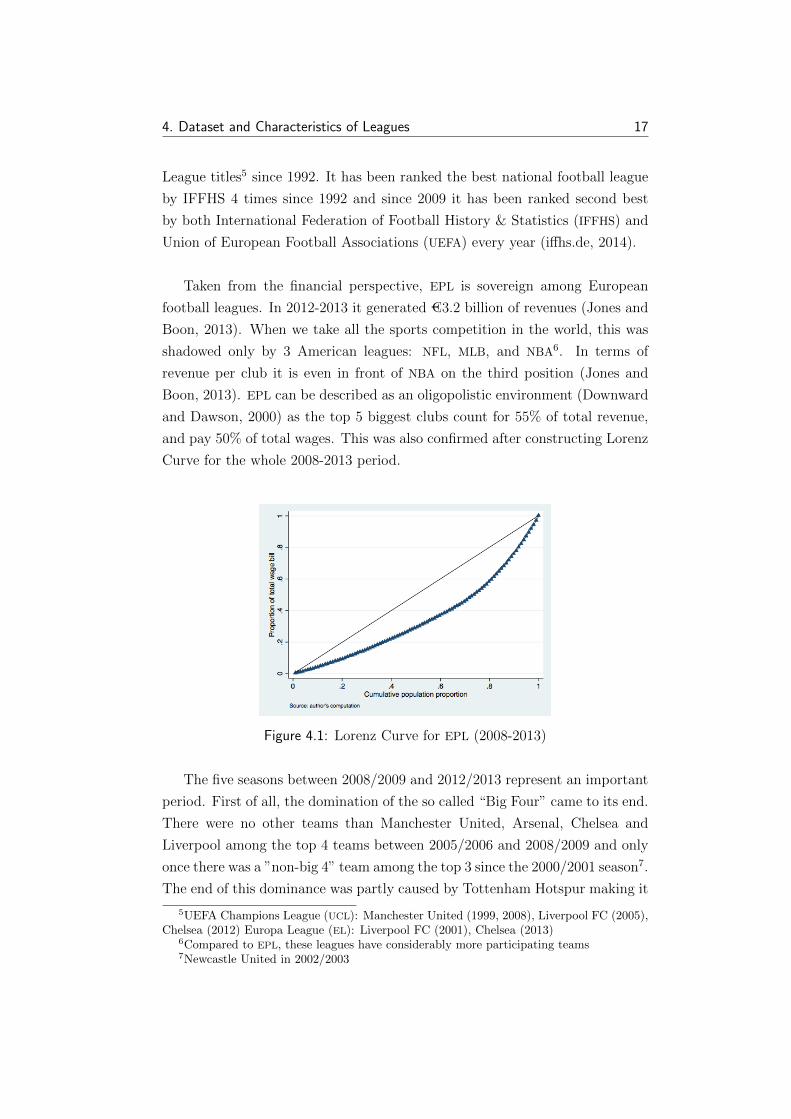
Boon, 2013). EPL can be described as an oligopolistic environment (Downward
and Dawson, 2000) as the top 5 biggest clubs count for 55% of total revenue,
and pay 50% of total wages. This was also confirmed after constructing Lorenz
Curve for the whole 2008-2013 period.
Figure 4.1: Lorenz Curve for EPL (2008-2013)
The five seasons between 2008/2009 and 2012/2013 represent an important
period. First of all, the domination of the so called “Big Four” came to its end.
There were no other teams than Manchester United, Arsenal, Chelsea and
Liverpool among the top 4 teams between 2005/2006 and 2008/2009 and only
once there was a ”non-big 4” team among the top 3 since the 2000/2001 season7.
The end of this dominance was partly caused by Tottenham Hotspur making it
5UEFA Champions League (UCL): Manchester United (1999, 2008), Liverpool FC (2005),Chelsea (2012) Europa League (EL): Liverpool FC (2001), Chelsea (2013)
6Compared to EPL, these leagues have considerably more participating teams7Newcastle United in 2002/2003
4. Dataset and Characteristics of Leagues 18
into top 4 twice but mainly because of the emergence of a new ambitious team
- Manchester City. Exactly coinciding with the start of our observed period i.e.
in the start of 2008 season, Abu Dhabi Investment Group purchased the club.
In the first 2 seasons the club paid more than €300 million in transfer fees for
new players and tripled its wage bill (transfermarkt.de, 2015). Even with such
a financial power Manchester City struggled to make it into the top 4 in the
first 2 seasons finishing 10th and 5th respectively. However, they made it into
the top 3 in each of the three following seasons after investing additional €300
million in transfers and almost doubling its wage bill relative to the 2009/2010
season. Another reason why these 5 seasons are special is the fact that they are
the last 5 seasons of Alex Ferguson’s era as the manager of Manchester United.
The legendary manager kept his job for 26 consecutive seasons and won 38
trophies including 13 Premier League and 2 UCL titles (BBC News, 2013). He
was famous for his orthodox approach to deal with his star players. ”David
Beckham thought he was bigger than me that is why he had to leave,” wrote
Ferguson about the surprising transfer of his best-paid player at that time -
David Beckham. He dealt with other great footballers similarly: Jaap Stam,
Ruud van Nistelrooy, and Cristiano Ronaldo (Ferguson, 2013, p. 25). One of
the reason why Ferguson was so admired was the fact that he was able to win
more trophies than anyone in England without having the highest budgets.
Lastly, these 5 seasons are a↵ected by the echo of 2008 financial crisis. Clubs
revenues shrank but costs stayed more or less the same which resulted in a
massive increase in debt among English clubs. In 2010 56% of the total debt
of all European football teams were contributed by English clubs (Fox, 2010).
There was an immediate call for more financial control by some clubs. However,
the clubs were not able to make an agreement until December 2012 when new
financial fair-play rules were introduced. They consist of 2 main elements:
Long-term sustainability clubs are not allowed to make a loss in excess of €105m
for the seasons 2013/2014, 2014/2015 and 2015/2016 aggregated.
Short-term control measure clubs’ wage bill can rise max. by 100% between
2012/2013 and 2013/2014 and max. by 50% between 2013/2014 and
2014/2015 (premierleague.com, 2012).
Therefore, our observed period presents the very last opportunity to observe
the e↵ects of a rapid increase of wages on results.

4. Dataset and Characteristics of Leagues 19
As can be seen in Table 4.1, the most paying team won the league only twice
and the least paying team never finished the last. Tottenham achieved a place
in UCL with only 7th highest wage budget in 2009/2010. However, not even
6th highest wage bill saved Newcastle United from relegation in 2008/2009.
Despite all these facts, league standings seems to follow wage bill ranks on
most occasions.
Team sheetSeason Position Team Wage Bill Rank
2008/2009
1 Manchester United 24 Arsenal 318 Newcastle United 620 West Bromwich Albion 19
2009/2010
1 Chelsea FC 14 Tottenham Hotspur 718 Burnley 1919 Hull City8 16
2010/2011
1 Manchester United 34 Arsenal 518 Birmingham City 1720 West Ham United 16
2011/2012
1 Manchester City 14 Tottenham Hotspur 618 Bolton Wanderers 1320 Wolverhampton Wanderers 17
2012/2013
1 Manchester United 24 Arsenal 418 Wigan Athletic 2020 Queens Park Rangers 7
Table 4.1: League Position vs. Wage Bill Rank Comparison for EPL
4.3 German Bundesliga
Football has been German national passion for a long time. However, it took
Germans much longer to create a nation-wide competition compared to Eng-
land or even former Czechoslovakia. Until 1963 when Bundesliga was finally
created in West Germany only several regional leagues had been played and
their winners had played each other in play-o↵ matches. Since then Bundesliga
has experienced several reorganisations, the most important one of them was
the incorporation of teams from East Germany in 1991 following German re-

4. Dataset and Characteristics of Leagues 20
unification. These teams could, however, not withstand the economic di↵er-
ences and even in the observed period 18 years after the reunification only
one team9 played in GBL and its spell in the league lasted only one season.
18 teams playing 34 games a season compete in Bundesliga which operates
on promotion-relegation basis with 2nd Bundesliga. 17th and 18th teams are
relegated automatically while 16th plays a playo↵ game against 3rd team of
2. Bundesliga. Until the 2011/2012 season the 3 best-placed teams were pro-
moted to UCL. Thanks to their successful performance the number increased
to 4 since 2012/2013 season. The two best-placed teams that do not qualify
for UCL earn spots in Europa League. Bayern Munich is the most successful
team in GBL history with 23 GBL titles. The Bavarians have not had an equal
contender throughout the whole GBL history, and therefore the second-most
successful teams are Borussia Monchengladbach and Borussia Dortmund with
only 5 titles each.
GBL is Europe’s second biggest league in terms of revenue (Jones and Boon,
2013) and it can boast the biggest average attendance per match, mainly due to
new stadiums and lowest ticket prices among TOP 5 European leagues (Jack-
son, 2010). Compared to EPL, Bundesliga enjoys much higher incomes from
broadcasting rights10 and its clubs can rely on high streams from sponsorship
deals with local firms. Most importantly, clubs are able to keep player wages
relatively low11. As the to financial regulations there is the 50+1 rule concern-
ing ownership of the clubs. Under this rule club members have to hold the
majority of voting rights (Satzung DFB, 2000). This protects the clubs from
being purchased by foreign tycoons or external investors12. In general the clubs
are almost free of debt and most of them achieve black numbers in terms of
profitability (Crook, 2013).
The observed period between 2008 and 2013 saw 3 di↵erent champions.
Bayern Munich and Borussia Dormund celebrated 2 league titles each and
VfL Wolfsburg added their very first ”Meisterschale” in the 2008/2009 season.
The positive trends in the financial situation of German clubs gradually led
to an improvement in their results in European competitions and resulted in
9Energie Cottbus10Thanks to a much more competitive TV market (Crook, 2013)11Less than 50% of revenues compared to 80% in EPL (Source: author’s computations)12There are 2 exceptions: Bayer Leverkusen is owned by majority by Bayer AG and VfL
Wolfsburg by Volkswagen AG

4. Dataset and Characteristics of Leagues 21
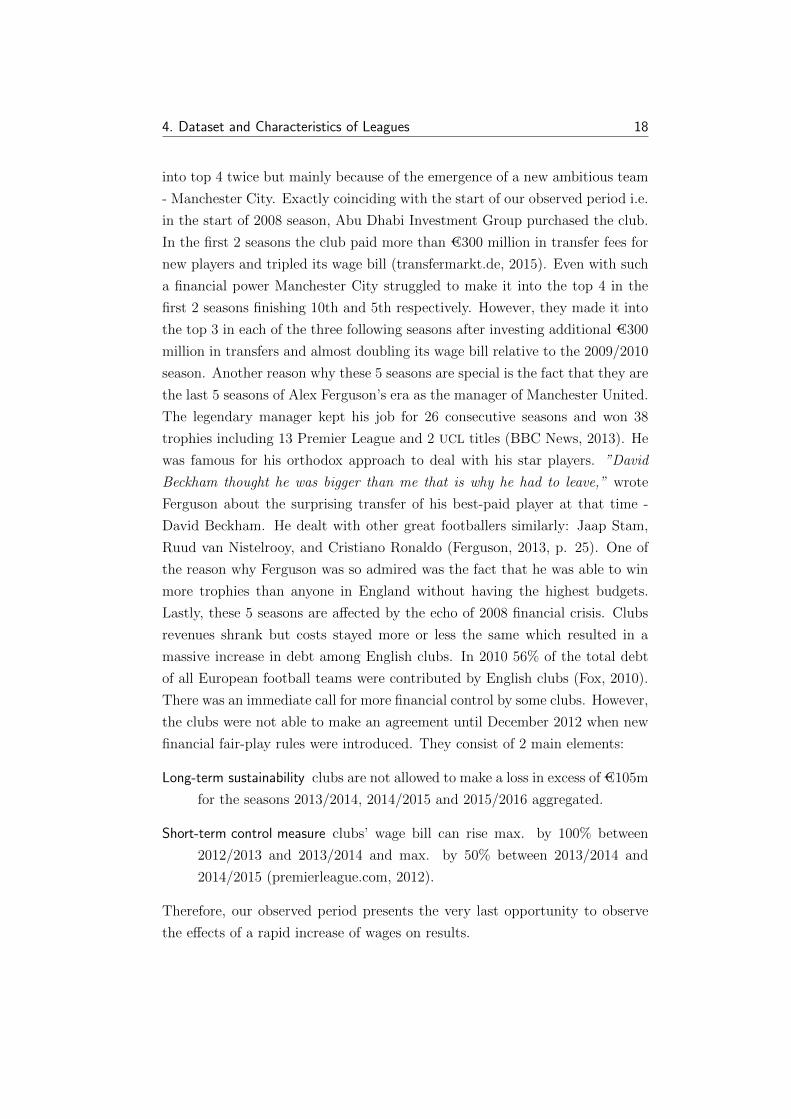
Figure 4.2: Lorenz Curve for GBL (2008-2013)
a German-only UCL finals between Bayern Munich and Borussia Dortmund in
2013. The fact that Bayern was the most-paying team was true in each of
the observed seasons. They paid approximately 50% more then the second-
most-paying teams which were either Schalke 04 or VfL Wolfsburg13. Despite
such massive spendings Bayern won only 2 league titles. The same number
as Borussia Dortmund who worked with a slightly over-average wage budget
but was supported by the largest number of fans on the biggest stadium in the
country (soccerstats.com, 2015). As seen in the following Table 4.2, the story
of Borussia Monchengladbach is also interesting. In season 2010/2011 they had
to play to avoid relegation from Bundesliga with 12th largest wage budget, but
12 months later with 9th largest budget they earned a spot in UCL. The teams
that finished last were always from the bottom half of the wage bill ranking
and twice it was exactly the last team from the ranking.
4.4 Major League Soccer
European football, or soccer as known in American English, has always been
in the shadow of typical American sports such as baseball, basketball, ice-
hockey, and most notably its namesake American football. Plans for MLS itself
were established in 1988 as part of American World Cup 1994 candidacy which
promised establishment of professional nation-wide football competition start-
ing from 1996 (MLSsoccer.com, 1996). Of course, football had been played in
the US and Canada well before that happened but it had never been able to
13Source: author’s computations

4. Dataset and Characteristics of Leagues 22
Team sheetSeason Position Team Wage Bill Rank
2008/2009
1 VfL Wolfsburg 24 Hertha BSC 1016 Energie Cottbus 1318 Arminia Bielefeld 18
2009/2010
1 Bayern Munich 14 Bayer 04 Leverkusen 716 1. FC Nurnberg 1618 Hertha BSC Berlin 13
2010/2011
1 Borussia Dortmund 74 Hannover 96 1116 Borussia Monchengladbach 1218 FC St. Pauli 14
2011/2012
1 Borussia Dortmund 54 Borussia Monchengladbach 916 Hertha BSC Berlin 1318 1. FC Kaiserslautern 17
2012/2013
1 Bayern Munich 14 Schalke 04 216 TSG 1899 Ho↵enheim 1118 SpVgg Greuther Furth 18
Table 4.2: League Position vs. Wage Bill Rank Comparison for GBL
attract much attention. Even with players such as Pele or Beckenbauer kick-
ing ball in American stadiums14. MLS started with ten American teams and
has been growing steadily. In 2015 it has 20 teams - 17 based in the USA
and 3 in Canada. The most successful teams are LA Galaxy followed by D.C.
United with 5 and 4 MLS cups respectively. Meanwhile, it uses the same point
system as in European football competitions, MLS is quite unique due to the
features shared with the other professional competitions in the USA. First of
all, there is no promotion or relegation. If a team wants to enter it has to buy
franchise rights from MLS. This way the teams are not independent entities
but branches of the head corporation (hoovers.com, 2015). Secondly, the entry
draft, a procedure where the teams lay exclusive rights on the rookie players,
takes place every year. Lastly, the wage bills are restricted by the wage cap.
Equivalently to European Champions League, MLS teams compete in the CON-
14New York Cosmos which Pele and Beckenbauer played for was part of NASL (NorthAmerican Soccer League), established in 1968 with early success but followed by decline inthe 1980s and dissolution in 1984

4. Dataset and Characteristics of Leagues 23
CACAF Champions League (CCL)15 . The three best-placed US-based teams
have their places in CCL guaranteed. Moreover, the fourth team plays at the
US Open with the teams from other American club competition for another
spot and Canadian teams can win a spot allocated to Canada at the annual
Canadian Championship. Since the creation of the CCL, the MLS teams have
not been able to win the trophy. Nevertheless, LA Galaxy is the only non-
Mexican team that made it as far as the semifinals (transfermarkt.de, 2015).
MLS is nowhere near EPL when it comes to the finances. In 2012 it generated
€362 million in revenues (€19.1 million per team) (Smith, 2013). Compared
to European competitions the closest match for MLS is German 2nd Bundesliga
(€384.5 million and €21.4 million per team) (Bundesliga, 2013). The teams are
required to respect the salary cap of $3.1 million. The teams’ top 20 best-paid
players count to this salary cap and the maximum salary for a single player
is $387.500 (MLS Player’s Union, 2014). However, there are three exceptions
established to attract player quality while maintaining the salary cap.
Designated Player Rule - this rule allows the clubs to pay wages exceeding the
maximum salary to a limited number of players. Their salary, regardless
how big it is, counts only for $387 500. This rule was used to attract
some of the world’s most renowned footballers. Nonetheless, usually they
come to MLS in the late stage of their careers when their abilities are
declining. This rule was used for the first time in 2007 in case of David
Beckham, and thus it is often colloquially called the ”Beckham Rule”
(MLS Player’s Union, 2014). Other famous players signed under this rule
are Thiery Henry, Robbie Keane, Kaka, Rafael Marquez, Tim Cahill, or
Jermaine Defoe.
Core Player Rule - this rule allows re-signing of players using retention funds
that do not count against the salary cap (MLSsoccer.com, 2009). Reten-
tion funds are earned by selling players to other leagues. The transfer fee
itself goes to the MLS, which in return allows the clubs to use these funds
to increase their wage caps.
Adidas Generation - this programme is a joint venture between MLS and U.S.
Soccer16 and is supposed to attract the best young American players to
15CONCACAF - football federation of North America and the Caribbean16Governing body of football in the USA

4. Dataset and Characteristics of Leagues 24
stay playing in MLS while studying. Their salaries are covered by the
name sponsor of the programme and do not count against the salary cap
at all. Several prominent American players such as Landon Donovan,
Clint Dempsey, Tim Howard, or Michael Bradley were persuaded to prefer
playing in their homeland and reject o↵ers from European clubs thanks
to the programme (US Soccer Players, 2012).
The Lorenz curve for MLS is much less convex than the ones of EPL and
GBL which indicates less heterogeneity within MLS clubs.
Figure 4.3: Lorenz Curve for MLS (2009-2013)
In the period between 2009 and 2013 seasons, MLS continued in its expan-
sion. Five new clubs joined the league: Seattle Sounders (2009), Philadel-
phia Union (2010), Portland Timbers (2011), Vancouver Whitecaps (2011),
and Montreal Impact (2012). Mainly thanks to the Designated Player Rule the
wage bills increased dramatically17 in spite of the financial crisis. Thanks to
this rule 21% of the league’s total wages went to only 5 players and there was
much more income inequality in MLS than in any other major US sports league
(MLS Player’s Union, 2014). NY Redbulls, LA Galaxy, and Seattle Sounders
were the most paying teams with each of them paying more than 2.5 times
more than the median wage bill.
Even a quick glance at Table 4.3 is enough to see a di↵erence to EPL. We
chose to enclose teams finishing in 1st (MLS champion), 4th (CCL qualification)
and the last position in the league. It happened twice that the champion was
also the best-paying team. However, Columbus Crew and mainly San Jose
17From $52 million in 2009 to $94 million in 2013

4. Dataset and Characteristics of Leagues 25
Earthquakes victories indicate that even an average or even well below average
wage bills can pay for the championship trophy. Even more surprising is the
fact that the teams in the last positions never belonged to the most modest
teams. On the contrary, the fourth or the third highest budgets did not prevent
teams from finishing at the bottom of the table.
Team sheetSeason Position Team Wage Bill Rank
20091 Columbus Crew 74 Seattle Sounders 515 New York Red Bulls 4
20101 LA Galaxy 24 FC Dallas 816 D.C. United 10
20111 LA Galaxy 14 FC Dallas 1218 Vancouver Whitecaps 4
20121 San Jose Earthquakes 174 NY Red Bulls 119 Toronto FC 3
20131 New York Redbulls 14 Real Salt Lake 1019 D.C. United 8
Table 4.3: League Position vs. Wage Bill Rank Comparison for MLS
4.5 Gambrinus Liga
Gambrinus Liga was founded as First Czech Football League in the summer
of 1993 after the dissolution of Czechoslovak League. Czechoslovak League
was established in 1925 and until 1931 it was played exclusively by Czech
clubs (Rec.Sport.Soccer Statistics Foundation, 2000). In the 1960s and 1970s
it was regarded as one of the best football leagues in the world with world-
wide superstars such as Josef Masopust, Antonın Panenka, Josef Bican, or
Jan Popluhar. Nowadays, the league is contested by 16 teams and operates a
promotion-relegation system the National Football League (Narodnı fotbalova
liga). The teams play 30 games a season playing each team twice. In the seasons
2008/2009 and 2009/2010 the best two teams earned spots in the UEFA Cham-
pions League qualification, while afterwards only the league winner played in
UCL. The two teams behind UCL participants played in UEFA Europa League

4. Dataset and Characteristics of Leagues 26
as well as the Czech National Cup champion. The last two teams are relegated
and replaced by the first two teams from Narodnı fotbalova liga. As of 2014
there are 5 teams which managed to win the league: Sparta Prague (12 titles),
Slavia Prague (3), Slovan Liberec (3), Viktoria Plzen (2), Banık Ostrava (1).
CGL does not belong to the wealthiest leagues in Europe in terms of rev-
enue. UEFA ranked the league as 21st in Europe in terms of average revenue
per club (UEFA, 2011). There is also big heterogeneity between the wage bills
of the participants. For instance in 2010/2011 Sparta Prague was paying 24
times more to its players than the least-paying team - FK Ustı nad Labem18.
Even though such a huge di↵erence lasted only for one season (FK Ustı got
relegated), teams such as Sparta, Slavia (2008/2009, 2009/2010), or Viktoria
Plzen (2011/2012, 2012/2013) spent between 8 to 10 times more on wages than
the least paying teams and between 4-5 times more than the median-paying
team. Such a huge di↵erence is not present in any of the remaining 4 observed
leagues. Another interesting fact is that the total league’s wage bill was high-
est in season 2008/2009 and was gradually declining until 2012/201319. This
is partly caused by the decline of SK Slavia Prague, the most paying team in
2008/2009, but the main factors contributing to the downturn are the global fi-
nancial crisis and appreciation of the Czech Koruna vis-a-vis Euro (Maly, 2011).
The wage bill heterogeneity is clearly visible in Lorenz curve when 80% of
most-paying clubs pay more than 50% of total league wages.
Figure 4.4: Lorenz Curve for CGL (2008-2013)
18418.4 million CZK vs. 17.137 million CZK19From 1.89 billion CZK to 1.621 billion CZK

4. Dataset and Characteristics of Leagues 27
In the observed period 4 di↵erent clubs became the champions: Vikto-
ria Plzen (2010/2011, 2012/2013), Slovan Liberec (2011/2012), Sparta Prague
(2009/2010), and Slavia Prague (2008/2009). During this 5-year period CGL
experienced several other significant events. First, Czech clubs lost their com-
petitive position in European competitions and lost one of the 2 spots in UCL
qualification. Successful UCL campaign of Viktoria Plzen in 2011/2012 season
was a sign of potential improvement, though. Secondly, SK Slavia Praha after
being champion in 2007/2008, and 2008/2009, playing UCL group stage in the
first of the seasons, and opening of the new Eden Stadium started to experi-
ence financial problems. These problems led gradually to the loss of Slavia’s
position as Sparta’s main challenger and Slavia finished 10th, 12th, and 8th
in season 2010/2011, 2011/2012, and 2012/2013. Slavia’s emptied spot was
quickly taken by Slovan Liberec and especially by Viktoria Plzen which has
never abandoned the top three since 2010/2011 season. The relegation of 1.FC
Brno, one of the most popular and famous Czech clubs, drew attention on the
other side of the table.
In the table 4.4 we decided to include teams that finished first and claimed
the championship, the third teams which were guaranteed a place in Europa
League and the last two teams which got relegated for each season. The table
shows that although the most-paying club was the champion only once, there
are fewer outliers compared to MLS. The least-paying team got relegated in
3 out of 5 seasons, and only once a team from the bottom half of the wage
ranking claimed 3rd spot, and thus gained the promotion to Europa League.
4.6 Corgon Liga
Similarly to CGL, Slovak top football division was established as Slovak Su-
perliga in 1993 after the dissolution of the Czechoslovak Football League. Slo-
vak teams played an important role in the history of Czechoslovak football.
Three of them were able to win the league: SK Slovan Bratislava (8 times),
Spartak Trnava (5 times), and Inter Bratislava20 (once). These teams con-
tributed the key players to the Czechoslovak national team and represented
Czechoslovakia in European club competitions. Moreover, Slovan Bratislava is
the only Czechoslovak team to win a major European competition - Cup of
20Formerly known as Cervena Hviezda Bratislava

4. Dataset and Characteristics of Leagues 28
Team sheetSeason Position Team Wage Bill Rank
2008/2009
1 Slavia Prague 13 Slovan Liberec 715 Tescoma Zlın 1416 Viktoria Zizkov 10
2009/2010
1 Sparta Prague 23 Banık Ostrava 415 Sk Kladno 1616 FK Bohemians Prague (Strızkov) 15
2010/2011
1 Viktoria Plzen 43 Baumit Jablonec 1318 1.FC Brno 620 FK Ustı nad Labem 16
2011/2012
1 Slovan Liberec 63 Viktoria Plzen 115 Bohemians Prague 1905 1416 Viktoria Zizkov 16
2012/2013
1 Viktoria Plzen 23 Slovan Liberec 415 Dynamo Ceske Budejovice 816 FC Hradec Kralove 12
Table 4.4: League Position vs. Wage Bill Rank Comparison for CGL
Winner’s Cup in 1969 after beating FC Barcelona in the finals. In 1993 the 6
Slovak participants of the Czechoslovak league were joined with top 6 teams
from Slovak National League21. During its existence it often changed names
but between 2003 and 2014 it was called Corgon Liga because of sponsorship
reasons and since 2006 it has had 12 participants again22 (transfermarkt.de).
The 12 participants play each team 3 times per season and the 12th is relegated
to the Slovak Second League. The balance of powers and league positions of
teams change very quickly, and therefore no teams has played all 20 seasons in
the top division. There are two teams which has dominated SCL in the first 20
years of its existence - Slovan Bratislava with 8 league titles and MSK Zilina
with 6 league titles (as of 2014). The champion of SCL plays in the Champions
League qualification, the second and the third team plays in Europa League.
In terms of financial situation, Slovak teams are similar to those from the
21Former second division of Czechoslovak Football League pyramid221996 to 2000 - 16 teams, 2000-2006 - 10 teams

4. Dataset and Characteristics of Leagues 29
Czech Republic. Whereas there is no club comparable to Sparta Prague in
terms of wage bill in Slovakia, the upper part of SCL pays their players com-
parable wages to their Czech counterparts. Similarly to CGL the wage bills of
Slovak teams were on decline between the season 2008/2009 and 2012/2013.
They declined by 26% from €27.447 million in the first observed season to
€20.397 million in the last season observed. This is supposedly again due
to the negative e↵ects of the financial crisis (Gasparovic, 2009). Additionally,
rapid decline of one of the former richest Slovak clubs, Artmedia Petrzalka, had
its e↵ect, too. The clubs are financially much more homogeneous compared to
CGL. Whereas when small clubs like Vion Zlate Moravce played SCL their
wage bills was approximately 11 times lower than Slovan Bratislava’s one, in
the other seasons this multiple is much smaller23. Slovak clubs contrary to the
teams from the best-ranked leagues are usually dependent on a single stream of
revenue - their owner (Transparency International, 2012). Nevertheless, when
the owners get into troubles, the clubs often fail to pay wages on time which
leads to notorious disputes between the clubs’ o�cials and the players.
Lorenz curve shows signs of lower heterogeneity compared to CGL, although
the top 20% of teams still pay around 40% of all wages while bottom 20%
account only for less than 10%.
Figure 4.5: Lorenz Curve for SCL (2008-2013)
Only two teams dominated SCL in the period between the seasons 2008/2009
and 2012/2013. Slovan Bratislava and MSK Zilina were replacing themselves
on the throne of the Slovak football champion season after season. These 2
23Between 4.5 to 5

4. Dataset and Characteristics of Leagues 30
teams also dominated the pay table. Only one team in one season got between
them; Artmedia Petrzalka with second highest wage bill in the 2008/2009 sea-
son. This team is a typical example of how Slovak clubs are dependent on
a single person. After the title-winning season 2007/2008 Artmedia’s owner,
Ivan Kmotrık, announced his exit from Armedia and simultaneously he bought
a majority share in Slovan Bratislava (Hospodarske noviny, 2008). Previously
successful club which achieved considerable successes in European cups quickly
fell in the league table and eventually got relegated in 2009/2010 season. Slo-
vak clubs enjoyed relatively good period in the European competitions: MSK
Zilina played in the group stage Europa League in 2008/2009, and in the group
stage of UCL in 2010/2011, Slovan Bratislava played in the group phase of EL in
2011/2012. The experience gained thanks to European confrontation gave the
teams even greater advantage as well as considerable financial amounts which
allowed the two teams to strengthen their dominance (UEFA, 2011).
In the table 4.5 one can see the comparison of the teams finishing as 1st
(UCL qualification), 3rd (EL qualification) and 12th (relegation). The team
paying highest salaries won SCL only once - Slovan Bratislava in the 2010/2011
season. Except for AS Trencin in 2012/2013, the teams finishing third were
among the 4 most paying teams. On the other hand, the relegation of DAC
Dunajska Streda or Tatran Presov proved that even with relatively high wage
budget clubs were not safe from relegation.

4. Dataset and Characteristics of Leagues 31
Team sheetSeason Position Team Wage Bill Rank
2008/20091 Slovan Bratislava 33 Spartak Trnava 412 ViOn Zlate Moravce 12
2009/20101 MSK Zilina 23 Dukla Banska Bystrica 412 MFK Petrzalka24 8
2010/20111 Slovan Bratislava 23 MSK Zilina 112 MFK Dubnica 10
2011/20121 MSK Zilina 23 Slovan Bratislava 112 DAC Dunajska Streda 3
2012/20131 Slovan Bratislava 13 AS Trencın 912 Tatran Presov 5
Table 4.5: League Position vs. Wage Bill Rank Comparison for SCL
Chapter 5
Model and Discussion of the
Results
In this section we would like to describe the model used to find the pay-
performance relationship. First, we want to describe the selection of the vari-
ables used. Secondly, we would like to implement pooled OLS, fixed e↵ects,
between e↵ects and random e↵ects models, compare their results and find out
which of them is the most suitable one. This we would like to undertake using
the data for all 5 observed competitions. Thirdly, we would like to develop a
separate model for each of the competitions and observe the di↵erences between
them. Before we do that, we will start with examination of the correlation be-
tween the clubs’ position in the league table and their position in the respective
payroll table.
5.1 General Model
In the name of the thesis,”Does Money Guarantee Money in Football”, we do
not refer to a particular competition, and thus our first and main task is to pre-
pare a general model that could predict how much clubs’ results are influenced
by the money paid to players and coaching sta↵s by clubs across all 5 observed
competitions. The key variables are points, goals and wages. However, the
entries are not directly comparable across the leagues or between di↵erent sea-
sons due to di↵erent number of games played1, or overall financial level of the
130 games a season in CGL, 33 SCL, 34 in GBL, 36 in EPL and varying in MLS (due tovarying number of participants)

5. Model and Discussion of the Results 33
competition2.
We decided to generate a variable called WRM (wages relative to median)
which represents team payroll spending relative to the median team payroll
of the league in the particular season. Median was used instead of average
contrary to Hall, Szymanski and Zimbalist (2002). We believe that using me-
dian is more suitable for our analysis as in some of the observed competitions
several teams have much higher payrolls compared to their peers which drives
up the average although most of the teams have below-average payrolls. When
it comes to measuring performance a new variable, perpoints, was created. It
measures number of points earned as a fraction of total number of points that
could have been earned by the clubs. Thus, the fact that for example 60 points
have smaller value in EPL than in CGL is dealt with. Nevertheless, it is also true
that the use of such variables makes the interpretation of the results more com-
plicated. Moreover, when examining the e↵ects of wages on goals we worked
with goals-per-game measure. The table comparing variables perpoints, cham-
pion, goalpg and WRM in di↵erent leagues is enclosed below. One can see
that the measures are comparable for all leagues, and therefore can be used in
general models pooling all the leagues together.
EPL GBL MLS CGL SCL0.4578 0.4586 0.4539 0.4567 0.4540
perpoints(0.1454) (0.1380) (0.1075) (0.1393) (0.1245)0.0505 0.0556 0.0575 0.0625 0.0833
champion(0.2201) (0.2303) (0.2341) (0.2436) (0.2787)1.3698 1.4451 1.2877 1.2688 1.1798
goalpg(0.4035) (0.4239) (0.2380) (0.3862) (0.3368)1.3219 1.2127 1.3589 1.3917 1.1401
WRM(0.7864) (0.7061) (0.9080) (1.2350) (0.6568)
Table 5.1: Means of Variables across Leagues
After generating all the necessary variables, we started to look for the right
model specification. We tried to add a dummy variable for every season but
they proved not significant. This was expected because if one of the dummies
was significant, it would mean that the percentage of points gained would di↵er
significantly in this particular season. As the points allocation rules did not
2E.g. the wage bill of the most-paying team in SCL is much lower than the wage bill ofthe least-paying in EPL

5. Model and Discussion of the Results 34
change in any of the seasons and competitions, the insignificance of the dum-
mies makes sense.
The next step was to test the significance of interaction terms between
WRM and the year dummies. Their significance would mean that wages had
di↵erent e↵ect on points in di↵erent years. We tried to include all the pos-
sible combinations but none of them proved significant. The White test for
heteroscedasticity was undertaken as well and there was not enough evidence
found to reject homoscedasticity hypothesis. RESET test for model specifica-
tion was also done. Nevertheless, linear specification proved to be the most
suitable.
Lastly, we tried to include the squared term of WRM. It could expose
whether the marginal e↵ect of an additional increase in WRM on perpoints is
positive or negative, and how big it is. This term proved to be very significant,
and therefore it was added into the model:
perpoints = �0 + �1WRM + �2WRM
2 + u (5.1)
5.2 Correlation between Wage Bill Rank and League
Rank
Correlation coe�cient is a measure of linear dependence between two random
variables that does not depend on units of measurement and takes on the
values between -1 and 1, where -1 and 1 represent perfect linear dependence
(Wooldridge, 2009). In order to get oriented how the league position depends
on wage bills of the clubs, we firstly looked at the correlation coe�cients for
all the observed leagues and all the seasons. In the table 5.1 one can see that
the coe�cients were changing rapidly from season to season. Nevertheless, in
general it can be concluded that the higher the quality of the league3, the more
greatly the league and wage bill ranks are correlated as the highest coe�cients
was found in the most renowned leagues - EPL and GBL. MLS with its wage bill
3According to the UEFA coe�cient4

5. Model and Discussion of the Results 35
cap system has the lowest correlation from all 5 leagues. Taken from seasonal
perspective there seems to be a drop in the observed correlation between the
2009/2010 and 2010/2011 season. This might be loosely connected to the e↵ects
of the global financial crisis of 2008. When clubs got into financial problems,
they made a lot of players redundant after their contracts expired5. With such
an oversupply of free-agent players they were willing to be underpaid, mean-
while the players with lasting contracts enjoyed their pre-crisis wages. The
balance on the market was distorted because players with the same skills were
paid di↵erently only due to the fact whether their contract was signed before
or after the crisis.
League 2008/2009 2009/2010 2010/2011 2011/2012 2012/2013 OverallPremier League 0.6962 0.8048 0.8582 0.7003 0.6496 0.7401Bundesliga 0.7491 0.8080 -0.0498 0.7309 0.6640 0.5806Major League Soccer6 0.2714 0.3088 0.0506 -0.0193 0.1417 0.1433Gambrinus Liga 0.6412 0.5941 0.3118 0.5441 0.5029 0.5188Corgon Liga 0.7954 0.4615 0.4068 0.3636 0.1608 0.4382Overall 0.6691 0.6684 0.3840 0.5055 0.4987 0.5399
Table 5.2: Correlation Coe�cients between Position in League Tableand Payroll Ranking
5.3 Pooled OLS
In the first part of the analysis we will use pooled OLS estimation method
to find out the e↵ects of wages, represented by wage bill relative to league’s
seasonal median wage bill ratio. By using pooled OLS the time aspects of
the estimation will be e↵ectively disregarded and di↵erent seasons of the same
league will be independent of each other.
Actually, this approach is not di↵erent from having observations from 25
di↵erent leagues in a single season. Although it may seemingly distort reality,
many authors who cover this topic use this type of regression. They argue
that teams’ performance in the last seasons have no or minimal e↵ect on the
performance of the team in the next season (Szymanski, 2003). Following this
logic if the whole squad of Manchester United was swapped with the one of
AFC Sunderland and the players wages would be kept equal AFC Sunderland
5The lag is expected as an average length of football player contract is 3.5 years in EPL
(Amir and Livne, 2005)

5. Model and Discussion of the Results 36
would attain position in the top of the table, meanwhile the famous Manch-
ester United would have to fight hard to avoid relegation. It is di�cult to
find an example of such a situation because transfers of groups of more players
between two clubs happen very rarely. However, one such case occurred in
Slovak Corgon Liga in the very beginning of the observed period before the
season 2008/2009. Artmedia Petrzalka was the reigning champion, the team
who has only as the second Slovak team participated in the group phase of
UCL and one of the wealthiest clubs of SCL. However, its owner and chairman
decided to leave the club and bought majority interest in the most famous and
successful Slovak team - Slovan Bratislava. With him he took 5 key players of
the league winning team among them also several national team players (trans-
fermarkt.de). Five players of Slovan Bratislava’s 2007/2008 squad went in the
opposite direction. In the 2007/2008 season Artmedia won the league with
74 points (scored 77 goals) and Slovan finished 5th with 51 points (scored 46
goals). After this massive player transactions in the 2008/2009 season Slovan
won the league with 70 points (69 goals) and Artmedia finished 6th with 47
points (46 goals) (transfermarkt.de). The almost-mirror-image results of the
two teams in terms of positions, points and goals before and after the group
player transfer indicate that there might be validity to the claims that each
season represents an unique environment without strong links to the former
performance.
Table 5.2 o↵ers the results of 3 di↵erent regression models. The dependent
variable of each regression is di↵erent. If success is understood as better league
position, we use dependent variable perpoints
7. In the case that success is to
play attractive football, we used data about goal per game average. Finally,
dummy variable champion is used in a linear probability model when only
league triumph is taken as success.
The first two regressions have quite high coe�cients of determination, mean-
while the third model shows a little weaker explanatory power. Important
discovery is that WRM variable as well as its squared term are significant
in all three models and almost every time at the strictest 0.1% significance
level. When a club increases its budget by 100% of median team’s budget,
it is predicted to gain additional 15.35% of available points. This might not
seem enormous, but one has to keep in mind that mean perpoints is 45.6% and
7Percentage of points earned relative to all possible points in a season
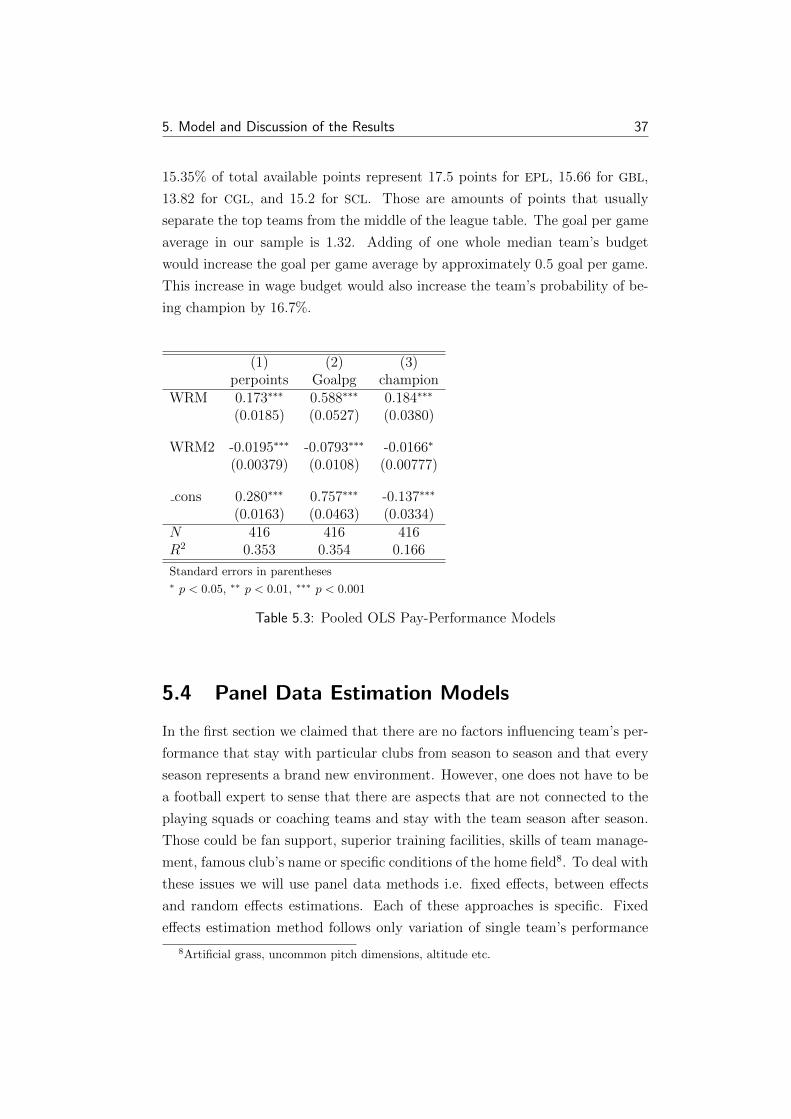
5. Model and Discussion of the Results 37
15.35% of total available points represent 17.5 points for EPL, 15.66 for GBL,
13.82 for CGL, and 15.2 for SCL. Those are amounts of points that usually
separate the top teams from the middle of the league table. The goal per game
average in our sample is 1.32. Adding of one whole median team’s budget
would increase the goal per game average by approximately 0.5 goal per game.
This increase in wage budget would also increase the team’s probability of be-
ing champion by 16.7%.
(1) (2) (3)perpoints Goalpg champion
WRM 0.173⇤⇤⇤ 0.588⇤⇤⇤ 0.184⇤⇤⇤
(0.0185) (0.0527) (0.0380)
WRM2 -0.0195⇤⇤⇤ -0.0793⇤⇤⇤ -0.0166⇤
(0.00379) (0.0108) (0.00777)
cons 0.280⇤⇤⇤ 0.757⇤⇤⇤ -0.137⇤⇤⇤
(0.0163) (0.0463) (0.0334)N 416 416 416R
2 0.353 0.354 0.166
Standard errors in parentheses⇤ p < 0.05, ⇤⇤ p < 0.01, ⇤⇤⇤ p < 0.001
Table 5.3: Pooled OLS Pay-Performance Models
5.4 Panel Data Estimation Models
In the first section we claimed that there are no factors influencing team’s per-
formance that stay with particular clubs from season to season and that every
season represents a brand new environment. However, one does not have to be
a football expert to sense that there are aspects that are not connected to the
playing squads or coaching teams and stay with the team season after season.
Those could be fan support, superior training facilities, skills of team manage-
ment, famous club’s name or specific conditions of the home field8. To deal with
these issues we will use panel data methods i.e. fixed e↵ects, between e↵ects
and random e↵ects estimations. Each of these approaches is specific. Fixed
e↵ects estimation method follows only variation of single team’s performance
8Artificial grass, uncommon pitch dimensions, altitude etc.

5. Model and Discussion of the Results 38
within one cross section. Each club with its 5 observed seasons represents a
cross section in this case. Between e↵ects and fixed e↵ects follow the variation
across cross sections.
5.4.1 Perpoints on WRM
Fixed E↵ects Between E↵ects Random E↵ectsperpoints perpoints perpoints
WRM 0.0352⇤⇤⇤ 0.108⇤⇤⇤ 0.0716⇤⇤⇤
(0.0106) (0.0102) (0.00732)
cons 0.411⇤⇤⇤ 0.303⇤⇤⇤ 0.355⇤⇤⇤
(0.0143) (0.0140) (0.0117)N 416 416 416R
2 0.6892 0.507 0.3118
Standard errors in parentheses⇤ p < 0.05, ⇤⇤ p < 0.01, ⇤⇤⇤ p < 0.001
Table 5.4: Wage-Points Fixed, Between and Random E↵ects Regres-sions
Let us look at the regression results for the first type of regression with
perpoints as dependent variable. In this type of model WRM2 proved not to
be significant, and therefore we excluded it and ran only the simple regression
of perpoints on WRM. Compared to the pooled OLS estimate (0.1535) from
previous sections, these regressions predicts smaller e↵ect and these estimates
are also less significant.
Fixed e↵ects model predicts only 3.52% increase in number of points gained
out of all points available. This corresponds only to 4.01 points in EPL, 3.59
points in GBL and MLS9, 3.17 points in CGL, and 3.48 points in SCL. This
is a very small reward for adding such substantial financial means in form of
wages. This model explains as much as 68.92% of variation in perpoints gains
for particular teams. Less variation is explained by between and random ef-
fects - 50.7% and 31.18% respectively. Nevertheless, random e↵ects model’s10
estimated coe�cient of 0.0716 is twice as big as the one of fixed e↵ects model.
9For 2012 and 2013 seasons10Which is in any case more e↵ective than between e↵ects model

5. Model and Discussion of the Results 39
(1) (2) (3)Goalpg Goalpg Goalpg
WRM 0.188⇤ 0.652⇤⇤⇤ 0.491⇤⇤⇤
(0.0894) (0.0859) (0.0584)
WRM2 -0.0203 -0.0901⇤⇤⇤ -0.0634⇤⇤⇤
(0.0153) (0.0196) (0.0114)
cons 1.130⇤⇤⇤ 0.692⇤⇤⇤ 0.834⇤⇤⇤
(0.0820) (0.0658) (0.0524)N 416 416 416R
2 0.704 0.536 0.353
Standard errors in parentheses⇤ p < 0.05, ⇤⇤ p < 0.01, ⇤⇤⇤ p < 0.001
Table 5.5: Wage-Goals Fixed, Between, and Random E↵ects Regres-sions
In order to determine whether we have random e↵ects i.e. whether fixed
e↵ects are uncorrelated with WRM, we use Hausman test. The relative �
2-
statistic has the value of 22.92 which provides enough evidence to reject the
hypothesis of random e↵ects. Fixed e↵ects are thus the more suitable method
for this model.
5.4.2 Goals on WRM
Again when we look at the estimates of fixed, between, and random e↵ects
models in Table 5.4 we see that they di↵er compared to the estimate of pooled
OLS (0.588). The estimate of fixed e↵ects model (0.188) is much lower and
significant only at 5% significance level, meanwhile random e↵ects model’s
estimate of 0.491 is relatively close to the prediction of pooled OLS. The fixed
e↵ects model explains more than 70% of variation, whereas random e↵ects
only 35.3%. Hausman tests produces �
2-statistic of 20.11 which favours the
alternative of fixed e↵ects model.
5.4.3 Champion on WRM
Finally, we get to the regression which tells us how an additional increase
in players’ pay influences the probability of winning the league. In this case
the estimated coe�cients of fixed e↵ects as well as random e↵ects model are

5. Model and Discussion of the Results 40
Fixed E↵ects Between E↵ects Random E↵ectschampion champion champion
WRM 0.177⇤ 0.130⇤⇤⇤ 0.184⇤⇤⇤
(0.0835) (0.0373) (0.0380)
WRM2 -0.0176 -0.00542 -0.0166⇤
(0.0143) (0.00851) (0.00777)
cons -0.126 -0.0931⇤⇤ -0.137⇤⇤⇤
(0.0766) (0.0285) (0.0334)N 416 416 416R
2 0.3572 0.434 0.1665
Standard errors in parentheses⇤ p < 0.05, ⇤⇤ p < 0.01, ⇤⇤⇤ p < 0.001
Table 5.6: Wage-Champion Fixed, Between, and Random E↵ects Re-gressions
both highly significant and corresponds to the estimate of pooled OLS (0.184).
Taking into account the e↵ect of the negative squared term, which is significant
only for random e↵ects, we can expect that the increase of club’s payroll by
the amount of payroll league’s median team pays increases the team’s chances
of being the champion by 15 to 17%. When we conducted Hausman test, the
corresponding �
2-statistic was only 0.29 which suggests that random e↵ects
estimator is more suitable for this model. This result may indicate that there
is no such thing as a predisposition to be the champion among football clubs.
5.5 Pay-Performance Models in Particular Leagues
In the previous sections of Chapter 5, we proved that a positive relationship
between the amount of wages paid and teams’ performance exists. In this part
we would like to deal with the second and third of the research questions which
ask about the di↵erences between the observed leagues and the e↵ect of trans-
fer spendings. The hints that these di↵erences actually do exist can be seen in
the part 5.2 when we saw that the coe�cients of correlation between the league
positions and the position in the payroll rank di↵erred among the league as well
in conclusions of Hall, Szymanski and Zimbalist (2002) who found the overall
correlation between the pay and performance to be the strongest in EPL. They
argued that it is caused by the fact that there are almost no barriers in player

5. Model and Discussion of the Results 41
trade.
When running regressions for individual leagues we decided to use pooled
OLS estimation method. In the previous section we found out that panel data
estimation methods are more suitable for our data. However, when dealing
with particular leagues the sample shrinks substantially. In each league we
would only have between 15 and 25 observations. Such a small sample would
restrict our ability to draw conclusions about significance of variables in di↵er-
ent leagues. For the purposes of better interpretation we will, therefore, use
variables in their real values as di↵erent seasons of one league are comparable
to each other taking into account low levels of inflation the relevant countries
experienced in observed period (tradingeconomics.com, 2015). Nevertheless, in
the last part we will also o↵er regressions with variables perpoints and WRM
so that we can compare the coe�cients of di↵erent leagues. Additionally, we
will provide a prediction table for each league. The table will show how our
model11 predicts number of points for clubs in the 2012/2013 season based on
their wage spending and compare the results with the actual point gains.
5.5.1 English Premier League
So far we have worked only with one unique explanatory variable (WRM ) and
its squared term (WRM2 ). However, for the analysis of EPL and GBL reliable
data about transfer fees are available. Transfer fees, the money one club pays
to its counterpart when purchasing a player who is under a contract, are much
more discussed by media than players’ wages. The fees are gradually increasing
year after year and nowadays as much as €100mil12 can be paid for the biggest
stars (transfermarkt.de). But do these enormous fees matter for performance?
In order to find out we tried to add money paid for incoming players to the
models for EPL and GBL. It makes no sense to add money earned for outgoing
players as this money are either used for other players’ purchases or increases
in wage bill which is already covered by the model or this money is used in a
way13 that does not influence sporting performance directly.
After adding player purchases to the pooled OLS model for EPL the coe�-
cient at purchases is surprisingly negative (-0.04). This would mean that paying
11Based on data from the first four seasons of our observed period12Cristiano Ronaldo (2009) from Manchester United to Real Madrid13Paid to club owners, invested into the stadium or other facilities etc.

5. Model and Discussion of the Results 42
(1) (2) (3)Points Goals champion
Wagesmil15 0.304⇤⇤⇤ 0.292⇤⇤⇤ 0.00284⇤⇤⇤
(0.0278) (0.0253) (0.000539)
transfersin -0.0443 -0.0614 -0.00156⇤
(0.0372) (0.0338) (0.000720)
cons 30.53⇤⇤⇤ 31.92⇤⇤⇤ -0.111⇤⇤
(1.939) (1.764) (0.0376)N 99 99 99R
2 0.642 0.654 0.238
Standard errors in parentheses⇤ p < 0.05, ⇤⇤ p < 0.01, ⇤⇤⇤ p < 0.001
Table 5.7: Pay-Performance Models for EPL
1 additional million for new players results in 0.04 points less in the league ta-
ble. Nevertheless, this coe�cient has a t-statistic of only -1.19 which means it
is not significant at 5% significance level. The coe�cient is significant in the
regression with champion as dependent variable, however, the e↵ect is again
negative. Its interpretations would be that additional €10 million of transfer
spendings decrease the chances to win EPL by 0.015% which is a very negligible
e↵ect. For EPL we can, therefore, claim that transfer spendings actually do not
influence team performance. Additionally, the coe�cient of squared term of
wages is not significant in any of the models. Therefore we worked only with
Wagesmil and transfersin
14 variables.
S.d >meanwage bill
ClubPredicted numberof points
Actual numberof points
+2 Manchester United 90.5 89+1 Arsenal FC 77.3 730 Tottenham Hotspur 59.3 72-1 Wigan Athletics 43.9 36
Table 5.8: Prediction Table for EPL
When we look at the predictions of the model for the 2012/2013 season we
can see that it almost exactly predicted the final number of points for Manch-
ester United and its prediction for Arsenal FC was only 4 points lower. On
14Transfer fees in € million

5. Model and Discussion of the Results 43
(1) (2) (3)Points Goals champion
Wagesmil 0.460⇤⇤⇤ 0.529⇤⇤⇤ 0.00198(0.0747) (0.0689) (0.00143)
transfersin1 -0.0840⇤⇤⇤ -0.0945 0.00481⇤
(0.00209) (0.101) (0.00209)
cons 30.96⇤⇤⇤ 30.93⇤⇤⇤ -0.0784(2.337) (2.154) (0.0446)
N 90 90 90R
2 0.416 0.527 0.207
Standard errors in parentheses⇤ p < 0.05, ⇤⇤ p < 0.01, ⇤⇤⇤ p < 0.001
Table 5.9: Pay-Performance Models for GBL
the other hand, it missed the actual number of points for Tottenham Hotspur
who regularly overachieved and had more points than correspond to their wage
budget.
5.5.2 German Bundesliga
The predictive power16 of our 3 models for GBL is lower compared to EPL. This
is probably the result of the fact that apart from Bayern Munich GBL teams
form a much more homogeneous group in terms of wage budgets. With most
of the teams paying similar amounts to the players other aspects play more
important role in determination of the teams’ performance. In the points-wage
model we again discovered the negative relation between transfer spendings
and number of points gained. The coe�cient is now highly significant with a
t-statistic of 40.19. Both points-wage and goals-wage models confirm the signif-
icant role of wages. Surprisingly, this is not the case in the third champion-wage
model where the coe�cient at wages is not significant anymore while coe�cient
at transfer spendings is now positive and significant at 5% significance level.
Nevertheless, when we look at the historical tables this fact is not unexpected.
Bayern Munich and Schalke 04 topped the wage bill table each season, but
Bayern was the champion only twice and Schalke not even once. Therefore,
the model expects other variables determining the champion more. Transfer
16Measured by R2

5. Model and Discussion of the Results 44
spendings are probably one of them as Wolfsburg as well as Bayern spend ex-
ceptionally high amounts on the arrivals of new players in their championship
seasons (transfermarkt.de).
S.d >meanwage bill
ClubPredicted numberof points
Actual numberof points
+2 Schalke 04 67.7 55+1 Borussia Dortmund 62.2 660 VfB Stuttgart 49.3 43-1 Greuther Furth 36.4 21
Table 5.10: Prediction Table for GBL
As the predictive power of the model for GBL is lower compared to EPL,
the predicted point gains for GBL clubs are more distant to the actual ones.
Nonetheless, predicted numbers of points for Borussia Dortmund or VfB Stuttgart
is not very di↵erent from reality.
5.5.3 Major League Soccer
The predictive power of the models for MLS is very low and the coe�cients
at wages are less significant than we saw in the cases of EPL and GBL. The
reason for this is the presence of the wage cap. Because of it the only hetero-
geneities are caused by the players that are excluded from the cap. However,
the marginal contribution of these players to their team’s performance does not
correspond to the high salaries these players earn. In most cases the players
under designated player rule are the players who once belonged to the world’s
best but came to MLS in the late stage of their careers. Therefore, their acqui-
sition is usually more of a marketing move than an actual contribution to the
squad’s quality. The R
2 and the coe�cient at Wagesmil for MLS are actually
very similar to those predicted for other North American professional league
where wage caps are in place as measured by Hall, Szymanski and Zimbalist
(2002).
Although the R
2 of the wage-points model is low, the prediction table
for 2012/2013 table shows that the predicted numbers of points for Seattle
Sounders, LA Galaxy or Chicago Fire almost match their respective actual
gains.

5. Model and Discussion of the Results 45
(1) (2) (3)Points Goals champion
Wagesmil 1.071⇤⇤ 0.748⇤ 0.0259⇤⇤
(0.378) (0.299) (0.00803)
cons 39.54⇤⇤⇤ 38.63⇤⇤⇤ -0.0592(2.038) (1.614) (0.0433)
N 87 87 87R
2 0.086 0.068 0.109
Standard errors in parentheses⇤ p < 0.05, ⇤⇤ p < 0.01, ⇤⇤⇤ p < 0.001
Table 5.11: Pay-Performance Models for MLS
S.d >meanwage bill
ClubPredicted numberof points
Actual numberof points
+2 Seattle Sounders 50.7 52+1 LA Galaxy 50.1 530 Chicago Fire 44.9 49-1 Chivas USA 42.3 21
Table 5.12: Prediction Table for MLS
5.5.4 Czech Gambrinus Liga
The situation in CGL is similar to GBL. Similarly to Bayern Munich, Sparta
Prague paid much more to its players than the rest of the league where the
di↵erences in pay are not so large. Sparta Prague won the championship only
twice in the observed period and this is the major reason why there is relatively
small R2 for this regression. The coe�cients at wages in all three models are
highly significant. They are lower than one would expect, though. According
to the model additional 25 million CZK17 should bring only 1.875 points, 1.44
goals and increase in probability of being champion by 2.2%.
The prediction table for CGL reveals a very good fit between the estimates
of the model and the real values. The only prediction which stands out of the
row is the one of Viktoria Plzen who surpassed the model’s prediction. This
might have been caused by the omitted factors such as coaching and managerial
quality as the team was coached by Pavel Vrba, who was voted the coach of
the year in the Czech Republic 5 years in row between 2010 and 2014 (Novak,
2013).
17Rough estimate of 1 million Euro in the observed period
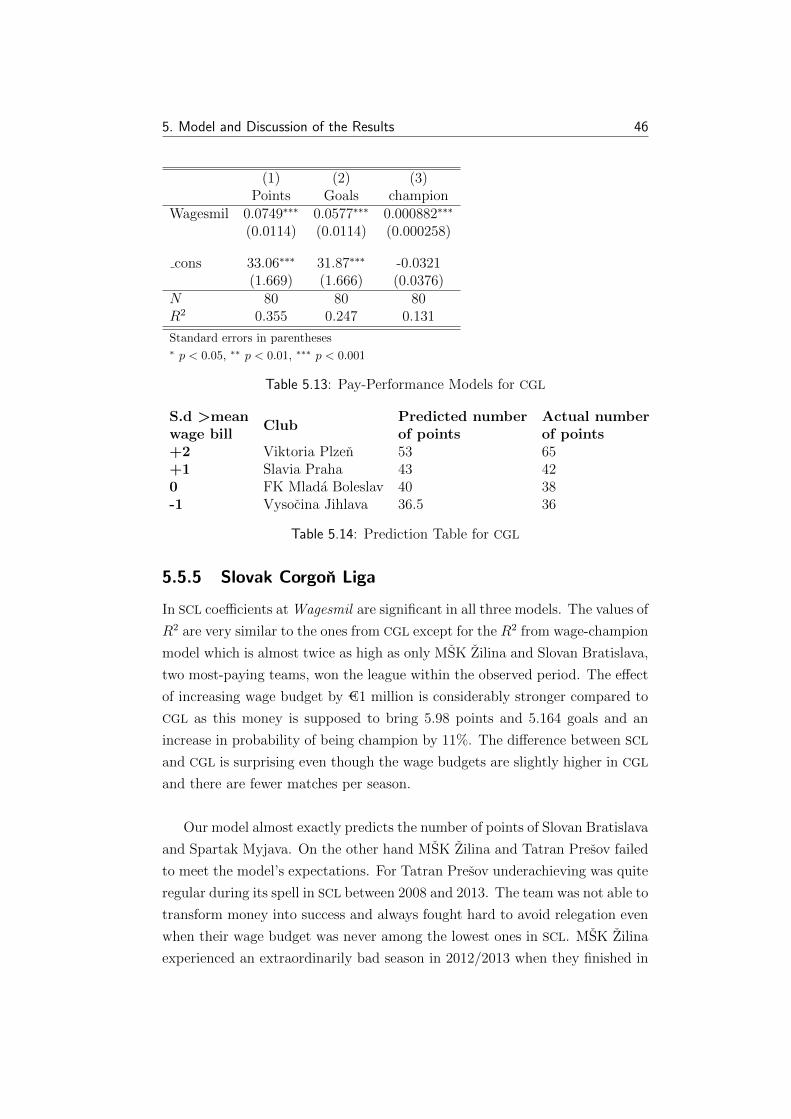
5. Model and Discussion of the Results 46
(1) (2) (3)Points Goals champion
Wagesmil 0.0749⇤⇤⇤ 0.0577⇤⇤⇤ 0.000882⇤⇤⇤
(0.0114) (0.0114) (0.000258)
cons 33.06⇤⇤⇤ 31.87⇤⇤⇤ -0.0321(1.669) (1.666) (0.0376)
N 80 80 80R
2 0.355 0.247 0.131
Standard errors in parentheses⇤ p < 0.05, ⇤⇤ p < 0.01, ⇤⇤⇤ p < 0.001
Table 5.13: Pay-Performance Models for CGL
S.d >meanwage bill
ClubPredicted numberof points
Actual numberof points
+2 Viktoria Plzen 53 65+1 Slavia Praha 43 420 FK Mlada Boleslav 40 38-1 Vysocina Jihlava 36.5 36
Table 5.14: Prediction Table for CGL
5.5.5 Slovak Corgon Liga
In SCL coe�cients atWagesmil are significant in all three models. The values of
R
2 are very similar to the ones from CGL except for the R2 from wage-champion
model which is almost twice as high as only MSK Zilina and Slovan Bratislava,
two most-paying teams, won the league within the observed period. The e↵ect
of increasing wage budget by €1 million is considerably stronger compared to
CGL as this money is supposed to bring 5.98 points and 5.164 goals and an
increase in probability of being champion by 11%. The di↵erence between SCL
and CGL is surprising even though the wage budgets are slightly higher in CGL
and there are fewer matches per season.
Our model almost exactly predicts the number of points of Slovan Bratislava
and Spartak Myjava. On the other hand MSK Zilina and Tatran Presov failed
to meet the model’s expectations. For Tatran Presov underachieving was quite
regular during its spell in SCL between 2008 and 2013. The team was not able to
transform money into success and always fought hard to avoid relegation even
when their wage budget was never among the lowest ones in SCL. MSK Zilina
experienced an extraordinarily bad season in 2012/2013 when they finished in

5. Model and Discussion of the Results 47
(1) (2) (3)Points Goals champion
Wagesmil 5.978⇤⇤⇤ 5.164⇤⇤⇤ 0.118⇤⇤⇤
(1.153) (1.059) (0.0275)
cons 32.74⇤⇤⇤ 28.38⇤⇤⇤ -0.157⇤
(2.703) (2.483) (0.0644)N 60 60 60R
2 0.317 0.291 0.240
Standard errors in parentheses⇤ p < 0.05, ⇤⇤ p < 0.01, ⇤⇤⇤ p < 0.001
Table 5.15: Pay-Performance Models for SCL
S.d >meanwage bill
ClubPredicted numberof points
Actual numberof points
+2 Slovan Bratislava 57.1 59+1 MSK Zilina 50 420 Tatran Presov 42 33-1 Spartak Myjava 36.1 36
Table 5.16: Prediction Table for SCL
7th position as the defending champion. This was probably connected to their
participation in the group stage of the Champions League which burdened the
players who did not have enough energy to play up to their potential in SCL.
5.5.6 Comparison of leagues
The comparison table 5.11 gives us the opportunity to compare the pay-to-
performance relationships in the 5 observed leagues. We used simple regressions
of the variable perpoints on WRM variable to be consistent and used the same
model for all the leagues. It can be seen that EPL is the league where clubs’
standings are mostly influenced by wage bills. As much as 67% of variation
in points gained is explained by wages. This result is somewhere inbetween
the results of Szymanski (2003) (70% of variation) and The Economist (2014)
(56%). The marginal e↵ect of increasing wages relative to league median is
also the highest among the observed leagues in EPL as well as it is the most
significant one. This is probably caused by the fact that there are fewest player
trade barriers18 in EPL as proposed by Hall, Szymanski and Zimbalist(2002).
18Nationality restrictions, financial responsibility rules, financial capabilities of the teamsetc.

5. Model and Discussion of the Results 48
EPL GBL MLS CGL SCLperpoints perpoints perpoints perpoints perpoints
WRM 0.151⇤⇤⇤ 0.125⇤⇤⇤ 0.0326⇤⇤ 0.0618⇤⇤⇤ 0.100⇤⇤⇤
(0.0108) (0.0160) (0.0123) (0.0107) (0.0211)
cons 0.258⇤⇤⇤ 0.307⇤⇤⇤ 0.410⇤⇤⇤ 0.371⇤⇤⇤ 0.340⇤⇤⇤
(0.0166) (0.0224) (0.0201) (0.0198) (0.0277)N 99 90 87 80 60R
2 0.670 0.408 0.076 0.300 0.280
Standard errors in parentheses⇤ p < 0.05, ⇤⇤ p < 0.01, ⇤⇤⇤ p < 0.001
Table 5.17: Wage-Points Model across Leagues
Because of the league’s prestige there are very few players who would reject an
EPL club when o↵ered a fair wage. Meanwhile in the other observed leagues
this situation happens more often and the clubs, therefore, have to o↵er more
than fair salary to attract the players. Simply said in EPL it is most likely that
clubs get the ability corresponding to the pay from their players.
In GBL the amount of variation explained is lower probably because the
lower heterogeneity in wage bills among most of the teams. The coe�cient at
WRM of 0.125 is also similar to the one of EPL. These coe�cients are almost
the same compared to the ones from Szymanski (2003) which were 0.19 for
EPL and 0.12 for GBL. These were found using much larger dataset including
season between 1974 and 1999. The fact that our results are very similar might
indicate that they do not vary over time substantially.
CGL and SCL are similar leagues in terms of footballing quality as well as
finance. Payrolls explain approximately the same amount of variation (30% vs.
28%). However, there is a surprising di↵erence in terms of marginal contribu-
tion of an increase in wages which is almost twice as high in SCL compared to
CGL.
The low coe�cient of determination in case of MLS was expected as the
league has similar structure and rules to the other Northern American leagues
which had R
2 of between 13% to 20% in the end of 1990s. The degree of
variation explained in MLS is even lower as on contrary to the other leagues
some of the best-paid players are excluded from wage caps but these players

5. Model and Discussion of the Results 49
are usually over-paid and fail to make contribution to their team’s performance
corresponding to their wage.
5.6 Shortcomings and Possible Extensions
In this chapter we have not only discovered a high-level of correlation between
wages and salaries, we have also claimed that higher wages explains higher
finishes. Moreover, we have said that spending more on wages is much more
e↵ective than spending on transfers. However, these claims can be challenged.
If these conclusions were 100% true, then a team from the bottom of league
table such as Wigan Athletics in EPL could do significantly better just by pay-
ing higher salaries to the same players. Meanwhile, this might be partly true,
we cannot certainly expect that the club owners always get the higher value
with the same team only by increasing wages. In chapter 3 we provided several
cases when even a high-paying team finished at the bottom of its league table.
Another shortcoming is the fact that even though Hall, Szymanski, Zimbal-
ist (2002) did not find enough evidence for the causation from performance to
wages, the causation almost certainly runs to some extent in both directions.
The top finishers get higher rewards and can play in European competitions19 which provide enormous boosts to clubs’ finances. Not to forget that our
wage dataset includes di↵erent performance bonuses (per goal, per appearance,
per assist etc.) Therefore, good performance may also lead to higher wages.
This problem could be solved by IV regression with an instrument that is cor-
related with teams final league standing but not with di↵erences in wages as
proposed by Dan Altman (2014). Altman (2014) proposes the use of team’s
save percentage - the ratio of unsuccessful shots faced20. Nonetheless, for such
an analysis we would need much more detailed data which especially for less-
observed leagues such as SCL or CGL might not even have been recorded.
The next potential improvement to the analysis would be more extensive
data. Whereas we found out that fixed e↵ects model or random e↵ects model
are more suitable, in the analysis of particular leagues less precise method of
pooled OLS had to be used due to lack of su�cient number of observations. To
be able to conduct fixed e↵ects models for all leagues we would have to possess
19Except for MLS20Total misses and saves to total shots

5. Model and Discussion of the Results 50
financial data for more seasons as well as for lower divisions so that we would
be able to keep track of clubs for a longer time no matter what competition
they played in.

Chapter 6
Connection to Other Industries
6.1 University Rankings and Professors’ Pay
In the previous chapter we revealed a strong link between how much clubs pay
to their players and their performance. As stated in the section 5.2 club’s league
position correlates with the clubs rank in payroll table with a coe�cient of 0.54.
In order to find out whether this is high or low, we would like to compare it
with a pay-performance ratio in di↵erent areas. This proved to be a serious
challenge as there are almost no industries where the performance of entities
depends on abilities of their workers to such large extent and simultaneously
data about their compensation as well as performance are widely available.
Finally, education was chosen as the right area and namely we looked at
how the wages of the professors at American universities are linked to their
respective school’s performance in a university ranking. We assume that the
quality of a university depends on the ability of its professors to the similar
extent as a quality of a professional football club depends on the ability of
its players and coaches and we used the fact that the data about salaries of
professors of American universities are publicly available.
Nevertheless, we were made to do several adjustments to the approach we
used to analyse football clubs. Firstly, we used average salary per professor
because universities di↵er in size much more than football squads, and there-
fore it would not make sense to use total payroll data. Secondly, we used only
data for years 2013 and 2014 as the older Payscale College Salary Reports were
not available on the Internet. As for university rankings, there are several ones

6. Connection to Other Industries 52
that are respected and they o↵er di↵erent results. We have to understand that
to large extent they are subjective but these rankings provide the only reason-
able measure how to compare the quality of the institutions. We will use the
data from Times Higher Education World University Rankings also known as
THE Ranking which is one of the most respected ones (Marszal, 2012). It is
known to be the most dynamic of the university rankings as it focuses its cri-
teria mainly on the volume and quality of research of the institutions whereas
slow-varying factors such as reputation are less important than in the other
rankings (Marszal, 2012).
In the sample of 85 best American universities the correlation coe�cient of
0.5976 was discovered between the position in THE Ranking and the position
in Payscale College Salary Report (as of 2014). Such a value is very similar to
the correlation between football clubs’ league rank and their relative payroll
rank. This result also indicates that the strength of football pay-performance
relationship might be in line with the one of other industries’ and it might not
be specific only for football.
Figure 6.1: Scatterplot of THE University Ranking against PayscaleCollege Salary Report

Chapter 7
Conclusion
In this thesis we examined the impacts of money on sporting performance of
football clubs in selected leagues. In the thesis proposal we stated 4 main re-
search questions for which we were able to find answers to the width and depth
the dataset allowed us.
We studied 5 di↵erent leagues in 5 seasons between years 2008 and 2013.
English Premier League and German Bundesliga represented world’s best foot-
ball competitions, meanwhile Czech Gambrinus Liga and Slovak Corgon Liga
stood for more minor European leagues. The fifth league was North American
Major League Soccer which represents a unique, much more restricted environ-
ment than European leagues do and is very similar in the structure and rules
to the other professional leagues in the USA and Canada. The data about
the finances were obtained from o�cial annual statements of each club. The
data for European clubs are not absolutely precise as apart from players’ and
coaches’ wages they can include other personal expenses such as performance
bonuses, contract cancellation fees, contract extension bonuses etc. These data
were, however, used as they provided the best information source that was
publicly available.
To answer the first of the research questions, whether there is a significant
e↵ect of wages on success, we used 3 di↵erent approaches based on what is
meant under success. The e↵ects of wages on points, goals and probability of
being champion were studied depending on whether league position, beauty of
the played game in the eyes of fans, or championship title were considered as
the measure of success and performance, respectively. We used pooled OLS

7. Conclusion 54
estimation method as well as panel data estimation methods (fixed e↵ects, be-
tween e↵ects, random e↵ects) on the whole sample where all the observation
were pooled together after generating new variables that regarded for struc-
tural and financial di↵erences between the particular leagues. In every case
examined the e↵ect of wages on dependent variable was positive and highly
significant. Hausman test recommended us the fixed e↵ects for wage-points
and wage-goals models in which wages explained 69% and 70% of variation in
points and goals scored, respectively. Random e↵ects model was suggested by
Hausman test for wages-champion model and it explained as much as 16.65%
of the variation in the probability of becoming the league champion. The result
of Hausman test might suggest that there is no such thing as a predisposition
for being champion.
The second research question asked about the di↵erences in pay-performance
relationship depending on the league’s quality. We found enough evidence to
claim that in the best leagues such as EPL or GBL this relationship is more solid.
It is proved by the higher amount of variation in points, goals, and probability
of winning explained in GBL and EPL compared to the less prestigious leagues
such as CGL, SCL, or MLS. The actual regression coe�cients found at WRM
are much higher for EPL and GBL compared to the other three leagues - EPL’s
coe�cient is more than twice as high as the one of CGL and almost three times
as high is the of MLS. As proposed by Szymanski (2001) this di↵erences might
be explained by less restricted player markets in the best competitions. In CGL
and SCL clubs have to pay each other the so called ”table fees” even when a free
agent1 players are transferred2. In the USA the system is much more restricted
as all the players are owned by the league not by the individual clubs, the clubs
have exclusive rights for their drafted players, and most importantly wage cap
is in place. This conclusion confirms the findings of Hubbard and Palia (1995)
who found that the pay-performance relationship is stronger in an environment
with less regulation.
The third research question asked about the significance of transfer fees.
As the transfer fees are not always made public, we were able to find reliable
transfer data only for EPL and GBL. In these two leagues the e↵ect of trans-
fer spending on goals was negative and not significant which is surprising as
1Without valid contract2Source: Prestupovy poriadok SFZ, Prestupnı rad CMFS
7. Conclusion 55
the highest transfer fees are almost always paid for o↵ensive players (trans-
fermarkt.de). The same was found for the e↵ect on points in EPL, however,
in GBL a small negative coe�cient was found to be significant. The excepted
significant positive e↵ect was found only in regression of transfer spendings on
probability of being champion in GBL. The lack of significance and small values
of coe�cient at transfer spending might mean that a new addition to the team
disrupts team’s harmony and at least in the first season it does not pay o↵. The
other reason might be the fact that purchase of a new player does not mean only
an increase in transfer spendings but also an increase in wages. Therefore, part
of the e↵ect might be consumed by the variable wages. Even though we can
claim that the e↵ect of transfer fees is much lower than the one of player wages.
In the final chapter of our thesis we tried to answer the fourth research
question, although we dealt with serious lack of reliable data. However, from
the data we had at hand we found out that the correlation between quality
ranking and average salary ranking for US universities is very similar to the
one between payroll ranking and league position for the five observed leagues
in the period between 2008 and 2013. This is certainly not enough evidence to
be definitely sure about our research question, nevertheless, it gives us a hint
that the pay-performance relationship in these two highly-competitive markets
might be similar.
In the final subsection of chapter 5 we highlighted some of the shortcomings
of our analysis. These are mainly issues connected to the depth and width of
the dataset. Our claims could be much stronger if we had reliable financial data
for more leagues and seasons. Important issue is also the both-way causality
which was suggested by Altman (2014). This issue could be partially solved by
having data about wages not including performance compensations. However,
such data are not publicly available and most of the researchers had to use the
gross values. Another solution how to account for the causality problem would
be IV regression. For such a regression we would need suitable instruments such
as team’s saves percentage (proposed by Altman (2014)) which was, however,
not available.

Bibliography
Akerlof, G. and Yellen, J. (1986). Efficiency wage models of the labor market. Cambridge [Cambridgeshire]: Cambridge University Press.
Amir, E. and Livne, G. (2005). Accounting, Valuation and Duration of Football Player Contracts. Journal of Business Finance & Accounting, 32(3-4), pp.549-586.
Albach, H., Frick, B. and Rahmann, B. (2004). Sportökonomie. Sportwiss, 34(1), pp.109-113.
Altman, D. (2014). Does pay follow performance in the English Premier League, or vice versa?. [Blog]Stats Insights. Available at: https://www.bsports.com/statsinsights/football/pay-follow-performance-english-premier-league-vice-versa#.VTv-bmTtmko [Accessed 17 Apr. 2015].
BBC News, (2013). Sir Alex Ferguson is going to retire at the end of the season. [online] Available at: http://www.bbc.com/news/uk-22445866 [Accessed 10 Apr. 2015].
Bundesliga, (2013). Report 2013 - The economic state of German professional football. [online] Frankfurt am Main: German League Association. Available at: http://static.bundesliga.com/media/native/autosync/report_2013_gb_72dpi.pdf [Accessed 9 Apr. 2015].
Crook, C. (2013). At Last, Germany Secures Total Dominance of Europe. [online] Bloomberg. Available at: http://www.bloomberg.com/news/articles/2013-05-23/at-last-germany-secures-total-dominance-of-europe [Accessed 10 Apr. 2015].
Downward, P. and Dawson, A. (2000). The economics of professional team sports. London: Routledge.
Dunning, E. (1999). Sport matters: Sociological Studies of Sport, Violence and Civilisation. London: Routledge.
Encyclopedia Britannica, (2014). Football (Soccer). [online] Available at: http://www.britannica.com/EBchecked/topic/550852/football [Accessed 5 Apr. 2015].

FIFA.com, (2006). Big Count. [online] Available at: http://www.fifa.com/worldfootball/bigcount/registeredplayers.html [Accessed 7 Apr. 2015].
FIFPro World Players' Union, (2014). FIFPro World Players' Union. [online] Available at: http://fifpro.org/en/about [Accessed 7 Apr. 2015].
Forrest, D. and Simmons, R. (2000). The Relationship between Pay and Performance : Team Salaries and Playing Success from a Comparative Perspective. In: Economics of Professional Soccer.
Fox, B. (2010). Football's financial crisis. [online] The Guardian. Available at: http://www.theguardian.com/commentisfree/2010/oct/02/football-premier-league-debt [Accessed 25 Apr. 2015].
Frick, B., Prinz, J. and Winkelmann, K. (2003). Pay inequalities and team performance. Int J of Manpower, 24(4), pp.472-488.
Gašparovič, M. (2009). Krízu cítia aj športovci. [online] TREND. Available at: http://profit.etrend.sk/dennik/krizu-citia-aj-sportovci.html [Accessed 16 Apr. 2015].
Hall, S., Szymanski, S. and Zimbalist, A. (2002). Testing Causality Between Team Performance and Payroll: The Cases of Major League Baseball and English Soccer. Journal of Sports Economics, 3(2), pp.149-168.
Hoovers.com, (2015). MAJOR LEAGUE SOCCER, L.L.C. | Company Profile from Hoover’s. [online] Available at: http://www.hoovers.com/company-information/cs/company-profile.Major_League_Soccer_LLC.0432cbf68c309307.html [Accessed 14 Apr. 2015].
Hospodárske noviny, (2008). Ivan Kmotrík kúpil Slovan. [online] Available at: http://tv.hnonline.sk/ivan-kmotrik-kupil-slovan-291458 [Accessed 13 Apr. 2015].
Hospodárske noviny, (2014). Slovenský futbal chystá ekonomickú revolúciu. Hráčom zmení platy. [online] Available at: http://hn.hnonline.sk/sport-121/slovensky-futbal-chysta-ekonomicku-revoluciu-hracom-zmeni-platy-634330 [Accessed 8 Apr. 2015].
Hubbard, R. and Palia, D. (1995). Executive pay and performance Evidence from the U.S. banking industry. Journal of Financial Economics, 39(1), pp.105-130.

Iffhs.de, (2014). Former Results | IFFHS. [online] Available at: http://www.iffhs.de/former-results/ [Accessed 7 Apr. 2015].
Jackson, J. (2010). How the Bundesliga puts the Premier League to shame. [online] The Guardian. Available at: http://www.theguardian.com/football/blog/2010/apr/11/bundesliga-premier-league [Accessed 16 Apr. 2015].
Jones, D. and Boon, G. (2013). Deloitte Annual Review of Football Finance 2013. Manchester: Deloitte & Touche Sport.
Kahn, L. (2000). The Sports Business as a Labor Market Laboratory. Journal of Economic Perspectives, 14(3), pp.75-94.
Lawler, E. (1990). Strategic pay. San Francisco: Jossey-Bass Publishers.
Lewis, M. (2003). Moneyball. New York: W.W. Norton.
Malý, J. (2011). Fotbal v Česku táhnou hlavně sponzoři. [online] Hospodářské noviny. Available at: http://archiv.ihned.cz/c1-52518910-fotbal-v-cesku-tahnou-hlavne-sponzori [Accessed 13 Apr. 2015].
Marszal, A. (2012). University rankings: Which world university rankings should we trust?. [online] Daily Telegraph. Available at: http://www.telegraph.co.uk/education/universityeducation/9584155/University-rankings-which-world-university-rankings-should-we-trust.html [Accessed 14 Apr. 2015].
MLS Player's Union, (2014). Player Salaries. [online] Available at: http://www.mlsplayers.org/salary_info.html [Accessed 14 Apr. 2015].
MLSsoccer.com, (2009). Retention funds explained. [online] Available at: http://www.mlssoccer.com/news/article/2013/08/02/retention-funds-explained-mls-reveals-list-14-players-graham-zusi-re-signed- [Accessed 13 Apr. 2015].
MLSsoccer.com, (1996). 1996 Season Recap. [online] Available at: http://www.mlssoccer.com/history/season/1996 [Accessed 17 Apr. 2015].
Novák, M. (2013). Fotbalovým králem je opět brankář. [online] MF Dnes. Available at: http://fotbal.idnes.cz/anketa-fotbalista-roku-2012-cech-vyhral-poseste-fab-/fot_reprez.aspx?c=A130204_202619_fot_reprez_min [Accessed 10 Apr. 2015].

Paul, R. (2003). Variations in NHL Attendance: The Impact of Violence, Scoring, and Regional Rivalries. American Journal of Economics and Sociology, 62(2), pp.345-364.
PayScale, (2014). 2013 - 2014 College Salary Report. [online] Available at: http://www.payscale.com/college-salary-report-2014 [Accessed 20 Apr. 2015].
Premierleague.com, (2012). Background to introduction of new financial rules. [online] Available at: http://www.premierleague.com/en-gb/news/news/2012-13/feb/background-to-introduction-of-new-financial-rules/ [Accessed 10 Apr. 2015].
Premierleague.com, (2013). Premier League History. [online] Available at: http://www.premierleague.com/en-gb/about/history.html [Accessed 9 Apr. 2015].
Rec.Sport.Soccer Statistics Foundation, (2000). Czechoslovakia / Czech Republic - List of League Tables. [online] Available at: http://www.rsssf.com/tablest/tsjslhist.html [Accessed 14 Apr. 2015].
Rigdon, M. (2002). Efficiency wages in an experimental labor market. Proceedings of the National Academy of Sciences, 99(20), pp.13348-13351.
Rodriguez, P., Kesenne, S. and Garcia, J. (2013). The econometrics of sport. Cheltenham: Edward Elgar.
Satzung DFB. (2000). 1st ed. [ebook] Berlin: Deutsche Fußball-Bund. Available at: http://www.dfb.de/fileadmin/_dfbdam/2014124_02_Satzung.pdf [Accessed 25 Apr. 2015].
Smith, C. (2013). Major League Soccer's Most Valuable Teams. [online] Forbes. Available at: http://www.forbes.com/sites/chrissmith/2013/11/20/major-league-soccers-most-valuable-teams/ [Accessed 14 Apr. 2015].
Soccerstats.com, (2015). Bundesliga - attendance table, average and highest attendances. [online] Available at: http://www.soccerstats.com/attendance.asp?league=germany [Accessed 10 Apr. 2015].
Szymanski, S. (2003). The Assessment: The Economics of Sport. Oxford Review of Economic Policy, 19(4), pp.467-477.
Szymanski, S. and Kuypers, T. (1999). Winners and Loosers: The Business Strategy of Football. London: Viking.

Szymanski, S. and Smith, R. (1997). The English Football Industry: profit, performance and industrial structure. International Review of Applied Economics, 11(1), pp.135-153.
The Economist, (2014). Football and Money: Everything to play for. [online] Available at: http://www.economist.com/printedition/2014-05-10 [Accessed 25 Apr. 2015].
THE University Ranking, (2014). World University Rankings 2013-2014 - Times Higher Education. [online] Available at: http://www.timeshighereducation.co.uk/world-university-rankings/2013-14/world-ranking [Accessed 12 Apr. 2015].
Tomkins, P., Riley, G. and Fulcher, G. (2010). Pay as you play. [United Kingdom?]: GPRF Pub.
Ton, Z. (n.d.). The Effect of Labor on Profitability: The Role of Quality. SSRN Journal.
Tradingeconomics.com, (2015). Inflation Rate - Countries - List. [online] Available at: http://www.tradingeconomics.com/country-list/inflation-rate [Accessed 11 Apr. 2015].
Transfermarkt.de, (2015). Transfermarkt. [online] Available at: http://www.transfermarkt.de [Accessed 2 Apr. 2015].
Transparency International, (2012). Financovanie športových klubov – veľká hra na schovávačku. [online] Available at: http://www.transparency.sk/sk/financovanie-sportovych-klubov-velka-hra-na-schovavacku [Accessed 8 Apr. 2015].
UEFA, (2011). The European Club Licensing Benchmarking Report. [online] Nyon: UEFA, pp.38-44. Available at: http://www.uefa.org/MultimediaFiles/Download/uefaorg/Administration/02/07/89/16/2078916_DOWNLOAD.pdf [Accessed 9 Apr. 2015].
US Soccer Players, (2012). Adidas Generation. [online] Available at: http://www.ussoccerplayers.com/ [Accessed 14 Apr. 2015].
Wiseman, F. and Chatterjee, S. (2003). Team payroll and team performance in major league baseball: 1985 - 2002. Economics Bulletin, 1(2), pp.1-10.
Wooldridge, J. (2002). Econometric analysis of cross section and panel data. Cambridge, Mass.: MIT Press.

Wooldridge, J. (2009). Introductory econometrics. Mason, OH: South Western, Cengage Learning.
Related Documents